Guymon, OK Map & Demographics
Guymon Map
Guymon Overview
$22,005
PER CAPITA INCOME
$67,898
AVG FAMILY INCOME
$55,526
AVG HOUSEHOLD INCOME
29.0%
WAGE / INCOME GAP [ % ]
71.0¢/ $1
WAGE / INCOME GAP [ $ ]
$10,380
FAMILY INCOME DEFICIT
0.38
INEQUALITY / GINI INDEX
12,743
TOTAL POPULATION
7,075
MALE POPULATION
5,668
FEMALE POPULATION
124.82
MALES / 100 FEMALES
80.11
FEMALES / 100 MALES
30.8
MEDIAN AGE
3.9
AVG FAMILY SIZE
3.1
AVG HOUSEHOLD SIZE
6,703
LABOR FORCE [ PEOPLE ]
71.8%
PERCENT IN LABOR FORCE
2.8%
UNEMPLOYMENT RATE
Guymon Zip Codes
Guymon Area Codes
Income in Guymon
Income Overview in Guymon
Per Capita Income in Guymon is $22,005, while median incomes of families and households are $67,898 and $55,526 respectively.
| Characteristic | Number | Measure |
| Per Capita Income | 12,743 | $22,005 |
| Median Family Income | 2,651 | $67,898 |
| Mean Family Income | 2,651 | $72,480 |
| Median Household Income | 4,112 | $55,526 |
| Mean Household Income | 4,112 | $62,682 |
| Income Deficit | 2,651 | $10,380 |
| Wage / Income Gap (%) | 12,743 | 28.98% |
| Wage / Income Gap ($) | 12,743 | 71.02¢ per $1 |
| Gini / Inequality Index | 12,743 | 0.38 |
Earnings by Sex in Guymon
Average Earnings in Guymon are $29,354, $35,888 for men and $25,488 for women, a difference of 29.0%.

| Sex | Number | Average Earnings |
| Male | 4,150 (60.7%) | $35,888 |
| Female | 2,692 (39.4%) | $25,488 |
| Total | 6,842 (100.0%) | $29,354 |
Earnings by Sex by Income Bracket in Guymon
The most common earnings brackets in Guymon are $40,000 to $44,999 for men (562 | 13.5%) and $10,000 to $12,499 for women (409 | 15.2%).
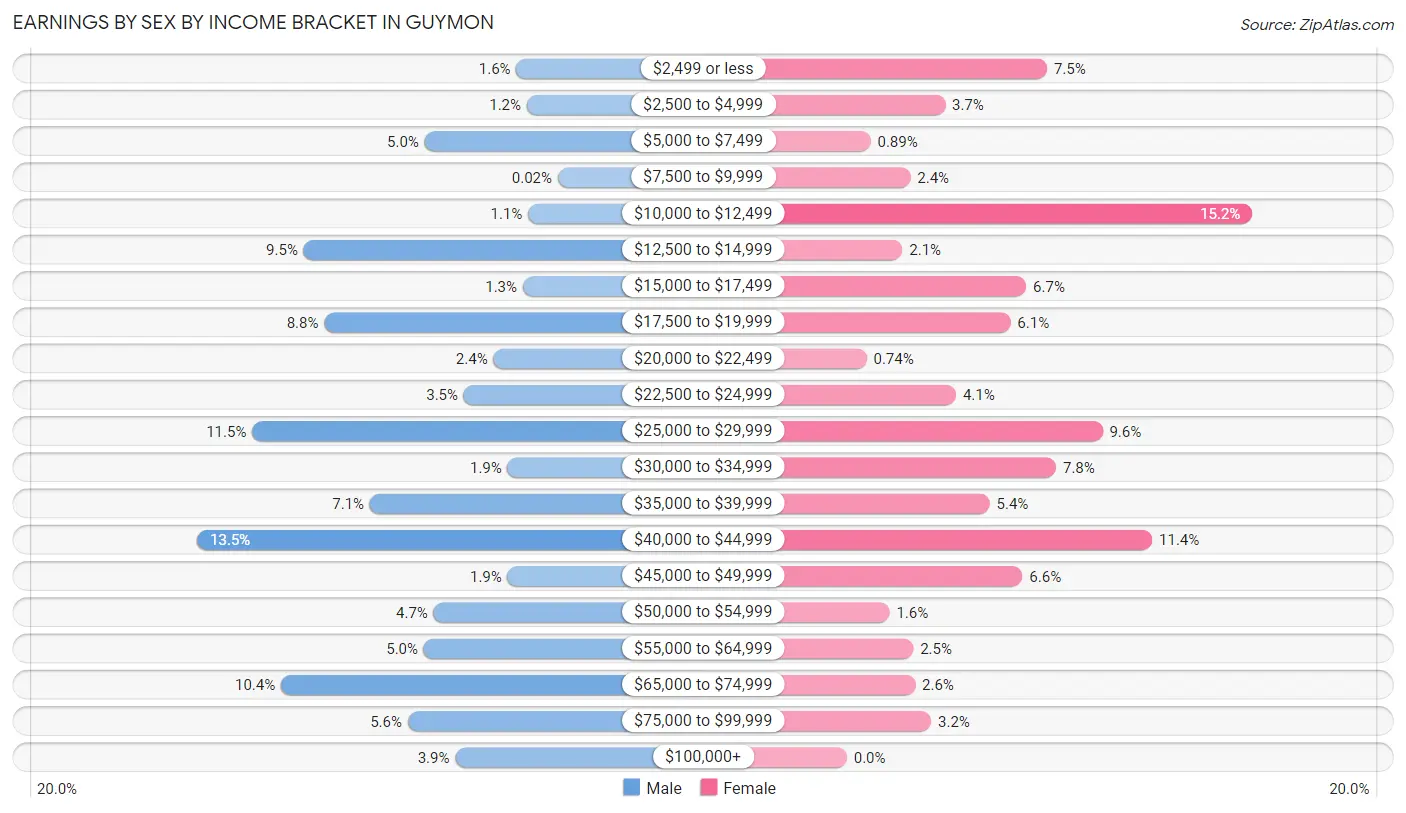
| Income | Male | Female |
| $2,499 or less | 65 (1.6%) | 202 (7.5%) |
| $2,500 to $4,999 | 49 (1.2%) | 99 (3.7%) |
| $5,000 to $7,499 | 208 (5.0%) | 24 (0.9%) |
| $7,500 to $9,999 | 1 (0.0%) | 64 (2.4%) |
| $10,000 to $12,499 | 47 (1.1%) | 409 (15.2%) |
| $12,500 to $14,999 | 396 (9.5%) | 56 (2.1%) |
| $15,000 to $17,499 | 55 (1.3%) | 181 (6.7%) |
| $17,500 to $19,999 | 364 (8.8%) | 165 (6.1%) |
| $20,000 to $22,499 | 101 (2.4%) | 20 (0.7%) |
| $22,500 to $24,999 | 147 (3.5%) | 110 (4.1%) |
| $25,000 to $29,999 | 476 (11.5%) | 258 (9.6%) |
| $30,000 to $34,999 | 79 (1.9%) | 211 (7.8%) |
| $35,000 to $39,999 | 293 (7.1%) | 144 (5.3%) |
| $40,000 to $44,999 | 562 (13.5%) | 308 (11.4%) |
| $45,000 to $49,999 | 79 (1.9%) | 177 (6.6%) |
| $50,000 to $54,999 | 194 (4.7%) | 43 (1.6%) |
| $55,000 to $64,999 | 209 (5.0%) | 67 (2.5%) |
| $65,000 to $74,999 | 431 (10.4%) | 69 (2.6%) |
| $75,000 to $99,999 | 234 (5.6%) | 85 (3.2%) |
| $100,000+ | 160 (3.9%) | 0 (0.0%) |
| Total | 4,150 (100.0%) | 2,692 (100.0%) |
Earnings by Sex by Educational Attainment in Guymon
Average earnings in Guymon are $37,383 for men and $28,551 for women, a difference of 23.6%. Men with an educational attainment of high school diploma enjoy the highest average annual earnings of $67,656, while those with graduate degree education earn the least with $19,461. Women with an educational attainment of bachelor's degree earn the most with the average annual earnings of $41,467, while those with graduate degree education have the smallest earnings of $11,678.
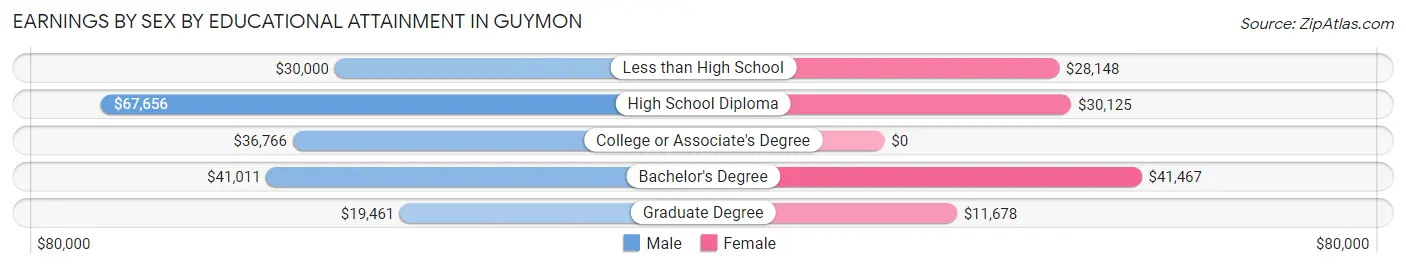
| Educational Attainment | Male Income | Female Income |
| Less than High School | $30,000 | $28,148 |
| High School Diploma | $67,656 | $30,125 |
| College or Associate's Degree | $36,766 | $0 |
| Bachelor's Degree | $41,011 | $41,467 |
| Graduate Degree | $19,461 | $11,678 |
| Total | $37,383 | $28,551 |
Family Income in Guymon
Family Income Brackets in Guymon
According to the Guymon family income data, there are 610 families falling into the $50,000 to $74,999 income range, which is the most common income bracket and makes up 23.0% of all families. Conversely, the $200,000+ income bracket is the least frequent group with only 21 families (0.8%) belonging to this category.
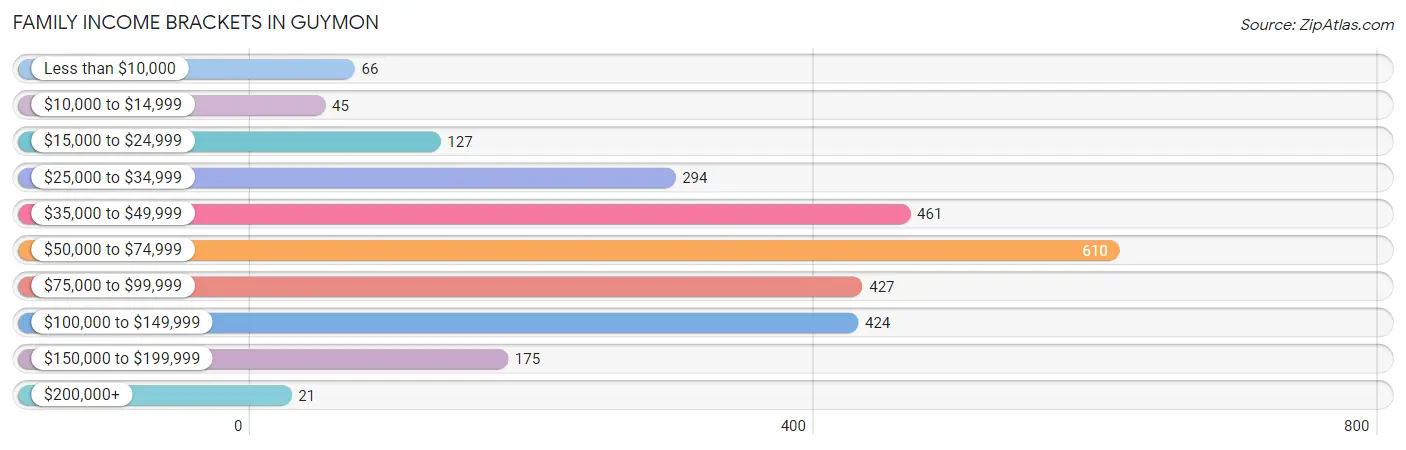
| Income Bracket | # Families | % Families |
| Less than $10,000 | 66 | 2.5% |
| $10,000 to $14,999 | 45 | 1.7% |
| $15,000 to $24,999 | 127 | 4.8% |
| $25,000 to $34,999 | 294 | 11.1% |
| $35,000 to $49,999 | 461 | 17.4% |
| $50,000 to $74,999 | 610 | 23.0% |
| $75,000 to $99,999 | 427 | 16.1% |
| $100,000 to $149,999 | 424 | 16.0% |
| $150,000 to $199,999 | 175 | 6.6% |
| $200,000+ | 21 | 0.8% |
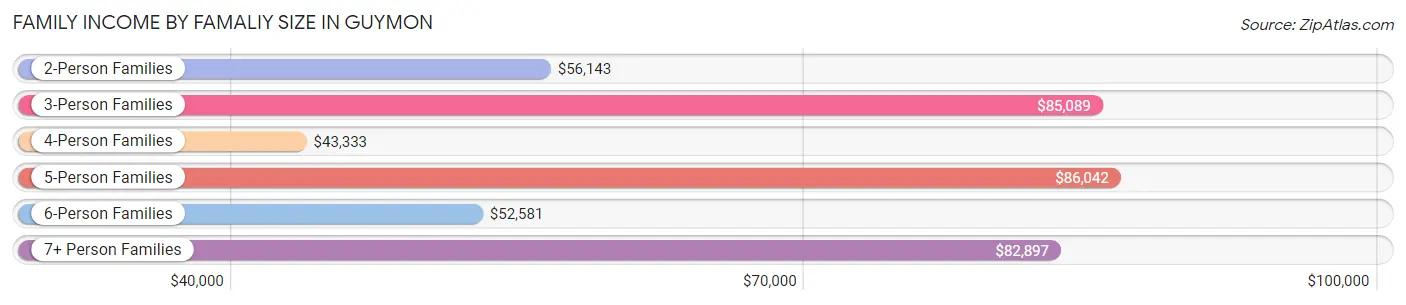
Family Income by Famaliy Size in Guymon
5-person families (468 | 17.6%) account for the highest median family income in Guymon with $86,042 per family, while 3-person families (696 | 26.3%) have the highest median income of $28,363 per family member.
| Income Bracket | # Families | Median Income |
| 2-Person Families | 978 (36.9%) | $56,143 |
| 3-Person Families | 696 (26.3%) | $85,089 |
| 4-Person Families | 234 (8.8%) | $43,333 |
| 5-Person Families | 468 (17.6%) | $86,042 |
| 6-Person Families | 132 (5.0%) | $52,581 |
| 7+ Person Families | 143 (5.4%) | $82,897 |
| Total | 2,651 (100.0%) | $67,898 |
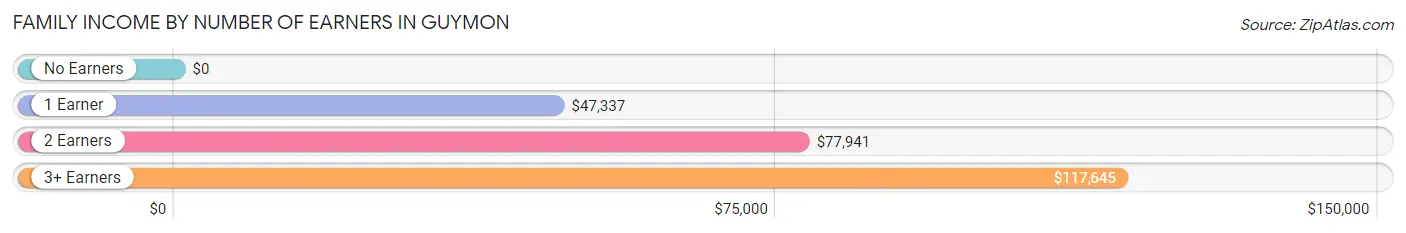
Family Income by Number of Earners in Guymon
| Number of Earners | # Families | Median Income |
| No Earners | 97 (3.7%) | $0 |
| 1 Earner | 1,068 (40.3%) | $47,337 |
| 2 Earners | 1,116 (42.1%) | $77,941 |
| 3+ Earners | 370 (14.0%) | $117,645 |
| Total | 2,651 (100.0%) | $67,898 |
Household Income in Guymon
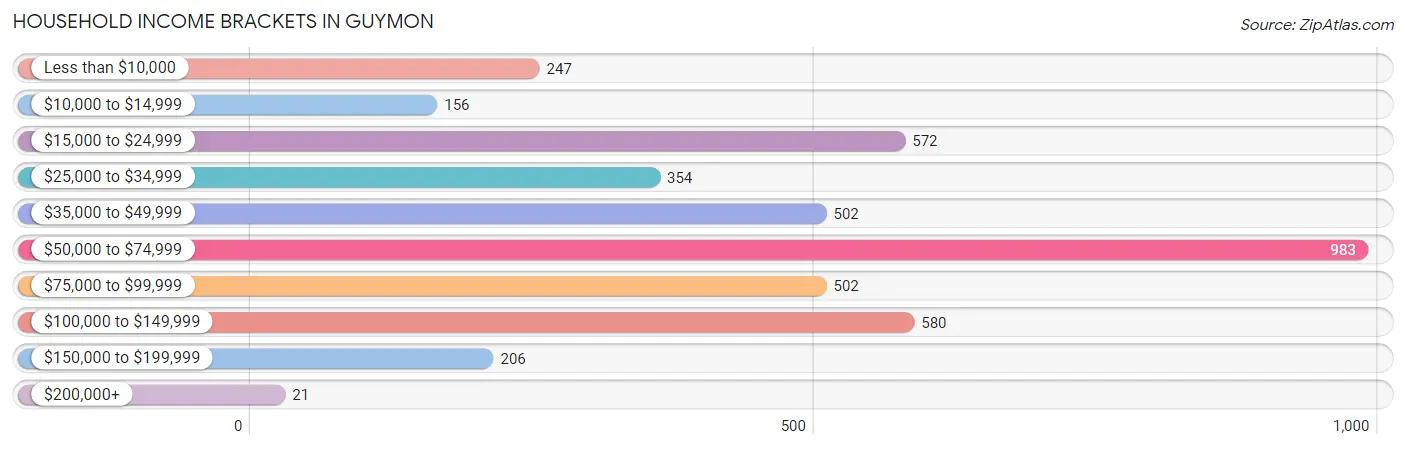
Household Income Brackets in Guymon
With 983 households falling in the category, the $50,000 to $74,999 income range is the most frequent in Guymon, accounting for 23.9% of all households. In contrast, only 21 households (0.5%) fall into the $200,000+ income bracket, making it the least populous group.
| Income Bracket | # Households | % Households |
| Less than $10,000 | 247 | 6.0% |
| $10,000 to $14,999 | 156 | 3.8% |
| $15,000 to $24,999 | 572 | 13.9% |
| $25,000 to $34,999 | 354 | 8.6% |
| $35,000 to $49,999 | 502 | 12.2% |
| $50,000 to $74,999 | 983 | 23.9% |
| $75,000 to $99,999 | 502 | 12.2% |
| $100,000 to $149,999 | 580 | 14.1% |
| $150,000 to $199,999 | 206 | 5.0% |
| $200,000+ | 21 | 0.5% |
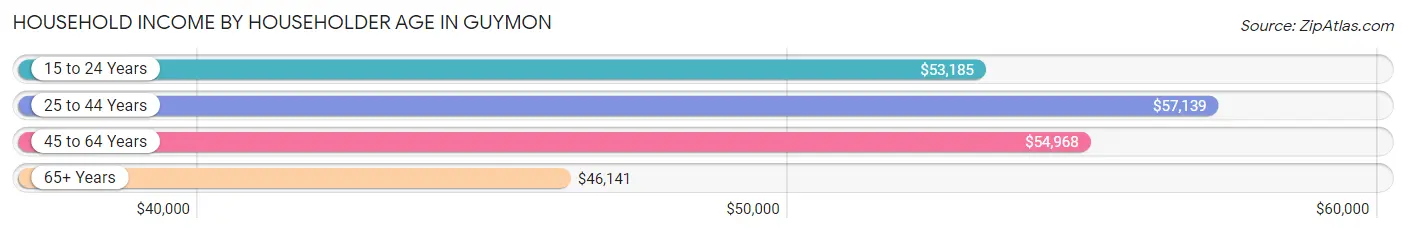
Household Income by Householder Age in Guymon
The median household income in Guymon is $55,526, with the highest median household income of $57,139 found in the 25 to 44 years age bracket for the primary householder. A total of 1,685 households (41.0%) fall into this category. Meanwhile, the 65+ years age bracket for the primary householder has the lowest median household income of $46,141, with 597 households (14.5%) in this group.
| Income Bracket | # Households | Median Income |
| 15 to 24 Years | 215 (5.2%) | $53,185 |
| 25 to 44 Years | 1,685 (41.0%) | $57,139 |
| 45 to 64 Years | 1,615 (39.3%) | $54,968 |
| 65+ Years | 597 (14.5%) | $46,141 |
| Total | 4,112 (100.0%) | $55,526 |
Poverty in Guymon
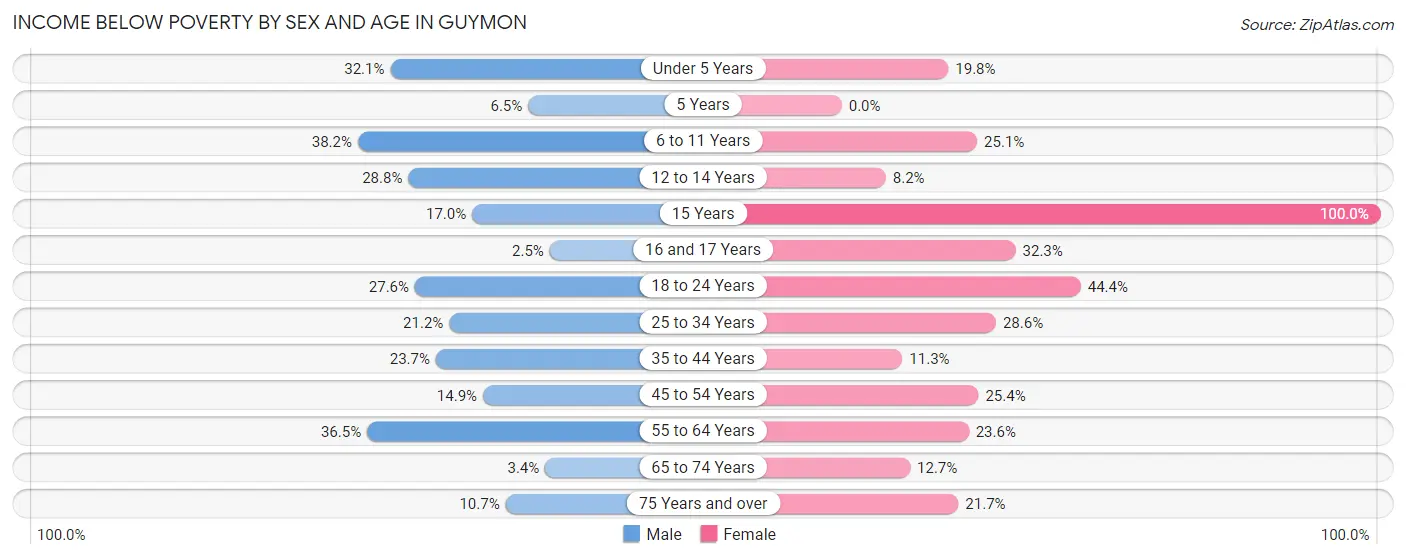
Income Below Poverty by Sex and Age in Guymon
With 23.5% poverty level for males and 22.5% for females among the residents of Guymon, 6 to 11 year old males and 15 year old females are the most vulnerable to poverty, with 206 males (38.2%) and 35 females (100.0%) in their respective age groups living below the poverty level.
| Age Bracket | Male | Female |
| Under 5 Years | 211 (32.1%) | 90 (19.8%) |
| 5 Years | 17 (6.5%) | 0 (0.0%) |
| 6 to 11 Years | 206 (38.2%) | 154 (25.1%) |
| 12 to 14 Years | 76 (28.8%) | 35 (8.2%) |
| 15 Years | 20 (17.0%) | 35 (100.0%) |
| 16 and 17 Years | 6 (2.5%) | 90 (32.3%) |
| 18 to 24 Years | 207 (27.6%) | 181 (44.4%) |
| 25 to 34 Years | 276 (21.2%) | 172 (28.6%) |
| 35 to 44 Years | 188 (23.7%) | 101 (11.3%) |
| 45 to 54 Years | 125 (14.9%) | 207 (25.4%) |
| 55 to 64 Years | 296 (36.4%) | 127 (23.6%) |
| 65 to 74 Years | 11 (3.4%) | 53 (12.7%) |
| 75 Years and over | 13 (10.7%) | 21 (21.6%) |
| Total | 1,652 (23.5%) | 1,266 (22.5%) |
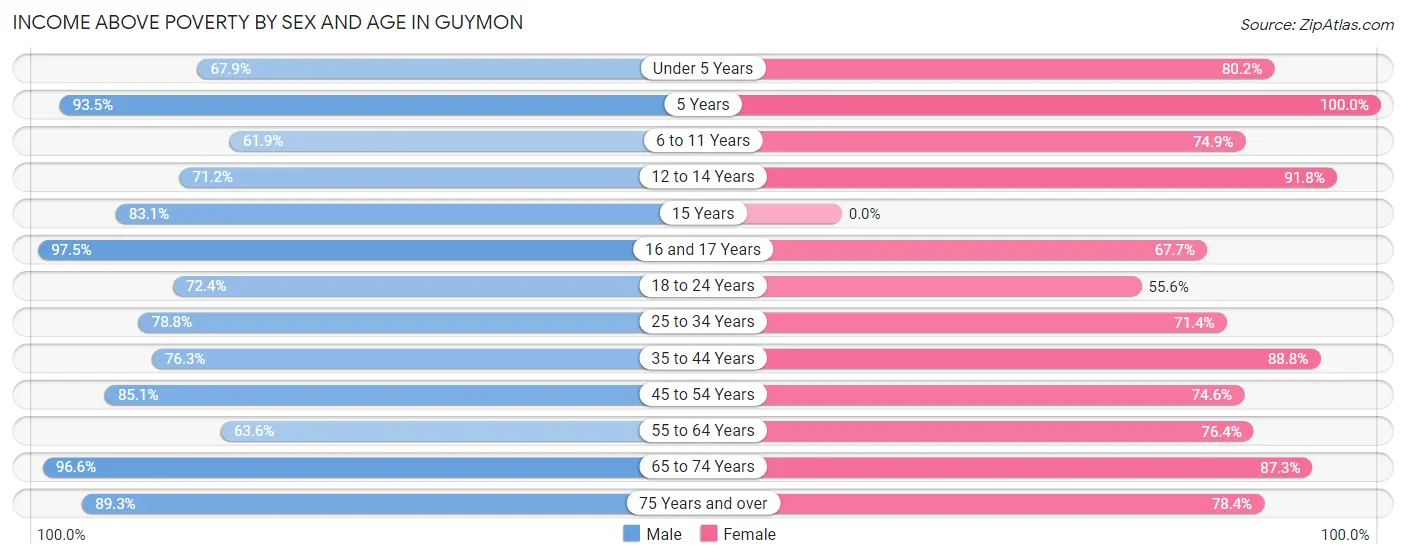
Income Above Poverty by Sex and Age in Guymon
According to the poverty statistics in Guymon, males aged 16 and 17 years and females aged 5 years are the age groups that are most secure financially, with 97.5% of males and 100.0% of females in these age groups living above the poverty line.
| Age Bracket | Male | Female |
| Under 5 Years | 446 (67.9%) | 365 (80.2%) |
| 5 Years | 243 (93.5%) | 38 (100.0%) |
| 6 to 11 Years | 334 (61.9%) | 459 (74.9%) |
| 12 to 14 Years | 188 (71.2%) | 393 (91.8%) |
| 15 Years | 98 (83.1%) | 0 (0.0%) |
| 16 and 17 Years | 230 (97.5%) | 189 (67.7%) |
| 18 to 24 Years | 544 (72.4%) | 227 (55.6%) |
| 25 to 34 Years | 1,026 (78.8%) | 429 (71.4%) |
| 35 to 44 Years | 606 (76.3%) | 797 (88.7%) |
| 45 to 54 Years | 712 (85.1%) | 609 (74.6%) |
| 55 to 64 Years | 516 (63.5%) | 412 (76.4%) |
| 65 to 74 Years | 314 (96.6%) | 365 (87.3%) |
| 75 Years and over | 108 (89.3%) | 76 (78.3%) |
| Total | 5,365 (76.5%) | 4,359 (77.5%) |
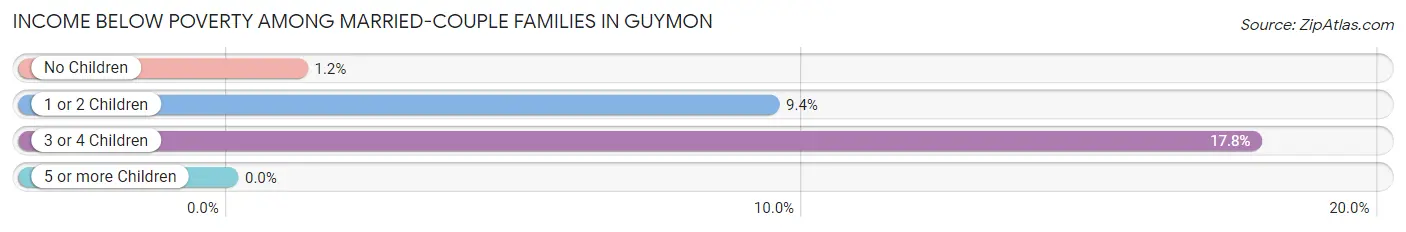
Income Below Poverty Among Married-Couple Families in Guymon
The poverty statistics for married-couple families in Guymon show that 6.8% or 112 of the total 1,659 families live below the poverty line. Families with 3 or 4 children have the highest poverty rate of 17.8%, comprising of 56 families. On the other hand, families with 5 or more children have the lowest poverty rate of 0.0%, which includes 0 families.
| Children | Above Poverty | Below Poverty |
| No Children | 736 (98.8%) | 9 (1.2%) |
| 1 or 2 Children | 452 (90.6%) | 47 (9.4%) |
| 3 or 4 Children | 258 (82.2%) | 56 (17.8%) |
| 5 or more Children | 101 (100.0%) | 0 (0.0%) |
| Total | 1,547 (93.2%) | 112 (6.8%) |
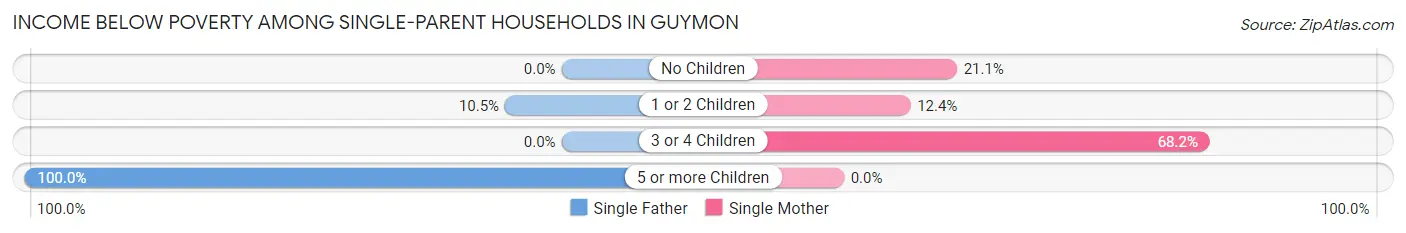
Income Below Poverty Among Single-Parent Households in Guymon
According to the poverty data in Guymon, 21.7% or 77 single-father households and 27.9% or 178 single-mother households are living below the poverty line. Among single-father households, those with 5 or more children have the highest poverty rate, with 45 households (100.0%) experiencing poverty. Likewise, among single-mother households, those with 3 or 4 children have the highest poverty rate, with 105 households (68.2%) falling below the poverty line.
| Children | Single Father | Single Mother |
| No Children | 0 (0.0%) | 32 (21.0%) |
| 1 or 2 Children | 32 (10.5%) | 41 (12.4%) |
| 3 or 4 Children | 0 (0.0%) | 105 (68.2%) |
| 5 or more Children | 45 (100.0%) | 0 (0.0%) |
| Total | 77 (21.7%) | 178 (27.9%) |
Income Below Poverty Among Married-Couple vs Single-Parent Households in Guymon
The poverty data for Guymon shows that 112 of the married-couple family households (6.8%) and 255 of the single-parent households (25.7%) are living below the poverty level. Within the married-couple family households, those with 3 or 4 children have the highest poverty rate, with 56 households (17.8%) falling below the poverty line. Among the single-parent households, those with 5 or more children have the highest poverty rate, with 45 household (100.0%) living below poverty.
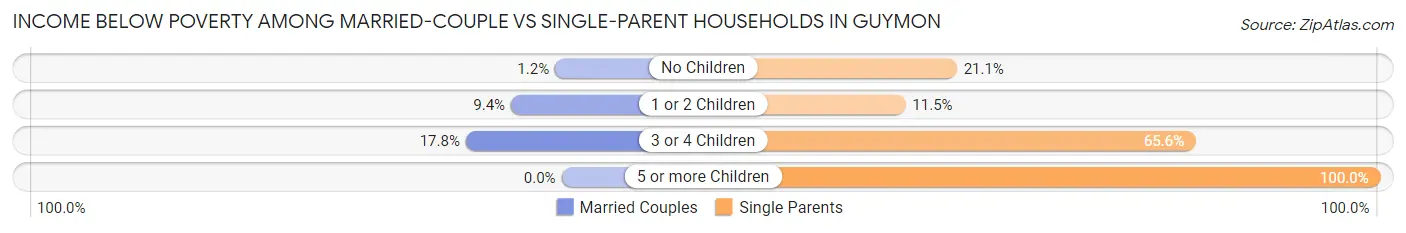
| Children | Married-Couple Families | Single-Parent Households |
| No Children | 9 (1.2%) | 32 (21.0%) |
| 1 or 2 Children | 47 (9.4%) | 73 (11.5%) |
| 3 or 4 Children | 56 (17.8%) | 105 (65.6%) |
| 5 or more Children | 0 (0.0%) | 45 (100.0%) |
| Total | 112 (6.8%) | 255 (25.7%) |
Race in Guymon
The most populous races in Guymon are Hispanic or Latino (7,053 | 55.3%), White / Caucasian (6,252 | 49.1%), and Some other Race (2,908 | 22.8%).
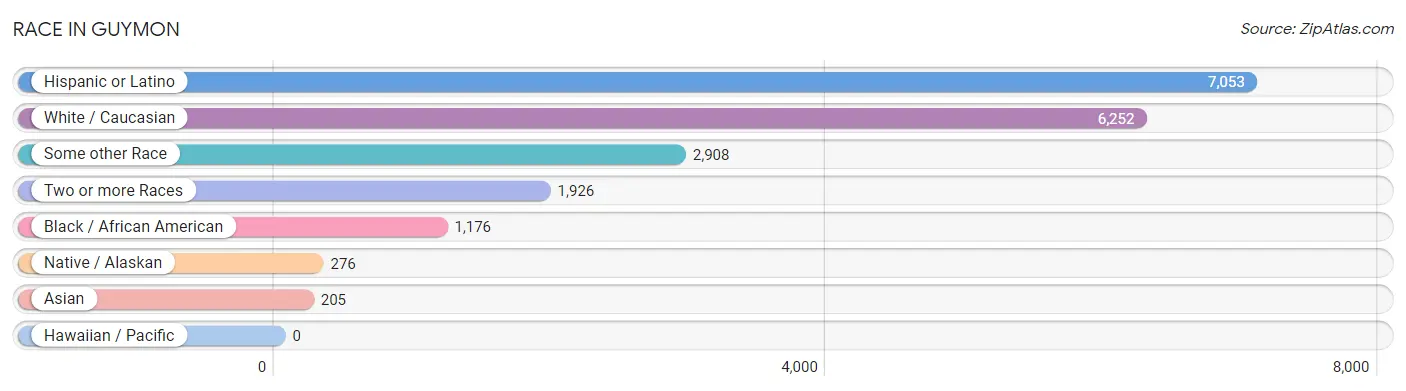
| Race | # Population | % Population |
| Asian | 205 | 1.6% |
| Black / African American | 1,176 | 9.2% |
| Hawaiian / Pacific | 0 | 0.0% |
| Hispanic or Latino | 7,053 | 55.3% |
| Native / Alaskan | 276 | 2.2% |
| White / Caucasian | 6,252 | 49.1% |
| Two or more Races | 1,926 | 15.1% |
| Some other Race | 2,908 | 22.8% |
| Total | 12,743 | 100.0% |
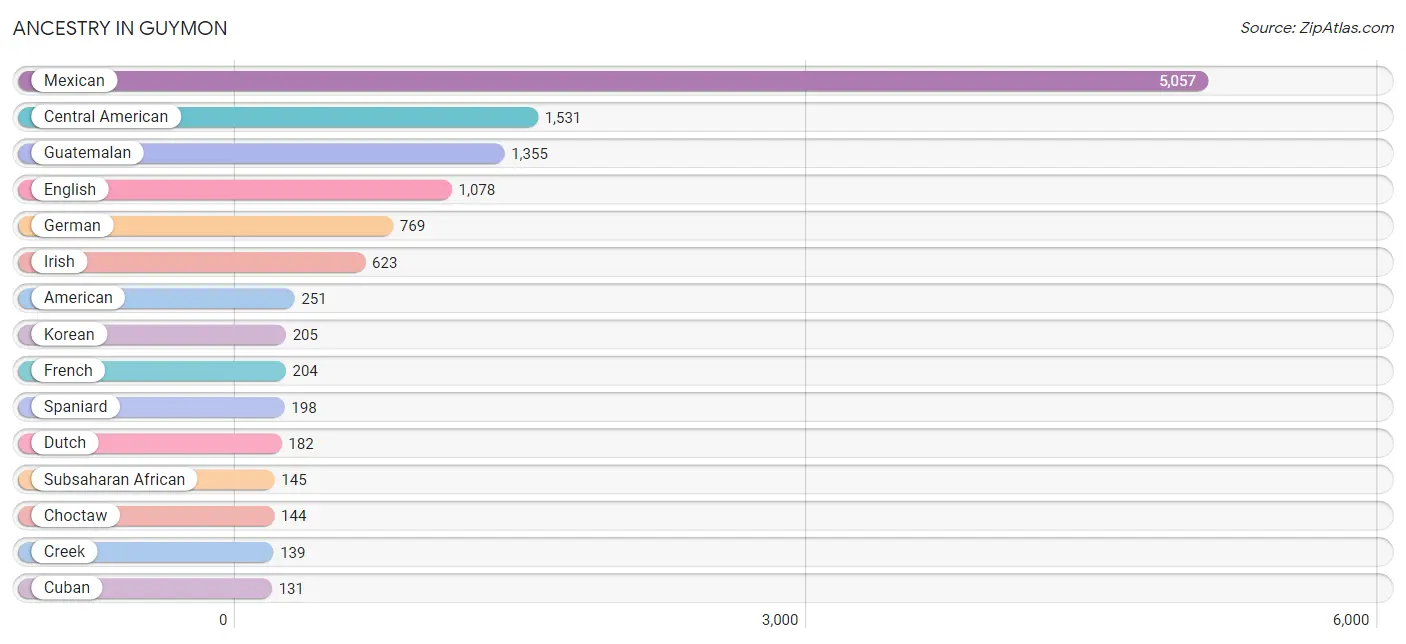
Ancestry in Guymon
The most populous ancestries reported in Guymon are Mexican (5,057 | 39.7%), Central American (1,531 | 12.0%), Guatemalan (1,355 | 10.6%), English (1,078 | 8.5%), and German (769 | 6.0%), together accounting for 76.8% of all Guymon residents.
| Ancestry | # Population | % Population |
| African | 82 | 0.6% |
| American | 251 | 2.0% |
| Apache | 33 | 0.3% |
| British | 9 | 0.1% |
| Central American | 1,531 | 12.0% |
| Central American Indian | 31 | 0.2% |
| Cherokee | 110 | 0.9% |
| Cheyenne | 1 | 0.0% |
| Choctaw | 144 | 1.1% |
| Creek | 139 | 1.1% |
| Cuban | 131 | 1.0% |
| Czech | 25 | 0.2% |
| Dutch | 182 | 1.4% |
| Ecuadorian | 6 | 0.1% |
| English | 1,078 | 8.5% |
| European | 6 | 0.1% |
| French | 204 | 1.6% |
| German | 769 | 6.0% |
| Guatemalan | 1,355 | 10.6% |
| Honduran | 98 | 0.8% |
| Hungarian | 1 | 0.0% |
| Irish | 623 | 4.9% |
| Korean | 205 | 1.6% |
| Mexican | 5,057 | 39.7% |
| Mexican American Indian | 78 | 0.6% |
| Norwegian | 33 | 0.3% |
| Polish | 20 | 0.2% |
| Puerto Rican | 89 | 0.7% |
| Russian | 19 | 0.2% |
| Salvadoran | 78 | 0.6% |
| Scotch-Irish | 80 | 0.6% |
| Scottish | 72 | 0.6% |
| South American | 6 | 0.1% |
| Spaniard | 198 | 1.5% |
| Spanish | 27 | 0.2% |
| Subsaharan African | 145 | 1.1% |
| Sudanese | 63 | 0.5% |
| Swedish | 42 | 0.3% |
| Welsh | 77 | 0.6% | View All 39 Rows |
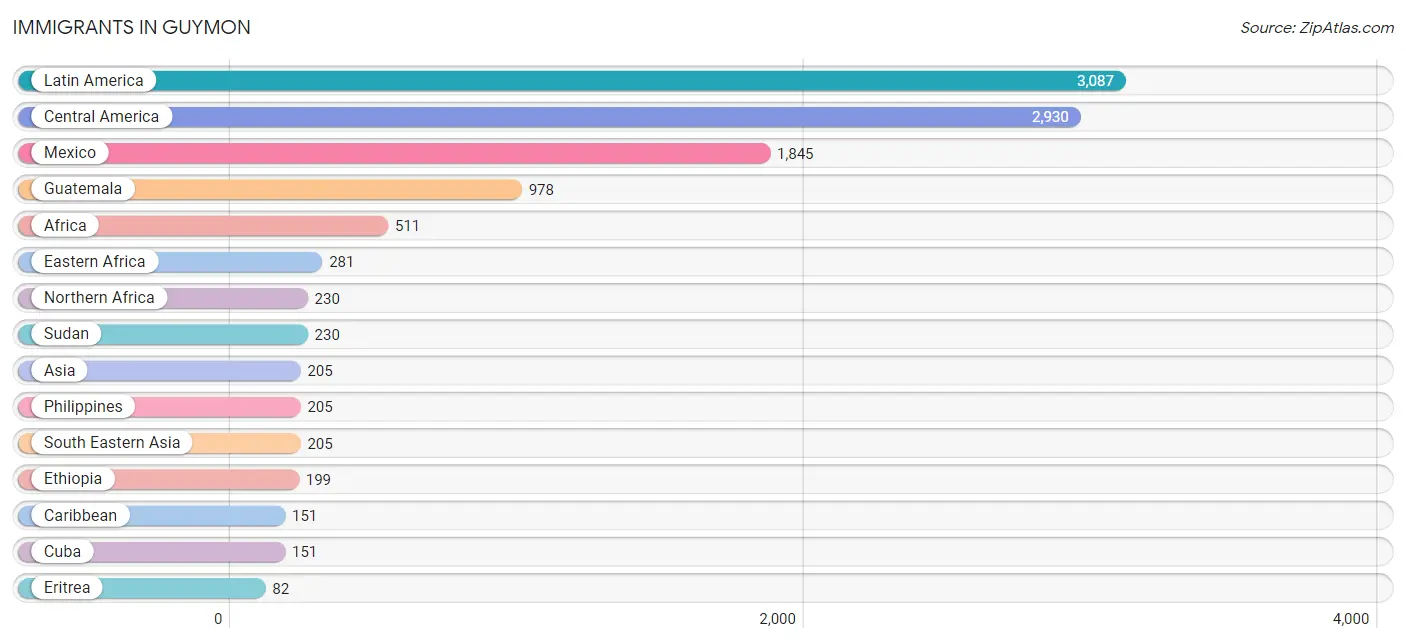
Immigrants in Guymon
The most numerous immigrant groups reported in Guymon came from Latin America (3,087 | 24.2%), Central America (2,930 | 23.0%), Mexico (1,845 | 14.5%), Guatemala (978 | 7.7%), and Africa (511 | 4.0%), together accounting for 73.4% of all Guymon residents.
| Immigration Origin | # Population | % Population |
| Africa | 511 | 4.0% |
| Asia | 205 | 1.6% |
| Caribbean | 151 | 1.2% |
| Central America | 2,930 | 23.0% |
| Cuba | 151 | 1.2% |
| Eastern Africa | 281 | 2.2% |
| Ecuador | 6 | 0.1% |
| El Salvador | 78 | 0.6% |
| England | 21 | 0.2% |
| Eritrea | 82 | 0.6% |
| Ethiopia | 199 | 1.6% |
| Europe | 21 | 0.2% |
| Guatemala | 978 | 7.7% |
| Honduras | 29 | 0.2% |
| Latin America | 3,087 | 24.2% |
| Mexico | 1,845 | 14.5% |
| Northern Africa | 230 | 1.8% |
| Northern Europe | 21 | 0.2% |
| Philippines | 205 | 1.6% |
| South America | 6 | 0.1% |
| South Eastern Asia | 205 | 1.6% |
| Sudan | 230 | 1.8% | View All 22 Rows |
Sex and Age in Guymon
Sex and Age in Guymon
The most populous age groups in Guymon are 25 to 29 Years (764 | 10.8%) for men and 5 to 9 Years (549 | 9.7%) for women.

| Age Bracket | Male | Female |
| Under 5 Years | 657 (9.3%) | 455 (8.0%) |
| 5 to 9 Years | 646 (9.1%) | 549 (9.7%) |
| 10 to 14 Years | 418 (5.9%) | 530 (9.3%) |
| 15 to 19 Years | 554 (7.8%) | 375 (6.6%) |
| 20 to 24 Years | 554 (7.8%) | 347 (6.1%) |
| 25 to 29 Years | 764 (10.8%) | 245 (4.3%) |
| 30 to 34 Years | 554 (7.8%) | 356 (6.3%) |
| 35 to 39 Years | 499 (7.0%) | 510 (9.0%) |
| 40 to 44 Years | 305 (4.3%) | 388 (6.9%) |
| 45 to 49 Years | 513 (7.2%) | 472 (8.3%) |
| 50 to 54 Years | 333 (4.7%) | 352 (6.2%) |
| 55 to 59 Years | 567 (8.0%) | 121 (2.1%) |
| 60 to 64 Years | 257 (3.6%) | 423 (7.5%) |
| 65 to 69 Years | 152 (2.1%) | 310 (5.5%) |
| 70 to 74 Years | 173 (2.5%) | 113 (2.0%) |
| 75 to 79 Years | 95 (1.3%) | 0 (0.0%) |
| 80 to 84 Years | 32 (0.4%) | 45 (0.8%) |
| 85 Years and over | 2 (0.0%) | 77 (1.4%) |
| Total | 7,075 (100.0%) | 5,668 (100.0%) |
Families and Households in Guymon
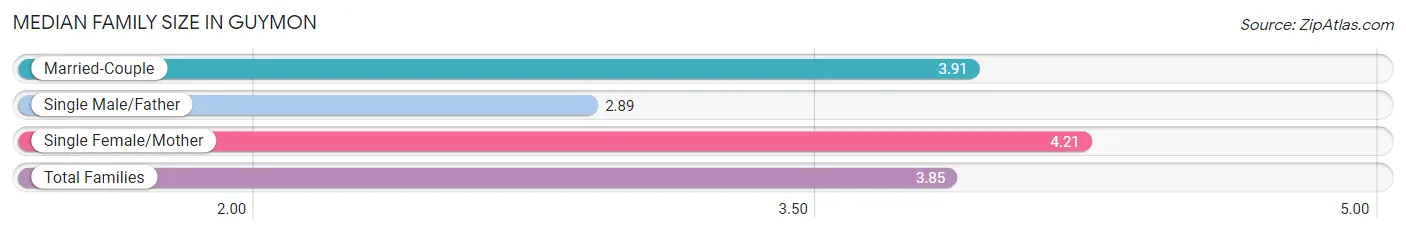
Median Family Size in Guymon
The median family size in Guymon is 3.85 persons per family, with single female/mother families (637 | 24.0%) accounting for the largest median family size of 4.21 persons per family. On the other hand, single male/father families (355 | 13.4%) represent the smallest median family size with 2.89 persons per family.
| Family Type | # Families | Family Size |
| Married-Couple | 1,659 (62.6%) | 3.91 |
| Single Male/Father | 355 (13.4%) | 2.89 |
| Single Female/Mother | 637 (24.0%) | 4.21 |
| Total Families | 2,651 (100.0%) | 3.85 |
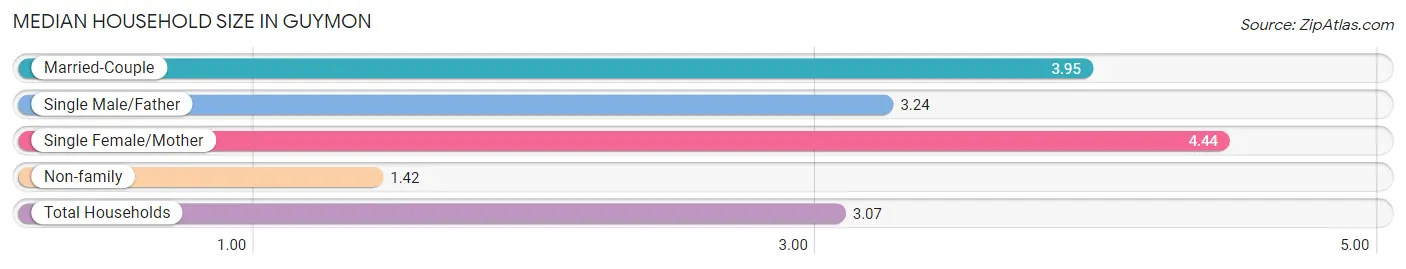
Median Household Size in Guymon
The median household size in Guymon is 3.07 persons per household, with single female/mother households (637 | 15.5%) accounting for the largest median household size of 4.44 persons per household. non-family households (1,461 | 35.5%) represent the smallest median household size with 1.42 persons per household.
| Household Type | # Households | Household Size |
| Married-Couple | 1,659 (40.4%) | 3.95 |
| Single Male/Father | 355 (8.6%) | 3.24 |
| Single Female/Mother | 637 (15.5%) | 4.44 |
| Non-family | 1,461 (35.5%) | 1.42 |
| Total Households | 4,112 (100.0%) | 3.07 |
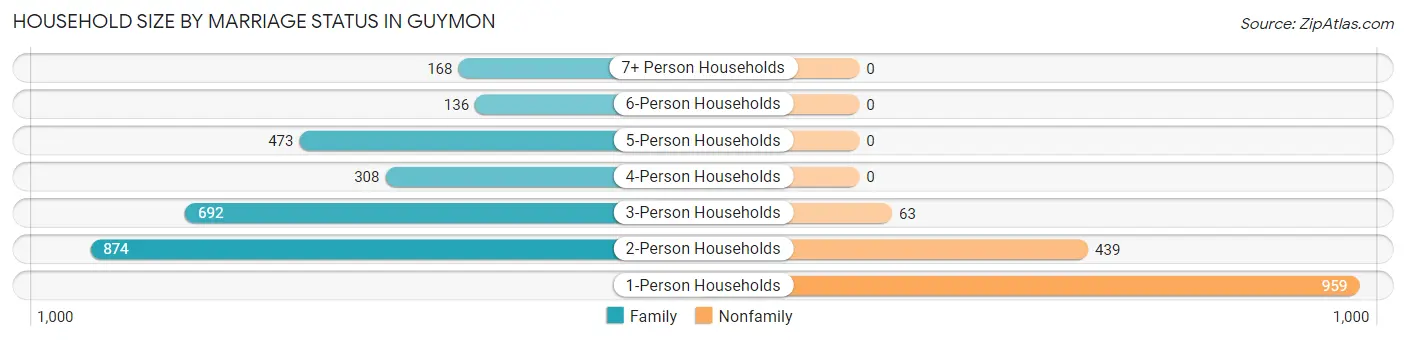
Household Size by Marriage Status in Guymon
Out of a total of 4,112 households in Guymon, 2,651 (64.5%) are family households, while 1,461 (35.5%) are nonfamily households. The most numerous type of family households are 2-person households, comprising 874, and the most common type of nonfamily households are 1-person households, comprising 959.
| Household Size | Family Households | Nonfamily Households |
| 1-Person Households | - | 959 (23.3%) |
| 2-Person Households | 874 (21.2%) | 439 (10.7%) |
| 3-Person Households | 692 (16.8%) | 63 (1.5%) |
| 4-Person Households | 308 (7.5%) | 0 (0.0%) |
| 5-Person Households | 473 (11.5%) | 0 (0.0%) |
| 6-Person Households | 136 (3.3%) | 0 (0.0%) |
| 7+ Person Households | 168 (4.1%) | 0 (0.0%) |
| Total | 2,651 (64.5%) | 1,461 (35.5%) |
Female Fertility in Guymon
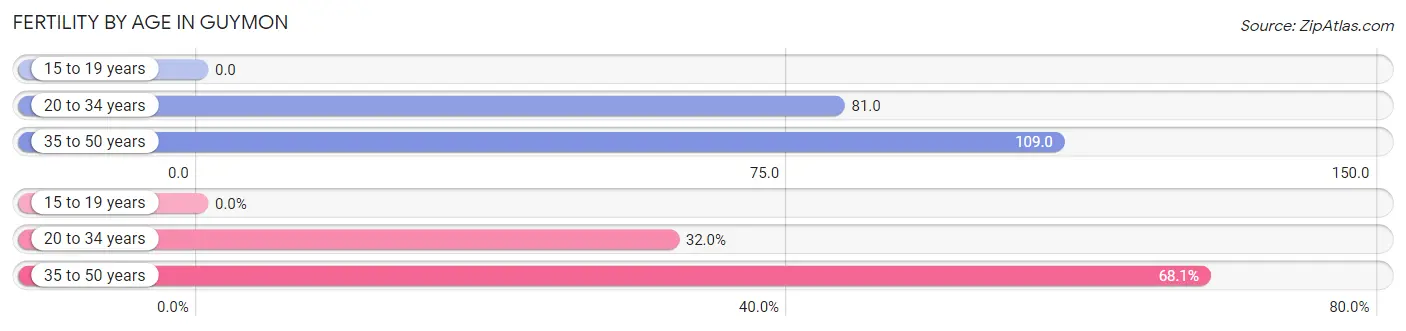
Fertility by Age in Guymon
Average fertility rate in Guymon is 85.0 births per 1,000 women. Women in the age bracket of 35 to 50 years have the highest fertility rate with 109.0 births per 1,000 women. Women in the age bracket of 35 to 50 years acount for 68.0% of all women with births.
| Age Bracket | Women with Births | Births / 1,000 Women |
| 15 to 19 years | 0 (0.0%) | 0.0 |
| 20 to 34 years | 77 (32.0%) | 81.0 |
| 35 to 50 years | 164 (68.0%) | 109.0 |
| Total | 241 (100.0%) | 85.0 |
Fertility by Age by Marriage Status in Guymon
86.7% of women with births (241) in Guymon are married. The highest percentage of unmarried women with births falls into 35 to 50 years age bracket with 19.5% of them unmarried at the time of birth, while the lowest percentage of unmarried women with births belong to 20 to 34 years age bracket with 0.0% of them unmarried.
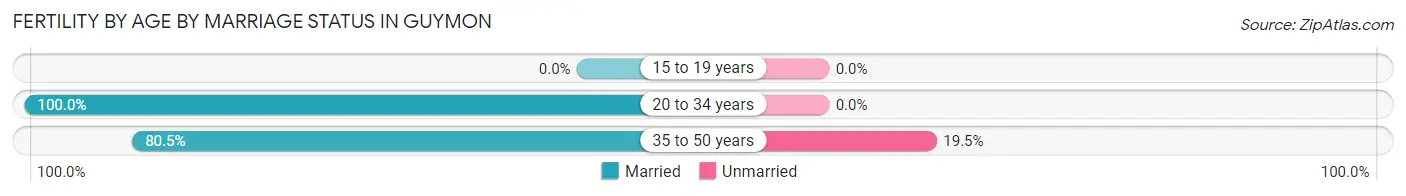
| Age Bracket | Married | Unmarried |
| 15 to 19 years | 0 (0.0%) | 0 (0.0%) |
| 20 to 34 years | 77 (100.0%) | 0 (0.0%) |
| 35 to 50 years | 132 (80.5%) | 32 (19.5%) |
| Total | 209 (86.7%) | 32 (13.3%) |
Fertility by Education in Guymon
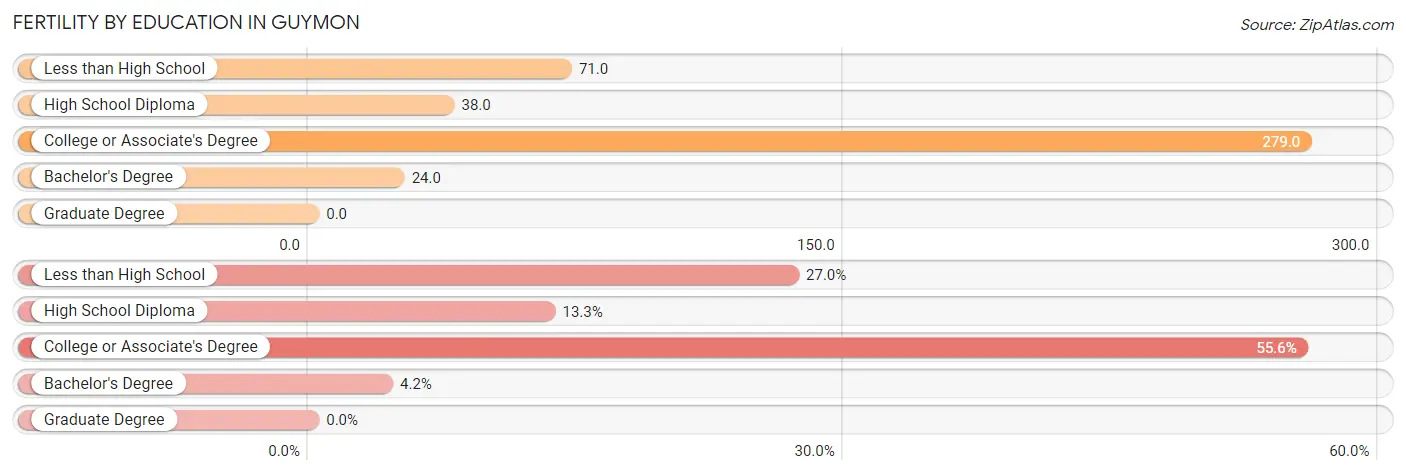
| Educational Attainment | Women with Births | Births / 1,000 Women |
| Less than High School | 65 (27.0%) | 71.0 |
| High School Diploma | 32 (13.3%) | 38.0 |
| College or Associate's Degree | 134 (55.6%) | 279.0 |
| Bachelor's Degree | 10 (4.2%) | 24.0 |
| Graduate Degree | 0 (0.0%) | 0.0 |
| Total | 241 (100.0%) | 85.0 |
Fertility by Education by Marriage Status in Guymon
13.3% of women with births in Guymon are unmarried. Women with the educational attainment of less than high school are most likely to be married with 100.0% of them married at childbirth, while women with the educational attainment of high school diploma are least likely to be married with 100.0% of them unmarried at childbirth.
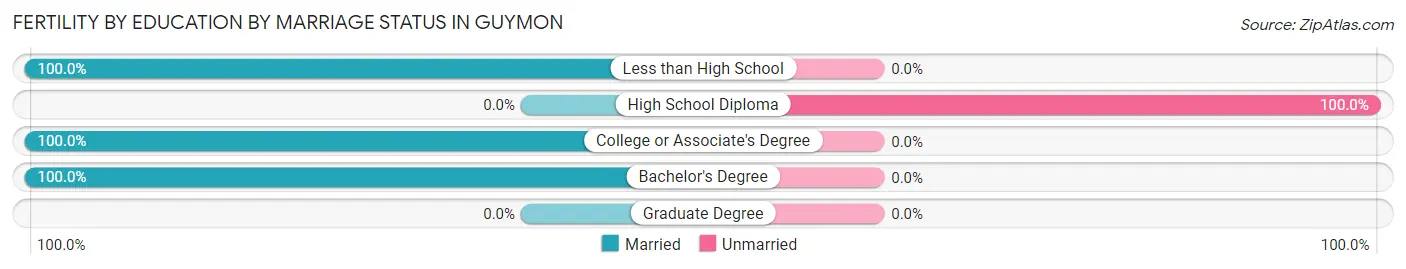
| Educational Attainment | Married | Unmarried |
| Less than High School | 65 (100.0%) | 0 (0.0%) |
| High School Diploma | 0 (0.0%) | 32 (100.0%) |
| College or Associate's Degree | 134 (100.0%) | 0 (0.0%) |
| Bachelor's Degree | 10 (100.0%) | 0 (0.0%) |
| Graduate Degree | 0 (0.0%) | 0 (0.0%) |
| Total | 209 (86.7%) | 32 (13.3%) |
Employment Characteristics in Guymon
Employment by Class of Employer in Guymon
Among the 6,455 employed individuals in Guymon, private company employees (4,809 | 74.5%), state government employees (574 | 8.9%), and local government employees (343 | 5.3%) make up the most common classes of employment.
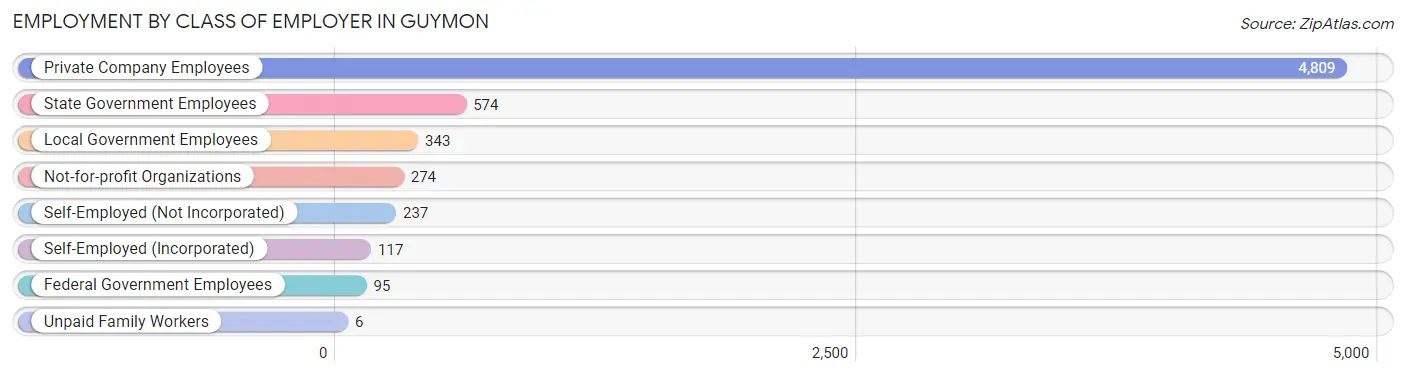
| Employer Class | # Employees | % Employees |
| Private Company Employees | 4,809 | 74.5% |
| Self-Employed (Incorporated) | 117 | 1.8% |
| Self-Employed (Not Incorporated) | 237 | 3.7% |
| Not-for-profit Organizations | 274 | 4.2% |
| Local Government Employees | 343 | 5.3% |
| State Government Employees | 574 | 8.9% |
| Federal Government Employees | 95 | 1.5% |
| Unpaid Family Workers | 6 | 0.1% |
| Total | 6,455 | 100.0% |
Employment Status by Age in Guymon
According to the labor force statistics for Guymon, out of the total population over 16 years of age (9,335), 71.8% or 6,703 individuals are in the labor force, with 2.8% or 188 of them unemployed. The age group with the highest labor force participation rate is 55 to 59 years, with 94.3% or 649 individuals in the labor force. Within the labor force, the 25 to 29 years age range has the highest percentage of unemployed individuals, with 7.6% or 60 of them being unemployed.
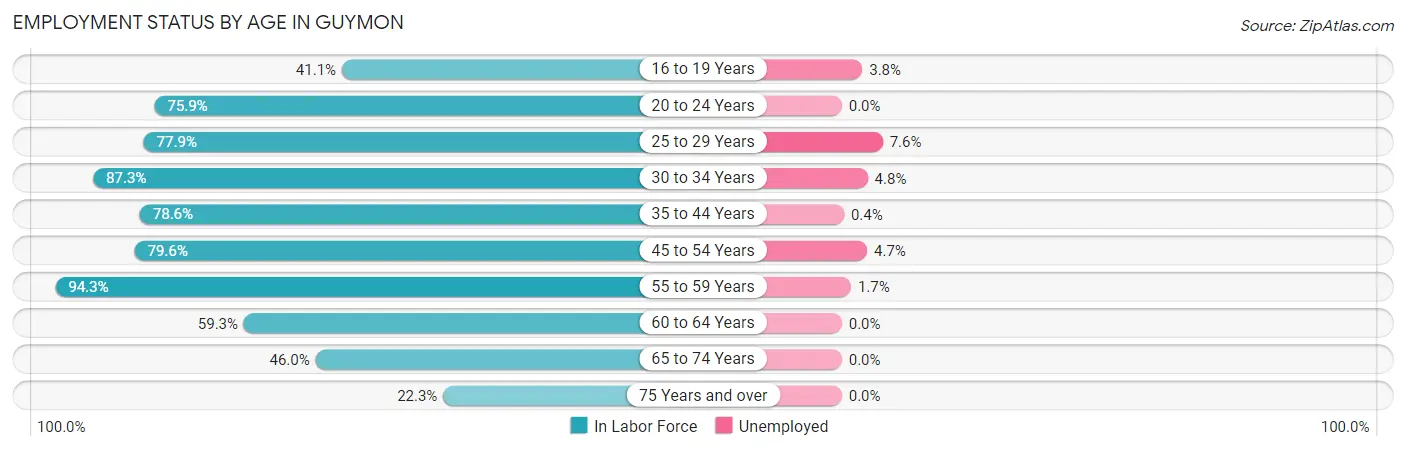
| Age Bracket | In Labor Force | Unemployed |
| 16 to 19 Years | 319 (41.1%) | 12 (3.8%) |
| 20 to 24 Years | 684 (75.9%) | 0 (0.0%) |
| 25 to 29 Years | 786 (77.9%) | 60 (7.6%) |
| 30 to 34 Years | 794 (87.3%) | 38 (4.8%) |
| 35 to 44 Years | 1,338 (78.6%) | 5 (0.4%) |
| 45 to 54 Years | 1,329 (79.6%) | 62 (4.7%) |
| 55 to 59 Years | 649 (94.3%) | 11 (1.7%) |
| 60 to 64 Years | 403 (59.3%) | 0 (0.0%) |
| 65 to 74 Years | 344 (46.0%) | 0 (0.0%) |
| 75 Years and over | 56 (22.3%) | 0 (0.0%) |
| Total | 6,703 (71.8%) | 188 (2.8%) |
Employment Status by Educational Attainment in Guymon
According to labor force statistics for Guymon, 79.6% of individuals (5,301) out of the total population between 25 and 64 years of age (6,659) are in the labor force, with 3.3% or 175 of them being unemployed. The group with the highest labor force participation rate are those with the educational attainment of bachelor's degree or higher, with 93.0% or 1,281 individuals in the labor force. Within the labor force, individuals with less than high school education have the highest percentage of unemployment, with 7.6% or 113 of them being unemployed.
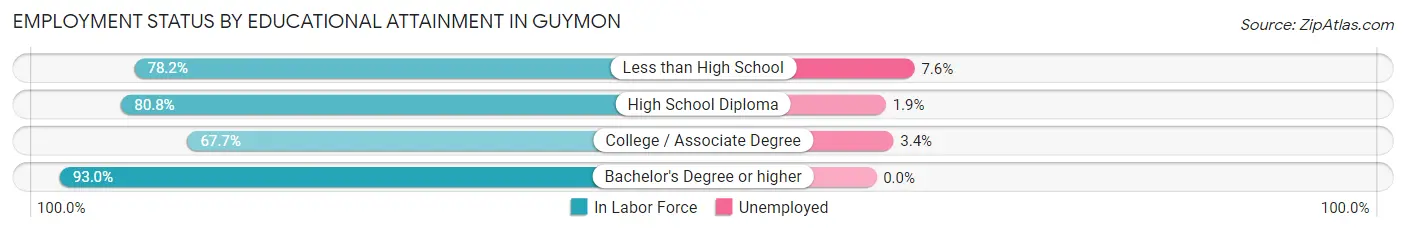
| Educational Attainment | In Labor Force | Unemployed |
| Less than High School | 1,488 (78.2%) | 145 (7.6%) |
| High School Diploma | 1,499 (80.8%) | 35 (1.9%) |
| College / Associate Degree | 1,032 (67.7%) | 52 (3.4%) |
| Bachelor's Degree or higher | 1,281 (93.0%) | 0 (0.0%) |
| Total | 5,301 (79.6%) | 220 (3.3%) |
Employment Occupations by Sex in Guymon
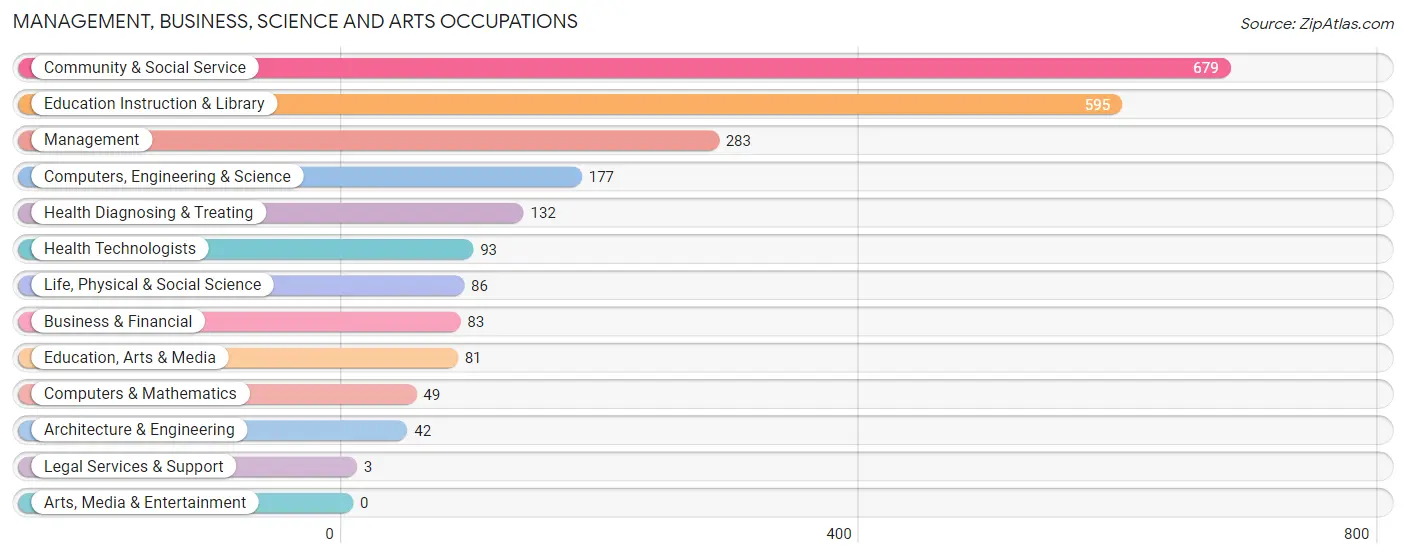
Management, Business, Science and Arts Occupations
The most common Management, Business, Science and Arts occupations in Guymon are Community & Social Service (679 | 10.4%), Education Instruction & Library (595 | 9.1%), Management (283 | 4.3%), Computers, Engineering & Science (177 | 2.7%), and Health Diagnosing & Treating (132 | 2.0%).
Management, Business, Science and Arts Occupations by Sex
Within the Management, Business, Science and Arts occupations in Guymon, the most male-oriented occupations are Architecture & Engineering (100.0%), Education, Arts & Media (79.0%), and Management (64.7%), while the most female-oriented occupations are Legal Services & Support (100.0%), Business & Financial (74.7%), and Health Technologists (74.2%).
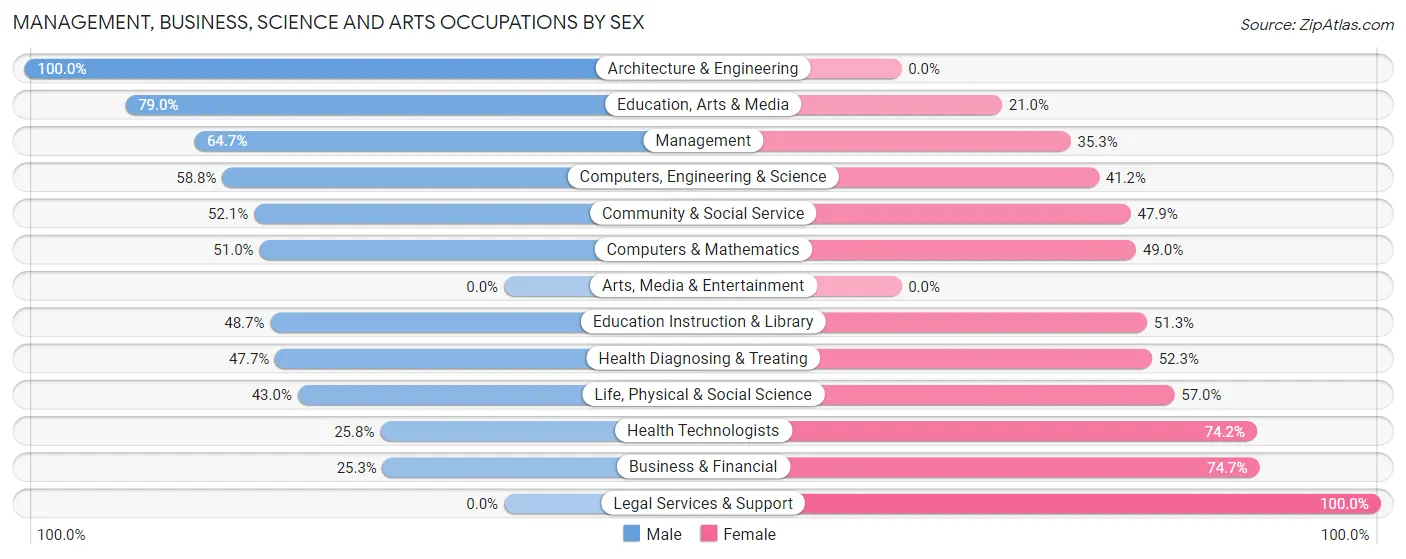
| Occupation | Male | Female |
| Management | 183 (64.7%) | 100 (35.3%) |
| Business & Financial | 21 (25.3%) | 62 (74.7%) |
| Computers, Engineering & Science | 104 (58.8%) | 73 (41.2%) |
| Computers & Mathematics | 25 (51.0%) | 24 (49.0%) |
| Architecture & Engineering | 42 (100.0%) | 0 (0.0%) |
| Life, Physical & Social Science | 37 (43.0%) | 49 (57.0%) |
| Community & Social Service | 354 (52.1%) | 325 (47.9%) |
| Education, Arts & Media | 64 (79.0%) | 17 (21.0%) |
| Legal Services & Support | 0 (0.0%) | 3 (100.0%) |
| Education Instruction & Library | 290 (48.7%) | 305 (51.3%) |
| Arts, Media & Entertainment | 0 (0.0%) | 0 (0.0%) |
| Health Diagnosing & Treating | 63 (47.7%) | 69 (52.3%) |
| Health Technologists | 24 (25.8%) | 69 (74.2%) |
| Total (Category) | 725 (53.5%) | 629 (46.5%) |
| Total (Overall) | 4,065 (62.4%) | 2,449 (37.6%) |
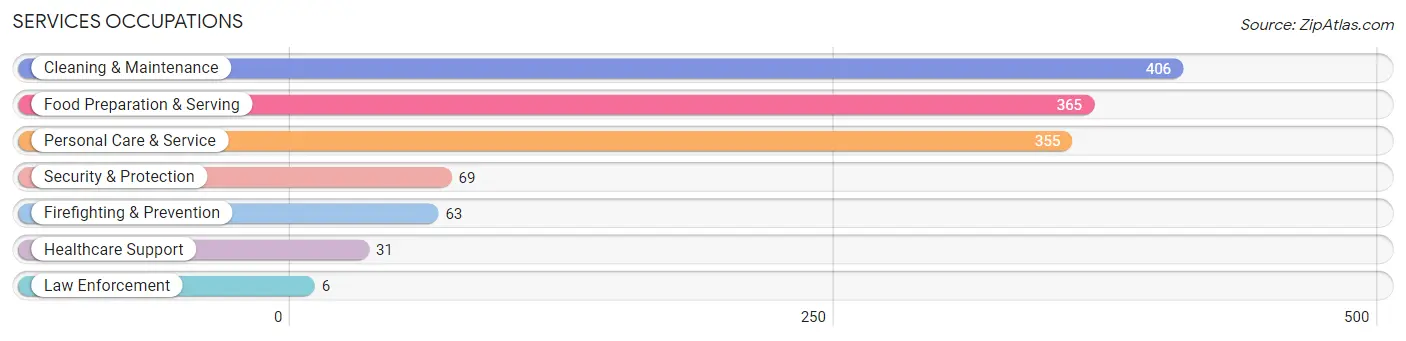
Services Occupations
The most common Services occupations in Guymon are Cleaning & Maintenance (406 | 6.2%), Food Preparation & Serving (365 | 5.6%), Personal Care & Service (355 | 5.4%), Security & Protection (69 | 1.1%), and Firefighting & Prevention (63 | 1.0%).
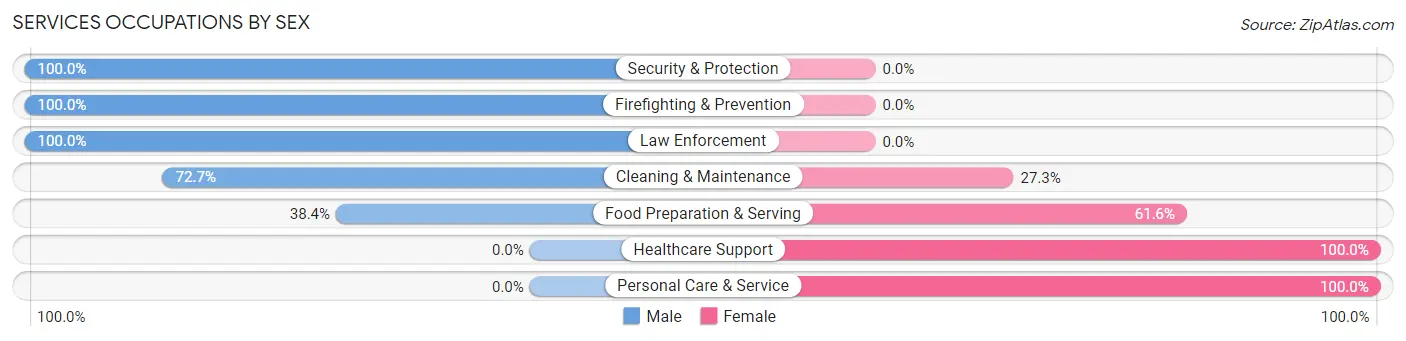
Services Occupations by Sex
Within the Services occupations in Guymon, the most male-oriented occupations are Security & Protection (100.0%), Firefighting & Prevention (100.0%), and Law Enforcement (100.0%), while the most female-oriented occupations are Healthcare Support (100.0%), Personal Care & Service (100.0%), and Food Preparation & Serving (61.6%).
| Occupation | Male | Female |
| Healthcare Support | 0 (0.0%) | 31 (100.0%) |
| Security & Protection | 69 (100.0%) | 0 (0.0%) |
| Firefighting & Prevention | 63 (100.0%) | 0 (0.0%) |
| Law Enforcement | 6 (100.0%) | 0 (0.0%) |
| Food Preparation & Serving | 140 (38.4%) | 225 (61.6%) |
| Cleaning & Maintenance | 295 (72.7%) | 111 (27.3%) |
| Personal Care & Service | 0 (0.0%) | 355 (100.0%) |
| Total (Category) | 504 (41.1%) | 722 (58.9%) |
| Total (Overall) | 4,065 (62.4%) | 2,449 (37.6%) |
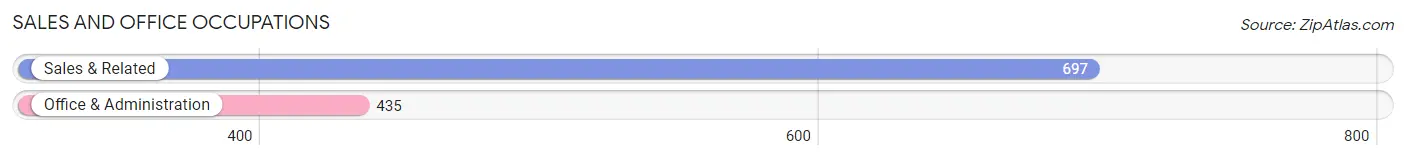
Sales and Office Occupations
The most common Sales and Office occupations in Guymon are Sales & Related (697 | 10.7%), and Office & Administration (435 | 6.7%).
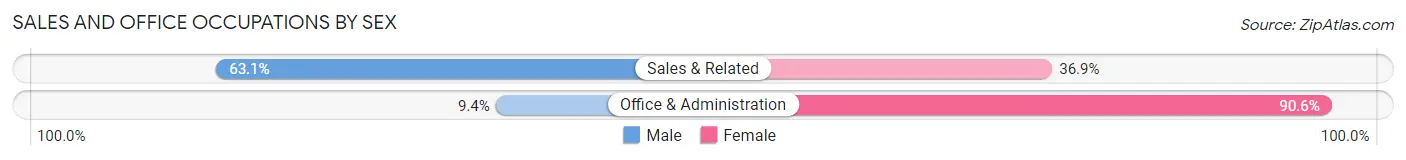
Sales and Office Occupations by Sex
| Occupation | Male | Female |
| Sales & Related | 440 (63.1%) | 257 (36.9%) |
| Office & Administration | 41 (9.4%) | 394 (90.6%) |
| Total (Category) | 481 (42.5%) | 651 (57.5%) |
| Total (Overall) | 4,065 (62.4%) | 2,449 (37.6%) |
Natural Resources, Construction and Maintenance Occupations
The most common Natural Resources, Construction and Maintenance occupations in Guymon are Construction & Extraction (1,019 | 15.6%), Installation, Maintenance & Repair (293 | 4.5%), and Farming, Fishing & Forestry (214 | 3.3%).
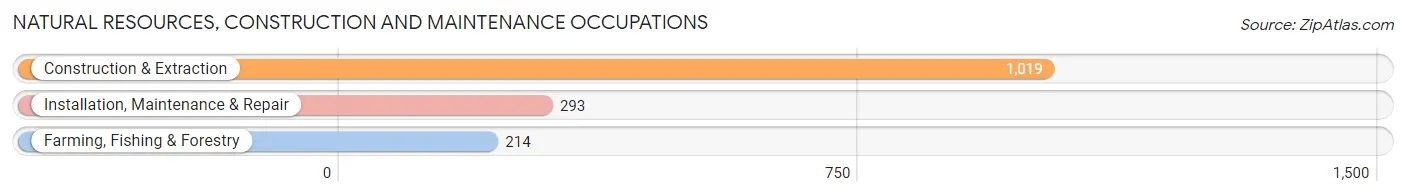
Natural Resources, Construction and Maintenance Occupations by Sex
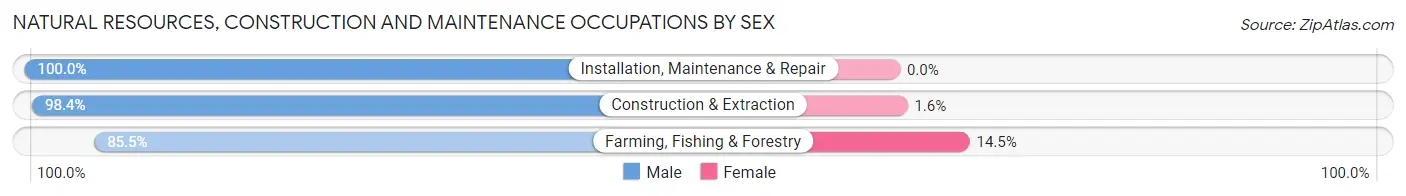
| Occupation | Male | Female |
| Farming, Fishing & Forestry | 183 (85.5%) | 31 (14.5%) |
| Construction & Extraction | 1,003 (98.4%) | 16 (1.6%) |
| Installation, Maintenance & Repair | 293 (100.0%) | 0 (0.0%) |
| Total (Category) | 1,479 (96.9%) | 47 (3.1%) |
| Total (Overall) | 4,065 (62.4%) | 2,449 (37.6%) |
Production, Transportation and Moving Occupations
The most common Production, Transportation and Moving occupations in Guymon are Production (964 | 14.8%), Material Moving (181 | 2.8%), and Transportation (131 | 2.0%).
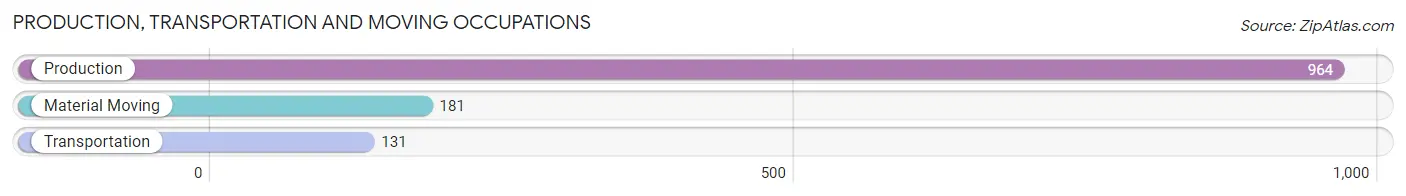
Production, Transportation and Moving Occupations by Sex
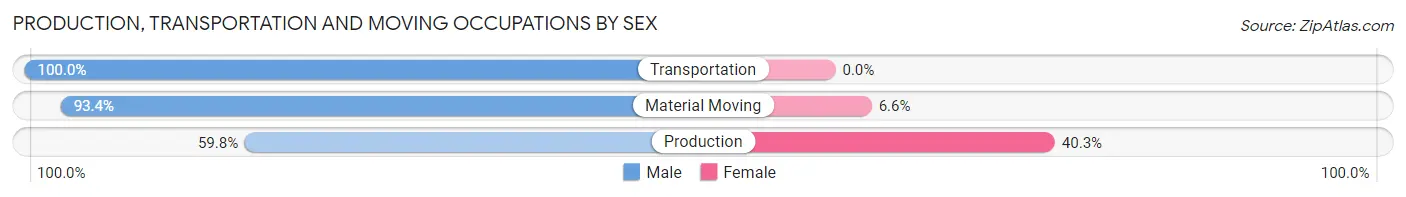
| Occupation | Male | Female |
| Production | 576 (59.8%) | 388 (40.3%) |
| Transportation | 131 (100.0%) | 0 (0.0%) |
| Material Moving | 169 (93.4%) | 12 (6.6%) |
| Total (Category) | 876 (68.6%) | 400 (31.4%) |
| Total (Overall) | 4,065 (62.4%) | 2,449 (37.6%) |
Employment Industries by Sex in Guymon
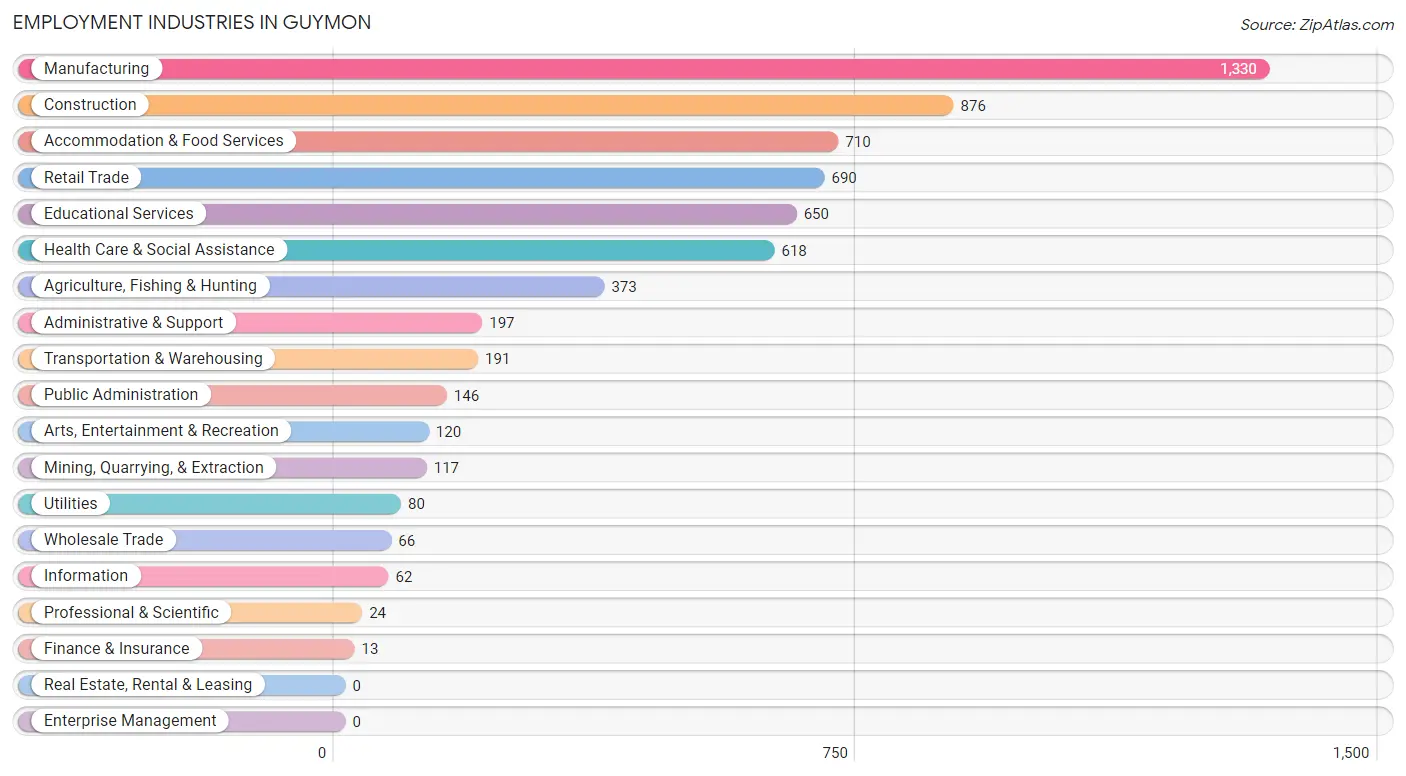
Employment Industries in Guymon
The major employment industries in Guymon include Manufacturing (1,330 | 20.4%), Construction (876 | 13.5%), Accommodation & Food Services (710 | 10.9%), Retail Trade (690 | 10.6%), and Educational Services (650 | 10.0%).
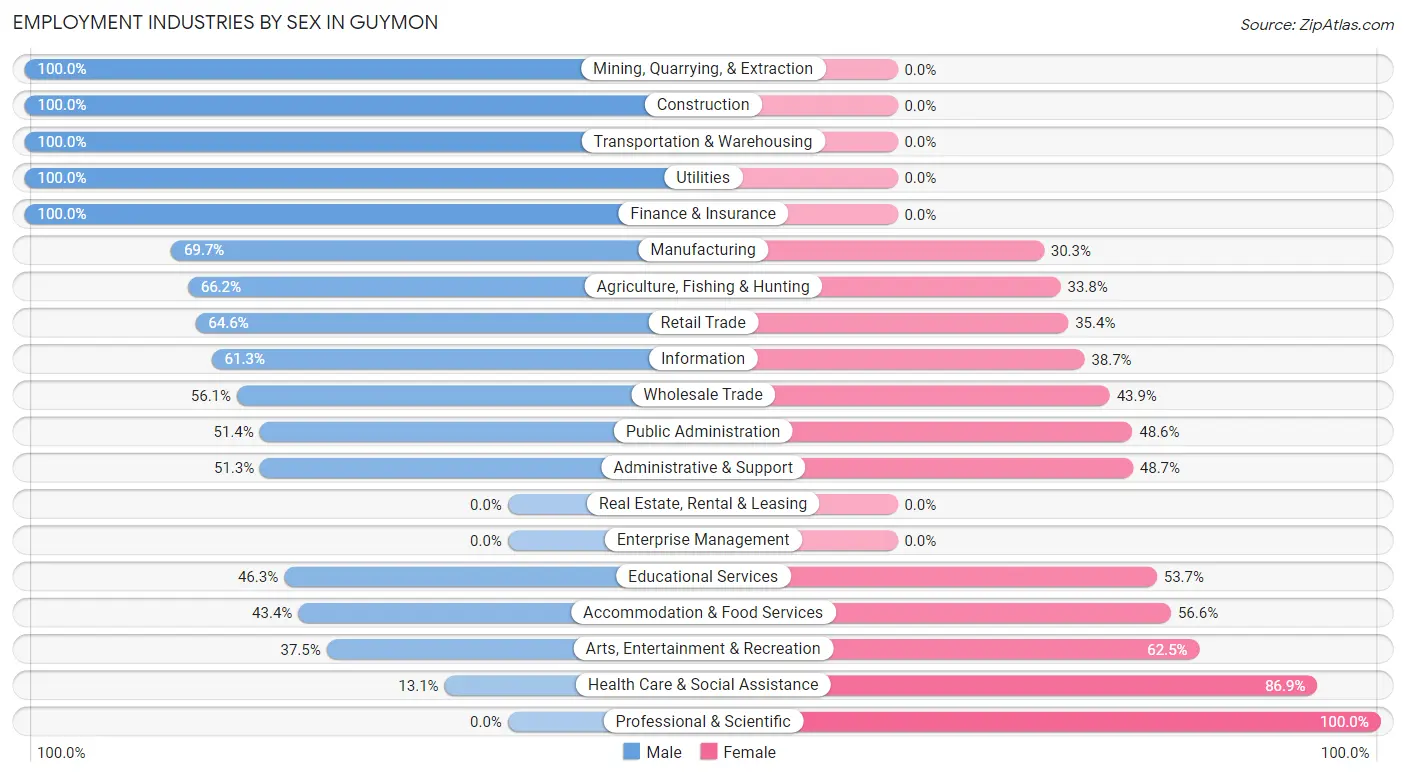
Employment Industries by Sex in Guymon
The Guymon industries that see more men than women are Mining, Quarrying, & Extraction (100.0%), Construction (100.0%), and Transportation & Warehousing (100.0%), whereas the industries that tend to have a higher number of women are Professional & Scientific (100.0%), Health Care & Social Assistance (86.9%), and Arts, Entertainment & Recreation (62.5%).
| Industry | Male | Female |
| Agriculture, Fishing & Hunting | 247 (66.2%) | 126 (33.8%) |
| Mining, Quarrying, & Extraction | 117 (100.0%) | 0 (0.0%) |
| Construction | 876 (100.0%) | 0 (0.0%) |
| Manufacturing | 927 (69.7%) | 403 (30.3%) |
| Wholesale Trade | 37 (56.1%) | 29 (43.9%) |
| Retail Trade | 446 (64.6%) | 244 (35.4%) |
| Transportation & Warehousing | 191 (100.0%) | 0 (0.0%) |
| Utilities | 80 (100.0%) | 0 (0.0%) |
| Information | 38 (61.3%) | 24 (38.7%) |
| Finance & Insurance | 13 (100.0%) | 0 (0.0%) |
| Real Estate, Rental & Leasing | 0 (0.0%) | 0 (0.0%) |
| Professional & Scientific | 0 (0.0%) | 24 (100.0%) |
| Enterprise Management | 0 (0.0%) | 0 (0.0%) |
| Administrative & Support | 101 (51.3%) | 96 (48.7%) |
| Educational Services | 301 (46.3%) | 349 (53.7%) |
| Health Care & Social Assistance | 81 (13.1%) | 537 (86.9%) |
| Arts, Entertainment & Recreation | 45 (37.5%) | 75 (62.5%) |
| Accommodation & Food Services | 308 (43.4%) | 402 (56.6%) |
| Public Administration | 75 (51.4%) | 71 (48.6%) |
| Total | 4,065 (62.4%) | 2,449 (37.6%) |
Education in Guymon
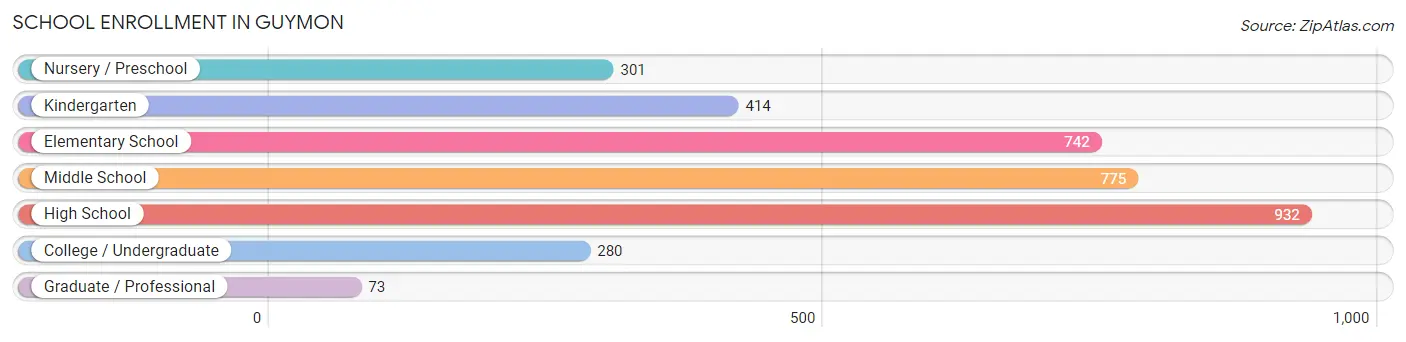
School Enrollment in Guymon
The most common levels of schooling among the 3,517 students in Guymon are high school (932 | 26.5%), middle school (775 | 22.0%), and elementary school (742 | 21.1%).
| School Level | # Students | % Students |
| Nursery / Preschool | 301 | 8.6% |
| Kindergarten | 414 | 11.8% |
| Elementary School | 742 | 21.1% |
| Middle School | 775 | 22.0% |
| High School | 932 | 26.5% |
| College / Undergraduate | 280 | 8.0% |
| Graduate / Professional | 73 | 2.1% |
| Total | 3,517 | 100.0% |
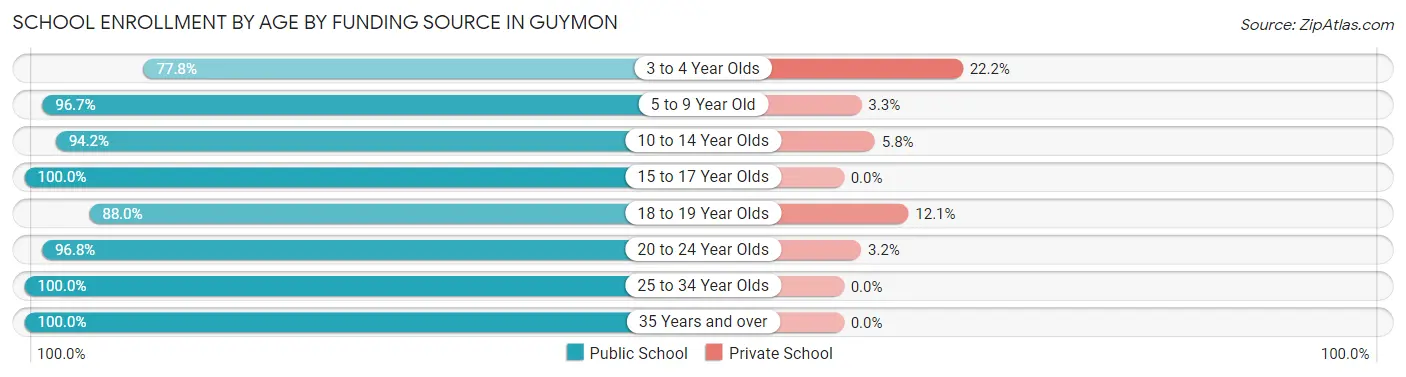
School Enrollment by Age by Funding Source in Guymon
Out of a total of 3,517 students who are enrolled in schools in Guymon, 176 (5.0%) attend a private institution, while the remaining 3,341 (95.0%) are enrolled in public schools. The age group of 3 to 4 year olds has the highest likelihood of being enrolled in private schools, with 49 (22.2% in the age bracket) enrolled. Conversely, the age group of 15 to 17 year olds has the lowest likelihood of being enrolled in a private school, with 653 (100.0% in the age bracket) attending a public institution.
| Age Bracket | Public School | Private School |
| 3 to 4 Year Olds | 172 (77.8%) | 49 (22.2%) |
| 5 to 9 Year Old | 1,144 (96.7%) | 39 (3.3%) |
| 10 to 14 Year Olds | 828 (94.2%) | 51 (5.8%) |
| 15 to 17 Year Olds | 653 (100.0%) | 0 (0.0%) |
| 18 to 19 Year Olds | 219 (87.9%) | 30 (12.0%) |
| 20 to 24 Year Olds | 179 (96.8%) | 6 (3.2%) |
| 25 to 34 Year Olds | 129 (100.0%) | 0 (0.0%) |
| 35 Years and over | 18 (100.0%) | 0 (0.0%) |
| Total | 3,341 (95.0%) | 176 (5.0%) |
Educational Attainment by Field of Study in Guymon
Education (514 | 32.4%), bio, nature & agricultural (390 | 24.6%), visual & performing arts (230 | 14.5%), engineering (170 | 10.7%), and business (123 | 7.7%) are the most common fields of study among 1,588 individuals in Guymon who have obtained a bachelor's degree or higher.
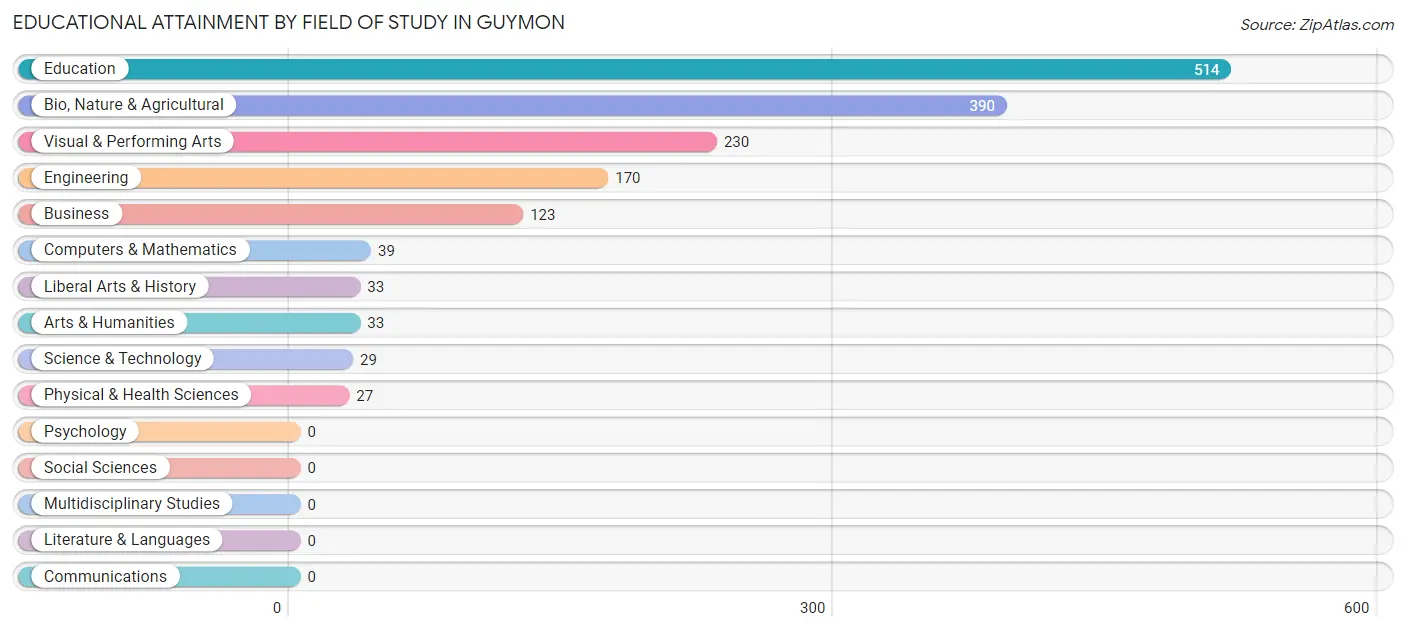
| Field of Study | # Graduates | % Graduates |
| Computers & Mathematics | 39 | 2.5% |
| Bio, Nature & Agricultural | 390 | 24.6% |
| Physical & Health Sciences | 27 | 1.7% |
| Psychology | 0 | 0.0% |
| Social Sciences | 0 | 0.0% |
| Engineering | 170 | 10.7% |
| Multidisciplinary Studies | 0 | 0.0% |
| Science & Technology | 29 | 1.8% |
| Business | 123 | 7.7% |
| Education | 514 | 32.4% |
| Literature & Languages | 0 | 0.0% |
| Liberal Arts & History | 33 | 2.1% |
| Visual & Performing Arts | 230 | 14.5% |
| Communications | 0 | 0.0% |
| Arts & Humanities | 33 | 2.1% |
| Total | 1,588 | 100.0% |
Transportation & Commute in Guymon
Vehicle Availability by Sex in Guymon
The most prevalent vehicle ownership categories in Guymon are males with 2 vehicles (1,679, accounting for 42.0%) and females with 2 vehicles (1,060, making up 68.6%).
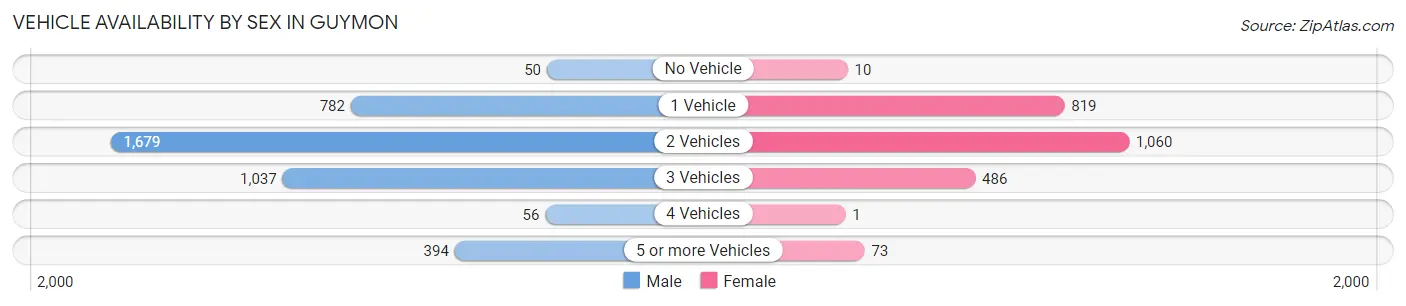
| Vehicles Available | Male | Female |
| No Vehicle | 50 (1.3%) | 10 (0.4%) |
| 1 Vehicle | 782 (19.6%) | 819 (33.4%) |
| 2 Vehicles | 1,679 (42.0%) | 1,060 (43.3%) |
| 3 Vehicles | 1,037 (25.9%) | 486 (19.8%) |
| 4 Vehicles | 56 (1.4%) | 1 (0.0%) |
| 5 or more Vehicles | 394 (9.9%) | 73 (3.0%) |
| Total | 3,998 (100.0%) | 2,449 (100.0%) |
Commute Time in Guymon
The most frequently occuring commute durations in Guymon are 5 to 9 minutes (2,486 commuters, 39.2%), 10 to 14 minutes (1,805 commuters, 28.5%), and less than 5 minutes (670 commuters, 10.6%).
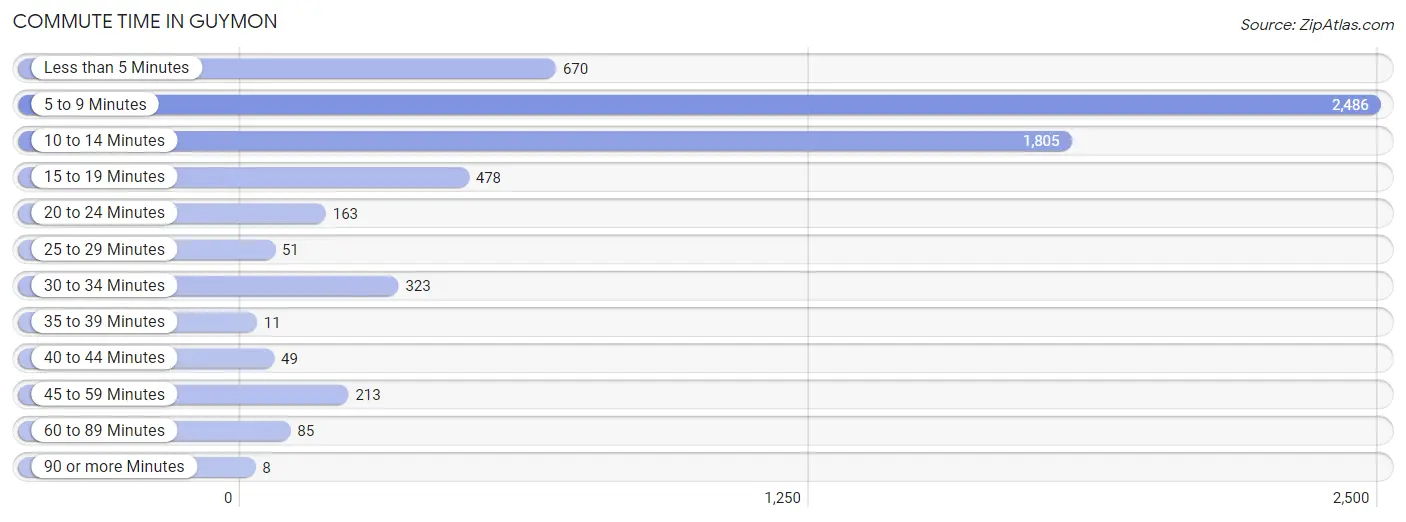
| Commute Time | # Commuters | % Commuters |
| Less than 5 Minutes | 670 | 10.6% |
| 5 to 9 Minutes | 2,486 | 39.2% |
| 10 to 14 Minutes | 1,805 | 28.5% |
| 15 to 19 Minutes | 478 | 7.5% |
| 20 to 24 Minutes | 163 | 2.6% |
| 25 to 29 Minutes | 51 | 0.8% |
| 30 to 34 Minutes | 323 | 5.1% |
| 35 to 39 Minutes | 11 | 0.2% |
| 40 to 44 Minutes | 49 | 0.8% |
| 45 to 59 Minutes | 213 | 3.4% |
| 60 to 89 Minutes | 85 | 1.3% |
| 90 or more Minutes | 8 | 0.1% |
Commute Time by Sex in Guymon
The most common commute times in Guymon are 5 to 9 minutes (1,399 commuters, 35.5%) for males and 5 to 9 minutes (1,087 commuters, 45.2%) for females.
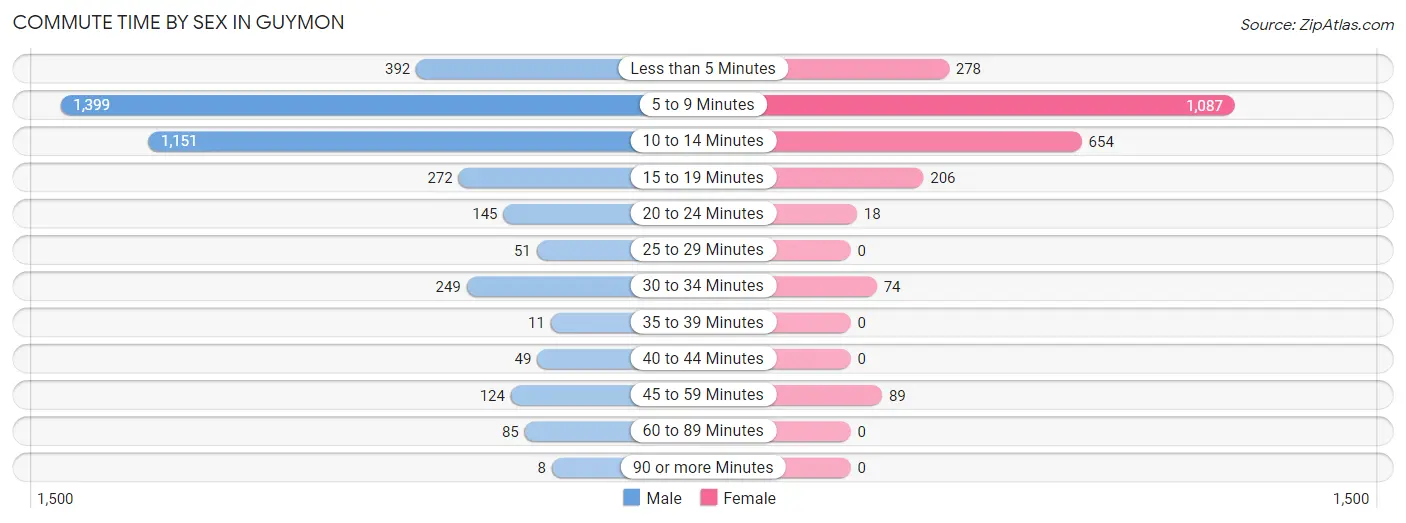
| Commute Time | Male | Female |
| Less than 5 Minutes | 392 (10.0%) | 278 (11.6%) |
| 5 to 9 Minutes | 1,399 (35.5%) | 1,087 (45.2%) |
| 10 to 14 Minutes | 1,151 (29.2%) | 654 (27.2%) |
| 15 to 19 Minutes | 272 (6.9%) | 206 (8.6%) |
| 20 to 24 Minutes | 145 (3.7%) | 18 (0.7%) |
| 25 to 29 Minutes | 51 (1.3%) | 0 (0.0%) |
| 30 to 34 Minutes | 249 (6.3%) | 74 (3.1%) |
| 35 to 39 Minutes | 11 (0.3%) | 0 (0.0%) |
| 40 to 44 Minutes | 49 (1.2%) | 0 (0.0%) |
| 45 to 59 Minutes | 124 (3.2%) | 89 (3.7%) |
| 60 to 89 Minutes | 85 (2.2%) | 0 (0.0%) |
| 90 or more Minutes | 8 (0.2%) | 0 (0.0%) |
Time of Departure to Work by Sex in Guymon
The most frequent times of departure to work in Guymon are 7:30 AM to 7:59 AM (613, 15.6%) for males and 7:30 AM to 7:59 AM (506, 21.0%) for females.
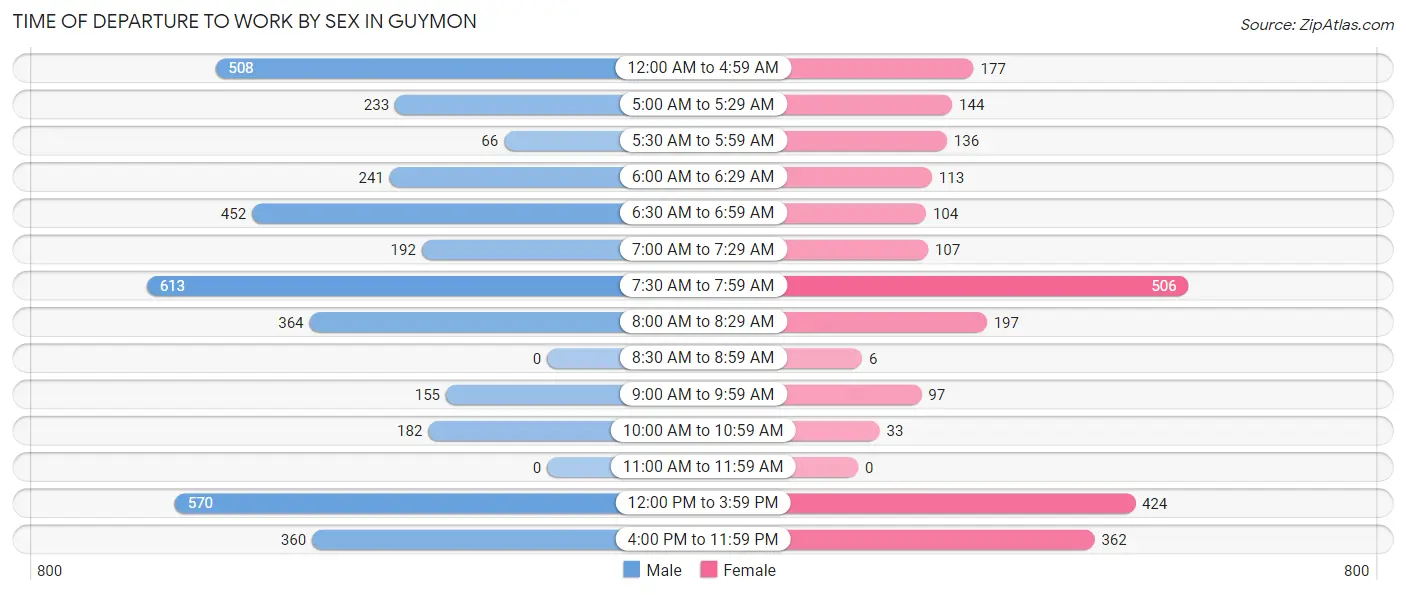
| Time of Departure | Male | Female |
| 12:00 AM to 4:59 AM | 508 (12.9%) | 177 (7.4%) |
| 5:00 AM to 5:29 AM | 233 (5.9%) | 144 (6.0%) |
| 5:30 AM to 5:59 AM | 66 (1.7%) | 136 (5.7%) |
| 6:00 AM to 6:29 AM | 241 (6.1%) | 113 (4.7%) |
| 6:30 AM to 6:59 AM | 452 (11.5%) | 104 (4.3%) |
| 7:00 AM to 7:29 AM | 192 (4.9%) | 107 (4.4%) |
| 7:30 AM to 7:59 AM | 613 (15.6%) | 506 (21.0%) |
| 8:00 AM to 8:29 AM | 364 (9.2%) | 197 (8.2%) |
| 8:30 AM to 8:59 AM | 0 (0.0%) | 6 (0.3%) |
| 9:00 AM to 9:59 AM | 155 (3.9%) | 97 (4.0%) |
| 10:00 AM to 10:59 AM | 182 (4.6%) | 33 (1.4%) |
| 11:00 AM to 11:59 AM | 0 (0.0%) | 0 (0.0%) |
| 12:00 PM to 3:59 PM | 570 (14.5%) | 424 (17.6%) |
| 4:00 PM to 11:59 PM | 360 (9.1%) | 362 (15.0%) |
| Total | 3,936 (100.0%) | 2,406 (100.0%) |
Housing Occupancy in Guymon
Occupancy by Ownership in Guymon
Of the total 4,112 dwellings in Guymon, owner-occupied units account for 2,618 (63.7%), while renter-occupied units make up 1,494 (36.3%).
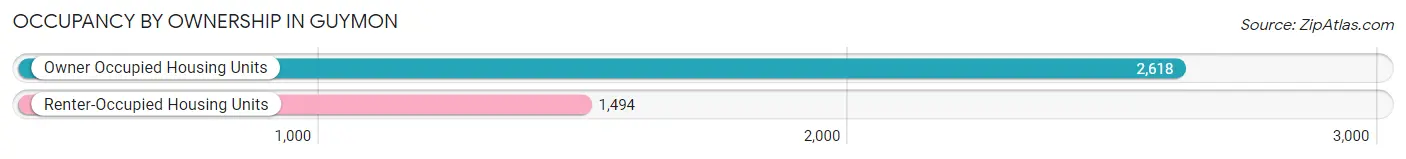
| Occupancy | # Housing Units | % Housing Units |
| Owner Occupied Housing Units | 2,618 | 63.7% |
| Renter-Occupied Housing Units | 1,494 | 36.3% |
| Total Occupied Housing Units | 4,112 | 100.0% |
Occupancy by Household Size in Guymon
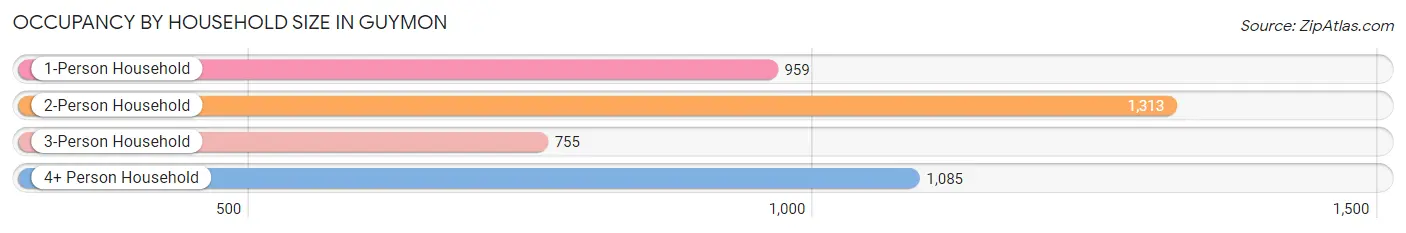
| Household Size | # Housing Units | % Housing Units |
| 1-Person Household | 959 | 23.3% |
| 2-Person Household | 1,313 | 31.9% |
| 3-Person Household | 755 | 18.4% |
| 4+ Person Household | 1,085 | 26.4% |
| Total Housing Units | 4,112 | 100.0% |
Occupancy by Ownership by Household Size in Guymon
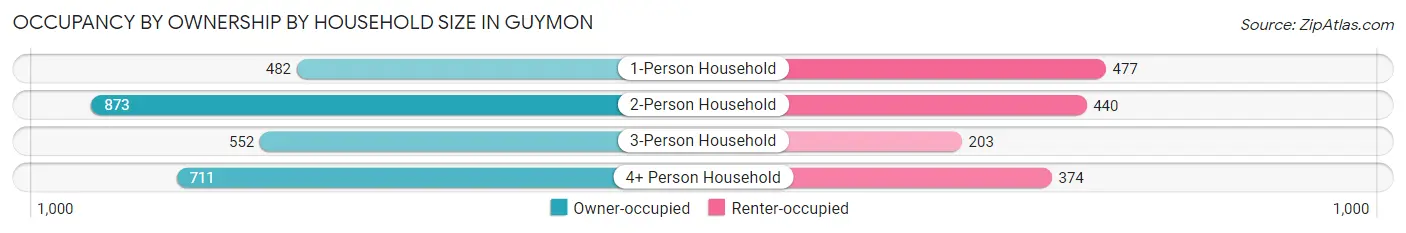
| Household Size | Owner-occupied | Renter-occupied |
| 1-Person Household | 482 (50.3%) | 477 (49.7%) |
| 2-Person Household | 873 (66.5%) | 440 (33.5%) |
| 3-Person Household | 552 (73.1%) | 203 (26.9%) |
| 4+ Person Household | 711 (65.5%) | 374 (34.5%) |
| Total Housing Units | 2,618 (63.7%) | 1,494 (36.3%) |
Occupancy by Educational Attainment in Guymon
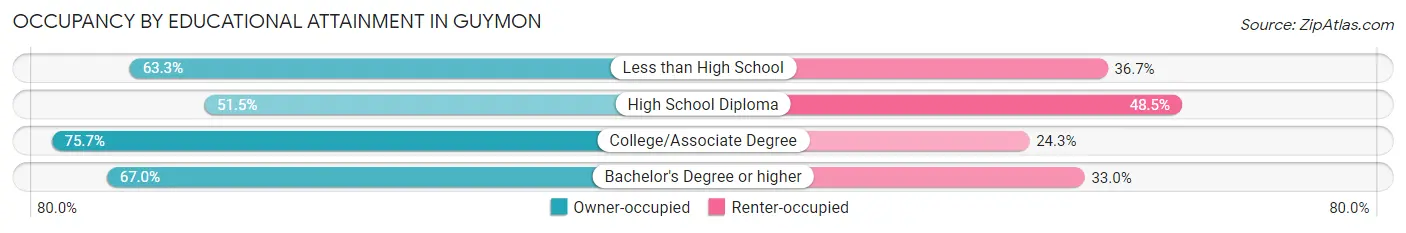
| Household Size | Owner-occupied | Renter-occupied |
| Less than High School | 682 (63.3%) | 395 (36.7%) |
| High School Diploma | 625 (51.5%) | 588 (48.5%) |
| College/Associate Degree | 786 (75.7%) | 252 (24.3%) |
| Bachelor's Degree or higher | 525 (67.0%) | 259 (33.0%) |
Occupancy by Age of Householder in Guymon
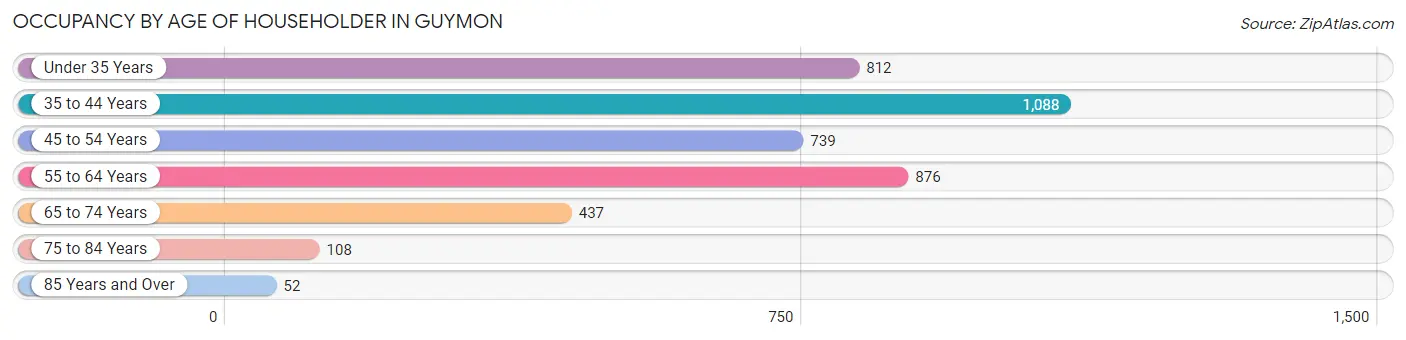
| Age Bracket | # Households | % Households |
| Under 35 Years | 812 | 19.8% |
| 35 to 44 Years | 1,088 | 26.5% |
| 45 to 54 Years | 739 | 18.0% |
| 55 to 64 Years | 876 | 21.3% |
| 65 to 74 Years | 437 | 10.6% |
| 75 to 84 Years | 108 | 2.6% |
| 85 Years and Over | 52 | 1.3% |
| Total | 4,112 | 100.0% |
Housing Finances in Guymon
Median Income by Occupancy in Guymon
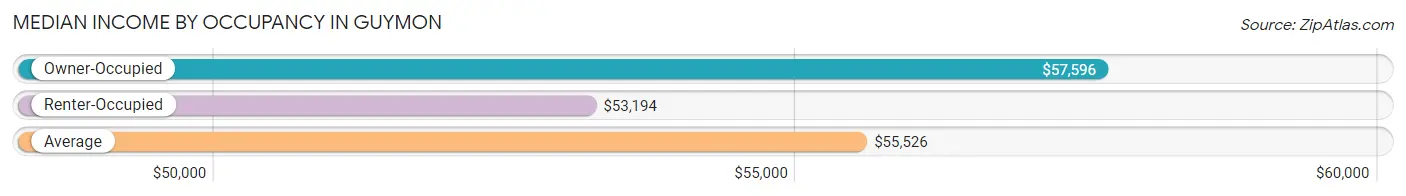
| Occupancy Type | # Households | Median Income |
| Owner-Occupied | 2,618 (63.7%) | $57,596 |
| Renter-Occupied | 1,494 (36.3%) | $53,194 |
| Average | 4,112 (100.0%) | $55,526 |
Occupancy by Householder Income Bracket in Guymon
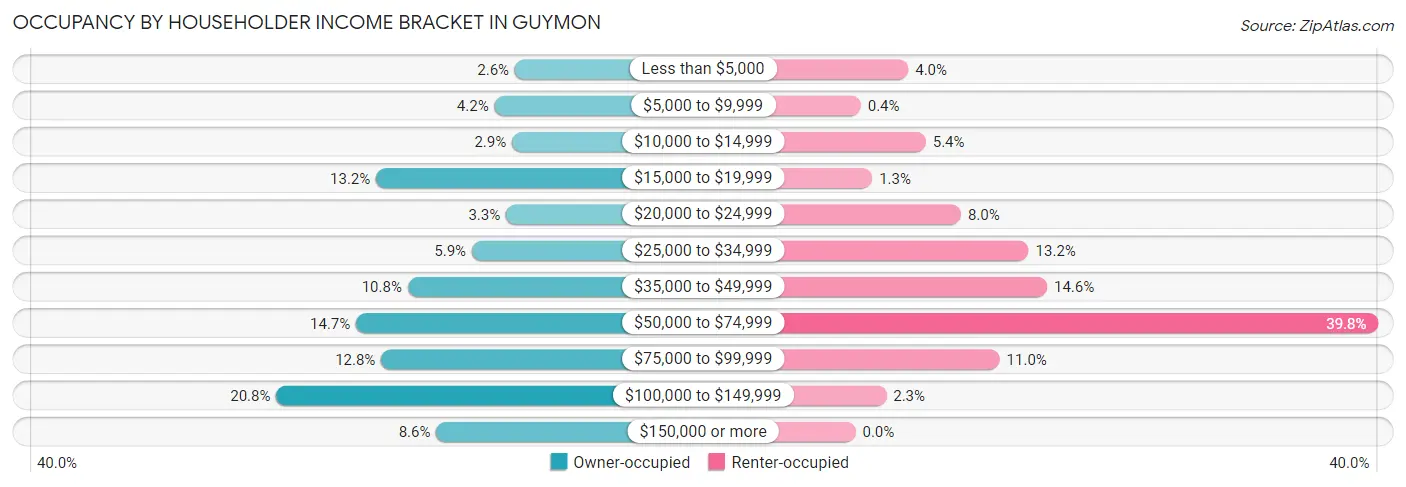
| Income Bracket | Owner-occupied | Renter-occupied |
| Less than $5,000 | 69 (2.6%) | 60 (4.0%) |
| $5,000 to $9,999 | 110 (4.2%) | 6 (0.4%) |
| $10,000 to $14,999 | 75 (2.9%) | 80 (5.3%) |
| $15,000 to $19,999 | 346 (13.2%) | 19 (1.3%) |
| $20,000 to $24,999 | 87 (3.3%) | 120 (8.0%) |
| $25,000 to $34,999 | 155 (5.9%) | 197 (13.2%) |
| $35,000 to $49,999 | 283 (10.8%) | 218 (14.6%) |
| $50,000 to $74,999 | 386 (14.7%) | 595 (39.8%) |
| $75,000 to $99,999 | 336 (12.8%) | 164 (11.0%) |
| $100,000 to $149,999 | 545 (20.8%) | 35 (2.3%) |
| $150,000 or more | 226 (8.6%) | 0 (0.0%) |
| Total | 2,618 (100.0%) | 1,494 (100.0%) |
Monthly Housing Cost Tiers in Guymon
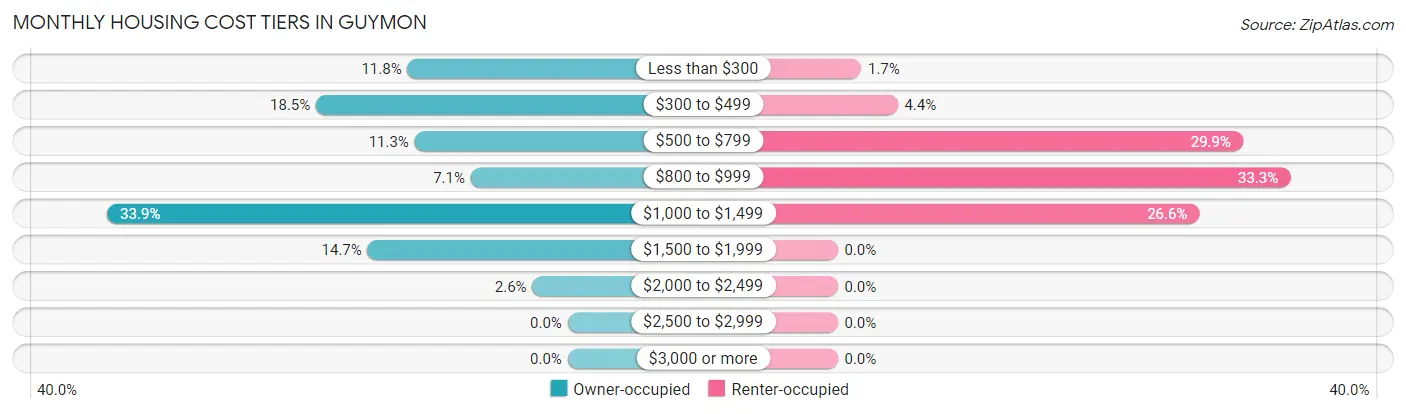
| Monthly Cost | Owner-occupied | Renter-occupied |
| Less than $300 | 309 (11.8%) | 26 (1.7%) |
| $300 to $499 | 485 (18.5%) | 66 (4.4%) |
| $500 to $799 | 295 (11.3%) | 446 (29.8%) |
| $800 to $999 | 187 (7.1%) | 498 (33.3%) |
| $1,000 to $1,499 | 888 (33.9%) | 398 (26.6%) |
| $1,500 to $1,999 | 386 (14.7%) | 0 (0.0%) |
| $2,000 to $2,499 | 68 (2.6%) | 0 (0.0%) |
| $2,500 to $2,999 | 0 (0.0%) | 0 (0.0%) |
| $3,000 or more | 0 (0.0%) | 0 (0.0%) |
| Total | 2,618 (100.0%) | 1,494 (100.0%) |
Physical Housing Characteristics in Guymon
Housing Structures in Guymon
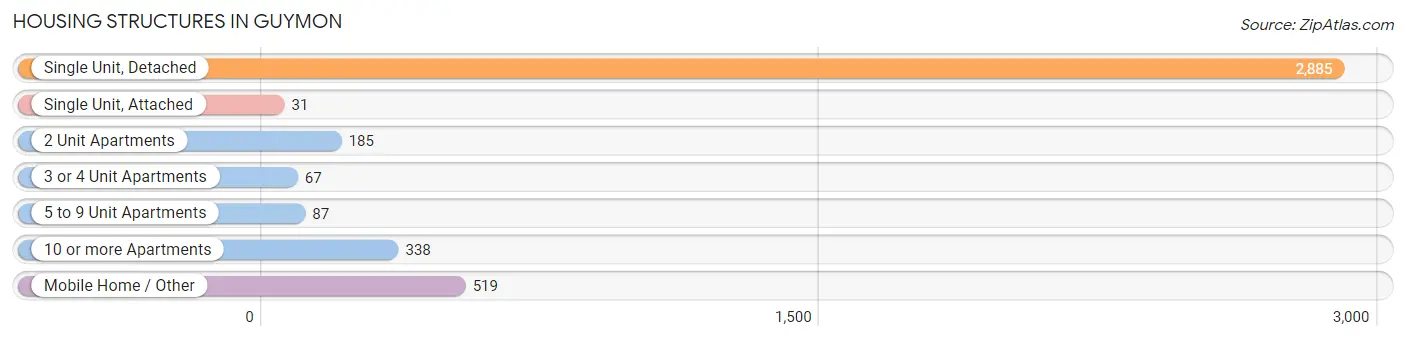
| Structure Type | # Housing Units | % Housing Units |
| Single Unit, Detached | 2,885 | 70.2% |
| Single Unit, Attached | 31 | 0.7% |
| 2 Unit Apartments | 185 | 4.5% |
| 3 or 4 Unit Apartments | 67 | 1.6% |
| 5 to 9 Unit Apartments | 87 | 2.1% |
| 10 or more Apartments | 338 | 8.2% |
| Mobile Home / Other | 519 | 12.6% |
| Total | 4,112 | 100.0% |
Housing Structures by Occupancy in Guymon
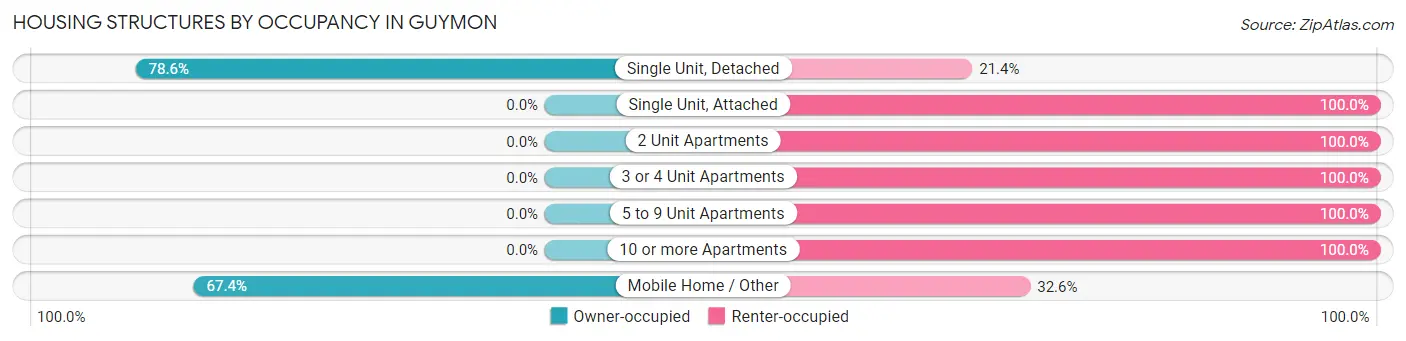
| Structure Type | Owner-occupied | Renter-occupied |
| Single Unit, Detached | 2,268 (78.6%) | 617 (21.4%) |
| Single Unit, Attached | 0 (0.0%) | 31 (100.0%) |
| 2 Unit Apartments | 0 (0.0%) | 185 (100.0%) |
| 3 or 4 Unit Apartments | 0 (0.0%) | 67 (100.0%) |
| 5 to 9 Unit Apartments | 0 (0.0%) | 87 (100.0%) |
| 10 or more Apartments | 0 (0.0%) | 338 (100.0%) |
| Mobile Home / Other | 350 (67.4%) | 169 (32.6%) |
| Total | 2,618 (63.7%) | 1,494 (36.3%) |
Housing Structures by Number of Rooms in Guymon
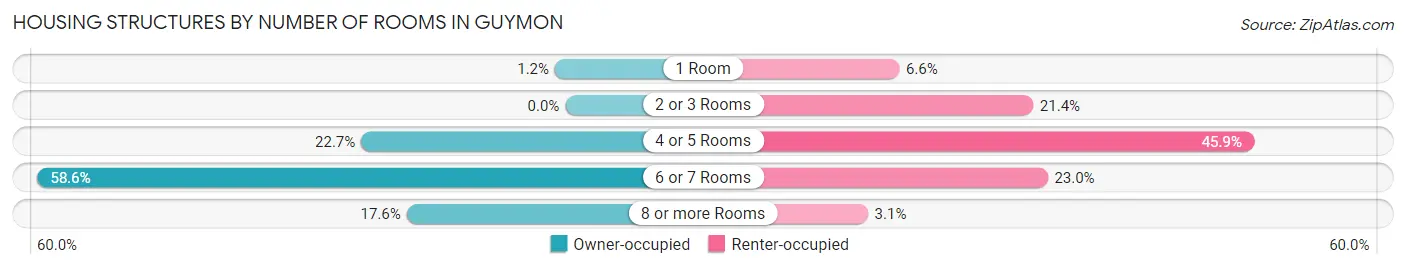
| Number of Rooms | Owner-occupied | Renter-occupied |
| 1 Room | 30 (1.1%) | 98 (6.6%) |
| 2 or 3 Rooms | 0 (0.0%) | 320 (21.4%) |
| 4 or 5 Rooms | 593 (22.7%) | 686 (45.9%) |
| 6 or 7 Rooms | 1,534 (58.6%) | 344 (23.0%) |
| 8 or more Rooms | 461 (17.6%) | 46 (3.1%) |
| Total | 2,618 (100.0%) | 1,494 (100.0%) |
Housing Structure by Heating Type in Guymon
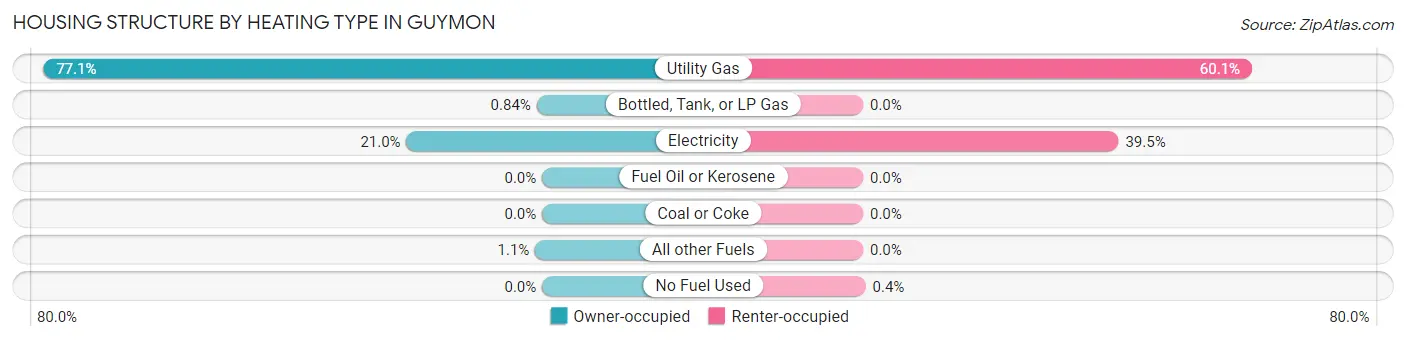
| Heating Type | Owner-occupied | Renter-occupied |
| Utility Gas | 2,019 (77.1%) | 898 (60.1%) |
| Bottled, Tank, or LP Gas | 22 (0.8%) | 0 (0.0%) |
| Electricity | 549 (21.0%) | 590 (39.5%) |
| Fuel Oil or Kerosene | 0 (0.0%) | 0 (0.0%) |
| Coal or Coke | 0 (0.0%) | 0 (0.0%) |
| All other Fuels | 28 (1.1%) | 0 (0.0%) |
| No Fuel Used | 0 (0.0%) | 6 (0.4%) |
| Total | 2,618 (100.0%) | 1,494 (100.0%) |
Household Vehicle Usage in Guymon
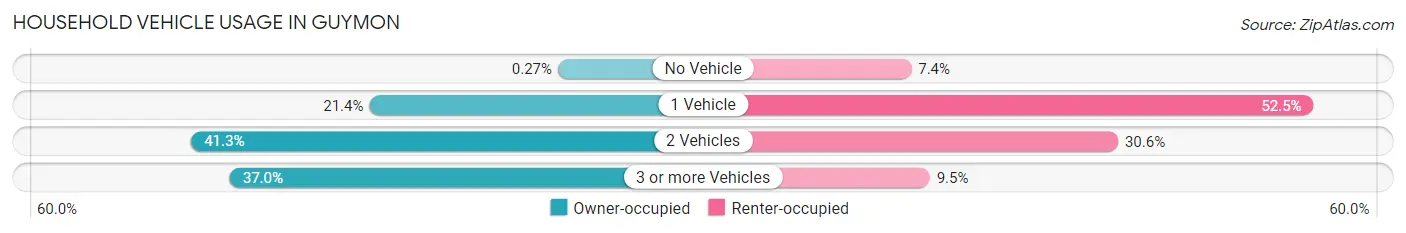
| Vehicles per Household | Owner-occupied | Renter-occupied |
| No Vehicle | 7 (0.3%) | 111 (7.4%) |
| 1 Vehicle | 560 (21.4%) | 784 (52.5%) |
| 2 Vehicles | 1,082 (41.3%) | 457 (30.6%) |
| 3 or more Vehicles | 969 (37.0%) | 142 (9.5%) |
| Total | 2,618 (100.0%) | 1,494 (100.0%) |
Real Estate & Mortgages in Guymon
Real Estate and Mortgage Overview in Guymon
| Characteristic | Without Mortgage | With Mortgage |
| Housing Units | 1,100 | 1,518 |
| Median Property Value | $76,400 | $165,400 |
| Median Household Income | $47,766 | $144 |
| Monthly Housing Costs | $401 | $0 |
| Real Estate Taxes | $550 | $46 |
Property Value by Mortgage Status in Guymon
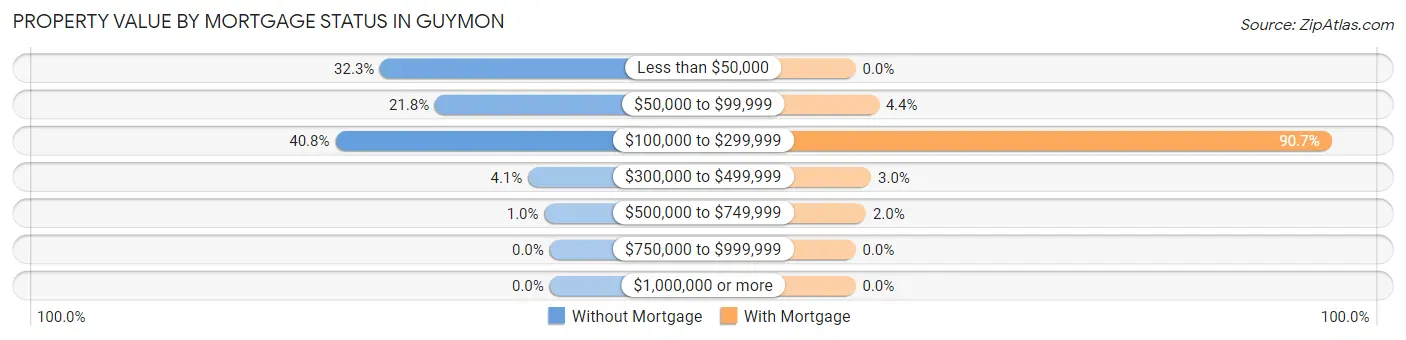
| Property Value | Without Mortgage | With Mortgage |
| Less than $50,000 | 355 (32.3%) | 0 (0.0%) |
| $50,000 to $99,999 | 240 (21.8%) | 67 (4.4%) |
| $100,000 to $299,999 | 449 (40.8%) | 1,376 (90.6%) |
| $300,000 to $499,999 | 45 (4.1%) | 45 (3.0%) |
| $500,000 to $749,999 | 11 (1.0%) | 30 (2.0%) |
| $750,000 to $999,999 | 0 (0.0%) | 0 (0.0%) |
| $1,000,000 or more | 0 (0.0%) | 0 (0.0%) |
| Total | 1,100 (100.0%) | 1,518 (100.0%) |
Household Income by Mortgage Status in Guymon
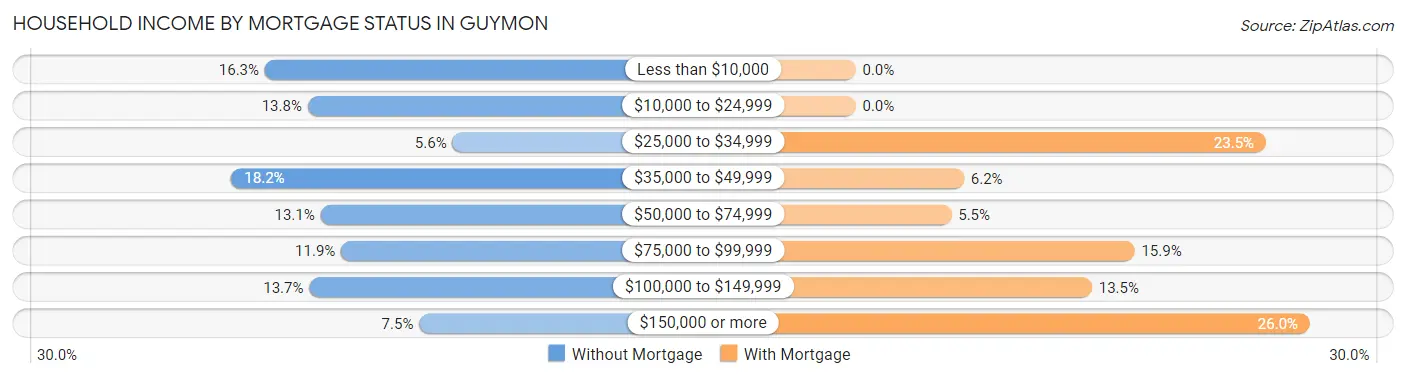
| Household Income | Without Mortgage | With Mortgage |
| Less than $10,000 | 179 (16.3%) | 0 (0.0%) |
| $10,000 to $24,999 | 152 (13.8%) | 0 (0.0%) |
| $25,000 to $34,999 | 61 (5.6%) | 356 (23.4%) |
| $35,000 to $49,999 | 200 (18.2%) | 94 (6.2%) |
| $50,000 to $74,999 | 144 (13.1%) | 83 (5.5%) |
| $75,000 to $99,999 | 131 (11.9%) | 242 (15.9%) |
| $100,000 to $149,999 | 151 (13.7%) | 205 (13.5%) |
| $150,000 or more | 82 (7.4%) | 394 (26.0%) |
| Total | 1,100 (100.0%) | 1,518 (100.0%) |
Property Value to Household Income Ratio in Guymon
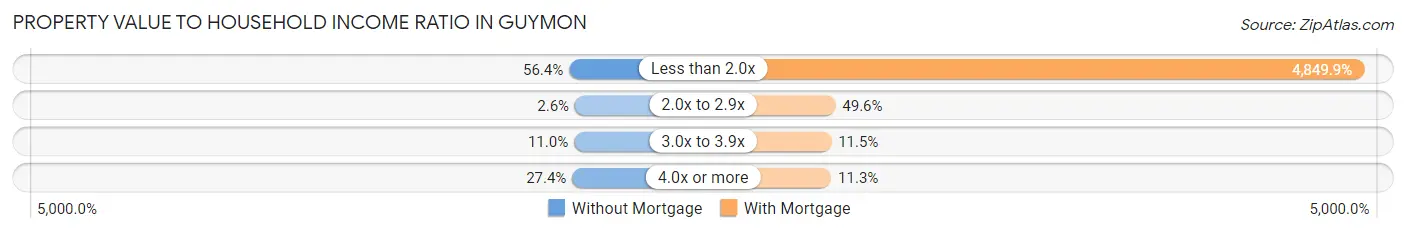
| Value-to-Income Ratio | Without Mortgage | With Mortgage |
| Less than 2.0x | 620 (56.4%) | 73,621 (4,849.9%) |
| 2.0x to 2.9x | 28 (2.5%) | 753 (49.6%) |
| 3.0x to 3.9x | 121 (11.0%) | 175 (11.5%) |
| 4.0x or more | 301 (27.4%) | 171 (11.3%) |
| Total | 1,100 (100.0%) | 1,518 (100.0%) |
Real Estate Taxes by Mortgage Status in Guymon
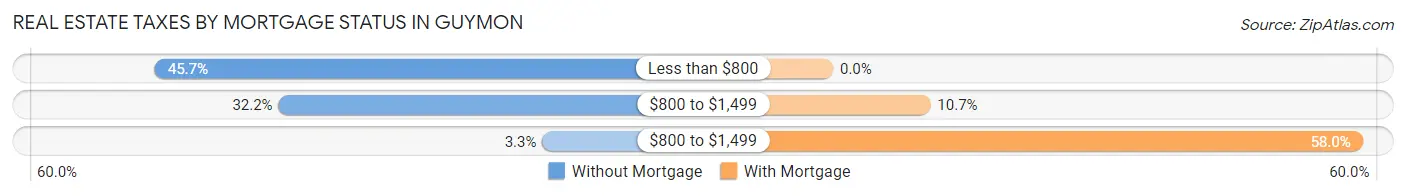
| Property Taxes | Without Mortgage | With Mortgage |
| Less than $800 | 503 (45.7%) | 0 (0.0%) |
| $800 to $1,499 | 354 (32.2%) | 162 (10.7%) |
| $800 to $1,499 | 36 (3.3%) | 881 (58.0%) |
| Total | 1,100 (100.0%) | 1,518 (100.0%) |
Health & Disability in Guymon
Health Insurance Coverage by Age in Guymon
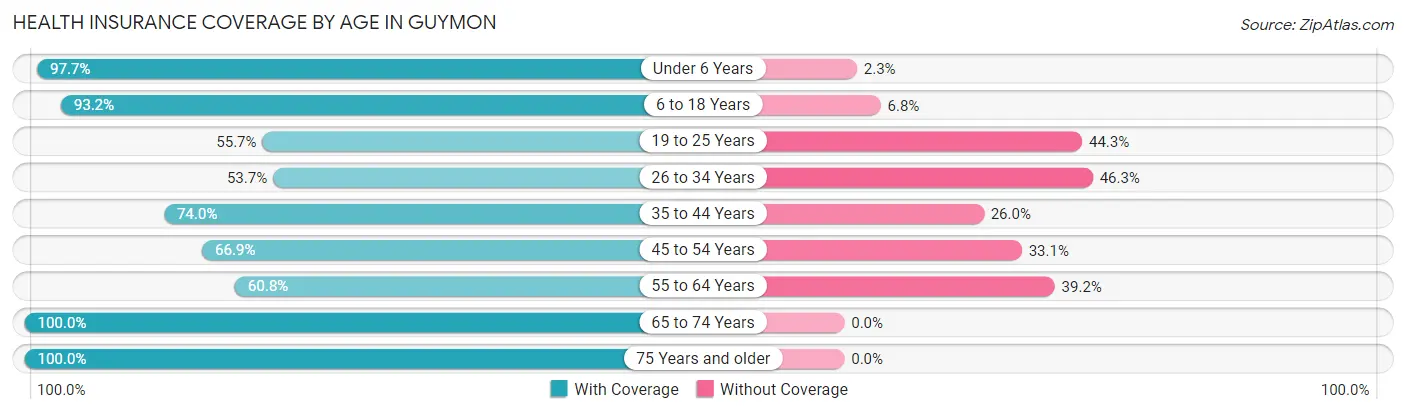
| Age Bracket | With Coverage | Without Coverage |
| Under 6 Years | 1,377 (97.7%) | 33 (2.3%) |
| 6 to 18 Years | 2,438 (93.2%) | 177 (6.8%) |
| 19 to 25 Years | 649 (55.7%) | 517 (44.3%) |
| 26 to 34 Years | 963 (53.7%) | 831 (46.3%) |
| 35 to 44 Years | 1,252 (74.0%) | 440 (26.0%) |
| 45 to 54 Years | 1,106 (66.9%) | 547 (33.1%) |
| 55 to 64 Years | 821 (60.8%) | 530 (39.2%) |
| 65 to 74 Years | 743 (100.0%) | 0 (0.0%) |
| 75 Years and older | 218 (100.0%) | 0 (0.0%) |
| Total | 9,567 (75.7%) | 3,075 (24.3%) |
Health Insurance Coverage by Citizenship Status in Guymon
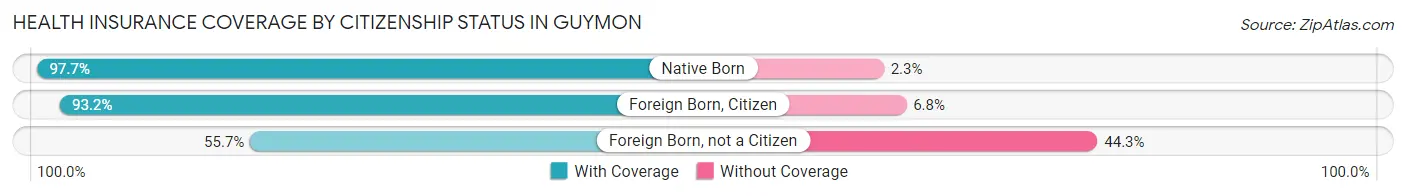
| Citizenship Status | With Coverage | Without Coverage |
| Native Born | 1,377 (97.7%) | 33 (2.3%) |
| Foreign Born, Citizen | 2,438 (93.2%) | 177 (6.8%) |
| Foreign Born, not a Citizen | 649 (55.7%) | 517 (44.3%) |
Health Insurance Coverage by Household Income in Guymon
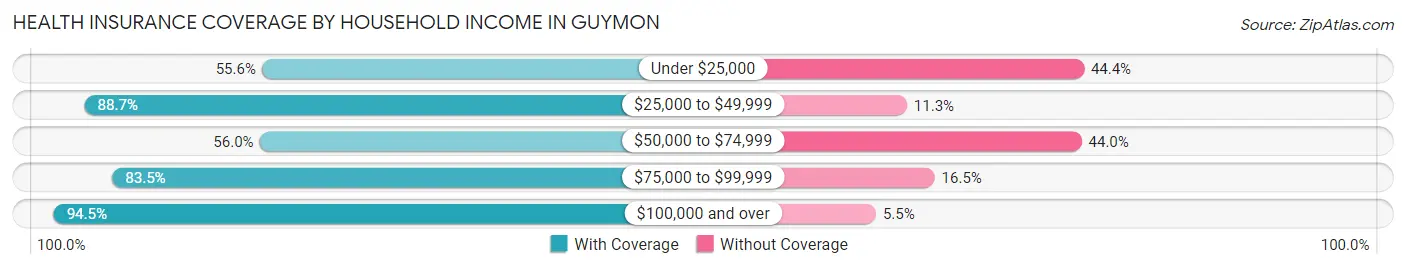
| Household Income | With Coverage | Without Coverage |
| Under $25,000 | 1,028 (55.6%) | 822 (44.4%) |
| $25,000 to $49,999 | 2,324 (88.7%) | 295 (11.3%) |
| $50,000 to $74,999 | 1,925 (56.0%) | 1,512 (44.0%) |
| $75,000 to $99,999 | 1,370 (83.5%) | 270 (16.5%) |
| $100,000 and over | 2,891 (94.5%) | 167 (5.5%) |
Public vs Private Health Insurance Coverage by Age in Guymon
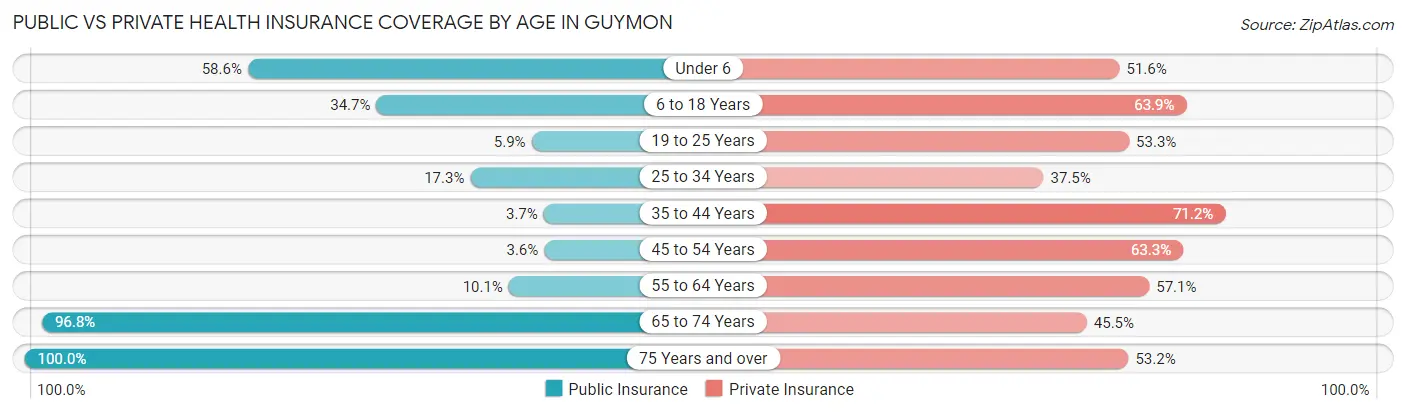
| Age Bracket | Public Insurance | Private Insurance |
| Under 6 | 826 (58.6%) | 727 (51.6%) |
| 6 to 18 Years | 908 (34.7%) | 1,672 (63.9%) |
| 19 to 25 Years | 69 (5.9%) | 622 (53.3%) |
| 25 to 34 Years | 310 (17.3%) | 672 (37.5%) |
| 35 to 44 Years | 62 (3.7%) | 1,204 (71.2%) |
| 45 to 54 Years | 59 (3.6%) | 1,047 (63.3%) |
| 55 to 64 Years | 137 (10.1%) | 771 (57.1%) |
| 65 to 74 Years | 719 (96.8%) | 338 (45.5%) |
| 75 Years and over | 218 (100.0%) | 116 (53.2%) |
| Total | 3,308 (26.2%) | 7,169 (56.7%) |
Disability Status by Sex by Age in Guymon
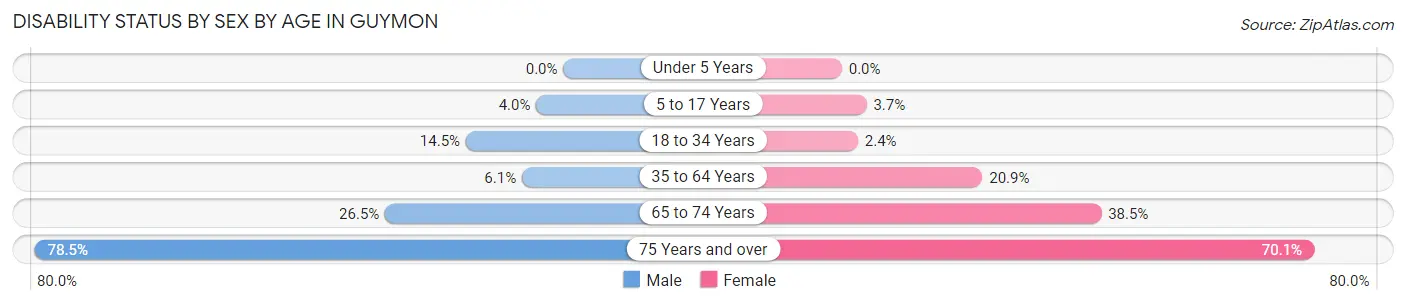
| Age Bracket | Male | Female |
| Under 5 Years | 0 (0.0%) | 0 (0.0%) |
| 5 to 17 Years | 57 (4.0%) | 51 (3.7%) |
| 18 to 34 Years | 297 (14.5%) | 24 (2.4%) |
| 35 to 64 Years | 150 (6.1%) | 470 (20.9%) |
| 65 to 74 Years | 86 (26.5%) | 161 (38.5%) |
| 75 Years and over | 95 (78.5%) | 68 (70.1%) |
Disability Class by Sex by Age in Guymon
Disability Class: Hearing Difficulty
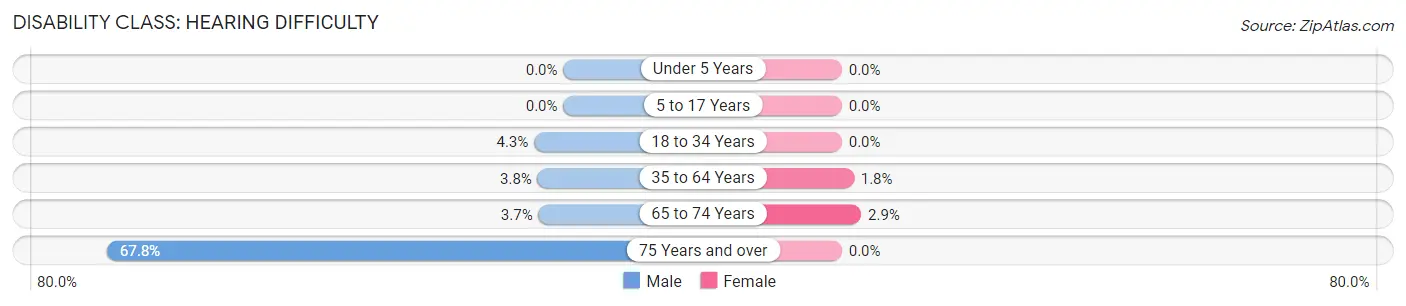
| Age Bracket | Male | Female |
| Under 5 Years | 0 (0.0%) | 0 (0.0%) |
| 5 to 17 Years | 0 (0.0%) | 0 (0.0%) |
| 18 to 34 Years | 89 (4.3%) | 0 (0.0%) |
| 35 to 64 Years | 93 (3.8%) | 40 (1.8%) |
| 65 to 74 Years | 12 (3.7%) | 12 (2.9%) |
| 75 Years and over | 82 (67.8%) | 0 (0.0%) |
Disability Class: Vision Difficulty
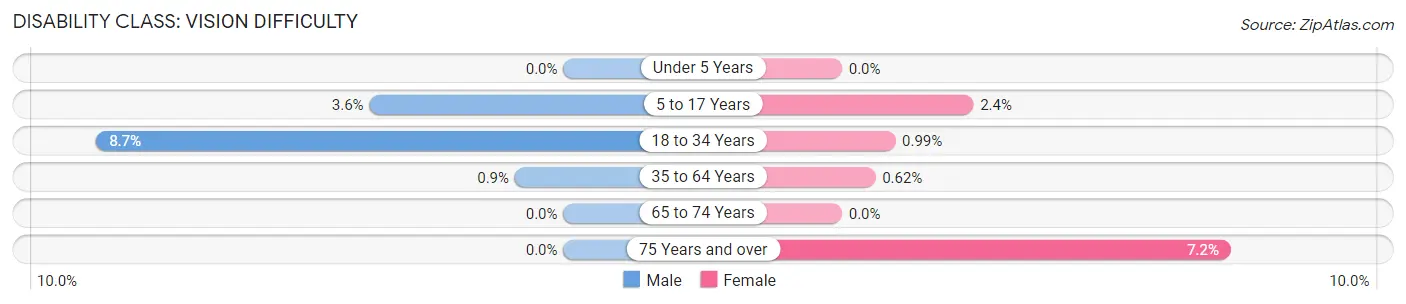
| Age Bracket | Male | Female |
| Under 5 Years | 0 (0.0%) | 0 (0.0%) |
| 5 to 17 Years | 51 (3.6%) | 34 (2.4%) |
| 18 to 34 Years | 178 (8.7%) | 10 (1.0%) |
| 35 to 64 Years | 22 (0.9%) | 14 (0.6%) |
| 65 to 74 Years | 0 (0.0%) | 0 (0.0%) |
| 75 Years and over | 0 (0.0%) | 7 (7.2%) |
Disability Class: Cognitive Difficulty
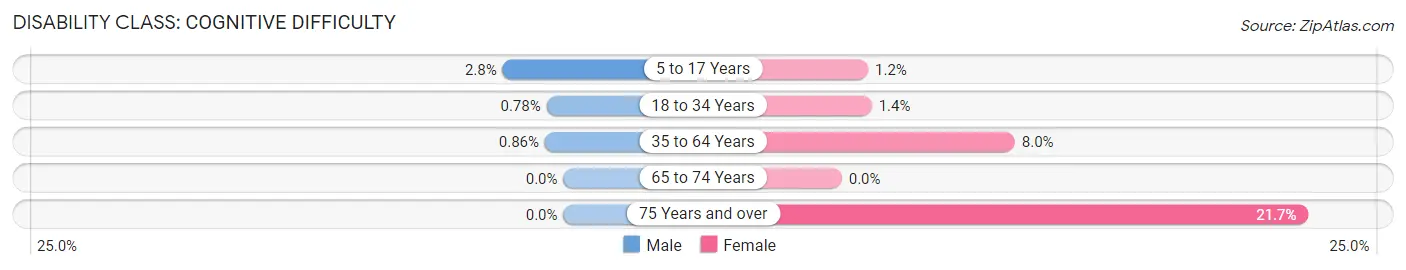
| Age Bracket | Male | Female |
| 5 to 17 Years | 40 (2.8%) | 17 (1.2%) |
| 18 to 34 Years | 16 (0.8%) | 14 (1.4%) |
| 35 to 64 Years | 21 (0.9%) | 181 (8.0%) |
| 65 to 74 Years | 0 (0.0%) | 0 (0.0%) |
| 75 Years and over | 0 (0.0%) | 21 (21.6%) |
Disability Class: Ambulatory Difficulty
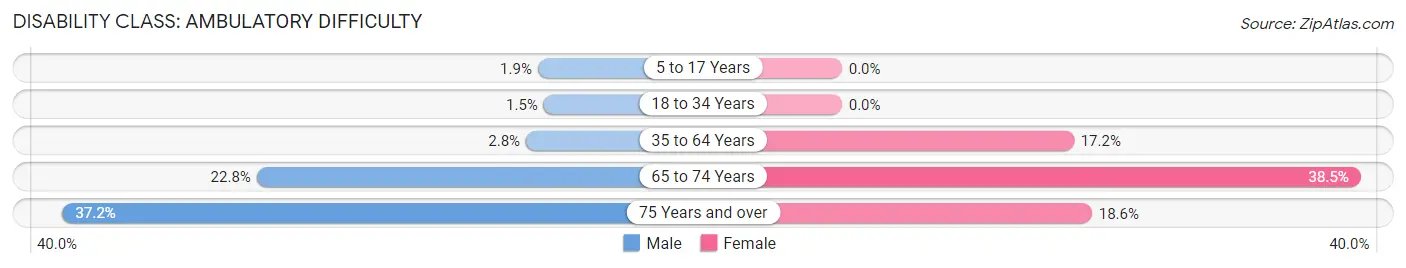
| Age Bracket | Male | Female |
| 5 to 17 Years | 27 (1.9%) | 0 (0.0%) |
| 18 to 34 Years | 30 (1.5%) | 0 (0.0%) |
| 35 to 64 Years | 68 (2.8%) | 388 (17.2%) |
| 65 to 74 Years | 74 (22.8%) | 161 (38.5%) |
| 75 Years and over | 45 (37.2%) | 18 (18.6%) |
Disability Class: Self-Care Difficulty
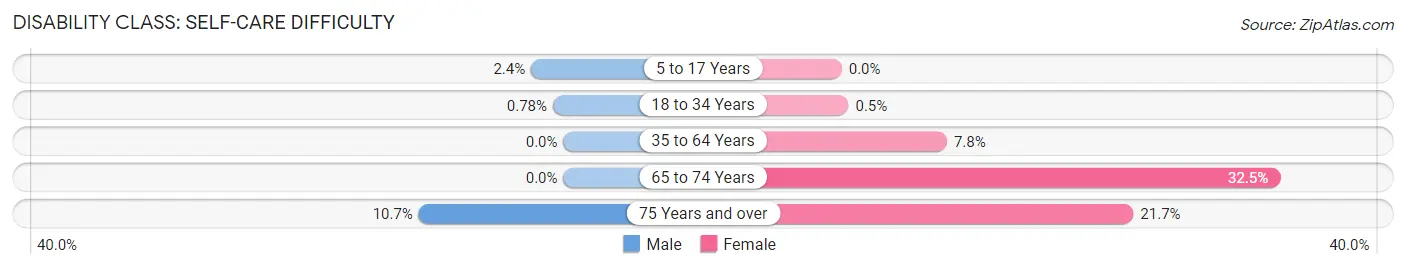
| Age Bracket | Male | Female |
| 5 to 17 Years | 34 (2.4%) | 0 (0.0%) |
| 18 to 34 Years | 16 (0.8%) | 5 (0.5%) |
| 35 to 64 Years | 0 (0.0%) | 176 (7.8%) |
| 65 to 74 Years | 0 (0.0%) | 136 (32.5%) |
| 75 Years and over | 13 (10.7%) | 21 (21.6%) |
Technology Access in Guymon
Computing Device Access in Guymon
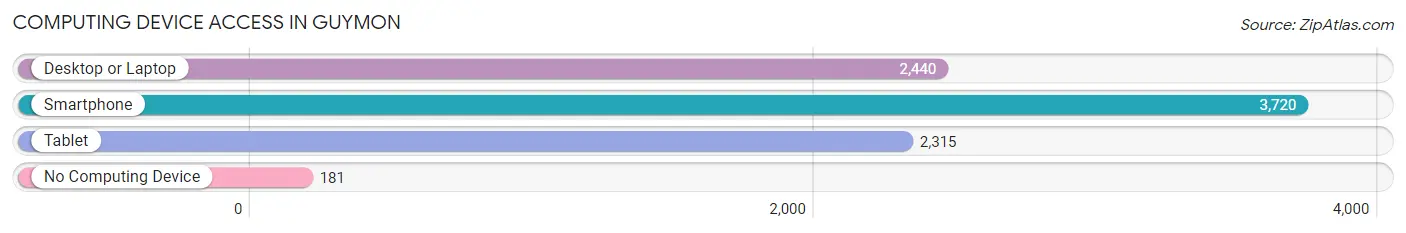
| Device Type | # Households | % Households |
| Desktop or Laptop | 2,440 | 59.3% |
| Smartphone | 3,720 | 90.5% |
| Tablet | 2,315 | 56.3% |
| No Computing Device | 181 | 4.4% |
| Total | 4,112 | 100.0% |
Internet Access in Guymon
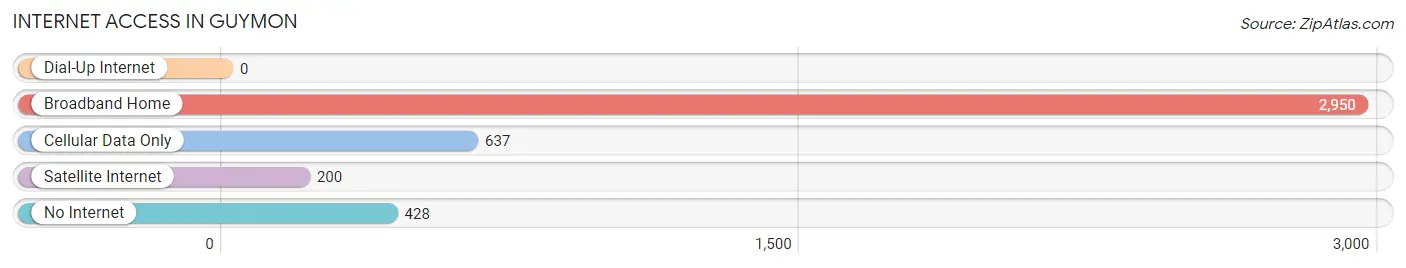
| Internet Type | # Households | % Households |
| Dial-Up Internet | 0 | 0.0% |
| Broadband Home | 2,950 | 71.7% |
| Cellular Data Only | 637 | 15.5% |
| Satellite Internet | 200 | 4.9% |
| No Internet | 428 | 10.4% |
| Total | 4,112 | 100.0% |
Guymon Summary
Guymon is a city located in the Texas County of Oklahoma. It is the county seat of Texas County and is the largest city in the Oklahoma Panhandle. The city is located in the western part of the state, near the border of Texas and New Mexico. The population of Guymon was 11,442 at the 2010 census, an increase of 8.7 percent from the 2000 census.
History
Guymon was founded in 1901 by the Santa Fe Railroad. The city was named after William Guymon, a railroad official. The city was incorporated in 1906 and has since grown to become the largest city in the Oklahoma Panhandle.
Geography
Guymon is located at the intersection of U.S. Highway 54 and State Highway 3. It is situated in the Oklahoma Panhandle, near the borders of Texas and New Mexico. The city is located in the High Plains region of the Great Plains, and is part of the Great Plains region of the United States. The city has a total area of 8.2 square miles, all of which is land.
Economy
Guymon is the economic hub of the Oklahoma Panhandle. The city is home to a variety of businesses, including manufacturing, retail, and service industries. The city is also home to a number of agricultural businesses, including cattle, wheat, and corn. The city is also home to a number of oil and gas companies.
Demographics
As of the 2010 census, the population of Guymon was 11,442. The racial makeup of the city was 79.2% White, 0.7% African American, 0.9% Native American, 0.3% Asian, 0.1% Pacific Islander, 16.2% from other races, and 2.7% from two or more races. Hispanic or Latino of any race were 28.2% of the population.
The median income for a household in Guymon was $37,917, and the median income for a family was $45,917. The per capita income for the city was $19,917. About 16.2% of families and 19.2% of the population were below the poverty line, including 25.2% of those under age 18 and 11.2% of those age 65 or over.
Conclusion
Guymon is a city located in the Texas County of Oklahoma. It is the county seat of Texas County and is the largest city in the Oklahoma Panhandle. The city was founded in 1901 by the Santa Fe Railroad and has since grown to become the economic hub of the Oklahoma Panhandle. The population of Guymon was 11,442 at the 2010 census, and the racial makeup of the city was 79.2% White, 0.7% African American, 0.9% Native American, 0.3% Asian, 0.1% Pacific Islander, 16.2% from other races, and 2.7% from two or more races. The median income for a household in Guymon was $37,917, and the median income for a family was $45,917. The per capita income for the city was $19,917. Guymon is a diverse city with a rich history and a bright future.
Common Questions
What is Per Capita Income in Guymon?
Per Capita income in Guymon is $22,005.
What is the Median Family Income in Guymon?
Median Family Income in Guymon is $67,898.
What is the Median Household income in Guymon?
Median Household Income in Guymon is $55,526.
What is Income or Wage Gap in Guymon?
Income or Wage Gap in Guymon is 29.0%.
Women in Guymon earn 71.0 cents for every dollar earned by a man.
What is Family Income Deficit in Guymon?
Family Income Deficit in Guymon is $10,380.
Families that are below poverty line in Guymon earn $10,380 less on average than the poverty threshold level.
What is Inequality or Gini Index in Guymon?
Inequality or Gini Index in Guymon is 0.38.
What is the Total Population of Guymon?
Total Population of Guymon is 12,743.
What is the Total Male Population of Guymon?
Total Male Population of Guymon is 7,075.
What is the Total Female Population of Guymon?
Total Female Population of Guymon is 5,668.
What is the Ratio of Males per 100 Females in Guymon?
There are 124.82 Males per 100 Females in Guymon.
What is the Ratio of Females per 100 Males in Guymon?
There are 80.11 Females per 100 Males in Guymon.
What is the Median Population Age in Guymon?
Median Population Age in Guymon is 30.8 Years.
What is the Average Family Size in Guymon
Average Family Size in Guymon is 3.9 People.
What is the Average Household Size in Guymon
Average Household Size in Guymon is 3.1 People.
How Large is the Labor Force in Guymon?
There are 6,703 People in the Labor Forcein in Guymon.
What is the Percentage of People in the Labor Force in Guymon?
71.8% of People are in the Labor Force in Guymon.
What is the Unemployment Rate in Guymon?
Unemployment Rate in Guymon is 2.8%.