Avondale, AZ Map & Demographics
Avondale Map

Avondale Overview
$29,700
PER CAPITA INCOME
$84,954
AVG FAMILY INCOME
$76,496
AVG HOUSEHOLD INCOME
19.3%
WAGE / INCOME GAP [ % ]
80.7¢/ $1
WAGE / INCOME GAP [ $ ]
$11,395
FAMILY INCOME DEFICIT
0.38
INEQUALITY / GINI INDEX
89,214
TOTAL POPULATION
44,150
MALE POPULATION
45,064
FEMALE POPULATION
97.97
MALES / 100 FEMALES
102.07
FEMALES / 100 MALES
31.9
MEDIAN AGE
3.6
AVG FAMILY SIZE
3.1
AVG HOUSEHOLD SIZE
46,543
LABOR FORCE [ PEOPLE ]
69.4%
PERCENT IN LABOR FORCE
4.8%
UNEMPLOYMENT RATE
Avondale Area Codes
Income in Avondale
Income Overview in Avondale
Per Capita Income in Avondale is $29,700, while median incomes of families and households are $84,954 and $76,496 respectively.
| Characteristic | Number | Measure |
| Per Capita Income | 89,214 | $29,700 |
| Median Family Income | 20,975 | $84,954 |
| Mean Family Income | 20,975 | $97,655 |
| Median Household Income | 28,831 | $76,496 |
| Mean Household Income | 28,831 | $90,122 |
| Income Deficit | 20,975 | $11,395 |
| Wage / Income Gap (%) | 89,214 | 19.35% |
| Wage / Income Gap ($) | 89,214 | 80.65¢ per $1 |
| Gini / Inequality Index | 89,214 | 0.38 |
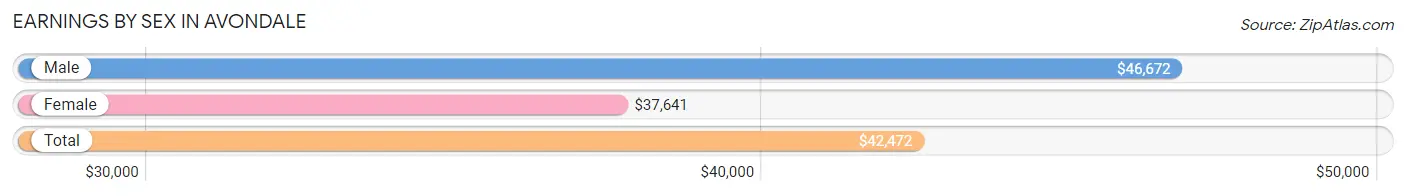
Earnings by Sex in Avondale
Average Earnings in Avondale are $42,472, $46,672 for men and $37,641 for women, a difference of 19.4%.
| Sex | Number | Average Earnings |
| Male | 25,764 (54.7%) | $46,672 |
| Female | 21,348 (45.3%) | $37,641 |
| Total | 47,112 (100.0%) | $42,472 |
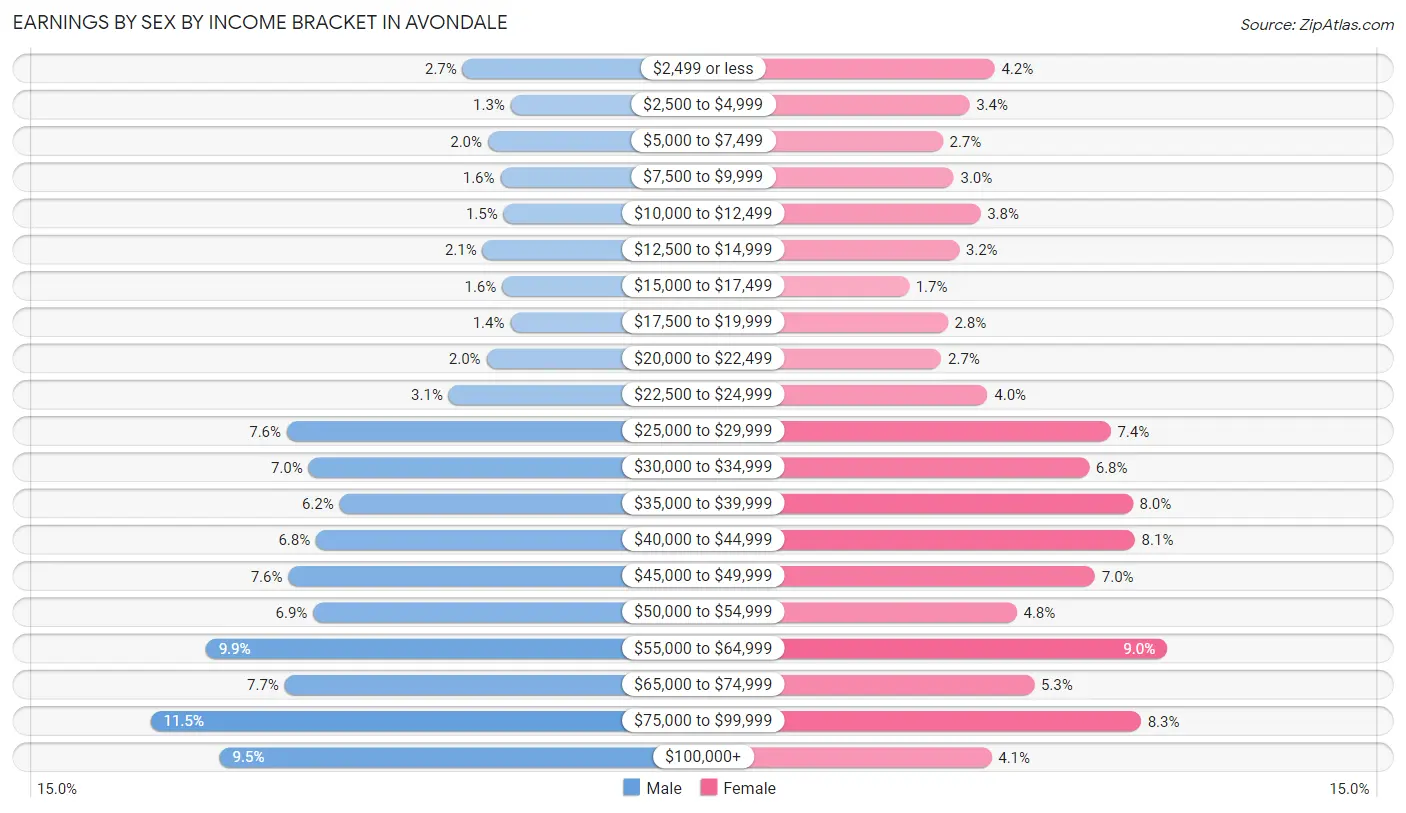
Earnings by Sex by Income Bracket in Avondale
The most common earnings brackets in Avondale are $75,000 to $99,999 for men (2,953 | 11.5%) and $55,000 to $64,999 for women (1,921 | 9.0%).
| Income | Male | Female |
| $2,499 or less | 692 (2.7%) | 885 (4.2%) |
| $2,500 to $4,999 | 345 (1.3%) | 735 (3.4%) |
| $5,000 to $7,499 | 509 (2.0%) | 574 (2.7%) |
| $7,500 to $9,999 | 419 (1.6%) | 640 (3.0%) |
| $10,000 to $12,499 | 397 (1.5%) | 801 (3.7%) |
| $12,500 to $14,999 | 548 (2.1%) | 672 (3.2%) |
| $15,000 to $17,499 | 406 (1.6%) | 371 (1.7%) |
| $17,500 to $19,999 | 349 (1.3%) | 605 (2.8%) |
| $20,000 to $22,499 | 521 (2.0%) | 566 (2.6%) |
| $22,500 to $24,999 | 794 (3.1%) | 844 (4.0%) |
| $25,000 to $29,999 | 1,967 (7.6%) | 1,581 (7.4%) |
| $30,000 to $34,999 | 1,808 (7.0%) | 1,452 (6.8%) |
| $35,000 to $39,999 | 1,584 (6.1%) | 1,715 (8.0%) |
| $40,000 to $44,999 | 1,755 (6.8%) | 1,726 (8.1%) |
| $45,000 to $49,999 | 1,956 (7.6%) | 1,488 (7.0%) |
| $50,000 to $54,999 | 1,774 (6.9%) | 1,019 (4.8%) |
| $55,000 to $64,999 | 2,553 (9.9%) | 1,921 (9.0%) |
| $65,000 to $74,999 | 1,981 (7.7%) | 1,122 (5.3%) |
| $75,000 to $99,999 | 2,953 (11.5%) | 1,764 (8.3%) |
| $100,000+ | 2,453 (9.5%) | 867 (4.1%) |
| Total | 25,764 (100.0%) | 21,348 (100.0%) |
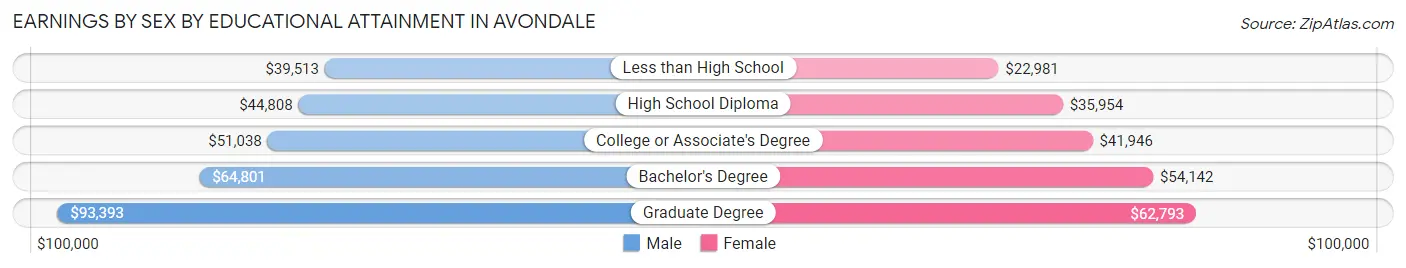
Earnings by Sex by Educational Attainment in Avondale
Average earnings in Avondale are $50,867 for men and $41,932 for women, a difference of 17.6%. Men with an educational attainment of graduate degree enjoy the highest average annual earnings of $93,393, while those with less than high school education earn the least with $39,513. Women with an educational attainment of graduate degree earn the most with the average annual earnings of $62,793, while those with less than high school education have the smallest earnings of $22,981.
| Educational Attainment | Male Income | Female Income |
| Less than High School | $39,513 | $22,981 |
| High School Diploma | $44,808 | $35,954 |
| College or Associate's Degree | $51,038 | $41,946 |
| Bachelor's Degree | $64,801 | $54,142 |
| Graduate Degree | $93,393 | $62,793 |
| Total | $50,867 | $41,932 |
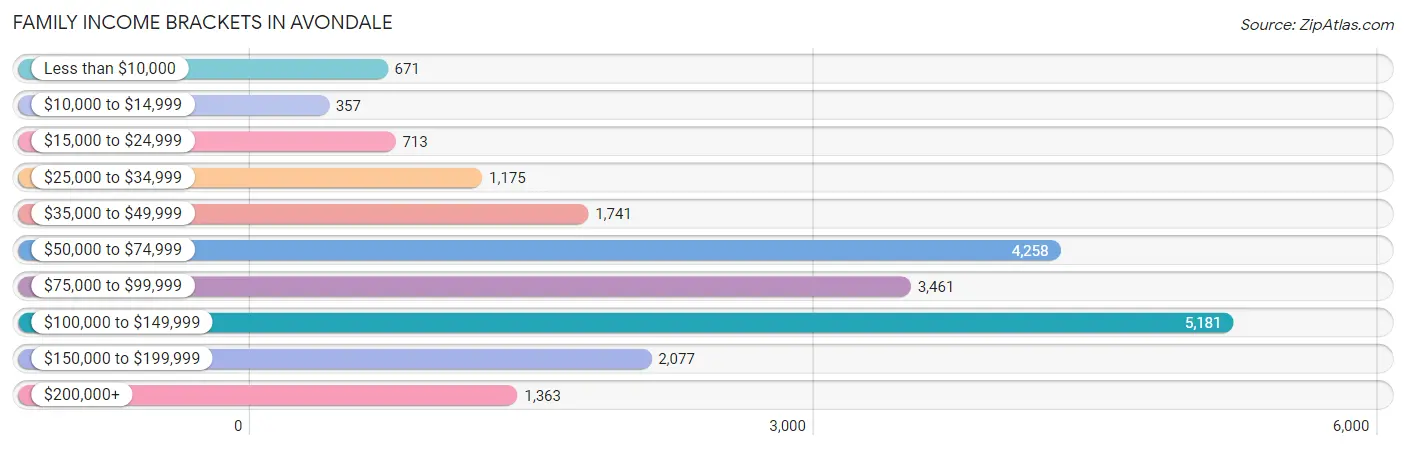
Family Income in Avondale
Family Income Brackets in Avondale
According to the Avondale family income data, there are 5,181 families falling into the $100,000 to $149,999 income range, which is the most common income bracket and makes up 24.7% of all families. Conversely, the $10,000 to $14,999 income bracket is the least frequent group with only 357 families (1.7%) belonging to this category.
| Income Bracket | # Families | % Families |
| Less than $10,000 | 671 | 3.2% |
| $10,000 to $14,999 | 357 | 1.7% |
| $15,000 to $24,999 | 713 | 3.4% |
| $25,000 to $34,999 | 1,175 | 5.6% |
| $35,000 to $49,999 | 1,741 | 8.3% |
| $50,000 to $74,999 | 4,258 | 20.3% |
| $75,000 to $99,999 | 3,461 | 16.5% |
| $100,000 to $149,999 | 5,181 | 24.7% |
| $150,000 to $199,999 | 2,077 | 9.9% |
| $200,000+ | 1,363 | 6.5% |
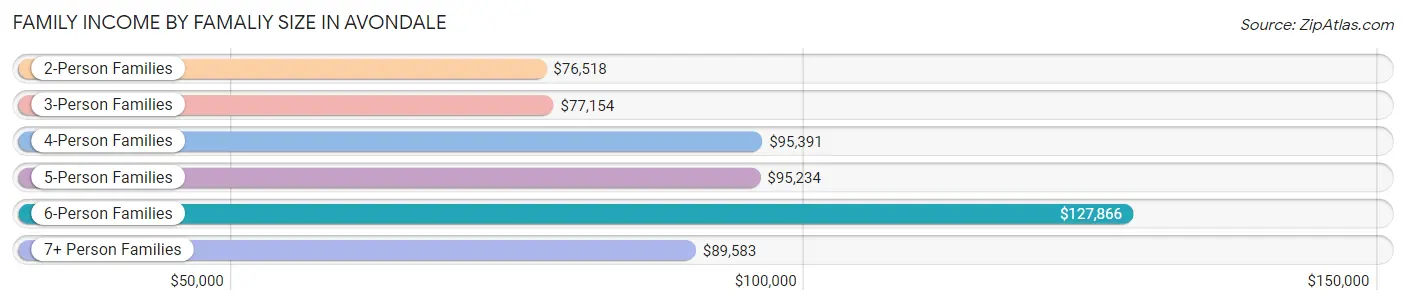
Family Income by Famaliy Size in Avondale
6-person families (1,399 | 6.7%) account for the highest median family income in Avondale with $127,866 per family, while 2-person families (7,133 | 34.0%) have the highest median income of $38,259 per family member.
| Income Bracket | # Families | Median Income |
| 2-Person Families | 7,133 (34.0%) | $76,518 |
| 3-Person Families | 5,012 (23.9%) | $77,154 |
| 4-Person Families | 3,631 (17.3%) | $95,391 |
| 5-Person Families | 2,715 (12.9%) | $95,234 |
| 6-Person Families | 1,399 (6.7%) | $127,866 |
| 7+ Person Families | 1,085 (5.2%) | $89,583 |
| Total | 20,975 (100.0%) | $84,954 |
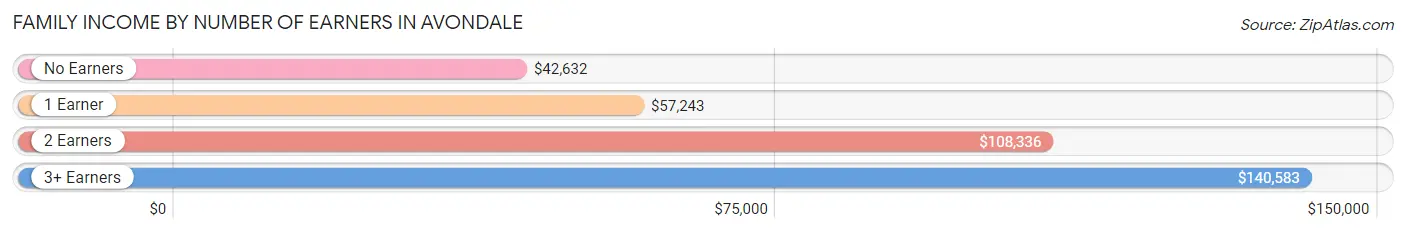
Family Income by Number of Earners in Avondale
The median family income in Avondale is $84,954, with families comprising 3+ earners (3,303) having the highest median family income of $140,583, while families with no earners (1,794) have the lowest median family income of $42,632, accounting for 15.8% and 8.6% of families, respectively.
| Number of Earners | # Families | Median Income |
| No Earners | 1,794 (8.6%) | $42,632 |
| 1 Earner | 7,145 (34.1%) | $57,243 |
| 2 Earners | 8,733 (41.6%) | $108,336 |
| 3+ Earners | 3,303 (15.8%) | $140,583 |
| Total | 20,975 (100.0%) | $84,954 |
Household Income in Avondale
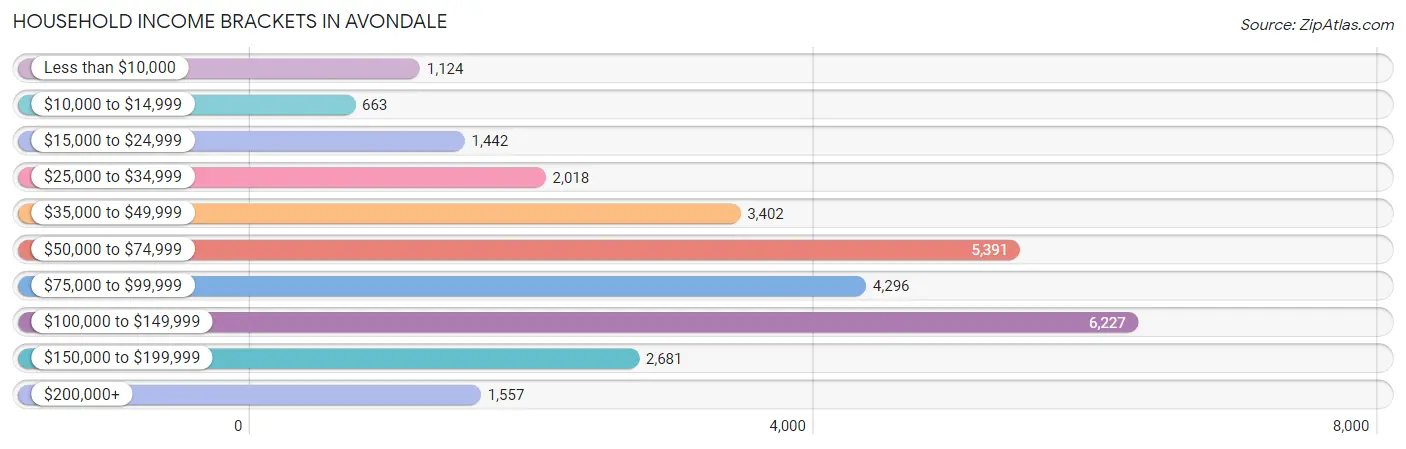
Household Income Brackets in Avondale
With 6,227 households falling in the category, the $100,000 to $149,999 income range is the most frequent in Avondale, accounting for 21.6% of all households. In contrast, only 663 households (2.3%) fall into the $10,000 to $14,999 income bracket, making it the least populous group.
| Income Bracket | # Households | % Households |
| Less than $10,000 | 1,124 | 3.9% |
| $10,000 to $14,999 | 663 | 2.3% |
| $15,000 to $24,999 | 1,442 | 5.0% |
| $25,000 to $34,999 | 2,018 | 7.0% |
| $35,000 to $49,999 | 3,402 | 11.8% |
| $50,000 to $74,999 | 5,391 | 18.7% |
| $75,000 to $99,999 | 4,296 | 14.9% |
| $100,000 to $149,999 | 6,227 | 21.6% |
| $150,000 to $199,999 | 2,681 | 9.3% |
| $200,000+ | 1,557 | 5.4% |
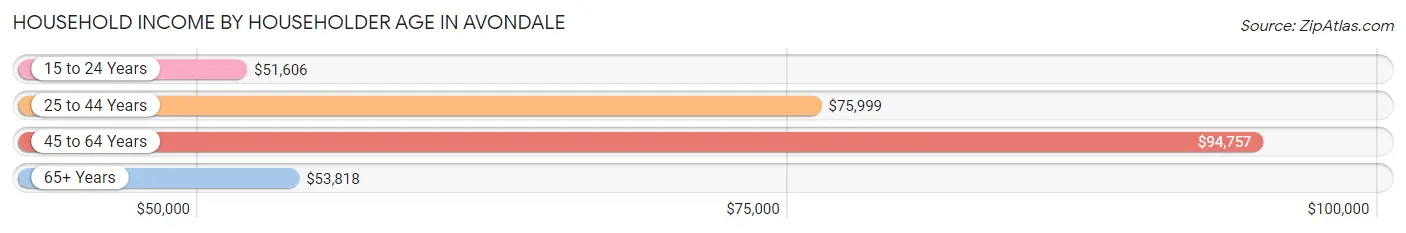
Household Income by Householder Age in Avondale
The median household income in Avondale is $76,496, with the highest median household income of $94,757 found in the 45 to 64 years age bracket for the primary householder. A total of 10,784 households (37.4%) fall into this category. Meanwhile, the 15 to 24 years age bracket for the primary householder has the lowest median household income of $51,606, with 1,716 households (5.9%) in this group.
| Income Bracket | # Households | Median Income |
| 15 to 24 Years | 1,716 (5.9%) | $51,606 |
| 25 to 44 Years | 11,979 (41.5%) | $75,999 |
| 45 to 64 Years | 10,784 (37.4%) | $94,757 |
| 65+ Years | 4,352 (15.1%) | $53,818 |
| Total | 28,831 (100.0%) | $76,496 |
Poverty in Avondale
Income Below Poverty by Sex and Age in Avondale
With 10.0% poverty level for males and 11.5% for females among the residents of Avondale, 6 to 11 year old males and 75 year old and over females are the most vulnerable to poverty, with 838 males (21.6%) and 263 females (16.4%) in their respective age groups living below the poverty level.
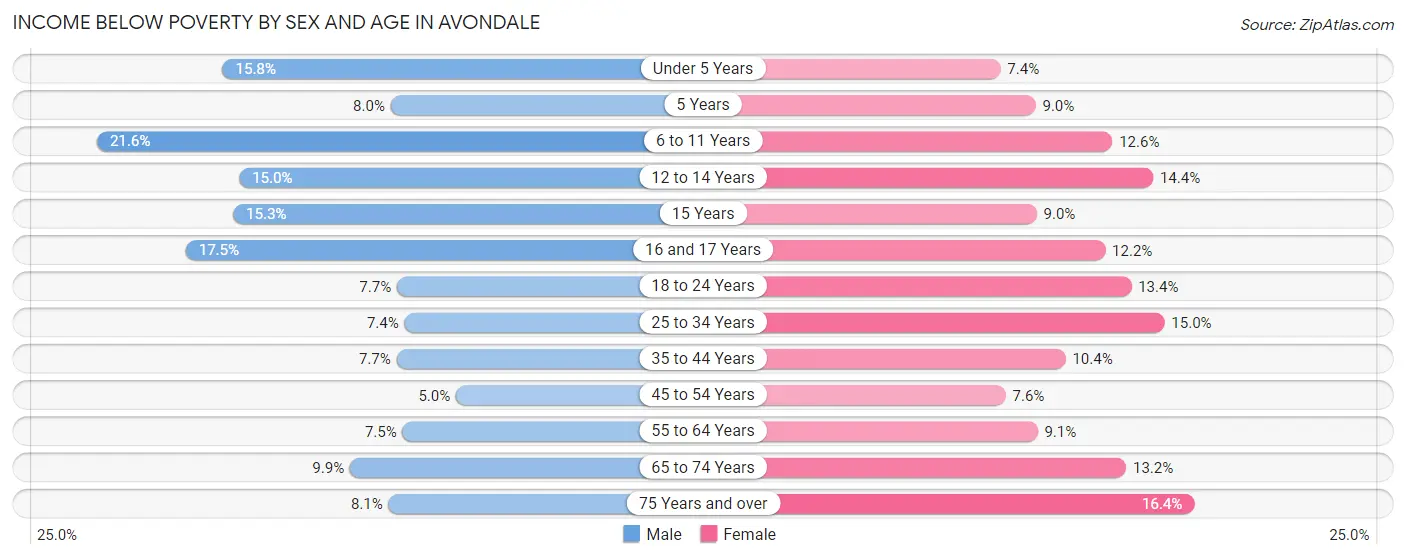
| Age Bracket | Male | Female |
| Under 5 Years | 482 (15.8%) | 262 (7.4%) |
| 5 Years | 60 (8.0%) | 82 (9.0%) |
| 6 to 11 Years | 838 (21.6%) | 490 (12.6%) |
| 12 to 14 Years | 291 (15.0%) | 279 (14.4%) |
| 15 Years | 158 (15.3%) | 69 (9.0%) |
| 16 and 17 Years | 220 (17.5%) | 170 (12.2%) |
| 18 to 24 Years | 370 (7.7%) | 625 (13.4%) |
| 25 to 34 Years | 550 (7.4%) | 1,077 (15.0%) |
| 35 to 44 Years | 485 (7.7%) | 627 (10.4%) |
| 45 to 54 Years | 274 (5.0%) | 438 (7.6%) |
| 55 to 64 Years | 332 (7.5%) | 398 (9.1%) |
| 65 to 74 Years | 230 (9.9%) | 347 (13.2%) |
| 75 Years and over | 94 (8.1%) | 263 (16.4%) |
| Total | 4,384 (10.0%) | 5,127 (11.5%) |
Income Above Poverty by Sex and Age in Avondale
According to the poverty statistics in Avondale, males aged 45 to 54 years and females aged under 5 years are the age groups that are most secure financially, with 95.0% of males and 92.6% of females in these age groups living above the poverty line.
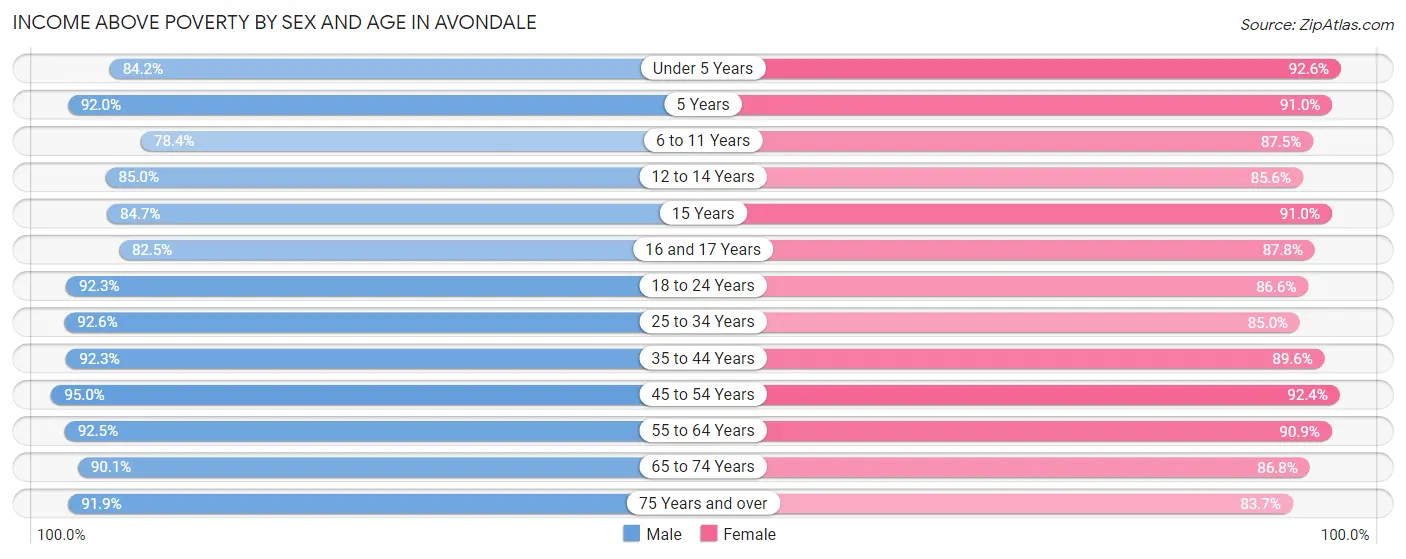
| Age Bracket | Male | Female |
| Under 5 Years | 2,567 (84.2%) | 3,297 (92.6%) |
| 5 Years | 689 (92.0%) | 830 (91.0%) |
| 6 to 11 Years | 3,035 (78.4%) | 3,413 (87.5%) |
| 12 to 14 Years | 1,644 (85.0%) | 1,653 (85.6%) |
| 15 Years | 873 (84.7%) | 694 (91.0%) |
| 16 and 17 Years | 1,036 (82.5%) | 1,221 (87.8%) |
| 18 to 24 Years | 4,422 (92.3%) | 4,028 (86.6%) |
| 25 to 34 Years | 6,911 (92.6%) | 6,119 (85.0%) |
| 35 to 44 Years | 5,784 (92.3%) | 5,412 (89.6%) |
| 45 to 54 Years | 5,223 (95.0%) | 5,323 (92.4%) |
| 55 to 64 Years | 4,118 (92.5%) | 3,987 (90.9%) |
| 65 to 74 Years | 2,094 (90.1%) | 2,284 (86.8%) |
| 75 Years and over | 1,065 (91.9%) | 1,346 (83.7%) |
| Total | 39,461 (90.0%) | 39,607 (88.5%) |
Income Below Poverty Among Married-Couple Families in Avondale
The poverty statistics for married-couple families in Avondale show that 4.8% or 662 of the total 13,910 families live below the poverty line. Families with 3 or 4 children have the highest poverty rate of 9.5%, comprising of 185 families. On the other hand, families with no children have the lowest poverty rate of 3.2%, which includes 204 families.
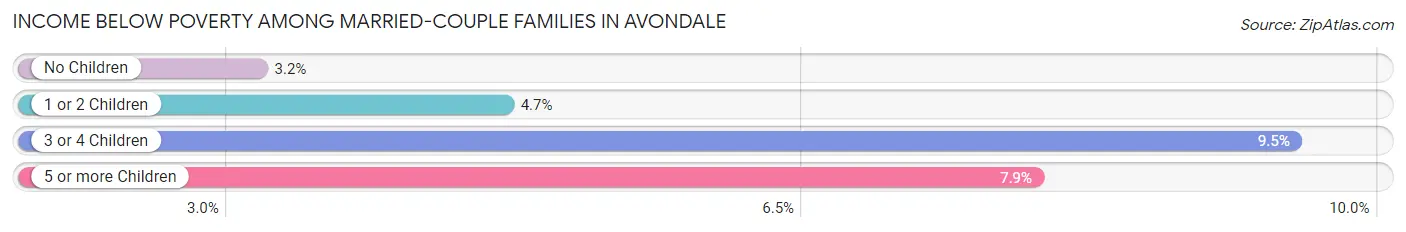
| Children | Above Poverty | Below Poverty |
| No Children | 6,205 (96.8%) | 204 (3.2%) |
| 1 or 2 Children | 4,892 (95.3%) | 240 (4.7%) |
| 3 or 4 Children | 1,767 (90.5%) | 185 (9.5%) |
| 5 or more Children | 384 (92.1%) | 33 (7.9%) |
| Total | 13,248 (95.2%) | 662 (4.8%) |
Income Below Poverty Among Single-Parent Households in Avondale
According to the poverty data in Avondale, 7.6% or 188 single-father households and 21.8% or 1,003 single-mother households are living below the poverty line. Among single-father households, those with 3 or 4 children have the highest poverty rate, with 34 households (14.2%) experiencing poverty. Likewise, among single-mother households, those with 5 or more children have the highest poverty rate, with 27 households (61.4%) falling below the poverty line.
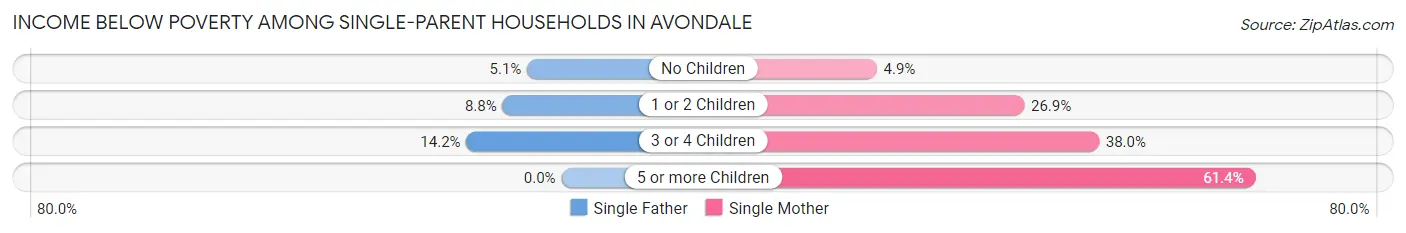
| Children | Single Father | Single Mother |
| No Children | 54 (5.1%) | 71 (4.9%) |
| 1 or 2 Children | 100 (8.8%) | 675 (26.9%) |
| 3 or 4 Children | 34 (14.2%) | 230 (38.0%) |
| 5 or more Children | 0 (0.0%) | 27 (61.4%) |
| Total | 188 (7.6%) | 1,003 (21.8%) |
Income Below Poverty Among Married-Couple vs Single-Parent Households in Avondale
The poverty data for Avondale shows that 662 of the married-couple family households (4.8%) and 1,191 of the single-parent households (16.9%) are living below the poverty level. Within the married-couple family households, those with 3 or 4 children have the highest poverty rate, with 185 households (9.5%) falling below the poverty line. Among the single-parent households, those with 5 or more children have the highest poverty rate, with 27 household (40.9%) living below poverty.
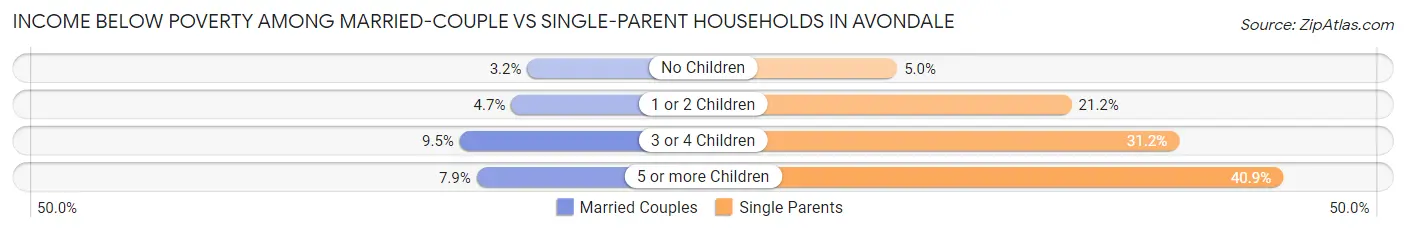
| Children | Married-Couple Families | Single-Parent Households |
| No Children | 204 (3.2%) | 125 (5.0%) |
| 1 or 2 Children | 240 (4.7%) | 775 (21.2%) |
| 3 or 4 Children | 185 (9.5%) | 264 (31.2%) |
| 5 or more Children | 33 (7.9%) | 27 (40.9%) |
| Total | 662 (4.8%) | 1,191 (16.9%) |
Race in Avondale
The most populous races in Avondale are Hispanic or Latino (49,292 | 55.2%), White / Caucasian (44,025 | 49.3%), and Two or more Races (17,932 | 20.1%).
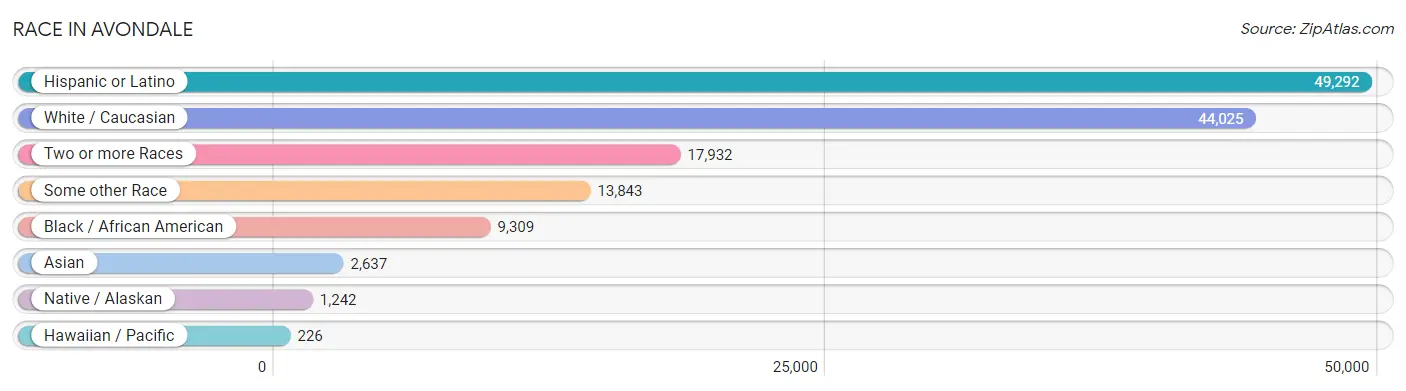
| Race | # Population | % Population |
| Asian | 2,637 | 3.0% |
| Black / African American | 9,309 | 10.4% |
| Hawaiian / Pacific | 226 | 0.3% |
| Hispanic or Latino | 49,292 | 55.2% |
| Native / Alaskan | 1,242 | 1.4% |
| White / Caucasian | 44,025 | 49.3% |
| Two or more Races | 17,932 | 20.1% |
| Some other Race | 13,843 | 15.5% |
| Total | 89,214 | 100.0% |
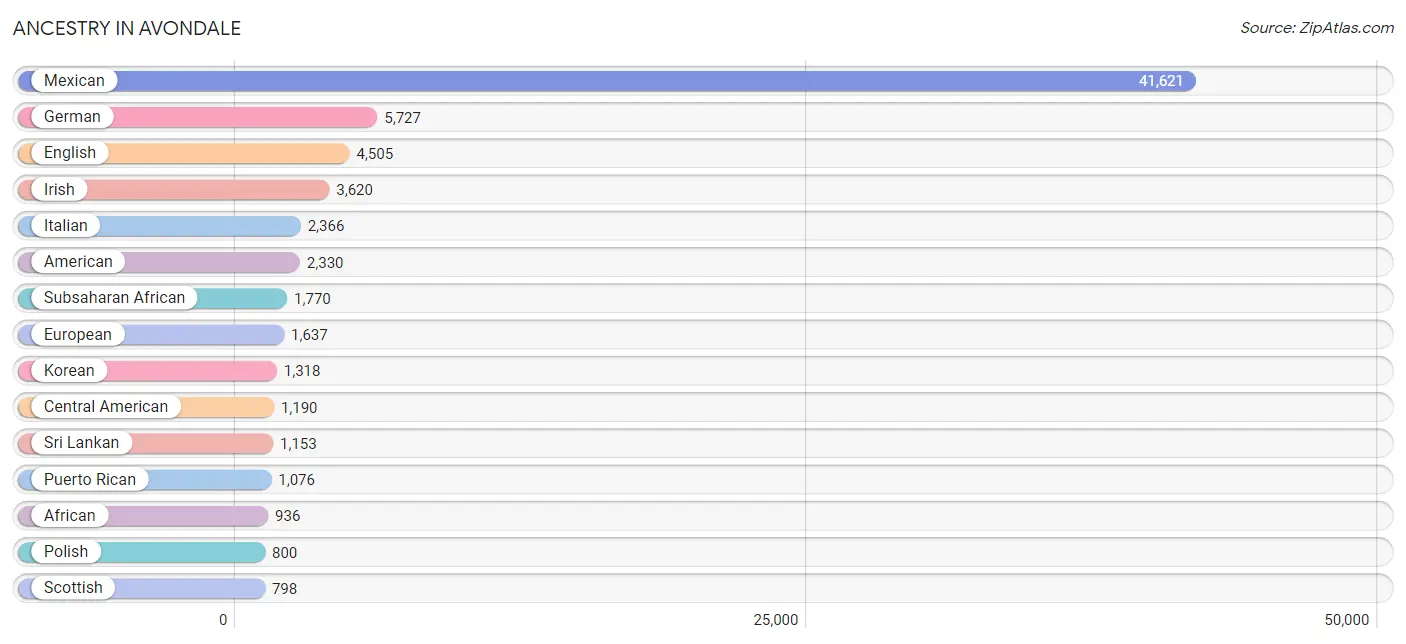
Ancestry in Avondale
The most populous ancestries reported in Avondale are Mexican (41,621 | 46.7%), German (5,727 | 6.4%), English (4,505 | 5.1%), Irish (3,620 | 4.1%), and Italian (2,366 | 2.6%), together accounting for 64.8% of all Avondale residents.
| Ancestry | # Population | % Population |
| African | 936 | 1.1% |
| Albanian | 26 | 0.0% |
| American | 2,330 | 2.6% |
| Apache | 382 | 0.4% |
| Arab | 320 | 0.4% |
| Argentinean | 101 | 0.1% |
| Assyrian / Chaldean / Syriac | 24 | 0.0% |
| Australian | 7 | 0.0% |
| Austrian | 17 | 0.0% |
| Belgian | 51 | 0.1% |
| Bhutanese | 511 | 0.6% |
| Blackfeet | 6 | 0.0% |
| Brazilian | 28 | 0.0% |
| British | 482 | 0.5% |
| Bulgarian | 45 | 0.1% |
| Burmese | 256 | 0.3% |
| Canadian | 157 | 0.2% |
| Cape Verdean | 74 | 0.1% |
| Celtic | 6 | 0.0% |
| Central American | 1,190 | 1.3% |
| Central American Indian | 44 | 0.1% |
| Cherokee | 109 | 0.1% |
| Chickasaw | 23 | 0.0% |
| Chilean | 135 | 0.2% |
| Choctaw | 44 | 0.1% |
| Colombian | 95 | 0.1% |
| Costa Rican | 4 | 0.0% |
| Croatian | 29 | 0.0% |
| Cuban | 519 | 0.6% |
| Czech | 89 | 0.1% |
| Czechoslovakian | 128 | 0.1% |
| Danish | 263 | 0.3% |
| Dominican | 112 | 0.1% |
| Dutch | 665 | 0.7% |
| Eastern European | 37 | 0.0% |
| Ecuadorian | 28 | 0.0% |
| English | 4,505 | 5.1% |
| Ethiopian | 102 | 0.1% |
| European | 1,637 | 1.8% |
| Fijian | 123 | 0.1% |
| Filipino | 15 | 0.0% |
| Finnish | 91 | 0.1% |
| French | 575 | 0.6% |
| French Canadian | 212 | 0.2% |
| German | 5,727 | 6.4% |
| Greek | 114 | 0.1% |
| Guamanian / Chamorro | 97 | 0.1% |
| Guatemalan | 613 | 0.7% |
| Guyanese | 89 | 0.1% |
| Honduran | 31 | 0.0% |
| Hopi | 17 | 0.0% |
| Hungarian | 113 | 0.1% |
| Indian (Asian) | 605 | 0.7% |
| Indonesian | 10 | 0.0% |
| Iranian | 60 | 0.1% |
| Iraqi | 113 | 0.1% |
| Irish | 3,620 | 4.1% |
| Iroquois | 4 | 0.0% |
| Italian | 2,366 | 2.6% |
| Jamaican | 187 | 0.2% |
| Japanese | 57 | 0.1% |
| Jordanian | 15 | 0.0% |
| Korean | 1,318 | 1.5% |
| Lebanese | 53 | 0.1% |
| Liberian | 39 | 0.0% |
| Lithuanian | 53 | 0.1% |
| Luxembourger | 8 | 0.0% |
| Malaysian | 34 | 0.0% |
| Mexican | 41,621 | 46.7% |
| Mexican American Indian | 216 | 0.2% |
| Native Hawaiian | 391 | 0.4% |
| Navajo | 439 | 0.5% |
| Nicaraguan | 180 | 0.2% |
| Nigerian | 158 | 0.2% |
| Northern European | 10 | 0.0% |
| Norwegian | 734 | 0.8% |
| Pakistani | 190 | 0.2% |
| Palestinian | 98 | 0.1% |
| Panamanian | 23 | 0.0% |
| Peruvian | 112 | 0.1% |
| Pima | 211 | 0.2% |
| Polish | 800 | 0.9% |
| Portuguese | 137 | 0.2% |
| Potawatomi | 48 | 0.1% |
| Pueblo | 29 | 0.0% |
| Puerto Rican | 1,076 | 1.2% |
| Romanian | 122 | 0.1% |
| Russian | 72 | 0.1% |
| Salvadoran | 339 | 0.4% |
| Samoan | 195 | 0.2% |
| Scandinavian | 279 | 0.3% |
| Scotch-Irish | 245 | 0.3% |
| Scottish | 798 | 0.9% |
| Senegalese | 11 | 0.0% |
| Serbian | 11 | 0.0% |
| Sioux | 106 | 0.1% |
| Slovak | 11 | 0.0% |
| Slovene | 30 | 0.0% |
| South African | 25 | 0.0% |
| South American | 543 | 0.6% |
| South American Indian | 10 | 0.0% |
| Spaniard | 389 | 0.4% |
| Spanish | 354 | 0.4% |
| Sri Lankan | 1,153 | 1.3% |
| Subsaharan African | 1,770 | 2.0% |
| Sudanese | 395 | 0.4% |
| Swedish | 407 | 0.5% |
| Swiss | 174 | 0.2% |
| Syrian | 19 | 0.0% |
| Thai | 142 | 0.2% |
| Tohono O'Odham | 134 | 0.2% |
| Tongan | 42 | 0.1% |
| Turkish | 24 | 0.0% |
| Ukrainian | 155 | 0.2% |
| Venezuelan | 72 | 0.1% |
| Welsh | 273 | 0.3% |
| West Indian | 9 | 0.0% |
| Yaqui | 91 | 0.1% |
| Yugoslavian | 20 | 0.0% |
| Yuman | 62 | 0.1% | View All 120 Rows |
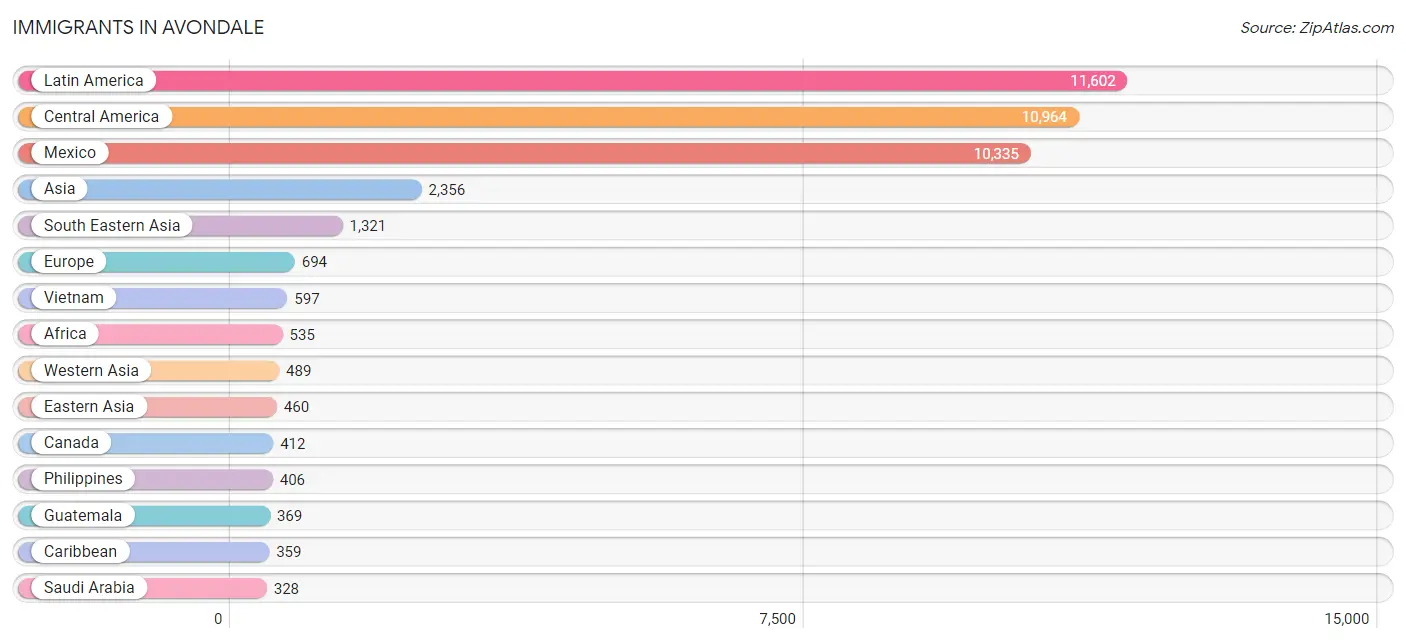
Immigrants in Avondale
The most numerous immigrant groups reported in Avondale came from Latin America (11,602 | 13.0%), Central America (10,964 | 12.3%), Mexico (10,335 | 11.6%), Asia (2,356 | 2.6%), and South Eastern Asia (1,321 | 1.5%), together accounting for 41.0% of all Avondale residents.
| Immigration Origin | # Population | % Population |
| Africa | 535 | 0.6% |
| Albania | 15 | 0.0% |
| Asia | 2,356 | 2.6% |
| Bosnia and Herzegovina | 20 | 0.0% |
| Brazil | 18 | 0.0% |
| Bulgaria | 45 | 0.1% |
| Cambodia | 8 | 0.0% |
| Canada | 412 | 0.5% |
| Caribbean | 359 | 0.4% |
| Central America | 10,964 | 12.3% |
| Chile | 55 | 0.1% |
| China | 214 | 0.2% |
| Colombia | 73 | 0.1% |
| Costa Rica | 4 | 0.0% |
| Cuba | 204 | 0.2% |
| Dominican Republic | 101 | 0.1% |
| Eastern Africa | 43 | 0.1% |
| Eastern Asia | 460 | 0.5% |
| Eastern Europe | 186 | 0.2% |
| El Salvador | 179 | 0.2% |
| England | 145 | 0.2% |
| Ethiopia | 27 | 0.0% |
| Europe | 694 | 0.8% |
| Fiji | 1 | 0.0% |
| France | 14 | 0.0% |
| Germany | 102 | 0.1% |
| Guatemala | 369 | 0.4% |
| Honduras | 16 | 0.0% |
| Hong Kong | 37 | 0.0% |
| Hungary | 6 | 0.0% |
| India | 36 | 0.0% |
| Indonesia | 9 | 0.0% |
| Iran | 13 | 0.0% |
| Iraq | 125 | 0.1% |
| Ireland | 12 | 0.0% |
| Italy | 159 | 0.2% |
| Jamaica | 27 | 0.0% |
| Japan | 112 | 0.1% |
| Jordan | 28 | 0.0% |
| Korea | 134 | 0.2% |
| Laos | 16 | 0.0% |
| Latin America | 11,602 | 13.0% |
| Liberia | 68 | 0.1% |
| Mexico | 10,335 | 11.6% |
| Moldova | 52 | 0.1% |
| Nicaragua | 34 | 0.0% |
| Nigeria | 79 | 0.1% |
| Northern Africa | 75 | 0.1% |
| Northern Europe | 227 | 0.3% |
| Norway | 9 | 0.0% |
| Oceania | 54 | 0.1% |
| Pakistan | 3 | 0.0% |
| Panama | 12 | 0.0% |
| Peru | 89 | 0.1% |
| Philippines | 406 | 0.5% |
| Poland | 29 | 0.0% |
| Romania | 14 | 0.0% |
| Russia | 5 | 0.0% |
| Saudi Arabia | 328 | 0.4% |
| Senegal | 11 | 0.0% |
| Sierra Leone | 113 | 0.1% |
| Singapore | 75 | 0.1% |
| South Africa | 25 | 0.0% |
| South America | 279 | 0.3% |
| South Central Asia | 52 | 0.1% |
| South Eastern Asia | 1,321 | 1.5% |
| Southern Europe | 165 | 0.2% |
| Spain | 6 | 0.0% |
| Sudan | 67 | 0.1% |
| Taiwan | 41 | 0.1% |
| Thailand | 210 | 0.2% |
| Trinidad and Tobago | 18 | 0.0% |
| Turkey | 8 | 0.0% |
| Uganda | 4 | 0.0% |
| Venezuela | 44 | 0.1% |
| Vietnam | 597 | 0.7% |
| West Indies | 9 | 0.0% |
| Western Africa | 289 | 0.3% |
| Western Asia | 489 | 0.5% |
| Western Europe | 116 | 0.1% | View All 80 Rows |
Sex and Age in Avondale
Sex and Age in Avondale
The most populous age groups in Avondale are 25 to 29 Years (4,142 | 9.4%) for men and 30 to 34 Years (3,842 | 8.5%) for women.
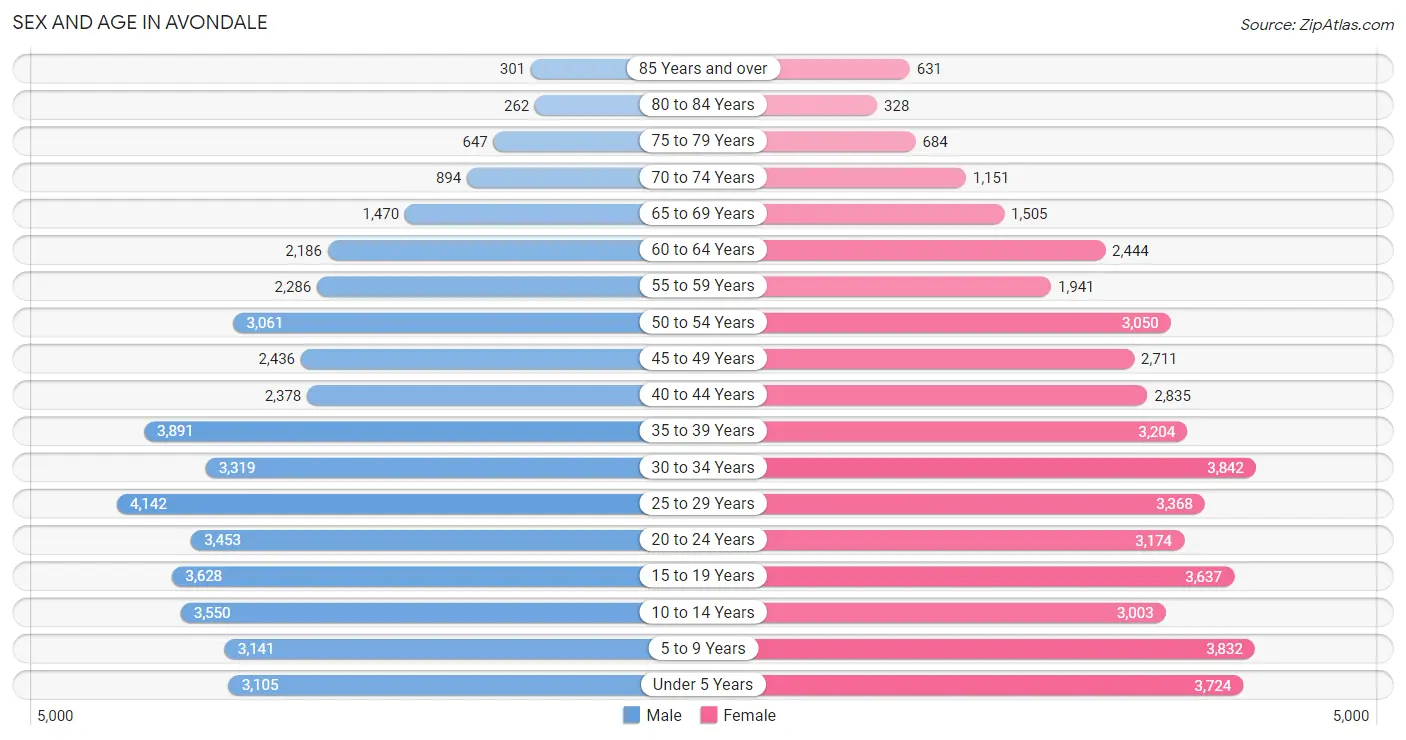
| Age Bracket | Male | Female |
| Under 5 Years | 3,105 (7.0%) | 3,724 (8.3%) |
| 5 to 9 Years | 3,141 (7.1%) | 3,832 (8.5%) |
| 10 to 14 Years | 3,550 (8.0%) | 3,003 (6.7%) |
| 15 to 19 Years | 3,628 (8.2%) | 3,637 (8.1%) |
| 20 to 24 Years | 3,453 (7.8%) | 3,174 (7.0%) |
| 25 to 29 Years | 4,142 (9.4%) | 3,368 (7.5%) |
| 30 to 34 Years | 3,319 (7.5%) | 3,842 (8.5%) |
| 35 to 39 Years | 3,891 (8.8%) | 3,204 (7.1%) |
| 40 to 44 Years | 2,378 (5.4%) | 2,835 (6.3%) |
| 45 to 49 Years | 2,436 (5.5%) | 2,711 (6.0%) |
| 50 to 54 Years | 3,061 (6.9%) | 3,050 (6.8%) |
| 55 to 59 Years | 2,286 (5.2%) | 1,941 (4.3%) |
| 60 to 64 Years | 2,186 (5.0%) | 2,444 (5.4%) |
| 65 to 69 Years | 1,470 (3.3%) | 1,505 (3.3%) |
| 70 to 74 Years | 894 (2.0%) | 1,151 (2.5%) |
| 75 to 79 Years | 647 (1.5%) | 684 (1.5%) |
| 80 to 84 Years | 262 (0.6%) | 328 (0.7%) |
| 85 Years and over | 301 (0.7%) | 631 (1.4%) |
| Total | 44,150 (100.0%) | 45,064 (100.0%) |
Families and Households in Avondale
Median Family Size in Avondale
The median family size in Avondale is 3.58 persons per family, with married-couple families (13,910 | 66.3%) accounting for the largest median family size of 3.76 persons per family. On the other hand, single male/father families (2,458 | 11.7%) represent the smallest median family size with 2.92 persons per family.
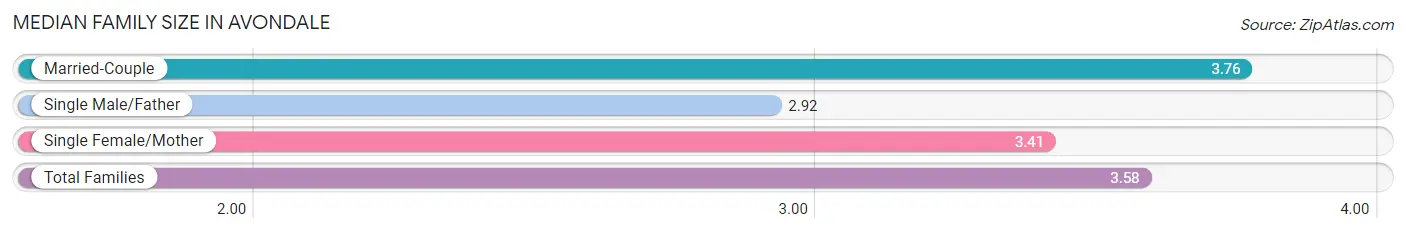
| Family Type | # Families | Family Size |
| Married-Couple | 13,910 (66.3%) | 3.76 |
| Single Male/Father | 2,458 (11.7%) | 2.92 |
| Single Female/Mother | 4,607 (22.0%) | 3.41 |
| Total Families | 20,975 (100.0%) | 3.58 |
Median Household Size in Avondale
The median household size in Avondale is 3.09 persons per household, with married-couple households (13,910 | 48.2%) accounting for the largest median household size of 3.79 persons per household. non-family households (7,856 | 27.3%) represent the smallest median household size with 1.42 persons per household.
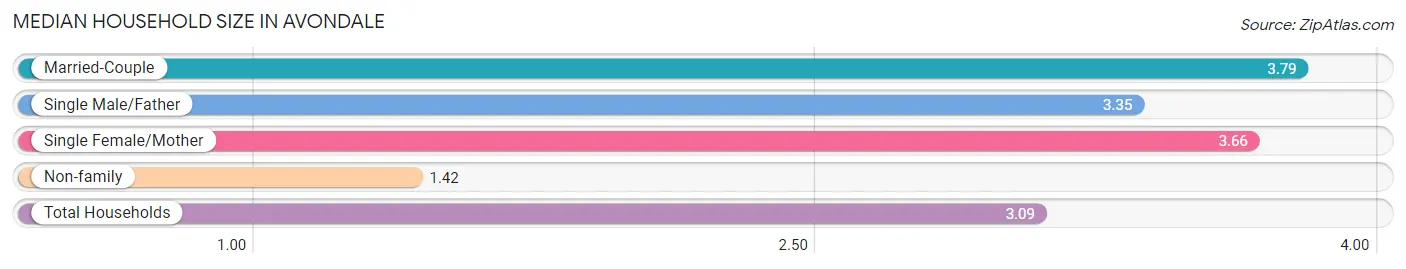
| Household Type | # Households | Household Size |
| Married-Couple | 13,910 (48.2%) | 3.79 |
| Single Male/Father | 2,458 (8.5%) | 3.35 |
| Single Female/Mother | 4,607 (16.0%) | 3.66 |
| Non-family | 7,856 (27.3%) | 1.42 |
| Total Households | 28,831 (100.0%) | 3.09 |
Household Size by Marriage Status in Avondale
Out of a total of 28,831 households in Avondale, 20,975 (72.8%) are family households, while 7,856 (27.3%) are nonfamily households. The most numerous type of family households are 2-person households, comprising 6,091, and the most common type of nonfamily households are 1-person households, comprising 5,413.
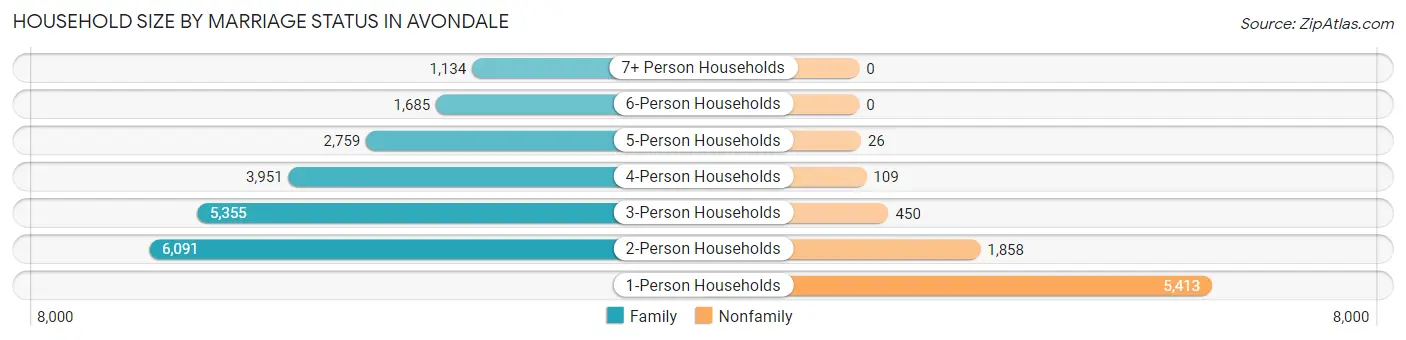
| Household Size | Family Households | Nonfamily Households |
| 1-Person Households | - | 5,413 (18.8%) |
| 2-Person Households | 6,091 (21.1%) | 1,858 (6.4%) |
| 3-Person Households | 5,355 (18.6%) | 450 (1.6%) |
| 4-Person Households | 3,951 (13.7%) | 109 (0.4%) |
| 5-Person Households | 2,759 (9.6%) | 26 (0.1%) |
| 6-Person Households | 1,685 (5.8%) | 0 (0.0%) |
| 7+ Person Households | 1,134 (3.9%) | 0 (0.0%) |
| Total | 20,975 (72.8%) | 7,856 (27.3%) |
Female Fertility in Avondale
Fertility by Age in Avondale
Average fertility rate in Avondale is 57.0 births per 1,000 women. Women in the age bracket of 20 to 34 years have the highest fertility rate with 91.0 births per 1,000 women. Women in the age bracket of 20 to 34 years acount for 71.5% of all women with births.
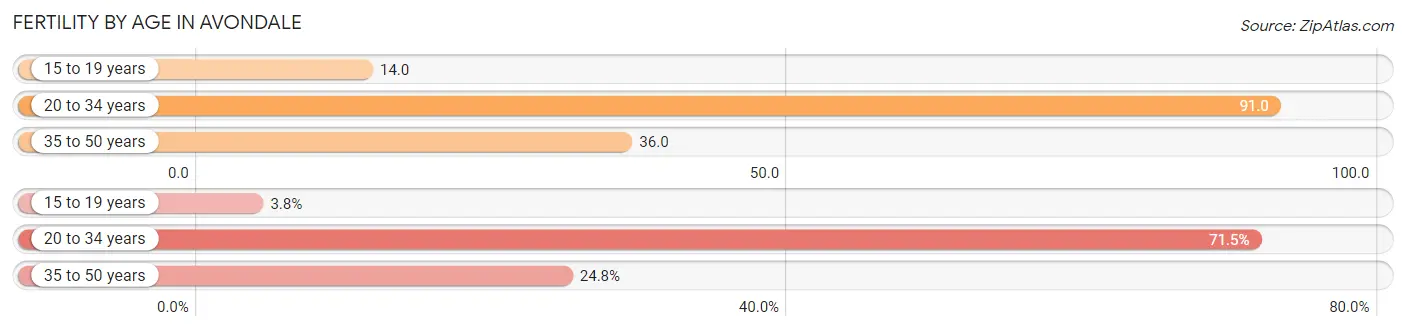
| Age Bracket | Women with Births | Births / 1,000 Women |
| 15 to 19 years | 50 (3.8%) | 14.0 |
| 20 to 34 years | 950 (71.5%) | 91.0 |
| 35 to 50 years | 329 (24.8%) | 36.0 |
| Total | 1,329 (100.0%) | 57.0 |
Fertility by Age by Marriage Status in Avondale
71.4% of women with births (1,329) in Avondale are married. The highest percentage of unmarried women with births falls into 15 to 19 years age bracket with 100.0% of them unmarried at the time of birth, while the lowest percentage of unmarried women with births belong to 20 to 34 years age bracket with 25.0% of them unmarried.
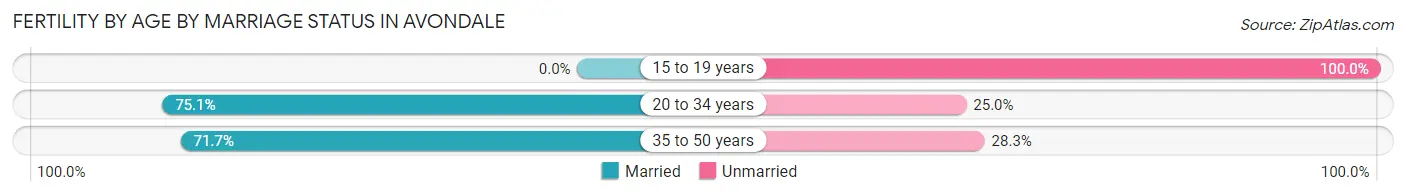
| Age Bracket | Married | Unmarried |
| 15 to 19 years | 0 (0.0%) | 50 (100.0%) |
| 20 to 34 years | 713 (75.0%) | 237 (24.9%) |
| 35 to 50 years | 236 (71.7%) | 93 (28.3%) |
| Total | 949 (71.4%) | 380 (28.6%) |
Fertility by Education in Avondale
Average fertility rate in Avondale is 57.0 births per 1,000 women. Women with the education attainment of bachelor's degree have the highest fertility rate of 88.0 births per 1,000 women, while women with the education attainment of graduate degree have the lowest fertility at 15.0 births per 1,000 women. Women with the education attainment of college or associate's degree represent 38.8% of all women with births.
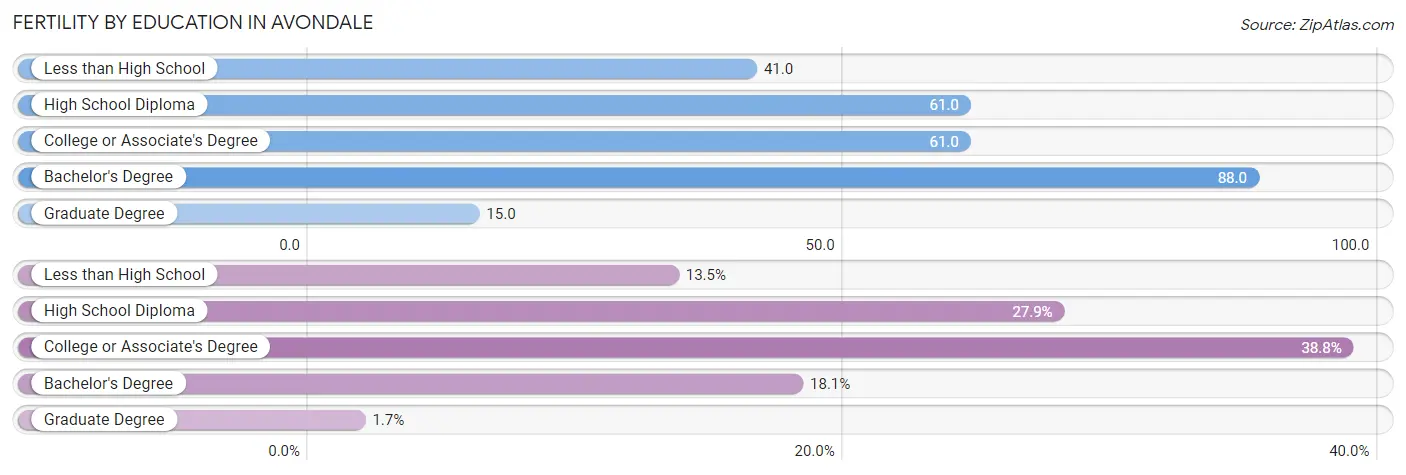
| Educational Attainment | Women with Births | Births / 1,000 Women |
| Less than High School | 179 (13.5%) | 41.0 |
| High School Diploma | 371 (27.9%) | 61.0 |
| College or Associate's Degree | 515 (38.8%) | 61.0 |
| Bachelor's Degree | 241 (18.1%) | 88.0 |
| Graduate Degree | 23 (1.7%) | 15.0 |
| Total | 1,329 (100.0%) | 57.0 |
Fertility by Education by Marriage Status in Avondale
28.6% of women with births in Avondale are unmarried. Women with the educational attainment of graduate degree are most likely to be married with 100.0% of them married at childbirth, while women with the educational attainment of high school diploma are least likely to be married with 39.1% of them unmarried at childbirth.
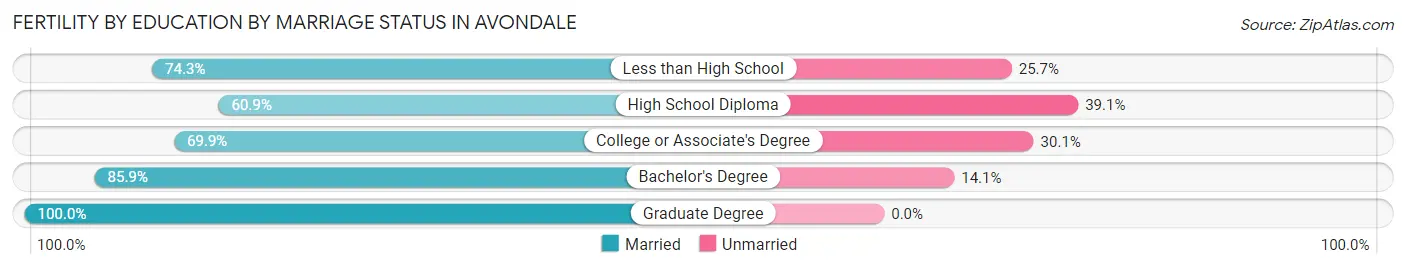
| Educational Attainment | Married | Unmarried |
| Less than High School | 133 (74.3%) | 46 (25.7%) |
| High School Diploma | 226 (60.9%) | 145 (39.1%) |
| College or Associate's Degree | 360 (69.9%) | 155 (30.1%) |
| Bachelor's Degree | 207 (85.9%) | 34 (14.1%) |
| Graduate Degree | 23 (100.0%) | 0 (0.0%) |
| Total | 949 (71.4%) | 380 (28.6%) |
Employment Characteristics in Avondale
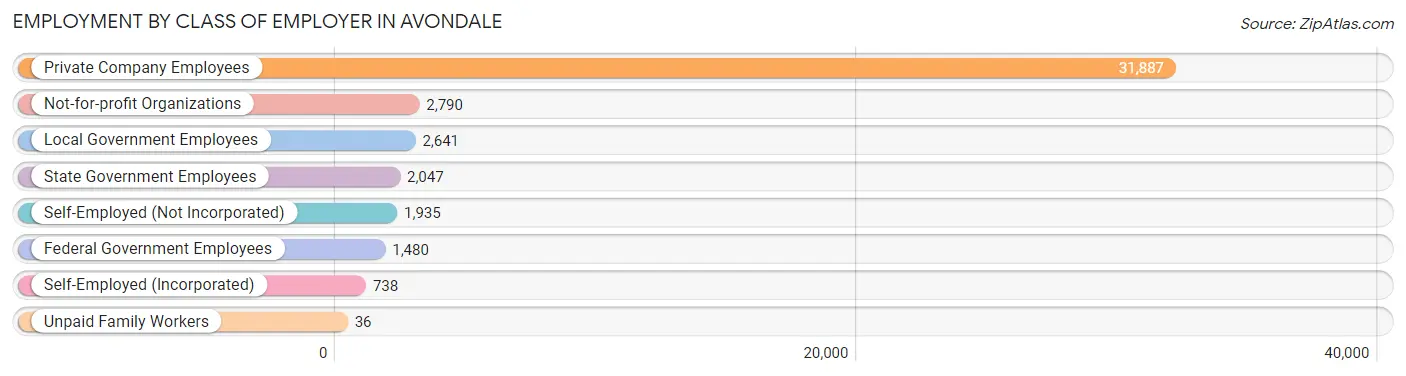
Employment by Class of Employer in Avondale
Among the 43,554 employed individuals in Avondale, private company employees (31,887 | 73.2%), not-for-profit organizations (2,790 | 6.4%), and local government employees (2,641 | 6.1%) make up the most common classes of employment.
| Employer Class | # Employees | % Employees |
| Private Company Employees | 31,887 | 73.2% |
| Self-Employed (Incorporated) | 738 | 1.7% |
| Self-Employed (Not Incorporated) | 1,935 | 4.4% |
| Not-for-profit Organizations | 2,790 | 6.4% |
| Local Government Employees | 2,641 | 6.1% |
| State Government Employees | 2,047 | 4.7% |
| Federal Government Employees | 1,480 | 3.4% |
| Unpaid Family Workers | 36 | 0.1% |
| Total | 43,554 | 100.0% |
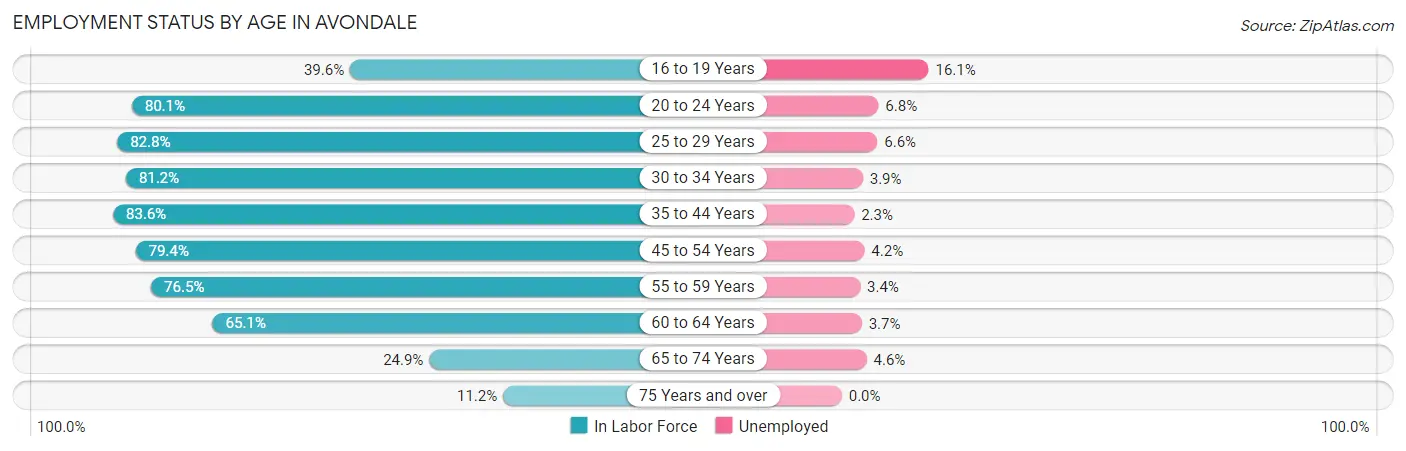
Employment Status by Age in Avondale
According to the labor force statistics for Avondale, out of the total population over 16 years of age (67,065), 69.4% or 46,543 individuals are in the labor force, with 4.8% or 2,234 of them unemployed. The age group with the highest labor force participation rate is 35 to 44 years, with 83.6% or 10,289 individuals in the labor force. Within the labor force, the 16 to 19 years age range has the highest percentage of unemployed individuals, with 16.1% or 349 of them being unemployed.
| Age Bracket | In Labor Force | Unemployed |
| 16 to 19 Years | 2,167 (39.6%) | 349 (16.1%) |
| 20 to 24 Years | 5,308 (80.1%) | 361 (6.8%) |
| 25 to 29 Years | 6,218 (82.8%) | 410 (6.6%) |
| 30 to 34 Years | 5,815 (81.2%) | 227 (3.9%) |
| 35 to 44 Years | 10,289 (83.6%) | 237 (2.3%) |
| 45 to 54 Years | 8,939 (79.4%) | 375 (4.2%) |
| 55 to 59 Years | 3,234 (76.5%) | 110 (3.4%) |
| 60 to 64 Years | 3,014 (65.1%) | 112 (3.7%) |
| 65 to 74 Years | 1,250 (24.9%) | 58 (4.6%) |
| 75 Years and over | 320 (11.2%) | 0 (0.0%) |
| Total | 46,543 (69.4%) | 2,234 (4.8%) |
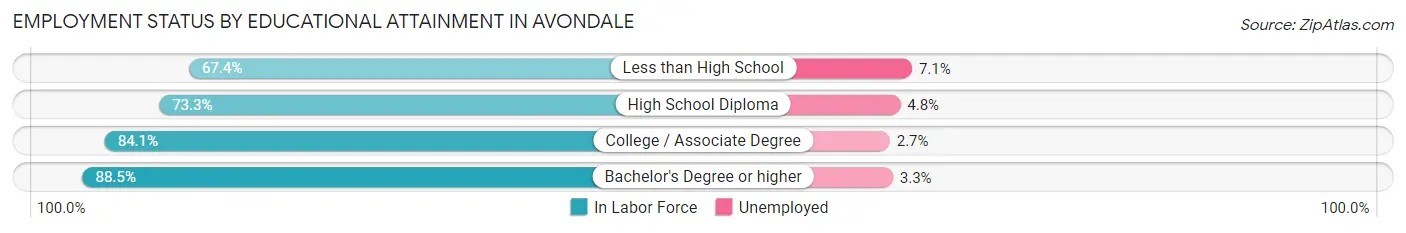
Employment Status by Educational Attainment in Avondale
According to labor force statistics for Avondale, 79.6% of individuals (37,487) out of the total population between 25 and 64 years of age (47,094) are in the labor force, with 3.9% or 1,462 of them being unemployed. The group with the highest labor force participation rate are those with the educational attainment of bachelor's degree or higher, with 88.5% or 8,903 individuals in the labor force. Within the labor force, individuals with less than high school education have the highest percentage of unemployment, with 7.1% or 317 of them being unemployed.
| Educational Attainment | In Labor Force | Unemployed |
| Less than High School | 4,459 (67.4%) | 470 (7.1%) |
| High School Diploma | 9,770 (73.3%) | 640 (4.8%) |
| College / Associate Degree | 14,372 (84.1%) | 461 (2.7%) |
| Bachelor's Degree or higher | 8,903 (88.5%) | 332 (3.3%) |
| Total | 37,487 (79.6%) | 1,837 (3.9%) |
Employment Occupations by Sex in Avondale
Management, Business, Science and Arts Occupations
The most common Management, Business, Science and Arts occupations in Avondale are Community & Social Service (4,189 | 9.6%), Management (3,283 | 7.5%), Business & Financial (2,414 | 5.5%), Education Instruction & Library (2,324 | 5.3%), and Health Diagnosing & Treating (2,296 | 5.2%).
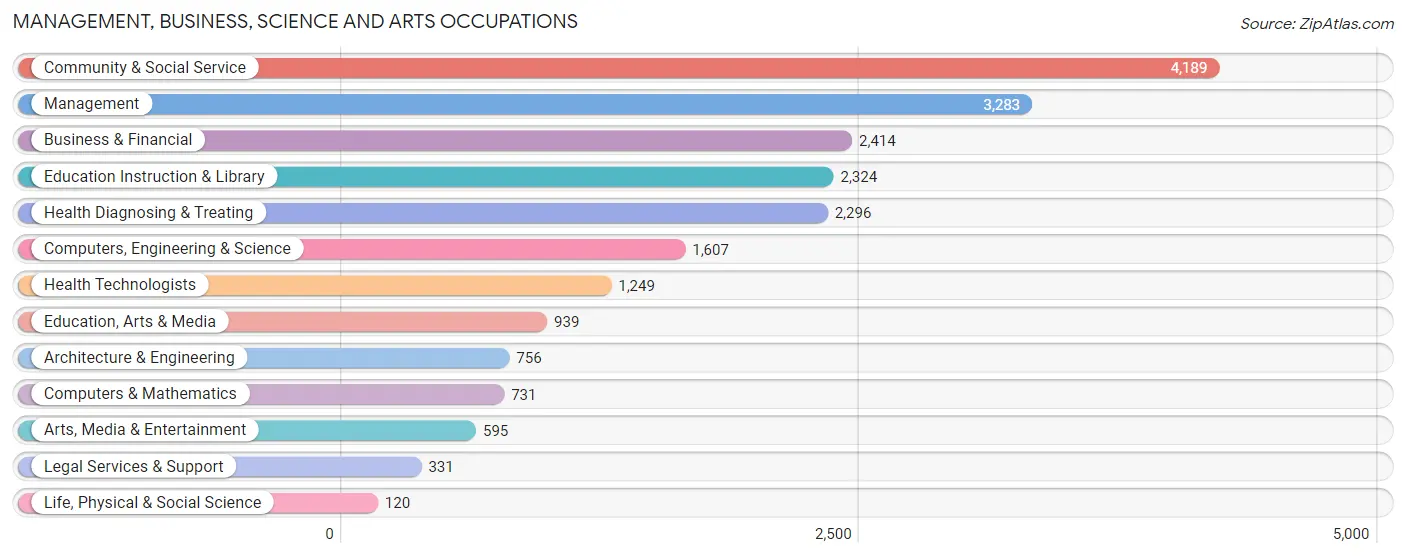
Management, Business, Science and Arts Occupations by Sex
Within the Management, Business, Science and Arts occupations in Avondale, the most male-oriented occupations are Architecture & Engineering (96.0%), Computers, Engineering & Science (84.1%), and Life, Physical & Social Science (74.2%), while the most female-oriented occupations are Legal Services & Support (95.2%), Health Technologists (77.6%), and Health Diagnosing & Treating (73.4%).
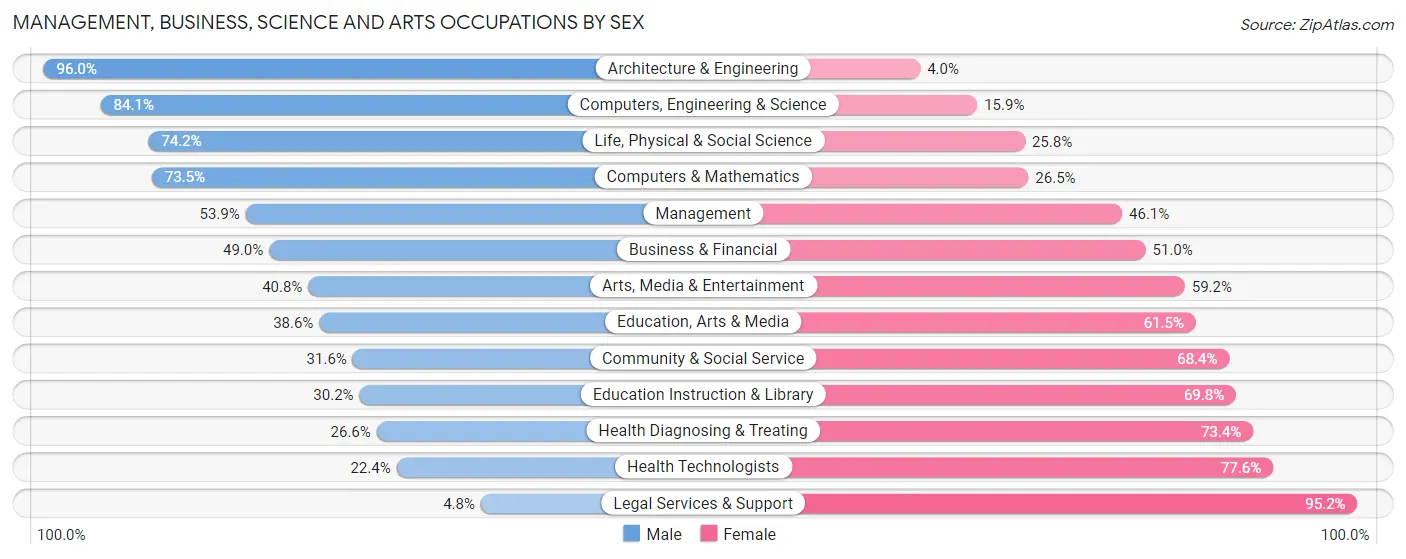
| Occupation | Male | Female |
| Management | 1,770 (53.9%) | 1,513 (46.1%) |
| Business & Financial | 1,183 (49.0%) | 1,231 (51.0%) |
| Computers, Engineering & Science | 1,352 (84.1%) | 255 (15.9%) |
| Computers & Mathematics | 537 (73.5%) | 194 (26.5%) |
| Architecture & Engineering | 726 (96.0%) | 30 (4.0%) |
| Life, Physical & Social Science | 89 (74.2%) | 31 (25.8%) |
| Community & Social Service | 1,322 (31.6%) | 2,867 (68.4%) |
| Education, Arts & Media | 362 (38.6%) | 577 (61.5%) |
| Legal Services & Support | 16 (4.8%) | 315 (95.2%) |
| Education Instruction & Library | 701 (30.2%) | 1,623 (69.8%) |
| Arts, Media & Entertainment | 243 (40.8%) | 352 (59.2%) |
| Health Diagnosing & Treating | 610 (26.6%) | 1,686 (73.4%) |
| Health Technologists | 280 (22.4%) | 969 (77.6%) |
| Total (Category) | 6,237 (45.2%) | 7,552 (54.8%) |
| Total (Overall) | 23,759 (54.3%) | 20,008 (45.7%) |
Services Occupations
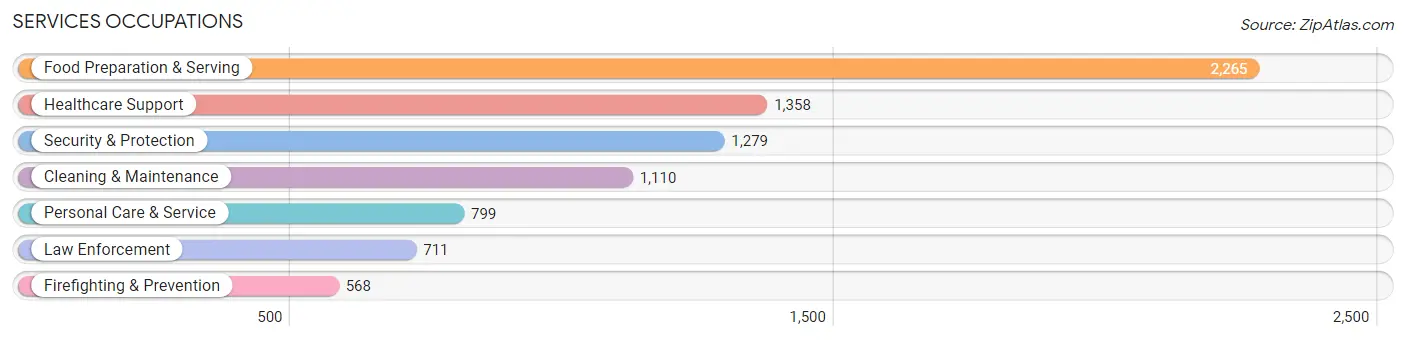
The most common Services occupations in Avondale are Food Preparation & Serving (2,265 | 5.2%), Healthcare Support (1,358 | 3.1%), Security & Protection (1,279 | 2.9%), Cleaning & Maintenance (1,110 | 2.5%), and Personal Care & Service (799 | 1.8%).
Services Occupations by Sex
Within the Services occupations in Avondale, the most male-oriented occupations are Law Enforcement (92.5%), Security & Protection (86.4%), and Firefighting & Prevention (78.7%), while the most female-oriented occupations are Healthcare Support (84.6%), Personal Care & Service (82.9%), and Food Preparation & Serving (53.2%).
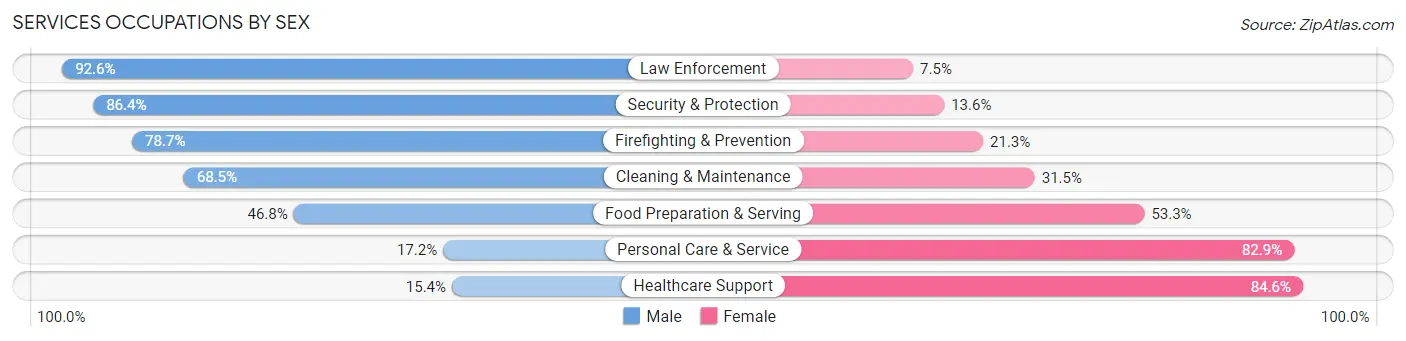
| Occupation | Male | Female |
| Healthcare Support | 209 (15.4%) | 1,149 (84.6%) |
| Security & Protection | 1,105 (86.4%) | 174 (13.6%) |
| Firefighting & Prevention | 447 (78.7%) | 121 (21.3%) |
| Law Enforcement | 658 (92.5%) | 53 (7.4%) |
| Food Preparation & Serving | 1,059 (46.8%) | 1,206 (53.2%) |
| Cleaning & Maintenance | 760 (68.5%) | 350 (31.5%) |
| Personal Care & Service | 137 (17.2%) | 662 (82.9%) |
| Total (Category) | 3,270 (48.0%) | 3,541 (52.0%) |
| Total (Overall) | 23,759 (54.3%) | 20,008 (45.7%) |
Sales and Office Occupations
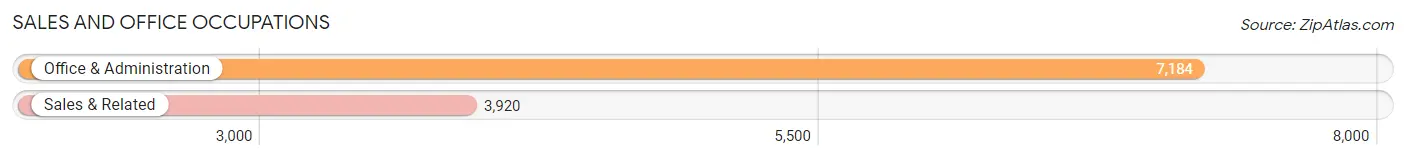
The most common Sales and Office occupations in Avondale are Office & Administration (7,184 | 16.4%), and Sales & Related (3,920 | 9.0%).
Sales and Office Occupations by Sex
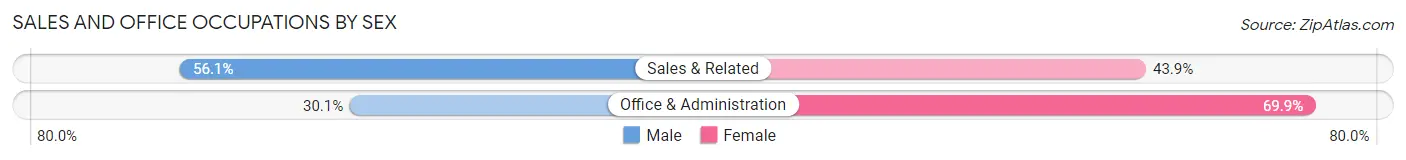
| Occupation | Male | Female |
| Sales & Related | 2,198 (56.1%) | 1,722 (43.9%) |
| Office & Administration | 2,162 (30.1%) | 5,022 (69.9%) |
| Total (Category) | 4,360 (39.3%) | 6,744 (60.7%) |
| Total (Overall) | 23,759 (54.3%) | 20,008 (45.7%) |
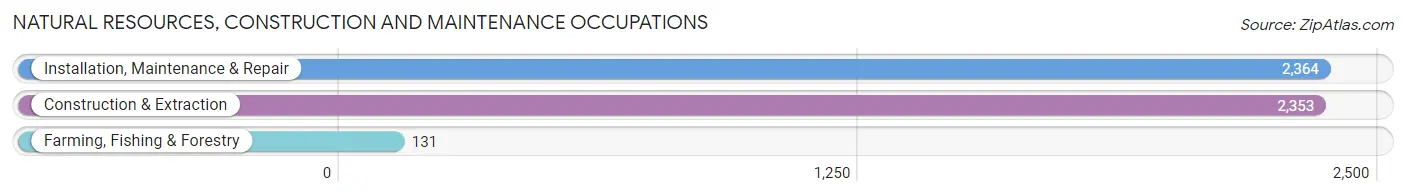
Natural Resources, Construction and Maintenance Occupations
The most common Natural Resources, Construction and Maintenance occupations in Avondale are Installation, Maintenance & Repair (2,364 | 5.4%), Construction & Extraction (2,353 | 5.4%), and Farming, Fishing & Forestry (131 | 0.3%).
Natural Resources, Construction and Maintenance Occupations by Sex
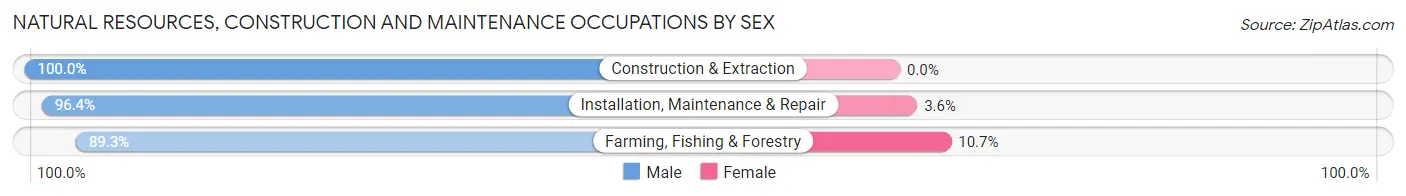
| Occupation | Male | Female |
| Farming, Fishing & Forestry | 117 (89.3%) | 14 (10.7%) |
| Construction & Extraction | 2,353 (100.0%) | 0 (0.0%) |
| Installation, Maintenance & Repair | 2,279 (96.4%) | 85 (3.6%) |
| Total (Category) | 4,749 (98.0%) | 99 (2.0%) |
| Total (Overall) | 23,759 (54.3%) | 20,008 (45.7%) |
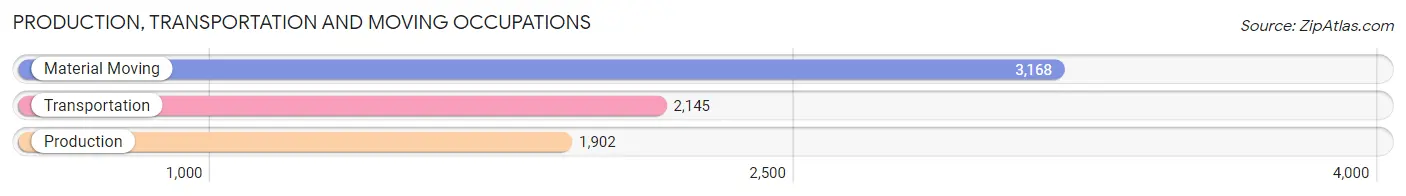
Production, Transportation and Moving Occupations
The most common Production, Transportation and Moving occupations in Avondale are Material Moving (3,168 | 7.2%), Transportation (2,145 | 4.9%), and Production (1,902 | 4.3%).
Production, Transportation and Moving Occupations by Sex
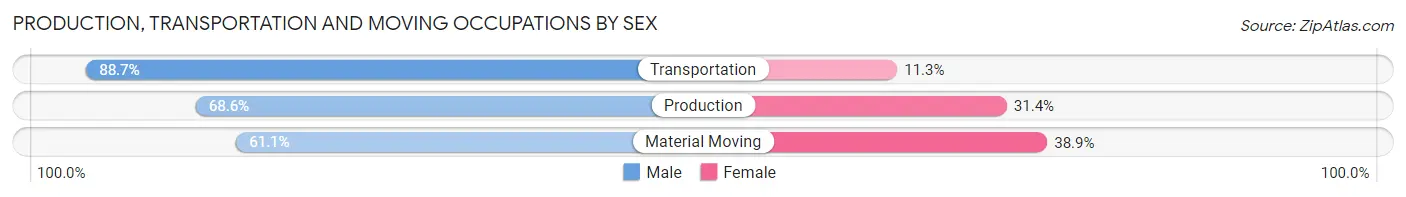
| Occupation | Male | Female |
| Production | 1,304 (68.6%) | 598 (31.4%) |
| Transportation | 1,902 (88.7%) | 243 (11.3%) |
| Material Moving | 1,937 (61.1%) | 1,231 (38.9%) |
| Total (Category) | 5,143 (71.3%) | 2,072 (28.7%) |
| Total (Overall) | 23,759 (54.3%) | 20,008 (45.7%) |
Employment Industries by Sex in Avondale
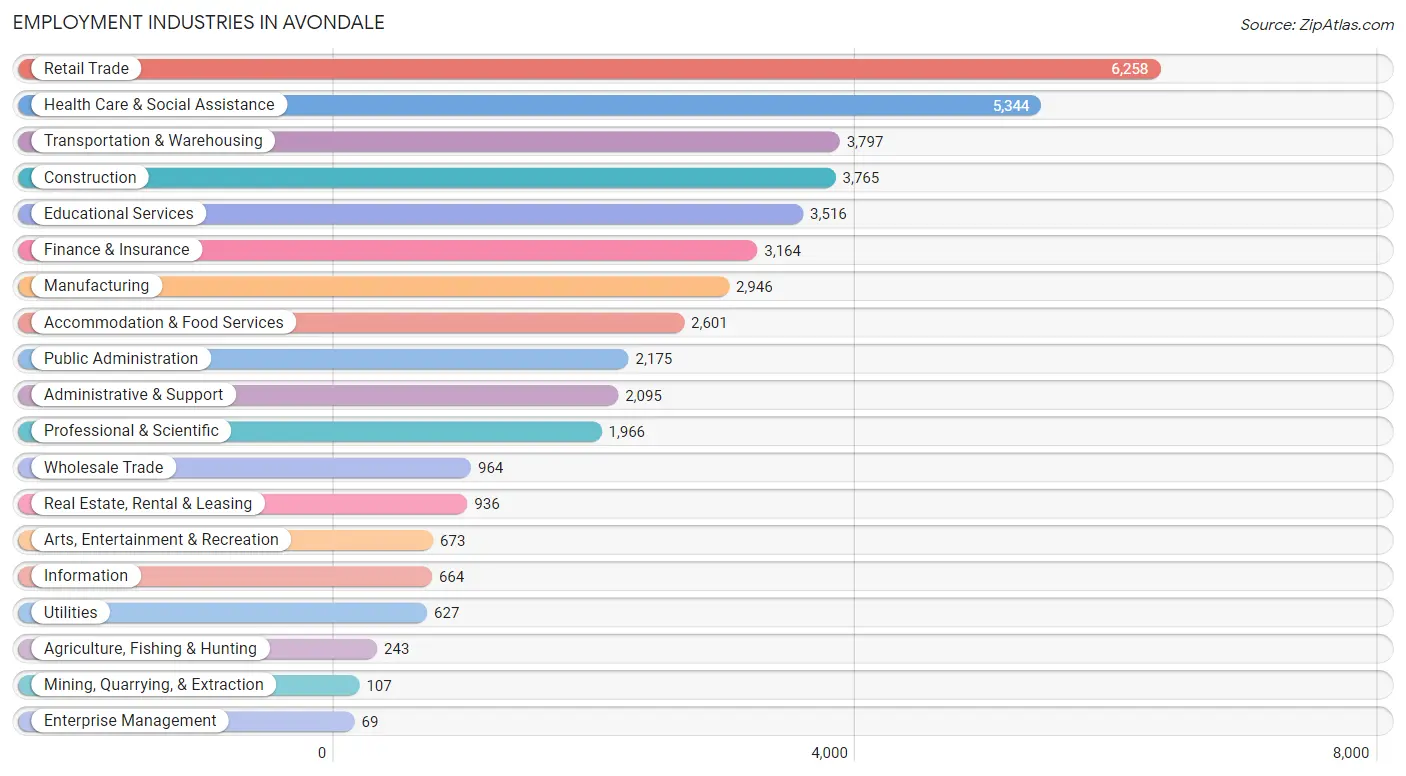
Employment Industries in Avondale
The major employment industries in Avondale include Retail Trade (6,258 | 14.3%), Health Care & Social Assistance (5,344 | 12.2%), Transportation & Warehousing (3,797 | 8.7%), Construction (3,765 | 8.6%), and Educational Services (3,516 | 8.0%).
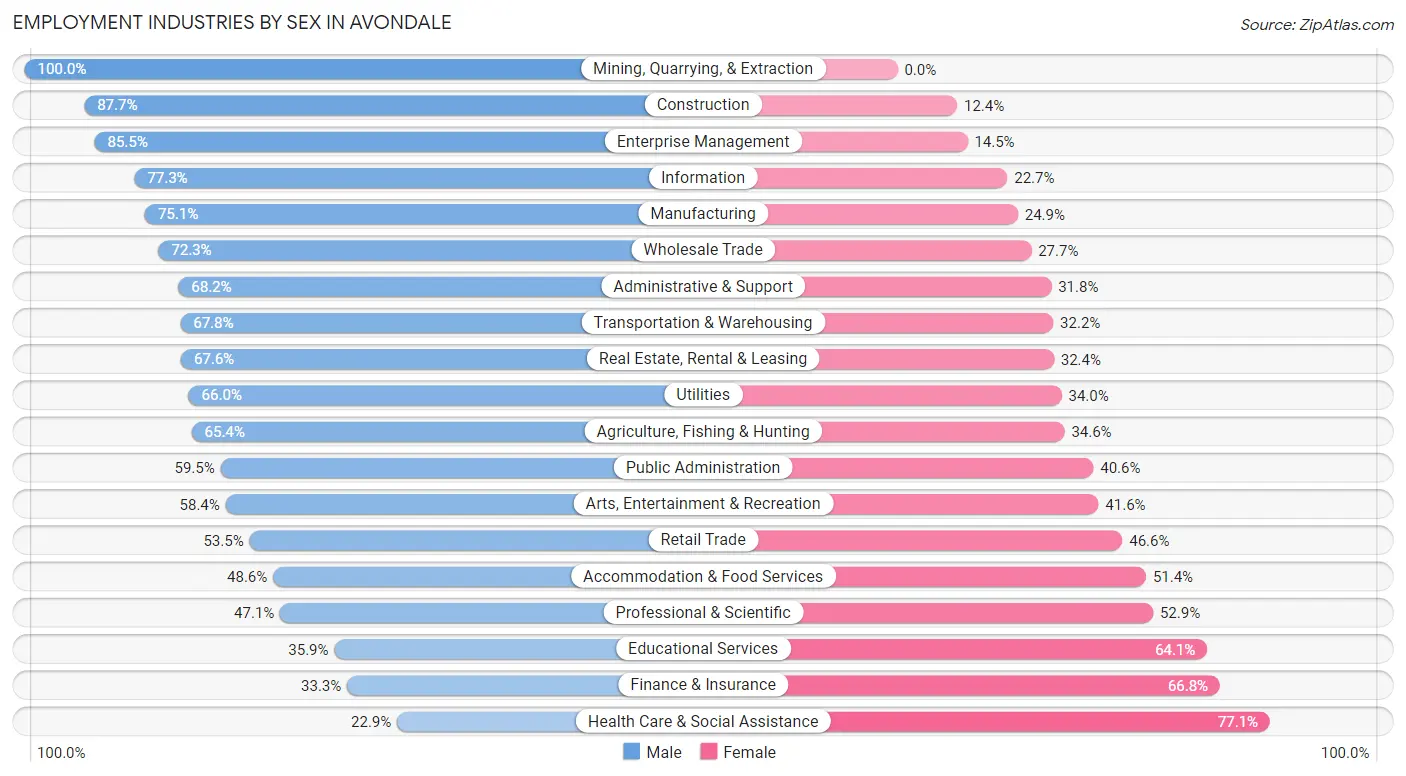
Employment Industries by Sex in Avondale
The Avondale industries that see more men than women are Mining, Quarrying, & Extraction (100.0%), Construction (87.6%), and Enterprise Management (85.5%), whereas the industries that tend to have a higher number of women are Health Care & Social Assistance (77.1%), Finance & Insurance (66.7%), and Educational Services (64.1%).
| Industry | Male | Female |
| Agriculture, Fishing & Hunting | 159 (65.4%) | 84 (34.6%) |
| Mining, Quarrying, & Extraction | 107 (100.0%) | 0 (0.0%) |
| Construction | 3,300 (87.6%) | 465 (12.3%) |
| Manufacturing | 2,212 (75.1%) | 734 (24.9%) |
| Wholesale Trade | 697 (72.3%) | 267 (27.7%) |
| Retail Trade | 3,345 (53.4%) | 2,913 (46.6%) |
| Transportation & Warehousing | 2,573 (67.8%) | 1,224 (32.2%) |
| Utilities | 414 (66.0%) | 213 (34.0%) |
| Information | 513 (77.3%) | 151 (22.7%) |
| Finance & Insurance | 1,052 (33.3%) | 2,112 (66.7%) |
| Real Estate, Rental & Leasing | 633 (67.6%) | 303 (32.4%) |
| Professional & Scientific | 926 (47.1%) | 1,040 (52.9%) |
| Enterprise Management | 59 (85.5%) | 10 (14.5%) |
| Administrative & Support | 1,428 (68.2%) | 667 (31.8%) |
| Educational Services | 1,262 (35.9%) | 2,254 (64.1%) |
| Health Care & Social Assistance | 1,224 (22.9%) | 4,120 (77.1%) |
| Arts, Entertainment & Recreation | 393 (58.4%) | 280 (41.6%) |
| Accommodation & Food Services | 1,263 (48.6%) | 1,338 (51.4%) |
| Public Administration | 1,293 (59.5%) | 882 (40.6%) |
| Total | 23,759 (54.3%) | 20,008 (45.7%) |
Education in Avondale
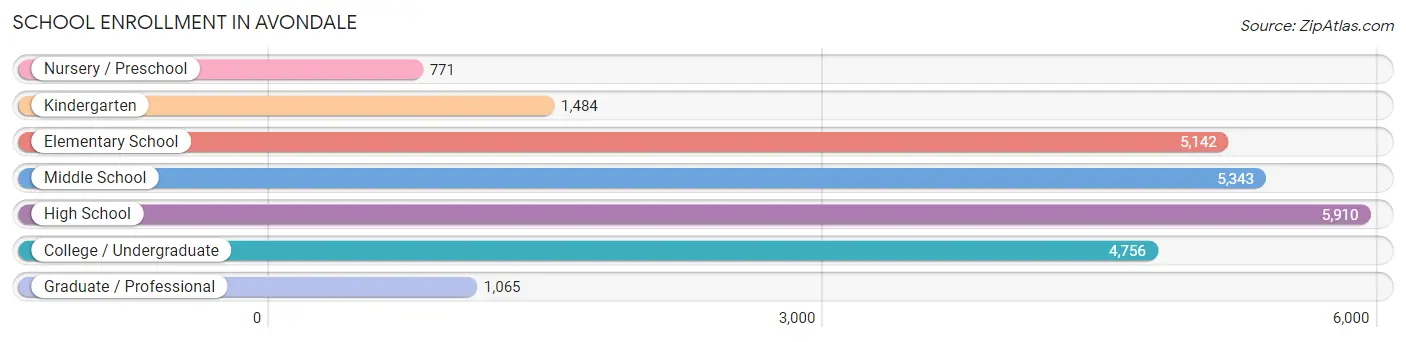
School Enrollment in Avondale
The most common levels of schooling among the 24,471 students in Avondale are high school (5,910 | 24.1%), middle school (5,343 | 21.8%), and elementary school (5,142 | 21.0%).
| School Level | # Students | % Students |
| Nursery / Preschool | 771 | 3.2% |
| Kindergarten | 1,484 | 6.1% |
| Elementary School | 5,142 | 21.0% |
| Middle School | 5,343 | 21.8% |
| High School | 5,910 | 24.1% |
| College / Undergraduate | 4,756 | 19.4% |
| Graduate / Professional | 1,065 | 4.3% |
| Total | 24,471 | 100.0% |
School Enrollment by Age by Funding Source in Avondale
Out of a total of 24,471 students who are enrolled in schools in Avondale, 3,304 (13.5%) attend a private institution, while the remaining 21,167 (86.5%) are enrolled in public schools. The age group of 35 years and over has the highest likelihood of being enrolled in private schools, with 423 (29.0% in the age bracket) enrolled. Conversely, the age group of 15 to 17 year olds has the lowest likelihood of being enrolled in a private school, with 3,983 (92.3% in the age bracket) attending a public institution.
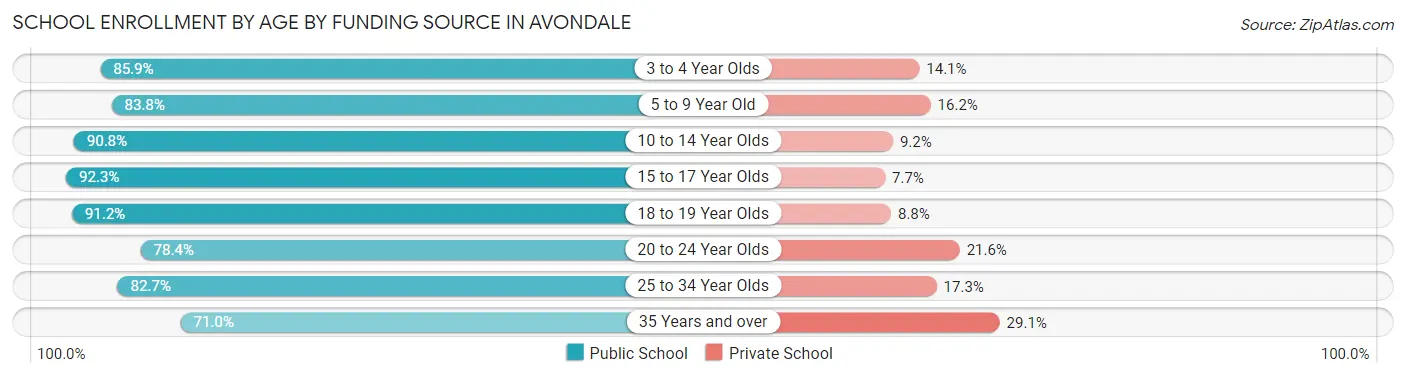
| Age Bracket | Public School | Private School |
| 3 to 4 Year Olds | 475 (85.9%) | 78 (14.1%) |
| 5 to 9 Year Old | 5,259 (83.8%) | 1,017 (16.2%) |
| 10 to 14 Year Olds | 5,888 (90.8%) | 595 (9.2%) |
| 15 to 17 Year Olds | 3,983 (92.3%) | 333 (7.7%) |
| 18 to 19 Year Olds | 1,778 (91.2%) | 172 (8.8%) |
| 20 to 24 Year Olds | 1,513 (78.4%) | 417 (21.6%) |
| 25 to 34 Year Olds | 1,246 (82.7%) | 261 (17.3%) |
| 35 Years and over | 1,033 (71.0%) | 423 (29.0%) |
| Total | 21,167 (86.5%) | 3,304 (13.5%) |
Educational Attainment by Field of Study in Avondale
Business (2,423 | 20.2%), education (1,748 | 14.6%), science & technology (1,572 | 13.1%), psychology (1,122 | 9.4%), and arts & humanities (922 | 7.7%) are the most common fields of study among 11,985 individuals in Avondale who have obtained a bachelor's degree or higher.
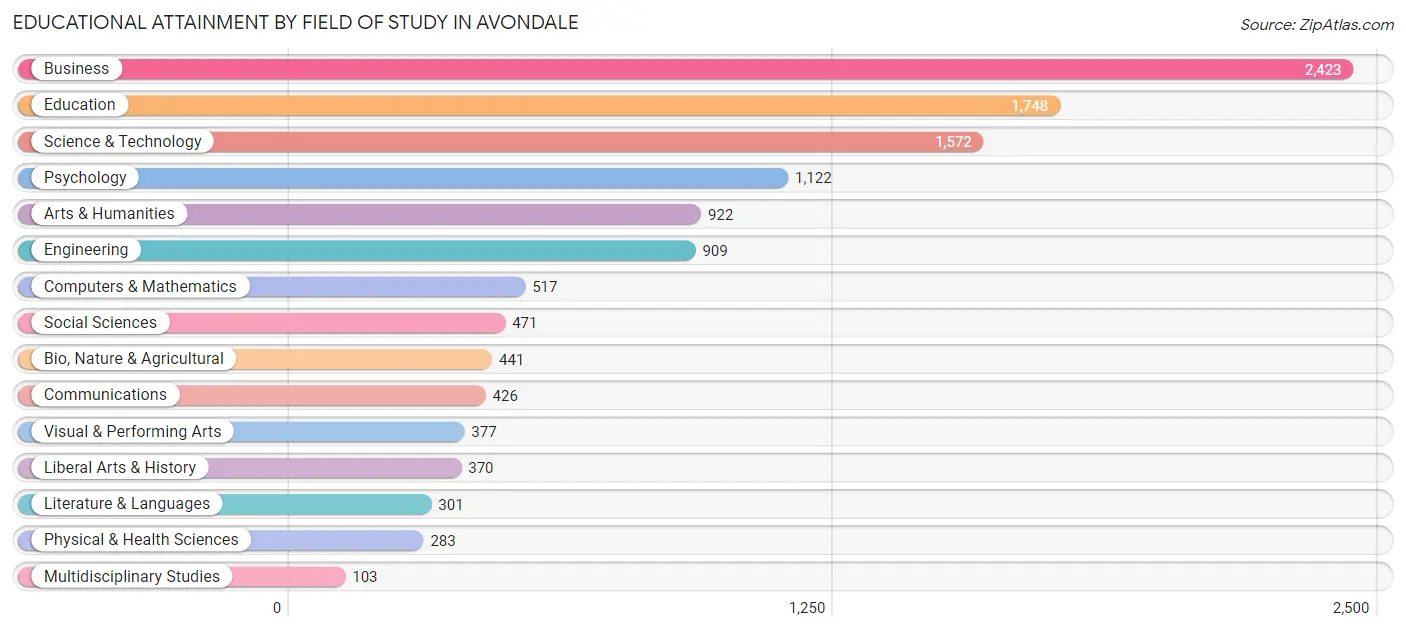
| Field of Study | # Graduates | % Graduates |
| Computers & Mathematics | 517 | 4.3% |
| Bio, Nature & Agricultural | 441 | 3.7% |
| Physical & Health Sciences | 283 | 2.4% |
| Psychology | 1,122 | 9.4% |
| Social Sciences | 471 | 3.9% |
| Engineering | 909 | 7.6% |
| Multidisciplinary Studies | 103 | 0.9% |
| Science & Technology | 1,572 | 13.1% |
| Business | 2,423 | 20.2% |
| Education | 1,748 | 14.6% |
| Literature & Languages | 301 | 2.5% |
| Liberal Arts & History | 370 | 3.1% |
| Visual & Performing Arts | 377 | 3.2% |
| Communications | 426 | 3.5% |
| Arts & Humanities | 922 | 7.7% |
| Total | 11,985 | 100.0% |
Transportation & Commute in Avondale
Vehicle Availability by Sex in Avondale
The most prevalent vehicle ownership categories in Avondale are males with 2 vehicles (9,669, accounting for 40.4%) and females with 2 vehicles (7,991, making up 49.3%).
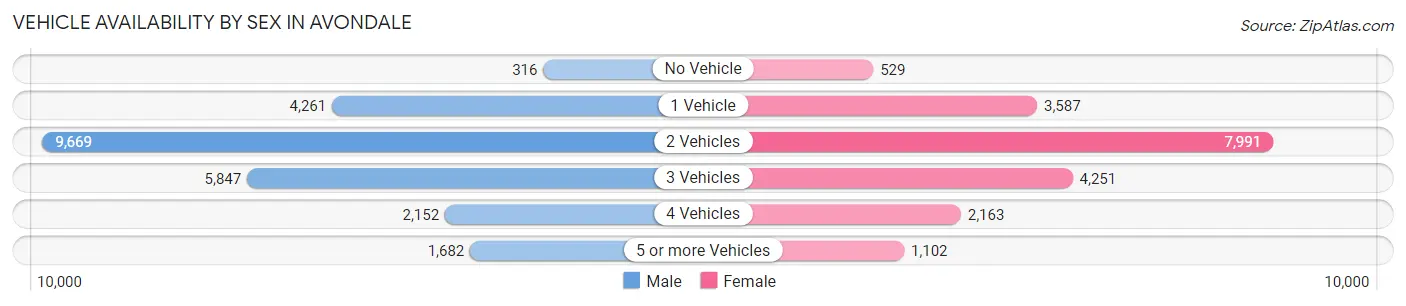
| Vehicles Available | Male | Female |
| No Vehicle | 316 (1.3%) | 529 (2.7%) |
| 1 Vehicle | 4,261 (17.8%) | 3,587 (18.3%) |
| 2 Vehicles | 9,669 (40.4%) | 7,991 (40.7%) |
| 3 Vehicles | 5,847 (24.4%) | 4,251 (21.7%) |
| 4 Vehicles | 2,152 (9.0%) | 2,163 (11.0%) |
| 5 or more Vehicles | 1,682 (7.0%) | 1,102 (5.6%) |
| Total | 23,927 (100.0%) | 19,623 (100.0%) |
Commute Time in Avondale
The most frequently occuring commute durations in Avondale are 30 to 34 minutes (6,642 commuters, 17.2%), 15 to 19 minutes (5,439 commuters, 14.1%), and 20 to 24 minutes (5,274 commuters, 13.6%).
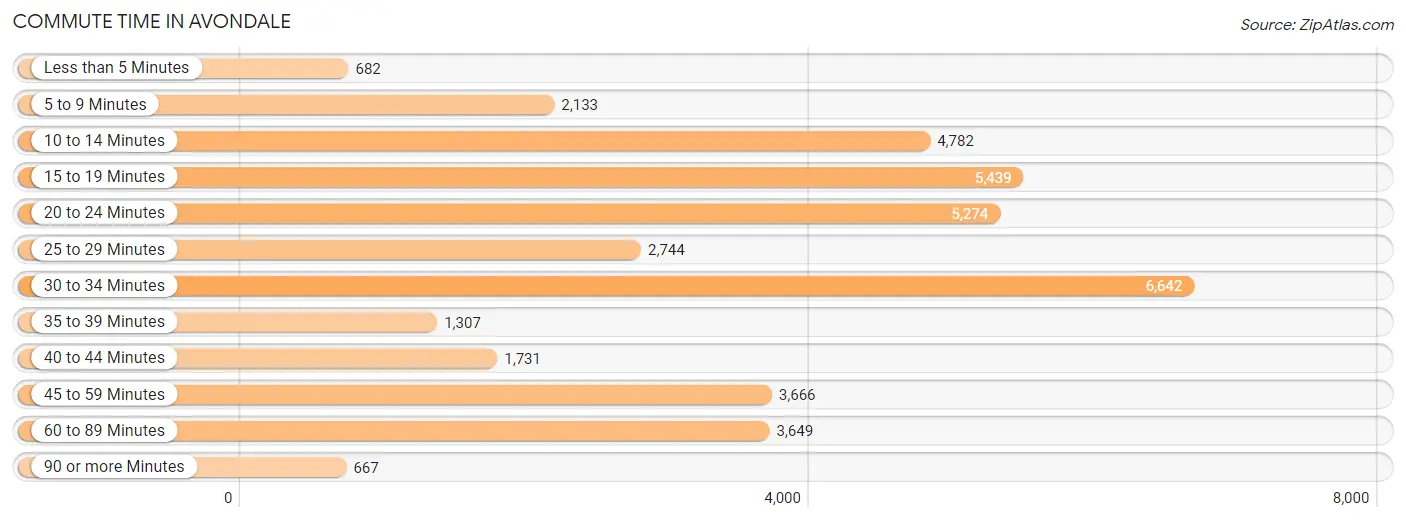
| Commute Time | # Commuters | % Commuters |
| Less than 5 Minutes | 682 | 1.8% |
| 5 to 9 Minutes | 2,133 | 5.5% |
| 10 to 14 Minutes | 4,782 | 12.3% |
| 15 to 19 Minutes | 5,439 | 14.1% |
| 20 to 24 Minutes | 5,274 | 13.6% |
| 25 to 29 Minutes | 2,744 | 7.1% |
| 30 to 34 Minutes | 6,642 | 17.2% |
| 35 to 39 Minutes | 1,307 | 3.4% |
| 40 to 44 Minutes | 1,731 | 4.5% |
| 45 to 59 Minutes | 3,666 | 9.5% |
| 60 to 89 Minutes | 3,649 | 9.4% |
| 90 or more Minutes | 667 | 1.7% |
Commute Time by Sex in Avondale
The most common commute times in Avondale are 30 to 34 minutes (4,576 commuters, 21.2%) for males and 15 to 19 minutes (2,520 commuters, 14.7%) for females.
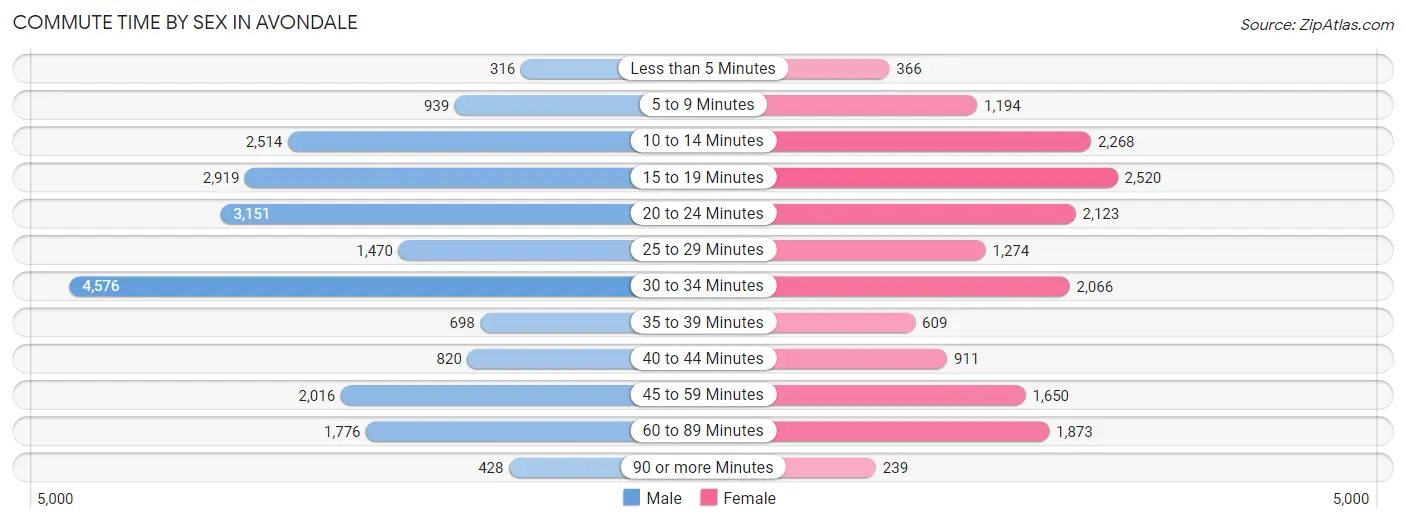
| Commute Time | Male | Female |
| Less than 5 Minutes | 316 (1.5%) | 366 (2.1%) |
| 5 to 9 Minutes | 939 (4.3%) | 1,194 (7.0%) |
| 10 to 14 Minutes | 2,514 (11.6%) | 2,268 (13.3%) |
| 15 to 19 Minutes | 2,919 (13.5%) | 2,520 (14.7%) |
| 20 to 24 Minutes | 3,151 (14.6%) | 2,123 (12.4%) |
| 25 to 29 Minutes | 1,470 (6.8%) | 1,274 (7.4%) |
| 30 to 34 Minutes | 4,576 (21.2%) | 2,066 (12.1%) |
| 35 to 39 Minutes | 698 (3.2%) | 609 (3.6%) |
| 40 to 44 Minutes | 820 (3.8%) | 911 (5.3%) |
| 45 to 59 Minutes | 2,016 (9.3%) | 1,650 (9.7%) |
| 60 to 89 Minutes | 1,776 (8.2%) | 1,873 (11.0%) |
| 90 or more Minutes | 428 (2.0%) | 239 (1.4%) |
Time of Departure to Work by Sex in Avondale
The most frequent times of departure to work in Avondale are 12:00 AM to 4:59 AM (3,025, 14.0%) for males and 7:00 AM to 7:29 AM (2,591, 15.2%) for females.
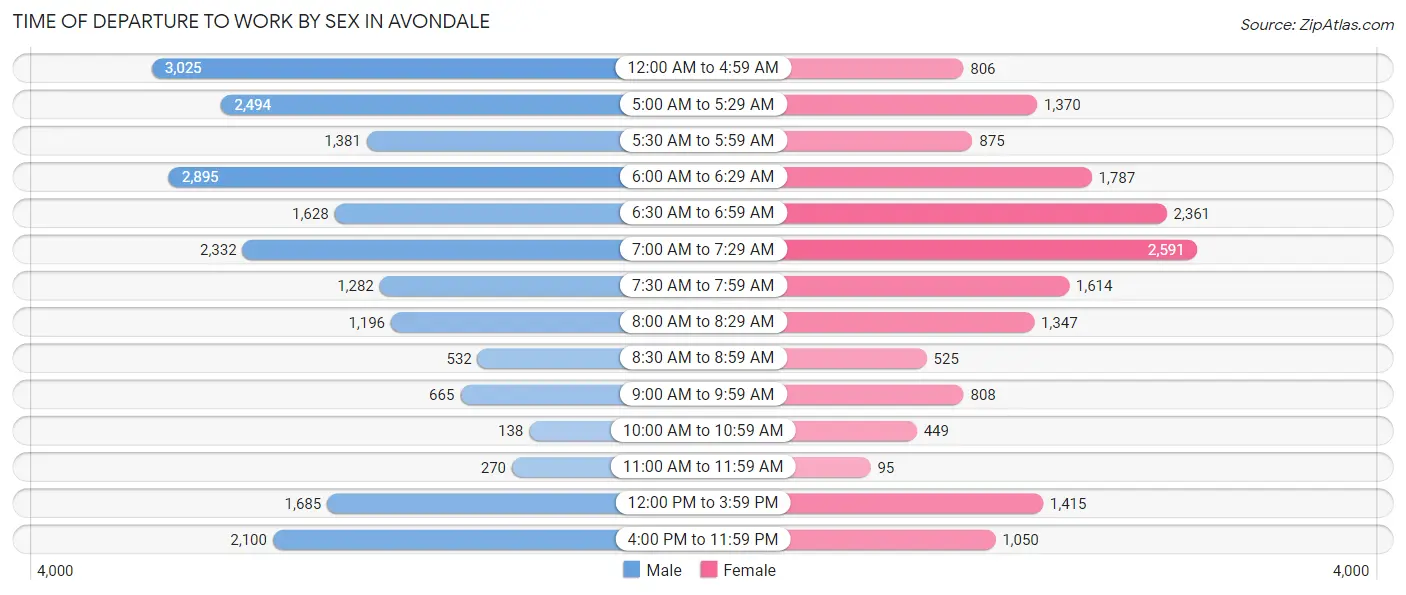
| Time of Departure | Male | Female |
| 12:00 AM to 4:59 AM | 3,025 (14.0%) | 806 (4.7%) |
| 5:00 AM to 5:29 AM | 2,494 (11.5%) | 1,370 (8.0%) |
| 5:30 AM to 5:59 AM | 1,381 (6.4%) | 875 (5.1%) |
| 6:00 AM to 6:29 AM | 2,895 (13.4%) | 1,787 (10.4%) |
| 6:30 AM to 6:59 AM | 1,628 (7.5%) | 2,361 (13.8%) |
| 7:00 AM to 7:29 AM | 2,332 (10.8%) | 2,591 (15.2%) |
| 7:30 AM to 7:59 AM | 1,282 (5.9%) | 1,614 (9.4%) |
| 8:00 AM to 8:29 AM | 1,196 (5.5%) | 1,347 (7.9%) |
| 8:30 AM to 8:59 AM | 532 (2.5%) | 525 (3.1%) |
| 9:00 AM to 9:59 AM | 665 (3.1%) | 808 (4.7%) |
| 10:00 AM to 10:59 AM | 138 (0.6%) | 449 (2.6%) |
| 11:00 AM to 11:59 AM | 270 (1.3%) | 95 (0.6%) |
| 12:00 PM to 3:59 PM | 1,685 (7.8%) | 1,415 (8.3%) |
| 4:00 PM to 11:59 PM | 2,100 (9.7%) | 1,050 (6.1%) |
| Total | 21,623 (100.0%) | 17,093 (100.0%) |
Housing Occupancy in Avondale
Occupancy by Ownership in Avondale
Of the total 28,831 dwellings in Avondale, owner-occupied units account for 17,195 (59.6%), while renter-occupied units make up 11,636 (40.4%).
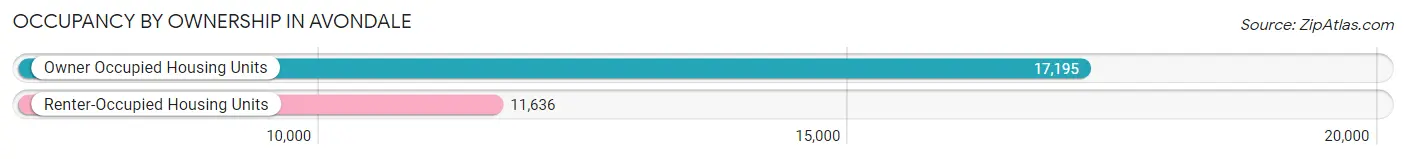
| Occupancy | # Housing Units | % Housing Units |
| Owner Occupied Housing Units | 17,195 | 59.6% |
| Renter-Occupied Housing Units | 11,636 | 40.4% |
| Total Occupied Housing Units | 28,831 | 100.0% |
Occupancy by Household Size in Avondale
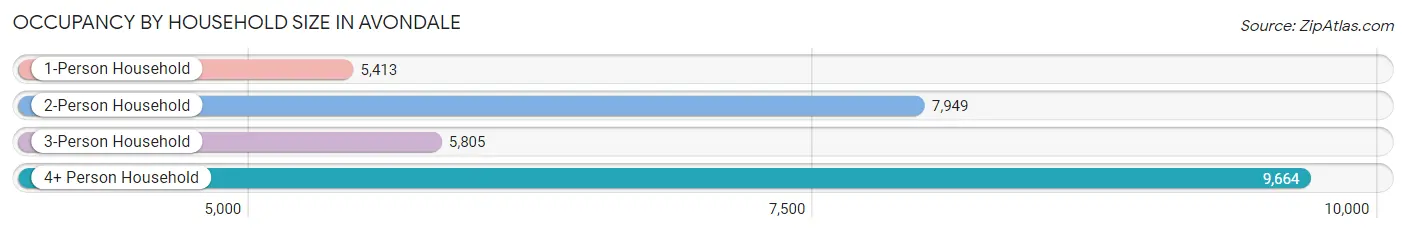
| Household Size | # Housing Units | % Housing Units |
| 1-Person Household | 5,413 | 18.8% |
| 2-Person Household | 7,949 | 27.6% |
| 3-Person Household | 5,805 | 20.1% |
| 4+ Person Household | 9,664 | 33.5% |
| Total Housing Units | 28,831 | 100.0% |
Occupancy by Ownership by Household Size in Avondale
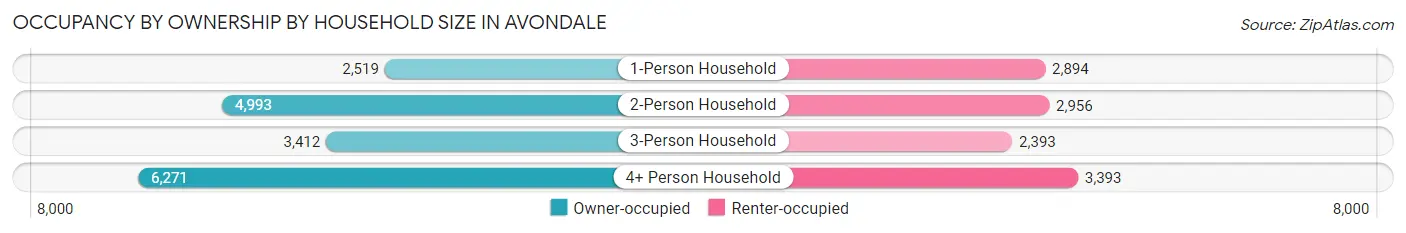
| Household Size | Owner-occupied | Renter-occupied |
| 1-Person Household | 2,519 (46.5%) | 2,894 (53.5%) |
| 2-Person Household | 4,993 (62.8%) | 2,956 (37.2%) |
| 3-Person Household | 3,412 (58.8%) | 2,393 (41.2%) |
| 4+ Person Household | 6,271 (64.9%) | 3,393 (35.1%) |
| Total Housing Units | 17,195 (59.6%) | 11,636 (40.4%) |
Occupancy by Educational Attainment in Avondale
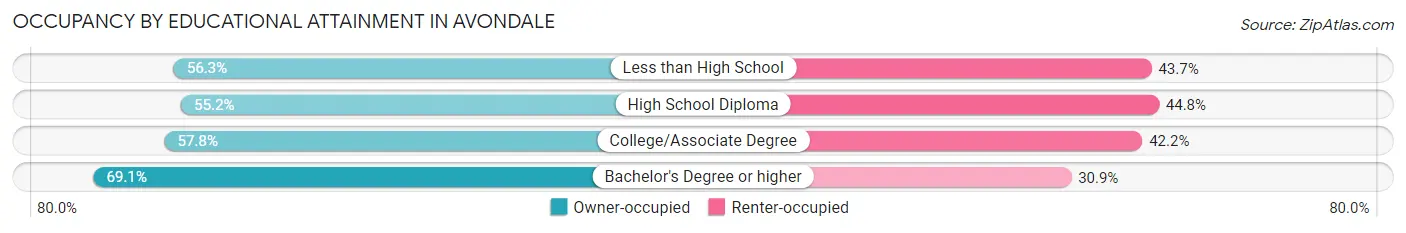
| Household Size | Owner-occupied | Renter-occupied |
| Less than High School | 1,895 (56.3%) | 1,469 (43.7%) |
| High School Diploma | 3,721 (55.2%) | 3,025 (44.8%) |
| College/Associate Degree | 6,928 (57.8%) | 5,059 (42.2%) |
| Bachelor's Degree or higher | 4,651 (69.1%) | 2,083 (30.9%) |
Occupancy by Age of Householder in Avondale
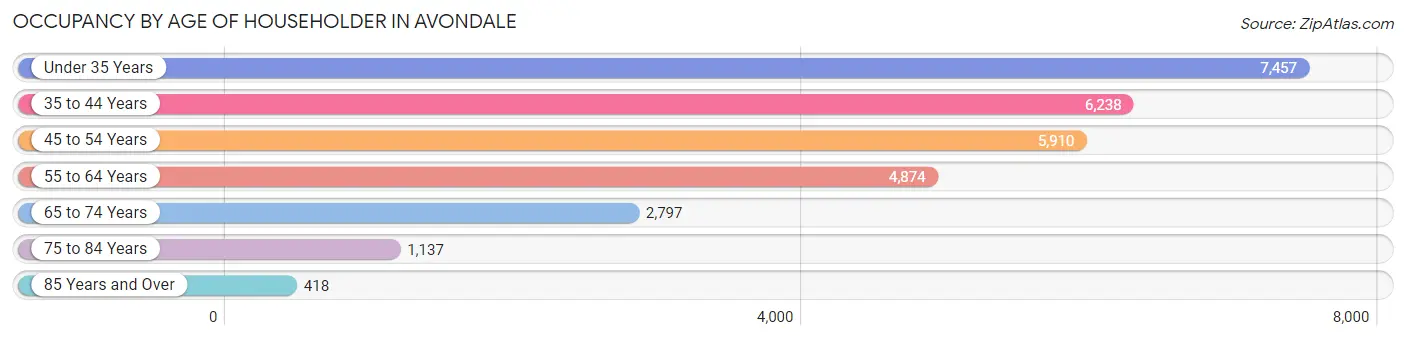
| Age Bracket | # Households | % Households |
| Under 35 Years | 7,457 | 25.9% |
| 35 to 44 Years | 6,238 | 21.6% |
| 45 to 54 Years | 5,910 | 20.5% |
| 55 to 64 Years | 4,874 | 16.9% |
| 65 to 74 Years | 2,797 | 9.7% |
| 75 to 84 Years | 1,137 | 3.9% |
| 85 Years and Over | 418 | 1.5% |
| Total | 28,831 | 100.0% |
Housing Finances in Avondale
Median Income by Occupancy in Avondale
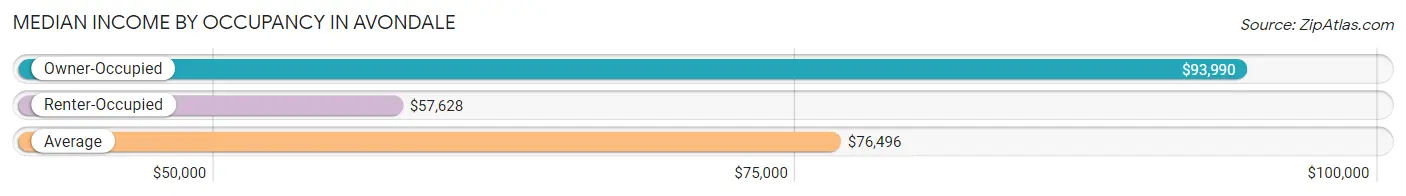
| Occupancy Type | # Households | Median Income |
| Owner-Occupied | 17,195 (59.6%) | $93,990 |
| Renter-Occupied | 11,636 (40.4%) | $57,628 |
| Average | 28,831 (100.0%) | $76,496 |
Occupancy by Householder Income Bracket in Avondale
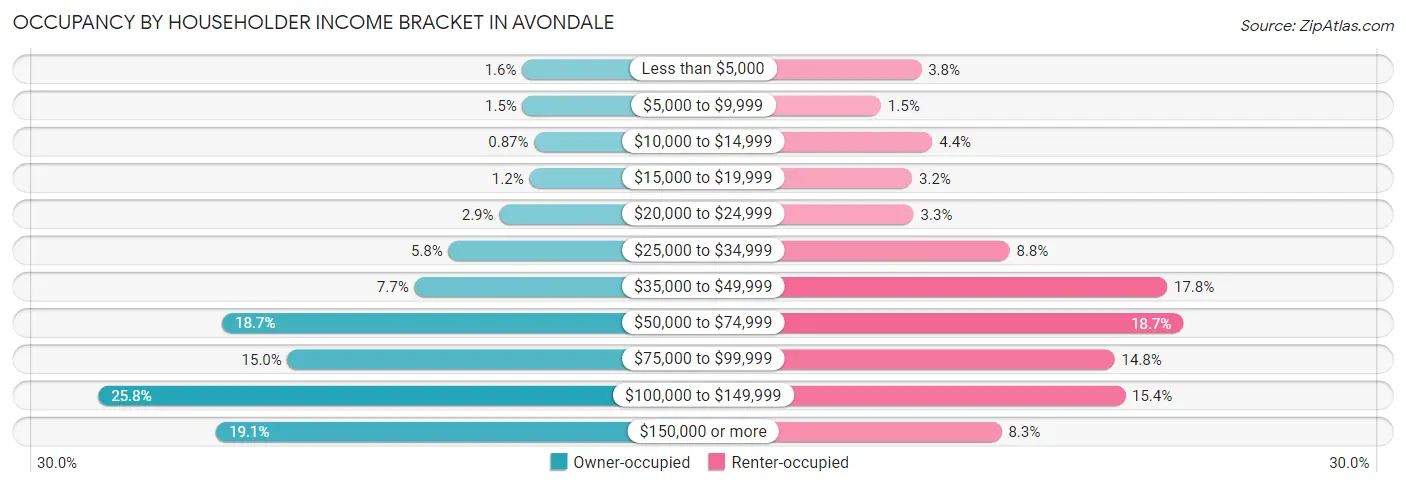
| Income Bracket | Owner-occupied | Renter-occupied |
| Less than $5,000 | 269 (1.6%) | 436 (3.7%) |
| $5,000 to $9,999 | 264 (1.5%) | 169 (1.5%) |
| $10,000 to $14,999 | 149 (0.9%) | 511 (4.4%) |
| $15,000 to $19,999 | 197 (1.1%) | 376 (3.2%) |
| $20,000 to $24,999 | 493 (2.9%) | 386 (3.3%) |
| $25,000 to $34,999 | 993 (5.8%) | 1,024 (8.8%) |
| $35,000 to $49,999 | 1,327 (7.7%) | 2,071 (17.8%) |
| $50,000 to $74,999 | 3,217 (18.7%) | 2,178 (18.7%) |
| $75,000 to $99,999 | 2,574 (15.0%) | 1,722 (14.8%) |
| $100,000 to $149,999 | 4,434 (25.8%) | 1,792 (15.4%) |
| $150,000 or more | 3,278 (19.1%) | 971 (8.3%) |
| Total | 17,195 (100.0%) | 11,636 (100.0%) |
Monthly Housing Cost Tiers in Avondale
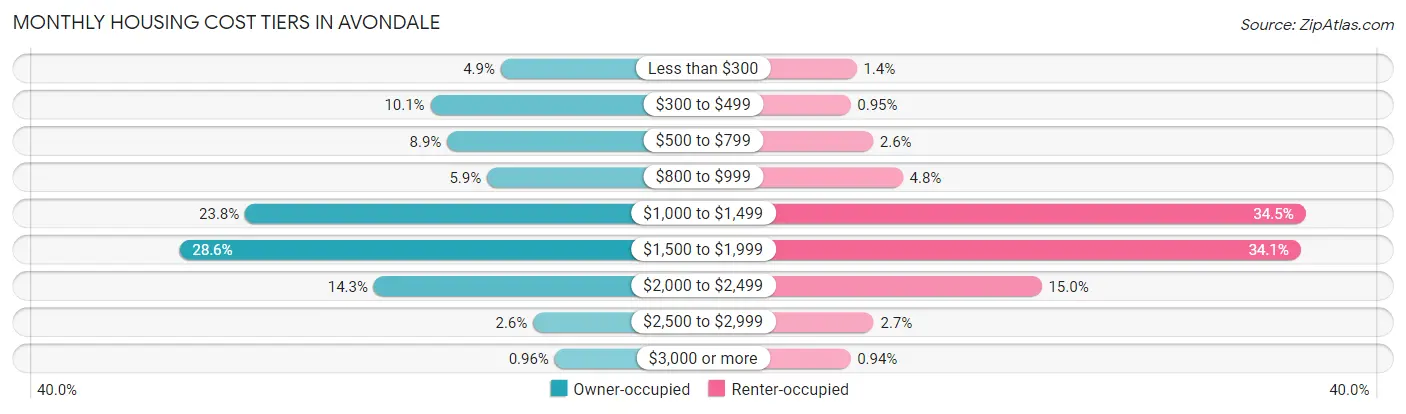
| Monthly Cost | Owner-occupied | Renter-occupied |
| Less than $300 | 847 (4.9%) | 163 (1.4%) |
| $300 to $499 | 1,738 (10.1%) | 111 (0.9%) |
| $500 to $799 | 1,527 (8.9%) | 304 (2.6%) |
| $800 to $999 | 1,021 (5.9%) | 559 (4.8%) |
| $1,000 to $1,499 | 4,086 (23.8%) | 4,011 (34.5%) |
| $1,500 to $1,999 | 4,917 (28.6%) | 3,970 (34.1%) |
| $2,000 to $2,499 | 2,455 (14.3%) | 1,749 (15.0%) |
| $2,500 to $2,999 | 439 (2.5%) | 310 (2.7%) |
| $3,000 or more | 165 (1.0%) | 109 (0.9%) |
| Total | 17,195 (100.0%) | 11,636 (100.0%) |
Physical Housing Characteristics in Avondale
Housing Structures in Avondale
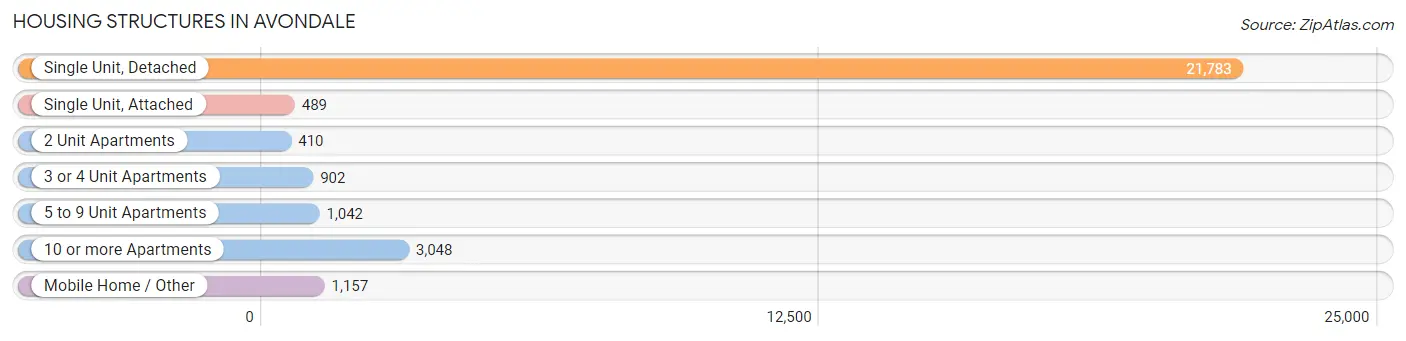
| Structure Type | # Housing Units | % Housing Units |
| Single Unit, Detached | 21,783 | 75.5% |
| Single Unit, Attached | 489 | 1.7% |
| 2 Unit Apartments | 410 | 1.4% |
| 3 or 4 Unit Apartments | 902 | 3.1% |
| 5 to 9 Unit Apartments | 1,042 | 3.6% |
| 10 or more Apartments | 3,048 | 10.6% |
| Mobile Home / Other | 1,157 | 4.0% |
| Total | 28,831 | 100.0% |
Housing Structures by Occupancy in Avondale
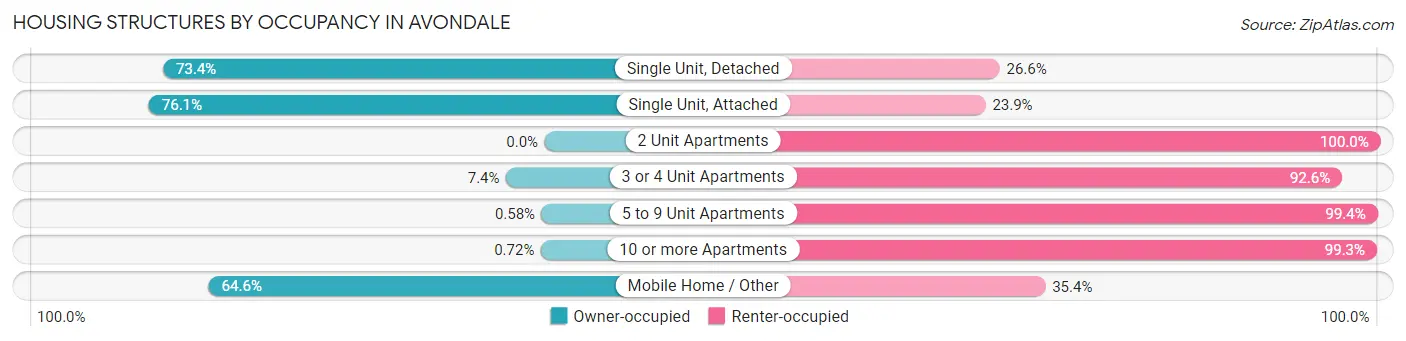
| Structure Type | Owner-occupied | Renter-occupied |
| Single Unit, Detached | 15,981 (73.4%) | 5,802 (26.6%) |
| Single Unit, Attached | 372 (76.1%) | 117 (23.9%) |
| 2 Unit Apartments | 0 (0.0%) | 410 (100.0%) |
| 3 or 4 Unit Apartments | 67 (7.4%) | 835 (92.6%) |
| 5 to 9 Unit Apartments | 6 (0.6%) | 1,036 (99.4%) |
| 10 or more Apartments | 22 (0.7%) | 3,026 (99.3%) |
| Mobile Home / Other | 747 (64.6%) | 410 (35.4%) |
| Total | 17,195 (59.6%) | 11,636 (40.4%) |
Housing Structures by Number of Rooms in Avondale
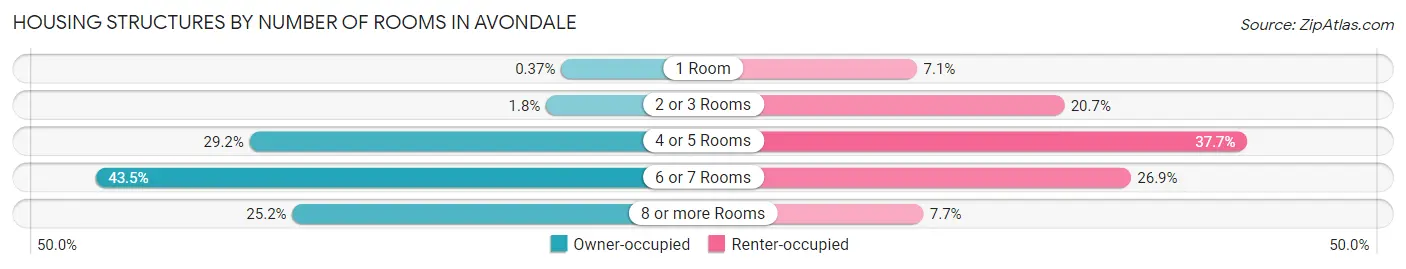
| Number of Rooms | Owner-occupied | Renter-occupied |
| 1 Room | 63 (0.4%) | 825 (7.1%) |
| 2 or 3 Rooms | 302 (1.8%) | 2,409 (20.7%) |
| 4 or 5 Rooms | 5,019 (29.2%) | 4,385 (37.7%) |
| 6 or 7 Rooms | 7,473 (43.5%) | 3,125 (26.9%) |
| 8 or more Rooms | 4,338 (25.2%) | 892 (7.7%) |
| Total | 17,195 (100.0%) | 11,636 (100.0%) |
Housing Structure by Heating Type in Avondale
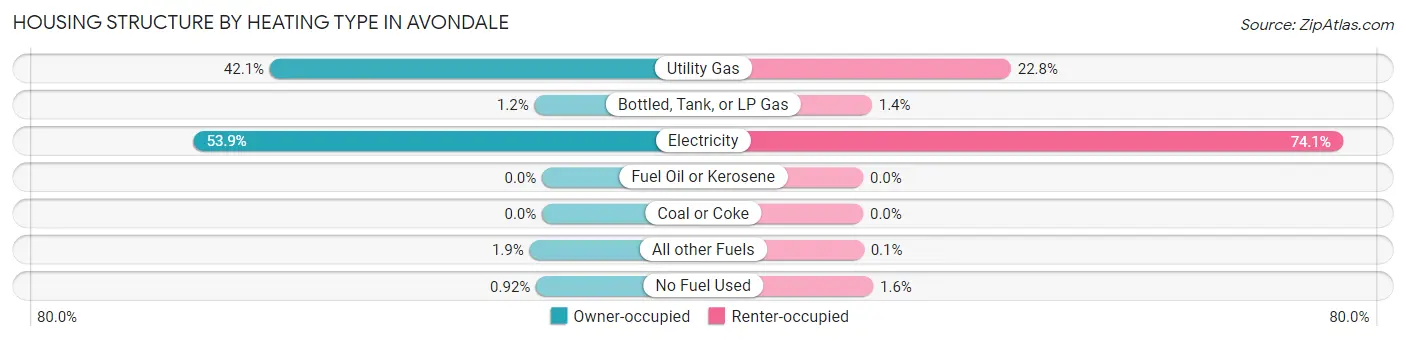
| Heating Type | Owner-occupied | Renter-occupied |
| Utility Gas | 7,236 (42.1%) | 2,658 (22.8%) |
| Bottled, Tank, or LP Gas | 201 (1.2%) | 157 (1.3%) |
| Electricity | 9,266 (53.9%) | 8,627 (74.1%) |
| Fuel Oil or Kerosene | 0 (0.0%) | 0 (0.0%) |
| Coal or Coke | 0 (0.0%) | 0 (0.0%) |
| All other Fuels | 333 (1.9%) | 12 (0.1%) |
| No Fuel Used | 159 (0.9%) | 182 (1.6%) |
| Total | 17,195 (100.0%) | 11,636 (100.0%) |
Household Vehicle Usage in Avondale
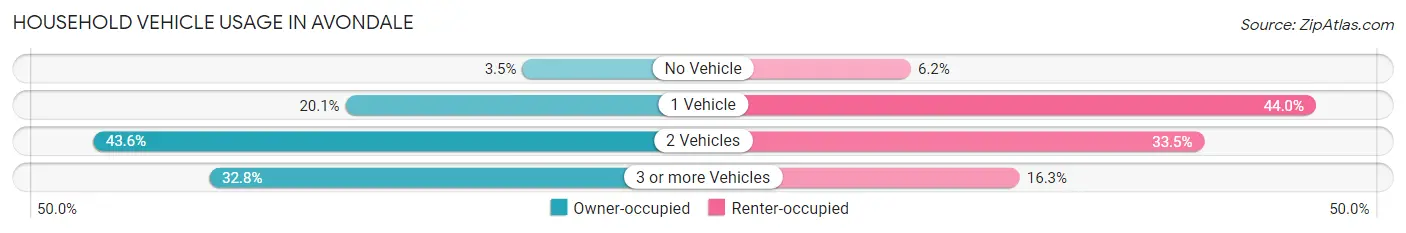
| Vehicles per Household | Owner-occupied | Renter-occupied |
| No Vehicle | 609 (3.5%) | 718 (6.2%) |
| 1 Vehicle | 3,448 (20.1%) | 5,115 (44.0%) |
| 2 Vehicles | 7,502 (43.6%) | 3,903 (33.5%) |
| 3 or more Vehicles | 5,636 (32.8%) | 1,900 (16.3%) |
| Total | 17,195 (100.0%) | 11,636 (100.0%) |
Real Estate & Mortgages in Avondale
Real Estate and Mortgage Overview in Avondale
| Characteristic | Without Mortgage | With Mortgage |
| Housing Units | 4,246 | 12,949 |
| Median Property Value | $283,300 | $311,700 |
| Median Household Income | $61,549 | $2,938 |
| Monthly Housing Costs | $451 | $165 |
| Real Estate Taxes | $1,506 | $565 |
Property Value by Mortgage Status in Avondale
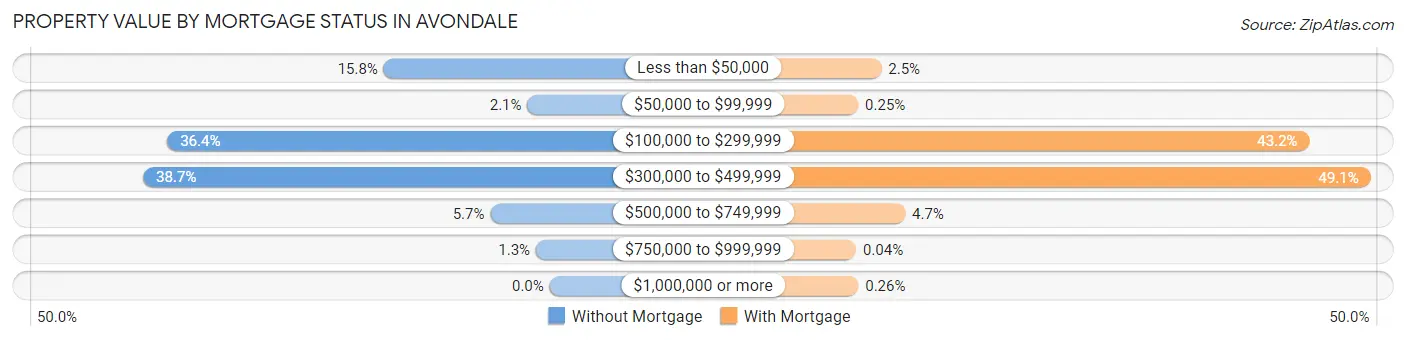
| Property Value | Without Mortgage | With Mortgage |
| Less than $50,000 | 671 (15.8%) | 319 (2.5%) |
| $50,000 to $99,999 | 90 (2.1%) | 32 (0.3%) |
| $100,000 to $299,999 | 1,546 (36.4%) | 5,597 (43.2%) |
| $300,000 to $499,999 | 1,644 (38.7%) | 6,351 (49.0%) |
| $500,000 to $749,999 | 240 (5.7%) | 611 (4.7%) |
| $750,000 to $999,999 | 55 (1.3%) | 5 (0.0%) |
| $1,000,000 or more | 0 (0.0%) | 34 (0.3%) |
| Total | 4,246 (100.0%) | 12,949 (100.0%) |
Household Income by Mortgage Status in Avondale
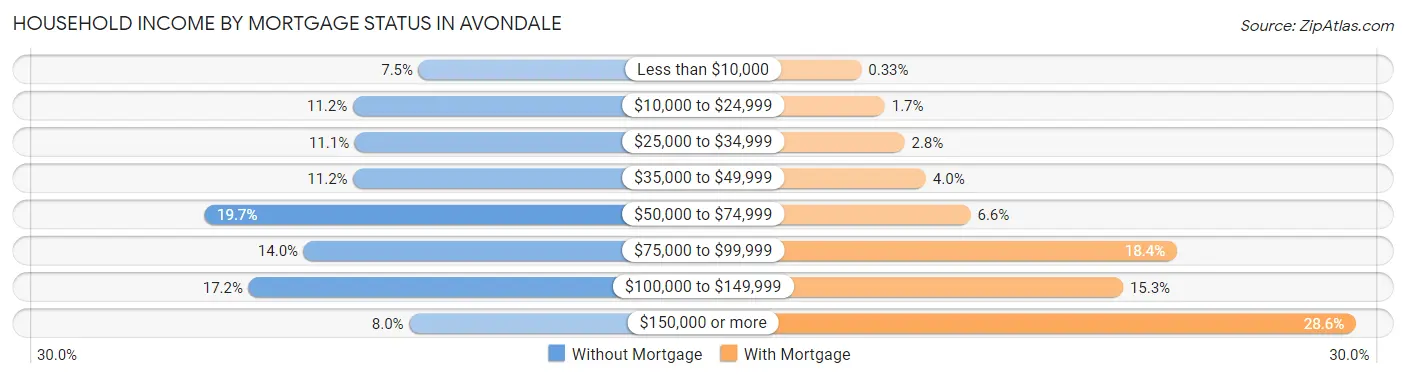
| Household Income | Without Mortgage | With Mortgage |
| Less than $10,000 | 317 (7.5%) | 43 (0.3%) |
| $10,000 to $24,999 | 477 (11.2%) | 216 (1.7%) |
| $25,000 to $34,999 | 472 (11.1%) | 362 (2.8%) |
| $35,000 to $49,999 | 476 (11.2%) | 521 (4.0%) |
| $50,000 to $74,999 | 838 (19.7%) | 851 (6.6%) |
| $75,000 to $99,999 | 596 (14.0%) | 2,379 (18.4%) |
| $100,000 to $149,999 | 730 (17.2%) | 1,978 (15.3%) |
| $150,000 or more | 340 (8.0%) | 3,704 (28.6%) |
| Total | 4,246 (100.0%) | 12,949 (100.0%) |
Property Value to Household Income Ratio in Avondale
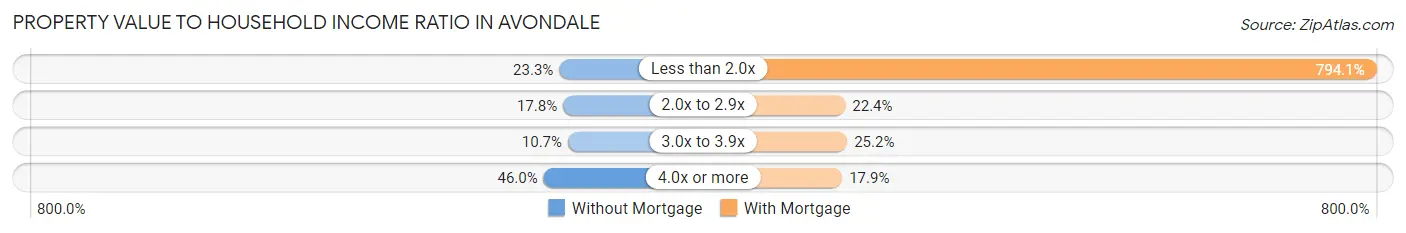
| Value-to-Income Ratio | Without Mortgage | With Mortgage |
| Less than 2.0x | 991 (23.3%) | 102,824 (794.1%) |
| 2.0x to 2.9x | 756 (17.8%) | 2,901 (22.4%) |
| 3.0x to 3.9x | 455 (10.7%) | 3,260 (25.2%) |
| 4.0x or more | 1,955 (46.0%) | 2,312 (17.8%) |
| Total | 4,246 (100.0%) | 12,949 (100.0%) |
Real Estate Taxes by Mortgage Status in Avondale
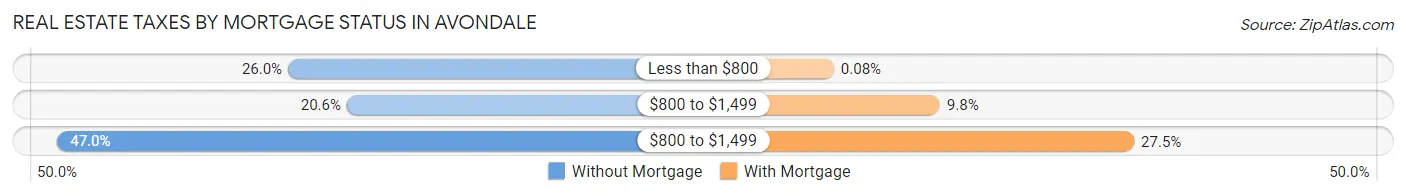
| Property Taxes | Without Mortgage | With Mortgage |
| Less than $800 | 1,102 (26.0%) | 10 (0.1%) |
| $800 to $1,499 | 874 (20.6%) | 1,264 (9.8%) |
| $800 to $1,499 | 1,996 (47.0%) | 3,561 (27.5%) |
| Total | 4,246 (100.0%) | 12,949 (100.0%) |
Health & Disability in Avondale
Health Insurance Coverage by Age in Avondale
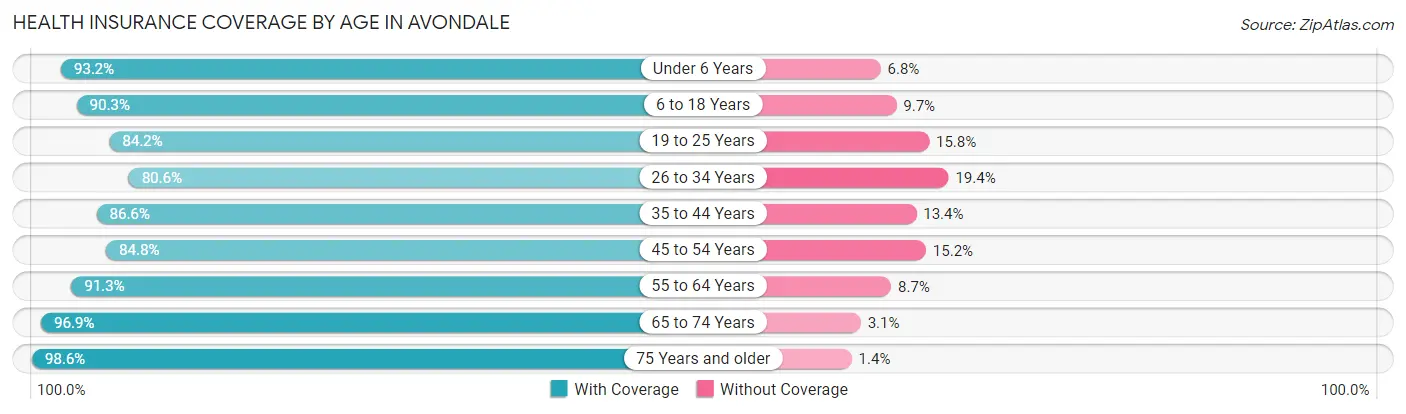
| Age Bracket | With Coverage | Without Coverage |
| Under 6 Years | 7,977 (93.2%) | 579 (6.8%) |
| 6 to 18 Years | 16,076 (90.3%) | 1,726 (9.7%) |
| 19 to 25 Years | 7,623 (84.2%) | 1,432 (15.8%) |
| 26 to 34 Years | 10,449 (80.6%) | 2,520 (19.4%) |
| 35 to 44 Years | 10,593 (86.6%) | 1,644 (13.4%) |
| 45 to 54 Years | 9,544 (84.8%) | 1,714 (15.2%) |
| 55 to 64 Years | 8,059 (91.3%) | 770 (8.7%) |
| 65 to 74 Years | 4,803 (96.9%) | 152 (3.1%) |
| 75 Years and older | 2,730 (98.6%) | 38 (1.4%) |
| Total | 77,854 (88.0%) | 10,575 (12.0%) |
Health Insurance Coverage by Citizenship Status in Avondale
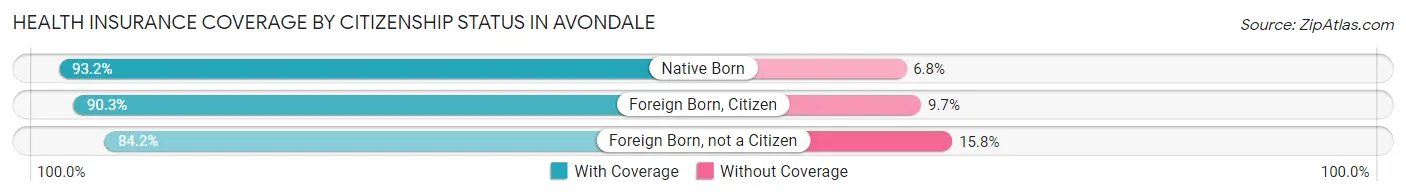
| Citizenship Status | With Coverage | Without Coverage |
| Native Born | 7,977 (93.2%) | 579 (6.8%) |
| Foreign Born, Citizen | 16,076 (90.3%) | 1,726 (9.7%) |
| Foreign Born, not a Citizen | 7,623 (84.2%) | 1,432 (15.8%) |
Health Insurance Coverage by Household Income in Avondale
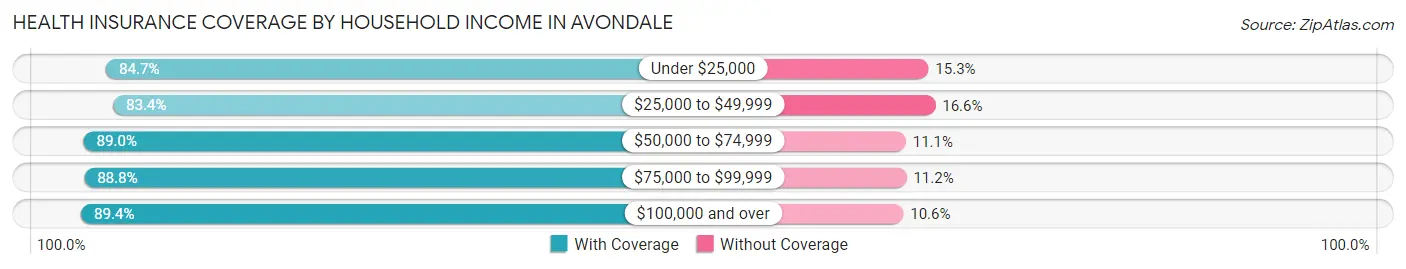
| Household Income | With Coverage | Without Coverage |
| Under $25,000 | 5,851 (84.7%) | 1,056 (15.3%) |
| $25,000 to $49,999 | 10,245 (83.4%) | 2,036 (16.6%) |
| $50,000 to $74,999 | 14,911 (88.9%) | 1,852 (11.1%) |
| $75,000 to $99,999 | 11,480 (88.8%) | 1,445 (11.2%) |
| $100,000 and over | 35,339 (89.4%) | 4,186 (10.6%) |
Public vs Private Health Insurance Coverage by Age in Avondale
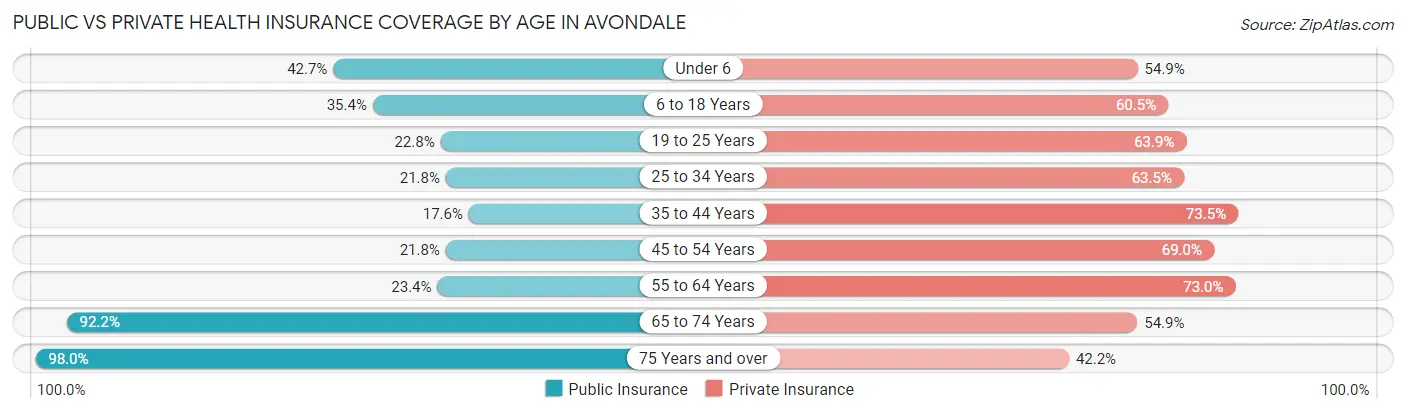
| Age Bracket | Public Insurance | Private Insurance |
| Under 6 | 3,655 (42.7%) | 4,698 (54.9%) |
| 6 to 18 Years | 6,299 (35.4%) | 10,778 (60.5%) |
| 19 to 25 Years | 2,065 (22.8%) | 5,789 (63.9%) |
| 25 to 34 Years | 2,830 (21.8%) | 8,230 (63.5%) |
| 35 to 44 Years | 2,147 (17.5%) | 8,998 (73.5%) |
| 45 to 54 Years | 2,459 (21.8%) | 7,773 (69.0%) |
| 55 to 64 Years | 2,065 (23.4%) | 6,449 (73.0%) |
| 65 to 74 Years | 4,569 (92.2%) | 2,718 (54.8%) |
| 75 Years and over | 2,713 (98.0%) | 1,167 (42.2%) |
| Total | 28,802 (32.6%) | 56,600 (64.0%) |
Disability Status by Sex by Age in Avondale
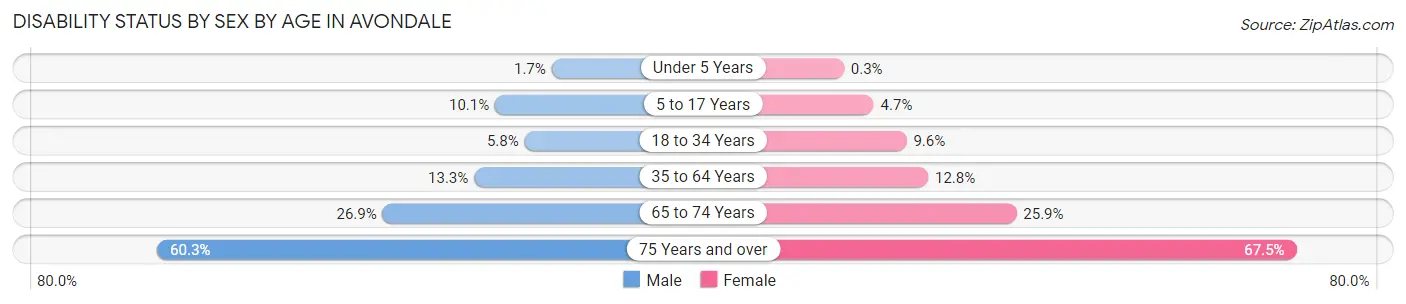
| Age Bracket | Male | Female |
| Under 5 Years | 54 (1.7%) | 11 (0.3%) |
| 5 to 17 Years | 910 (10.1%) | 425 (4.7%) |
| 18 to 34 Years | 678 (5.8%) | 1,135 (9.6%) |
| 35 to 64 Years | 2,139 (13.3%) | 2,074 (12.8%) |
| 65 to 74 Years | 624 (26.9%) | 682 (25.9%) |
| 75 Years and over | 699 (60.3%) | 1,086 (67.5%) |
Disability Class by Sex by Age in Avondale
Disability Class: Hearing Difficulty
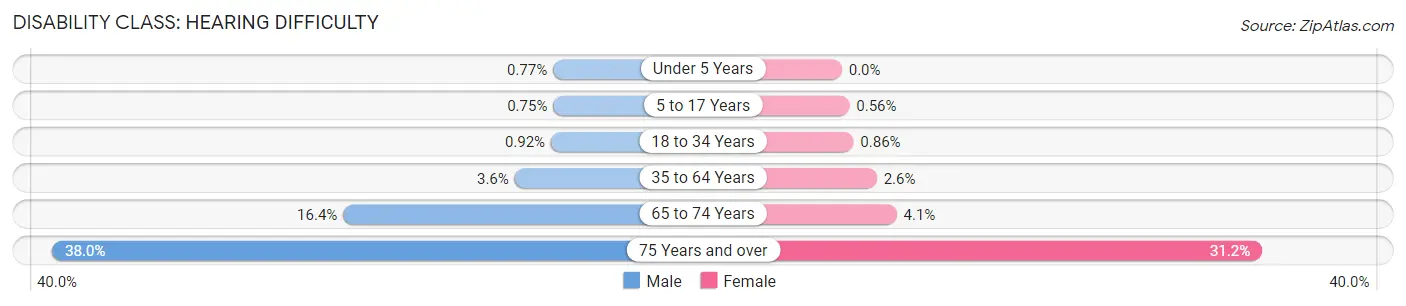
| Age Bracket | Male | Female |
| Under 5 Years | 24 (0.8%) | 0 (0.0%) |
| 5 to 17 Years | 67 (0.7%) | 50 (0.6%) |
| 18 to 34 Years | 108 (0.9%) | 102 (0.9%) |
| 35 to 64 Years | 584 (3.6%) | 420 (2.6%) |
| 65 to 74 Years | 380 (16.4%) | 107 (4.1%) |
| 75 Years and over | 440 (38.0%) | 502 (31.2%) |
Disability Class: Vision Difficulty
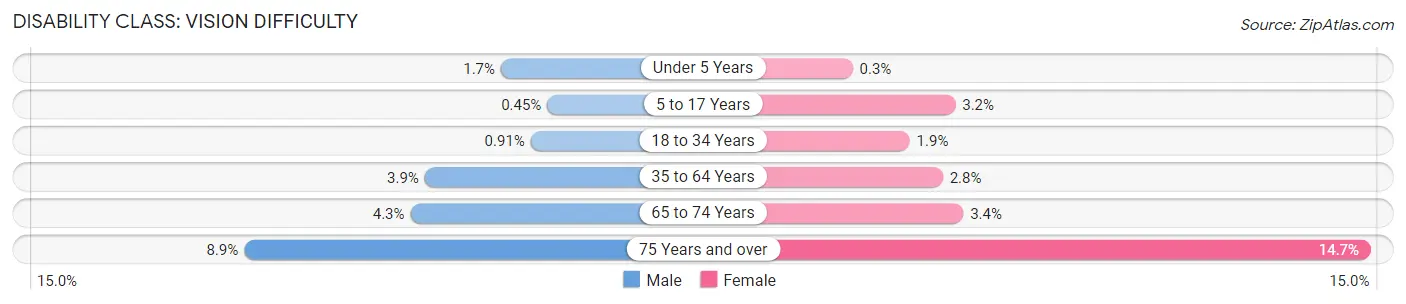
| Age Bracket | Male | Female |
| Under 5 Years | 54 (1.7%) | 11 (0.3%) |
| 5 to 17 Years | 40 (0.4%) | 284 (3.2%) |
| 18 to 34 Years | 107 (0.9%) | 224 (1.9%) |
| 35 to 64 Years | 623 (3.9%) | 454 (2.8%) |
| 65 to 74 Years | 99 (4.3%) | 89 (3.4%) |
| 75 Years and over | 103 (8.9%) | 237 (14.7%) |
Disability Class: Cognitive Difficulty
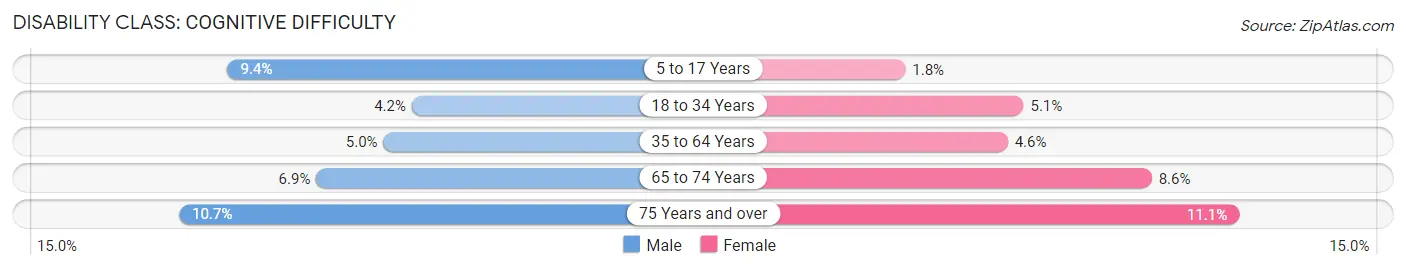
| Age Bracket | Male | Female |
| 5 to 17 Years | 839 (9.3%) | 159 (1.8%) |
| 18 to 34 Years | 497 (4.2%) | 598 (5.1%) |
| 35 to 64 Years | 808 (5.0%) | 747 (4.6%) |
| 65 to 74 Years | 160 (6.9%) | 227 (8.6%) |
| 75 Years and over | 124 (10.7%) | 178 (11.1%) |
Disability Class: Ambulatory Difficulty
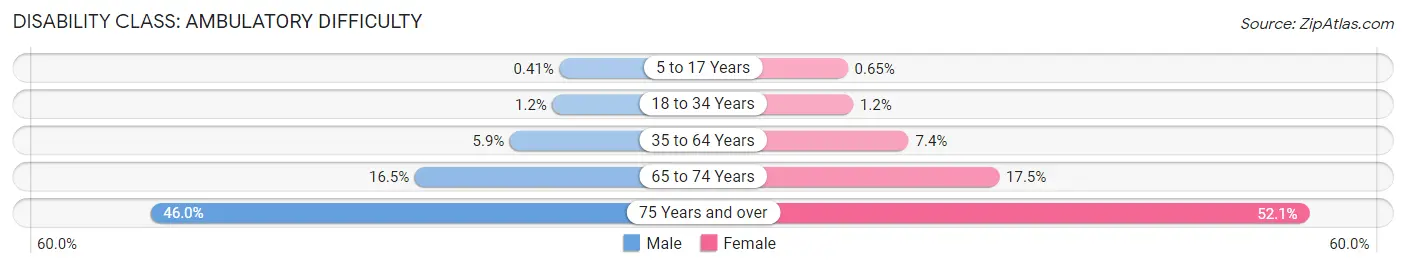
| Age Bracket | Male | Female |
| 5 to 17 Years | 37 (0.4%) | 58 (0.6%) |
| 18 to 34 Years | 140 (1.2%) | 147 (1.2%) |
| 35 to 64 Years | 956 (5.9%) | 1,204 (7.4%) |
| 65 to 74 Years | 384 (16.5%) | 461 (17.5%) |
| 75 Years and over | 533 (46.0%) | 838 (52.1%) |
Disability Class: Self-Care Difficulty
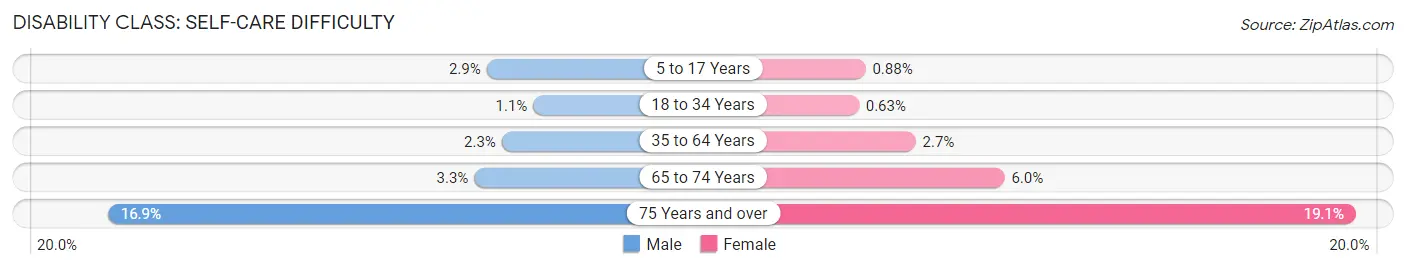
| Age Bracket | Male | Female |
| 5 to 17 Years | 256 (2.9%) | 79 (0.9%) |
| 18 to 34 Years | 132 (1.1%) | 74 (0.6%) |
| 35 to 64 Years | 369 (2.3%) | 444 (2.7%) |
| 65 to 74 Years | 77 (3.3%) | 159 (6.0%) |
| 75 Years and over | 196 (16.9%) | 307 (19.1%) |
Technology Access in Avondale
Computing Device Access in Avondale
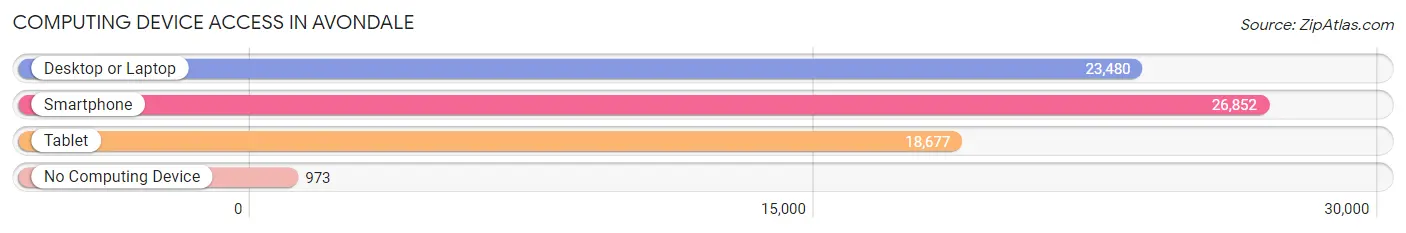
| Device Type | # Households | % Households |
| Desktop or Laptop | 23,480 | 81.4% |
| Smartphone | 26,852 | 93.1% |
| Tablet | 18,677 | 64.8% |
| No Computing Device | 973 | 3.4% |
| Total | 28,831 | 100.0% |
Internet Access in Avondale
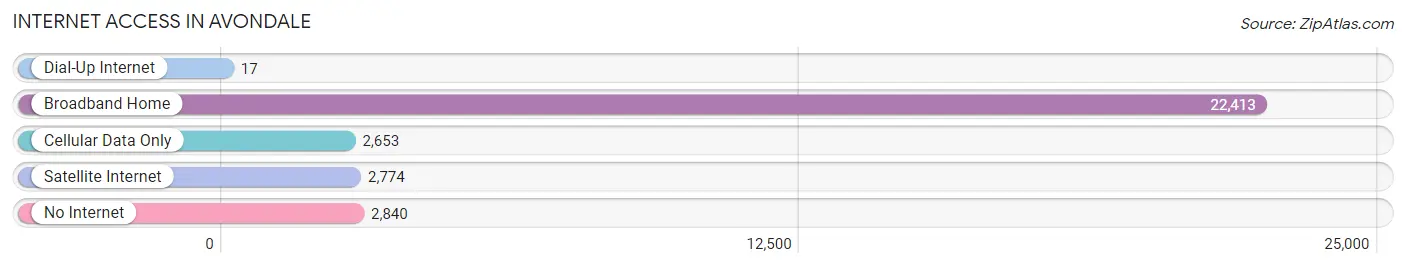
| Internet Type | # Households | % Households |
| Dial-Up Internet | 17 | 0.1% |
| Broadband Home | 22,413 | 77.7% |
| Cellular Data Only | 2,653 | 9.2% |
| Satellite Internet | 2,774 | 9.6% |
| No Internet | 2,840 | 9.9% |
| Total | 28,831 | 100.0% |
Avondale Summary
Avondale, Arizona is a city located in Maricopa County, Arizona, United States. It is located about 20 miles west of downtown Phoenix and is part of the Phoenix metropolitan area. As of the 2010 census, the population of Avondale was 76,238, making it the fourth largest city in Arizona.
Geography
Avondale is located in the southwestern corner of Maricopa County, Arizona, at 33°26′N 112°20′W. It is bordered by the cities of Goodyear to the west, Tolleson to the north, Phoenix to the east, and Litchfield Park to the south. The city covers an area of about 56 square miles, with an elevation of 1,074 feet.
The city is located in the Sonoran Desert, and is characterized by hot, dry summers and mild winters. The average annual temperature is about 75°F, with an average high of about 95°F in the summer and an average low of about 55°F in the winter. The average annual precipitation is about 8 inches.
Economy
Avondale’s economy is largely based on the service industry, with many residents employed in retail, hospitality, and healthcare. The city is also home to several large employers, including the Phoenix International Raceway, the University of Phoenix, and the Avondale Industrial Park.
Avondale is also home to several major shopping centers, including the Avondale Mall, the Avondale Marketplace, and the Avondale Towne Center. The city is also home to several large employers, including the Phoenix International Raceway, the University of Phoenix, and the Avondale Industrial Park.
Demographics
As of the 2010 census, the population of Avondale was 76,238, with a population density of 1,360 people per square mile. The racial makeup of the city was 63.3% White, 4.2% African American, 1.2% Native American, 2.2% Asian, 0.2% Pacific Islander, 25.2% from other races, and 3.7% from two or more races. Hispanic or Latino of any race were 44.3% of the population.
The median household income in Avondale was $45,945, and the median family income was $50,945. The per capita income for the city was $20,945. About 17.2% of families and 21.3% of the population were below the poverty line, including 28.3% of those under age 18 and 11.2% of those age 65 or over.
Avondale is served by the Avondale Elementary School District, the Avondale Union High School District, and the Agua Fria Union High School District. The city is also home to several higher education institutions, including the University of Phoenix, Arizona State University West, and the Southwestern College of Business.
Conclusion
Avondale, Arizona is a city located in Maricopa County, Arizona, United States. It is located about 20 miles west of downtown Phoenix and is part of the Phoenix metropolitan area. As of the 2010 census, the population of Avondale was 76,238, making it the fourth largest city in Arizona. The city is characterized by hot, dry summers and mild winters, and its economy is largely based on the service industry. The racial makeup of the city was 63.3% White, 4.2% African American, 1.2% Native American, 2.2% Asian, 0.2% Pacific Islander, 25.2% from other races, and 3.7% from two or more races. Hispanic or Latino of any race were 44.3% of the population. Avondale is served by several school districts and higher education institutions, and is home to several major shopping centers and employers.
Common Questions
What is Per Capita Income in Avondale?
Per Capita income in Avondale is $29,700.
What is the Median Family Income in Avondale?
Median Family Income in Avondale is $84,954.
What is the Median Household income in Avondale?
Median Household Income in Avondale is $76,496.
What is Income or Wage Gap in Avondale?
Income or Wage Gap in Avondale is 19.3%.
Women in Avondale earn 80.7 cents for every dollar earned by a man.
What is Family Income Deficit in Avondale?
Family Income Deficit in Avondale is $11,395.
Families that are below poverty line in Avondale earn $11,395 less on average than the poverty threshold level.
What is Inequality or Gini Index in Avondale?
Inequality or Gini Index in Avondale is 0.38.
What is the Total Population of Avondale?
Total Population of Avondale is 89,214.
What is the Total Male Population of Avondale?
Total Male Population of Avondale is 44,150.
What is the Total Female Population of Avondale?
Total Female Population of Avondale is 45,064.
What is the Ratio of Males per 100 Females in Avondale?
There are 97.97 Males per 100 Females in Avondale.
What is the Ratio of Females per 100 Males in Avondale?
There are 102.07 Females per 100 Males in Avondale.
What is the Median Population Age in Avondale?
Median Population Age in Avondale is 31.9 Years.
What is the Average Family Size in Avondale
Average Family Size in Avondale is 3.6 People.
What is the Average Household Size in Avondale
Average Household Size in Avondale is 3.1 People.
How Large is the Labor Force in Avondale?
There are 46,543 People in the Labor Forcein in Avondale.
What is the Percentage of People in the Labor Force in Avondale?
69.4% of People are in the Labor Force in Avondale.
What is the Unemployment Rate in Avondale?
Unemployment Rate in Avondale is 4.8%.