Crumpler, WV Map & Demographics
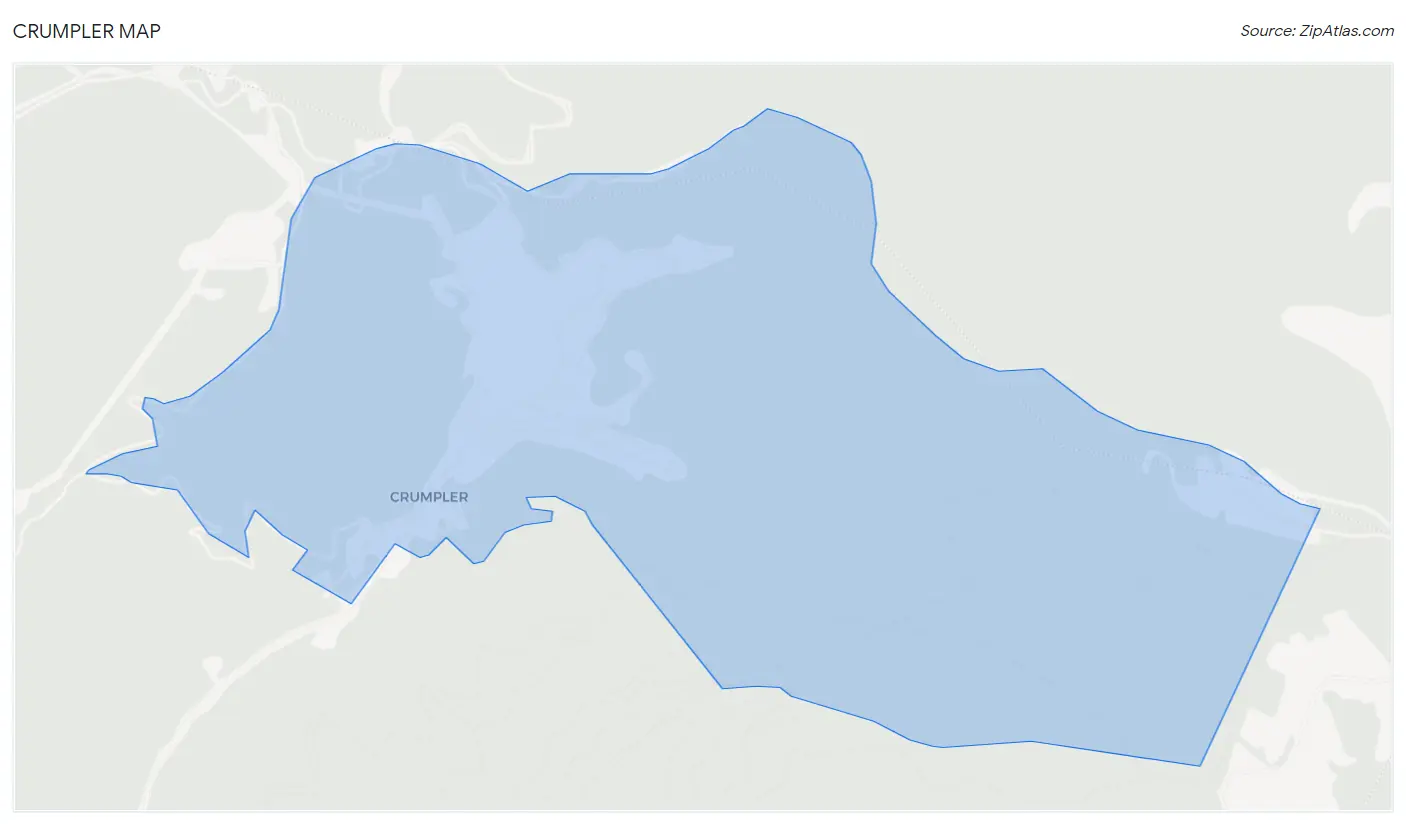
Crumpler Map
Crumpler Overview
$14,787
PER CAPITA INCOME
0.50
INEQUALITY / GINI INDEX
399
TOTAL POPULATION
265
MALE POPULATION
134
FEMALE POPULATION
197.76
MALES / 100 FEMALES
50.57
FEMALES / 100 MALES
68.4
MEDIAN AGE
3.2
AVG FAMILY SIZE
3.3
AVG HOUSEHOLD SIZE
8
LABOR FORCE [ PEOPLE ]
2.2%
PERCENT IN LABOR FORCE
Income in Crumpler
Income Overview in Crumpler
| Characteristic | Number | Measure |
| Per Capita Income | 399 | $14,787 |
| Median Family Income | 108 | $0 |
| Mean Family Income | 108 | $41,547 |
| Median Household Income | 121 | $0 |
| Mean Household Income | 121 | $40,669 |
| Income Deficit | 108 | $0 |
| Wage / Income Gap (%) | 399 | 0.00% |
| Wage / Income Gap ($) | 399 | 100.00¢ per $1 |
| Gini / Inequality Index | 399 | 0.50 |
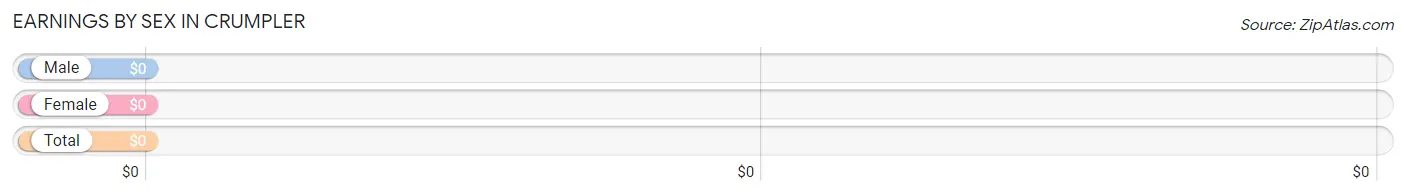
Earnings by Sex in Crumpler
| Sex | Number | Average Earnings |
| Male | 0 (0.0%) | $0 |
| Female | 8 (100.0%) | $0 |
| Total | 8 (100.0%) | $0 |
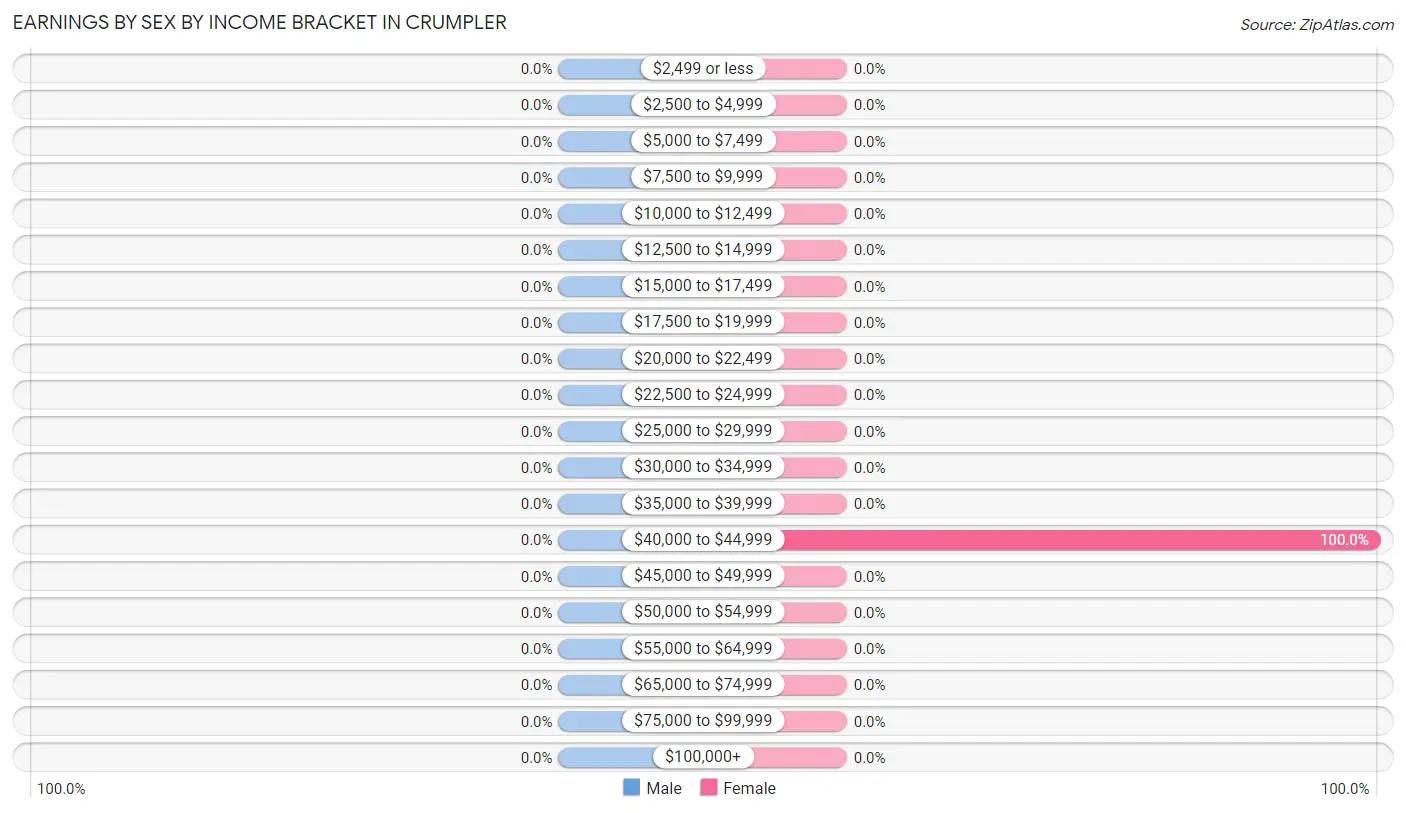
Earnings by Sex by Income Bracket in Crumpler
| Income | Male | Female |
| $2,499 or less | 0 (0.0%) | 0 (0.0%) |
| $2,500 to $4,999 | 0 (0.0%) | 0 (0.0%) |
| $5,000 to $7,499 | 0 (0.0%) | 0 (0.0%) |
| $7,500 to $9,999 | 0 (0.0%) | 0 (0.0%) |
| $10,000 to $12,499 | 0 (0.0%) | 0 (0.0%) |
| $12,500 to $14,999 | 0 (0.0%) | 0 (0.0%) |
| $15,000 to $17,499 | 0 (0.0%) | 0 (0.0%) |
| $17,500 to $19,999 | 0 (0.0%) | 0 (0.0%) |
| $20,000 to $22,499 | 0 (0.0%) | 0 (0.0%) |
| $22,500 to $24,999 | 0 (0.0%) | 0 (0.0%) |
| $25,000 to $29,999 | 0 (0.0%) | 0 (0.0%) |
| $30,000 to $34,999 | 0 (0.0%) | 0 (0.0%) |
| $35,000 to $39,999 | 0 (0.0%) | 0 (0.0%) |
| $40,000 to $44,999 | 0 (0.0%) | 8 (100.0%) |
| $45,000 to $49,999 | 0 (0.0%) | 0 (0.0%) |
| $50,000 to $54,999 | 0 (0.0%) | 0 (0.0%) |
| $55,000 to $64,999 | 0 (0.0%) | 0 (0.0%) |
| $65,000 to $74,999 | 0 (0.0%) | 0 (0.0%) |
| $75,000 to $99,999 | 0 (0.0%) | 0 (0.0%) |
| $100,000+ | 0 (0.0%) | 0 (0.0%) |
| Total | 0 (0.0%) | 8 (100.0%) |
Earnings by Sex by Educational Attainment in Crumpler
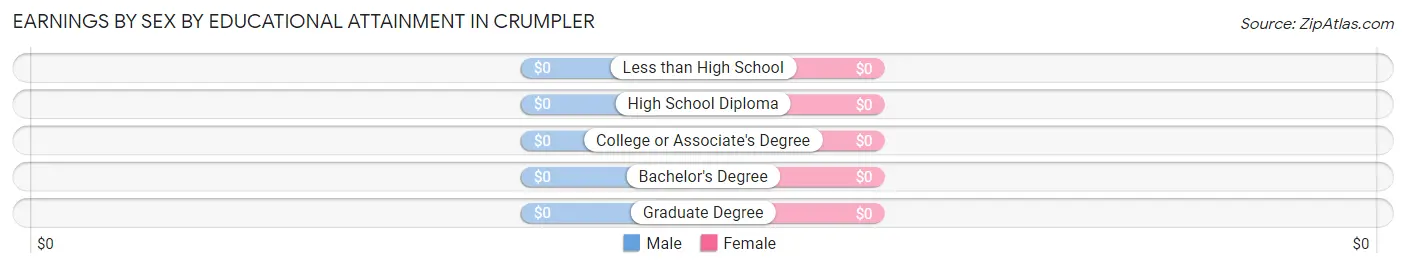
| Educational Attainment | Male Income | Female Income |
| Less than High School | - | - |
| High School Diploma | - | - |
| College or Associate's Degree | - | - |
| Bachelor's Degree | - | - |
| Graduate Degree | - | - |
| Total | - | - |
Family Income in Crumpler
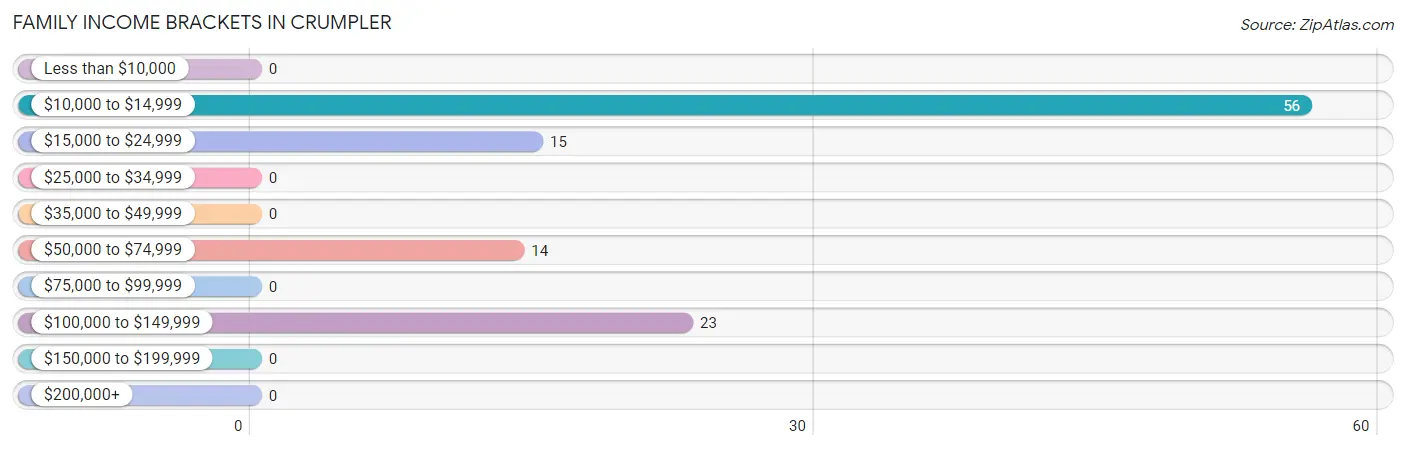
Family Income Brackets in Crumpler
According to the Crumpler family income data, there are 56 families falling into the $10,000 to $14,999 income range, which is the most common income bracket and makes up 51.8% of all families.
| Income Bracket | # Families | % Families |
| Less than $10,000 | 0 | 0.0% |
| $10,000 to $14,999 | 56 | 51.9% |
| $15,000 to $24,999 | 15 | 13.9% |
| $25,000 to $34,999 | 0 | 0.0% |
| $35,000 to $49,999 | 0 | 0.0% |
| $50,000 to $74,999 | 14 | 13.0% |
| $75,000 to $99,999 | 0 | 0.0% |
| $100,000 to $149,999 | 23 | 21.3% |
| $150,000 to $199,999 | 0 | 0.0% |
| $200,000+ | 0 | 0.0% |
Family Income by Famaliy Size in Crumpler
| Income Bracket | # Families | Median Income |
| 2-Person Families | 102 (94.4%) | $0 |
| 3-Person Families | 0 (0.0%) | $0 |
| 4-Person Families | 6 (5.6%) | $0 |
| 5-Person Families | 0 (0.0%) | $0 |
| 6-Person Families | 0 (0.0%) | $0 |
| 7+ Person Families | 0 (0.0%) | $0 |
| Total | 108 (100.0%) | $0 |
Family Income by Number of Earners in Crumpler
| Number of Earners | # Families | Median Income |
| No Earners | 102 (94.4%) | $0 |
| 1 Earner | 6 (5.6%) | $0 |
| 2 Earners | 0 (0.0%) | $0 |
| 3+ Earners | 0 (0.0%) | $0 |
| Total | 108 (100.0%) | $0 |
Household Income in Crumpler
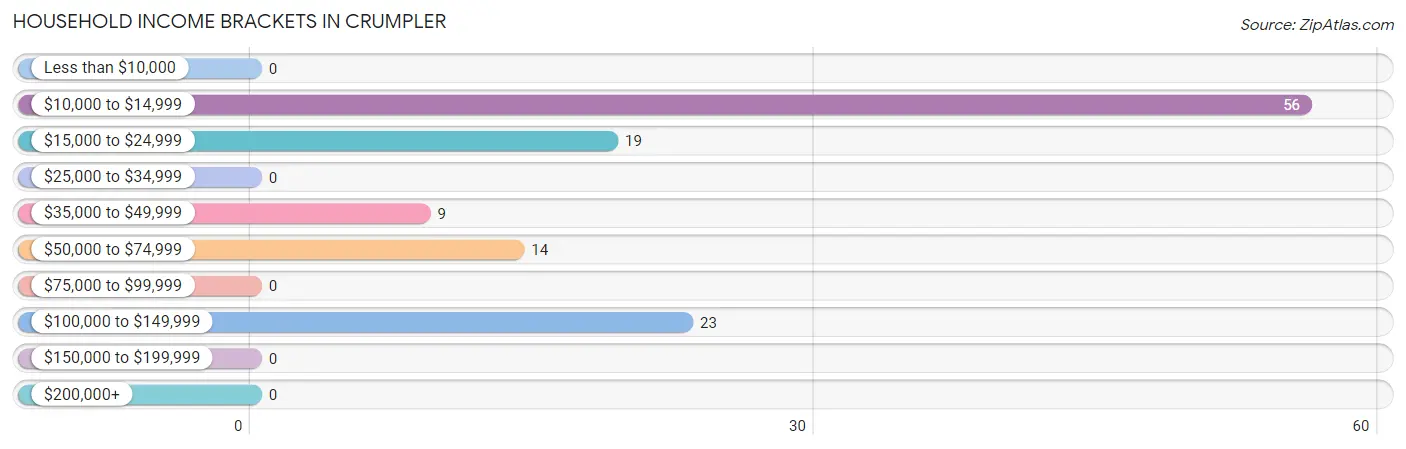
Household Income Brackets in Crumpler
With 56 households falling in the category, the $10,000 to $14,999 income range is the most frequent in Crumpler, accounting for 46.3% of all households.
| Income Bracket | # Households | % Households |
| Less than $10,000 | 0 | 0.0% |
| $10,000 to $14,999 | 56 | 46.3% |
| $15,000 to $24,999 | 19 | 15.7% |
| $25,000 to $34,999 | 0 | 0.0% |
| $35,000 to $49,999 | 9 | 7.4% |
| $50,000 to $74,999 | 14 | 11.6% |
| $75,000 to $99,999 | 0 | 0.0% |
| $100,000 to $149,999 | 23 | 19.0% |
| $150,000 to $199,999 | 0 | 0.0% |
| $200,000+ | 0 | 0.0% |
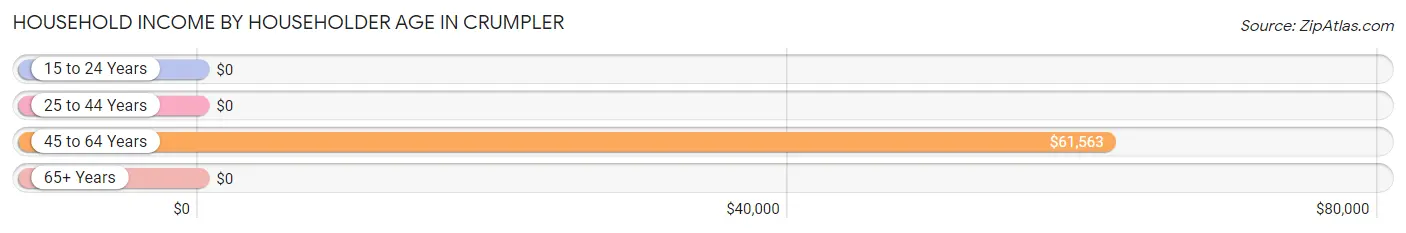
Household Income by Householder Age in Crumpler
The median household income in Crumpler is $0, with the highest median household income of $61,563 found in the 45 to 64 years age bracket for the primary householder. A total of 18 households (14.9%) fall into this category.
| Income Bracket | # Households | Median Income |
| 15 to 24 Years | 0 (0.0%) | $0 |
| 25 to 44 Years | 7 (5.8%) | $0 |
| 45 to 64 Years | 18 (14.9%) | $61,563 |
| 65+ Years | 96 (79.3%) | $0 |
| Total | 121 (100.0%) | $0 |
Poverty in Crumpler
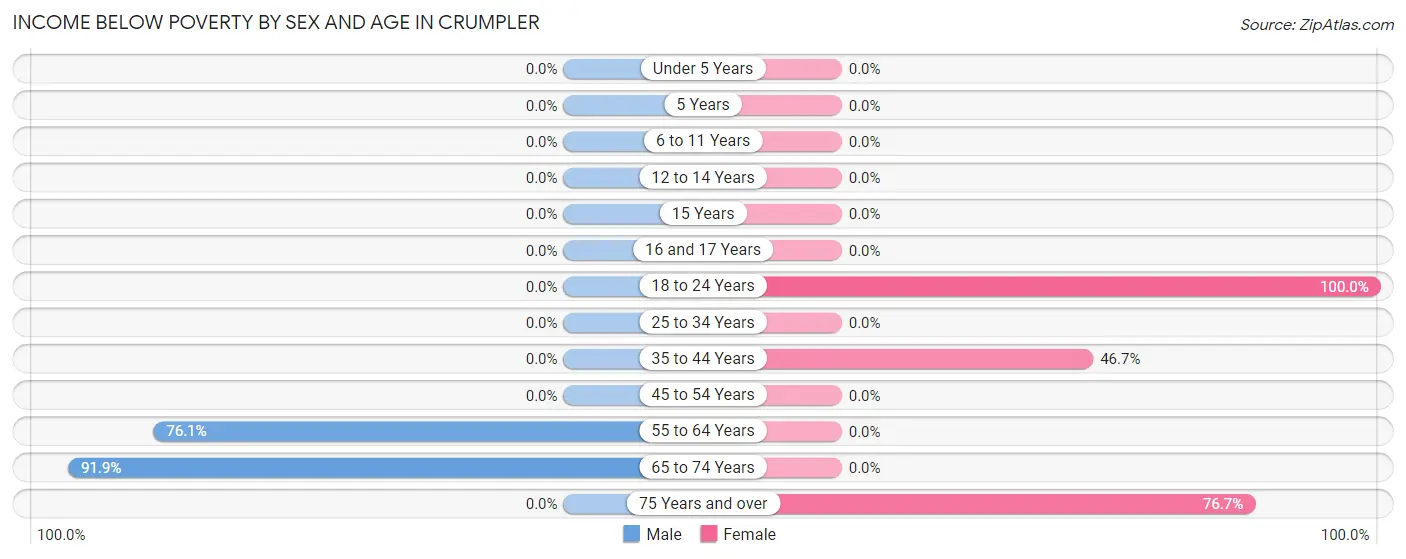
Income Below Poverty by Sex and Age in Crumpler
With 69.1% poverty level for males and 59.8% for females among the residents of Crumpler, 65 to 74 year old males and 18 to 24 year old females are the most vulnerable to poverty, with 148 males (91.9%) and 13 females (100.0%) in their respective age groups living below the poverty level.
| Age Bracket | Male | Female |
| Under 5 Years | 0 (0.0%) | 0 (0.0%) |
| 5 Years | 0 (0.0%) | 0 (0.0%) |
| 6 to 11 Years | 0 (0.0%) | 0 (0.0%) |
| 12 to 14 Years | 0 (0.0%) | 0 (0.0%) |
| 15 Years | 0 (0.0%) | 0 (0.0%) |
| 16 and 17 Years | 0 (0.0%) | 0 (0.0%) |
| 18 to 24 Years | 0 (0.0%) | 13 (100.0%) |
| 25 to 34 Years | 0 (0.0%) | 0 (0.0%) |
| 35 to 44 Years | 0 (0.0%) | 7 (46.7%) |
| 45 to 54 Years | 0 (0.0%) | 0 (0.0%) |
| 55 to 64 Years | 35 (76.1%) | 0 (0.0%) |
| 65 to 74 Years | 148 (91.9%) | 0 (0.0%) |
| 75 Years and over | 0 (0.0%) | 56 (76.7%) |
| Total | 183 (69.1%) | 76 (59.8%) |
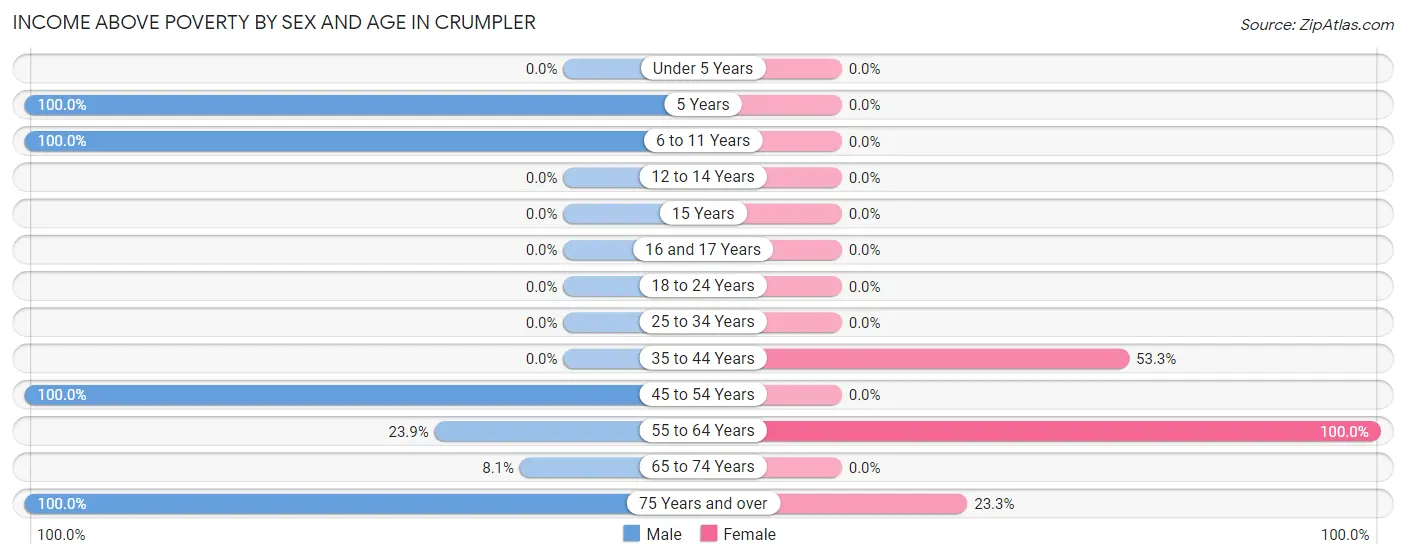
Income Above Poverty by Sex and Age in Crumpler
According to the poverty statistics in Crumpler, males aged 5 years and females aged 55 to 64 years are the age groups that are most secure financially, with 100.0% of males and 100.0% of females in these age groups living above the poverty line.
| Age Bracket | Male | Female |
| Under 5 Years | 0 (0.0%) | 0 (0.0%) |
| 5 Years | 14 (100.0%) | 0 (0.0%) |
| 6 to 11 Years | 15 (100.0%) | 0 (0.0%) |
| 12 to 14 Years | 0 (0.0%) | 0 (0.0%) |
| 15 Years | 0 (0.0%) | 0 (0.0%) |
| 16 and 17 Years | 0 (0.0%) | 0 (0.0%) |
| 18 to 24 Years | 0 (0.0%) | 0 (0.0%) |
| 25 to 34 Years | 0 (0.0%) | 0 (0.0%) |
| 35 to 44 Years | 0 (0.0%) | 8 (53.3%) |
| 45 to 54 Years | 6 (100.0%) | 0 (0.0%) |
| 55 to 64 Years | 11 (23.9%) | 26 (100.0%) |
| 65 to 74 Years | 13 (8.1%) | 0 (0.0%) |
| 75 Years and over | 23 (100.0%) | 17 (23.3%) |
| Total | 82 (30.9%) | 51 (40.2%) |
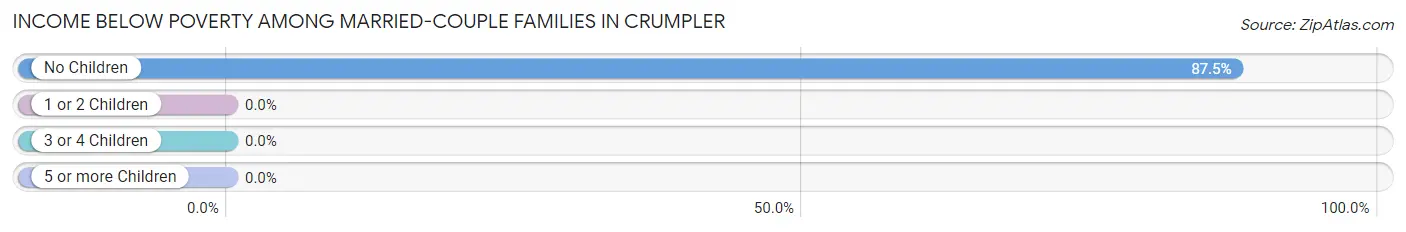
Income Below Poverty Among Married-Couple Families in Crumpler
The poverty statistics for married-couple families in Crumpler show that 80.0% or 56 of the total 70 families live below the poverty line. Families with no children have the highest poverty rate of 87.5%, comprising of 56 families. On the other hand, families with 1 or 2 children have the lowest poverty rate of 0.0%, which includes 0 families.
| Children | Above Poverty | Below Poverty |
| No Children | 8 (12.5%) | 56 (87.5%) |
| 1 or 2 Children | 6 (100.0%) | 0 (0.0%) |
| 3 or 4 Children | 0 (0.0%) | 0 (0.0%) |
| 5 or more Children | 0 (0.0%) | 0 (0.0%) |
| Total | 14 (20.0%) | 56 (80.0%) |
Income Below Poverty Among Single-Parent Households in Crumpler
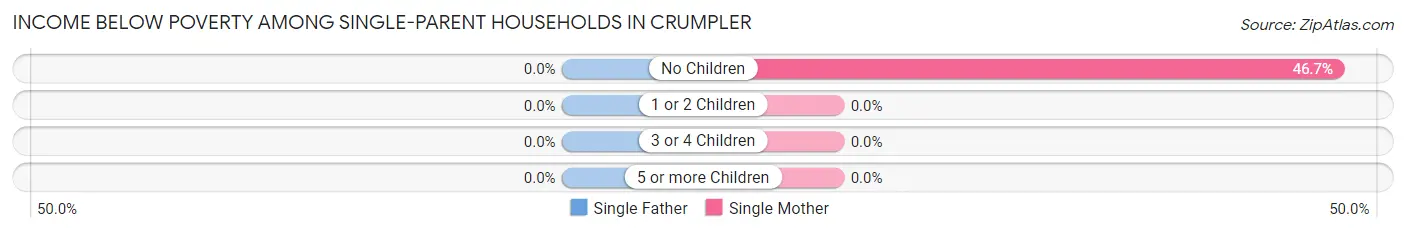
| Children | Single Father | Single Mother |
| No Children | 0 (0.0%) | 7 (46.7%) |
| 1 or 2 Children | 0 (0.0%) | 0 (0.0%) |
| 3 or 4 Children | 0 (0.0%) | 0 (0.0%) |
| 5 or more Children | 0 (0.0%) | 0 (0.0%) |
| Total | 0 (0.0%) | 7 (46.7%) |
Income Below Poverty Among Married-Couple vs Single-Parent Households in Crumpler
The poverty data for Crumpler shows that 56 of the married-couple family households (80.0%) and 7 of the single-parent households (18.4%) are living below the poverty level. Within the married-couple family households, those with no children have the highest poverty rate, with 56 households (87.5%) falling below the poverty line. Among the single-parent households, those with no children have the highest poverty rate, with 7 household (18.4%) living below poverty.
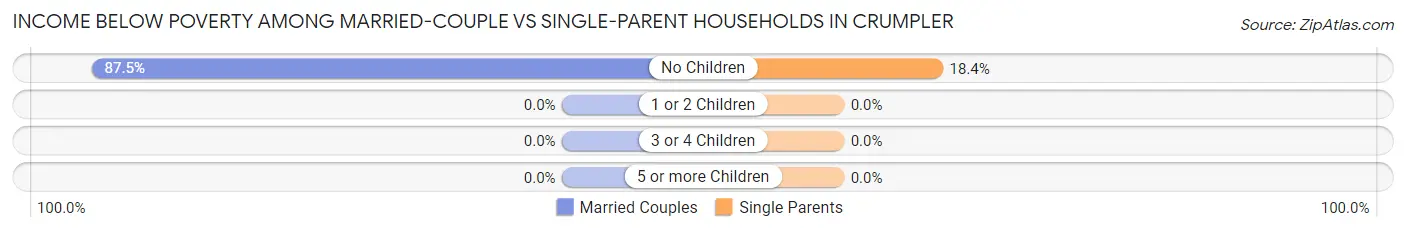
| Children | Married-Couple Families | Single-Parent Households |
| No Children | 56 (87.5%) | 7 (18.4%) |
| 1 or 2 Children | 0 (0.0%) | 0 (0.0%) |
| 3 or 4 Children | 0 (0.0%) | 0 (0.0%) |
| 5 or more Children | 0 (0.0%) | 0 (0.0%) |
| Total | 56 (80.0%) | 7 (18.4%) |
Race in Crumpler
The most populous races in Crumpler are White / Caucasian (216 | 54.1%), and Black / African American (183 | 45.9%).
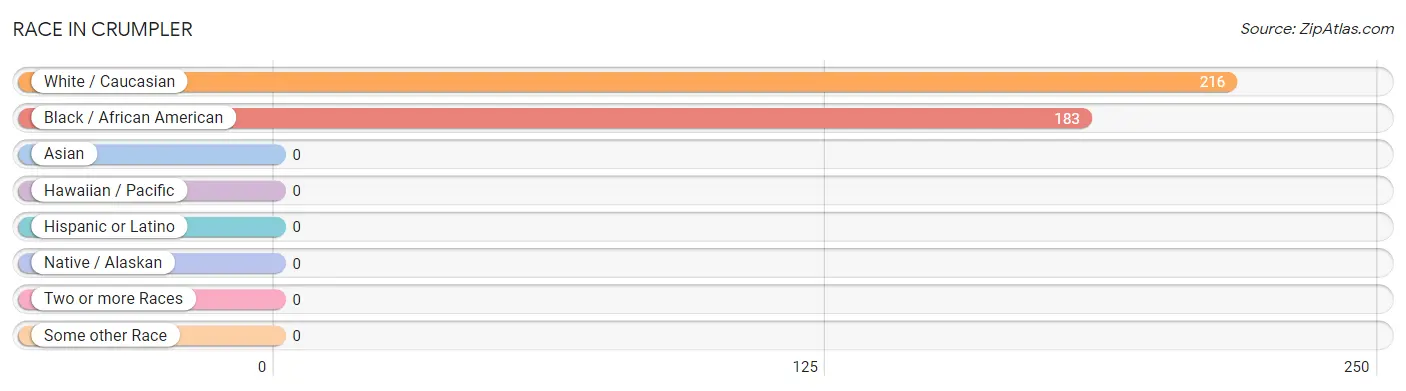
| Race | # Population | % Population |
| Asian | 0 | 0.0% |
| Black / African American | 183 | 45.9% |
| Hawaiian / Pacific | 0 | 0.0% |
| Hispanic or Latino | 0 | 0.0% |
| Native / Alaskan | 0 | 0.0% |
| White / Caucasian | 216 | 54.1% |
| Two or more Races | 0 | 0.0% |
| Some other Race | 0 | 0.0% |
| Total | 399 | 100.0% |
Ancestry in Crumpler
The most populous ancestries reported in Crumpler are African (35 | 8.8%), Subsaharan African (35 | 8.8%), Scottish (34 | 8.5%), Irish (29 | 7.3%), and German (22 | 5.5%), together accounting for 38.8% of all Crumpler residents.
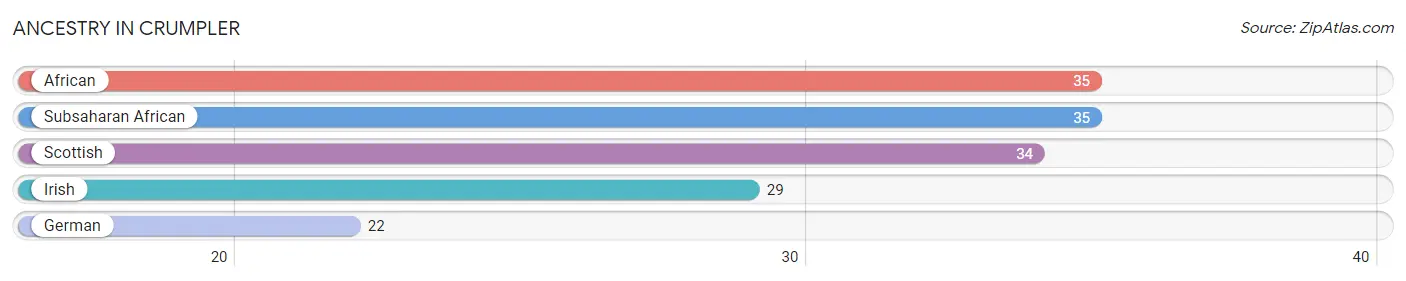
| Ancestry | # Population | % Population |
| African | 35 | 8.8% |
| German | 22 | 5.5% |
| Irish | 29 | 7.3% |
| Scottish | 34 | 8.5% |
| Subsaharan African | 35 | 8.8% | View All 5 Rows |
Immigrants in Crumpler

| Immigration Origin | # Population | % Population | View All 0 Rows |
Sex and Age in Crumpler
Sex and Age in Crumpler
The most populous age groups in Crumpler are 65 to 69 Years (148 | 55.8%) for men and 75 to 79 Years (65 | 48.5%) for women.
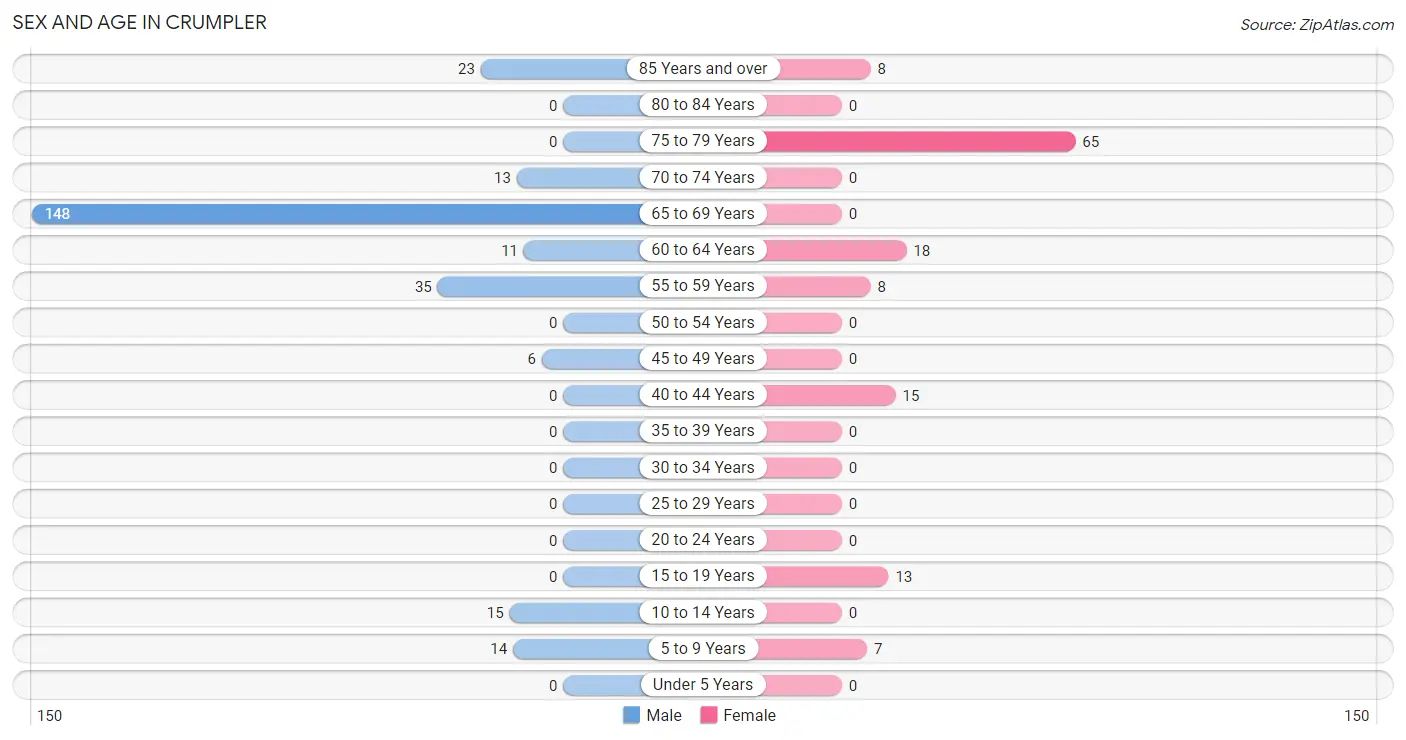
| Age Bracket | Male | Female |
| Under 5 Years | 0 (0.0%) | 0 (0.0%) |
| 5 to 9 Years | 14 (5.3%) | 7 (5.2%) |
| 10 to 14 Years | 15 (5.7%) | 0 (0.0%) |
| 15 to 19 Years | 0 (0.0%) | 13 (9.7%) |
| 20 to 24 Years | 0 (0.0%) | 0 (0.0%) |
| 25 to 29 Years | 0 (0.0%) | 0 (0.0%) |
| 30 to 34 Years | 0 (0.0%) | 0 (0.0%) |
| 35 to 39 Years | 0 (0.0%) | 0 (0.0%) |
| 40 to 44 Years | 0 (0.0%) | 15 (11.2%) |
| 45 to 49 Years | 6 (2.3%) | 0 (0.0%) |
| 50 to 54 Years | 0 (0.0%) | 0 (0.0%) |
| 55 to 59 Years | 35 (13.2%) | 8 (6.0%) |
| 60 to 64 Years | 11 (4.2%) | 18 (13.4%) |
| 65 to 69 Years | 148 (55.8%) | 0 (0.0%) |
| 70 to 74 Years | 13 (4.9%) | 0 (0.0%) |
| 75 to 79 Years | 0 (0.0%) | 65 (48.5%) |
| 80 to 84 Years | 0 (0.0%) | 0 (0.0%) |
| 85 Years and over | 23 (8.7%) | 8 (6.0%) |
| Total | 265 (100.0%) | 134 (100.0%) |
Families and Households in Crumpler
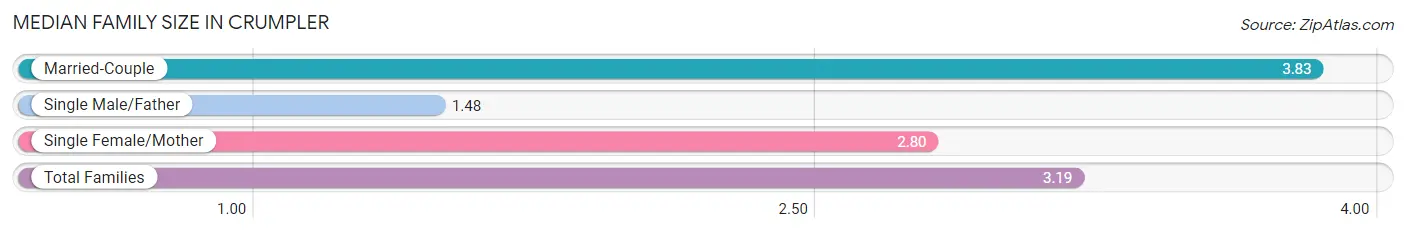
Median Family Size in Crumpler
The median family size in Crumpler is 3.19 persons per family, with married-couple families (70 | 64.8%) accounting for the largest median family size of 3.83 persons per family. On the other hand, single male/father families (23 | 21.3%) represent the smallest median family size with 1.48 persons per family.
| Family Type | # Families | Family Size |
| Married-Couple | 70 (64.8%) | 3.83 |
| Single Male/Father | 23 (21.3%) | 1.48 |
| Single Female/Mother | 15 (13.9%) | 2.80 |
| Total Families | 108 (100.0%) | 3.19 |
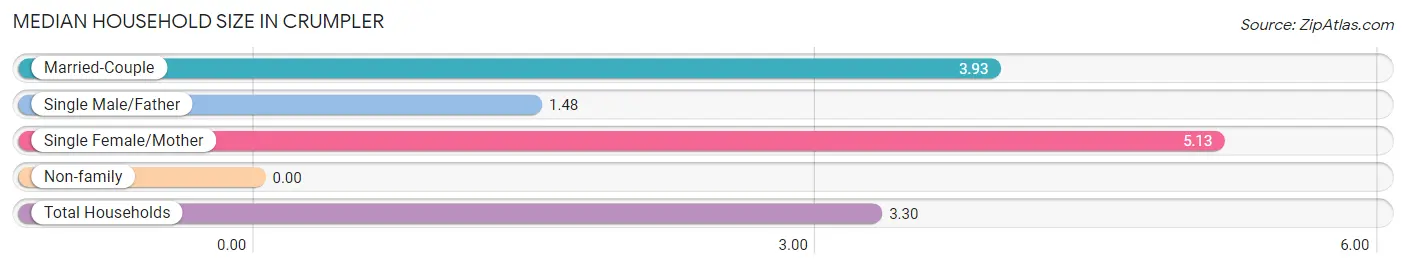
Median Household Size in Crumpler
| Household Type | # Households | Household Size |
| Married-Couple | 70 (57.9%) | 3.93 |
| Single Male/Father | 23 (19.0%) | 1.48 |
| Single Female/Mother | 15 (12.4%) | 5.13 |
| Non-family | 13 (10.7%) | - |
| Total Households | 121 (100.0%) | 3.30 |
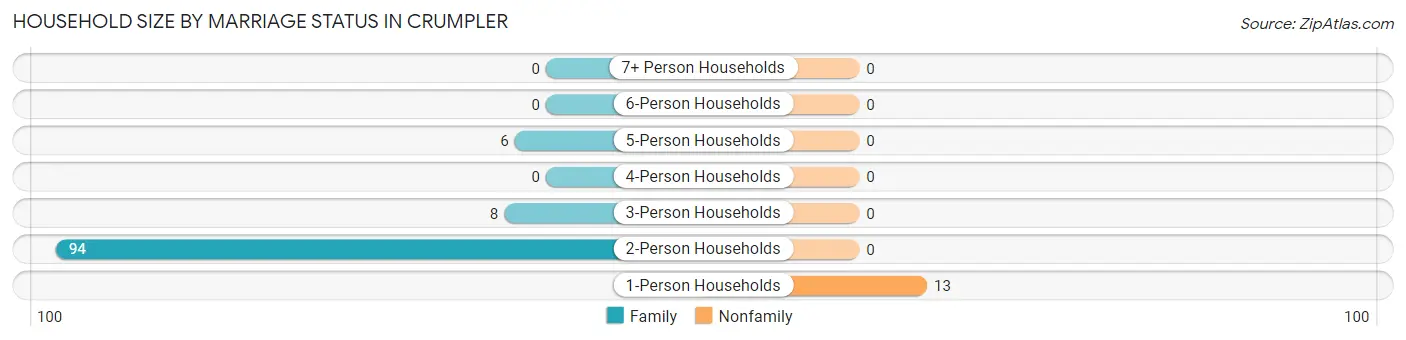
Household Size by Marriage Status in Crumpler
Out of a total of 121 households in Crumpler, 108 (89.3%) are family households, while 13 (10.7%) are nonfamily households. The most numerous type of family households are 2-person households, comprising 94, and the most common type of nonfamily households are 1-person households, comprising 13.
| Household Size | Family Households | Nonfamily Households |
| 1-Person Households | - | 13 (10.7%) |
| 2-Person Households | 94 (77.7%) | 0 (0.0%) |
| 3-Person Households | 8 (6.6%) | 0 (0.0%) |
| 4-Person Households | 0 (0.0%) | 0 (0.0%) |
| 5-Person Households | 6 (5.0%) | 0 (0.0%) |
| 6-Person Households | 0 (0.0%) | 0 (0.0%) |
| 7+ Person Households | 0 (0.0%) | 0 (0.0%) |
| Total | 108 (89.3%) | 13 (10.7%) |
Female Fertility in Crumpler
Fertility by Age in Crumpler
| Age Bracket | Women with Births | Births / 1,000 Women |
| 15 to 19 years | 0 (0.0%) | 0.0 |
| 20 to 34 years | 0 (0.0%) | 0.0 |
| 35 to 50 years | 0 (0.0%) | 0.0 |
| Total | 0 (0.0%) | 0.0 |
Fertility by Age by Marriage Status in Crumpler
| Age Bracket | Married | Unmarried |
| 15 to 19 years | 0 (0.0%) | 0 (0.0%) |
| 20 to 34 years | 0 (0.0%) | 0 (0.0%) |
| 35 to 50 years | 0 (0.0%) | 0 (0.0%) |
| Total | 0 (0.0%) | 0 (0.0%) |
Fertility by Education in Crumpler
| Educational Attainment | Women with Births | Births / 1,000 Women |
| Less than High School | 0 (0.0%) | 0.0 |
| High School Diploma | 0 (0.0%) | 0.0 |
| College or Associate's Degree | 0 (0.0%) | 0.0 |
| Bachelor's Degree | 0 (0.0%) | 0.0 |
| Graduate Degree | 0 (0.0%) | 0.0 |
| Total | 0 (0.0%) | 0.0 |
Fertility by Education by Marriage Status in Crumpler
| Educational Attainment | Married | Unmarried |
| Less than High School | 0 (0.0%) | 0 (0.0%) |
| High School Diploma | 0 (0.0%) | 0 (0.0%) |
| College or Associate's Degree | 0 (0.0%) | 0 (0.0%) |
| Bachelor's Degree | 0 (0.0%) | 0 (0.0%) |
| Graduate Degree | 0 (0.0%) | 0 (0.0%) |
| Total | 0 (0.0%) | 0 (0.0%) |
Employment Characteristics in Crumpler
Employment by Class of Employer in Crumpler
Among the 8 employed individuals in Crumpler, , and private company employees (8 | 100.0%) make up the most common classes of employment.
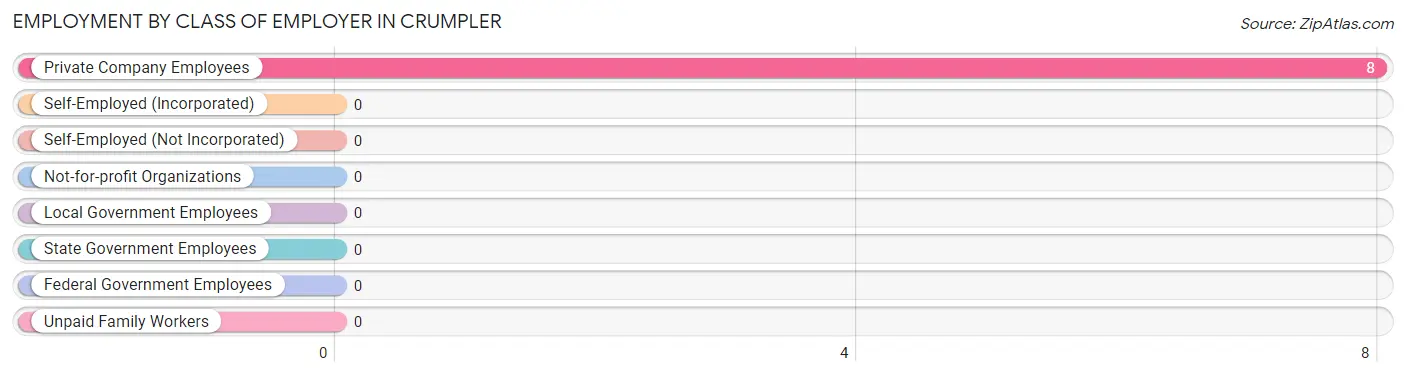
| Employer Class | # Employees | % Employees |
| Private Company Employees | 8 | 100.0% |
| Self-Employed (Incorporated) | 0 | 0.0% |
| Self-Employed (Not Incorporated) | 0 | 0.0% |
| Not-for-profit Organizations | 0 | 0.0% |
| Local Government Employees | 0 | 0.0% |
| State Government Employees | 0 | 0.0% |
| Federal Government Employees | 0 | 0.0% |
| Unpaid Family Workers | 0 | 0.0% |
| Total | 8 | 100.0% |
Employment Status by Age in Crumpler
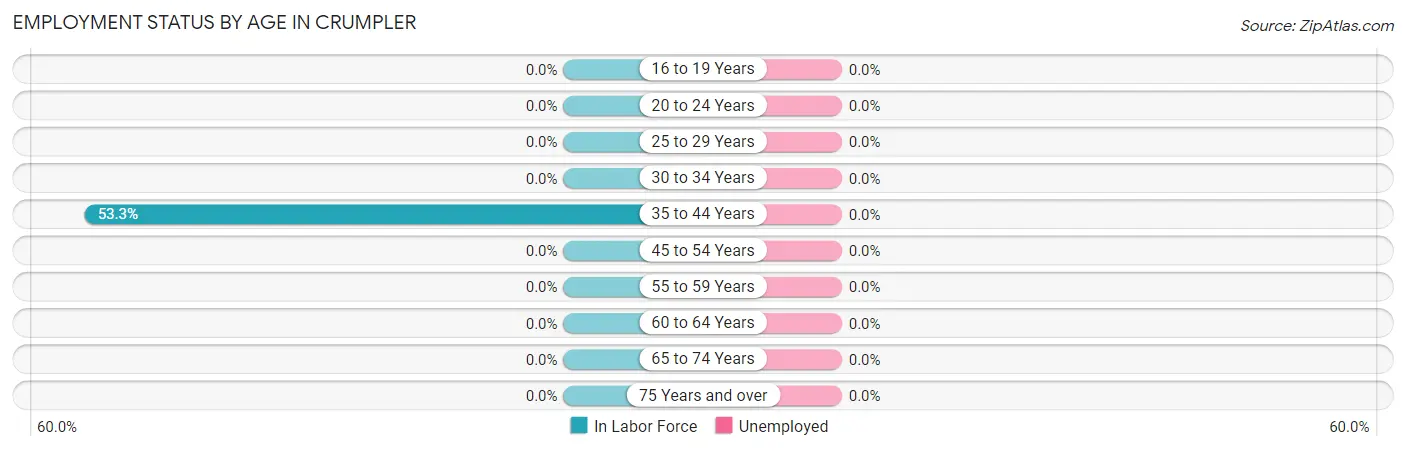
| Age Bracket | In Labor Force | Unemployed |
| 16 to 19 Years | 0 (0.0%) | 0 (0.0%) |
| 20 to 24 Years | 0 (0.0%) | 0 (0.0%) |
| 25 to 29 Years | 0 (0.0%) | 0 (0.0%) |
| 30 to 34 Years | 0 (0.0%) | 0 (0.0%) |
| 35 to 44 Years | 8 (53.3%) | 0 (0.0%) |
| 45 to 54 Years | 0 (0.0%) | 0 (0.0%) |
| 55 to 59 Years | 0 (0.0%) | 0 (0.0%) |
| 60 to 64 Years | 0 (0.0%) | 0 (0.0%) |
| 65 to 74 Years | 0 (0.0%) | 0 (0.0%) |
| 75 Years and over | 0 (0.0%) | 0 (0.0%) |
| Total | 8 (2.2%) | 0 (0.0%) |
Employment Status by Educational Attainment in Crumpler
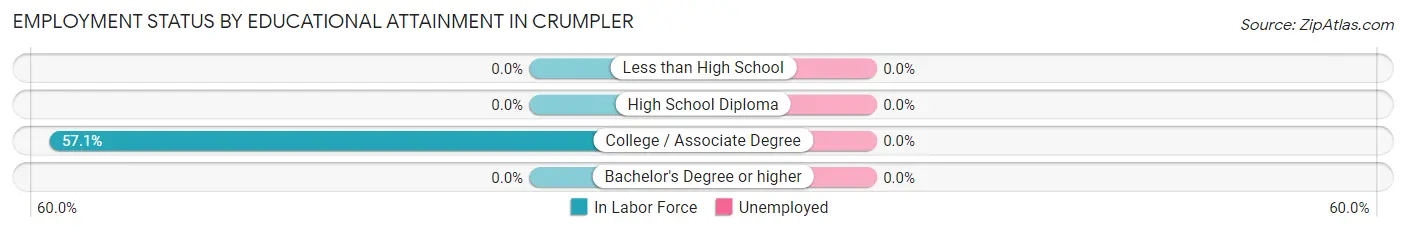
| Educational Attainment | In Labor Force | Unemployed |
| Less than High School | 0 (0.0%) | 0 (0.0%) |
| High School Diploma | 0 (0.0%) | 0 (0.0%) |
| College / Associate Degree | 8 (57.1%) | 0 (0.0%) |
| Bachelor's Degree or higher | 0 (0.0%) | 0 (0.0%) |
| Total | 8 (8.6%) | 0 (0.0%) |
Employment Occupations by Sex in Crumpler
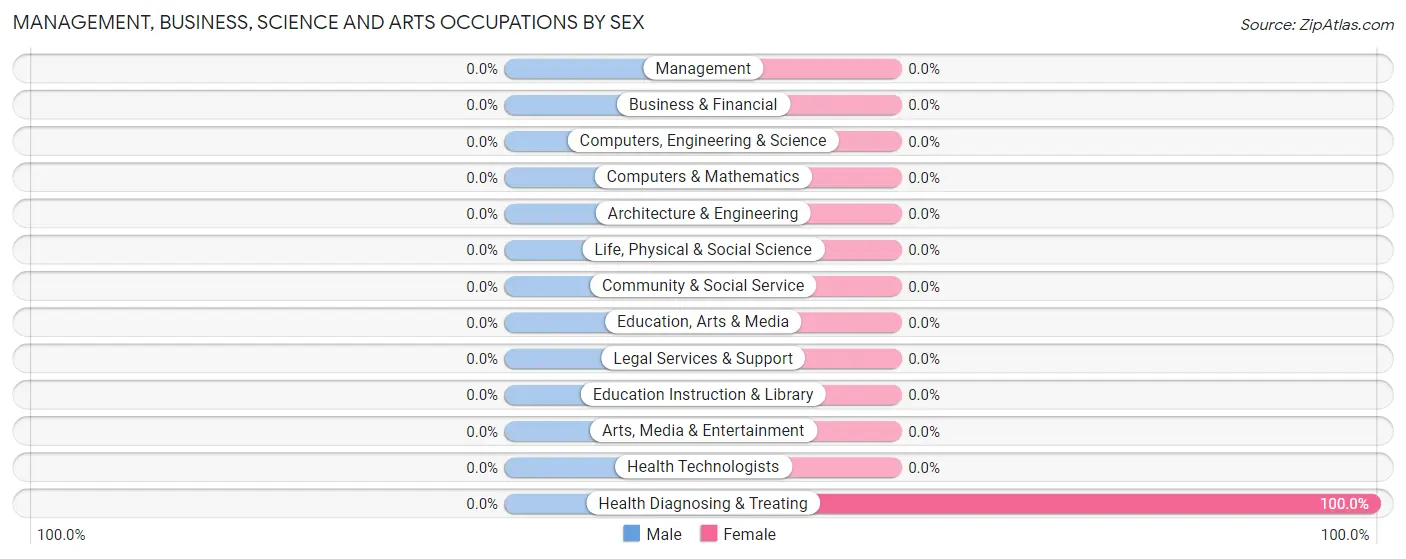
Management, Business, Science and Arts Occupations
The most common Management, Business, Science and Arts occupations in Crumpler are , and Health Diagnosing & Treating (8 | 100.0%).
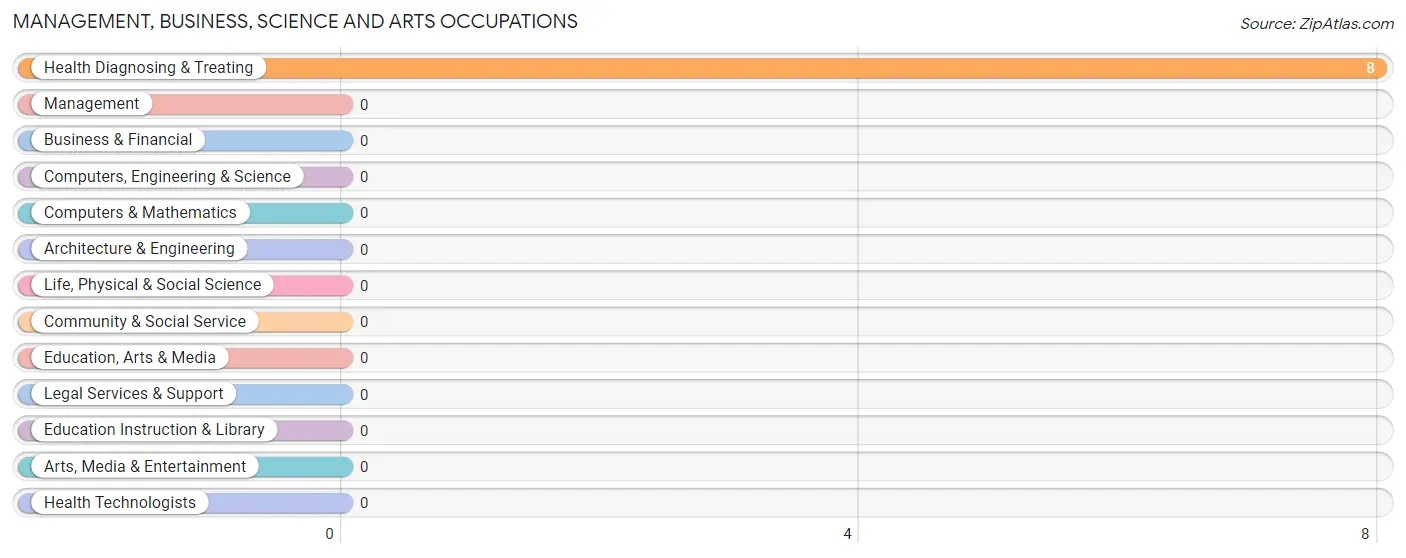
Management, Business, Science and Arts Occupations by Sex
| Occupation | Male | Female |
| Management | 0 (0.0%) | 0 (0.0%) |
| Business & Financial | 0 (0.0%) | 0 (0.0%) |
| Computers, Engineering & Science | 0 (0.0%) | 0 (0.0%) |
| Computers & Mathematics | 0 (0.0%) | 0 (0.0%) |
| Architecture & Engineering | 0 (0.0%) | 0 (0.0%) |
| Life, Physical & Social Science | 0 (0.0%) | 0 (0.0%) |
| Community & Social Service | 0 (0.0%) | 0 (0.0%) |
| Education, Arts & Media | 0 (0.0%) | 0 (0.0%) |
| Legal Services & Support | 0 (0.0%) | 0 (0.0%) |
| Education Instruction & Library | 0 (0.0%) | 0 (0.0%) |
| Arts, Media & Entertainment | 0 (0.0%) | 0 (0.0%) |
| Health Diagnosing & Treating | 0 (0.0%) | 8 (100.0%) |
| Health Technologists | 0 (0.0%) | 0 (0.0%) |
| Total (Category) | 0 (0.0%) | 8 (100.0%) |
| Total (Overall) | 0 (0.0%) | 8 (100.0%) |
Services Occupations
Services Occupations by Sex
| Occupation | Male | Female |
| Healthcare Support | 0 (0.0%) | 0 (0.0%) |
| Security & Protection | 0 (0.0%) | 0 (0.0%) |
| Firefighting & Prevention | 0 (0.0%) | 0 (0.0%) |
| Law Enforcement | 0 (0.0%) | 0 (0.0%) |
| Food Preparation & Serving | 0 (0.0%) | 0 (0.0%) |
| Cleaning & Maintenance | 0 (0.0%) | 0 (0.0%) |
| Personal Care & Service | 0 (0.0%) | 0 (0.0%) |
| Total (Category) | 0 (0.0%) | 0 (0.0%) |
| Total (Overall) | 0 (0.0%) | 8 (100.0%) |
Sales and Office Occupations
Sales and Office Occupations by Sex
| Occupation | Male | Female |
| Sales & Related | 0 (0.0%) | 0 (0.0%) |
| Office & Administration | 0 (0.0%) | 0 (0.0%) |
| Total (Category) | 0 (0.0%) | 0 (0.0%) |
| Total (Overall) | 0 (0.0%) | 8 (100.0%) |
Natural Resources, Construction and Maintenance Occupations
Natural Resources, Construction and Maintenance Occupations by Sex
| Occupation | Male | Female |
| Farming, Fishing & Forestry | 0 (0.0%) | 0 (0.0%) |
| Construction & Extraction | 0 (0.0%) | 0 (0.0%) |
| Installation, Maintenance & Repair | 0 (0.0%) | 0 (0.0%) |
| Total (Category) | 0 (0.0%) | 0 (0.0%) |
| Total (Overall) | 0 (0.0%) | 8 (100.0%) |
Production, Transportation and Moving Occupations
Production, Transportation and Moving Occupations by Sex
| Occupation | Male | Female |
| Production | 0 (0.0%) | 0 (0.0%) |
| Transportation | 0 (0.0%) | 0 (0.0%) |
| Material Moving | 0 (0.0%) | 0 (0.0%) |
| Total (Category) | 0 (0.0%) | 0 (0.0%) |
| Total (Overall) | 0 (0.0%) | 8 (100.0%) |
Employment Industries by Sex in Crumpler
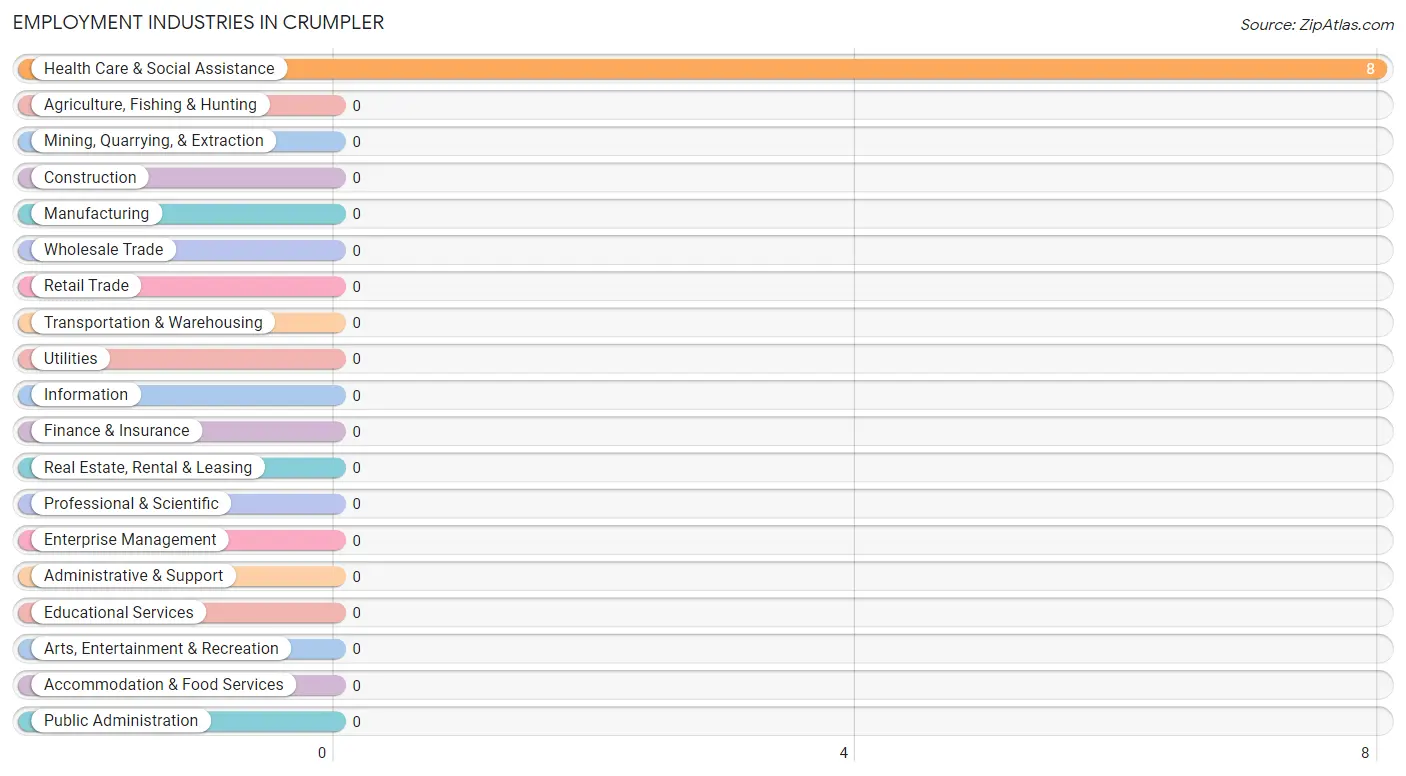
Employment Industries in Crumpler
The major employment industries in Crumpler include , and Health Care & Social Assistance (8 | 100.0%).
Employment Industries by Sex in Crumpler
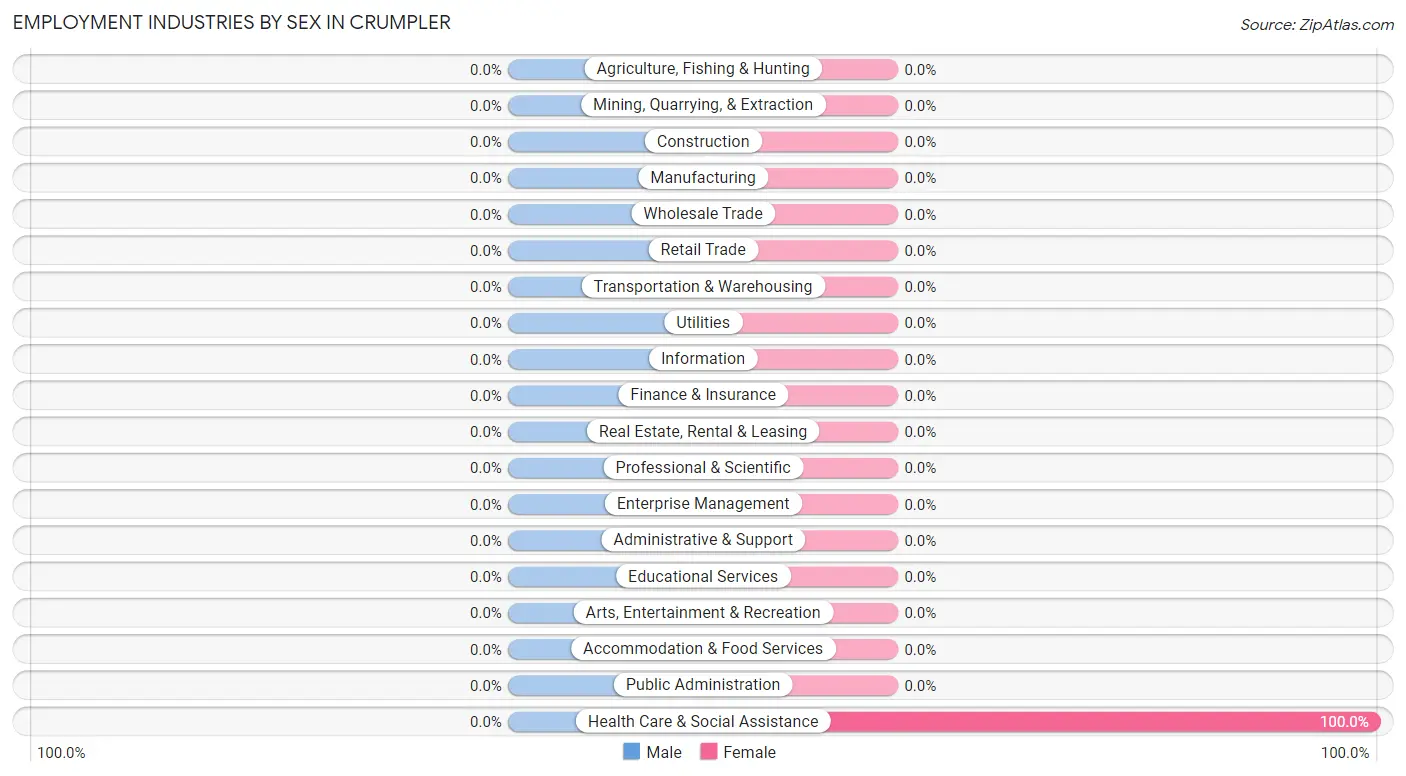
| Industry | Male | Female |
| Agriculture, Fishing & Hunting | 0 (0.0%) | 0 (0.0%) |
| Mining, Quarrying, & Extraction | 0 (0.0%) | 0 (0.0%) |
| Construction | 0 (0.0%) | 0 (0.0%) |
| Manufacturing | 0 (0.0%) | 0 (0.0%) |
| Wholesale Trade | 0 (0.0%) | 0 (0.0%) |
| Retail Trade | 0 (0.0%) | 0 (0.0%) |
| Transportation & Warehousing | 0 (0.0%) | 0 (0.0%) |
| Utilities | 0 (0.0%) | 0 (0.0%) |
| Information | 0 (0.0%) | 0 (0.0%) |
| Finance & Insurance | 0 (0.0%) | 0 (0.0%) |
| Real Estate, Rental & Leasing | 0 (0.0%) | 0 (0.0%) |
| Professional & Scientific | 0 (0.0%) | 0 (0.0%) |
| Enterprise Management | 0 (0.0%) | 0 (0.0%) |
| Administrative & Support | 0 (0.0%) | 0 (0.0%) |
| Educational Services | 0 (0.0%) | 0 (0.0%) |
| Health Care & Social Assistance | 0 (0.0%) | 8 (100.0%) |
| Arts, Entertainment & Recreation | 0 (0.0%) | 0 (0.0%) |
| Accommodation & Food Services | 0 (0.0%) | 0 (0.0%) |
| Public Administration | 0 (0.0%) | 0 (0.0%) |
| Total | 0 (0.0%) | 8 (100.0%) |
Education in Crumpler
School Enrollment in Crumpler
The most common levels of schooling among the 36 students in Crumpler are middle school (15 | 41.7%), nursery / preschool (14 | 38.9%), and elementary school (7 | 19.4%).
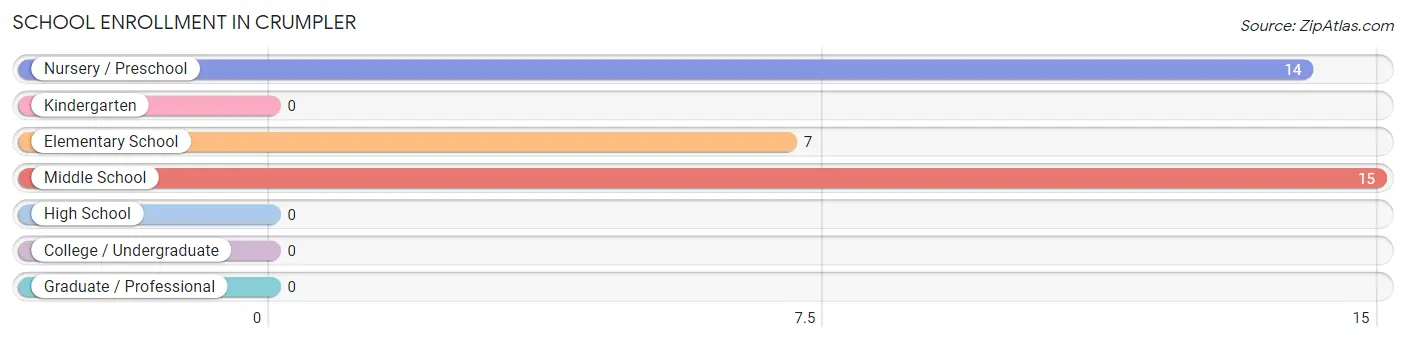
| School Level | # Students | % Students |
| Nursery / Preschool | 14 | 38.9% |
| Kindergarten | 0 | 0.0% |
| Elementary School | 7 | 19.4% |
| Middle School | 15 | 41.7% |
| High School | 0 | 0.0% |
| College / Undergraduate | 0 | 0.0% |
| Graduate / Professional | 0 | 0.0% |
| Total | 36 | 100.0% |
School Enrollment by Age by Funding Source in Crumpler
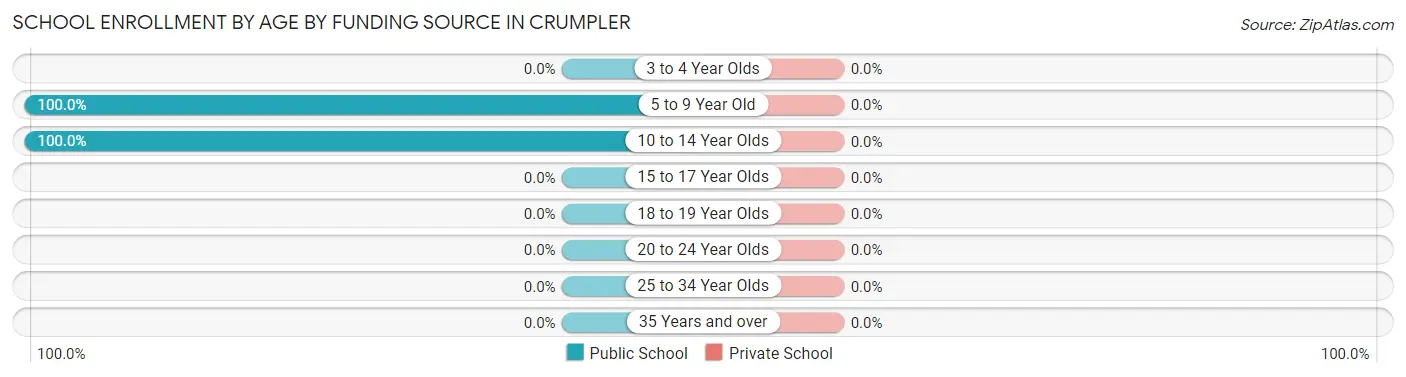
| Age Bracket | Public School | Private School |
| 3 to 4 Year Olds | 0 (0.0%) | 0 (0.0%) |
| 5 to 9 Year Old | 21 (100.0%) | 0 (0.0%) |
| 10 to 14 Year Olds | 15 (100.0%) | 0 (0.0%) |
| 15 to 17 Year Olds | 0 (0.0%) | 0 (0.0%) |
| 18 to 19 Year Olds | 0 (0.0%) | 0 (0.0%) |
| 20 to 24 Year Olds | 0 (0.0%) | 0 (0.0%) |
| 25 to 34 Year Olds | 0 (0.0%) | 0 (0.0%) |
| 35 Years and over | 0 (0.0%) | 0 (0.0%) |
| Total | 36 (100.0%) | 0 (0.0%) |
Educational Attainment by Field of Study in Crumpler
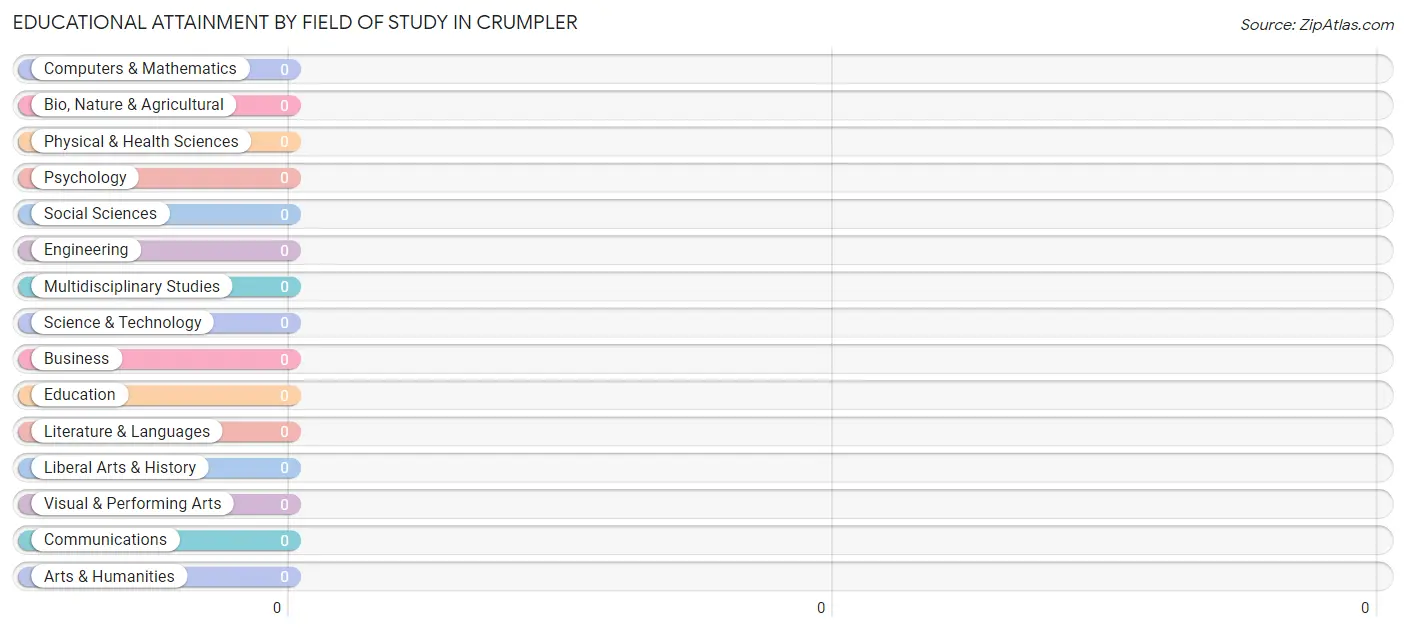
| Field of Study | # Graduates | % Graduates |
| Computers & Mathematics | 0 | 0.0% |
| Bio, Nature & Agricultural | 0 | 0.0% |
| Physical & Health Sciences | 0 | 0.0% |
| Psychology | 0 | 0.0% |
| Social Sciences | 0 | 0.0% |
| Engineering | 0 | 0.0% |
| Multidisciplinary Studies | 0 | 0.0% |
| Science & Technology | 0 | 0.0% |
| Business | 0 | 0.0% |
| Education | 0 | 0.0% |
| Literature & Languages | 0 | 0.0% |
| Liberal Arts & History | 0 | 0.0% |
| Visual & Performing Arts | 0 | 0.0% |
| Communications | 0 | 0.0% |
| Arts & Humanities | 0 | 0.0% |
| Total | 0 | 0.0% |
Transportation & Commute in Crumpler
Vehicle Availability by Sex in Crumpler
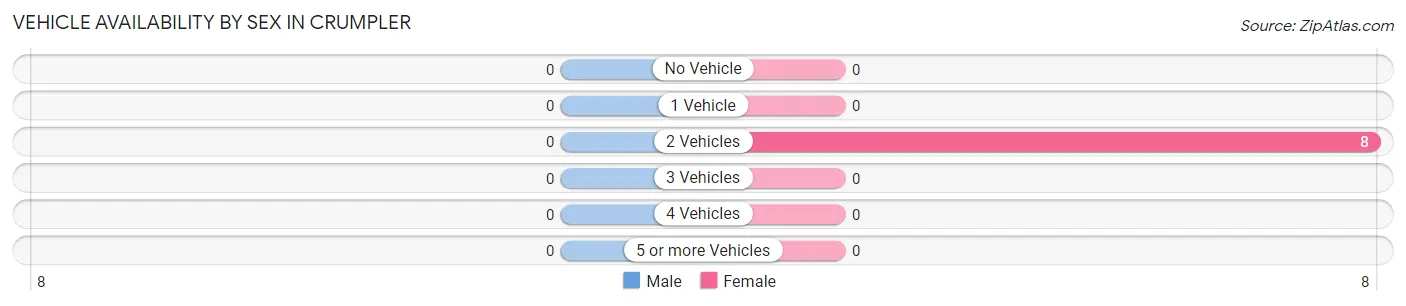
| Vehicles Available | Male | Female |
| No Vehicle | 0 (0.0%) | 0 (0.0%) |
| 1 Vehicle | 0 (0.0%) | 0 (0.0%) |
| 2 Vehicles | 0 (0.0%) | 8 (100.0%) |
| 3 Vehicles | 0 (0.0%) | 0 (0.0%) |
| 4 Vehicles | 0 (0.0%) | 0 (0.0%) |
| 5 or more Vehicles | 0 (0.0%) | 0 (0.0%) |
| Total | 0 (0.0%) | 8 (100.0%) |
Commute Time in Crumpler
The most frequently occuring commute durations in Crumpler are 35 to 39 minutes (8 commuters, 100.0%), less than 5 minutes (0 commuters, 0.0%), and 5 to 9 minutes (0 commuters, 0.0%).
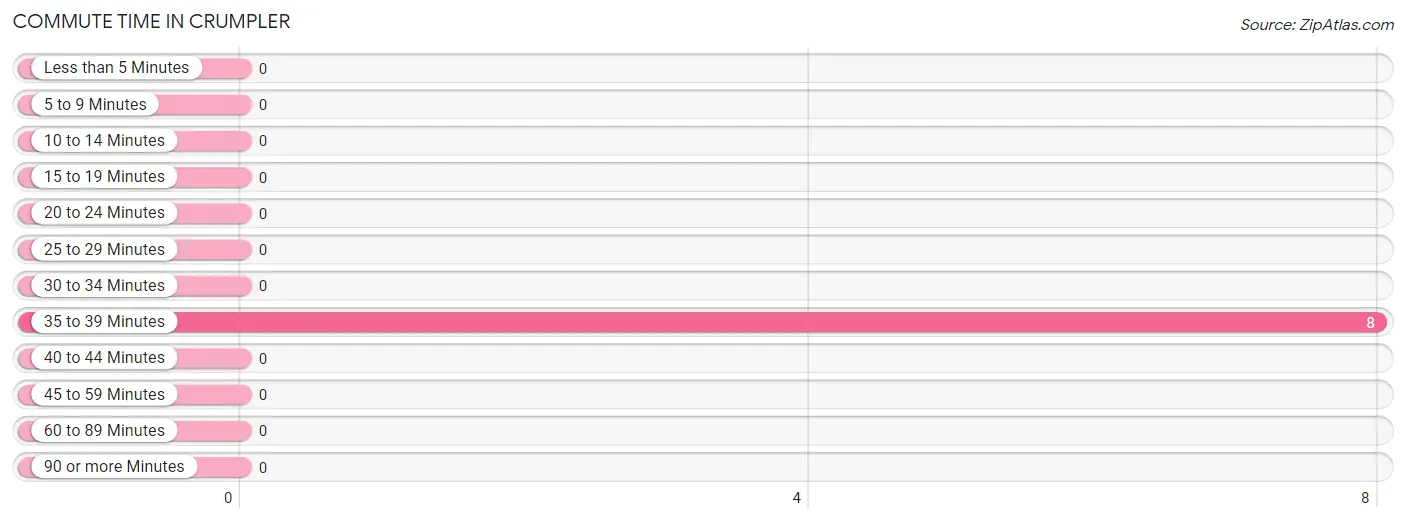
| Commute Time | # Commuters | % Commuters |
| Less than 5 Minutes | 0 | 0.0% |
| 5 to 9 Minutes | 0 | 0.0% |
| 10 to 14 Minutes | 0 | 0.0% |
| 15 to 19 Minutes | 0 | 0.0% |
| 20 to 24 Minutes | 0 | 0.0% |
| 25 to 29 Minutes | 0 | 0.0% |
| 30 to 34 Minutes | 0 | 0.0% |
| 35 to 39 Minutes | 8 | 100.0% |
| 40 to 44 Minutes | 0 | 0.0% |
| 45 to 59 Minutes | 0 | 0.0% |
| 60 to 89 Minutes | 0 | 0.0% |
| 90 or more Minutes | 0 | 0.0% |
Commute Time by Sex in Crumpler
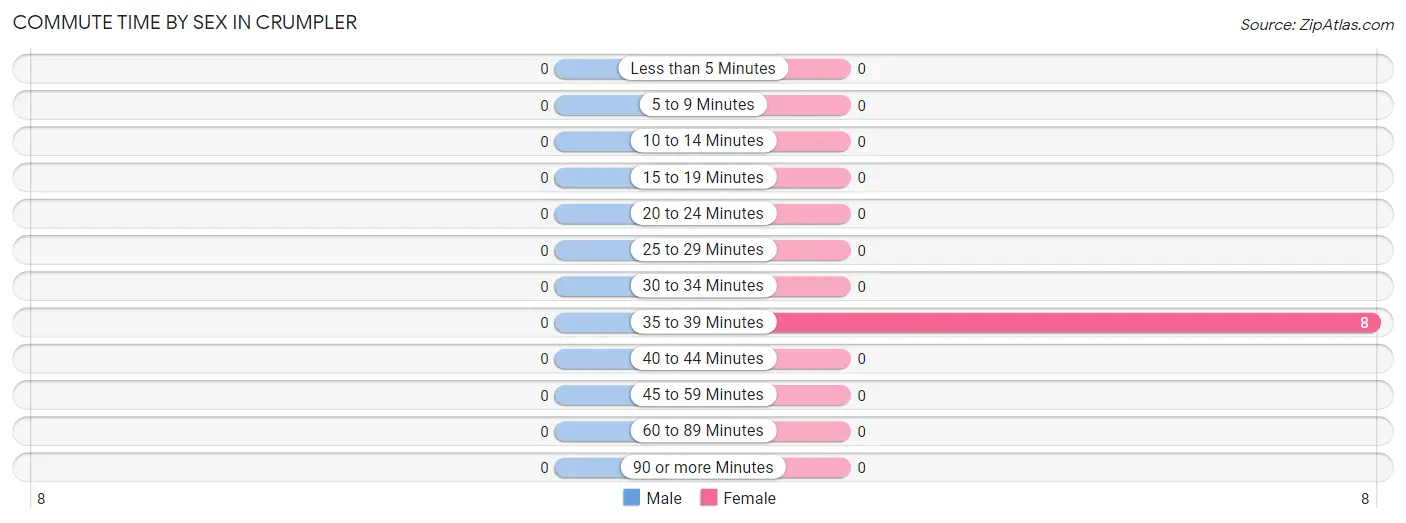
| Commute Time | Male | Female |
| Less than 5 Minutes | 0 (0.0%) | 0 (0.0%) |
| 5 to 9 Minutes | 0 (0.0%) | 0 (0.0%) |
| 10 to 14 Minutes | 0 (0.0%) | 0 (0.0%) |
| 15 to 19 Minutes | 0 (0.0%) | 0 (0.0%) |
| 20 to 24 Minutes | 0 (0.0%) | 0 (0.0%) |
| 25 to 29 Minutes | 0 (0.0%) | 0 (0.0%) |
| 30 to 34 Minutes | 0 (0.0%) | 0 (0.0%) |
| 35 to 39 Minutes | 0 (0.0%) | 8 (100.0%) |
| 40 to 44 Minutes | 0 (0.0%) | 0 (0.0%) |
| 45 to 59 Minutes | 0 (0.0%) | 0 (0.0%) |
| 60 to 89 Minutes | 0 (0.0%) | 0 (0.0%) |
| 90 or more Minutes | 0 (0.0%) | 0 (0.0%) |
Time of Departure to Work by Sex in Crumpler
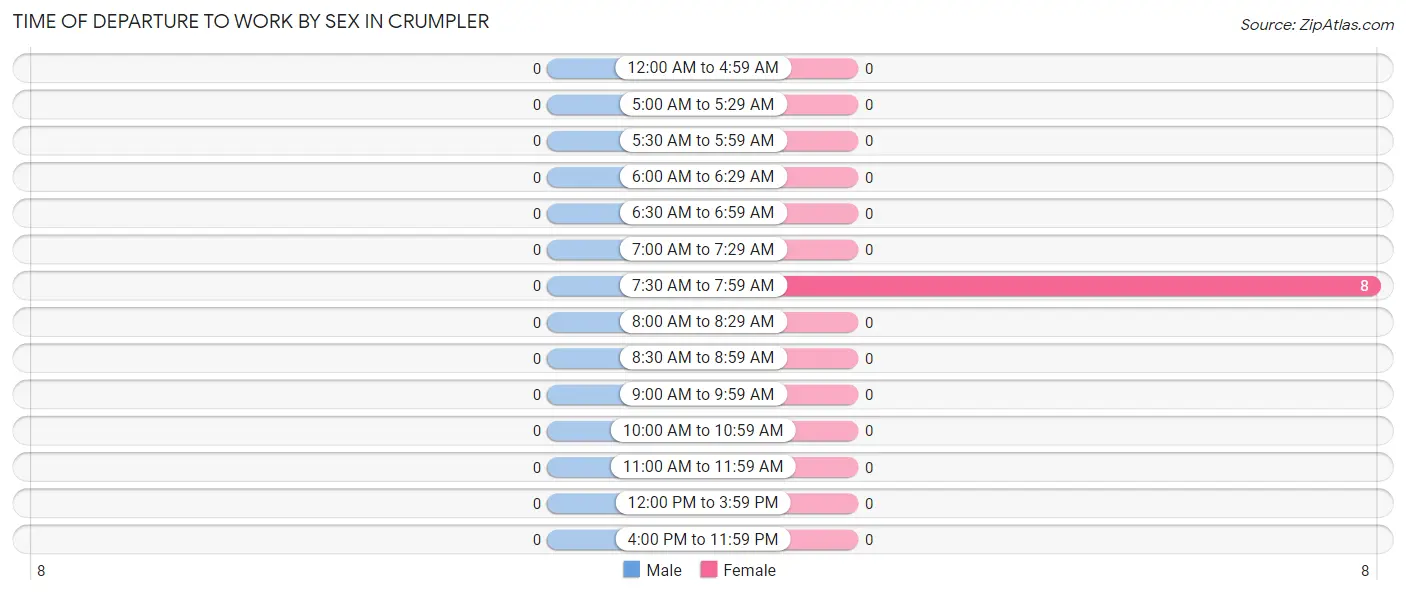
| Time of Departure | Male | Female |
| 12:00 AM to 4:59 AM | 0 (0.0%) | 0 (0.0%) |
| 5:00 AM to 5:29 AM | 0 (0.0%) | 0 (0.0%) |
| 5:30 AM to 5:59 AM | 0 (0.0%) | 0 (0.0%) |
| 6:00 AM to 6:29 AM | 0 (0.0%) | 0 (0.0%) |
| 6:30 AM to 6:59 AM | 0 (0.0%) | 0 (0.0%) |
| 7:00 AM to 7:29 AM | 0 (0.0%) | 0 (0.0%) |
| 7:30 AM to 7:59 AM | 0 (0.0%) | 8 (100.0%) |
| 8:00 AM to 8:29 AM | 0 (0.0%) | 0 (0.0%) |
| 8:30 AM to 8:59 AM | 0 (0.0%) | 0 (0.0%) |
| 9:00 AM to 9:59 AM | 0 (0.0%) | 0 (0.0%) |
| 10:00 AM to 10:59 AM | 0 (0.0%) | 0 (0.0%) |
| 11:00 AM to 11:59 AM | 0 (0.0%) | 0 (0.0%) |
| 12:00 PM to 3:59 PM | 0 (0.0%) | 0 (0.0%) |
| 4:00 PM to 11:59 PM | 0 (0.0%) | 0 (0.0%) |
| Total | 0 (0.0%) | 8 (100.0%) |
Housing Occupancy in Crumpler
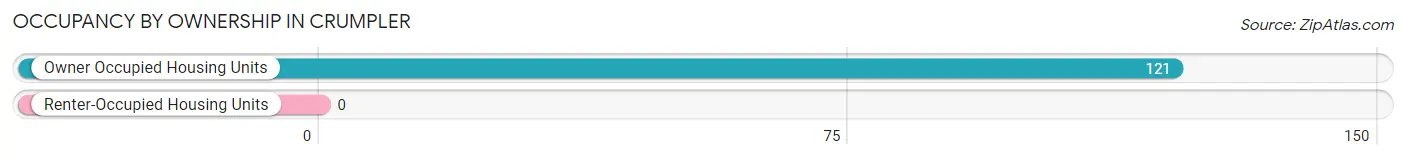
Occupancy by Ownership in Crumpler
Of the total 121 dwellings in Crumpler, owner-occupied units account for 121 (100.0%), while renter-occupied units make up 0 (0.0%).
| Occupancy | # Housing Units | % Housing Units |
| Owner Occupied Housing Units | 121 | 100.0% |
| Renter-Occupied Housing Units | 0 | 0.0% |
| Total Occupied Housing Units | 121 | 100.0% |
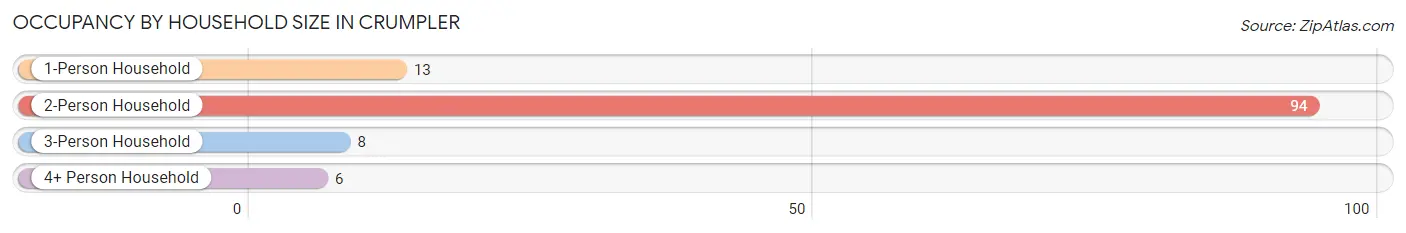
Occupancy by Household Size in Crumpler
| Household Size | # Housing Units | % Housing Units |
| 1-Person Household | 13 | 10.7% |
| 2-Person Household | 94 | 77.7% |
| 3-Person Household | 8 | 6.6% |
| 4+ Person Household | 6 | 5.0% |
| Total Housing Units | 121 | 100.0% |
Occupancy by Ownership by Household Size in Crumpler
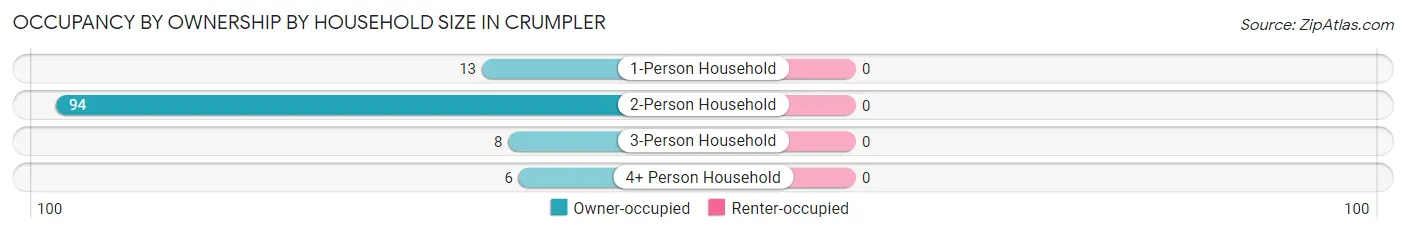
| Household Size | Owner-occupied | Renter-occupied |
| 1-Person Household | 13 (100.0%) | 0 (0.0%) |
| 2-Person Household | 94 (100.0%) | 0 (0.0%) |
| 3-Person Household | 8 (100.0%) | 0 (0.0%) |
| 4+ Person Household | 6 (100.0%) | 0 (0.0%) |
| Total Housing Units | 121 (100.0%) | 0 (0.0%) |
Occupancy by Educational Attainment in Crumpler
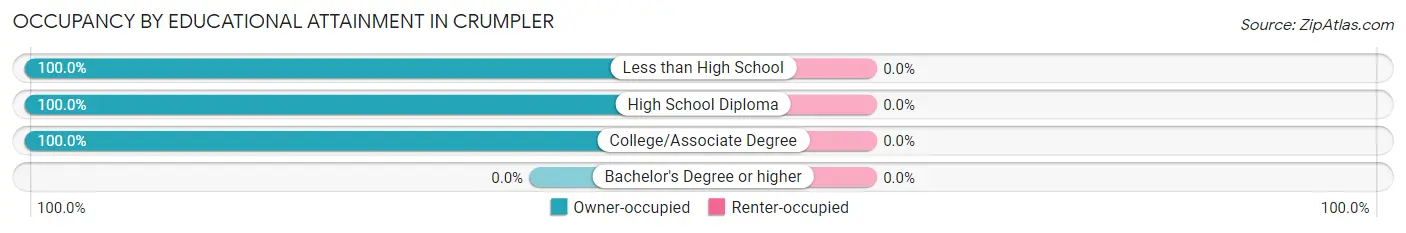
| Household Size | Owner-occupied | Renter-occupied |
| Less than High School | 8 (100.0%) | 0 (0.0%) |
| High School Diploma | 51 (100.0%) | 0 (0.0%) |
| College/Associate Degree | 62 (100.0%) | 0 (0.0%) |
| Bachelor's Degree or higher | 0 (0.0%) | 0 (0.0%) |
Occupancy by Age of Householder in Crumpler
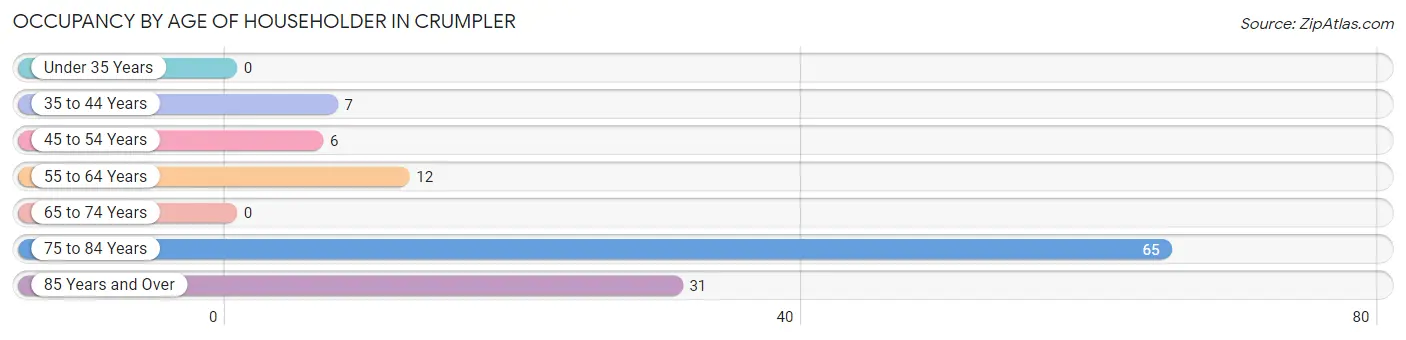
| Age Bracket | # Households | % Households |
| Under 35 Years | 0 | 0.0% |
| 35 to 44 Years | 7 | 5.8% |
| 45 to 54 Years | 6 | 5.0% |
| 55 to 64 Years | 12 | 9.9% |
| 65 to 74 Years | 0 | 0.0% |
| 75 to 84 Years | 65 | 53.7% |
| 85 Years and Over | 31 | 25.6% |
| Total | 121 | 100.0% |
Housing Finances in Crumpler
Median Income by Occupancy in Crumpler
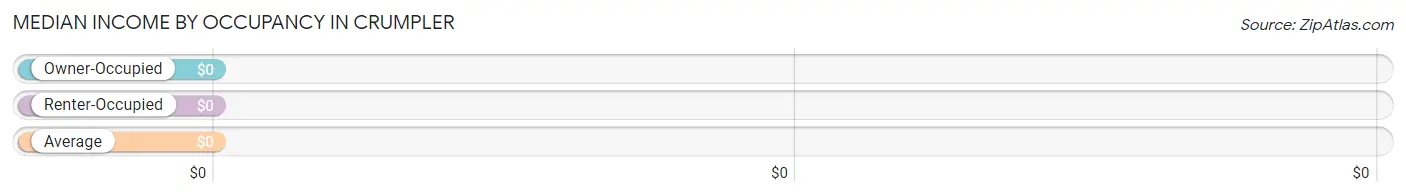
| Occupancy Type | # Households | Median Income |
| Owner-Occupied | 121 (100.0%) | $0 |
| Renter-Occupied | 0 (0.0%) | $0 |
| Average | 121 (100.0%) | $0 |
Occupancy by Householder Income Bracket in Crumpler
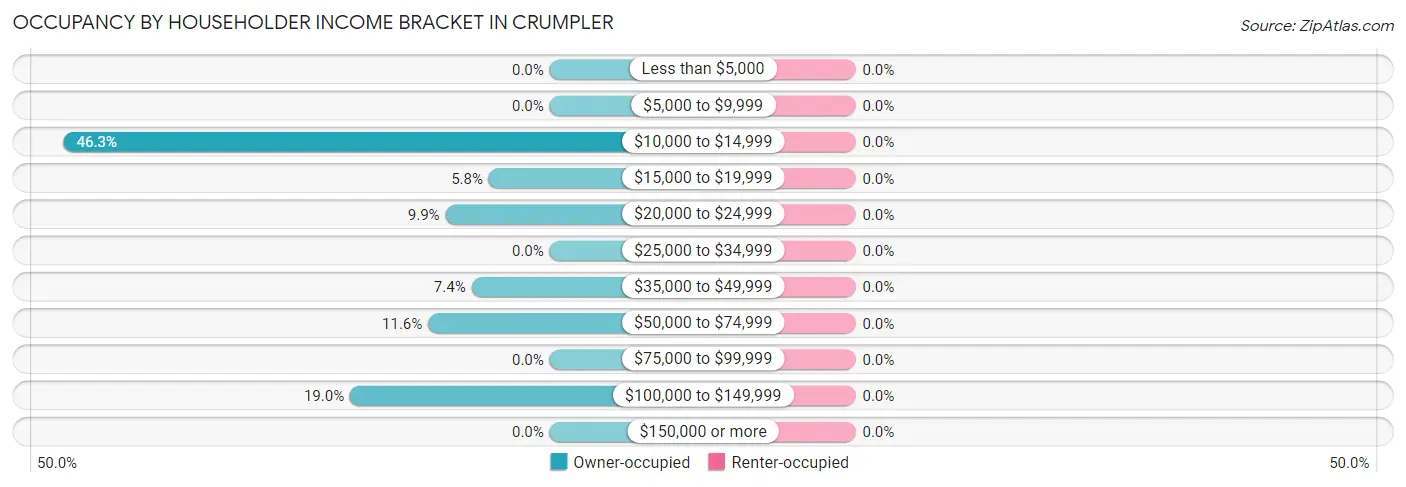
| Income Bracket | Owner-occupied | Renter-occupied |
| Less than $5,000 | 0 (0.0%) | 0 (0.0%) |
| $5,000 to $9,999 | 0 (0.0%) | 0 (0.0%) |
| $10,000 to $14,999 | 56 (46.3%) | 0 (0.0%) |
| $15,000 to $19,999 | 7 (5.8%) | 0 (0.0%) |
| $20,000 to $24,999 | 12 (9.9%) | 0 (0.0%) |
| $25,000 to $34,999 | 0 (0.0%) | 0 (0.0%) |
| $35,000 to $49,999 | 9 (7.4%) | 0 (0.0%) |
| $50,000 to $74,999 | 14 (11.6%) | 0 (0.0%) |
| $75,000 to $99,999 | 0 (0.0%) | 0 (0.0%) |
| $100,000 to $149,999 | 23 (19.0%) | 0 (0.0%) |
| $150,000 or more | 0 (0.0%) | 0 (0.0%) |
| Total | 121 (100.0%) | 0 (0.0%) |
Monthly Housing Cost Tiers in Crumpler
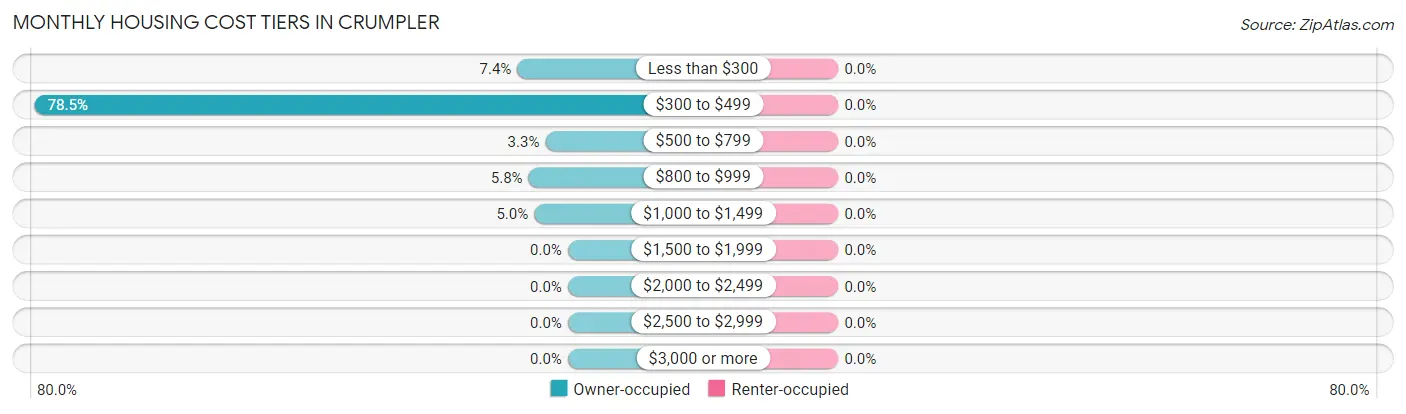
| Monthly Cost | Owner-occupied | Renter-occupied |
| Less than $300 | 9 (7.4%) | 0 (0.0%) |
| $300 to $499 | 95 (78.5%) | 0 (0.0%) |
| $500 to $799 | 4 (3.3%) | 0 (0.0%) |
| $800 to $999 | 7 (5.8%) | 0 (0.0%) |
| $1,000 to $1,499 | 6 (5.0%) | 0 (0.0%) |
| $1,500 to $1,999 | 0 (0.0%) | 0 (0.0%) |
| $2,000 to $2,499 | 0 (0.0%) | 0 (0.0%) |
| $2,500 to $2,999 | 0 (0.0%) | 0 (0.0%) |
| $3,000 or more | 0 (0.0%) | 0 (0.0%) |
| Total | 121 (100.0%) | 0 (0.0%) |
Physical Housing Characteristics in Crumpler
Housing Structures in Crumpler
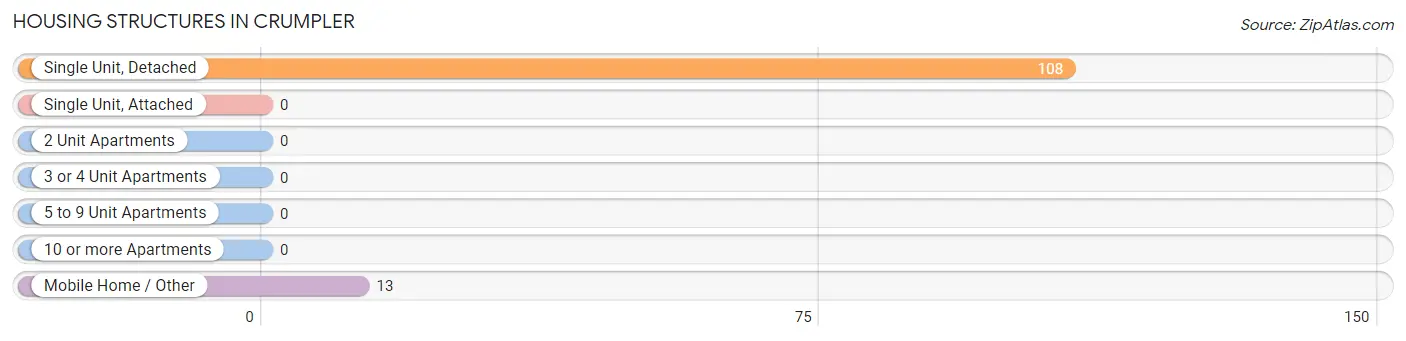
| Structure Type | # Housing Units | % Housing Units |
| Single Unit, Detached | 108 | 89.3% |
| Single Unit, Attached | 0 | 0.0% |
| 2 Unit Apartments | 0 | 0.0% |
| 3 or 4 Unit Apartments | 0 | 0.0% |
| 5 to 9 Unit Apartments | 0 | 0.0% |
| 10 or more Apartments | 0 | 0.0% |
| Mobile Home / Other | 13 | 10.7% |
| Total | 121 | 100.0% |
Housing Structures by Occupancy in Crumpler
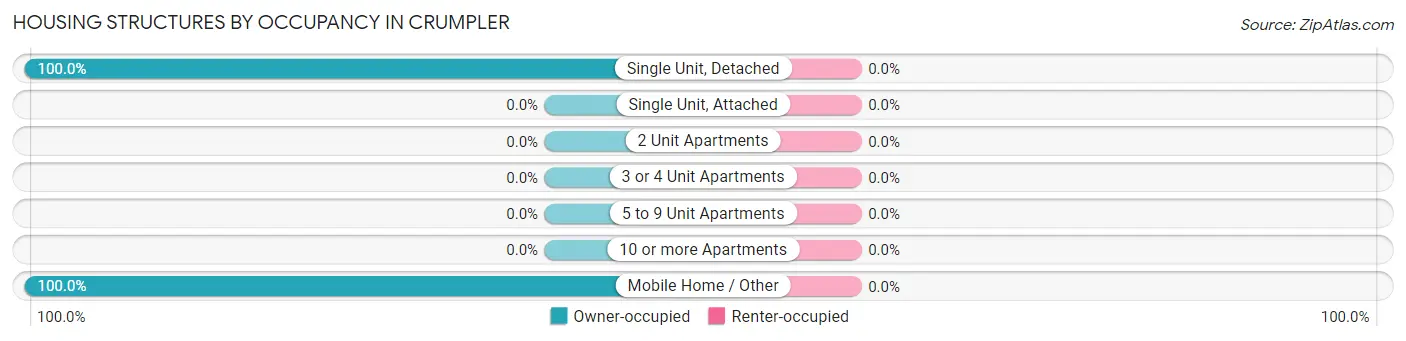
| Structure Type | Owner-occupied | Renter-occupied |
| Single Unit, Detached | 108 (100.0%) | 0 (0.0%) |
| Single Unit, Attached | 0 (0.0%) | 0 (0.0%) |
| 2 Unit Apartments | 0 (0.0%) | 0 (0.0%) |
| 3 or 4 Unit Apartments | 0 (0.0%) | 0 (0.0%) |
| 5 to 9 Unit Apartments | 0 (0.0%) | 0 (0.0%) |
| 10 or more Apartments | 0 (0.0%) | 0 (0.0%) |
| Mobile Home / Other | 13 (100.0%) | 0 (0.0%) |
| Total | 121 (100.0%) | 0 (0.0%) |
Housing Structures by Number of Rooms in Crumpler
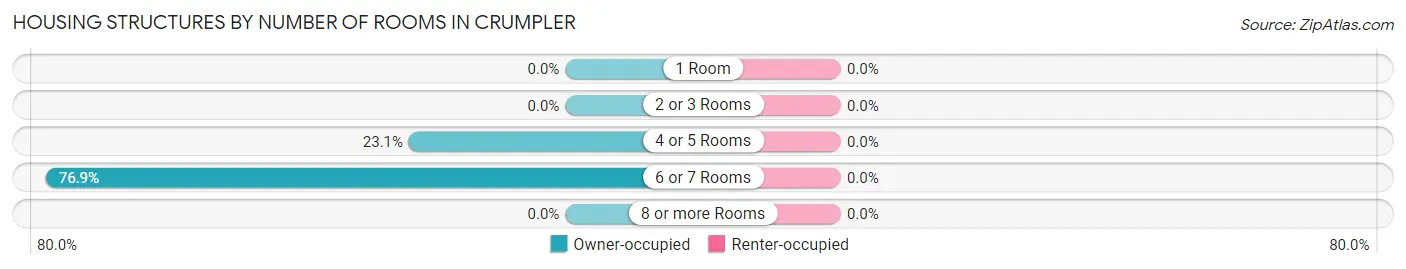
| Number of Rooms | Owner-occupied | Renter-occupied |
| 1 Room | 0 (0.0%) | 0 (0.0%) |
| 2 or 3 Rooms | 0 (0.0%) | 0 (0.0%) |
| 4 or 5 Rooms | 28 (23.1%) | 0 (0.0%) |
| 6 or 7 Rooms | 93 (76.9%) | 0 (0.0%) |
| 8 or more Rooms | 0 (0.0%) | 0 (0.0%) |
| Total | 121 (100.0%) | 0 (0.0%) |
Housing Structure by Heating Type in Crumpler
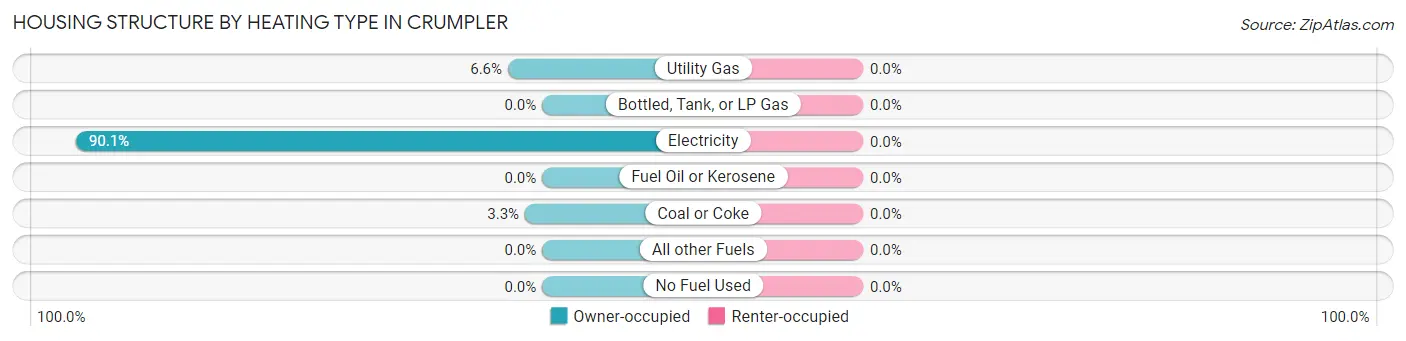
| Heating Type | Owner-occupied | Renter-occupied |
| Utility Gas | 8 (6.6%) | 0 (0.0%) |
| Bottled, Tank, or LP Gas | 0 (0.0%) | 0 (0.0%) |
| Electricity | 109 (90.1%) | 0 (0.0%) |
| Fuel Oil or Kerosene | 0 (0.0%) | 0 (0.0%) |
| Coal or Coke | 4 (3.3%) | 0 (0.0%) |
| All other Fuels | 0 (0.0%) | 0 (0.0%) |
| No Fuel Used | 0 (0.0%) | 0 (0.0%) |
| Total | 121 (100.0%) | 0 (0.0%) |
Household Vehicle Usage in Crumpler
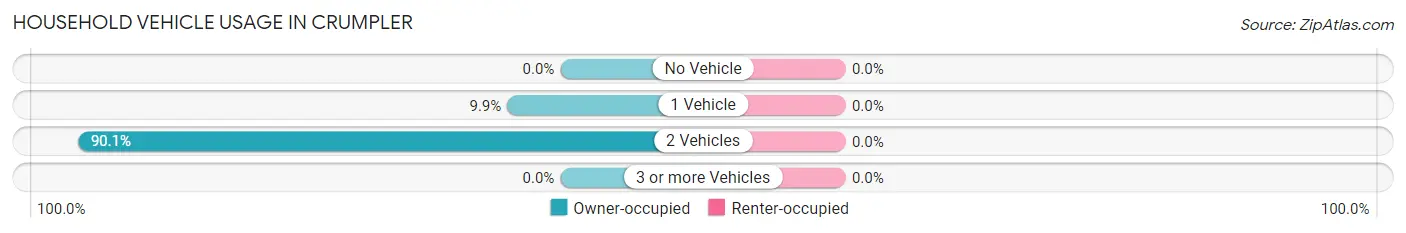
| Vehicles per Household | Owner-occupied | Renter-occupied |
| No Vehicle | 0 (0.0%) | 0 (0.0%) |
| 1 Vehicle | 12 (9.9%) | 0 (0.0%) |
| 2 Vehicles | 109 (90.1%) | 0 (0.0%) |
| 3 or more Vehicles | 0 (0.0%) | 0 (0.0%) |
| Total | 121 (100.0%) | 0 (0.0%) |
Real Estate & Mortgages in Crumpler
Real Estate and Mortgage Overview in Crumpler
| Characteristic | Without Mortgage | With Mortgage |
| Housing Units | 108 | 13 |
| Median Property Value | $85,200 | $0 |
| Median Household Income | - | - |
| Monthly Housing Costs | $370 | $0 |
| Real Estate Taxes | $376 | $7 |
Property Value by Mortgage Status in Crumpler
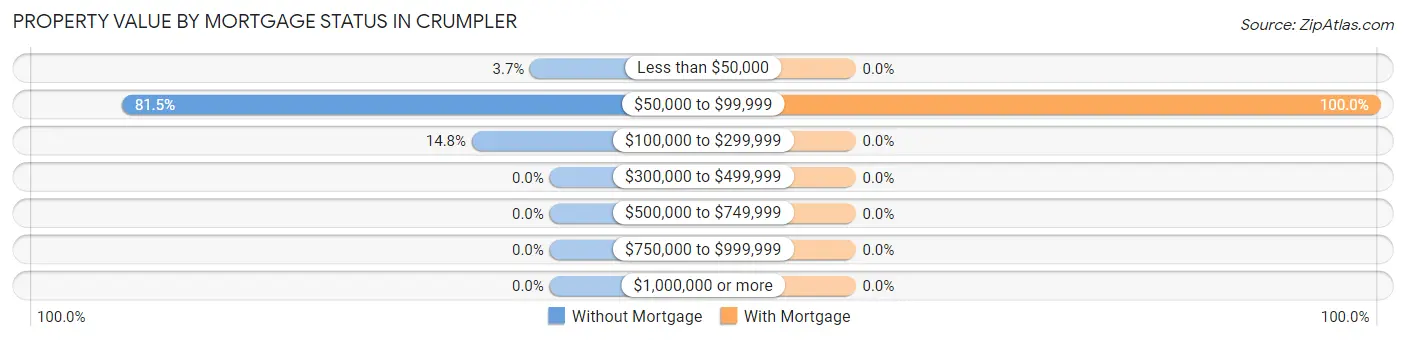
| Property Value | Without Mortgage | With Mortgage |
| Less than $50,000 | 4 (3.7%) | 0 (0.0%) |
| $50,000 to $99,999 | 88 (81.5%) | 13 (100.0%) |
| $100,000 to $299,999 | 16 (14.8%) | 0 (0.0%) |
| $300,000 to $499,999 | 0 (0.0%) | 0 (0.0%) |
| $500,000 to $749,999 | 0 (0.0%) | 0 (0.0%) |
| $750,000 to $999,999 | 0 (0.0%) | 0 (0.0%) |
| $1,000,000 or more | 0 (0.0%) | 0 (0.0%) |
| Total | 108 (100.0%) | 13 (100.0%) |
Household Income by Mortgage Status in Crumpler
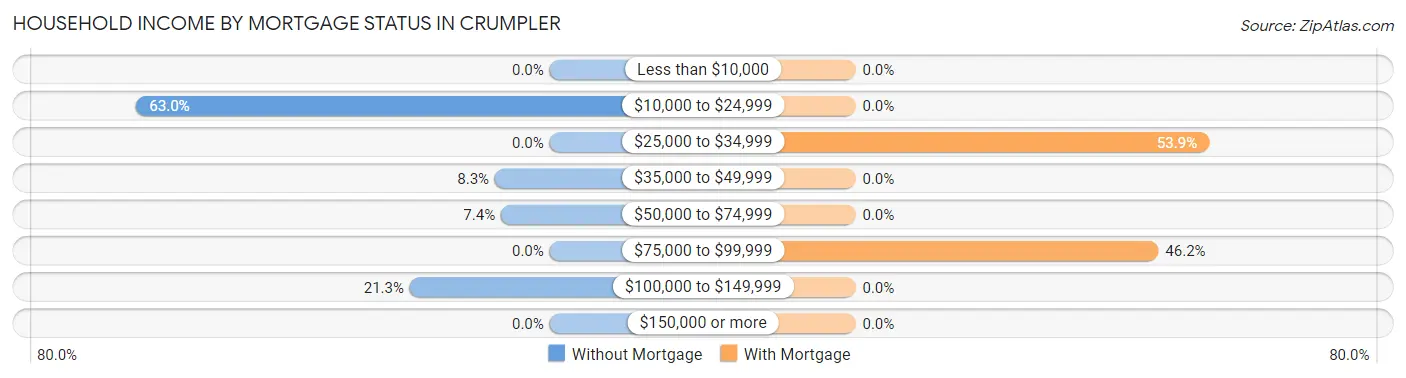
| Household Income | Without Mortgage | With Mortgage |
| Less than $10,000 | 0 (0.0%) | 0 (0.0%) |
| $10,000 to $24,999 | 68 (63.0%) | 0 (0.0%) |
| $25,000 to $34,999 | 0 (0.0%) | 7 (53.8%) |
| $35,000 to $49,999 | 9 (8.3%) | 0 (0.0%) |
| $50,000 to $74,999 | 8 (7.4%) | 0 (0.0%) |
| $75,000 to $99,999 | 0 (0.0%) | 6 (46.2%) |
| $100,000 to $149,999 | 23 (21.3%) | 0 (0.0%) |
| $150,000 or more | 0 (0.0%) | 0 (0.0%) |
| Total | 108 (100.0%) | 13 (100.0%) |
Property Value to Household Income Ratio in Crumpler
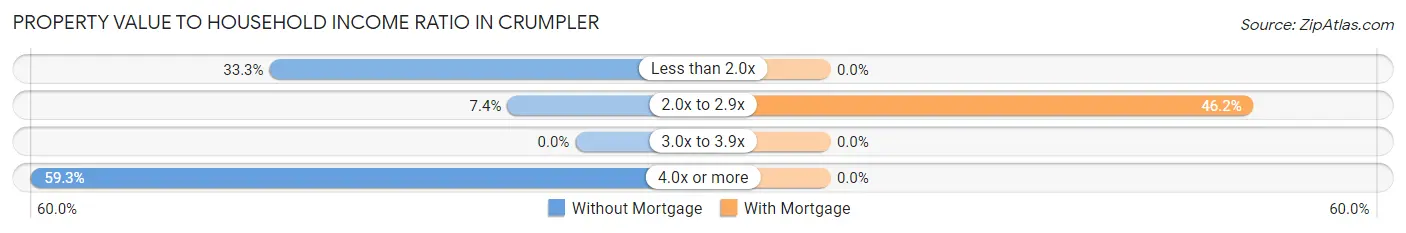
| Value-to-Income Ratio | Without Mortgage | With Mortgage |
| Less than 2.0x | 36 (33.3%) | 0 (0.0%) |
| 2.0x to 2.9x | 8 (7.4%) | 6 (46.2%) |
| 3.0x to 3.9x | 0 (0.0%) | 0 (0.0%) |
| 4.0x or more | 64 (59.3%) | 0 (0.0%) |
| Total | 108 (100.0%) | 13 (100.0%) |
Real Estate Taxes by Mortgage Status in Crumpler
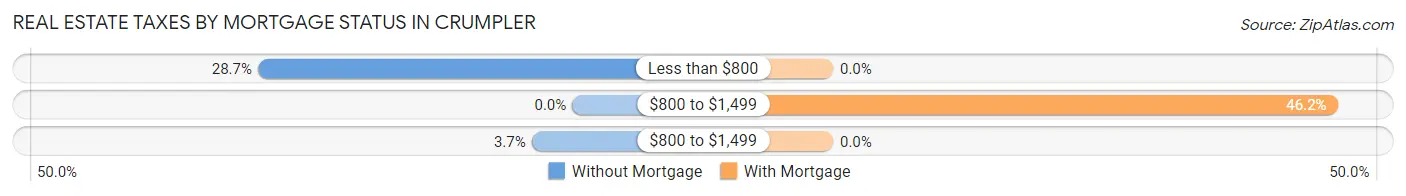
| Property Taxes | Without Mortgage | With Mortgage |
| Less than $800 | 31 (28.7%) | 0 (0.0%) |
| $800 to $1,499 | 0 (0.0%) | 6 (46.2%) |
| $800 to $1,499 | 4 (3.7%) | 0 (0.0%) |
| Total | 108 (100.0%) | 13 (100.0%) |
Health & Disability in Crumpler
Health Insurance Coverage by Age in Crumpler
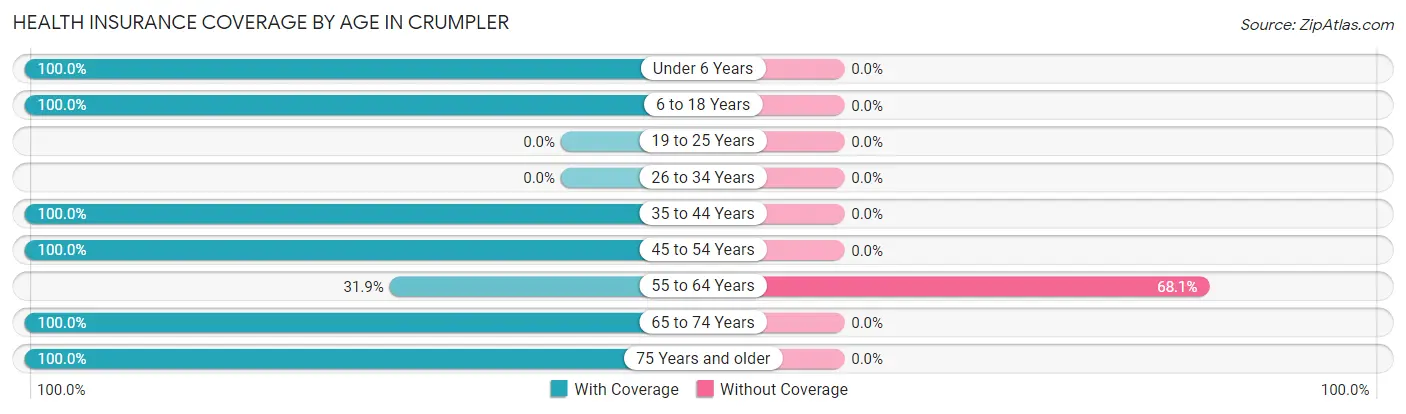
| Age Bracket | With Coverage | Without Coverage |
| Under 6 Years | 14 (100.0%) | 0 (0.0%) |
| 6 to 18 Years | 35 (100.0%) | 0 (0.0%) |
| 19 to 25 Years | 0 (0.0%) | 0 (0.0%) |
| 26 to 34 Years | 0 (0.0%) | 0 (0.0%) |
| 35 to 44 Years | 15 (100.0%) | 0 (0.0%) |
| 45 to 54 Years | 6 (100.0%) | 0 (0.0%) |
| 55 to 64 Years | 23 (31.9%) | 49 (68.1%) |
| 65 to 74 Years | 161 (100.0%) | 0 (0.0%) |
| 75 Years and older | 96 (100.0%) | 0 (0.0%) |
| Total | 350 (87.7%) | 49 (12.3%) |
Health Insurance Coverage by Citizenship Status in Crumpler
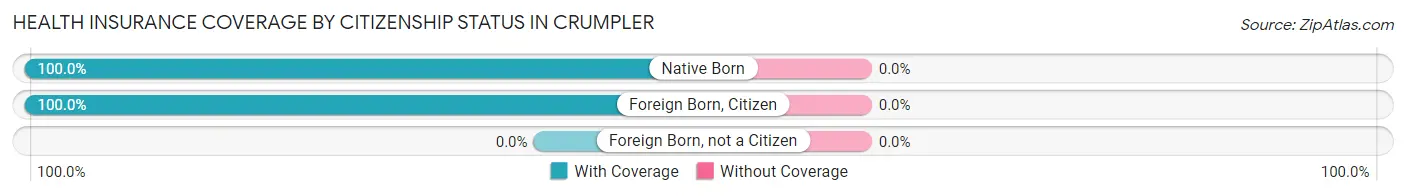
| Citizenship Status | With Coverage | Without Coverage |
| Native Born | 14 (100.0%) | 0 (0.0%) |
| Foreign Born, Citizen | 35 (100.0%) | 0 (0.0%) |
| Foreign Born, not a Citizen | 0 (0.0%) | 0 (0.0%) |
Health Insurance Coverage by Household Income in Crumpler
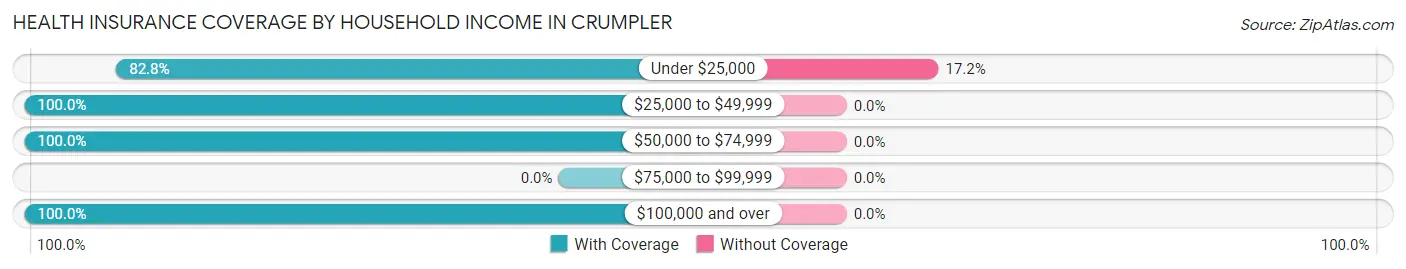
| Household Income | With Coverage | Without Coverage |
| Under $25,000 | 236 (82.8%) | 49 (17.2%) |
| $25,000 to $49,999 | 9 (100.0%) | 0 (0.0%) |
| $50,000 to $74,999 | 71 (100.0%) | 0 (0.0%) |
| $75,000 to $99,999 | 0 (0.0%) | 0 (0.0%) |
| $100,000 and over | 34 (100.0%) | 0 (0.0%) |
Public vs Private Health Insurance Coverage by Age in Crumpler
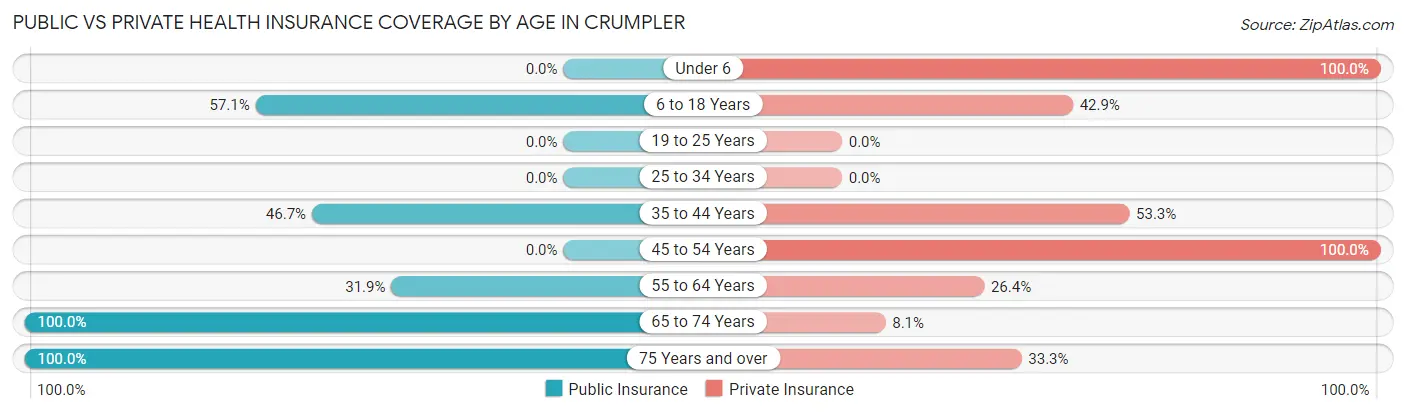
| Age Bracket | Public Insurance | Private Insurance |
| Under 6 | 0 (0.0%) | 14 (100.0%) |
| 6 to 18 Years | 20 (57.1%) | 15 (42.9%) |
| 19 to 25 Years | 0 (0.0%) | 0 (0.0%) |
| 25 to 34 Years | 0 (0.0%) | 0 (0.0%) |
| 35 to 44 Years | 7 (46.7%) | 8 (53.3%) |
| 45 to 54 Years | 0 (0.0%) | 6 (100.0%) |
| 55 to 64 Years | 23 (31.9%) | 19 (26.4%) |
| 65 to 74 Years | 161 (100.0%) | 13 (8.1%) |
| 75 Years and over | 96 (100.0%) | 32 (33.3%) |
| Total | 307 (76.9%) | 107 (26.8%) |
Disability Status by Sex by Age in Crumpler
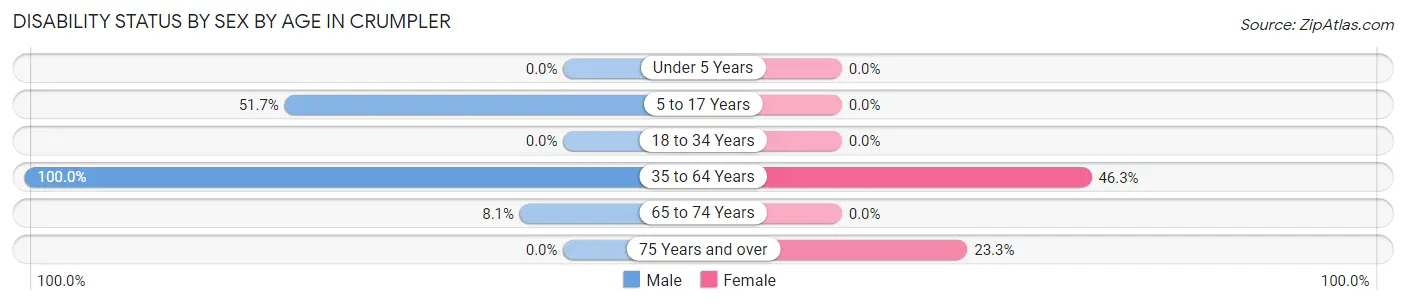
| Age Bracket | Male | Female |
| Under 5 Years | 0 (0.0%) | 0 (0.0%) |
| 5 to 17 Years | 15 (51.7%) | 0 (0.0%) |
| 18 to 34 Years | 0 (0.0%) | 0 (0.0%) |
| 35 to 64 Years | 52 (100.0%) | 19 (46.3%) |
| 65 to 74 Years | 13 (8.1%) | 0 (0.0%) |
| 75 Years and over | 0 (0.0%) | 17 (23.3%) |
Disability Class by Sex by Age in Crumpler
Disability Class: Hearing Difficulty
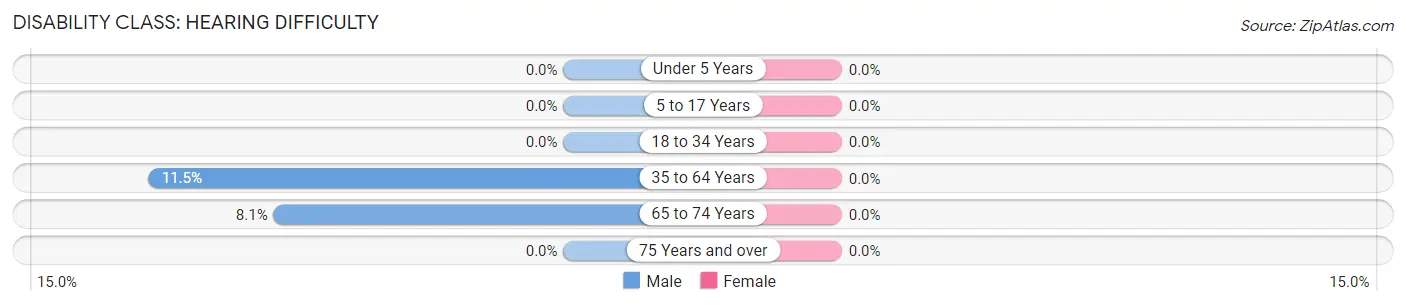
| Age Bracket | Male | Female |
| Under 5 Years | 0 (0.0%) | 0 (0.0%) |
| 5 to 17 Years | 0 (0.0%) | 0 (0.0%) |
| 18 to 34 Years | 0 (0.0%) | 0 (0.0%) |
| 35 to 64 Years | 6 (11.5%) | 0 (0.0%) |
| 65 to 74 Years | 13 (8.1%) | 0 (0.0%) |
| 75 Years and over | 0 (0.0%) | 0 (0.0%) |
Disability Class: Vision Difficulty
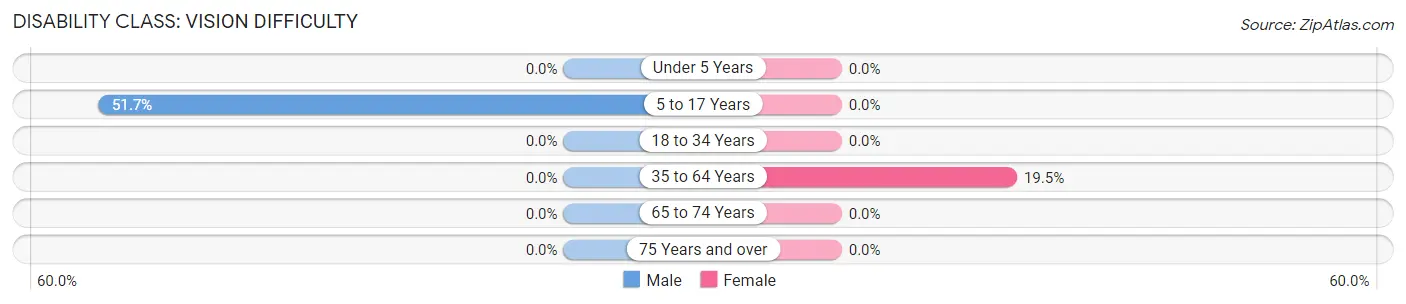
| Age Bracket | Male | Female |
| Under 5 Years | 0 (0.0%) | 0 (0.0%) |
| 5 to 17 Years | 15 (51.7%) | 0 (0.0%) |
| 18 to 34 Years | 0 (0.0%) | 0 (0.0%) |
| 35 to 64 Years | 0 (0.0%) | 8 (19.5%) |
| 65 to 74 Years | 0 (0.0%) | 0 (0.0%) |
| 75 Years and over | 0 (0.0%) | 0 (0.0%) |
Disability Class: Cognitive Difficulty
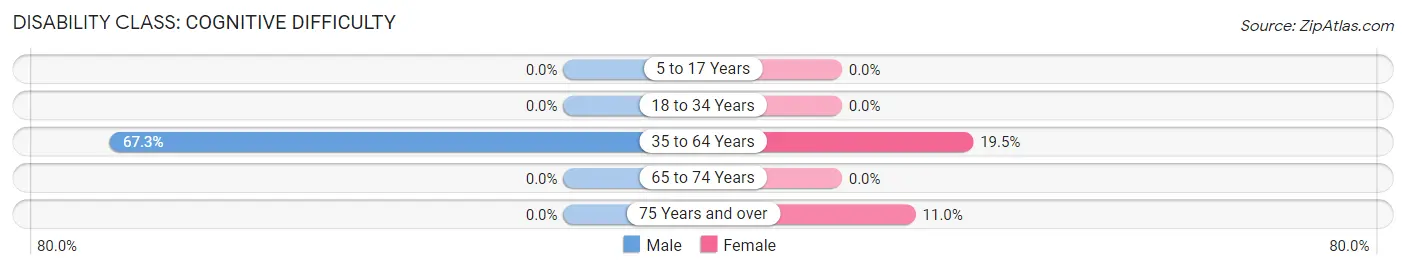
| Age Bracket | Male | Female |
| 5 to 17 Years | 0 (0.0%) | 0 (0.0%) |
| 18 to 34 Years | 0 (0.0%) | 0 (0.0%) |
| 35 to 64 Years | 35 (67.3%) | 8 (19.5%) |
| 65 to 74 Years | 0 (0.0%) | 0 (0.0%) |
| 75 Years and over | 0 (0.0%) | 8 (11.0%) |
Disability Class: Ambulatory Difficulty
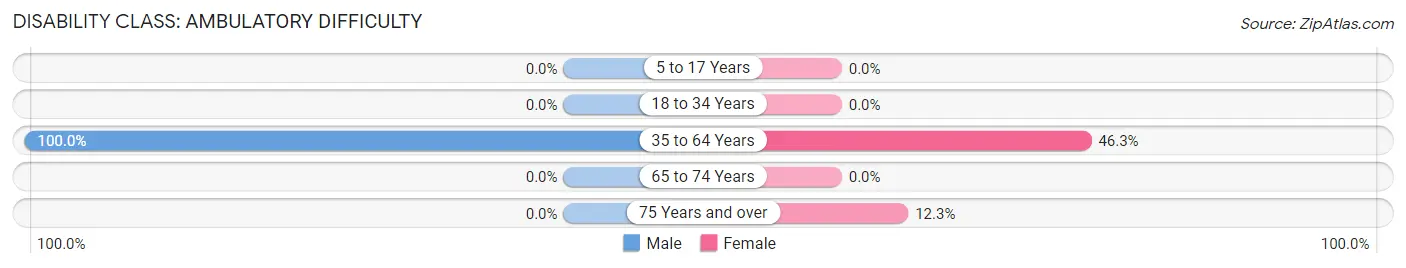
| Age Bracket | Male | Female |
| 5 to 17 Years | 0 (0.0%) | 0 (0.0%) |
| 18 to 34 Years | 0 (0.0%) | 0 (0.0%) |
| 35 to 64 Years | 52 (100.0%) | 19 (46.3%) |
| 65 to 74 Years | 0 (0.0%) | 0 (0.0%) |
| 75 Years and over | 0 (0.0%) | 9 (12.3%) |
Disability Class: Self-Care Difficulty
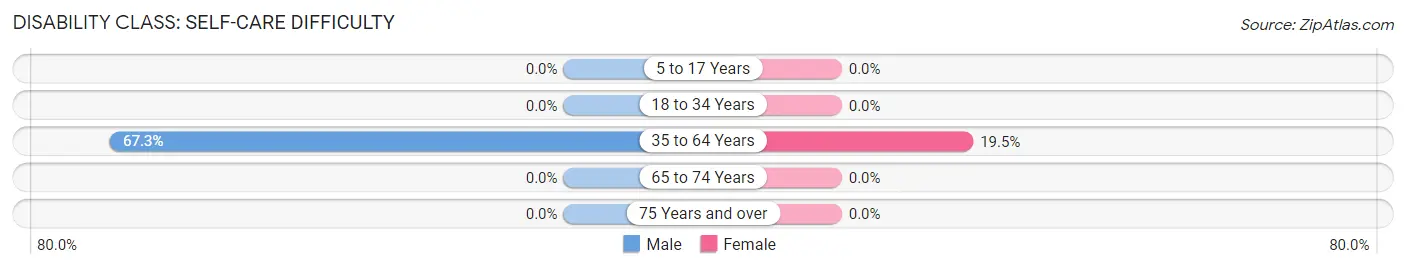
| Age Bracket | Male | Female |
| 5 to 17 Years | 0 (0.0%) | 0 (0.0%) |
| 18 to 34 Years | 0 (0.0%) | 0 (0.0%) |
| 35 to 64 Years | 35 (67.3%) | 8 (19.5%) |
| 65 to 74 Years | 0 (0.0%) | 0 (0.0%) |
| 75 Years and over | 0 (0.0%) | 0 (0.0%) |
Technology Access in Crumpler
Computing Device Access in Crumpler
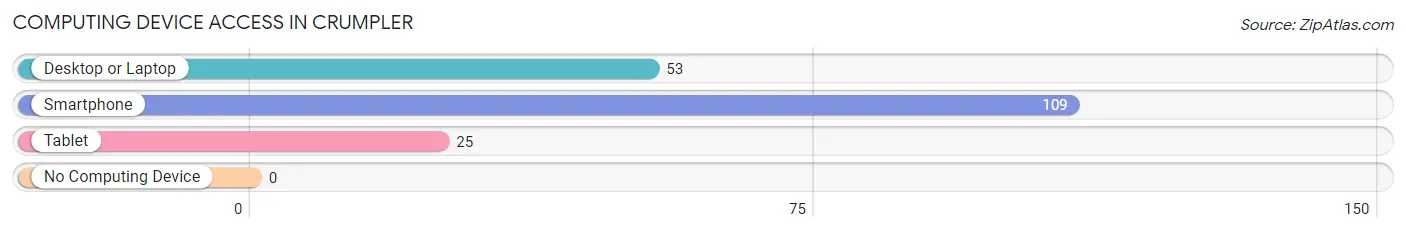
| Device Type | # Households | % Households |
| Desktop or Laptop | 53 | 43.8% |
| Smartphone | 109 | 90.1% |
| Tablet | 25 | 20.7% |
| No Computing Device | 0 | 0.0% |
| Total | 121 | 100.0% |
Internet Access in Crumpler
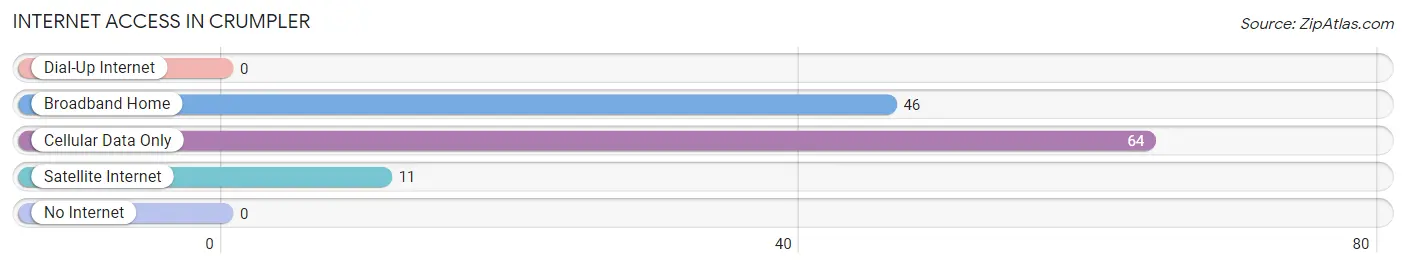
| Internet Type | # Households | % Households |
| Dial-Up Internet | 0 | 0.0% |
| Broadband Home | 46 | 38.0% |
| Cellular Data Only | 64 | 52.9% |
| Satellite Internet | 11 | 9.1% |
| No Internet | 0 | 0.0% |
| Total | 121 | 100.0% |
Crumpler Summary
Crumpler is a small unincorporated community located in McDowell County, West Virginia. It is situated in the Appalachian Mountains, and is surrounded by the towns of Welch, Gary, and Northfork. The population of Crumpler was estimated to be around 200 people in 2020.
History
Crumpler was founded in the late 19th century by the Crumpler family, who were originally from North Carolina. The family moved to the area in search of better economic opportunities, and the town was named after them. The town was originally a coal mining town, and the Crumpler family owned several coal mines in the area. The town was also home to a post office, a general store, and a school.
Geography
Crumpler is located in the Appalachian Mountains, and is surrounded by the towns of Welch, Gary, and Northfork. The town is situated at an elevation of 2,400 feet, and is located in a valley between two mountains. The town is located near the Tug Fork River, and is approximately 10 miles from the Virginia border.
Economy
Crumpler’s economy is largely based on coal mining. The town was originally a coal mining town, and the Crumpler family owned several coal mines in the area. The town is also home to a post office, a general store, and a school.
Demographics
Crumpler is a small unincorporated community with an estimated population of 200 people in 2020. The town is predominantly white, with a small minority population. The median household income in Crumpler is $25,000, and the median age is 40 years old. The town has a high poverty rate, with nearly 40% of the population living below the poverty line.
Common Questions
What is Per Capita Income in Crumpler?
Per Capita income in Crumpler is $14,787.
What is Inequality or Gini Index in Crumpler?
Inequality or Gini Index in Crumpler is 0.50.
What is the Total Population of Crumpler?
Total Population of Crumpler is 399.
What is the Total Male Population of Crumpler?
Total Male Population of Crumpler is 265.
What is the Total Female Population of Crumpler?
Total Female Population of Crumpler is 134.
What is the Ratio of Males per 100 Females in Crumpler?
There are 197.76 Males per 100 Females in Crumpler.
What is the Ratio of Females per 100 Males in Crumpler?
There are 50.57 Females per 100 Males in Crumpler.
What is the Median Population Age in Crumpler?
Median Population Age in Crumpler is 68.4 Years.
What is the Average Family Size in Crumpler
Average Family Size in Crumpler is 3.2 People.
What is the Average Household Size in Crumpler
Average Household Size in Crumpler is 3.3 People.
How Large is the Labor Force in Crumpler?
There are 8 People in the Labor Forcein in Crumpler.
What is the Percentage of People in the Labor Force in Crumpler?
2.2% of People are in the Labor Force in Crumpler.