Bull Hollow, OK Map & Demographics
Bull Hollow Map
Bull Hollow Overview
$57,905
PER CAPITA INCOME
0.01
INEQUALITY / GINI INDEX
125
TOTAL POPULATION
96
MALE POPULATION
29
FEMALE POPULATION
331.03
MALES / 100 FEMALES
30.21
FEMALES / 100 MALES
39.9
MEDIAN AGE
3.3
AVG FAMILY SIZE
3.3
AVG HOUSEHOLD SIZE
86
LABOR FORCE [ PEOPLE ]
68.8%
PERCENT IN LABOR FORCE
45.3%
UNEMPLOYMENT RATE
Income in Bull Hollow
Income Overview in Bull Hollow
| Characteristic | Number | Measure |
| Per Capita Income | 125 | $57,905 |
| Median Family Income | 38 | $0 |
| Mean Family Income | 38 | $0 |
| Median Household Income | 38 | $0 |
| Mean Household Income | 38 | $0 |
| Income Deficit | 38 | $0 |
| Wage / Income Gap (%) | 125 | 0.00% |
| Wage / Income Gap ($) | 125 | 100.00¢ per $1 |
| Gini / Inequality Index | 125 | 0.01 |
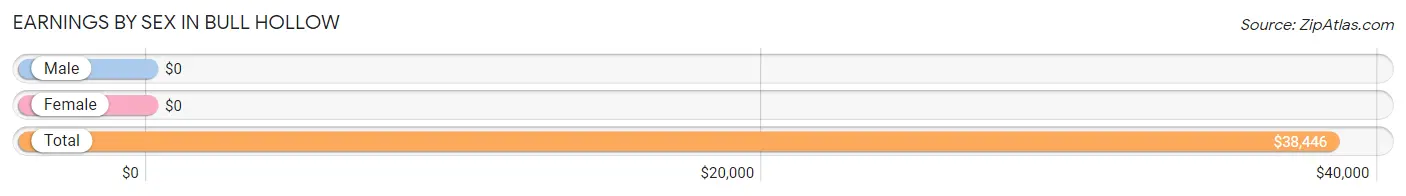
Earnings by Sex in Bull Hollow
| Sex | Number | Average Earnings |
| Male | 56 (66.7%) | $0 |
| Female | 28 (33.3%) | $0 |
| Total | 84 (100.0%) | $38,446 |
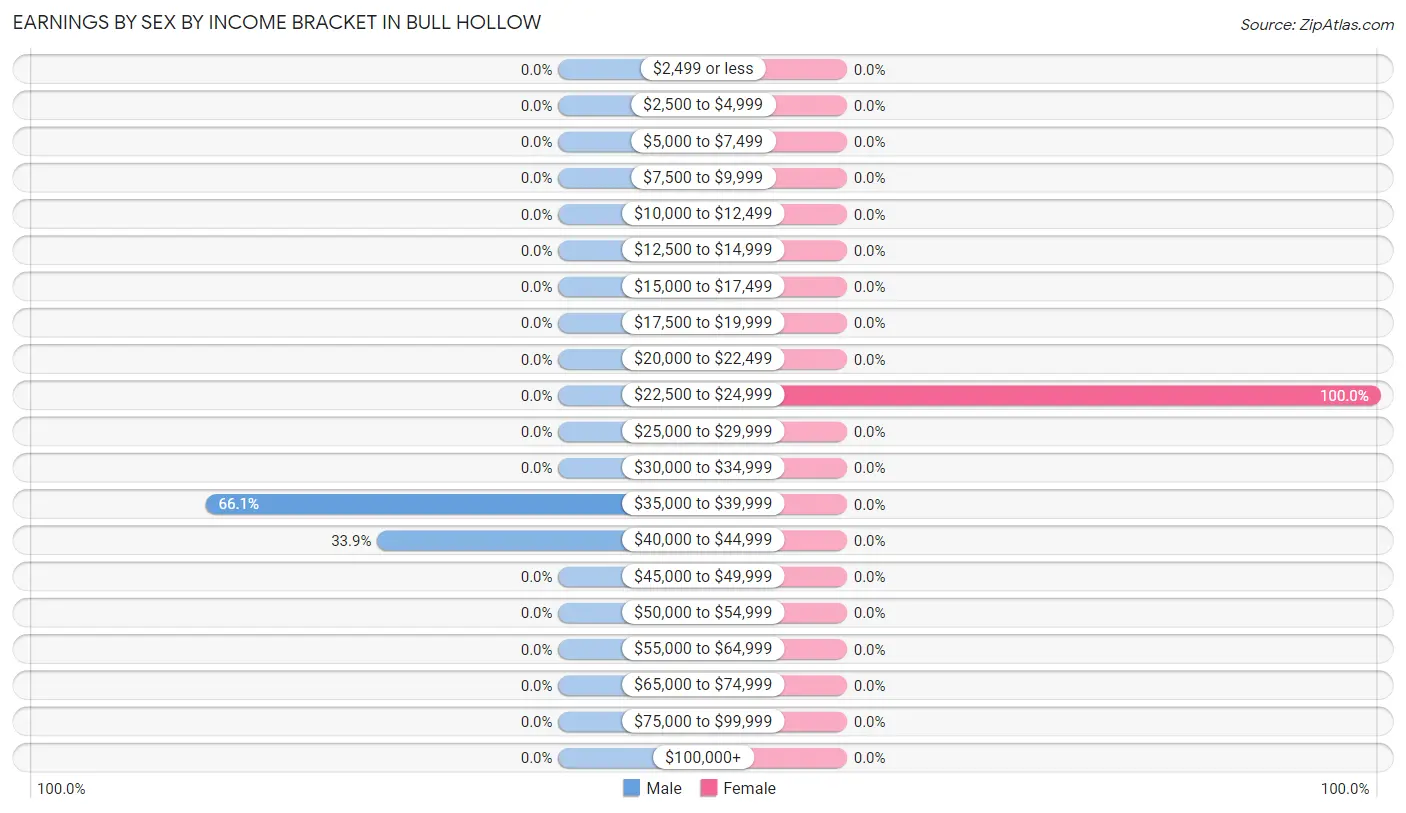
Earnings by Sex by Income Bracket in Bull Hollow
The most common earnings brackets in Bull Hollow are $35,000 to $39,999 for men (37 | 66.1%) and $22,500 to $24,999 for women (28 | 100.0%).
| Income | Male | Female |
| $2,499 or less | 0 (0.0%) | 0 (0.0%) |
| $2,500 to $4,999 | 0 (0.0%) | 0 (0.0%) |
| $5,000 to $7,499 | 0 (0.0%) | 0 (0.0%) |
| $7,500 to $9,999 | 0 (0.0%) | 0 (0.0%) |
| $10,000 to $12,499 | 0 (0.0%) | 0 (0.0%) |
| $12,500 to $14,999 | 0 (0.0%) | 0 (0.0%) |
| $15,000 to $17,499 | 0 (0.0%) | 0 (0.0%) |
| $17,500 to $19,999 | 0 (0.0%) | 0 (0.0%) |
| $20,000 to $22,499 | 0 (0.0%) | 0 (0.0%) |
| $22,500 to $24,999 | 0 (0.0%) | 28 (100.0%) |
| $25,000 to $29,999 | 0 (0.0%) | 0 (0.0%) |
| $30,000 to $34,999 | 0 (0.0%) | 0 (0.0%) |
| $35,000 to $39,999 | 37 (66.1%) | 0 (0.0%) |
| $40,000 to $44,999 | 19 (33.9%) | 0 (0.0%) |
| $45,000 to $49,999 | 0 (0.0%) | 0 (0.0%) |
| $50,000 to $54,999 | 0 (0.0%) | 0 (0.0%) |
| $55,000 to $64,999 | 0 (0.0%) | 0 (0.0%) |
| $65,000 to $74,999 | 0 (0.0%) | 0 (0.0%) |
| $75,000 to $99,999 | 0 (0.0%) | 0 (0.0%) |
| $100,000+ | 0 (0.0%) | 0 (0.0%) |
| Total | 56 (100.0%) | 28 (100.0%) |
Earnings by Sex by Educational Attainment in Bull Hollow
| Educational Attainment | Male Income | Female Income |
| Less than High School | - | - |
| High School Diploma | - | - |
| College or Associate's Degree | - | - |
| Bachelor's Degree | - | - |
| Graduate Degree | - | - |
| Total | - | - |
Family Income in Bull Hollow
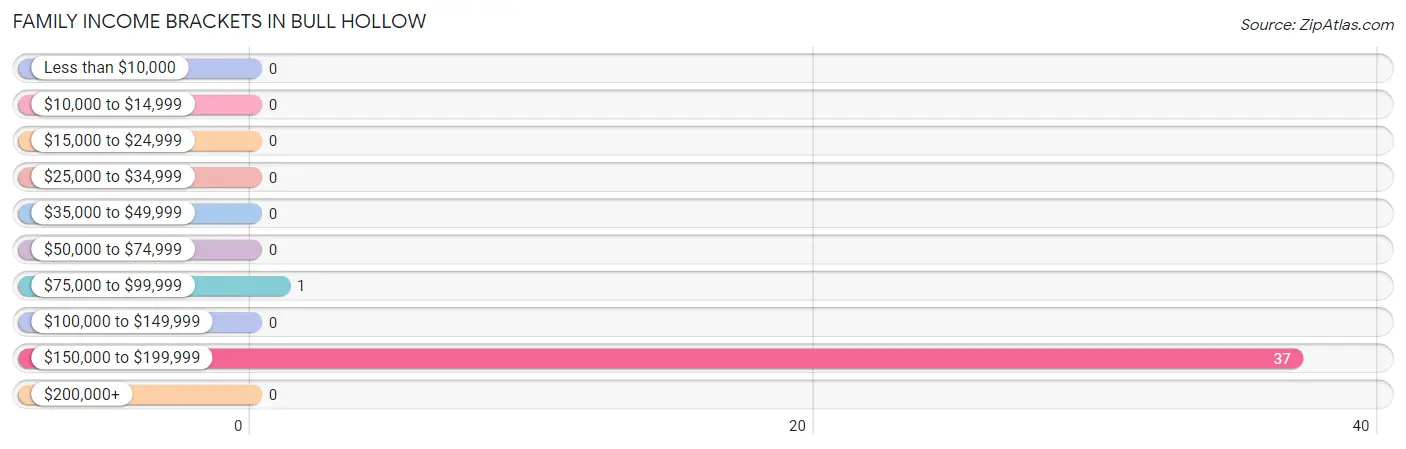
Family Income Brackets in Bull Hollow
According to the Bull Hollow family income data, there are 37 families falling into the $150,000 to $199,999 income range, which is the most common income bracket and makes up 97.4% of all families.
| Income Bracket | # Families | % Families |
| Less than $10,000 | 0 | 0.0% |
| $10,000 to $14,999 | 0 | 0.0% |
| $15,000 to $24,999 | 0 | 0.0% |
| $25,000 to $34,999 | 0 | 0.0% |
| $35,000 to $49,999 | 0 | 0.0% |
| $50,000 to $74,999 | 0 | 0.0% |
| $75,000 to $99,999 | 1 | 2.6% |
| $100,000 to $149,999 | 0 | 0.0% |
| $150,000 to $199,999 | 37 | 97.4% |
| $200,000+ | 0 | 0.0% |
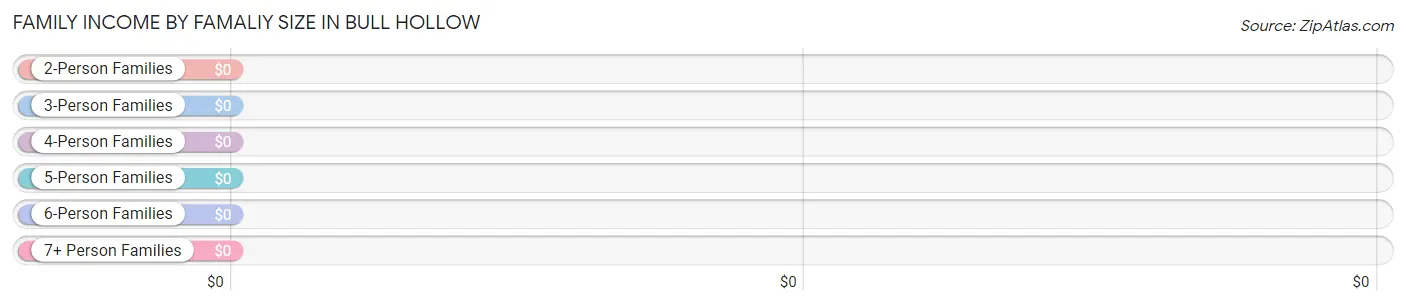
Family Income by Famaliy Size in Bull Hollow
| Income Bracket | # Families | Median Income |
| 2-Person Families | 37 (97.4%) | $0 |
| 3-Person Families | 0 (0.0%) | $0 |
| 4-Person Families | 1 (2.6%) | $0 |
| 5-Person Families | 0 (0.0%) | $0 |
| 6-Person Families | 0 (0.0%) | $0 |
| 7+ Person Families | 0 (0.0%) | $0 |
| Total | 38 (100.0%) | $0 |
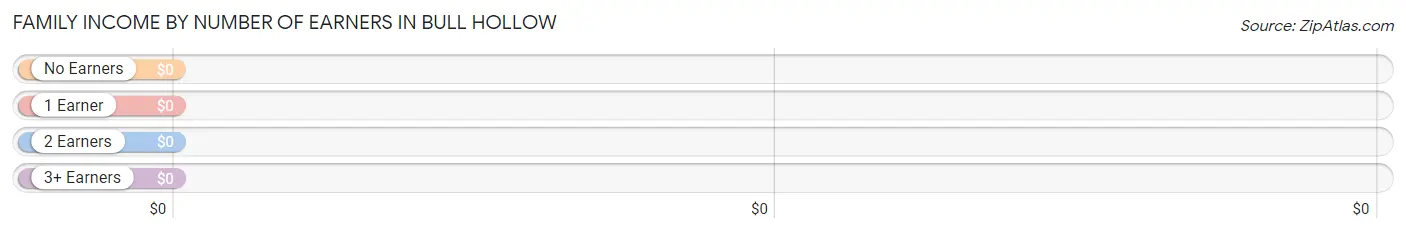
Family Income by Number of Earners in Bull Hollow
| Number of Earners | # Families | Median Income |
| No Earners | 0 (0.0%) | $0 |
| 1 Earner | 37 (97.4%) | $0 |
| 2 Earners | 1 (2.6%) | $0 |
| 3+ Earners | 0 (0.0%) | $0 |
| Total | 38 (100.0%) | $0 |
Household Income in Bull Hollow
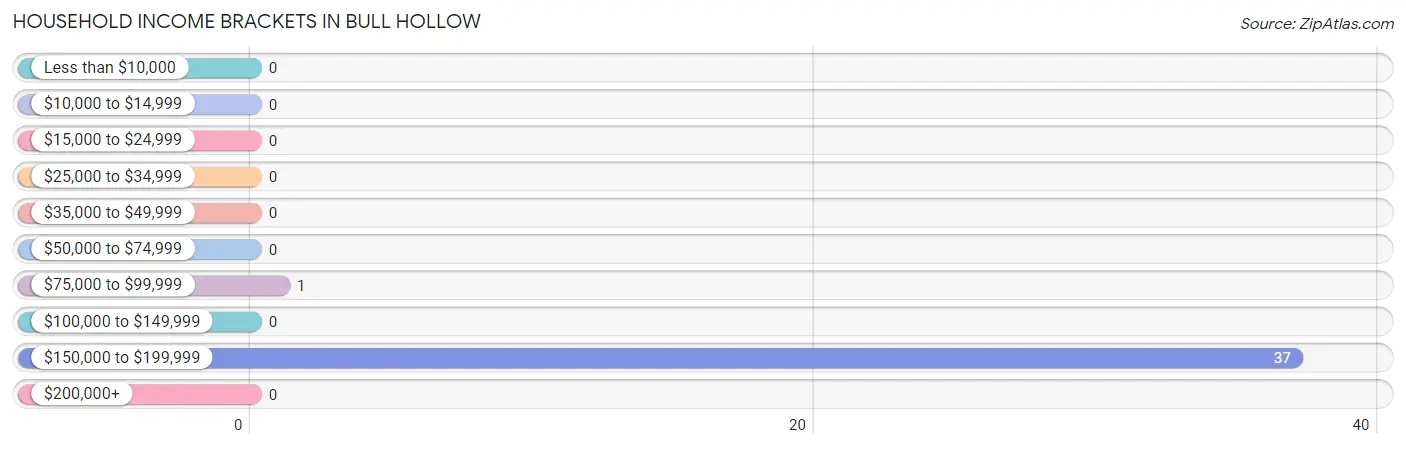
Household Income Brackets in Bull Hollow
With 37 households falling in the category, the $150,000 to $199,999 income range is the most frequent in Bull Hollow, accounting for 97.4% of all households.
| Income Bracket | # Households | % Households |
| Less than $10,000 | 0 | 0.0% |
| $10,000 to $14,999 | 0 | 0.0% |
| $15,000 to $24,999 | 0 | 0.0% |
| $25,000 to $34,999 | 0 | 0.0% |
| $35,000 to $49,999 | 0 | 0.0% |
| $50,000 to $74,999 | 0 | 0.0% |
| $75,000 to $99,999 | 1 | 2.6% |
| $100,000 to $149,999 | 0 | 0.0% |
| $150,000 to $199,999 | 37 | 97.4% |
| $200,000+ | 0 | 0.0% |
Household Income by Householder Age in Bull Hollow
| Income Bracket | # Households | Median Income |
| 15 to 24 Years | 0 (0.0%) | $0 |
| 25 to 44 Years | 0 (0.0%) | $0 |
| 45 to 64 Years | 0 (0.0%) | $0 |
| 65+ Years | 38 (100.0%) | $0 |
| Total | 38 (100.0%) | $0 |
Poverty in Bull Hollow
Income Below Poverty by Sex and Age in Bull Hollow
| Age Bracket | Male | Female |
| Under 5 Years | 0 (0.0%) | 0 (0.0%) |
| 5 Years | 0 (0.0%) | 0 (0.0%) |
| 6 to 11 Years | 0 (0.0%) | 0 (0.0%) |
| 12 to 14 Years | 0 (0.0%) | 0 (0.0%) |
| 15 Years | 0 (0.0%) | 0 (0.0%) |
| 16 and 17 Years | 0 (0.0%) | 0 (0.0%) |
| 18 to 24 Years | 0 (0.0%) | 0 (0.0%) |
| 25 to 34 Years | 0 (0.0%) | 0 (0.0%) |
| 35 to 44 Years | 0 (0.0%) | 0 (0.0%) |
| 45 to 54 Years | 0 (0.0%) | 0 (0.0%) |
| 55 to 64 Years | 0 (0.0%) | 0 (0.0%) |
| 65 to 74 Years | 0 (0.0%) | 0 (0.0%) |
| 75 Years and over | 0 (0.0%) | 0 (0.0%) |
| Total | 0 (0.0%) | 0 (0.0%) |
Income Above Poverty by Sex and Age in Bull Hollow
According to the poverty statistics in Bull Hollow, males aged 35 to 44 years and females aged 25 to 34 years are the age groups that are most secure financially, with 100.0% of males and 100.0% of females in these age groups living above the poverty line.
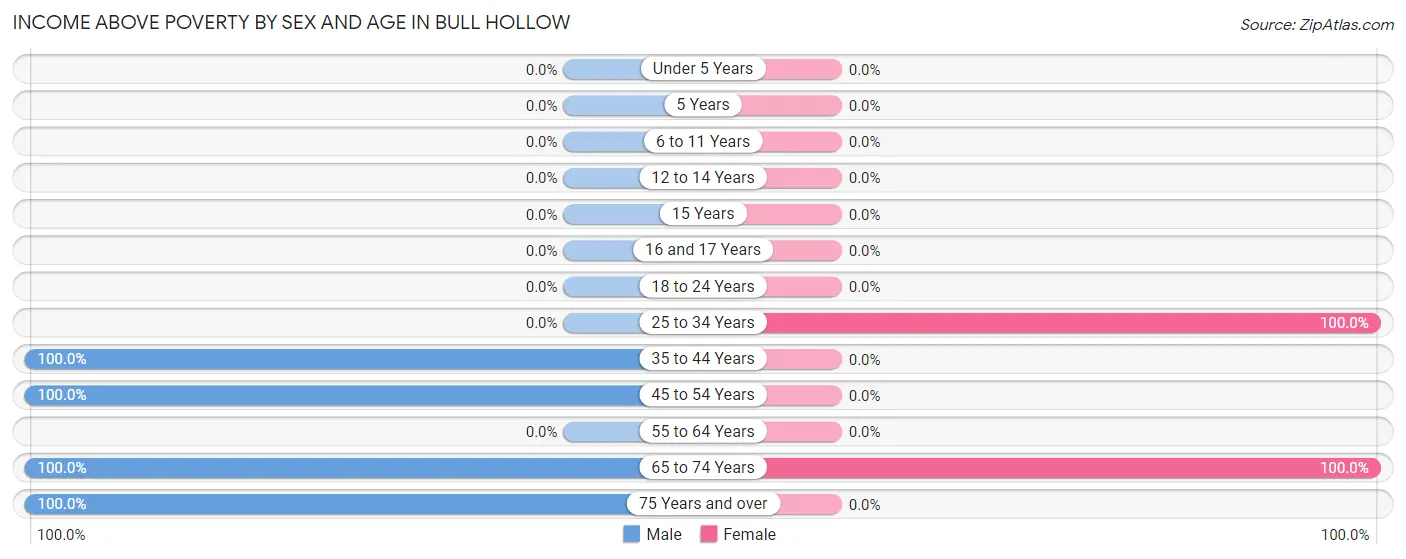
| Age Bracket | Male | Female |
| Under 5 Years | 0 (0.0%) | 0 (0.0%) |
| 5 Years | 0 (0.0%) | 0 (0.0%) |
| 6 to 11 Years | 0 (0.0%) | 0 (0.0%) |
| 12 to 14 Years | 0 (0.0%) | 0 (0.0%) |
| 15 Years | 0 (0.0%) | 0 (0.0%) |
| 16 and 17 Years | 0 (0.0%) | 0 (0.0%) |
| 18 to 24 Years | 0 (0.0%) | 0 (0.0%) |
| 25 to 34 Years | 0 (0.0%) | 28 (100.0%) |
| 35 to 44 Years | 39 (100.0%) | 0 (0.0%) |
| 45 to 54 Years | 19 (100.0%) | 0 (0.0%) |
| 55 to 64 Years | 0 (0.0%) | 0 (0.0%) |
| 65 to 74 Years | 37 (100.0%) | 1 (100.0%) |
| 75 Years and over | 1 (100.0%) | 0 (0.0%) |
| Total | 96 (100.0%) | 29 (100.0%) |
Income Below Poverty Among Married-Couple Families in Bull Hollow
| Children | Above Poverty | Below Poverty |
| No Children | 37 (100.0%) | 0 (0.0%) |
| 1 or 2 Children | 0 (0.0%) | 0 (0.0%) |
| 3 or 4 Children | 0 (0.0%) | 0 (0.0%) |
| 5 or more Children | 0 (0.0%) | 0 (0.0%) |
| Total | 37 (100.0%) | 0 (0.0%) |
Income Below Poverty Among Single-Parent Households in Bull Hollow
| Children | Single Father | Single Mother |
| No Children | 0 (0.0%) | 0 (0.0%) |
| 1 or 2 Children | 0 (0.0%) | 0 (0.0%) |
| 3 or 4 Children | 0 (0.0%) | 0 (0.0%) |
| 5 or more Children | 0 (0.0%) | 0 (0.0%) |
| Total | 0 (0.0%) | 0 (0.0%) |
Income Below Poverty Among Married-Couple vs Single-Parent Households in Bull Hollow
| Children | Married-Couple Families | Single-Parent Households |
| No Children | 0 (0.0%) | 0 (0.0%) |
| 1 or 2 Children | 0 (0.0%) | 0 (0.0%) |
| 3 or 4 Children | 0 (0.0%) | 0 (0.0%) |
| 5 or more Children | 0 (0.0%) | 0 (0.0%) |
| Total | 0 (0.0%) | 0 (0.0%) |
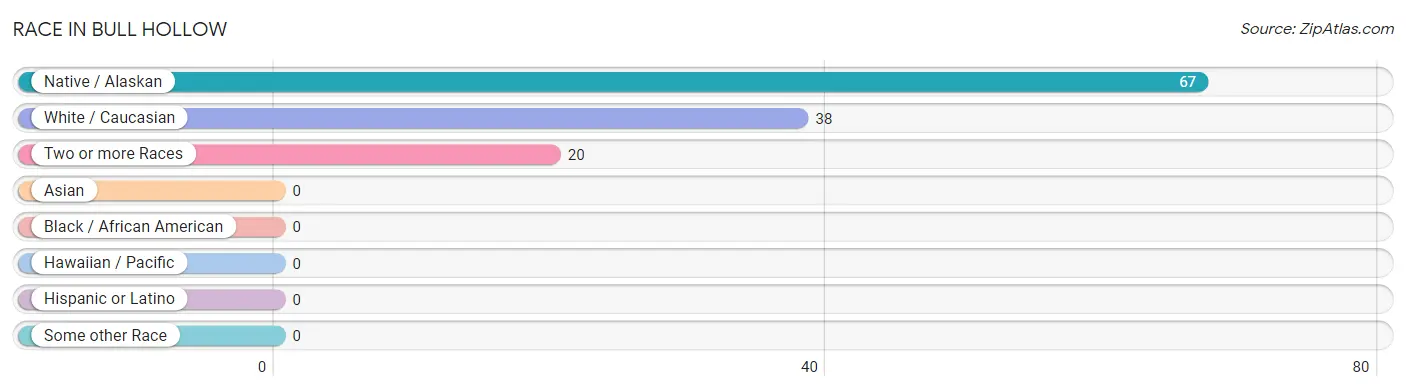
Race in Bull Hollow
The most populous races in Bull Hollow are Native / Alaskan (67 | 53.6%), White / Caucasian (38 | 30.4%), and Two or more Races (20 | 16.0%).
| Race | # Population | % Population |
| Asian | 0 | 0.0% |
| Black / African American | 0 | 0.0% |
| Hawaiian / Pacific | 0 | 0.0% |
| Hispanic or Latino | 0 | 0.0% |
| Native / Alaskan | 67 | 53.6% |
| White / Caucasian | 38 | 30.4% |
| Two or more Races | 20 | 16.0% |
| Some other Race | 0 | 0.0% |
| Total | 125 | 100.0% |
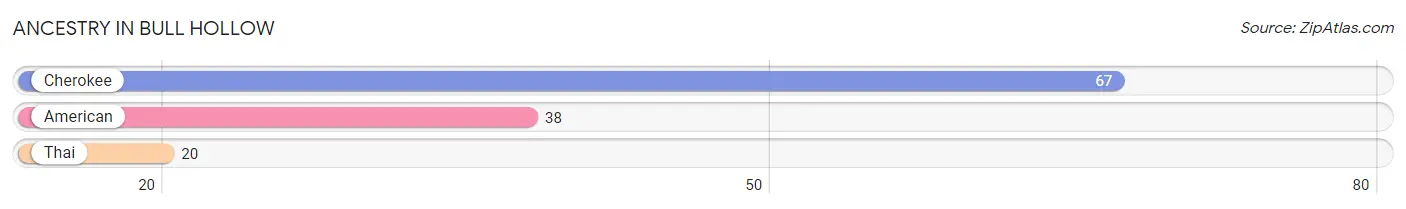
Ancestry in Bull Hollow
The most populous ancestries reported in Bull Hollow are Cherokee (67 | 53.6%), American (38 | 30.4%), and Thai (20 | 16.0%), together accounting for 100.0% of all Bull Hollow residents.
| Ancestry | # Population | % Population |
| American | 38 | 30.4% |
| Cherokee | 67 | 53.6% |
| Thai | 20 | 16.0% | View All 3 Rows |
Immigrants in Bull Hollow

| Immigration Origin | # Population | % Population | View All 0 Rows |
Sex and Age in Bull Hollow
Sex and Age in Bull Hollow
The most populous age groups in Bull Hollow are 35 to 39 Years (39 | 40.6%) for men and 25 to 29 Years (28 | 96.6%) for women.
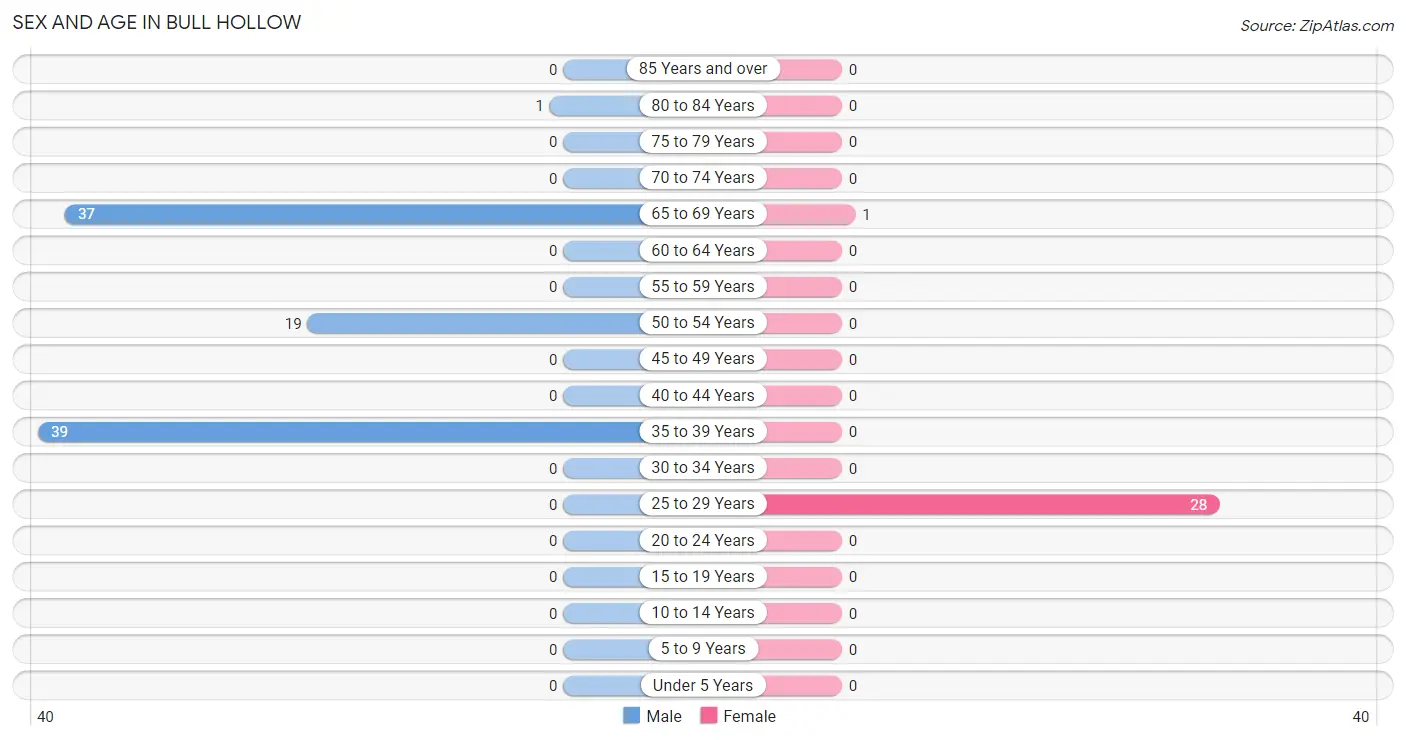
| Age Bracket | Male | Female |
| Under 5 Years | 0 (0.0%) | 0 (0.0%) |
| 5 to 9 Years | 0 (0.0%) | 0 (0.0%) |
| 10 to 14 Years | 0 (0.0%) | 0 (0.0%) |
| 15 to 19 Years | 0 (0.0%) | 0 (0.0%) |
| 20 to 24 Years | 0 (0.0%) | 0 (0.0%) |
| 25 to 29 Years | 0 (0.0%) | 28 (96.6%) |
| 30 to 34 Years | 0 (0.0%) | 0 (0.0%) |
| 35 to 39 Years | 39 (40.6%) | 0 (0.0%) |
| 40 to 44 Years | 0 (0.0%) | 0 (0.0%) |
| 45 to 49 Years | 0 (0.0%) | 0 (0.0%) |
| 50 to 54 Years | 19 (19.8%) | 0 (0.0%) |
| 55 to 59 Years | 0 (0.0%) | 0 (0.0%) |
| 60 to 64 Years | 0 (0.0%) | 0 (0.0%) |
| 65 to 69 Years | 37 (38.5%) | 1 (3.5%) |
| 70 to 74 Years | 0 (0.0%) | 0 (0.0%) |
| 75 to 79 Years | 0 (0.0%) | 0 (0.0%) |
| 80 to 84 Years | 1 (1.0%) | 0 (0.0%) |
| 85 Years and over | 0 (0.0%) | 0 (0.0%) |
| Total | 96 (100.0%) | 29 (100.0%) |
Families and Households in Bull Hollow
Median Family Size in Bull Hollow
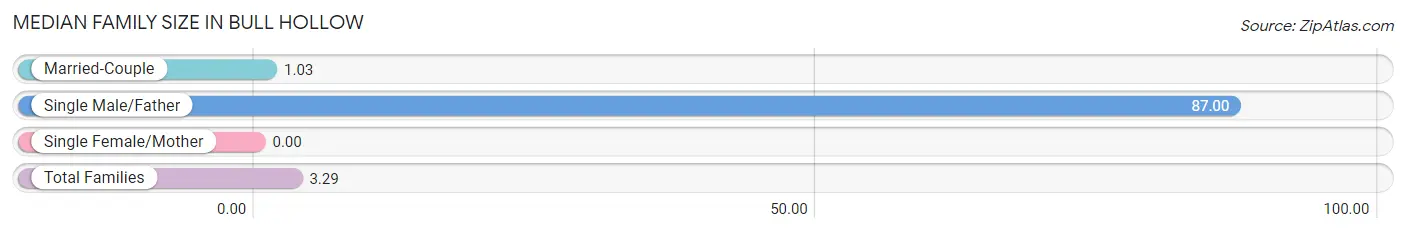
| Family Type | # Families | Family Size |
| Married-Couple | 37 (97.4%) | 1.03 |
| Single Male/Father | 1 (2.6%) | 87.00 |
| Single Female/Mother | 0 (0.0%) | - |
| Total Families | 38 (100.0%) | 3.29 |
Median Household Size in Bull Hollow
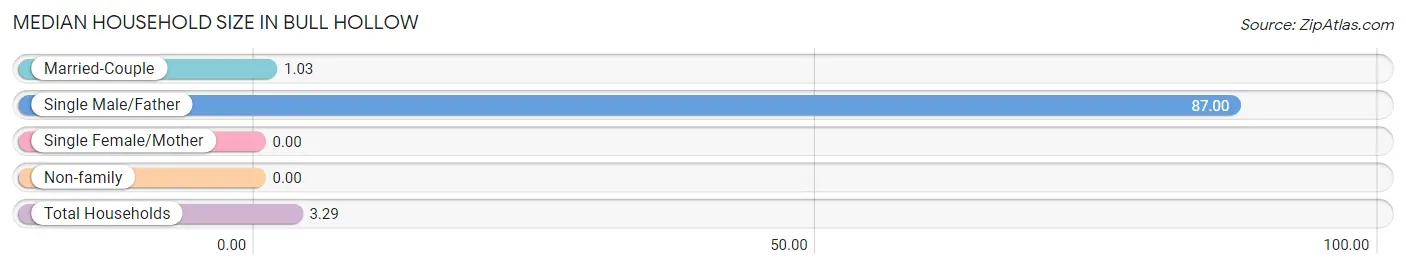
| Household Type | # Households | Household Size |
| Married-Couple | 37 (97.4%) | 1.03 |
| Single Male/Father | 1 (2.6%) | 87.00 |
| Single Female/Mother | 0 (0.0%) | - |
| Non-family | 0 (0.0%) | - |
| Total Households | 38 (100.0%) | 3.29 |
Household Size by Marriage Status in Bull Hollow
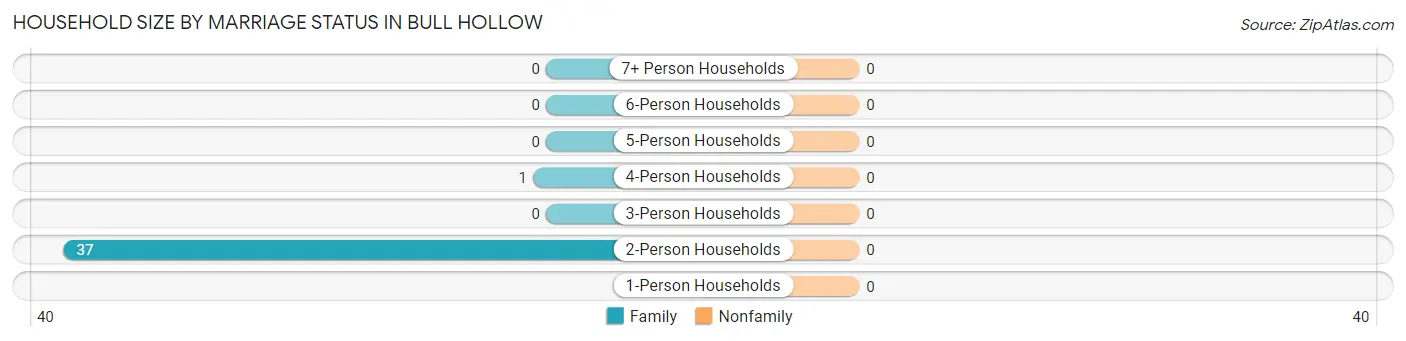
| Household Size | Family Households | Nonfamily Households |
| 1-Person Households | - | 0 (0.0%) |
| 2-Person Households | 37 (97.4%) | 0 (0.0%) |
| 3-Person Households | 0 (0.0%) | 0 (0.0%) |
| 4-Person Households | 1 (2.6%) | 0 (0.0%) |
| 5-Person Households | 0 (0.0%) | 0 (0.0%) |
| 6-Person Households | 0 (0.0%) | 0 (0.0%) |
| 7+ Person Households | 0 (0.0%) | 0 (0.0%) |
| Total | 38 (100.0%) | 0 (0.0%) |
Female Fertility in Bull Hollow
Fertility by Age in Bull Hollow
| Age Bracket | Women with Births | Births / 1,000 Women |
| 15 to 19 years | 0 (0.0%) | 0.0 |
| 20 to 34 years | 0 (0.0%) | 0.0 |
| 35 to 50 years | 0 (0.0%) | 0.0 |
| Total | 0 (0.0%) | 0.0 |
Fertility by Age by Marriage Status in Bull Hollow
| Age Bracket | Married | Unmarried |
| 15 to 19 years | 0 (0.0%) | 0 (0.0%) |
| 20 to 34 years | 0 (0.0%) | 0 (0.0%) |
| 35 to 50 years | 0 (0.0%) | 0 (0.0%) |
| Total | 0 (0.0%) | 0 (0.0%) |
Fertility by Education in Bull Hollow
| Educational Attainment | Women with Births | Births / 1,000 Women |
| Less than High School | 0 (0.0%) | 0.0 |
| High School Diploma | 0 (0.0%) | 0.0 |
| College or Associate's Degree | 0 (0.0%) | 0.0 |
| Bachelor's Degree | 0 (0.0%) | 0.0 |
| Graduate Degree | 0 (0.0%) | 0.0 |
| Total | 0 (0.0%) | 0.0 |
Fertility by Education by Marriage Status in Bull Hollow
| Educational Attainment | Married | Unmarried |
| Less than High School | 0 (0.0%) | 0 (0.0%) |
| High School Diploma | 0 (0.0%) | 0 (0.0%) |
| College or Associate's Degree | 0 (0.0%) | 0 (0.0%) |
| Bachelor's Degree | 0 (0.0%) | 0 (0.0%) |
| Graduate Degree | 0 (0.0%) | 0 (0.0%) |
| Total | 0 (0.0%) | 0 (0.0%) |
Employment Characteristics in Bull Hollow
Employment by Class of Employer in Bull Hollow
Among the 47 employed individuals in Bull Hollow, private company employees (28 | 59.6%), and state government employees (19 | 40.4%) make up the most common classes of employment.
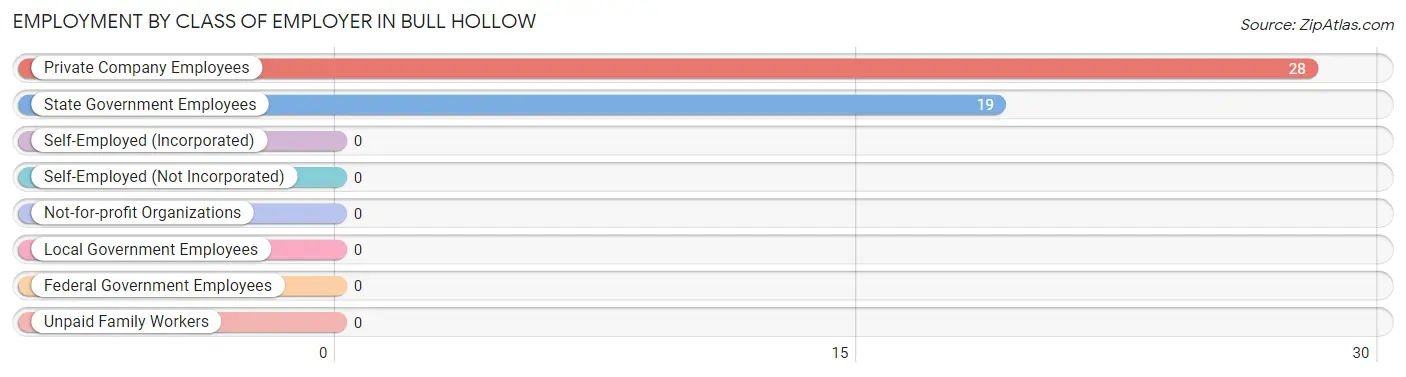
| Employer Class | # Employees | % Employees |
| Private Company Employees | 28 | 59.6% |
| Self-Employed (Incorporated) | 0 | 0.0% |
| Self-Employed (Not Incorporated) | 0 | 0.0% |
| Not-for-profit Organizations | 0 | 0.0% |
| Local Government Employees | 0 | 0.0% |
| State Government Employees | 19 | 40.4% |
| Federal Government Employees | 0 | 0.0% |
| Unpaid Family Workers | 0 | 0.0% |
| Total | 47 | 100.0% |
Employment Status by Age in Bull Hollow
According to the labor force statistics for Bull Hollow, out of the total population over 16 years of age (125), 68.8% or 86 individuals are in the labor force, with 45.3% or 39 of them unemployed. The age group with the highest labor force participation rate is 25 to 29 years, with 100.0% or 28 individuals in the labor force. Within the labor force, the 35 to 44 years age range has the highest percentage of unemployed individuals, with 100.0% or 39 of them being unemployed.
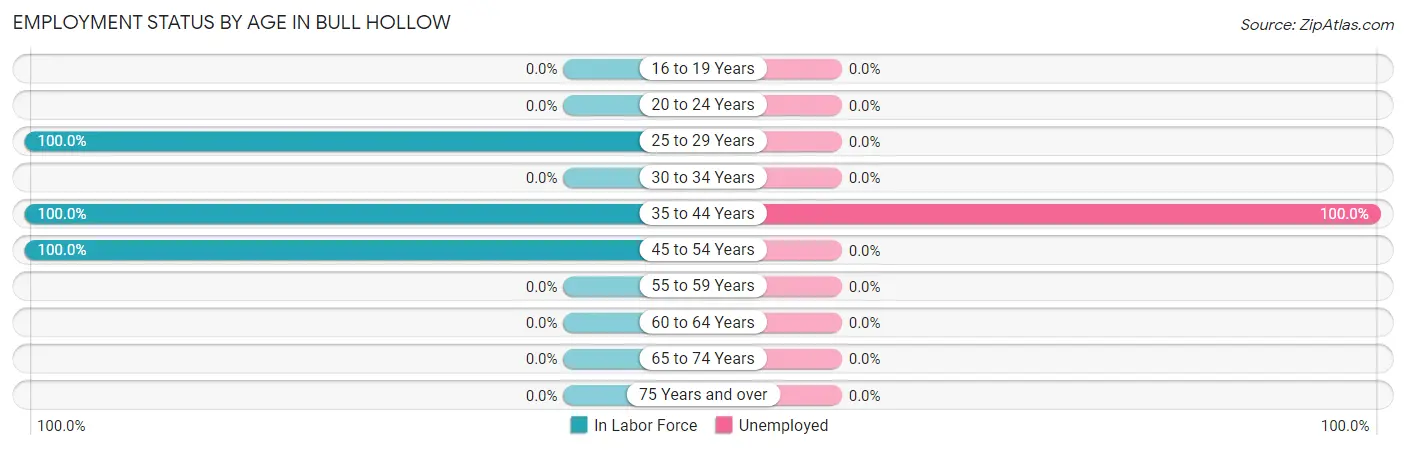
| Age Bracket | In Labor Force | Unemployed |
| 16 to 19 Years | 0 (0.0%) | 0 (0.0%) |
| 20 to 24 Years | 0 (0.0%) | 0 (0.0%) |
| 25 to 29 Years | 28 (100.0%) | 0 (0.0%) |
| 30 to 34 Years | 0 (0.0%) | 0 (0.0%) |
| 35 to 44 Years | 39 (100.0%) | 39 (100.0%) |
| 45 to 54 Years | 19 (100.0%) | 0 (0.0%) |
| 55 to 59 Years | 0 (0.0%) | 0 (0.0%) |
| 60 to 64 Years | 0 (0.0%) | 0 (0.0%) |
| 65 to 74 Years | 0 (0.0%) | 0 (0.0%) |
| 75 Years and over | 0 (0.0%) | 0 (0.0%) |
| Total | 86 (68.8%) | 39 (45.3%) |
Employment Status by Educational Attainment in Bull Hollow
According to labor force statistics for Bull Hollow, 100.0% of individuals (86) out of the total population between 25 and 64 years of age (86) are in the labor force, with 45.3% or 39 of them being unemployed. The group with the highest labor force participation rate are those with the educational attainment of high school diploma, with 100.0% or 86 individuals in the labor force. Within the labor force, individuals with high school diploma education have the highest percentage of unemployment, with 45.3% or 39 of them being unemployed.
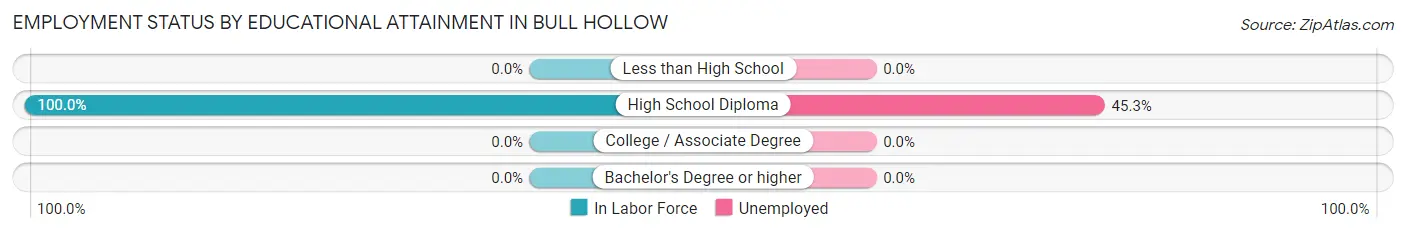
| Educational Attainment | In Labor Force | Unemployed |
| Less than High School | 0 (0.0%) | 0 (0.0%) |
| High School Diploma | 86 (100.0%) | 39 (45.3%) |
| College / Associate Degree | 0 (0.0%) | 0 (0.0%) |
| Bachelor's Degree or higher | 0 (0.0%) | 0 (0.0%) |
| Total | 86 (100.0%) | 39 (45.3%) |
Employment Occupations by Sex in Bull Hollow
Management, Business, Science and Arts Occupations
The most common Management, Business, Science and Arts occupations in Bull Hollow are , and Health Diagnosing & Treating (28 | 59.6%).
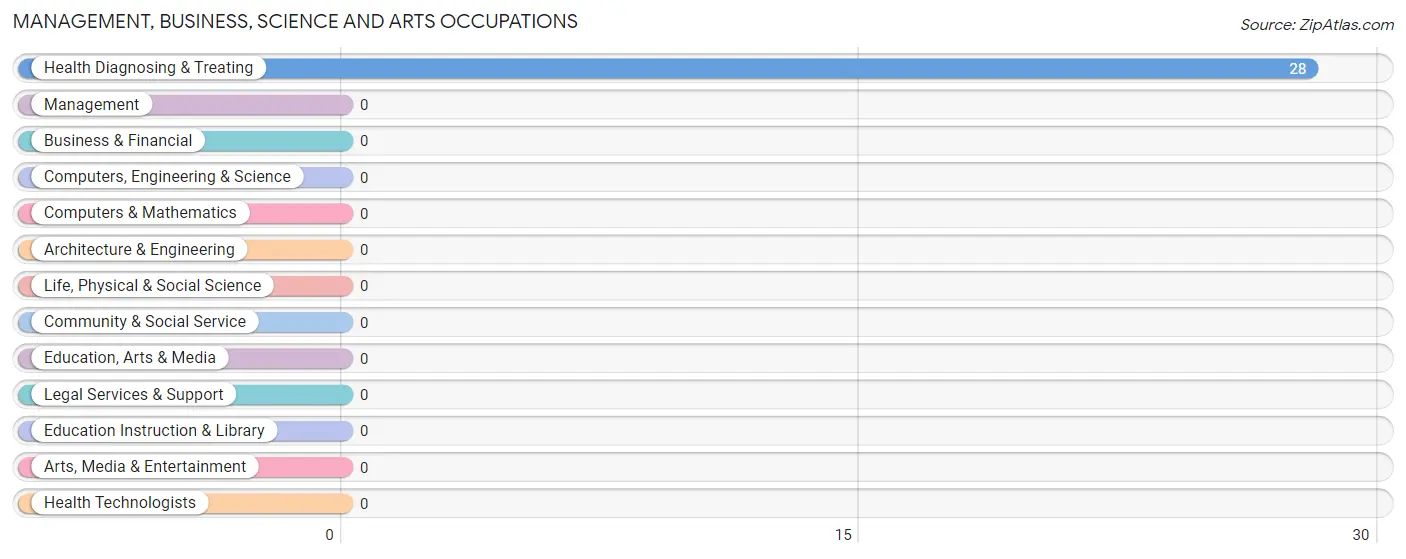
Management, Business, Science and Arts Occupations by Sex
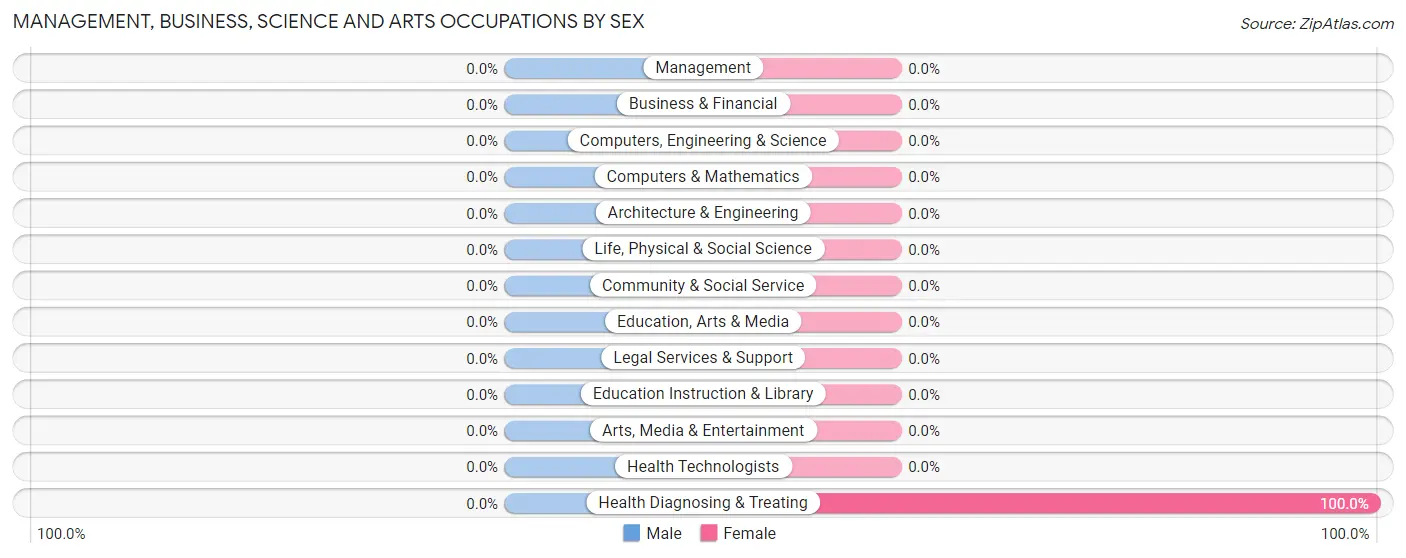
| Occupation | Male | Female |
| Management | 0 (0.0%) | 0 (0.0%) |
| Business & Financial | 0 (0.0%) | 0 (0.0%) |
| Computers, Engineering & Science | 0 (0.0%) | 0 (0.0%) |
| Computers & Mathematics | 0 (0.0%) | 0 (0.0%) |
| Architecture & Engineering | 0 (0.0%) | 0 (0.0%) |
| Life, Physical & Social Science | 0 (0.0%) | 0 (0.0%) |
| Community & Social Service | 0 (0.0%) | 0 (0.0%) |
| Education, Arts & Media | 0 (0.0%) | 0 (0.0%) |
| Legal Services & Support | 0 (0.0%) | 0 (0.0%) |
| Education Instruction & Library | 0 (0.0%) | 0 (0.0%) |
| Arts, Media & Entertainment | 0 (0.0%) | 0 (0.0%) |
| Health Diagnosing & Treating | 0 (0.0%) | 28 (100.0%) |
| Health Technologists | 0 (0.0%) | 0 (0.0%) |
| Total (Category) | 0 (0.0%) | 28 (100.0%) |
| Total (Overall) | 19 (40.4%) | 28 (59.6%) |
Services Occupations
Services Occupations by Sex
| Occupation | Male | Female |
| Healthcare Support | 0 (0.0%) | 0 (0.0%) |
| Security & Protection | 0 (0.0%) | 0 (0.0%) |
| Firefighting & Prevention | 0 (0.0%) | 0 (0.0%) |
| Law Enforcement | 0 (0.0%) | 0 (0.0%) |
| Food Preparation & Serving | 0 (0.0%) | 0 (0.0%) |
| Cleaning & Maintenance | 0 (0.0%) | 0 (0.0%) |
| Personal Care & Service | 0 (0.0%) | 0 (0.0%) |
| Total (Category) | 0 (0.0%) | 0 (0.0%) |
| Total (Overall) | 19 (40.4%) | 28 (59.6%) |
Sales and Office Occupations
Sales and Office Occupations by Sex
| Occupation | Male | Female |
| Sales & Related | 0 (0.0%) | 0 (0.0%) |
| Office & Administration | 0 (0.0%) | 0 (0.0%) |
| Total (Category) | 0 (0.0%) | 0 (0.0%) |
| Total (Overall) | 19 (40.4%) | 28 (59.6%) |
Natural Resources, Construction and Maintenance Occupations
Natural Resources, Construction and Maintenance Occupations by Sex
| Occupation | Male | Female |
| Farming, Fishing & Forestry | 0 (0.0%) | 0 (0.0%) |
| Construction & Extraction | 0 (0.0%) | 0 (0.0%) |
| Installation, Maintenance & Repair | 0 (0.0%) | 0 (0.0%) |
| Total (Category) | 0 (0.0%) | 0 (0.0%) |
| Total (Overall) | 19 (40.4%) | 28 (59.6%) |
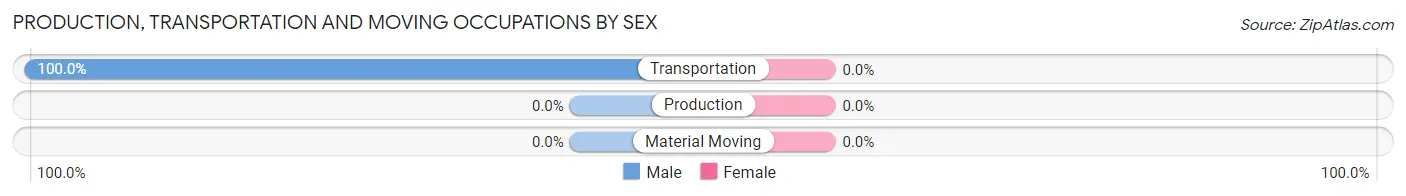
Production, Transportation and Moving Occupations
The most common Production, Transportation and Moving occupations in Bull Hollow are , and Transportation (19 | 40.4%).
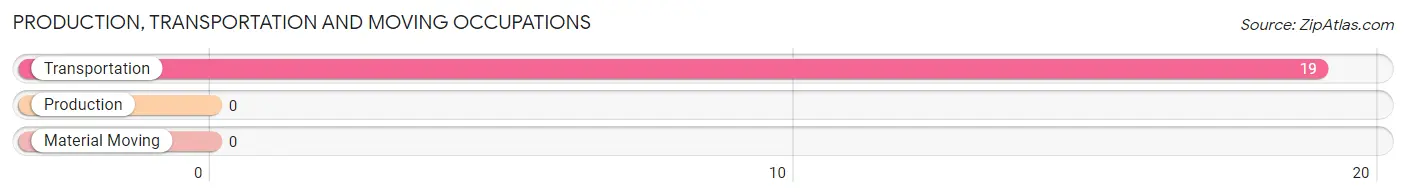
Production, Transportation and Moving Occupations by Sex
| Occupation | Male | Female |
| Production | 0 (0.0%) | 0 (0.0%) |
| Transportation | 19 (100.0%) | 0 (0.0%) |
| Material Moving | 0 (0.0%) | 0 (0.0%) |
| Total (Category) | 19 (100.0%) | 0 (0.0%) |
| Total (Overall) | 19 (40.4%) | 28 (59.6%) |
Employment Industries by Sex in Bull Hollow
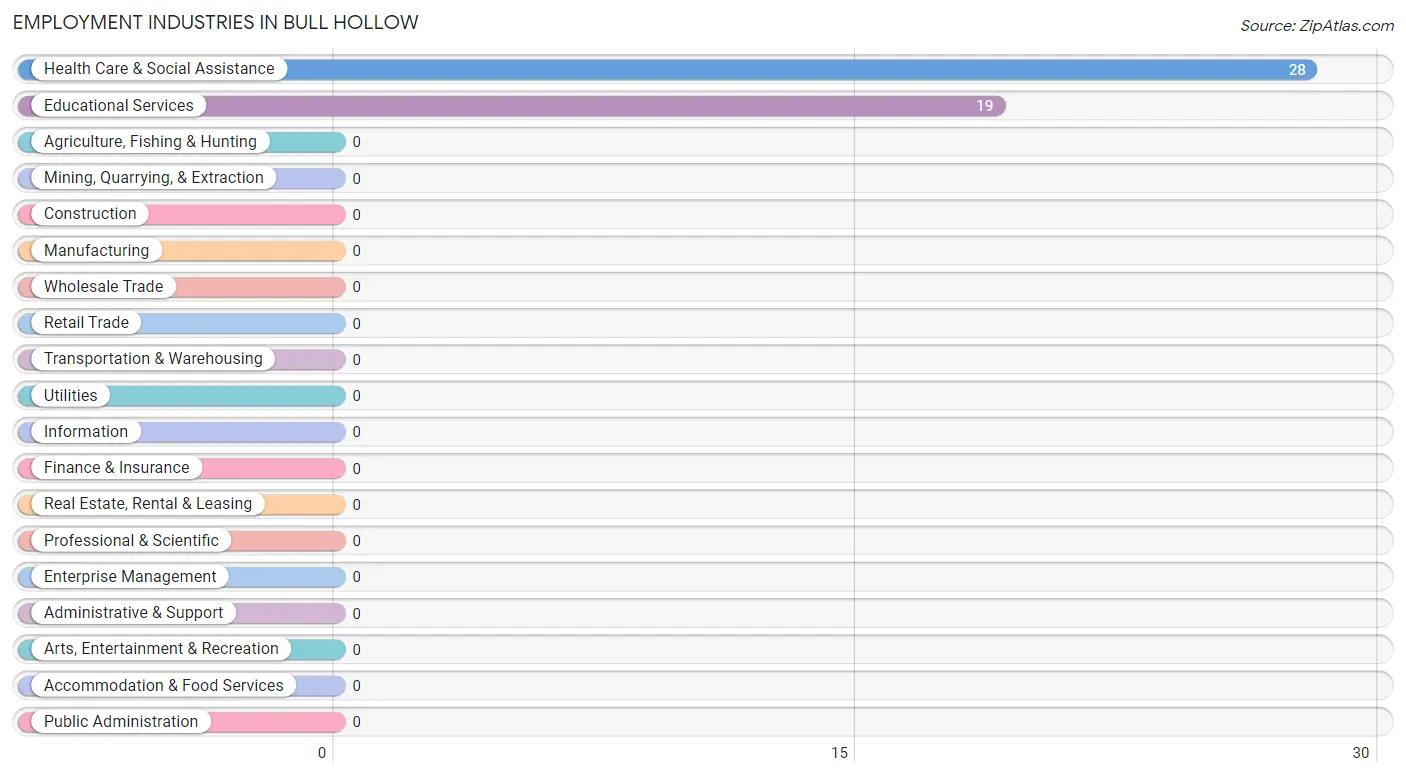
Employment Industries in Bull Hollow
The major employment industries in Bull Hollow include Health Care & Social Assistance (28 | 59.6%), and Educational Services (19 | 40.4%).
Employment Industries by Sex in Bull Hollow
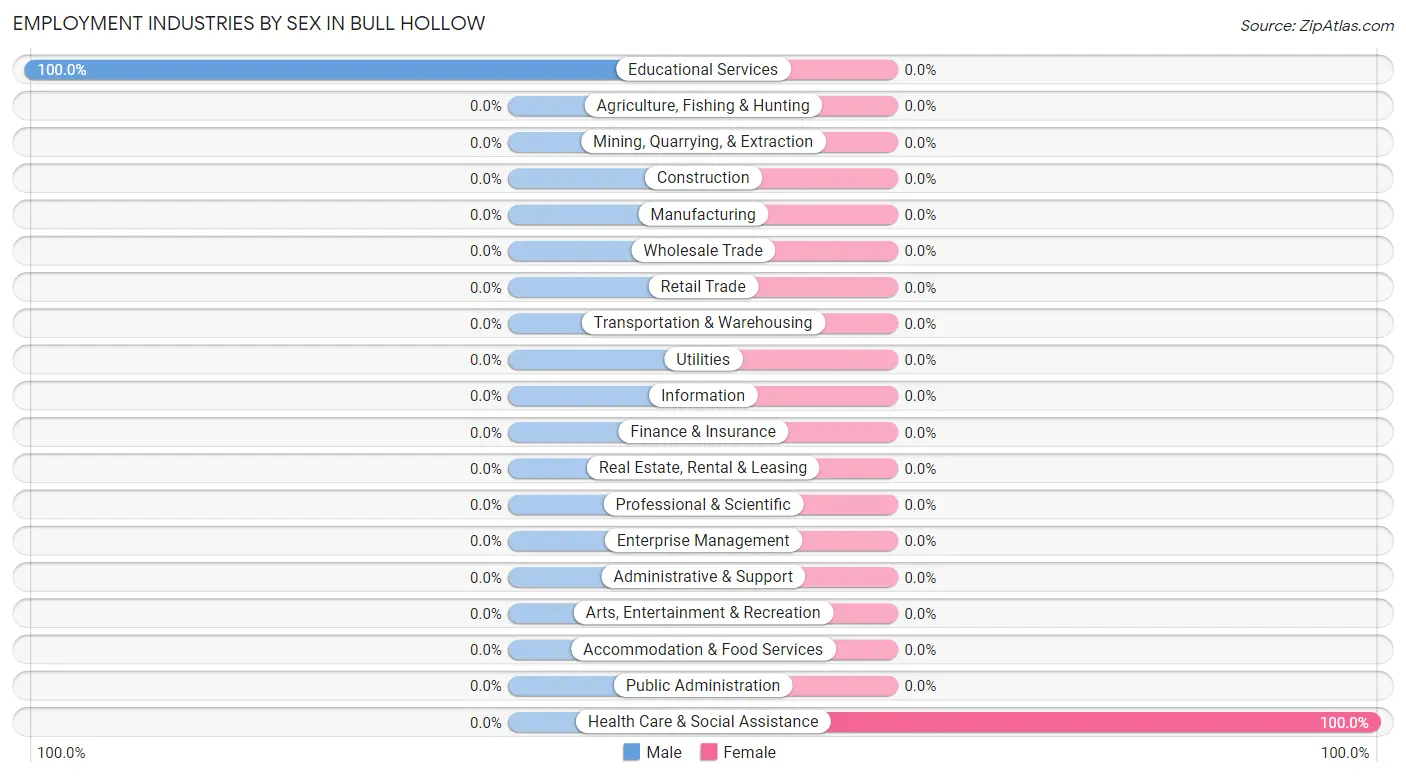
| Industry | Male | Female |
| Agriculture, Fishing & Hunting | 0 (0.0%) | 0 (0.0%) |
| Mining, Quarrying, & Extraction | 0 (0.0%) | 0 (0.0%) |
| Construction | 0 (0.0%) | 0 (0.0%) |
| Manufacturing | 0 (0.0%) | 0 (0.0%) |
| Wholesale Trade | 0 (0.0%) | 0 (0.0%) |
| Retail Trade | 0 (0.0%) | 0 (0.0%) |
| Transportation & Warehousing | 0 (0.0%) | 0 (0.0%) |
| Utilities | 0 (0.0%) | 0 (0.0%) |
| Information | 0 (0.0%) | 0 (0.0%) |
| Finance & Insurance | 0 (0.0%) | 0 (0.0%) |
| Real Estate, Rental & Leasing | 0 (0.0%) | 0 (0.0%) |
| Professional & Scientific | 0 (0.0%) | 0 (0.0%) |
| Enterprise Management | 0 (0.0%) | 0 (0.0%) |
| Administrative & Support | 0 (0.0%) | 0 (0.0%) |
| Educational Services | 19 (100.0%) | 0 (0.0%) |
| Health Care & Social Assistance | 0 (0.0%) | 28 (100.0%) |
| Arts, Entertainment & Recreation | 0 (0.0%) | 0 (0.0%) |
| Accommodation & Food Services | 0 (0.0%) | 0 (0.0%) |
| Public Administration | 0 (0.0%) | 0 (0.0%) |
| Total | 19 (40.4%) | 28 (59.6%) |
Education in Bull Hollow
School Enrollment in Bull Hollow
| School Level | # Students | % Students |
| Nursery / Preschool | 0 | 0.0% |
| Kindergarten | 0 | 0.0% |
| Elementary School | 0 | 0.0% |
| Middle School | 0 | 0.0% |
| High School | 0 | 0.0% |
| College / Undergraduate | 0 | 0.0% |
| Graduate / Professional | 0 | 0.0% |
| Total | 0 | 0.0% |
School Enrollment by Age by Funding Source in Bull Hollow
| Age Bracket | Public School | Private School |
| 3 to 4 Year Olds | 0 (0.0%) | 0 (0.0%) |
| 5 to 9 Year Old | 0 (0.0%) | 0 (0.0%) |
| 10 to 14 Year Olds | 0 (0.0%) | 0 (0.0%) |
| 15 to 17 Year Olds | 0 (0.0%) | 0 (0.0%) |
| 18 to 19 Year Olds | 0 (0.0%) | 0 (0.0%) |
| 20 to 24 Year Olds | 0 (0.0%) | 0 (0.0%) |
| 25 to 34 Year Olds | 0 (0.0%) | 0 (0.0%) |
| 35 Years and over | 0 (0.0%) | 0 (0.0%) |
| Total | 0 (0.0%) | 0 (0.0%) |
Educational Attainment by Field of Study in Bull Hollow
| Field of Study | # Graduates | % Graduates |
| Computers & Mathematics | 0 | 0.0% |
| Bio, Nature & Agricultural | 0 | 0.0% |
| Physical & Health Sciences | 0 | 0.0% |
| Psychology | 0 | 0.0% |
| Social Sciences | 0 | 0.0% |
| Engineering | 0 | 0.0% |
| Multidisciplinary Studies | 0 | 0.0% |
| Science & Technology | 0 | 0.0% |
| Business | 0 | 0.0% |
| Education | 0 | 0.0% |
| Literature & Languages | 0 | 0.0% |
| Liberal Arts & History | 0 | 0.0% |
| Visual & Performing Arts | 0 | 0.0% |
| Communications | 0 | 0.0% |
| Arts & Humanities | 0 | 0.0% |
| Total | 0 | 0.0% |
Transportation & Commute in Bull Hollow
Vehicle Availability by Sex in Bull Hollow
The most prevalent vehicle ownership categories in Bull Hollow are males with 2 vehicles (19, accounting for 100.0%) and females with 2 vehicles (28, making up 67.9%).
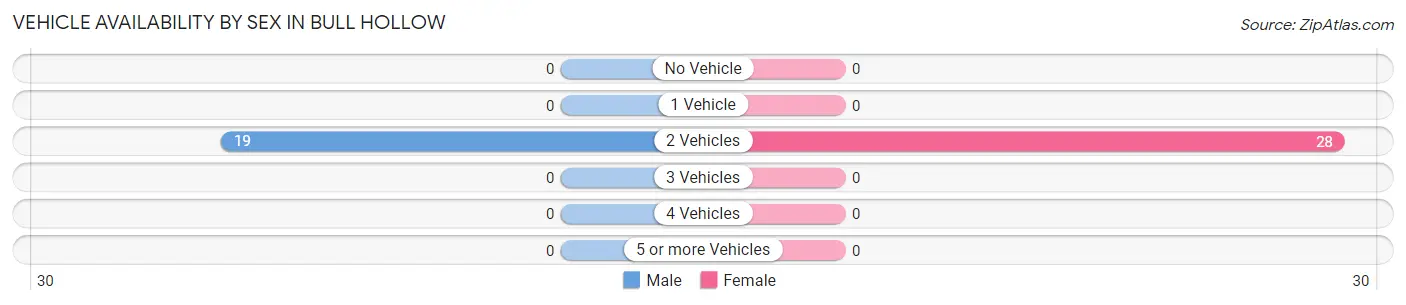
| Vehicles Available | Male | Female |
| No Vehicle | 0 (0.0%) | 0 (0.0%) |
| 1 Vehicle | 0 (0.0%) | 0 (0.0%) |
| 2 Vehicles | 19 (100.0%) | 28 (100.0%) |
| 3 Vehicles | 0 (0.0%) | 0 (0.0%) |
| 4 Vehicles | 0 (0.0%) | 0 (0.0%) |
| 5 or more Vehicles | 0 (0.0%) | 0 (0.0%) |
| Total | 19 (100.0%) | 28 (100.0%) |
Commute Time in Bull Hollow
The most frequently occuring commute durations in Bull Hollow are 45 to 59 minutes (28 commuters, 59.6%), 30 to 34 minutes (19 commuters, 40.4%), and less than 5 minutes (0 commuters, 0.0%).
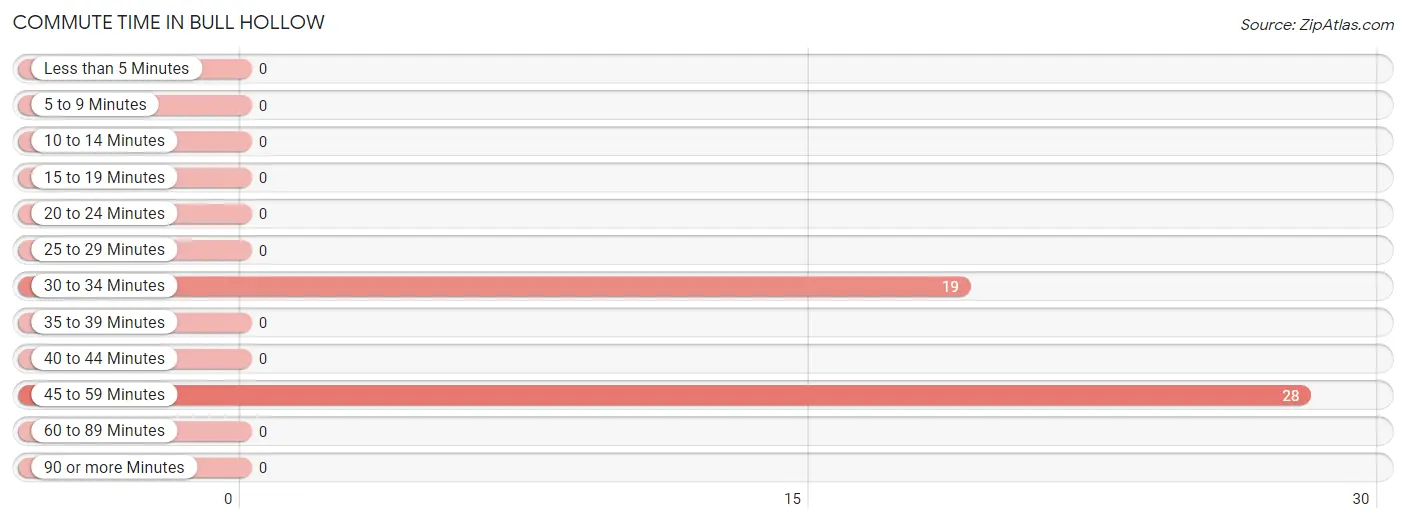
| Commute Time | # Commuters | % Commuters |
| Less than 5 Minutes | 0 | 0.0% |
| 5 to 9 Minutes | 0 | 0.0% |
| 10 to 14 Minutes | 0 | 0.0% |
| 15 to 19 Minutes | 0 | 0.0% |
| 20 to 24 Minutes | 0 | 0.0% |
| 25 to 29 Minutes | 0 | 0.0% |
| 30 to 34 Minutes | 19 | 40.4% |
| 35 to 39 Minutes | 0 | 0.0% |
| 40 to 44 Minutes | 0 | 0.0% |
| 45 to 59 Minutes | 28 | 59.6% |
| 60 to 89 Minutes | 0 | 0.0% |
| 90 or more Minutes | 0 | 0.0% |
Commute Time by Sex in Bull Hollow
The most common commute times in Bull Hollow are 30 to 34 minutes (19 commuters, 100.0%) for males and 45 to 59 minutes (28 commuters, 100.0%) for females.
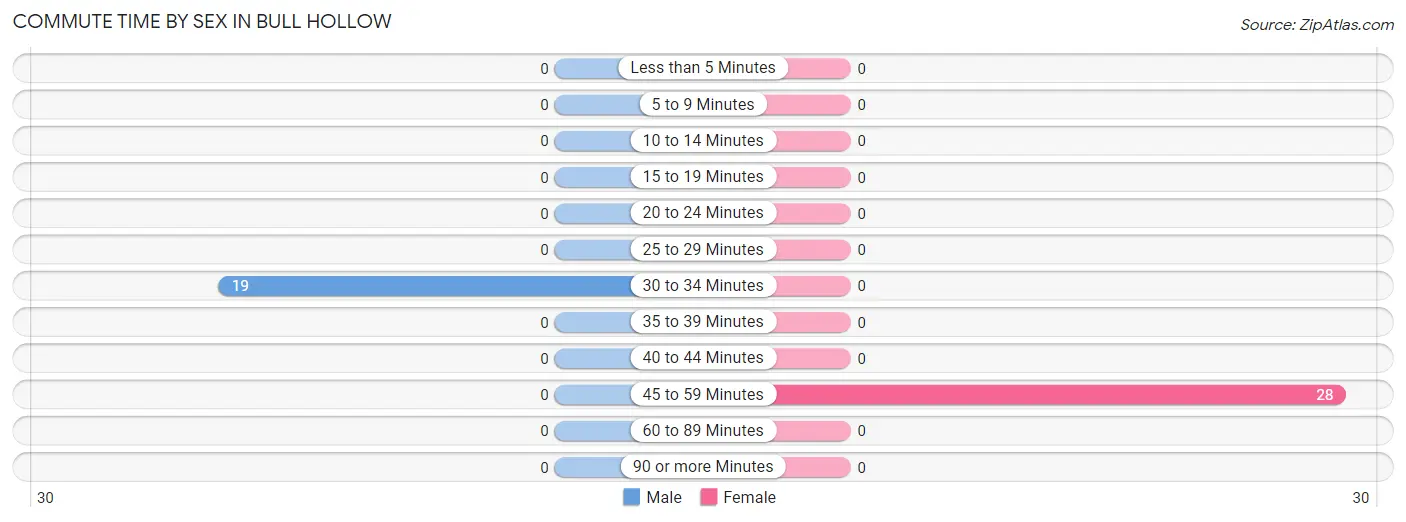
| Commute Time | Male | Female |
| Less than 5 Minutes | 0 (0.0%) | 0 (0.0%) |
| 5 to 9 Minutes | 0 (0.0%) | 0 (0.0%) |
| 10 to 14 Minutes | 0 (0.0%) | 0 (0.0%) |
| 15 to 19 Minutes | 0 (0.0%) | 0 (0.0%) |
| 20 to 24 Minutes | 0 (0.0%) | 0 (0.0%) |
| 25 to 29 Minutes | 0 (0.0%) | 0 (0.0%) |
| 30 to 34 Minutes | 19 (100.0%) | 0 (0.0%) |
| 35 to 39 Minutes | 0 (0.0%) | 0 (0.0%) |
| 40 to 44 Minutes | 0 (0.0%) | 0 (0.0%) |
| 45 to 59 Minutes | 0 (0.0%) | 28 (100.0%) |
| 60 to 89 Minutes | 0 (0.0%) | 0 (0.0%) |
| 90 or more Minutes | 0 (0.0%) | 0 (0.0%) |
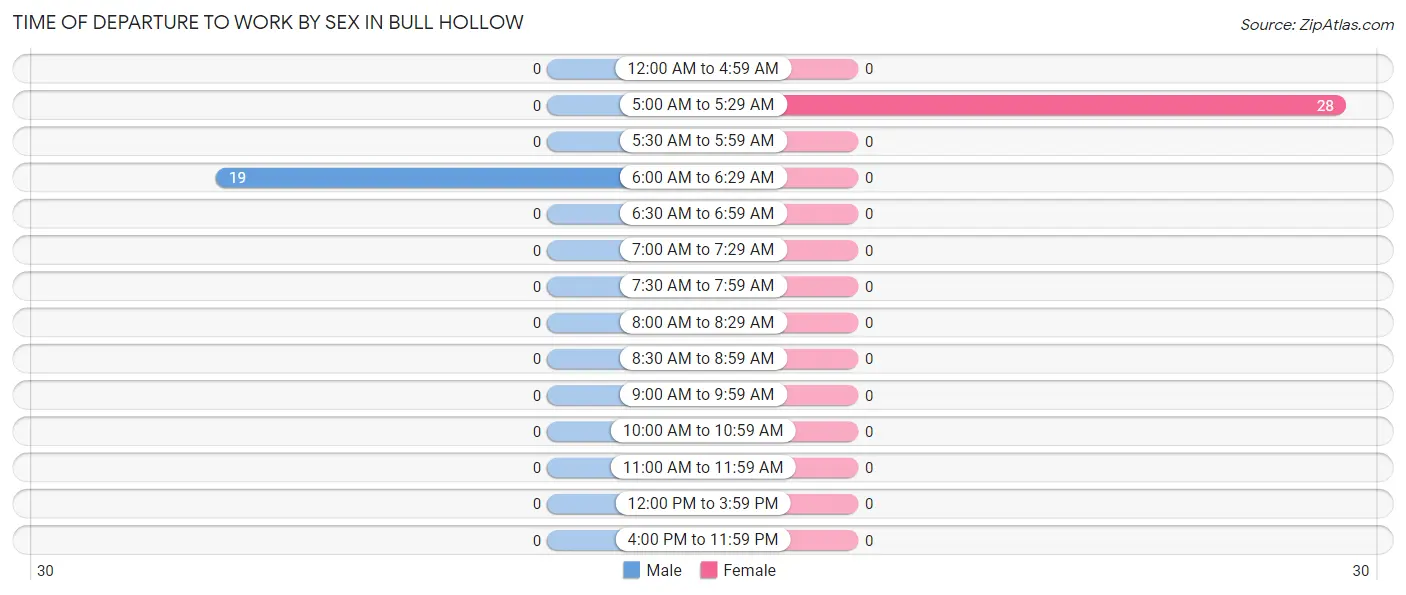
Time of Departure to Work by Sex in Bull Hollow
The most frequent times of departure to work in Bull Hollow are 6:00 AM to 6:29 AM (19, 100.0%) for males and 5:00 AM to 5:29 AM (28, 100.0%) for females.
| Time of Departure | Male | Female |
| 12:00 AM to 4:59 AM | 0 (0.0%) | 0 (0.0%) |
| 5:00 AM to 5:29 AM | 0 (0.0%) | 28 (100.0%) |
| 5:30 AM to 5:59 AM | 0 (0.0%) | 0 (0.0%) |
| 6:00 AM to 6:29 AM | 19 (100.0%) | 0 (0.0%) |
| 6:30 AM to 6:59 AM | 0 (0.0%) | 0 (0.0%) |
| 7:00 AM to 7:29 AM | 0 (0.0%) | 0 (0.0%) |
| 7:30 AM to 7:59 AM | 0 (0.0%) | 0 (0.0%) |
| 8:00 AM to 8:29 AM | 0 (0.0%) | 0 (0.0%) |
| 8:30 AM to 8:59 AM | 0 (0.0%) | 0 (0.0%) |
| 9:00 AM to 9:59 AM | 0 (0.0%) | 0 (0.0%) |
| 10:00 AM to 10:59 AM | 0 (0.0%) | 0 (0.0%) |
| 11:00 AM to 11:59 AM | 0 (0.0%) | 0 (0.0%) |
| 12:00 PM to 3:59 PM | 0 (0.0%) | 0 (0.0%) |
| 4:00 PM to 11:59 PM | 0 (0.0%) | 0 (0.0%) |
| Total | 19 (100.0%) | 28 (100.0%) |
Housing Occupancy in Bull Hollow
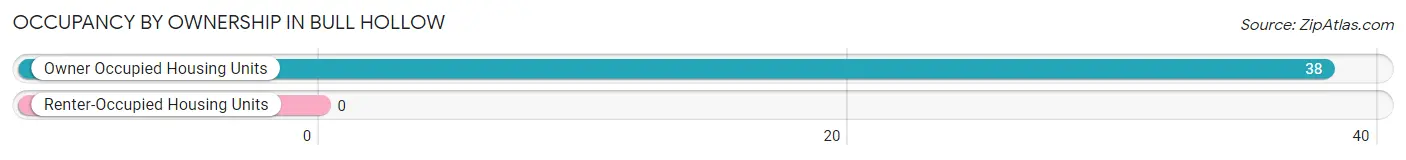
Occupancy by Ownership in Bull Hollow
Of the total 38 dwellings in Bull Hollow, owner-occupied units account for 38 (100.0%), while renter-occupied units make up 0 (0.0%).
| Occupancy | # Housing Units | % Housing Units |
| Owner Occupied Housing Units | 38 | 100.0% |
| Renter-Occupied Housing Units | 0 | 0.0% |
| Total Occupied Housing Units | 38 | 100.0% |
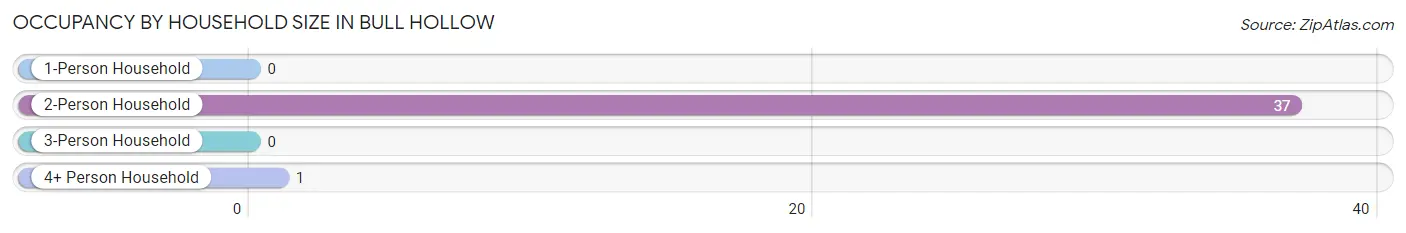
Occupancy by Household Size in Bull Hollow
| Household Size | # Housing Units | % Housing Units |
| 1-Person Household | 0 | 0.0% |
| 2-Person Household | 37 | 97.4% |
| 3-Person Household | 0 | 0.0% |
| 4+ Person Household | 1 | 2.6% |
| Total Housing Units | 38 | 100.0% |
Occupancy by Ownership by Household Size in Bull Hollow
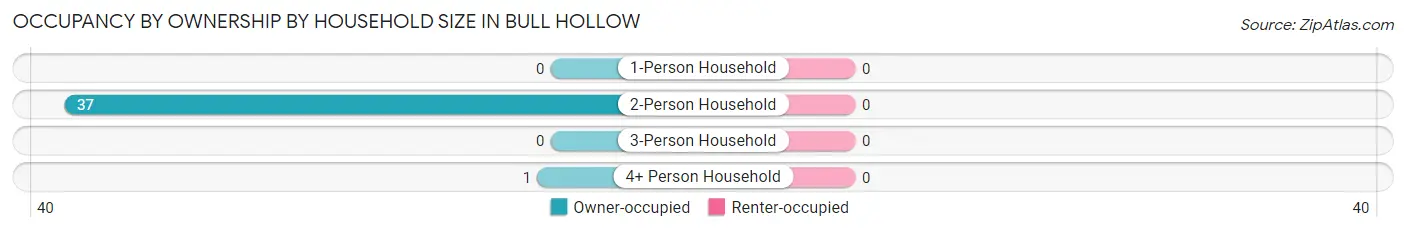
| Household Size | Owner-occupied | Renter-occupied |
| 1-Person Household | 0 (0.0%) | 0 (0.0%) |
| 2-Person Household | 37 (100.0%) | 0 (0.0%) |
| 3-Person Household | 0 (0.0%) | 0 (0.0%) |
| 4+ Person Household | 1 (100.0%) | 0 (0.0%) |
| Total Housing Units | 38 (100.0%) | 0 (0.0%) |
Occupancy by Educational Attainment in Bull Hollow
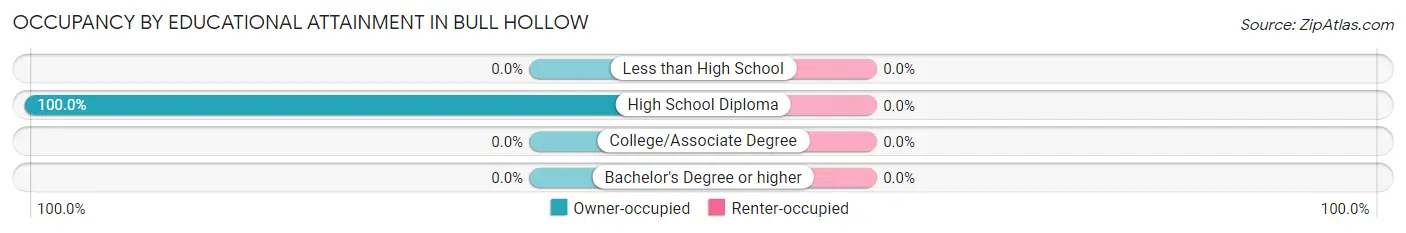
| Household Size | Owner-occupied | Renter-occupied |
| Less than High School | 0 (0.0%) | 0 (0.0%) |
| High School Diploma | 38 (100.0%) | 0 (0.0%) |
| College/Associate Degree | 0 (0.0%) | 0 (0.0%) |
| Bachelor's Degree or higher | 0 (0.0%) | 0 (0.0%) |
Occupancy by Age of Householder in Bull Hollow
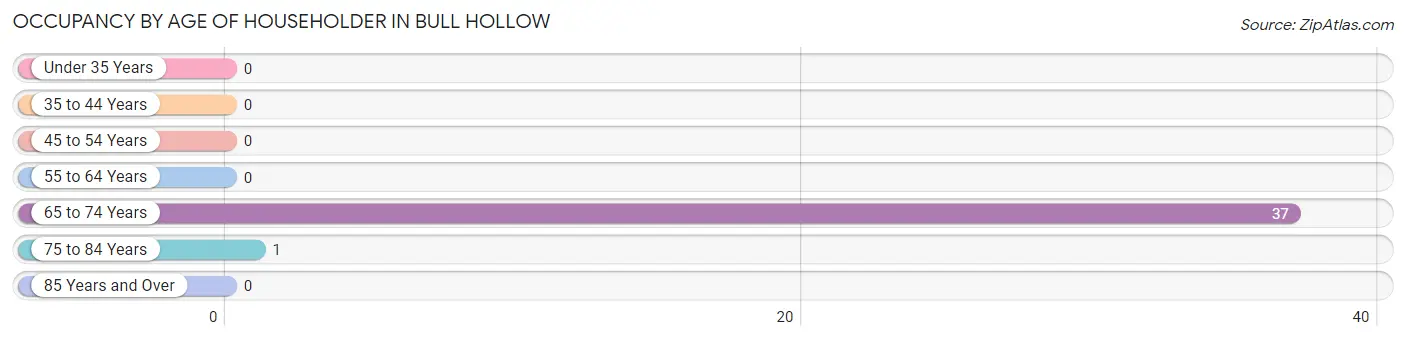
| Age Bracket | # Households | % Households |
| Under 35 Years | 0 | 0.0% |
| 35 to 44 Years | 0 | 0.0% |
| 45 to 54 Years | 0 | 0.0% |
| 55 to 64 Years | 0 | 0.0% |
| 65 to 74 Years | 37 | 97.4% |
| 75 to 84 Years | 1 | 2.6% |
| 85 Years and Over | 0 | 0.0% |
| Total | 38 | 100.0% |
Housing Finances in Bull Hollow
Median Income by Occupancy in Bull Hollow
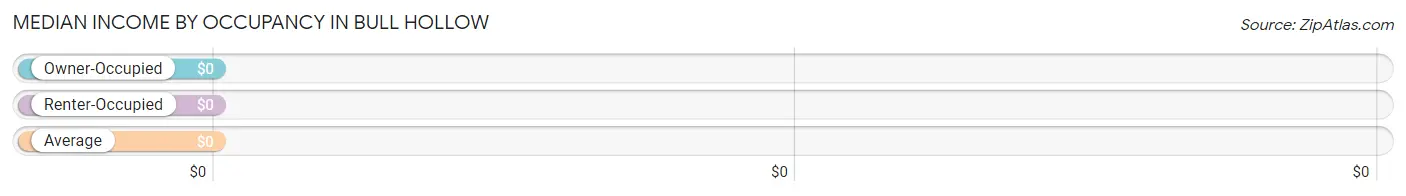
| Occupancy Type | # Households | Median Income |
| Owner-Occupied | 38 (100.0%) | $0 |
| Renter-Occupied | 0 (0.0%) | $0 |
| Average | 38 (100.0%) | $0 |
Occupancy by Householder Income Bracket in Bull Hollow
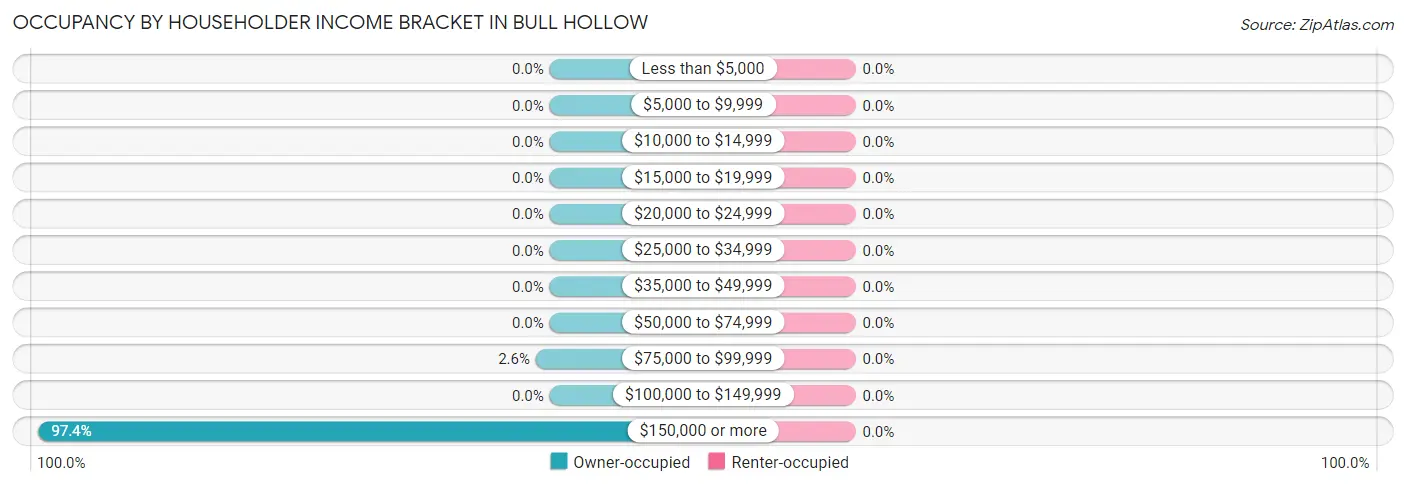
| Income Bracket | Owner-occupied | Renter-occupied |
| Less than $5,000 | 0 (0.0%) | 0 (0.0%) |
| $5,000 to $9,999 | 0 (0.0%) | 0 (0.0%) |
| $10,000 to $14,999 | 0 (0.0%) | 0 (0.0%) |
| $15,000 to $19,999 | 0 (0.0%) | 0 (0.0%) |
| $20,000 to $24,999 | 0 (0.0%) | 0 (0.0%) |
| $25,000 to $34,999 | 0 (0.0%) | 0 (0.0%) |
| $35,000 to $49,999 | 0 (0.0%) | 0 (0.0%) |
| $50,000 to $74,999 | 0 (0.0%) | 0 (0.0%) |
| $75,000 to $99,999 | 1 (2.6%) | 0 (0.0%) |
| $100,000 to $149,999 | 0 (0.0%) | 0 (0.0%) |
| $150,000 or more | 37 (97.4%) | 0 (0.0%) |
| Total | 38 (100.0%) | 0 (0.0%) |
Monthly Housing Cost Tiers in Bull Hollow
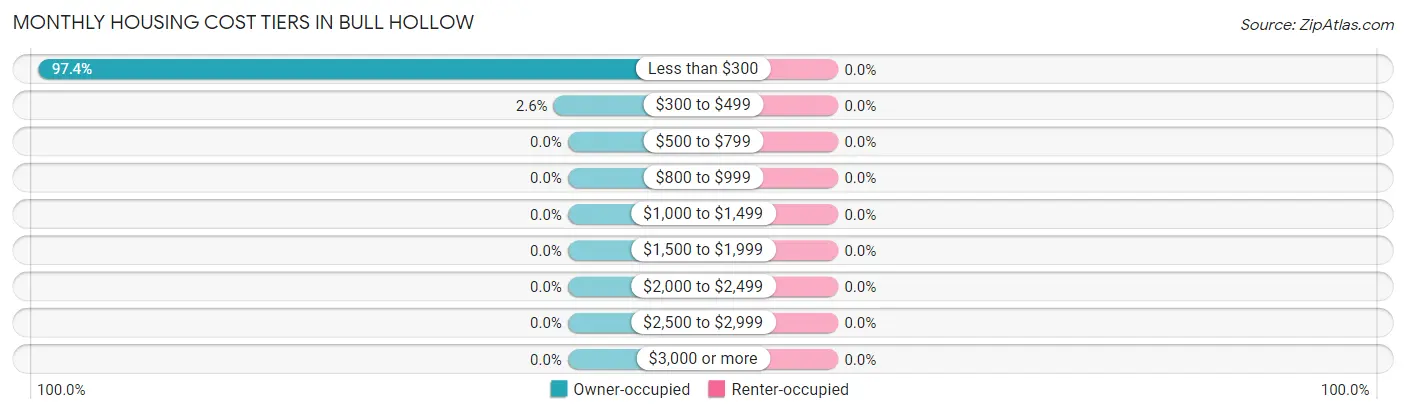
| Monthly Cost | Owner-occupied | Renter-occupied |
| Less than $300 | 37 (97.4%) | 0 (0.0%) |
| $300 to $499 | 1 (2.6%) | 0 (0.0%) |
| $500 to $799 | 0 (0.0%) | 0 (0.0%) |
| $800 to $999 | 0 (0.0%) | 0 (0.0%) |
| $1,000 to $1,499 | 0 (0.0%) | 0 (0.0%) |
| $1,500 to $1,999 | 0 (0.0%) | 0 (0.0%) |
| $2,000 to $2,499 | 0 (0.0%) | 0 (0.0%) |
| $2,500 to $2,999 | 0 (0.0%) | 0 (0.0%) |
| $3,000 or more | 0 (0.0%) | 0 (0.0%) |
| Total | 38 (100.0%) | 0 (0.0%) |
Physical Housing Characteristics in Bull Hollow
Housing Structures in Bull Hollow
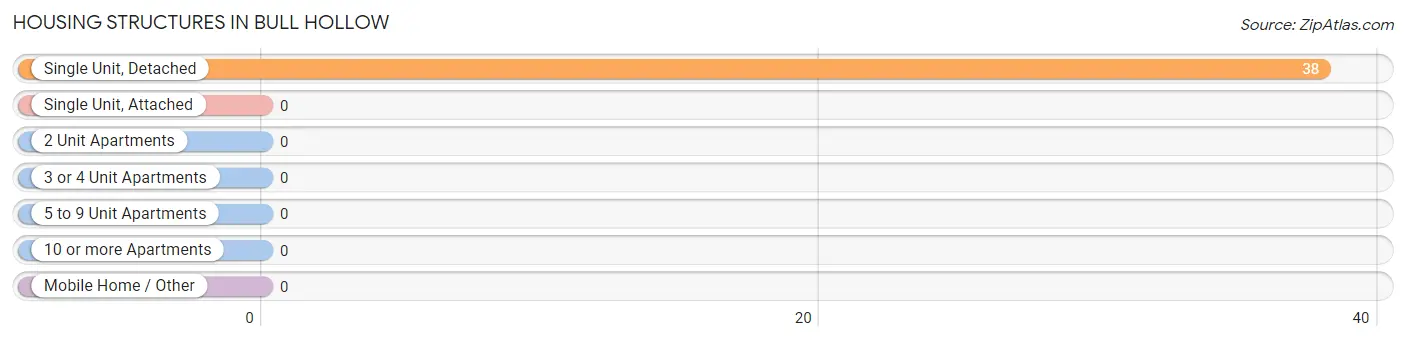
| Structure Type | # Housing Units | % Housing Units |
| Single Unit, Detached | 38 | 100.0% |
| Single Unit, Attached | 0 | 0.0% |
| 2 Unit Apartments | 0 | 0.0% |
| 3 or 4 Unit Apartments | 0 | 0.0% |
| 5 to 9 Unit Apartments | 0 | 0.0% |
| 10 or more Apartments | 0 | 0.0% |
| Mobile Home / Other | 0 | 0.0% |
| Total | 38 | 100.0% |
Housing Structures by Occupancy in Bull Hollow
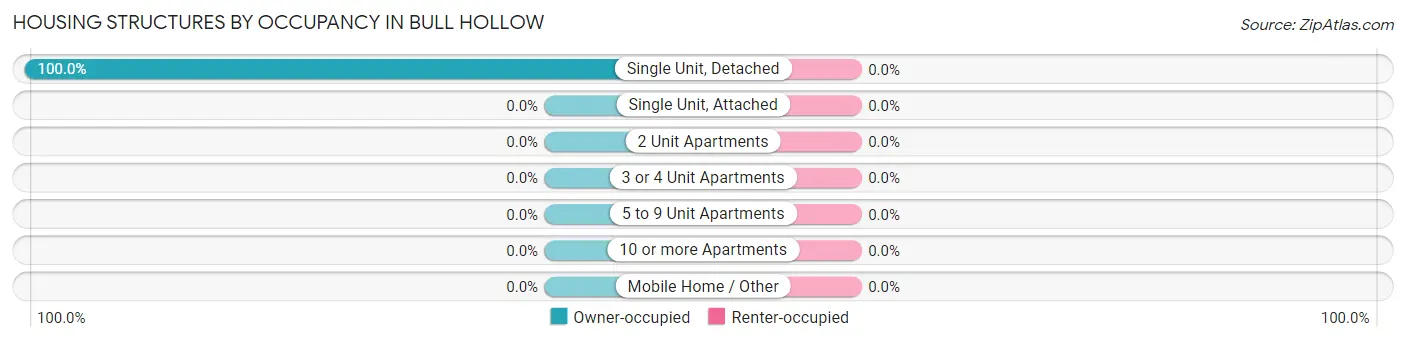
| Structure Type | Owner-occupied | Renter-occupied |
| Single Unit, Detached | 38 (100.0%) | 0 (0.0%) |
| Single Unit, Attached | 0 (0.0%) | 0 (0.0%) |
| 2 Unit Apartments | 0 (0.0%) | 0 (0.0%) |
| 3 or 4 Unit Apartments | 0 (0.0%) | 0 (0.0%) |
| 5 to 9 Unit Apartments | 0 (0.0%) | 0 (0.0%) |
| 10 or more Apartments | 0 (0.0%) | 0 (0.0%) |
| Mobile Home / Other | 0 (0.0%) | 0 (0.0%) |
| Total | 38 (100.0%) | 0 (0.0%) |
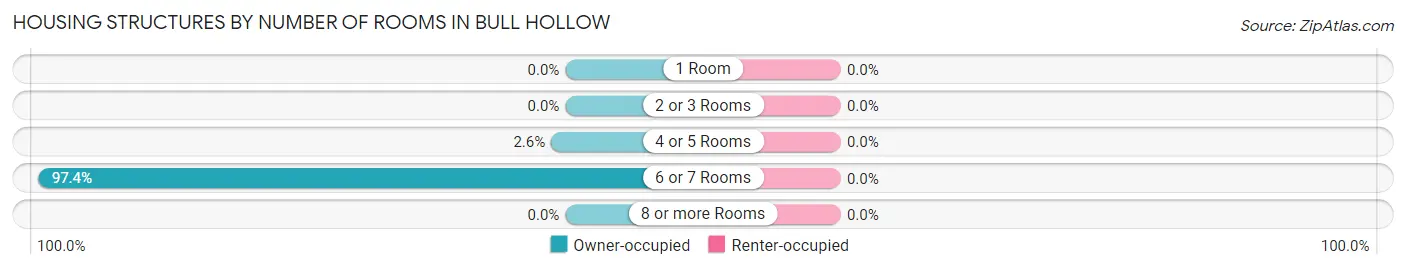
Housing Structures by Number of Rooms in Bull Hollow
| Number of Rooms | Owner-occupied | Renter-occupied |
| 1 Room | 0 (0.0%) | 0 (0.0%) |
| 2 or 3 Rooms | 0 (0.0%) | 0 (0.0%) |
| 4 or 5 Rooms | 1 (2.6%) | 0 (0.0%) |
| 6 or 7 Rooms | 37 (97.4%) | 0 (0.0%) |
| 8 or more Rooms | 0 (0.0%) | 0 (0.0%) |
| Total | 38 (100.0%) | 0 (0.0%) |
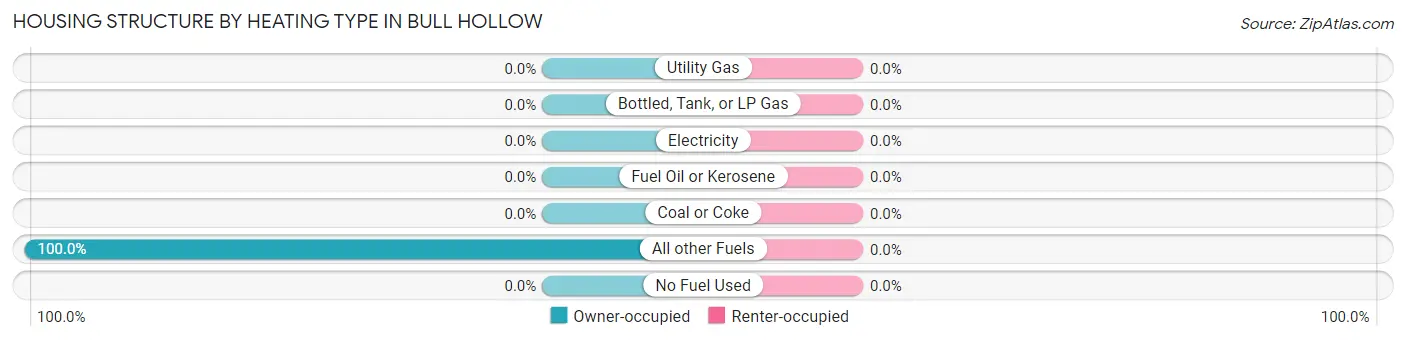
Housing Structure by Heating Type in Bull Hollow
| Heating Type | Owner-occupied | Renter-occupied |
| Utility Gas | 0 (0.0%) | 0 (0.0%) |
| Bottled, Tank, or LP Gas | 0 (0.0%) | 0 (0.0%) |
| Electricity | 0 (0.0%) | 0 (0.0%) |
| Fuel Oil or Kerosene | 0 (0.0%) | 0 (0.0%) |
| Coal or Coke | 0 (0.0%) | 0 (0.0%) |
| All other Fuels | 38 (100.0%) | 0 (0.0%) |
| No Fuel Used | 0 (0.0%) | 0 (0.0%) |
| Total | 38 (100.0%) | 0 (0.0%) |
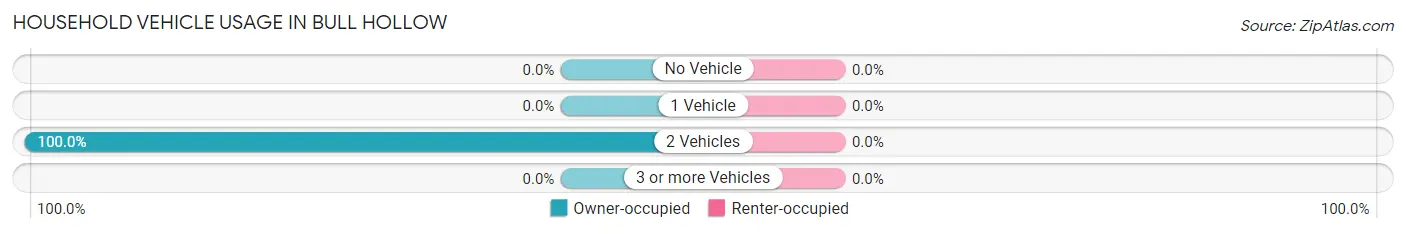
Household Vehicle Usage in Bull Hollow
| Vehicles per Household | Owner-occupied | Renter-occupied |
| No Vehicle | 0 (0.0%) | 0 (0.0%) |
| 1 Vehicle | 0 (0.0%) | 0 (0.0%) |
| 2 Vehicles | 38 (100.0%) | 0 (0.0%) |
| 3 or more Vehicles | 0 (0.0%) | 0 (0.0%) |
| Total | 38 (100.0%) | 0 (0.0%) |
Real Estate & Mortgages in Bull Hollow
Real Estate and Mortgage Overview in Bull Hollow
| Characteristic | Without Mortgage | With Mortgage |
| Housing Units | 38 | 0 |
| Median Property Value | - | - |
| Median Household Income | - | - |
| Monthly Housing Costs | - | - |
| Real Estate Taxes | - | - |
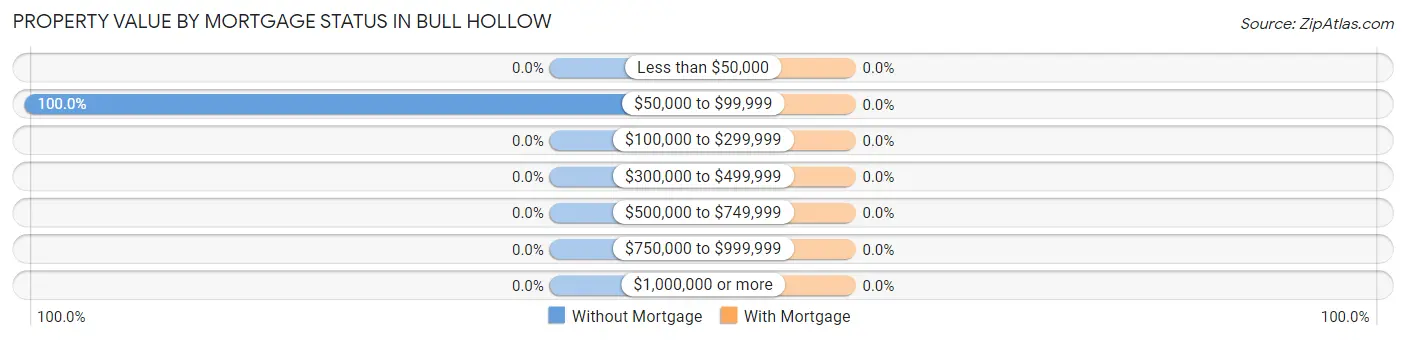
Property Value by Mortgage Status in Bull Hollow
| Property Value | Without Mortgage | With Mortgage |
| Less than $50,000 | 0 (0.0%) | 0 (0.0%) |
| $50,000 to $99,999 | 38 (100.0%) | 0 (0.0%) |
| $100,000 to $299,999 | 0 (0.0%) | 0 (0.0%) |
| $300,000 to $499,999 | 0 (0.0%) | 0 (0.0%) |
| $500,000 to $749,999 | 0 (0.0%) | 0 (0.0%) |
| $750,000 to $999,999 | 0 (0.0%) | 0 (0.0%) |
| $1,000,000 or more | 0 (0.0%) | 0 (0.0%) |
| Total | 38 (100.0%) | 0 (0.0%) |
Household Income by Mortgage Status in Bull Hollow
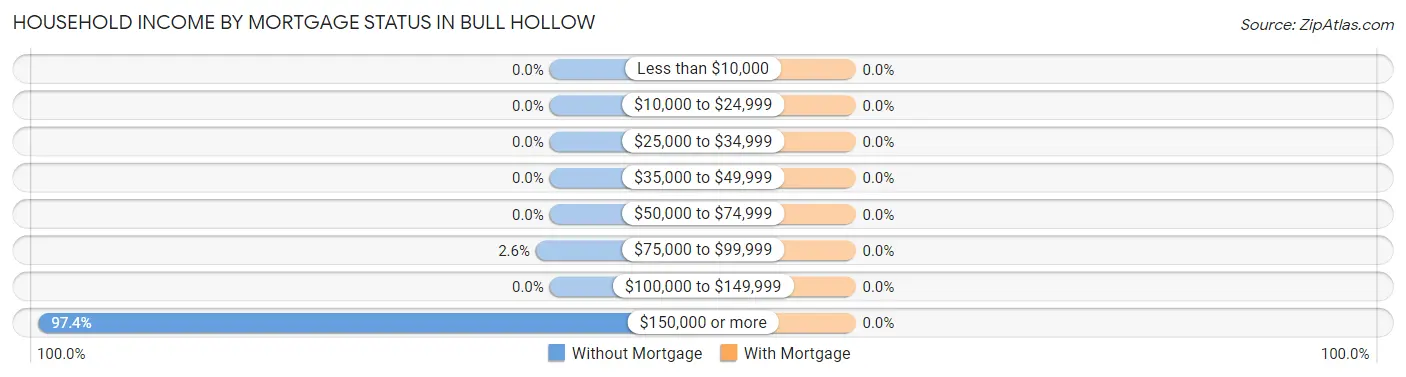
| Household Income | Without Mortgage | With Mortgage |
| Less than $10,000 | 0 (0.0%) | 0 (0.0%) |
| $10,000 to $24,999 | 0 (0.0%) | 0 (0.0%) |
| $25,000 to $34,999 | 0 (0.0%) | 0 (0.0%) |
| $35,000 to $49,999 | 0 (0.0%) | 0 (0.0%) |
| $50,000 to $74,999 | 0 (0.0%) | 0 (0.0%) |
| $75,000 to $99,999 | 1 (2.6%) | 0 (0.0%) |
| $100,000 to $149,999 | 0 (0.0%) | 0 (0.0%) |
| $150,000 or more | 37 (97.4%) | 0 (0.0%) |
| Total | 38 (100.0%) | 0 (0.0%) |
Property Value to Household Income Ratio in Bull Hollow
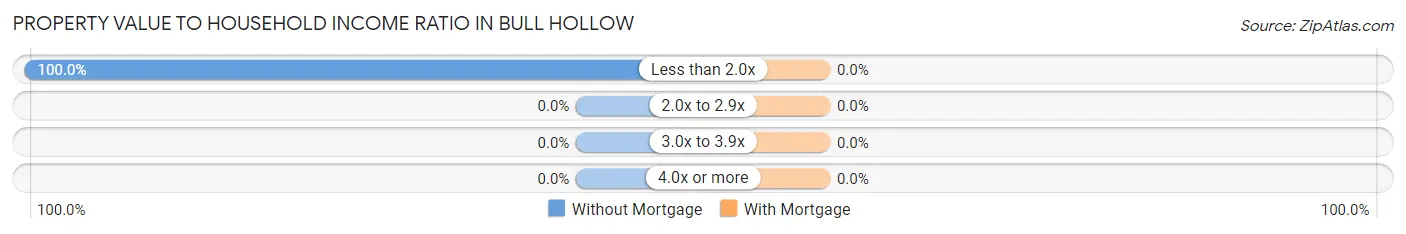
| Value-to-Income Ratio | Without Mortgage | With Mortgage |
| Less than 2.0x | 38 (100.0%) | 0 (0.0%) |
| 2.0x to 2.9x | 0 (0.0%) | 0 (0.0%) |
| 3.0x to 3.9x | 0 (0.0%) | 0 (0.0%) |
| 4.0x or more | 0 (0.0%) | 0 (0.0%) |
| Total | 38 (100.0%) | 0 (0.0%) |
Real Estate Taxes by Mortgage Status in Bull Hollow
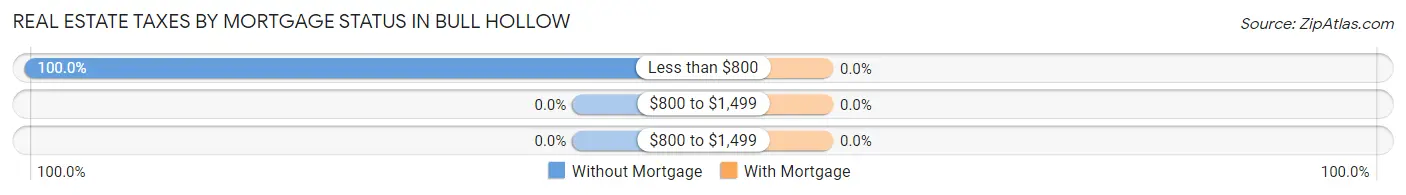
| Property Taxes | Without Mortgage | With Mortgage |
| Less than $800 | 38 (100.0%) | 0 (0.0%) |
| $800 to $1,499 | 0 (0.0%) | 0 (0.0%) |
| $800 to $1,499 | 0 (0.0%) | 0 (0.0%) |
| Total | 38 (100.0%) | 0 (0.0%) |
Health & Disability in Bull Hollow
Health Insurance Coverage by Age in Bull Hollow
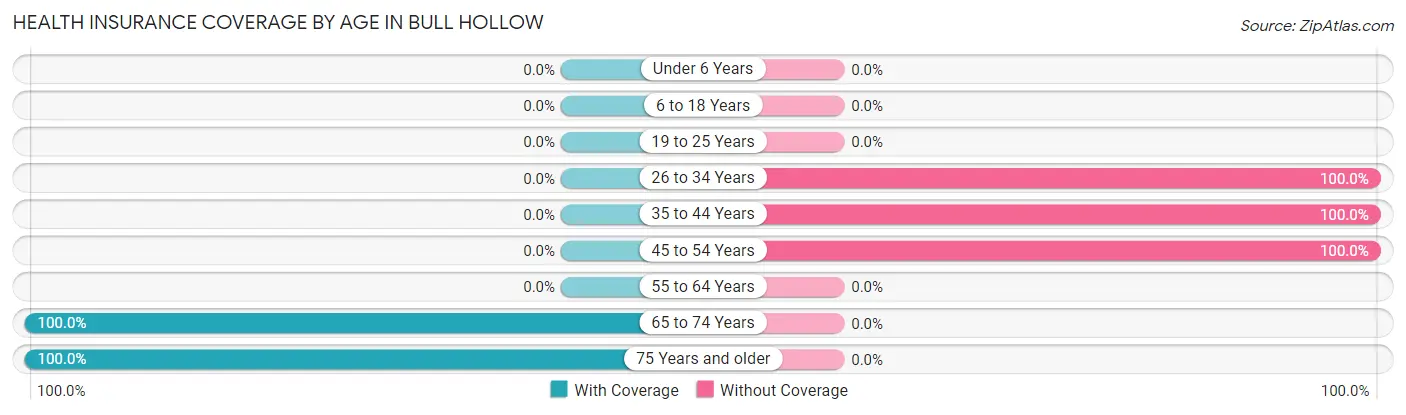
| Age Bracket | With Coverage | Without Coverage |
| Under 6 Years | 0 (0.0%) | 0 (0.0%) |
| 6 to 18 Years | 0 (0.0%) | 0 (0.0%) |
| 19 to 25 Years | 0 (0.0%) | 0 (0.0%) |
| 26 to 34 Years | 0 (0.0%) | 28 (100.0%) |
| 35 to 44 Years | 0 (0.0%) | 39 (100.0%) |
| 45 to 54 Years | 0 (0.0%) | 19 (100.0%) |
| 55 to 64 Years | 0 (0.0%) | 0 (0.0%) |
| 65 to 74 Years | 38 (100.0%) | 0 (0.0%) |
| 75 Years and older | 1 (100.0%) | 0 (0.0%) |
| Total | 39 (31.2%) | 86 (68.8%) |
Health Insurance Coverage by Citizenship Status in Bull Hollow
| Citizenship Status | With Coverage | Without Coverage |
| Native Born | 0 (0.0%) | 0 (0.0%) |
| Foreign Born, Citizen | 0 (0.0%) | 0 (0.0%) |
| Foreign Born, not a Citizen | 0 (0.0%) | 0 (0.0%) |
Health Insurance Coverage by Household Income in Bull Hollow
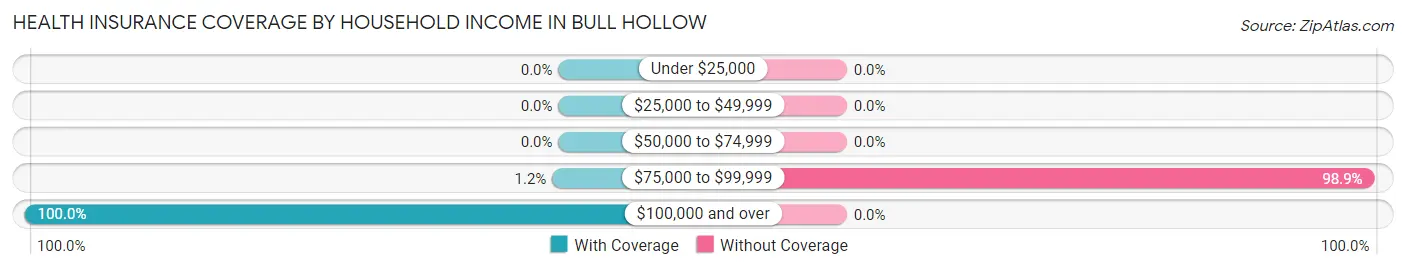
| Household Income | With Coverage | Without Coverage |
| Under $25,000 | 0 (0.0%) | 0 (0.0%) |
| $25,000 to $49,999 | 0 (0.0%) | 0 (0.0%) |
| $50,000 to $74,999 | 0 (0.0%) | 0 (0.0%) |
| $75,000 to $99,999 | 1 (1.1%) | 86 (98.9%) |
| $100,000 and over | 38 (100.0%) | 0 (0.0%) |
Public vs Private Health Insurance Coverage by Age in Bull Hollow
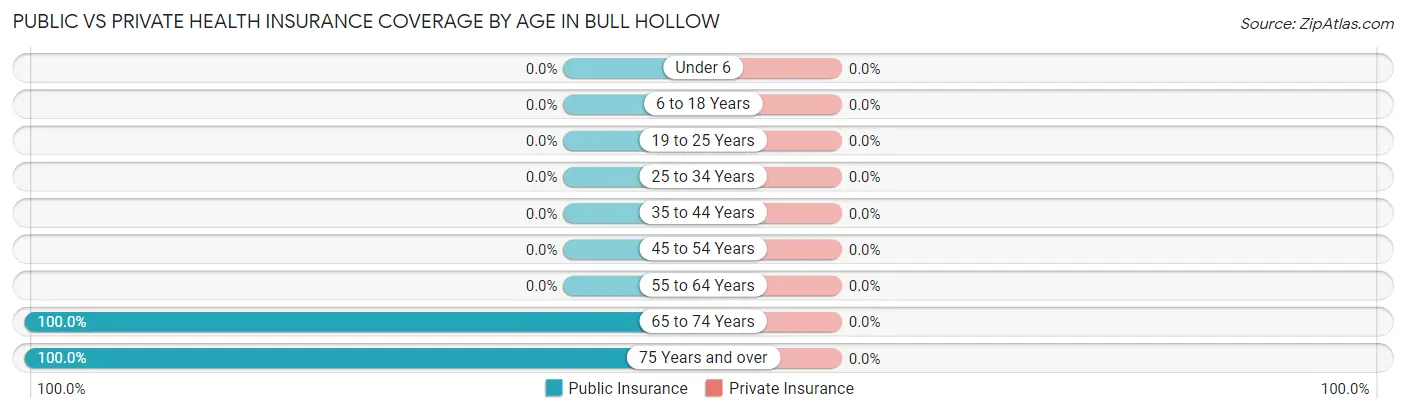
| Age Bracket | Public Insurance | Private Insurance |
| Under 6 | 0 (0.0%) | 0 (0.0%) |
| 6 to 18 Years | 0 (0.0%) | 0 (0.0%) |
| 19 to 25 Years | 0 (0.0%) | 0 (0.0%) |
| 25 to 34 Years | 0 (0.0%) | 0 (0.0%) |
| 35 to 44 Years | 0 (0.0%) | 0 (0.0%) |
| 45 to 54 Years | 0 (0.0%) | 0 (0.0%) |
| 55 to 64 Years | 0 (0.0%) | 0 (0.0%) |
| 65 to 74 Years | 38 (100.0%) | 0 (0.0%) |
| 75 Years and over | 1 (100.0%) | 0 (0.0%) |
| Total | 39 (31.2%) | 0 (0.0%) |
Disability Status by Sex by Age in Bull Hollow
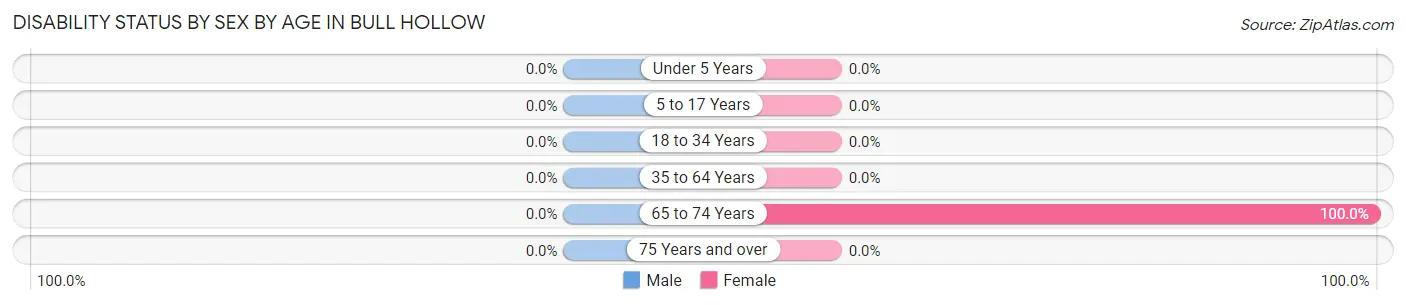
| Age Bracket | Male | Female |
| Under 5 Years | 0 (0.0%) | 0 (0.0%) |
| 5 to 17 Years | 0 (0.0%) | 0 (0.0%) |
| 18 to 34 Years | 0 (0.0%) | 0 (0.0%) |
| 35 to 64 Years | 0 (0.0%) | 0 (0.0%) |
| 65 to 74 Years | 0 (0.0%) | 1 (100.0%) |
| 75 Years and over | 0 (0.0%) | 0 (0.0%) |
Disability Class by Sex by Age in Bull Hollow
Disability Class: Hearing Difficulty
| Age Bracket | Male | Female |
| Under 5 Years | 0 (0.0%) | 0 (0.0%) |
| 5 to 17 Years | 0 (0.0%) | 0 (0.0%) |
| 18 to 34 Years | 0 (0.0%) | 0 (0.0%) |
| 35 to 64 Years | 0 (0.0%) | 0 (0.0%) |
| 65 to 74 Years | 0 (0.0%) | 0 (0.0%) |
| 75 Years and over | 0 (0.0%) | 0 (0.0%) |
Disability Class: Vision Difficulty
| Age Bracket | Male | Female |
| Under 5 Years | 0 (0.0%) | 0 (0.0%) |
| 5 to 17 Years | 0 (0.0%) | 0 (0.0%) |
| 18 to 34 Years | 0 (0.0%) | 0 (0.0%) |
| 35 to 64 Years | 0 (0.0%) | 0 (0.0%) |
| 65 to 74 Years | 0 (0.0%) | 0 (0.0%) |
| 75 Years and over | 0 (0.0%) | 0 (0.0%) |
Disability Class: Cognitive Difficulty
| Age Bracket | Male | Female |
| 5 to 17 Years | 0 (0.0%) | 0 (0.0%) |
| 18 to 34 Years | 0 (0.0%) | 0 (0.0%) |
| 35 to 64 Years | 0 (0.0%) | 0 (0.0%) |
| 65 to 74 Years | 0 (0.0%) | 0 (0.0%) |
| 75 Years and over | 0 (0.0%) | 0 (0.0%) |
Disability Class: Ambulatory Difficulty
| Age Bracket | Male | Female |
| 5 to 17 Years | 0 (0.0%) | 0 (0.0%) |
| 18 to 34 Years | 0 (0.0%) | 0 (0.0%) |
| 35 to 64 Years | 0 (0.0%) | 0 (0.0%) |
| 65 to 74 Years | 0 (0.0%) | 0 (0.0%) |
| 75 Years and over | 0 (0.0%) | 0 (0.0%) |
Disability Class: Self-Care Difficulty
| Age Bracket | Male | Female |
| 5 to 17 Years | 0 (0.0%) | 0 (0.0%) |
| 18 to 34 Years | 0 (0.0%) | 0 (0.0%) |
| 35 to 64 Years | 0 (0.0%) | 0 (0.0%) |
| 65 to 74 Years | 0 (0.0%) | 0 (0.0%) |
| 75 Years and over | 0 (0.0%) | 0 (0.0%) |
Technology Access in Bull Hollow
Computing Device Access in Bull Hollow
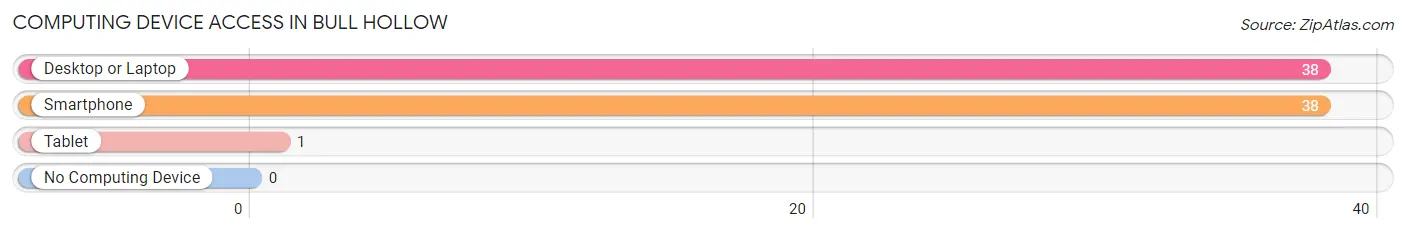
| Device Type | # Households | % Households |
| Desktop or Laptop | 38 | 100.0% |
| Smartphone | 38 | 100.0% |
| Tablet | 1 | 2.6% |
| No Computing Device | 0 | 0.0% |
| Total | 38 | 100.0% |
Internet Access in Bull Hollow
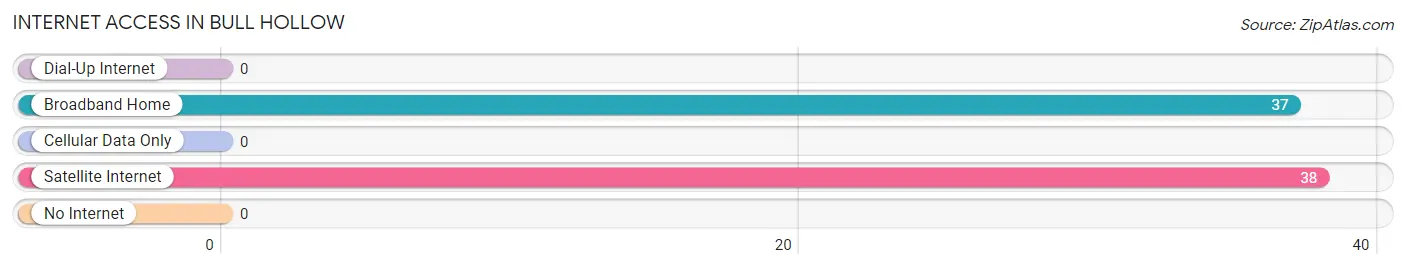
| Internet Type | # Households | % Households |
| Dial-Up Internet | 0 | 0.0% |
| Broadband Home | 37 | 97.4% |
| Cellular Data Only | 0 | 0.0% |
| Satellite Internet | 38 | 100.0% |
| No Internet | 0 | 0.0% |
| Total | 38 | 100.0% |
Bull Hollow Summary
Hollow, Oklahoma is a small unincorporated community located in the southeastern corner of the state. It is situated in the foothills of the Ozark Mountains, and is part of the Ozark Plateau. The area is known for its rolling hills, lush forests, and abundant wildlife. The population of Hollow is estimated to be around 200 people.
History
Hollow was first settled in the late 1800s by a group of settlers from the nearby town of Ozark. The settlers were looking for a place to call home and found the area to be ideal for farming and ranching. The area was originally known as “Bull Hollow” due to the abundance of wild bulls in the area. The name was eventually shortened to “Hollow” and the area became known as such.
The area was primarily used for farming and ranching until the early 1900s when oil was discovered in the area. This led to an influx of people and businesses to the area, and the population of Hollow began to grow. The town was officially incorporated in 1910 and the population continued to grow until the 1950s when the oil industry began to decline.
Geography
Hollow is located in the southeastern corner of Oklahoma, in the foothills of the Ozark Mountains. The area is known for its rolling hills, lush forests, and abundant wildlife. The area is also home to several creeks and rivers, including the Arkansas River, which flows through the area.
The climate in Hollow is generally mild, with hot summers and cold winters. The average temperature in the summer is around 80 degrees Fahrenheit, and the average temperature in the winter is around 40 degrees Fahrenheit.
Economy
The economy of Hollow is primarily based on agriculture and ranching. The area is known for its cattle and dairy farms, as well as its timber and oil production. The area is also home to several small businesses, including restaurants, stores, and other services.
Demographics
The population of Hollow is estimated to be around 200 people. The majority of the population is white, with a small percentage of African Americans, Native Americans, and other ethnicities. The median household income in Hollow is around $30,000, and the median age is around 40 years old.
Conclusion
Hollow, Oklahoma is a small unincorporated community located in the southeastern corner of the state. It is situated in the foothills of the Ozark Mountains, and is part of the Ozark Plateau. The area is known for its rolling hills, lush forests, and abundant wildlife. The economy of Hollow is primarily based on agriculture and ranching, and the population is estimated to be around 200 people. The majority of the population is white, with a small percentage of African Americans, Native Americans, and other ethnicities. The median household income in Hollow is around $30,000, and the median age is around 40 years old.
Common Questions
What is Per Capita Income in Bull Hollow?
Per Capita income in Bull Hollow is $57,905.
What is Inequality or Gini Index in Bull Hollow?
Inequality or Gini Index in Bull Hollow is 0.01.
What is the Total Population of Bull Hollow?
Total Population of Bull Hollow is 125.
What is the Total Male Population of Bull Hollow?
Total Male Population of Bull Hollow is 96.
What is the Total Female Population of Bull Hollow?
Total Female Population of Bull Hollow is 29.
What is the Ratio of Males per 100 Females in Bull Hollow?
There are 331.03 Males per 100 Females in Bull Hollow.
What is the Ratio of Females per 100 Males in Bull Hollow?
There are 30.21 Females per 100 Males in Bull Hollow.
What is the Median Population Age in Bull Hollow?
Median Population Age in Bull Hollow is 39.9 Years.
What is the Average Family Size in Bull Hollow
Average Family Size in Bull Hollow is 3.3 People.
What is the Average Household Size in Bull Hollow
Average Household Size in Bull Hollow is 3.3 People.
How Large is the Labor Force in Bull Hollow?
There are 86 People in the Labor Forcein in Bull Hollow.
What is the Percentage of People in the Labor Force in Bull Hollow?
68.8% of People are in the Labor Force in Bull Hollow.
What is the Unemployment Rate in Bull Hollow?
Unemployment Rate in Bull Hollow is 45.3%.