Central, AZ Map & Demographics
Central Map
Central Overview
$47,554
PER CAPITA INCOME
$96,607
AVG FAMILY INCOME
$88,645
AVG HOUSEHOLD INCOME
1.4%
WAGE / INCOME GAP [ % ]
98.6¢/ $1
WAGE / INCOME GAP [ $ ]
0.16
INEQUALITY / GINI INDEX
375
TOTAL POPULATION
98
MALE POPULATION
277
FEMALE POPULATION
35.38
MALES / 100 FEMALES
282.65
FEMALES / 100 MALES
26.8
MEDIAN AGE
3.4
AVG FAMILY SIZE
2.0
AVG HOUSEHOLD SIZE
224
LABOR FORCE [ PEOPLE ]
84.2%
PERCENT IN LABOR FORCE
Central Zip Codes
Central Area Codes
Income in Central
Income Overview in Central
Per Capita Income in Central is $47,554, while median incomes of families and households are $96,607 and $88,645 respectively.
| Characteristic | Number | Measure |
| Per Capita Income | 375 | $47,554 |
| Median Family Income | 77 | $96,607 |
| Mean Family Income | 77 | $115,247 |
| Median Household Income | 189 | $88,645 |
| Mean Household Income | 189 | $95,226 |
| Income Deficit | 77 | $0 |
| Wage / Income Gap (%) | 375 | 1.41% |
| Wage / Income Gap ($) | 375 | 98.59¢ per $1 |
| Gini / Inequality Index | 375 | 0.16 |
Earnings by Sex in Central
Average Earnings in Central are $85,588, $86,563 for men and $85,342 for women, a difference of 1.4%.
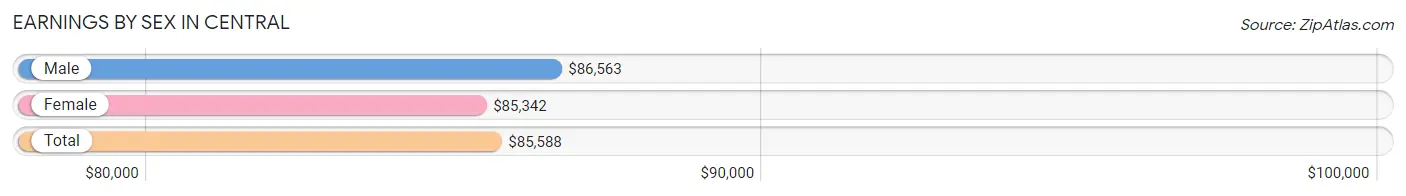
| Sex | Number | Average Earnings |
| Male | 60 (26.8%) | $86,563 |
| Female | 164 (73.2%) | $85,342 |
| Total | 224 (100.0%) | $85,588 |
Earnings by Sex by Income Bracket in Central
The most common earnings brackets in Central are $75,000 to $99,999 for men (49 | 81.7%) and $75,000 to $99,999 for women (95 | 57.9%).
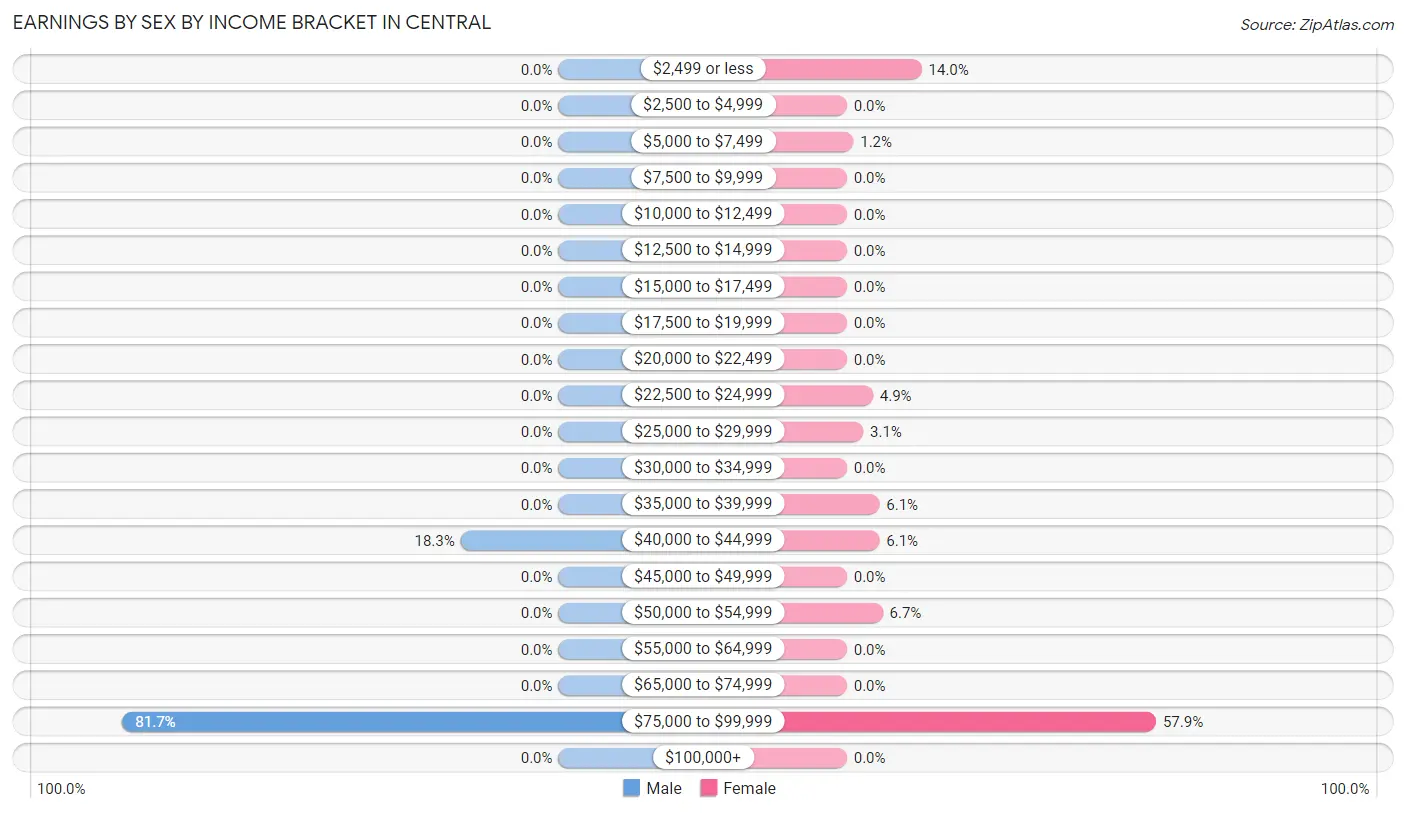
| Income | Male | Female |
| $2,499 or less | 0 (0.0%) | 23 (14.0%) |
| $2,500 to $4,999 | 0 (0.0%) | 0 (0.0%) |
| $5,000 to $7,499 | 0 (0.0%) | 2 (1.2%) |
| $7,500 to $9,999 | 0 (0.0%) | 0 (0.0%) |
| $10,000 to $12,499 | 0 (0.0%) | 0 (0.0%) |
| $12,500 to $14,999 | 0 (0.0%) | 0 (0.0%) |
| $15,000 to $17,499 | 0 (0.0%) | 0 (0.0%) |
| $17,500 to $19,999 | 0 (0.0%) | 0 (0.0%) |
| $20,000 to $22,499 | 0 (0.0%) | 0 (0.0%) |
| $22,500 to $24,999 | 0 (0.0%) | 8 (4.9%) |
| $25,000 to $29,999 | 0 (0.0%) | 5 (3.0%) |
| $30,000 to $34,999 | 0 (0.0%) | 0 (0.0%) |
| $35,000 to $39,999 | 0 (0.0%) | 10 (6.1%) |
| $40,000 to $44,999 | 11 (18.3%) | 10 (6.1%) |
| $45,000 to $49,999 | 0 (0.0%) | 0 (0.0%) |
| $50,000 to $54,999 | 0 (0.0%) | 11 (6.7%) |
| $55,000 to $64,999 | 0 (0.0%) | 0 (0.0%) |
| $65,000 to $74,999 | 0 (0.0%) | 0 (0.0%) |
| $75,000 to $99,999 | 49 (81.7%) | 95 (57.9%) |
| $100,000+ | 0 (0.0%) | 0 (0.0%) |
| Total | 60 (100.0%) | 164 (100.0%) |
Earnings by Sex by Educational Attainment in Central
Average earnings in Central are $86,563 for men and $85,368 for women, a difference of 1.4%. Men with an educational attainment of college or associate's degree enjoy the highest average annual earnings of $87,344, while those with college or associate's degree education earn the least with $87,344. Women with an educational attainment of graduate degree earn the most with the average annual earnings of $41,625, while those with graduate degree education have the smallest earnings of $41,625.
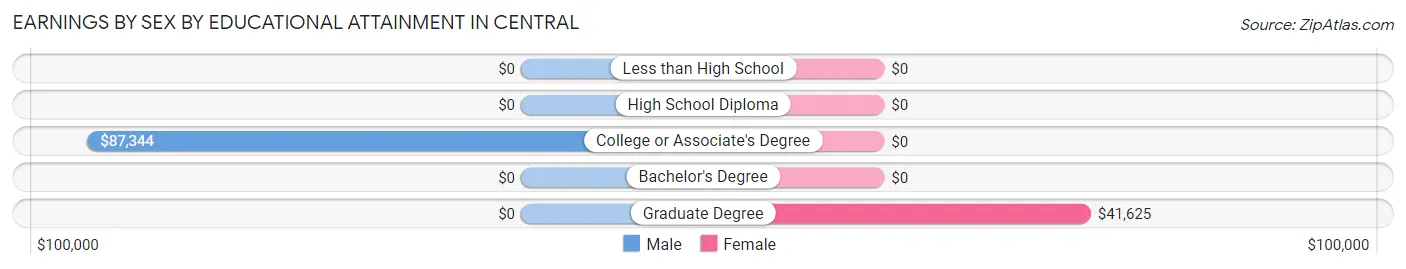
| Educational Attainment | Male Income | Female Income |
| Less than High School | - | - |
| High School Diploma | - | - |
| College or Associate's Degree | $87,344 | $0 |
| Bachelor's Degree | - | - |
| Graduate Degree | - | - |
| Total | $86,563 | $85,368 |
Family Income in Central
Family Income Brackets in Central
According to the Central family income data, there are 41 families falling into the $75,000 to $99,999 income range, which is the most common income bracket and makes up 53.2% of all families.
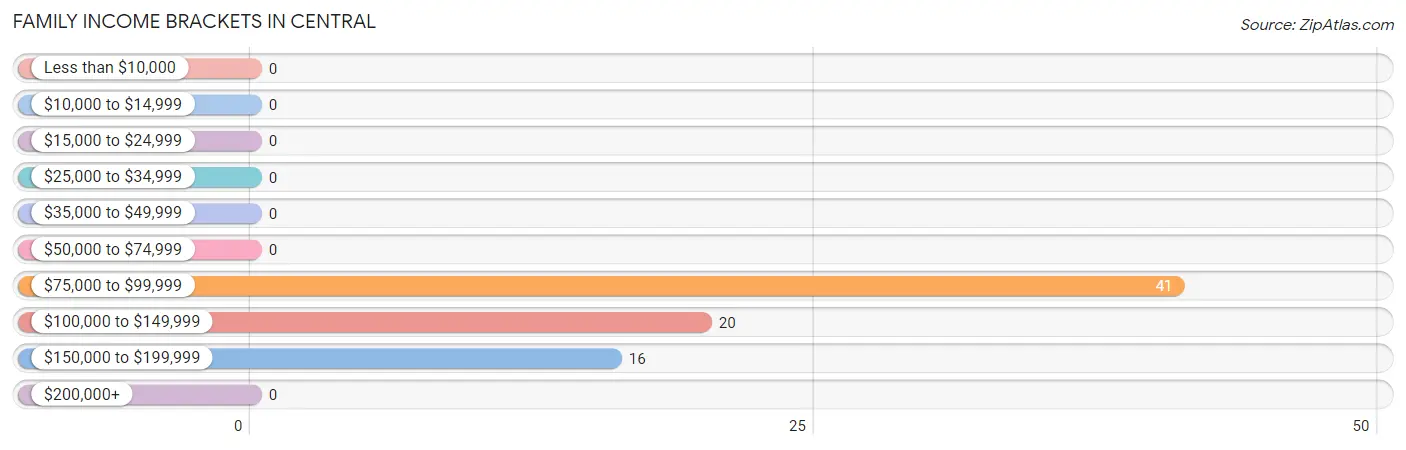
| Income Bracket | # Families | % Families |
| Less than $10,000 | 0 | 0.0% |
| $10,000 to $14,999 | 0 | 0.0% |
| $15,000 to $24,999 | 0 | 0.0% |
| $25,000 to $34,999 | 0 | 0.0% |
| $35,000 to $49,999 | 0 | 0.0% |
| $50,000 to $74,999 | 0 | 0.0% |
| $75,000 to $99,999 | 41 | 53.2% |
| $100,000 to $149,999 | 20 | 26.0% |
| $150,000 to $199,999 | 16 | 20.8% |
| $200,000+ | 0 | 0.0% |
Family Income by Famaliy Size in Central
| Income Bracket | # Families | Median Income |
| 2-Person Families | 28 (36.4%) | $0 |
| 3-Person Families | 10 (13.0%) | $0 |
| 4-Person Families | 24 (31.2%) | $0 |
| 5-Person Families | 10 (13.0%) | $0 |
| 6-Person Families | 5 (6.5%) | $0 |
| 7+ Person Families | 0 (0.0%) | $0 |
| Total | 77 (100.0%) | $96,607 |
Family Income by Number of Earners in Central
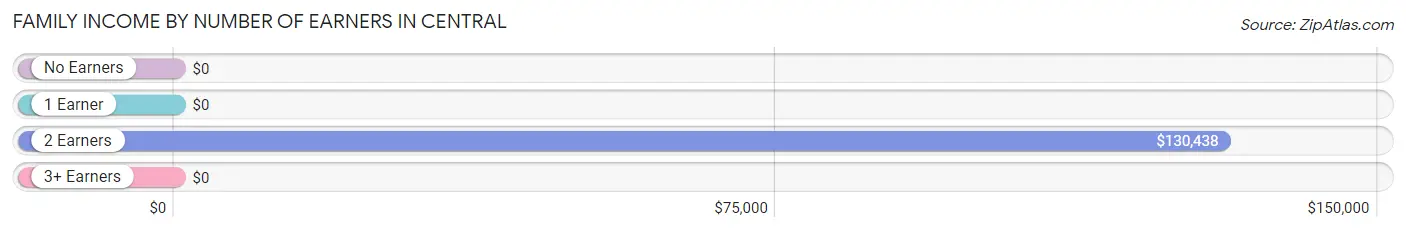
| Number of Earners | # Families | Median Income |
| No Earners | 7 (9.1%) | $0 |
| 1 Earner | 10 (13.0%) | $0 |
| 2 Earners | 55 (71.4%) | $130,438 |
| 3+ Earners | 5 (6.5%) | $0 |
| Total | 77 (100.0%) | $96,607 |
Household Income in Central
Household Income Brackets in Central
With 136 households falling in the category, the $75,000 to $99,999 income range is the most frequent in Central, accounting for 72.0% of all households.
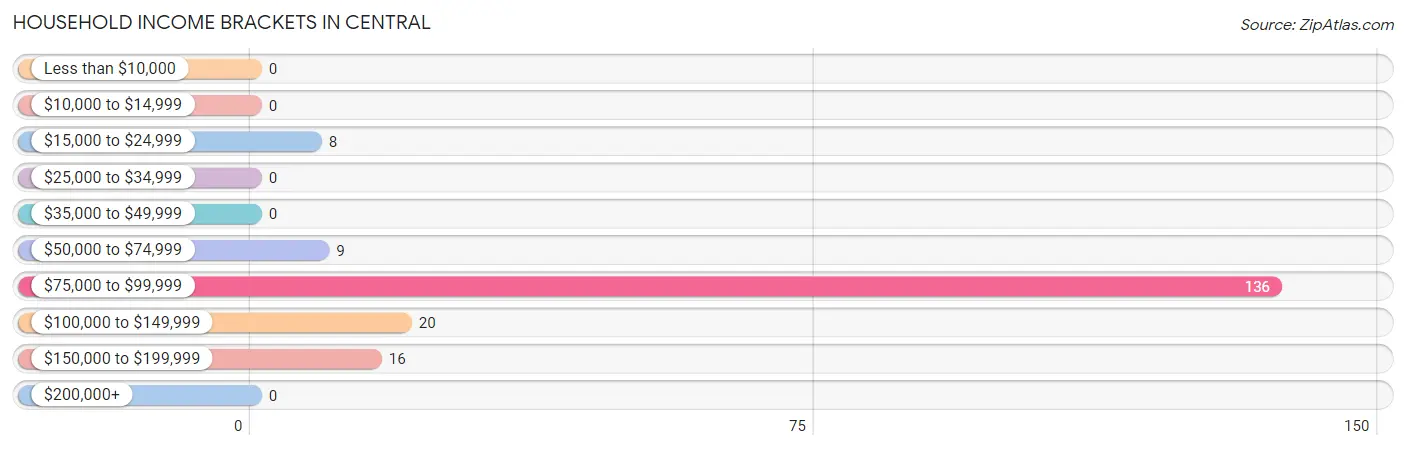
| Income Bracket | # Households | % Households |
| Less than $10,000 | 0 | 0.0% |
| $10,000 to $14,999 | 0 | 0.0% |
| $15,000 to $24,999 | 8 | 4.2% |
| $25,000 to $34,999 | 0 | 0.0% |
| $35,000 to $49,999 | 0 | 0.0% |
| $50,000 to $74,999 | 9 | 4.8% |
| $75,000 to $99,999 | 136 | 72.0% |
| $100,000 to $149,999 | 20 | 10.6% |
| $150,000 to $199,999 | 16 | 8.5% |
| $200,000+ | 0 | 0.0% |
Household Income by Householder Age in Central
The median household income in Central is $88,645, with the highest median household income of $168,182 found in the 45 to 64 years age bracket for the primary householder. A total of 26 households (13.8%) fall into this category.
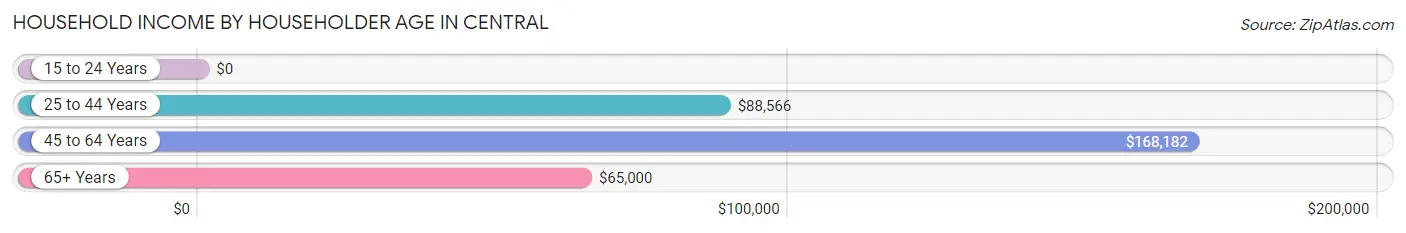
| Income Bracket | # Households | Median Income |
| 15 to 24 Years | 0 (0.0%) | $0 |
| 25 to 44 Years | 129 (68.2%) | $88,566 |
| 45 to 64 Years | 26 (13.8%) | $168,182 |
| 65+ Years | 34 (18.0%) | $65,000 |
| Total | 189 (100.0%) | $88,645 |
Poverty in Central
Income Below Poverty by Sex and Age in Central
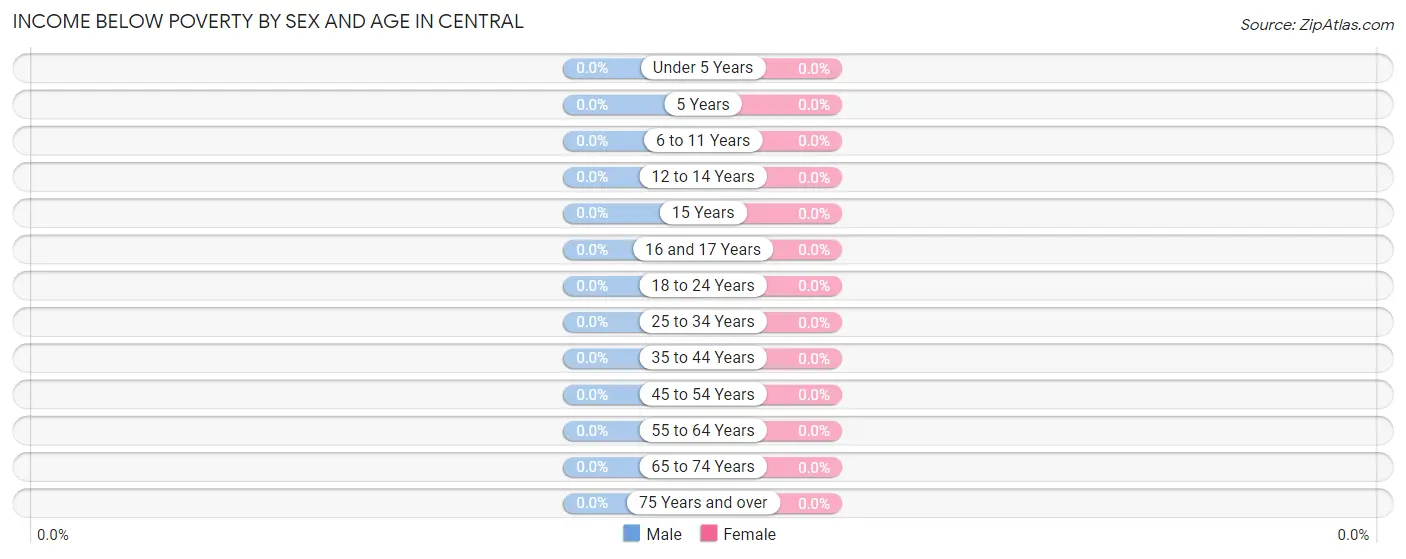
| Age Bracket | Male | Female |
| Under 5 Years | 0 (0.0%) | 0 (0.0%) |
| 5 Years | 0 (0.0%) | 0 (0.0%) |
| 6 to 11 Years | 0 (0.0%) | 0 (0.0%) |
| 12 to 14 Years | 0 (0.0%) | 0 (0.0%) |
| 15 Years | 0 (0.0%) | 0 (0.0%) |
| 16 and 17 Years | 0 (0.0%) | 0 (0.0%) |
| 18 to 24 Years | 0 (0.0%) | 0 (0.0%) |
| 25 to 34 Years | 0 (0.0%) | 0 (0.0%) |
| 35 to 44 Years | 0 (0.0%) | 0 (0.0%) |
| 45 to 54 Years | 0 (0.0%) | 0 (0.0%) |
| 55 to 64 Years | 0 (0.0%) | 0 (0.0%) |
| 65 to 74 Years | 0 (0.0%) | 0 (0.0%) |
| 75 Years and over | 0 (0.0%) | 0 (0.0%) |
| Total | 0 (0.0%) | 0 (0.0%) |
Income Above Poverty by Sex and Age in Central
According to the poverty statistics in Central, males aged 12 to 14 years and females aged under 5 years are the age groups that are most secure financially, with 100.0% of males and 100.0% of females in these age groups living above the poverty line.
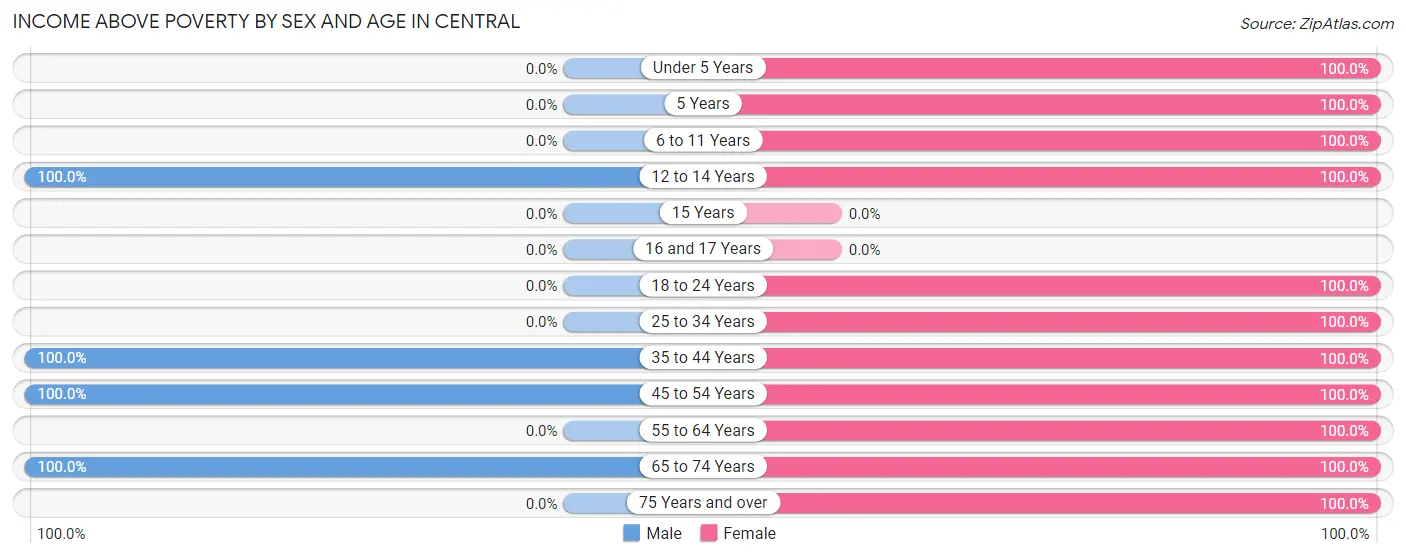
| Age Bracket | Male | Female |
| Under 5 Years | 0 (0.0%) | 37 (100.0%) |
| 5 Years | 0 (0.0%) | 3 (100.0%) |
| 6 to 11 Years | 0 (0.0%) | 46 (100.0%) |
| 12 to 14 Years | 20 (100.0%) | 3 (100.0%) |
| 15 Years | 0 (0.0%) | 0 (0.0%) |
| 16 and 17 Years | 0 (0.0%) | 0 (0.0%) |
| 18 to 24 Years | 0 (0.0%) | 2 (100.0%) |
| 25 to 34 Years | 0 (0.0%) | 95 (100.0%) |
| 35 to 44 Years | 35 (100.0%) | 33 (100.0%) |
| 45 to 54 Years | 25 (100.0%) | 26 (100.0%) |
| 55 to 64 Years | 0 (0.0%) | 8 (100.0%) |
| 65 to 74 Years | 18 (100.0%) | 16 (100.0%) |
| 75 Years and over | 0 (0.0%) | 8 (100.0%) |
| Total | 98 (100.0%) | 277 (100.0%) |
Income Below Poverty Among Married-Couple Families in Central
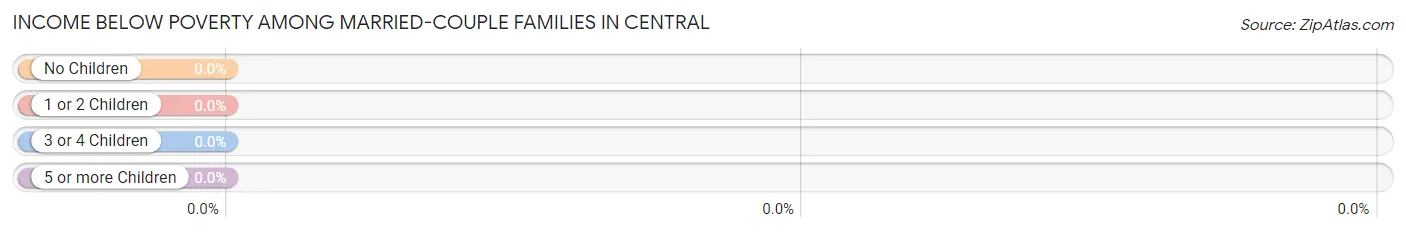
| Children | Above Poverty | Below Poverty |
| No Children | 28 (100.0%) | 0 (0.0%) |
| 1 or 2 Children | 34 (100.0%) | 0 (0.0%) |
| 3 or 4 Children | 15 (100.0%) | 0 (0.0%) |
| 5 or more Children | 0 (0.0%) | 0 (0.0%) |
| Total | 77 (100.0%) | 0 (0.0%) |
Income Below Poverty Among Single-Parent Households in Central
| Children | Single Father | Single Mother |
| No Children | 0 (0.0%) | 0 (0.0%) |
| 1 or 2 Children | 0 (0.0%) | 0 (0.0%) |
| 3 or 4 Children | 0 (0.0%) | 0 (0.0%) |
| 5 or more Children | 0 (0.0%) | 0 (0.0%) |
| Total | 0 (0.0%) | 0 (0.0%) |
Income Below Poverty Among Married-Couple vs Single-Parent Households in Central
| Children | Married-Couple Families | Single-Parent Households |
| No Children | 0 (0.0%) | 0 (0.0%) |
| 1 or 2 Children | 0 (0.0%) | 0 (0.0%) |
| 3 or 4 Children | 0 (0.0%) | 0 (0.0%) |
| 5 or more Children | 0 (0.0%) | 0 (0.0%) |
| Total | 0 (0.0%) | 0 (0.0%) |
Race in Central
The most populous races in Central are White / Caucasian (280 | 74.7%), and Asian (95 | 25.3%).
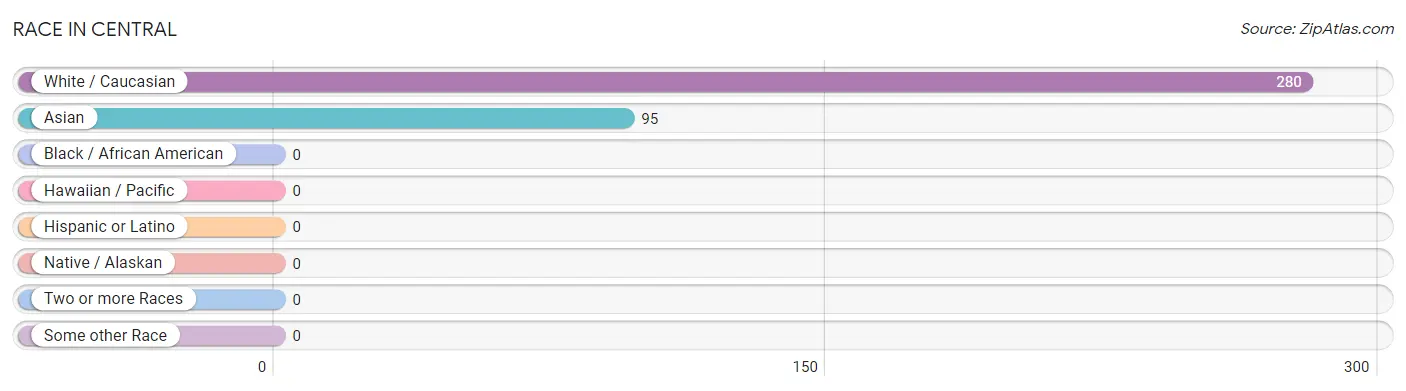
| Race | # Population | % Population |
| Asian | 95 | 25.3% |
| Black / African American | 0 | 0.0% |
| Hawaiian / Pacific | 0 | 0.0% |
| Hispanic or Latino | 0 | 0.0% |
| Native / Alaskan | 0 | 0.0% |
| White / Caucasian | 280 | 74.7% |
| Two or more Races | 0 | 0.0% |
| Some other Race | 0 | 0.0% |
| Total | 375 | 100.0% |
Ancestry in Central
The most populous ancestries reported in Central are Korean (95 | 25.3%), English (45 | 12.0%), German (24 | 6.4%), American (18 | 4.8%), and Scottish (18 | 4.8%), together accounting for 53.3% of all Central residents.
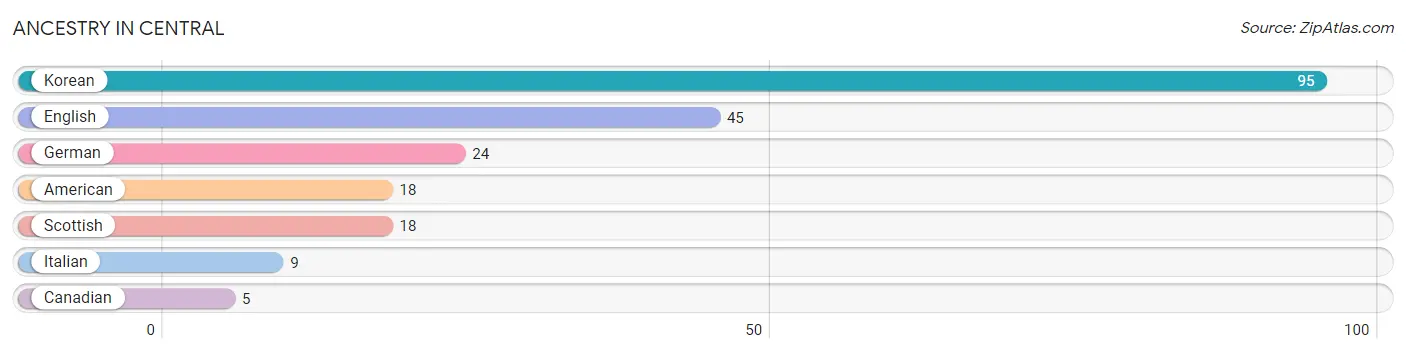
| Ancestry | # Population | % Population |
| American | 18 | 4.8% |
| Canadian | 5 | 1.3% |
| English | 45 | 12.0% |
| German | 24 | 6.4% |
| Italian | 9 | 2.4% |
| Korean | 95 | 25.3% |
| Scottish | 18 | 4.8% | View All 7 Rows |
Immigrants in Central

| Immigration Origin | # Population | % Population | View All 0 Rows |
Sex and Age in Central
Sex and Age in Central
The most populous age groups in Central are 40 to 44 Years (35 | 35.7%) for men and 25 to 29 Years (95 | 34.3%) for women.
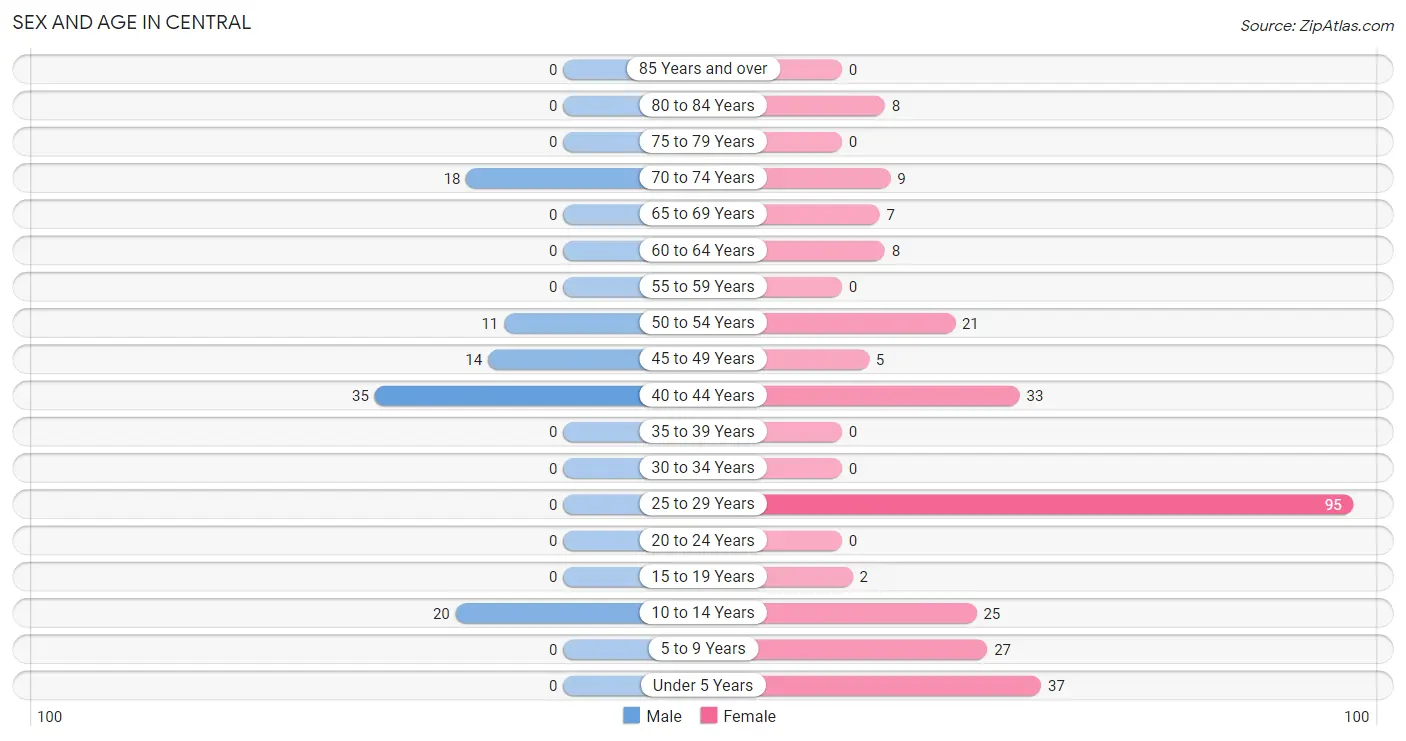
| Age Bracket | Male | Female |
| Under 5 Years | 0 (0.0%) | 37 (13.4%) |
| 5 to 9 Years | 0 (0.0%) | 27 (9.8%) |
| 10 to 14 Years | 20 (20.4%) | 25 (9.0%) |
| 15 to 19 Years | 0 (0.0%) | 2 (0.7%) |
| 20 to 24 Years | 0 (0.0%) | 0 (0.0%) |
| 25 to 29 Years | 0 (0.0%) | 95 (34.3%) |
| 30 to 34 Years | 0 (0.0%) | 0 (0.0%) |
| 35 to 39 Years | 0 (0.0%) | 0 (0.0%) |
| 40 to 44 Years | 35 (35.7%) | 33 (11.9%) |
| 45 to 49 Years | 14 (14.3%) | 5 (1.8%) |
| 50 to 54 Years | 11 (11.2%) | 21 (7.6%) |
| 55 to 59 Years | 0 (0.0%) | 0 (0.0%) |
| 60 to 64 Years | 0 (0.0%) | 8 (2.9%) |
| 65 to 69 Years | 0 (0.0%) | 7 (2.5%) |
| 70 to 74 Years | 18 (18.4%) | 9 (3.3%) |
| 75 to 79 Years | 0 (0.0%) | 0 (0.0%) |
| 80 to 84 Years | 0 (0.0%) | 8 (2.9%) |
| 85 Years and over | 0 (0.0%) | 0 (0.0%) |
| Total | 98 (100.0%) | 277 (100.0%) |
Families and Households in Central
Median Family Size in Central
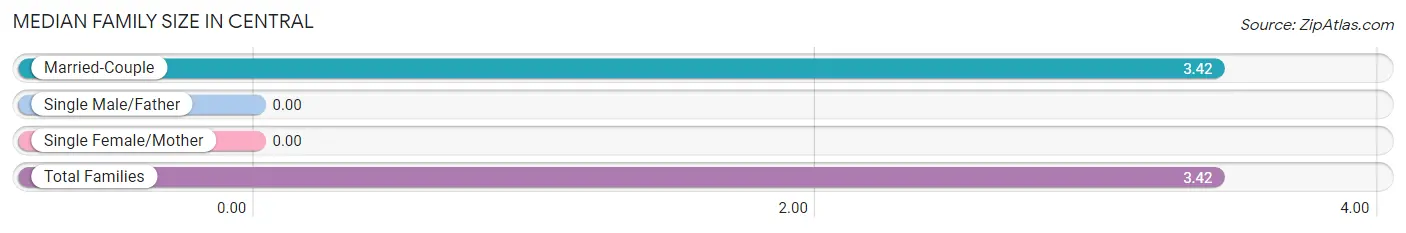
| Family Type | # Families | Family Size |
| Married-Couple | 77 (100.0%) | 3.42 |
| Single Male/Father | 0 (0.0%) | - |
| Single Female/Mother | 0 (0.0%) | - |
| Total Families | 77 (100.0%) | 3.42 |
Median Household Size in Central
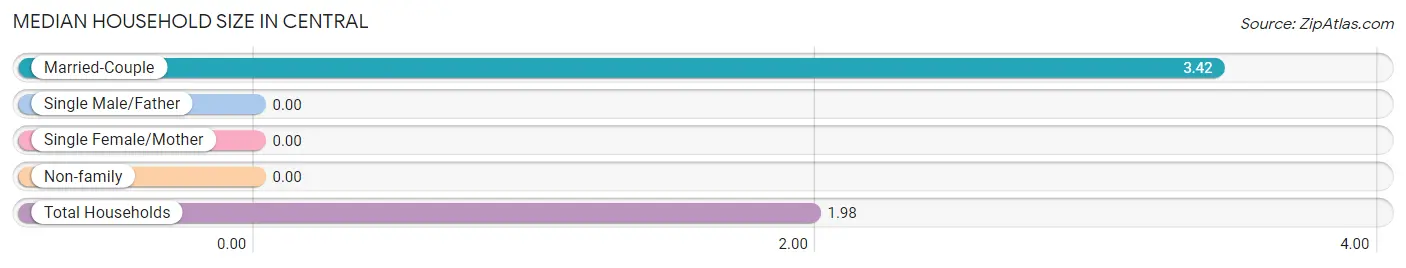
| Household Type | # Households | Household Size |
| Married-Couple | 77 (40.7%) | 3.42 |
| Single Male/Father | 0 (0.0%) | - |
| Single Female/Mother | 0 (0.0%) | - |
| Non-family | 112 (59.3%) | - |
| Total Households | 189 (100.0%) | 1.98 |
Household Size by Marriage Status in Central
Out of a total of 189 households in Central, 77 (40.7%) are family households, while 112 (59.3%) are nonfamily households. The most numerous type of family households are 2-person households, comprising 28, and the most common type of nonfamily households are 1-person households, comprising 112.
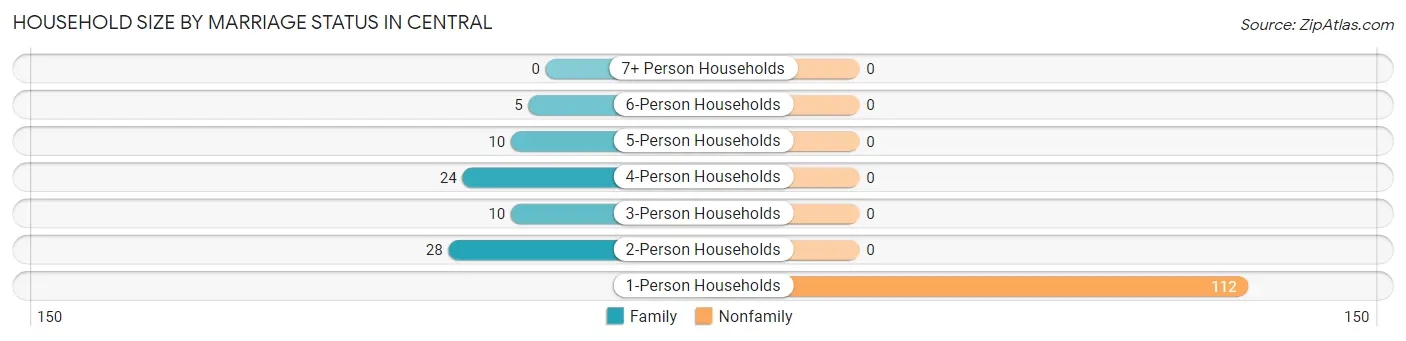
| Household Size | Family Households | Nonfamily Households |
| 1-Person Households | - | 112 (59.3%) |
| 2-Person Households | 28 (14.8%) | 0 (0.0%) |
| 3-Person Households | 10 (5.3%) | 0 (0.0%) |
| 4-Person Households | 24 (12.7%) | 0 (0.0%) |
| 5-Person Households | 10 (5.3%) | 0 (0.0%) |
| 6-Person Households | 5 (2.6%) | 0 (0.0%) |
| 7+ Person Households | 0 (0.0%) | 0 (0.0%) |
| Total | 77 (40.7%) | 112 (59.3%) |
Female Fertility in Central
Fertility by Age in Central
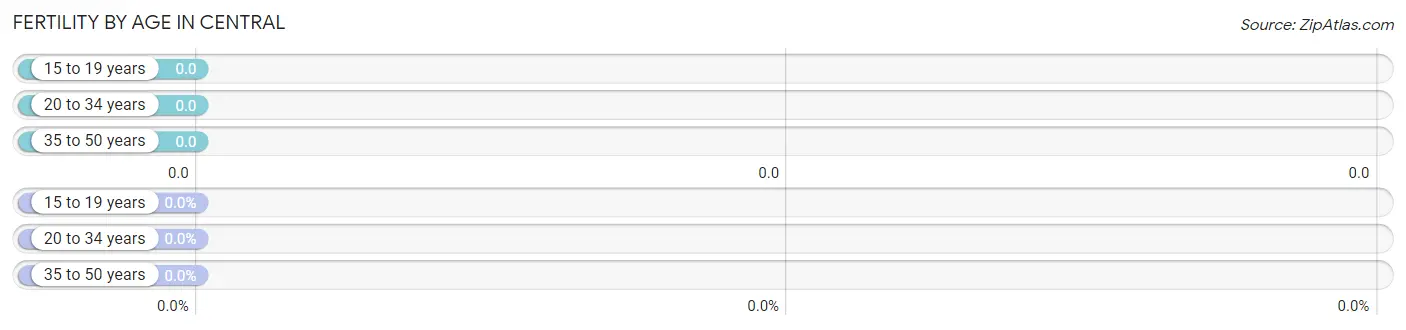
| Age Bracket | Women with Births | Births / 1,000 Women |
| 15 to 19 years | 0 (0.0%) | 0.0 |
| 20 to 34 years | 0 (0.0%) | 0.0 |
| 35 to 50 years | 0 (0.0%) | 0.0 |
| Total | 0 (0.0%) | 0.0 |
Fertility by Age by Marriage Status in Central
| Age Bracket | Married | Unmarried |
| 15 to 19 years | 0 (0.0%) | 0 (0.0%) |
| 20 to 34 years | 0 (0.0%) | 0 (0.0%) |
| 35 to 50 years | 0 (0.0%) | 0 (0.0%) |
| Total | 0 (0.0%) | 0 (0.0%) |
Fertility by Education in Central
| Educational Attainment | Women with Births | Births / 1,000 Women |
| Less than High School | 0 (0.0%) | 0.0 |
| High School Diploma | 0 (0.0%) | 0.0 |
| College or Associate's Degree | 0 (0.0%) | 0.0 |
| Bachelor's Degree | 0 (0.0%) | 0.0 |
| Graduate Degree | 0 (0.0%) | 0.0 |
| Total | 0 (0.0%) | 0.0 |
Fertility by Education by Marriage Status in Central
| Educational Attainment | Married | Unmarried |
| Less than High School | 0 (0.0%) | 0 (0.0%) |
| High School Diploma | 0 (0.0%) | 0 (0.0%) |
| College or Associate's Degree | 0 (0.0%) | 0 (0.0%) |
| Bachelor's Degree | 0 (0.0%) | 0 (0.0%) |
| Graduate Degree | 0 (0.0%) | 0 (0.0%) |
| Total | 0 (0.0%) | 0 (0.0%) |
Employment Characteristics in Central
Employment by Class of Employer in Central
Among the 224 employed individuals in Central, private company employees (150 | 67.0%), local government employees (45 | 20.1%), and state government employees (29 | 13.0%) make up the most common classes of employment.
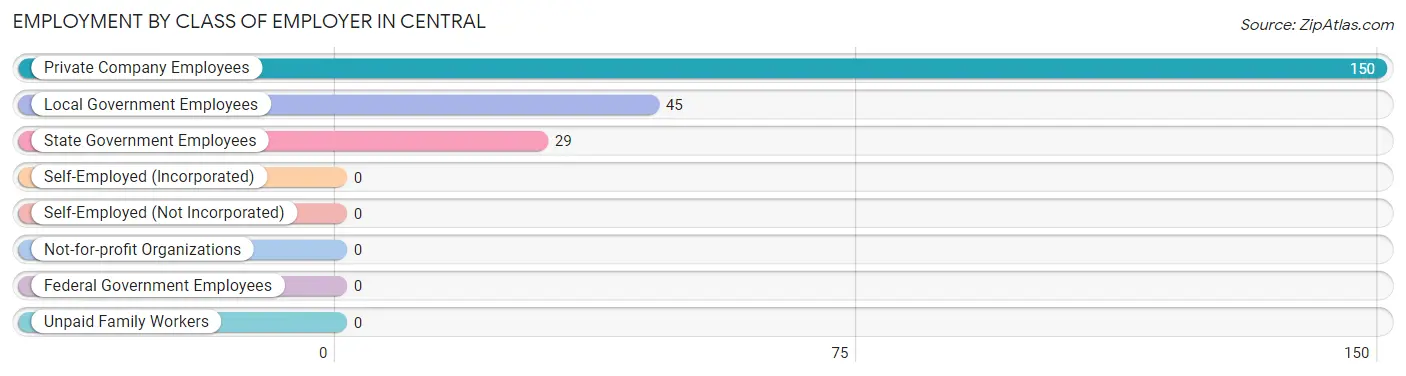
| Employer Class | # Employees | % Employees |
| Private Company Employees | 150 | 67.0% |
| Self-Employed (Incorporated) | 0 | 0.0% |
| Self-Employed (Not Incorporated) | 0 | 0.0% |
| Not-for-profit Organizations | 0 | 0.0% |
| Local Government Employees | 45 | 20.1% |
| State Government Employees | 29 | 13.0% |
| Federal Government Employees | 0 | 0.0% |
| Unpaid Family Workers | 0 | 0.0% |
| Total | 224 | 100.0% |
Employment Status by Age in Central
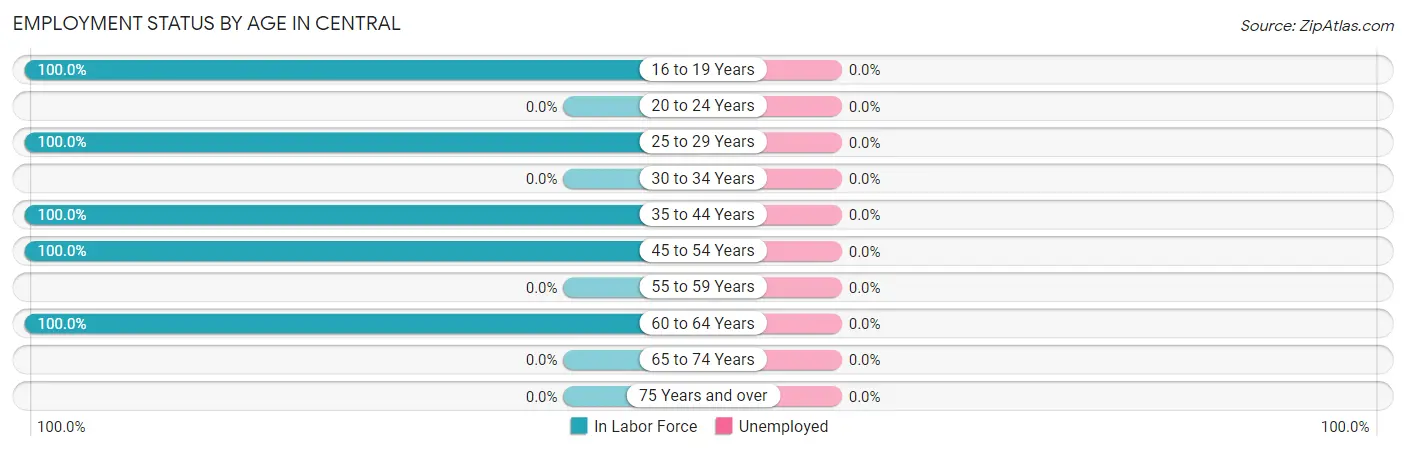
| Age Bracket | In Labor Force | Unemployed |
| 16 to 19 Years | 2 (100.0%) | 0 (0.0%) |
| 20 to 24 Years | 0 (0.0%) | 0 (0.0%) |
| 25 to 29 Years | 95 (100.0%) | 0 (0.0%) |
| 30 to 34 Years | 0 (0.0%) | 0 (0.0%) |
| 35 to 44 Years | 68 (100.0%) | 0 (0.0%) |
| 45 to 54 Years | 51 (100.0%) | 0 (0.0%) |
| 55 to 59 Years | 0 (0.0%) | 0 (0.0%) |
| 60 to 64 Years | 8 (100.0%) | 0 (0.0%) |
| 65 to 74 Years | 0 (0.0%) | 0 (0.0%) |
| 75 Years and over | 0 (0.0%) | 0 (0.0%) |
| Total | 224 (84.2%) | 0 (0.0%) |
Employment Status by Educational Attainment in Central
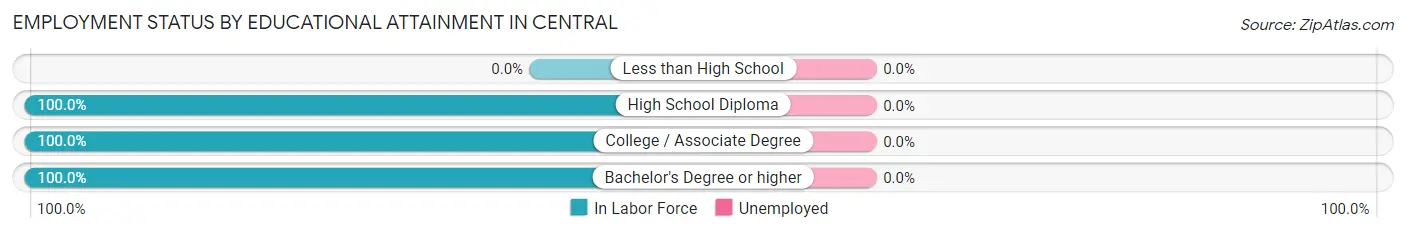
| Educational Attainment | In Labor Force | Unemployed |
| Less than High School | 0 (0.0%) | 0 (0.0%) |
| High School Diploma | 34 (100.0%) | 0 (0.0%) |
| College / Associate Degree | 55 (100.0%) | 0 (0.0%) |
| Bachelor's Degree or higher | 133 (100.0%) | 0 (0.0%) |
| Total | 222 (100.0%) | 0 (0.0%) |
Employment Occupations by Sex in Central
Management, Business, Science and Arts Occupations
The most common Management, Business, Science and Arts occupations in Central are Health Diagnosing & Treating (105 | 46.9%), Community & Social Service (33 | 14.7%), Education Instruction & Library (29 | 13.0%), Health Technologists (10 | 4.5%), and Legal Services & Support (4 | 1.8%).
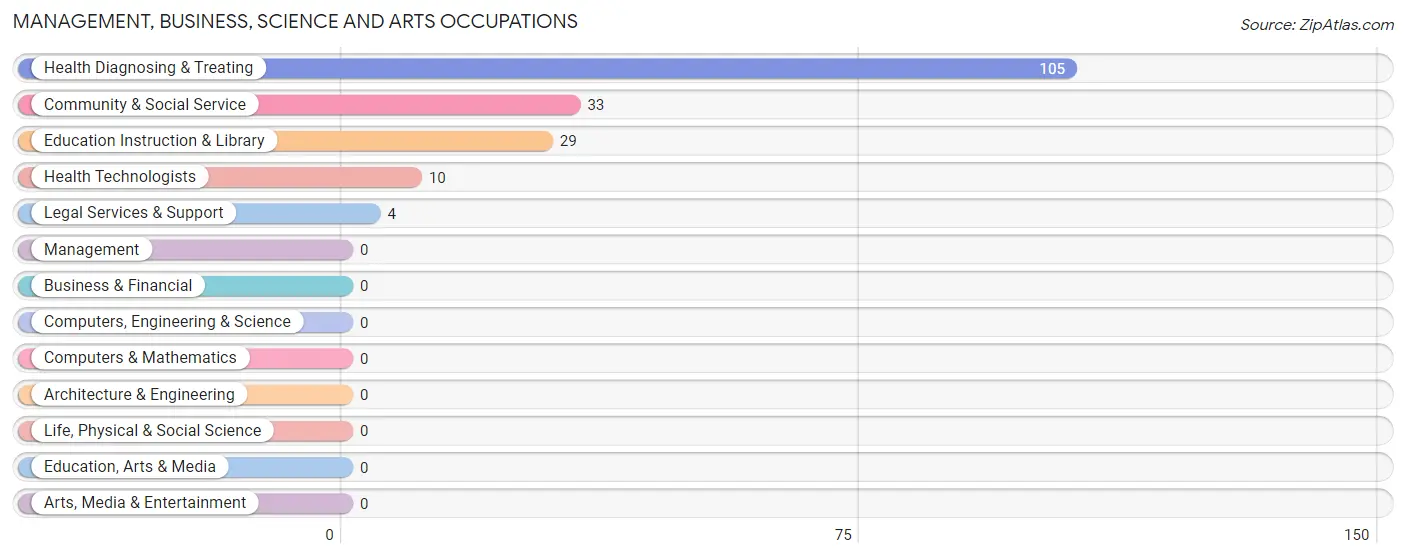
Management, Business, Science and Arts Occupations by Sex
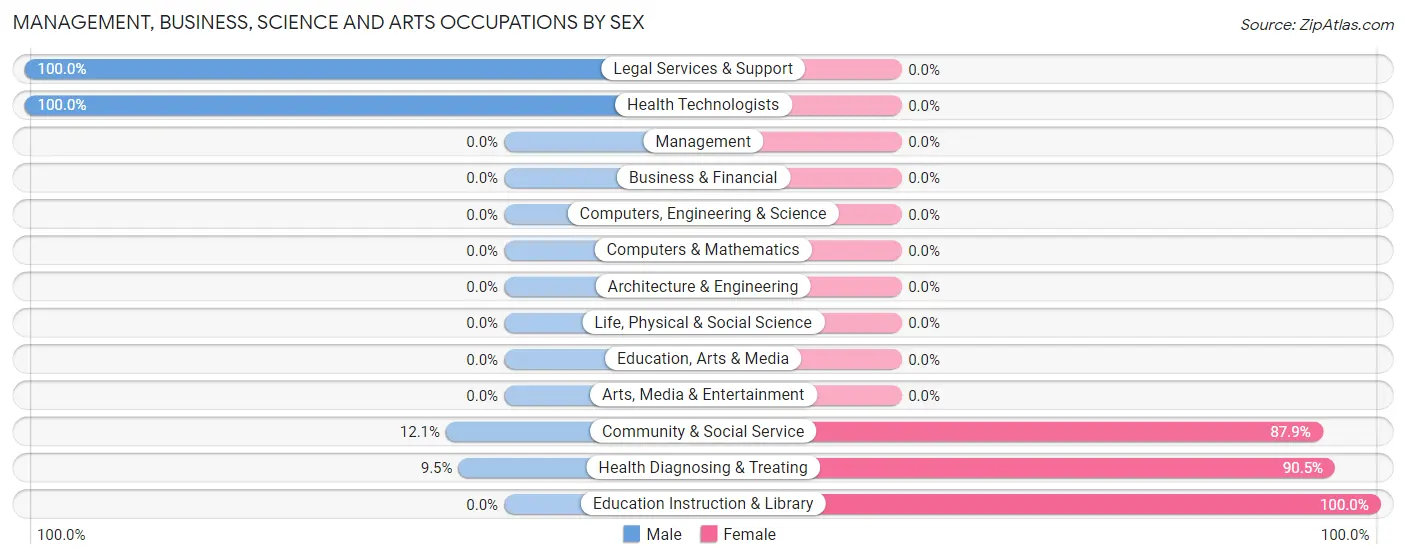
Within the Management, Business, Science and Arts occupations in Central, the most male-oriented occupations are Legal Services & Support (100.0%), Health Technologists (100.0%), and Community & Social Service (12.1%), while the most female-oriented occupations are Education Instruction & Library (100.0%), Health Diagnosing & Treating (90.5%), and Community & Social Service (87.9%).
| Occupation | Male | Female |
| Management | 0 (0.0%) | 0 (0.0%) |
| Business & Financial | 0 (0.0%) | 0 (0.0%) |
| Computers, Engineering & Science | 0 (0.0%) | 0 (0.0%) |
| Computers & Mathematics | 0 (0.0%) | 0 (0.0%) |
| Architecture & Engineering | 0 (0.0%) | 0 (0.0%) |
| Life, Physical & Social Science | 0 (0.0%) | 0 (0.0%) |
| Community & Social Service | 4 (12.1%) | 29 (87.9%) |
| Education, Arts & Media | 0 (0.0%) | 0 (0.0%) |
| Legal Services & Support | 4 (100.0%) | 0 (0.0%) |
| Education Instruction & Library | 0 (0.0%) | 29 (100.0%) |
| Arts, Media & Entertainment | 0 (0.0%) | 0 (0.0%) |
| Health Diagnosing & Treating | 10 (9.5%) | 95 (90.5%) |
| Health Technologists | 10 (100.0%) | 0 (0.0%) |
| Total (Category) | 14 (10.1%) | 124 (89.9%) |
| Total (Overall) | 60 (26.8%) | 164 (73.2%) |
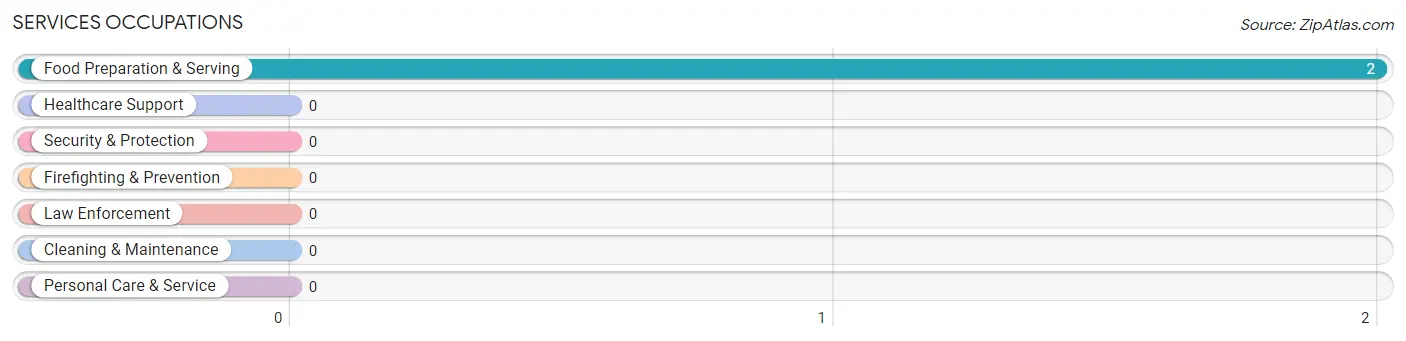
Services Occupations
The most common Services occupations in Central are , and Food Preparation & Serving (2 | 0.9%).
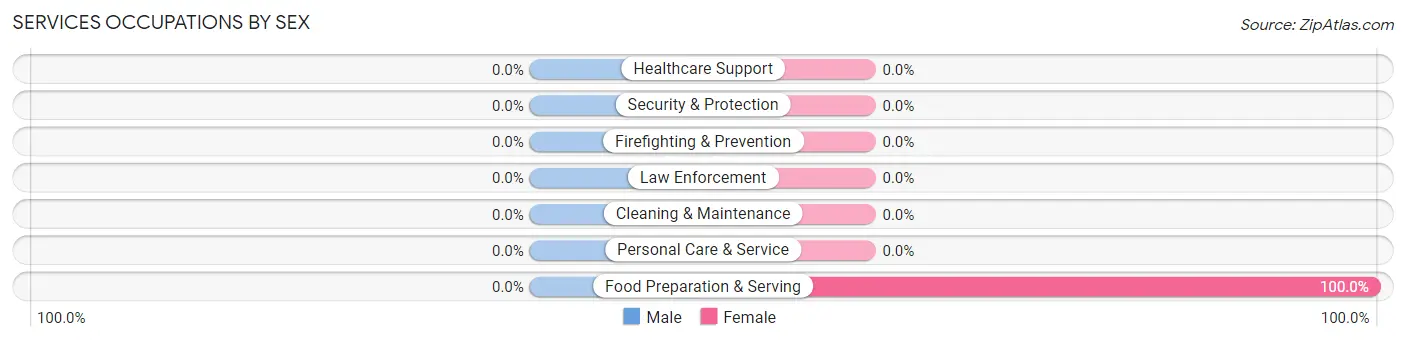
Services Occupations by Sex
| Occupation | Male | Female |
| Healthcare Support | 0 (0.0%) | 0 (0.0%) |
| Security & Protection | 0 (0.0%) | 0 (0.0%) |
| Firefighting & Prevention | 0 (0.0%) | 0 (0.0%) |
| Law Enforcement | 0 (0.0%) | 0 (0.0%) |
| Food Preparation & Serving | 0 (0.0%) | 2 (100.0%) |
| Cleaning & Maintenance | 0 (0.0%) | 0 (0.0%) |
| Personal Care & Service | 0 (0.0%) | 0 (0.0%) |
| Total (Category) | 0 (0.0%) | 2 (100.0%) |
| Total (Overall) | 60 (26.8%) | 164 (73.2%) |
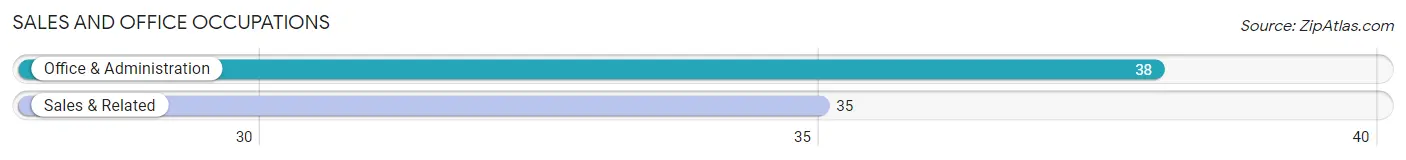
Sales and Office Occupations
The most common Sales and Office occupations in Central are Office & Administration (38 | 17.0%), and Sales & Related (35 | 15.6%).
Sales and Office Occupations by Sex
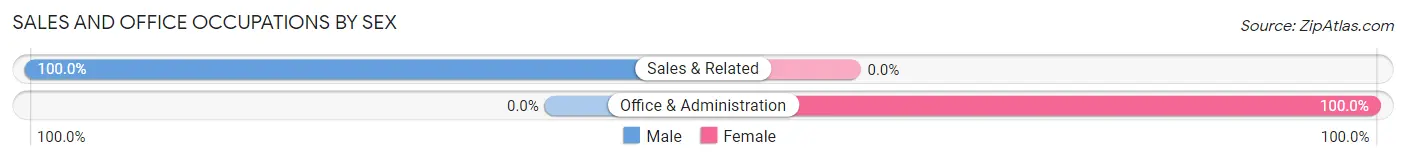
| Occupation | Male | Female |
| Sales & Related | 35 (100.0%) | 0 (0.0%) |
| Office & Administration | 0 (0.0%) | 38 (100.0%) |
| Total (Category) | 35 (47.9%) | 38 (52.0%) |
| Total (Overall) | 60 (26.8%) | 164 (73.2%) |
Natural Resources, Construction and Maintenance Occupations
The most common Natural Resources, Construction and Maintenance occupations in Central are , and Construction & Extraction (11 | 4.9%).
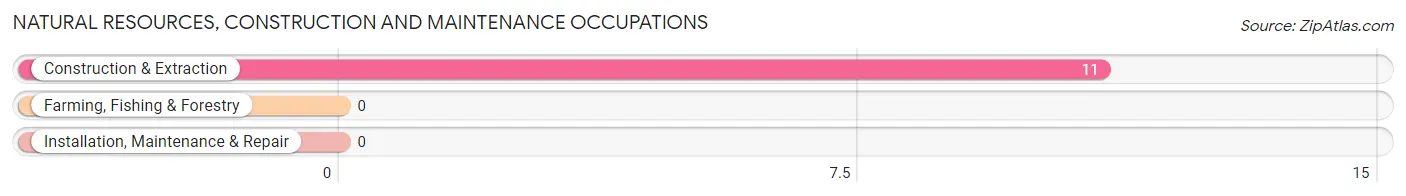
Natural Resources, Construction and Maintenance Occupations by Sex
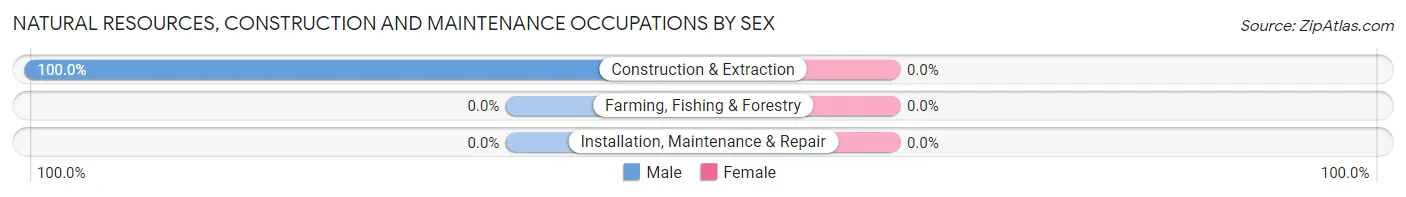
| Occupation | Male | Female |
| Farming, Fishing & Forestry | 0 (0.0%) | 0 (0.0%) |
| Construction & Extraction | 11 (100.0%) | 0 (0.0%) |
| Installation, Maintenance & Repair | 0 (0.0%) | 0 (0.0%) |
| Total (Category) | 11 (100.0%) | 0 (0.0%) |
| Total (Overall) | 60 (26.8%) | 164 (73.2%) |
Production, Transportation and Moving Occupations
Production, Transportation and Moving Occupations by Sex
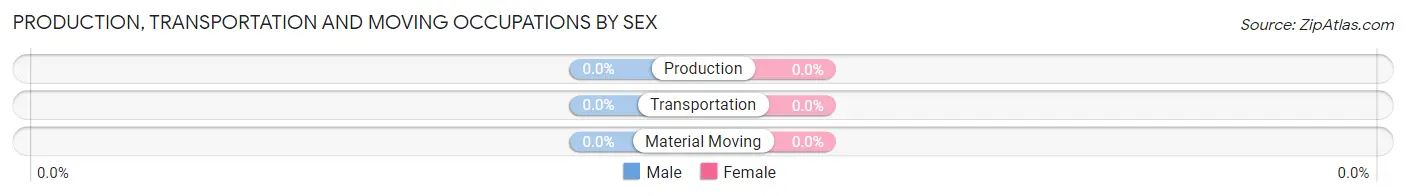
| Occupation | Male | Female |
| Production | 0 (0.0%) | 0 (0.0%) |
| Transportation | 0 (0.0%) | 0 (0.0%) |
| Material Moving | 0 (0.0%) | 0 (0.0%) |
| Total (Category) | 0 (0.0%) | 0 (0.0%) |
| Total (Overall) | 60 (26.8%) | 164 (73.2%) |
Employment Industries by Sex in Central
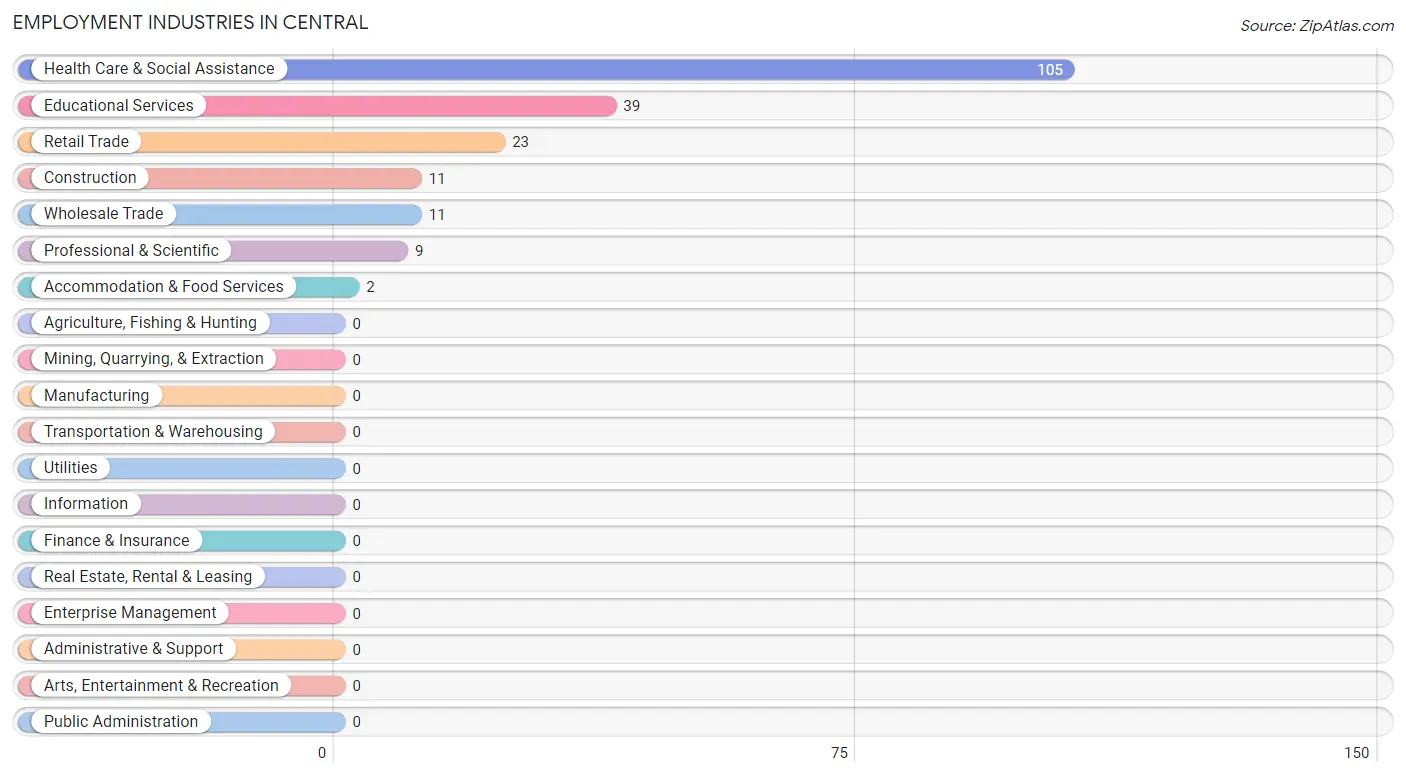
Employment Industries in Central
The major employment industries in Central include Health Care & Social Assistance (105 | 46.9%), Educational Services (39 | 17.4%), Retail Trade (23 | 10.3%), Construction (11 | 4.9%), and Wholesale Trade (11 | 4.9%).
Employment Industries by Sex in Central
The Central industries that see more men than women are Construction (100.0%), Wholesale Trade (100.0%), and Professional & Scientific (44.4%), whereas the industries that tend to have a higher number of women are Retail Trade (100.0%), Educational Services (100.0%), and Accommodation & Food Services (100.0%).
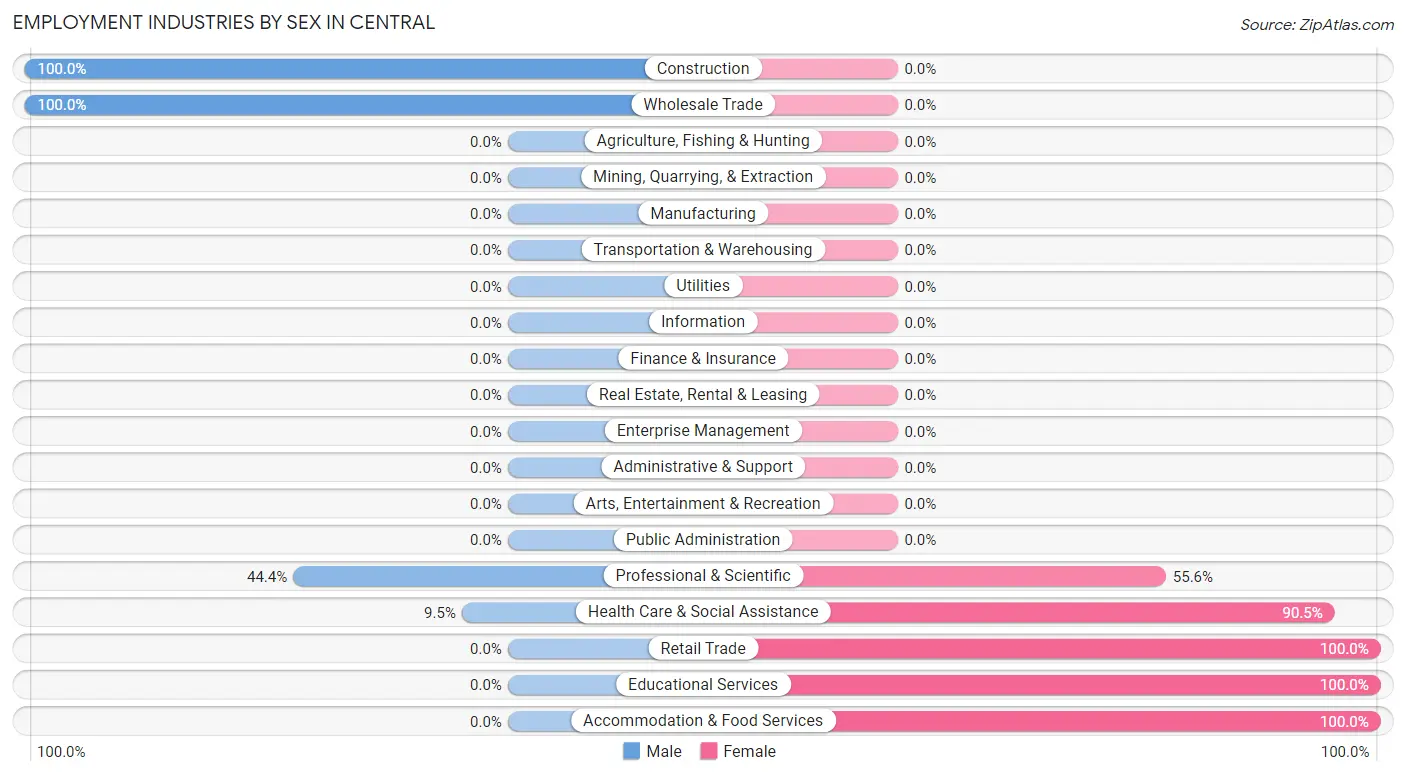
| Industry | Male | Female |
| Agriculture, Fishing & Hunting | 0 (0.0%) | 0 (0.0%) |
| Mining, Quarrying, & Extraction | 0 (0.0%) | 0 (0.0%) |
| Construction | 11 (100.0%) | 0 (0.0%) |
| Manufacturing | 0 (0.0%) | 0 (0.0%) |
| Wholesale Trade | 11 (100.0%) | 0 (0.0%) |
| Retail Trade | 0 (0.0%) | 23 (100.0%) |
| Transportation & Warehousing | 0 (0.0%) | 0 (0.0%) |
| Utilities | 0 (0.0%) | 0 (0.0%) |
| Information | 0 (0.0%) | 0 (0.0%) |
| Finance & Insurance | 0 (0.0%) | 0 (0.0%) |
| Real Estate, Rental & Leasing | 0 (0.0%) | 0 (0.0%) |
| Professional & Scientific | 4 (44.4%) | 5 (55.6%) |
| Enterprise Management | 0 (0.0%) | 0 (0.0%) |
| Administrative & Support | 0 (0.0%) | 0 (0.0%) |
| Educational Services | 0 (0.0%) | 39 (100.0%) |
| Health Care & Social Assistance | 10 (9.5%) | 95 (90.5%) |
| Arts, Entertainment & Recreation | 0 (0.0%) | 0 (0.0%) |
| Accommodation & Food Services | 0 (0.0%) | 2 (100.0%) |
| Public Administration | 0 (0.0%) | 0 (0.0%) |
| Total | 60 (26.8%) | 164 (73.2%) |
Education in Central
School Enrollment in Central
The most common levels of schooling among the 118 students in Central are nursery / preschool (37 | 31.4%), elementary school (35 | 29.7%), and middle school (34 | 28.8%).
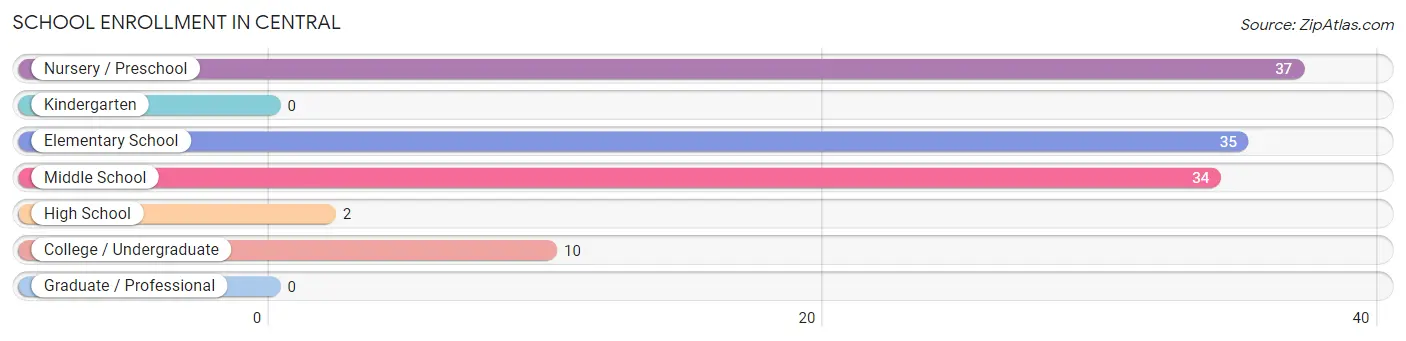
| School Level | # Students | % Students |
| Nursery / Preschool | 37 | 31.4% |
| Kindergarten | 0 | 0.0% |
| Elementary School | 35 | 29.7% |
| Middle School | 34 | 28.8% |
| High School | 2 | 1.7% |
| College / Undergraduate | 10 | 8.5% |
| Graduate / Professional | 0 | 0.0% |
| Total | 118 | 100.0% |
School Enrollment by Age by Funding Source in Central
Out of a total of 118 students who are enrolled in schools in Central, 37 (31.4%) attend a private institution, while the remaining 81 (68.6%) are enrolled in public schools. The age group of 3 to 4 year olds has the highest likelihood of being enrolled in private schools, with 37 (100.0% in the age bracket) enrolled. Conversely, the age group of 5 to 9 year old has the lowest likelihood of being enrolled in a private school, with 24 (100.0% in the age bracket) attending a public institution.
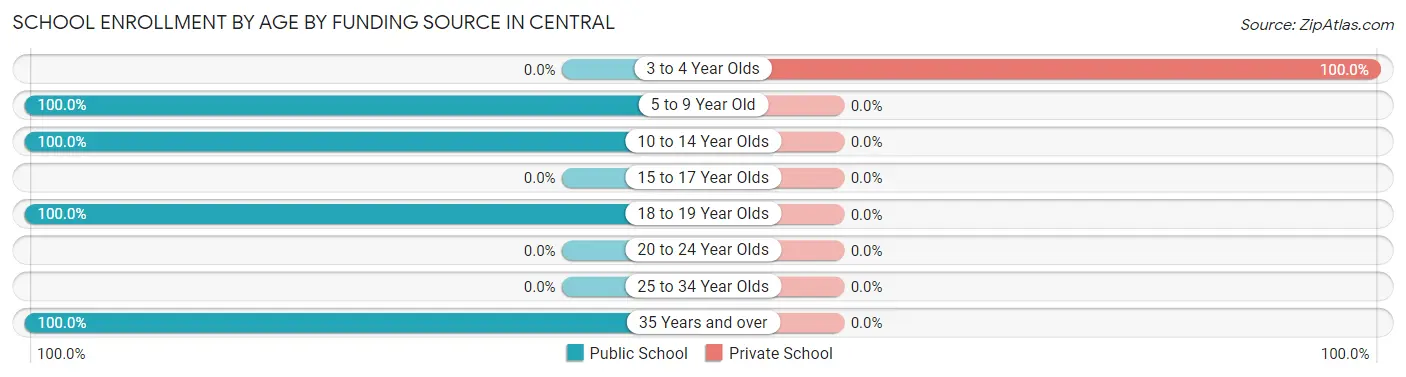
| Age Bracket | Public School | Private School |
| 3 to 4 Year Olds | 0 (0.0%) | 37 (100.0%) |
| 5 to 9 Year Old | 24 (100.0%) | 0 (0.0%) |
| 10 to 14 Year Olds | 45 (100.0%) | 0 (0.0%) |
| 15 to 17 Year Olds | 0 (0.0%) | 0 (0.0%) |
| 18 to 19 Year Olds | 2 (100.0%) | 0 (0.0%) |
| 20 to 24 Year Olds | 0 (0.0%) | 0 (0.0%) |
| 25 to 34 Year Olds | 0 (0.0%) | 0 (0.0%) |
| 35 Years and over | 10 (100.0%) | 0 (0.0%) |
| Total | 81 (68.6%) | 37 (31.4%) |
Educational Attainment by Field of Study in Central
Bio, nature & agricultural (112 | 67.1%), education (30 | 18.0%), engineering (8 | 4.8%), visual & performing arts (8 | 4.8%), and science & technology (5 | 3.0%) are the most common fields of study among 167 individuals in Central who have obtained a bachelor's degree or higher.
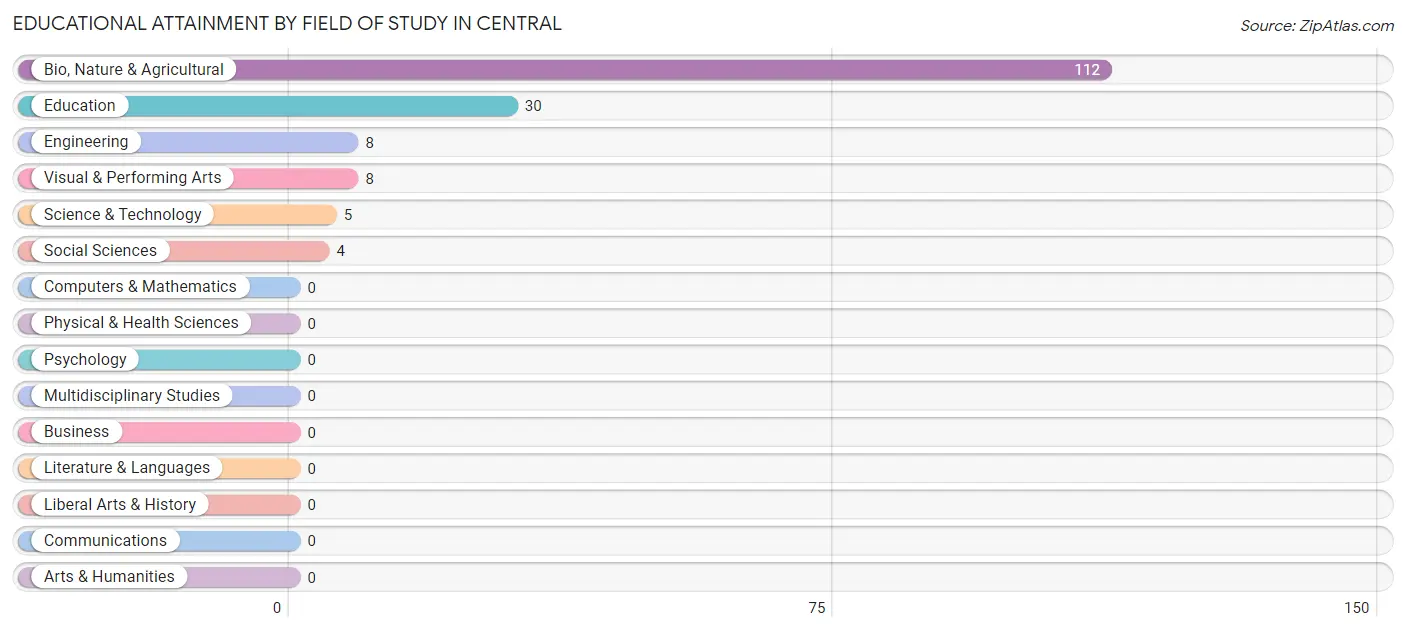
| Field of Study | # Graduates | % Graduates |
| Computers & Mathematics | 0 | 0.0% |
| Bio, Nature & Agricultural | 112 | 67.1% |
| Physical & Health Sciences | 0 | 0.0% |
| Psychology | 0 | 0.0% |
| Social Sciences | 4 | 2.4% |
| Engineering | 8 | 4.8% |
| Multidisciplinary Studies | 0 | 0.0% |
| Science & Technology | 5 | 3.0% |
| Business | 0 | 0.0% |
| Education | 30 | 18.0% |
| Literature & Languages | 0 | 0.0% |
| Liberal Arts & History | 0 | 0.0% |
| Visual & Performing Arts | 8 | 4.8% |
| Communications | 0 | 0.0% |
| Arts & Humanities | 0 | 0.0% |
| Total | 167 | 100.0% |
Transportation & Commute in Central
Vehicle Availability by Sex in Central
The most prevalent vehicle ownership categories in Central are males with 2 vehicles (32, accounting for 53.3%) and females with 2 vehicles (31, making up 19.5%).
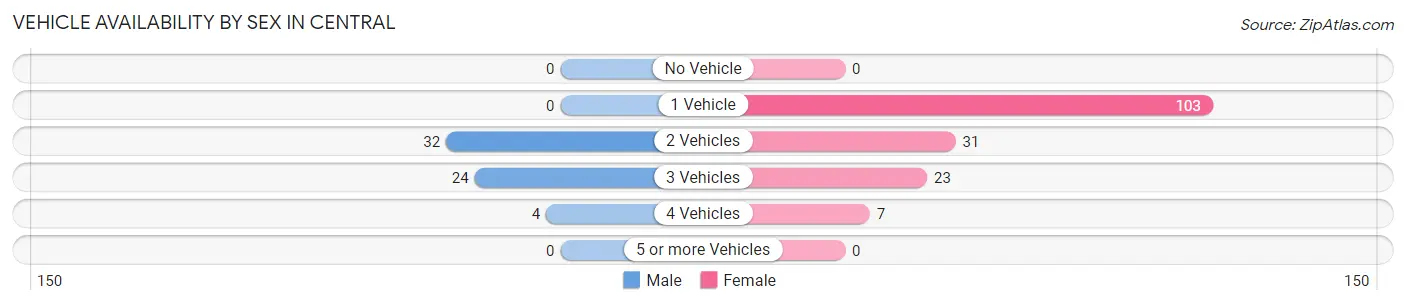
| Vehicles Available | Male | Female |
| No Vehicle | 0 (0.0%) | 0 (0.0%) |
| 1 Vehicle | 0 (0.0%) | 103 (62.8%) |
| 2 Vehicles | 32 (53.3%) | 31 (18.9%) |
| 3 Vehicles | 24 (40.0%) | 23 (14.0%) |
| 4 Vehicles | 4 (6.7%) | 7 (4.3%) |
| 5 or more Vehicles | 0 (0.0%) | 0 (0.0%) |
| Total | 60 (100.0%) | 164 (100.0%) |
Commute Time in Central
The most frequently occuring commute durations in Central are 25 to 29 minutes (95 commuters, 42.4%), 10 to 14 minutes (69 commuters, 30.8%), and 5 to 9 minutes (41 commuters, 18.3%).
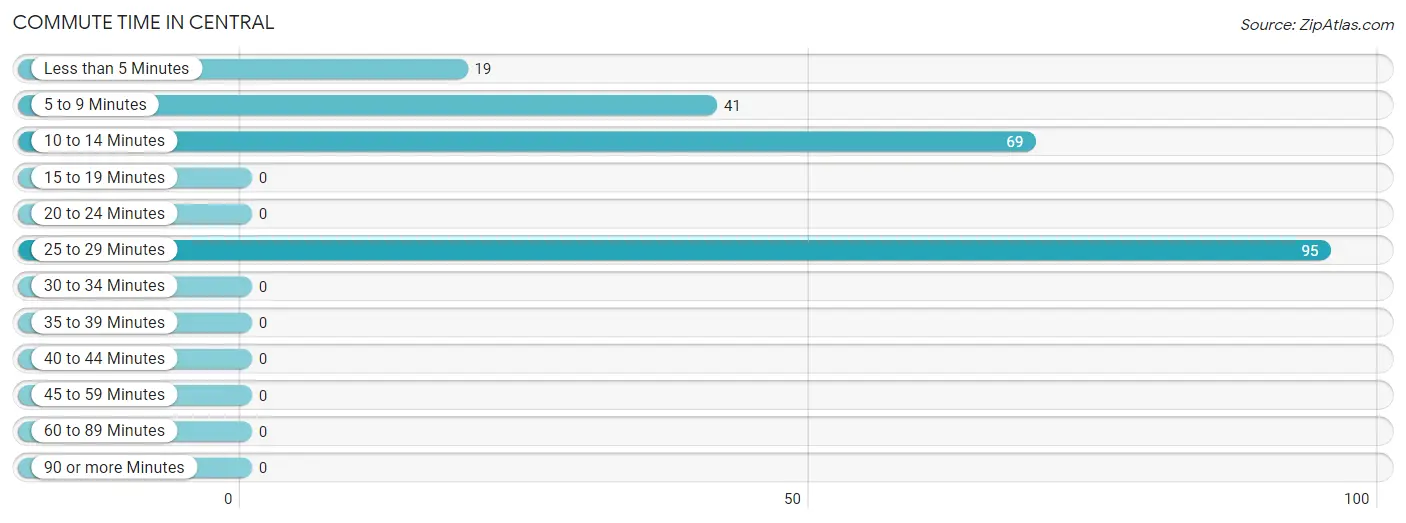
| Commute Time | # Commuters | % Commuters |
| Less than 5 Minutes | 19 | 8.5% |
| 5 to 9 Minutes | 41 | 18.3% |
| 10 to 14 Minutes | 69 | 30.8% |
| 15 to 19 Minutes | 0 | 0.0% |
| 20 to 24 Minutes | 0 | 0.0% |
| 25 to 29 Minutes | 95 | 42.4% |
| 30 to 34 Minutes | 0 | 0.0% |
| 35 to 39 Minutes | 0 | 0.0% |
| 40 to 44 Minutes | 0 | 0.0% |
| 45 to 59 Minutes | 0 | 0.0% |
| 60 to 89 Minutes | 0 | 0.0% |
| 90 or more Minutes | 0 | 0.0% |
Commute Time by Sex in Central
The most common commute times in Central are 10 to 14 minutes (39 commuters, 65.0%) for males and 25 to 29 minutes (95 commuters, 57.9%) for females.
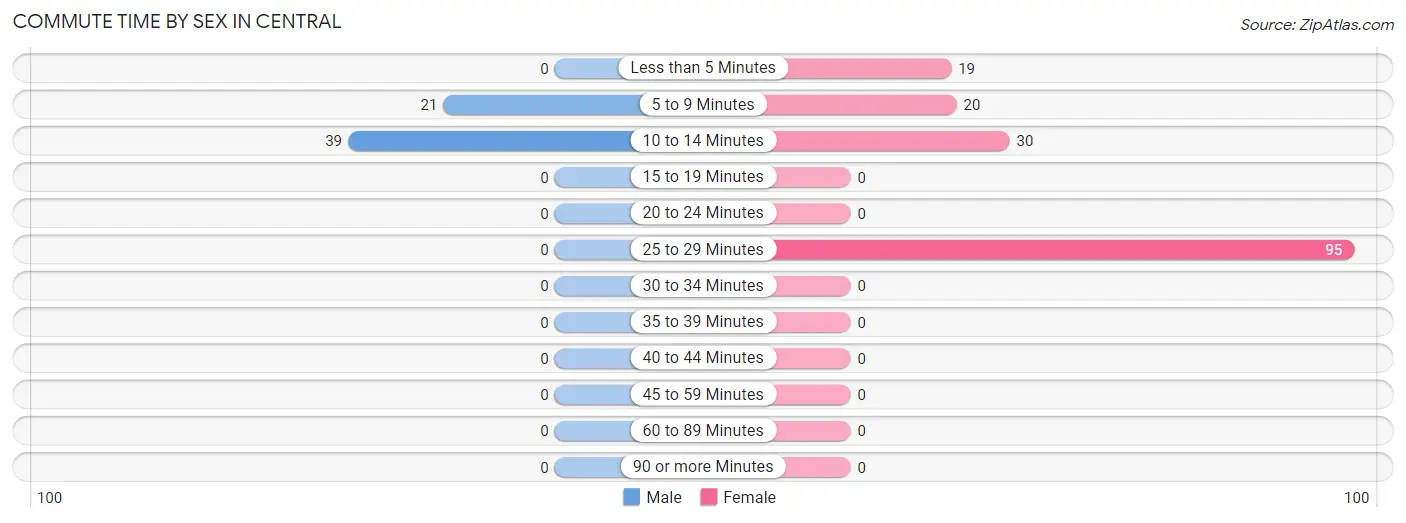
| Commute Time | Male | Female |
| Less than 5 Minutes | 0 (0.0%) | 19 (11.6%) |
| 5 to 9 Minutes | 21 (35.0%) | 20 (12.2%) |
| 10 to 14 Minutes | 39 (65.0%) | 30 (18.3%) |
| 15 to 19 Minutes | 0 (0.0%) | 0 (0.0%) |
| 20 to 24 Minutes | 0 (0.0%) | 0 (0.0%) |
| 25 to 29 Minutes | 0 (0.0%) | 95 (57.9%) |
| 30 to 34 Minutes | 0 (0.0%) | 0 (0.0%) |
| 35 to 39 Minutes | 0 (0.0%) | 0 (0.0%) |
| 40 to 44 Minutes | 0 (0.0%) | 0 (0.0%) |
| 45 to 59 Minutes | 0 (0.0%) | 0 (0.0%) |
| 60 to 89 Minutes | 0 (0.0%) | 0 (0.0%) |
| 90 or more Minutes | 0 (0.0%) | 0 (0.0%) |
Time of Departure to Work by Sex in Central
The most frequent times of departure to work in Central are 8:00 AM to 8:29 AM (28, 46.7%) for males and 7:30 AM to 7:59 AM (95, 57.9%) for females.
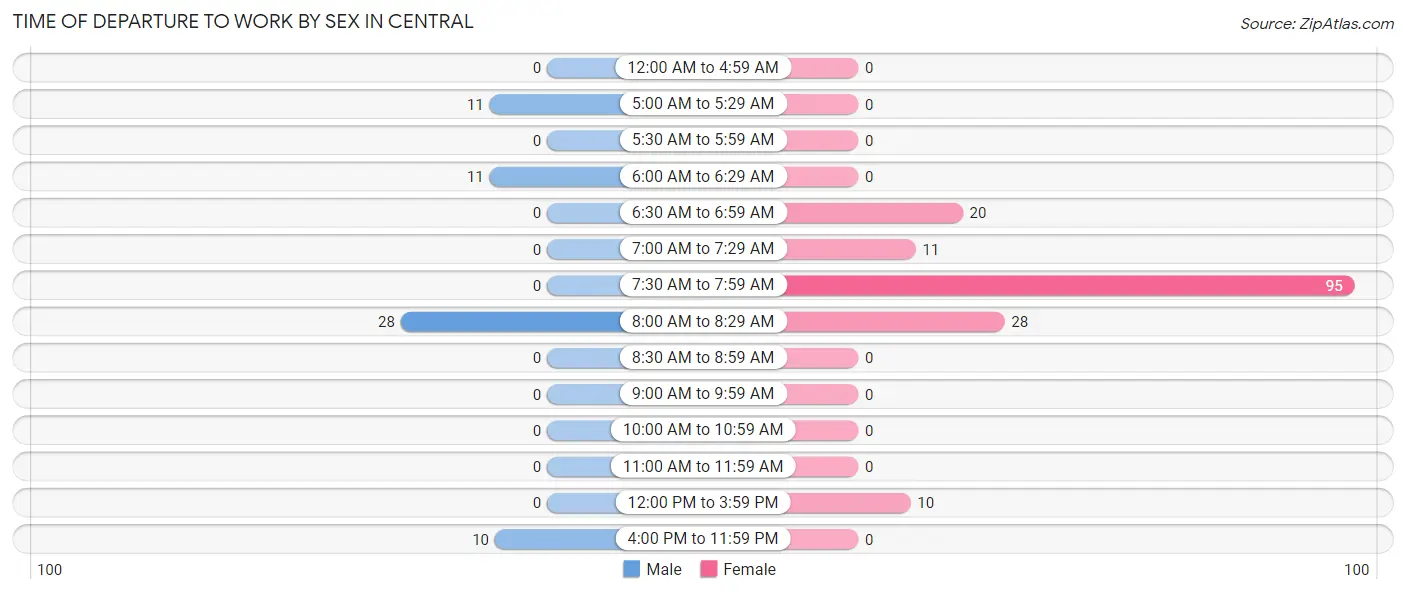
| Time of Departure | Male | Female |
| 12:00 AM to 4:59 AM | 0 (0.0%) | 0 (0.0%) |
| 5:00 AM to 5:29 AM | 11 (18.3%) | 0 (0.0%) |
| 5:30 AM to 5:59 AM | 0 (0.0%) | 0 (0.0%) |
| 6:00 AM to 6:29 AM | 11 (18.3%) | 0 (0.0%) |
| 6:30 AM to 6:59 AM | 0 (0.0%) | 20 (12.2%) |
| 7:00 AM to 7:29 AM | 0 (0.0%) | 11 (6.7%) |
| 7:30 AM to 7:59 AM | 0 (0.0%) | 95 (57.9%) |
| 8:00 AM to 8:29 AM | 28 (46.7%) | 28 (17.1%) |
| 8:30 AM to 8:59 AM | 0 (0.0%) | 0 (0.0%) |
| 9:00 AM to 9:59 AM | 0 (0.0%) | 0 (0.0%) |
| 10:00 AM to 10:59 AM | 0 (0.0%) | 0 (0.0%) |
| 11:00 AM to 11:59 AM | 0 (0.0%) | 0 (0.0%) |
| 12:00 PM to 3:59 PM | 0 (0.0%) | 10 (6.1%) |
| 4:00 PM to 11:59 PM | 10 (16.7%) | 0 (0.0%) |
| Total | 60 (100.0%) | 164 (100.0%) |
Housing Occupancy in Central
Occupancy by Ownership in Central
Of the total 189 dwellings in Central, owner-occupied units account for 76 (40.2%), while renter-occupied units make up 113 (59.8%).
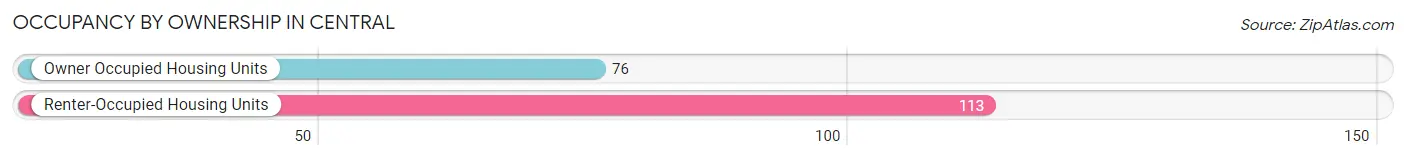
| Occupancy | # Housing Units | % Housing Units |
| Owner Occupied Housing Units | 76 | 40.2% |
| Renter-Occupied Housing Units | 113 | 59.8% |
| Total Occupied Housing Units | 189 | 100.0% |
Occupancy by Household Size in Central
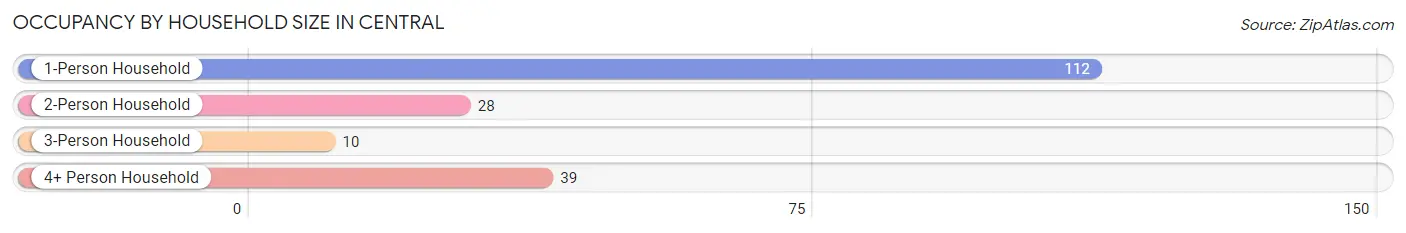
| Household Size | # Housing Units | % Housing Units |
| 1-Person Household | 112 | 59.3% |
| 2-Person Household | 28 | 14.8% |
| 3-Person Household | 10 | 5.3% |
| 4+ Person Household | 39 | 20.6% |
| Total Housing Units | 189 | 100.0% |
Occupancy by Ownership by Household Size in Central
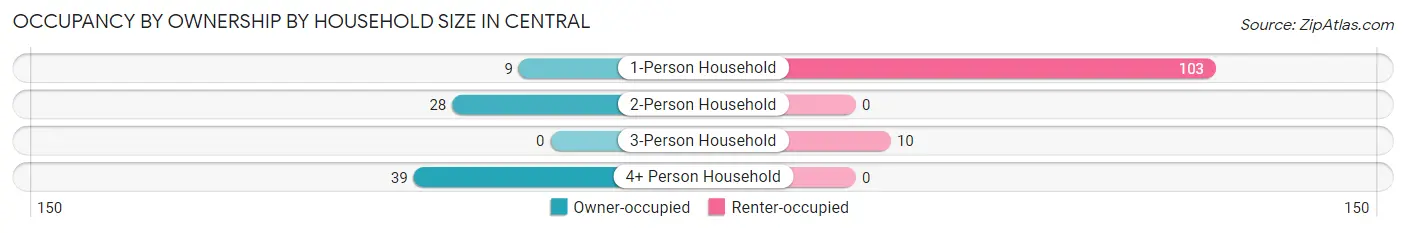
| Household Size | Owner-occupied | Renter-occupied |
| 1-Person Household | 9 (8.0%) | 103 (92.0%) |
| 2-Person Household | 28 (100.0%) | 0 (0.0%) |
| 3-Person Household | 0 (0.0%) | 10 (100.0%) |
| 4+ Person Household | 39 (100.0%) | 0 (0.0%) |
| Total Housing Units | 76 (40.2%) | 113 (59.8%) |
Occupancy by Educational Attainment in Central
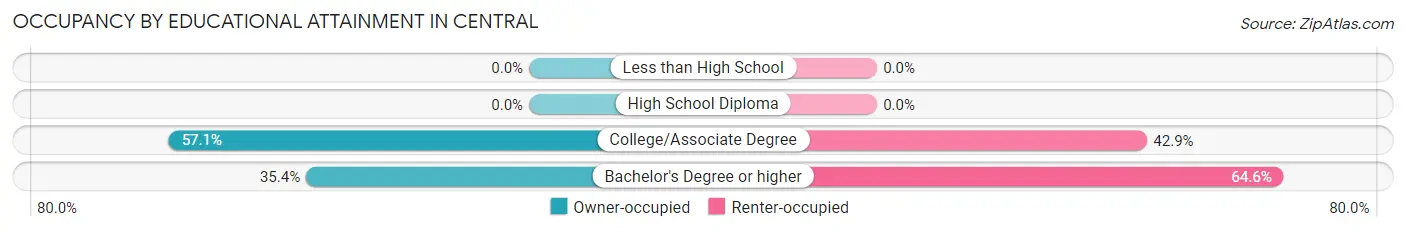
| Household Size | Owner-occupied | Renter-occupied |
| Less than High School | 0 (0.0%) | 0 (0.0%) |
| High School Diploma | 0 (0.0%) | 0 (0.0%) |
| College/Associate Degree | 24 (57.1%) | 18 (42.9%) |
| Bachelor's Degree or higher | 52 (35.4%) | 95 (64.6%) |
Occupancy by Age of Householder in Central
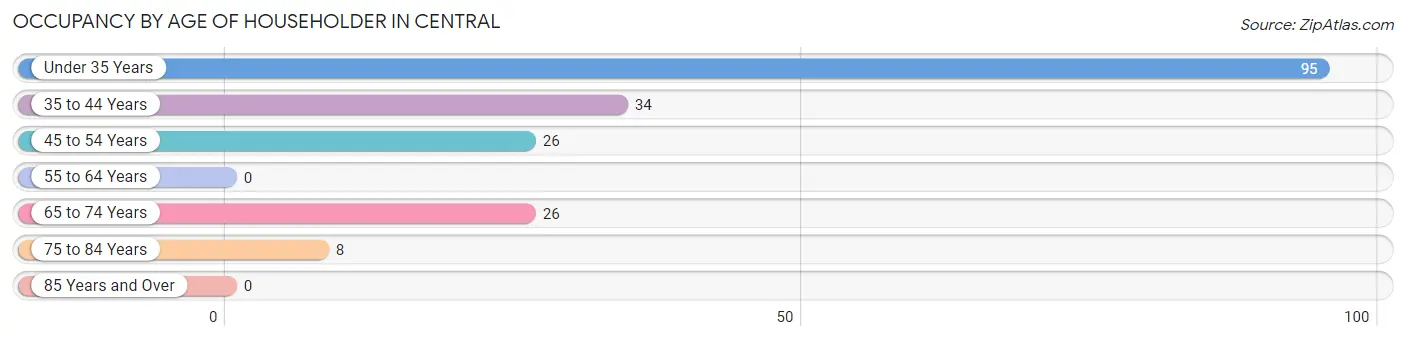
| Age Bracket | # Households | % Households |
| Under 35 Years | 95 | 50.3% |
| 35 to 44 Years | 34 | 18.0% |
| 45 to 54 Years | 26 | 13.8% |
| 55 to 64 Years | 0 | 0.0% |
| 65 to 74 Years | 26 | 13.8% |
| 75 to 84 Years | 8 | 4.2% |
| 85 Years and Over | 0 | 0.0% |
| Total | 189 | 100.0% |
Housing Finances in Central
Median Income by Occupancy in Central
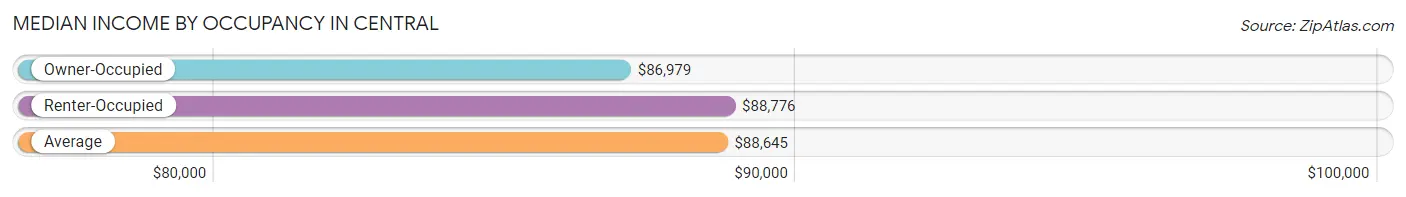
| Occupancy Type | # Households | Median Income |
| Owner-Occupied | 76 (40.2%) | $86,979 |
| Renter-Occupied | 113 (59.8%) | $88,776 |
| Average | 189 (100.0%) | $88,645 |
Occupancy by Householder Income Bracket in Central
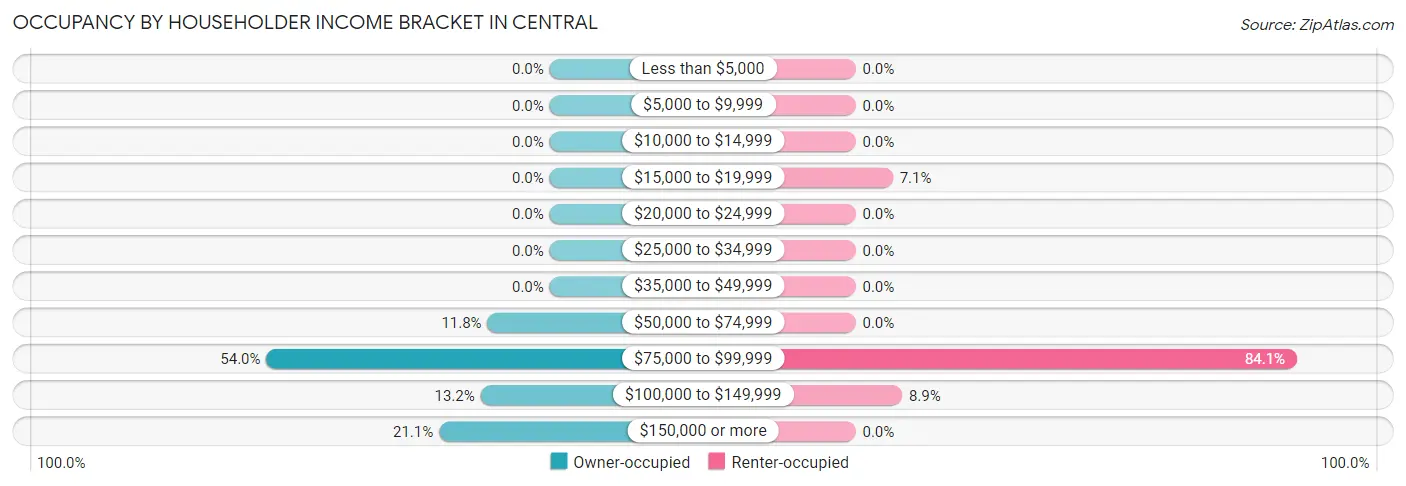
| Income Bracket | Owner-occupied | Renter-occupied |
| Less than $5,000 | 0 (0.0%) | 0 (0.0%) |
| $5,000 to $9,999 | 0 (0.0%) | 0 (0.0%) |
| $10,000 to $14,999 | 0 (0.0%) | 0 (0.0%) |
| $15,000 to $19,999 | 0 (0.0%) | 8 (7.1%) |
| $20,000 to $24,999 | 0 (0.0%) | 0 (0.0%) |
| $25,000 to $34,999 | 0 (0.0%) | 0 (0.0%) |
| $35,000 to $49,999 | 0 (0.0%) | 0 (0.0%) |
| $50,000 to $74,999 | 9 (11.8%) | 0 (0.0%) |
| $75,000 to $99,999 | 41 (53.9%) | 95 (84.1%) |
| $100,000 to $149,999 | 10 (13.2%) | 10 (8.8%) |
| $150,000 or more | 16 (21.0%) | 0 (0.0%) |
| Total | 76 (100.0%) | 113 (100.0%) |
Monthly Housing Cost Tiers in Central
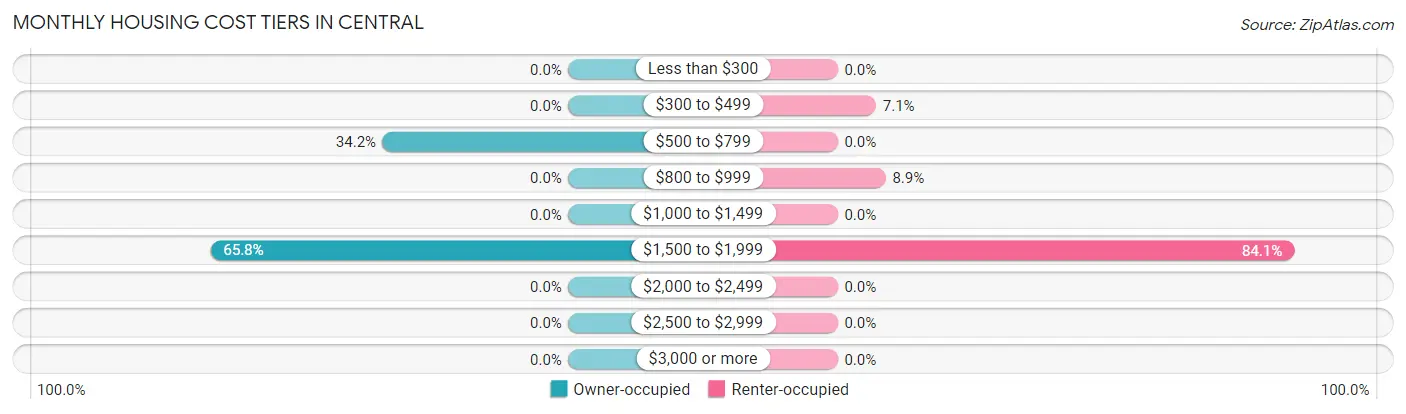
| Monthly Cost | Owner-occupied | Renter-occupied |
| Less than $300 | 0 (0.0%) | 0 (0.0%) |
| $300 to $499 | 0 (0.0%) | 8 (7.1%) |
| $500 to $799 | 26 (34.2%) | 0 (0.0%) |
| $800 to $999 | 0 (0.0%) | 10 (8.8%) |
| $1,000 to $1,499 | 0 (0.0%) | 0 (0.0%) |
| $1,500 to $1,999 | 50 (65.8%) | 95 (84.1%) |
| $2,000 to $2,499 | 0 (0.0%) | 0 (0.0%) |
| $2,500 to $2,999 | 0 (0.0%) | 0 (0.0%) |
| $3,000 or more | 0 (0.0%) | 0 (0.0%) |
| Total | 76 (100.0%) | 113 (100.0%) |
Physical Housing Characteristics in Central
Housing Structures in Central
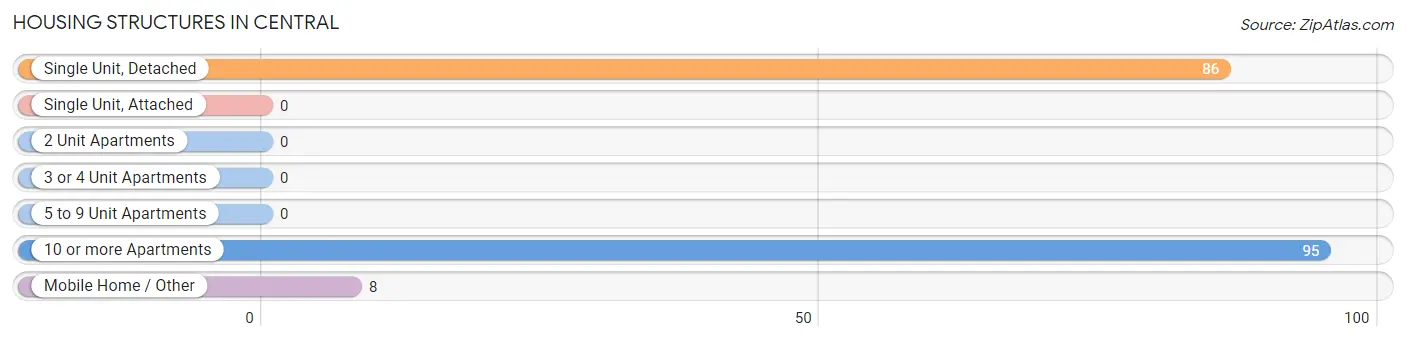
| Structure Type | # Housing Units | % Housing Units |
| Single Unit, Detached | 86 | 45.5% |
| Single Unit, Attached | 0 | 0.0% |
| 2 Unit Apartments | 0 | 0.0% |
| 3 or 4 Unit Apartments | 0 | 0.0% |
| 5 to 9 Unit Apartments | 0 | 0.0% |
| 10 or more Apartments | 95 | 50.3% |
| Mobile Home / Other | 8 | 4.2% |
| Total | 189 | 100.0% |
Housing Structures by Occupancy in Central
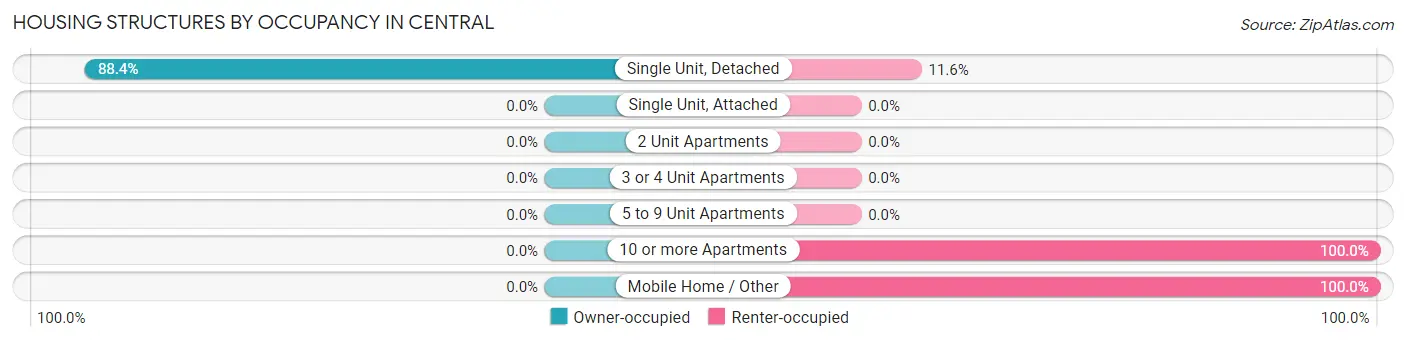
| Structure Type | Owner-occupied | Renter-occupied |
| Single Unit, Detached | 76 (88.4%) | 10 (11.6%) |
| Single Unit, Attached | 0 (0.0%) | 0 (0.0%) |
| 2 Unit Apartments | 0 (0.0%) | 0 (0.0%) |
| 3 or 4 Unit Apartments | 0 (0.0%) | 0 (0.0%) |
| 5 to 9 Unit Apartments | 0 (0.0%) | 0 (0.0%) |
| 10 or more Apartments | 0 (0.0%) | 95 (100.0%) |
| Mobile Home / Other | 0 (0.0%) | 8 (100.0%) |
| Total | 76 (40.2%) | 113 (59.8%) |
Housing Structures by Number of Rooms in Central
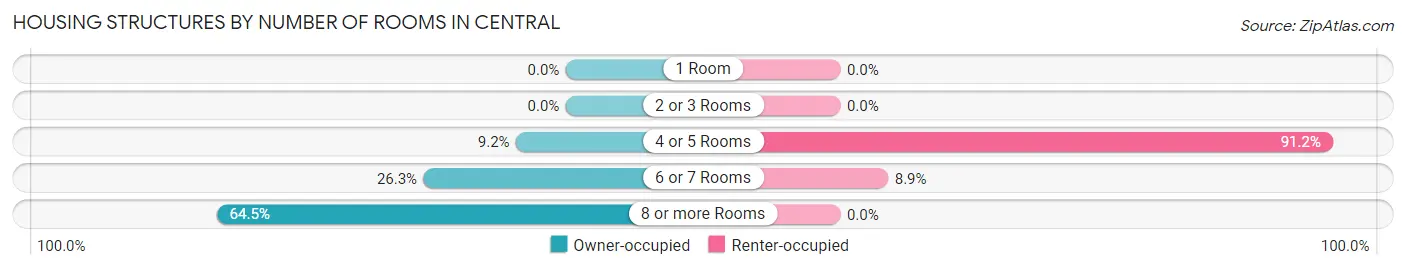
| Number of Rooms | Owner-occupied | Renter-occupied |
| 1 Room | 0 (0.0%) | 0 (0.0%) |
| 2 or 3 Rooms | 0 (0.0%) | 0 (0.0%) |
| 4 or 5 Rooms | 7 (9.2%) | 103 (91.1%) |
| 6 or 7 Rooms | 20 (26.3%) | 10 (8.8%) |
| 8 or more Rooms | 49 (64.5%) | 0 (0.0%) |
| Total | 76 (100.0%) | 113 (100.0%) |
Housing Structure by Heating Type in Central
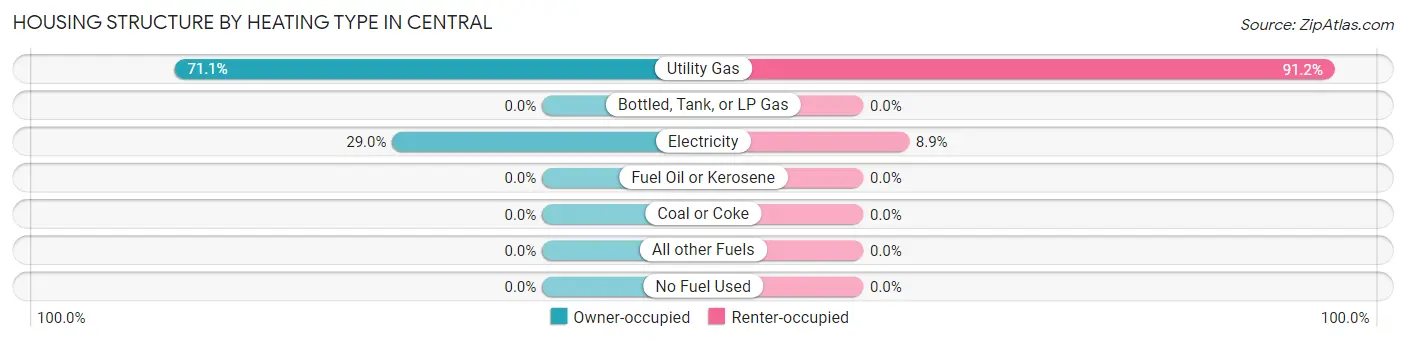
| Heating Type | Owner-occupied | Renter-occupied |
| Utility Gas | 54 (71.1%) | 103 (91.1%) |
| Bottled, Tank, or LP Gas | 0 (0.0%) | 0 (0.0%) |
| Electricity | 22 (28.9%) | 10 (8.8%) |
| Fuel Oil or Kerosene | 0 (0.0%) | 0 (0.0%) |
| Coal or Coke | 0 (0.0%) | 0 (0.0%) |
| All other Fuels | 0 (0.0%) | 0 (0.0%) |
| No Fuel Used | 0 (0.0%) | 0 (0.0%) |
| Total | 76 (100.0%) | 113 (100.0%) |
Household Vehicle Usage in Central
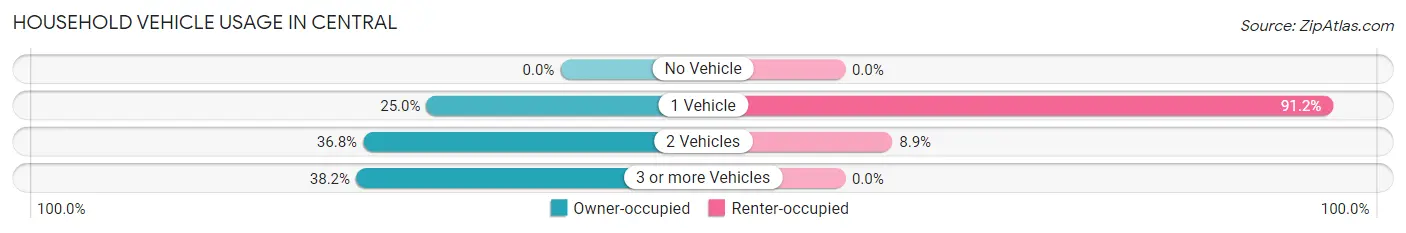
| Vehicles per Household | Owner-occupied | Renter-occupied |
| No Vehicle | 0 (0.0%) | 0 (0.0%) |
| 1 Vehicle | 19 (25.0%) | 103 (91.1%) |
| 2 Vehicles | 28 (36.8%) | 10 (8.8%) |
| 3 or more Vehicles | 29 (38.2%) | 0 (0.0%) |
| Total | 76 (100.0%) | 113 (100.0%) |
Real Estate & Mortgages in Central
Real Estate and Mortgage Overview in Central
| Characteristic | Without Mortgage | With Mortgage |
| Housing Units | 26 | 50 |
| Median Property Value | $318,800 | $0 |
| Median Household Income | $78,500 | $16 |
| Monthly Housing Costs | $576 | $0 |
| Real Estate Taxes | $2,188 | $0 |
Property Value by Mortgage Status in Central
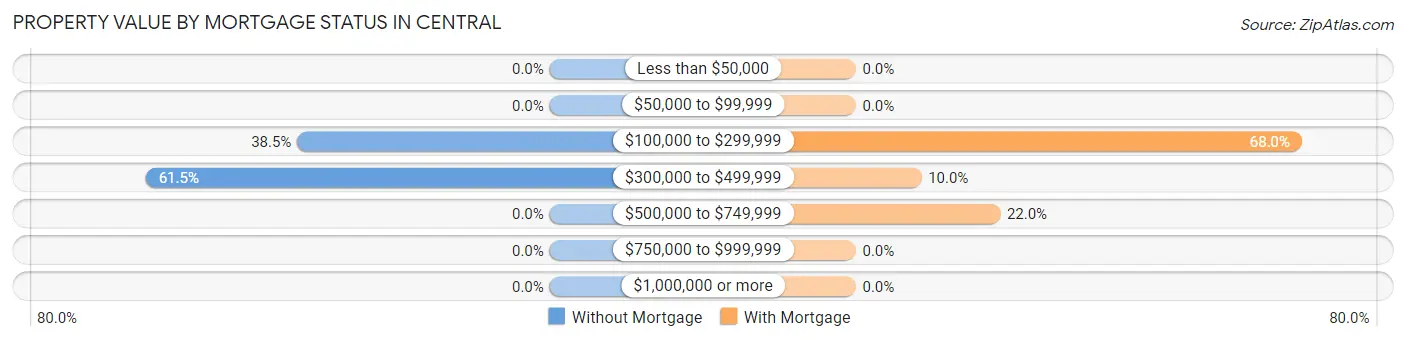
| Property Value | Without Mortgage | With Mortgage |
| Less than $50,000 | 0 (0.0%) | 0 (0.0%) |
| $50,000 to $99,999 | 0 (0.0%) | 0 (0.0%) |
| $100,000 to $299,999 | 10 (38.5%) | 34 (68.0%) |
| $300,000 to $499,999 | 16 (61.5%) | 5 (10.0%) |
| $500,000 to $749,999 | 0 (0.0%) | 11 (22.0%) |
| $750,000 to $999,999 | 0 (0.0%) | 0 (0.0%) |
| $1,000,000 or more | 0 (0.0%) | 0 (0.0%) |
| Total | 26 (100.0%) | 50 (100.0%) |
Household Income by Mortgage Status in Central
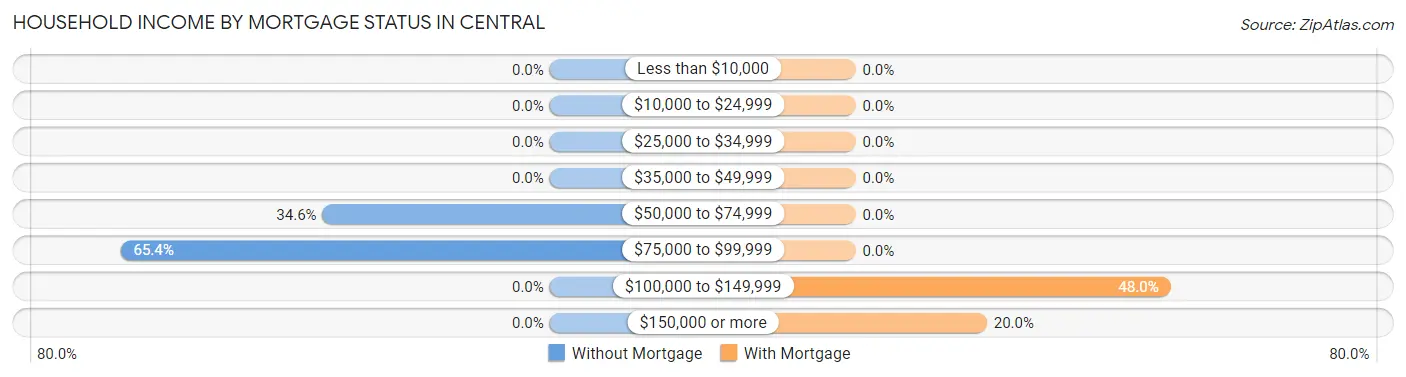
| Household Income | Without Mortgage | With Mortgage |
| Less than $10,000 | 0 (0.0%) | 0 (0.0%) |
| $10,000 to $24,999 | 0 (0.0%) | 0 (0.0%) |
| $25,000 to $34,999 | 0 (0.0%) | 0 (0.0%) |
| $35,000 to $49,999 | 0 (0.0%) | 0 (0.0%) |
| $50,000 to $74,999 | 9 (34.6%) | 0 (0.0%) |
| $75,000 to $99,999 | 17 (65.4%) | 0 (0.0%) |
| $100,000 to $149,999 | 0 (0.0%) | 24 (48.0%) |
| $150,000 or more | 0 (0.0%) | 10 (20.0%) |
| Total | 26 (100.0%) | 50 (100.0%) |
Property Value to Household Income Ratio in Central
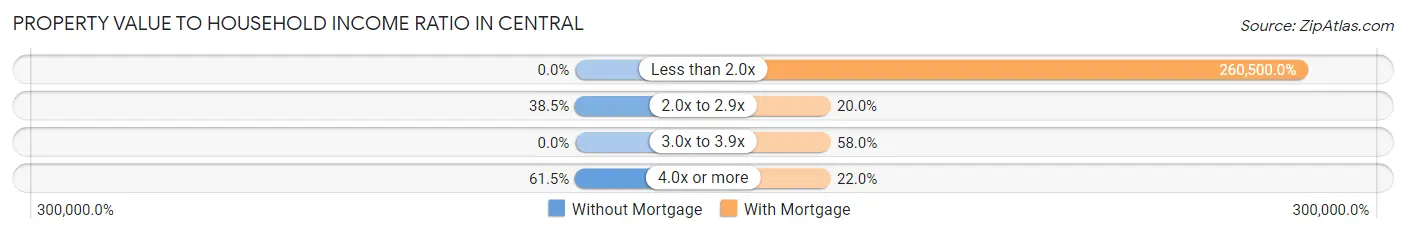
| Value-to-Income Ratio | Without Mortgage | With Mortgage |
| Less than 2.0x | 0 (0.0%) | 130,250 (260,500.0%) |
| 2.0x to 2.9x | 10 (38.5%) | 10 (20.0%) |
| 3.0x to 3.9x | 0 (0.0%) | 29 (58.0%) |
| 4.0x or more | 16 (61.5%) | 11 (22.0%) |
| Total | 26 (100.0%) | 50 (100.0%) |
Real Estate Taxes by Mortgage Status in Central
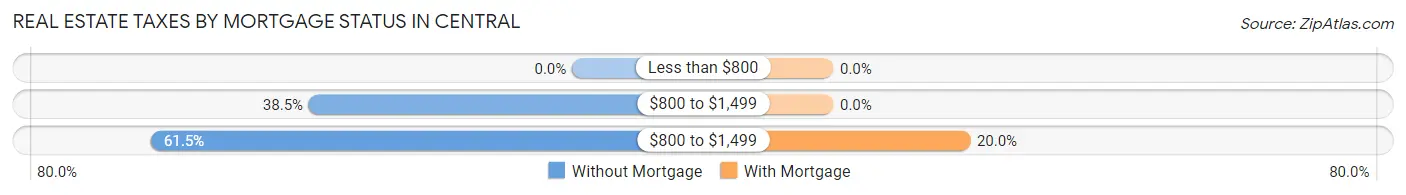
| Property Taxes | Without Mortgage | With Mortgage |
| Less than $800 | 0 (0.0%) | 0 (0.0%) |
| $800 to $1,499 | 10 (38.5%) | 0 (0.0%) |
| $800 to $1,499 | 16 (61.5%) | 10 (20.0%) |
| Total | 26 (100.0%) | 50 (100.0%) |
Health & Disability in Central
Health Insurance Coverage by Age in Central
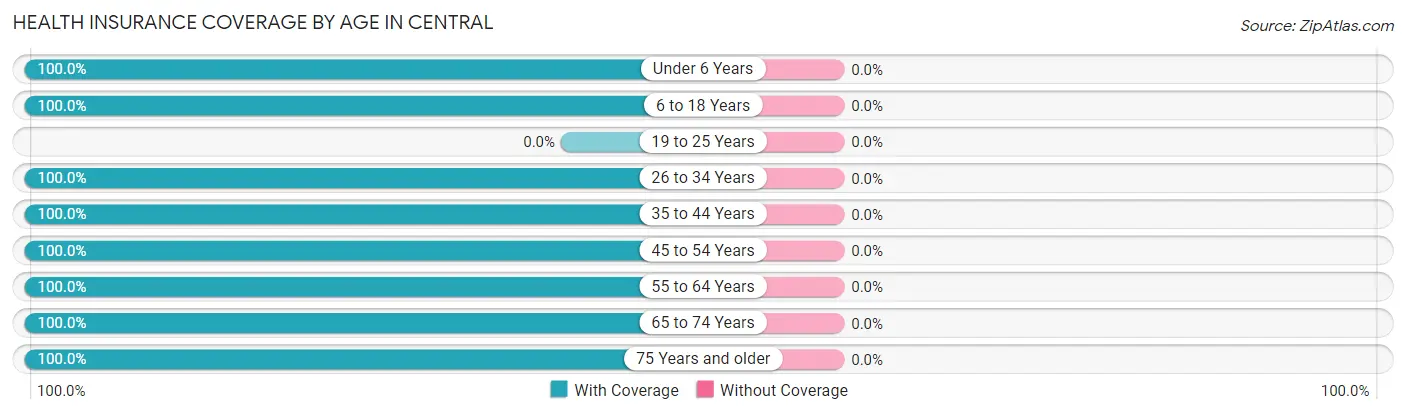
| Age Bracket | With Coverage | Without Coverage |
| Under 6 Years | 40 (100.0%) | 0 (0.0%) |
| 6 to 18 Years | 71 (100.0%) | 0 (0.0%) |
| 19 to 25 Years | 0 (0.0%) | 0 (0.0%) |
| 26 to 34 Years | 95 (100.0%) | 0 (0.0%) |
| 35 to 44 Years | 68 (100.0%) | 0 (0.0%) |
| 45 to 54 Years | 51 (100.0%) | 0 (0.0%) |
| 55 to 64 Years | 8 (100.0%) | 0 (0.0%) |
| 65 to 74 Years | 34 (100.0%) | 0 (0.0%) |
| 75 Years and older | 8 (100.0%) | 0 (0.0%) |
| Total | 375 (100.0%) | 0 (0.0%) |
Health Insurance Coverage by Citizenship Status in Central
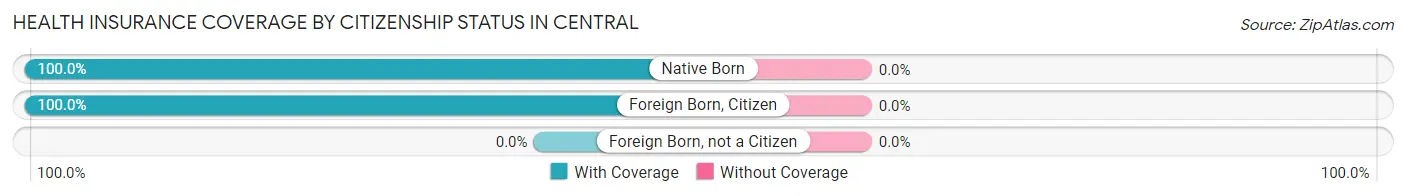
| Citizenship Status | With Coverage | Without Coverage |
| Native Born | 40 (100.0%) | 0 (0.0%) |
| Foreign Born, Citizen | 71 (100.0%) | 0 (0.0%) |
| Foreign Born, not a Citizen | 0 (0.0%) | 0 (0.0%) |
Health Insurance Coverage by Household Income in Central
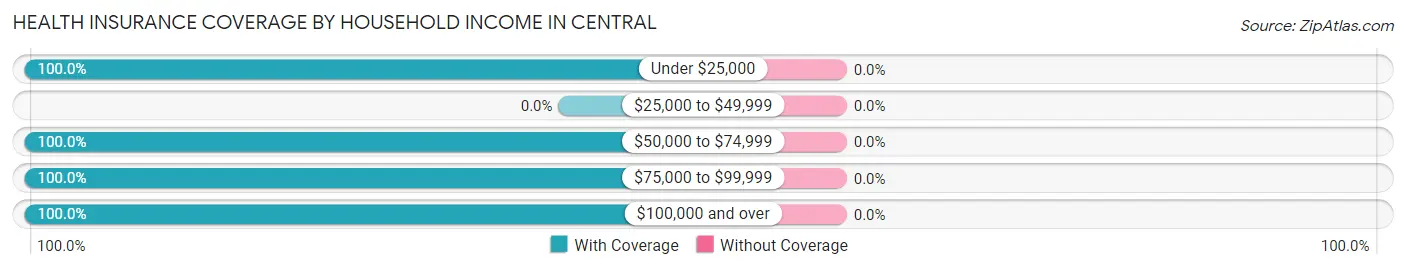
| Household Income | With Coverage | Without Coverage |
| Under $25,000 | 8 (100.0%) | 0 (0.0%) |
| $25,000 to $49,999 | 0 (0.0%) | 0 (0.0%) |
| $50,000 to $74,999 | 9 (100.0%) | 0 (0.0%) |
| $75,000 to $99,999 | 236 (100.0%) | 0 (0.0%) |
| $100,000 and over | 122 (100.0%) | 0 (0.0%) |
Public vs Private Health Insurance Coverage by Age in Central
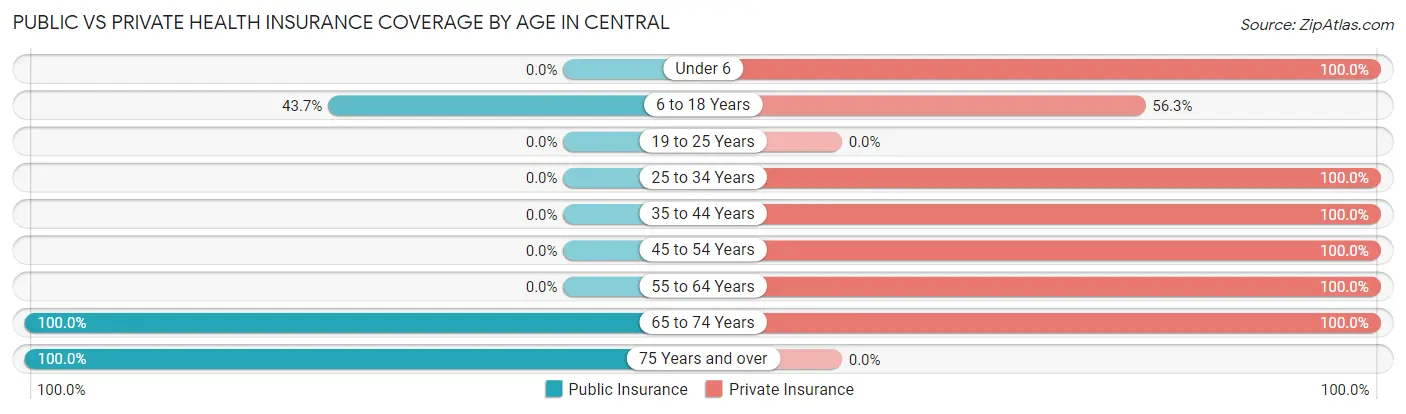
| Age Bracket | Public Insurance | Private Insurance |
| Under 6 | 0 (0.0%) | 40 (100.0%) |
| 6 to 18 Years | 31 (43.7%) | 40 (56.3%) |
| 19 to 25 Years | 0 (0.0%) | 0 (0.0%) |
| 25 to 34 Years | 0 (0.0%) | 95 (100.0%) |
| 35 to 44 Years | 0 (0.0%) | 68 (100.0%) |
| 45 to 54 Years | 0 (0.0%) | 51 (100.0%) |
| 55 to 64 Years | 0 (0.0%) | 8 (100.0%) |
| 65 to 74 Years | 34 (100.0%) | 34 (100.0%) |
| 75 Years and over | 8 (100.0%) | 0 (0.0%) |
| Total | 73 (19.5%) | 336 (89.6%) |
Disability Status by Sex by Age in Central
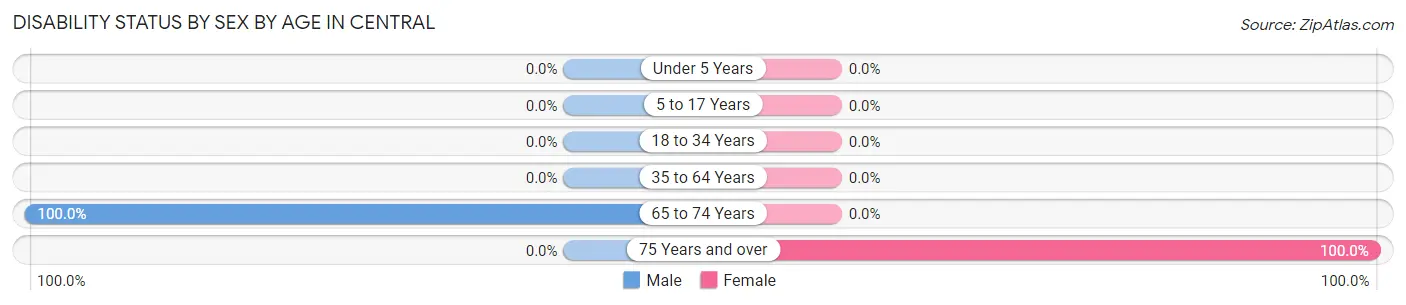
| Age Bracket | Male | Female |
| Under 5 Years | 0 (0.0%) | 0 (0.0%) |
| 5 to 17 Years | 0 (0.0%) | 0 (0.0%) |
| 18 to 34 Years | 0 (0.0%) | 0 (0.0%) |
| 35 to 64 Years | 0 (0.0%) | 0 (0.0%) |
| 65 to 74 Years | 18 (100.0%) | 0 (0.0%) |
| 75 Years and over | 0 (0.0%) | 8 (100.0%) |
Disability Class by Sex by Age in Central
Disability Class: Hearing Difficulty
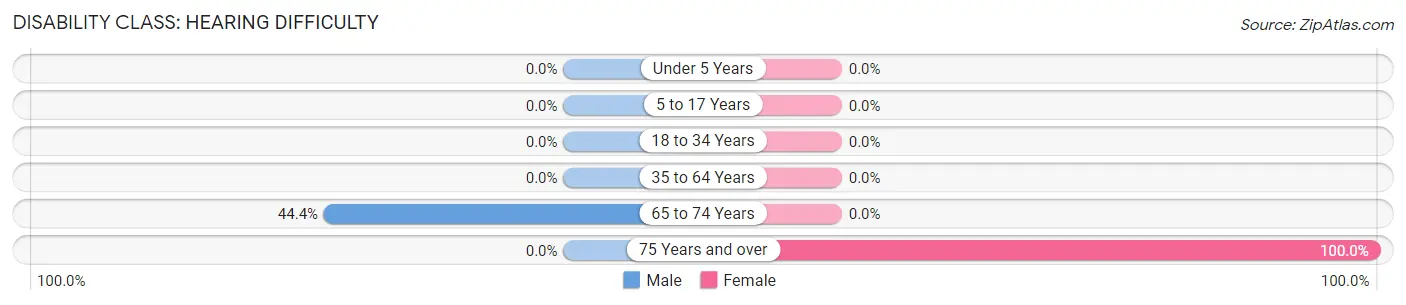
| Age Bracket | Male | Female |
| Under 5 Years | 0 (0.0%) | 0 (0.0%) |
| 5 to 17 Years | 0 (0.0%) | 0 (0.0%) |
| 18 to 34 Years | 0 (0.0%) | 0 (0.0%) |
| 35 to 64 Years | 0 (0.0%) | 0 (0.0%) |
| 65 to 74 Years | 8 (44.4%) | 0 (0.0%) |
| 75 Years and over | 0 (0.0%) | 8 (100.0%) |
Disability Class: Vision Difficulty
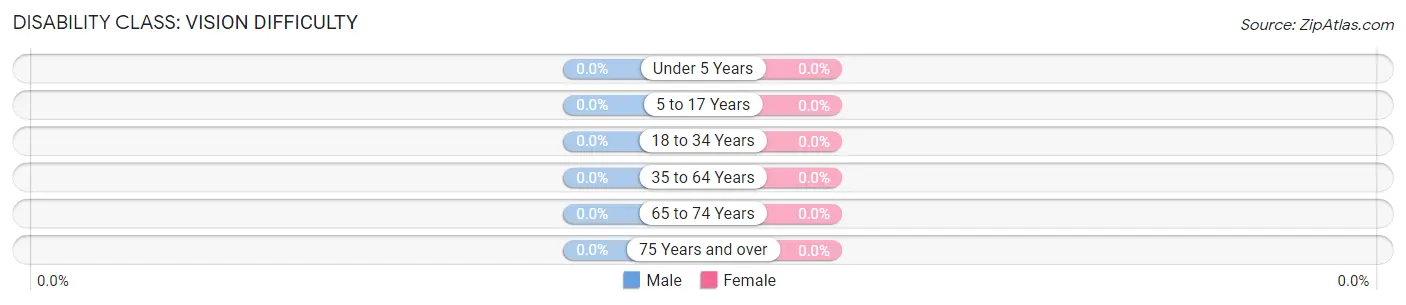
| Age Bracket | Male | Female |
| Under 5 Years | 0 (0.0%) | 0 (0.0%) |
| 5 to 17 Years | 0 (0.0%) | 0 (0.0%) |
| 18 to 34 Years | 0 (0.0%) | 0 (0.0%) |
| 35 to 64 Years | 0 (0.0%) | 0 (0.0%) |
| 65 to 74 Years | 0 (0.0%) | 0 (0.0%) |
| 75 Years and over | 0 (0.0%) | 0 (0.0%) |
Disability Class: Cognitive Difficulty
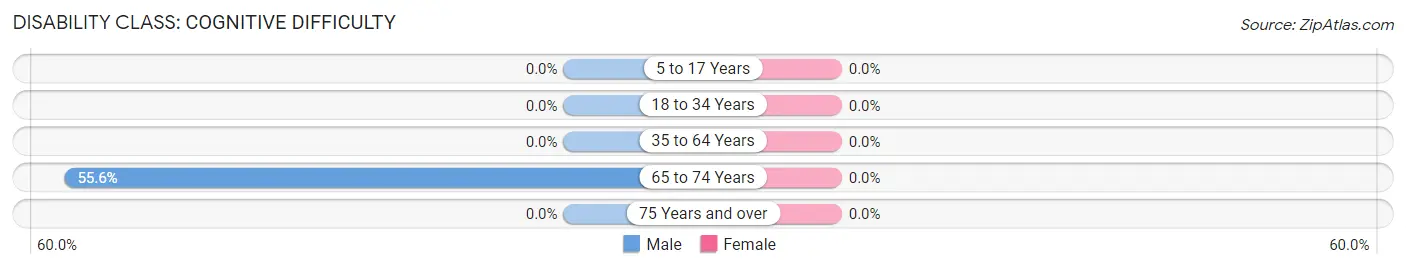
| Age Bracket | Male | Female |
| 5 to 17 Years | 0 (0.0%) | 0 (0.0%) |
| 18 to 34 Years | 0 (0.0%) | 0 (0.0%) |
| 35 to 64 Years | 0 (0.0%) | 0 (0.0%) |
| 65 to 74 Years | 10 (55.6%) | 0 (0.0%) |
| 75 Years and over | 0 (0.0%) | 0 (0.0%) |
Disability Class: Ambulatory Difficulty
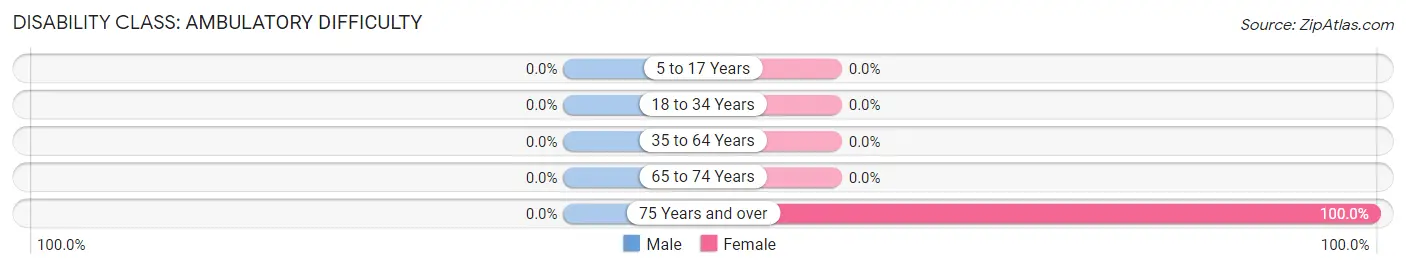
| Age Bracket | Male | Female |
| 5 to 17 Years | 0 (0.0%) | 0 (0.0%) |
| 18 to 34 Years | 0 (0.0%) | 0 (0.0%) |
| 35 to 64 Years | 0 (0.0%) | 0 (0.0%) |
| 65 to 74 Years | 0 (0.0%) | 0 (0.0%) |
| 75 Years and over | 0 (0.0%) | 8 (100.0%) |
Disability Class: Self-Care Difficulty
| Age Bracket | Male | Female |
| 5 to 17 Years | 0 (0.0%) | 0 (0.0%) |
| 18 to 34 Years | 0 (0.0%) | 0 (0.0%) |
| 35 to 64 Years | 0 (0.0%) | 0 (0.0%) |
| 65 to 74 Years | 0 (0.0%) | 0 (0.0%) |
| 75 Years and over | 0 (0.0%) | 0 (0.0%) |
Technology Access in Central
Computing Device Access in Central
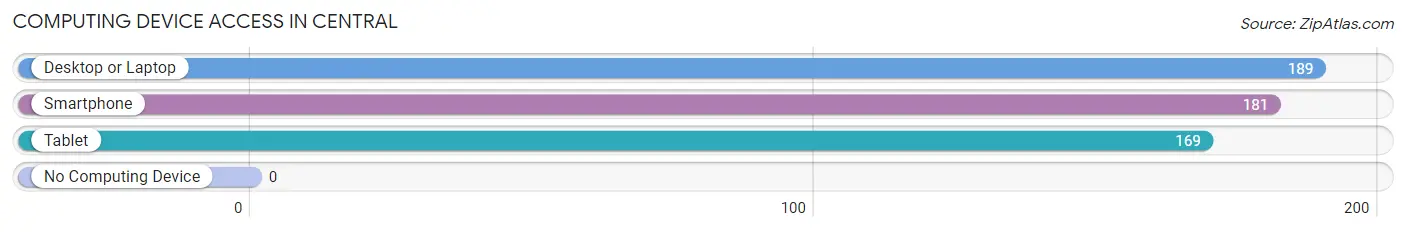
| Device Type | # Households | % Households |
| Desktop or Laptop | 189 | 100.0% |
| Smartphone | 181 | 95.8% |
| Tablet | 169 | 89.4% |
| No Computing Device | 0 | 0.0% |
| Total | 189 | 100.0% |
Internet Access in Central
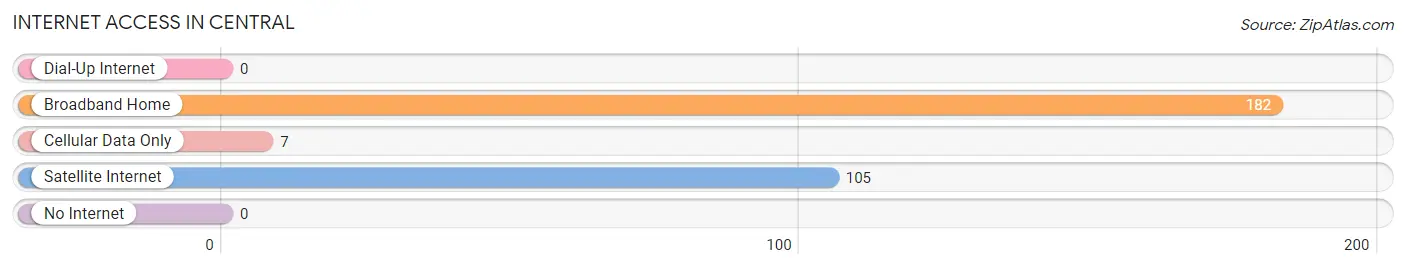
| Internet Type | # Households | % Households |
| Dial-Up Internet | 0 | 0.0% |
| Broadband Home | 182 | 96.3% |
| Cellular Data Only | 7 | 3.7% |
| Satellite Internet | 105 | 55.6% |
| No Internet | 0 | 0.0% |
| Total | 189 | 100.0% |
Central Summary
Central Arizona is a region of the state that is located in the central part of the state. It is bordered by the Mogollon Rim to the north, the White Mountains to the east, the Gila River to the south, and the Colorado Plateau to the west. The region is home to a variety of landscapes, from the high desert of the Sonoran Desert to the lush forests of the Mogollon Rim.
History
The history of Central Arizona is closely tied to the history of the Native American tribes that have lived in the region for centuries. The area was first inhabited by the Hohokam, who were a semi-nomadic people who lived in the area from around 300 BCE to 1450 CE. They were followed by the Pima and Tohono O’odham, who were agriculturalists who lived in the area from around 1450 to the late 1800s.
The first Europeans to explore the area were Spanish explorers in the late 1500s. They were followed by American settlers in the late 1800s, who established ranches and farms in the area. The area was also home to a number of mining operations, which were established in the late 1800s and early 1900s.
Geography
Central Arizona is located in the central part of the state, and is bordered by the Mogollon Rim to the north, the White Mountains to the east, the Gila River to the south, and the Colorado Plateau to the west. The region is home to a variety of landscapes, from the high desert of the Sonoran Desert to the lush forests of the Mogollon Rim.
The region is home to a number of mountain ranges, including the White Mountains, the Mazatzal Mountains, the Superstition Mountains, and the Santa Catalina Mountains. The region is also home to a number of rivers, including the Gila, Salt, and Verde Rivers.
Economy
The economy of Central Arizona is largely based on agriculture, tourism, and mining. Agriculture is the largest sector of the economy, with crops such as cotton, alfalfa, and hay being grown in the region. Tourism is also an important part of the economy, with visitors coming to the region to enjoy the natural beauty of the area. Mining is also an important part of the economy, with copper, gold, and silver being mined in the region.
Demographics
As of the 2010 census, the population of Central Arizona was 1,837,621. The population is largely made up of Native Americans, with the largest group being the Tohono O’odham. The region is also home to a large Hispanic population, with the largest group being Mexican Americans. The region is also home to a large number of white Americans, with the largest group being German Americans.
Common Questions
What is Per Capita Income in Central?
Per Capita income in Central is $47,554.
What is the Median Family Income in Central?
Median Family Income in Central is $96,607.
What is the Median Household income in Central?
Median Household Income in Central is $88,645.
What is Income or Wage Gap in Central?
Income or Wage Gap in Central is 1.4%.
Women in Central earn 98.6 cents for every dollar earned by a man.
What is Inequality or Gini Index in Central?
Inequality or Gini Index in Central is 0.16.
What is the Total Population of Central?
Total Population of Central is 375.
What is the Total Male Population of Central?
Total Male Population of Central is 98.
What is the Total Female Population of Central?
Total Female Population of Central is 277.
What is the Ratio of Males per 100 Females in Central?
There are 35.38 Males per 100 Females in Central.
What is the Ratio of Females per 100 Males in Central?
There are 282.65 Females per 100 Males in Central.
What is the Median Population Age in Central?
Median Population Age in Central is 26.8 Years.
What is the Average Family Size in Central
Average Family Size in Central is 3.4 People.
What is the Average Household Size in Central
Average Household Size in Central is 2.0 People.
How Large is the Labor Force in Central?
There are 224 People in the Labor Forcein in Central.
What is the Percentage of People in the Labor Force in Central?
84.2% of People are in the Labor Force in Central.