Tibes, PR Map & Demographics
Tibes Map
Tibes Overview
$8,860
PER CAPITA INCOME
0.57
INEQUALITY / GINI INDEX
176
TOTAL POPULATION
117
MALE POPULATION
59
FEMALE POPULATION
198.31
MALES / 100 FEMALES
50.43
FEMALES / 100 MALES
39.1
MEDIAN AGE
3.0
AVG FAMILY SIZE
2.3
AVG HOUSEHOLD SIZE
32
LABOR FORCE [ PEOPLE ]
30.8%
PERCENT IN LABOR FORCE
Income in Tibes
Income Overview in Tibes
| Characteristic | Number | Measure |
| Per Capita Income | 176 | $8,860 |
| Median Family Income | 41 | $0 |
| Mean Family Income | 41 | $35,115 |
| Median Household Income | 78 | $0 |
| Mean Household Income | 78 | $20,137 |
| Income Deficit | 41 | $0 |
| Wage / Income Gap (%) | 176 | 0.00% |
| Wage / Income Gap ($) | 176 | 100.00¢ per $1 |
| Gini / Inequality Index | 176 | 0.57 |
Earnings by Sex in Tibes
| Sex | Number | Average Earnings |
| Male | 0 (0.0%) | $0 |
| Female | 32 (100.0%) | $0 |
| Total | 32 (100.0%) | $0 |
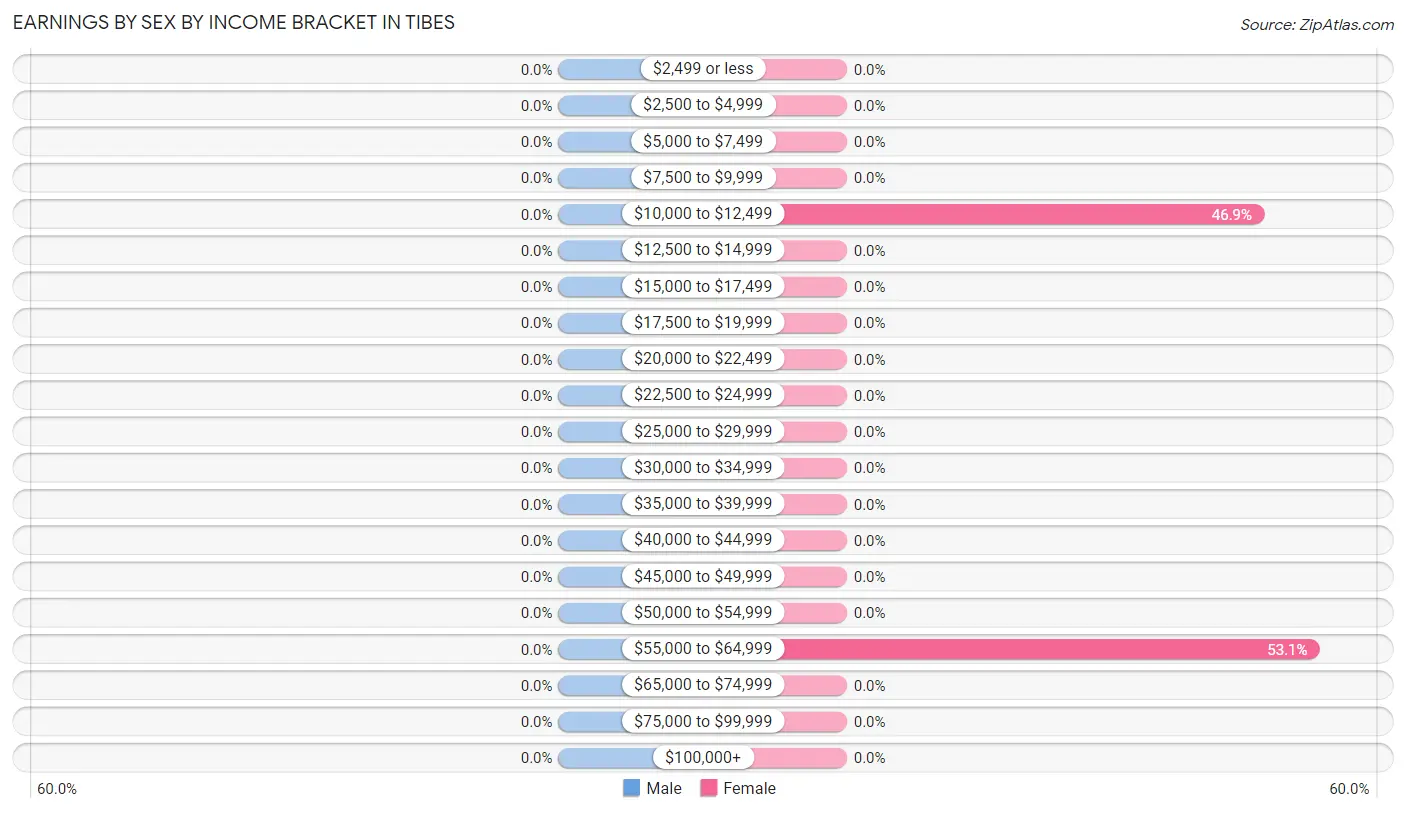
Earnings by Sex by Income Bracket in Tibes
| Income | Male | Female |
| $2,499 or less | 0 (0.0%) | 0 (0.0%) |
| $2,500 to $4,999 | 0 (0.0%) | 0 (0.0%) |
| $5,000 to $7,499 | 0 (0.0%) | 0 (0.0%) |
| $7,500 to $9,999 | 0 (0.0%) | 0 (0.0%) |
| $10,000 to $12,499 | 0 (0.0%) | 15 (46.9%) |
| $12,500 to $14,999 | 0 (0.0%) | 0 (0.0%) |
| $15,000 to $17,499 | 0 (0.0%) | 0 (0.0%) |
| $17,500 to $19,999 | 0 (0.0%) | 0 (0.0%) |
| $20,000 to $22,499 | 0 (0.0%) | 0 (0.0%) |
| $22,500 to $24,999 | 0 (0.0%) | 0 (0.0%) |
| $25,000 to $29,999 | 0 (0.0%) | 0 (0.0%) |
| $30,000 to $34,999 | 0 (0.0%) | 0 (0.0%) |
| $35,000 to $39,999 | 0 (0.0%) | 0 (0.0%) |
| $40,000 to $44,999 | 0 (0.0%) | 0 (0.0%) |
| $45,000 to $49,999 | 0 (0.0%) | 0 (0.0%) |
| $50,000 to $54,999 | 0 (0.0%) | 0 (0.0%) |
| $55,000 to $64,999 | 0 (0.0%) | 17 (53.1%) |
| $65,000 to $74,999 | 0 (0.0%) | 0 (0.0%) |
| $75,000 to $99,999 | 0 (0.0%) | 0 (0.0%) |
| $100,000+ | 0 (0.0%) | 0 (0.0%) |
| Total | 0 (0.0%) | 32 (100.0%) |
Earnings by Sex by Educational Attainment in Tibes
| Educational Attainment | Male Income | Female Income |
| Less than High School | - | - |
| High School Diploma | - | - |
| College or Associate's Degree | - | - |
| Bachelor's Degree | - | - |
| Graduate Degree | - | - |
| Total | - | - |
Family Income in Tibes
Family Income Brackets in Tibes
According to the Tibes family income data, there are 17 families falling into the $50,000 to $74,999 income range, which is the most common income bracket and makes up 41.5% of all families.
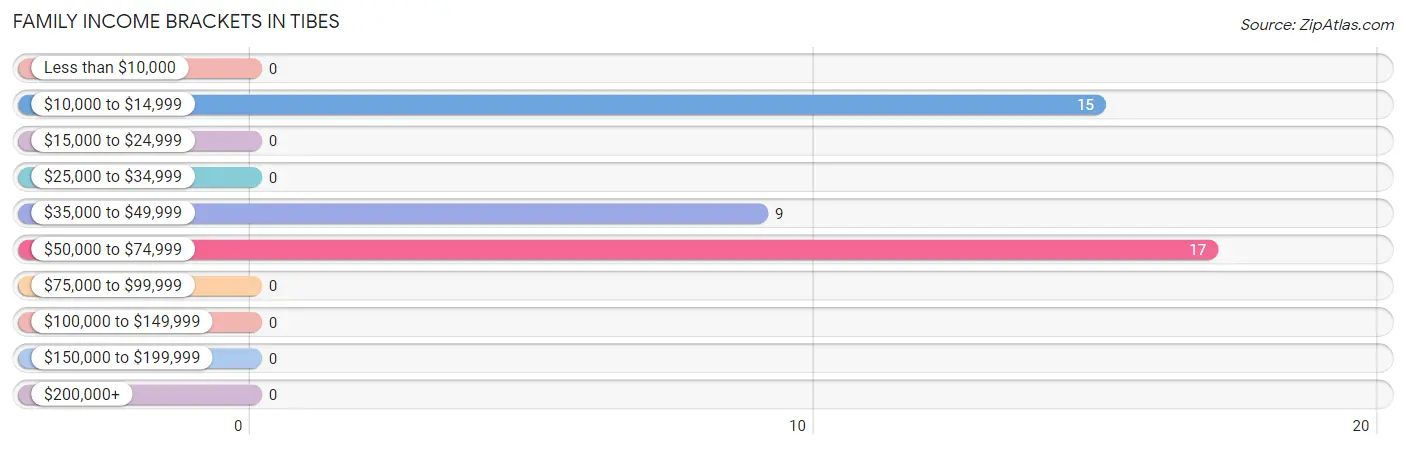
| Income Bracket | # Families | % Families |
| Less than $10,000 | 0 | 0.0% |
| $10,000 to $14,999 | 15 | 36.6% |
| $15,000 to $24,999 | 0 | 0.0% |
| $25,000 to $34,999 | 0 | 0.0% |
| $35,000 to $49,999 | 9 | 22.0% |
| $50,000 to $74,999 | 17 | 41.5% |
| $75,000 to $99,999 | 0 | 0.0% |
| $100,000 to $149,999 | 0 | 0.0% |
| $150,000 to $199,999 | 0 | 0.0% |
| $200,000+ | 0 | 0.0% |
Family Income by Famaliy Size in Tibes
| Income Bracket | # Families | Median Income |
| 2-Person Families | 9 (22.0%) | $0 |
| 3-Person Families | 32 (78.0%) | $0 |
| 4-Person Families | 0 (0.0%) | $0 |
| 5-Person Families | 0 (0.0%) | $0 |
| 6-Person Families | 0 (0.0%) | $0 |
| 7+ Person Families | 0 (0.0%) | $0 |
| Total | 41 (100.0%) | $0 |
Family Income by Number of Earners in Tibes
| Number of Earners | # Families | Median Income |
| No Earners | 9 (22.0%) | $0 |
| 1 Earner | 32 (78.0%) | $0 |
| 2 Earners | 0 (0.0%) | $0 |
| 3+ Earners | 0 (0.0%) | $0 |
| Total | 41 (100.0%) | $0 |
Household Income in Tibes
Household Income Brackets in Tibes
With 37 households falling in the category, the less than $10,000 income range is the most frequent in Tibes, accounting for 47.4% of all households.
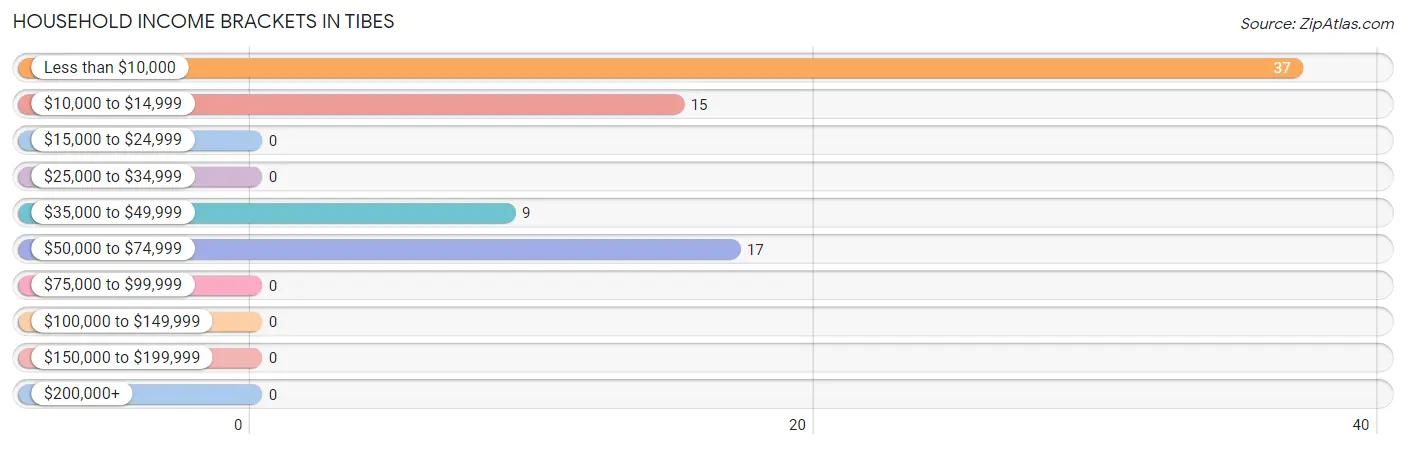
| Income Bracket | # Households | % Households |
| Less than $10,000 | 37 | 47.4% |
| $10,000 to $14,999 | 15 | 19.2% |
| $15,000 to $24,999 | 0 | 0.0% |
| $25,000 to $34,999 | 0 | 0.0% |
| $35,000 to $49,999 | 9 | 11.5% |
| $50,000 to $74,999 | 17 | 21.8% |
| $75,000 to $99,999 | 0 | 0.0% |
| $100,000 to $149,999 | 0 | 0.0% |
| $150,000 to $199,999 | 0 | 0.0% |
| $200,000+ | 0 | 0.0% |
Household Income by Householder Age in Tibes
| Income Bracket | # Households | Median Income |
| 15 to 24 Years | 0 (0.0%) | $0 |
| 25 to 44 Years | 32 (41.0%) | $0 |
| 45 to 64 Years | 20 (25.6%) | $0 |
| 65+ Years | 26 (33.3%) | $0 |
| Total | 78 (100.0%) | $0 |
Poverty in Tibes
Income Below Poverty by Sex and Age in Tibes
With 62.4% poverty level for males and 57.6% for females among the residents of Tibes, 12 to 14 year old males and 6 to 11 year old females are the most vulnerable to poverty, with 18 males (100.0%) and 19 females (100.0%) in their respective age groups living below the poverty level.
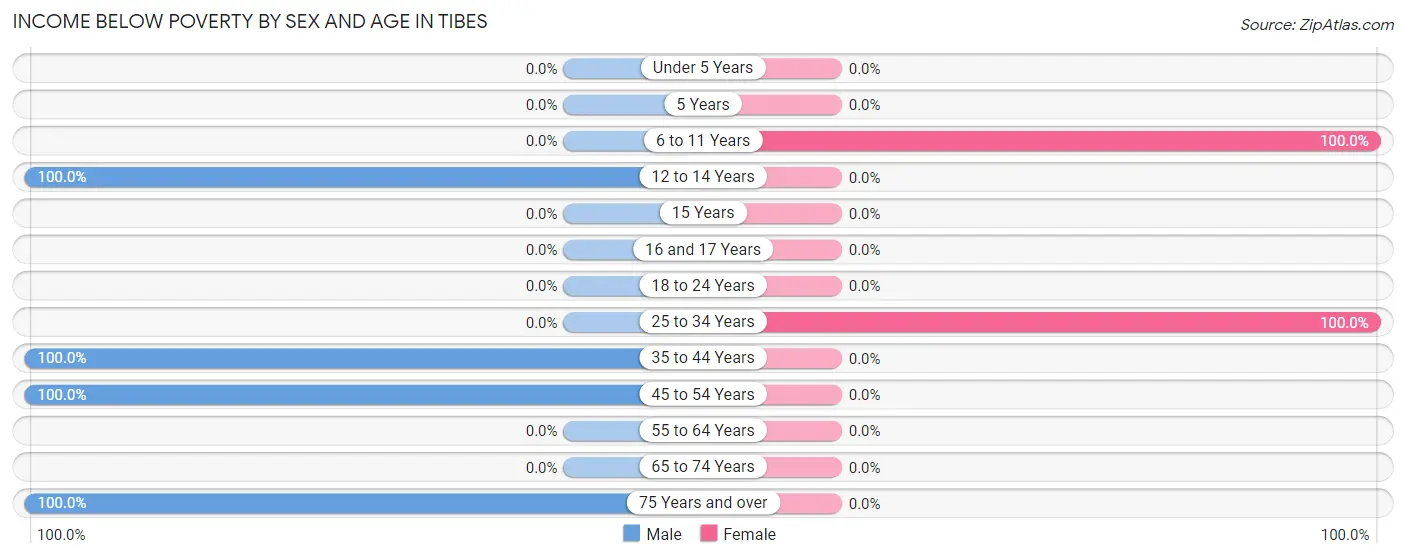
| Age Bracket | Male | Female |
| Under 5 Years | 0 (0.0%) | 0 (0.0%) |
| 5 Years | 0 (0.0%) | 0 (0.0%) |
| 6 to 11 Years | 0 (0.0%) | 19 (100.0%) |
| 12 to 14 Years | 18 (100.0%) | 0 (0.0%) |
| 15 Years | 0 (0.0%) | 0 (0.0%) |
| 16 and 17 Years | 0 (0.0%) | 0 (0.0%) |
| 18 to 24 Years | 0 (0.0%) | 0 (0.0%) |
| 25 to 34 Years | 0 (0.0%) | 15 (100.0%) |
| 35 to 44 Years | 18 (100.0%) | 0 (0.0%) |
| 45 to 54 Years | 20 (100.0%) | 0 (0.0%) |
| 55 to 64 Years | 0 (0.0%) | 0 (0.0%) |
| 65 to 74 Years | 0 (0.0%) | 0 (0.0%) |
| 75 Years and over | 17 (100.0%) | 0 (0.0%) |
| Total | 73 (62.4%) | 34 (57.6%) |
Income Above Poverty by Sex and Age in Tibes
According to the poverty statistics in Tibes, males aged under 5 years and females aged 35 to 44 years are the age groups that are most secure financially, with 100.0% of males and 100.0% of females in these age groups living above the poverty line.
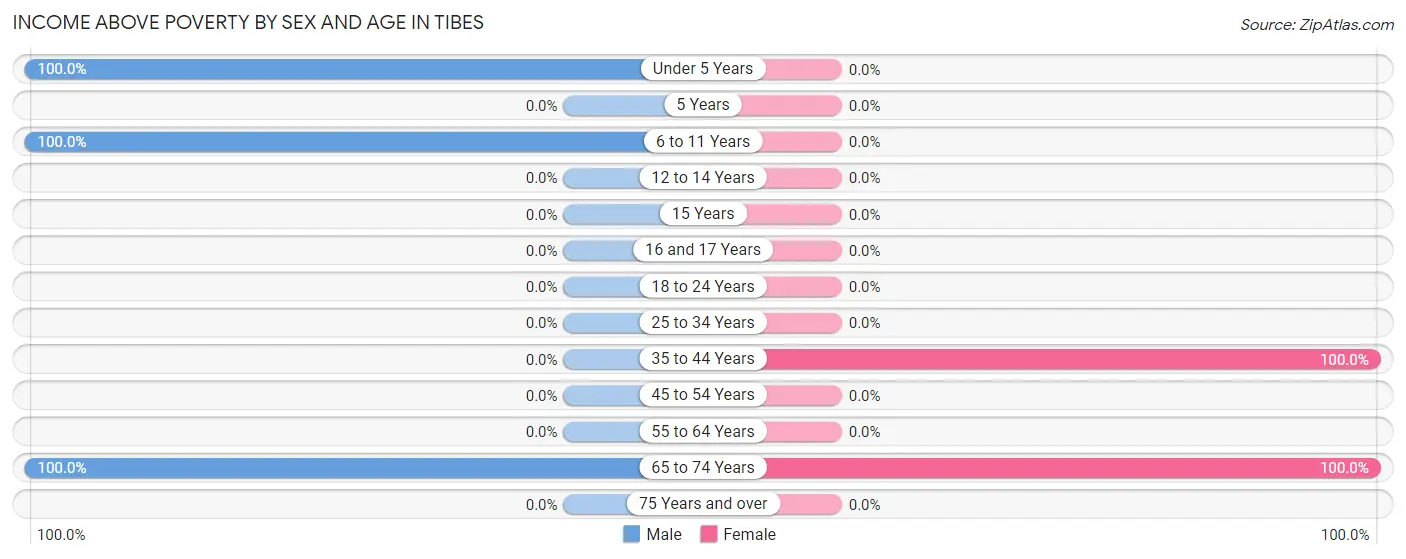
| Age Bracket | Male | Female |
| Under 5 Years | 19 (100.0%) | 0 (0.0%) |
| 5 Years | 0 (0.0%) | 0 (0.0%) |
| 6 to 11 Years | 16 (100.0%) | 0 (0.0%) |
| 12 to 14 Years | 0 (0.0%) | 0 (0.0%) |
| 15 Years | 0 (0.0%) | 0 (0.0%) |
| 16 and 17 Years | 0 (0.0%) | 0 (0.0%) |
| 18 to 24 Years | 0 (0.0%) | 0 (0.0%) |
| 25 to 34 Years | 0 (0.0%) | 0 (0.0%) |
| 35 to 44 Years | 0 (0.0%) | 17 (100.0%) |
| 45 to 54 Years | 0 (0.0%) | 0 (0.0%) |
| 55 to 64 Years | 0 (0.0%) | 0 (0.0%) |
| 65 to 74 Years | 9 (100.0%) | 8 (100.0%) |
| 75 Years and over | 0 (0.0%) | 0 (0.0%) |
| Total | 44 (37.6%) | 25 (42.4%) |
Income Below Poverty Among Married-Couple Families in Tibes
| Children | Above Poverty | Below Poverty |
| No Children | 9 (100.0%) | 0 (0.0%) |
| 1 or 2 Children | 0 (0.0%) | 0 (0.0%) |
| 3 or 4 Children | 0 (0.0%) | 0 (0.0%) |
| 5 or more Children | 0 (0.0%) | 0 (0.0%) |
| Total | 9 (100.0%) | 0 (0.0%) |
Income Below Poverty Among Single-Parent Households in Tibes
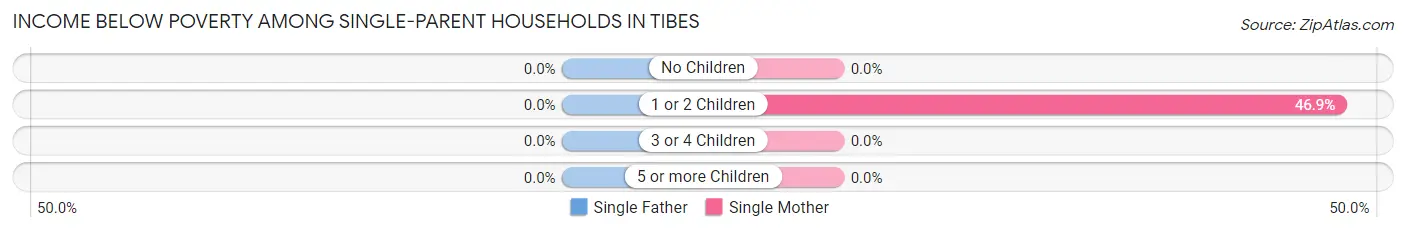
| Children | Single Father | Single Mother |
| No Children | 0 (0.0%) | 0 (0.0%) |
| 1 or 2 Children | 0 (0.0%) | 15 (46.9%) |
| 3 or 4 Children | 0 (0.0%) | 0 (0.0%) |
| 5 or more Children | 0 (0.0%) | 0 (0.0%) |
| Total | 0 (0.0%) | 15 (46.9%) |
Income Below Poverty Among Married-Couple vs Single-Parent Households in Tibes
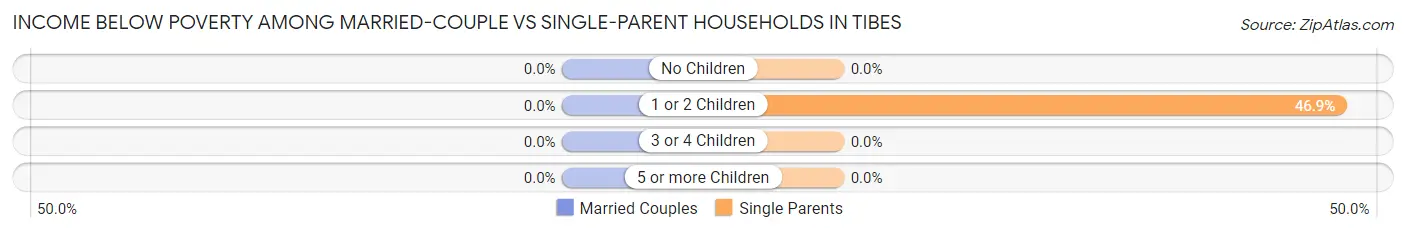
| Children | Married-Couple Families | Single-Parent Households |
| No Children | 0 (0.0%) | 0 (0.0%) |
| 1 or 2 Children | 0 (0.0%) | 15 (46.9%) |
| 3 or 4 Children | 0 (0.0%) | 0 (0.0%) |
| 5 or more Children | 0 (0.0%) | 0 (0.0%) |
| Total | 0 (0.0%) | 15 (46.9%) |
Race in Tibes
The most populous races in Tibes are Hispanic or Latino (176 | 100.0%), White / Caucasian (159 | 90.3%), and Black / African American (17 | 9.7%).
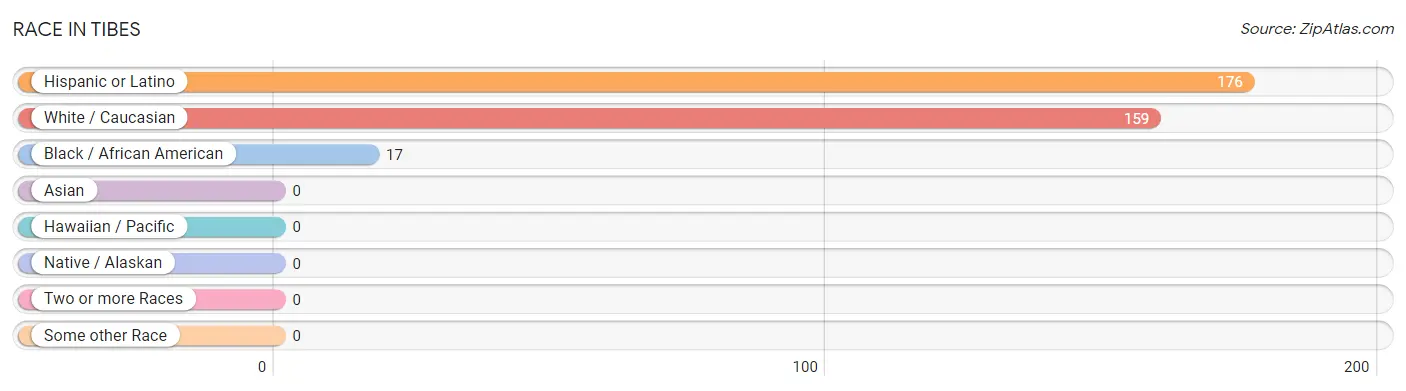
| Race | # Population | % Population |
| Asian | 0 | 0.0% |
| Black / African American | 17 | 9.7% |
| Hawaiian / Pacific | 0 | 0.0% |
| Hispanic or Latino | 176 | 100.0% |
| Native / Alaskan | 0 | 0.0% |
| White / Caucasian | 159 | 90.3% |
| Two or more Races | 0 | 0.0% |
| Some other Race | 0 | 0.0% |
| Total | 176 | 100.0% |
Ancestry in Tibes
The most populous ancestries reported in Tibes are Puerto Rican (159 | 90.3%), Dominican (17 | 9.7%), and Italian (9 | 5.1%), together accounting for 105.1% of all Tibes residents.
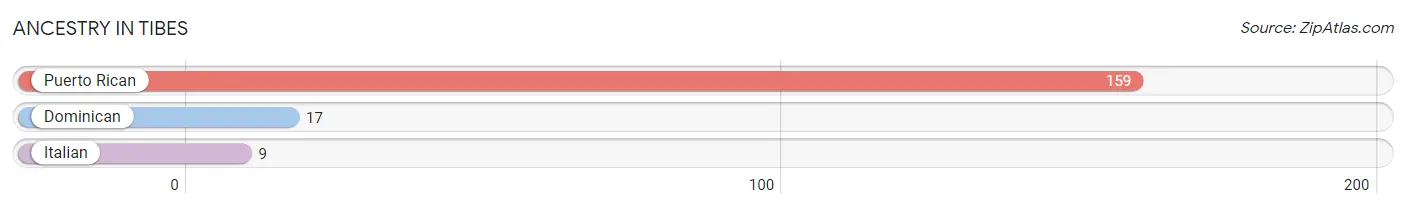
| Ancestry | # Population | % Population |
| Dominican | 17 | 9.7% |
| Italian | 9 | 5.1% |
| Puerto Rican | 159 | 90.3% | View All 3 Rows |
Immigrants in Tibes

| Immigration Origin | # Population | % Population | View All 0 Rows |
Sex and Age in Tibes
Sex and Age in Tibes
The most populous age groups in Tibes are 50 to 54 Years (20 | 17.1%) for men and 5 to 9 Years (19 | 32.2%) for women.
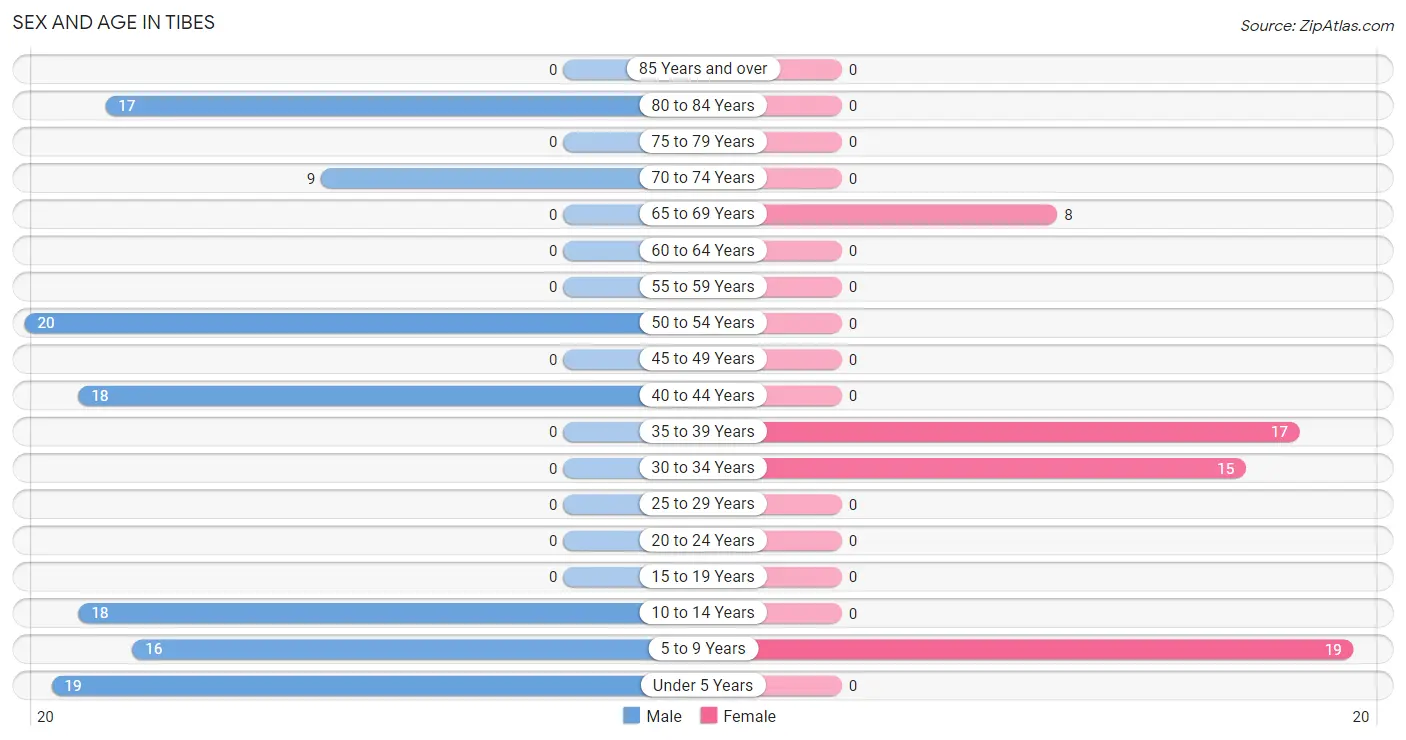
| Age Bracket | Male | Female |
| Under 5 Years | 19 (16.2%) | 0 (0.0%) |
| 5 to 9 Years | 16 (13.7%) | 19 (32.2%) |
| 10 to 14 Years | 18 (15.4%) | 0 (0.0%) |
| 15 to 19 Years | 0 (0.0%) | 0 (0.0%) |
| 20 to 24 Years | 0 (0.0%) | 0 (0.0%) |
| 25 to 29 Years | 0 (0.0%) | 0 (0.0%) |
| 30 to 34 Years | 0 (0.0%) | 15 (25.4%) |
| 35 to 39 Years | 0 (0.0%) | 17 (28.8%) |
| 40 to 44 Years | 18 (15.4%) | 0 (0.0%) |
| 45 to 49 Years | 0 (0.0%) | 0 (0.0%) |
| 50 to 54 Years | 20 (17.1%) | 0 (0.0%) |
| 55 to 59 Years | 0 (0.0%) | 0 (0.0%) |
| 60 to 64 Years | 0 (0.0%) | 0 (0.0%) |
| 65 to 69 Years | 0 (0.0%) | 8 (13.6%) |
| 70 to 74 Years | 9 (7.7%) | 0 (0.0%) |
| 75 to 79 Years | 0 (0.0%) | 0 (0.0%) |
| 80 to 84 Years | 17 (14.5%) | 0 (0.0%) |
| 85 Years and over | 0 (0.0%) | 0 (0.0%) |
| Total | 117 (100.0%) | 59 (100.0%) |
Families and Households in Tibes
Median Family Size in Tibes
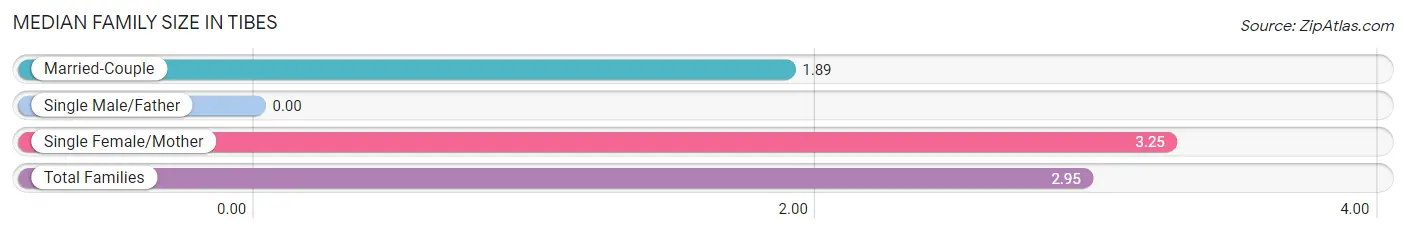
| Family Type | # Families | Family Size |
| Married-Couple | 9 (22.0%) | 1.89 |
| Single Male/Father | 0 (0.0%) | - |
| Single Female/Mother | 32 (78.0%) | 3.25 |
| Total Families | 41 (100.0%) | 2.95 |
Median Household Size in Tibes
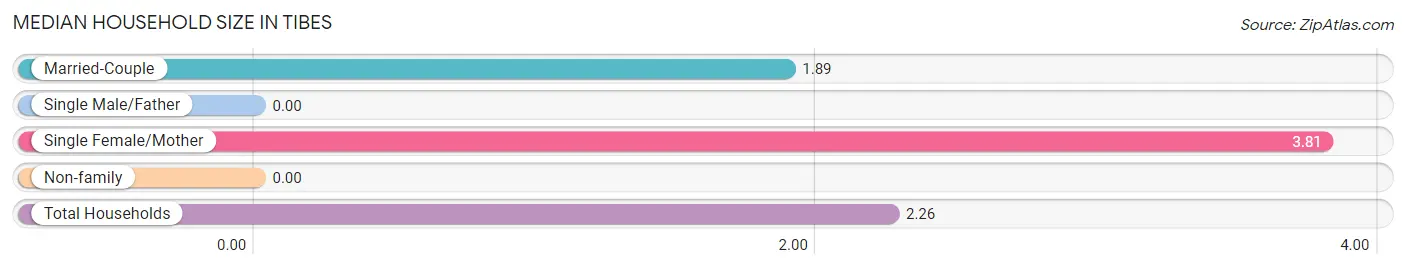
| Household Type | # Households | Household Size |
| Married-Couple | 9 (11.5%) | 1.89 |
| Single Male/Father | 0 (0.0%) | - |
| Single Female/Mother | 32 (41.0%) | 3.81 |
| Non-family | 37 (47.4%) | - |
| Total Households | 78 (100.0%) | 2.26 |
Household Size by Marriage Status in Tibes
Out of a total of 78 households in Tibes, 41 (52.6%) are family households, while 37 (47.4%) are nonfamily households. The most numerous type of family households are 3-person households, comprising 17, and the most common type of nonfamily households are 1-person households, comprising 37.
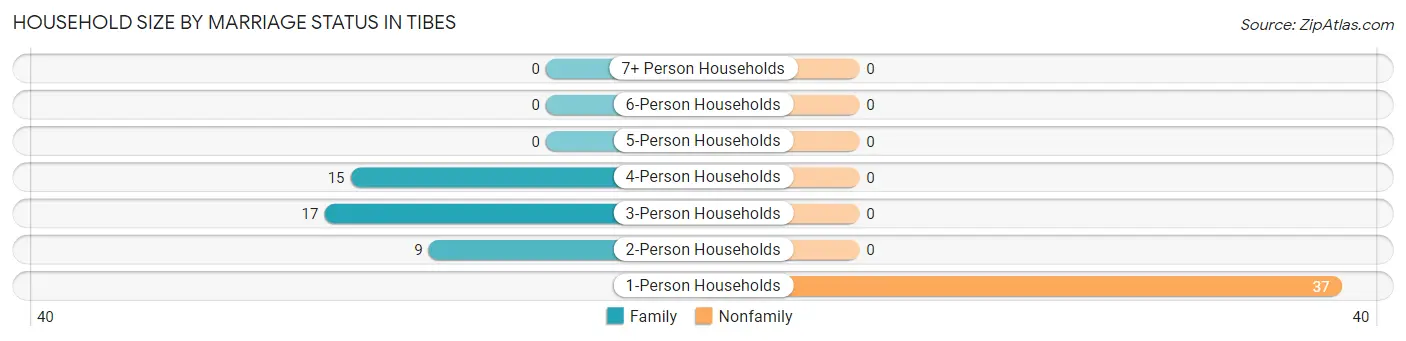
| Household Size | Family Households | Nonfamily Households |
| 1-Person Households | - | 37 (47.4%) |
| 2-Person Households | 9 (11.5%) | 0 (0.0%) |
| 3-Person Households | 17 (21.8%) | 0 (0.0%) |
| 4-Person Households | 15 (19.2%) | 0 (0.0%) |
| 5-Person Households | 0 (0.0%) | 0 (0.0%) |
| 6-Person Households | 0 (0.0%) | 0 (0.0%) |
| 7+ Person Households | 0 (0.0%) | 0 (0.0%) |
| Total | 41 (52.6%) | 37 (47.4%) |
Female Fertility in Tibes
Fertility by Age in Tibes
| Age Bracket | Women with Births | Births / 1,000 Women |
| 15 to 19 years | 0 (0.0%) | 0.0 |
| 20 to 34 years | 0 (0.0%) | 0.0 |
| 35 to 50 years | 0 (0.0%) | 0.0 |
| Total | 0 (0.0%) | 0.0 |
Fertility by Age by Marriage Status in Tibes
| Age Bracket | Married | Unmarried |
| 15 to 19 years | 0 (0.0%) | 0 (0.0%) |
| 20 to 34 years | 0 (0.0%) | 0 (0.0%) |
| 35 to 50 years | 0 (0.0%) | 0 (0.0%) |
| Total | 0 (0.0%) | 0 (0.0%) |
Fertility by Education in Tibes
| Educational Attainment | Women with Births | Births / 1,000 Women |
| Less than High School | 0 (0.0%) | 0.0 |
| High School Diploma | 0 (0.0%) | 0.0 |
| College or Associate's Degree | 0 (0.0%) | 0.0 |
| Bachelor's Degree | 0 (0.0%) | 0.0 |
| Graduate Degree | 0 (0.0%) | 0.0 |
| Total | 0 (0.0%) | 0.0 |
Fertility by Education by Marriage Status in Tibes
| Educational Attainment | Married | Unmarried |
| Less than High School | 0 (0.0%) | 0 (0.0%) |
| High School Diploma | 0 (0.0%) | 0 (0.0%) |
| College or Associate's Degree | 0 (0.0%) | 0 (0.0%) |
| Bachelor's Degree | 0 (0.0%) | 0 (0.0%) |
| Graduate Degree | 0 (0.0%) | 0 (0.0%) |
| Total | 0 (0.0%) | 0 (0.0%) |
Employment Characteristics in Tibes
Employment by Class of Employer in Tibes
Among the 32 employed individuals in Tibes, , and private company employees (32 | 100.0%) make up the most common classes of employment.
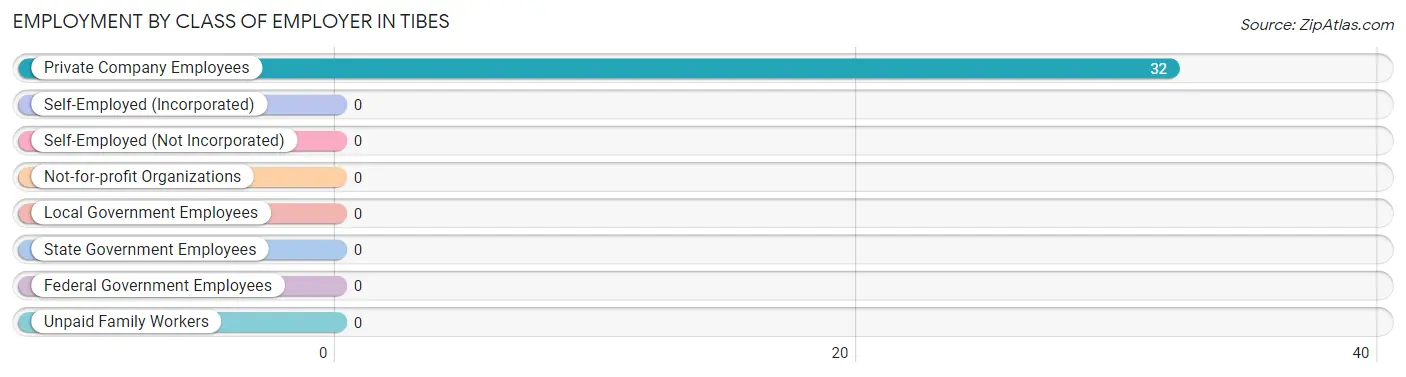
| Employer Class | # Employees | % Employees |
| Private Company Employees | 32 | 100.0% |
| Self-Employed (Incorporated) | 0 | 0.0% |
| Self-Employed (Not Incorporated) | 0 | 0.0% |
| Not-for-profit Organizations | 0 | 0.0% |
| Local Government Employees | 0 | 0.0% |
| State Government Employees | 0 | 0.0% |
| Federal Government Employees | 0 | 0.0% |
| Unpaid Family Workers | 0 | 0.0% |
| Total | 32 | 100.0% |
Employment Status by Age in Tibes
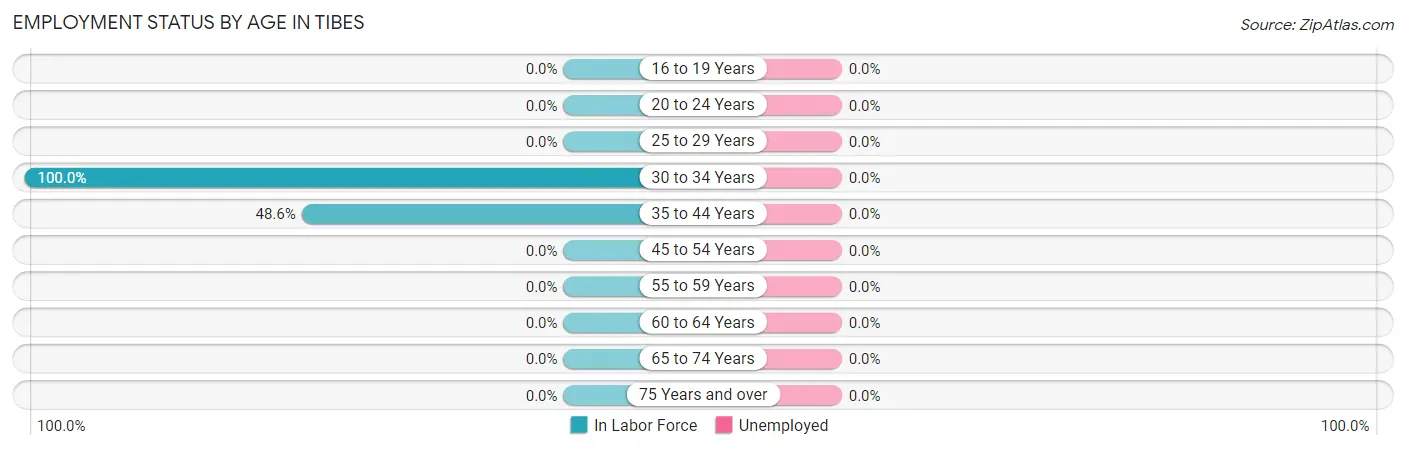
| Age Bracket | In Labor Force | Unemployed |
| 16 to 19 Years | 0 (0.0%) | 0 (0.0%) |
| 20 to 24 Years | 0 (0.0%) | 0 (0.0%) |
| 25 to 29 Years | 0 (0.0%) | 0 (0.0%) |
| 30 to 34 Years | 15 (100.0%) | 0 (0.0%) |
| 35 to 44 Years | 17 (48.6%) | 0 (0.0%) |
| 45 to 54 Years | 0 (0.0%) | 0 (0.0%) |
| 55 to 59 Years | 0 (0.0%) | 0 (0.0%) |
| 60 to 64 Years | 0 (0.0%) | 0 (0.0%) |
| 65 to 74 Years | 0 (0.0%) | 0 (0.0%) |
| 75 Years and over | 0 (0.0%) | 0 (0.0%) |
| Total | 32 (30.8%) | 0 (0.0%) |
Employment Status by Educational Attainment in Tibes
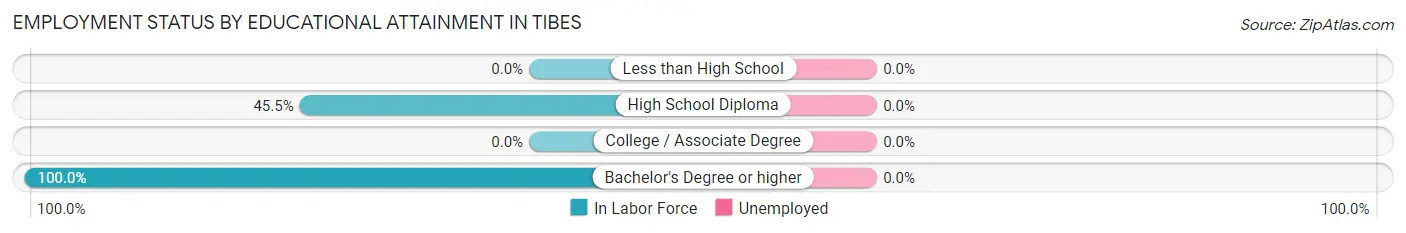
| Educational Attainment | In Labor Force | Unemployed |
| Less than High School | 0 (0.0%) | 0 (0.0%) |
| High School Diploma | 15 (45.5%) | 0 (0.0%) |
| College / Associate Degree | 0 (0.0%) | 0 (0.0%) |
| Bachelor's Degree or higher | 17 (100.0%) | 0 (0.0%) |
| Total | 32 (45.7%) | 0 (0.0%) |
Employment Occupations by Sex in Tibes
Management, Business, Science and Arts Occupations
The most common Management, Business, Science and Arts occupations in Tibes are Health Diagnosing & Treating (17 | 53.1%), and Health Technologists (17 | 53.1%).
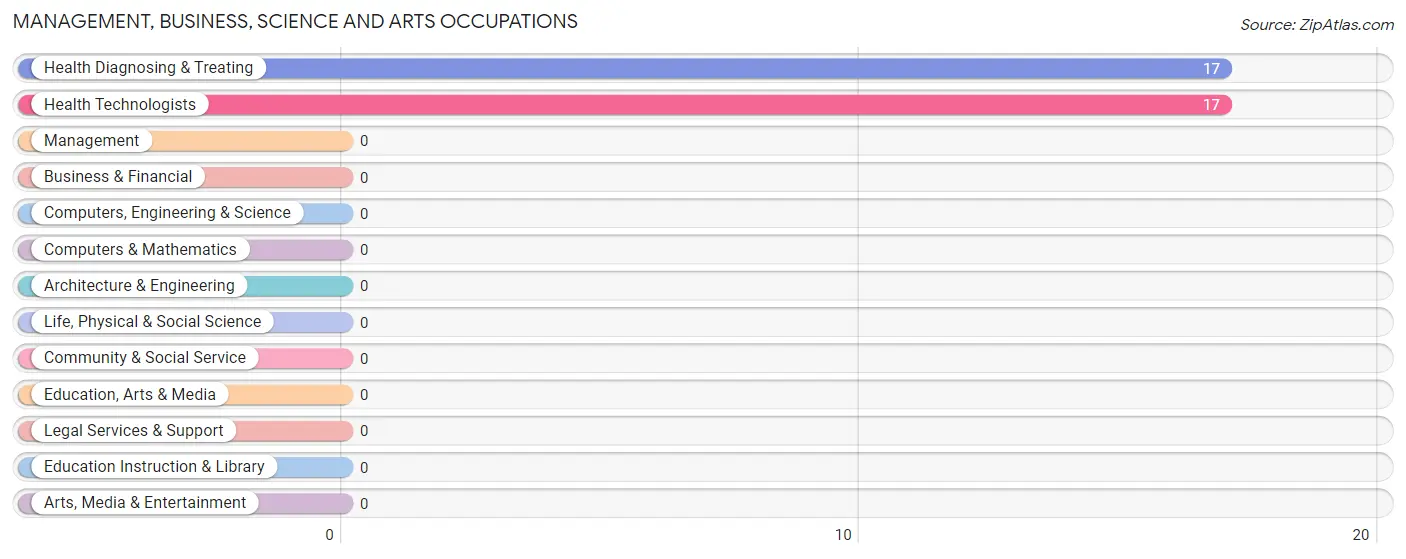
Management, Business, Science and Arts Occupations by Sex
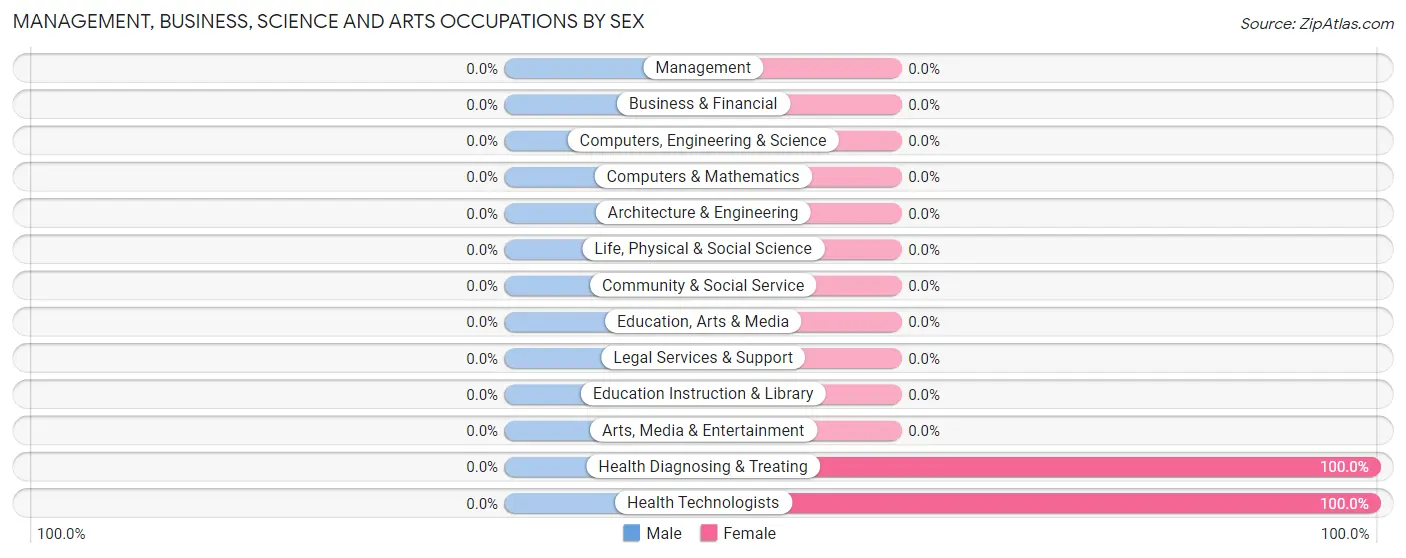
| Occupation | Male | Female |
| Management | 0 (0.0%) | 0 (0.0%) |
| Business & Financial | 0 (0.0%) | 0 (0.0%) |
| Computers, Engineering & Science | 0 (0.0%) | 0 (0.0%) |
| Computers & Mathematics | 0 (0.0%) | 0 (0.0%) |
| Architecture & Engineering | 0 (0.0%) | 0 (0.0%) |
| Life, Physical & Social Science | 0 (0.0%) | 0 (0.0%) |
| Community & Social Service | 0 (0.0%) | 0 (0.0%) |
| Education, Arts & Media | 0 (0.0%) | 0 (0.0%) |
| Legal Services & Support | 0 (0.0%) | 0 (0.0%) |
| Education Instruction & Library | 0 (0.0%) | 0 (0.0%) |
| Arts, Media & Entertainment | 0 (0.0%) | 0 (0.0%) |
| Health Diagnosing & Treating | 0 (0.0%) | 17 (100.0%) |
| Health Technologists | 0 (0.0%) | 17 (100.0%) |
| Total (Category) | 0 (0.0%) | 17 (100.0%) |
| Total (Overall) | 0 (0.0%) | 32 (100.0%) |
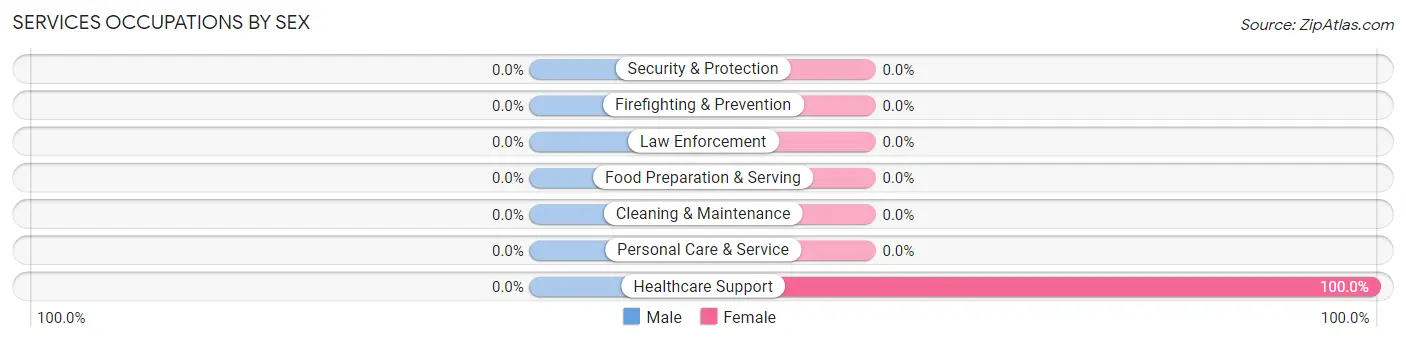
Services Occupations
The most common Services occupations in Tibes are , and Healthcare Support (15 | 46.9%).
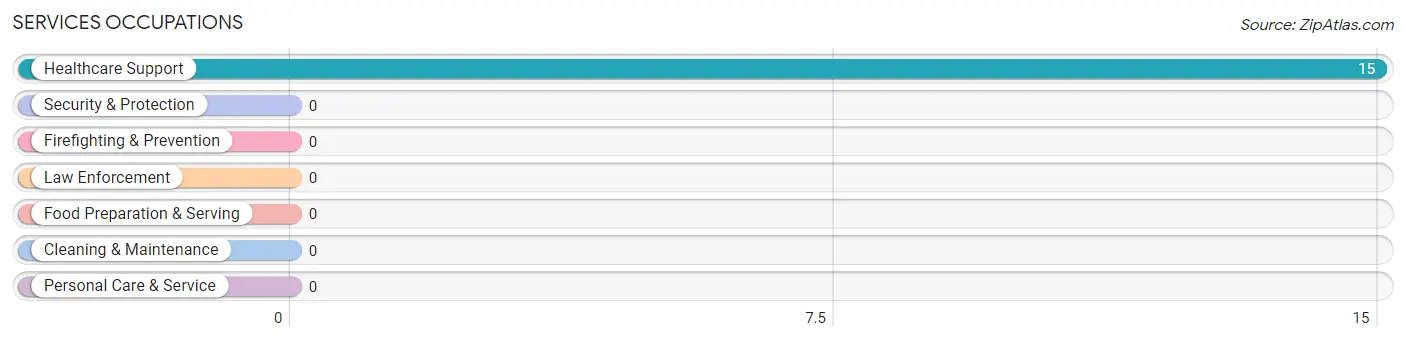
Services Occupations by Sex
| Occupation | Male | Female |
| Healthcare Support | 0 (0.0%) | 15 (100.0%) |
| Security & Protection | 0 (0.0%) | 0 (0.0%) |
| Firefighting & Prevention | 0 (0.0%) | 0 (0.0%) |
| Law Enforcement | 0 (0.0%) | 0 (0.0%) |
| Food Preparation & Serving | 0 (0.0%) | 0 (0.0%) |
| Cleaning & Maintenance | 0 (0.0%) | 0 (0.0%) |
| Personal Care & Service | 0 (0.0%) | 0 (0.0%) |
| Total (Category) | 0 (0.0%) | 15 (100.0%) |
| Total (Overall) | 0 (0.0%) | 32 (100.0%) |
Sales and Office Occupations
Sales and Office Occupations by Sex
| Occupation | Male | Female |
| Sales & Related | 0 (0.0%) | 0 (0.0%) |
| Office & Administration | 0 (0.0%) | 0 (0.0%) |
| Total (Category) | 0 (0.0%) | 0 (0.0%) |
| Total (Overall) | 0 (0.0%) | 32 (100.0%) |
Natural Resources, Construction and Maintenance Occupations
Natural Resources, Construction and Maintenance Occupations by Sex
| Occupation | Male | Female |
| Farming, Fishing & Forestry | 0 (0.0%) | 0 (0.0%) |
| Construction & Extraction | 0 (0.0%) | 0 (0.0%) |
| Installation, Maintenance & Repair | 0 (0.0%) | 0 (0.0%) |
| Total (Category) | 0 (0.0%) | 0 (0.0%) |
| Total (Overall) | 0 (0.0%) | 32 (100.0%) |
Production, Transportation and Moving Occupations
Production, Transportation and Moving Occupations by Sex
| Occupation | Male | Female |
| Production | 0 (0.0%) | 0 (0.0%) |
| Transportation | 0 (0.0%) | 0 (0.0%) |
| Material Moving | 0 (0.0%) | 0 (0.0%) |
| Total (Category) | 0 (0.0%) | 0 (0.0%) |
| Total (Overall) | 0 (0.0%) | 32 (100.0%) |
Employment Industries by Sex in Tibes
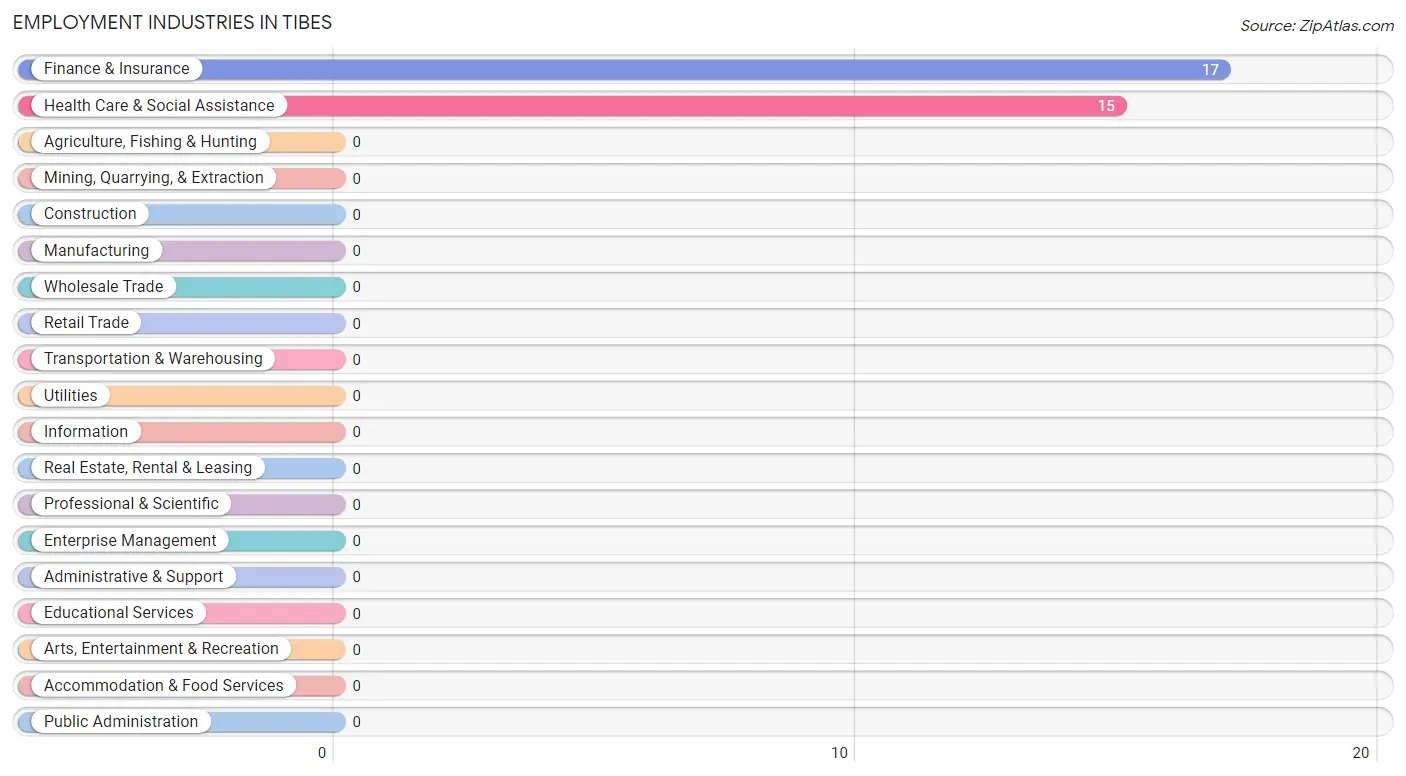
Employment Industries in Tibes
The major employment industries in Tibes include Finance & Insurance (17 | 53.1%), and Health Care & Social Assistance (15 | 46.9%).
Employment Industries by Sex in Tibes
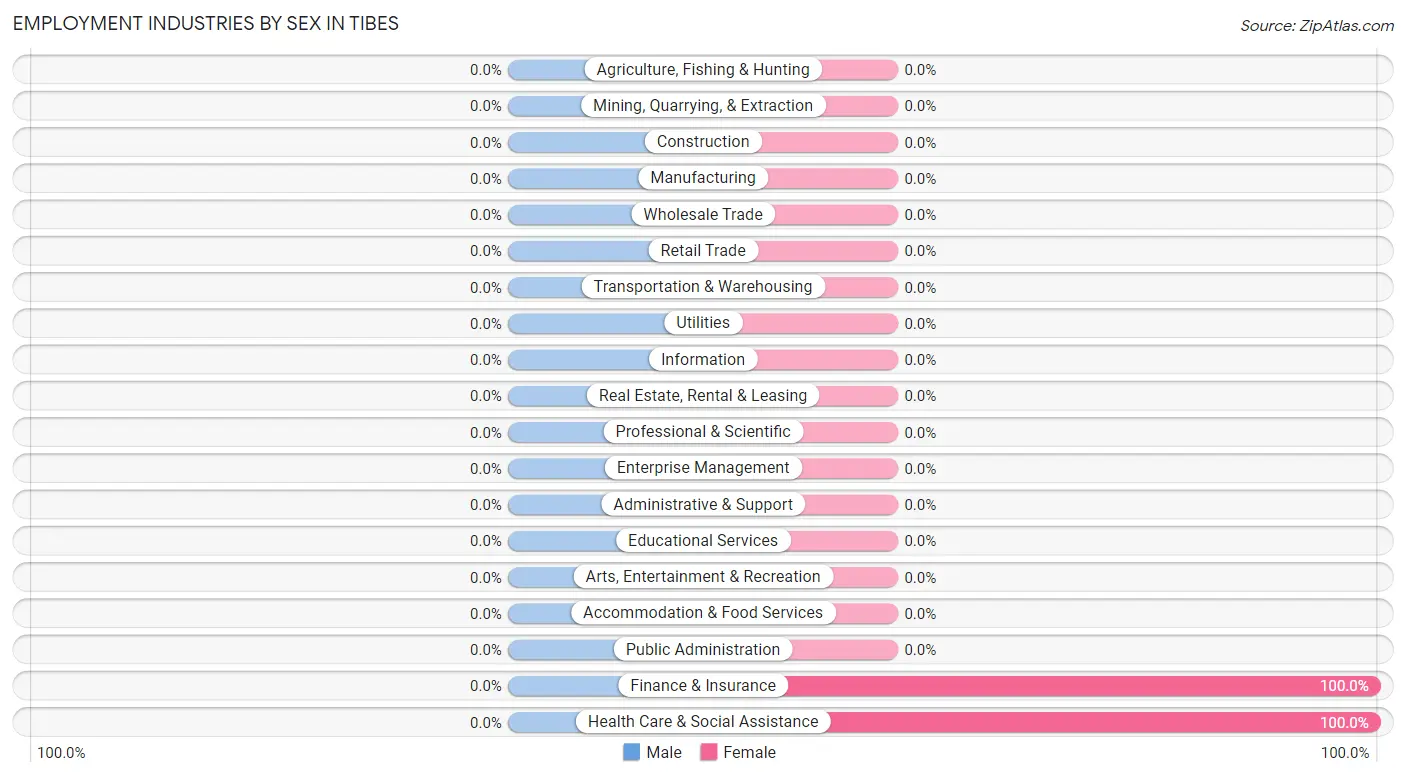
| Industry | Male | Female |
| Agriculture, Fishing & Hunting | 0 (0.0%) | 0 (0.0%) |
| Mining, Quarrying, & Extraction | 0 (0.0%) | 0 (0.0%) |
| Construction | 0 (0.0%) | 0 (0.0%) |
| Manufacturing | 0 (0.0%) | 0 (0.0%) |
| Wholesale Trade | 0 (0.0%) | 0 (0.0%) |
| Retail Trade | 0 (0.0%) | 0 (0.0%) |
| Transportation & Warehousing | 0 (0.0%) | 0 (0.0%) |
| Utilities | 0 (0.0%) | 0 (0.0%) |
| Information | 0 (0.0%) | 0 (0.0%) |
| Finance & Insurance | 0 (0.0%) | 17 (100.0%) |
| Real Estate, Rental & Leasing | 0 (0.0%) | 0 (0.0%) |
| Professional & Scientific | 0 (0.0%) | 0 (0.0%) |
| Enterprise Management | 0 (0.0%) | 0 (0.0%) |
| Administrative & Support | 0 (0.0%) | 0 (0.0%) |
| Educational Services | 0 (0.0%) | 0 (0.0%) |
| Health Care & Social Assistance | 0 (0.0%) | 15 (100.0%) |
| Arts, Entertainment & Recreation | 0 (0.0%) | 0 (0.0%) |
| Accommodation & Food Services | 0 (0.0%) | 0 (0.0%) |
| Public Administration | 0 (0.0%) | 0 (0.0%) |
| Total | 0 (0.0%) | 32 (100.0%) |
Education in Tibes
School Enrollment in Tibes
The most common levels of schooling among the 72 students in Tibes are elementary school (35 | 48.6%), nursery / preschool (19 | 26.4%), and middle school (18 | 25.0%).
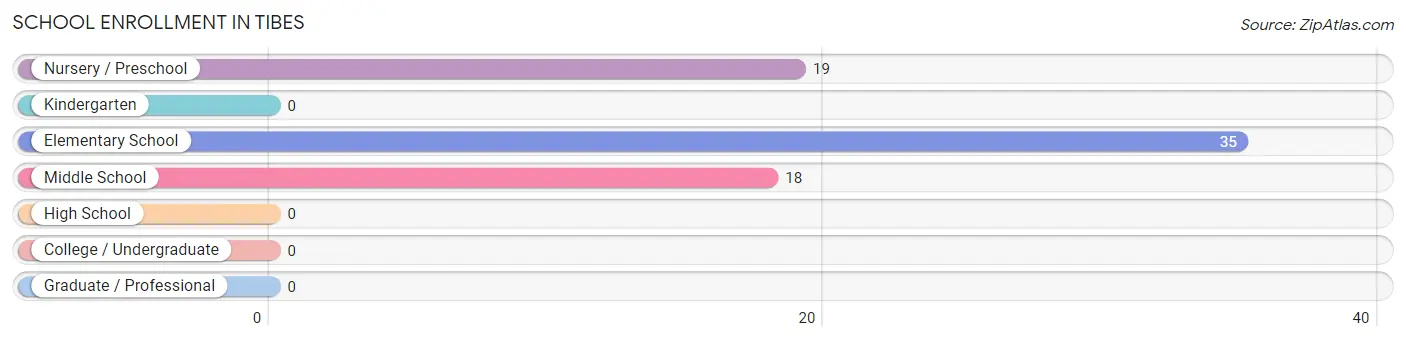
| School Level | # Students | % Students |
| Nursery / Preschool | 19 | 26.4% |
| Kindergarten | 0 | 0.0% |
| Elementary School | 35 | 48.6% |
| Middle School | 18 | 25.0% |
| High School | 0 | 0.0% |
| College / Undergraduate | 0 | 0.0% |
| Graduate / Professional | 0 | 0.0% |
| Total | 72 | 100.0% |
School Enrollment by Age by Funding Source in Tibes
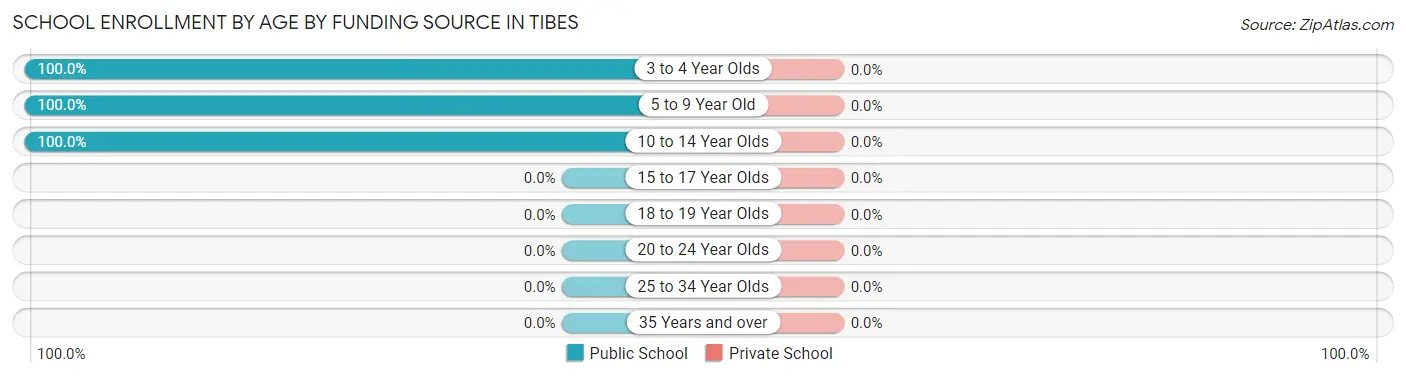
| Age Bracket | Public School | Private School |
| 3 to 4 Year Olds | 19 (100.0%) | 0 (0.0%) |
| 5 to 9 Year Old | 35 (100.0%) | 0 (0.0%) |
| 10 to 14 Year Olds | 18 (100.0%) | 0 (0.0%) |
| 15 to 17 Year Olds | 0 (0.0%) | 0 (0.0%) |
| 18 to 19 Year Olds | 0 (0.0%) | 0 (0.0%) |
| 20 to 24 Year Olds | 0 (0.0%) | 0 (0.0%) |
| 25 to 34 Year Olds | 0 (0.0%) | 0 (0.0%) |
| 35 Years and over | 0 (0.0%) | 0 (0.0%) |
| Total | 72 (100.0%) | 0 (0.0%) |
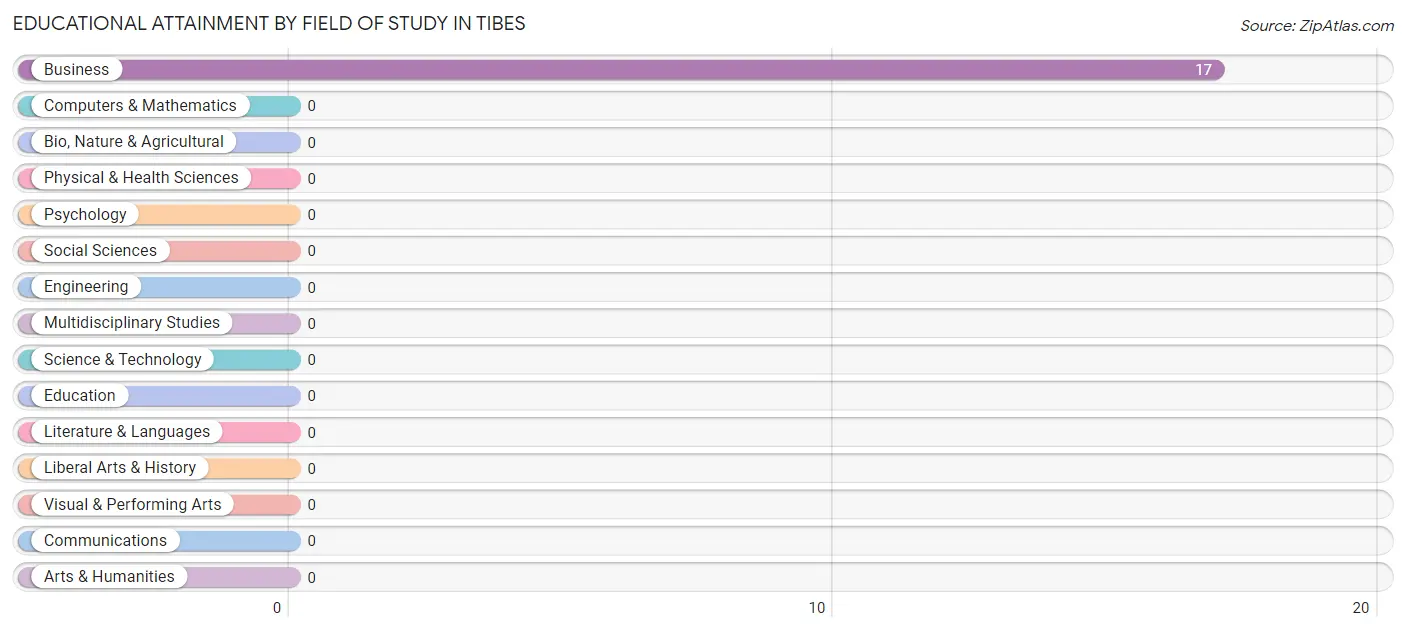
Educational Attainment by Field of Study in Tibes
, and business (17 | 100.0%) are the most common fields of study among 17 individuals in Tibes who have obtained a bachelor's degree or higher.
| Field of Study | # Graduates | % Graduates |
| Computers & Mathematics | 0 | 0.0% |
| Bio, Nature & Agricultural | 0 | 0.0% |
| Physical & Health Sciences | 0 | 0.0% |
| Psychology | 0 | 0.0% |
| Social Sciences | 0 | 0.0% |
| Engineering | 0 | 0.0% |
| Multidisciplinary Studies | 0 | 0.0% |
| Science & Technology | 0 | 0.0% |
| Business | 17 | 100.0% |
| Education | 0 | 0.0% |
| Literature & Languages | 0 | 0.0% |
| Liberal Arts & History | 0 | 0.0% |
| Visual & Performing Arts | 0 | 0.0% |
| Communications | 0 | 0.0% |
| Arts & Humanities | 0 | 0.0% |
| Total | 17 | 100.0% |
Transportation & Commute in Tibes
Vehicle Availability by Sex in Tibes
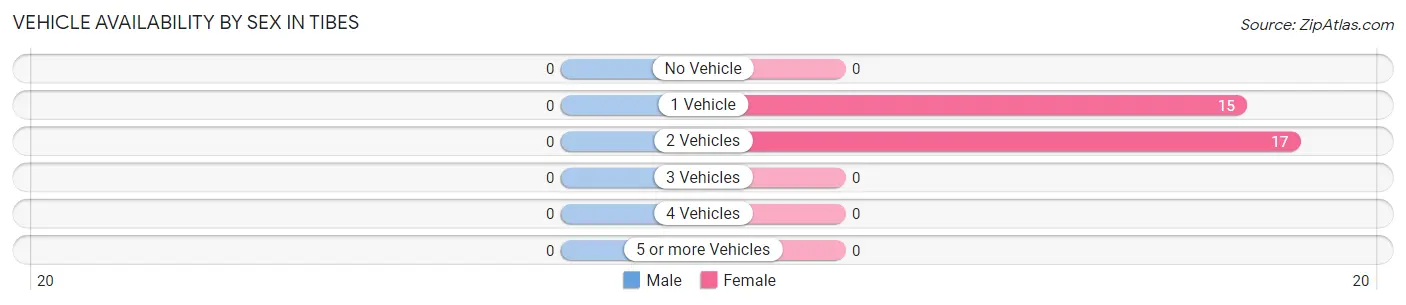
| Vehicles Available | Male | Female |
| No Vehicle | 0 (0.0%) | 0 (0.0%) |
| 1 Vehicle | 0 (0.0%) | 15 (46.9%) |
| 2 Vehicles | 0 (0.0%) | 17 (53.1%) |
| 3 Vehicles | 0 (0.0%) | 0 (0.0%) |
| 4 Vehicles | 0 (0.0%) | 0 (0.0%) |
| 5 or more Vehicles | 0 (0.0%) | 0 (0.0%) |
| Total | 0 (0.0%) | 32 (100.0%) |
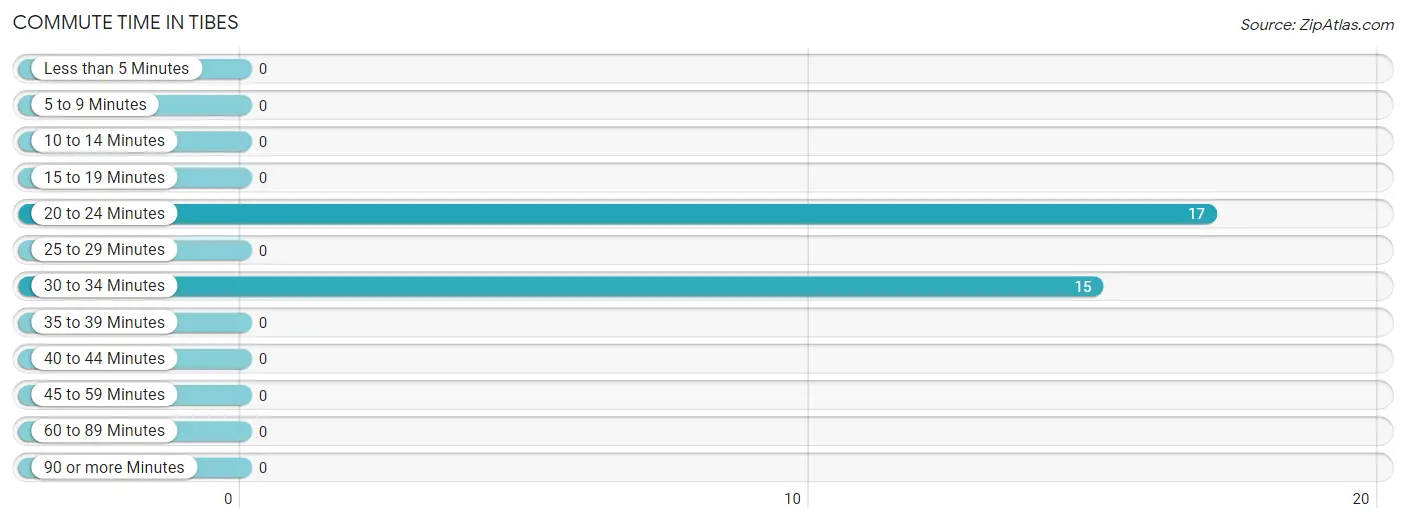
Commute Time in Tibes
The most frequently occuring commute durations in Tibes are 20 to 24 minutes (17 commuters, 53.1%), 30 to 34 minutes (15 commuters, 46.9%), and less than 5 minutes (0 commuters, 0.0%).
| Commute Time | # Commuters | % Commuters |
| Less than 5 Minutes | 0 | 0.0% |
| 5 to 9 Minutes | 0 | 0.0% |
| 10 to 14 Minutes | 0 | 0.0% |
| 15 to 19 Minutes | 0 | 0.0% |
| 20 to 24 Minutes | 17 | 53.1% |
| 25 to 29 Minutes | 0 | 0.0% |
| 30 to 34 Minutes | 15 | 46.9% |
| 35 to 39 Minutes | 0 | 0.0% |
| 40 to 44 Minutes | 0 | 0.0% |
| 45 to 59 Minutes | 0 | 0.0% |
| 60 to 89 Minutes | 0 | 0.0% |
| 90 or more Minutes | 0 | 0.0% |
Commute Time by Sex in Tibes
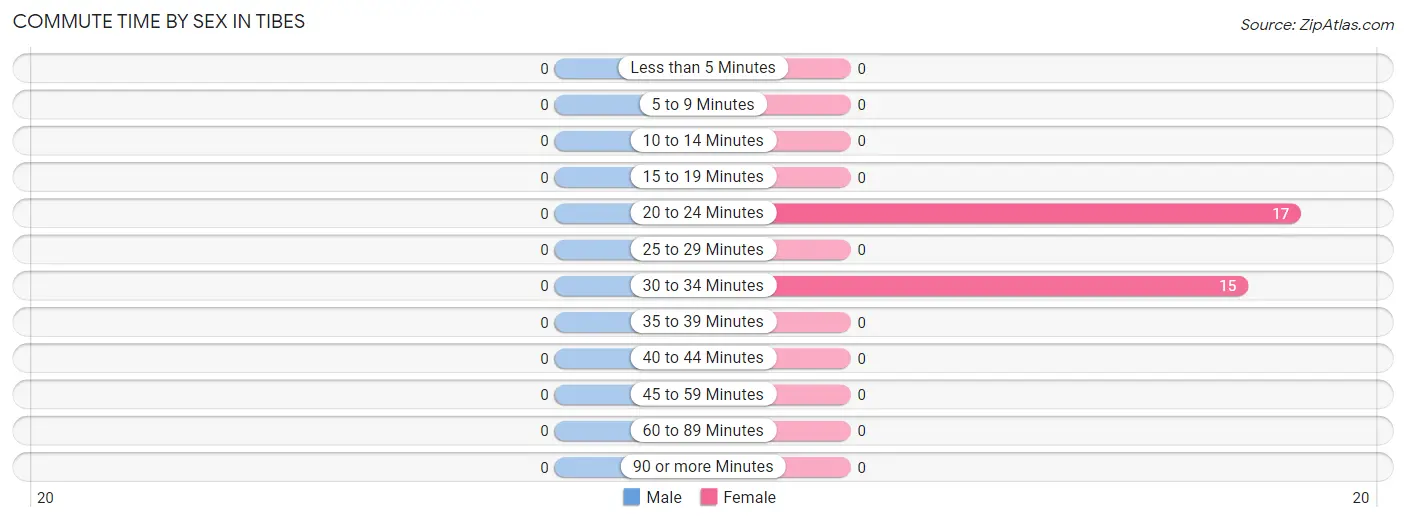
| Commute Time | Male | Female |
| Less than 5 Minutes | 0 (0.0%) | 0 (0.0%) |
| 5 to 9 Minutes | 0 (0.0%) | 0 (0.0%) |
| 10 to 14 Minutes | 0 (0.0%) | 0 (0.0%) |
| 15 to 19 Minutes | 0 (0.0%) | 0 (0.0%) |
| 20 to 24 Minutes | 0 (0.0%) | 17 (53.1%) |
| 25 to 29 Minutes | 0 (0.0%) | 0 (0.0%) |
| 30 to 34 Minutes | 0 (0.0%) | 15 (46.9%) |
| 35 to 39 Minutes | 0 (0.0%) | 0 (0.0%) |
| 40 to 44 Minutes | 0 (0.0%) | 0 (0.0%) |
| 45 to 59 Minutes | 0 (0.0%) | 0 (0.0%) |
| 60 to 89 Minutes | 0 (0.0%) | 0 (0.0%) |
| 90 or more Minutes | 0 (0.0%) | 0 (0.0%) |
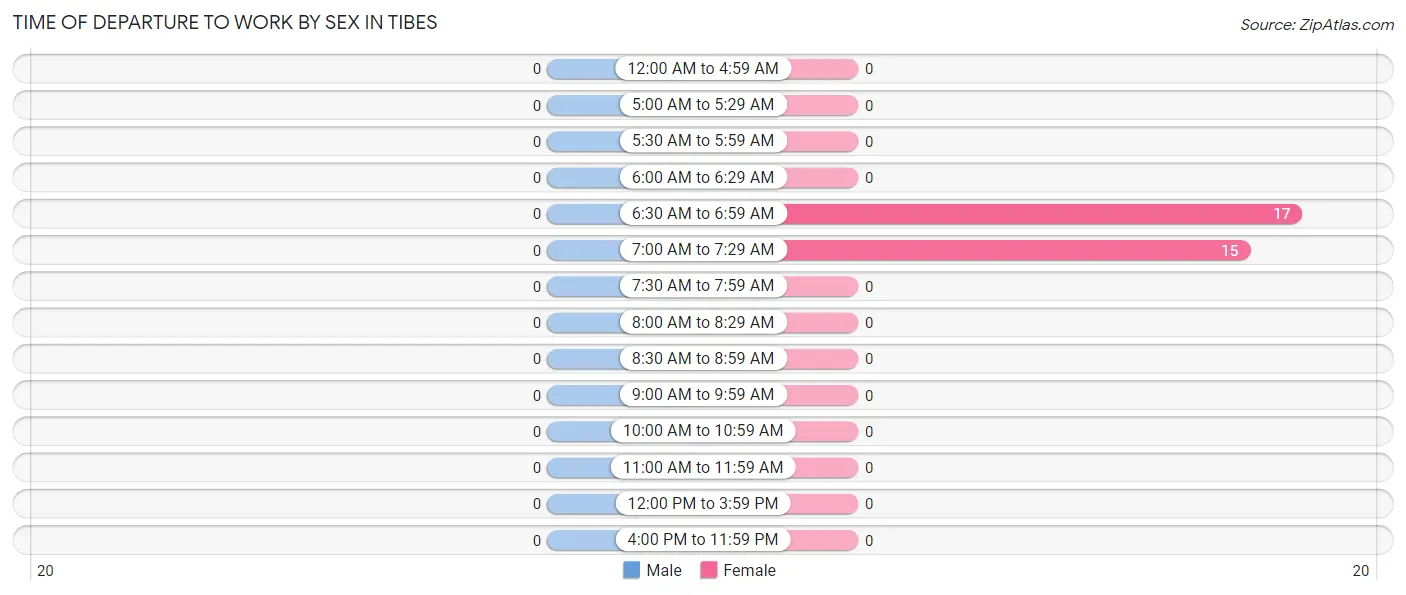
Time of Departure to Work by Sex in Tibes
| Time of Departure | Male | Female |
| 12:00 AM to 4:59 AM | 0 (0.0%) | 0 (0.0%) |
| 5:00 AM to 5:29 AM | 0 (0.0%) | 0 (0.0%) |
| 5:30 AM to 5:59 AM | 0 (0.0%) | 0 (0.0%) |
| 6:00 AM to 6:29 AM | 0 (0.0%) | 0 (0.0%) |
| 6:30 AM to 6:59 AM | 0 (0.0%) | 17 (53.1%) |
| 7:00 AM to 7:29 AM | 0 (0.0%) | 15 (46.9%) |
| 7:30 AM to 7:59 AM | 0 (0.0%) | 0 (0.0%) |
| 8:00 AM to 8:29 AM | 0 (0.0%) | 0 (0.0%) |
| 8:30 AM to 8:59 AM | 0 (0.0%) | 0 (0.0%) |
| 9:00 AM to 9:59 AM | 0 (0.0%) | 0 (0.0%) |
| 10:00 AM to 10:59 AM | 0 (0.0%) | 0 (0.0%) |
| 11:00 AM to 11:59 AM | 0 (0.0%) | 0 (0.0%) |
| 12:00 PM to 3:59 PM | 0 (0.0%) | 0 (0.0%) |
| 4:00 PM to 11:59 PM | 0 (0.0%) | 0 (0.0%) |
| Total | 0 (0.0%) | 32 (100.0%) |
Housing Occupancy in Tibes
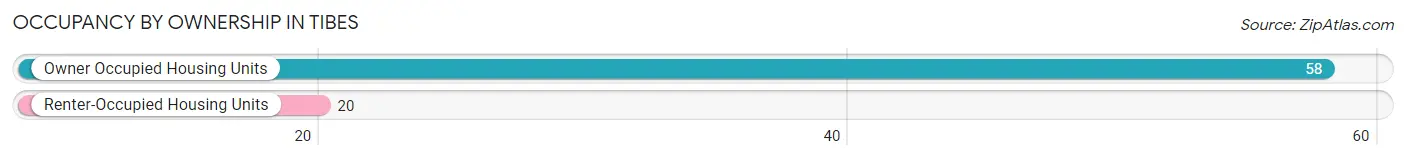
Occupancy by Ownership in Tibes
Of the total 78 dwellings in Tibes, owner-occupied units account for 58 (74.4%), while renter-occupied units make up 20 (25.6%).
| Occupancy | # Housing Units | % Housing Units |
| Owner Occupied Housing Units | 58 | 74.4% |
| Renter-Occupied Housing Units | 20 | 25.6% |
| Total Occupied Housing Units | 78 | 100.0% |
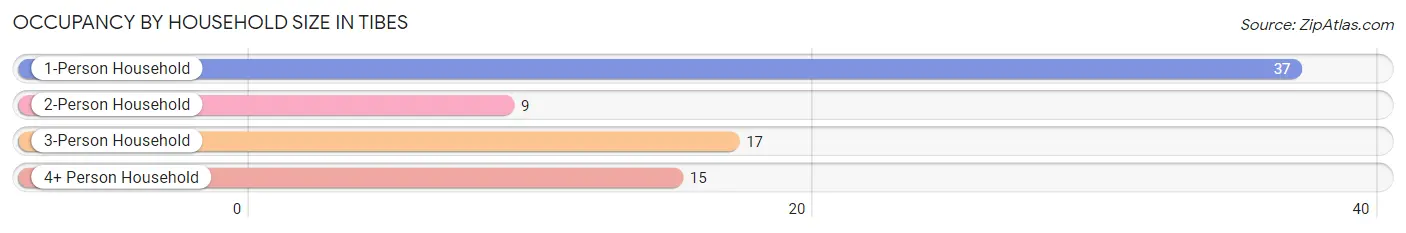
Occupancy by Household Size in Tibes
| Household Size | # Housing Units | % Housing Units |
| 1-Person Household | 37 | 47.4% |
| 2-Person Household | 9 | 11.5% |
| 3-Person Household | 17 | 21.8% |
| 4+ Person Household | 15 | 19.2% |
| Total Housing Units | 78 | 100.0% |
Occupancy by Ownership by Household Size in Tibes
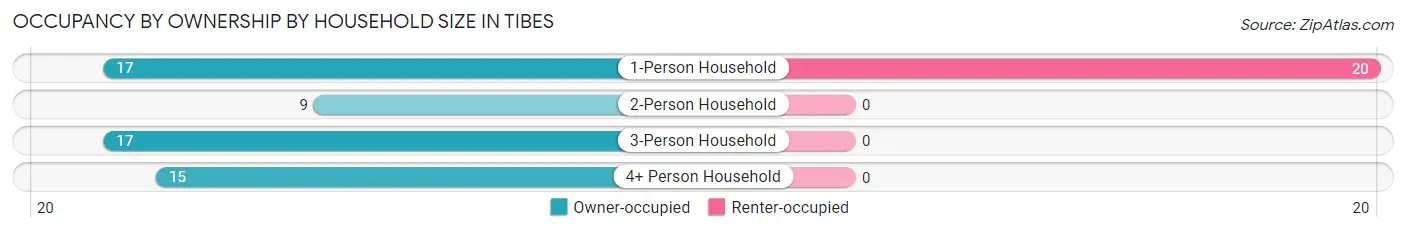
| Household Size | Owner-occupied | Renter-occupied |
| 1-Person Household | 17 (46.0%) | 20 (54.0%) |
| 2-Person Household | 9 (100.0%) | 0 (0.0%) |
| 3-Person Household | 17 (100.0%) | 0 (0.0%) |
| 4+ Person Household | 15 (100.0%) | 0 (0.0%) |
| Total Housing Units | 58 (74.4%) | 20 (25.6%) |
Occupancy by Educational Attainment in Tibes
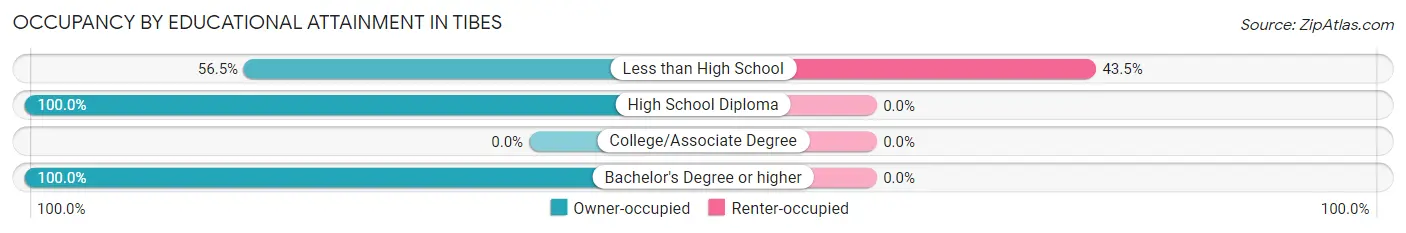
| Household Size | Owner-occupied | Renter-occupied |
| Less than High School | 26 (56.5%) | 20 (43.5%) |
| High School Diploma | 15 (100.0%) | 0 (0.0%) |
| College/Associate Degree | 0 (0.0%) | 0 (0.0%) |
| Bachelor's Degree or higher | 17 (100.0%) | 0 (0.0%) |
Occupancy by Age of Householder in Tibes
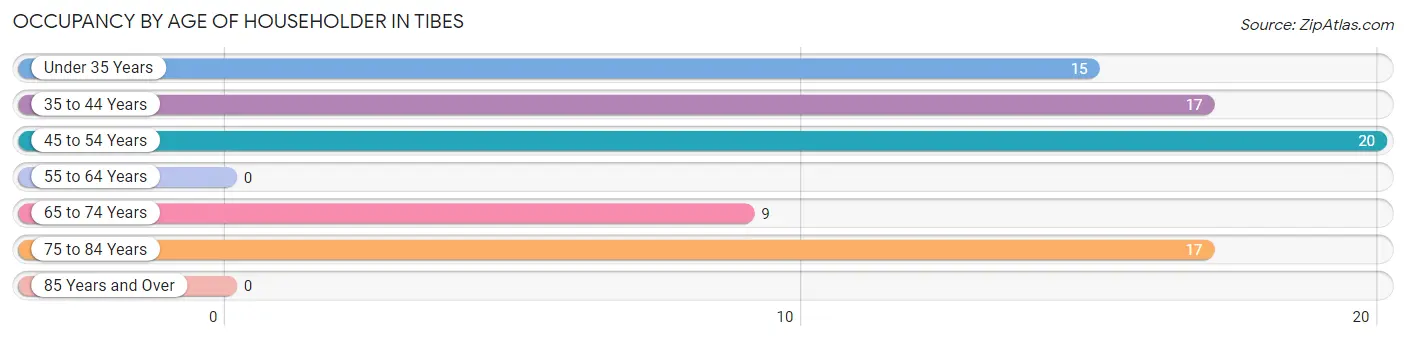
| Age Bracket | # Households | % Households |
| Under 35 Years | 15 | 19.2% |
| 35 to 44 Years | 17 | 21.8% |
| 45 to 54 Years | 20 | 25.6% |
| 55 to 64 Years | 0 | 0.0% |
| 65 to 74 Years | 9 | 11.5% |
| 75 to 84 Years | 17 | 21.8% |
| 85 Years and Over | 0 | 0.0% |
| Total | 78 | 100.0% |
Housing Finances in Tibes
Median Income by Occupancy in Tibes
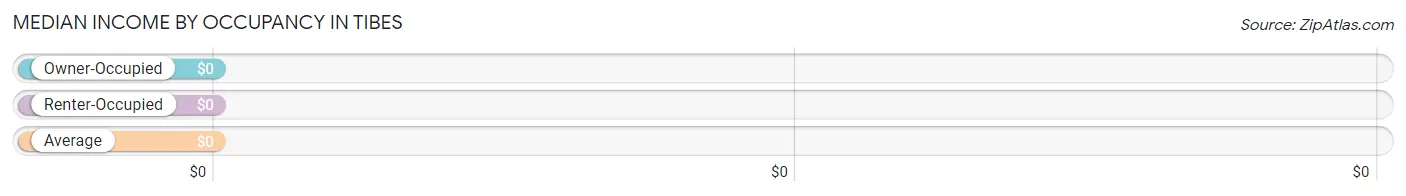
| Occupancy Type | # Households | Median Income |
| Owner-Occupied | 58 (74.4%) | $0 |
| Renter-Occupied | 20 (25.6%) | $0 |
| Average | 78 (100.0%) | $0 |
Occupancy by Householder Income Bracket in Tibes
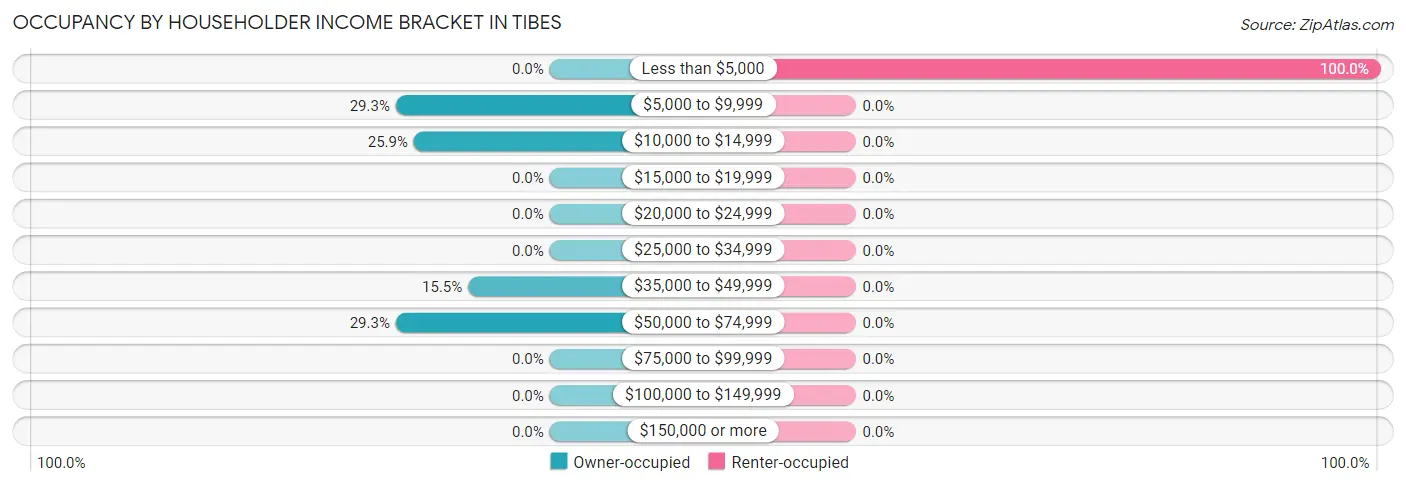
| Income Bracket | Owner-occupied | Renter-occupied |
| Less than $5,000 | 0 (0.0%) | 20 (100.0%) |
| $5,000 to $9,999 | 17 (29.3%) | 0 (0.0%) |
| $10,000 to $14,999 | 15 (25.9%) | 0 (0.0%) |
| $15,000 to $19,999 | 0 (0.0%) | 0 (0.0%) |
| $20,000 to $24,999 | 0 (0.0%) | 0 (0.0%) |
| $25,000 to $34,999 | 0 (0.0%) | 0 (0.0%) |
| $35,000 to $49,999 | 9 (15.5%) | 0 (0.0%) |
| $50,000 to $74,999 | 17 (29.3%) | 0 (0.0%) |
| $75,000 to $99,999 | 0 (0.0%) | 0 (0.0%) |
| $100,000 to $149,999 | 0 (0.0%) | 0 (0.0%) |
| $150,000 or more | 0 (0.0%) | 0 (0.0%) |
| Total | 58 (100.0%) | 20 (100.0%) |
Monthly Housing Cost Tiers in Tibes

| Monthly Cost | Owner-occupied | Renter-occupied |
| Less than $300 | 58 (100.0%) | 0 (0.0%) |
| $300 to $499 | 0 (0.0%) | 0 (0.0%) |
| $500 to $799 | 0 (0.0%) | 0 (0.0%) |
| $800 to $999 | 0 (0.0%) | 0 (0.0%) |
| $1,000 to $1,499 | 0 (0.0%) | 0 (0.0%) |
| $1,500 to $1,999 | 0 (0.0%) | 0 (0.0%) |
| $2,000 to $2,499 | 0 (0.0%) | 0 (0.0%) |
| $2,500 to $2,999 | 0 (0.0%) | 0 (0.0%) |
| $3,000 or more | 0 (0.0%) | 0 (0.0%) |
| Total | 58 (100.0%) | 20 (100.0%) |
Physical Housing Characteristics in Tibes
Housing Structures in Tibes
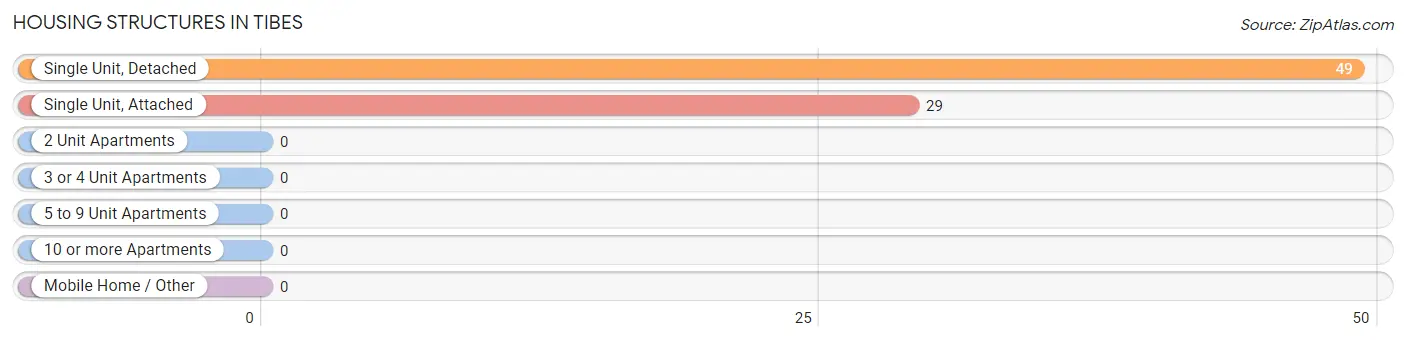
| Structure Type | # Housing Units | % Housing Units |
| Single Unit, Detached | 49 | 62.8% |
| Single Unit, Attached | 29 | 37.2% |
| 2 Unit Apartments | 0 | 0.0% |
| 3 or 4 Unit Apartments | 0 | 0.0% |
| 5 to 9 Unit Apartments | 0 | 0.0% |
| 10 or more Apartments | 0 | 0.0% |
| Mobile Home / Other | 0 | 0.0% |
| Total | 78 | 100.0% |
Housing Structures by Occupancy in Tibes
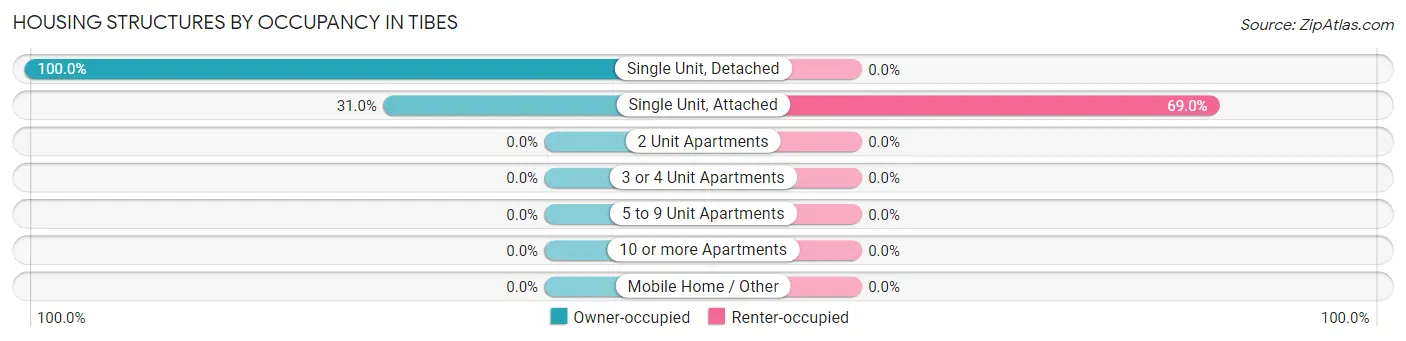
| Structure Type | Owner-occupied | Renter-occupied |
| Single Unit, Detached | 49 (100.0%) | 0 (0.0%) |
| Single Unit, Attached | 9 (31.0%) | 20 (69.0%) |
| 2 Unit Apartments | 0 (0.0%) | 0 (0.0%) |
| 3 or 4 Unit Apartments | 0 (0.0%) | 0 (0.0%) |
| 5 to 9 Unit Apartments | 0 (0.0%) | 0 (0.0%) |
| 10 or more Apartments | 0 (0.0%) | 0 (0.0%) |
| Mobile Home / Other | 0 (0.0%) | 0 (0.0%) |
| Total | 58 (74.4%) | 20 (25.6%) |
Housing Structures by Number of Rooms in Tibes
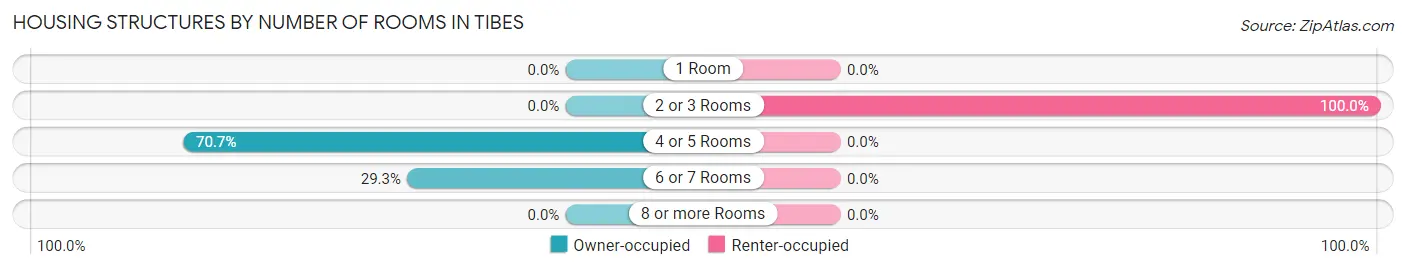
| Number of Rooms | Owner-occupied | Renter-occupied |
| 1 Room | 0 (0.0%) | 0 (0.0%) |
| 2 or 3 Rooms | 0 (0.0%) | 20 (100.0%) |
| 4 or 5 Rooms | 41 (70.7%) | 0 (0.0%) |
| 6 or 7 Rooms | 17 (29.3%) | 0 (0.0%) |
| 8 or more Rooms | 0 (0.0%) | 0 (0.0%) |
| Total | 58 (100.0%) | 20 (100.0%) |
Housing Structure by Heating Type in Tibes
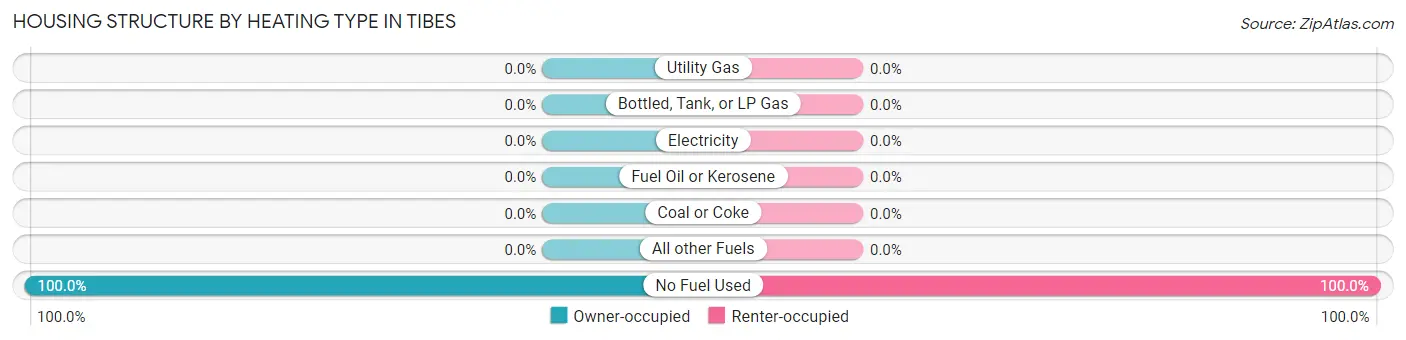
| Heating Type | Owner-occupied | Renter-occupied |
| Utility Gas | 0 (0.0%) | 0 (0.0%) |
| Bottled, Tank, or LP Gas | 0 (0.0%) | 0 (0.0%) |
| Electricity | 0 (0.0%) | 0 (0.0%) |
| Fuel Oil or Kerosene | 0 (0.0%) | 0 (0.0%) |
| Coal or Coke | 0 (0.0%) | 0 (0.0%) |
| All other Fuels | 0 (0.0%) | 0 (0.0%) |
| No Fuel Used | 58 (100.0%) | 20 (100.0%) |
| Total | 58 (100.0%) | 20 (100.0%) |
Household Vehicle Usage in Tibes
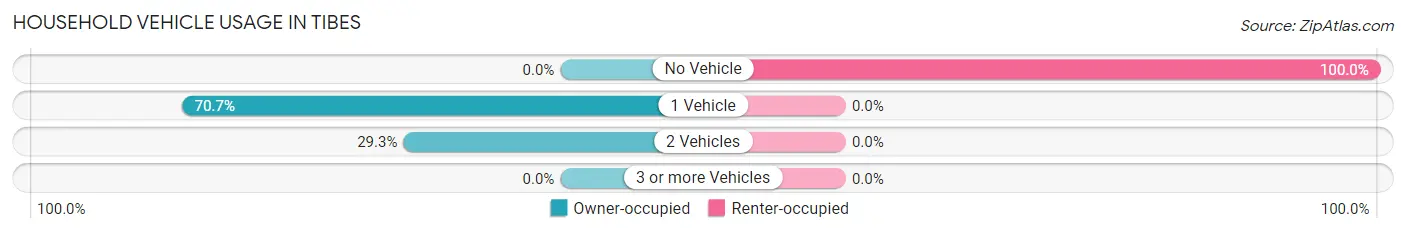
| Vehicles per Household | Owner-occupied | Renter-occupied |
| No Vehicle | 0 (0.0%) | 20 (100.0%) |
| 1 Vehicle | 41 (70.7%) | 0 (0.0%) |
| 2 Vehicles | 17 (29.3%) | 0 (0.0%) |
| 3 or more Vehicles | 0 (0.0%) | 0 (0.0%) |
| Total | 58 (100.0%) | 20 (100.0%) |
Real Estate & Mortgages in Tibes
Real Estate and Mortgage Overview in Tibes
| Characteristic | Without Mortgage | With Mortgage |
| Housing Units | 58 | 0 |
| Median Property Value | $58,000 | $0 |
| Median Household Income | - | - |
| Monthly Housing Costs | $99 | $0 |
| Real Estate Taxes | - | - |
Property Value by Mortgage Status in Tibes
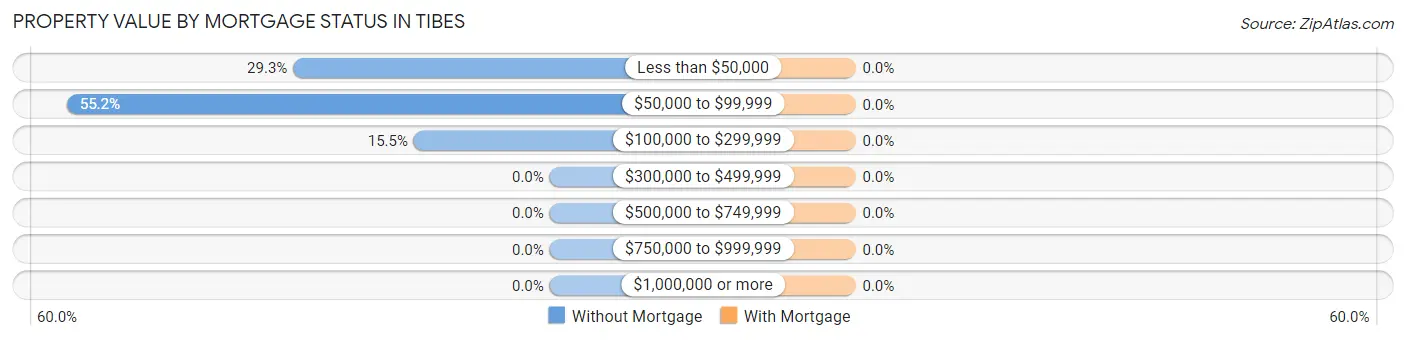
| Property Value | Without Mortgage | With Mortgage |
| Less than $50,000 | 17 (29.3%) | 0 (0.0%) |
| $50,000 to $99,999 | 32 (55.2%) | 0 (0.0%) |
| $100,000 to $299,999 | 9 (15.5%) | 0 (0.0%) |
| $300,000 to $499,999 | 0 (0.0%) | 0 (0.0%) |
| $500,000 to $749,999 | 0 (0.0%) | 0 (0.0%) |
| $750,000 to $999,999 | 0 (0.0%) | 0 (0.0%) |
| $1,000,000 or more | 0 (0.0%) | 0 (0.0%) |
| Total | 58 (100.0%) | 0 (0.0%) |
Household Income by Mortgage Status in Tibes
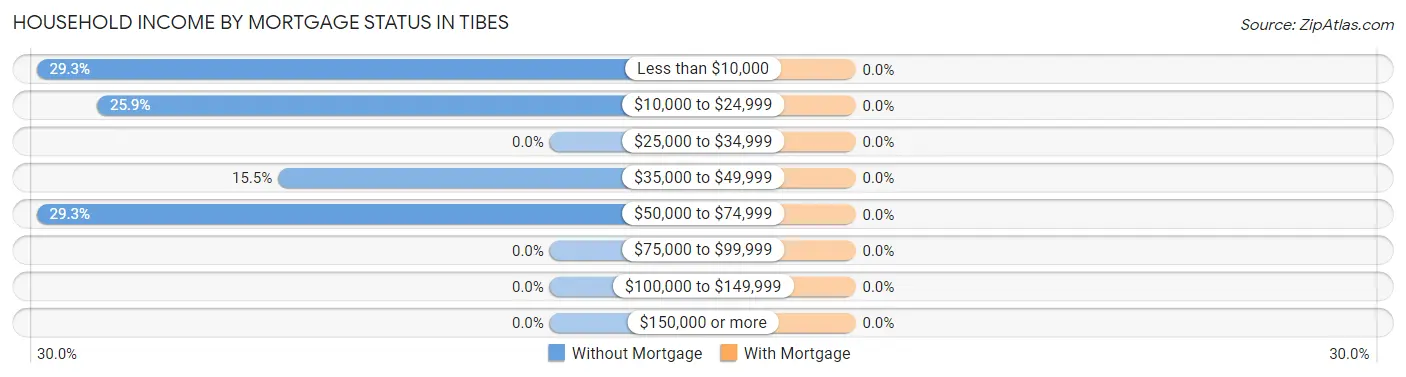
| Household Income | Without Mortgage | With Mortgage |
| Less than $10,000 | 17 (29.3%) | 0 (0.0%) |
| $10,000 to $24,999 | 15 (25.9%) | 0 (0.0%) |
| $25,000 to $34,999 | 0 (0.0%) | 0 (0.0%) |
| $35,000 to $49,999 | 9 (15.5%) | 0 (0.0%) |
| $50,000 to $74,999 | 17 (29.3%) | 0 (0.0%) |
| $75,000 to $99,999 | 0 (0.0%) | 0 (0.0%) |
| $100,000 to $149,999 | 0 (0.0%) | 0 (0.0%) |
| $150,000 or more | 0 (0.0%) | 0 (0.0%) |
| Total | 58 (100.0%) | 0 (0.0%) |
Property Value to Household Income Ratio in Tibes
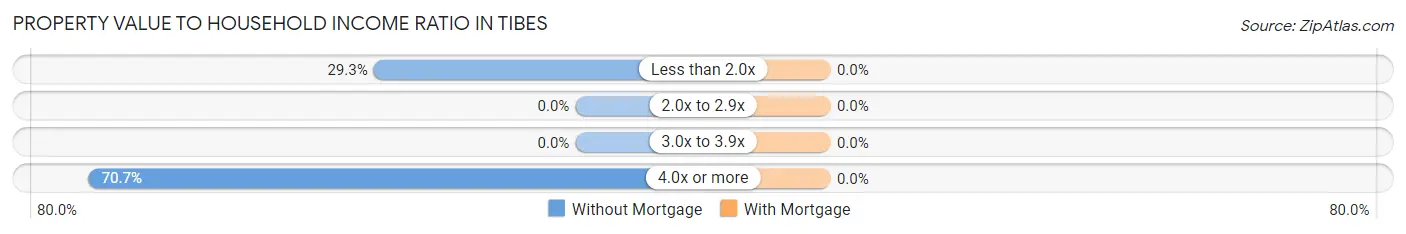
| Value-to-Income Ratio | Without Mortgage | With Mortgage |
| Less than 2.0x | 17 (29.3%) | 0 (0.0%) |
| 2.0x to 2.9x | 0 (0.0%) | 0 (0.0%) |
| 3.0x to 3.9x | 0 (0.0%) | 0 (0.0%) |
| 4.0x or more | 41 (70.7%) | 0 (0.0%) |
| Total | 58 (100.0%) | 0 (0.0%) |
Real Estate Taxes by Mortgage Status in Tibes
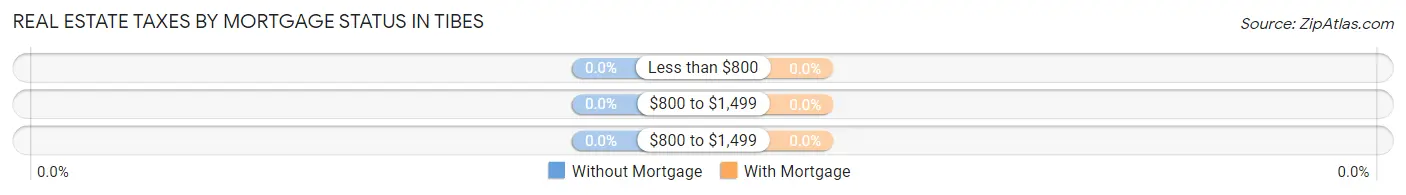
| Property Taxes | Without Mortgage | With Mortgage |
| Less than $800 | 0 (0.0%) | 0 (0.0%) |
| $800 to $1,499 | 0 (0.0%) | 0 (0.0%) |
| $800 to $1,499 | 0 (0.0%) | 0 (0.0%) |
| Total | 58 (100.0%) | 0 (0.0%) |
Health & Disability in Tibes
Health Insurance Coverage by Age in Tibes
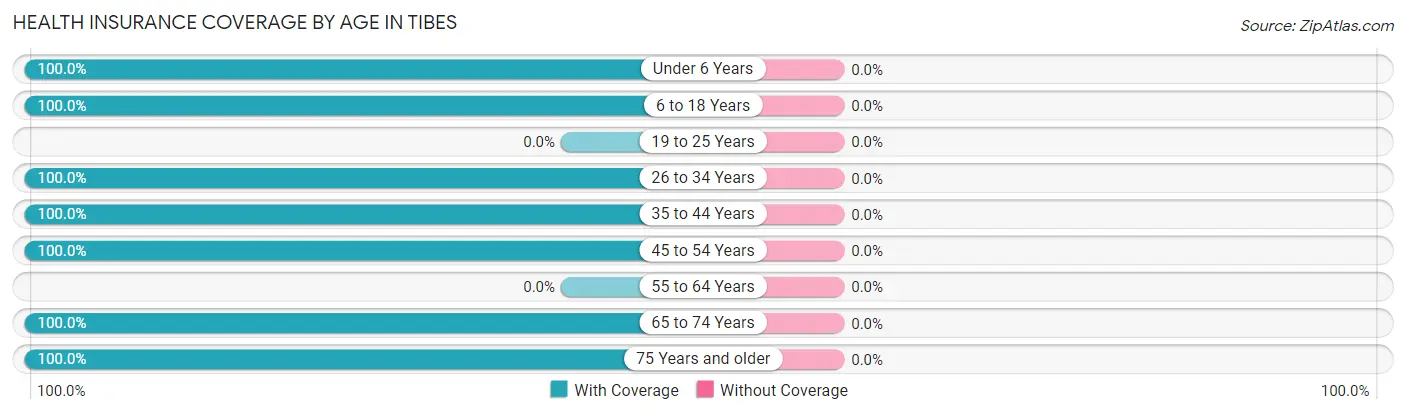
| Age Bracket | With Coverage | Without Coverage |
| Under 6 Years | 19 (100.0%) | 0 (0.0%) |
| 6 to 18 Years | 53 (100.0%) | 0 (0.0%) |
| 19 to 25 Years | 0 (0.0%) | 0 (0.0%) |
| 26 to 34 Years | 15 (100.0%) | 0 (0.0%) |
| 35 to 44 Years | 35 (100.0%) | 0 (0.0%) |
| 45 to 54 Years | 20 (100.0%) | 0 (0.0%) |
| 55 to 64 Years | 0 (0.0%) | 0 (0.0%) |
| 65 to 74 Years | 17 (100.0%) | 0 (0.0%) |
| 75 Years and older | 17 (100.0%) | 0 (0.0%) |
| Total | 176 (100.0%) | 0 (0.0%) |
Health Insurance Coverage by Citizenship Status in Tibes
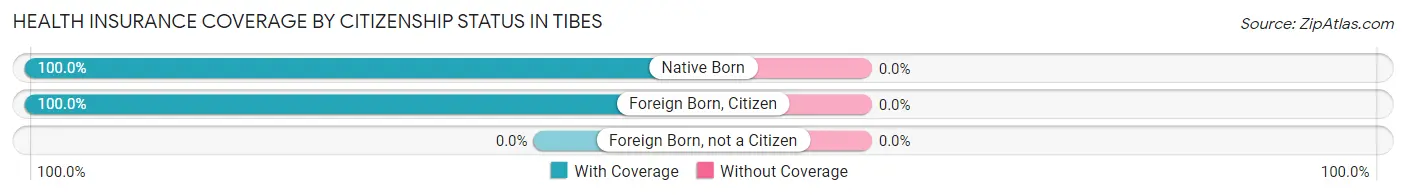
| Citizenship Status | With Coverage | Without Coverage |
| Native Born | 19 (100.0%) | 0 (0.0%) |
| Foreign Born, Citizen | 53 (100.0%) | 0 (0.0%) |
| Foreign Born, not a Citizen | 0 (0.0%) | 0 (0.0%) |
Health Insurance Coverage by Household Income in Tibes
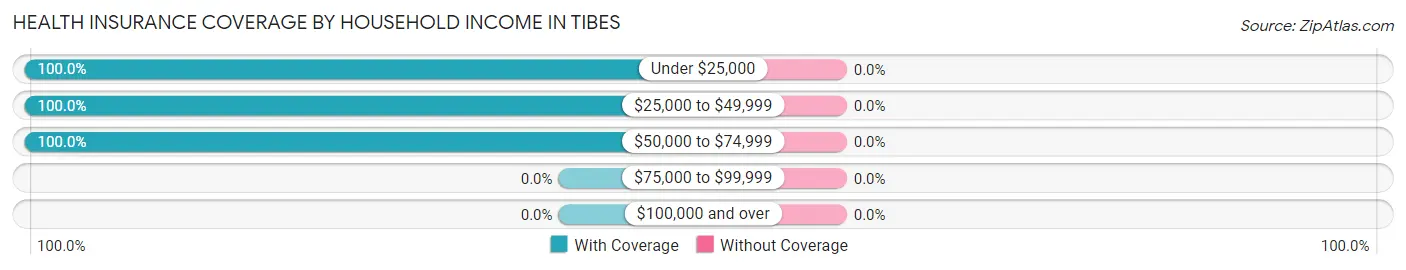
| Household Income | With Coverage | Without Coverage |
| Under $25,000 | 107 (100.0%) | 0 (0.0%) |
| $25,000 to $49,999 | 17 (100.0%) | 0 (0.0%) |
| $50,000 to $74,999 | 52 (100.0%) | 0 (0.0%) |
| $75,000 to $99,999 | 0 (0.0%) | 0 (0.0%) |
| $100,000 and over | 0 (0.0%) | 0 (0.0%) |
Public vs Private Health Insurance Coverage by Age in Tibes
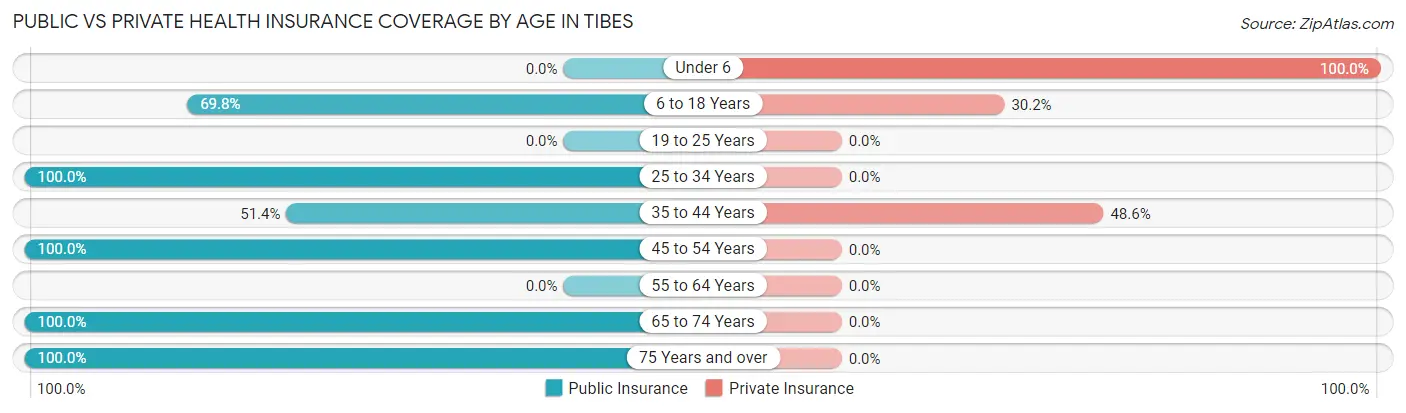
| Age Bracket | Public Insurance | Private Insurance |
| Under 6 | 0 (0.0%) | 19 (100.0%) |
| 6 to 18 Years | 37 (69.8%) | 16 (30.2%) |
| 19 to 25 Years | 0 (0.0%) | 0 (0.0%) |
| 25 to 34 Years | 15 (100.0%) | 0 (0.0%) |
| 35 to 44 Years | 18 (51.4%) | 17 (48.6%) |
| 45 to 54 Years | 20 (100.0%) | 0 (0.0%) |
| 55 to 64 Years | 0 (0.0%) | 0 (0.0%) |
| 65 to 74 Years | 17 (100.0%) | 0 (0.0%) |
| 75 Years and over | 17 (100.0%) | 0 (0.0%) |
| Total | 124 (70.5%) | 52 (29.5%) |
Disability Status by Sex by Age in Tibes
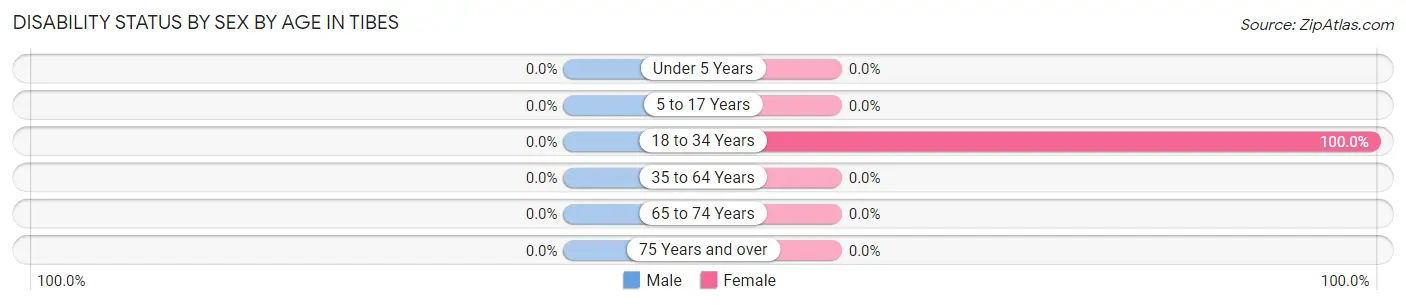
| Age Bracket | Male | Female |
| Under 5 Years | 0 (0.0%) | 0 (0.0%) |
| 5 to 17 Years | 0 (0.0%) | 0 (0.0%) |
| 18 to 34 Years | 0 (0.0%) | 15 (100.0%) |
| 35 to 64 Years | 0 (0.0%) | 0 (0.0%) |
| 65 to 74 Years | 0 (0.0%) | 0 (0.0%) |
| 75 Years and over | 0 (0.0%) | 0 (0.0%) |
Disability Class by Sex by Age in Tibes
Disability Class: Hearing Difficulty
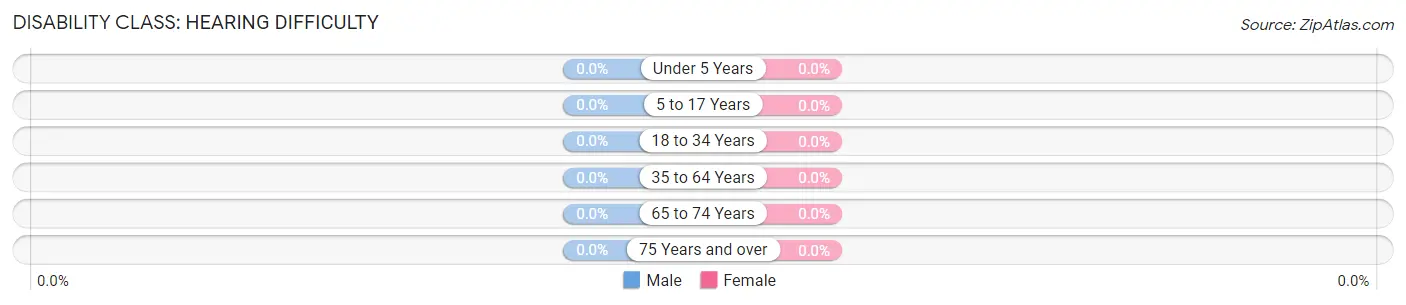
| Age Bracket | Male | Female |
| Under 5 Years | 0 (0.0%) | 0 (0.0%) |
| 5 to 17 Years | 0 (0.0%) | 0 (0.0%) |
| 18 to 34 Years | 0 (0.0%) | 0 (0.0%) |
| 35 to 64 Years | 0 (0.0%) | 0 (0.0%) |
| 65 to 74 Years | 0 (0.0%) | 0 (0.0%) |
| 75 Years and over | 0 (0.0%) | 0 (0.0%) |
Disability Class: Vision Difficulty
| Age Bracket | Male | Female |
| Under 5 Years | 0 (0.0%) | 0 (0.0%) |
| 5 to 17 Years | 0 (0.0%) | 0 (0.0%) |
| 18 to 34 Years | 0 (0.0%) | 0 (0.0%) |
| 35 to 64 Years | 0 (0.0%) | 0 (0.0%) |
| 65 to 74 Years | 0 (0.0%) | 0 (0.0%) |
| 75 Years and over | 0 (0.0%) | 0 (0.0%) |
Disability Class: Cognitive Difficulty
| Age Bracket | Male | Female |
| 5 to 17 Years | 0 (0.0%) | 0 (0.0%) |
| 18 to 34 Years | 0 (0.0%) | 15 (100.0%) |
| 35 to 64 Years | 0 (0.0%) | 0 (0.0%) |
| 65 to 74 Years | 0 (0.0%) | 0 (0.0%) |
| 75 Years and over | 0 (0.0%) | 0 (0.0%) |
Disability Class: Ambulatory Difficulty
| Age Bracket | Male | Female |
| 5 to 17 Years | 0 (0.0%) | 0 (0.0%) |
| 18 to 34 Years | 0 (0.0%) | 0 (0.0%) |
| 35 to 64 Years | 0 (0.0%) | 0 (0.0%) |
| 65 to 74 Years | 0 (0.0%) | 0 (0.0%) |
| 75 Years and over | 0 (0.0%) | 0 (0.0%) |
Disability Class: Self-Care Difficulty
| Age Bracket | Male | Female |
| 5 to 17 Years | 0 (0.0%) | 0 (0.0%) |
| 18 to 34 Years | 0 (0.0%) | 0 (0.0%) |
| 35 to 64 Years | 0 (0.0%) | 0 (0.0%) |
| 65 to 74 Years | 0 (0.0%) | 0 (0.0%) |
| 75 Years and over | 0 (0.0%) | 0 (0.0%) |
Technology Access in Tibes
Computing Device Access in Tibes
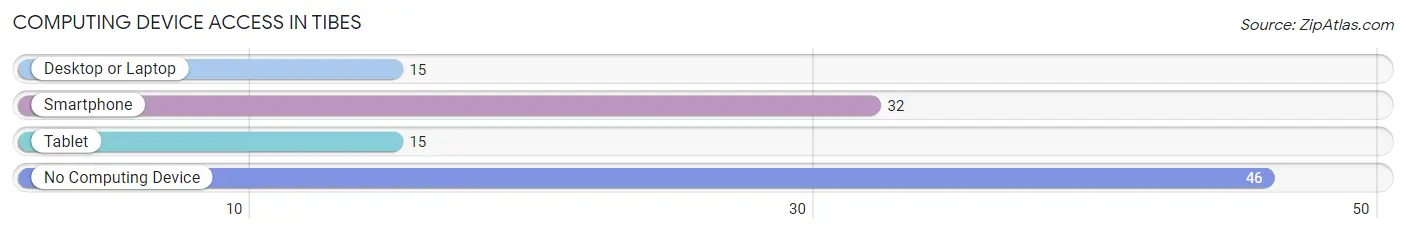
| Device Type | # Households | % Households |
| Desktop or Laptop | 15 | 19.2% |
| Smartphone | 32 | 41.0% |
| Tablet | 15 | 19.2% |
| No Computing Device | 46 | 59.0% |
| Total | 78 | 100.0% |
Internet Access in Tibes
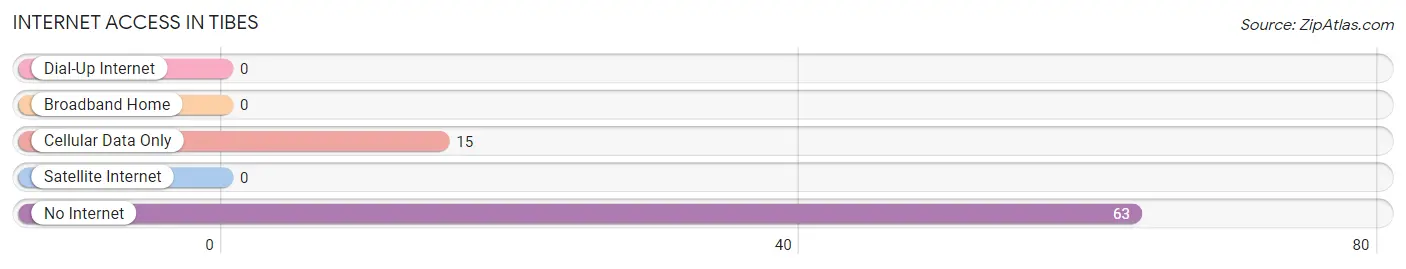
| Internet Type | # Households | % Households |
| Dial-Up Internet | 0 | 0.0% |
| Broadband Home | 0 | 0.0% |
| Cellular Data Only | 15 | 19.2% |
| Satellite Internet | 0 | 0.0% |
| No Internet | 63 | 80.8% |
| Total | 78 | 100.0% |
Tibes Summary
Tibes is a small town located in the municipality of Ponce, Puerto Rico. It is located in the southern part of the island, about 10 miles from the city of Ponce. Tibes is known for its archaeological site, which is the largest and most important in the Caribbean. The site is believed to have been inhabited by the indigenous Taíno people from around 1000 AD to the arrival of the Spanish in the late 15th century.
Geography
Tibes is located in the southern part of Puerto Rico, in the municipality of Ponce. It is situated in the coastal plain of the Caribbean Sea, at an elevation of about 20 feet above sea level. The town is bordered by the municipalities of Juana Díaz to the north, Guayanilla to the east, and Yauco to the south. The Tibes River flows through the town, and the town is also home to several small creeks and streams.
Economy
Tibes is primarily an agricultural town, with most of its residents engaged in farming and fishing. The town is also home to several small businesses, including restaurants, grocery stores, and other retail establishments. Tourism is also an important part of the local economy, with the archaeological site being a major draw for visitors.
Demographics
As of the 2010 census, Tibes had a population of 2,845. The population is primarily of Hispanic descent, with a small minority of African-Americans. The median household income in Tibes is $14,845, and the median age is 37.
History
Tibes was founded in the late 16th century by Spanish settlers. The town was originally known as “Tibes de los Indios”, or “Tibes of the Indians”, in reference to the indigenous Taíno people who inhabited the area prior to the arrival of the Spanish. The town was an important center of the sugar industry in the 18th and 19th centuries, and was also home to several large coffee plantations.
In 1975, the Tibes archaeological site was discovered, and it quickly became one of the most important archaeological sites in the Caribbean. The site is believed to have been inhabited by the Taíno people from around 1000 AD to the arrival of the Spanish in the late 15th century. The site has yielded a wealth of artifacts, including pottery, tools, and jewelry.
Today, Tibes is a small, rural town with a population of just over 2,800. The town is home to the Tibes archaeological site, which is a major tourist attraction. The town is also home to several small businesses, including restaurants, grocery stores, and other retail establishments.
Common Questions
What is Per Capita Income in Tibes?
Per Capita income in Tibes is $8,860.
What is Inequality or Gini Index in Tibes?
Inequality or Gini Index in Tibes is 0.57.
What is the Total Population of Tibes?
Total Population of Tibes is 176.
What is the Total Male Population of Tibes?
Total Male Population of Tibes is 117.
What is the Total Female Population of Tibes?
Total Female Population of Tibes is 59.
What is the Ratio of Males per 100 Females in Tibes?
There are 198.31 Males per 100 Females in Tibes.
What is the Ratio of Females per 100 Males in Tibes?
There are 50.43 Females per 100 Males in Tibes.
What is the Median Population Age in Tibes?
Median Population Age in Tibes is 39.1 Years.
What is the Average Family Size in Tibes
Average Family Size in Tibes is 3.0 People.
What is the Average Household Size in Tibes
Average Household Size in Tibes is 2.3 People.
How Large is the Labor Force in Tibes?
There are 32 People in the Labor Forcein in Tibes.
What is the Percentage of People in the Labor Force in Tibes?
30.8% of People are in the Labor Force in Tibes.