Top of the World, AZ Map & Demographics
Top of the World Map
Top of the World Overview
$24,391
PER CAPITA INCOME
$68,015
AVG FAMILY INCOME
0.52
INEQUALITY / GINI INDEX
227
TOTAL POPULATION
164
MALE POPULATION
63
FEMALE POPULATION
260.32
MALES / 100 FEMALES
38.41
FEMALES / 100 MALES
71.5
MEDIAN AGE
2.1
AVG FAMILY SIZE
1.4
AVG HOUSEHOLD SIZE
35
LABOR FORCE [ PEOPLE ]
15.4%
PERCENT IN LABOR FORCE
Income in Top of the World
Income Overview in Top of the World
| Characteristic | Number | Measure |
| Per Capita Income | 227 | $24,391 |
| Median Family Income | 43 | $68,015 |
| Mean Family Income | 43 | $61,433 |
| Median Household Income | 161 | $0 |
| Mean Household Income | 161 | $33,381 |
| Income Deficit | 43 | $0 |
| Wage / Income Gap (%) | 227 | 0.00% |
| Wage / Income Gap ($) | 227 | 100.00¢ per $1 |
| Gini / Inequality Index | 227 | 0.52 |
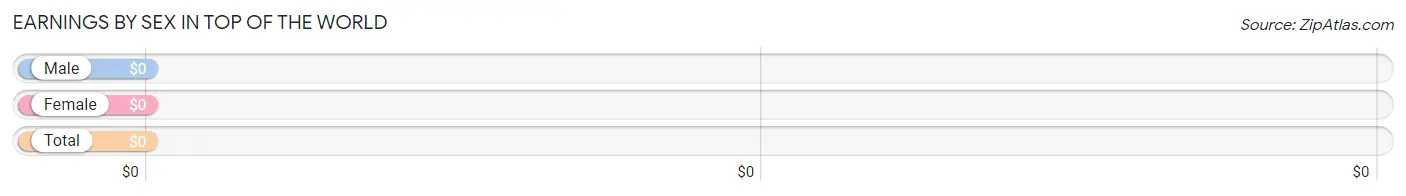
Earnings by Sex in Top of the World
| Sex | Number | Average Earnings |
| Male | 17 (48.6%) | $0 |
| Female | 18 (51.4%) | $0 |
| Total | 35 (100.0%) | $0 |
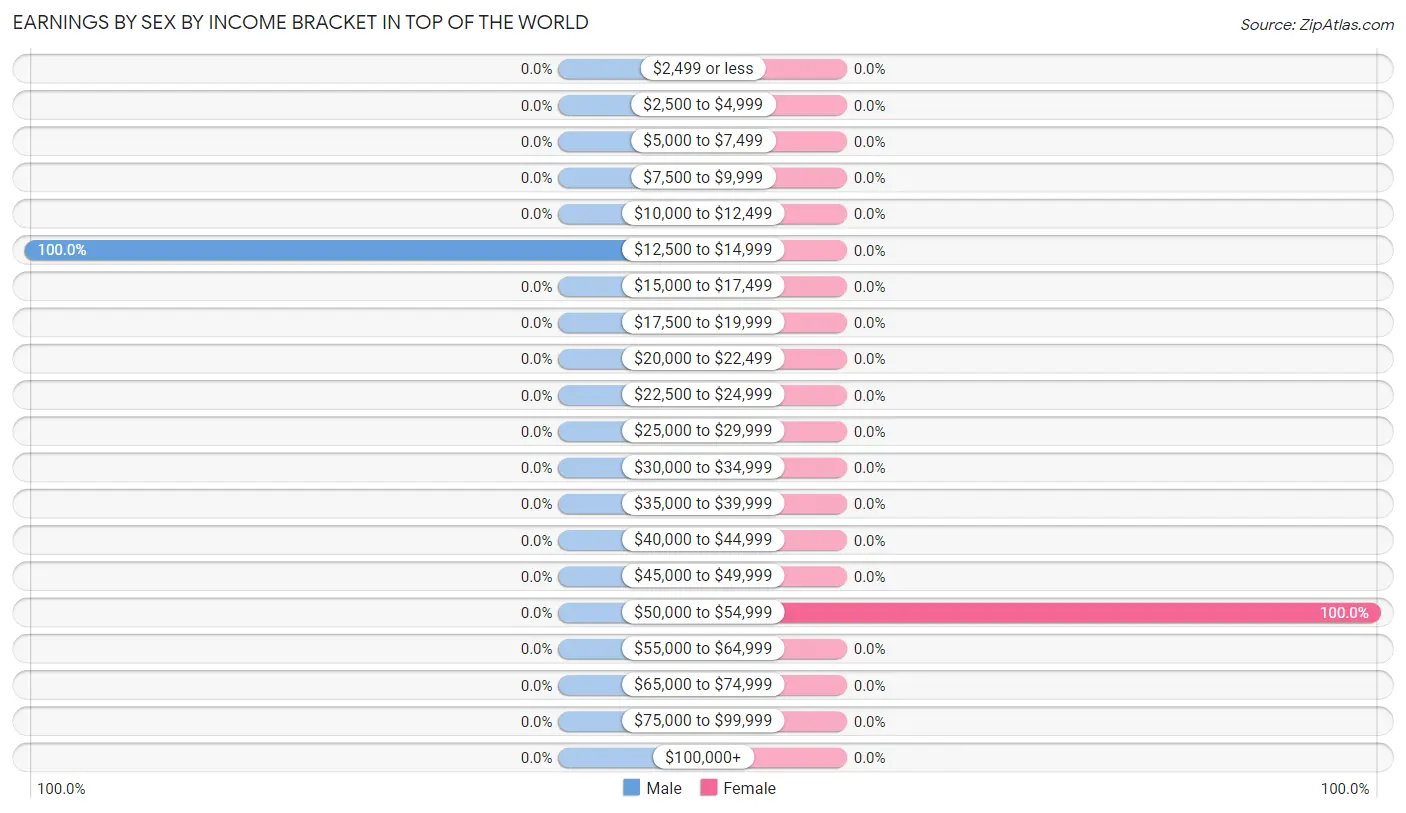
Earnings by Sex by Income Bracket in Top of the World
The most common earnings brackets in Top of the World are $12,500 to $14,999 for men (17 | 100.0%) and $50,000 to $54,999 for women (18 | 100.0%).
| Income | Male | Female |
| $2,499 or less | 0 (0.0%) | 0 (0.0%) |
| $2,500 to $4,999 | 0 (0.0%) | 0 (0.0%) |
| $5,000 to $7,499 | 0 (0.0%) | 0 (0.0%) |
| $7,500 to $9,999 | 0 (0.0%) | 0 (0.0%) |
| $10,000 to $12,499 | 0 (0.0%) | 0 (0.0%) |
| $12,500 to $14,999 | 17 (100.0%) | 0 (0.0%) |
| $15,000 to $17,499 | 0 (0.0%) | 0 (0.0%) |
| $17,500 to $19,999 | 0 (0.0%) | 0 (0.0%) |
| $20,000 to $22,499 | 0 (0.0%) | 0 (0.0%) |
| $22,500 to $24,999 | 0 (0.0%) | 0 (0.0%) |
| $25,000 to $29,999 | 0 (0.0%) | 0 (0.0%) |
| $30,000 to $34,999 | 0 (0.0%) | 0 (0.0%) |
| $35,000 to $39,999 | 0 (0.0%) | 0 (0.0%) |
| $40,000 to $44,999 | 0 (0.0%) | 0 (0.0%) |
| $45,000 to $49,999 | 0 (0.0%) | 0 (0.0%) |
| $50,000 to $54,999 | 0 (0.0%) | 18 (100.0%) |
| $55,000 to $64,999 | 0 (0.0%) | 0 (0.0%) |
| $65,000 to $74,999 | 0 (0.0%) | 0 (0.0%) |
| $75,000 to $99,999 | 0 (0.0%) | 0 (0.0%) |
| $100,000+ | 0 (0.0%) | 0 (0.0%) |
| Total | 17 (100.0%) | 18 (100.0%) |
Earnings by Sex by Educational Attainment in Top of the World
| Educational Attainment | Male Income | Female Income |
| Less than High School | - | - |
| High School Diploma | - | - |
| College or Associate's Degree | - | - |
| Bachelor's Degree | - | - |
| Graduate Degree | - | - |
| Total | - | - |
Family Income in Top of the World
Family Income Brackets in Top of the World
According to the Top of the World family income data, there are 30 families falling into the $50,000 to $74,999 income range, which is the most common income bracket and makes up 69.8% of all families.
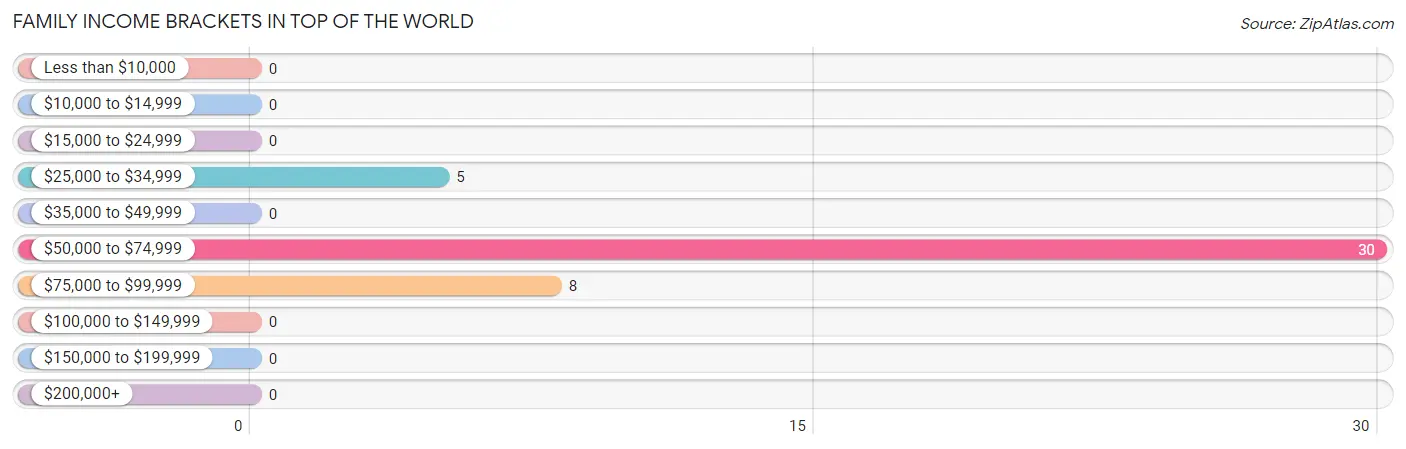
| Income Bracket | # Families | % Families |
| Less than $10,000 | 0 | 0.0% |
| $10,000 to $14,999 | 0 | 0.0% |
| $15,000 to $24,999 | 0 | 0.0% |
| $25,000 to $34,999 | 5 | 11.6% |
| $35,000 to $49,999 | 0 | 0.0% |
| $50,000 to $74,999 | 30 | 69.8% |
| $75,000 to $99,999 | 8 | 18.6% |
| $100,000 to $149,999 | 0 | 0.0% |
| $150,000 to $199,999 | 0 | 0.0% |
| $200,000+ | 0 | 0.0% |
Family Income by Famaliy Size in Top of the World
2-person families (43 | 100.0%) account for the highest median family income in Top of the World with $68,015 per family, while 2-person families (43 | 100.0%) have the highest median income of $34,008 per family member.
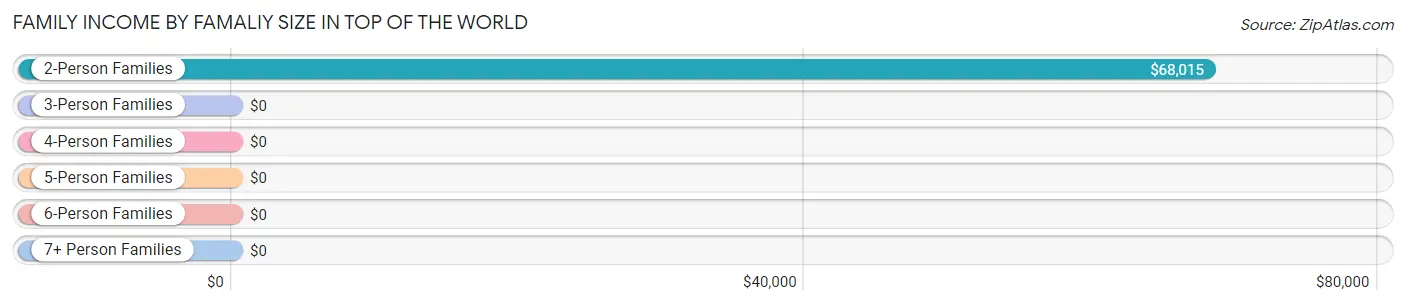
| Income Bracket | # Families | Median Income |
| 2-Person Families | 43 (100.0%) | $68,015 |
| 3-Person Families | 0 (0.0%) | $0 |
| 4-Person Families | 0 (0.0%) | $0 |
| 5-Person Families | 0 (0.0%) | $0 |
| 6-Person Families | 0 (0.0%) | $0 |
| 7+ Person Families | 0 (0.0%) | $0 |
| Total | 43 (100.0%) | $68,015 |
Family Income by Number of Earners in Top of the World
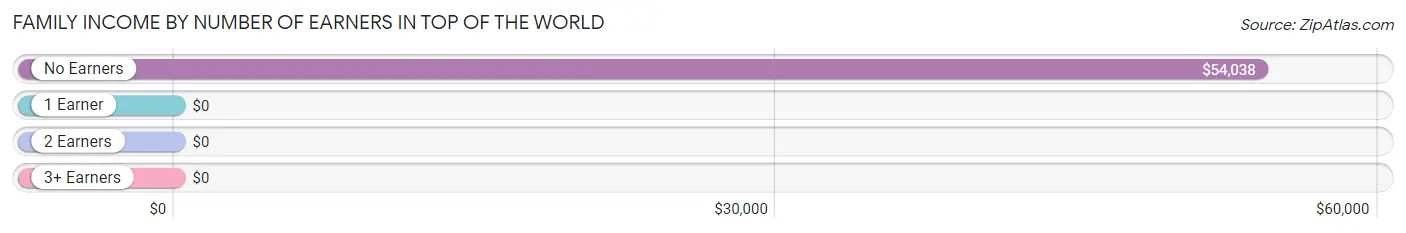
| Number of Earners | # Families | Median Income |
| No Earners | 26 (60.5%) | $54,038 |
| 1 Earner | 17 (39.5%) | $0 |
| 2 Earners | 0 (0.0%) | $0 |
| 3+ Earners | 0 (0.0%) | $0 |
| Total | 43 (100.0%) | $68,015 |
Household Income in Top of the World
Household Income Brackets in Top of the World
With 97 households falling in the category, the less than $10,000 income range is the most frequent in Top of the World, accounting for 60.3% of all households.
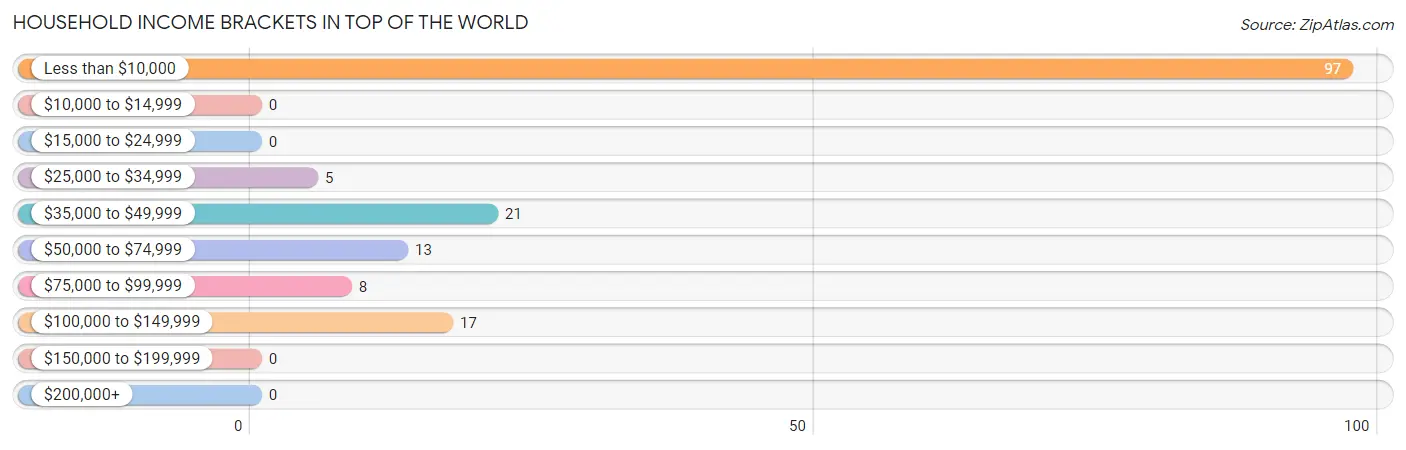
| Income Bracket | # Households | % Households |
| Less than $10,000 | 97 | 60.2% |
| $10,000 to $14,999 | 0 | 0.0% |
| $15,000 to $24,999 | 0 | 0.0% |
| $25,000 to $34,999 | 5 | 3.1% |
| $35,000 to $49,999 | 21 | 13.0% |
| $50,000 to $74,999 | 13 | 8.1% |
| $75,000 to $99,999 | 8 | 5.0% |
| $100,000 to $149,999 | 17 | 10.6% |
| $150,000 to $199,999 | 0 | 0.0% |
| $200,000+ | 0 | 0.0% |
Household Income by Householder Age in Top of the World
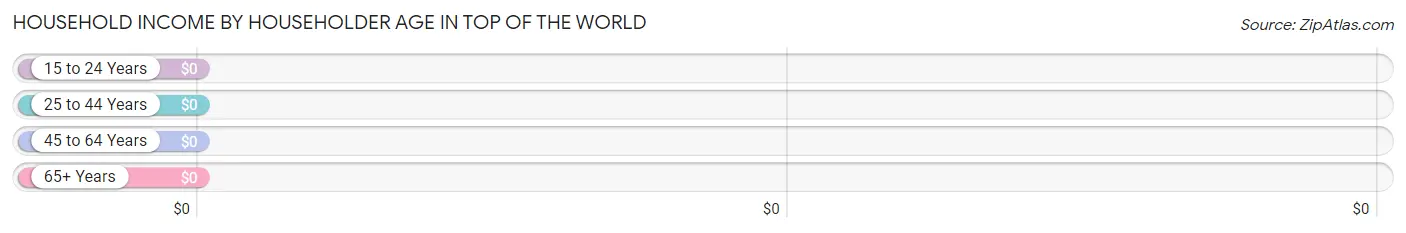
| Income Bracket | # Households | Median Income |
| 15 to 24 Years | 0 (0.0%) | $0 |
| 25 to 44 Years | 0 (0.0%) | $0 |
| 45 to 64 Years | 13 (8.1%) | $0 |
| 65+ Years | 148 (91.9%) | $0 |
| Total | 161 (100.0%) | $0 |
Poverty in Top of the World
Income Below Poverty by Sex and Age in Top of the World
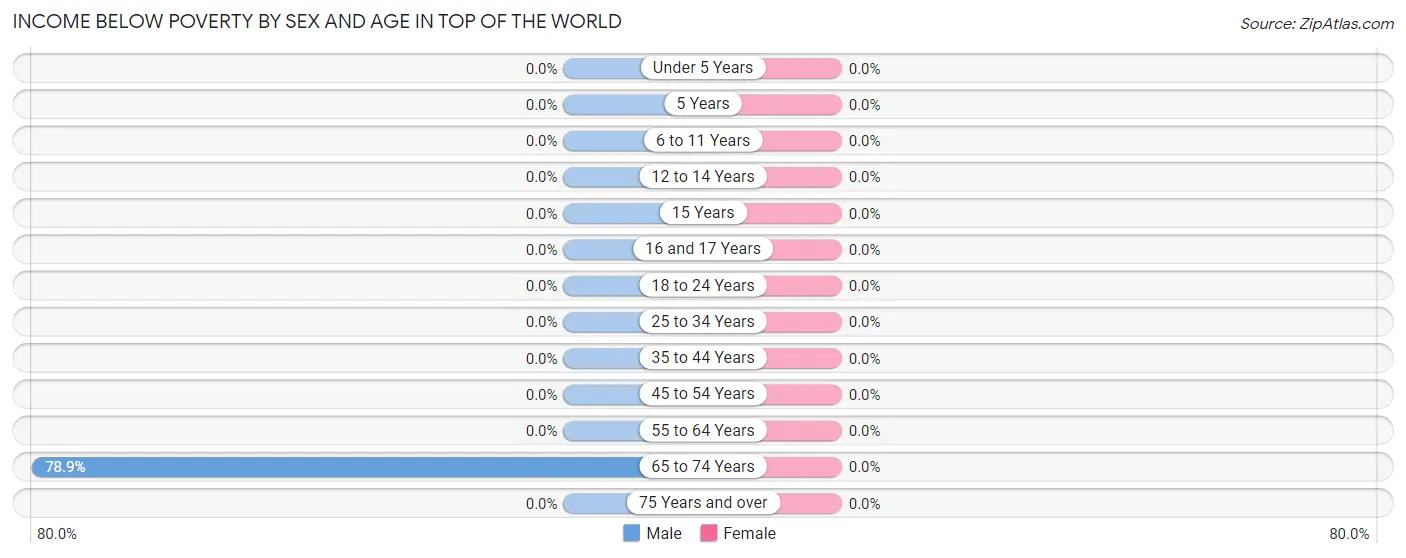
| Age Bracket | Male | Female |
| Under 5 Years | 0 (0.0%) | 0 (0.0%) |
| 5 Years | 0 (0.0%) | 0 (0.0%) |
| 6 to 11 Years | 0 (0.0%) | 0 (0.0%) |
| 12 to 14 Years | 0 (0.0%) | 0 (0.0%) |
| 15 Years | 0 (0.0%) | 0 (0.0%) |
| 16 and 17 Years | 0 (0.0%) | 0 (0.0%) |
| 18 to 24 Years | 0 (0.0%) | 0 (0.0%) |
| 25 to 34 Years | 0 (0.0%) | 0 (0.0%) |
| 35 to 44 Years | 0 (0.0%) | 0 (0.0%) |
| 45 to 54 Years | 0 (0.0%) | 0 (0.0%) |
| 55 to 64 Years | 0 (0.0%) | 0 (0.0%) |
| 65 to 74 Years | 97 (78.9%) | 0 (0.0%) |
| 75 Years and over | 0 (0.0%) | 0 (0.0%) |
| Total | 97 (59.2%) | 0 (0.0%) |
Income Above Poverty by Sex and Age in Top of the World
According to the poverty statistics in Top of the World, males aged 55 to 64 years and females aged 35 to 44 years are the age groups that are most secure financially, with 100.0% of males and 100.0% of females in these age groups living above the poverty line.
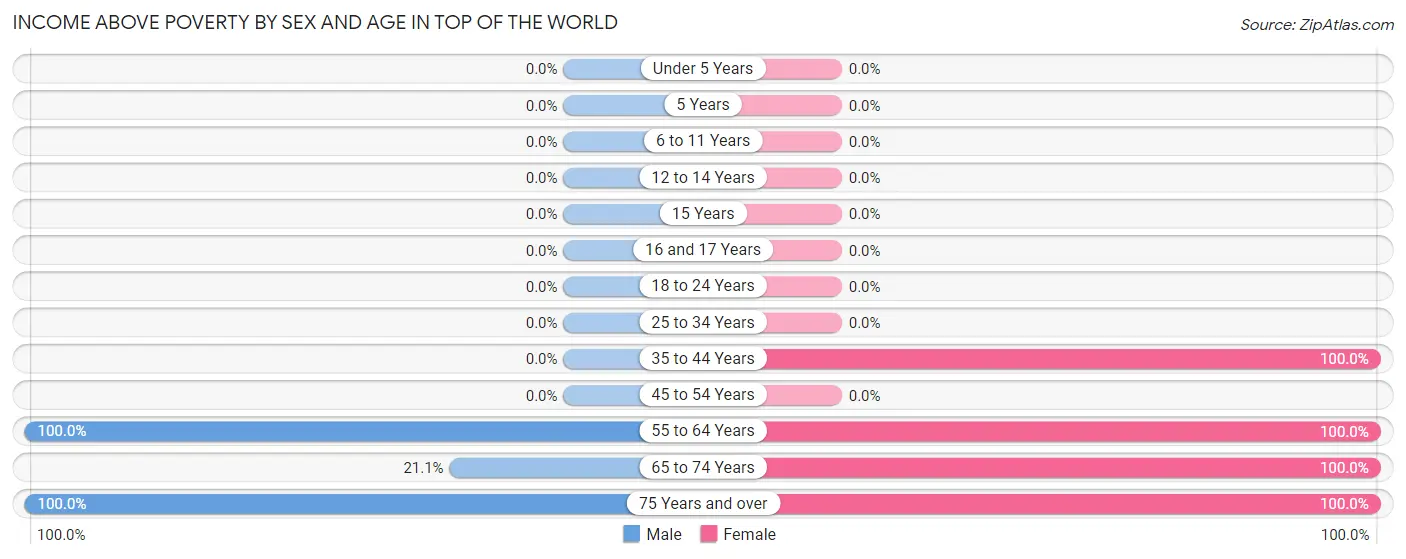
| Age Bracket | Male | Female |
| Under 5 Years | 0 (0.0%) | 0 (0.0%) |
| 5 Years | 0 (0.0%) | 0 (0.0%) |
| 6 to 11 Years | 0 (0.0%) | 0 (0.0%) |
| 12 to 14 Years | 0 (0.0%) | 0 (0.0%) |
| 15 Years | 0 (0.0%) | 0 (0.0%) |
| 16 and 17 Years | 0 (0.0%) | 0 (0.0%) |
| 18 to 24 Years | 0 (0.0%) | 0 (0.0%) |
| 25 to 34 Years | 0 (0.0%) | 0 (0.0%) |
| 35 to 44 Years | 0 (0.0%) | 18 (100.0%) |
| 45 to 54 Years | 0 (0.0%) | 0 (0.0%) |
| 55 to 64 Years | 15 (100.0%) | 13 (100.0%) |
| 65 to 74 Years | 26 (21.1%) | 15 (100.0%) |
| 75 Years and over | 26 (100.0%) | 17 (100.0%) |
| Total | 67 (40.8%) | 63 (100.0%) |
Income Below Poverty Among Married-Couple Families in Top of the World
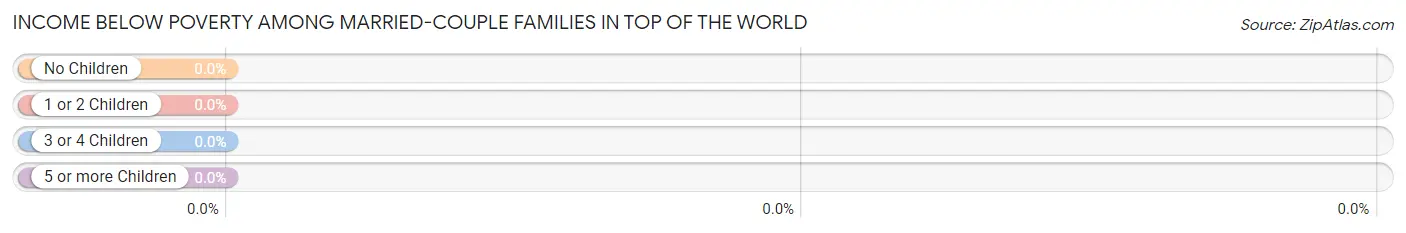
| Children | Above Poverty | Below Poverty |
| No Children | 43 (100.0%) | 0 (0.0%) |
| 1 or 2 Children | 0 (0.0%) | 0 (0.0%) |
| 3 or 4 Children | 0 (0.0%) | 0 (0.0%) |
| 5 or more Children | 0 (0.0%) | 0 (0.0%) |
| Total | 43 (100.0%) | 0 (0.0%) |
Income Below Poverty Among Single-Parent Households in Top of the World
| Children | Single Father | Single Mother |
| No Children | 0 (0.0%) | 0 (0.0%) |
| 1 or 2 Children | 0 (0.0%) | 0 (0.0%) |
| 3 or 4 Children | 0 (0.0%) | 0 (0.0%) |
| 5 or more Children | 0 (0.0%) | 0 (0.0%) |
| Total | 0 (0.0%) | 0 (0.0%) |
Income Below Poverty Among Married-Couple vs Single-Parent Households in Top of the World
| Children | Married-Couple Families | Single-Parent Households |
| No Children | 0 (0.0%) | 0 (0.0%) |
| 1 or 2 Children | 0 (0.0%) | 0 (0.0%) |
| 3 or 4 Children | 0 (0.0%) | 0 (0.0%) |
| 5 or more Children | 0 (0.0%) | 0 (0.0%) |
| Total | 0 (0.0%) | 0 (0.0%) |
Race in Top of the World
The most populous races in Top of the World are Native / Alaskan (118 | 52.0%), White / Caucasian (109 | 48.0%), and Hispanic or Latino (97 | 42.7%).
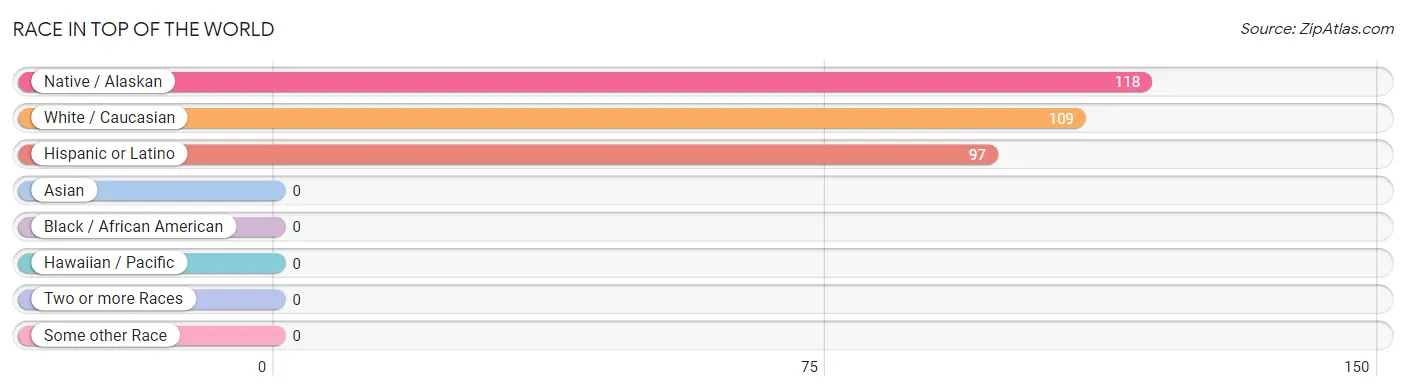
| Race | # Population | % Population |
| Asian | 0 | 0.0% |
| Black / African American | 0 | 0.0% |
| Hawaiian / Pacific | 0 | 0.0% |
| Hispanic or Latino | 97 | 42.7% |
| Native / Alaskan | 118 | 52.0% |
| White / Caucasian | 109 | 48.0% |
| Two or more Races | 0 | 0.0% |
| Some other Race | 0 | 0.0% |
| Total | 227 | 100.0% |
Ancestry in Top of the World
The most populous ancestries reported in Top of the World are Apache (97 | 42.7%), Mexican (97 | 42.7%), German (64 | 28.2%), English (17 | 7.5%), and Portuguese (15 | 6.6%), together accounting for 127.8% of all Top of the World residents.
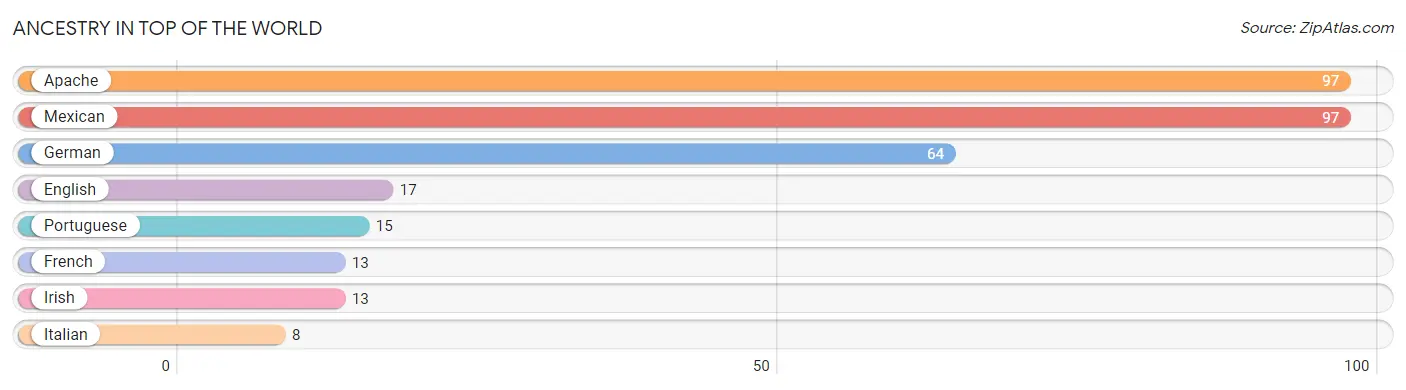
| Ancestry | # Population | % Population |
| Apache | 97 | 42.7% |
| English | 17 | 7.5% |
| French | 13 | 5.7% |
| German | 64 | 28.2% |
| Irish | 13 | 5.7% |
| Italian | 8 | 3.5% |
| Mexican | 97 | 42.7% |
| Portuguese | 15 | 6.6% | View All 8 Rows |
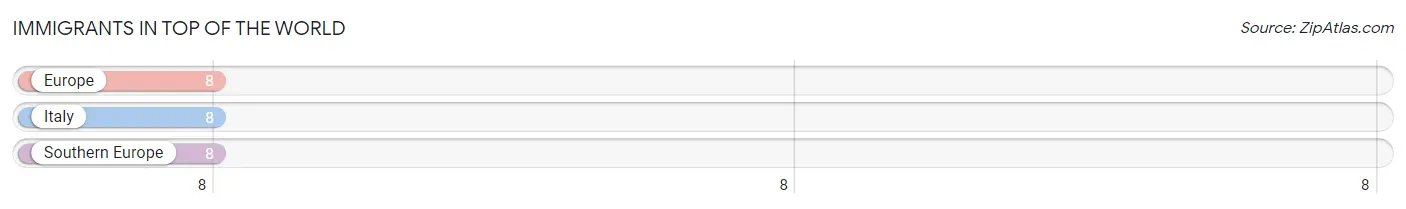
Immigrants in Top of the World
The most numerous immigrant groups reported in Top of the World came from Europe (8 | 3.5%), Italy (8 | 3.5%), and Southern Europe (8 | 3.5%), together accounting for 10.6% of all Top of the World residents.
| Immigration Origin | # Population | % Population |
| Europe | 8 | 3.5% |
| Italy | 8 | 3.5% |
| Southern Europe | 8 | 3.5% | View All 3 Rows |
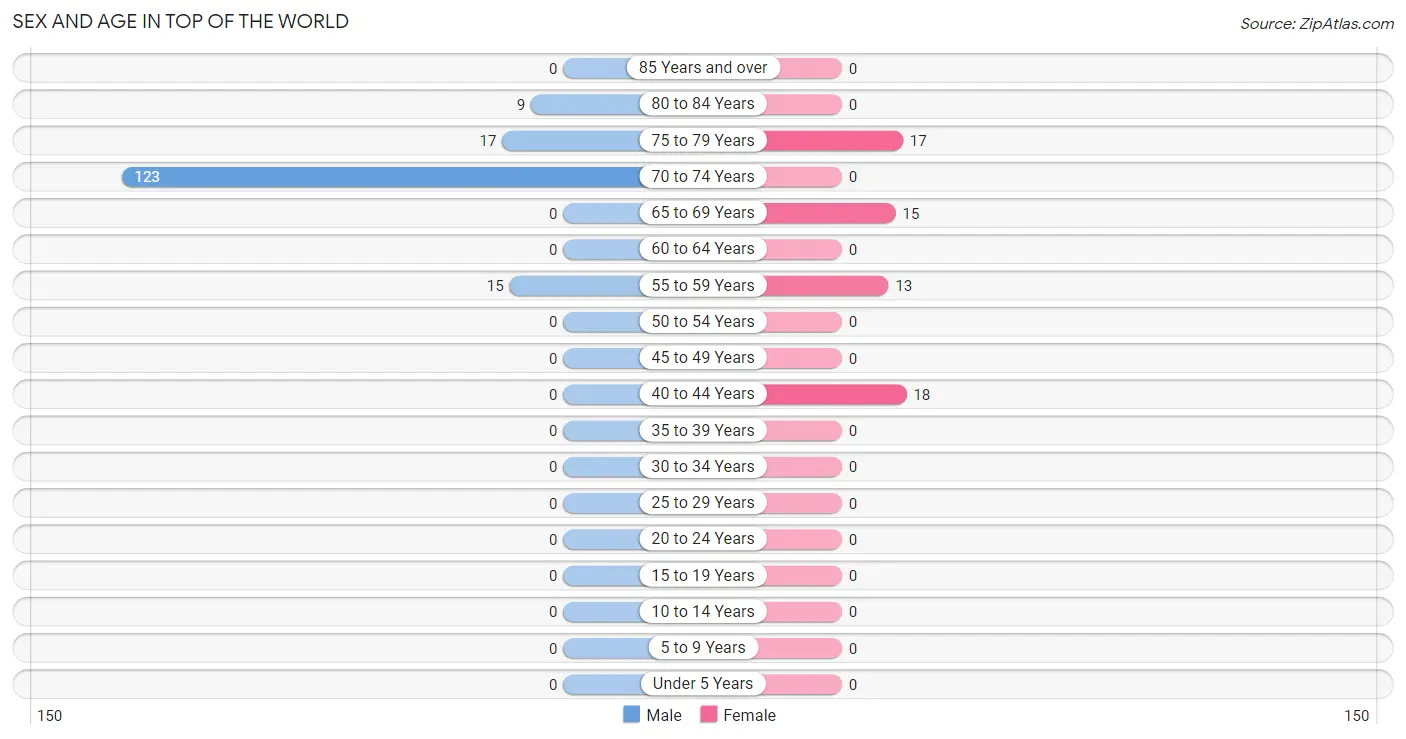
Sex and Age in Top of the World
Sex and Age in Top of the World
The most populous age groups in Top of the World are 70 to 74 Years (123 | 75.0%) for men and 40 to 44 Years (18 | 28.6%) for women.
| Age Bracket | Male | Female |
| Under 5 Years | 0 (0.0%) | 0 (0.0%) |
| 5 to 9 Years | 0 (0.0%) | 0 (0.0%) |
| 10 to 14 Years | 0 (0.0%) | 0 (0.0%) |
| 15 to 19 Years | 0 (0.0%) | 0 (0.0%) |
| 20 to 24 Years | 0 (0.0%) | 0 (0.0%) |
| 25 to 29 Years | 0 (0.0%) | 0 (0.0%) |
| 30 to 34 Years | 0 (0.0%) | 0 (0.0%) |
| 35 to 39 Years | 0 (0.0%) | 0 (0.0%) |
| 40 to 44 Years | 0 (0.0%) | 18 (28.6%) |
| 45 to 49 Years | 0 (0.0%) | 0 (0.0%) |
| 50 to 54 Years | 0 (0.0%) | 0 (0.0%) |
| 55 to 59 Years | 15 (9.1%) | 13 (20.6%) |
| 60 to 64 Years | 0 (0.0%) | 0 (0.0%) |
| 65 to 69 Years | 0 (0.0%) | 15 (23.8%) |
| 70 to 74 Years | 123 (75.0%) | 0 (0.0%) |
| 75 to 79 Years | 17 (10.4%) | 17 (27.0%) |
| 80 to 84 Years | 9 (5.5%) | 0 (0.0%) |
| 85 Years and over | 0 (0.0%) | 0 (0.0%) |
| Total | 164 (100.0%) | 63 (100.0%) |
Families and Households in Top of the World
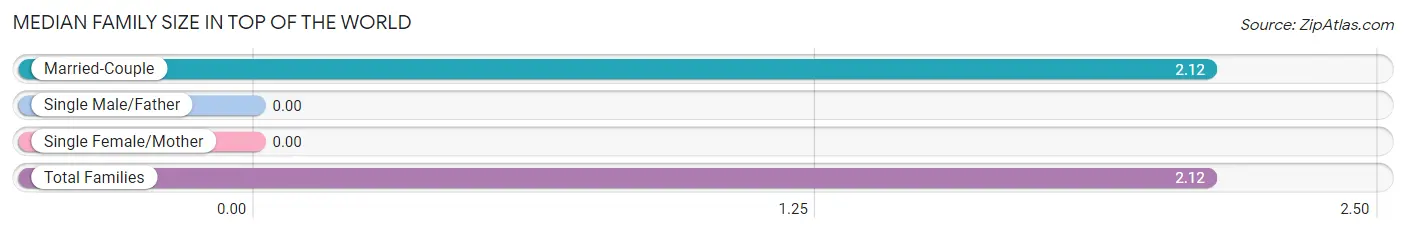
Median Family Size in Top of the World
| Family Type | # Families | Family Size |
| Married-Couple | 43 (100.0%) | 2.12 |
| Single Male/Father | 0 (0.0%) | - |
| Single Female/Mother | 0 (0.0%) | - |
| Total Families | 43 (100.0%) | 2.12 |
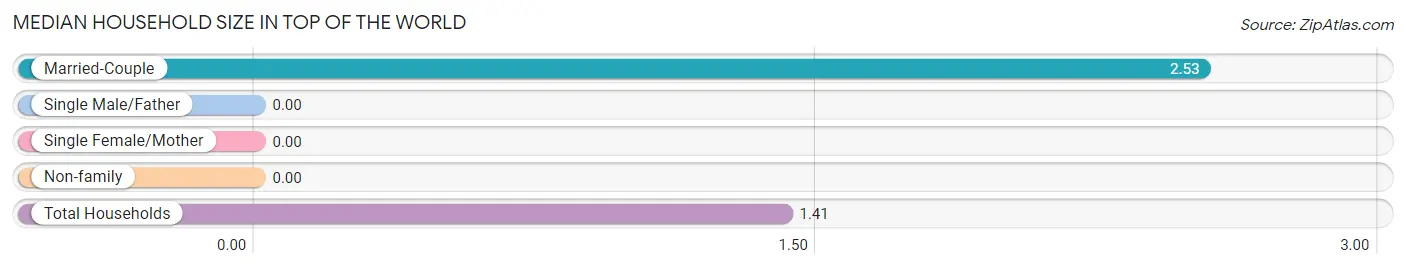
Median Household Size in Top of the World
| Household Type | # Households | Household Size |
| Married-Couple | 43 (26.7%) | 2.53 |
| Single Male/Father | 0 (0.0%) | - |
| Single Female/Mother | 0 (0.0%) | - |
| Non-family | 118 (73.3%) | - |
| Total Households | 161 (100.0%) | 1.41 |
Household Size by Marriage Status in Top of the World
Out of a total of 161 households in Top of the World, 43 (26.7%) are family households, while 118 (73.3%) are nonfamily households. The most numerous type of family households are 2-person households, comprising 26, and the most common type of nonfamily households are 1-person households, comprising 118.
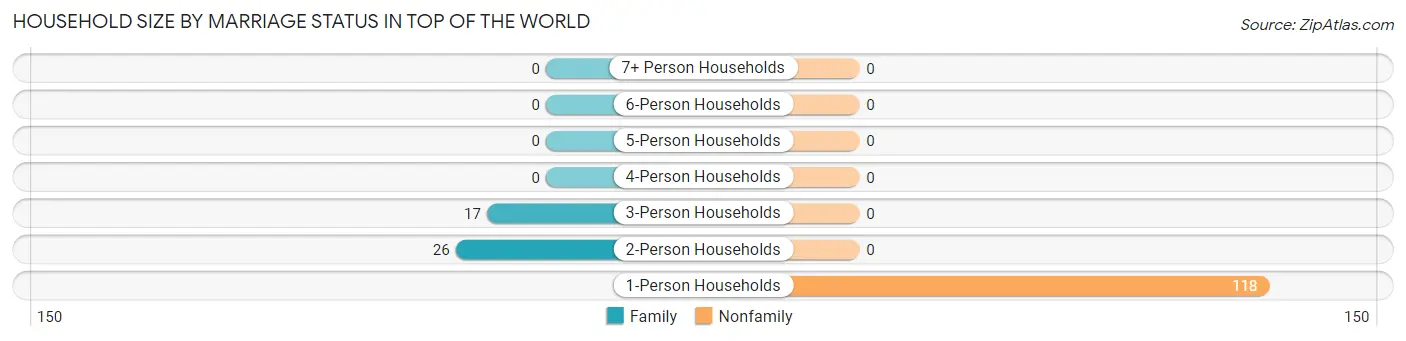
| Household Size | Family Households | Nonfamily Households |
| 1-Person Households | - | 118 (73.3%) |
| 2-Person Households | 26 (16.2%) | 0 (0.0%) |
| 3-Person Households | 17 (10.6%) | 0 (0.0%) |
| 4-Person Households | 0 (0.0%) | 0 (0.0%) |
| 5-Person Households | 0 (0.0%) | 0 (0.0%) |
| 6-Person Households | 0 (0.0%) | 0 (0.0%) |
| 7+ Person Households | 0 (0.0%) | 0 (0.0%) |
| Total | 43 (26.7%) | 118 (73.3%) |
Female Fertility in Top of the World
Fertility by Age in Top of the World
| Age Bracket | Women with Births | Births / 1,000 Women |
| 15 to 19 years | 0 (0.0%) | 0.0 |
| 20 to 34 years | 0 (0.0%) | 0.0 |
| 35 to 50 years | 0 (0.0%) | 0.0 |
| Total | 0 (0.0%) | 0.0 |
Fertility by Age by Marriage Status in Top of the World
| Age Bracket | Married | Unmarried |
| 15 to 19 years | 0 (0.0%) | 0 (0.0%) |
| 20 to 34 years | 0 (0.0%) | 0 (0.0%) |
| 35 to 50 years | 0 (0.0%) | 0 (0.0%) |
| Total | 0 (0.0%) | 0 (0.0%) |
Fertility by Education in Top of the World
| Educational Attainment | Women with Births | Births / 1,000 Women |
| Less than High School | 0 (0.0%) | 0.0 |
| High School Diploma | 0 (0.0%) | 0.0 |
| College or Associate's Degree | 0 (0.0%) | 0.0 |
| Bachelor's Degree | 0 (0.0%) | 0.0 |
| Graduate Degree | 0 (0.0%) | 0.0 |
| Total | 0 (0.0%) | 0.0 |
Fertility by Education by Marriage Status in Top of the World
| Educational Attainment | Married | Unmarried |
| Less than High School | 0 (0.0%) | 0 (0.0%) |
| High School Diploma | 0 (0.0%) | 0 (0.0%) |
| College or Associate's Degree | 0 (0.0%) | 0 (0.0%) |
| Bachelor's Degree | 0 (0.0%) | 0 (0.0%) |
| Graduate Degree | 0 (0.0%) | 0 (0.0%) |
| Total | 0 (0.0%) | 0 (0.0%) |
Employment Characteristics in Top of the World
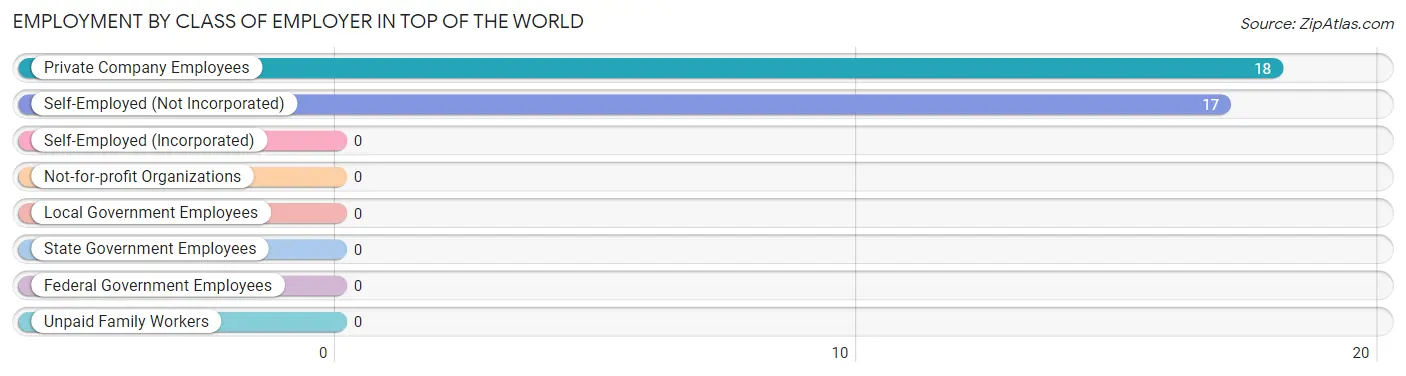
Employment by Class of Employer in Top of the World
Among the 35 employed individuals in Top of the World, private company employees (18 | 51.4%), and self-employed (not incorporated) (17 | 48.6%) make up the most common classes of employment.
| Employer Class | # Employees | % Employees |
| Private Company Employees | 18 | 51.4% |
| Self-Employed (Incorporated) | 0 | 0.0% |
| Self-Employed (Not Incorporated) | 17 | 48.6% |
| Not-for-profit Organizations | 0 | 0.0% |
| Local Government Employees | 0 | 0.0% |
| State Government Employees | 0 | 0.0% |
| Federal Government Employees | 0 | 0.0% |
| Unpaid Family Workers | 0 | 0.0% |
| Total | 35 | 100.0% |
Employment Status by Age in Top of the World
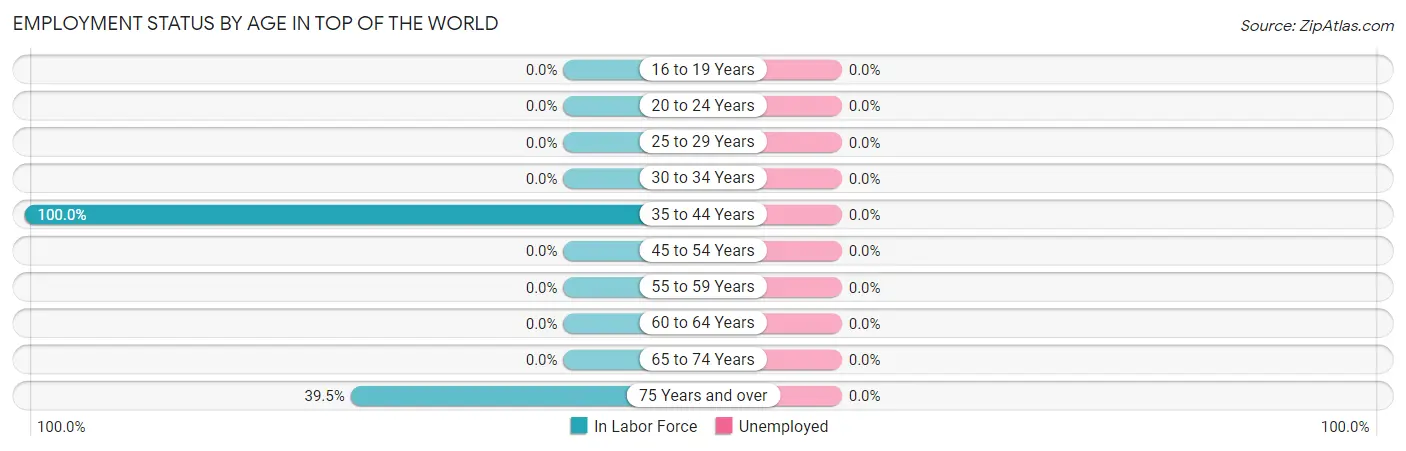
| Age Bracket | In Labor Force | Unemployed |
| 16 to 19 Years | 0 (0.0%) | 0 (0.0%) |
| 20 to 24 Years | 0 (0.0%) | 0 (0.0%) |
| 25 to 29 Years | 0 (0.0%) | 0 (0.0%) |
| 30 to 34 Years | 0 (0.0%) | 0 (0.0%) |
| 35 to 44 Years | 18 (100.0%) | 0 (0.0%) |
| 45 to 54 Years | 0 (0.0%) | 0 (0.0%) |
| 55 to 59 Years | 0 (0.0%) | 0 (0.0%) |
| 60 to 64 Years | 0 (0.0%) | 0 (0.0%) |
| 65 to 74 Years | 0 (0.0%) | 0 (0.0%) |
| 75 Years and over | 17 (39.5%) | 0 (0.0%) |
| Total | 35 (15.4%) | 0 (0.0%) |
Employment Status by Educational Attainment in Top of the World
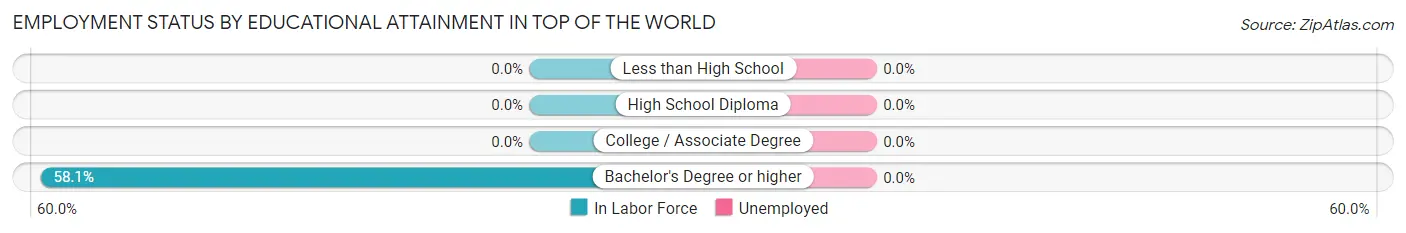
| Educational Attainment | In Labor Force | Unemployed |
| Less than High School | 0 (0.0%) | 0 (0.0%) |
| High School Diploma | 0 (0.0%) | 0 (0.0%) |
| College / Associate Degree | 0 (0.0%) | 0 (0.0%) |
| Bachelor's Degree or higher | 18 (58.1%) | 0 (0.0%) |
| Total | 18 (39.1%) | 0 (0.0%) |
Employment Occupations by Sex in Top of the World
Management, Business, Science and Arts Occupations
The most common Management, Business, Science and Arts occupations in Top of the World are Health Diagnosing & Treating (18 | 51.4%), and Health Technologists (18 | 51.4%).
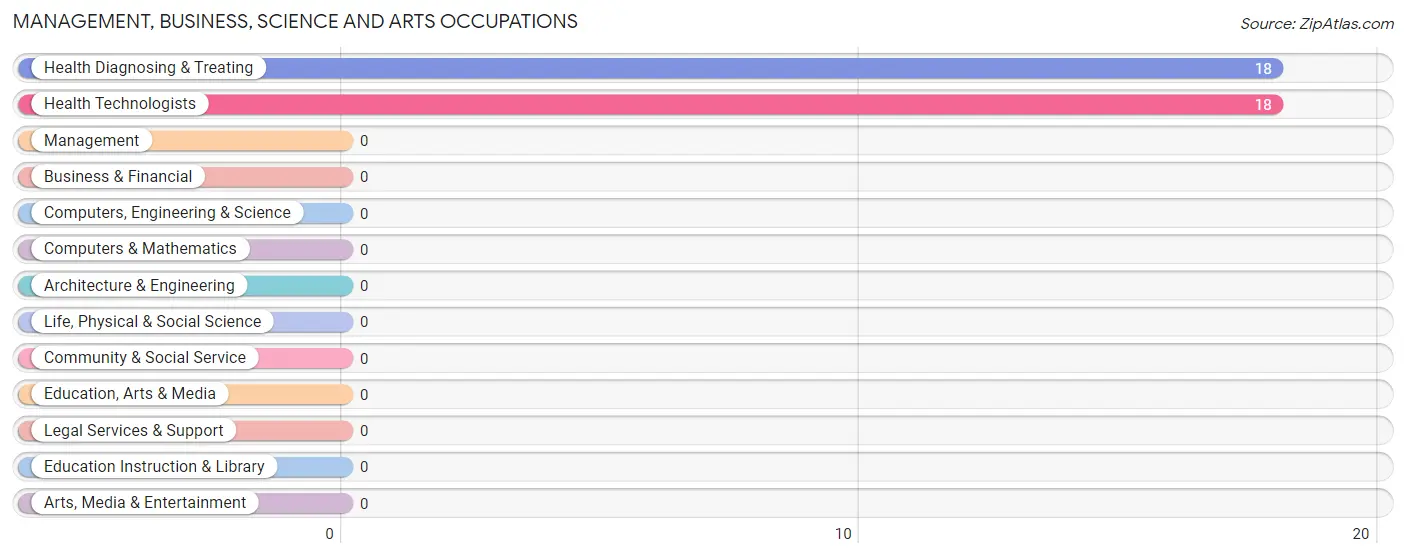
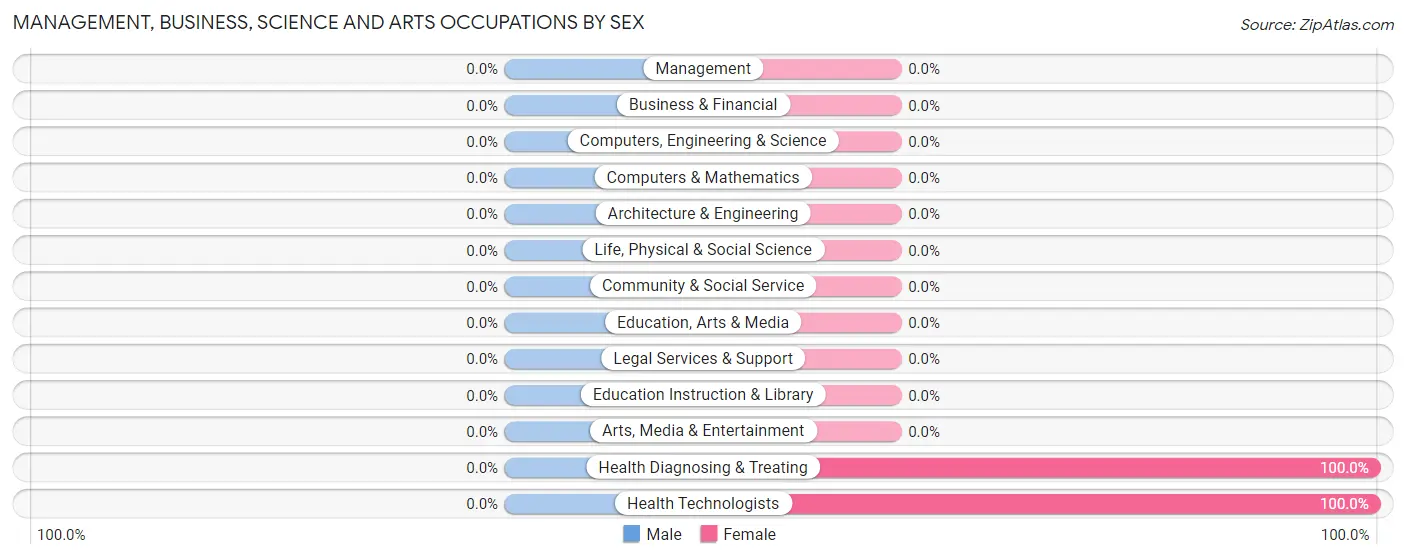
Management, Business, Science and Arts Occupations by Sex
| Occupation | Male | Female |
| Management | 0 (0.0%) | 0 (0.0%) |
| Business & Financial | 0 (0.0%) | 0 (0.0%) |
| Computers, Engineering & Science | 0 (0.0%) | 0 (0.0%) |
| Computers & Mathematics | 0 (0.0%) | 0 (0.0%) |
| Architecture & Engineering | 0 (0.0%) | 0 (0.0%) |
| Life, Physical & Social Science | 0 (0.0%) | 0 (0.0%) |
| Community & Social Service | 0 (0.0%) | 0 (0.0%) |
| Education, Arts & Media | 0 (0.0%) | 0 (0.0%) |
| Legal Services & Support | 0 (0.0%) | 0 (0.0%) |
| Education Instruction & Library | 0 (0.0%) | 0 (0.0%) |
| Arts, Media & Entertainment | 0 (0.0%) | 0 (0.0%) |
| Health Diagnosing & Treating | 0 (0.0%) | 18 (100.0%) |
| Health Technologists | 0 (0.0%) | 18 (100.0%) |
| Total (Category) | 0 (0.0%) | 18 (100.0%) |
| Total (Overall) | 17 (48.6%) | 18 (51.4%) |
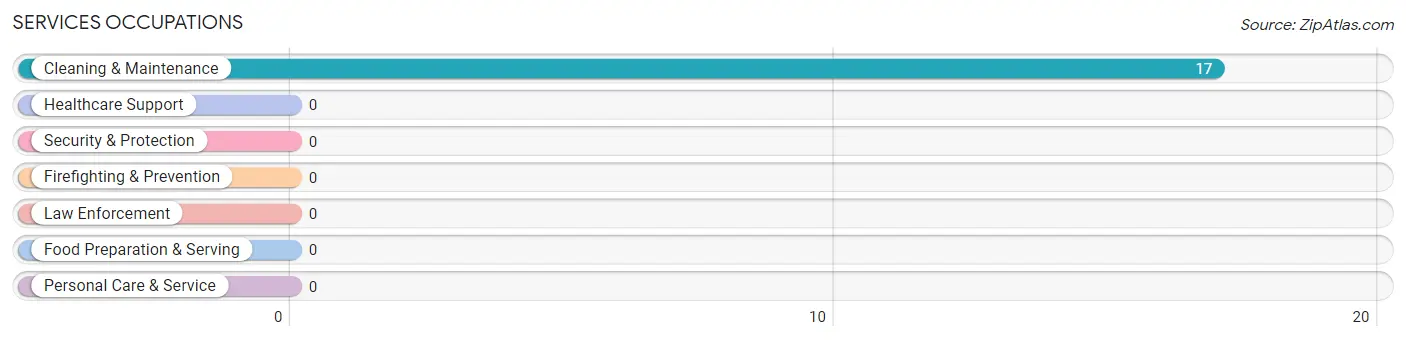
Services Occupations
The most common Services occupations in Top of the World are , and Cleaning & Maintenance (17 | 48.6%).
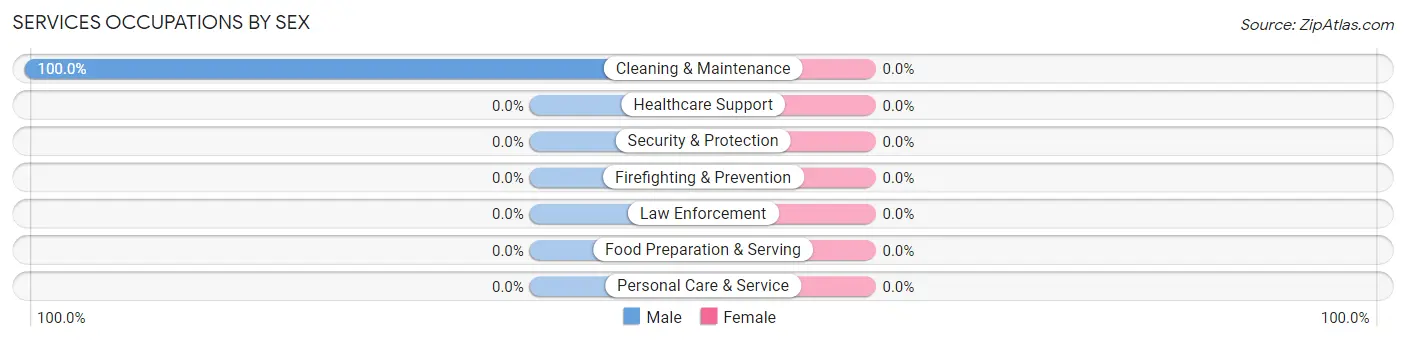
Services Occupations by Sex
| Occupation | Male | Female |
| Healthcare Support | 0 (0.0%) | 0 (0.0%) |
| Security & Protection | 0 (0.0%) | 0 (0.0%) |
| Firefighting & Prevention | 0 (0.0%) | 0 (0.0%) |
| Law Enforcement | 0 (0.0%) | 0 (0.0%) |
| Food Preparation & Serving | 0 (0.0%) | 0 (0.0%) |
| Cleaning & Maintenance | 17 (100.0%) | 0 (0.0%) |
| Personal Care & Service | 0 (0.0%) | 0 (0.0%) |
| Total (Category) | 17 (100.0%) | 0 (0.0%) |
| Total (Overall) | 17 (48.6%) | 18 (51.4%) |
Sales and Office Occupations

Sales and Office Occupations by Sex
| Occupation | Male | Female |
| Sales & Related | 0 (0.0%) | 0 (0.0%) |
| Office & Administration | 0 (0.0%) | 0 (0.0%) |
| Total (Category) | 0 (0.0%) | 0 (0.0%) |
| Total (Overall) | 17 (48.6%) | 18 (51.4%) |
Natural Resources, Construction and Maintenance Occupations
Natural Resources, Construction and Maintenance Occupations by Sex
| Occupation | Male | Female |
| Farming, Fishing & Forestry | 0 (0.0%) | 0 (0.0%) |
| Construction & Extraction | 0 (0.0%) | 0 (0.0%) |
| Installation, Maintenance & Repair | 0 (0.0%) | 0 (0.0%) |
| Total (Category) | 0 (0.0%) | 0 (0.0%) |
| Total (Overall) | 17 (48.6%) | 18 (51.4%) |
Production, Transportation and Moving Occupations
Production, Transportation and Moving Occupations by Sex
| Occupation | Male | Female |
| Production | 0 (0.0%) | 0 (0.0%) |
| Transportation | 0 (0.0%) | 0 (0.0%) |
| Material Moving | 0 (0.0%) | 0 (0.0%) |
| Total (Category) | 0 (0.0%) | 0 (0.0%) |
| Total (Overall) | 17 (48.6%) | 18 (51.4%) |
Employment Industries by Sex in Top of the World
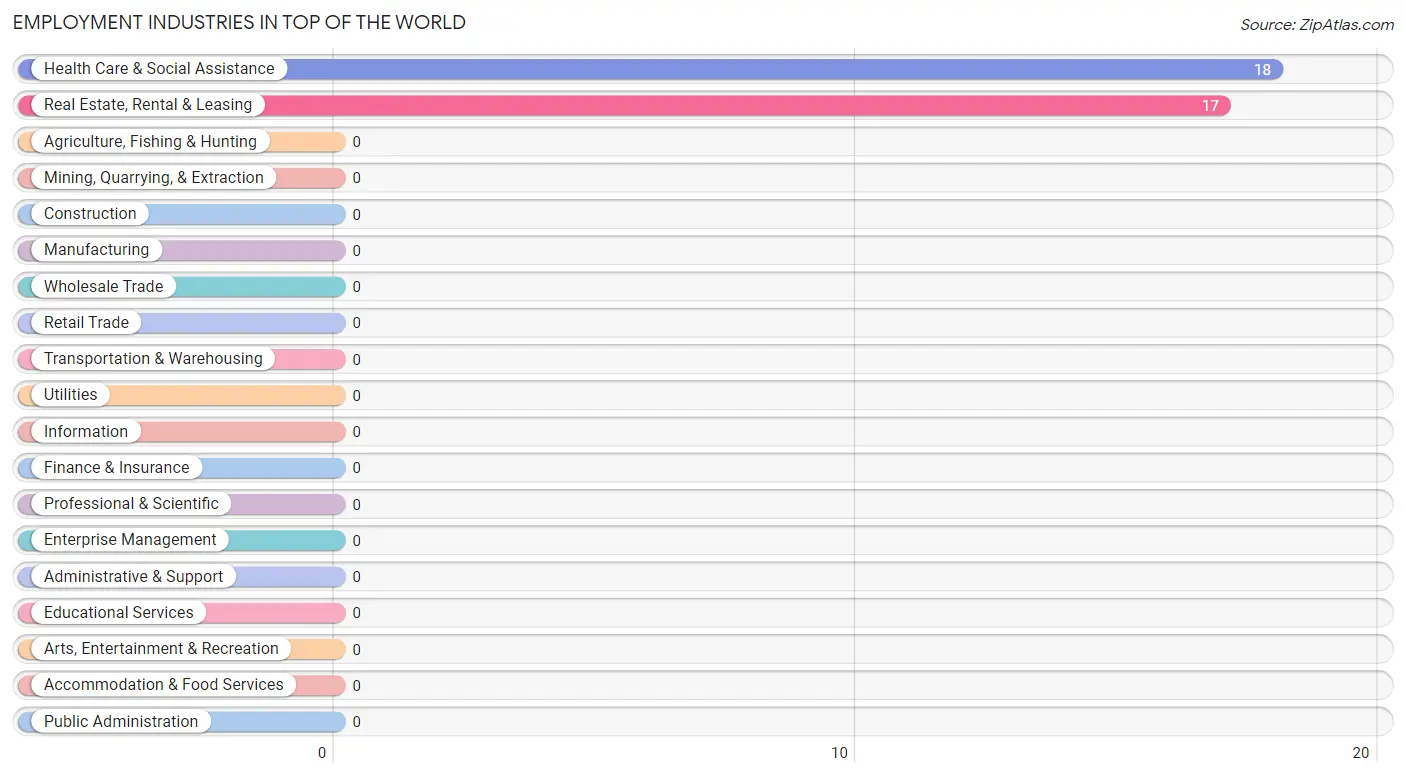
Employment Industries in Top of the World
The major employment industries in Top of the World include Health Care & Social Assistance (18 | 51.4%), and Real Estate, Rental & Leasing (17 | 48.6%).
Employment Industries by Sex in Top of the World
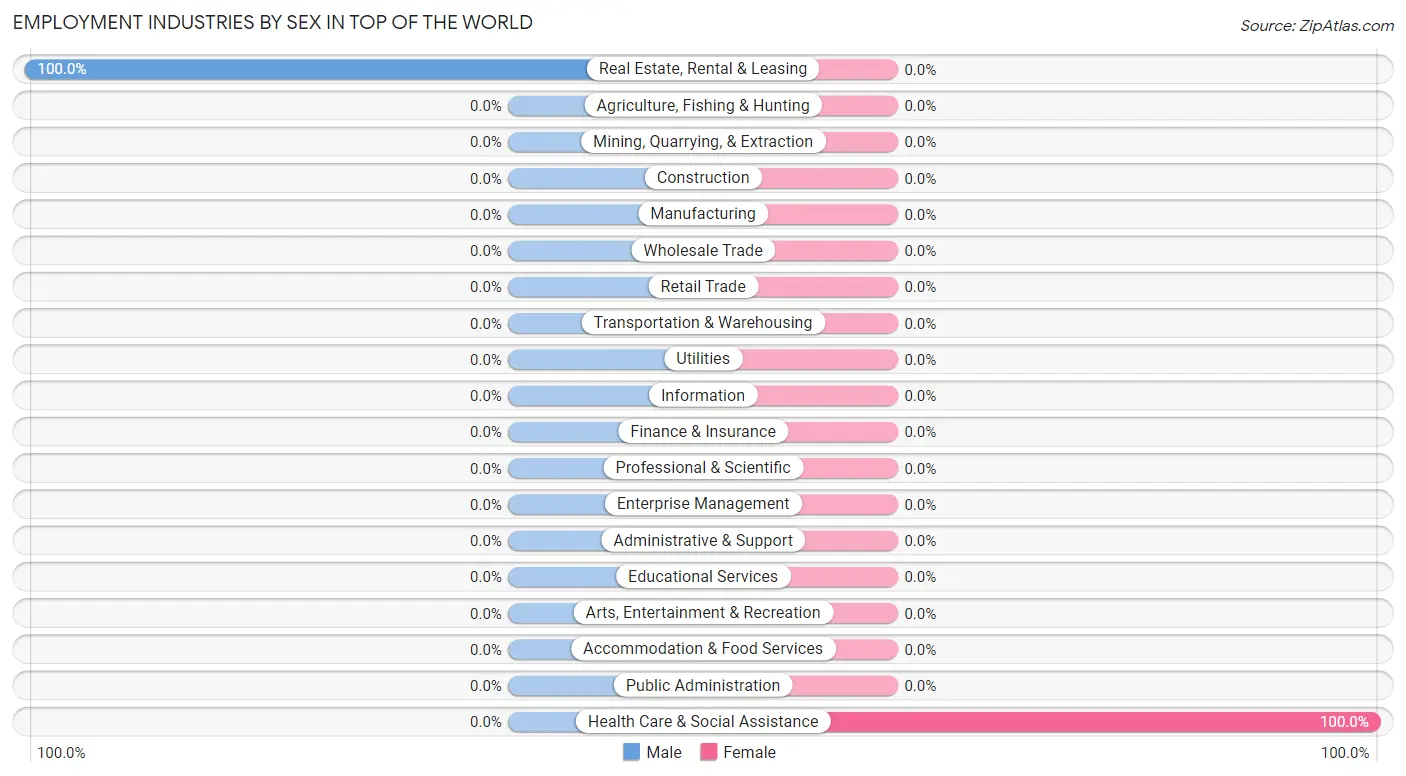
| Industry | Male | Female |
| Agriculture, Fishing & Hunting | 0 (0.0%) | 0 (0.0%) |
| Mining, Quarrying, & Extraction | 0 (0.0%) | 0 (0.0%) |
| Construction | 0 (0.0%) | 0 (0.0%) |
| Manufacturing | 0 (0.0%) | 0 (0.0%) |
| Wholesale Trade | 0 (0.0%) | 0 (0.0%) |
| Retail Trade | 0 (0.0%) | 0 (0.0%) |
| Transportation & Warehousing | 0 (0.0%) | 0 (0.0%) |
| Utilities | 0 (0.0%) | 0 (0.0%) |
| Information | 0 (0.0%) | 0 (0.0%) |
| Finance & Insurance | 0 (0.0%) | 0 (0.0%) |
| Real Estate, Rental & Leasing | 17 (100.0%) | 0 (0.0%) |
| Professional & Scientific | 0 (0.0%) | 0 (0.0%) |
| Enterprise Management | 0 (0.0%) | 0 (0.0%) |
| Administrative & Support | 0 (0.0%) | 0 (0.0%) |
| Educational Services | 0 (0.0%) | 0 (0.0%) |
| Health Care & Social Assistance | 0 (0.0%) | 18 (100.0%) |
| Arts, Entertainment & Recreation | 0 (0.0%) | 0 (0.0%) |
| Accommodation & Food Services | 0 (0.0%) | 0 (0.0%) |
| Public Administration | 0 (0.0%) | 0 (0.0%) |
| Total | 17 (48.6%) | 18 (51.4%) |
Education in Top of the World
School Enrollment in Top of the World
| School Level | # Students | % Students |
| Nursery / Preschool | 0 | 0.0% |
| Kindergarten | 0 | 0.0% |
| Elementary School | 0 | 0.0% |
| Middle School | 0 | 0.0% |
| High School | 0 | 0.0% |
| College / Undergraduate | 0 | 0.0% |
| Graduate / Professional | 0 | 0.0% |
| Total | 0 | 0.0% |
School Enrollment by Age by Funding Source in Top of the World
| Age Bracket | Public School | Private School |
| 3 to 4 Year Olds | 0 (0.0%) | 0 (0.0%) |
| 5 to 9 Year Old | 0 (0.0%) | 0 (0.0%) |
| 10 to 14 Year Olds | 0 (0.0%) | 0 (0.0%) |
| 15 to 17 Year Olds | 0 (0.0%) | 0 (0.0%) |
| 18 to 19 Year Olds | 0 (0.0%) | 0 (0.0%) |
| 20 to 24 Year Olds | 0 (0.0%) | 0 (0.0%) |
| 25 to 34 Year Olds | 0 (0.0%) | 0 (0.0%) |
| 35 Years and over | 0 (0.0%) | 0 (0.0%) |
| Total | 0 (0.0%) | 0 (0.0%) |
Educational Attainment by Field of Study in Top of the World
Business (31 | 44.9%), computers & mathematics (21 | 30.4%), engineering (9 | 13.0%), and arts & humanities (8 | 11.6%) are the most common fields of study among 69 individuals in Top of the World who have obtained a bachelor's degree or higher.
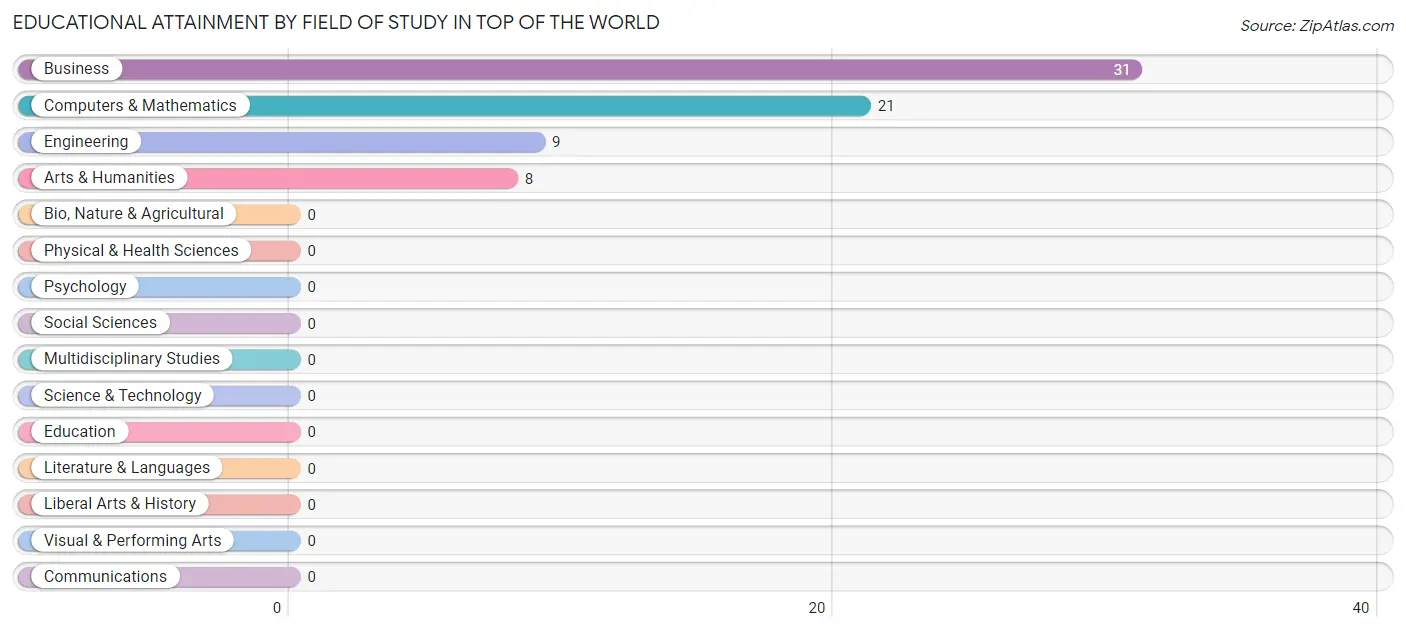
| Field of Study | # Graduates | % Graduates |
| Computers & Mathematics | 21 | 30.4% |
| Bio, Nature & Agricultural | 0 | 0.0% |
| Physical & Health Sciences | 0 | 0.0% |
| Psychology | 0 | 0.0% |
| Social Sciences | 0 | 0.0% |
| Engineering | 9 | 13.0% |
| Multidisciplinary Studies | 0 | 0.0% |
| Science & Technology | 0 | 0.0% |
| Business | 31 | 44.9% |
| Education | 0 | 0.0% |
| Literature & Languages | 0 | 0.0% |
| Liberal Arts & History | 0 | 0.0% |
| Visual & Performing Arts | 0 | 0.0% |
| Communications | 0 | 0.0% |
| Arts & Humanities | 8 | 11.6% |
| Total | 69 | 100.0% |
Transportation & Commute in Top of the World
Vehicle Availability by Sex in Top of the World
The most prevalent vehicle ownership categories in Top of the World are males with 3 vehicles (17, accounting for 100.0%) and females with 3 vehicles (18, making up 94.4%).
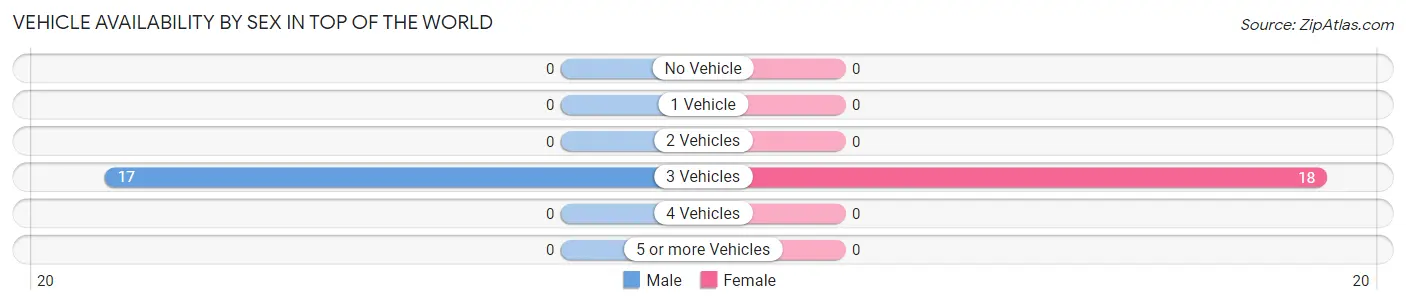
| Vehicles Available | Male | Female |
| No Vehicle | 0 (0.0%) | 0 (0.0%) |
| 1 Vehicle | 0 (0.0%) | 0 (0.0%) |
| 2 Vehicles | 0 (0.0%) | 0 (0.0%) |
| 3 Vehicles | 17 (100.0%) | 18 (100.0%) |
| 4 Vehicles | 0 (0.0%) | 0 (0.0%) |
| 5 or more Vehicles | 0 (0.0%) | 0 (0.0%) |
| Total | 17 (100.0%) | 18 (100.0%) |
Commute Time in Top of the World
| Commute Time | # Commuters | % Commuters |
| Less than 5 Minutes | 0 | 0.0% |
| 5 to 9 Minutes | 0 | 0.0% |
| 10 to 14 Minutes | 0 | 0.0% |
| 15 to 19 Minutes | 0 | 0.0% |
| 20 to 24 Minutes | 0 | 0.0% |
| 25 to 29 Minutes | 0 | 0.0% |
| 30 to 34 Minutes | 0 | 0.0% |
| 35 to 39 Minutes | 0 | 0.0% |
| 40 to 44 Minutes | 0 | 0.0% |
| 45 to 59 Minutes | 0 | 0.0% |
| 60 to 89 Minutes | 0 | 0.0% |
| 90 or more Minutes | 0 | 0.0% |
Commute Time by Sex in Top of the World
| Commute Time | Male | Female |
| Less than 5 Minutes | 0 (0.0%) | 0 (0.0%) |
| 5 to 9 Minutes | 0 (0.0%) | 0 (0.0%) |
| 10 to 14 Minutes | 0 (0.0%) | 0 (0.0%) |
| 15 to 19 Minutes | 0 (0.0%) | 0 (0.0%) |
| 20 to 24 Minutes | 0 (0.0%) | 0 (0.0%) |
| 25 to 29 Minutes | 0 (0.0%) | 0 (0.0%) |
| 30 to 34 Minutes | 0 (0.0%) | 0 (0.0%) |
| 35 to 39 Minutes | 0 (0.0%) | 0 (0.0%) |
| 40 to 44 Minutes | 0 (0.0%) | 0 (0.0%) |
| 45 to 59 Minutes | 0 (0.0%) | 0 (0.0%) |
| 60 to 89 Minutes | 0 (0.0%) | 0 (0.0%) |
| 90 or more Minutes | 0 (0.0%) | 0 (0.0%) |
Time of Departure to Work by Sex in Top of the World
| Time of Departure | Male | Female |
| 12:00 AM to 4:59 AM | 0 (0.0%) | 0 (0.0%) |
| 5:00 AM to 5:29 AM | 0 (0.0%) | 0 (0.0%) |
| 5:30 AM to 5:59 AM | 0 (0.0%) | 0 (0.0%) |
| 6:00 AM to 6:29 AM | 0 (0.0%) | 0 (0.0%) |
| 6:30 AM to 6:59 AM | 0 (0.0%) | 0 (0.0%) |
| 7:00 AM to 7:29 AM | 0 (0.0%) | 0 (0.0%) |
| 7:30 AM to 7:59 AM | 0 (0.0%) | 0 (0.0%) |
| 8:00 AM to 8:29 AM | 0 (0.0%) | 0 (0.0%) |
| 8:30 AM to 8:59 AM | 0 (0.0%) | 0 (0.0%) |
| 9:00 AM to 9:59 AM | 0 (0.0%) | 0 (0.0%) |
| 10:00 AM to 10:59 AM | 0 (0.0%) | 0 (0.0%) |
| 11:00 AM to 11:59 AM | 0 (0.0%) | 0 (0.0%) |
| 12:00 PM to 3:59 PM | 0 (0.0%) | 0 (0.0%) |
| 4:00 PM to 11:59 PM | 0 (0.0%) | 0 (0.0%) |
| Total | 0 (0.0%) | 0 (0.0%) |
Housing Occupancy in Top of the World
Occupancy by Ownership in Top of the World
Of the total 161 dwellings in Top of the World, owner-occupied units account for 161 (100.0%), while renter-occupied units make up 0 (0.0%).
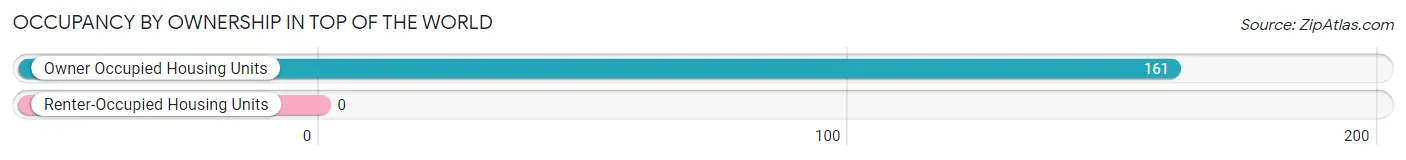
| Occupancy | # Housing Units | % Housing Units |
| Owner Occupied Housing Units | 161 | 100.0% |
| Renter-Occupied Housing Units | 0 | 0.0% |
| Total Occupied Housing Units | 161 | 100.0% |
Occupancy by Household Size in Top of the World
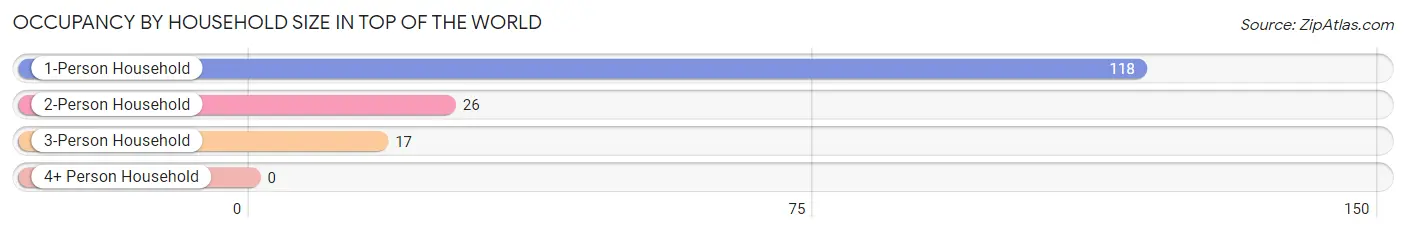
| Household Size | # Housing Units | % Housing Units |
| 1-Person Household | 118 | 73.3% |
| 2-Person Household | 26 | 16.2% |
| 3-Person Household | 17 | 10.6% |
| 4+ Person Household | 0 | 0.0% |
| Total Housing Units | 161 | 100.0% |
Occupancy by Ownership by Household Size in Top of the World
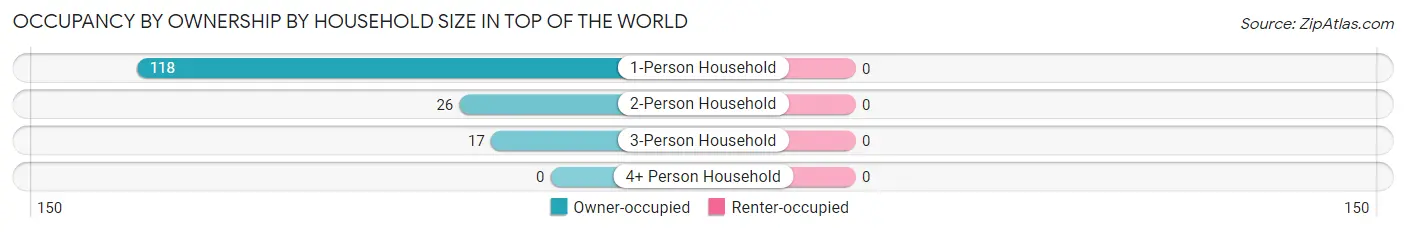
| Household Size | Owner-occupied | Renter-occupied |
| 1-Person Household | 118 (100.0%) | 0 (0.0%) |
| 2-Person Household | 26 (100.0%) | 0 (0.0%) |
| 3-Person Household | 17 (100.0%) | 0 (0.0%) |
| 4+ Person Household | 0 (0.0%) | 0 (0.0%) |
| Total Housing Units | 161 (100.0%) | 0 (0.0%) |
Occupancy by Educational Attainment in Top of the World
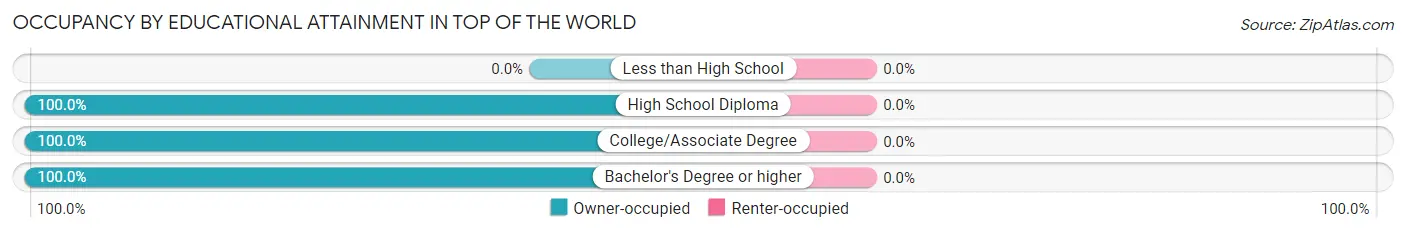
| Household Size | Owner-occupied | Renter-occupied |
| Less than High School | 0 (0.0%) | 0 (0.0%) |
| High School Diploma | 22 (100.0%) | 0 (0.0%) |
| College/Associate Degree | 97 (100.0%) | 0 (0.0%) |
| Bachelor's Degree or higher | 42 (100.0%) | 0 (0.0%) |
Occupancy by Age of Householder in Top of the World
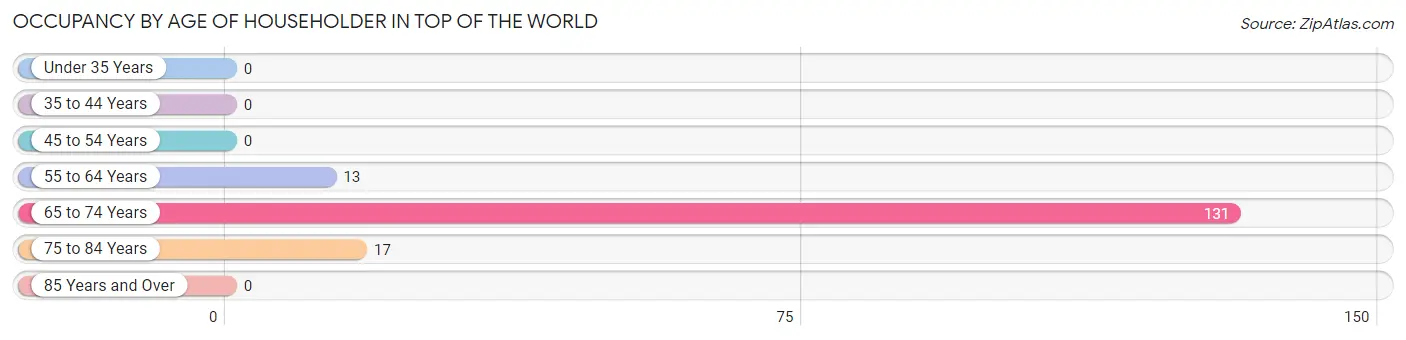
| Age Bracket | # Households | % Households |
| Under 35 Years | 0 | 0.0% |
| 35 to 44 Years | 0 | 0.0% |
| 45 to 54 Years | 0 | 0.0% |
| 55 to 64 Years | 13 | 8.1% |
| 65 to 74 Years | 131 | 81.4% |
| 75 to 84 Years | 17 | 10.6% |
| 85 Years and Over | 0 | 0.0% |
| Total | 161 | 100.0% |
Housing Finances in Top of the World
Median Income by Occupancy in Top of the World
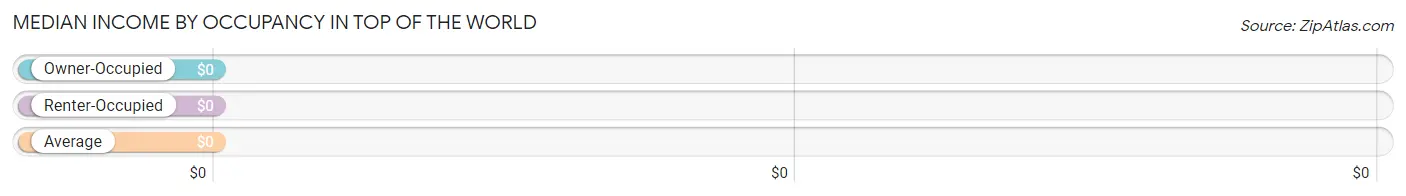
| Occupancy Type | # Households | Median Income |
| Owner-Occupied | 161 (100.0%) | $0 |
| Renter-Occupied | 0 (0.0%) | $0 |
| Average | 161 (100.0%) | $0 |
Occupancy by Householder Income Bracket in Top of the World
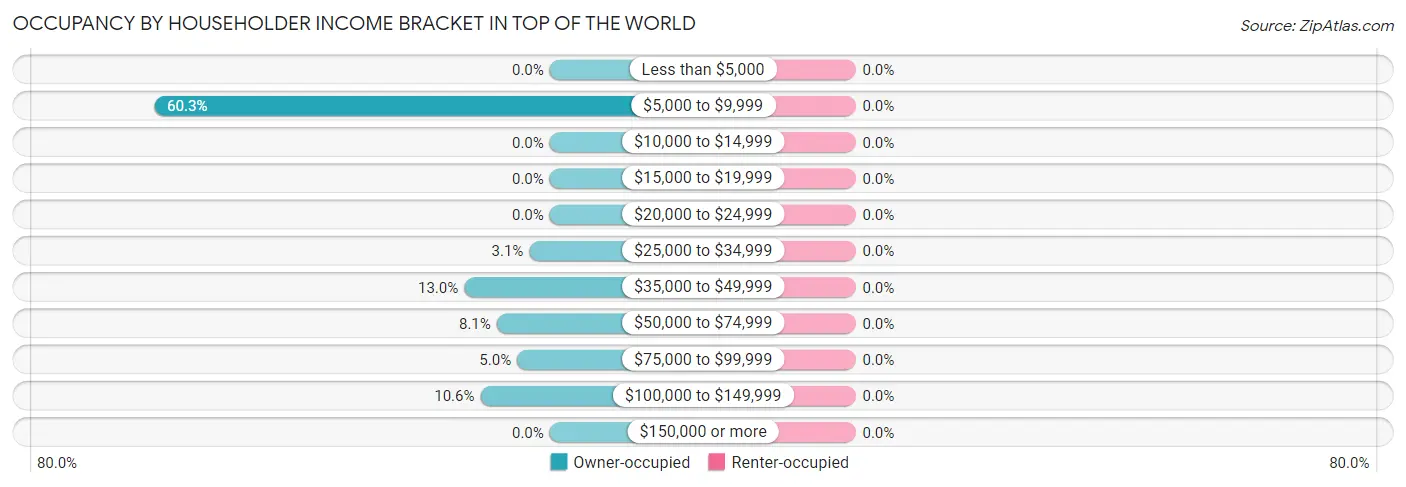
| Income Bracket | Owner-occupied | Renter-occupied |
| Less than $5,000 | 0 (0.0%) | 0 (0.0%) |
| $5,000 to $9,999 | 97 (60.3%) | 0 (0.0%) |
| $10,000 to $14,999 | 0 (0.0%) | 0 (0.0%) |
| $15,000 to $19,999 | 0 (0.0%) | 0 (0.0%) |
| $20,000 to $24,999 | 0 (0.0%) | 0 (0.0%) |
| $25,000 to $34,999 | 5 (3.1%) | 0 (0.0%) |
| $35,000 to $49,999 | 21 (13.0%) | 0 (0.0%) |
| $50,000 to $74,999 | 13 (8.1%) | 0 (0.0%) |
| $75,000 to $99,999 | 8 (5.0%) | 0 (0.0%) |
| $100,000 to $149,999 | 17 (10.6%) | 0 (0.0%) |
| $150,000 or more | 0 (0.0%) | 0 (0.0%) |
| Total | 161 (100.0%) | 0 (0.0%) |
Monthly Housing Cost Tiers in Top of the World
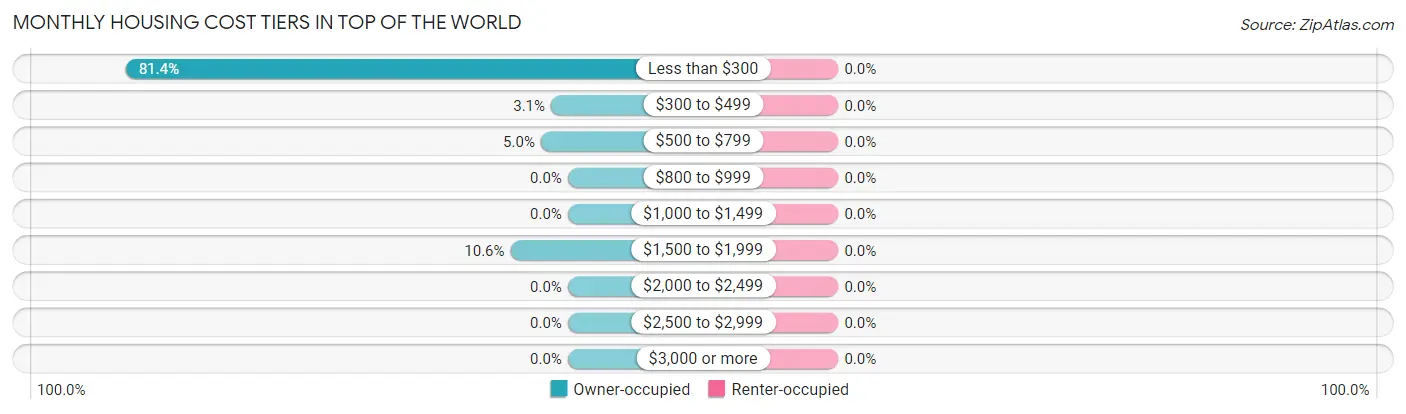
| Monthly Cost | Owner-occupied | Renter-occupied |
| Less than $300 | 131 (81.4%) | 0 (0.0%) |
| $300 to $499 | 5 (3.1%) | 0 (0.0%) |
| $500 to $799 | 8 (5.0%) | 0 (0.0%) |
| $800 to $999 | 0 (0.0%) | 0 (0.0%) |
| $1,000 to $1,499 | 0 (0.0%) | 0 (0.0%) |
| $1,500 to $1,999 | 17 (10.6%) | 0 (0.0%) |
| $2,000 to $2,499 | 0 (0.0%) | 0 (0.0%) |
| $2,500 to $2,999 | 0 (0.0%) | 0 (0.0%) |
| $3,000 or more | 0 (0.0%) | 0 (0.0%) |
| Total | 161 (100.0%) | 0 (0.0%) |
Physical Housing Characteristics in Top of the World
Housing Structures in Top of the World
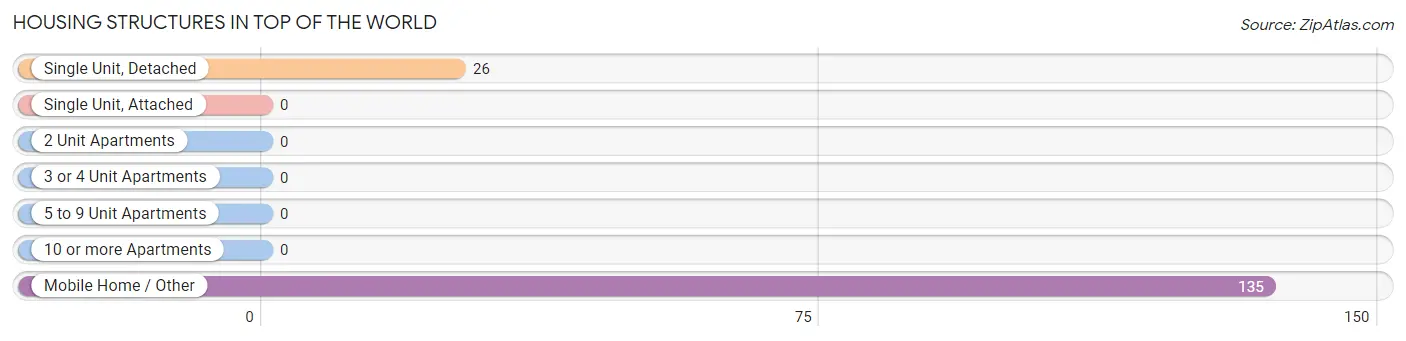
| Structure Type | # Housing Units | % Housing Units |
| Single Unit, Detached | 26 | 16.2% |
| Single Unit, Attached | 0 | 0.0% |
| 2 Unit Apartments | 0 | 0.0% |
| 3 or 4 Unit Apartments | 0 | 0.0% |
| 5 to 9 Unit Apartments | 0 | 0.0% |
| 10 or more Apartments | 0 | 0.0% |
| Mobile Home / Other | 135 | 83.9% |
| Total | 161 | 100.0% |
Housing Structures by Occupancy in Top of the World
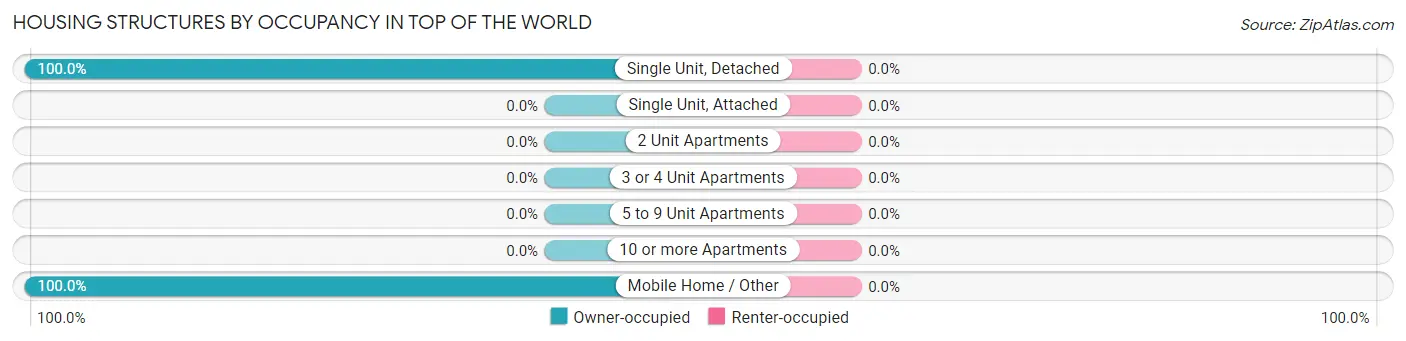
| Structure Type | Owner-occupied | Renter-occupied |
| Single Unit, Detached | 26 (100.0%) | 0 (0.0%) |
| Single Unit, Attached | 0 (0.0%) | 0 (0.0%) |
| 2 Unit Apartments | 0 (0.0%) | 0 (0.0%) |
| 3 or 4 Unit Apartments | 0 (0.0%) | 0 (0.0%) |
| 5 to 9 Unit Apartments | 0 (0.0%) | 0 (0.0%) |
| 10 or more Apartments | 0 (0.0%) | 0 (0.0%) |
| Mobile Home / Other | 135 (100.0%) | 0 (0.0%) |
| Total | 161 (100.0%) | 0 (0.0%) |
Housing Structures by Number of Rooms in Top of the World
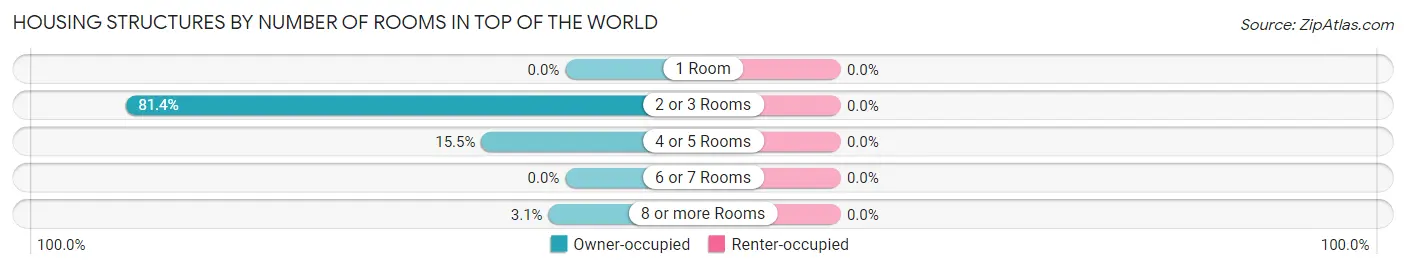
| Number of Rooms | Owner-occupied | Renter-occupied |
| 1 Room | 0 (0.0%) | 0 (0.0%) |
| 2 or 3 Rooms | 131 (81.4%) | 0 (0.0%) |
| 4 or 5 Rooms | 25 (15.5%) | 0 (0.0%) |
| 6 or 7 Rooms | 0 (0.0%) | 0 (0.0%) |
| 8 or more Rooms | 5 (3.1%) | 0 (0.0%) |
| Total | 161 (100.0%) | 0 (0.0%) |
Housing Structure by Heating Type in Top of the World
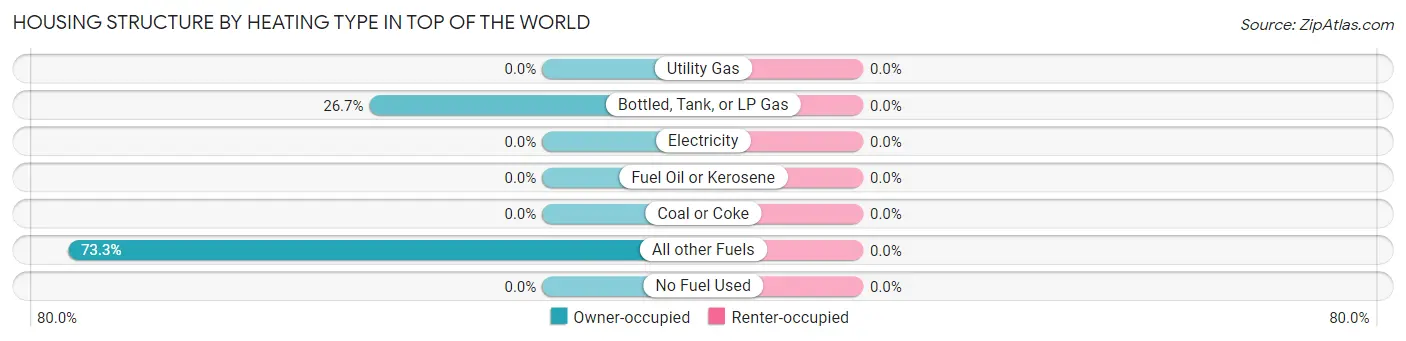
| Heating Type | Owner-occupied | Renter-occupied |
| Utility Gas | 0 (0.0%) | 0 (0.0%) |
| Bottled, Tank, or LP Gas | 43 (26.7%) | 0 (0.0%) |
| Electricity | 0 (0.0%) | 0 (0.0%) |
| Fuel Oil or Kerosene | 0 (0.0%) | 0 (0.0%) |
| Coal or Coke | 0 (0.0%) | 0 (0.0%) |
| All other Fuels | 118 (73.3%) | 0 (0.0%) |
| No Fuel Used | 0 (0.0%) | 0 (0.0%) |
| Total | 161 (100.0%) | 0 (0.0%) |
Household Vehicle Usage in Top of the World
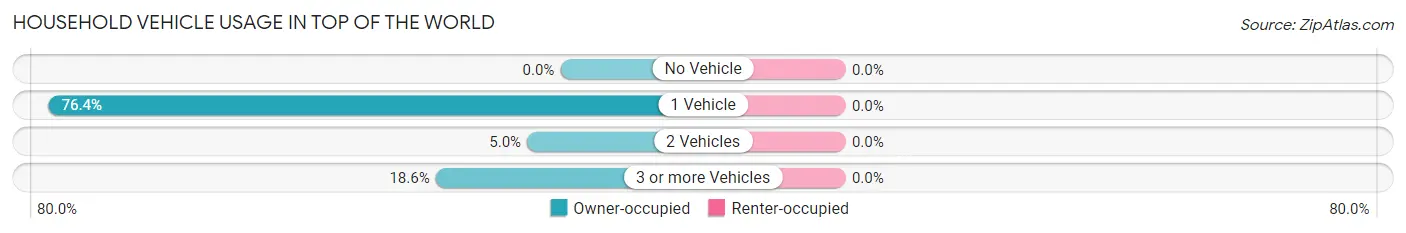
| Vehicles per Household | Owner-occupied | Renter-occupied |
| No Vehicle | 0 (0.0%) | 0 (0.0%) |
| 1 Vehicle | 123 (76.4%) | 0 (0.0%) |
| 2 Vehicles | 8 (5.0%) | 0 (0.0%) |
| 3 or more Vehicles | 30 (18.6%) | 0 (0.0%) |
| Total | 161 (100.0%) | 0 (0.0%) |
Real Estate & Mortgages in Top of the World
Real Estate and Mortgage Overview in Top of the World
| Characteristic | Without Mortgage | With Mortgage |
| Housing Units | 144 | 17 |
| Median Property Value | $9,999 | $0 |
| Median Household Income | - | - |
| Monthly Housing Costs | $99 | $0 |
| Real Estate Taxes | - | - |
Property Value by Mortgage Status in Top of the World
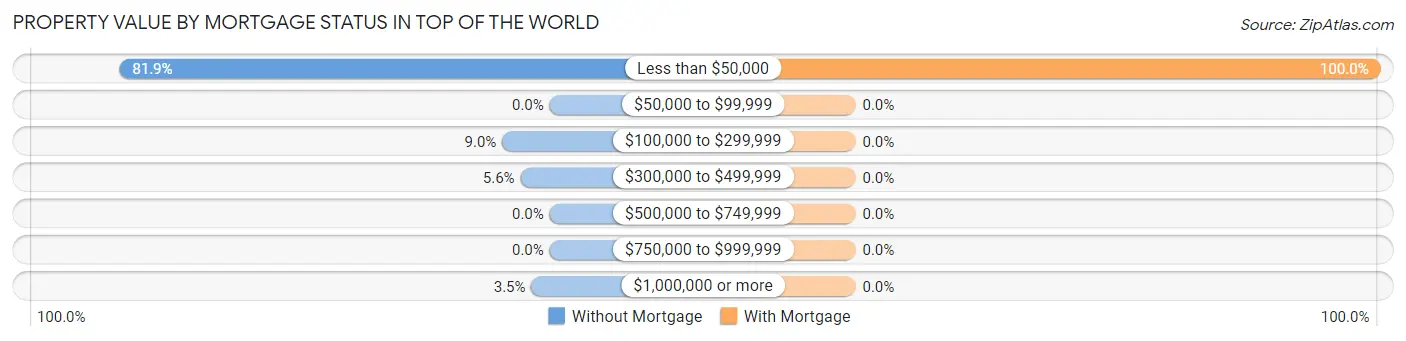
| Property Value | Without Mortgage | With Mortgage |
| Less than $50,000 | 118 (81.9%) | 17 (100.0%) |
| $50,000 to $99,999 | 0 (0.0%) | 0 (0.0%) |
| $100,000 to $299,999 | 13 (9.0%) | 0 (0.0%) |
| $300,000 to $499,999 | 8 (5.6%) | 0 (0.0%) |
| $500,000 to $749,999 | 0 (0.0%) | 0 (0.0%) |
| $750,000 to $999,999 | 0 (0.0%) | 0 (0.0%) |
| $1,000,000 or more | 5 (3.5%) | 0 (0.0%) |
| Total | 144 (100.0%) | 17 (100.0%) |
Household Income by Mortgage Status in Top of the World
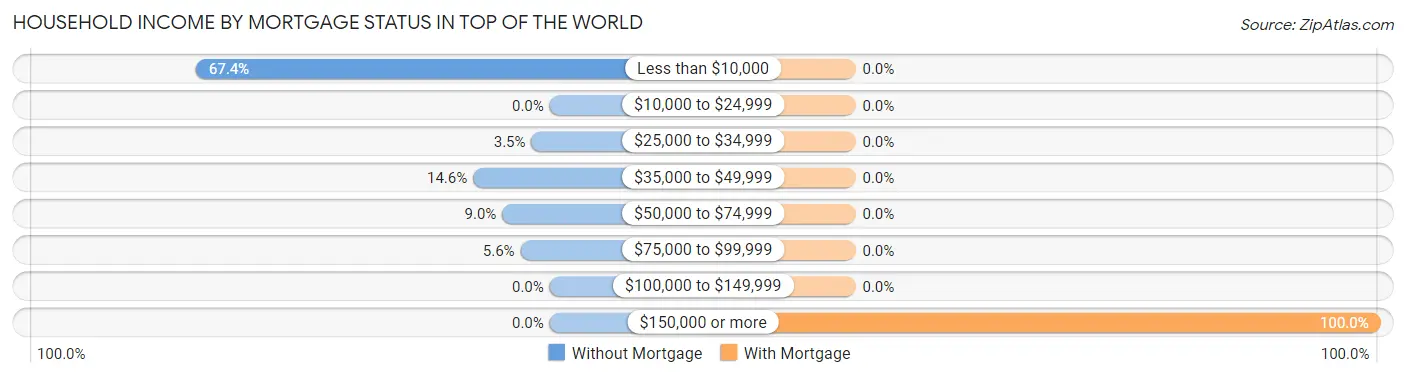
| Household Income | Without Mortgage | With Mortgage |
| Less than $10,000 | 97 (67.4%) | 0 (0.0%) |
| $10,000 to $24,999 | 0 (0.0%) | 0 (0.0%) |
| $25,000 to $34,999 | 5 (3.5%) | 0 (0.0%) |
| $35,000 to $49,999 | 21 (14.6%) | 0 (0.0%) |
| $50,000 to $74,999 | 13 (9.0%) | 0 (0.0%) |
| $75,000 to $99,999 | 8 (5.6%) | 0 (0.0%) |
| $100,000 to $149,999 | 0 (0.0%) | 0 (0.0%) |
| $150,000 or more | 0 (0.0%) | 17 (100.0%) |
| Total | 144 (100.0%) | 17 (100.0%) |
Property Value to Household Income Ratio in Top of the World
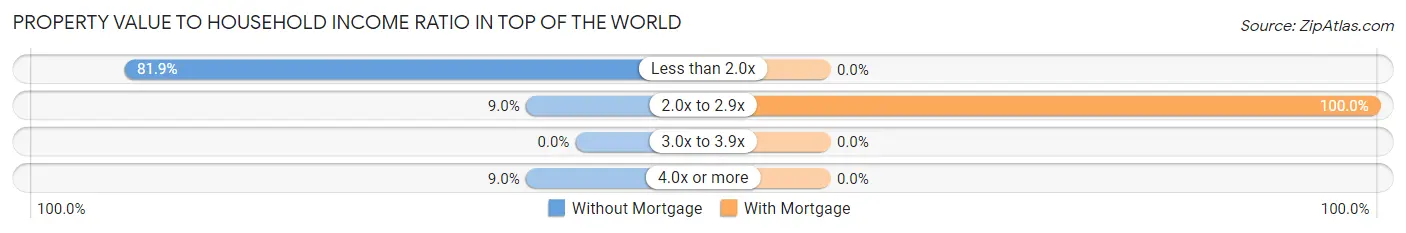
| Value-to-Income Ratio | Without Mortgage | With Mortgage |
| Less than 2.0x | 118 (81.9%) | 0 (0.0%) |
| 2.0x to 2.9x | 13 (9.0%) | 17 (100.0%) |
| 3.0x to 3.9x | 0 (0.0%) | 0 (0.0%) |
| 4.0x or more | 13 (9.0%) | 0 (0.0%) |
| Total | 144 (100.0%) | 17 (100.0%) |
Real Estate Taxes by Mortgage Status in Top of the World
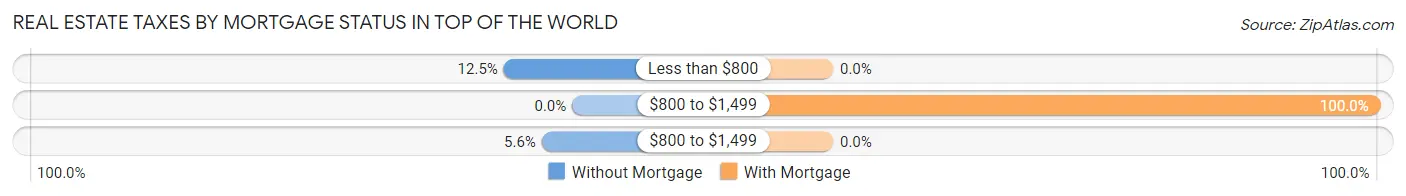
| Property Taxes | Without Mortgage | With Mortgage |
| Less than $800 | 18 (12.5%) | 0 (0.0%) |
| $800 to $1,499 | 0 (0.0%) | 17 (100.0%) |
| $800 to $1,499 | 8 (5.6%) | 0 (0.0%) |
| Total | 144 (100.0%) | 17 (100.0%) |
Health & Disability in Top of the World
Health Insurance Coverage by Age in Top of the World
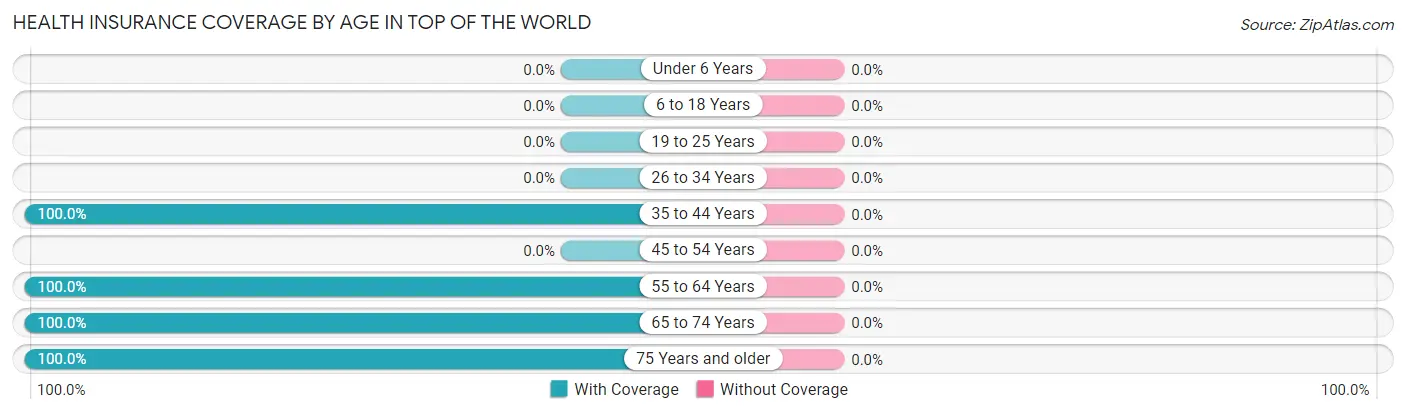
| Age Bracket | With Coverage | Without Coverage |
| Under 6 Years | 0 (0.0%) | 0 (0.0%) |
| 6 to 18 Years | 0 (0.0%) | 0 (0.0%) |
| 19 to 25 Years | 0 (0.0%) | 0 (0.0%) |
| 26 to 34 Years | 0 (0.0%) | 0 (0.0%) |
| 35 to 44 Years | 18 (100.0%) | 0 (0.0%) |
| 45 to 54 Years | 0 (0.0%) | 0 (0.0%) |
| 55 to 64 Years | 28 (100.0%) | 0 (0.0%) |
| 65 to 74 Years | 138 (100.0%) | 0 (0.0%) |
| 75 Years and older | 43 (100.0%) | 0 (0.0%) |
| Total | 227 (100.0%) | 0 (0.0%) |
Health Insurance Coverage by Citizenship Status in Top of the World
| Citizenship Status | With Coverage | Without Coverage |
| Native Born | 0 (0.0%) | 0 (0.0%) |
| Foreign Born, Citizen | 0 (0.0%) | 0 (0.0%) |
| Foreign Born, not a Citizen | 0 (0.0%) | 0 (0.0%) |
Health Insurance Coverage by Household Income in Top of the World
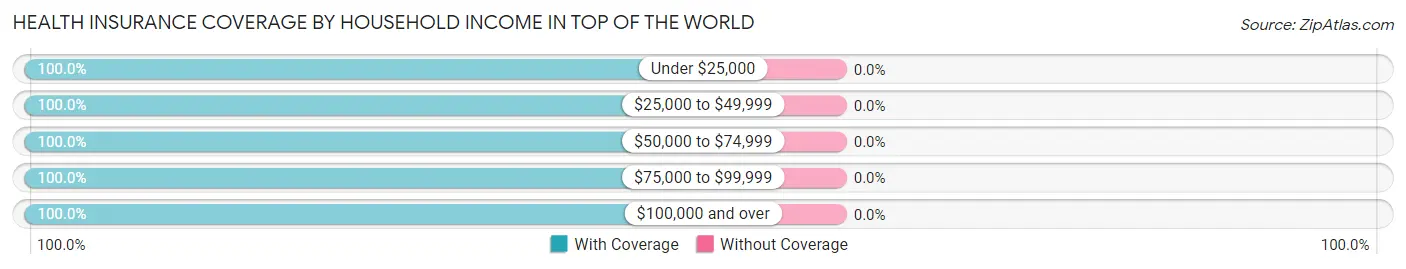
| Household Income | With Coverage | Without Coverage |
| Under $25,000 | 97 (100.0%) | 0 (0.0%) |
| $25,000 to $49,999 | 33 (100.0%) | 0 (0.0%) |
| $50,000 to $74,999 | 28 (100.0%) | 0 (0.0%) |
| $75,000 to $99,999 | 17 (100.0%) | 0 (0.0%) |
| $100,000 and over | 52 (100.0%) | 0 (0.0%) |
Public vs Private Health Insurance Coverage by Age in Top of the World
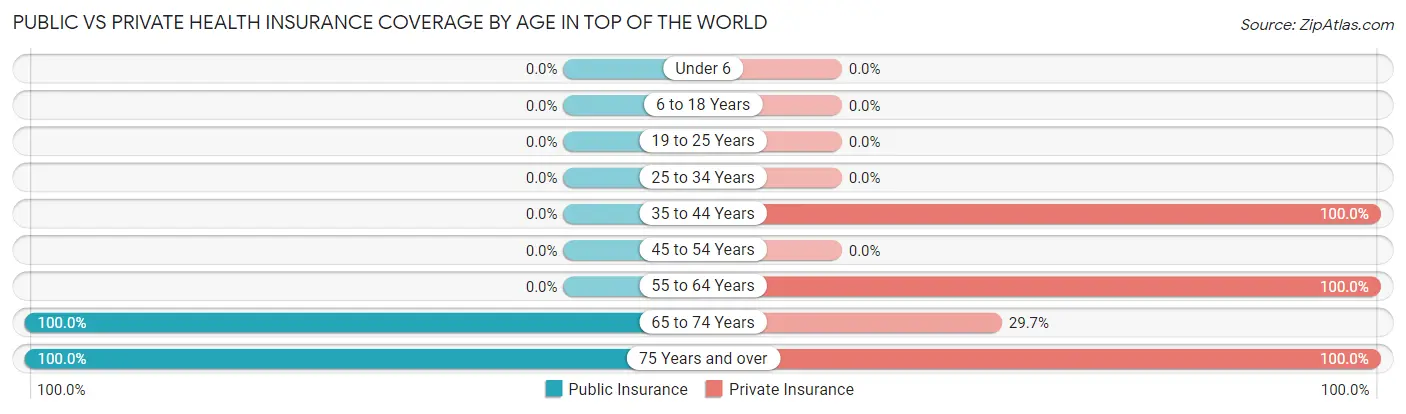
| Age Bracket | Public Insurance | Private Insurance |
| Under 6 | 0 (0.0%) | 0 (0.0%) |
| 6 to 18 Years | 0 (0.0%) | 0 (0.0%) |
| 19 to 25 Years | 0 (0.0%) | 0 (0.0%) |
| 25 to 34 Years | 0 (0.0%) | 0 (0.0%) |
| 35 to 44 Years | 0 (0.0%) | 18 (100.0%) |
| 45 to 54 Years | 0 (0.0%) | 0 (0.0%) |
| 55 to 64 Years | 0 (0.0%) | 28 (100.0%) |
| 65 to 74 Years | 138 (100.0%) | 41 (29.7%) |
| 75 Years and over | 43 (100.0%) | 43 (100.0%) |
| Total | 181 (79.7%) | 130 (57.3%) |
Disability Status by Sex by Age in Top of the World
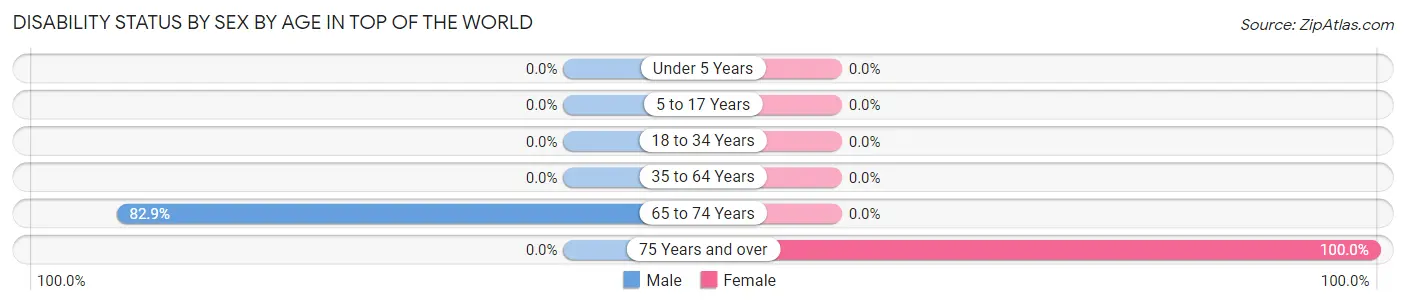
| Age Bracket | Male | Female |
| Under 5 Years | 0 (0.0%) | 0 (0.0%) |
| 5 to 17 Years | 0 (0.0%) | 0 (0.0%) |
| 18 to 34 Years | 0 (0.0%) | 0 (0.0%) |
| 35 to 64 Years | 0 (0.0%) | 0 (0.0%) |
| 65 to 74 Years | 102 (82.9%) | 0 (0.0%) |
| 75 Years and over | 0 (0.0%) | 17 (100.0%) |
Disability Class by Sex by Age in Top of the World
Disability Class: Hearing Difficulty
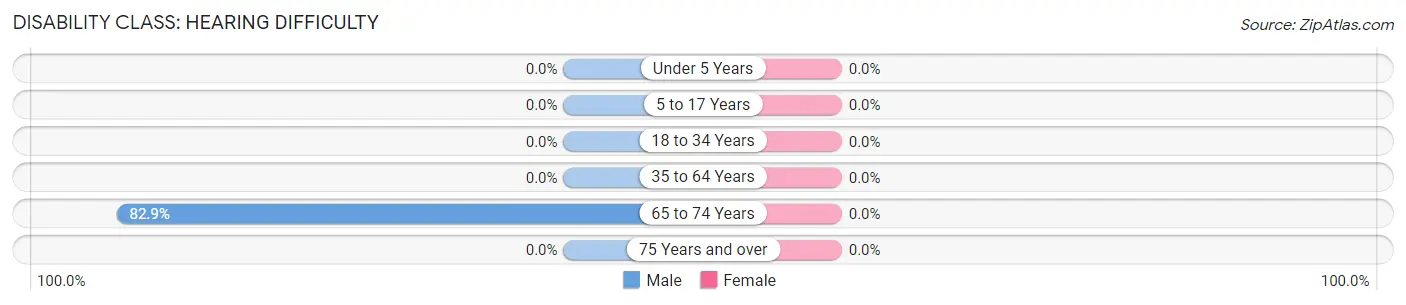
| Age Bracket | Male | Female |
| Under 5 Years | 0 (0.0%) | 0 (0.0%) |
| 5 to 17 Years | 0 (0.0%) | 0 (0.0%) |
| 18 to 34 Years | 0 (0.0%) | 0 (0.0%) |
| 35 to 64 Years | 0 (0.0%) | 0 (0.0%) |
| 65 to 74 Years | 102 (82.9%) | 0 (0.0%) |
| 75 Years and over | 0 (0.0%) | 0 (0.0%) |
Disability Class: Vision Difficulty
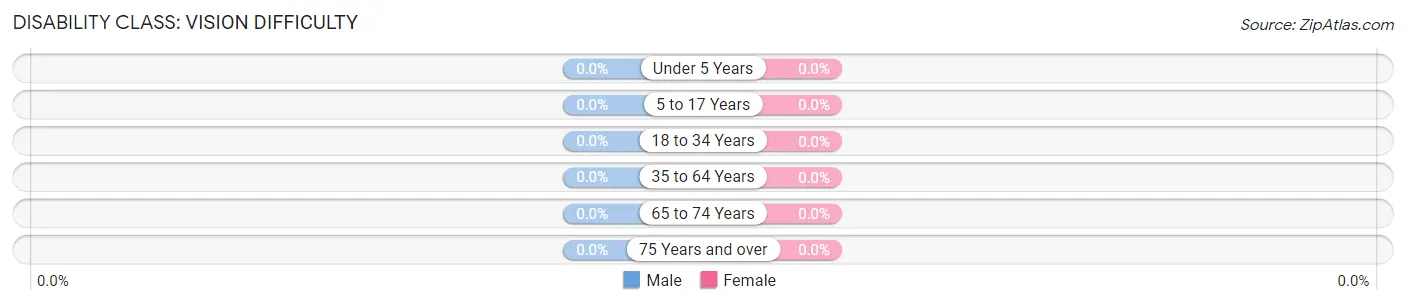
| Age Bracket | Male | Female |
| Under 5 Years | 0 (0.0%) | 0 (0.0%) |
| 5 to 17 Years | 0 (0.0%) | 0 (0.0%) |
| 18 to 34 Years | 0 (0.0%) | 0 (0.0%) |
| 35 to 64 Years | 0 (0.0%) | 0 (0.0%) |
| 65 to 74 Years | 0 (0.0%) | 0 (0.0%) |
| 75 Years and over | 0 (0.0%) | 0 (0.0%) |
Disability Class: Cognitive Difficulty
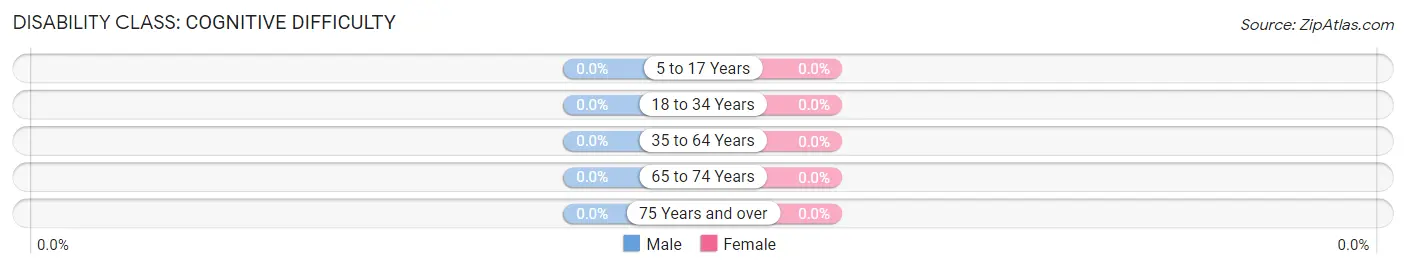
| Age Bracket | Male | Female |
| 5 to 17 Years | 0 (0.0%) | 0 (0.0%) |
| 18 to 34 Years | 0 (0.0%) | 0 (0.0%) |
| 35 to 64 Years | 0 (0.0%) | 0 (0.0%) |
| 65 to 74 Years | 0 (0.0%) | 0 (0.0%) |
| 75 Years and over | 0 (0.0%) | 0 (0.0%) |
Disability Class: Ambulatory Difficulty
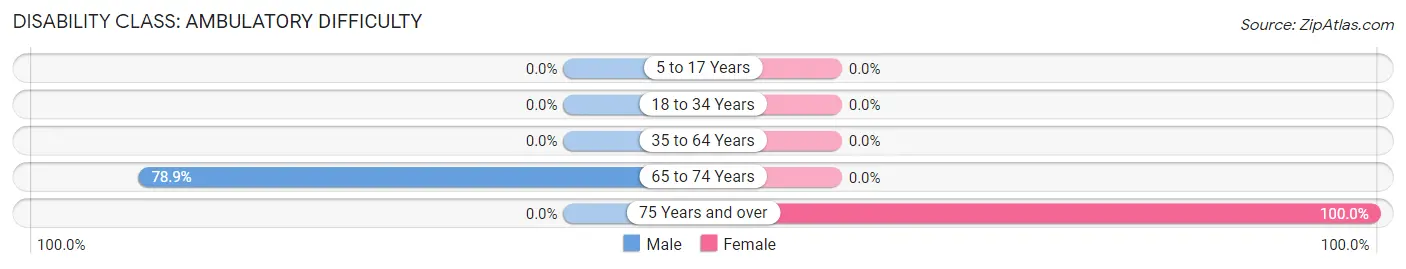
| Age Bracket | Male | Female |
| 5 to 17 Years | 0 (0.0%) | 0 (0.0%) |
| 18 to 34 Years | 0 (0.0%) | 0 (0.0%) |
| 35 to 64 Years | 0 (0.0%) | 0 (0.0%) |
| 65 to 74 Years | 97 (78.9%) | 0 (0.0%) |
| 75 Years and over | 0 (0.0%) | 17 (100.0%) |
Disability Class: Self-Care Difficulty
| Age Bracket | Male | Female |
| 5 to 17 Years | 0 (0.0%) | 0 (0.0%) |
| 18 to 34 Years | 0 (0.0%) | 0 (0.0%) |
| 35 to 64 Years | 0 (0.0%) | 0 (0.0%) |
| 65 to 74 Years | 0 (0.0%) | 0 (0.0%) |
| 75 Years and over | 0 (0.0%) | 0 (0.0%) |
Technology Access in Top of the World
Computing Device Access in Top of the World
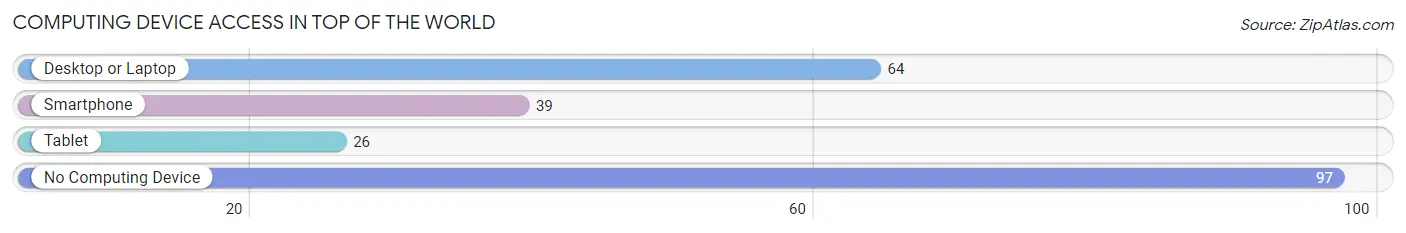
| Device Type | # Households | % Households |
| Desktop or Laptop | 64 | 39.8% |
| Smartphone | 39 | 24.2% |
| Tablet | 26 | 16.2% |
| No Computing Device | 97 | 60.3% |
| Total | 161 | 100.0% |
Internet Access in Top of the World
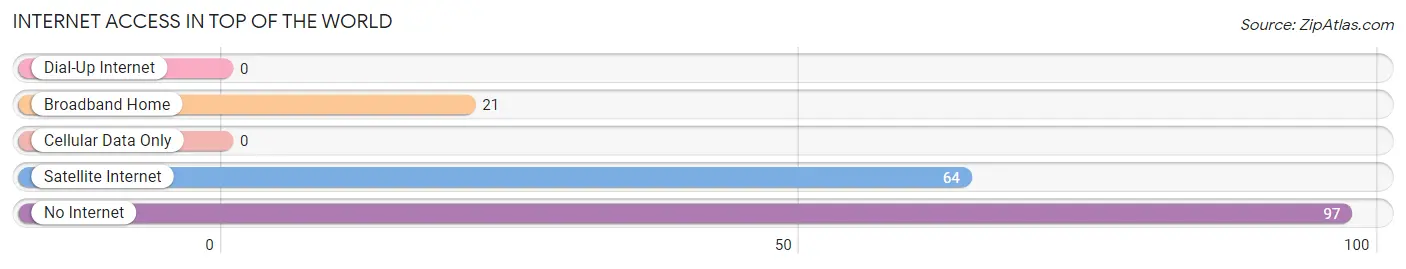
| Internet Type | # Households | % Households |
| Dial-Up Internet | 0 | 0.0% |
| Broadband Home | 21 | 13.0% |
| Cellular Data Only | 0 | 0.0% |
| Satellite Internet | 64 | 39.8% |
| No Internet | 97 | 60.3% |
| Total | 161 | 100.0% |
Top of the World Summary
Top of the World is an unincorporated community located in the White Mountains of Arizona. It is situated at an elevation of 8,000 feet and is surrounded by the Apache-Sitgreaves National Forest. The community is located in Navajo County and is approximately 30 miles from the city of Show Low.
History
The area around Top of the World was first settled in the late 1800s by ranchers and miners. The first post office was established in the area in 1891 and the community was officially named Top of the World in 1895. The name was chosen to reflect the high elevation of the area.
In the early 1900s, the area was home to a number of small mining operations. The most successful of these was the Top of the World Mine, which was established in 1906. The mine produced copper, lead, and zinc until it closed in the 1930s.
In the 1950s, the area around Top of the World began to be developed as a recreational area. The first ski resort in the area, Sunrise Ski Park, opened in 1959. The resort is still in operation today and is the closest ski resort to the Phoenix metropolitan area.
Geography
Top of the World is located in the White Mountains of Arizona. The area is characterized by high elevation and rugged terrain. The highest point in the area is the summit of Mount Baldy, which is 11,403 feet above sea level.
The climate in the area is generally cool and dry. Summers are mild with temperatures rarely exceeding 80 degrees Fahrenheit. Winters are cold with temperatures often dropping below freezing.
Economy
The economy of Top of the World is largely based on tourism. The area is a popular destination for outdoor recreation, particularly skiing and snowboarding. The Sunrise Ski Park is the main attraction in the area and is the closest ski resort to the Phoenix metropolitan area.
In addition to skiing and snowboarding, the area is also popular for camping, hiking, fishing, and hunting. The Apache-Sitgreaves National Forest provides a variety of recreational opportunities for visitors.
Demographics
As of the 2010 census, the population of Top of the World was 1,093. The population is predominantly white (94.3%) with a small Hispanic population (3.2%). The median household income in the area is $45,000. The median age is 44.7 years.
Conclusion
Top of the World is an unincorporated community located in the White Mountains of Arizona. It is situated at an elevation of 8,000 feet and is surrounded by the Apache-Sitgreaves National Forest. The economy of the area is largely based on tourism, with the Sunrise Ski Park being the main attraction. The population of the area is predominantly white with a median household income of $45,000.
Common Questions
What is Per Capita Income in Top of the World?
Per Capita income in Top of the World is $24,391.
What is the Median Family Income in Top of the World?
Median Family Income in Top of the World is $68,015.
What is Inequality or Gini Index in Top of the World?
Inequality or Gini Index in Top of the World is 0.52.
What is the Total Population of Top of the World?
Total Population of Top of the World is 227.
What is the Total Male Population of Top of the World?
Total Male Population of Top of the World is 164.
What is the Total Female Population of Top of the World?
Total Female Population of Top of the World is 63.
What is the Ratio of Males per 100 Females in Top of the World?
There are 260.32 Males per 100 Females in Top of the World.
What is the Ratio of Females per 100 Males in Top of the World?
There are 38.41 Females per 100 Males in Top of the World.
What is the Median Population Age in Top of the World?
Median Population Age in Top of the World is 71.5 Years.
What is the Average Family Size in Top of the World
Average Family Size in Top of the World is 2.1 People.
What is the Average Household Size in Top of the World
Average Household Size in Top of the World is 1.4 People.
How Large is the Labor Force in Top of the World?
There are 35 People in the Labor Forcein in Top of the World.
What is the Percentage of People in the Labor Force in Top of the World?
15.4% of People are in the Labor Force in Top of the World.