Zip Codes with the Highest Percentage of Population Employed in Health Diagnosing & Treating in the United States
RELATED REPORTS & OPTIONS
Health Diagnosing & Treating
United States
Compare Zip Codes
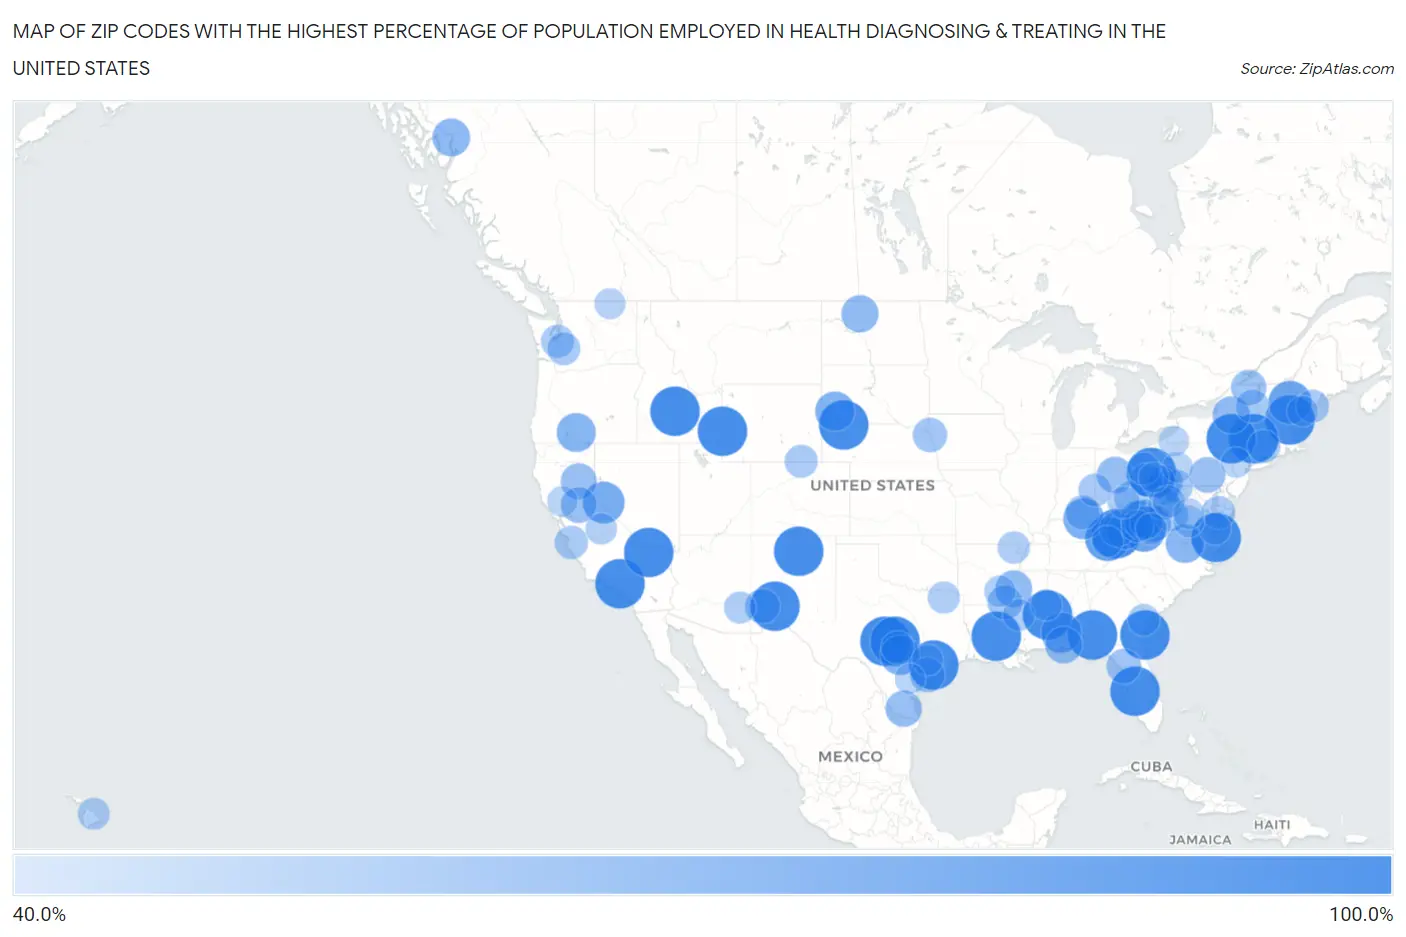
Map of Zip Codes with the Highest Percentage of Population Employed in Health Diagnosing & Treating in the United States
40.0%
100.0%
Zip Codes with the Highest Percentage of Population Employed in Health Diagnosing & Treating in the United States
| Zip Code | % Employed | vs State | vs National | |
| 1. | 87931 | 100.0% | 5.9%(+94.1)#1 | 6.2%(+93.8)#1 |
| 2. | 23708 | 100.0% | 5.7%(+94.3)#1 | 6.2%(+93.8)#2 |
| 3. | 87543 | 100.0% | 5.9%(+94.1)#2 | 6.2%(+93.8)#3 |
| 4. | 31561 | 100.0% | 5.7%(+94.3)#1 | 6.2%(+93.8)#4 |
| 5. | 83119 | 100.0% | 5.9%(+94.1)#1 | 6.2%(+93.8)#5 |
| 6. | 91046 | 100.0% | 5.3%(+94.7)#1 | 6.2%(+93.8)#6 |
| 7. | 03291 | 100.0% | 6.7%(+93.3)#1 | 6.2%(+93.8)#7 |
| 8. | 77443 | 100.0% | 5.5%(+94.5)#1 | 6.2%(+93.8)#8 |
| 9. | 40844 | 100.0% | 7.2%(+92.8)#1 | 6.2%(+93.8)#9 |
| 10. | 43925 | 100.0% | 7.2%(+92.8)#1 | 6.2%(+93.8)#10 |
| 11. | 71320 | 100.0% | 7.2%(+92.8)#1 | 6.2%(+93.8)#11 |
| 12. | 76848 | 100.0% | 5.5%(+94.5)#2 | 6.2%(+93.8)#12 |
| 13. | 76885 | 100.0% | 5.5%(+94.5)#3 | 6.2%(+93.8)#13 |
| 14. | 33835 | 100.0% | 6.4%(+93.6)#1 | 6.2%(+93.8)#14 |
| 15. | 36901 | 100.0% | 7.0%(+93.0)#1 | 6.2%(+93.8)#15 |
| 16. | 12544 | 100.0% | 6.6%(+93.4)#1 | 6.2%(+93.8)#16 |
| 17. | 92384 | 100.0% | 5.3%(+94.7)#2 | 6.2%(+93.8)#17 |
| 18. | 69365 | 100.0% | 6.2%(+93.8)#1 | 6.2%(+93.8)#18 |
| 19. | 13847 | 100.0% | 6.6%(+93.4)#2 | 6.2%(+93.8)#19 |
| 20. | 83354 | 100.0% | 5.6%(+94.4)#1 | 6.2%(+93.8)#20 |
| 21. | 39832 | 100.0% | 5.7%(+94.3)#2 | 6.2%(+93.8)#21 |
| 22. | 40921 | 84.6% | 7.2%(+77.4)#2 | 6.2%(+78.4)#22 |
| 23. | 24606 | 81.0% | 5.7%(+75.4)#2 | 6.2%(+74.8)#23 |
| 24. | 03847 | 80.8% | 6.7%(+74.1)#2 | 6.2%(+74.6)#24 |
| 25. | 89430 | 76.2% | 4.9%(+71.3)#1 | 6.2%(+69.9)#25 |
| 26. | 40110 | 73.5% | 7.2%(+66.3)#3 | 6.2%(+67.3)#26 |
| 27. | 36454 | 72.0% | 7.0%(+65.0)#2 | 6.2%(+65.8)#27 |
| 28. | 25174 | 71.7% | 8.0%(+63.7)#1 | 6.2%(+65.4)#28 |
| 29. | 78027 | 70.5% | 5.5%(+64.9)#4 | 6.2%(+64.2)#29 |
| 30. | 57738 | 69.5% | 7.5%(+61.9)#1 | 6.2%(+63.2)#30 |
| 31. | 97621 | 68.2% | 6.1%(+62.1)#1 | 6.2%(+61.9)#31 |
| 32. | 27584 | 66.7% | 6.4%(+60.2)#1 | 6.2%(+60.4)#32 |
| 33. | 99923 | 64.0% | 5.8%(+58.2)#1 | 6.2%(+57.8)#33 |
| 34. | 58705 | 62.5% | 7.6%(+54.9)#1 | 6.2%(+56.3)#34 |
| 35. | 13301 | 62.5% | 6.6%(+55.9)#3 | 6.2%(+56.3)#35 |
| 36. | 24981 | 62.1% | 8.0%(+54.1)#2 | 6.2%(+55.8)#36 |
| 37. | 32530 | 61.9% | 6.4%(+55.5)#2 | 6.2%(+55.7)#37 |
| 38. | 38738 | 61.4% | 7.8%(+53.5)#1 | 6.2%(+55.1)#38 |
| 39. | 41835 | 60.1% | 7.2%(+52.9)#4 | 6.2%(+53.9)#39 |
| 40. | 78563 | 60.0% | 5.5%(+54.5)#5 | 6.2%(+53.8)#40 |
| 41. | 43007 | 60.0% | 7.2%(+52.8)#2 | 6.2%(+53.8)#41 |
| 42. | 41367 | 59.5% | 7.2%(+52.3)#5 | 6.2%(+53.2)#42 |
| 43. | 25047 | 59.3% | 8.0%(+51.2)#3 | 6.2%(+53.0)#43 |
| 44. | 95984 | 58.7% | 5.3%(+53.4)#3 | 6.2%(+52.5)#44 |
| 45. | 95671 | 58.3% | 5.3%(+53.0)#4 | 6.2%(+52.1)#45 |
| 46. | 17093 | 58.2% | 7.4%(+50.8)#1 | 6.2%(+51.9)#46 |
| 47. | 25848 | 57.1% | 8.0%(+49.1)#4 | 6.2%(+50.9)#47 |
| 48. | 15447 | 57.0% | 7.4%(+49.6)#2 | 6.2%(+50.7)#48 |
| 49. | 12915 | 56.7% | 6.6%(+50.1)#4 | 6.2%(+50.4)#49 |
| 50. | 88053 | 55.6% | 5.9%(+49.6)#3 | 6.2%(+49.3)#50 |
| 51. | 77991 | 55.3% | 5.5%(+49.8)#6 | 6.2%(+49.1)#51 |
| 52. | 38731 | 55.0% | 7.8%(+47.2)#2 | 6.2%(+48.8)#52 |
| 53. | 32683 | 54.7% | 6.4%(+48.2)#3 | 6.2%(+48.4)#53 |
| 54. | 51111 | 54.2% | 6.2%(+48.1)#1 | 6.2%(+48.0)#54 |
| 55. | 26546 | 53.2% | 8.0%(+45.2)#5 | 6.2%(+46.9)#55 |
| 56. | 40041 | 52.9% | 7.2%(+45.7)#6 | 6.2%(+46.7)#56 |
| 57. | 45741 | 52.1% | 7.2%(+44.9)#3 | 6.2%(+45.8)#57 |
| 58. | 12872 | 51.5% | 6.6%(+44.9)#5 | 6.2%(+45.2)#58 |
| 59. | 24432 | 51.2% | 5.7%(+45.5)#3 | 6.2%(+45.0)#59 |
| 60. | 93962 | 50.8% | 5.3%(+45.5)#5 | 6.2%(+44.5)#60 |
| 61. | 98430 | 50.0% | 5.6%(+44.4)#1 | 6.2%(+43.8)#61 |
| 62. | 15562 | 50.0% | 7.4%(+42.6)#3 | 6.2%(+43.8)#62 |
| 63. | 47010 | 50.0% | 6.6%(+43.4)#1 | 6.2%(+43.8)#63 |
| 64. | 82084 | 50.0% | 5.9%(+44.1)#2 | 6.2%(+43.8)#64 |
| 65. | 78675 | 50.0% | 5.5%(+44.5)#7 | 6.2%(+43.8)#65 |
| 66. | 06022 | 50.0% | 6.7%(+43.3)#1 | 6.2%(+43.8)#66 |
| 67. | 15353 | 50.0% | 7.4%(+42.6)#4 | 6.2%(+43.8)#67 |
| 68. | 04541 | 50.0% | 6.8%(+43.2)#1 | 6.2%(+43.8)#68 |
| 69. | 21675 | 50.0% | 6.2%(+43.8)#1 | 6.2%(+43.8)#69 |
| 70. | 98330 | 50.0% | 5.6%(+44.4)#2 | 6.2%(+43.8)#70 |
| 71. | 43736 | 50.0% | 7.2%(+42.8)#4 | 6.2%(+43.8)#71 |
| 72. | 26293 | 49.7% | 8.0%(+41.7)#6 | 6.2%(+43.5)#72 |
| 73. | 44671 | 48.7% | 7.2%(+41.6)#5 | 6.2%(+42.5)#73 |
| 74. | 25911 | 48.5% | 8.0%(+40.5)#7 | 6.2%(+42.2)#74 |
| 75. | 24845 | 48.0% | 8.0%(+40.0)#8 | 6.2%(+41.8)#75 |
| 76. | 72435 | 47.8% | 7.2%(+40.6)#1 | 6.2%(+41.5)#76 |
| 77. | 26254 | 47.4% | 8.0%(+39.4)#9 | 6.2%(+41.1)#77 |
| 78. | 75450 | 47.3% | 5.5%(+41.8)#8 | 6.2%(+41.1)#78 |
| 79. | 23056 | 47.1% | 5.7%(+41.5)#4 | 6.2%(+40.9)#79 |
| 80. | 39174 | 46.9% | 7.8%(+39.1)#3 | 6.2%(+40.7)#80 |
| 81. | 85531 | 46.9% | 5.9%(+41.0)#1 | 6.2%(+40.6)#81 |
| 82. | 45677 | 46.7% | 7.2%(+39.5)#6 | 6.2%(+40.4)#82 |
| 83. | 96710 | 46.6% | 5.7%(+40.9)#1 | 6.2%(+40.4)#83 |
| 84. | 31318 | 46.6% | 5.7%(+40.8)#3 | 6.2%(+40.3)#84 |
| 85. | 93604 | 45.5% | 5.3%(+40.2)#6 | 6.2%(+39.3)#85 |
| 86. | 40763 | 45.5% | 7.2%(+38.2)#7 | 6.2%(+39.2)#86 |
| 87. | 71677 | 45.5% | 7.2%(+38.3)#2 | 6.2%(+39.2)#87 |
| 88. | 35477 | 45.2% | 7.0%(+38.1)#3 | 6.2%(+38.9)#88 |
| 89. | 23055 | 45.1% | 5.7%(+39.4)#5 | 6.2%(+38.9)#89 |
| 90. | 24093 | 45.1% | 5.7%(+39.4)#6 | 6.2%(+38.9)#90 |
| 91. | 78943 | 44.0% | 5.5%(+38.5)#9 | 6.2%(+37.8)#91 |
| 92. | 22972 | 43.8% | 5.7%(+38.1)#7 | 6.2%(+37.5)#92 |
| 93. | 98859 | 43.7% | 5.6%(+38.1)#3 | 6.2%(+37.4)#93 |
| 94. | 04109 | 43.3% | 6.8%(+36.5)#2 | 6.2%(+37.1)#94 |
| 95. | 15734 | 43.2% | 7.4%(+35.8)#5 | 6.2%(+36.9)#95 |
| 96. | 78142 | 42.9% | 5.5%(+37.3)#10 | 6.2%(+36.6)#96 |
| 97. | 07846 | 42.9% | 6.2%(+36.6)#1 | 6.2%(+36.6)#97 |
| 98. | 14742 | 42.5% | 6.6%(+35.9)#6 | 6.2%(+36.3)#98 |
| 99. | 26058 | 42.5% | 8.0%(+34.5)#10 | 6.2%(+36.2)#99 |
| 100. | 95679 | 42.3% | 5.3%(+37.0)#7 | 6.2%(+36.1)#100 |
Common Questions
What are the Top 10 Zip Codes with the Highest Percentage of Population Employed in Health Diagnosing & Treating in the United States?
Top 10 Zip Codes with the Highest Percentage of Population Employed in Health Diagnosing & Treating in the United States are:
#1
100.0%
#2
100.0%
#3
100.0%
#4
100.0%
#5
100.0%
#6
100.0%
#7
100.0%
#8
100.0%
#9
100.0%
#10
100.0%
What zip code has the Highest Percentage of Population Employed in Health Diagnosing & Treating in the United States?
87931 has the Highest Percentage of Population Employed in Health Diagnosing & Treating in the United States with 100.0%.
What is the Percentage of Population Employed in Health Diagnosing & Treating in the United States?
Percentage of Population Employed in Health Diagnosing & Treating in the United States is 6.2%.