Vanderbilt, TX Map & Demographics
Vanderbilt Map
Vanderbilt Overview
$25,547
PER CAPITA INCOME
$119,531
AVG FAMILY INCOME
$119,531
AVG HOUSEHOLD INCOME
0.16
INEQUALITY / GINI INDEX
526
TOTAL POPULATION
267
MALE POPULATION
259
FEMALE POPULATION
103.09
MALES / 100 FEMALES
97.00
FEMALES / 100 MALES
18.4
MEDIAN AGE
5.4
AVG FAMILY SIZE
5.4
AVG HOUSEHOLD SIZE
227
LABOR FORCE [ PEOPLE ]
85.0%
PERCENT IN LABOR FORCE
21.1%
UNEMPLOYMENT RATE
Vanderbilt Zip Codes
Vanderbilt Area Codes
Income in Vanderbilt
Income Overview in Vanderbilt
Per Capita Income in Vanderbilt is $25,547, while median incomes of families and households are $119,531 and $119,531 respectively.
| Characteristic | Number | Measure |
| Per Capita Income | 526 | $25,547 |
| Median Family Income | 98 | $119,531 |
| Mean Family Income | 98 | $129,302 |
| Median Household Income | 98 | $119,531 |
| Mean Household Income | 98 | $129,302 |
| Income Deficit | 98 | $0 |
| Wage / Income Gap (%) | 526 | 0.00% |
| Wage / Income Gap ($) | 526 | 100.00¢ per $1 |
| Gini / Inequality Index | 526 | 0.16 |
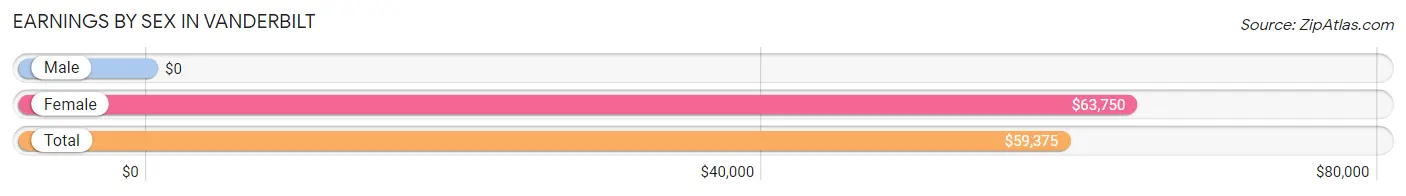
Earnings by Sex in Vanderbilt
| Sex | Number | Average Earnings |
| Male | 90 (44.6%) | $0 |
| Female | 112 (55.4%) | $63,750 |
| Total | 202 (100.0%) | $59,375 |
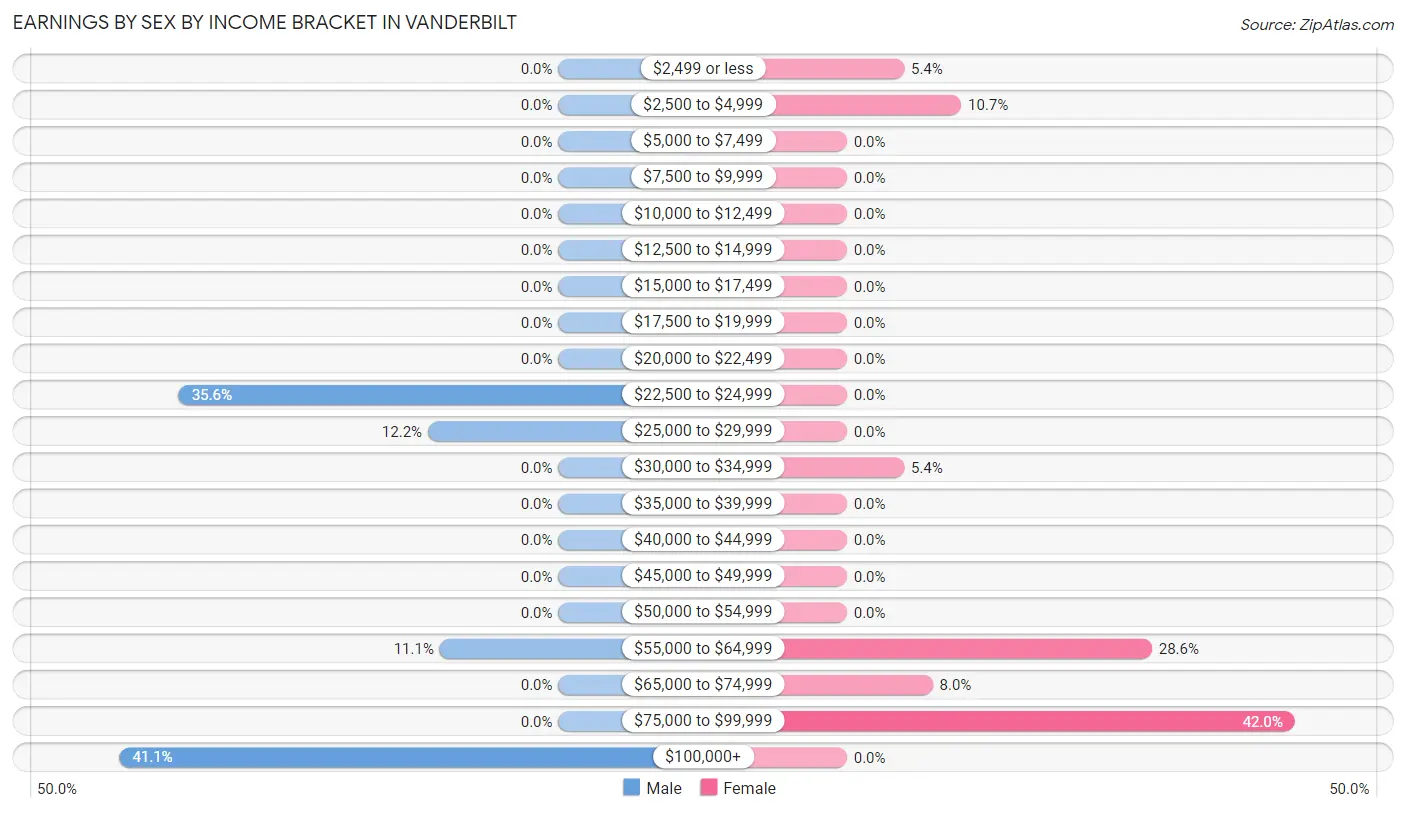
Earnings by Sex by Income Bracket in Vanderbilt
The most common earnings brackets in Vanderbilt are $100,000+ for men (37 | 41.1%) and $75,000 to $99,999 for women (47 | 42.0%).
| Income | Male | Female |
| $2,499 or less | 0 (0.0%) | 6 (5.4%) |
| $2,500 to $4,999 | 0 (0.0%) | 12 (10.7%) |
| $5,000 to $7,499 | 0 (0.0%) | 0 (0.0%) |
| $7,500 to $9,999 | 0 (0.0%) | 0 (0.0%) |
| $10,000 to $12,499 | 0 (0.0%) | 0 (0.0%) |
| $12,500 to $14,999 | 0 (0.0%) | 0 (0.0%) |
| $15,000 to $17,499 | 0 (0.0%) | 0 (0.0%) |
| $17,500 to $19,999 | 0 (0.0%) | 0 (0.0%) |
| $20,000 to $22,499 | 0 (0.0%) | 0 (0.0%) |
| $22,500 to $24,999 | 32 (35.6%) | 0 (0.0%) |
| $25,000 to $29,999 | 11 (12.2%) | 0 (0.0%) |
| $30,000 to $34,999 | 0 (0.0%) | 6 (5.4%) |
| $35,000 to $39,999 | 0 (0.0%) | 0 (0.0%) |
| $40,000 to $44,999 | 0 (0.0%) | 0 (0.0%) |
| $45,000 to $49,999 | 0 (0.0%) | 0 (0.0%) |
| $50,000 to $54,999 | 0 (0.0%) | 0 (0.0%) |
| $55,000 to $64,999 | 10 (11.1%) | 32 (28.6%) |
| $65,000 to $74,999 | 0 (0.0%) | 9 (8.0%) |
| $75,000 to $99,999 | 0 (0.0%) | 47 (42.0%) |
| $100,000+ | 37 (41.1%) | 0 (0.0%) |
| Total | 90 (100.0%) | 112 (100.0%) |
Earnings by Sex by Educational Attainment in Vanderbilt
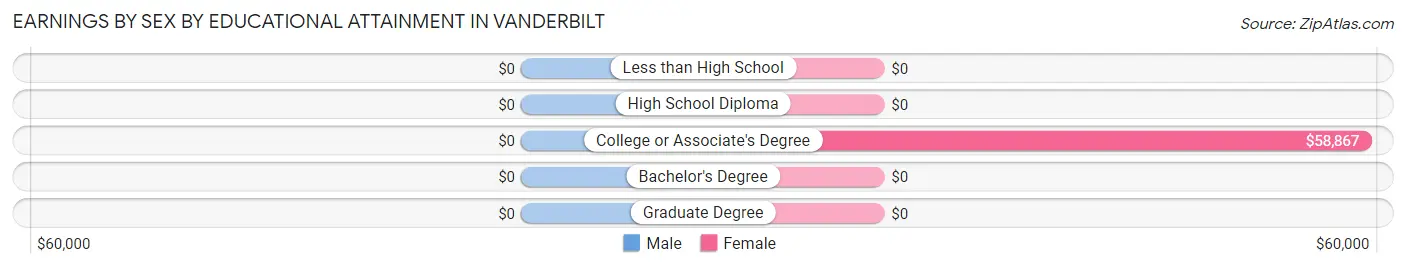
| Educational Attainment | Male Income | Female Income |
| Less than High School | - | - |
| High School Diploma | - | - |
| College or Associate's Degree | - | - |
| Bachelor's Degree | - | - |
| Graduate Degree | - | - |
| Total | - | - |
Family Income in Vanderbilt
Family Income Brackets in Vanderbilt
According to the Vanderbilt family income data, there are 43 families falling into the $150,000 to $199,999 income range, which is the most common income bracket and makes up 43.9% of all families.
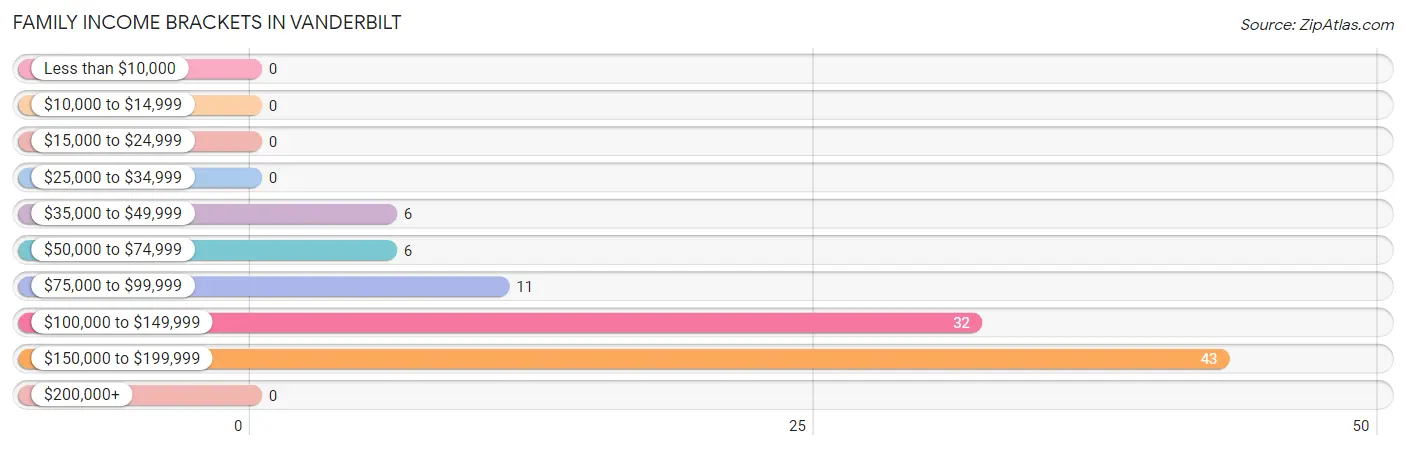
| Income Bracket | # Families | % Families |
| Less than $10,000 | 0 | 0.0% |
| $10,000 to $14,999 | 0 | 0.0% |
| $15,000 to $24,999 | 0 | 0.0% |
| $25,000 to $34,999 | 0 | 0.0% |
| $35,000 to $49,999 | 6 | 6.1% |
| $50,000 to $74,999 | 6 | 6.1% |
| $75,000 to $99,999 | 11 | 11.2% |
| $100,000 to $149,999 | 32 | 32.7% |
| $150,000 to $199,999 | 43 | 43.9% |
| $200,000+ | 0 | 0.0% |
Family Income by Famaliy Size in Vanderbilt
4-person families (70 | 71.4%) account for the highest median family income in Vanderbilt with $119,766 per family, while 4-person families (70 | 71.4%) have the highest median income of $29,942 per family member.
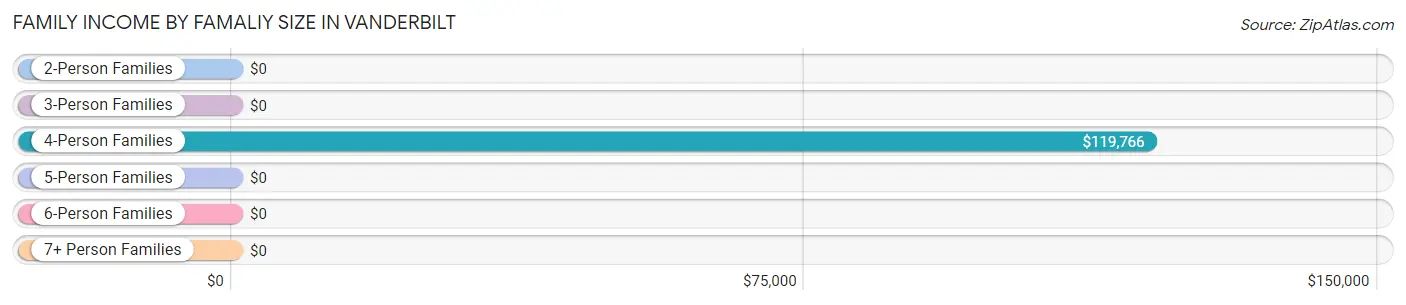
| Income Bracket | # Families | Median Income |
| 2-Person Families | 11 (11.2%) | $0 |
| 3-Person Families | 17 (17.3%) | $0 |
| 4-Person Families | 70 (71.4%) | $119,766 |
| 5-Person Families | 0 (0.0%) | $0 |
| 6-Person Families | 0 (0.0%) | $0 |
| 7+ Person Families | 0 (0.0%) | $0 |
| Total | 98 (100.0%) | $119,531 |
Family Income by Number of Earners in Vanderbilt
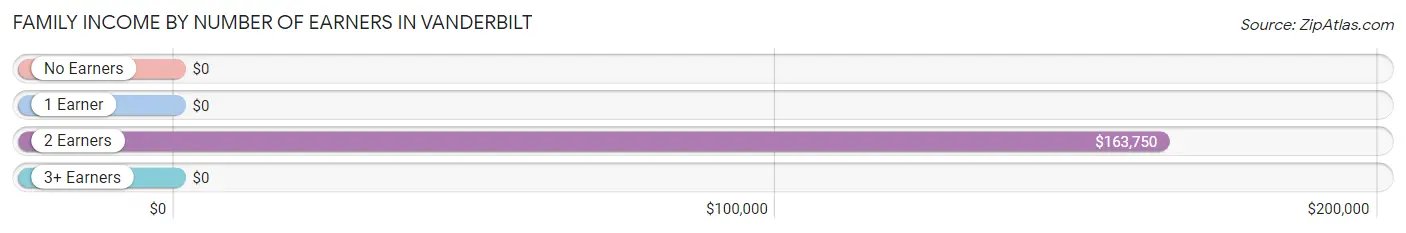
| Number of Earners | # Families | Median Income |
| No Earners | 0 (0.0%) | $0 |
| 1 Earner | 17 (17.3%) | $0 |
| 2 Earners | 75 (76.5%) | $163,750 |
| 3+ Earners | 6 (6.1%) | $0 |
| Total | 98 (100.0%) | $119,531 |
Household Income in Vanderbilt
Household Income Brackets in Vanderbilt
With 43 households falling in the category, the $150,000 to $199,999 income range is the most frequent in Vanderbilt, accounting for 43.9% of all households.
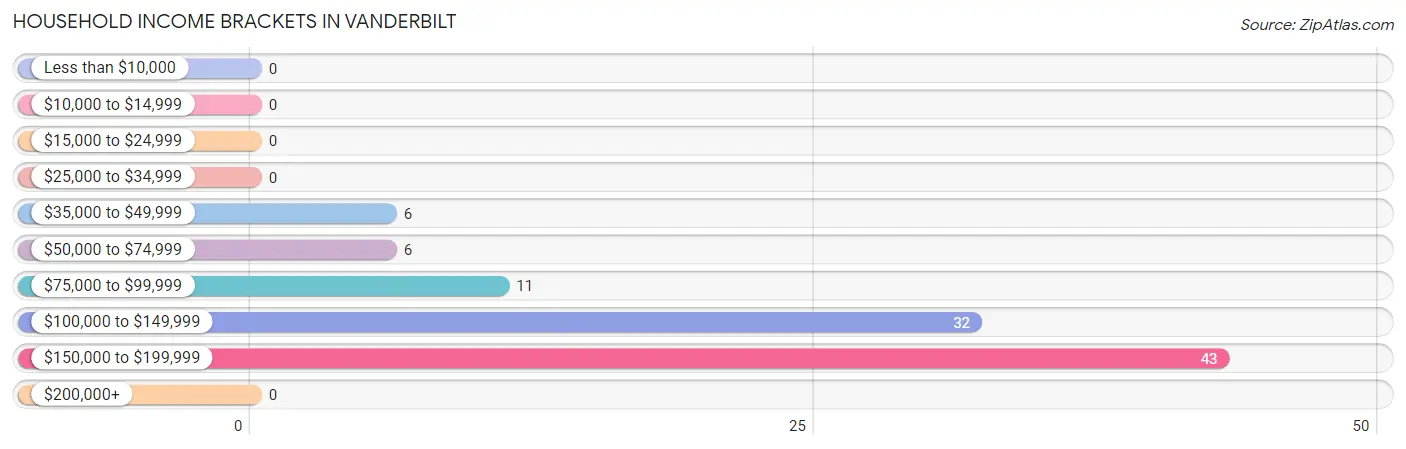
| Income Bracket | # Households | % Households |
| Less than $10,000 | 0 | 0.0% |
| $10,000 to $14,999 | 0 | 0.0% |
| $15,000 to $24,999 | 0 | 0.0% |
| $25,000 to $34,999 | 0 | 0.0% |
| $35,000 to $49,999 | 6 | 6.1% |
| $50,000 to $74,999 | 6 | 6.1% |
| $75,000 to $99,999 | 11 | 11.2% |
| $100,000 to $149,999 | 32 | 32.7% |
| $150,000 to $199,999 | 43 | 43.9% |
| $200,000+ | 0 | 0.0% |
Household Income by Householder Age in Vanderbilt
The median household income in Vanderbilt is $119,531, with the highest median household income of $67,292 found in the 65+ years age bracket for the primary householder. A total of 23 households (23.5%) fall into this category.
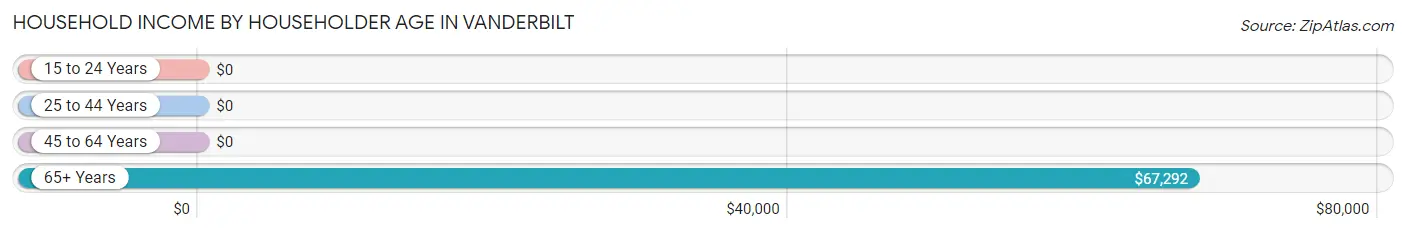
| Income Bracket | # Households | Median Income |
| 15 to 24 Years | 0 (0.0%) | $0 |
| 25 to 44 Years | 64 (65.3%) | $0 |
| 45 to 64 Years | 11 (11.2%) | $0 |
| 65+ Years | 23 (23.5%) | $67,292 |
| Total | 98 (100.0%) | $119,531 |
Poverty in Vanderbilt
Income Below Poverty by Sex and Age in Vanderbilt
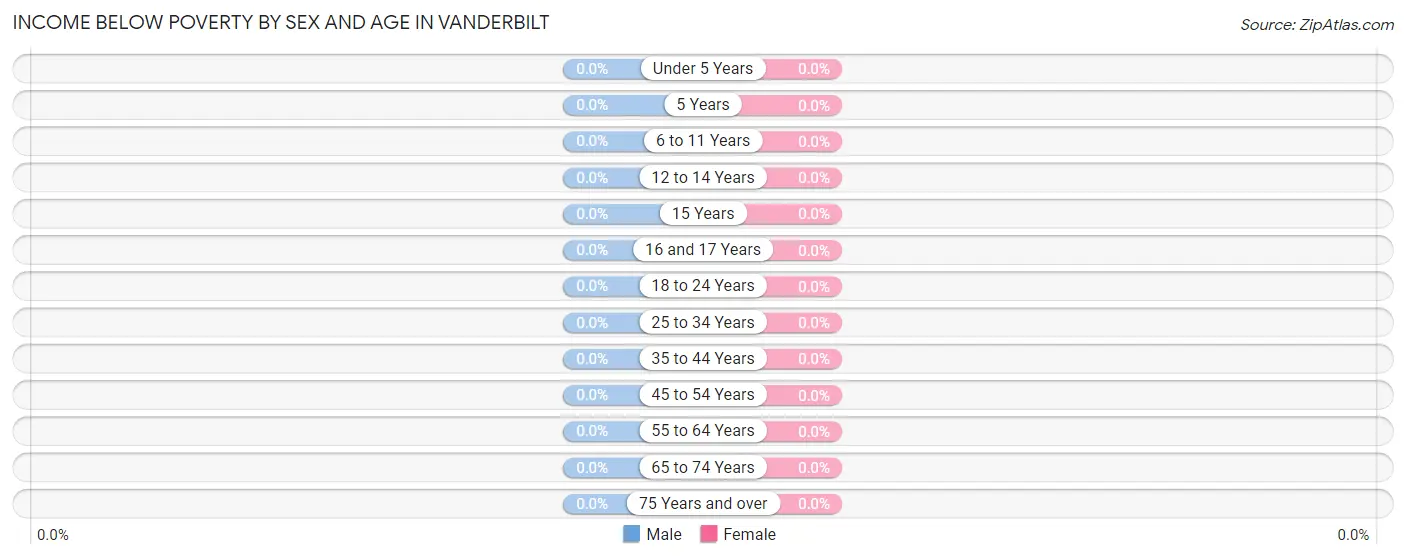
| Age Bracket | Male | Female |
| Under 5 Years | 0 (0.0%) | 0 (0.0%) |
| 5 Years | 0 (0.0%) | 0 (0.0%) |
| 6 to 11 Years | 0 (0.0%) | 0 (0.0%) |
| 12 to 14 Years | 0 (0.0%) | 0 (0.0%) |
| 15 Years | 0 (0.0%) | 0 (0.0%) |
| 16 and 17 Years | 0 (0.0%) | 0 (0.0%) |
| 18 to 24 Years | 0 (0.0%) | 0 (0.0%) |
| 25 to 34 Years | 0 (0.0%) | 0 (0.0%) |
| 35 to 44 Years | 0 (0.0%) | 0 (0.0%) |
| 45 to 54 Years | 0 (0.0%) | 0 (0.0%) |
| 55 to 64 Years | 0 (0.0%) | 0 (0.0%) |
| 65 to 74 Years | 0 (0.0%) | 0 (0.0%) |
| 75 Years and over | 0 (0.0%) | 0 (0.0%) |
| Total | 0 (0.0%) | 0 (0.0%) |
Income Above Poverty by Sex and Age in Vanderbilt
According to the poverty statistics in Vanderbilt, males aged 5 years and females aged 12 to 14 years are the age groups that are most secure financially, with 100.0% of males and 100.0% of females in these age groups living above the poverty line.
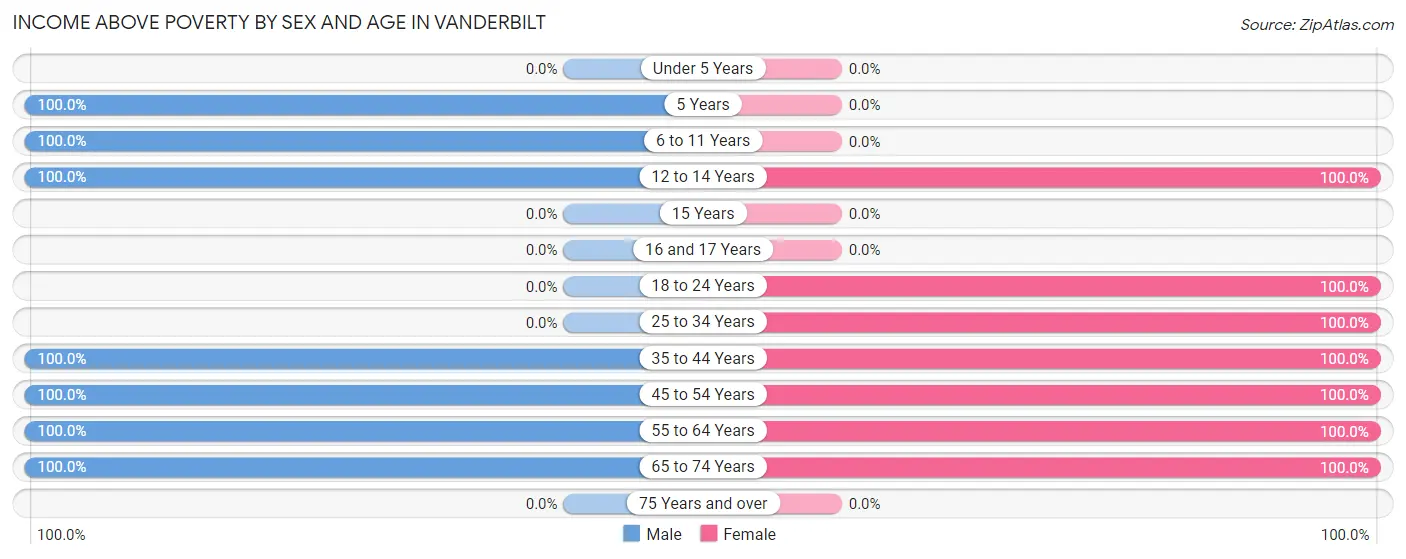
| Age Bracket | Male | Female |
| Under 5 Years | 0 (0.0%) | 0 (0.0%) |
| 5 Years | 30 (100.0%) | 0 (0.0%) |
| 6 to 11 Years | 30 (100.0%) | 0 (0.0%) |
| 12 to 14 Years | 106 (100.0%) | 93 (100.0%) |
| 15 Years | 0 (0.0%) | 0 (0.0%) |
| 16 and 17 Years | 0 (0.0%) | 0 (0.0%) |
| 18 to 24 Years | 0 (0.0%) | 35 (100.0%) |
| 25 to 34 Years | 0 (0.0%) | 25 (100.0%) |
| 35 to 44 Years | 32 (100.0%) | 32 (100.0%) |
| 45 to 54 Years | 47 (100.0%) | 47 (100.0%) |
| 55 to 64 Years | 11 (100.0%) | 15 (100.0%) |
| 65 to 74 Years | 11 (100.0%) | 12 (100.0%) |
| 75 Years and over | 0 (0.0%) | 0 (0.0%) |
| Total | 267 (100.0%) | 259 (100.0%) |
Income Below Poverty Among Married-Couple Families in Vanderbilt
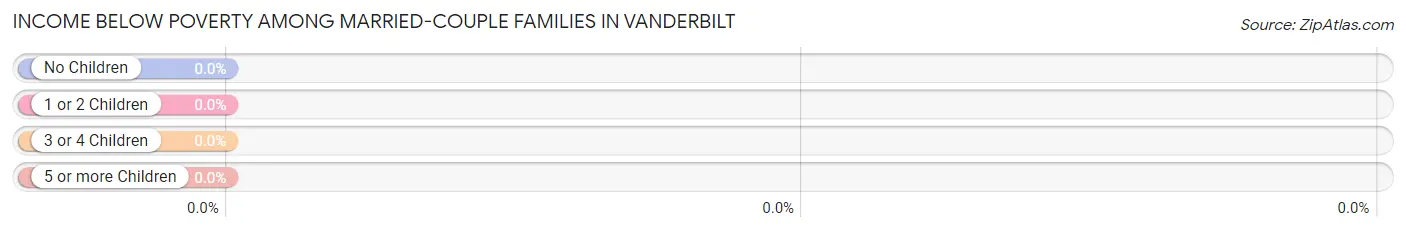
| Children | Above Poverty | Below Poverty |
| No Children | 22 (100.0%) | 0 (0.0%) |
| 1 or 2 Children | 64 (100.0%) | 0 (0.0%) |
| 3 or 4 Children | 0 (0.0%) | 0 (0.0%) |
| 5 or more Children | 0 (0.0%) | 0 (0.0%) |
| Total | 86 (100.0%) | 0 (0.0%) |
Income Below Poverty Among Single-Parent Households in Vanderbilt
| Children | Single Father | Single Mother |
| No Children | 0 (0.0%) | 0 (0.0%) |
| 1 or 2 Children | 0 (0.0%) | 0 (0.0%) |
| 3 or 4 Children | 0 (0.0%) | 0 (0.0%) |
| 5 or more Children | 0 (0.0%) | 0 (0.0%) |
| Total | 0 (0.0%) | 0 (0.0%) |
Income Below Poverty Among Married-Couple vs Single-Parent Households in Vanderbilt
| Children | Married-Couple Families | Single-Parent Households |
| No Children | 0 (0.0%) | 0 (0.0%) |
| 1 or 2 Children | 0 (0.0%) | 0 (0.0%) |
| 3 or 4 Children | 0 (0.0%) | 0 (0.0%) |
| 5 or more Children | 0 (0.0%) | 0 (0.0%) |
| Total | 0 (0.0%) | 0 (0.0%) |
Race in Vanderbilt
The most populous races in Vanderbilt are Hispanic or Latino (357 | 67.9%), Two or more Races (287 | 54.6%), and White / Caucasian (201 | 38.2%).
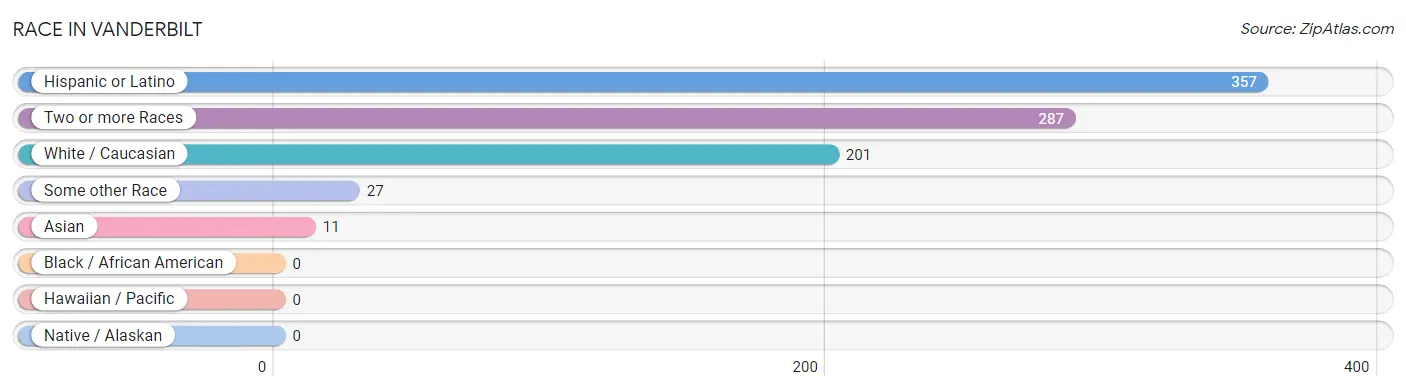
| Race | # Population | % Population |
| Asian | 11 | 2.1% |
| Black / African American | 0 | 0.0% |
| Hawaiian / Pacific | 0 | 0.0% |
| Hispanic or Latino | 357 | 67.9% |
| Native / Alaskan | 0 | 0.0% |
| White / Caucasian | 201 | 38.2% |
| Two or more Races | 287 | 54.6% |
| Some other Race | 27 | 5.1% |
| Total | 526 | 100.0% |
Ancestry in Vanderbilt
The most populous ancestries reported in Vanderbilt are Mexican (357 | 67.9%), Czech (42 | 8.0%), and Indian (Asian) (11 | 2.1%), together accounting for 77.9% of all Vanderbilt residents.
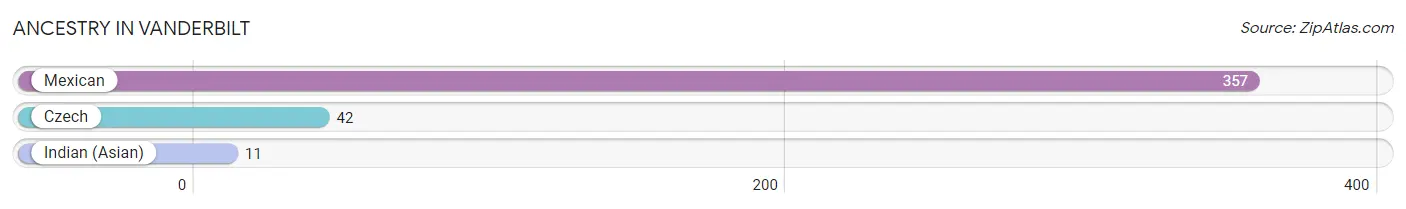
| Ancestry | # Population | % Population |
| Czech | 42 | 8.0% |
| Indian (Asian) | 11 | 2.1% |
| Mexican | 357 | 67.9% | View All 3 Rows |
Immigrants in Vanderbilt
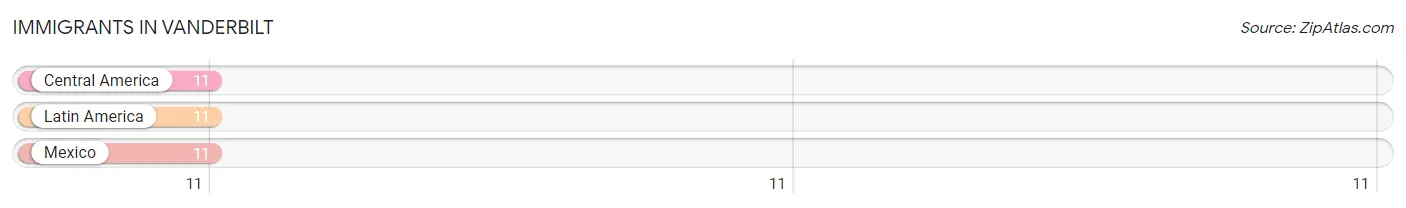
The most numerous immigrant groups reported in Vanderbilt came from Central America (11 | 2.1%), Latin America (11 | 2.1%), and Mexico (11 | 2.1%), together accounting for 6.3% of all Vanderbilt residents.
| Immigration Origin | # Population | % Population |
| Central America | 11 | 2.1% |
| Latin America | 11 | 2.1% |
| Mexico | 11 | 2.1% | View All 3 Rows |
Sex and Age in Vanderbilt
Sex and Age in Vanderbilt
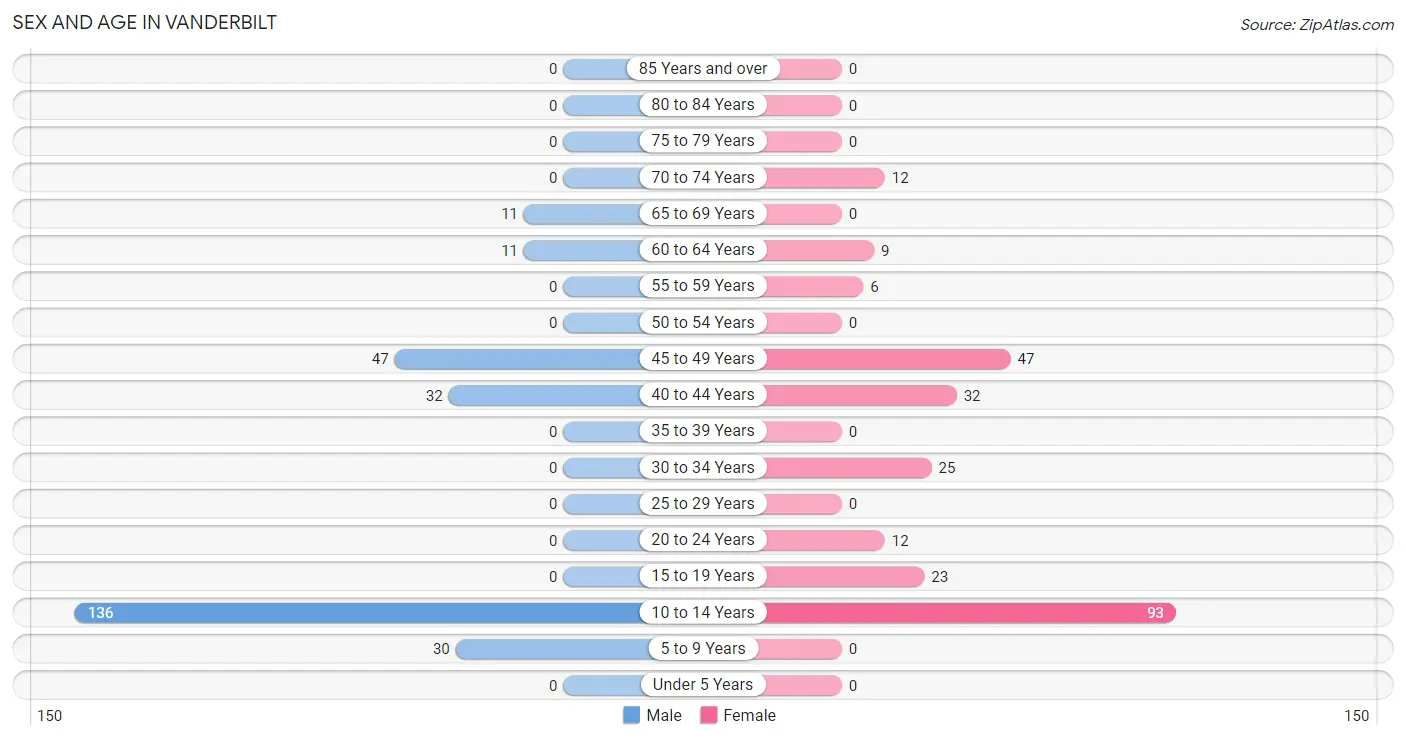
The most populous age groups in Vanderbilt are 10 to 14 Years (136 | 50.9%) for men and 10 to 14 Years (93 | 35.9%) for women.
| Age Bracket | Male | Female |
| Under 5 Years | 0 (0.0%) | 0 (0.0%) |
| 5 to 9 Years | 30 (11.2%) | 0 (0.0%) |
| 10 to 14 Years | 136 (50.9%) | 93 (35.9%) |
| 15 to 19 Years | 0 (0.0%) | 23 (8.9%) |
| 20 to 24 Years | 0 (0.0%) | 12 (4.6%) |
| 25 to 29 Years | 0 (0.0%) | 0 (0.0%) |
| 30 to 34 Years | 0 (0.0%) | 25 (9.7%) |
| 35 to 39 Years | 0 (0.0%) | 0 (0.0%) |
| 40 to 44 Years | 32 (12.0%) | 32 (12.4%) |
| 45 to 49 Years | 47 (17.6%) | 47 (18.1%) |
| 50 to 54 Years | 0 (0.0%) | 0 (0.0%) |
| 55 to 59 Years | 0 (0.0%) | 6 (2.3%) |
| 60 to 64 Years | 11 (4.1%) | 9 (3.5%) |
| 65 to 69 Years | 11 (4.1%) | 0 (0.0%) |
| 70 to 74 Years | 0 (0.0%) | 12 (4.6%) |
| 75 to 79 Years | 0 (0.0%) | 0 (0.0%) |
| 80 to 84 Years | 0 (0.0%) | 0 (0.0%) |
| 85 Years and over | 0 (0.0%) | 0 (0.0%) |
| Total | 267 (100.0%) | 259 (100.0%) |
Families and Households in Vanderbilt
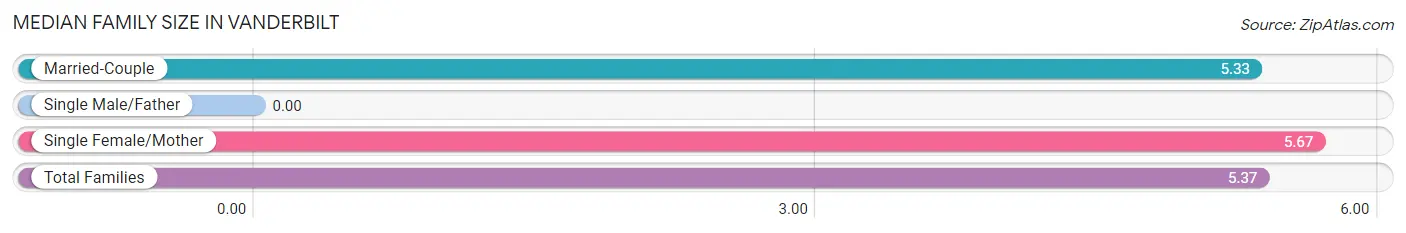
Median Family Size in Vanderbilt
| Family Type | # Families | Family Size |
| Married-Couple | 86 (87.8%) | 5.33 |
| Single Male/Father | 0 (0.0%) | - |
| Single Female/Mother | 12 (12.2%) | 5.67 |
| Total Families | 98 (100.0%) | 5.37 |
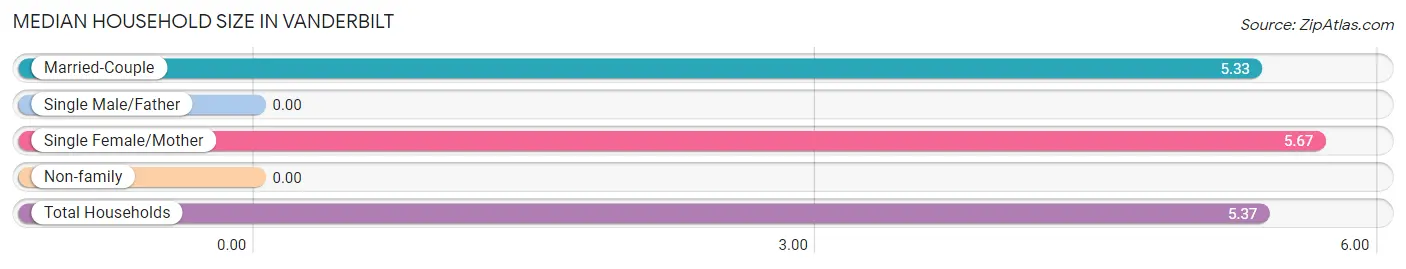
Median Household Size in Vanderbilt
| Household Type | # Households | Household Size |
| Married-Couple | 86 (87.8%) | 5.33 |
| Single Male/Father | 0 (0.0%) | - |
| Single Female/Mother | 12 (12.2%) | 5.67 |
| Non-family | 0 (0.0%) | - |
| Total Households | 98 (100.0%) | 5.37 |
Household Size by Marriage Status in Vanderbilt
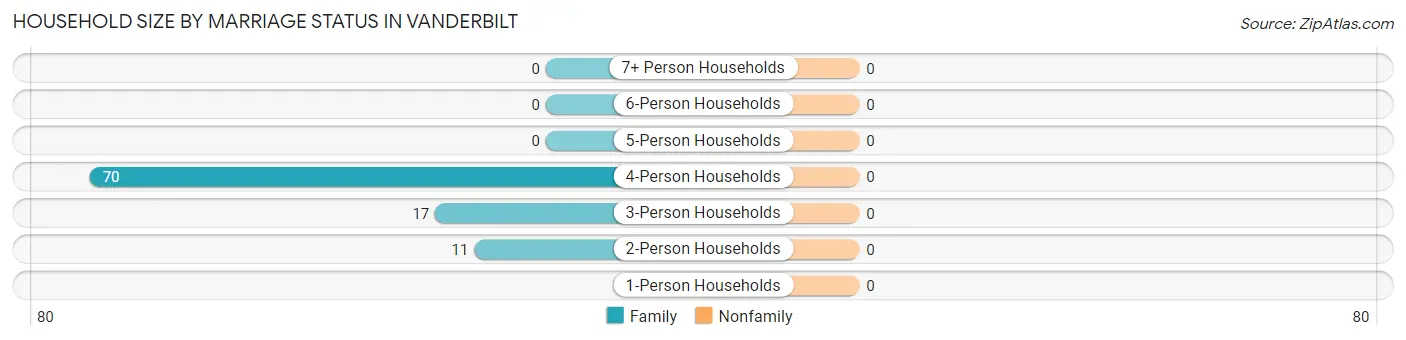
| Household Size | Family Households | Nonfamily Households |
| 1-Person Households | - | 0 (0.0%) |
| 2-Person Households | 11 (11.2%) | 0 (0.0%) |
| 3-Person Households | 17 (17.3%) | 0 (0.0%) |
| 4-Person Households | 70 (71.4%) | 0 (0.0%) |
| 5-Person Households | 0 (0.0%) | 0 (0.0%) |
| 6-Person Households | 0 (0.0%) | 0 (0.0%) |
| 7+ Person Households | 0 (0.0%) | 0 (0.0%) |
| Total | 98 (100.0%) | 0 (0.0%) |
Female Fertility in Vanderbilt
Fertility by Age in Vanderbilt
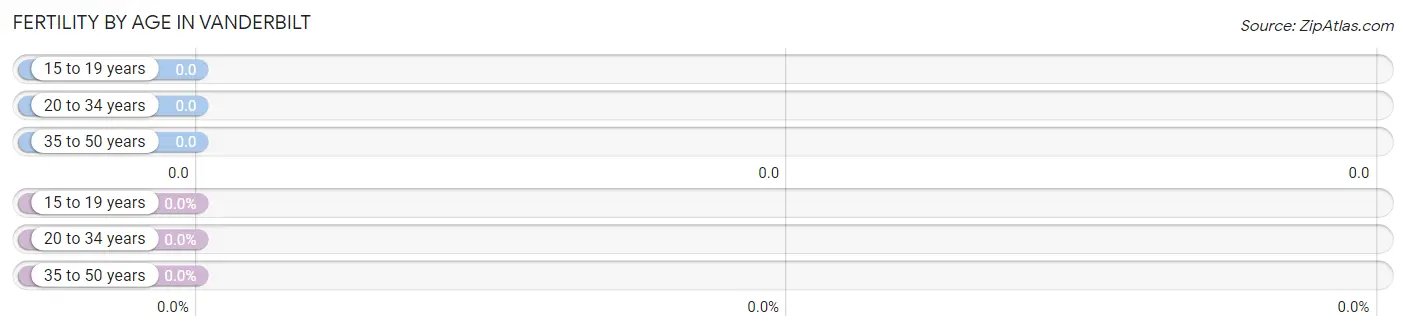
| Age Bracket | Women with Births | Births / 1,000 Women |
| 15 to 19 years | 0 (0.0%) | 0.0 |
| 20 to 34 years | 0 (0.0%) | 0.0 |
| 35 to 50 years | 0 (0.0%) | 0.0 |
| Total | 0 (0.0%) | 0.0 |
Fertility by Age by Marriage Status in Vanderbilt
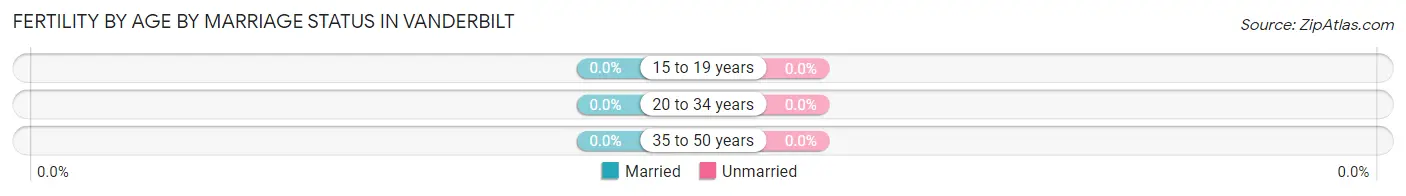
| Age Bracket | Married | Unmarried |
| 15 to 19 years | 0 (0.0%) | 0 (0.0%) |
| 20 to 34 years | 0 (0.0%) | 0 (0.0%) |
| 35 to 50 years | 0 (0.0%) | 0 (0.0%) |
| Total | 0 (0.0%) | 0 (0.0%) |
Fertility by Education in Vanderbilt
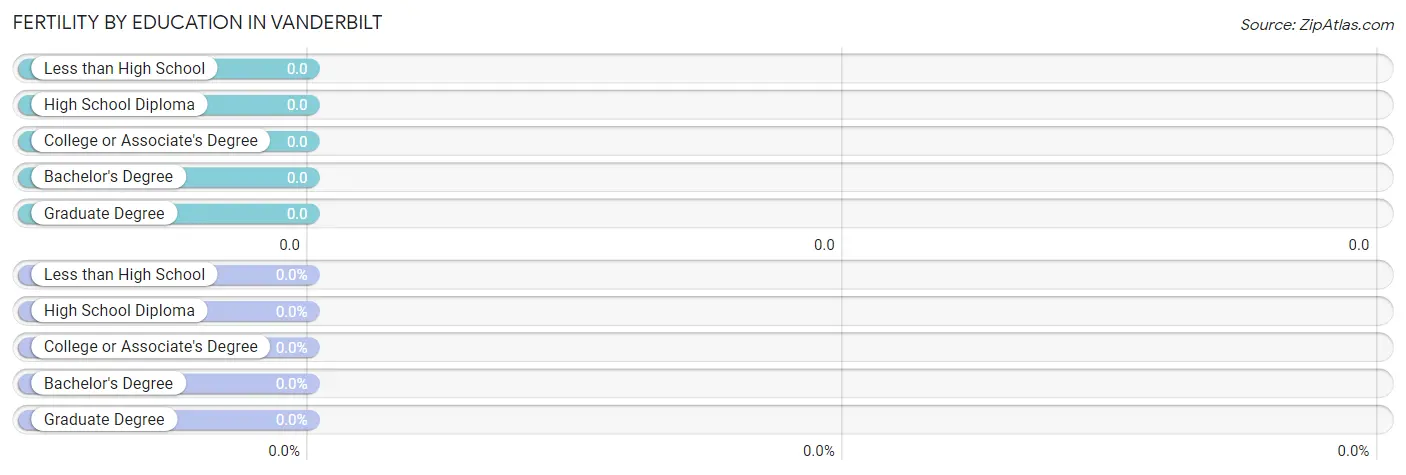
| Educational Attainment | Women with Births | Births / 1,000 Women |
| Less than High School | 0 (0.0%) | 0.0 |
| High School Diploma | 0 (0.0%) | 0.0 |
| College or Associate's Degree | 0 (0.0%) | 0.0 |
| Bachelor's Degree | 0 (0.0%) | 0.0 |
| Graduate Degree | 0 (0.0%) | 0.0 |
| Total | 0 (0.0%) | 0.0 |
Fertility by Education by Marriage Status in Vanderbilt
| Educational Attainment | Married | Unmarried |
| Less than High School | 0 (0.0%) | 0 (0.0%) |
| High School Diploma | 0 (0.0%) | 0 (0.0%) |
| College or Associate's Degree | 0 (0.0%) | 0 (0.0%) |
| Bachelor's Degree | 0 (0.0%) | 0 (0.0%) |
| Graduate Degree | 0 (0.0%) | 0 (0.0%) |
| Total | 0 (0.0%) | 0 (0.0%) |
Employment Characteristics in Vanderbilt
Employment by Class of Employer in Vanderbilt
Among the 179 employed individuals in Vanderbilt, private company employees (167 | 93.3%), self-employed (not incorporated) (6 | 3.4%), and local government employees (6 | 3.4%) make up the most common classes of employment.
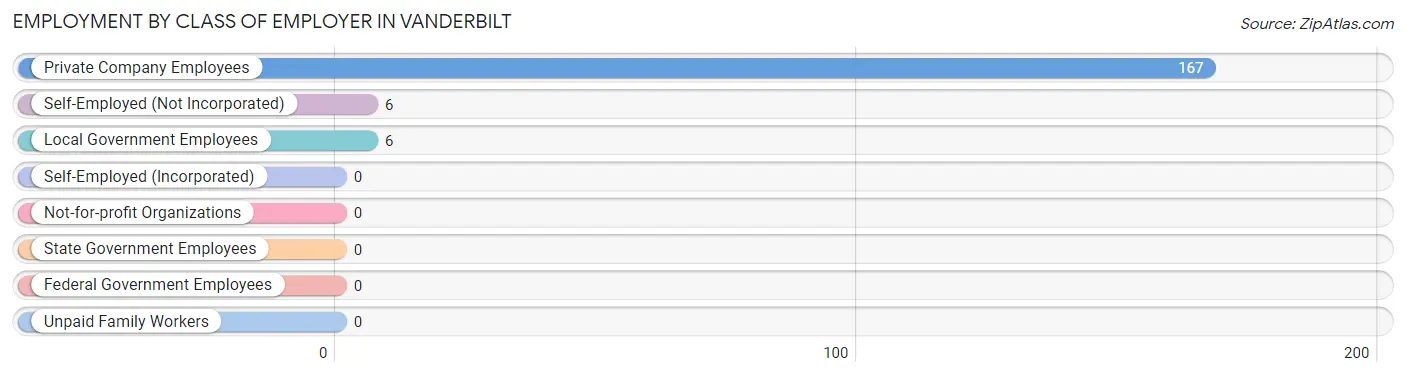
| Employer Class | # Employees | % Employees |
| Private Company Employees | 167 | 93.3% |
| Self-Employed (Incorporated) | 0 | 0.0% |
| Self-Employed (Not Incorporated) | 6 | 3.4% |
| Not-for-profit Organizations | 0 | 0.0% |
| Local Government Employees | 6 | 3.4% |
| State Government Employees | 0 | 0.0% |
| Federal Government Employees | 0 | 0.0% |
| Unpaid Family Workers | 0 | 0.0% |
| Total | 179 | 100.0% |
Employment Status by Age in Vanderbilt
According to the labor force statistics for Vanderbilt, out of the total population over 16 years of age (267), 85.0% or 227 individuals are in the labor force, with 21.1% or 48 of them unemployed. The age group with the highest labor force participation rate is 20 to 24 years, with 100.0% or 12 individuals in the labor force. Within the labor force, the 20 to 24 years age range has the highest percentage of unemployed individuals, with 100.0% or 12 of them being unemployed.
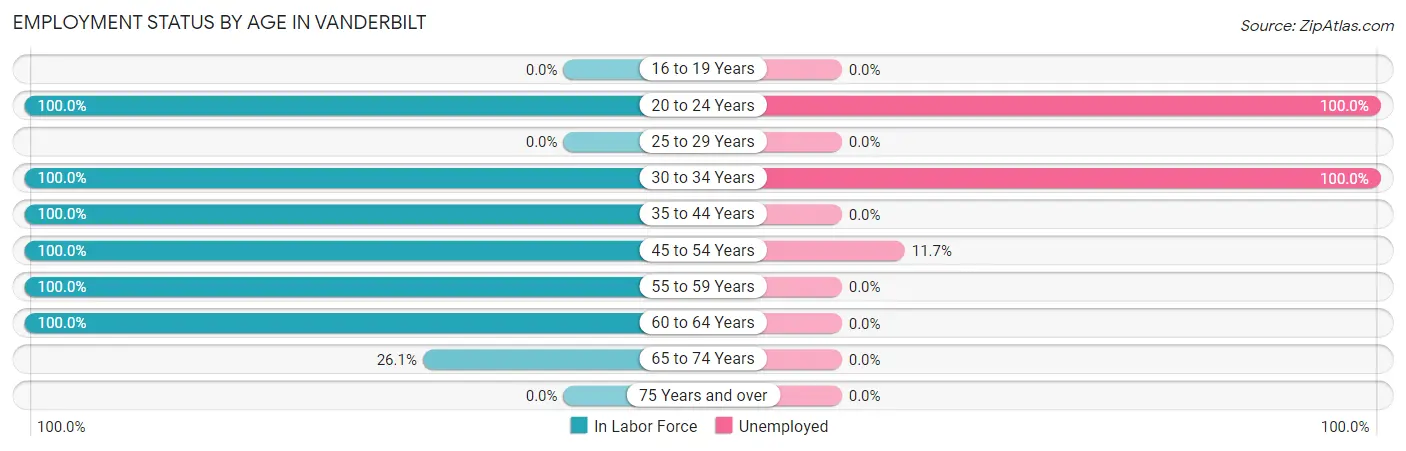
| Age Bracket | In Labor Force | Unemployed |
| 16 to 19 Years | 0 (0.0%) | 0 (0.0%) |
| 20 to 24 Years | 12 (100.0%) | 12 (100.0%) |
| 25 to 29 Years | 0 (0.0%) | 0 (0.0%) |
| 30 to 34 Years | 25 (100.0%) | 25 (100.0%) |
| 35 to 44 Years | 64 (100.0%) | 0 (0.0%) |
| 45 to 54 Years | 94 (100.0%) | 11 (11.7%) |
| 55 to 59 Years | 6 (100.0%) | 0 (0.0%) |
| 60 to 64 Years | 20 (100.0%) | 0 (0.0%) |
| 65 to 74 Years | 6 (26.1%) | 0 (0.0%) |
| 75 Years and over | 0 (0.0%) | 0 (0.0%) |
| Total | 227 (85.0%) | 48 (21.1%) |
Employment Status by Educational Attainment in Vanderbilt
According to labor force statistics for Vanderbilt, 100.0% of individuals (209) out of the total population between 25 and 64 years of age (209) are in the labor force, with 17.2% or 36 of them being unemployed. The group with the highest labor force participation rate are those with the educational attainment of less than high school, with 100.0% or 21 individuals in the labor force. Within the labor force, individuals with less than high school education have the highest percentage of unemployment, with 52.4% or 11 of them being unemployed.
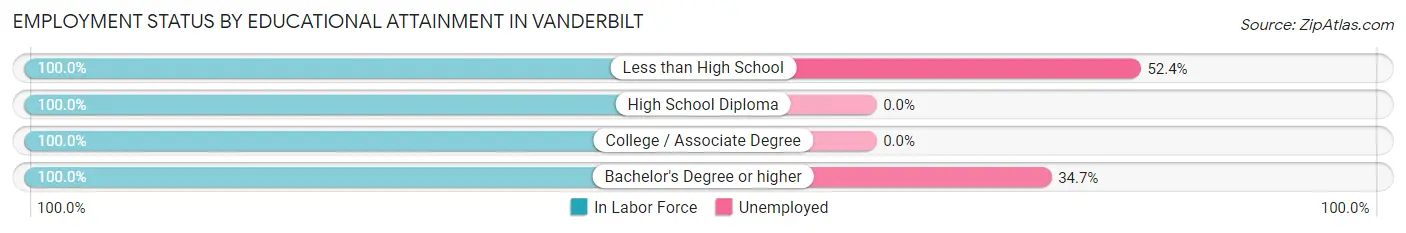
| Educational Attainment | In Labor Force | Unemployed |
| Less than High School | 21 (100.0%) | 11 (52.4%) |
| High School Diploma | 32 (100.0%) | 0 (0.0%) |
| College / Associate Degree | 84 (100.0%) | 0 (0.0%) |
| Bachelor's Degree or higher | 72 (100.0%) | 25 (34.7%) |
| Total | 209 (100.0%) | 36 (17.2%) |
Employment Occupations by Sex in Vanderbilt
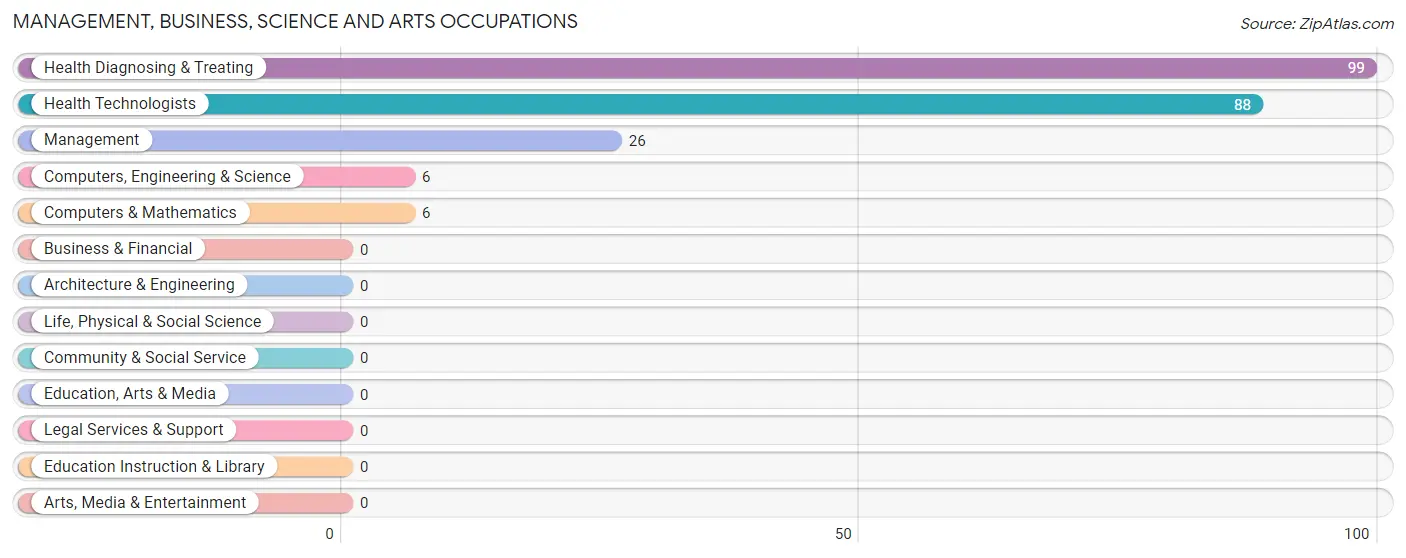
Management, Business, Science and Arts Occupations
The most common Management, Business, Science and Arts occupations in Vanderbilt are Health Diagnosing & Treating (99 | 55.3%), Health Technologists (88 | 49.2%), Management (26 | 14.5%), Computers, Engineering & Science (6 | 3.4%), and Computers & Mathematics (6 | 3.4%).
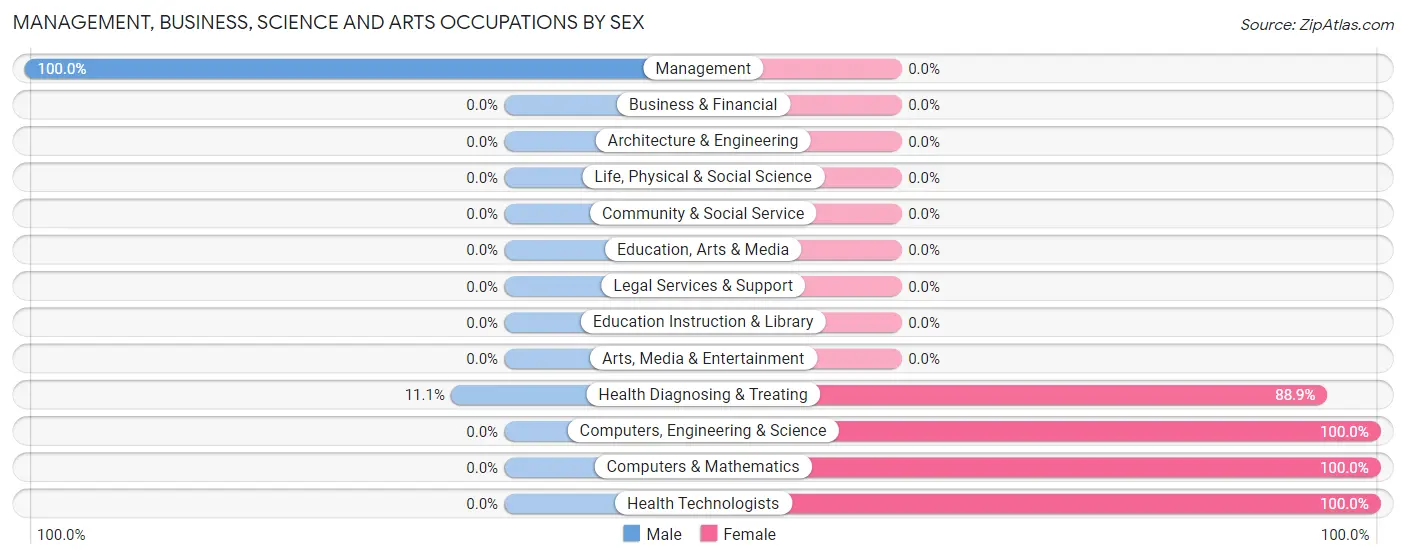
Management, Business, Science and Arts Occupations by Sex
Within the Management, Business, Science and Arts occupations in Vanderbilt, the most male-oriented occupations are Management (100.0%), and Health Diagnosing & Treating (11.1%), while the most female-oriented occupations are Computers, Engineering & Science (100.0%), Computers & Mathematics (100.0%), and Health Technologists (100.0%).
| Occupation | Male | Female |
| Management | 26 (100.0%) | 0 (0.0%) |
| Business & Financial | 0 (0.0%) | 0 (0.0%) |
| Computers, Engineering & Science | 0 (0.0%) | 6 (100.0%) |
| Computers & Mathematics | 0 (0.0%) | 6 (100.0%) |
| Architecture & Engineering | 0 (0.0%) | 0 (0.0%) |
| Life, Physical & Social Science | 0 (0.0%) | 0 (0.0%) |
| Community & Social Service | 0 (0.0%) | 0 (0.0%) |
| Education, Arts & Media | 0 (0.0%) | 0 (0.0%) |
| Legal Services & Support | 0 (0.0%) | 0 (0.0%) |
| Education Instruction & Library | 0 (0.0%) | 0 (0.0%) |
| Arts, Media & Entertainment | 0 (0.0%) | 0 (0.0%) |
| Health Diagnosing & Treating | 11 (11.1%) | 88 (88.9%) |
| Health Technologists | 0 (0.0%) | 88 (100.0%) |
| Total (Category) | 37 (28.2%) | 94 (71.8%) |
| Total (Overall) | 79 (44.1%) | 100 (55.9%) |
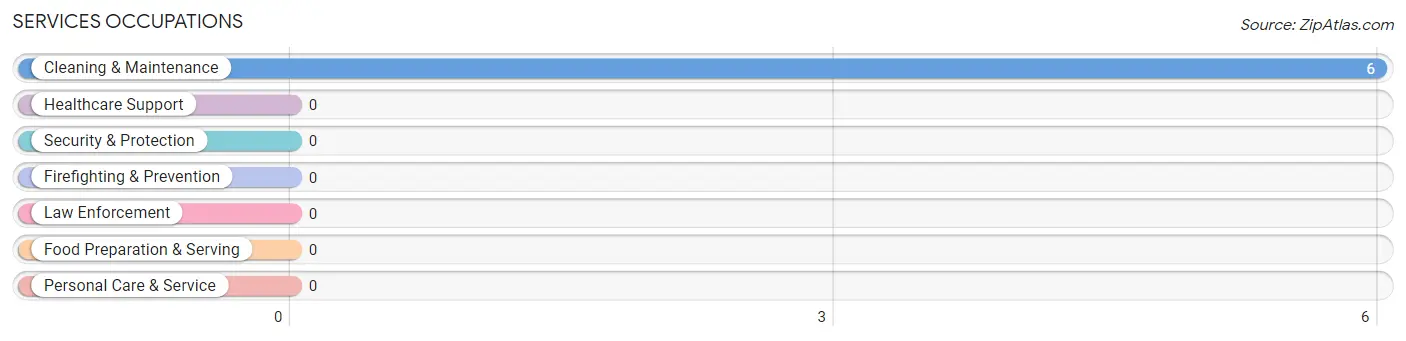
Services Occupations
The most common Services occupations in Vanderbilt are , and Cleaning & Maintenance (6 | 3.4%).
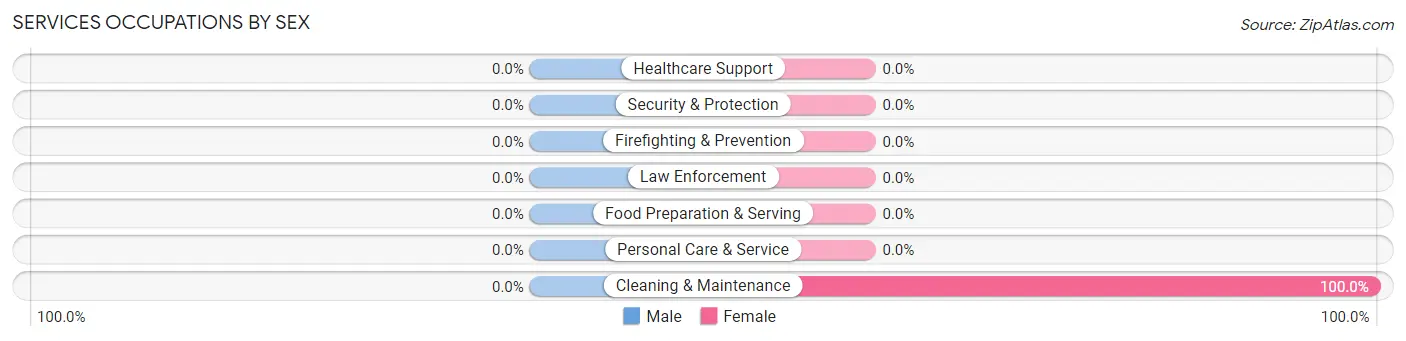
Services Occupations by Sex
| Occupation | Male | Female |
| Healthcare Support | 0 (0.0%) | 0 (0.0%) |
| Security & Protection | 0 (0.0%) | 0 (0.0%) |
| Firefighting & Prevention | 0 (0.0%) | 0 (0.0%) |
| Law Enforcement | 0 (0.0%) | 0 (0.0%) |
| Food Preparation & Serving | 0 (0.0%) | 0 (0.0%) |
| Cleaning & Maintenance | 0 (0.0%) | 6 (100.0%) |
| Personal Care & Service | 0 (0.0%) | 0 (0.0%) |
| Total (Category) | 0 (0.0%) | 6 (100.0%) |
| Total (Overall) | 79 (44.1%) | 100 (55.9%) |
Sales and Office Occupations
Sales and Office Occupations by Sex
| Occupation | Male | Female |
| Sales & Related | 0 (0.0%) | 0 (0.0%) |
| Office & Administration | 0 (0.0%) | 0 (0.0%) |
| Total (Category) | 0 (0.0%) | 0 (0.0%) |
| Total (Overall) | 79 (44.1%) | 100 (55.9%) |
Natural Resources, Construction and Maintenance Occupations
Natural Resources, Construction and Maintenance Occupations by Sex
| Occupation | Male | Female |
| Farming, Fishing & Forestry | 0 (0.0%) | 0 (0.0%) |
| Construction & Extraction | 0 (0.0%) | 0 (0.0%) |
| Installation, Maintenance & Repair | 0 (0.0%) | 0 (0.0%) |
| Total (Category) | 0 (0.0%) | 0 (0.0%) |
| Total (Overall) | 79 (44.1%) | 100 (55.9%) |
Production, Transportation and Moving Occupations
The most common Production, Transportation and Moving occupations in Vanderbilt are , and Transportation (42 | 23.5%).
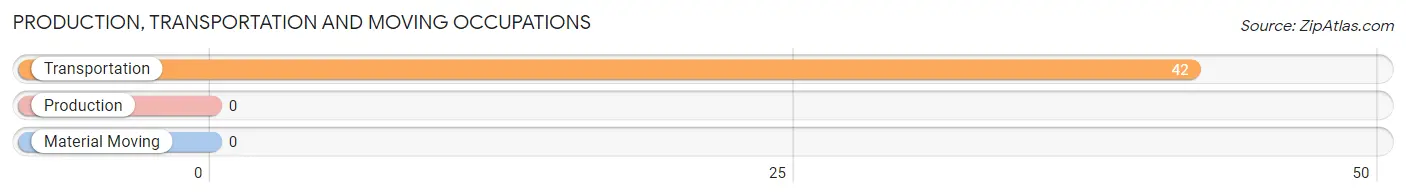
Production, Transportation and Moving Occupations by Sex
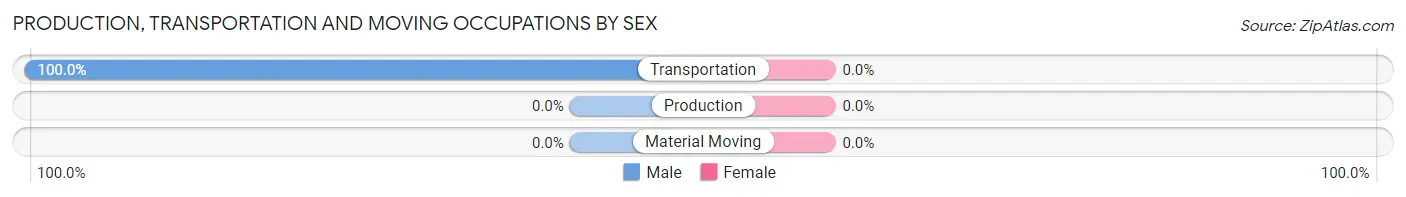
| Occupation | Male | Female |
| Production | 0 (0.0%) | 0 (0.0%) |
| Transportation | 42 (100.0%) | 0 (0.0%) |
| Material Moving | 0 (0.0%) | 0 (0.0%) |
| Total (Category) | 42 (100.0%) | 0 (0.0%) |
| Total (Overall) | 79 (44.1%) | 100 (55.9%) |
Employment Industries by Sex in Vanderbilt
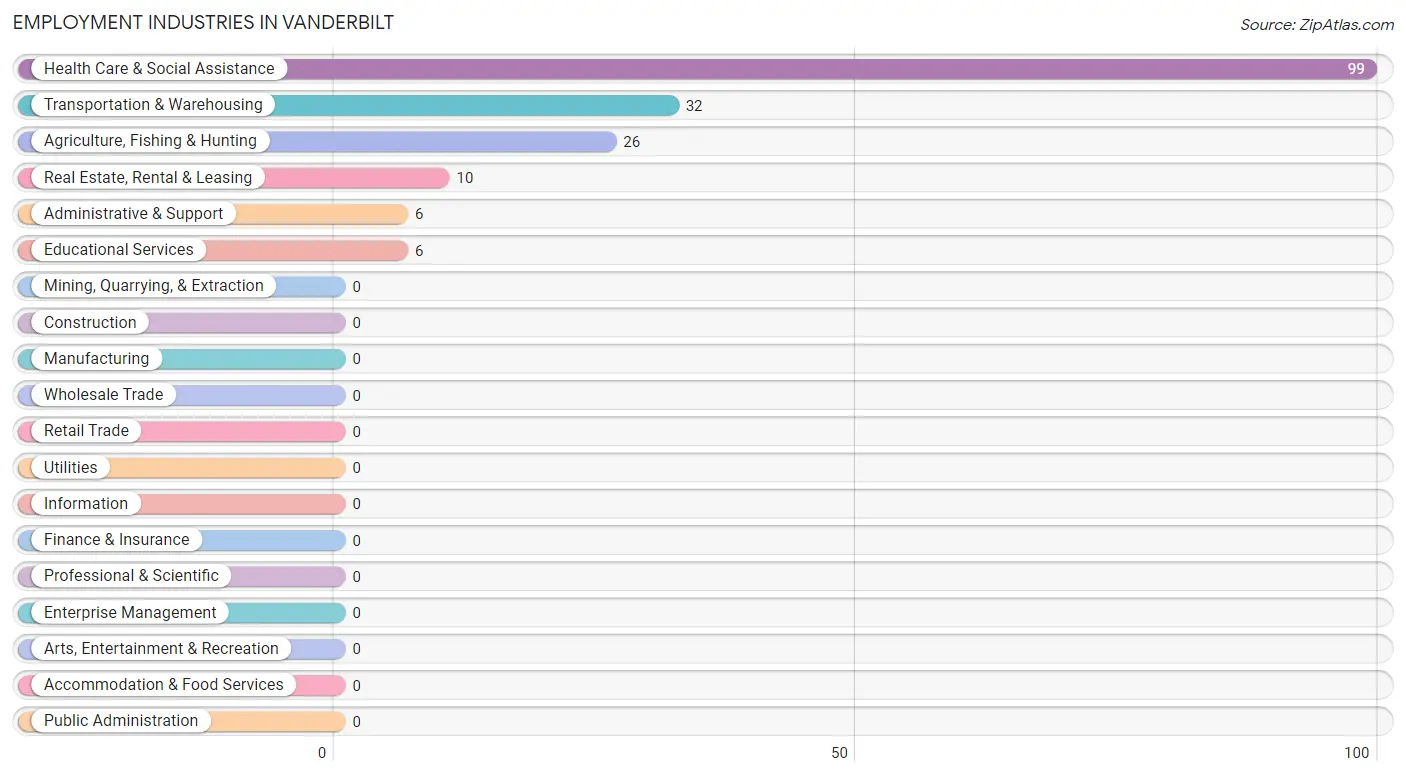
Employment Industries in Vanderbilt
The major employment industries in Vanderbilt include Health Care & Social Assistance (99 | 55.3%), Transportation & Warehousing (32 | 17.9%), Agriculture, Fishing & Hunting (26 | 14.5%), Real Estate, Rental & Leasing (10 | 5.6%), and Administrative & Support (6 | 3.4%).
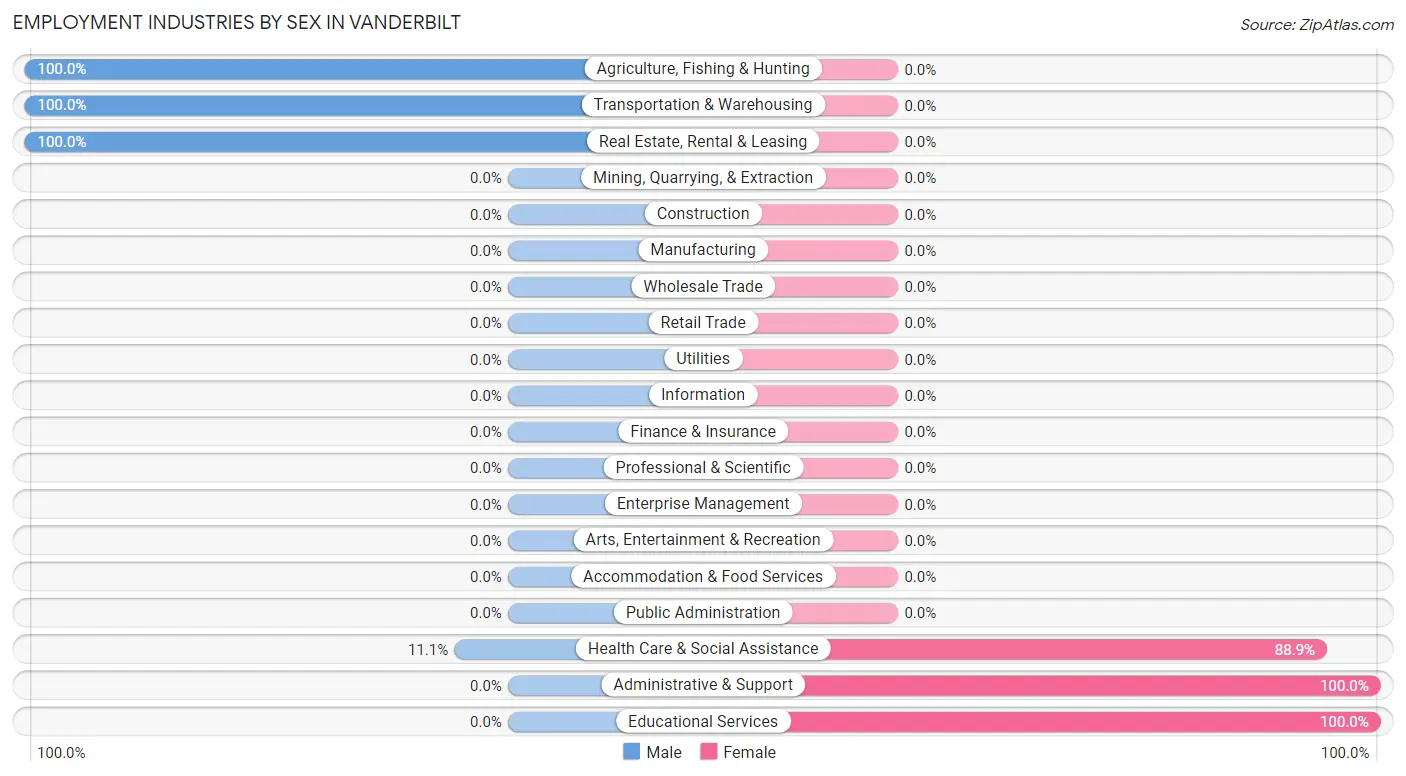
Employment Industries by Sex in Vanderbilt
The Vanderbilt industries that see more men than women are Agriculture, Fishing & Hunting (100.0%), Transportation & Warehousing (100.0%), and Real Estate, Rental & Leasing (100.0%), whereas the industries that tend to have a higher number of women are Administrative & Support (100.0%), Educational Services (100.0%), and Health Care & Social Assistance (88.9%).
| Industry | Male | Female |
| Agriculture, Fishing & Hunting | 26 (100.0%) | 0 (0.0%) |
| Mining, Quarrying, & Extraction | 0 (0.0%) | 0 (0.0%) |
| Construction | 0 (0.0%) | 0 (0.0%) |
| Manufacturing | 0 (0.0%) | 0 (0.0%) |
| Wholesale Trade | 0 (0.0%) | 0 (0.0%) |
| Retail Trade | 0 (0.0%) | 0 (0.0%) |
| Transportation & Warehousing | 32 (100.0%) | 0 (0.0%) |
| Utilities | 0 (0.0%) | 0 (0.0%) |
| Information | 0 (0.0%) | 0 (0.0%) |
| Finance & Insurance | 0 (0.0%) | 0 (0.0%) |
| Real Estate, Rental & Leasing | 10 (100.0%) | 0 (0.0%) |
| Professional & Scientific | 0 (0.0%) | 0 (0.0%) |
| Enterprise Management | 0 (0.0%) | 0 (0.0%) |
| Administrative & Support | 0 (0.0%) | 6 (100.0%) |
| Educational Services | 0 (0.0%) | 6 (100.0%) |
| Health Care & Social Assistance | 11 (11.1%) | 88 (88.9%) |
| Arts, Entertainment & Recreation | 0 (0.0%) | 0 (0.0%) |
| Accommodation & Food Services | 0 (0.0%) | 0 (0.0%) |
| Public Administration | 0 (0.0%) | 0 (0.0%) |
| Total | 79 (44.1%) | 100 (55.9%) |
Education in Vanderbilt
School Enrollment in Vanderbilt
The most common levels of schooling among the 270 students in Vanderbilt are middle school (229 | 84.8%), nursery / preschool (30 | 11.1%), and high school (11 | 4.1%).
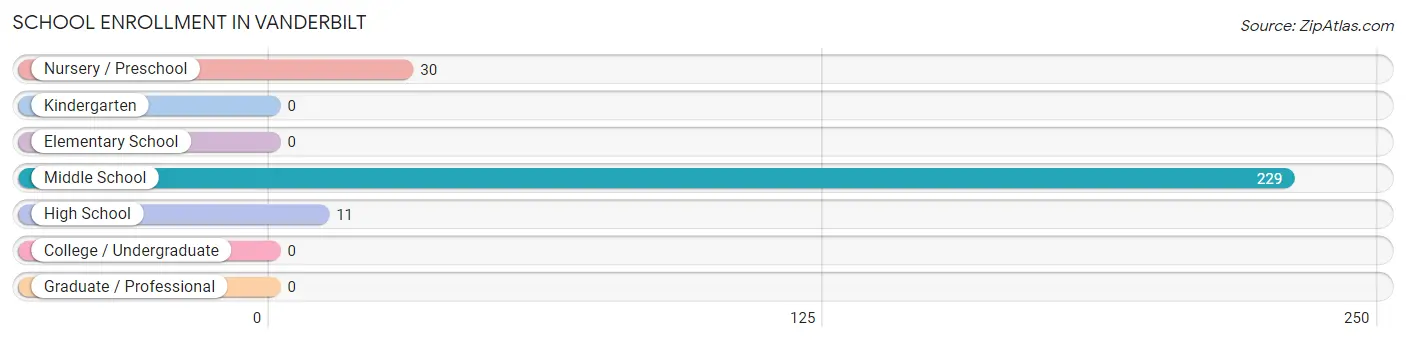
| School Level | # Students | % Students |
| Nursery / Preschool | 30 | 11.1% |
| Kindergarten | 0 | 0.0% |
| Elementary School | 0 | 0.0% |
| Middle School | 229 | 84.8% |
| High School | 11 | 4.1% |
| College / Undergraduate | 0 | 0.0% |
| Graduate / Professional | 0 | 0.0% |
| Total | 270 | 100.0% |
School Enrollment by Age by Funding Source in Vanderbilt
Out of a total of 270 students who are enrolled in schools in Vanderbilt, 30 (11.1%) attend a private institution, while the remaining 240 (88.9%) are enrolled in public schools. The age group of 5 to 9 year old has the highest likelihood of being enrolled in private schools, with 30 (100.0% in the age bracket) enrolled. Conversely, the age group of 10 to 14 year olds has the lowest likelihood of being enrolled in a private school, with 229 (100.0% in the age bracket) attending a public institution.
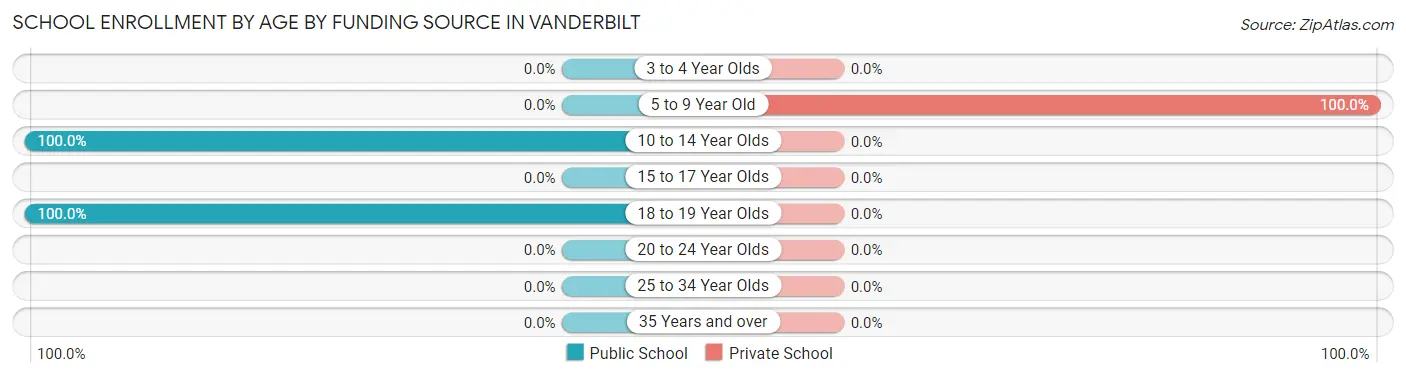
| Age Bracket | Public School | Private School |
| 3 to 4 Year Olds | 0 (0.0%) | 0 (0.0%) |
| 5 to 9 Year Old | 0 (0.0%) | 30 (100.0%) |
| 10 to 14 Year Olds | 229 (100.0%) | 0 (0.0%) |
| 15 to 17 Year Olds | 0 (0.0%) | 0 (0.0%) |
| 18 to 19 Year Olds | 11 (100.0%) | 0 (0.0%) |
| 20 to 24 Year Olds | 0 (0.0%) | 0 (0.0%) |
| 25 to 34 Year Olds | 0 (0.0%) | 0 (0.0%) |
| 35 Years and over | 0 (0.0%) | 0 (0.0%) |
| Total | 240 (88.9%) | 30 (11.1%) |
Educational Attainment by Field of Study in Vanderbilt
Physical & health sciences (47 | 48.4%), bio, nature & agricultural (25 | 25.8%), and business (25 | 25.8%) are the most common fields of study among 97 individuals in Vanderbilt who have obtained a bachelor's degree or higher.
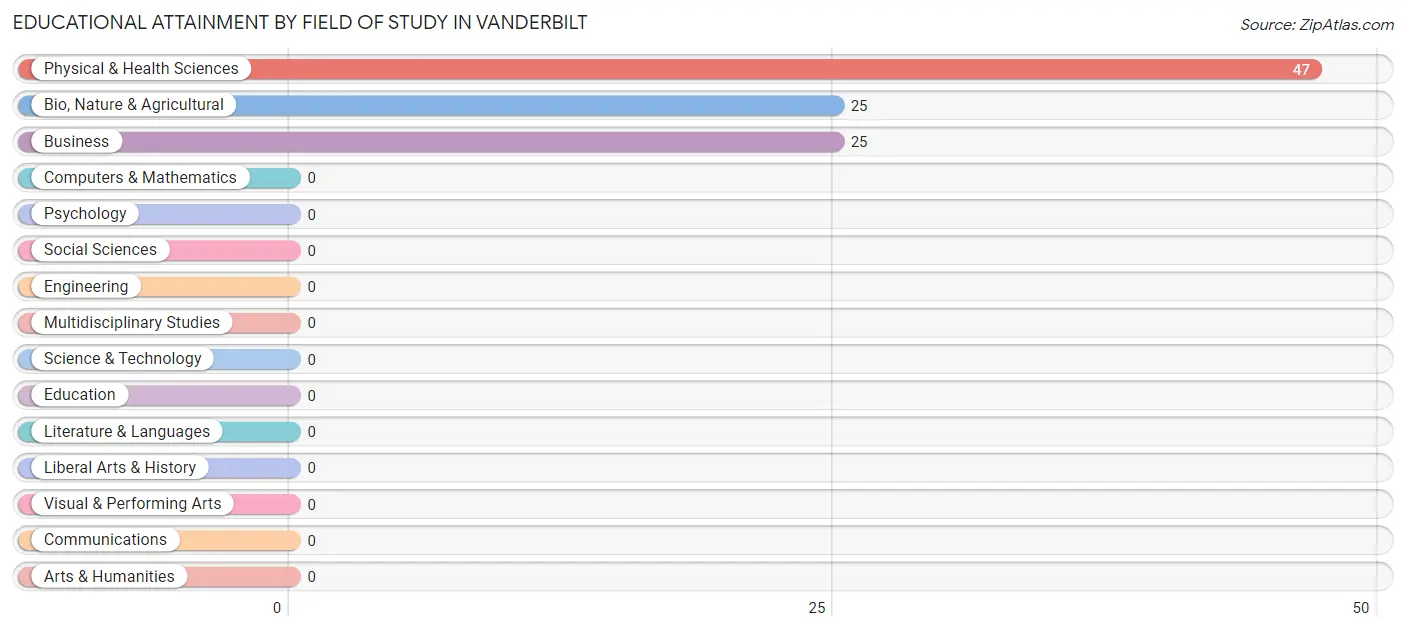
| Field of Study | # Graduates | % Graduates |
| Computers & Mathematics | 0 | 0.0% |
| Bio, Nature & Agricultural | 25 | 25.8% |
| Physical & Health Sciences | 47 | 48.4% |
| Psychology | 0 | 0.0% |
| Social Sciences | 0 | 0.0% |
| Engineering | 0 | 0.0% |
| Multidisciplinary Studies | 0 | 0.0% |
| Science & Technology | 0 | 0.0% |
| Business | 25 | 25.8% |
| Education | 0 | 0.0% |
| Literature & Languages | 0 | 0.0% |
| Liberal Arts & History | 0 | 0.0% |
| Visual & Performing Arts | 0 | 0.0% |
| Communications | 0 | 0.0% |
| Arts & Humanities | 0 | 0.0% |
| Total | 97 | 100.0% |
Transportation & Commute in Vanderbilt
Vehicle Availability by Sex in Vanderbilt
The most prevalent vehicle ownership categories in Vanderbilt are males with 2 vehicles (58, accounting for 73.4%) and females with 2 vehicles (79, making up 58.0%).
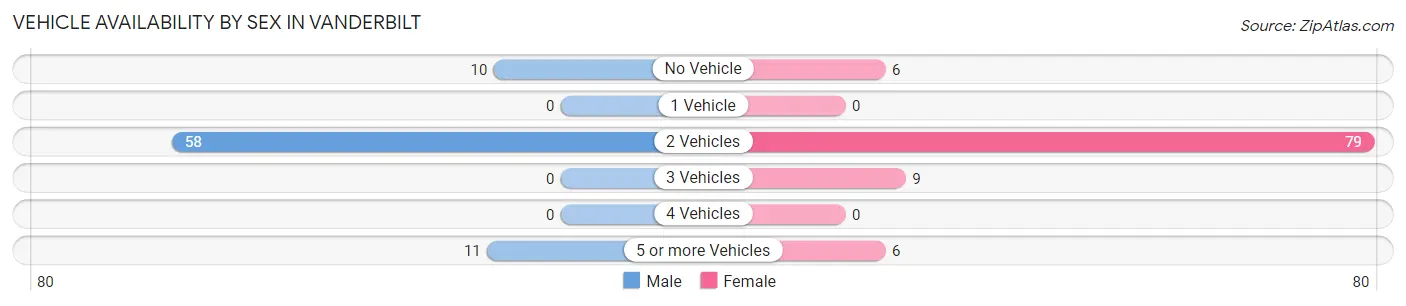
| Vehicles Available | Male | Female |
| No Vehicle | 10 (12.7%) | 6 (6.0%) |
| 1 Vehicle | 0 (0.0%) | 0 (0.0%) |
| 2 Vehicles | 58 (73.4%) | 79 (79.0%) |
| 3 Vehicles | 0 (0.0%) | 9 (9.0%) |
| 4 Vehicles | 0 (0.0%) | 0 (0.0%) |
| 5 or more Vehicles | 11 (13.9%) | 6 (6.0%) |
| Total | 79 (100.0%) | 100 (100.0%) |
Commute Time in Vanderbilt
The most frequently occuring commute durations in Vanderbilt are 35 to 39 minutes (88 commuters, 49.2%), 30 to 34 minutes (32 commuters, 17.9%), and 90 or more minutes (26 commuters, 14.5%).
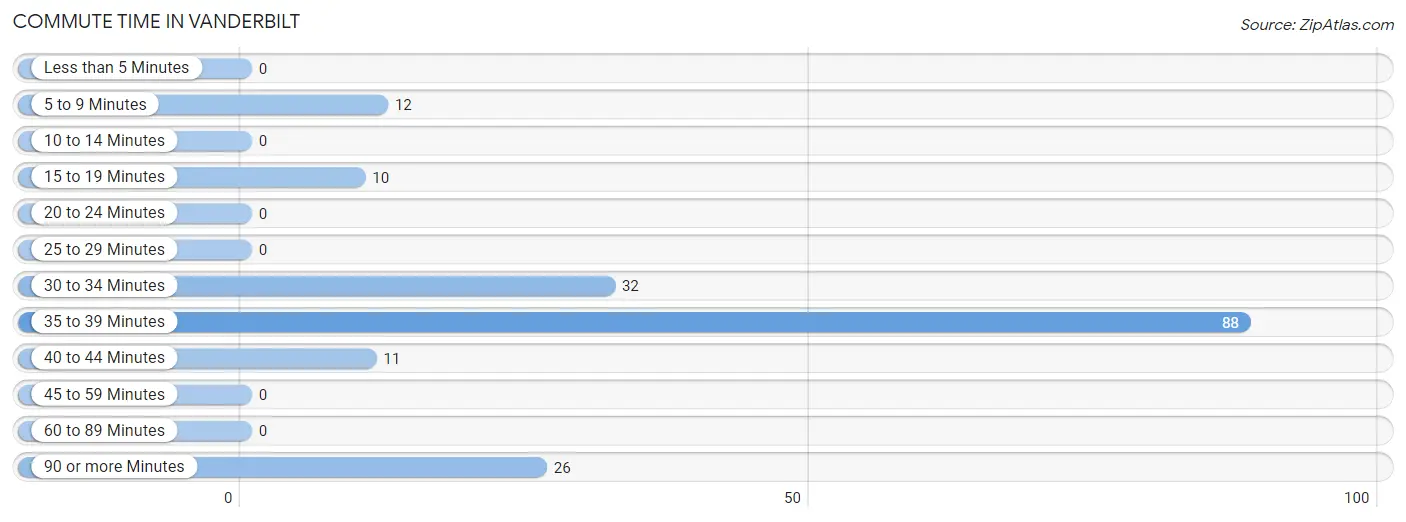
| Commute Time | # Commuters | % Commuters |
| Less than 5 Minutes | 0 | 0.0% |
| 5 to 9 Minutes | 12 | 6.7% |
| 10 to 14 Minutes | 0 | 0.0% |
| 15 to 19 Minutes | 10 | 5.6% |
| 20 to 24 Minutes | 0 | 0.0% |
| 25 to 29 Minutes | 0 | 0.0% |
| 30 to 34 Minutes | 32 | 17.9% |
| 35 to 39 Minutes | 88 | 49.2% |
| 40 to 44 Minutes | 11 | 6.1% |
| 45 to 59 Minutes | 0 | 0.0% |
| 60 to 89 Minutes | 0 | 0.0% |
| 90 or more Minutes | 26 | 14.5% |
Commute Time by Sex in Vanderbilt
The most common commute times in Vanderbilt are 30 to 34 minutes (32 commuters, 40.5%) for males and 35 to 39 minutes (88 commuters, 88.0%) for females.
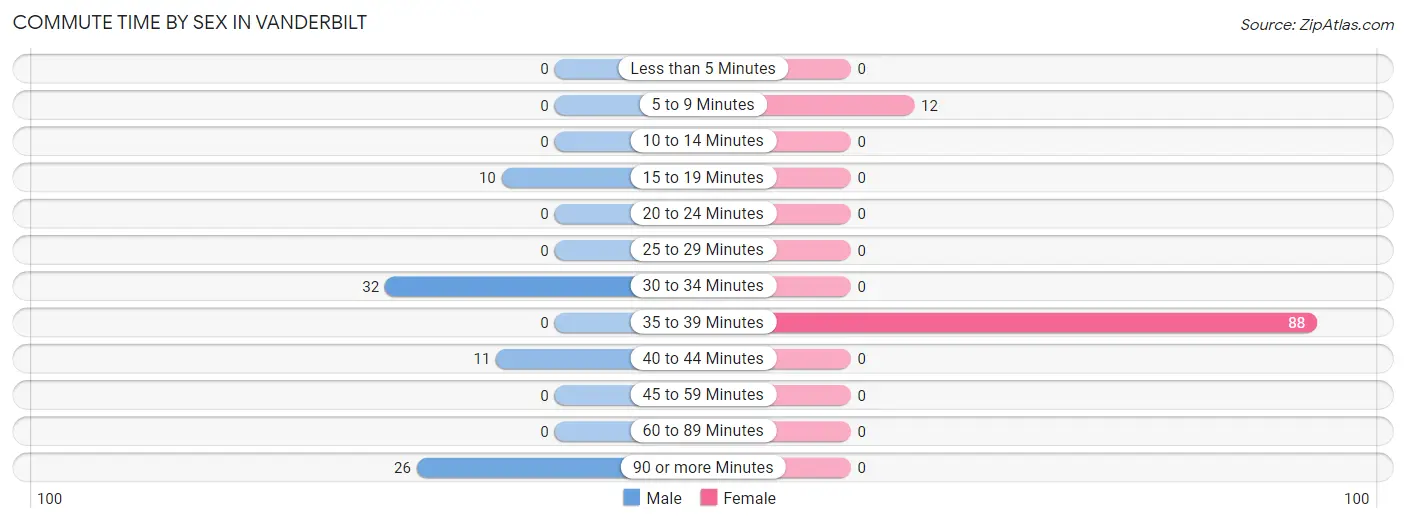
| Commute Time | Male | Female |
| Less than 5 Minutes | 0 (0.0%) | 0 (0.0%) |
| 5 to 9 Minutes | 0 (0.0%) | 12 (12.0%) |
| 10 to 14 Minutes | 0 (0.0%) | 0 (0.0%) |
| 15 to 19 Minutes | 10 (12.7%) | 0 (0.0%) |
| 20 to 24 Minutes | 0 (0.0%) | 0 (0.0%) |
| 25 to 29 Minutes | 0 (0.0%) | 0 (0.0%) |
| 30 to 34 Minutes | 32 (40.5%) | 0 (0.0%) |
| 35 to 39 Minutes | 0 (0.0%) | 88 (88.0%) |
| 40 to 44 Minutes | 11 (13.9%) | 0 (0.0%) |
| 45 to 59 Minutes | 0 (0.0%) | 0 (0.0%) |
| 60 to 89 Minutes | 0 (0.0%) | 0 (0.0%) |
| 90 or more Minutes | 26 (32.9%) | 0 (0.0%) |
Time of Departure to Work by Sex in Vanderbilt
The most frequent times of departure to work in Vanderbilt are 7:30 AM to 7:59 AM (32, 40.5%) for males and 5:00 AM to 5:29 AM (47, 47.0%) for females.
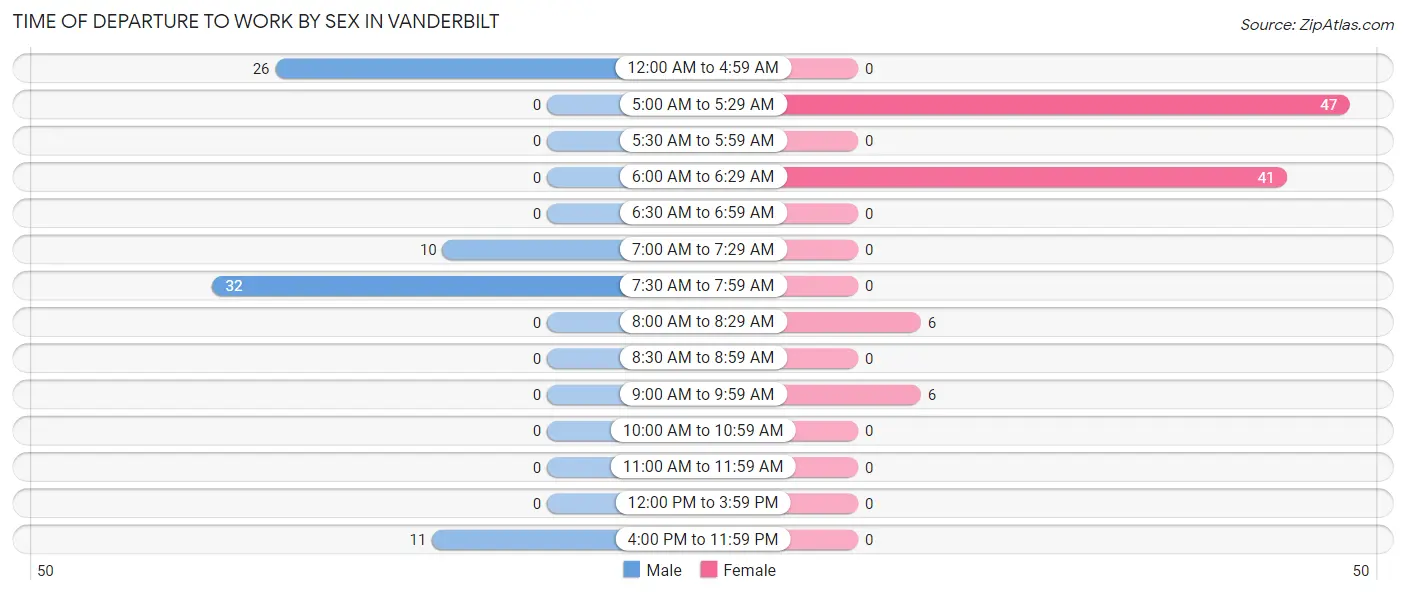
| Time of Departure | Male | Female |
| 12:00 AM to 4:59 AM | 26 (32.9%) | 0 (0.0%) |
| 5:00 AM to 5:29 AM | 0 (0.0%) | 47 (47.0%) |
| 5:30 AM to 5:59 AM | 0 (0.0%) | 0 (0.0%) |
| 6:00 AM to 6:29 AM | 0 (0.0%) | 41 (41.0%) |
| 6:30 AM to 6:59 AM | 0 (0.0%) | 0 (0.0%) |
| 7:00 AM to 7:29 AM | 10 (12.7%) | 0 (0.0%) |
| 7:30 AM to 7:59 AM | 32 (40.5%) | 0 (0.0%) |
| 8:00 AM to 8:29 AM | 0 (0.0%) | 6 (6.0%) |
| 8:30 AM to 8:59 AM | 0 (0.0%) | 0 (0.0%) |
| 9:00 AM to 9:59 AM | 0 (0.0%) | 6 (6.0%) |
| 10:00 AM to 10:59 AM | 0 (0.0%) | 0 (0.0%) |
| 11:00 AM to 11:59 AM | 0 (0.0%) | 0 (0.0%) |
| 12:00 PM to 3:59 PM | 0 (0.0%) | 0 (0.0%) |
| 4:00 PM to 11:59 PM | 11 (13.9%) | 0 (0.0%) |
| Total | 79 (100.0%) | 100 (100.0%) |
Housing Occupancy in Vanderbilt
Occupancy by Ownership in Vanderbilt
Of the total 98 dwellings in Vanderbilt, owner-occupied units account for 98 (100.0%), while renter-occupied units make up 0 (0.0%).
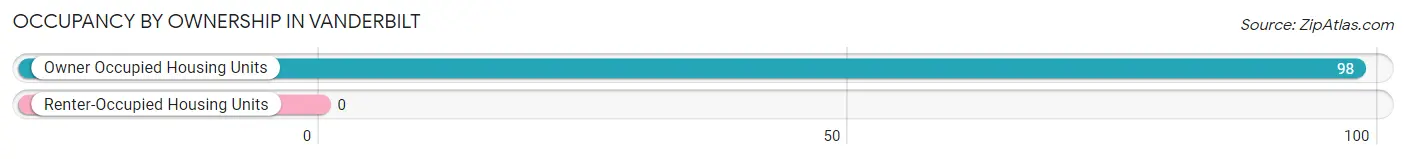
| Occupancy | # Housing Units | % Housing Units |
| Owner Occupied Housing Units | 98 | 100.0% |
| Renter-Occupied Housing Units | 0 | 0.0% |
| Total Occupied Housing Units | 98 | 100.0% |
Occupancy by Household Size in Vanderbilt
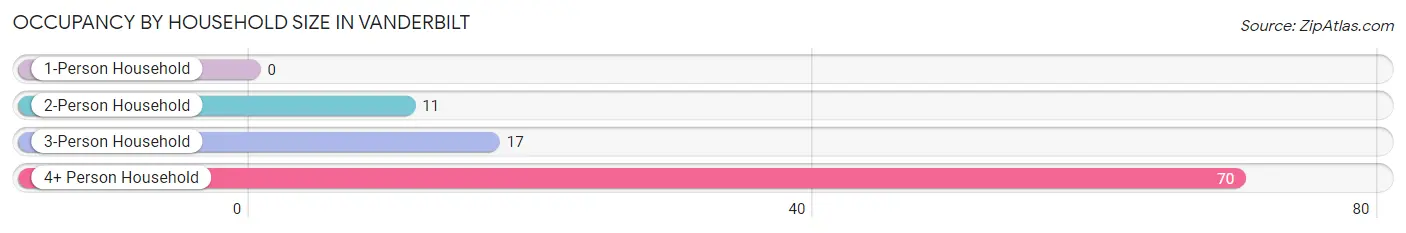
| Household Size | # Housing Units | % Housing Units |
| 1-Person Household | 0 | 0.0% |
| 2-Person Household | 11 | 11.2% |
| 3-Person Household | 17 | 17.3% |
| 4+ Person Household | 70 | 71.4% |
| Total Housing Units | 98 | 100.0% |
Occupancy by Ownership by Household Size in Vanderbilt
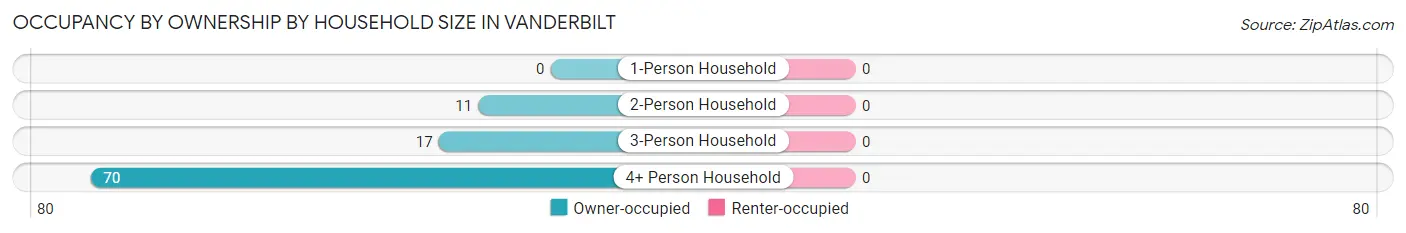
| Household Size | Owner-occupied | Renter-occupied |
| 1-Person Household | 0 (0.0%) | 0 (0.0%) |
| 2-Person Household | 11 (100.0%) | 0 (0.0%) |
| 3-Person Household | 17 (100.0%) | 0 (0.0%) |
| 4+ Person Household | 70 (100.0%) | 0 (0.0%) |
| Total Housing Units | 98 (100.0%) | 0 (0.0%) |
Occupancy by Educational Attainment in Vanderbilt
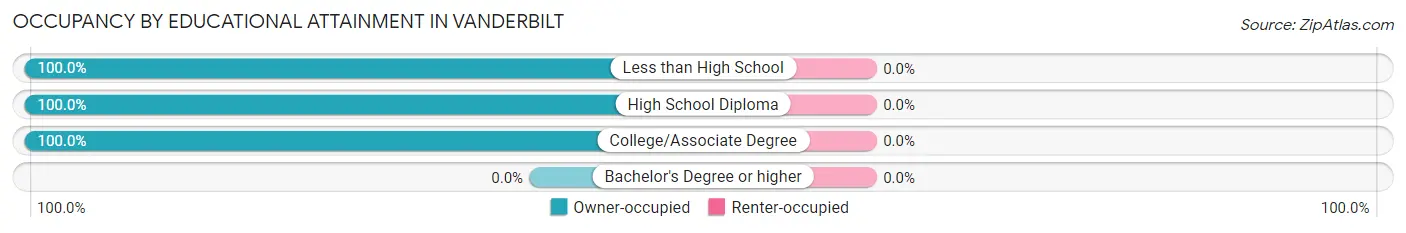
| Household Size | Owner-occupied | Renter-occupied |
| Less than High School | 12 (100.0%) | 0 (0.0%) |
| High School Diploma | 43 (100.0%) | 0 (0.0%) |
| College/Associate Degree | 43 (100.0%) | 0 (0.0%) |
| Bachelor's Degree or higher | 0 (0.0%) | 0 (0.0%) |
Occupancy by Age of Householder in Vanderbilt
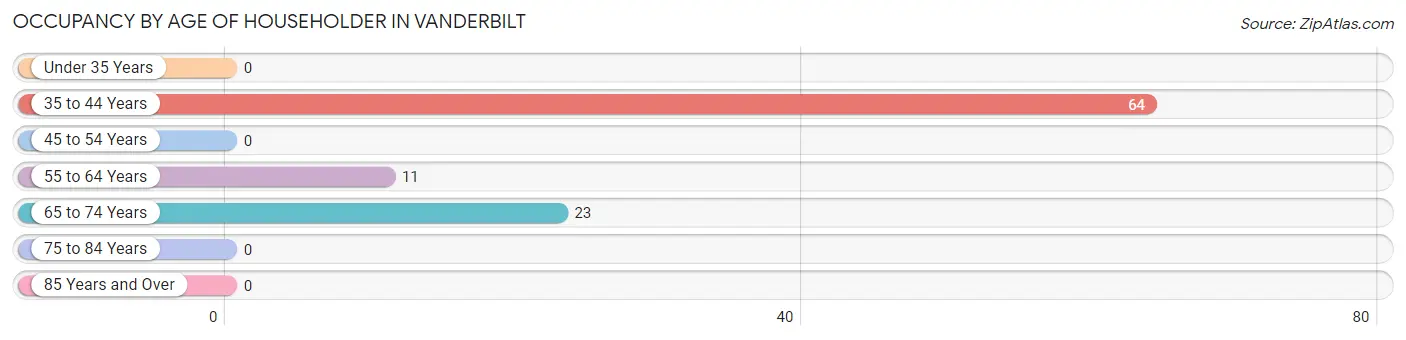
| Age Bracket | # Households | % Households |
| Under 35 Years | 0 | 0.0% |
| 35 to 44 Years | 64 | 65.3% |
| 45 to 54 Years | 0 | 0.0% |
| 55 to 64 Years | 11 | 11.2% |
| 65 to 74 Years | 23 | 23.5% |
| 75 to 84 Years | 0 | 0.0% |
| 85 Years and Over | 0 | 0.0% |
| Total | 98 | 100.0% |
Housing Finances in Vanderbilt
Median Income by Occupancy in Vanderbilt
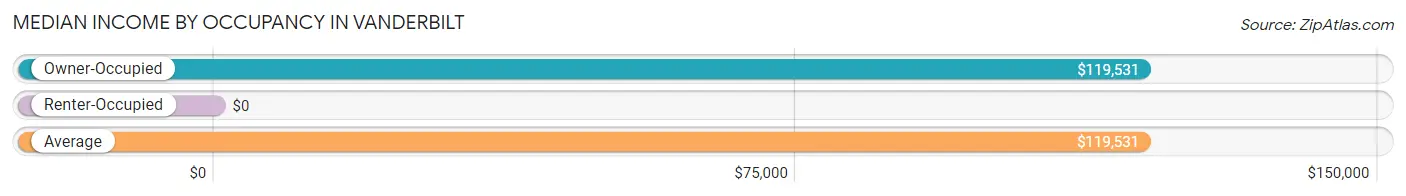
| Occupancy Type | # Households | Median Income |
| Owner-Occupied | 98 (100.0%) | $119,531 |
| Renter-Occupied | 0 (0.0%) | $0 |
| Average | 98 (100.0%) | $119,531 |
Occupancy by Householder Income Bracket in Vanderbilt
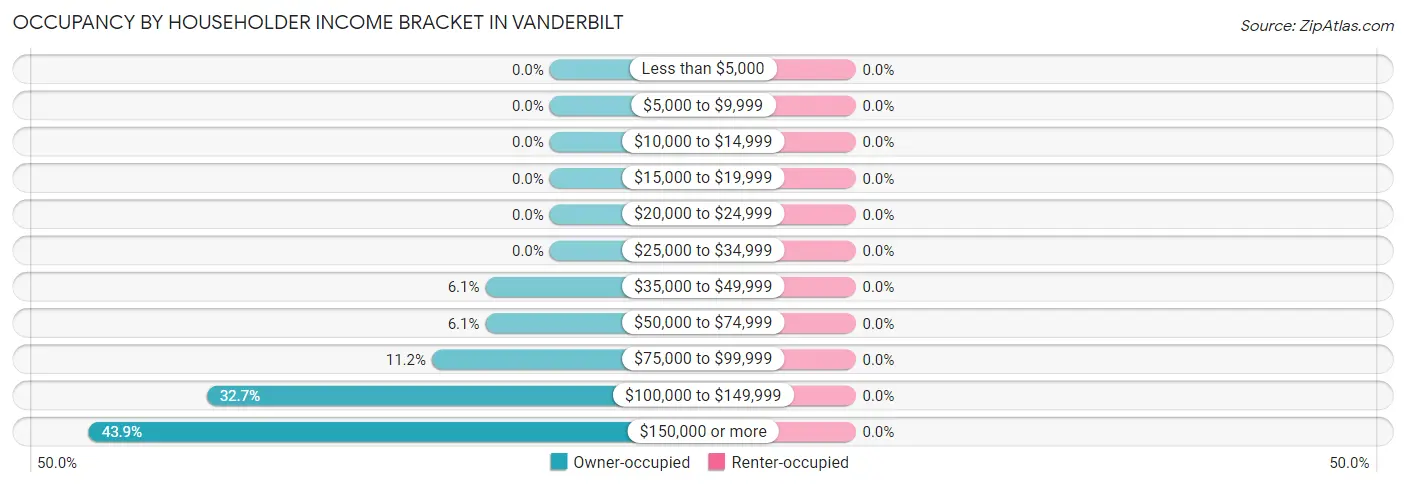
| Income Bracket | Owner-occupied | Renter-occupied |
| Less than $5,000 | 0 (0.0%) | 0 (0.0%) |
| $5,000 to $9,999 | 0 (0.0%) | 0 (0.0%) |
| $10,000 to $14,999 | 0 (0.0%) | 0 (0.0%) |
| $15,000 to $19,999 | 0 (0.0%) | 0 (0.0%) |
| $20,000 to $24,999 | 0 (0.0%) | 0 (0.0%) |
| $25,000 to $34,999 | 0 (0.0%) | 0 (0.0%) |
| $35,000 to $49,999 | 6 (6.1%) | 0 (0.0%) |
| $50,000 to $74,999 | 6 (6.1%) | 0 (0.0%) |
| $75,000 to $99,999 | 11 (11.2%) | 0 (0.0%) |
| $100,000 to $149,999 | 32 (32.7%) | 0 (0.0%) |
| $150,000 or more | 43 (43.9%) | 0 (0.0%) |
| Total | 98 (100.0%) | 0 (0.0%) |
Monthly Housing Cost Tiers in Vanderbilt
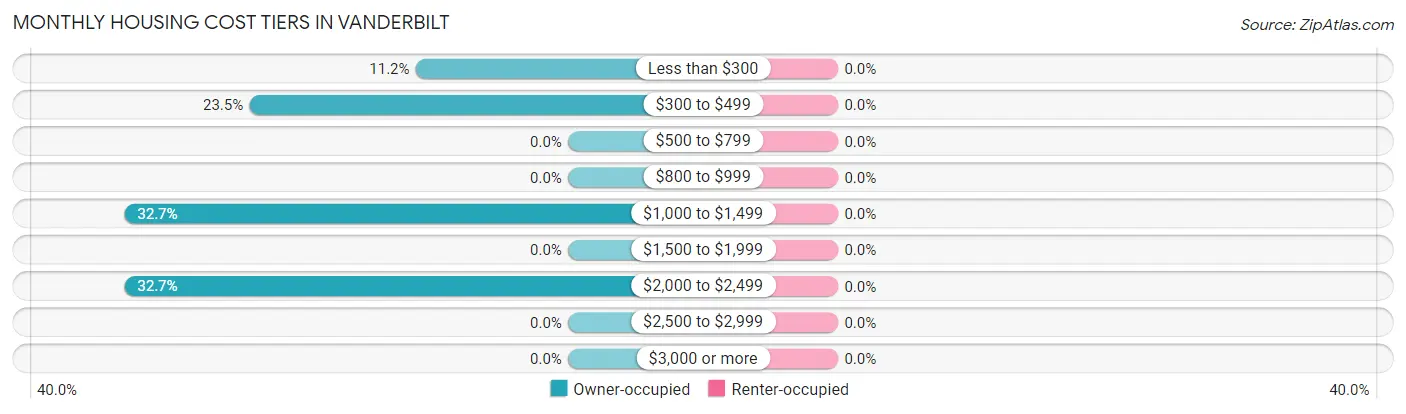
| Monthly Cost | Owner-occupied | Renter-occupied |
| Less than $300 | 11 (11.2%) | 0 (0.0%) |
| $300 to $499 | 23 (23.5%) | 0 (0.0%) |
| $500 to $799 | 0 (0.0%) | 0 (0.0%) |
| $800 to $999 | 0 (0.0%) | 0 (0.0%) |
| $1,000 to $1,499 | 32 (32.7%) | 0 (0.0%) |
| $1,500 to $1,999 | 0 (0.0%) | 0 (0.0%) |
| $2,000 to $2,499 | 32 (32.7%) | 0 (0.0%) |
| $2,500 to $2,999 | 0 (0.0%) | 0 (0.0%) |
| $3,000 or more | 0 (0.0%) | 0 (0.0%) |
| Total | 98 (100.0%) | 0 (0.0%) |
Physical Housing Characteristics in Vanderbilt
Housing Structures in Vanderbilt
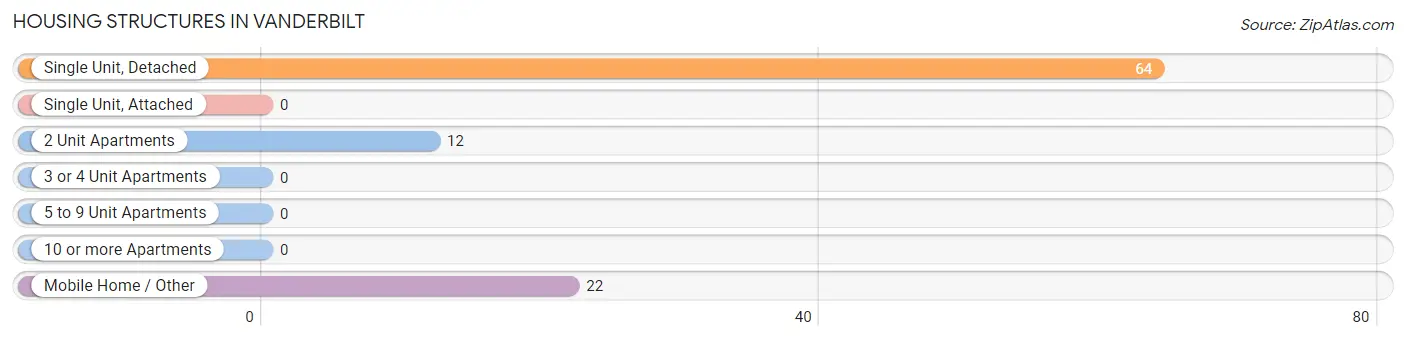
| Structure Type | # Housing Units | % Housing Units |
| Single Unit, Detached | 64 | 65.3% |
| Single Unit, Attached | 0 | 0.0% |
| 2 Unit Apartments | 12 | 12.2% |
| 3 or 4 Unit Apartments | 0 | 0.0% |
| 5 to 9 Unit Apartments | 0 | 0.0% |
| 10 or more Apartments | 0 | 0.0% |
| Mobile Home / Other | 22 | 22.5% |
| Total | 98 | 100.0% |
Housing Structures by Occupancy in Vanderbilt
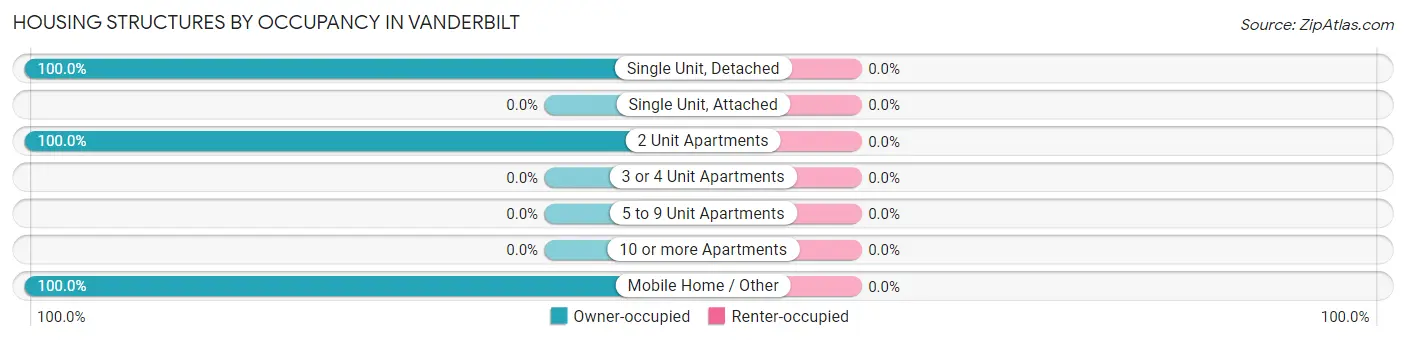
| Structure Type | Owner-occupied | Renter-occupied |
| Single Unit, Detached | 64 (100.0%) | 0 (0.0%) |
| Single Unit, Attached | 0 (0.0%) | 0 (0.0%) |
| 2 Unit Apartments | 12 (100.0%) | 0 (0.0%) |
| 3 or 4 Unit Apartments | 0 (0.0%) | 0 (0.0%) |
| 5 to 9 Unit Apartments | 0 (0.0%) | 0 (0.0%) |
| 10 or more Apartments | 0 (0.0%) | 0 (0.0%) |
| Mobile Home / Other | 22 (100.0%) | 0 (0.0%) |
| Total | 98 (100.0%) | 0 (0.0%) |
Housing Structures by Number of Rooms in Vanderbilt
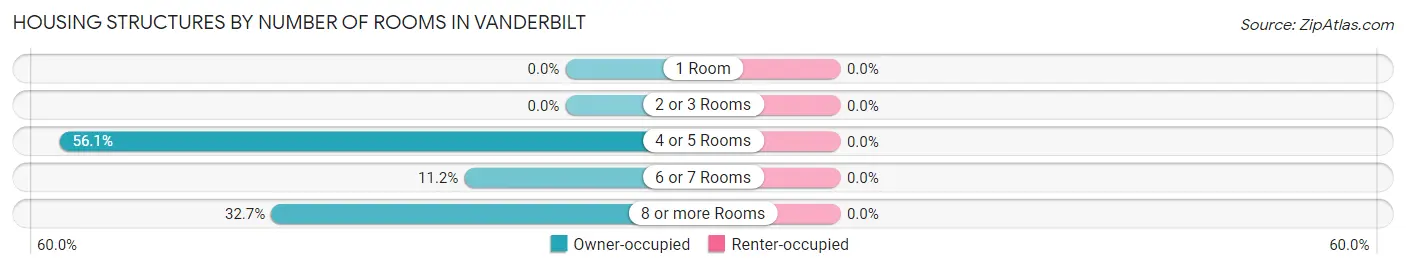
| Number of Rooms | Owner-occupied | Renter-occupied |
| 1 Room | 0 (0.0%) | 0 (0.0%) |
| 2 or 3 Rooms | 0 (0.0%) | 0 (0.0%) |
| 4 or 5 Rooms | 55 (56.1%) | 0 (0.0%) |
| 6 or 7 Rooms | 11 (11.2%) | 0 (0.0%) |
| 8 or more Rooms | 32 (32.7%) | 0 (0.0%) |
| Total | 98 (100.0%) | 0 (0.0%) |
Housing Structure by Heating Type in Vanderbilt
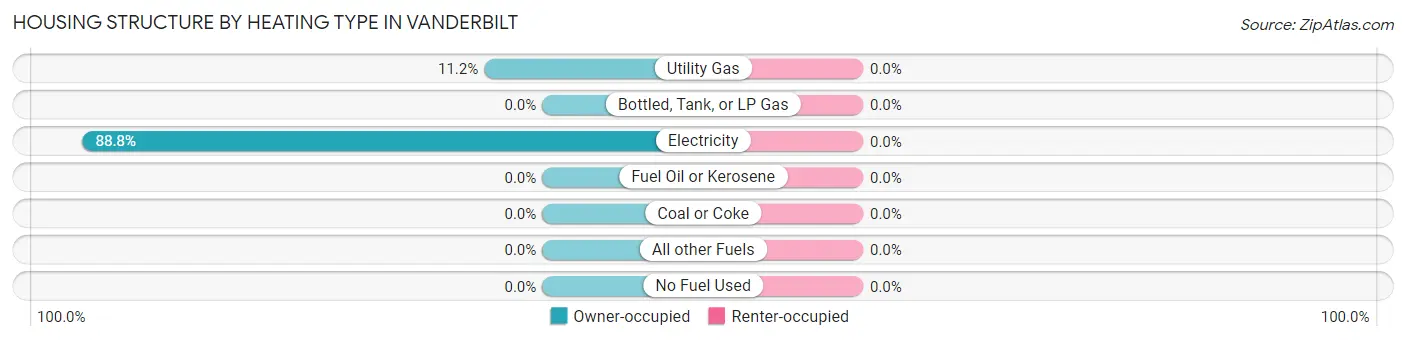
| Heating Type | Owner-occupied | Renter-occupied |
| Utility Gas | 11 (11.2%) | 0 (0.0%) |
| Bottled, Tank, or LP Gas | 0 (0.0%) | 0 (0.0%) |
| Electricity | 87 (88.8%) | 0 (0.0%) |
| Fuel Oil or Kerosene | 0 (0.0%) | 0 (0.0%) |
| Coal or Coke | 0 (0.0%) | 0 (0.0%) |
| All other Fuels | 0 (0.0%) | 0 (0.0%) |
| No Fuel Used | 0 (0.0%) | 0 (0.0%) |
| Total | 98 (100.0%) | 0 (0.0%) |
Household Vehicle Usage in Vanderbilt
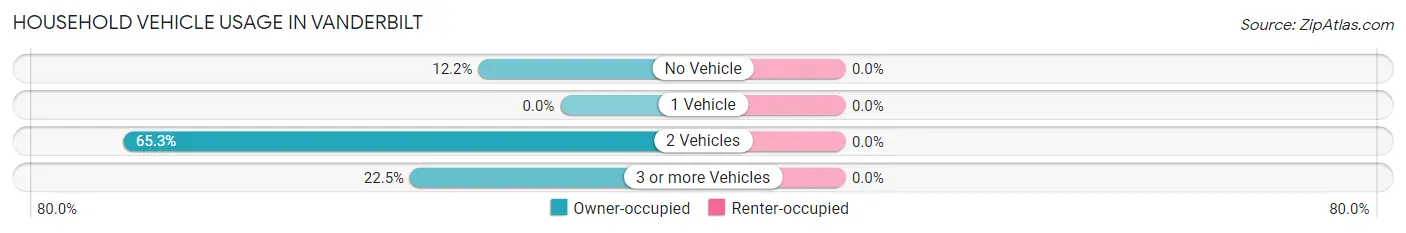
| Vehicles per Household | Owner-occupied | Renter-occupied |
| No Vehicle | 12 (12.2%) | 0 (0.0%) |
| 1 Vehicle | 0 (0.0%) | 0 (0.0%) |
| 2 Vehicles | 64 (65.3%) | 0 (0.0%) |
| 3 or more Vehicles | 22 (22.5%) | 0 (0.0%) |
| Total | 98 (100.0%) | 0 (0.0%) |
Real Estate & Mortgages in Vanderbilt
Real Estate and Mortgage Overview in Vanderbilt
| Characteristic | Without Mortgage | With Mortgage |
| Housing Units | 34 | 64 |
| Median Property Value | - | - |
| Median Household Income | $91,136 | $32 |
| Monthly Housing Costs | $318 | $0 |
| Real Estate Taxes | - | - |
Property Value by Mortgage Status in Vanderbilt
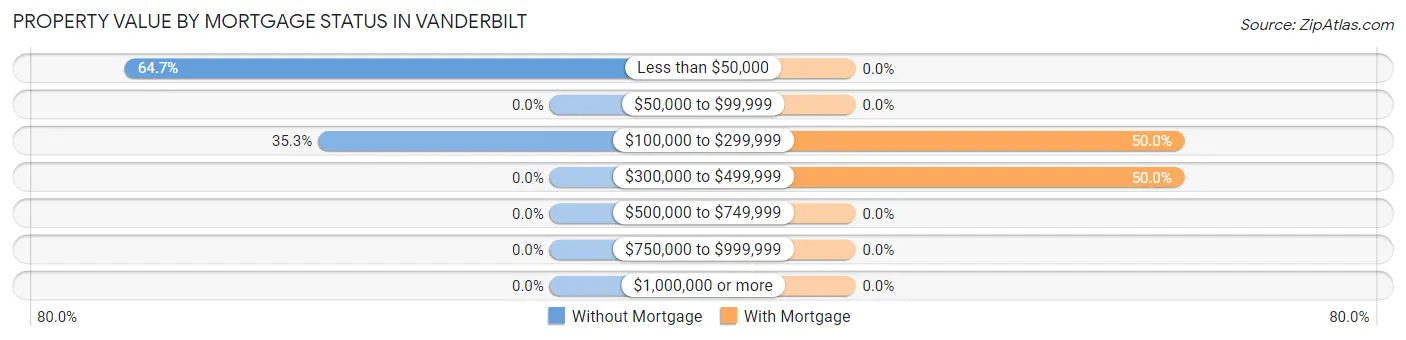
| Property Value | Without Mortgage | With Mortgage |
| Less than $50,000 | 22 (64.7%) | 0 (0.0%) |
| $50,000 to $99,999 | 0 (0.0%) | 0 (0.0%) |
| $100,000 to $299,999 | 12 (35.3%) | 32 (50.0%) |
| $300,000 to $499,999 | 0 (0.0%) | 32 (50.0%) |
| $500,000 to $749,999 | 0 (0.0%) | 0 (0.0%) |
| $750,000 to $999,999 | 0 (0.0%) | 0 (0.0%) |
| $1,000,000 or more | 0 (0.0%) | 0 (0.0%) |
| Total | 34 (100.0%) | 64 (100.0%) |
Household Income by Mortgage Status in Vanderbilt
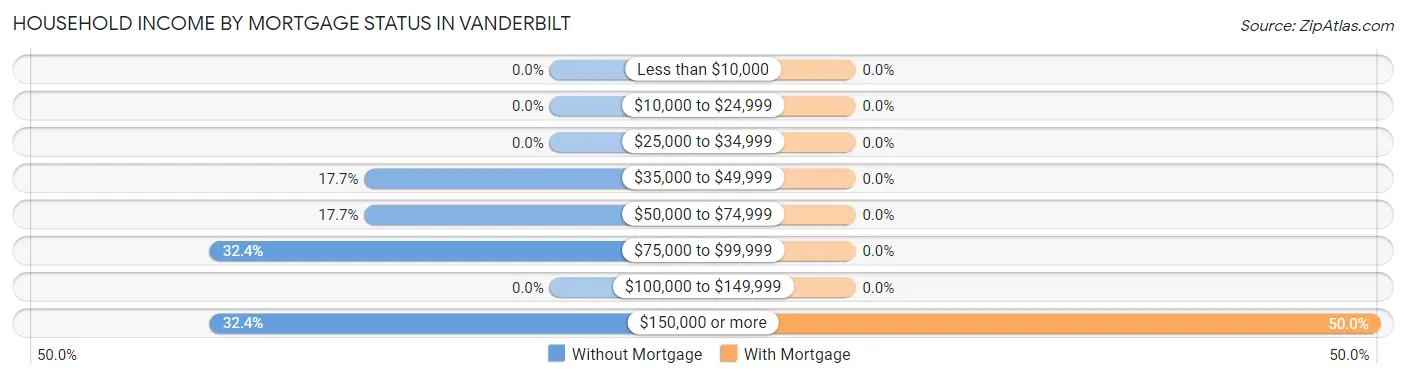
| Household Income | Without Mortgage | With Mortgage |
| Less than $10,000 | 0 (0.0%) | 0 (0.0%) |
| $10,000 to $24,999 | 0 (0.0%) | 0 (0.0%) |
| $25,000 to $34,999 | 0 (0.0%) | 0 (0.0%) |
| $35,000 to $49,999 | 6 (17.6%) | 0 (0.0%) |
| $50,000 to $74,999 | 6 (17.6%) | 0 (0.0%) |
| $75,000 to $99,999 | 11 (32.4%) | 0 (0.0%) |
| $100,000 to $149,999 | 0 (0.0%) | 0 (0.0%) |
| $150,000 or more | 11 (32.4%) | 32 (50.0%) |
| Total | 34 (100.0%) | 64 (100.0%) |
Property Value to Household Income Ratio in Vanderbilt
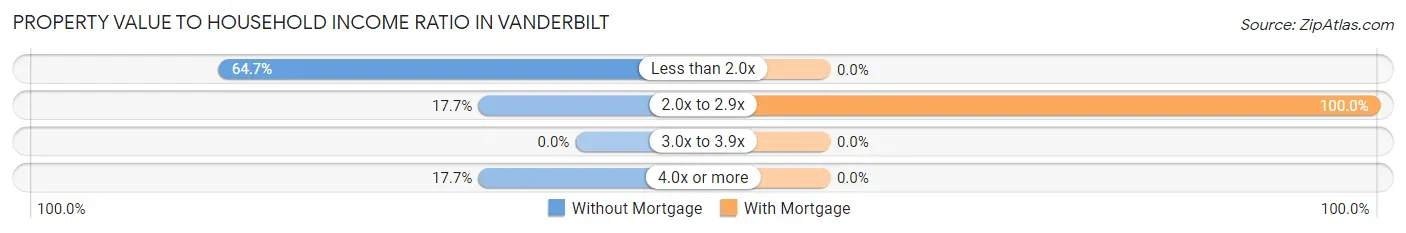
| Value-to-Income Ratio | Without Mortgage | With Mortgage |
| Less than 2.0x | 22 (64.7%) | 0 (0.0%) |
| 2.0x to 2.9x | 6 (17.6%) | 64 (100.0%) |
| 3.0x to 3.9x | 0 (0.0%) | 0 (0.0%) |
| 4.0x or more | 6 (17.6%) | 0 (0.0%) |
| Total | 34 (100.0%) | 64 (100.0%) |
Real Estate Taxes by Mortgage Status in Vanderbilt
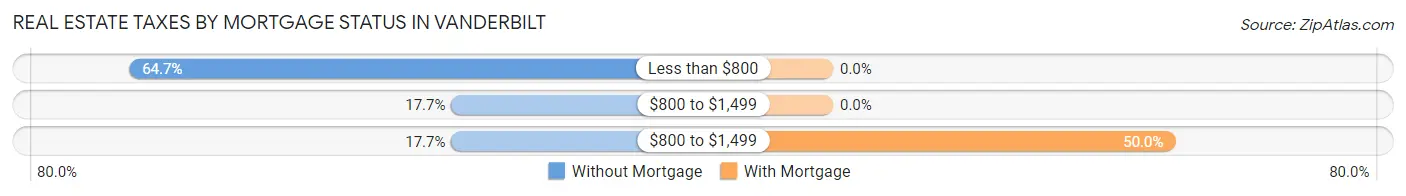
| Property Taxes | Without Mortgage | With Mortgage |
| Less than $800 | 22 (64.7%) | 0 (0.0%) |
| $800 to $1,499 | 6 (17.6%) | 0 (0.0%) |
| $800 to $1,499 | 6 (17.6%) | 32 (50.0%) |
| Total | 34 (100.0%) | 64 (100.0%) |
Health & Disability in Vanderbilt
Health Insurance Coverage by Age in Vanderbilt
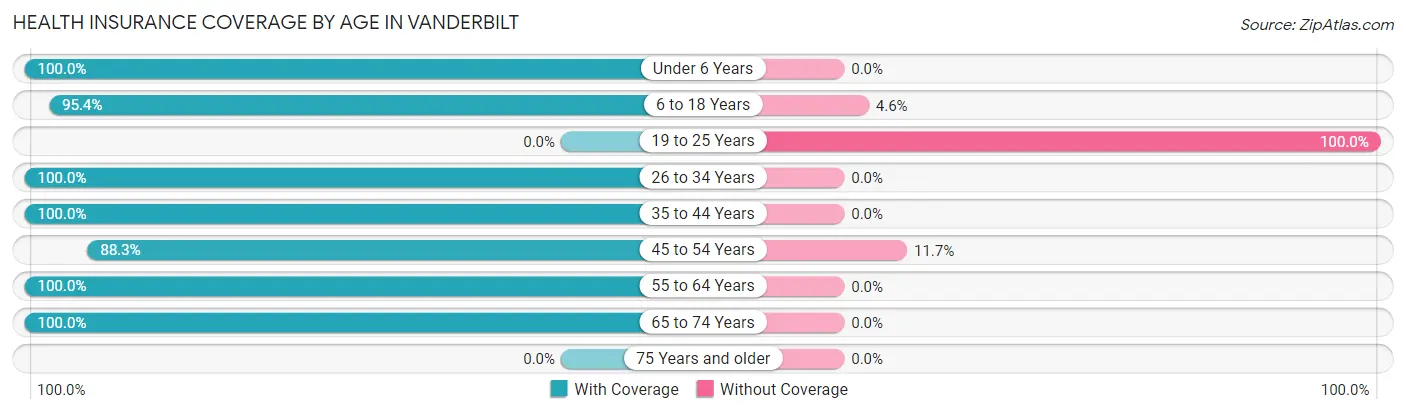
| Age Bracket | With Coverage | Without Coverage |
| Under 6 Years | 30 (100.0%) | 0 (0.0%) |
| 6 to 18 Years | 229 (95.4%) | 11 (4.6%) |
| 19 to 25 Years | 0 (0.0%) | 24 (100.0%) |
| 26 to 34 Years | 25 (100.0%) | 0 (0.0%) |
| 35 to 44 Years | 64 (100.0%) | 0 (0.0%) |
| 45 to 54 Years | 83 (88.3%) | 11 (11.7%) |
| 55 to 64 Years | 26 (100.0%) | 0 (0.0%) |
| 65 to 74 Years | 23 (100.0%) | 0 (0.0%) |
| 75 Years and older | 0 (0.0%) | 0 (0.0%) |
| Total | 480 (91.2%) | 46 (8.7%) |
Health Insurance Coverage by Citizenship Status in Vanderbilt
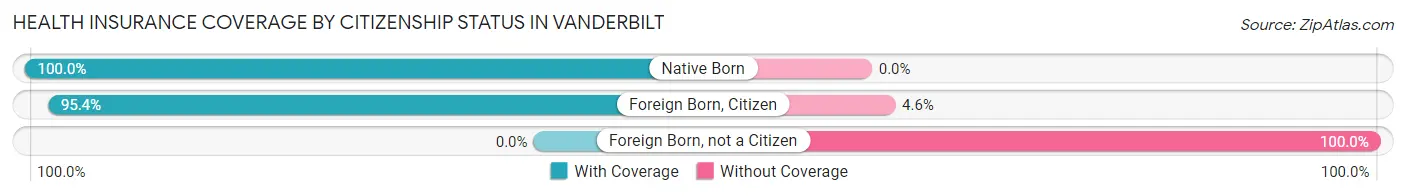
| Citizenship Status | With Coverage | Without Coverage |
| Native Born | 30 (100.0%) | 0 (0.0%) |
| Foreign Born, Citizen | 229 (95.4%) | 11 (4.6%) |
| Foreign Born, not a Citizen | 0 (0.0%) | 24 (100.0%) |
Health Insurance Coverage by Household Income in Vanderbilt
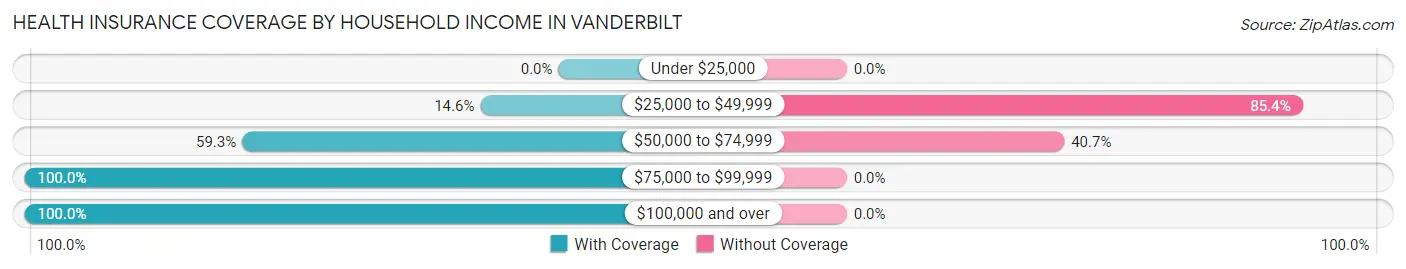
| Household Income | With Coverage | Without Coverage |
| Under $25,000 | 0 (0.0%) | 0 (0.0%) |
| $25,000 to $49,999 | 6 (14.6%) | 35 (85.4%) |
| $50,000 to $74,999 | 16 (59.3%) | 11 (40.7%) |
| $75,000 to $99,999 | 20 (100.0%) | 0 (0.0%) |
| $100,000 and over | 438 (100.0%) | 0 (0.0%) |
Public vs Private Health Insurance Coverage by Age in Vanderbilt
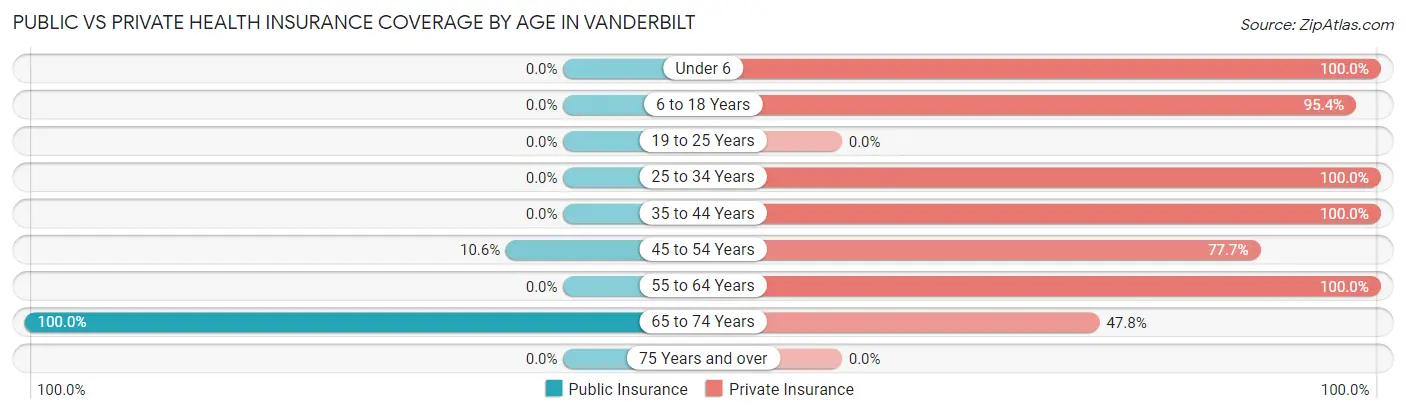
| Age Bracket | Public Insurance | Private Insurance |
| Under 6 | 0 (0.0%) | 30 (100.0%) |
| 6 to 18 Years | 0 (0.0%) | 229 (95.4%) |
| 19 to 25 Years | 0 (0.0%) | 0 (0.0%) |
| 25 to 34 Years | 0 (0.0%) | 25 (100.0%) |
| 35 to 44 Years | 0 (0.0%) | 64 (100.0%) |
| 45 to 54 Years | 10 (10.6%) | 73 (77.7%) |
| 55 to 64 Years | 0 (0.0%) | 26 (100.0%) |
| 65 to 74 Years | 23 (100.0%) | 11 (47.8%) |
| 75 Years and over | 0 (0.0%) | 0 (0.0%) |
| Total | 33 (6.3%) | 458 (87.1%) |
Disability Status by Sex by Age in Vanderbilt
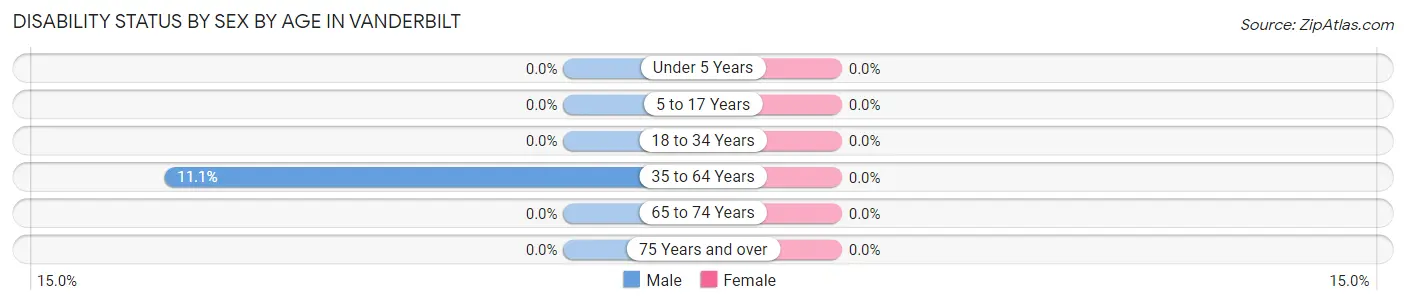
| Age Bracket | Male | Female |
| Under 5 Years | 0 (0.0%) | 0 (0.0%) |
| 5 to 17 Years | 0 (0.0%) | 0 (0.0%) |
| 18 to 34 Years | 0 (0.0%) | 0 (0.0%) |
| 35 to 64 Years | 10 (11.1%) | 0 (0.0%) |
| 65 to 74 Years | 0 (0.0%) | 0 (0.0%) |
| 75 Years and over | 0 (0.0%) | 0 (0.0%) |
Disability Class by Sex by Age in Vanderbilt
Disability Class: Hearing Difficulty
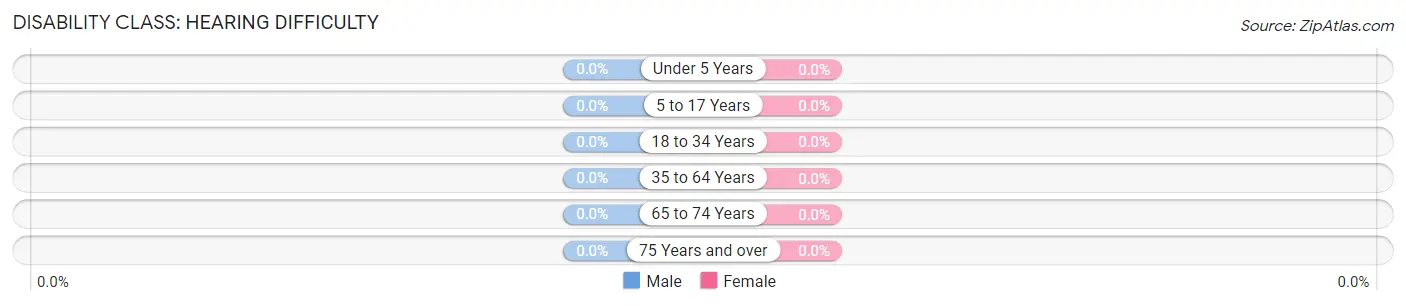
| Age Bracket | Male | Female |
| Under 5 Years | 0 (0.0%) | 0 (0.0%) |
| 5 to 17 Years | 0 (0.0%) | 0 (0.0%) |
| 18 to 34 Years | 0 (0.0%) | 0 (0.0%) |
| 35 to 64 Years | 0 (0.0%) | 0 (0.0%) |
| 65 to 74 Years | 0 (0.0%) | 0 (0.0%) |
| 75 Years and over | 0 (0.0%) | 0 (0.0%) |
Disability Class: Vision Difficulty
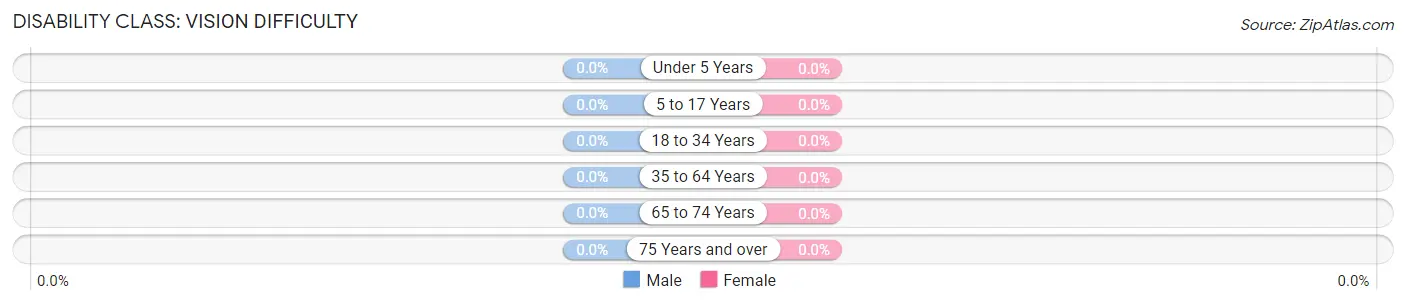
| Age Bracket | Male | Female |
| Under 5 Years | 0 (0.0%) | 0 (0.0%) |
| 5 to 17 Years | 0 (0.0%) | 0 (0.0%) |
| 18 to 34 Years | 0 (0.0%) | 0 (0.0%) |
| 35 to 64 Years | 0 (0.0%) | 0 (0.0%) |
| 65 to 74 Years | 0 (0.0%) | 0 (0.0%) |
| 75 Years and over | 0 (0.0%) | 0 (0.0%) |
Disability Class: Cognitive Difficulty
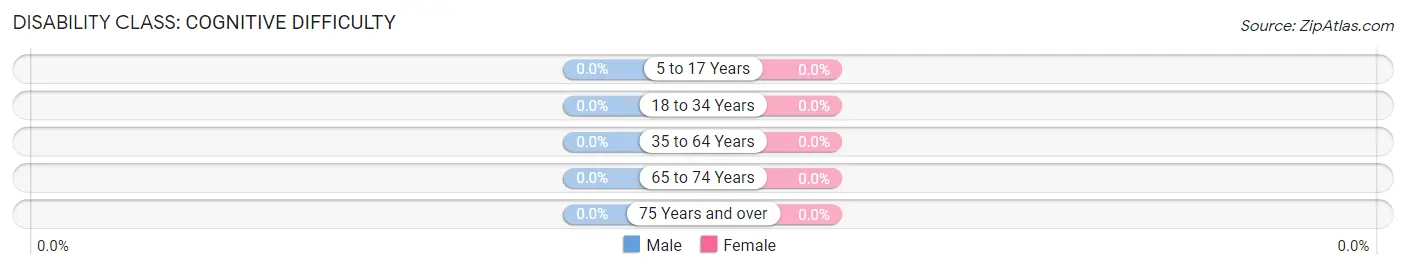
| Age Bracket | Male | Female |
| 5 to 17 Years | 0 (0.0%) | 0 (0.0%) |
| 18 to 34 Years | 0 (0.0%) | 0 (0.0%) |
| 35 to 64 Years | 0 (0.0%) | 0 (0.0%) |
| 65 to 74 Years | 0 (0.0%) | 0 (0.0%) |
| 75 Years and over | 0 (0.0%) | 0 (0.0%) |
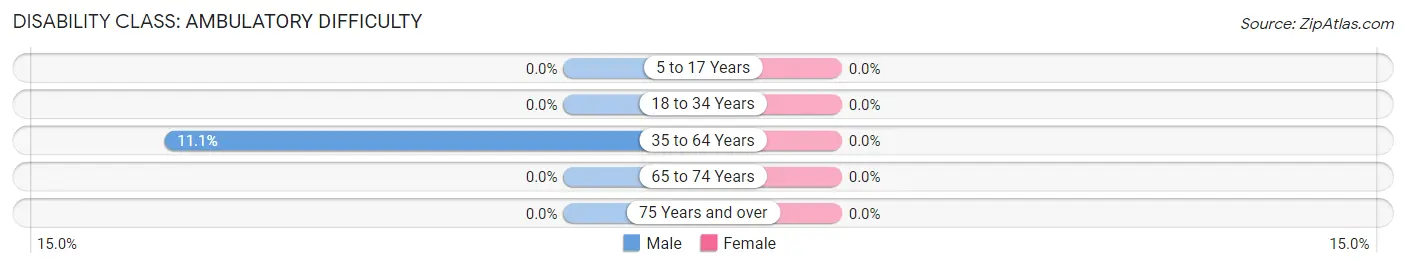
Disability Class: Ambulatory Difficulty
| Age Bracket | Male | Female |
| 5 to 17 Years | 0 (0.0%) | 0 (0.0%) |
| 18 to 34 Years | 0 (0.0%) | 0 (0.0%) |
| 35 to 64 Years | 10 (11.1%) | 0 (0.0%) |
| 65 to 74 Years | 0 (0.0%) | 0 (0.0%) |
| 75 Years and over | 0 (0.0%) | 0 (0.0%) |
Disability Class: Self-Care Difficulty
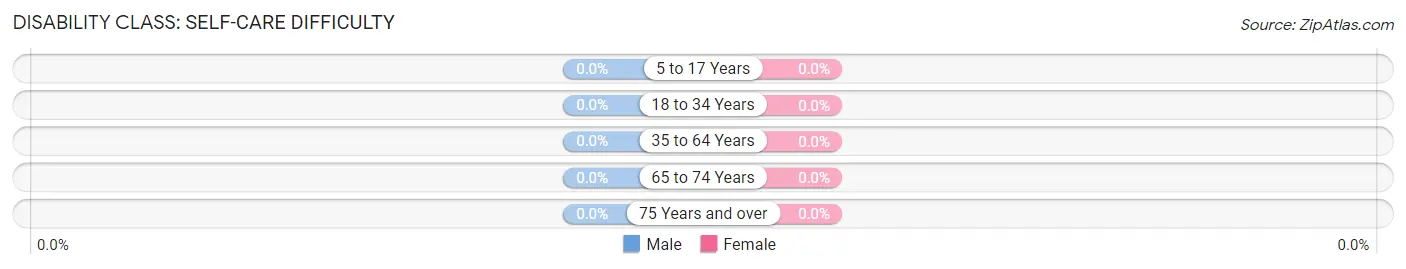
| Age Bracket | Male | Female |
| 5 to 17 Years | 0 (0.0%) | 0 (0.0%) |
| 18 to 34 Years | 0 (0.0%) | 0 (0.0%) |
| 35 to 64 Years | 0 (0.0%) | 0 (0.0%) |
| 65 to 74 Years | 0 (0.0%) | 0 (0.0%) |
| 75 Years and over | 0 (0.0%) | 0 (0.0%) |
Technology Access in Vanderbilt
Computing Device Access in Vanderbilt
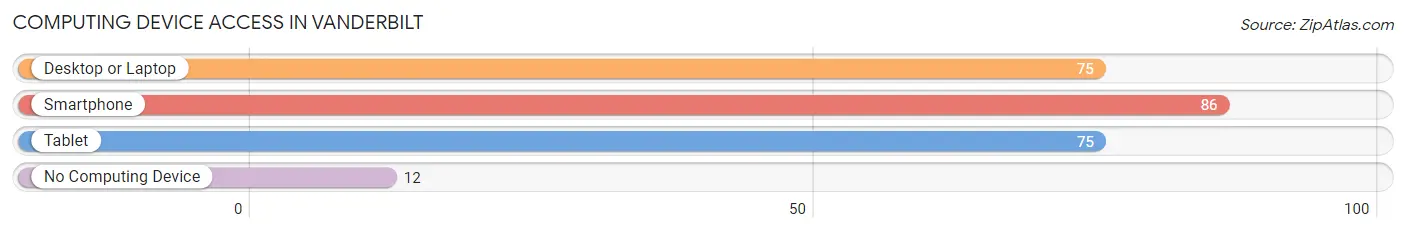
| Device Type | # Households | % Households |
| Desktop or Laptop | 75 | 76.5% |
| Smartphone | 86 | 87.8% |
| Tablet | 75 | 76.5% |
| No Computing Device | 12 | 12.2% |
| Total | 98 | 100.0% |
Internet Access in Vanderbilt
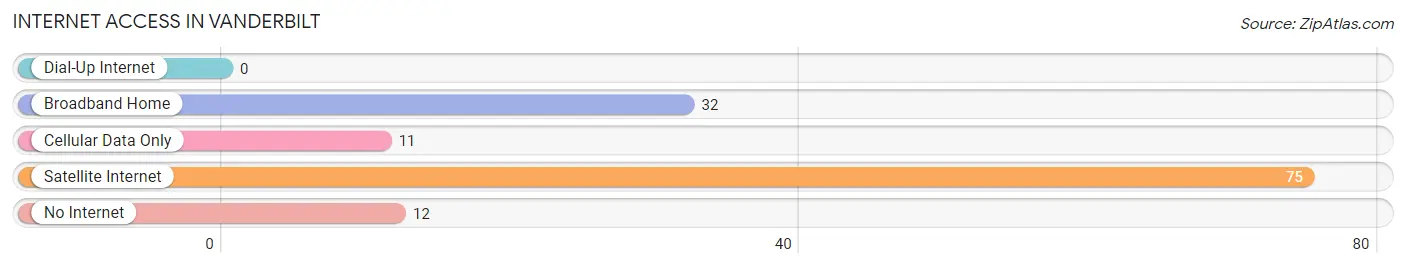
| Internet Type | # Households | % Households |
| Dial-Up Internet | 0 | 0.0% |
| Broadband Home | 32 | 32.7% |
| Cellular Data Only | 11 | 11.2% |
| Satellite Internet | 75 | 76.5% |
| No Internet | 12 | 12.2% |
| Total | 98 | 100.0% |
Vanderbilt Summary
Vanderbilt is a small town located in the state of Texas, in the United States. It is situated in the county of Jackson, and is part of the Victoria, Texas Metropolitan Statistical Area. The town has a population of approximately 1,000 people, and is located about 30 miles south of Victoria.
History
Vanderbilt was founded in 1883 by a group of German immigrants who had settled in the area. The town was named after Cornelius Vanderbilt, a prominent American businessman and philanthropist. The town was originally a farming community, and the main crops grown were cotton, corn, and hay. The town also had a small sawmill and a cotton gin.
In the early 1900s, the town began to grow and develop. The first school was built in 1906, and the first bank opened in 1907. The town also had a post office, a hotel, and a general store.
In the 1920s, the town began to decline due to the Great Depression. Many of the businesses closed, and the population decreased. However, the town was able to survive and eventually began to grow again.
Geography
Vanderbilt is located in the southeastern part of Texas, in Jackson County. The town is situated on the banks of the Lavaca River, and is surrounded by rolling hills and farmland. The climate in the area is generally mild, with hot summers and mild winters.
Economy
The economy of Vanderbilt is largely based on agriculture. The main crops grown in the area are cotton, corn, and hay. The town also has a few small businesses, including a grocery store, a hardware store, and a few restaurants.
Demographics
As of the 2010 census, the population of Vanderbilt was 1,000 people. The racial makeup of the town was 94.2% White, 0.7% African American, 0.2% Native American, 0.2% Asian, 0.1% Pacific Islander, 3.2% from other races, and 1.6% from two or more races. The median household income was $31,250, and the median family income was $37,500.
Conclusion
Vanderbilt is a small town located in the state of Texas, in the United States. It was founded in 1883 by a group of German immigrants, and is situated on the banks of the Lavaca River. The town has a population of approximately 1,000 people, and the economy is largely based on agriculture. The racial makeup of the town is mostly White, with a small percentage of African American, Native American, Asian, and Pacific Islander residents.
Common Questions
What is Per Capita Income in Vanderbilt?
Per Capita income in Vanderbilt is $25,547.
What is the Median Family Income in Vanderbilt?
Median Family Income in Vanderbilt is $119,531.
What is the Median Household income in Vanderbilt?
Median Household Income in Vanderbilt is $119,531.
What is Inequality or Gini Index in Vanderbilt?
Inequality or Gini Index in Vanderbilt is 0.16.
What is the Total Population of Vanderbilt?
Total Population of Vanderbilt is 526.
What is the Total Male Population of Vanderbilt?
Total Male Population of Vanderbilt is 267.
What is the Total Female Population of Vanderbilt?
Total Female Population of Vanderbilt is 259.
What is the Ratio of Males per 100 Females in Vanderbilt?
There are 103.09 Males per 100 Females in Vanderbilt.
What is the Ratio of Females per 100 Males in Vanderbilt?
There are 97.00 Females per 100 Males in Vanderbilt.
What is the Median Population Age in Vanderbilt?
Median Population Age in Vanderbilt is 18.4 Years.
What is the Average Family Size in Vanderbilt
Average Family Size in Vanderbilt is 5.4 People.
What is the Average Household Size in Vanderbilt
Average Household Size in Vanderbilt is 5.4 People.
How Large is the Labor Force in Vanderbilt?
There are 227 People in the Labor Forcein in Vanderbilt.
What is the Percentage of People in the Labor Force in Vanderbilt?
85.0% of People are in the Labor Force in Vanderbilt.
What is the Unemployment Rate in Vanderbilt?
Unemployment Rate in Vanderbilt is 21.1%.