Black Diamond, FL Map & Demographics
Black Diamond Map
Black Diamond Overview
$58,576
PER CAPITA INCOME
$105,223
AVG FAMILY INCOME
$115,045
AVG HOUSEHOLD INCOME
0.29
INEQUALITY / GINI INDEX
1,195
TOTAL POPULATION
486
MALE POPULATION
709
FEMALE POPULATION
68.55
MALES / 100 FEMALES
145.88
FEMALES / 100 MALES
66.9
MEDIAN AGE
2.5
AVG FAMILY SIZE
1.9
AVG HOUSEHOLD SIZE
243
LABOR FORCE [ PEOPLE ]
21.9%
PERCENT IN LABOR FORCE
14.0%
UNEMPLOYMENT RATE
Income in Black Diamond
Income Overview in Black Diamond
Per Capita Income in Black Diamond is $58,576, while median incomes of families and households are $105,223 and $115,045 respectively.
| Characteristic | Number | Measure |
| Per Capita Income | 1,195 | $58,576 |
| Median Family Income | 327 | $105,223 |
| Mean Family Income | 327 | $132,547 |
| Median Household Income | 535 | $115,045 |
| Mean Household Income | 535 | $125,285 |
| Income Deficit | 327 | $0 |
| Wage / Income Gap (%) | 1,195 | 0.00% |
| Wage / Income Gap ($) | 1,195 | 100.00¢ per $1 |
| Gini / Inequality Index | 1,195 | 0.29 |
Earnings by Sex in Black Diamond
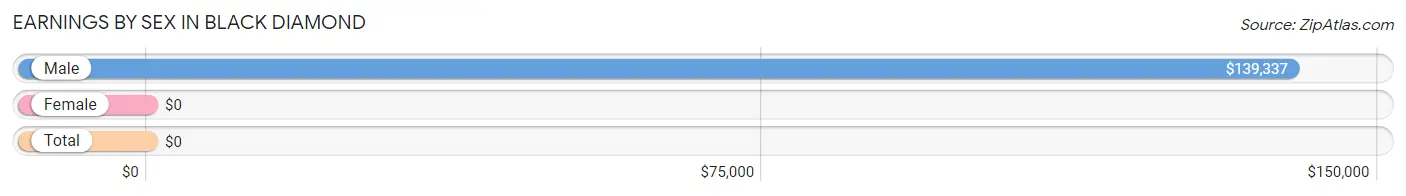
| Sex | Number | Average Earnings |
| Male | 166 (55.3%) | $139,337 |
| Female | 134 (44.7%) | $0 |
| Total | 300 (100.0%) | $0 |
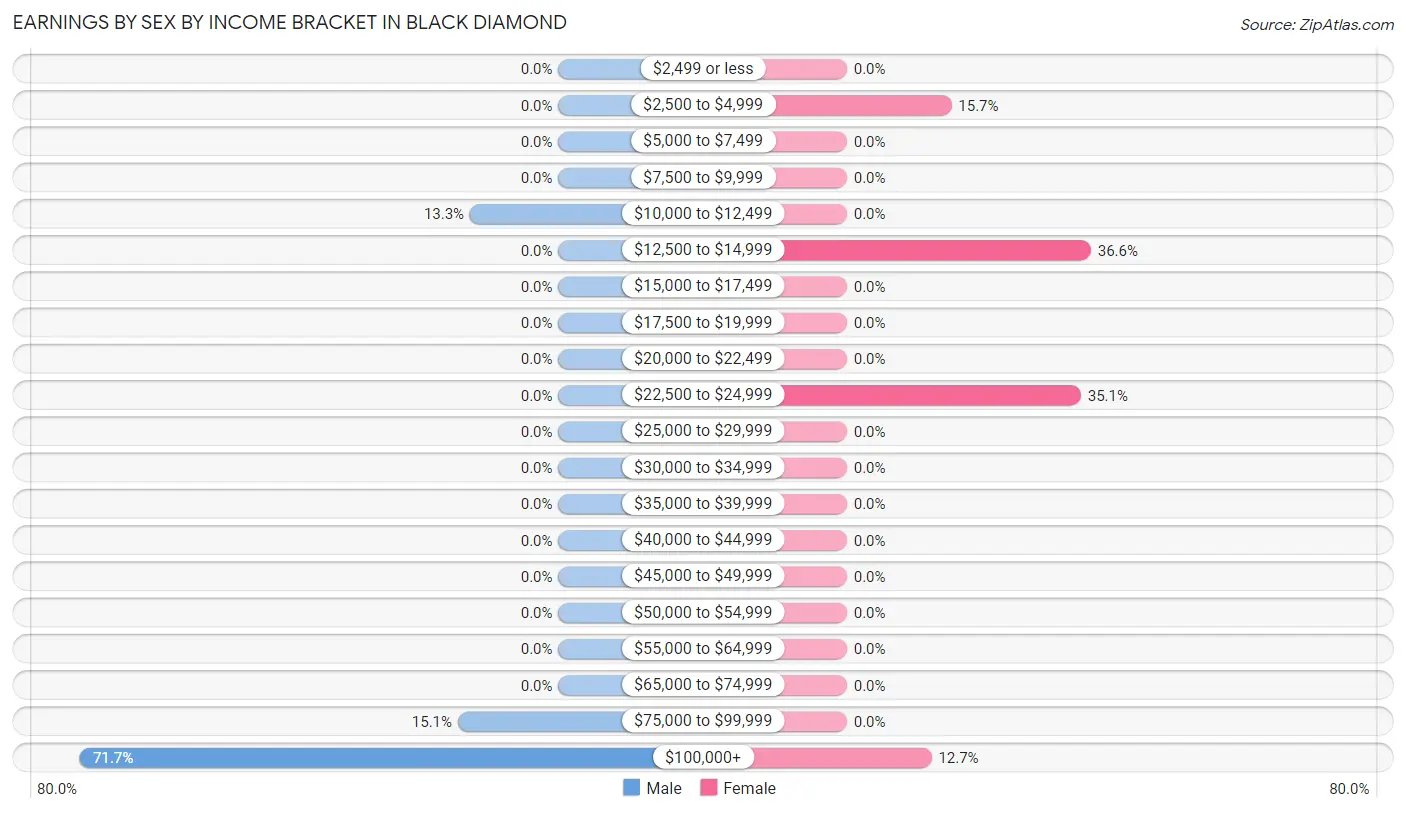
Earnings by Sex by Income Bracket in Black Diamond
The most common earnings brackets in Black Diamond are $100,000+ for men (119 | 71.7%) and $12,500 to $14,999 for women (49 | 36.6%).
| Income | Male | Female |
| $2,499 or less | 0 (0.0%) | 0 (0.0%) |
| $2,500 to $4,999 | 0 (0.0%) | 21 (15.7%) |
| $5,000 to $7,499 | 0 (0.0%) | 0 (0.0%) |
| $7,500 to $9,999 | 0 (0.0%) | 0 (0.0%) |
| $10,000 to $12,499 | 22 (13.3%) | 0 (0.0%) |
| $12,500 to $14,999 | 0 (0.0%) | 49 (36.6%) |
| $15,000 to $17,499 | 0 (0.0%) | 0 (0.0%) |
| $17,500 to $19,999 | 0 (0.0%) | 0 (0.0%) |
| $20,000 to $22,499 | 0 (0.0%) | 0 (0.0%) |
| $22,500 to $24,999 | 0 (0.0%) | 47 (35.1%) |
| $25,000 to $29,999 | 0 (0.0%) | 0 (0.0%) |
| $30,000 to $34,999 | 0 (0.0%) | 0 (0.0%) |
| $35,000 to $39,999 | 0 (0.0%) | 0 (0.0%) |
| $40,000 to $44,999 | 0 (0.0%) | 0 (0.0%) |
| $45,000 to $49,999 | 0 (0.0%) | 0 (0.0%) |
| $50,000 to $54,999 | 0 (0.0%) | 0 (0.0%) |
| $55,000 to $64,999 | 0 (0.0%) | 0 (0.0%) |
| $65,000 to $74,999 | 0 (0.0%) | 0 (0.0%) |
| $75,000 to $99,999 | 25 (15.1%) | 0 (0.0%) |
| $100,000+ | 119 (71.7%) | 17 (12.7%) |
| Total | 166 (100.0%) | 134 (100.0%) |
Earnings by Sex by Educational Attainment in Black Diamond
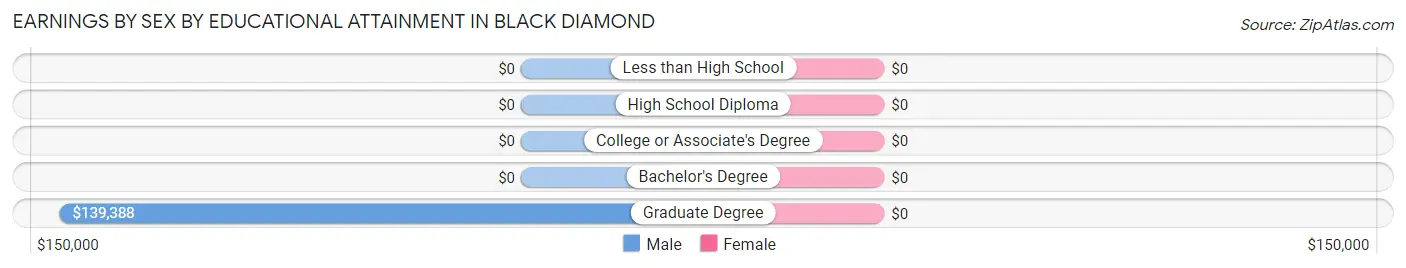
| Educational Attainment | Male Income | Female Income |
| Less than High School | - | - |
| High School Diploma | - | - |
| College or Associate's Degree | - | - |
| Bachelor's Degree | - | - |
| Graduate Degree | $139,388 | $0 |
| Total | $139,337 | $0 |
Family Income in Black Diamond
Family Income Brackets in Black Diamond
According to the Black Diamond family income data, there are 85 families falling into the $50,000 to $74,999 income range, which is the most common income bracket and makes up 26.0% of all families.
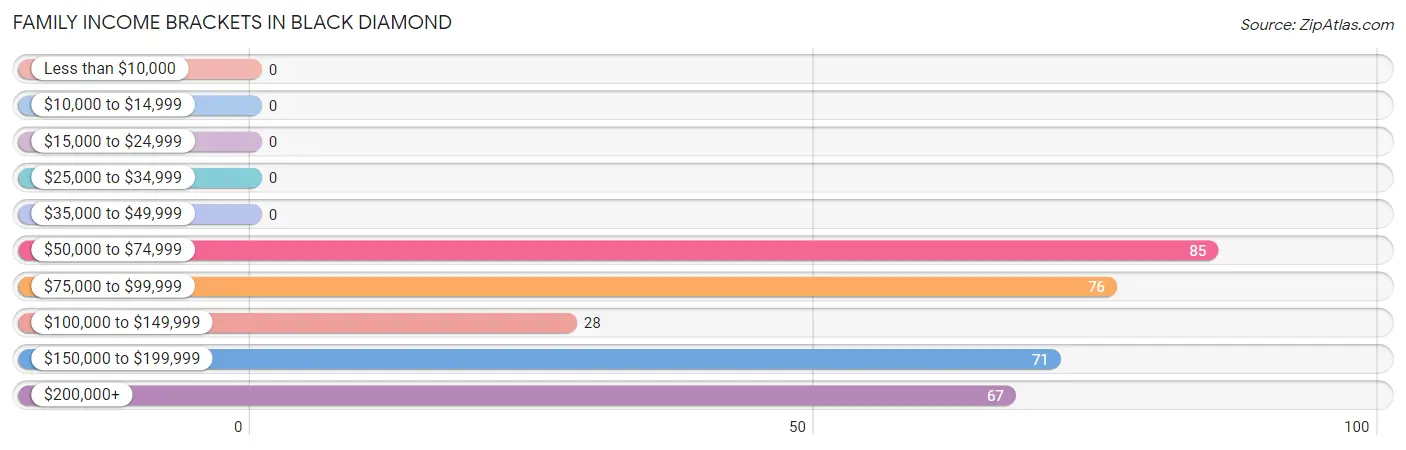
| Income Bracket | # Families | % Families |
| Less than $10,000 | 0 | 0.0% |
| $10,000 to $14,999 | 0 | 0.0% |
| $15,000 to $24,999 | 0 | 0.0% |
| $25,000 to $34,999 | 0 | 0.0% |
| $35,000 to $49,999 | 0 | 0.0% |
| $50,000 to $74,999 | 85 | 26.0% |
| $75,000 to $99,999 | 76 | 23.2% |
| $100,000 to $149,999 | 28 | 8.6% |
| $150,000 to $199,999 | 71 | 21.7% |
| $200,000+ | 67 | 20.5% |
Family Income by Famaliy Size in Black Diamond
2-person families (253 | 77.4%) account for the highest median family income in Black Diamond with $93,813 per family, while 2-person families (253 | 77.4%) have the highest median income of $46,906 per family member.
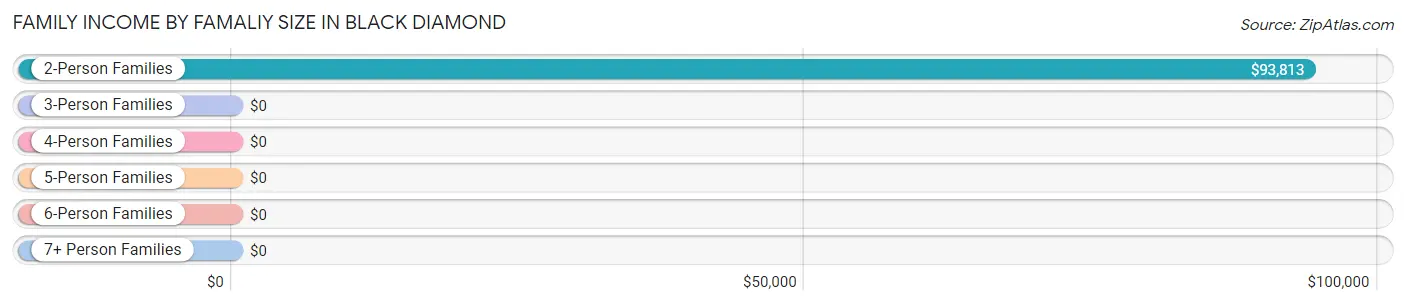
| Income Bracket | # Families | Median Income |
| 2-Person Families | 253 (77.4%) | $93,813 |
| 3-Person Families | 49 (15.0%) | $0 |
| 4-Person Families | 0 (0.0%) | $0 |
| 5-Person Families | 0 (0.0%) | $0 |
| 6-Person Families | 25 (7.6%) | $0 |
| 7+ Person Families | 0 (0.0%) | $0 |
| Total | 327 (100.0%) | $105,223 |
Family Income by Number of Earners in Black Diamond
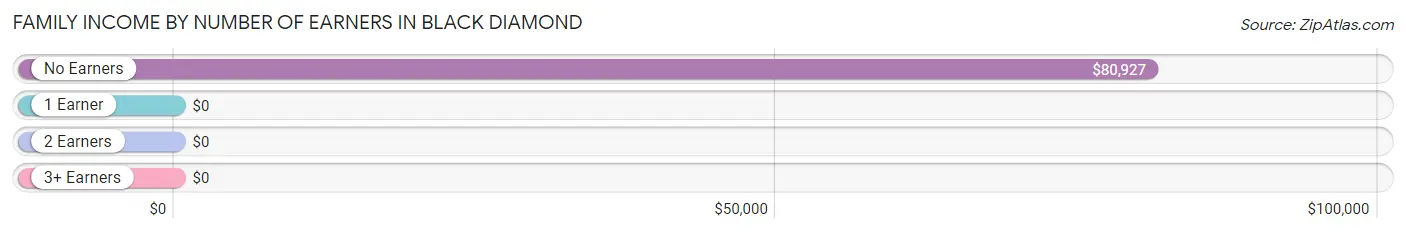
| Number of Earners | # Families | Median Income |
| No Earners | 193 (59.0%) | $80,927 |
| 1 Earner | 47 (14.4%) | $0 |
| 2 Earners | 38 (11.6%) | $0 |
| 3+ Earners | 49 (15.0%) | $0 |
| Total | 327 (100.0%) | $105,223 |
Household Income in Black Diamond
Household Income Brackets in Black Diamond
With 169 households falling in the category, the $100,000 to $149,999 income range is the most frequent in Black Diamond, accounting for 31.6% of all households.
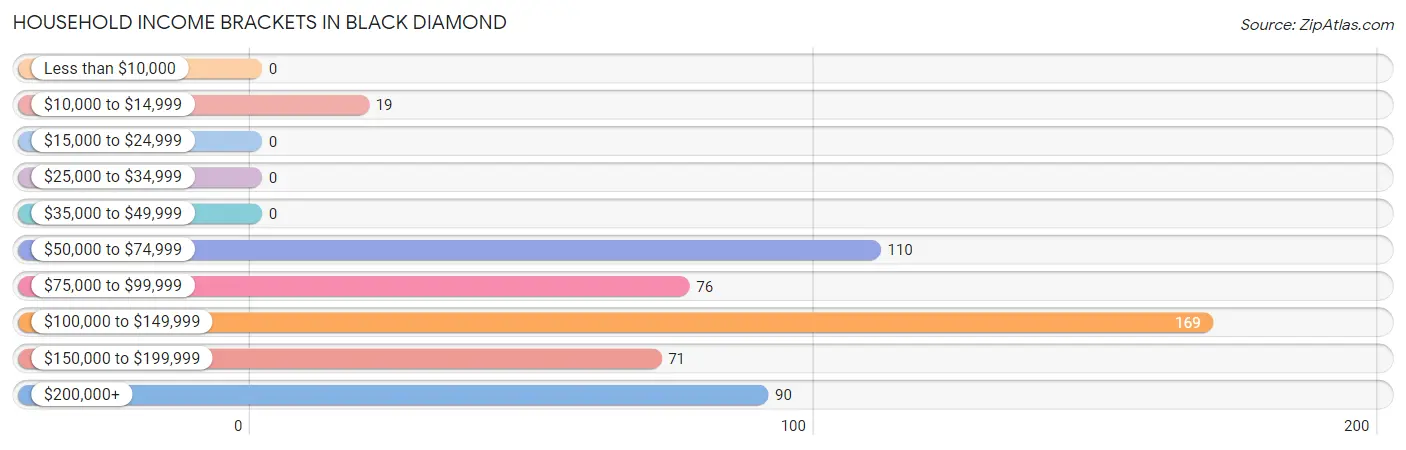
| Income Bracket | # Households | % Households |
| Less than $10,000 | 0 | 0.0% |
| $10,000 to $14,999 | 19 | 3.6% |
| $15,000 to $24,999 | 0 | 0.0% |
| $25,000 to $34,999 | 0 | 0.0% |
| $35,000 to $49,999 | 0 | 0.0% |
| $50,000 to $74,999 | 110 | 20.6% |
| $75,000 to $99,999 | 76 | 14.2% |
| $100,000 to $149,999 | 169 | 31.6% |
| $150,000 to $199,999 | 71 | 13.3% |
| $200,000+ | 90 | 16.8% |
Household Income by Householder Age in Black Diamond
The median household income in Black Diamond is $115,045, with the highest median household income of $150,170 found in the 45 to 64 years age bracket for the primary householder. A total of 219 households (40.9%) fall into this category.
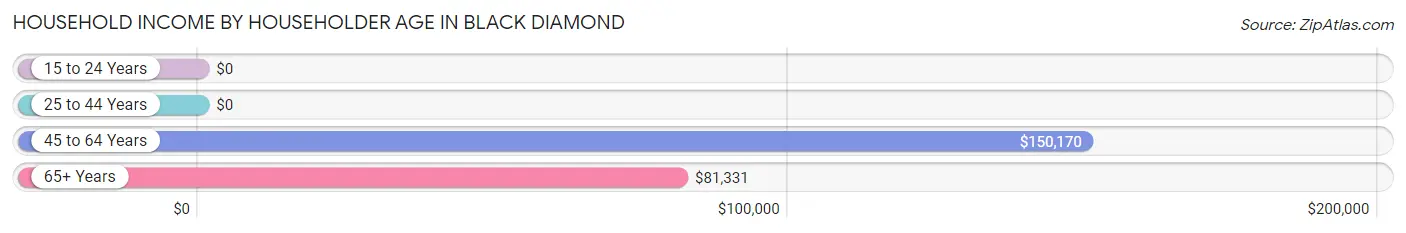
| Income Bracket | # Households | Median Income |
| 15 to 24 Years | 0 (0.0%) | $0 |
| 25 to 44 Years | 25 (4.7%) | $0 |
| 45 to 64 Years | 219 (40.9%) | $150,170 |
| 65+ Years | 291 (54.4%) | $81,331 |
| Total | 535 (100.0%) | $115,045 |
Poverty in Black Diamond
Income Below Poverty by Sex and Age in Black Diamond
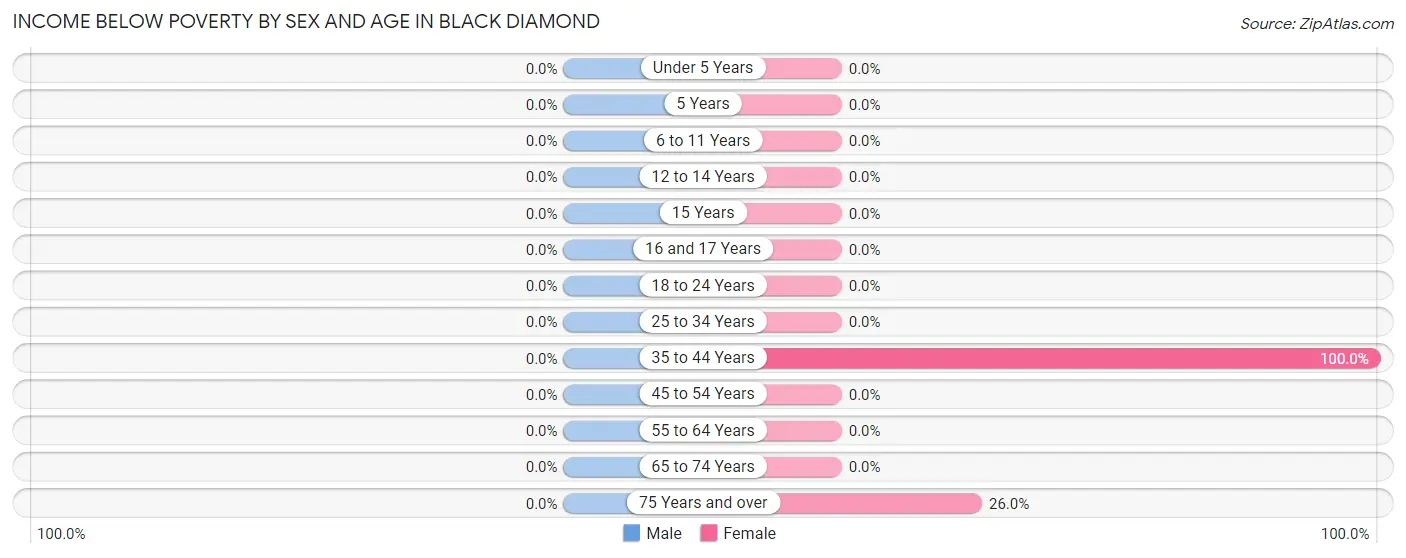
| Age Bracket | Male | Female |
| Under 5 Years | 0 (0.0%) | 0 (0.0%) |
| 5 Years | 0 (0.0%) | 0 (0.0%) |
| 6 to 11 Years | 0 (0.0%) | 0 (0.0%) |
| 12 to 14 Years | 0 (0.0%) | 0 (0.0%) |
| 15 Years | 0 (0.0%) | 0 (0.0%) |
| 16 and 17 Years | 0 (0.0%) | 0 (0.0%) |
| 18 to 24 Years | 0 (0.0%) | 0 (0.0%) |
| 25 to 34 Years | 0 (0.0%) | 0 (0.0%) |
| 35 to 44 Years | 0 (0.0%) | 27 (100.0%) |
| 45 to 54 Years | 0 (0.0%) | 0 (0.0%) |
| 55 to 64 Years | 0 (0.0%) | 0 (0.0%) |
| 65 to 74 Years | 0 (0.0%) | 0 (0.0%) |
| 75 Years and over | 0 (0.0%) | 19 (26.0%) |
| Total | 0 (0.0%) | 46 (7.4%) |
Income Above Poverty by Sex and Age in Black Diamond
According to the poverty statistics in Black Diamond, males aged under 5 years and females aged under 5 years are the age groups that are most secure financially, with 100.0% of males and 100.0% of females in these age groups living above the poverty line.
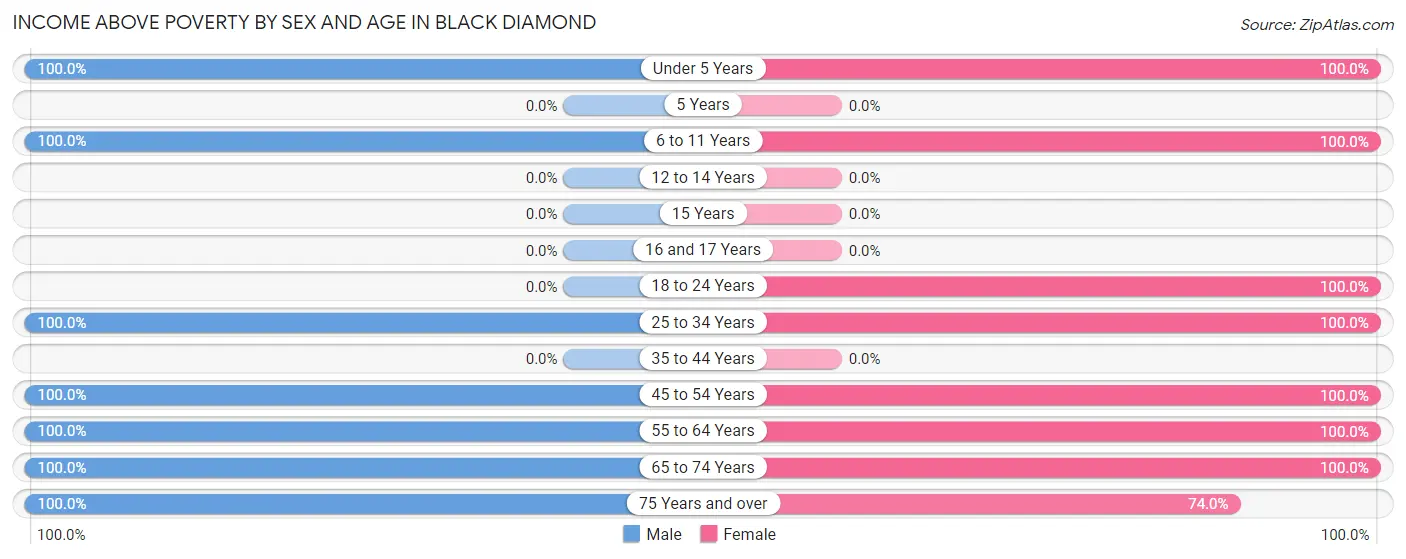
| Age Bracket | Male | Female |
| Under 5 Years | 13 (100.0%) | 24 (100.0%) |
| 5 Years | 0 (0.0%) | 0 (0.0%) |
| 6 to 11 Years | 25 (100.0%) | 24 (100.0%) |
| 12 to 14 Years | 0 (0.0%) | 0 (0.0%) |
| 15 Years | 0 (0.0%) | 0 (0.0%) |
| 16 and 17 Years | 0 (0.0%) | 0 (0.0%) |
| 18 to 24 Years | 0 (0.0%) | 47 (100.0%) |
| 25 to 34 Years | 25 (100.0%) | 34 (100.0%) |
| 35 to 44 Years | 0 (0.0%) | 0 (0.0%) |
| 45 to 54 Years | 23 (100.0%) | 83 (100.0%) |
| 55 to 64 Years | 121 (100.0%) | 110 (100.0%) |
| 65 to 74 Years | 155 (100.0%) | 198 (100.0%) |
| 75 Years and over | 55 (100.0%) | 54 (74.0%) |
| Total | 417 (100.0%) | 574 (92.6%) |
Income Below Poverty Among Married-Couple Families in Black Diamond
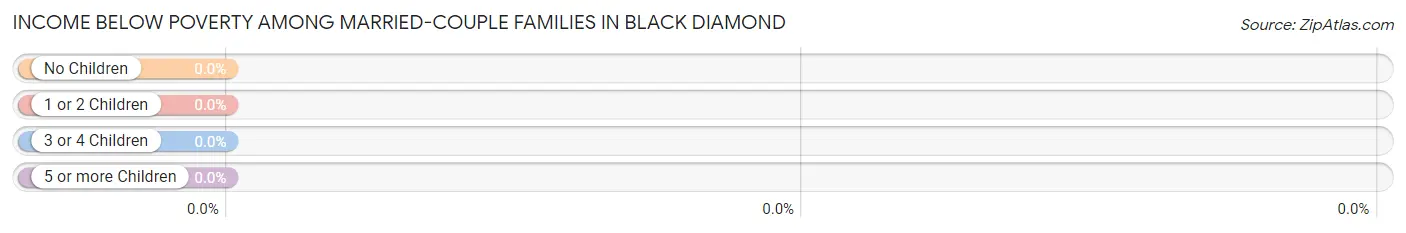
| Children | Above Poverty | Below Poverty |
| No Children | 302 (100.0%) | 0 (0.0%) |
| 1 or 2 Children | 0 (0.0%) | 0 (0.0%) |
| 3 or 4 Children | 25 (100.0%) | 0 (0.0%) |
| 5 or more Children | 0 (0.0%) | 0 (0.0%) |
| Total | 327 (100.0%) | 0 (0.0%) |
Income Below Poverty Among Single-Parent Households in Black Diamond
| Children | Single Father | Single Mother |
| No Children | 0 (0.0%) | 0 (0.0%) |
| 1 or 2 Children | 0 (0.0%) | 0 (0.0%) |
| 3 or 4 Children | 0 (0.0%) | 0 (0.0%) |
| 5 or more Children | 0 (0.0%) | 0 (0.0%) |
| Total | 0 (0.0%) | 0 (0.0%) |
Income Below Poverty Among Married-Couple vs Single-Parent Households in Black Diamond
| Children | Married-Couple Families | Single-Parent Households |
| No Children | 0 (0.0%) | 0 (0.0%) |
| 1 or 2 Children | 0 (0.0%) | 0 (0.0%) |
| 3 or 4 Children | 0 (0.0%) | 0 (0.0%) |
| 5 or more Children | 0 (0.0%) | 0 (0.0%) |
| Total | 0 (0.0%) | 0 (0.0%) |
Race in Black Diamond
The most populous races in Black Diamond are White / Caucasian (1,028 | 86.0%), Two or more Races (147 | 12.3%), and Hispanic or Latino (126 | 10.5%).
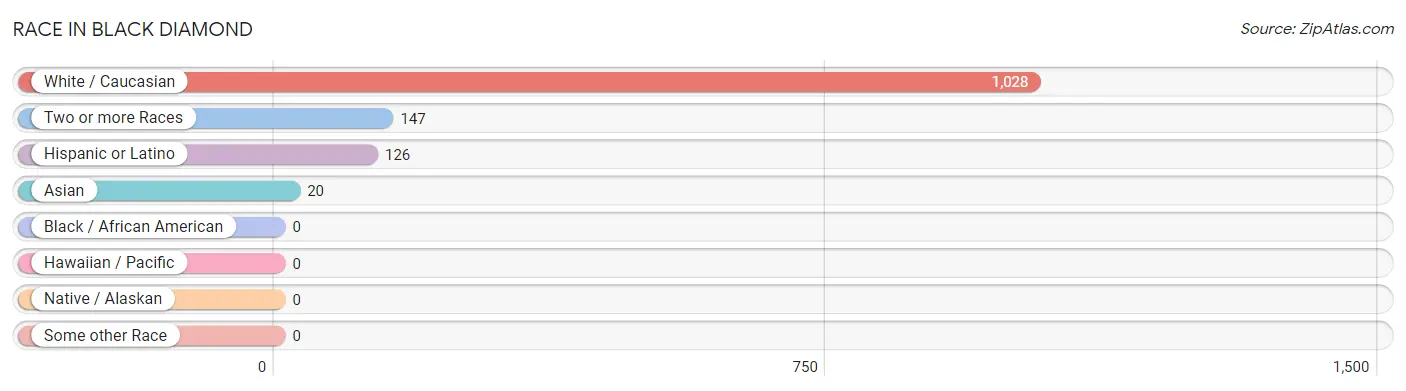
| Race | # Population | % Population |
| Asian | 20 | 1.7% |
| Black / African American | 0 | 0.0% |
| Hawaiian / Pacific | 0 | 0.0% |
| Hispanic or Latino | 126 | 10.5% |
| Native / Alaskan | 0 | 0.0% |
| White / Caucasian | 1,028 | 86.0% |
| Two or more Races | 147 | 12.3% |
| Some other Race | 0 | 0.0% |
| Total | 1,195 | 100.0% |
Ancestry in Black Diamond
The most populous ancestries reported in Black Diamond are English (273 | 22.9%), American (195 | 16.3%), Irish (186 | 15.6%), Italian (117 | 9.8%), and European (112 | 9.4%), together accounting for 73.9% of all Black Diamond residents.
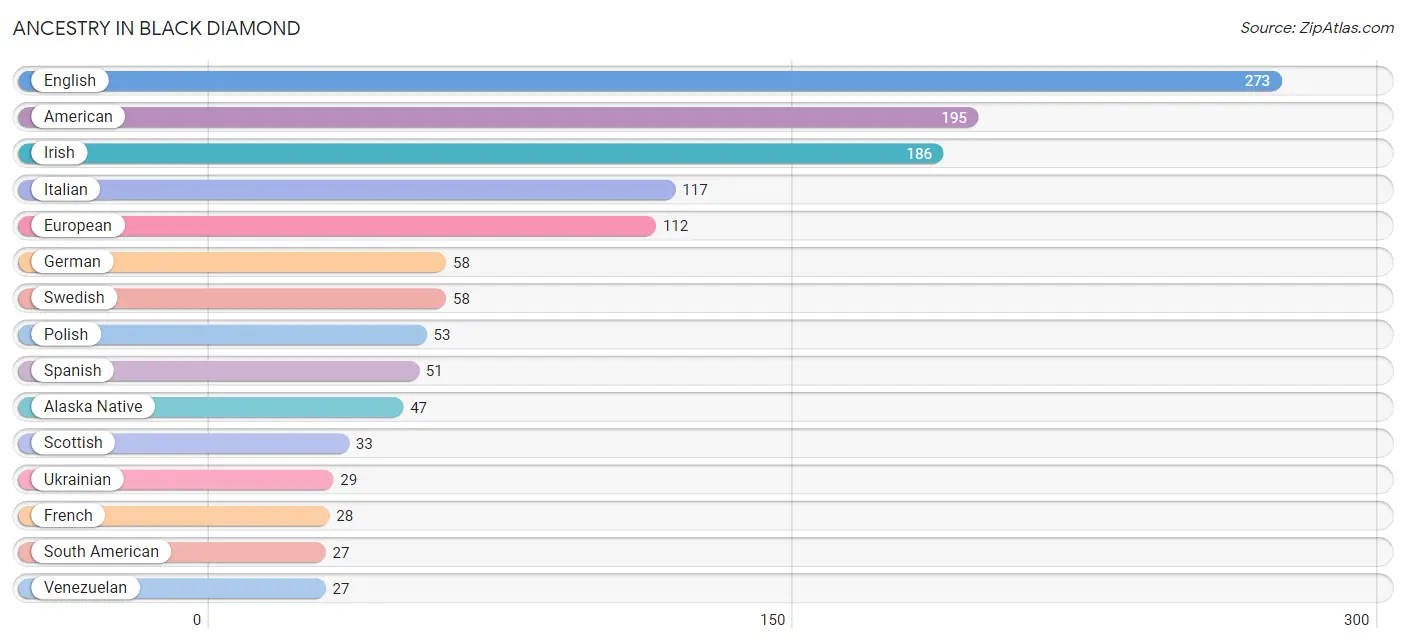
| Ancestry | # Population | % Population |
| Alaska Native | 47 | 3.9% |
| American | 195 | 16.3% |
| Bhutanese | 20 | 1.7% |
| Cuban | 22 | 1.8% |
| Czech | 19 | 1.6% |
| English | 273 | 22.9% |
| European | 112 | 9.4% |
| French | 28 | 2.3% |
| German | 58 | 4.9% |
| Irish | 186 | 15.6% |
| Italian | 117 | 9.8% |
| Polish | 53 | 4.4% |
| Puerto Rican | 26 | 2.2% |
| Russian | 21 | 1.8% |
| Scotch-Irish | 26 | 2.2% |
| Scottish | 33 | 2.8% |
| South American | 27 | 2.3% |
| Spanish | 51 | 4.3% |
| Swedish | 58 | 4.9% |
| Ukrainian | 29 | 2.4% |
| Venezuelan | 27 | 2.3% | View All 21 Rows |
Immigrants in Black Diamond
The most numerous immigrant groups reported in Black Diamond came from Latin America (49 | 4.1%), South America (27 | 2.3%), Venezuela (27 | 2.3%), Caribbean (22 | 1.8%), and Cuba (22 | 1.8%), together accounting for 12.3% of all Black Diamond residents.
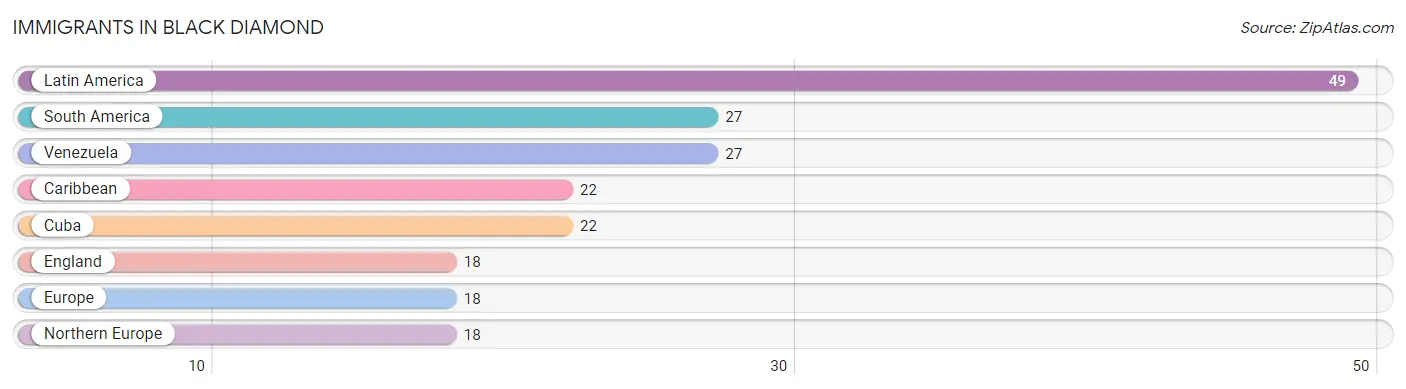
| Immigration Origin | # Population | % Population |
| Caribbean | 22 | 1.8% |
| Cuba | 22 | 1.8% |
| England | 18 | 1.5% |
| Europe | 18 | 1.5% |
| Latin America | 49 | 4.1% |
| Northern Europe | 18 | 1.5% |
| South America | 27 | 2.3% |
| Venezuela | 27 | 2.3% | View All 8 Rows |
Sex and Age in Black Diamond
Sex and Age in Black Diamond
The most populous age groups in Black Diamond are 60 to 64 Years (121 | 24.9%) for men and 70 to 74 Years (117 | 16.5%) for women.
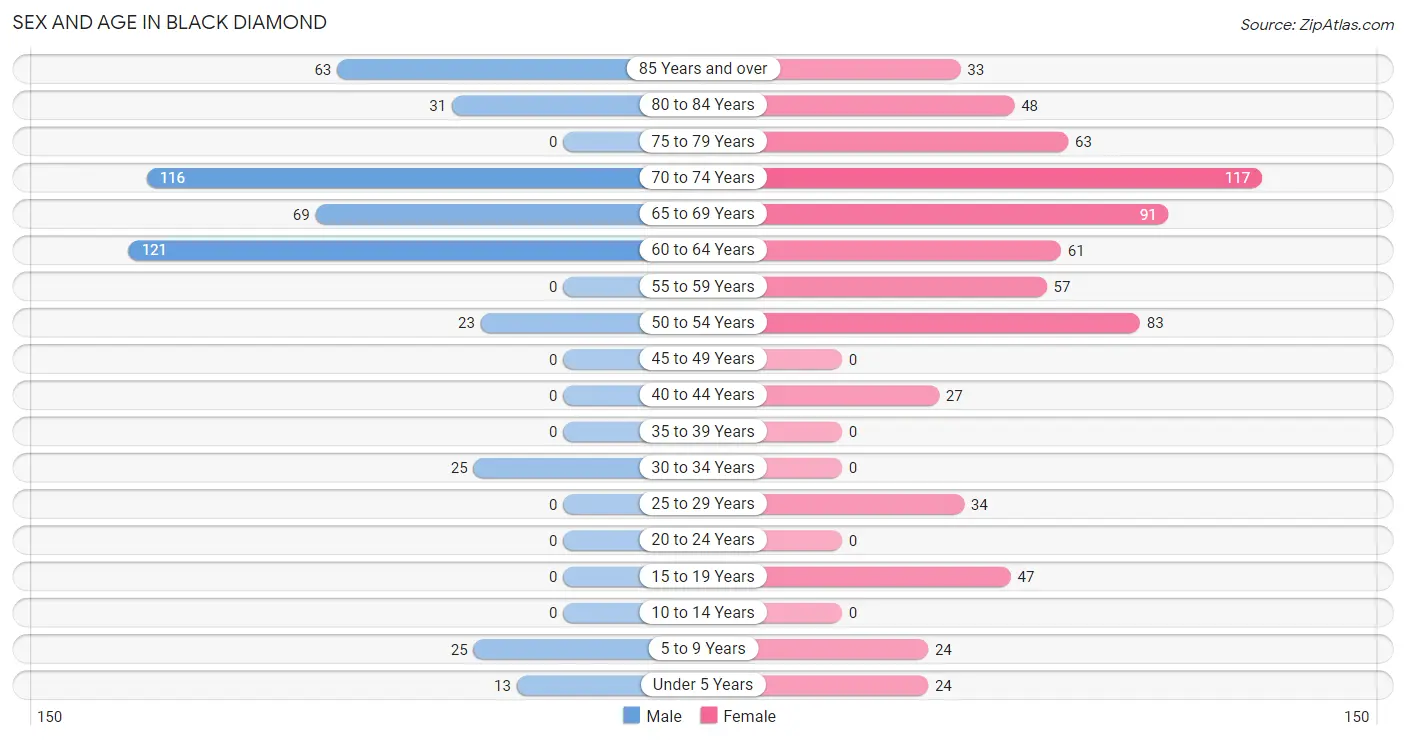
| Age Bracket | Male | Female |
| Under 5 Years | 13 (2.7%) | 24 (3.4%) |
| 5 to 9 Years | 25 (5.1%) | 24 (3.4%) |
| 10 to 14 Years | 0 (0.0%) | 0 (0.0%) |
| 15 to 19 Years | 0 (0.0%) | 47 (6.6%) |
| 20 to 24 Years | 0 (0.0%) | 0 (0.0%) |
| 25 to 29 Years | 0 (0.0%) | 34 (4.8%) |
| 30 to 34 Years | 25 (5.1%) | 0 (0.0%) |
| 35 to 39 Years | 0 (0.0%) | 0 (0.0%) |
| 40 to 44 Years | 0 (0.0%) | 27 (3.8%) |
| 45 to 49 Years | 0 (0.0%) | 0 (0.0%) |
| 50 to 54 Years | 23 (4.7%) | 83 (11.7%) |
| 55 to 59 Years | 0 (0.0%) | 57 (8.0%) |
| 60 to 64 Years | 121 (24.9%) | 61 (8.6%) |
| 65 to 69 Years | 69 (14.2%) | 91 (12.8%) |
| 70 to 74 Years | 116 (23.9%) | 117 (16.5%) |
| 75 to 79 Years | 0 (0.0%) | 63 (8.9%) |
| 80 to 84 Years | 31 (6.4%) | 48 (6.8%) |
| 85 Years and over | 63 (13.0%) | 33 (4.6%) |
| Total | 486 (100.0%) | 709 (100.0%) |
Families and Households in Black Diamond
Median Family Size in Black Diamond
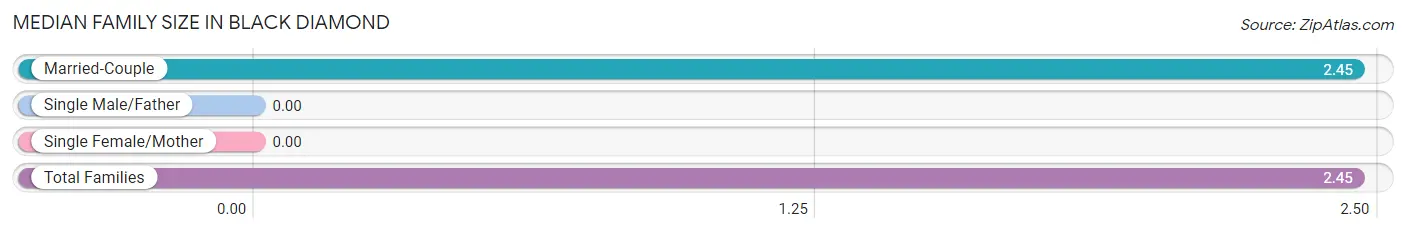
| Family Type | # Families | Family Size |
| Married-Couple | 327 (100.0%) | 2.45 |
| Single Male/Father | 0 (0.0%) | - |
| Single Female/Mother | 0 (0.0%) | - |
| Total Families | 327 (100.0%) | 2.45 |
Median Household Size in Black Diamond
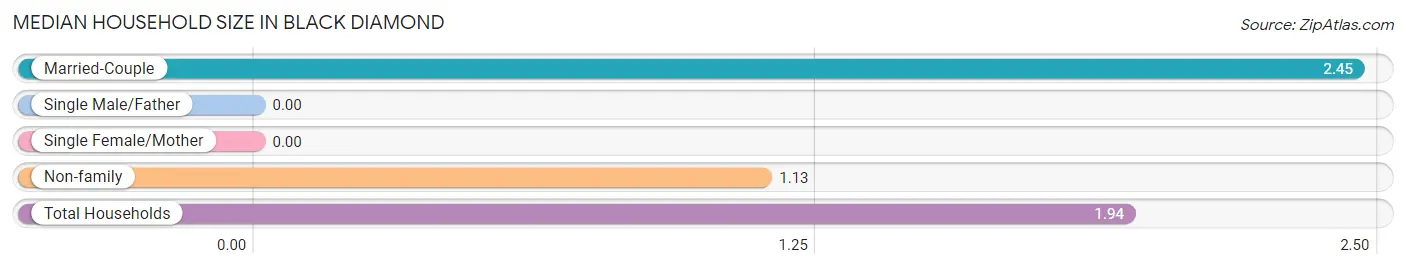
| Household Type | # Households | Household Size |
| Married-Couple | 327 (61.1%) | 2.45 |
| Single Male/Father | 0 (0.0%) | - |
| Single Female/Mother | 0 (0.0%) | - |
| Non-family | 208 (38.9%) | 1.13 |
| Total Households | 535 (100.0%) | 1.94 |
Household Size by Marriage Status in Black Diamond
Out of a total of 535 households in Black Diamond, 327 (61.1%) are family households, while 208 (38.9%) are nonfamily households. The most numerous type of family households are 2-person households, comprising 253, and the most common type of nonfamily households are 1-person households, comprising 185.
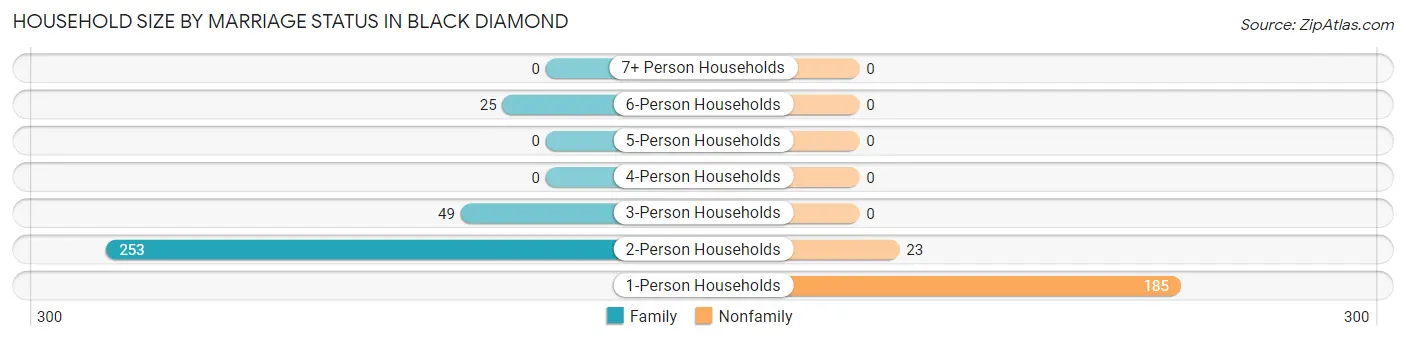
| Household Size | Family Households | Nonfamily Households |
| 1-Person Households | - | 185 (34.6%) |
| 2-Person Households | 253 (47.3%) | 23 (4.3%) |
| 3-Person Households | 49 (9.2%) | 0 (0.0%) |
| 4-Person Households | 0 (0.0%) | 0 (0.0%) |
| 5-Person Households | 0 (0.0%) | 0 (0.0%) |
| 6-Person Households | 25 (4.7%) | 0 (0.0%) |
| 7+ Person Households | 0 (0.0%) | 0 (0.0%) |
| Total | 327 (61.1%) | 208 (38.9%) |
Female Fertility in Black Diamond
Fertility by Age in Black Diamond
| Age Bracket | Women with Births | Births / 1,000 Women |
| 15 to 19 years | 0 (0.0%) | 0.0 |
| 20 to 34 years | 0 (0.0%) | 0.0 |
| 35 to 50 years | 0 (0.0%) | 0.0 |
| Total | 0 (0.0%) | 0.0 |
Fertility by Age by Marriage Status in Black Diamond
| Age Bracket | Married | Unmarried |
| 15 to 19 years | 0 (0.0%) | 0 (0.0%) |
| 20 to 34 years | 0 (0.0%) | 0 (0.0%) |
| 35 to 50 years | 0 (0.0%) | 0 (0.0%) |
| Total | 0 (0.0%) | 0 (0.0%) |
Fertility by Education in Black Diamond
| Educational Attainment | Women with Births | Births / 1,000 Women |
| Less than High School | 0 (0.0%) | 0.0 |
| High School Diploma | 0 (0.0%) | 0.0 |
| College or Associate's Degree | 0 (0.0%) | 0.0 |
| Bachelor's Degree | 0 (0.0%) | 0.0 |
| Graduate Degree | 0 (0.0%) | 0.0 |
| Total | 0 (0.0%) | 0.0 |
Fertility by Education by Marriage Status in Black Diamond
| Educational Attainment | Married | Unmarried |
| Less than High School | 0 (0.0%) | 0 (0.0%) |
| High School Diploma | 0 (0.0%) | 0 (0.0%) |
| College or Associate's Degree | 0 (0.0%) | 0 (0.0%) |
| Bachelor's Degree | 0 (0.0%) | 0 (0.0%) |
| Graduate Degree | 0 (0.0%) | 0 (0.0%) |
| Total | 0 (0.0%) | 0 (0.0%) |
Employment Characteristics in Black Diamond
Employment by Class of Employer in Black Diamond
Among the 209 employed individuals in Black Diamond, private company employees (162 | 77.5%), self-employed (not incorporated) (25 | 12.0%), and self-employed (incorporated) (22 | 10.5%) make up the most common classes of employment.
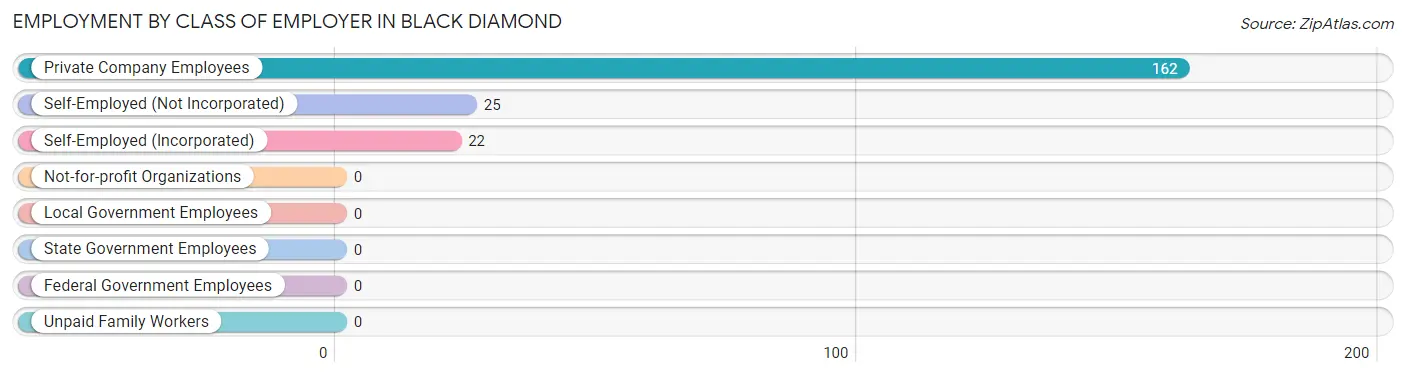
| Employer Class | # Employees | % Employees |
| Private Company Employees | 162 | 77.5% |
| Self-Employed (Incorporated) | 22 | 10.5% |
| Self-Employed (Not Incorporated) | 25 | 12.0% |
| Not-for-profit Organizations | 0 | 0.0% |
| Local Government Employees | 0 | 0.0% |
| State Government Employees | 0 | 0.0% |
| Federal Government Employees | 0 | 0.0% |
| Unpaid Family Workers | 0 | 0.0% |
| Total | 209 | 100.0% |
Employment Status by Age in Black Diamond
According to the labor force statistics for Black Diamond, out of the total population over 16 years of age (1,109), 21.9% or 243 individuals are in the labor force, with 14.0% or 34 of them unemployed. The age group with the highest labor force participation rate is 25 to 29 years, with 100.0% or 34 individuals in the labor force. Within the labor force, the 25 to 29 years age range has the highest percentage of unemployed individuals, with 100.0% or 34 of them being unemployed.
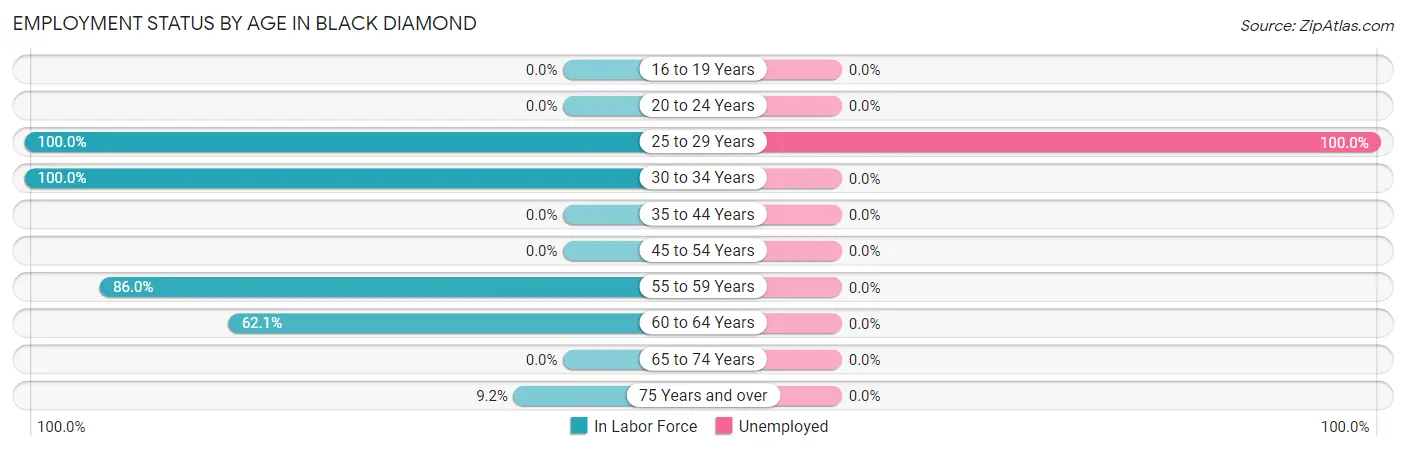
| Age Bracket | In Labor Force | Unemployed |
| 16 to 19 Years | 0 (0.0%) | 0 (0.0%) |
| 20 to 24 Years | 0 (0.0%) | 0 (0.0%) |
| 25 to 29 Years | 34 (100.0%) | 34 (100.0%) |
| 30 to 34 Years | 25 (100.0%) | 0 (0.0%) |
| 35 to 44 Years | 0 (0.0%) | 0 (0.0%) |
| 45 to 54 Years | 0 (0.0%) | 0 (0.0%) |
| 55 to 59 Years | 49 (86.0%) | 0 (0.0%) |
| 60 to 64 Years | 113 (62.1%) | 0 (0.0%) |
| 65 to 74 Years | 0 (0.0%) | 0 (0.0%) |
| 75 Years and over | 22 (9.2%) | 0 (0.0%) |
| Total | 243 (21.9%) | 34 (14.0%) |
Employment Status by Educational Attainment in Black Diamond
According to labor force statistics for Black Diamond, 51.3% of individuals (221) out of the total population between 25 and 64 years of age (431) are in the labor force, with 15.4% or 34 of them being unemployed. The group with the highest labor force participation rate are those with the educational attainment of high school diploma, with 75.8% or 25 individuals in the labor force. Within the labor force, individuals with college / associate degree education have the highest percentage of unemployment, with 66.7% or 34 of them being unemployed.
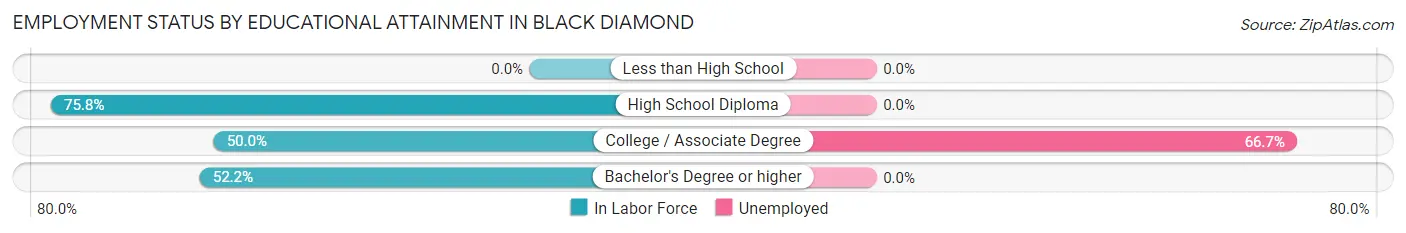
| Educational Attainment | In Labor Force | Unemployed |
| Less than High School | 0 (0.0%) | 0 (0.0%) |
| High School Diploma | 25 (75.8%) | 0 (0.0%) |
| College / Associate Degree | 51 (50.0%) | 68 (66.7%) |
| Bachelor's Degree or higher | 145 (52.2%) | 0 (0.0%) |
| Total | 221 (51.3%) | 66 (15.4%) |
Employment Occupations by Sex in Black Diamond
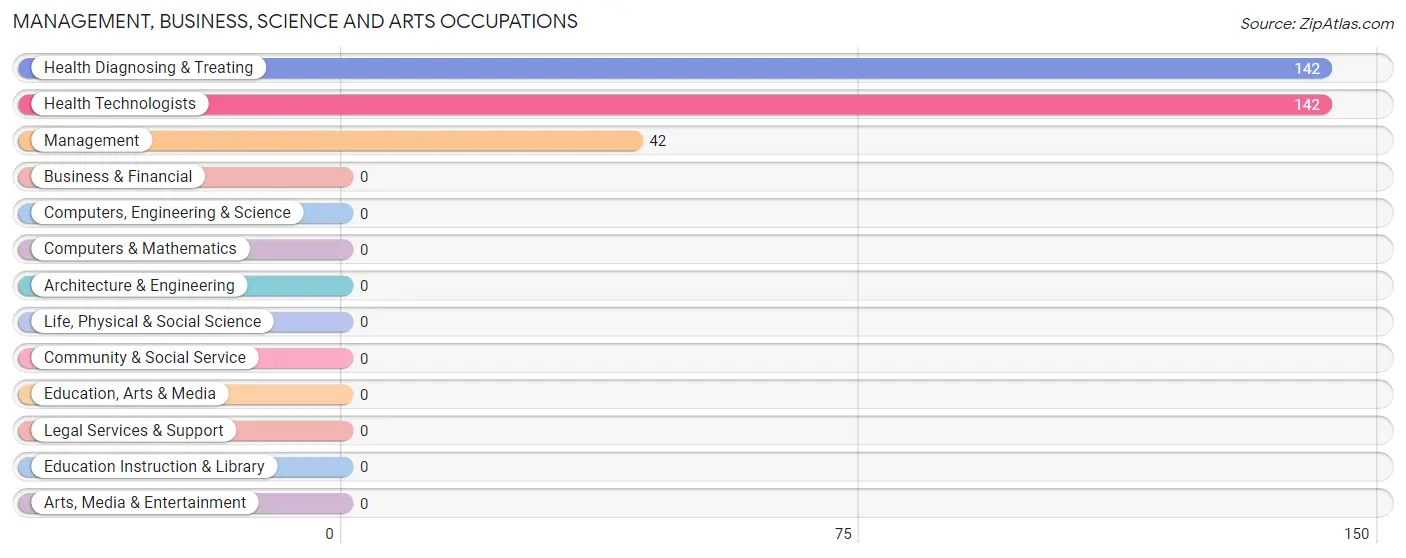
Management, Business, Science and Arts Occupations
The most common Management, Business, Science and Arts occupations in Black Diamond are Health Diagnosing & Treating (142 | 67.9%), Health Technologists (142 | 67.9%), and Management (42 | 20.1%).
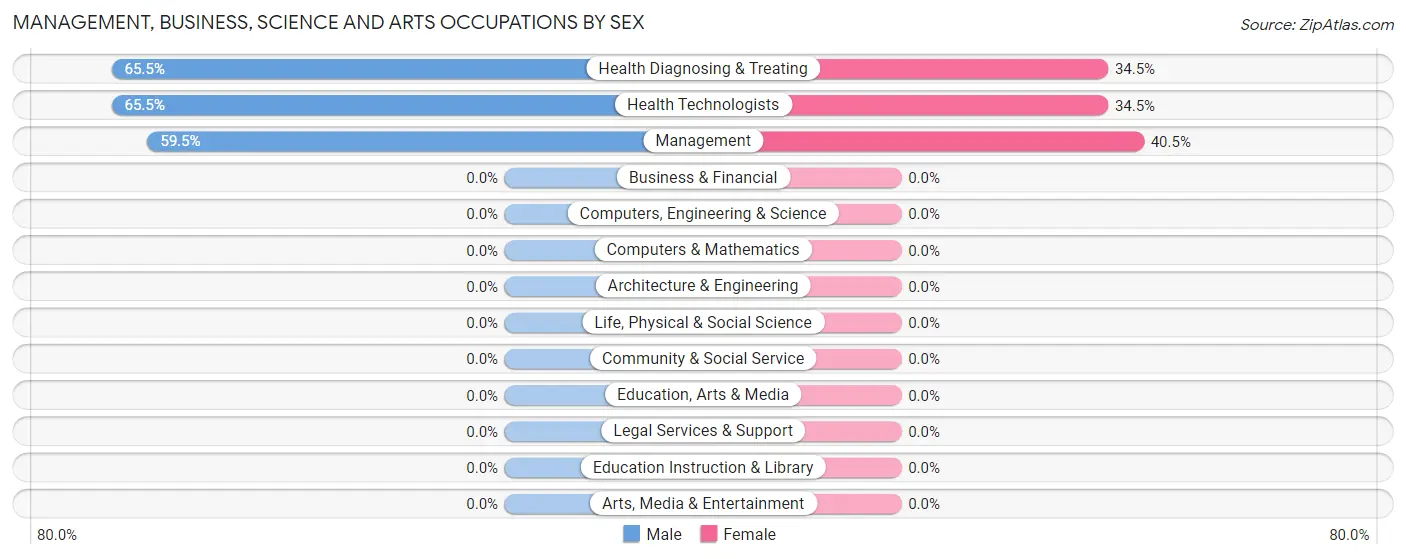
Management, Business, Science and Arts Occupations by Sex
Within the Management, Business, Science and Arts occupations in Black Diamond, the most male-oriented occupations are Health Diagnosing & Treating (65.5%), Health Technologists (65.5%), and Management (59.5%), while the most female-oriented occupations are Management (40.5%), Health Diagnosing & Treating (34.5%), and Health Technologists (34.5%).
| Occupation | Male | Female |
| Management | 25 (59.5%) | 17 (40.5%) |
| Business & Financial | 0 (0.0%) | 0 (0.0%) |
| Computers, Engineering & Science | 0 (0.0%) | 0 (0.0%) |
| Computers & Mathematics | 0 (0.0%) | 0 (0.0%) |
| Architecture & Engineering | 0 (0.0%) | 0 (0.0%) |
| Life, Physical & Social Science | 0 (0.0%) | 0 (0.0%) |
| Community & Social Service | 0 (0.0%) | 0 (0.0%) |
| Education, Arts & Media | 0 (0.0%) | 0 (0.0%) |
| Legal Services & Support | 0 (0.0%) | 0 (0.0%) |
| Education Instruction & Library | 0 (0.0%) | 0 (0.0%) |
| Arts, Media & Entertainment | 0 (0.0%) | 0 (0.0%) |
| Health Diagnosing & Treating | 93 (65.5%) | 49 (34.5%) |
| Health Technologists | 93 (65.5%) | 49 (34.5%) |
| Total (Category) | 118 (64.1%) | 66 (35.9%) |
| Total (Overall) | 143 (68.4%) | 66 (31.6%) |
Services Occupations
Services Occupations by Sex
| Occupation | Male | Female |
| Healthcare Support | 0 (0.0%) | 0 (0.0%) |
| Security & Protection | 0 (0.0%) | 0 (0.0%) |
| Firefighting & Prevention | 0 (0.0%) | 0 (0.0%) |
| Law Enforcement | 0 (0.0%) | 0 (0.0%) |
| Food Preparation & Serving | 0 (0.0%) | 0 (0.0%) |
| Cleaning & Maintenance | 0 (0.0%) | 0 (0.0%) |
| Personal Care & Service | 0 (0.0%) | 0 (0.0%) |
| Total (Category) | 0 (0.0%) | 0 (0.0%) |
| Total (Overall) | 143 (68.4%) | 66 (31.6%) |
Sales and Office Occupations
Sales and Office Occupations by Sex
| Occupation | Male | Female |
| Sales & Related | 0 (0.0%) | 0 (0.0%) |
| Office & Administration | 0 (0.0%) | 0 (0.0%) |
| Total (Category) | 0 (0.0%) | 0 (0.0%) |
| Total (Overall) | 143 (68.4%) | 66 (31.6%) |
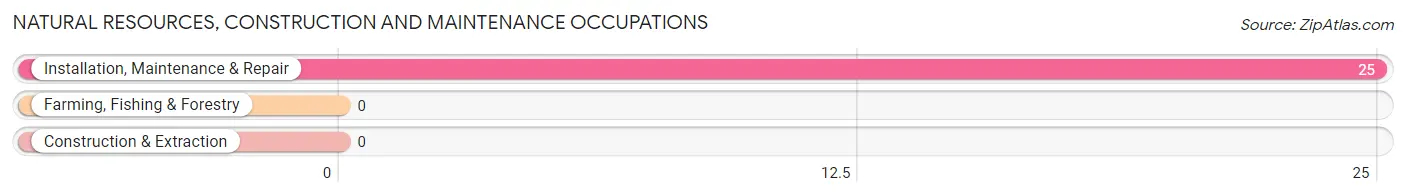
Natural Resources, Construction and Maintenance Occupations
The most common Natural Resources, Construction and Maintenance occupations in Black Diamond are , and Installation, Maintenance & Repair (25 | 12.0%).
Natural Resources, Construction and Maintenance Occupations by Sex
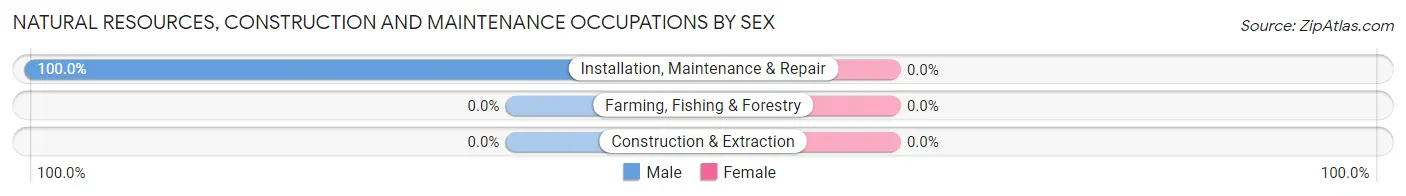
| Occupation | Male | Female |
| Farming, Fishing & Forestry | 0 (0.0%) | 0 (0.0%) |
| Construction & Extraction | 0 (0.0%) | 0 (0.0%) |
| Installation, Maintenance & Repair | 25 (100.0%) | 0 (0.0%) |
| Total (Category) | 25 (100.0%) | 0 (0.0%) |
| Total (Overall) | 143 (68.4%) | 66 (31.6%) |
Production, Transportation and Moving Occupations
Production, Transportation and Moving Occupations by Sex
| Occupation | Male | Female |
| Production | 0 (0.0%) | 0 (0.0%) |
| Transportation | 0 (0.0%) | 0 (0.0%) |
| Material Moving | 0 (0.0%) | 0 (0.0%) |
| Total (Category) | 0 (0.0%) | 0 (0.0%) |
| Total (Overall) | 143 (68.4%) | 66 (31.6%) |
Employment Industries by Sex in Black Diamond
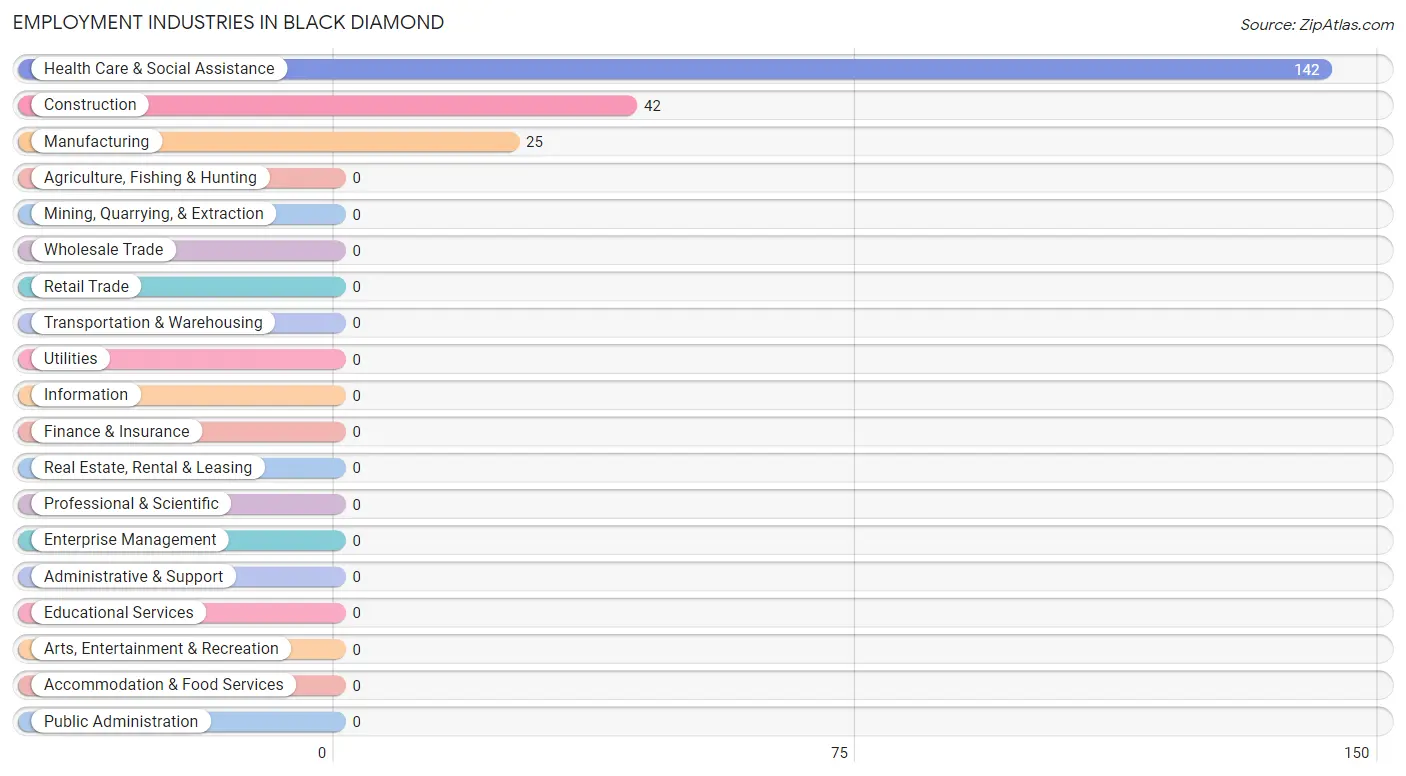
Employment Industries in Black Diamond
The major employment industries in Black Diamond include Health Care & Social Assistance (142 | 67.9%), Construction (42 | 20.1%), and Manufacturing (25 | 12.0%).
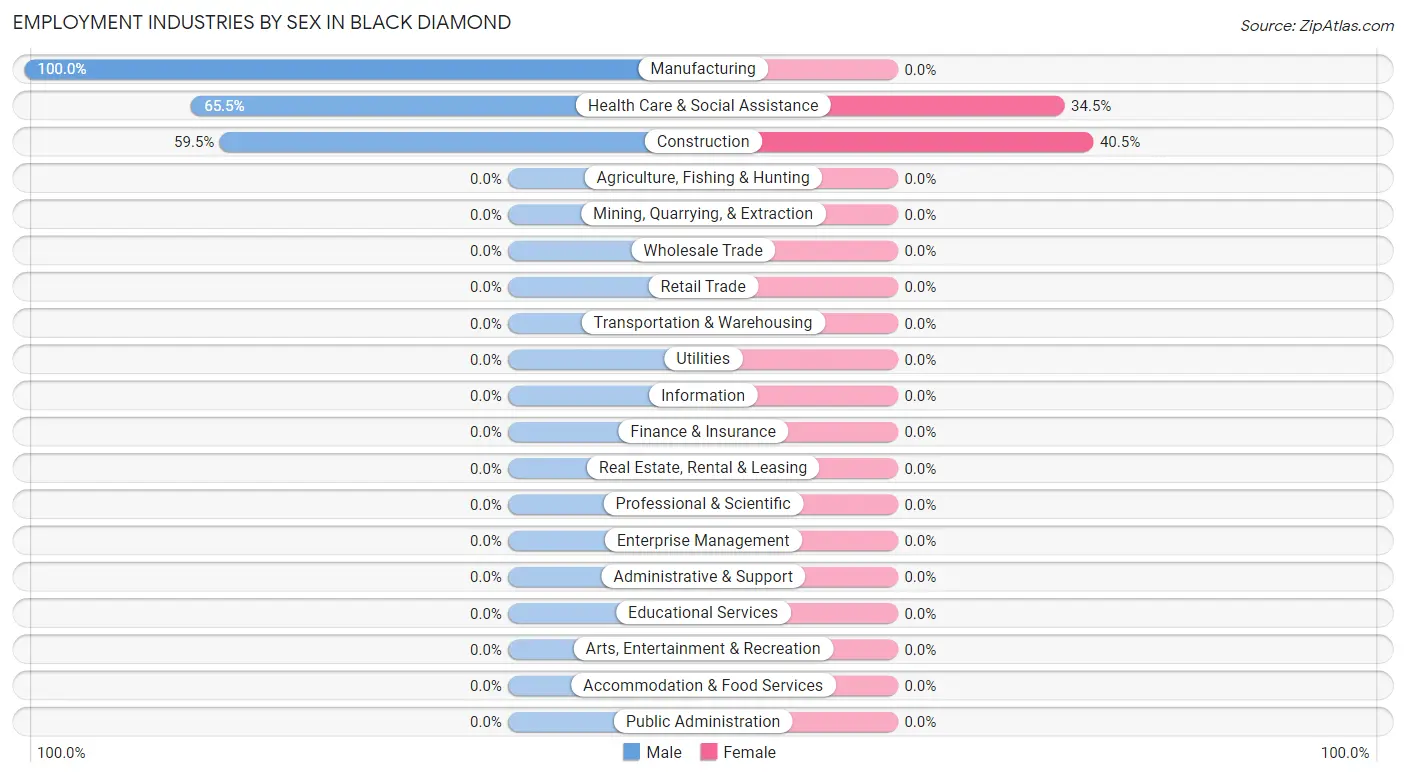
Employment Industries by Sex in Black Diamond
The Black Diamond industries that see more men than women are Manufacturing (100.0%), Health Care & Social Assistance (65.5%), and Construction (59.5%), whereas the industries that tend to have a higher number of women are Construction (40.5%), and Health Care & Social Assistance (34.5%).
| Industry | Male | Female |
| Agriculture, Fishing & Hunting | 0 (0.0%) | 0 (0.0%) |
| Mining, Quarrying, & Extraction | 0 (0.0%) | 0 (0.0%) |
| Construction | 25 (59.5%) | 17 (40.5%) |
| Manufacturing | 25 (100.0%) | 0 (0.0%) |
| Wholesale Trade | 0 (0.0%) | 0 (0.0%) |
| Retail Trade | 0 (0.0%) | 0 (0.0%) |
| Transportation & Warehousing | 0 (0.0%) | 0 (0.0%) |
| Utilities | 0 (0.0%) | 0 (0.0%) |
| Information | 0 (0.0%) | 0 (0.0%) |
| Finance & Insurance | 0 (0.0%) | 0 (0.0%) |
| Real Estate, Rental & Leasing | 0 (0.0%) | 0 (0.0%) |
| Professional & Scientific | 0 (0.0%) | 0 (0.0%) |
| Enterprise Management | 0 (0.0%) | 0 (0.0%) |
| Administrative & Support | 0 (0.0%) | 0 (0.0%) |
| Educational Services | 0 (0.0%) | 0 (0.0%) |
| Health Care & Social Assistance | 93 (65.5%) | 49 (34.5%) |
| Arts, Entertainment & Recreation | 0 (0.0%) | 0 (0.0%) |
| Accommodation & Food Services | 0 (0.0%) | 0 (0.0%) |
| Public Administration | 0 (0.0%) | 0 (0.0%) |
| Total | 143 (68.4%) | 66 (31.6%) |
Education in Black Diamond
School Enrollment in Black Diamond
The most common levels of schooling among the 105 students in Black Diamond are high school (47 | 44.8%), college / undergraduate (34 | 32.4%), and elementary school (24 | 22.9%).
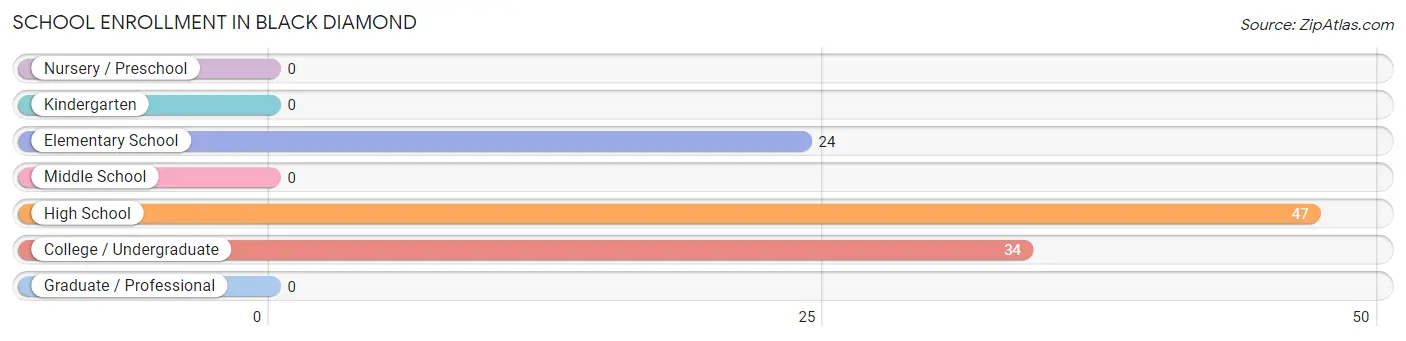
| School Level | # Students | % Students |
| Nursery / Preschool | 0 | 0.0% |
| Kindergarten | 0 | 0.0% |
| Elementary School | 24 | 22.9% |
| Middle School | 0 | 0.0% |
| High School | 47 | 44.8% |
| College / Undergraduate | 34 | 32.4% |
| Graduate / Professional | 0 | 0.0% |
| Total | 105 | 100.0% |
School Enrollment by Age by Funding Source in Black Diamond
Out of a total of 105 students who are enrolled in schools in Black Diamond, 47 (44.8%) attend a private institution, while the remaining 58 (55.2%) are enrolled in public schools. The age group of 18 to 19 year olds has the highest likelihood of being enrolled in private schools, with 47 (100.0% in the age bracket) enrolled. Conversely, the age group of 5 to 9 year old has the lowest likelihood of being enrolled in a private school, with 24 (100.0% in the age bracket) attending a public institution.
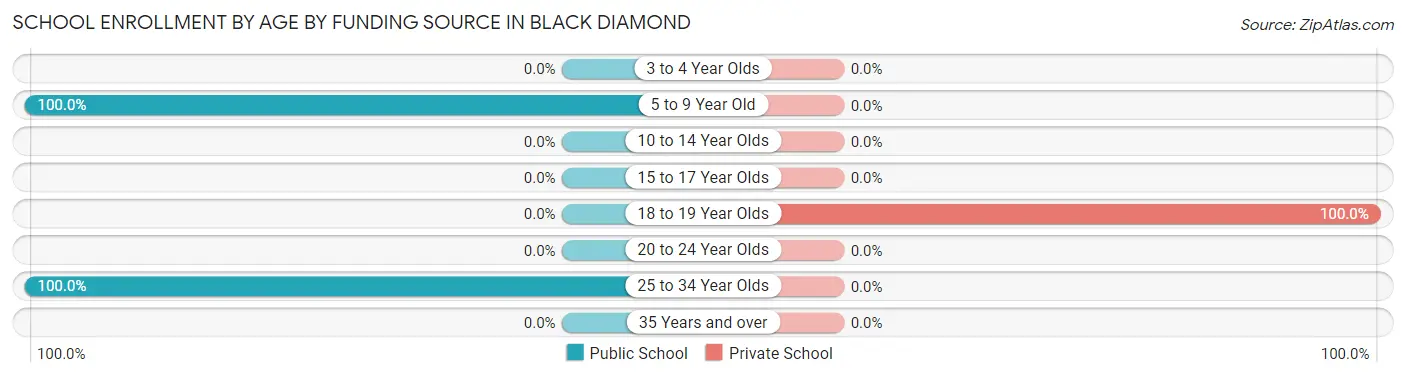
| Age Bracket | Public School | Private School |
| 3 to 4 Year Olds | 0 (0.0%) | 0 (0.0%) |
| 5 to 9 Year Old | 24 (100.0%) | 0 (0.0%) |
| 10 to 14 Year Olds | 0 (0.0%) | 0 (0.0%) |
| 15 to 17 Year Olds | 0 (0.0%) | 0 (0.0%) |
| 18 to 19 Year Olds | 0 (0.0%) | 47 (100.0%) |
| 20 to 24 Year Olds | 0 (0.0%) | 0 (0.0%) |
| 25 to 34 Year Olds | 34 (100.0%) | 0 (0.0%) |
| 35 Years and over | 0 (0.0%) | 0 (0.0%) |
| Total | 58 (55.2%) | 47 (44.8%) |
Educational Attainment by Field of Study in Black Diamond
Psychology (160 | 24.8%), business (114 | 17.7%), bio, nature & agricultural (105 | 16.3%), engineering (51 | 7.9%), and science & technology (49 | 7.6%) are the most common fields of study among 645 individuals in Black Diamond who have obtained a bachelor's degree or higher.
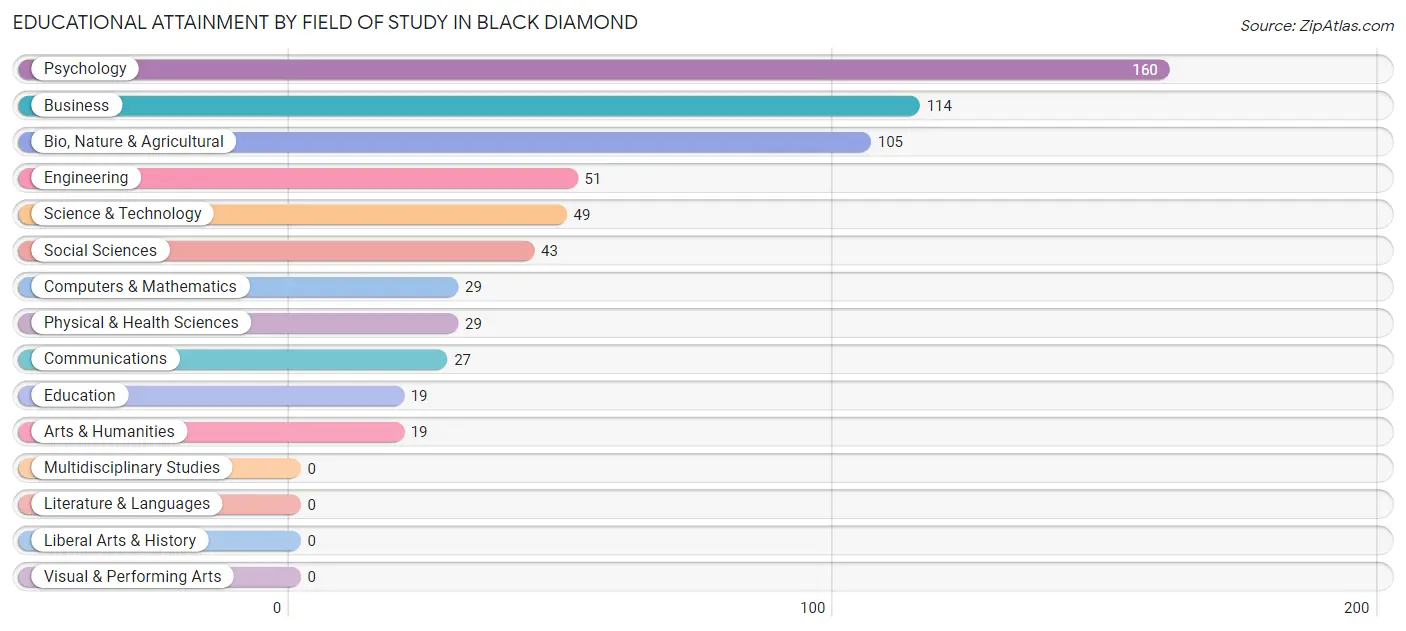
| Field of Study | # Graduates | % Graduates |
| Computers & Mathematics | 29 | 4.5% |
| Bio, Nature & Agricultural | 105 | 16.3% |
| Physical & Health Sciences | 29 | 4.5% |
| Psychology | 160 | 24.8% |
| Social Sciences | 43 | 6.7% |
| Engineering | 51 | 7.9% |
| Multidisciplinary Studies | 0 | 0.0% |
| Science & Technology | 49 | 7.6% |
| Business | 114 | 17.7% |
| Education | 19 | 2.9% |
| Literature & Languages | 0 | 0.0% |
| Liberal Arts & History | 0 | 0.0% |
| Visual & Performing Arts | 0 | 0.0% |
| Communications | 27 | 4.2% |
| Arts & Humanities | 19 | 2.9% |
| Total | 645 | 100.0% |
Transportation & Commute in Black Diamond
Vehicle Availability by Sex in Black Diamond
The most prevalent vehicle ownership categories in Black Diamond are males with 2 vehicles (118, accounting for 82.5%) and females with 2 vehicles (49, making up 178.8%).
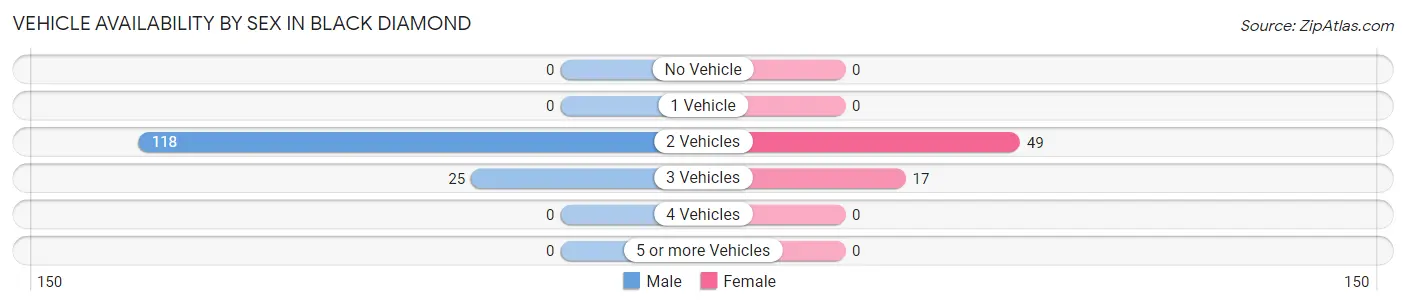
| Vehicles Available | Male | Female |
| No Vehicle | 0 (0.0%) | 0 (0.0%) |
| 1 Vehicle | 0 (0.0%) | 0 (0.0%) |
| 2 Vehicles | 118 (82.5%) | 49 (74.2%) |
| 3 Vehicles | 25 (17.5%) | 17 (25.8%) |
| 4 Vehicles | 0 (0.0%) | 0 (0.0%) |
| 5 or more Vehicles | 0 (0.0%) | 0 (0.0%) |
| Total | 143 (100.0%) | 66 (100.0%) |
Commute Time in Black Diamond
The most frequently occuring commute durations in Black Diamond are 10 to 14 minutes (98 commuters, 52.4%), 15 to 19 minutes (67 commuters, 35.8%), and 90 or more minutes (22 commuters, 11.8%).
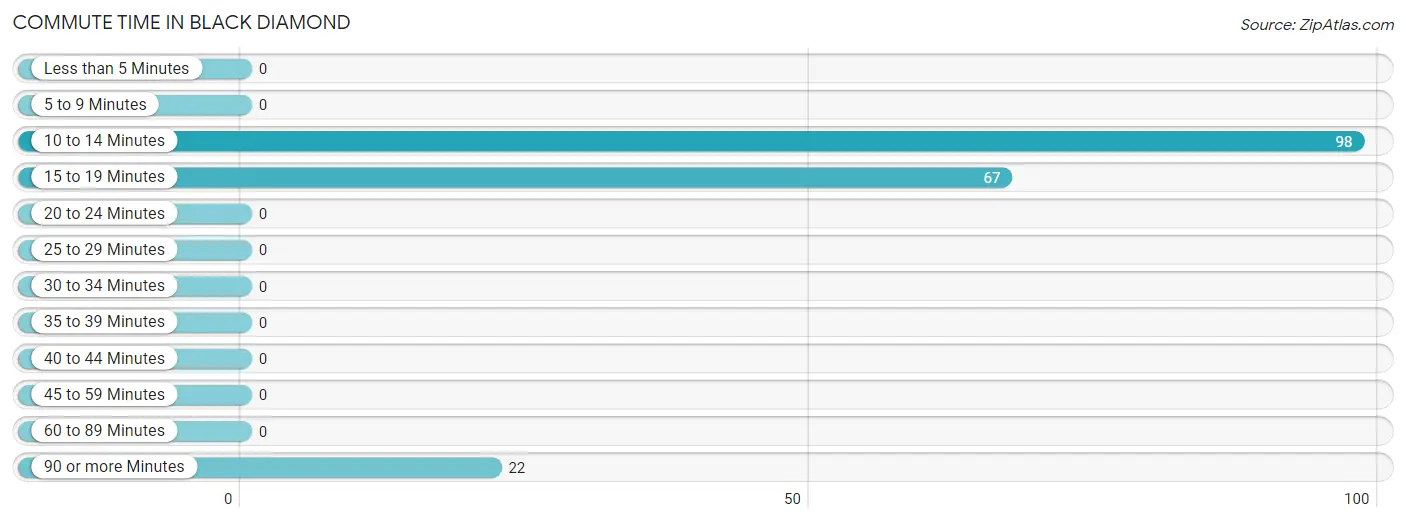
| Commute Time | # Commuters | % Commuters |
| Less than 5 Minutes | 0 | 0.0% |
| 5 to 9 Minutes | 0 | 0.0% |
| 10 to 14 Minutes | 98 | 52.4% |
| 15 to 19 Minutes | 67 | 35.8% |
| 20 to 24 Minutes | 0 | 0.0% |
| 25 to 29 Minutes | 0 | 0.0% |
| 30 to 34 Minutes | 0 | 0.0% |
| 35 to 39 Minutes | 0 | 0.0% |
| 40 to 44 Minutes | 0 | 0.0% |
| 45 to 59 Minutes | 0 | 0.0% |
| 60 to 89 Minutes | 0 | 0.0% |
| 90 or more Minutes | 22 | 11.8% |
Commute Time by Sex in Black Diamond
The most common commute times in Black Diamond are 15 to 19 minutes (50 commuters, 41.3%) for males and 10 to 14 minutes (49 commuters, 74.2%) for females.
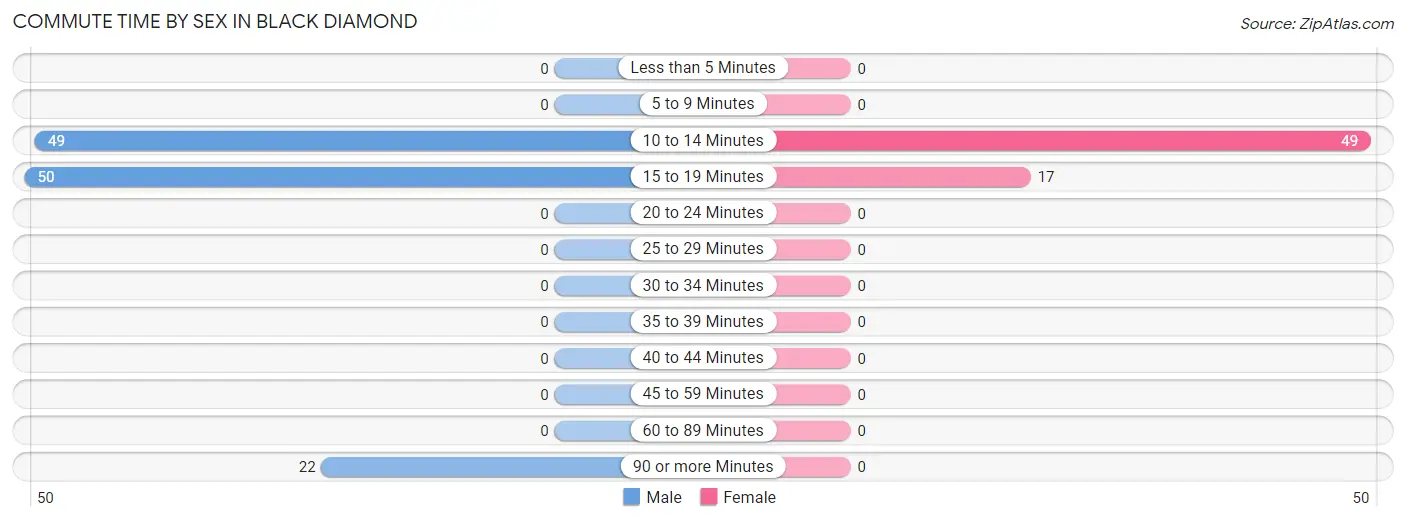
| Commute Time | Male | Female |
| Less than 5 Minutes | 0 (0.0%) | 0 (0.0%) |
| 5 to 9 Minutes | 0 (0.0%) | 0 (0.0%) |
| 10 to 14 Minutes | 49 (40.5%) | 49 (74.2%) |
| 15 to 19 Minutes | 50 (41.3%) | 17 (25.8%) |
| 20 to 24 Minutes | 0 (0.0%) | 0 (0.0%) |
| 25 to 29 Minutes | 0 (0.0%) | 0 (0.0%) |
| 30 to 34 Minutes | 0 (0.0%) | 0 (0.0%) |
| 35 to 39 Minutes | 0 (0.0%) | 0 (0.0%) |
| 40 to 44 Minutes | 0 (0.0%) | 0 (0.0%) |
| 45 to 59 Minutes | 0 (0.0%) | 0 (0.0%) |
| 60 to 89 Minutes | 0 (0.0%) | 0 (0.0%) |
| 90 or more Minutes | 22 (18.2%) | 0 (0.0%) |
Time of Departure to Work by Sex in Black Diamond
The most frequent times of departure to work in Black Diamond are 7:30 AM to 7:59 AM (49, 40.5%) for males and 7:30 AM to 7:59 AM (49, 74.2%) for females.
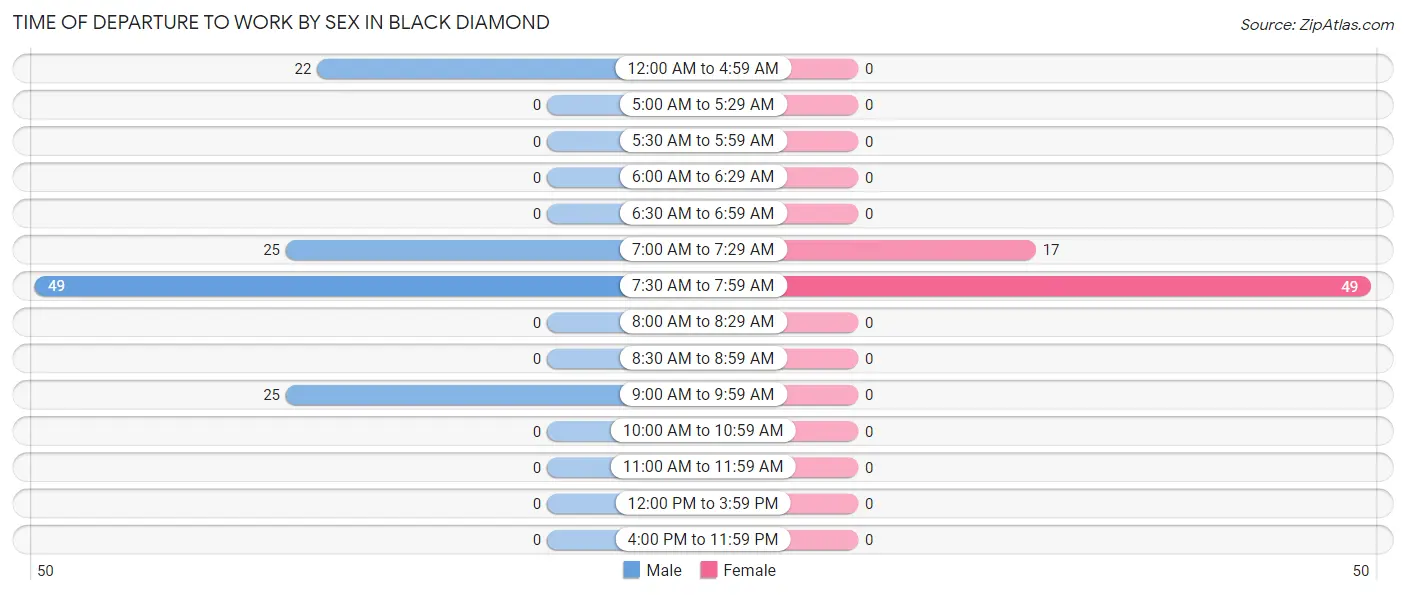
| Time of Departure | Male | Female |
| 12:00 AM to 4:59 AM | 22 (18.2%) | 0 (0.0%) |
| 5:00 AM to 5:29 AM | 0 (0.0%) | 0 (0.0%) |
| 5:30 AM to 5:59 AM | 0 (0.0%) | 0 (0.0%) |
| 6:00 AM to 6:29 AM | 0 (0.0%) | 0 (0.0%) |
| 6:30 AM to 6:59 AM | 0 (0.0%) | 0 (0.0%) |
| 7:00 AM to 7:29 AM | 25 (20.7%) | 17 (25.8%) |
| 7:30 AM to 7:59 AM | 49 (40.5%) | 49 (74.2%) |
| 8:00 AM to 8:29 AM | 0 (0.0%) | 0 (0.0%) |
| 8:30 AM to 8:59 AM | 0 (0.0%) | 0 (0.0%) |
| 9:00 AM to 9:59 AM | 25 (20.7%) | 0 (0.0%) |
| 10:00 AM to 10:59 AM | 0 (0.0%) | 0 (0.0%) |
| 11:00 AM to 11:59 AM | 0 (0.0%) | 0 (0.0%) |
| 12:00 PM to 3:59 PM | 0 (0.0%) | 0 (0.0%) |
| 4:00 PM to 11:59 PM | 0 (0.0%) | 0 (0.0%) |
| Total | 121 (100.0%) | 66 (100.0%) |
Housing Occupancy in Black Diamond
Occupancy by Ownership in Black Diamond
Of the total 535 dwellings in Black Diamond, owner-occupied units account for 535 (100.0%), while renter-occupied units make up 0 (0.0%).
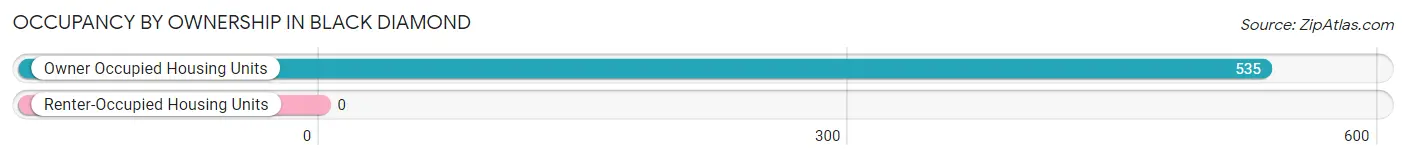
| Occupancy | # Housing Units | % Housing Units |
| Owner Occupied Housing Units | 535 | 100.0% |
| Renter-Occupied Housing Units | 0 | 0.0% |
| Total Occupied Housing Units | 535 | 100.0% |
Occupancy by Household Size in Black Diamond
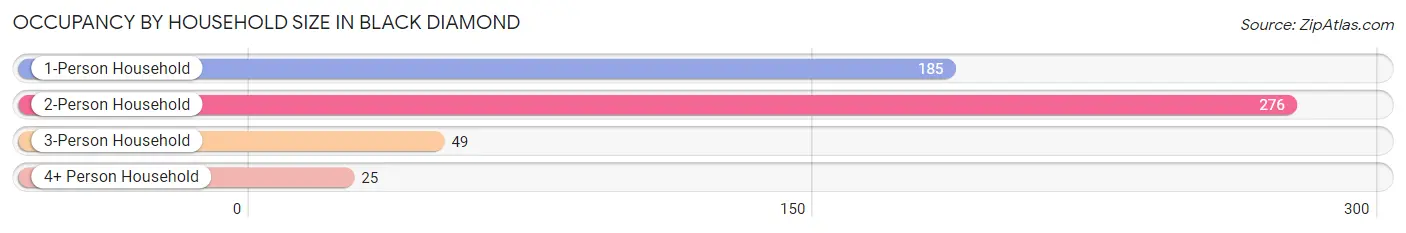
| Household Size | # Housing Units | % Housing Units |
| 1-Person Household | 185 | 34.6% |
| 2-Person Household | 276 | 51.6% |
| 3-Person Household | 49 | 9.2% |
| 4+ Person Household | 25 | 4.7% |
| Total Housing Units | 535 | 100.0% |
Occupancy by Ownership by Household Size in Black Diamond
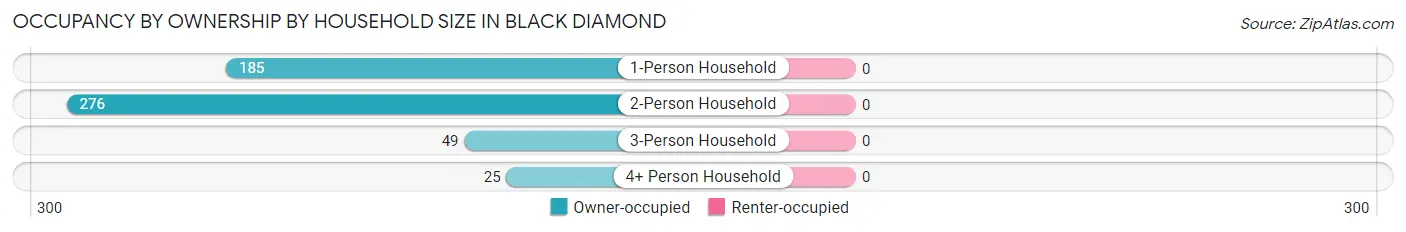
| Household Size | Owner-occupied | Renter-occupied |
| 1-Person Household | 185 (100.0%) | 0 (0.0%) |
| 2-Person Household | 276 (100.0%) | 0 (0.0%) |
| 3-Person Household | 49 (100.0%) | 0 (0.0%) |
| 4+ Person Household | 25 (100.0%) | 0 (0.0%) |
| Total Housing Units | 535 (100.0%) | 0 (0.0%) |
Occupancy by Educational Attainment in Black Diamond
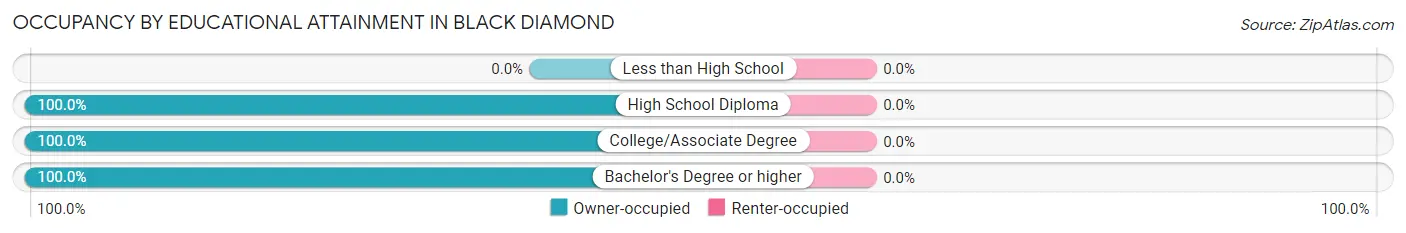
| Household Size | Owner-occupied | Renter-occupied |
| Less than High School | 0 (0.0%) | 0 (0.0%) |
| High School Diploma | 56 (100.0%) | 0 (0.0%) |
| College/Associate Degree | 200 (100.0%) | 0 (0.0%) |
| Bachelor's Degree or higher | 279 (100.0%) | 0 (0.0%) |
Occupancy by Age of Householder in Black Diamond
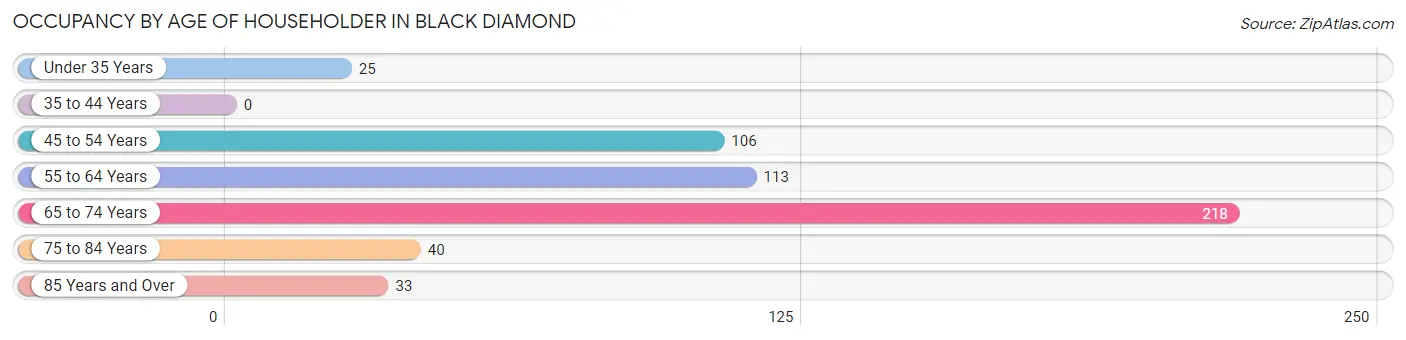
| Age Bracket | # Households | % Households |
| Under 35 Years | 25 | 4.7% |
| 35 to 44 Years | 0 | 0.0% |
| 45 to 54 Years | 106 | 19.8% |
| 55 to 64 Years | 113 | 21.1% |
| 65 to 74 Years | 218 | 40.7% |
| 75 to 84 Years | 40 | 7.5% |
| 85 Years and Over | 33 | 6.2% |
| Total | 535 | 100.0% |
Housing Finances in Black Diamond
Median Income by Occupancy in Black Diamond
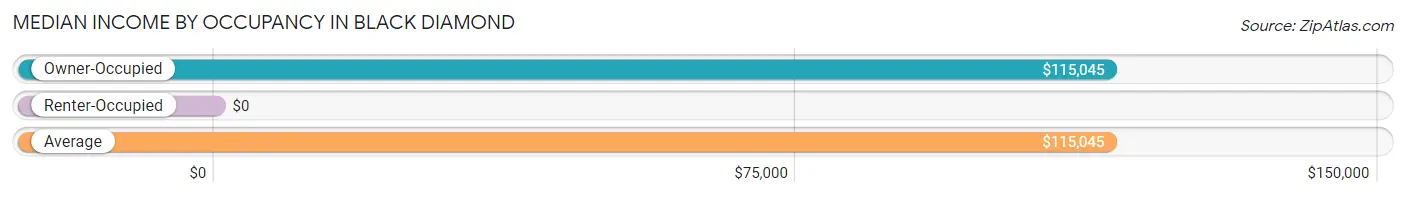
| Occupancy Type | # Households | Median Income |
| Owner-Occupied | 535 (100.0%) | $115,045 |
| Renter-Occupied | 0 (0.0%) | $0 |
| Average | 535 (100.0%) | $115,045 |
Occupancy by Householder Income Bracket in Black Diamond
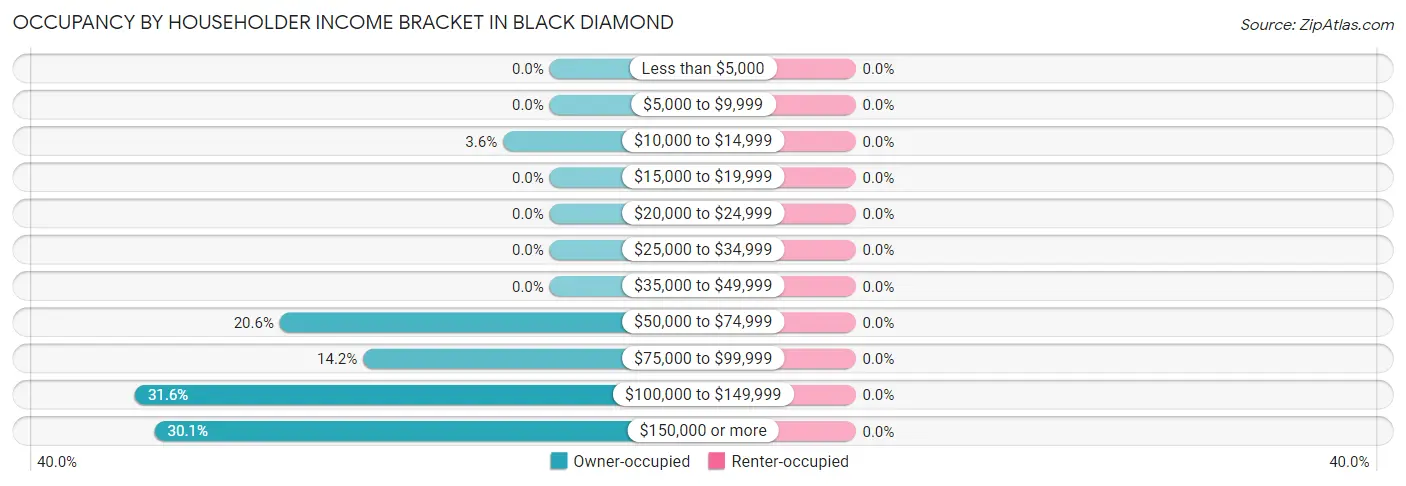
| Income Bracket | Owner-occupied | Renter-occupied |
| Less than $5,000 | 0 (0.0%) | 0 (0.0%) |
| $5,000 to $9,999 | 0 (0.0%) | 0 (0.0%) |
| $10,000 to $14,999 | 19 (3.5%) | 0 (0.0%) |
| $15,000 to $19,999 | 0 (0.0%) | 0 (0.0%) |
| $20,000 to $24,999 | 0 (0.0%) | 0 (0.0%) |
| $25,000 to $34,999 | 0 (0.0%) | 0 (0.0%) |
| $35,000 to $49,999 | 0 (0.0%) | 0 (0.0%) |
| $50,000 to $74,999 | 110 (20.6%) | 0 (0.0%) |
| $75,000 to $99,999 | 76 (14.2%) | 0 (0.0%) |
| $100,000 to $149,999 | 169 (31.6%) | 0 (0.0%) |
| $150,000 or more | 161 (30.1%) | 0 (0.0%) |
| Total | 535 (100.0%) | 0 (0.0%) |
Monthly Housing Cost Tiers in Black Diamond
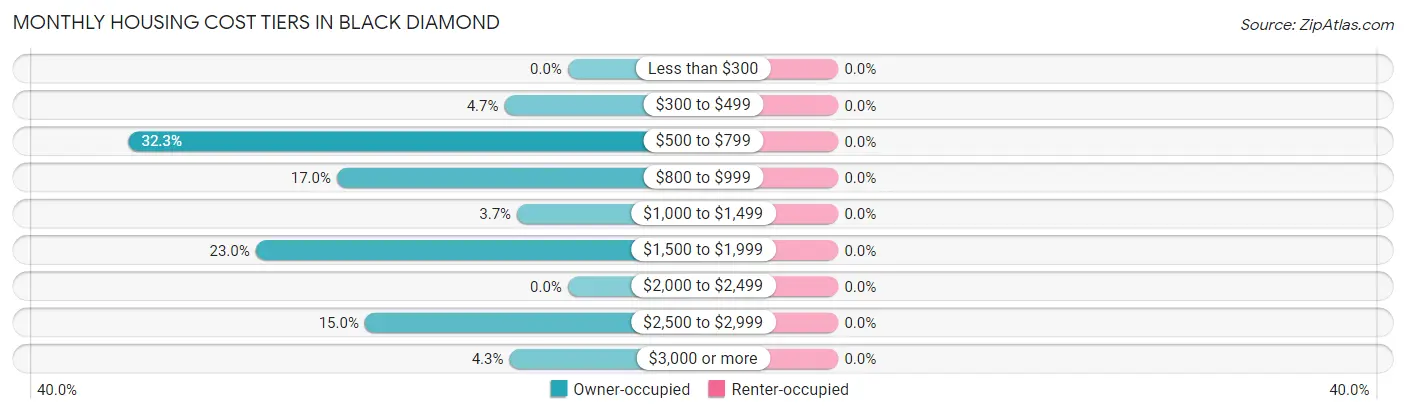
| Monthly Cost | Owner-occupied | Renter-occupied |
| Less than $300 | 0 (0.0%) | 0 (0.0%) |
| $300 to $499 | 25 (4.7%) | 0 (0.0%) |
| $500 to $799 | 173 (32.3%) | 0 (0.0%) |
| $800 to $999 | 91 (17.0%) | 0 (0.0%) |
| $1,000 to $1,499 | 20 (3.7%) | 0 (0.0%) |
| $1,500 to $1,999 | 123 (23.0%) | 0 (0.0%) |
| $2,000 to $2,499 | 0 (0.0%) | 0 (0.0%) |
| $2,500 to $2,999 | 80 (14.9%) | 0 (0.0%) |
| $3,000 or more | 23 (4.3%) | 0 (0.0%) |
| Total | 535 (100.0%) | 0 (0.0%) |
Physical Housing Characteristics in Black Diamond
Housing Structures in Black Diamond
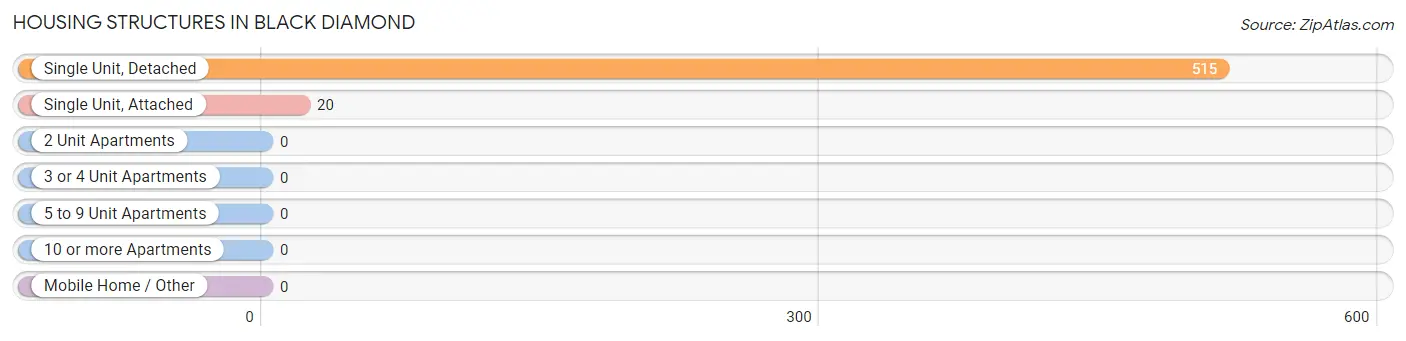
| Structure Type | # Housing Units | % Housing Units |
| Single Unit, Detached | 515 | 96.3% |
| Single Unit, Attached | 20 | 3.7% |
| 2 Unit Apartments | 0 | 0.0% |
| 3 or 4 Unit Apartments | 0 | 0.0% |
| 5 to 9 Unit Apartments | 0 | 0.0% |
| 10 or more Apartments | 0 | 0.0% |
| Mobile Home / Other | 0 | 0.0% |
| Total | 535 | 100.0% |
Housing Structures by Occupancy in Black Diamond
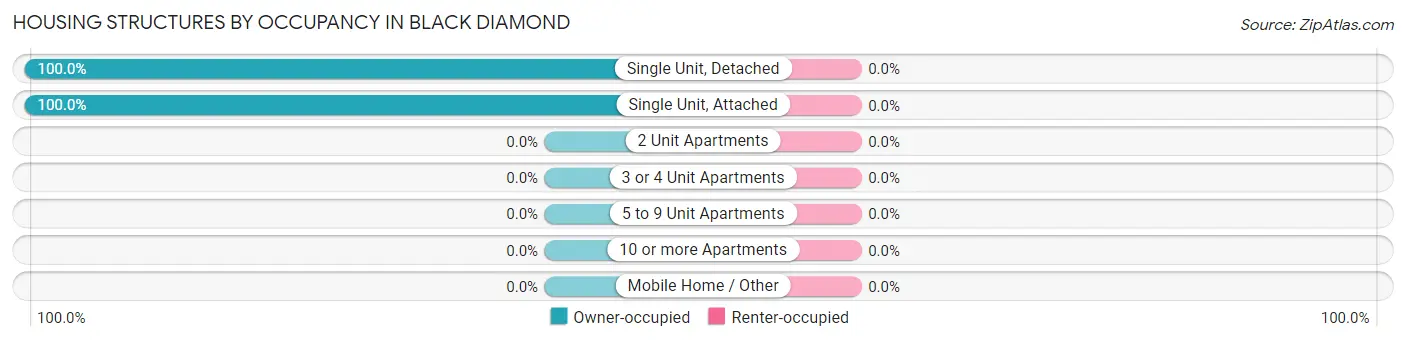
| Structure Type | Owner-occupied | Renter-occupied |
| Single Unit, Detached | 515 (100.0%) | 0 (0.0%) |
| Single Unit, Attached | 20 (100.0%) | 0 (0.0%) |
| 2 Unit Apartments | 0 (0.0%) | 0 (0.0%) |
| 3 or 4 Unit Apartments | 0 (0.0%) | 0 (0.0%) |
| 5 to 9 Unit Apartments | 0 (0.0%) | 0 (0.0%) |
| 10 or more Apartments | 0 (0.0%) | 0 (0.0%) |
| Mobile Home / Other | 0 (0.0%) | 0 (0.0%) |
| Total | 535 (100.0%) | 0 (0.0%) |
Housing Structures by Number of Rooms in Black Diamond
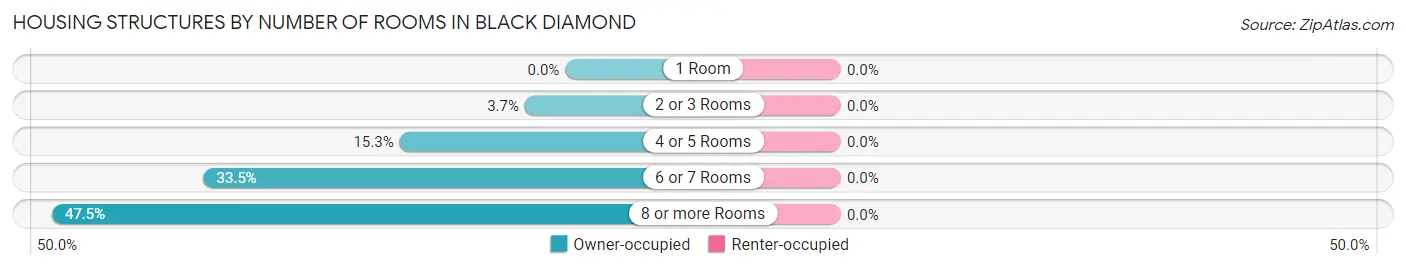
| Number of Rooms | Owner-occupied | Renter-occupied |
| 1 Room | 0 (0.0%) | 0 (0.0%) |
| 2 or 3 Rooms | 20 (3.7%) | 0 (0.0%) |
| 4 or 5 Rooms | 82 (15.3%) | 0 (0.0%) |
| 6 or 7 Rooms | 179 (33.5%) | 0 (0.0%) |
| 8 or more Rooms | 254 (47.5%) | 0 (0.0%) |
| Total | 535 (100.0%) | 0 (0.0%) |
Housing Structure by Heating Type in Black Diamond
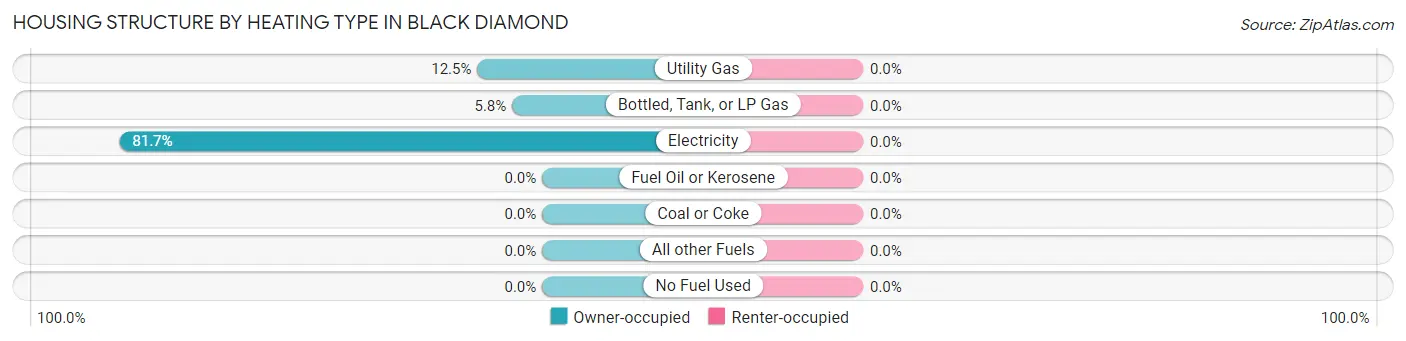
| Heating Type | Owner-occupied | Renter-occupied |
| Utility Gas | 67 (12.5%) | 0 (0.0%) |
| Bottled, Tank, or LP Gas | 31 (5.8%) | 0 (0.0%) |
| Electricity | 437 (81.7%) | 0 (0.0%) |
| Fuel Oil or Kerosene | 0 (0.0%) | 0 (0.0%) |
| Coal or Coke | 0 (0.0%) | 0 (0.0%) |
| All other Fuels | 0 (0.0%) | 0 (0.0%) |
| No Fuel Used | 0 (0.0%) | 0 (0.0%) |
| Total | 535 (100.0%) | 0 (0.0%) |
Household Vehicle Usage in Black Diamond
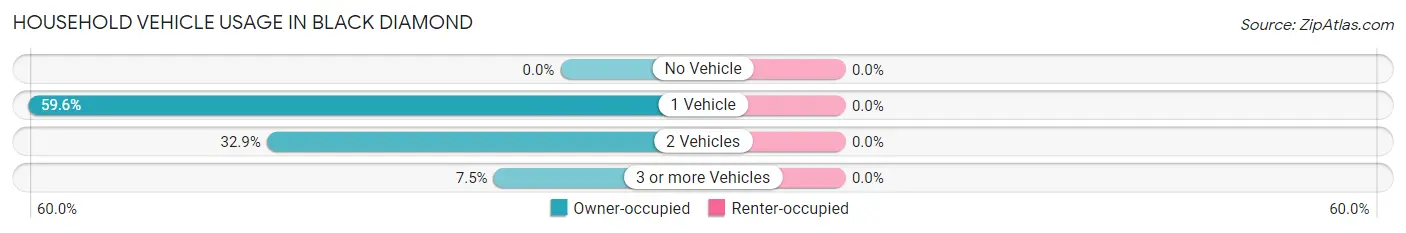
| Vehicles per Household | Owner-occupied | Renter-occupied |
| No Vehicle | 0 (0.0%) | 0 (0.0%) |
| 1 Vehicle | 319 (59.6%) | 0 (0.0%) |
| 2 Vehicles | 176 (32.9%) | 0 (0.0%) |
| 3 or more Vehicles | 40 (7.5%) | 0 (0.0%) |
| Total | 535 (100.0%) | 0 (0.0%) |
Real Estate & Mortgages in Black Diamond
Real Estate and Mortgage Overview in Black Diamond
| Characteristic | Without Mortgage | With Mortgage |
| Housing Units | 310 | 225 |
| Median Property Value | $376,700 | $450,800 |
| Median Household Income | $123,300 | $23 |
| Monthly Housing Costs | $735 | $23 |
| Real Estate Taxes | $3,545 | $0 |
Property Value by Mortgage Status in Black Diamond
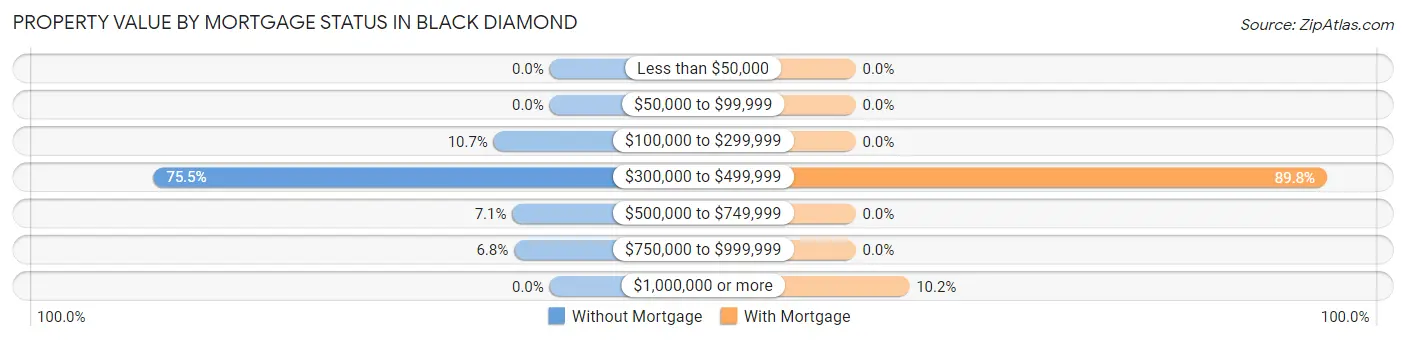
| Property Value | Without Mortgage | With Mortgage |
| Less than $50,000 | 0 (0.0%) | 0 (0.0%) |
| $50,000 to $99,999 | 0 (0.0%) | 0 (0.0%) |
| $100,000 to $299,999 | 33 (10.6%) | 0 (0.0%) |
| $300,000 to $499,999 | 234 (75.5%) | 202 (89.8%) |
| $500,000 to $749,999 | 22 (7.1%) | 0 (0.0%) |
| $750,000 to $999,999 | 21 (6.8%) | 0 (0.0%) |
| $1,000,000 or more | 0 (0.0%) | 23 (10.2%) |
| Total | 310 (100.0%) | 225 (100.0%) |
Household Income by Mortgage Status in Black Diamond
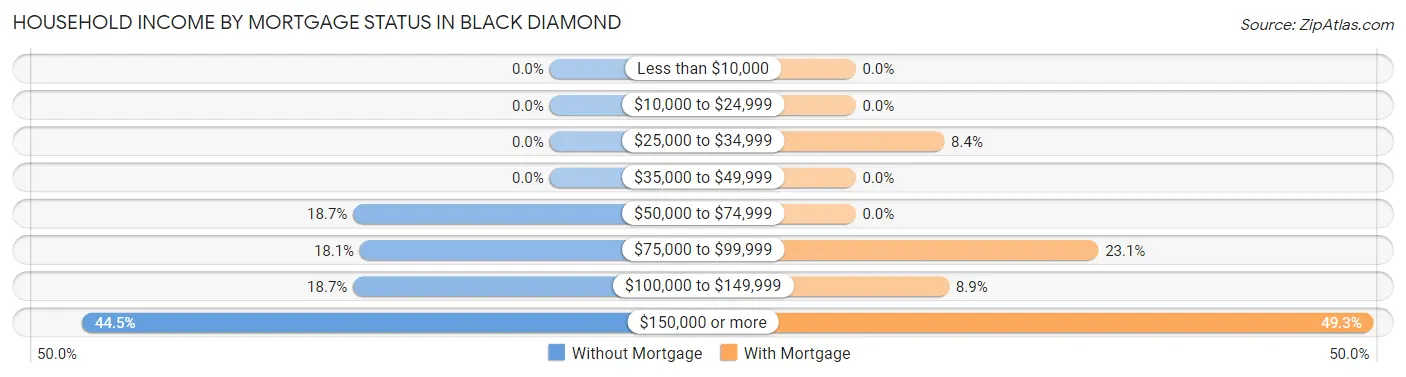
| Household Income | Without Mortgage | With Mortgage |
| Less than $10,000 | 0 (0.0%) | 0 (0.0%) |
| $10,000 to $24,999 | 0 (0.0%) | 0 (0.0%) |
| $25,000 to $34,999 | 0 (0.0%) | 19 (8.4%) |
| $35,000 to $49,999 | 0 (0.0%) | 0 (0.0%) |
| $50,000 to $74,999 | 58 (18.7%) | 0 (0.0%) |
| $75,000 to $99,999 | 56 (18.1%) | 52 (23.1%) |
| $100,000 to $149,999 | 58 (18.7%) | 20 (8.9%) |
| $150,000 or more | 138 (44.5%) | 111 (49.3%) |
| Total | 310 (100.0%) | 225 (100.0%) |
Property Value to Household Income Ratio in Black Diamond
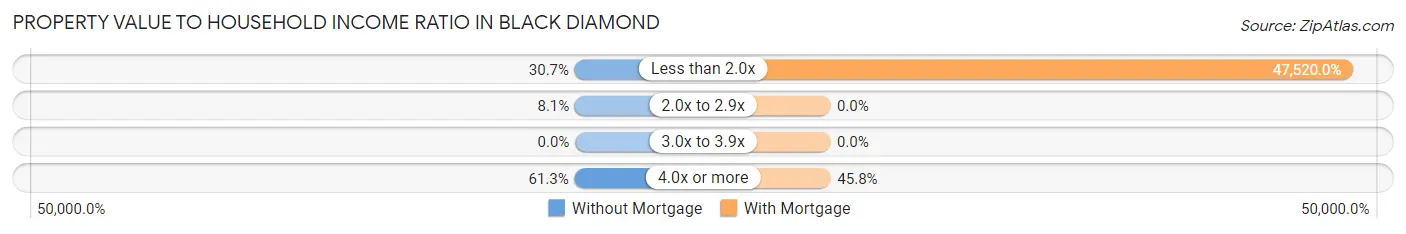
| Value-to-Income Ratio | Without Mortgage | With Mortgage |
| Less than 2.0x | 95 (30.6%) | 106,920 (47,520.0%) |
| 2.0x to 2.9x | 25 (8.1%) | 0 (0.0%) |
| 3.0x to 3.9x | 0 (0.0%) | 0 (0.0%) |
| 4.0x or more | 190 (61.3%) | 103 (45.8%) |
| Total | 310 (100.0%) | 225 (100.0%) |
Real Estate Taxes by Mortgage Status in Black Diamond

| Property Taxes | Without Mortgage | With Mortgage |
| Less than $800 | 0 (0.0%) | 0 (0.0%) |
| $800 to $1,499 | 31 (10.0%) | 0 (0.0%) |
| $800 to $1,499 | 279 (90.0%) | 0 (0.0%) |
| Total | 310 (100.0%) | 225 (100.0%) |
Health & Disability in Black Diamond
Health Insurance Coverage by Age in Black Diamond
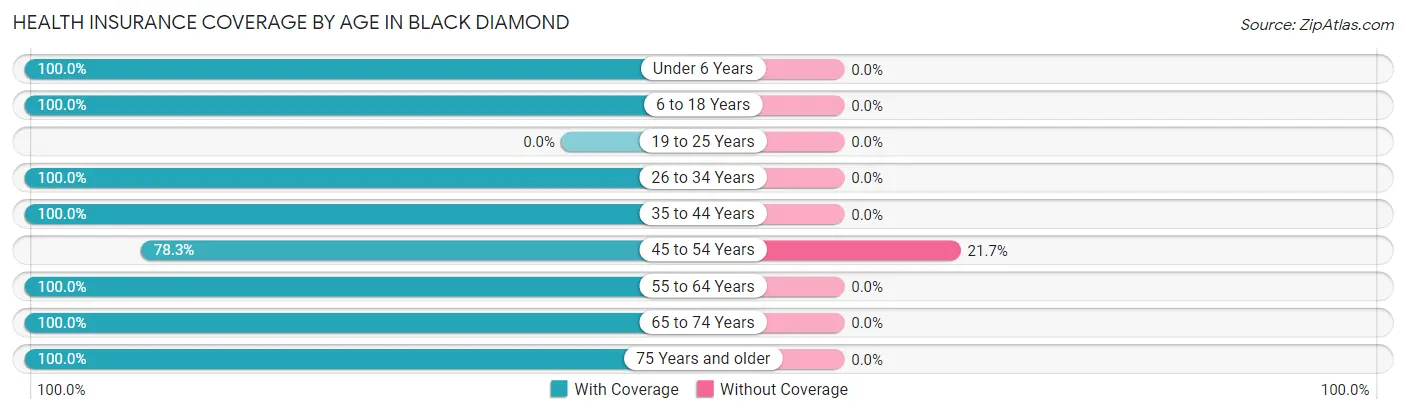
| Age Bracket | With Coverage | Without Coverage |
| Under 6 Years | 37 (100.0%) | 0 (0.0%) |
| 6 to 18 Years | 96 (100.0%) | 0 (0.0%) |
| 19 to 25 Years | 0 (0.0%) | 0 (0.0%) |
| 26 to 34 Years | 59 (100.0%) | 0 (0.0%) |
| 35 to 44 Years | 27 (100.0%) | 0 (0.0%) |
| 45 to 54 Years | 83 (78.3%) | 23 (21.7%) |
| 55 to 64 Years | 231 (100.0%) | 0 (0.0%) |
| 65 to 74 Years | 353 (100.0%) | 0 (0.0%) |
| 75 Years and older | 128 (100.0%) | 0 (0.0%) |
| Total | 1,014 (97.8%) | 23 (2.2%) |
Health Insurance Coverage by Citizenship Status in Black Diamond
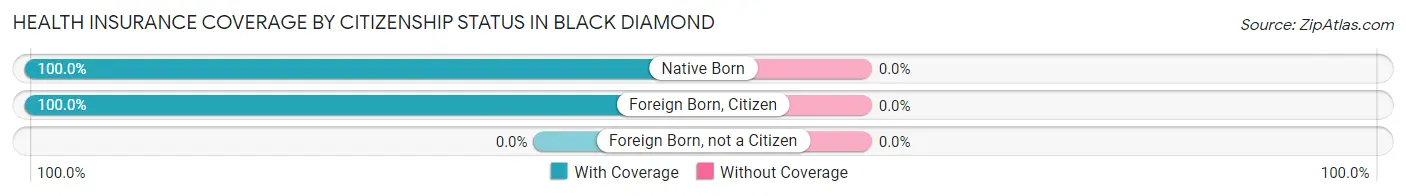
| Citizenship Status | With Coverage | Without Coverage |
| Native Born | 37 (100.0%) | 0 (0.0%) |
| Foreign Born, Citizen | 96 (100.0%) | 0 (0.0%) |
| Foreign Born, not a Citizen | 0 (0.0%) | 0 (0.0%) |
Health Insurance Coverage by Household Income in Black Diamond
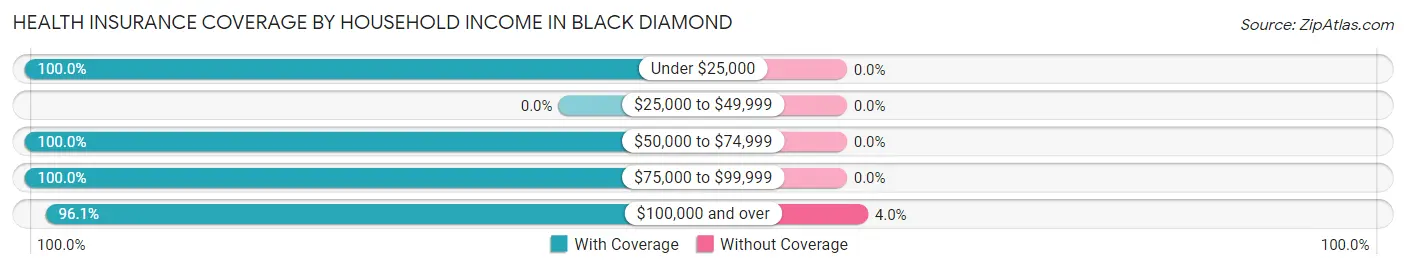
| Household Income | With Coverage | Without Coverage |
| Under $25,000 | 19 (100.0%) | 0 (0.0%) |
| $25,000 to $49,999 | 0 (0.0%) | 0 (0.0%) |
| $50,000 to $74,999 | 194 (100.0%) | 0 (0.0%) |
| $75,000 to $99,999 | 241 (100.0%) | 0 (0.0%) |
| $100,000 and over | 560 (96.1%) | 23 (4.0%) |
Public vs Private Health Insurance Coverage by Age in Black Diamond
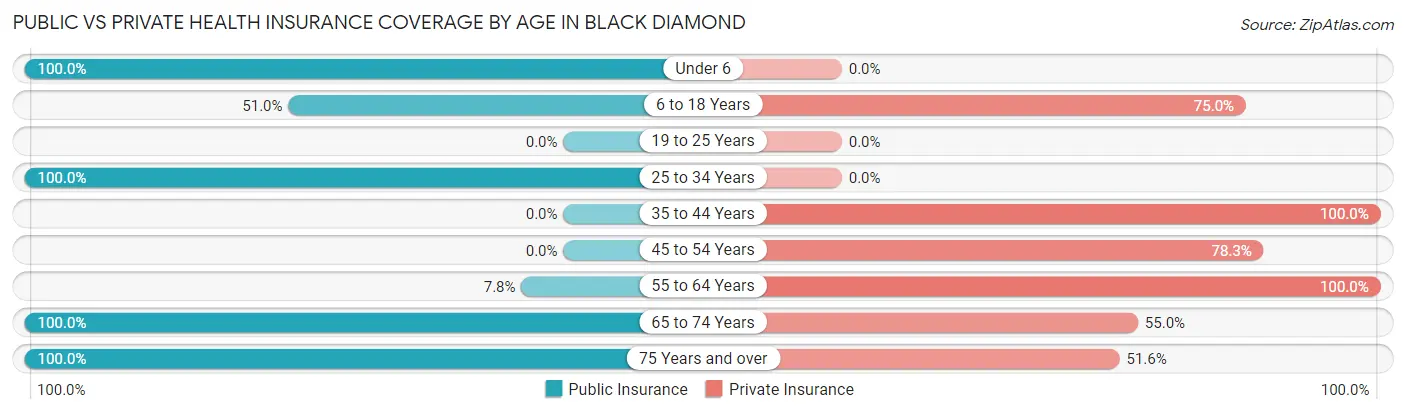
| Age Bracket | Public Insurance | Private Insurance |
| Under 6 | 37 (100.0%) | 0 (0.0%) |
| 6 to 18 Years | 49 (51.0%) | 72 (75.0%) |
| 19 to 25 Years | 0 (0.0%) | 0 (0.0%) |
| 25 to 34 Years | 59 (100.0%) | 0 (0.0%) |
| 35 to 44 Years | 0 (0.0%) | 27 (100.0%) |
| 45 to 54 Years | 0 (0.0%) | 83 (78.3%) |
| 55 to 64 Years | 18 (7.8%) | 231 (100.0%) |
| 65 to 74 Years | 353 (100.0%) | 194 (55.0%) |
| 75 Years and over | 128 (100.0%) | 66 (51.6%) |
| Total | 644 (62.1%) | 673 (64.9%) |
Disability Status by Sex by Age in Black Diamond
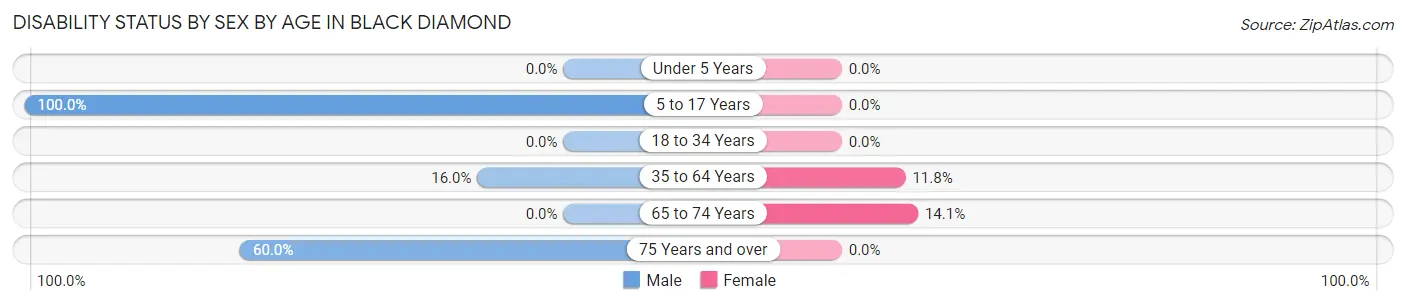
| Age Bracket | Male | Female |
| Under 5 Years | 0 (0.0%) | 0 (0.0%) |
| 5 to 17 Years | 25 (100.0%) | 0 (0.0%) |
| 18 to 34 Years | 0 (0.0%) | 0 (0.0%) |
| 35 to 64 Years | 23 (16.0%) | 26 (11.8%) |
| 65 to 74 Years | 0 (0.0%) | 28 (14.1%) |
| 75 Years and over | 33 (60.0%) | 0 (0.0%) |
Disability Class by Sex by Age in Black Diamond
Disability Class: Hearing Difficulty
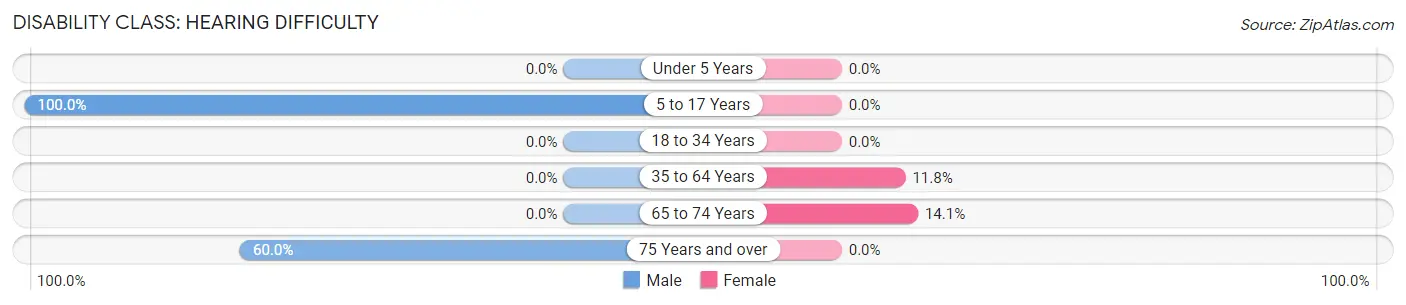
| Age Bracket | Male | Female |
| Under 5 Years | 0 (0.0%) | 0 (0.0%) |
| 5 to 17 Years | 25 (100.0%) | 0 (0.0%) |
| 18 to 34 Years | 0 (0.0%) | 0 (0.0%) |
| 35 to 64 Years | 0 (0.0%) | 26 (11.8%) |
| 65 to 74 Years | 0 (0.0%) | 28 (14.1%) |
| 75 Years and over | 33 (60.0%) | 0 (0.0%) |
Disability Class: Vision Difficulty
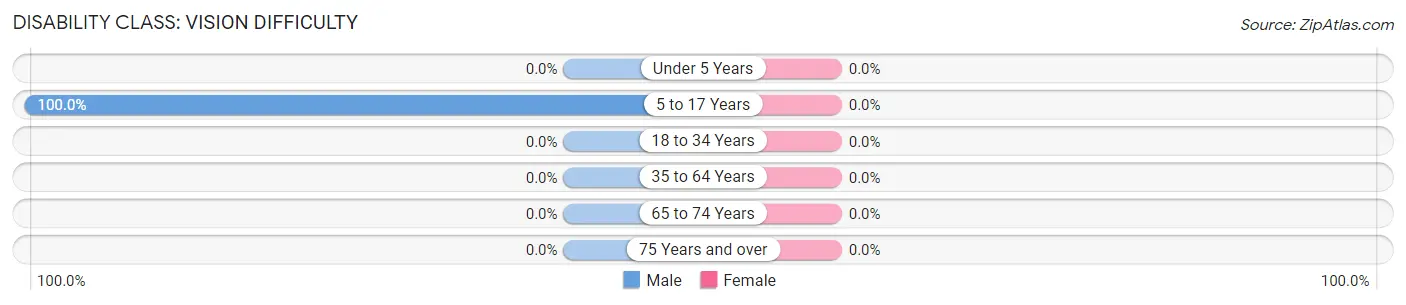
| Age Bracket | Male | Female |
| Under 5 Years | 0 (0.0%) | 0 (0.0%) |
| 5 to 17 Years | 25 (100.0%) | 0 (0.0%) |
| 18 to 34 Years | 0 (0.0%) | 0 (0.0%) |
| 35 to 64 Years | 0 (0.0%) | 0 (0.0%) |
| 65 to 74 Years | 0 (0.0%) | 0 (0.0%) |
| 75 Years and over | 0 (0.0%) | 0 (0.0%) |
Disability Class: Cognitive Difficulty
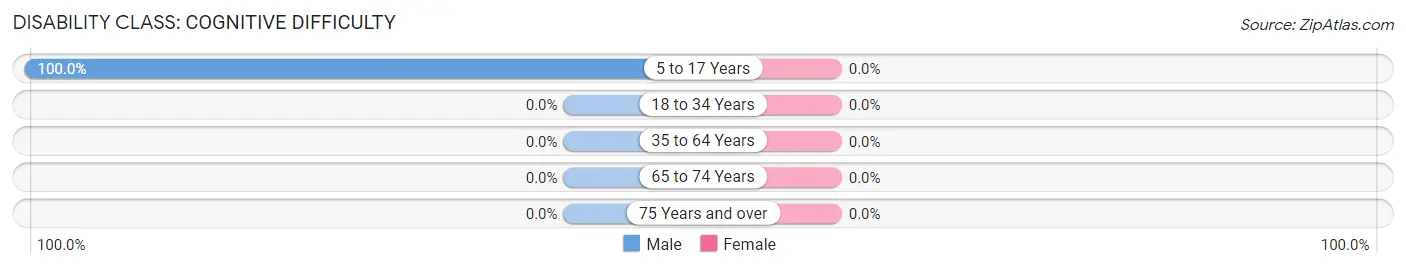
| Age Bracket | Male | Female |
| 5 to 17 Years | 25 (100.0%) | 0 (0.0%) |
| 18 to 34 Years | 0 (0.0%) | 0 (0.0%) |
| 35 to 64 Years | 0 (0.0%) | 0 (0.0%) |
| 65 to 74 Years | 0 (0.0%) | 0 (0.0%) |
| 75 Years and over | 0 (0.0%) | 0 (0.0%) |
Disability Class: Ambulatory Difficulty
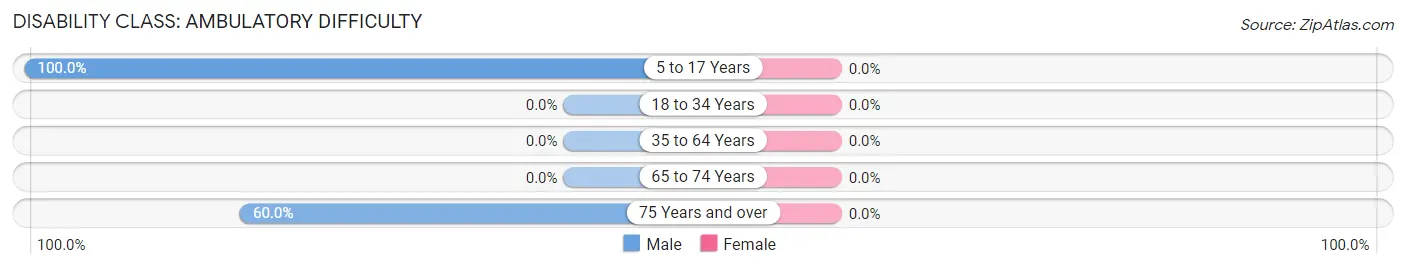
| Age Bracket | Male | Female |
| 5 to 17 Years | 25 (100.0%) | 0 (0.0%) |
| 18 to 34 Years | 0 (0.0%) | 0 (0.0%) |
| 35 to 64 Years | 0 (0.0%) | 0 (0.0%) |
| 65 to 74 Years | 0 (0.0%) | 0 (0.0%) |
| 75 Years and over | 33 (60.0%) | 0 (0.0%) |
Disability Class: Self-Care Difficulty
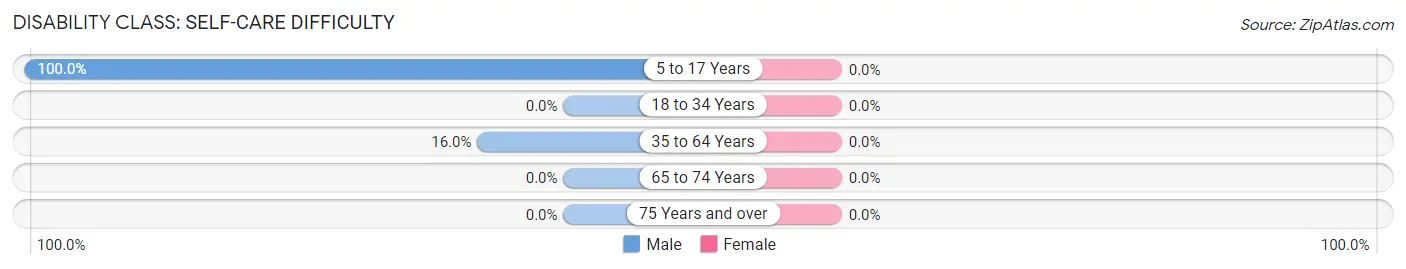
| Age Bracket | Male | Female |
| 5 to 17 Years | 25 (100.0%) | 0 (0.0%) |
| 18 to 34 Years | 0 (0.0%) | 0 (0.0%) |
| 35 to 64 Years | 23 (16.0%) | 0 (0.0%) |
| 65 to 74 Years | 0 (0.0%) | 0 (0.0%) |
| 75 Years and over | 0 (0.0%) | 0 (0.0%) |
Technology Access in Black Diamond
Computing Device Access in Black Diamond
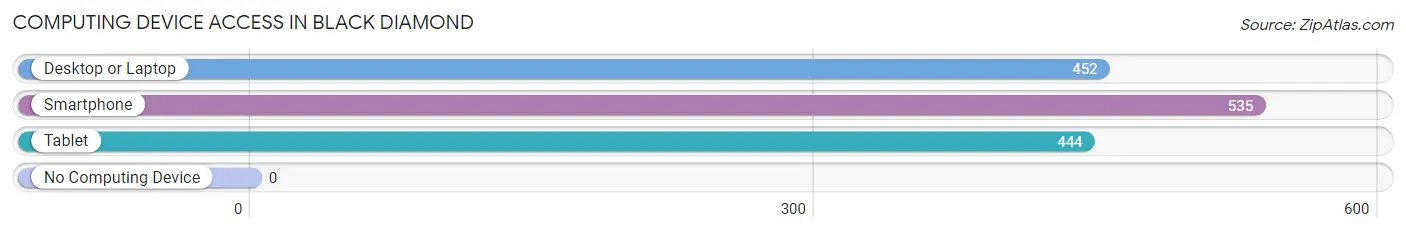
| Device Type | # Households | % Households |
| Desktop or Laptop | 452 | 84.5% |
| Smartphone | 535 | 100.0% |
| Tablet | 444 | 83.0% |
| No Computing Device | 0 | 0.0% |
| Total | 535 | 100.0% |
Internet Access in Black Diamond
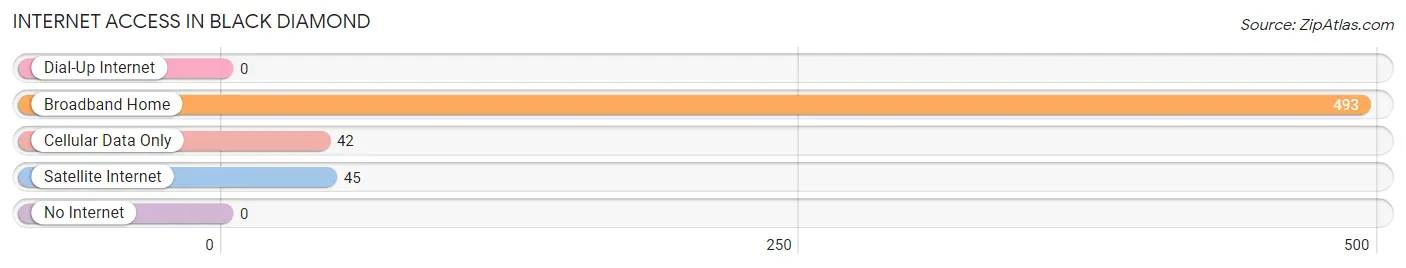
| Internet Type | # Households | % Households |
| Dial-Up Internet | 0 | 0.0% |
| Broadband Home | 493 | 92.1% |
| Cellular Data Only | 42 | 7.9% |
| Satellite Internet | 45 | 8.4% |
| No Internet | 0 | 0.0% |
| Total | 535 | 100.0% |
Black Diamond Summary
Diamond, Florida is a small town located in the northern part of the state, near the Georgia border. It is part of the Tallahassee Metropolitan Statistical Area and is located in Madison County. The town was founded in 1845 and was named after the nearby Black Diamond Mine. The town has a population of approximately 1,000 people and is known for its rural charm and small-town atmosphere.
History
The town of Black Diamond was founded in 1845 by a group of settlers from Georgia. The town was named after the nearby Black Diamond Mine, which was discovered in 1844. The mine was a major source of income for the town and provided jobs for many of the residents. The town grew quickly and by the late 1800s, it had become a thriving community with a population of over 1,000 people.
The town was a major center for the timber industry and was home to several sawmills and lumber companies. The town also had a thriving agricultural industry, with many of the residents growing cotton, corn, and other crops.
In the early 1900s, the town began to decline as the timber industry moved away and the population began to decline. The town was hit hard by the Great Depression and many of the businesses closed. The town was also hit hard by the Dust Bowl of the 1930s, which caused many of the farmers to leave the area.
Geography
Black Diamond is located in the northern part of Florida, near the Georgia border. The town is located in Madison County and is part of the Tallahassee Metropolitan Statistical Area. The town is located in a rural area and is surrounded by forests and farmland. The town is located near the Ochlockonee River and is approximately 20 miles from the state capital of Tallahassee.
The town has a total area of 1.2 square miles, all of which is land. The town has a humid subtropical climate, with hot, humid summers and mild winters. The average temperature in the summer is around 90 degrees Fahrenheit and the average temperature in the winter is around 50 degrees Fahrenheit.
Economy
The economy of Black Diamond is largely based on agriculture and timber. The town is home to several farms and ranches, which produce a variety of crops, including cotton, corn, and soybeans. The town is also home to several sawmills and lumber companies, which provide jobs for many of the residents.
The town also has a small tourism industry, with several bed and breakfasts and other tourist attractions. The town is also home to several antique stores and other small businesses.
Demographics
As of the 2010 census, the town had a population of 1,000 people. The racial makeup of the town was 95.2% White, 1.2% African American, 0.2% Native American, 0.2% Asian, 0.2% from other races, and 2.2% from two or more races. Hispanic or Latino of any race were 1.2% of the population.
The median income for a household in the town was $30,000 and the median income for a family was $35,000. The per capita income for the town was $15,000. About 15.2% of the population was below the poverty line.
Conclusion
Black Diamond, Florida is a small town located in the northern part of the state, near the Georgia border. The town was founded in 1845 and was named after the nearby Black Diamond Mine. The town has a population of approximately 1,000 people and is known for its rural charm and small-town atmosphere. The economy of the town is largely based on agriculture and timber, and the town also has a small tourism industry. The town has a diverse population, with a median income of $30,000 and a per capita income of $15,000.
Common Questions
What is Per Capita Income in Black Diamond?
Per Capita income in Black Diamond is $58,576.
What is the Median Family Income in Black Diamond?
Median Family Income in Black Diamond is $105,223.
What is the Median Household income in Black Diamond?
Median Household Income in Black Diamond is $115,045.
What is Inequality or Gini Index in Black Diamond?
Inequality or Gini Index in Black Diamond is 0.29.
What is the Total Population of Black Diamond?
Total Population of Black Diamond is 1,195.
What is the Total Male Population of Black Diamond?
Total Male Population of Black Diamond is 486.
What is the Total Female Population of Black Diamond?
Total Female Population of Black Diamond is 709.
What is the Ratio of Males per 100 Females in Black Diamond?
There are 68.55 Males per 100 Females in Black Diamond.
What is the Ratio of Females per 100 Males in Black Diamond?
There are 145.88 Females per 100 Males in Black Diamond.
What is the Median Population Age in Black Diamond?
Median Population Age in Black Diamond is 66.9 Years.
What is the Average Family Size in Black Diamond
Average Family Size in Black Diamond is 2.5 People.
What is the Average Household Size in Black Diamond
Average Household Size in Black Diamond is 1.9 People.
How Large is the Labor Force in Black Diamond?
There are 243 People in the Labor Forcein in Black Diamond.
What is the Percentage of People in the Labor Force in Black Diamond?
21.9% of People are in the Labor Force in Black Diamond.
What is the Unemployment Rate in Black Diamond?
Unemployment Rate in Black Diamond is 14.0%.