McRoberts, KY Map & Demographics
McRoberts Map
McRoberts Overview
$25,792
PER CAPITA INCOME
$115,667
AVG FAMILY INCOME
77.2%
WAGE / INCOME GAP [ % ]
22.8¢/ $1
WAGE / INCOME GAP [ $ ]
0.40
INEQUALITY / GINI INDEX
726
TOTAL POPULATION
414
MALE POPULATION
312
FEMALE POPULATION
132.69
MALES / 100 FEMALES
75.36
FEMALES / 100 MALES
41.4
MEDIAN AGE
2.8
AVG FAMILY SIZE
2.8
AVG HOUSEHOLD SIZE
270
LABOR FORCE [ PEOPLE ]
48.8%
PERCENT IN LABOR FORCE
Income in McRoberts
Income Overview in McRoberts
| Characteristic | Number | Measure |
| Per Capita Income | 726 | $25,792 |
| Median Family Income | 198 | $115,667 |
| Mean Family Income | 198 | $85,401 |
| Median Household Income | 260 | $0 |
| Mean Household Income | 260 | $71,579 |
| Income Deficit | 198 | $0 |
| Wage / Income Gap (%) | 726 | 77.21% |
| Wage / Income Gap ($) | 726 | 22.79¢ per $1 |
| Gini / Inequality Index | 726 | 0.40 |
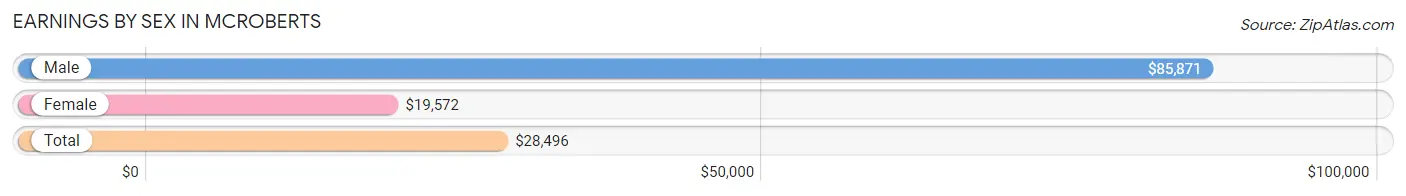
Earnings by Sex in McRoberts
Average Earnings in McRoberts are $28,496, $85,871 for men and $19,572 for women, a difference of 77.2%.
| Sex | Number | Average Earnings |
| Male | 174 (47.7%) | $85,871 |
| Female | 191 (52.3%) | $19,572 |
| Total | 365 (100.0%) | $28,496 |
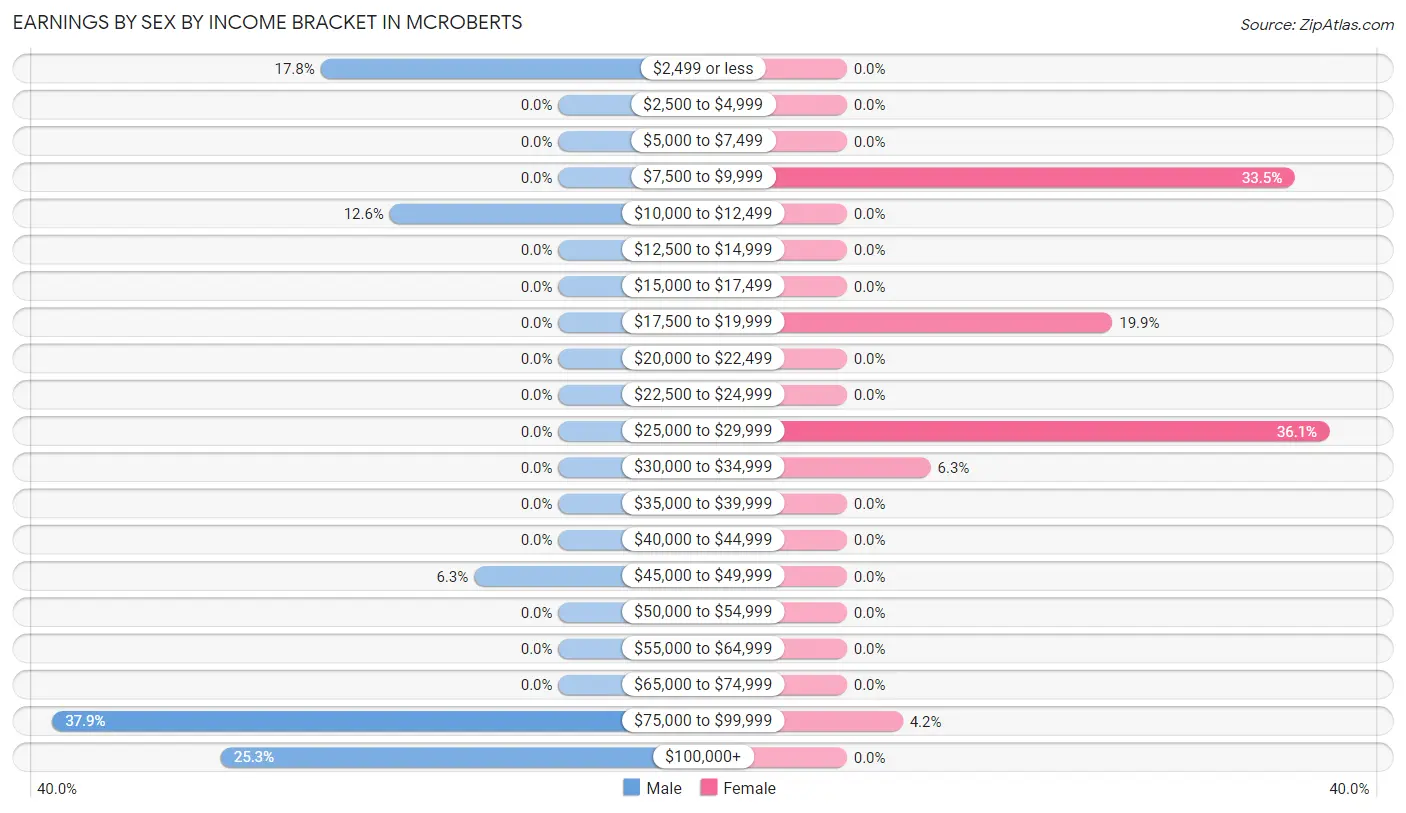
Earnings by Sex by Income Bracket in McRoberts
The most common earnings brackets in McRoberts are $75,000 to $99,999 for men (66 | 37.9%) and $25,000 to $29,999 for women (69 | 36.1%).
| Income | Male | Female |
| $2,499 or less | 31 (17.8%) | 0 (0.0%) |
| $2,500 to $4,999 | 0 (0.0%) | 0 (0.0%) |
| $5,000 to $7,499 | 0 (0.0%) | 0 (0.0%) |
| $7,500 to $9,999 | 0 (0.0%) | 64 (33.5%) |
| $10,000 to $12,499 | 22 (12.6%) | 0 (0.0%) |
| $12,500 to $14,999 | 0 (0.0%) | 0 (0.0%) |
| $15,000 to $17,499 | 0 (0.0%) | 0 (0.0%) |
| $17,500 to $19,999 | 0 (0.0%) | 38 (19.9%) |
| $20,000 to $22,499 | 0 (0.0%) | 0 (0.0%) |
| $22,500 to $24,999 | 0 (0.0%) | 0 (0.0%) |
| $25,000 to $29,999 | 0 (0.0%) | 69 (36.1%) |
| $30,000 to $34,999 | 0 (0.0%) | 12 (6.3%) |
| $35,000 to $39,999 | 0 (0.0%) | 0 (0.0%) |
| $40,000 to $44,999 | 0 (0.0%) | 0 (0.0%) |
| $45,000 to $49,999 | 11 (6.3%) | 0 (0.0%) |
| $50,000 to $54,999 | 0 (0.0%) | 0 (0.0%) |
| $55,000 to $64,999 | 0 (0.0%) | 0 (0.0%) |
| $65,000 to $74,999 | 0 (0.0%) | 0 (0.0%) |
| $75,000 to $99,999 | 66 (37.9%) | 8 (4.2%) |
| $100,000+ | 44 (25.3%) | 0 (0.0%) |
| Total | 174 (100.0%) | 191 (100.0%) |
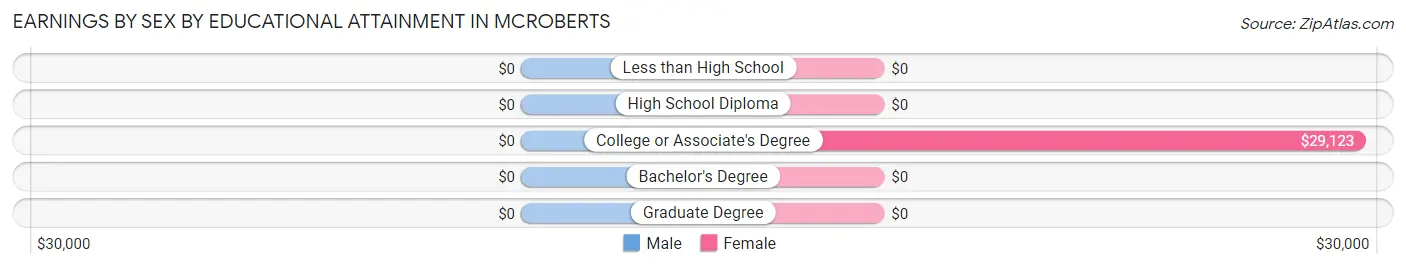
Earnings by Sex by Educational Attainment in McRoberts
| Educational Attainment | Male Income | Female Income |
| Less than High School | - | - |
| High School Diploma | - | - |
| College or Associate's Degree | - | - |
| Bachelor's Degree | - | - |
| Graduate Degree | - | - |
| Total | $86,458 | $28,424 |
Family Income in McRoberts
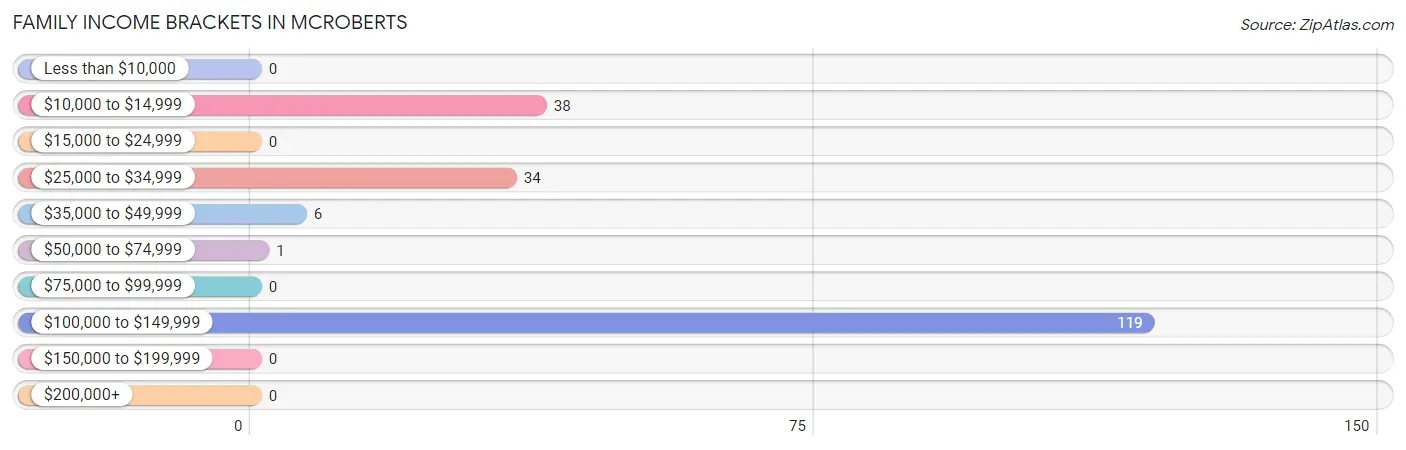
Family Income Brackets in McRoberts
According to the McRoberts family income data, there are 119 families falling into the $100,000 to $149,999 income range, which is the most common income bracket and makes up 60.1% of all families.
| Income Bracket | # Families | % Families |
| Less than $10,000 | 0 | 0.0% |
| $10,000 to $14,999 | 38 | 19.2% |
| $15,000 to $24,999 | 0 | 0.0% |
| $25,000 to $34,999 | 34 | 17.2% |
| $35,000 to $49,999 | 6 | 3.0% |
| $50,000 to $74,999 | 1 | 0.5% |
| $75,000 to $99,999 | 0 | 0.0% |
| $100,000 to $149,999 | 119 | 60.1% |
| $150,000 to $199,999 | 0 | 0.0% |
| $200,000+ | 0 | 0.0% |
Family Income by Famaliy Size in McRoberts
| Income Bracket | # Families | Median Income |
| 2-Person Families | 130 (65.7%) | $0 |
| 3-Person Families | 18 (9.1%) | $0 |
| 4-Person Families | 44 (22.2%) | $0 |
| 5-Person Families | 0 (0.0%) | $0 |
| 6-Person Families | 6 (3.0%) | $0 |
| 7+ Person Families | 0 (0.0%) | $0 |
| Total | 198 (100.0%) | $115,667 |
Family Income by Number of Earners in McRoberts
| Number of Earners | # Families | Median Income |
| No Earners | 38 (19.2%) | $0 |
| 1 Earner | 49 (24.7%) | $0 |
| 2 Earners | 67 (33.8%) | $0 |
| 3+ Earners | 44 (22.2%) | $0 |
| Total | 198 (100.0%) | $115,667 |
Household Income in McRoberts
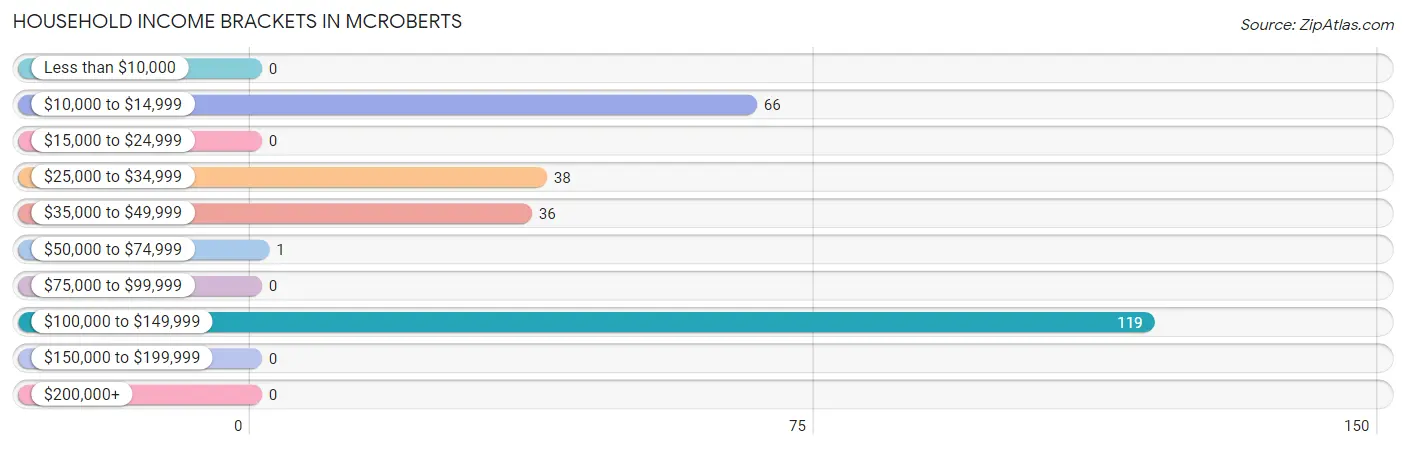
Household Income Brackets in McRoberts
With 119 households falling in the category, the $100,000 to $149,999 income range is the most frequent in McRoberts, accounting for 45.8% of all households.
| Income Bracket | # Households | % Households |
| Less than $10,000 | 0 | 0.0% |
| $10,000 to $14,999 | 66 | 25.4% |
| $15,000 to $24,999 | 0 | 0.0% |
| $25,000 to $34,999 | 38 | 14.6% |
| $35,000 to $49,999 | 36 | 13.8% |
| $50,000 to $74,999 | 1 | 0.4% |
| $75,000 to $99,999 | 0 | 0.0% |
| $100,000 to $149,999 | 119 | 45.8% |
| $150,000 to $199,999 | 0 | 0.0% |
| $200,000+ | 0 | 0.0% |
Household Income by Householder Age in McRoberts
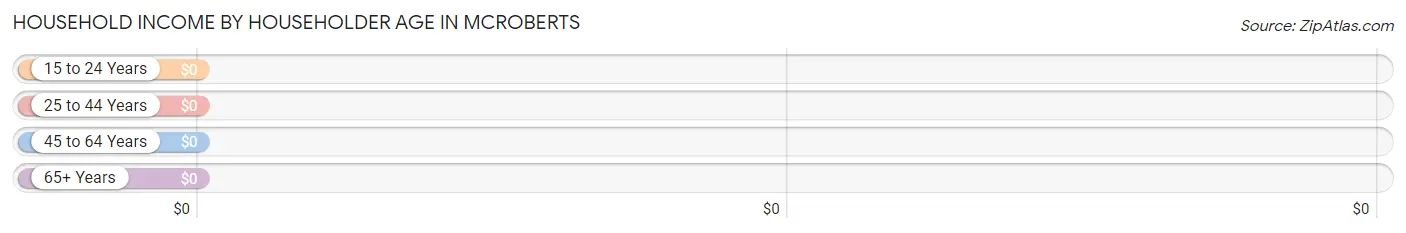
| Income Bracket | # Households | Median Income |
| 15 to 24 Years | 0 (0.0%) | $0 |
| 25 to 44 Years | 131 (50.4%) | $0 |
| 45 to 64 Years | 80 (30.8%) | $0 |
| 65+ Years | 49 (18.9%) | $0 |
| Total | 260 (100.0%) | $0 |
Poverty in McRoberts
Income Below Poverty by Sex and Age in McRoberts
With 12.0% poverty level for males and 22.1% for females among the residents of McRoberts, 65 to 74 year old males and 65 to 74 year old females are the most vulnerable to poverty, with 14 males (66.7%) and 28 females (100.0%) in their respective age groups living below the poverty level.
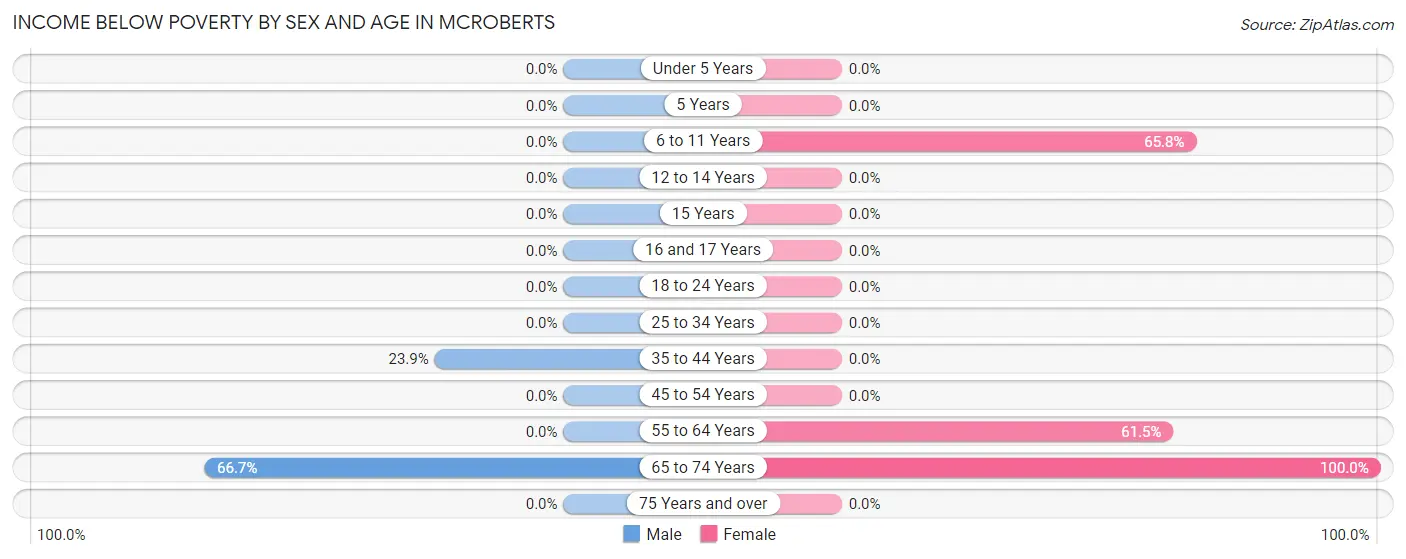
| Age Bracket | Male | Female |
| Under 5 Years | 0 (0.0%) | 0 (0.0%) |
| 5 Years | 0 (0.0%) | 0 (0.0%) |
| 6 to 11 Years | 0 (0.0%) | 25 (65.8%) |
| 12 to 14 Years | 0 (0.0%) | 0 (0.0%) |
| 15 Years | 0 (0.0%) | 0 (0.0%) |
| 16 and 17 Years | 0 (0.0%) | 0 (0.0%) |
| 18 to 24 Years | 0 (0.0%) | 0 (0.0%) |
| 25 to 34 Years | 0 (0.0%) | 0 (0.0%) |
| 35 to 44 Years | 22 (23.9%) | 0 (0.0%) |
| 45 to 54 Years | 0 (0.0%) | 0 (0.0%) |
| 55 to 64 Years | 0 (0.0%) | 16 (61.5%) |
| 65 to 74 Years | 14 (66.7%) | 28 (100.0%) |
| 75 Years and over | 0 (0.0%) | 0 (0.0%) |
| Total | 36 (12.0%) | 69 (22.1%) |
Income Above Poverty by Sex and Age in McRoberts
According to the poverty statistics in McRoberts, males aged under 5 years and females aged 15 years are the age groups that are most secure financially, with 100.0% of males and 100.0% of females in these age groups living above the poverty line.
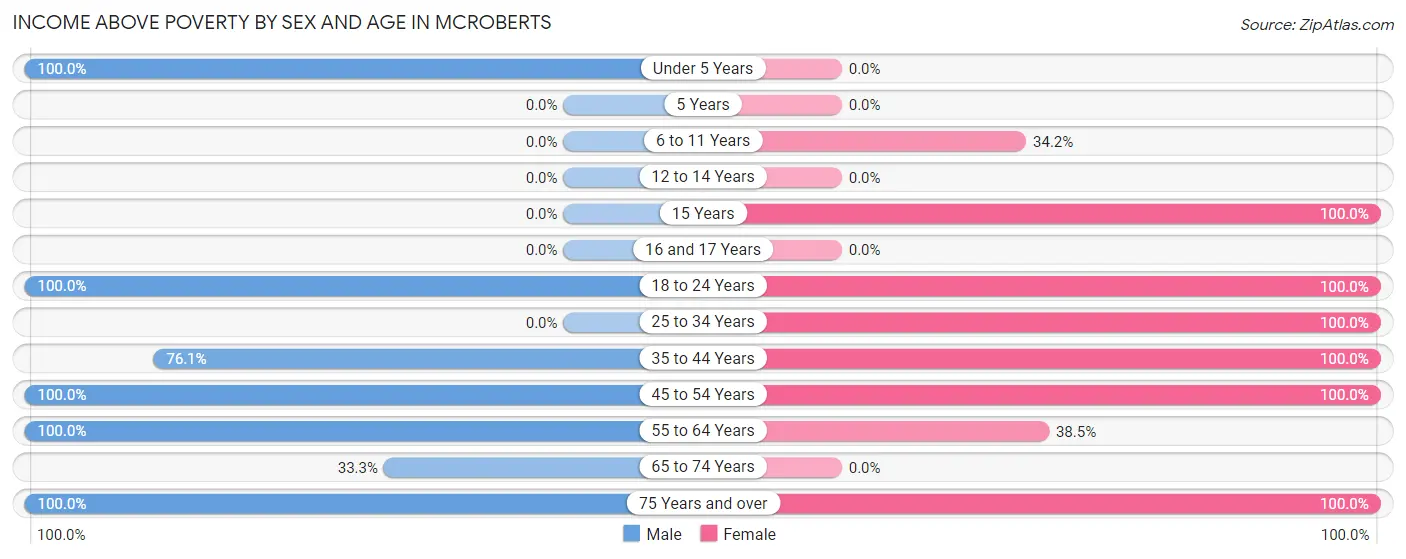
| Age Bracket | Male | Female |
| Under 5 Years | 13 (100.0%) | 0 (0.0%) |
| 5 Years | 0 (0.0%) | 0 (0.0%) |
| 6 to 11 Years | 0 (0.0%) | 13 (34.2%) |
| 12 to 14 Years | 0 (0.0%) | 0 (0.0%) |
| 15 Years | 0 (0.0%) | 8 (100.0%) |
| 16 and 17 Years | 0 (0.0%) | 0 (0.0%) |
| 18 to 24 Years | 36 (100.0%) | 64 (100.0%) |
| 25 to 34 Years | 0 (0.0%) | 12 (100.0%) |
| 35 to 44 Years | 70 (76.1%) | 105 (100.0%) |
| 45 to 54 Years | 110 (100.0%) | 13 (100.0%) |
| 55 to 64 Years | 11 (100.0%) | 10 (38.5%) |
| 65 to 74 Years | 7 (33.3%) | 0 (0.0%) |
| 75 Years and over | 17 (100.0%) | 18 (100.0%) |
| Total | 264 (88.0%) | 243 (77.9%) |
Income Below Poverty Among Married-Couple Families in McRoberts
The poverty statistics for married-couple families in McRoberts show that 9.8% or 16 of the total 164 families live below the poverty line. Families with no children have the highest poverty rate of 10.1%, comprising of 16 families. On the other hand, families with 3 or 4 children have the lowest poverty rate of 0.0%, which includes 0 families.
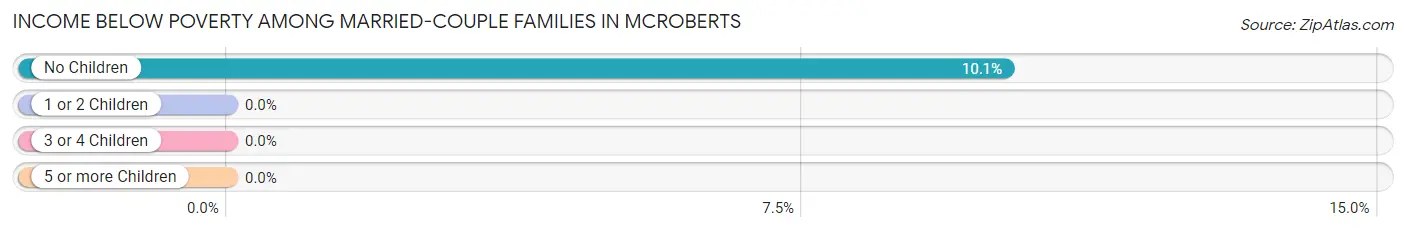
| Children | Above Poverty | Below Poverty |
| No Children | 142 (89.9%) | 16 (10.1%) |
| 1 or 2 Children | 0 (0.0%) | 0 (0.0%) |
| 3 or 4 Children | 6 (100.0%) | 0 (0.0%) |
| 5 or more Children | 0 (0.0%) | 0 (0.0%) |
| Total | 148 (90.2%) | 16 (9.8%) |
Income Below Poverty Among Single-Parent Households in McRoberts
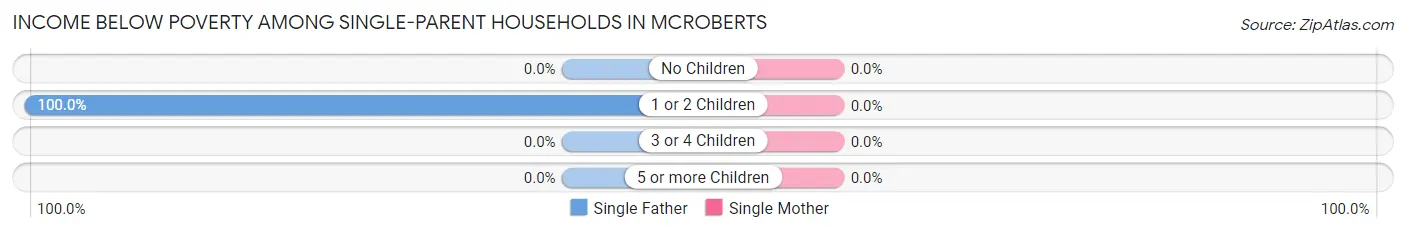
| Children | Single Father | Single Mother |
| No Children | 0 (0.0%) | 0 (0.0%) |
| 1 or 2 Children | 22 (100.0%) | 0 (0.0%) |
| 3 or 4 Children | 0 (0.0%) | 0 (0.0%) |
| 5 or more Children | 0 (0.0%) | 0 (0.0%) |
| Total | 22 (100.0%) | 0 (0.0%) |
Income Below Poverty Among Married-Couple vs Single-Parent Households in McRoberts
The poverty data for McRoberts shows that 16 of the married-couple family households (9.8%) and 22 of the single-parent households (64.7%) are living below the poverty level. Within the married-couple family households, those with no children have the highest poverty rate, with 16 households (10.1%) falling below the poverty line. Among the single-parent households, those with 1 or 2 children have the highest poverty rate, with 22 household (64.7%) living below poverty.
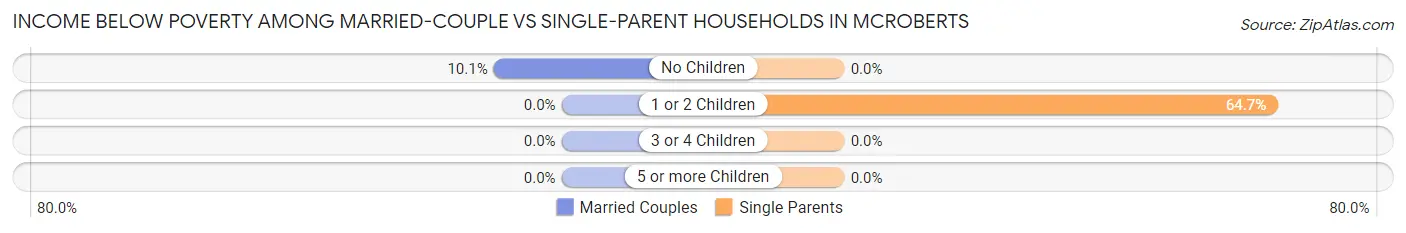
| Children | Married-Couple Families | Single-Parent Households |
| No Children | 16 (10.1%) | 0 (0.0%) |
| 1 or 2 Children | 0 (0.0%) | 22 (64.7%) |
| 3 or 4 Children | 0 (0.0%) | 0 (0.0%) |
| 5 or more Children | 0 (0.0%) | 0 (0.0%) |
| Total | 16 (9.8%) | 22 (64.7%) |
Race in McRoberts
The most populous races in McRoberts are , and White / Caucasian (726 | 100.0%).
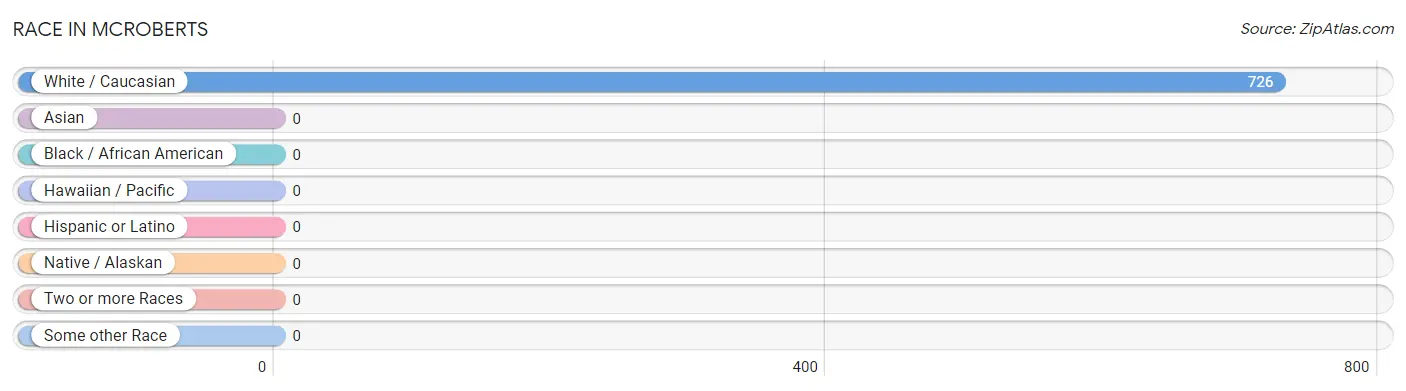
| Race | # Population | % Population |
| Asian | 0 | 0.0% |
| Black / African American | 0 | 0.0% |
| Hawaiian / Pacific | 0 | 0.0% |
| Hispanic or Latino | 0 | 0.0% |
| Native / Alaskan | 0 | 0.0% |
| White / Caucasian | 726 | 100.0% |
| Two or more Races | 0 | 0.0% |
| Some other Race | 0 | 0.0% |
| Total | 726 | 100.0% |
Ancestry in McRoberts
The most populous ancestries reported in McRoberts are American (258 | 35.5%), Irish (98 | 13.5%), European (66 | 9.1%), English (47 | 6.5%), and German (30 | 4.1%), together accounting for 68.7% of all McRoberts residents.
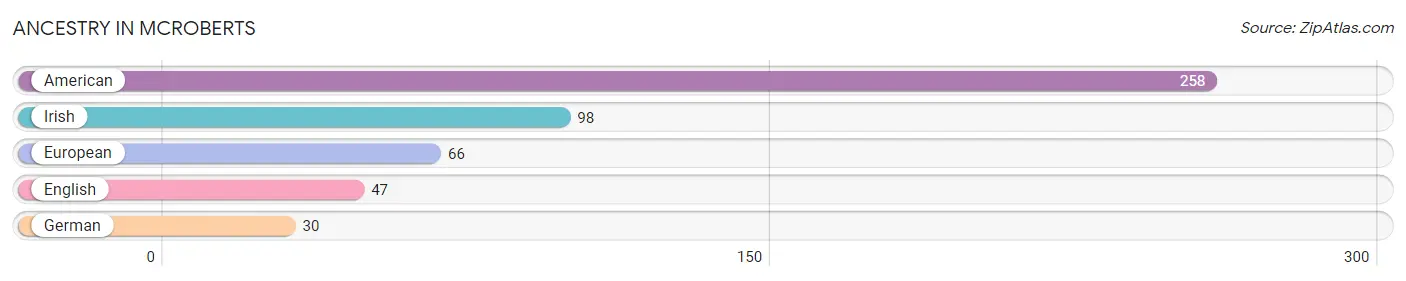
| Ancestry | # Population | % Population |
| American | 258 | 35.5% |
| English | 47 | 6.5% |
| European | 66 | 9.1% |
| German | 30 | 4.1% |
| Irish | 98 | 13.5% | View All 5 Rows |
Immigrants in McRoberts

| Immigration Origin | # Population | % Population | View All 0 Rows |
Sex and Age in McRoberts
Sex and Age in McRoberts
The most populous age groups in McRoberts are Under 5 Years (127 | 30.7%) for men and 40 to 44 Years (105 | 33.7%) for women.
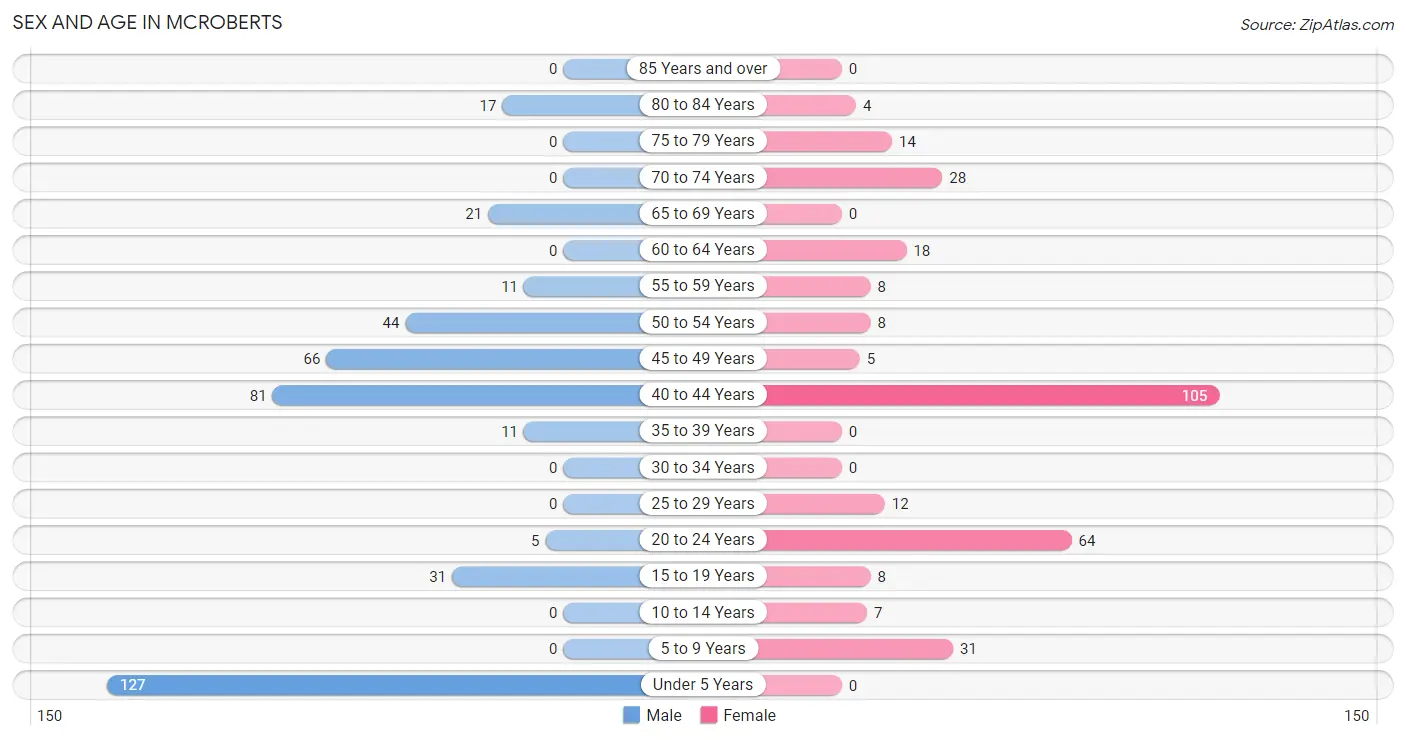
| Age Bracket | Male | Female |
| Under 5 Years | 127 (30.7%) | 0 (0.0%) |
| 5 to 9 Years | 0 (0.0%) | 31 (9.9%) |
| 10 to 14 Years | 0 (0.0%) | 7 (2.2%) |
| 15 to 19 Years | 31 (7.5%) | 8 (2.6%) |
| 20 to 24 Years | 5 (1.2%) | 64 (20.5%) |
| 25 to 29 Years | 0 (0.0%) | 12 (3.8%) |
| 30 to 34 Years | 0 (0.0%) | 0 (0.0%) |
| 35 to 39 Years | 11 (2.7%) | 0 (0.0%) |
| 40 to 44 Years | 81 (19.6%) | 105 (33.7%) |
| 45 to 49 Years | 66 (15.9%) | 5 (1.6%) |
| 50 to 54 Years | 44 (10.6%) | 8 (2.6%) |
| 55 to 59 Years | 11 (2.7%) | 8 (2.6%) |
| 60 to 64 Years | 0 (0.0%) | 18 (5.8%) |
| 65 to 69 Years | 21 (5.1%) | 0 (0.0%) |
| 70 to 74 Years | 0 (0.0%) | 28 (9.0%) |
| 75 to 79 Years | 0 (0.0%) | 14 (4.5%) |
| 80 to 84 Years | 17 (4.1%) | 4 (1.3%) |
| 85 Years and over | 0 (0.0%) | 0 (0.0%) |
| Total | 414 (100.0%) | 312 (100.0%) |
Families and Households in McRoberts
Median Family Size in McRoberts
The median family size in McRoberts is 2.78 persons per family, with married-couple families (164 | 82.8%) accounting for the largest median family size of 2.91 persons per family. On the other hand, single female/mother families (12 | 6.1%) represent the smallest median family size with 2.08 persons per family.
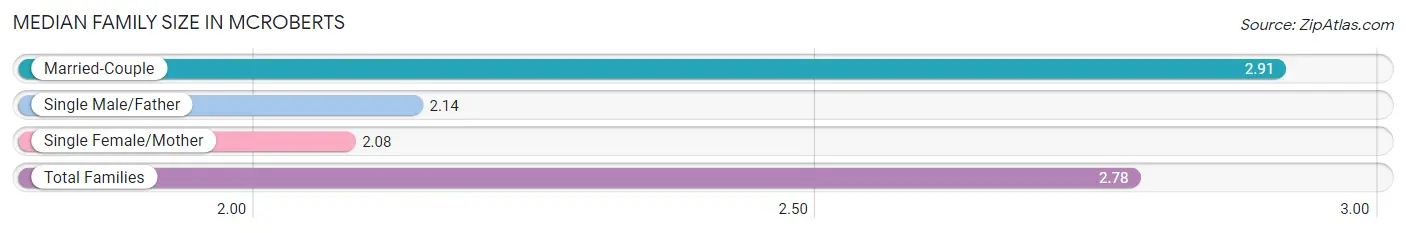
| Family Type | # Families | Family Size |
| Married-Couple | 164 (82.8%) | 2.91 |
| Single Male/Father | 22 (11.1%) | 2.14 |
| Single Female/Mother | 12 (6.1%) | 2.08 |
| Total Families | 198 (100.0%) | 2.78 |
Median Household Size in McRoberts
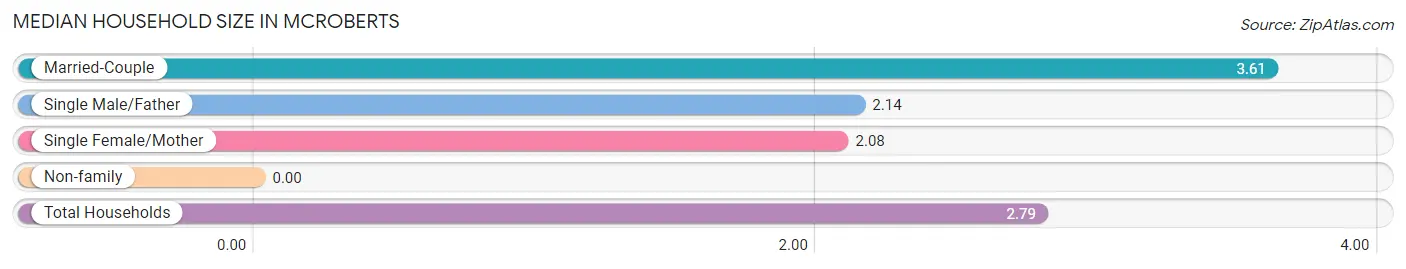
| Household Type | # Households | Household Size |
| Married-Couple | 164 (63.1%) | 3.61 |
| Single Male/Father | 22 (8.5%) | 2.14 |
| Single Female/Mother | 12 (4.6%) | 2.08 |
| Non-family | 62 (23.8%) | - |
| Total Households | 260 (100.0%) | 2.79 |
Household Size by Marriage Status in McRoberts
Out of a total of 260 households in McRoberts, 198 (76.1%) are family households, while 62 (23.8%) are nonfamily households. The most numerous type of family households are 3-person households, comprising 85, and the most common type of nonfamily households are 1-person households, comprising 62.
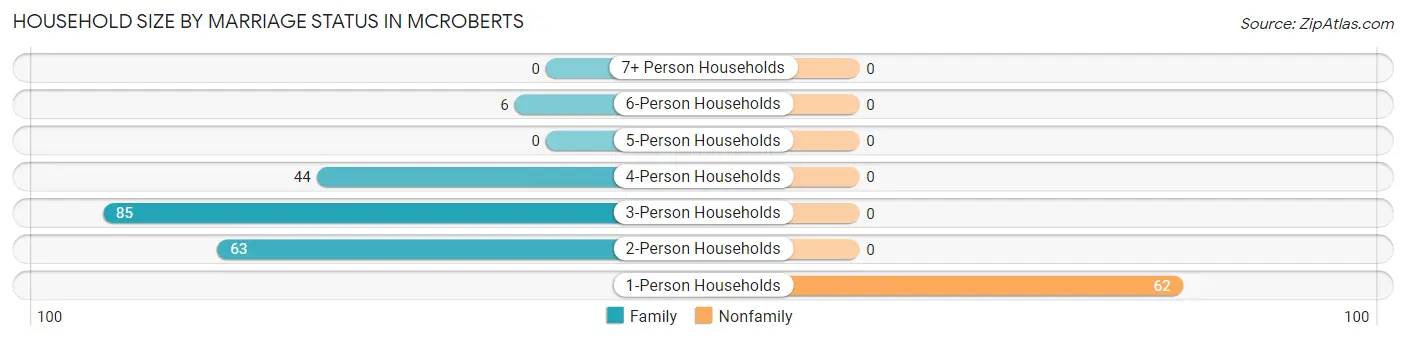
| Household Size | Family Households | Nonfamily Households |
| 1-Person Households | - | 62 (23.8%) |
| 2-Person Households | 63 (24.2%) | 0 (0.0%) |
| 3-Person Households | 85 (32.7%) | 0 (0.0%) |
| 4-Person Households | 44 (16.9%) | 0 (0.0%) |
| 5-Person Households | 0 (0.0%) | 0 (0.0%) |
| 6-Person Households | 6 (2.3%) | 0 (0.0%) |
| 7+ Person Households | 0 (0.0%) | 0 (0.0%) |
| Total | 198 (76.1%) | 62 (23.8%) |
Female Fertility in McRoberts
Fertility by Age in McRoberts
| Age Bracket | Women with Births | Births / 1,000 Women |
| 15 to 19 years | 0 (0.0%) | 0.0 |
| 20 to 34 years | 0 (0.0%) | 0.0 |
| 35 to 50 years | 0 (0.0%) | 0.0 |
| Total | 0 (0.0%) | 0.0 |
Fertility by Age by Marriage Status in McRoberts
| Age Bracket | Married | Unmarried |
| 15 to 19 years | 0 (0.0%) | 0 (0.0%) |
| 20 to 34 years | 0 (0.0%) | 0 (0.0%) |
| 35 to 50 years | 0 (0.0%) | 0 (0.0%) |
| Total | 0 (0.0%) | 0 (0.0%) |
Fertility by Education in McRoberts
| Educational Attainment | Women with Births | Births / 1,000 Women |
| Less than High School | 0 (0.0%) | 0.0 |
| High School Diploma | 0 (0.0%) | 0.0 |
| College or Associate's Degree | 0 (0.0%) | 0.0 |
| Bachelor's Degree | 0 (0.0%) | 0.0 |
| Graduate Degree | 0 (0.0%) | 0.0 |
| Total | 0 (0.0%) | 0.0 |
Fertility by Education by Marriage Status in McRoberts
| Educational Attainment | Married | Unmarried |
| Less than High School | 0 (0.0%) | 0 (0.0%) |
| High School Diploma | 0 (0.0%) | 0 (0.0%) |
| College or Associate's Degree | 0 (0.0%) | 0 (0.0%) |
| Bachelor's Degree | 0 (0.0%) | 0 (0.0%) |
| Graduate Degree | 0 (0.0%) | 0 (0.0%) |
| Total | 0 (0.0%) | 0 (0.0%) |
Employment Characteristics in McRoberts
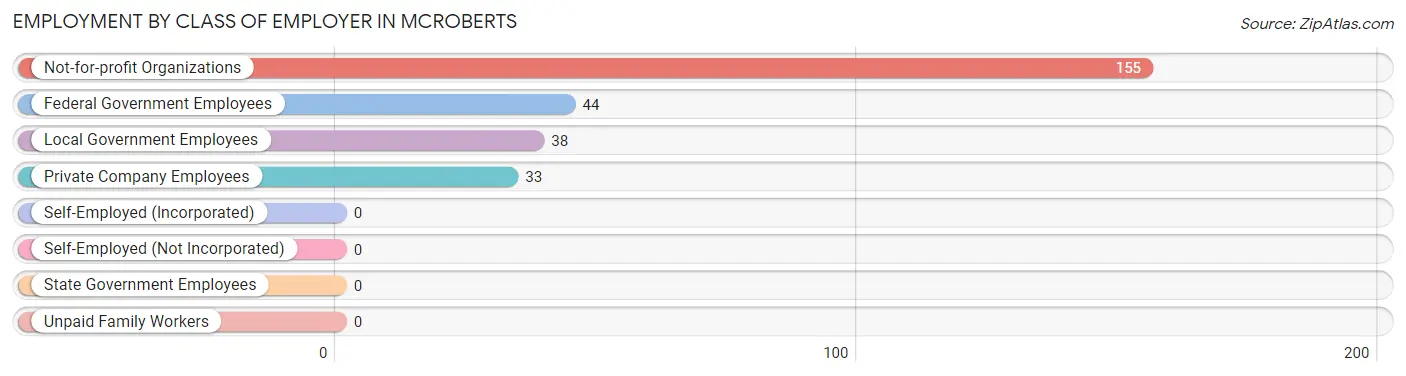
Employment by Class of Employer in McRoberts
Among the 270 employed individuals in McRoberts, not-for-profit organizations (155 | 57.4%), federal government employees (44 | 16.3%), and local government employees (38 | 14.1%) make up the most common classes of employment.
| Employer Class | # Employees | % Employees |
| Private Company Employees | 33 | 12.2% |
| Self-Employed (Incorporated) | 0 | 0.0% |
| Self-Employed (Not Incorporated) | 0 | 0.0% |
| Not-for-profit Organizations | 155 | 57.4% |
| Local Government Employees | 38 | 14.1% |
| State Government Employees | 0 | 0.0% |
| Federal Government Employees | 44 | 16.3% |
| Unpaid Family Workers | 0 | 0.0% |
| Total | 270 | 100.0% |
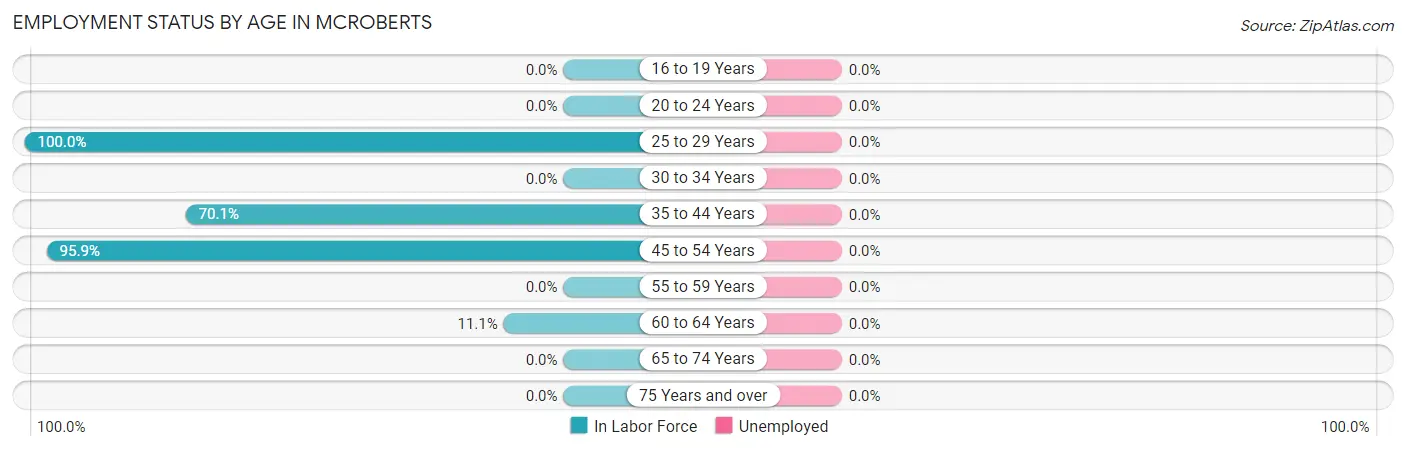
Employment Status by Age in McRoberts
| Age Bracket | In Labor Force | Unemployed |
| 16 to 19 Years | 0 (0.0%) | 0 (0.0%) |
| 20 to 24 Years | 0 (0.0%) | 0 (0.0%) |
| 25 to 29 Years | 12 (100.0%) | 0 (0.0%) |
| 30 to 34 Years | 0 (0.0%) | 0 (0.0%) |
| 35 to 44 Years | 138 (70.1%) | 0 (0.0%) |
| 45 to 54 Years | 118 (95.9%) | 0 (0.0%) |
| 55 to 59 Years | 0 (0.0%) | 0 (0.0%) |
| 60 to 64 Years | 2 (11.1%) | 0 (0.0%) |
| 65 to 74 Years | 0 (0.0%) | 0 (0.0%) |
| 75 Years and over | 0 (0.0%) | 0 (0.0%) |
| Total | 270 (48.8%) | 0 (0.0%) |
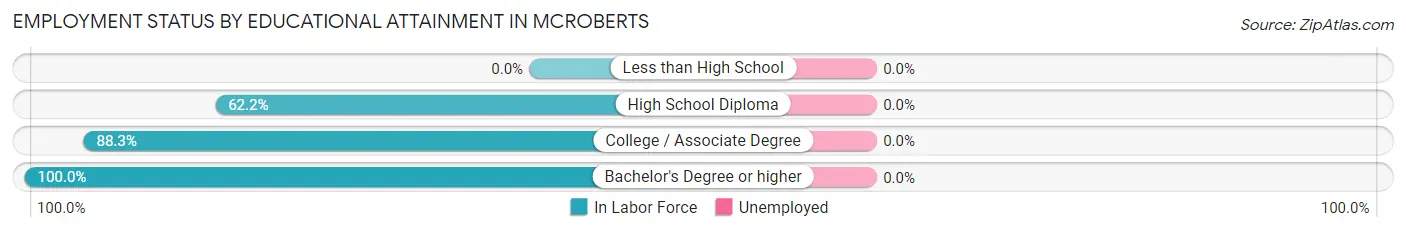
Employment Status by Educational Attainment in McRoberts
| Educational Attainment | In Labor Force | Unemployed |
| Less than High School | 0 (0.0%) | 0 (0.0%) |
| High School Diploma | 84 (62.2%) | 0 (0.0%) |
| College / Associate Degree | 98 (88.3%) | 0 (0.0%) |
| Bachelor's Degree or higher | 88 (100.0%) | 0 (0.0%) |
| Total | 270 (73.2%) | 0 (0.0%) |
Employment Occupations by Sex in McRoberts
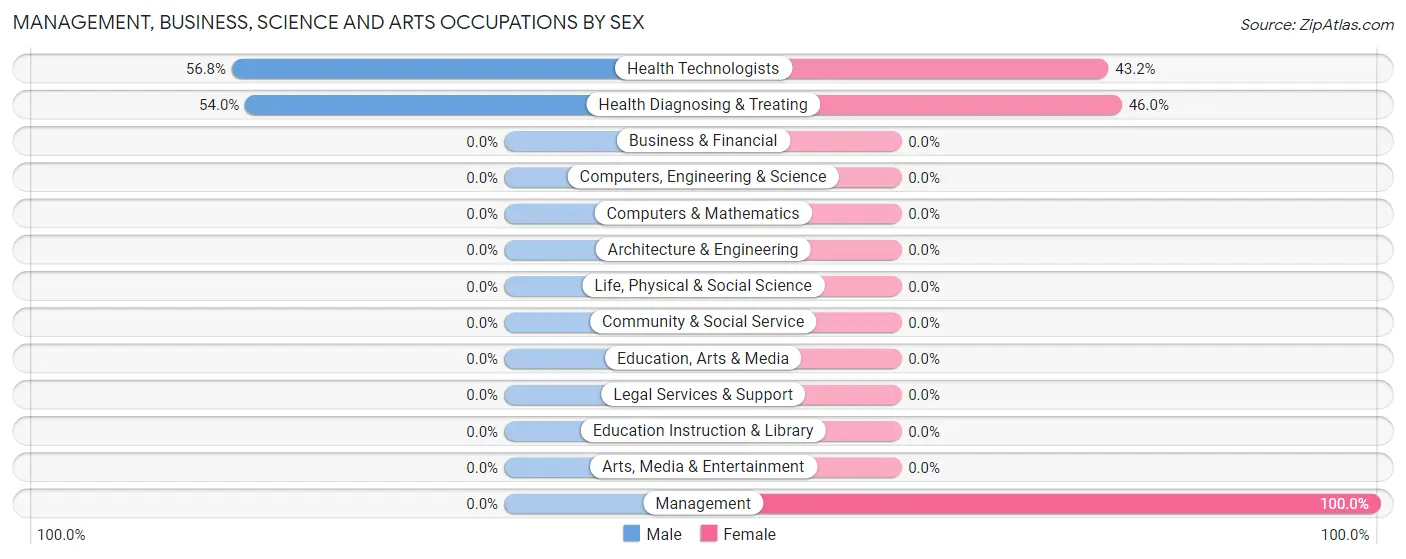
Management, Business, Science and Arts Occupations
The most common Management, Business, Science and Arts occupations in McRoberts are Health Diagnosing & Treating (163 | 60.4%), Health Technologists (155 | 57.4%), and Management (12 | 4.4%).
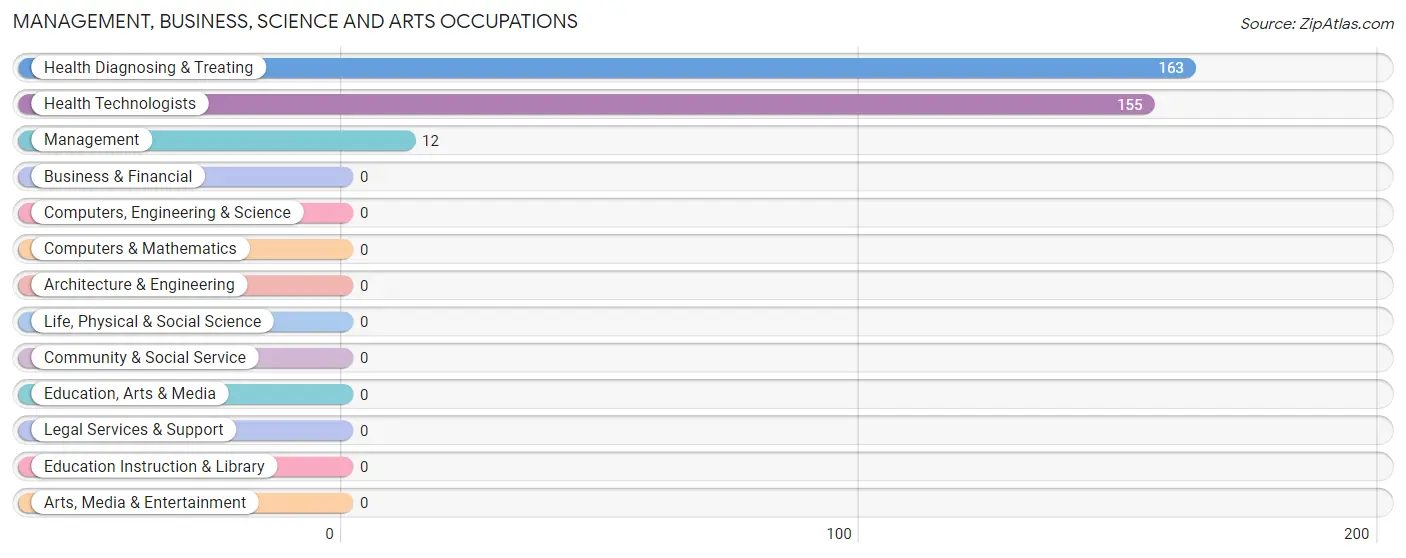
Management, Business, Science and Arts Occupations by Sex
Within the Management, Business, Science and Arts occupations in McRoberts, the most male-oriented occupations are Health Technologists (56.8%), and Health Diagnosing & Treating (54.0%), while the most female-oriented occupations are Management (100.0%), Health Diagnosing & Treating (46.0%), and Health Technologists (43.2%).
| Occupation | Male | Female |
| Management | 0 (0.0%) | 12 (100.0%) |
| Business & Financial | 0 (0.0%) | 0 (0.0%) |
| Computers, Engineering & Science | 0 (0.0%) | 0 (0.0%) |
| Computers & Mathematics | 0 (0.0%) | 0 (0.0%) |
| Architecture & Engineering | 0 (0.0%) | 0 (0.0%) |
| Life, Physical & Social Science | 0 (0.0%) | 0 (0.0%) |
| Community & Social Service | 0 (0.0%) | 0 (0.0%) |
| Education, Arts & Media | 0 (0.0%) | 0 (0.0%) |
| Legal Services & Support | 0 (0.0%) | 0 (0.0%) |
| Education Instruction & Library | 0 (0.0%) | 0 (0.0%) |
| Arts, Media & Entertainment | 0 (0.0%) | 0 (0.0%) |
| Health Diagnosing & Treating | 88 (54.0%) | 75 (46.0%) |
| Health Technologists | 88 (56.8%) | 67 (43.2%) |
| Total (Category) | 88 (50.3%) | 87 (49.7%) |
| Total (Overall) | 143 (53.0%) | 127 (47.0%) |
Services Occupations
Services Occupations by Sex
| Occupation | Male | Female |
| Healthcare Support | 0 (0.0%) | 0 (0.0%) |
| Security & Protection | 0 (0.0%) | 0 (0.0%) |
| Firefighting & Prevention | 0 (0.0%) | 0 (0.0%) |
| Law Enforcement | 0 (0.0%) | 0 (0.0%) |
| Food Preparation & Serving | 0 (0.0%) | 0 (0.0%) |
| Cleaning & Maintenance | 0 (0.0%) | 0 (0.0%) |
| Personal Care & Service | 0 (0.0%) | 0 (0.0%) |
| Total (Category) | 0 (0.0%) | 0 (0.0%) |
| Total (Overall) | 143 (53.0%) | 127 (47.0%) |
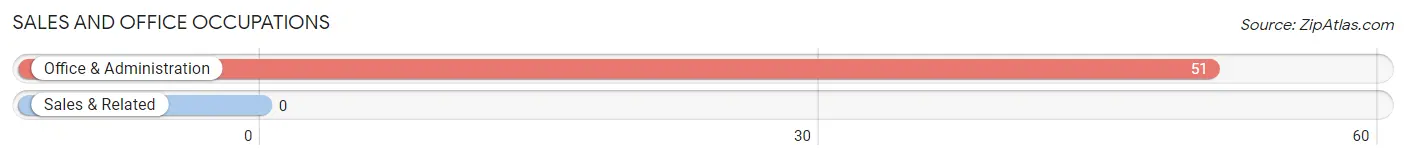
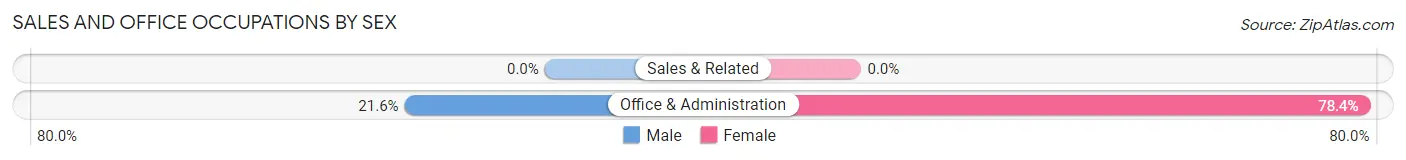
Sales and Office Occupations
The most common Sales and Office occupations in McRoberts are , and Office & Administration (51 | 18.9%).
Sales and Office Occupations by Sex
| Occupation | Male | Female |
| Sales & Related | 0 (0.0%) | 0 (0.0%) |
| Office & Administration | 11 (21.6%) | 40 (78.4%) |
| Total (Category) | 11 (21.6%) | 40 (78.4%) |
| Total (Overall) | 143 (53.0%) | 127 (47.0%) |
Natural Resources, Construction and Maintenance Occupations
Natural Resources, Construction and Maintenance Occupations by Sex
| Occupation | Male | Female |
| Farming, Fishing & Forestry | 0 (0.0%) | 0 (0.0%) |
| Construction & Extraction | 0 (0.0%) | 0 (0.0%) |
| Installation, Maintenance & Repair | 0 (0.0%) | 0 (0.0%) |
| Total (Category) | 0 (0.0%) | 0 (0.0%) |
| Total (Overall) | 143 (53.0%) | 127 (47.0%) |
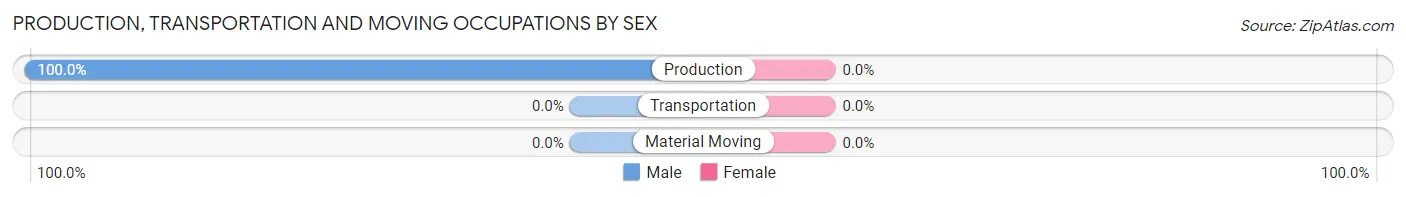
Production, Transportation and Moving Occupations
The most common Production, Transportation and Moving occupations in McRoberts are , and Production (44 | 16.3%).
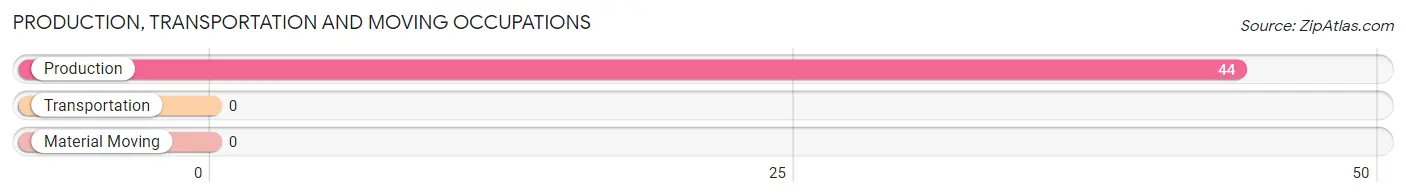
Production, Transportation and Moving Occupations by Sex
| Occupation | Male | Female |
| Production | 44 (100.0%) | 0 (0.0%) |
| Transportation | 0 (0.0%) | 0 (0.0%) |
| Material Moving | 0 (0.0%) | 0 (0.0%) |
| Total (Category) | 44 (100.0%) | 0 (0.0%) |
| Total (Overall) | 143 (53.0%) | 127 (47.0%) |
Employment Industries by Sex in McRoberts
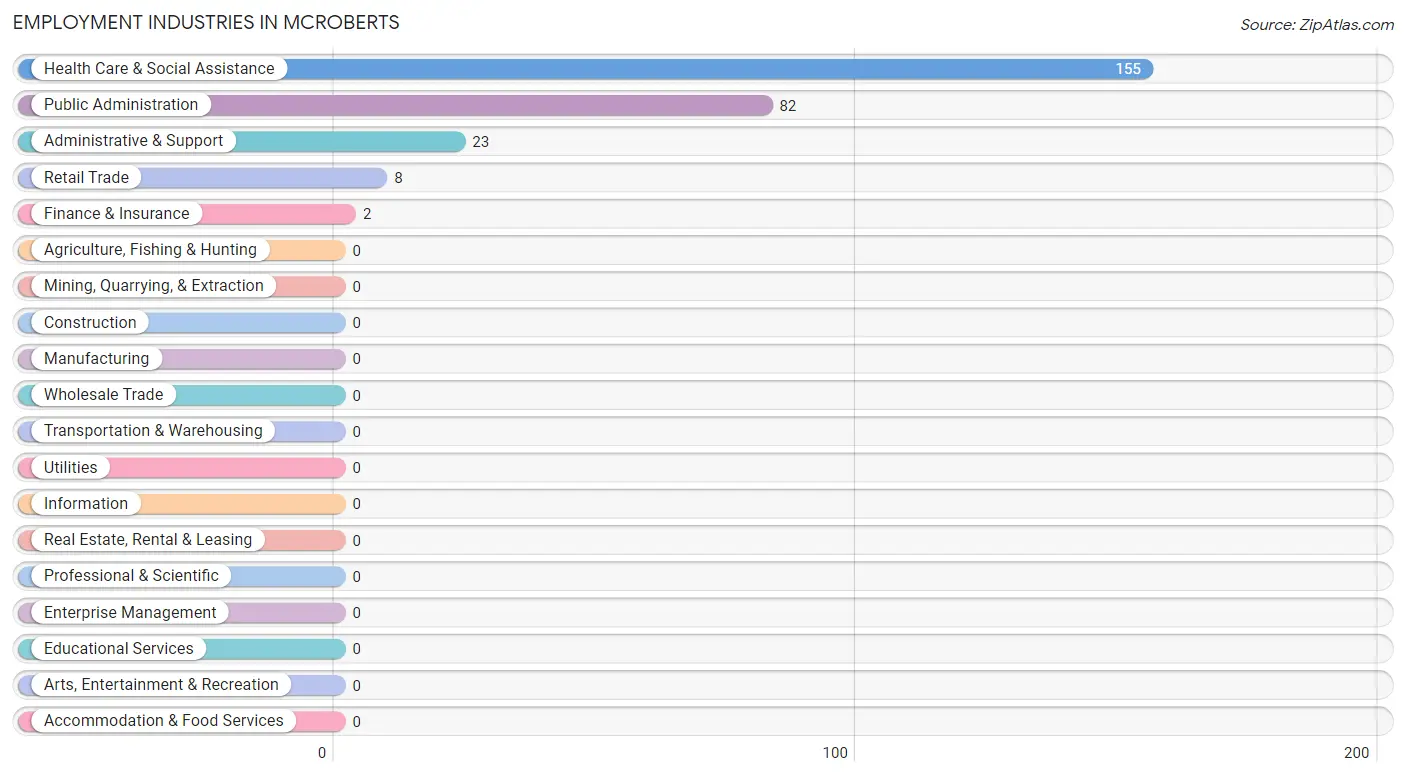
Employment Industries in McRoberts
The major employment industries in McRoberts include Health Care & Social Assistance (155 | 57.4%), Public Administration (82 | 30.4%), Administrative & Support (23 | 8.5%), Retail Trade (8 | 3.0%), and Finance & Insurance (2 | 0.7%).
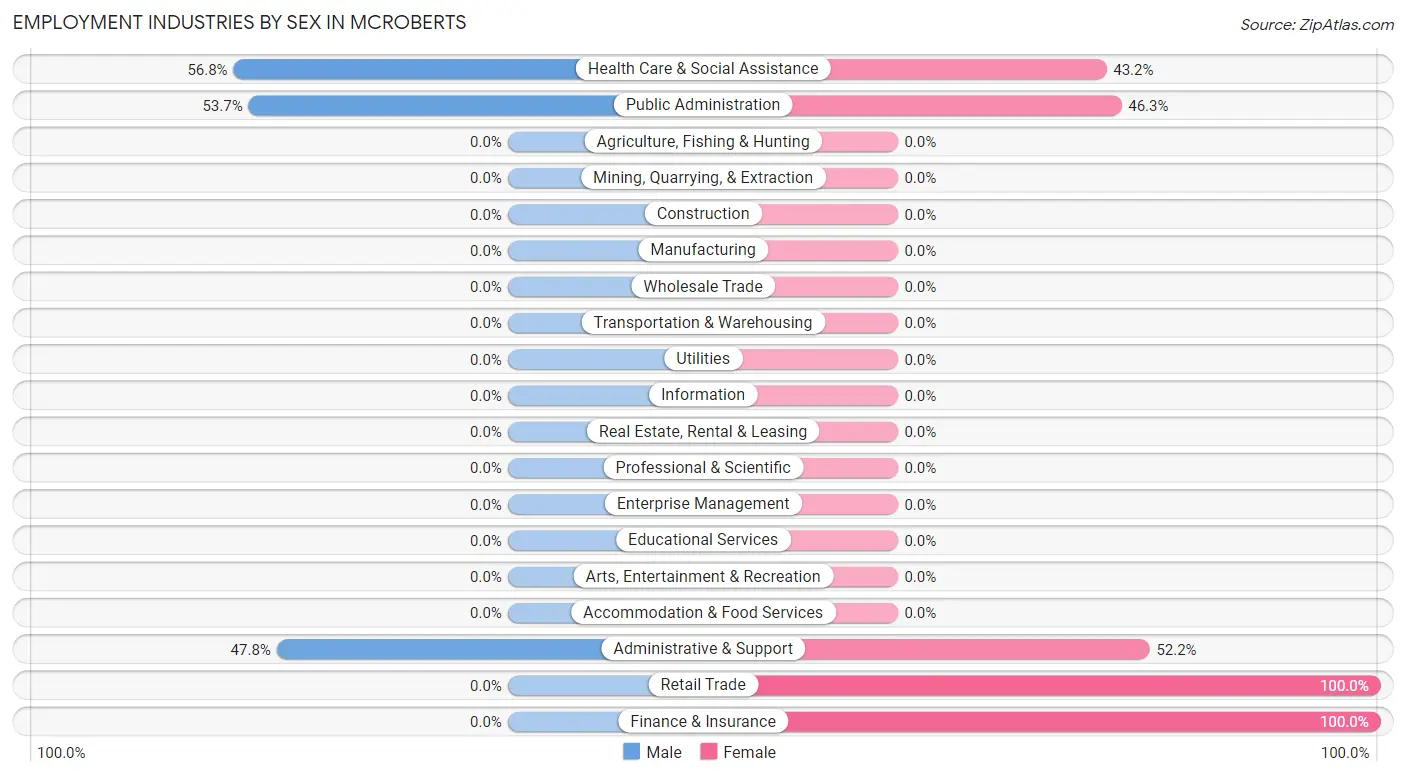
Employment Industries by Sex in McRoberts
The McRoberts industries that see more men than women are Health Care & Social Assistance (56.8%), Public Administration (53.7%), and Administrative & Support (47.8%), whereas the industries that tend to have a higher number of women are Retail Trade (100.0%), Finance & Insurance (100.0%), and Administrative & Support (52.2%).
| Industry | Male | Female |
| Agriculture, Fishing & Hunting | 0 (0.0%) | 0 (0.0%) |
| Mining, Quarrying, & Extraction | 0 (0.0%) | 0 (0.0%) |
| Construction | 0 (0.0%) | 0 (0.0%) |
| Manufacturing | 0 (0.0%) | 0 (0.0%) |
| Wholesale Trade | 0 (0.0%) | 0 (0.0%) |
| Retail Trade | 0 (0.0%) | 8 (100.0%) |
| Transportation & Warehousing | 0 (0.0%) | 0 (0.0%) |
| Utilities | 0 (0.0%) | 0 (0.0%) |
| Information | 0 (0.0%) | 0 (0.0%) |
| Finance & Insurance | 0 (0.0%) | 2 (100.0%) |
| Real Estate, Rental & Leasing | 0 (0.0%) | 0 (0.0%) |
| Professional & Scientific | 0 (0.0%) | 0 (0.0%) |
| Enterprise Management | 0 (0.0%) | 0 (0.0%) |
| Administrative & Support | 11 (47.8%) | 12 (52.2%) |
| Educational Services | 0 (0.0%) | 0 (0.0%) |
| Health Care & Social Assistance | 88 (56.8%) | 67 (43.2%) |
| Arts, Entertainment & Recreation | 0 (0.0%) | 0 (0.0%) |
| Accommodation & Food Services | 0 (0.0%) | 0 (0.0%) |
| Public Administration | 44 (53.7%) | 38 (46.3%) |
| Total | 143 (53.0%) | 127 (47.0%) |
Education in McRoberts
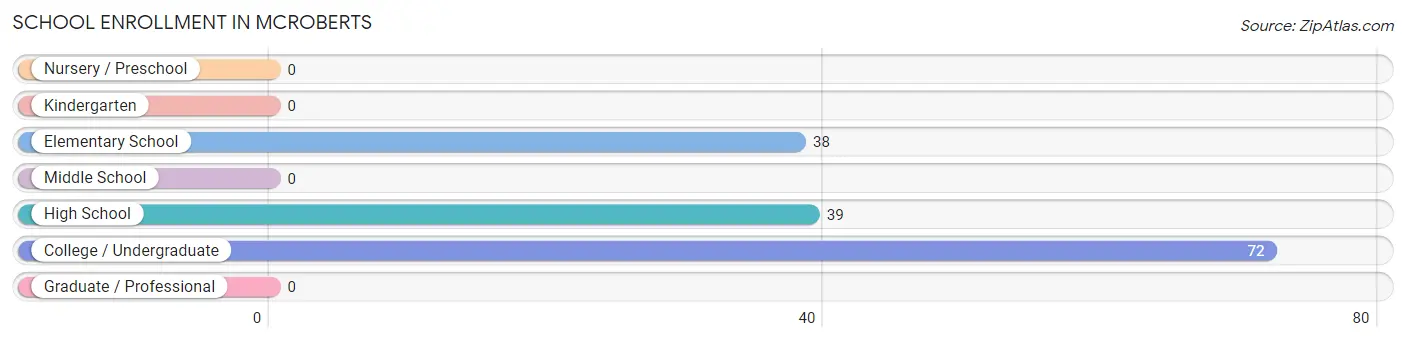
School Enrollment in McRoberts
The most common levels of schooling among the 149 students in McRoberts are college / undergraduate (72 | 48.3%), high school (39 | 26.2%), and elementary school (38 | 25.5%).
| School Level | # Students | % Students |
| Nursery / Preschool | 0 | 0.0% |
| Kindergarten | 0 | 0.0% |
| Elementary School | 38 | 25.5% |
| Middle School | 0 | 0.0% |
| High School | 39 | 26.2% |
| College / Undergraduate | 72 | 48.3% |
| Graduate / Professional | 0 | 0.0% |
| Total | 149 | 100.0% |
School Enrollment by Age by Funding Source in McRoberts
Out of a total of 149 students who are enrolled in schools in McRoberts, 64 (43.0%) attend a private institution, while the remaining 85 (57.0%) are enrolled in public schools. The age group of 20 to 24 year olds has the highest likelihood of being enrolled in private schools, with 64 (100.0% in the age bracket) enrolled. Conversely, the age group of 5 to 9 year old has the lowest likelihood of being enrolled in a private school, with 31 (100.0% in the age bracket) attending a public institution.
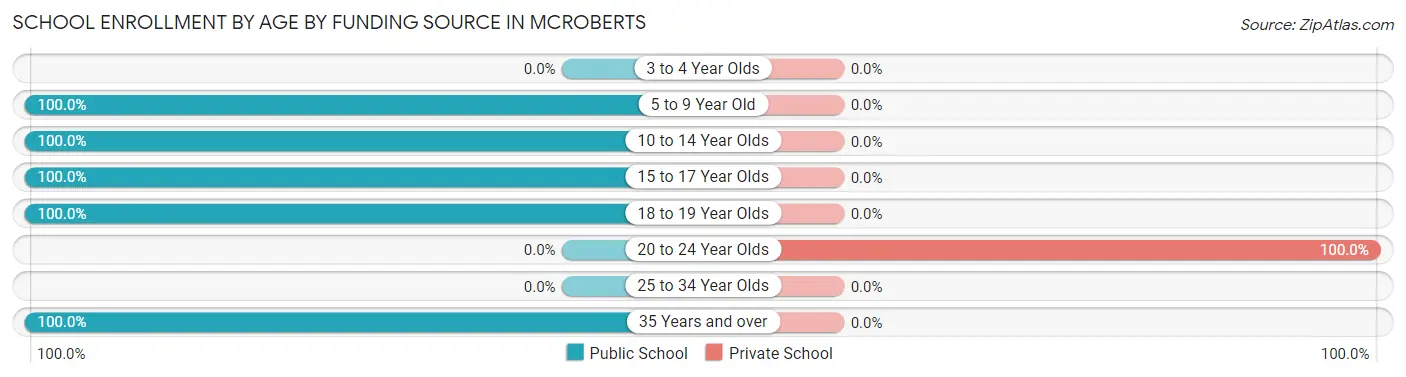
| Age Bracket | Public School | Private School |
| 3 to 4 Year Olds | 0 (0.0%) | 0 (0.0%) |
| 5 to 9 Year Old | 31 (100.0%) | 0 (0.0%) |
| 10 to 14 Year Olds | 7 (100.0%) | 0 (0.0%) |
| 15 to 17 Year Olds | 8 (100.0%) | 0 (0.0%) |
| 18 to 19 Year Olds | 31 (100.0%) | 0 (0.0%) |
| 20 to 24 Year Olds | 0 (0.0%) | 64 (100.0%) |
| 25 to 34 Year Olds | 0 (0.0%) | 0 (0.0%) |
| 35 Years and over | 8 (100.0%) | 0 (0.0%) |
| Total | 85 (57.0%) | 64 (43.0%) |
Educational Attainment by Field of Study in McRoberts
Liberal arts & history (66 | 60.0%), psychology (22 | 20.0%), and social sciences (22 | 20.0%) are the most common fields of study among 110 individuals in McRoberts who have obtained a bachelor's degree or higher.
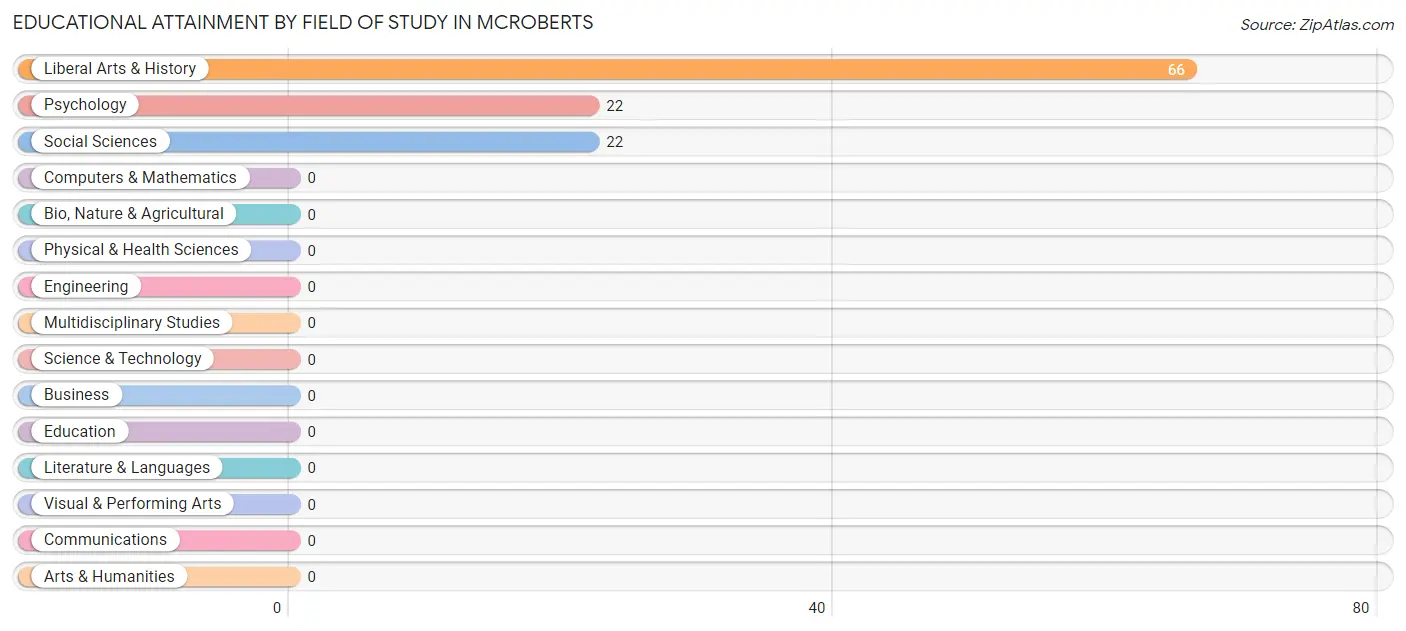
| Field of Study | # Graduates | % Graduates |
| Computers & Mathematics | 0 | 0.0% |
| Bio, Nature & Agricultural | 0 | 0.0% |
| Physical & Health Sciences | 0 | 0.0% |
| Psychology | 22 | 20.0% |
| Social Sciences | 22 | 20.0% |
| Engineering | 0 | 0.0% |
| Multidisciplinary Studies | 0 | 0.0% |
| Science & Technology | 0 | 0.0% |
| Business | 0 | 0.0% |
| Education | 0 | 0.0% |
| Literature & Languages | 0 | 0.0% |
| Liberal Arts & History | 66 | 60.0% |
| Visual & Performing Arts | 0 | 0.0% |
| Communications | 0 | 0.0% |
| Arts & Humanities | 0 | 0.0% |
| Total | 110 | 100.0% |
Transportation & Commute in McRoberts
Vehicle Availability by Sex in McRoberts
The most prevalent vehicle ownership categories in McRoberts are males with 2 vehicles (66, accounting for 46.2%) and females with 2 vehicles (81, making up 52.0%).
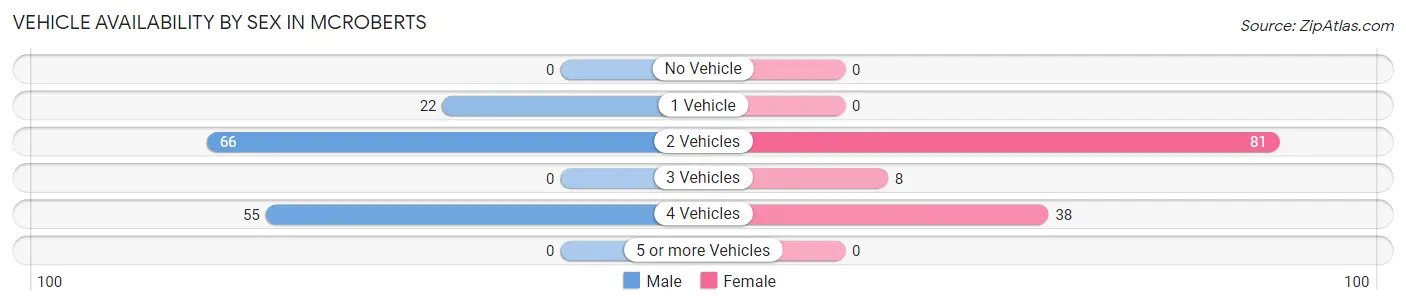
| Vehicles Available | Male | Female |
| No Vehicle | 0 (0.0%) | 0 (0.0%) |
| 1 Vehicle | 22 (15.4%) | 0 (0.0%) |
| 2 Vehicles | 66 (46.2%) | 81 (63.8%) |
| 3 Vehicles | 0 (0.0%) | 8 (6.3%) |
| 4 Vehicles | 55 (38.5%) | 38 (29.9%) |
| 5 or more Vehicles | 0 (0.0%) | 0 (0.0%) |
| Total | 143 (100.0%) | 127 (100.0%) |
Commute Time in McRoberts
The most frequently occuring commute durations in McRoberts are 25 to 29 minutes (69 commuters, 26.6%), 45 to 59 minutes (66 commuters, 25.5%), and 30 to 34 minutes (60 commuters, 23.2%).
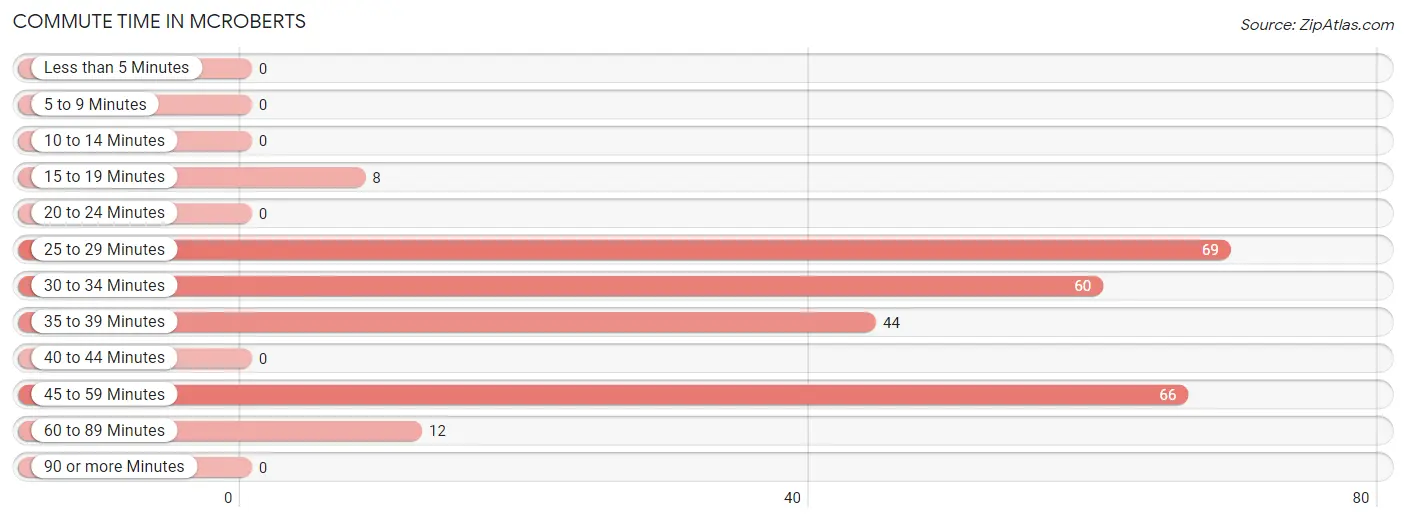
| Commute Time | # Commuters | % Commuters |
| Less than 5 Minutes | 0 | 0.0% |
| 5 to 9 Minutes | 0 | 0.0% |
| 10 to 14 Minutes | 0 | 0.0% |
| 15 to 19 Minutes | 8 | 3.1% |
| 20 to 24 Minutes | 0 | 0.0% |
| 25 to 29 Minutes | 69 | 26.6% |
| 30 to 34 Minutes | 60 | 23.2% |
| 35 to 39 Minutes | 44 | 17.0% |
| 40 to 44 Minutes | 0 | 0.0% |
| 45 to 59 Minutes | 66 | 25.5% |
| 60 to 89 Minutes | 12 | 4.6% |
| 90 or more Minutes | 0 | 0.0% |
Commute Time by Sex in McRoberts
The most common commute times in McRoberts are 45 to 59 minutes (66 commuters, 50.0%) for males and 25 to 29 minutes (69 commuters, 54.3%) for females.
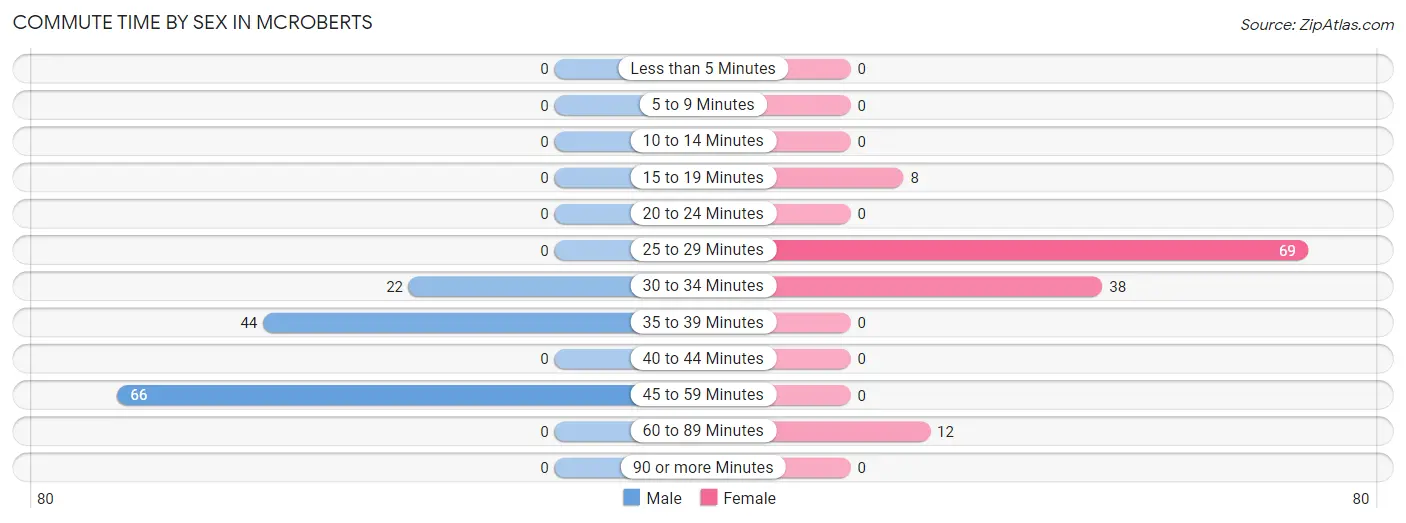
| Commute Time | Male | Female |
| Less than 5 Minutes | 0 (0.0%) | 0 (0.0%) |
| 5 to 9 Minutes | 0 (0.0%) | 0 (0.0%) |
| 10 to 14 Minutes | 0 (0.0%) | 0 (0.0%) |
| 15 to 19 Minutes | 0 (0.0%) | 8 (6.3%) |
| 20 to 24 Minutes | 0 (0.0%) | 0 (0.0%) |
| 25 to 29 Minutes | 0 (0.0%) | 69 (54.3%) |
| 30 to 34 Minutes | 22 (16.7%) | 38 (29.9%) |
| 35 to 39 Minutes | 44 (33.3%) | 0 (0.0%) |
| 40 to 44 Minutes | 0 (0.0%) | 0 (0.0%) |
| 45 to 59 Minutes | 66 (50.0%) | 0 (0.0%) |
| 60 to 89 Minutes | 0 (0.0%) | 12 (9.5%) |
| 90 or more Minutes | 0 (0.0%) | 0 (0.0%) |
Time of Departure to Work by Sex in McRoberts
The most frequent times of departure to work in McRoberts are 4:00 PM to 11:59 PM (66, 50.0%) for males and 4:00 PM to 11:59 PM (67, 52.8%) for females.
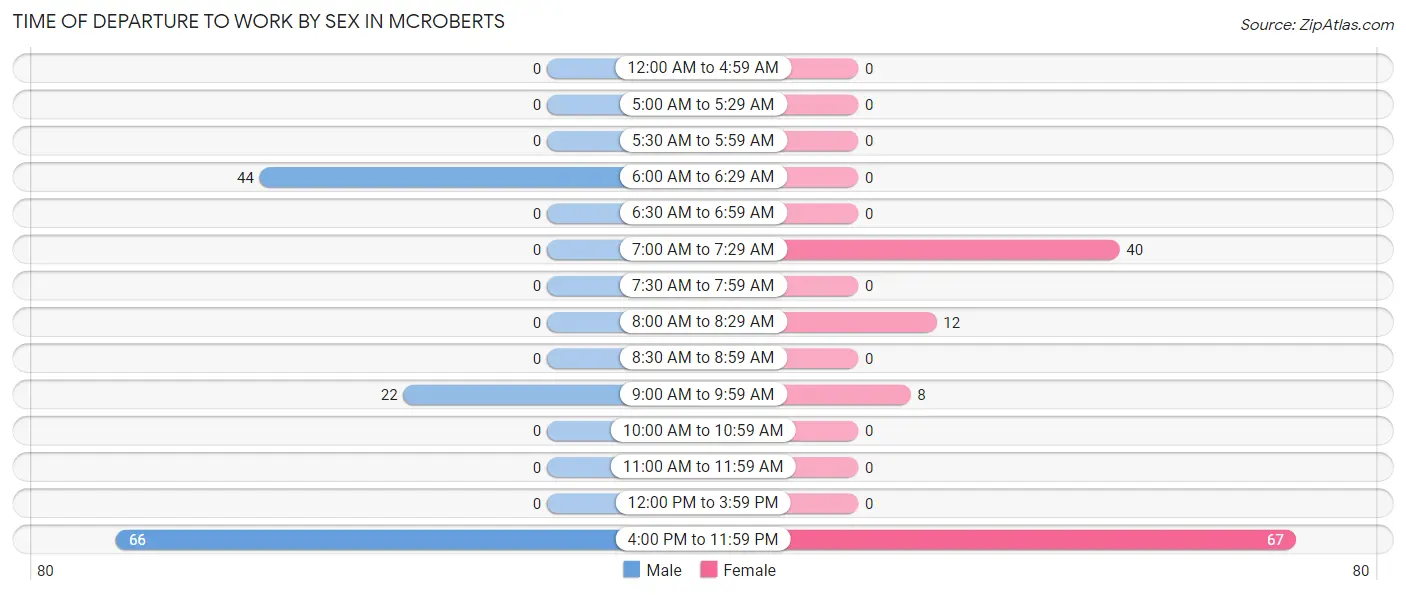
| Time of Departure | Male | Female |
| 12:00 AM to 4:59 AM | 0 (0.0%) | 0 (0.0%) |
| 5:00 AM to 5:29 AM | 0 (0.0%) | 0 (0.0%) |
| 5:30 AM to 5:59 AM | 0 (0.0%) | 0 (0.0%) |
| 6:00 AM to 6:29 AM | 44 (33.3%) | 0 (0.0%) |
| 6:30 AM to 6:59 AM | 0 (0.0%) | 0 (0.0%) |
| 7:00 AM to 7:29 AM | 0 (0.0%) | 40 (31.5%) |
| 7:30 AM to 7:59 AM | 0 (0.0%) | 0 (0.0%) |
| 8:00 AM to 8:29 AM | 0 (0.0%) | 12 (9.5%) |
| 8:30 AM to 8:59 AM | 0 (0.0%) | 0 (0.0%) |
| 9:00 AM to 9:59 AM | 22 (16.7%) | 8 (6.3%) |
| 10:00 AM to 10:59 AM | 0 (0.0%) | 0 (0.0%) |
| 11:00 AM to 11:59 AM | 0 (0.0%) | 0 (0.0%) |
| 12:00 PM to 3:59 PM | 0 (0.0%) | 0 (0.0%) |
| 4:00 PM to 11:59 PM | 66 (50.0%) | 67 (52.8%) |
| Total | 132 (100.0%) | 127 (100.0%) |
Housing Occupancy in McRoberts
Occupancy by Ownership in McRoberts
Of the total 260 dwellings in McRoberts, owner-occupied units account for 210 (80.8%), while renter-occupied units make up 50 (19.2%).
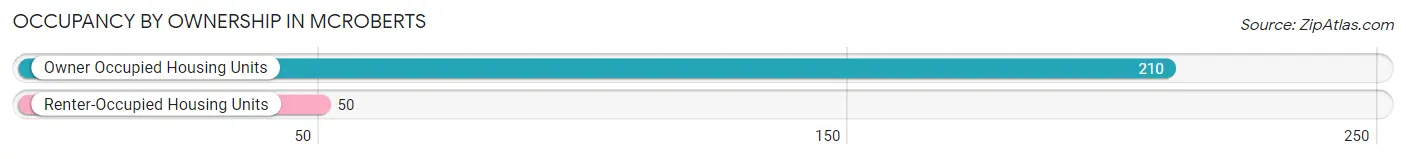
| Occupancy | # Housing Units | % Housing Units |
| Owner Occupied Housing Units | 210 | 80.8% |
| Renter-Occupied Housing Units | 50 | 19.2% |
| Total Occupied Housing Units | 260 | 100.0% |
Occupancy by Household Size in McRoberts
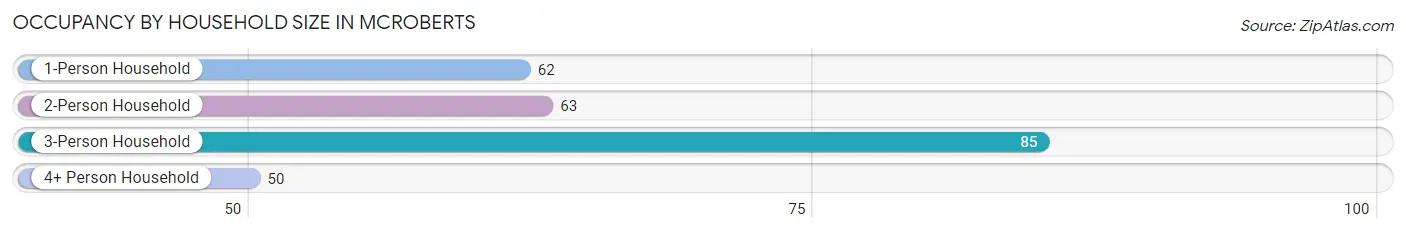
| Household Size | # Housing Units | % Housing Units |
| 1-Person Household | 62 | 23.8% |
| 2-Person Household | 63 | 24.2% |
| 3-Person Household | 85 | 32.7% |
| 4+ Person Household | 50 | 19.2% |
| Total Housing Units | 260 | 100.0% |
Occupancy by Ownership by Household Size in McRoberts
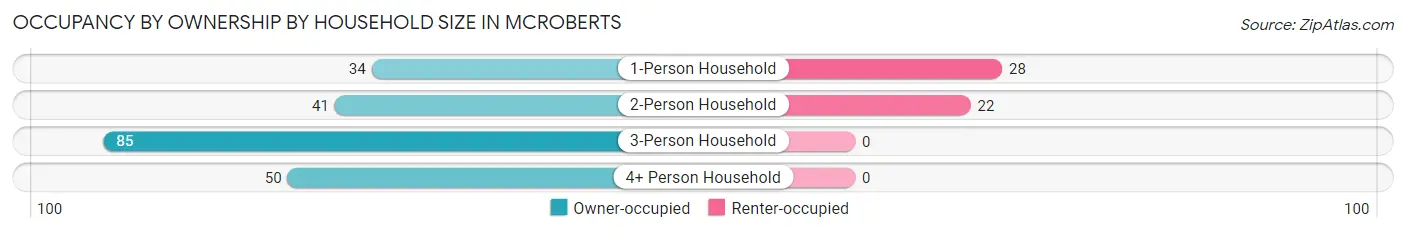
| Household Size | Owner-occupied | Renter-occupied |
| 1-Person Household | 34 (54.8%) | 28 (45.2%) |
| 2-Person Household | 41 (65.1%) | 22 (34.9%) |
| 3-Person Household | 85 (100.0%) | 0 (0.0%) |
| 4+ Person Household | 50 (100.0%) | 0 (0.0%) |
| Total Housing Units | 210 (80.8%) | 50 (19.2%) |
Occupancy by Educational Attainment in McRoberts
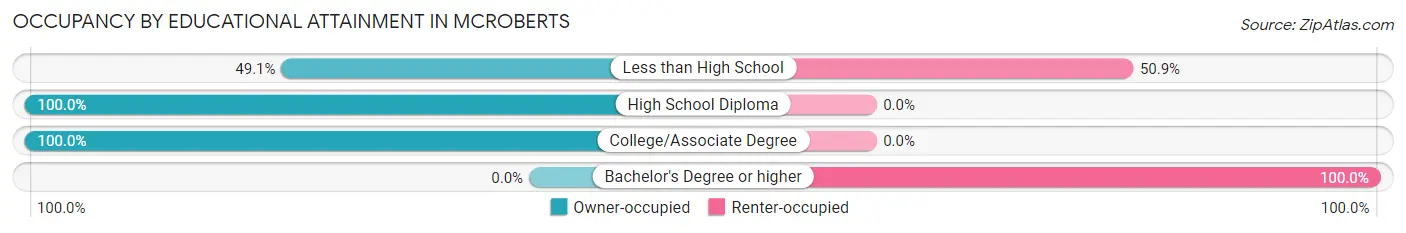
| Household Size | Owner-occupied | Renter-occupied |
| Less than High School | 27 (49.1%) | 28 (50.9%) |
| High School Diploma | 91 (100.0%) | 0 (0.0%) |
| College/Associate Degree | 92 (100.0%) | 0 (0.0%) |
| Bachelor's Degree or higher | 0 (0.0%) | 22 (100.0%) |
Occupancy by Age of Householder in McRoberts
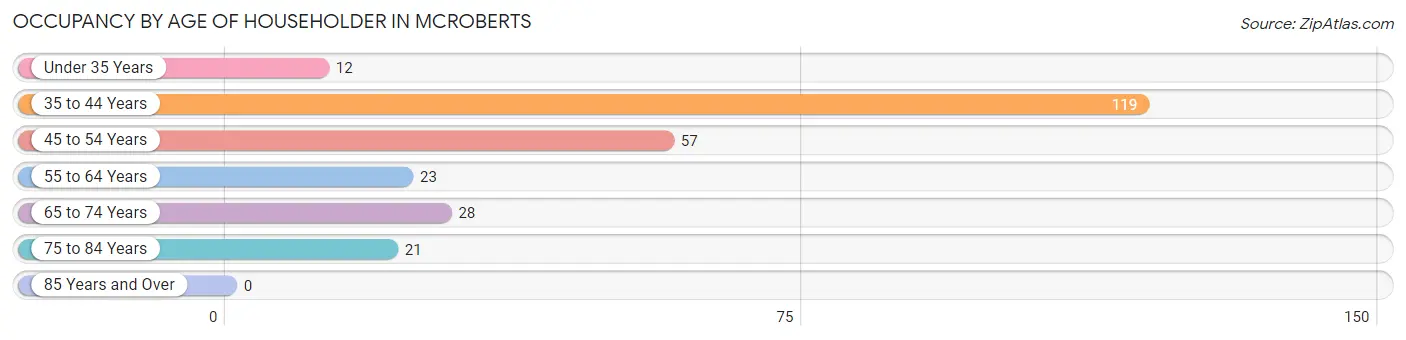
| Age Bracket | # Households | % Households |
| Under 35 Years | 12 | 4.6% |
| 35 to 44 Years | 119 | 45.8% |
| 45 to 54 Years | 57 | 21.9% |
| 55 to 64 Years | 23 | 8.8% |
| 65 to 74 Years | 28 | 10.8% |
| 75 to 84 Years | 21 | 8.1% |
| 85 Years and Over | 0 | 0.0% |
| Total | 260 | 100.0% |
Housing Finances in McRoberts
Median Income by Occupancy in McRoberts
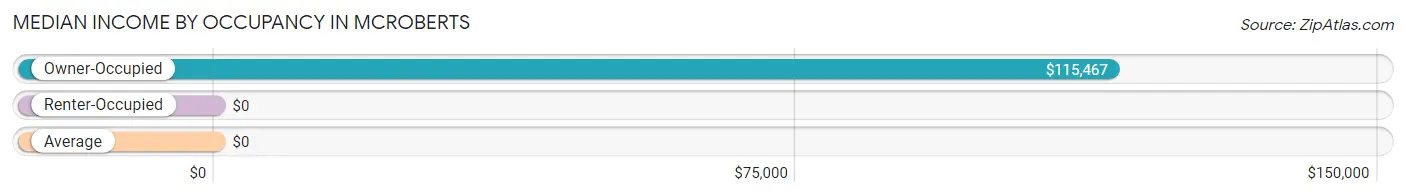
| Occupancy Type | # Households | Median Income |
| Owner-Occupied | 210 (80.8%) | $115,467 |
| Renter-Occupied | 50 (19.2%) | $0 |
| Average | 260 (100.0%) | $0 |
Occupancy by Householder Income Bracket in McRoberts
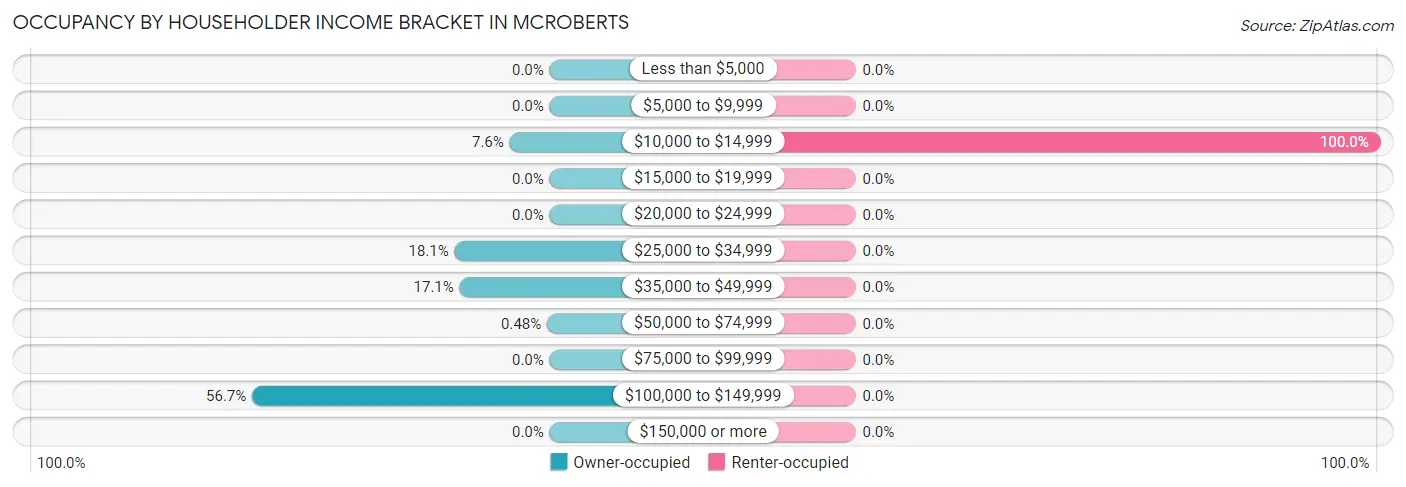
| Income Bracket | Owner-occupied | Renter-occupied |
| Less than $5,000 | 0 (0.0%) | 0 (0.0%) |
| $5,000 to $9,999 | 0 (0.0%) | 0 (0.0%) |
| $10,000 to $14,999 | 16 (7.6%) | 50 (100.0%) |
| $15,000 to $19,999 | 0 (0.0%) | 0 (0.0%) |
| $20,000 to $24,999 | 0 (0.0%) | 0 (0.0%) |
| $25,000 to $34,999 | 38 (18.1%) | 0 (0.0%) |
| $35,000 to $49,999 | 36 (17.1%) | 0 (0.0%) |
| $50,000 to $74,999 | 1 (0.5%) | 0 (0.0%) |
| $75,000 to $99,999 | 0 (0.0%) | 0 (0.0%) |
| $100,000 to $149,999 | 119 (56.7%) | 0 (0.0%) |
| $150,000 or more | 0 (0.0%) | 0 (0.0%) |
| Total | 210 (100.0%) | 50 (100.0%) |
Monthly Housing Cost Tiers in McRoberts
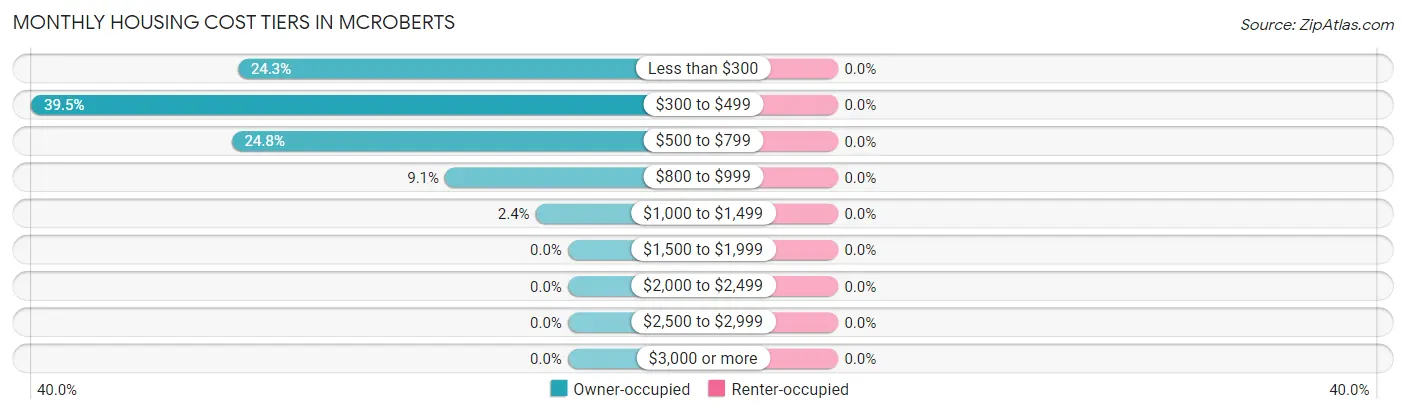
| Monthly Cost | Owner-occupied | Renter-occupied |
| Less than $300 | 51 (24.3%) | 0 (0.0%) |
| $300 to $499 | 83 (39.5%) | 0 (0.0%) |
| $500 to $799 | 52 (24.8%) | 0 (0.0%) |
| $800 to $999 | 19 (9.0%) | 0 (0.0%) |
| $1,000 to $1,499 | 5 (2.4%) | 0 (0.0%) |
| $1,500 to $1,999 | 0 (0.0%) | 0 (0.0%) |
| $2,000 to $2,499 | 0 (0.0%) | 0 (0.0%) |
| $2,500 to $2,999 | 0 (0.0%) | 0 (0.0%) |
| $3,000 or more | 0 (0.0%) | 0 (0.0%) |
| Total | 210 (100.0%) | 50 (100.0%) |
Physical Housing Characteristics in McRoberts
Housing Structures in McRoberts
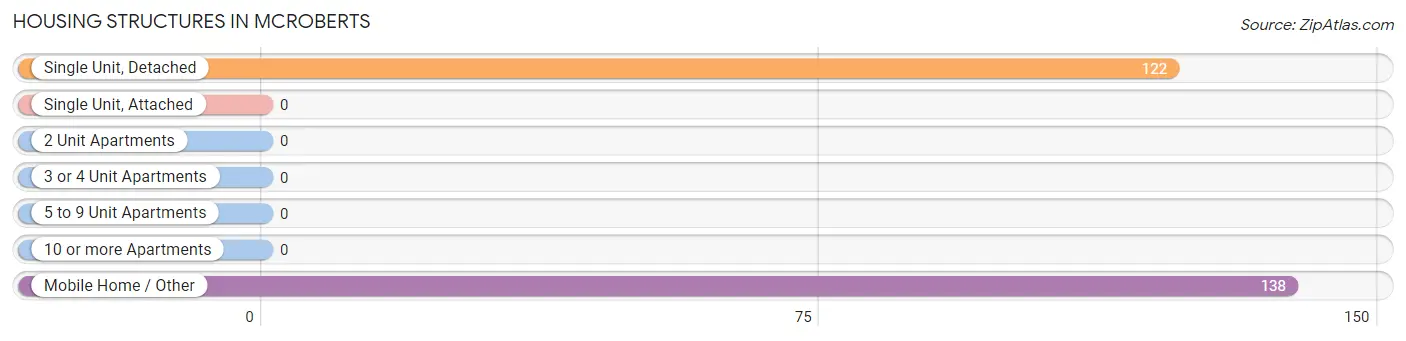
| Structure Type | # Housing Units | % Housing Units |
| Single Unit, Detached | 122 | 46.9% |
| Single Unit, Attached | 0 | 0.0% |
| 2 Unit Apartments | 0 | 0.0% |
| 3 or 4 Unit Apartments | 0 | 0.0% |
| 5 to 9 Unit Apartments | 0 | 0.0% |
| 10 or more Apartments | 0 | 0.0% |
| Mobile Home / Other | 138 | 53.1% |
| Total | 260 | 100.0% |
Housing Structures by Occupancy in McRoberts
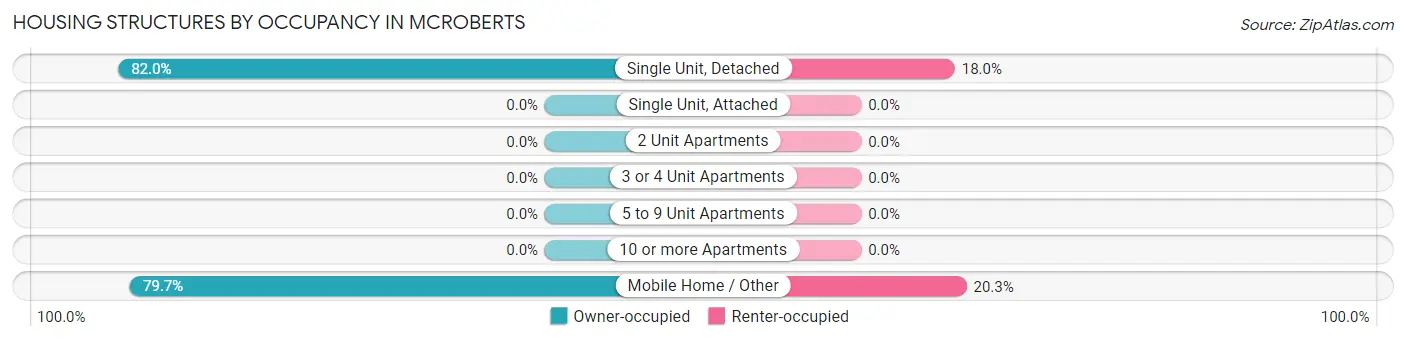
| Structure Type | Owner-occupied | Renter-occupied |
| Single Unit, Detached | 100 (82.0%) | 22 (18.0%) |
| Single Unit, Attached | 0 (0.0%) | 0 (0.0%) |
| 2 Unit Apartments | 0 (0.0%) | 0 (0.0%) |
| 3 or 4 Unit Apartments | 0 (0.0%) | 0 (0.0%) |
| 5 to 9 Unit Apartments | 0 (0.0%) | 0 (0.0%) |
| 10 or more Apartments | 0 (0.0%) | 0 (0.0%) |
| Mobile Home / Other | 110 (79.7%) | 28 (20.3%) |
| Total | 210 (80.8%) | 50 (19.2%) |
Housing Structures by Number of Rooms in McRoberts
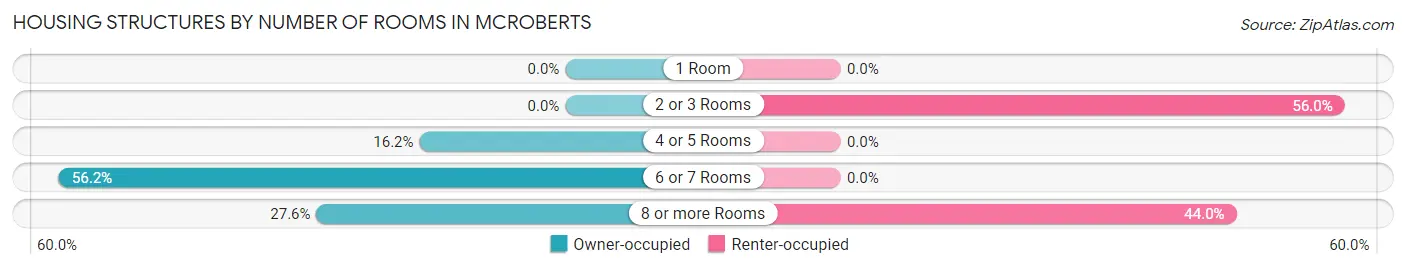
| Number of Rooms | Owner-occupied | Renter-occupied |
| 1 Room | 0 (0.0%) | 0 (0.0%) |
| 2 or 3 Rooms | 0 (0.0%) | 28 (56.0%) |
| 4 or 5 Rooms | 34 (16.2%) | 0 (0.0%) |
| 6 or 7 Rooms | 118 (56.2%) | 0 (0.0%) |
| 8 or more Rooms | 58 (27.6%) | 22 (44.0%) |
| Total | 210 (100.0%) | 50 (100.0%) |
Housing Structure by Heating Type in McRoberts
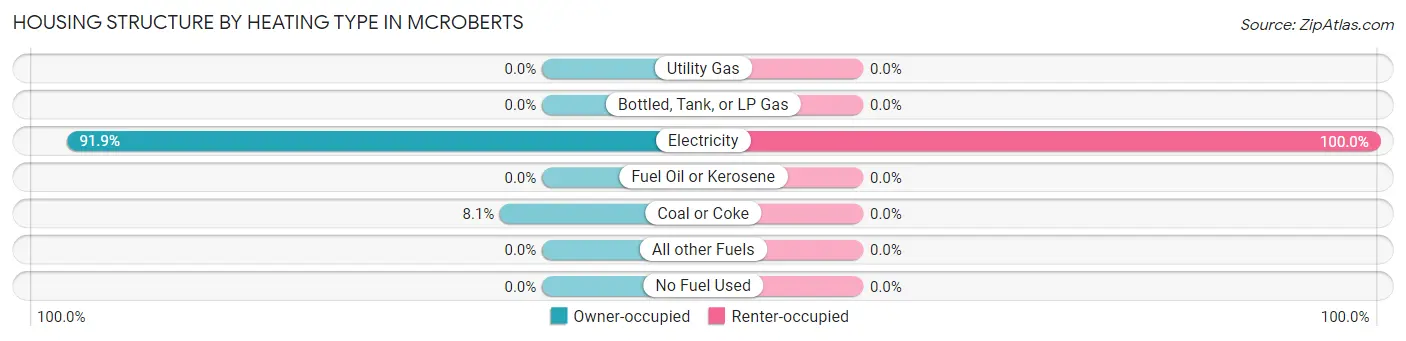
| Heating Type | Owner-occupied | Renter-occupied |
| Utility Gas | 0 (0.0%) | 0 (0.0%) |
| Bottled, Tank, or LP Gas | 0 (0.0%) | 0 (0.0%) |
| Electricity | 193 (91.9%) | 50 (100.0%) |
| Fuel Oil or Kerosene | 0 (0.0%) | 0 (0.0%) |
| Coal or Coke | 17 (8.1%) | 0 (0.0%) |
| All other Fuels | 0 (0.0%) | 0 (0.0%) |
| No Fuel Used | 0 (0.0%) | 0 (0.0%) |
| Total | 210 (100.0%) | 50 (100.0%) |
Household Vehicle Usage in McRoberts
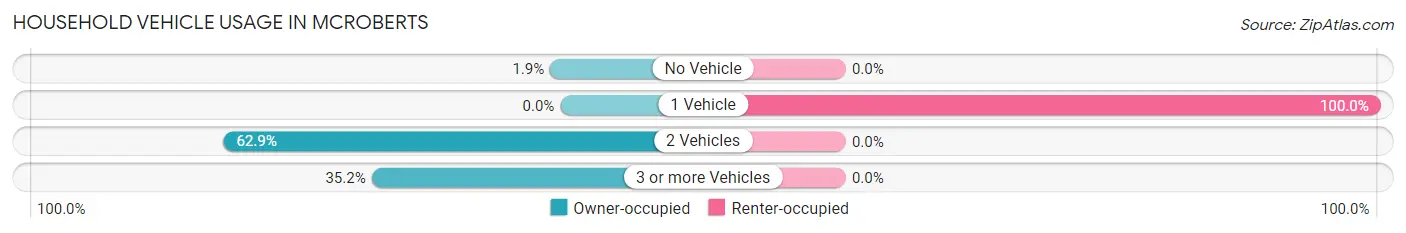
| Vehicles per Household | Owner-occupied | Renter-occupied |
| No Vehicle | 4 (1.9%) | 0 (0.0%) |
| 1 Vehicle | 0 (0.0%) | 50 (100.0%) |
| 2 Vehicles | 132 (62.9%) | 0 (0.0%) |
| 3 or more Vehicles | 74 (35.2%) | 0 (0.0%) |
| Total | 210 (100.0%) | 50 (100.0%) |
Real Estate & Mortgages in McRoberts
Real Estate and Mortgage Overview in McRoberts
| Characteristic | Without Mortgage | With Mortgage |
| Housing Units | 178 | 32 |
| Median Property Value | $55,000 | $76,700 |
| Median Household Income | $115,821 | $0 |
| Monthly Housing Costs | $323 | $0 |
| Real Estate Taxes | $308 | $1 |
Property Value by Mortgage Status in McRoberts
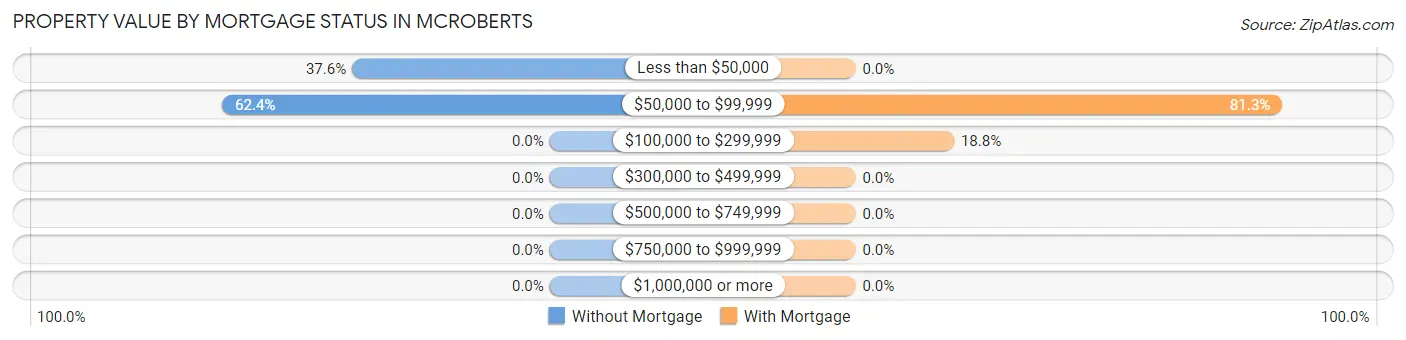
| Property Value | Without Mortgage | With Mortgage |
| Less than $50,000 | 67 (37.6%) | 0 (0.0%) |
| $50,000 to $99,999 | 111 (62.4%) | 26 (81.2%) |
| $100,000 to $299,999 | 0 (0.0%) | 6 (18.8%) |
| $300,000 to $499,999 | 0 (0.0%) | 0 (0.0%) |
| $500,000 to $749,999 | 0 (0.0%) | 0 (0.0%) |
| $750,000 to $999,999 | 0 (0.0%) | 0 (0.0%) |
| $1,000,000 or more | 0 (0.0%) | 0 (0.0%) |
| Total | 178 (100.0%) | 32 (100.0%) |
Household Income by Mortgage Status in McRoberts
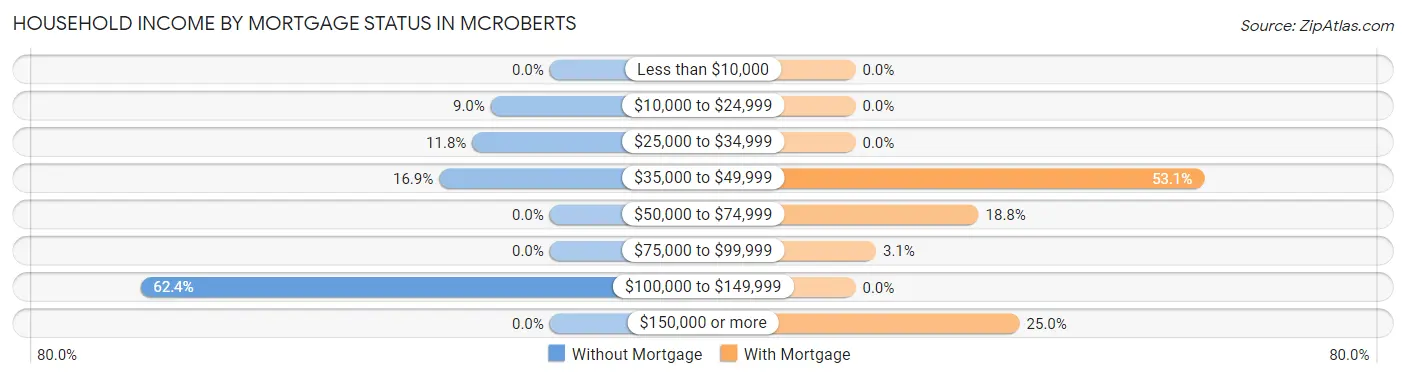
| Household Income | Without Mortgage | With Mortgage |
| Less than $10,000 | 0 (0.0%) | 0 (0.0%) |
| $10,000 to $24,999 | 16 (9.0%) | 0 (0.0%) |
| $25,000 to $34,999 | 21 (11.8%) | 0 (0.0%) |
| $35,000 to $49,999 | 30 (16.9%) | 17 (53.1%) |
| $50,000 to $74,999 | 0 (0.0%) | 6 (18.8%) |
| $75,000 to $99,999 | 0 (0.0%) | 1 (3.1%) |
| $100,000 to $149,999 | 111 (62.4%) | 0 (0.0%) |
| $150,000 or more | 0 (0.0%) | 8 (25.0%) |
| Total | 178 (100.0%) | 32 (100.0%) |
Property Value to Household Income Ratio in McRoberts
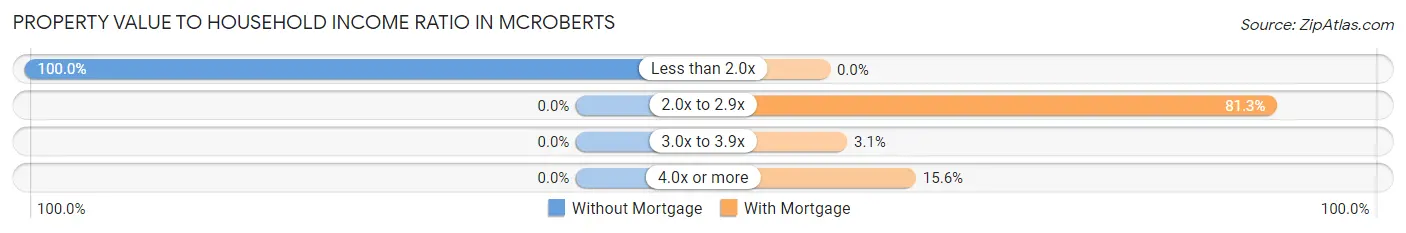
| Value-to-Income Ratio | Without Mortgage | With Mortgage |
| Less than 2.0x | 178 (100.0%) | 0 (0.0%) |
| 2.0x to 2.9x | 0 (0.0%) | 26 (81.2%) |
| 3.0x to 3.9x | 0 (0.0%) | 1 (3.1%) |
| 4.0x or more | 0 (0.0%) | 5 (15.6%) |
| Total | 178 (100.0%) | 32 (100.0%) |
Real Estate Taxes by Mortgage Status in McRoberts
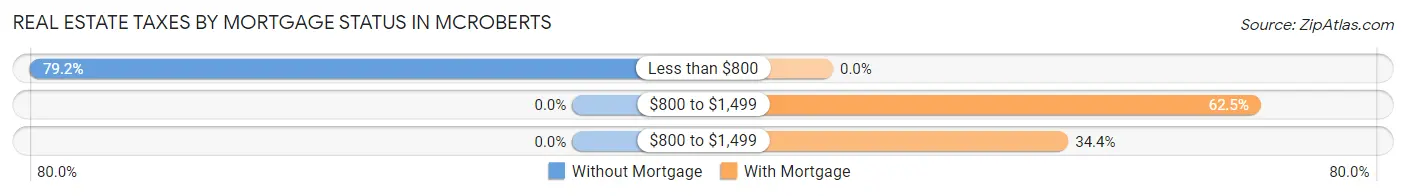
| Property Taxes | Without Mortgage | With Mortgage |
| Less than $800 | 141 (79.2%) | 0 (0.0%) |
| $800 to $1,499 | 0 (0.0%) | 20 (62.5%) |
| $800 to $1,499 | 0 (0.0%) | 11 (34.4%) |
| Total | 178 (100.0%) | 32 (100.0%) |
Health & Disability in McRoberts
Health Insurance Coverage by Age in McRoberts
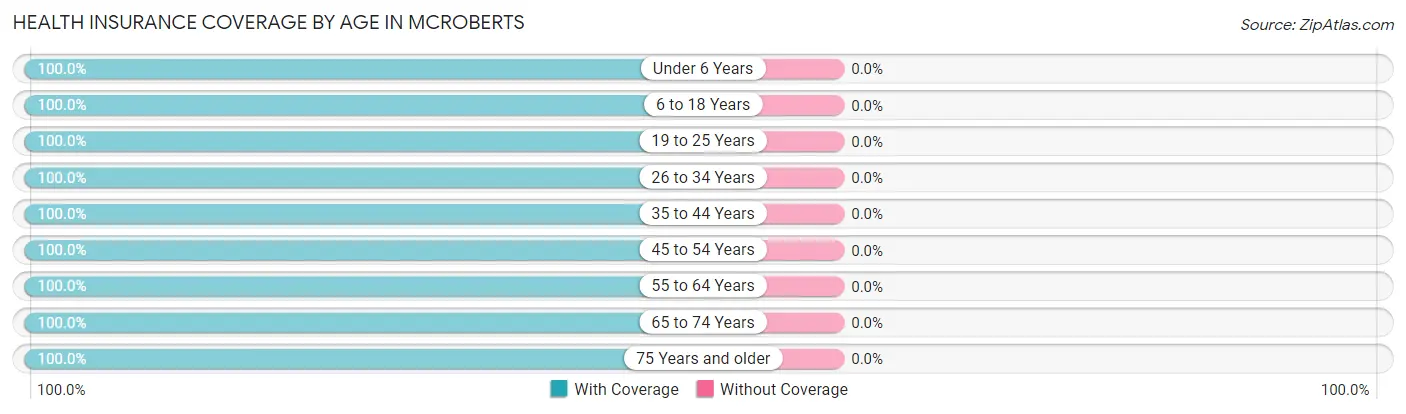
| Age Bracket | With Coverage | Without Coverage |
| Under 6 Years | 127 (100.0%) | 0 (0.0%) |
| 6 to 18 Years | 77 (100.0%) | 0 (0.0%) |
| 19 to 25 Years | 69 (100.0%) | 0 (0.0%) |
| 26 to 34 Years | 12 (100.0%) | 0 (0.0%) |
| 35 to 44 Years | 197 (100.0%) | 0 (0.0%) |
| 45 to 54 Years | 123 (100.0%) | 0 (0.0%) |
| 55 to 64 Years | 37 (100.0%) | 0 (0.0%) |
| 65 to 74 Years | 49 (100.0%) | 0 (0.0%) |
| 75 Years and older | 35 (100.0%) | 0 (0.0%) |
| Total | 726 (100.0%) | 0 (0.0%) |
Health Insurance Coverage by Citizenship Status in McRoberts
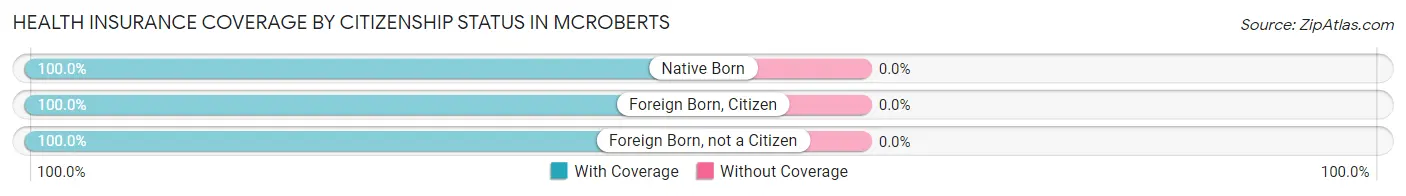
| Citizenship Status | With Coverage | Without Coverage |
| Native Born | 127 (100.0%) | 0 (0.0%) |
| Foreign Born, Citizen | 77 (100.0%) | 0 (0.0%) |
| Foreign Born, not a Citizen | 69 (100.0%) | 0 (0.0%) |
Health Insurance Coverage by Household Income in McRoberts
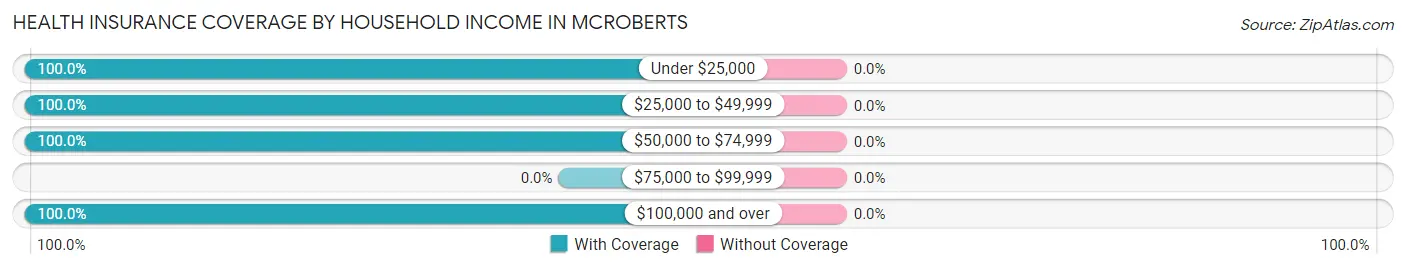
| Household Income | With Coverage | Without Coverage |
| Under $25,000 | 105 (100.0%) | 0 (0.0%) |
| $25,000 to $49,999 | 174 (100.0%) | 0 (0.0%) |
| $50,000 to $74,999 | 8 (100.0%) | 0 (0.0%) |
| $75,000 to $99,999 | 0 (0.0%) | 0 (0.0%) |
| $100,000 and over | 439 (100.0%) | 0 (0.0%) |
Public vs Private Health Insurance Coverage by Age in McRoberts
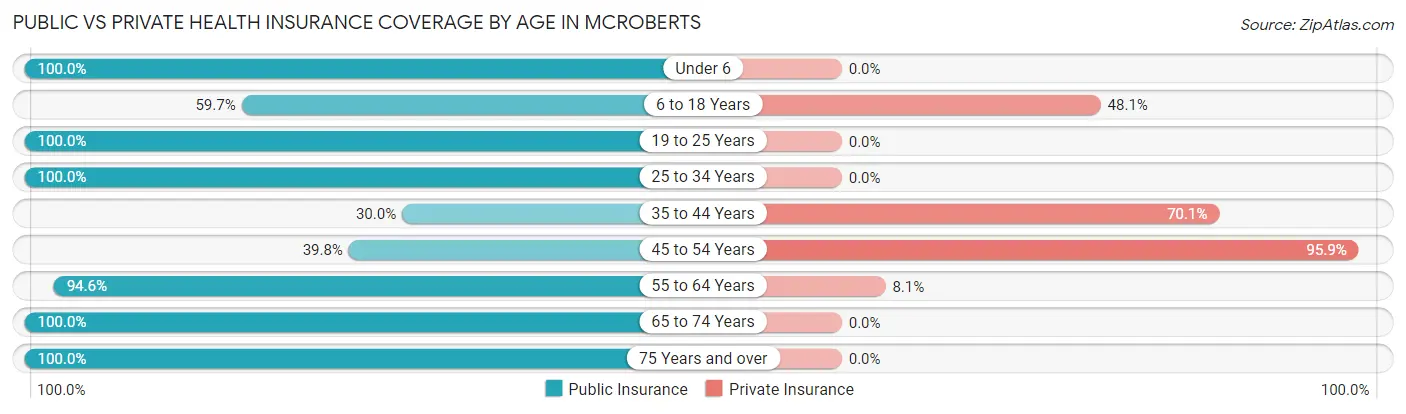
| Age Bracket | Public Insurance | Private Insurance |
| Under 6 | 127 (100.0%) | 0 (0.0%) |
| 6 to 18 Years | 46 (59.7%) | 37 (48.0%) |
| 19 to 25 Years | 69 (100.0%) | 0 (0.0%) |
| 25 to 34 Years | 12 (100.0%) | 0 (0.0%) |
| 35 to 44 Years | 59 (29.9%) | 138 (70.1%) |
| 45 to 54 Years | 49 (39.8%) | 118 (95.9%) |
| 55 to 64 Years | 35 (94.6%) | 3 (8.1%) |
| 65 to 74 Years | 49 (100.0%) | 0 (0.0%) |
| 75 Years and over | 35 (100.0%) | 0 (0.0%) |
| Total | 481 (66.2%) | 296 (40.8%) |
Disability Status by Sex by Age in McRoberts
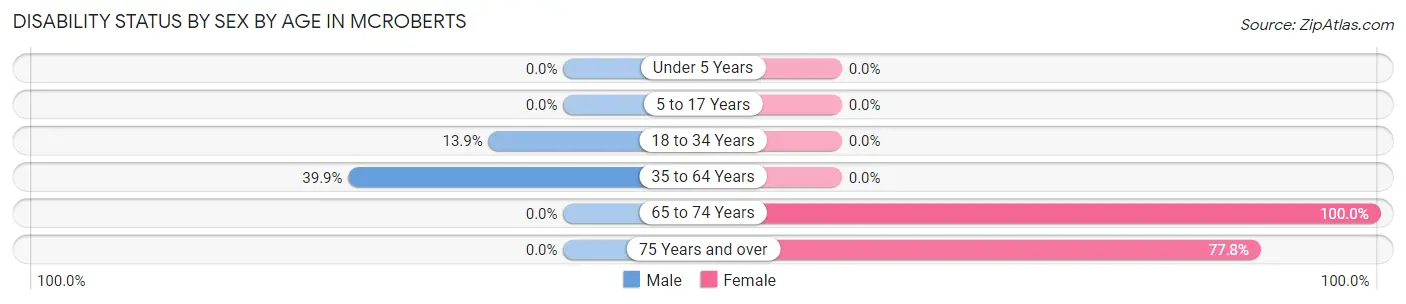
| Age Bracket | Male | Female |
| Under 5 Years | 0 (0.0%) | 0 (0.0%) |
| 5 to 17 Years | 0 (0.0%) | 0 (0.0%) |
| 18 to 34 Years | 5 (13.9%) | 0 (0.0%) |
| 35 to 64 Years | 85 (39.9%) | 0 (0.0%) |
| 65 to 74 Years | 0 (0.0%) | 28 (100.0%) |
| 75 Years and over | 0 (0.0%) | 14 (77.8%) |
Disability Class by Sex by Age in McRoberts
Disability Class: Hearing Difficulty
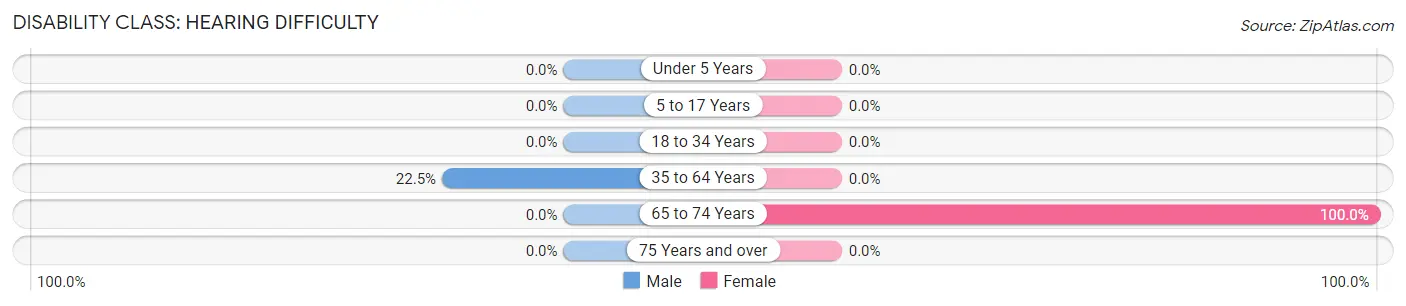
| Age Bracket | Male | Female |
| Under 5 Years | 0 (0.0%) | 0 (0.0%) |
| 5 to 17 Years | 0 (0.0%) | 0 (0.0%) |
| 18 to 34 Years | 0 (0.0%) | 0 (0.0%) |
| 35 to 64 Years | 48 (22.5%) | 0 (0.0%) |
| 65 to 74 Years | 0 (0.0%) | 28 (100.0%) |
| 75 Years and over | 0 (0.0%) | 0 (0.0%) |
Disability Class: Vision Difficulty
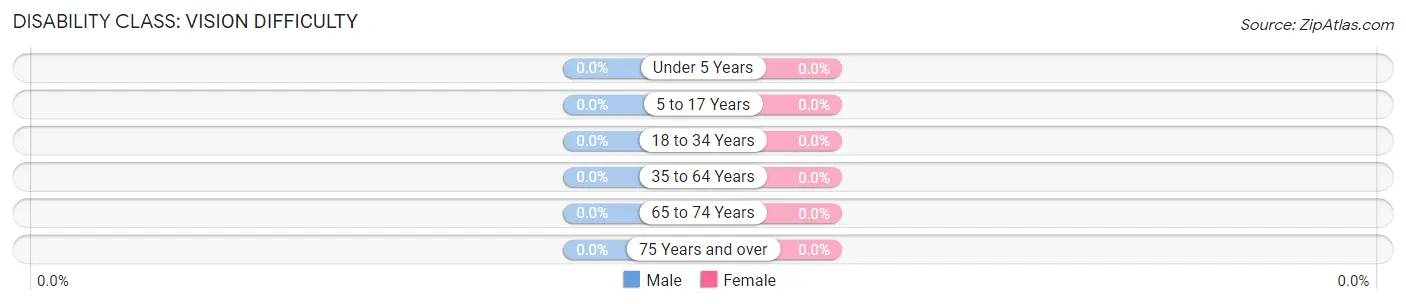
| Age Bracket | Male | Female |
| Under 5 Years | 0 (0.0%) | 0 (0.0%) |
| 5 to 17 Years | 0 (0.0%) | 0 (0.0%) |
| 18 to 34 Years | 0 (0.0%) | 0 (0.0%) |
| 35 to 64 Years | 0 (0.0%) | 0 (0.0%) |
| 65 to 74 Years | 0 (0.0%) | 0 (0.0%) |
| 75 Years and over | 0 (0.0%) | 0 (0.0%) |
Disability Class: Cognitive Difficulty
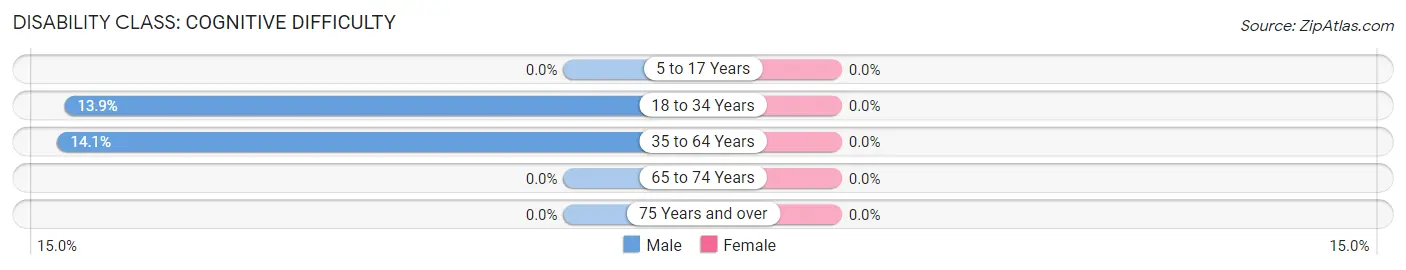
| Age Bracket | Male | Female |
| 5 to 17 Years | 0 (0.0%) | 0 (0.0%) |
| 18 to 34 Years | 5 (13.9%) | 0 (0.0%) |
| 35 to 64 Years | 30 (14.1%) | 0 (0.0%) |
| 65 to 74 Years | 0 (0.0%) | 0 (0.0%) |
| 75 Years and over | 0 (0.0%) | 0 (0.0%) |
Disability Class: Ambulatory Difficulty
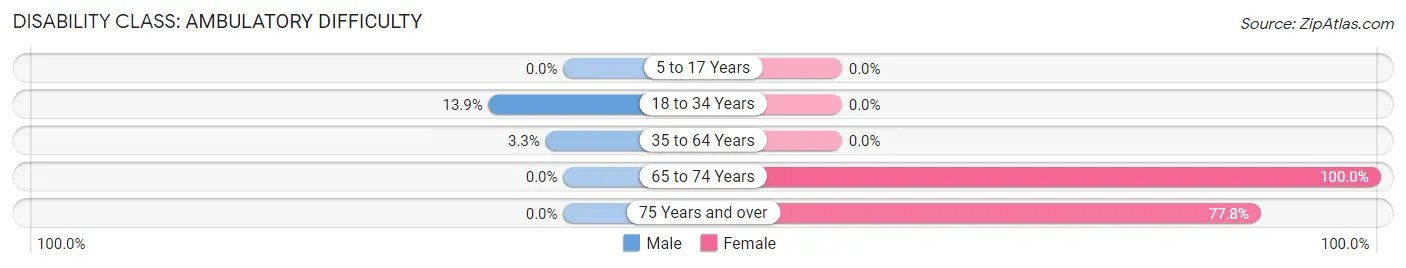
| Age Bracket | Male | Female |
| 5 to 17 Years | 0 (0.0%) | 0 (0.0%) |
| 18 to 34 Years | 5 (13.9%) | 0 (0.0%) |
| 35 to 64 Years | 7 (3.3%) | 0 (0.0%) |
| 65 to 74 Years | 0 (0.0%) | 28 (100.0%) |
| 75 Years and over | 0 (0.0%) | 14 (77.8%) |
Disability Class: Self-Care Difficulty
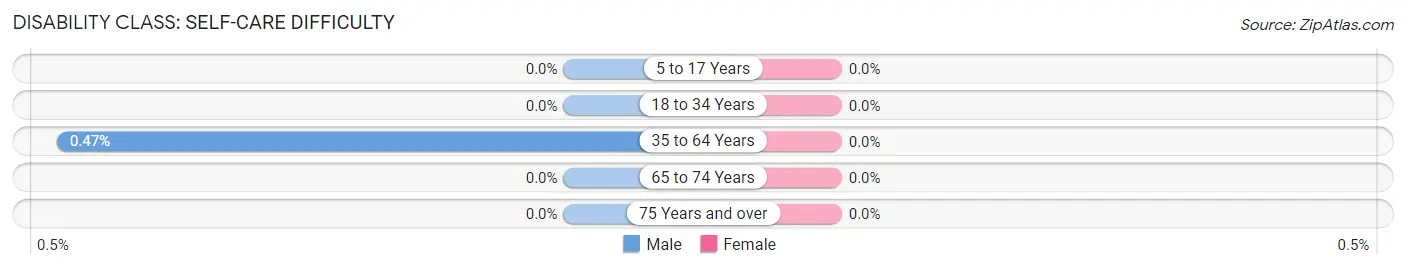
| Age Bracket | Male | Female |
| 5 to 17 Years | 0 (0.0%) | 0 (0.0%) |
| 18 to 34 Years | 0 (0.0%) | 0 (0.0%) |
| 35 to 64 Years | 1 (0.5%) | 0 (0.0%) |
| 65 to 74 Years | 0 (0.0%) | 0 (0.0%) |
| 75 Years and over | 0 (0.0%) | 0 (0.0%) |
Technology Access in McRoberts
Computing Device Access in McRoberts
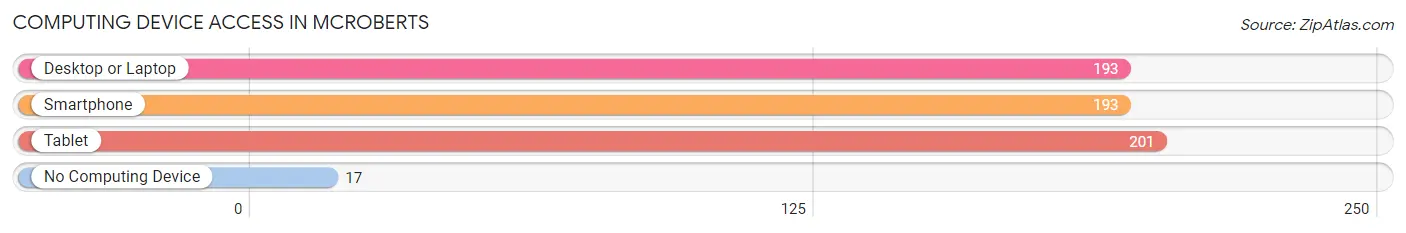
| Device Type | # Households | % Households |
| Desktop or Laptop | 193 | 74.2% |
| Smartphone | 193 | 74.2% |
| Tablet | 201 | 77.3% |
| No Computing Device | 17 | 6.5% |
| Total | 260 | 100.0% |
Internet Access in McRoberts
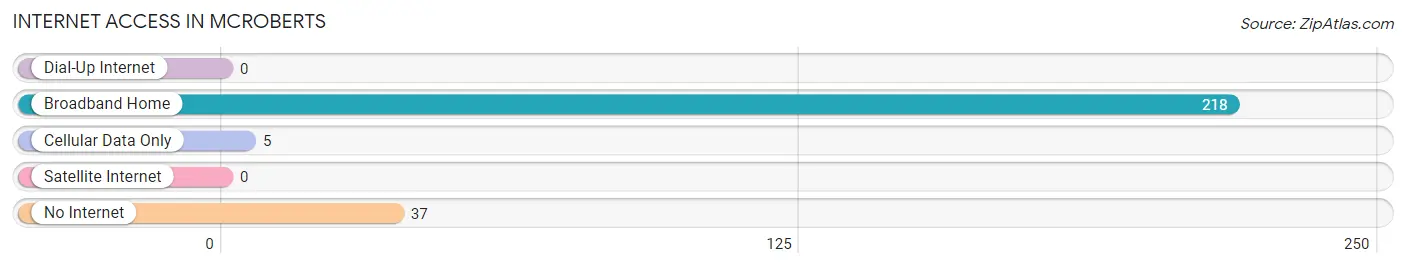
| Internet Type | # Households | % Households |
| Dial-Up Internet | 0 | 0.0% |
| Broadband Home | 218 | 83.9% |
| Cellular Data Only | 5 | 1.9% |
| Satellite Internet | 0 | 0.0% |
| No Internet | 37 | 14.2% |
| Total | 260 | 100.0% |
McRoberts Summary
Mcroberts is a small unincorporated community located in Letcher County, Kentucky. It is situated in the Appalachian Mountains and is part of the Appalachian Regional Commission. The population of Mcroberts was estimated to be around 500 in 2020.
History
Mcroberts was founded in 1891 by a group of settlers from the nearby town of Whitesburg. The town was named after a local doctor, Dr. John McRoberts. The town was originally a coal mining town, and the coal industry was the main source of income for the town. The coal industry declined in the early 20th century, and the town began to decline as well.
In the 1950s, the town was revitalized by the construction of a new highway, US 23, which connected Mcroberts to the larger cities of Hazard and Whitesburg. This allowed the town to become a popular tourist destination, as it was close to the Red River Gorge and other attractions.
Geography
Mcroberts is located in the Appalachian Mountains in Letcher County, Kentucky. The town is situated at an elevation of 1,890 feet above sea level. The town is surrounded by the Red River Gorge, which is a popular tourist destination. The town is also close to the Daniel Boone National Forest, which is a popular destination for outdoor activities such as hiking, camping, and fishing.
Economy
The economy of Mcroberts is largely based on tourism. The town is close to the Red River Gorge and other attractions, which draw tourists from all over the country. The town also has a few small businesses, such as restaurants, gas stations, and convenience stores.
Demographics
The population of Mcroberts was estimated to be around 500 in 2020. The town is predominantly white, with a small minority population. The median household income in Mcroberts is $30,000, which is lower than the national average. The town has a high poverty rate, with nearly 30% of the population living below the poverty line.
Conclusion
Mcroberts is a small unincorporated community located in Letcher County, Kentucky. It is situated in the Appalachian Mountains and is part of the Appalachian Regional Commission. The town was originally a coal mining town, but the industry declined in the early 20th century. The town was revitalized in the 1950s with the construction of a new highway, US 23, which connected Mcroberts to the larger cities of Hazard and Whitesburg. The economy of Mcroberts is largely based on tourism, and the town has a few small businesses. The population of Mcroberts was estimated to be around 500 in 2020, and the town is predominantly white with a small minority population. The median household income in Mcroberts is $30,000, and the town has a high poverty rate.
Common Questions
What is Per Capita Income in McRoberts?
Per Capita income in McRoberts is $25,792.
What is the Median Family Income in McRoberts?
Median Family Income in McRoberts is $115,667.
What is Income or Wage Gap in McRoberts?
Income or Wage Gap in McRoberts is 77.2%.
Women in McRoberts earn 22.8 cents for every dollar earned by a man.
What is Inequality or Gini Index in McRoberts?
Inequality or Gini Index in McRoberts is 0.40.
What is the Total Population of McRoberts?
Total Population of McRoberts is 726.
What is the Total Male Population of McRoberts?
Total Male Population of McRoberts is 414.
What is the Total Female Population of McRoberts?
Total Female Population of McRoberts is 312.
What is the Ratio of Males per 100 Females in McRoberts?
There are 132.69 Males per 100 Females in McRoberts.
What is the Ratio of Females per 100 Males in McRoberts?
There are 75.36 Females per 100 Males in McRoberts.
What is the Median Population Age in McRoberts?
Median Population Age in McRoberts is 41.4 Years.
What is the Average Family Size in McRoberts
Average Family Size in McRoberts is 2.8 People.
What is the Average Household Size in McRoberts
Average Household Size in McRoberts is 2.8 People.
How Large is the Labor Force in McRoberts?
There are 270 People in the Labor Forcein in McRoberts.
What is the Percentage of People in the Labor Force in McRoberts?
48.8% of People are in the Labor Force in McRoberts.