Hunter, KS Map & Demographics
Hunter Map
Hunter Overview
$15,600
PER CAPITA INCOME
$36,563
AVG HOUSEHOLD INCOME
0.40
INEQUALITY / GINI INDEX
108
TOTAL POPULATION
34
MALE POPULATION
74
FEMALE POPULATION
45.95
MALES / 100 FEMALES
217.65
FEMALES / 100 MALES
29.1
MEDIAN AGE
3.8
AVG FAMILY SIZE
3.3
AVG HOUSEHOLD SIZE
21
LABOR FORCE [ PEOPLE ]
28.0%
PERCENT IN LABOR FORCE
Hunter Zip Codes
Hunter Area Codes
Income in Hunter
Income Overview in Hunter
| Characteristic | Number | Measure |
| Per Capita Income | 108 | $15,600 |
| Median Family Income | 25 | $0 |
| Mean Family Income | 25 | $51,832 |
| Median Household Income | 33 | $36,563 |
| Mean Household Income | 33 | $45,679 |
| Income Deficit | 25 | $0 |
| Wage / Income Gap (%) | 108 | 0.00% |
| Wage / Income Gap ($) | 108 | 100.00¢ per $1 |
| Gini / Inequality Index | 108 | 0.40 |
Earnings by Sex in Hunter
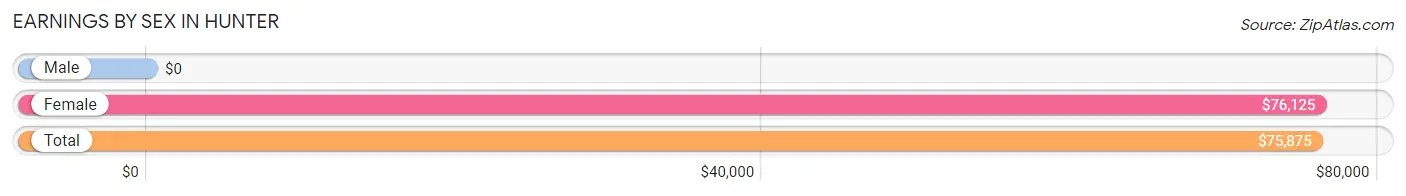
| Sex | Number | Average Earnings |
| Male | 2 (9.5%) | $0 |
| Female | 19 (90.5%) | $76,125 |
| Total | 21 (100.0%) | $75,875 |
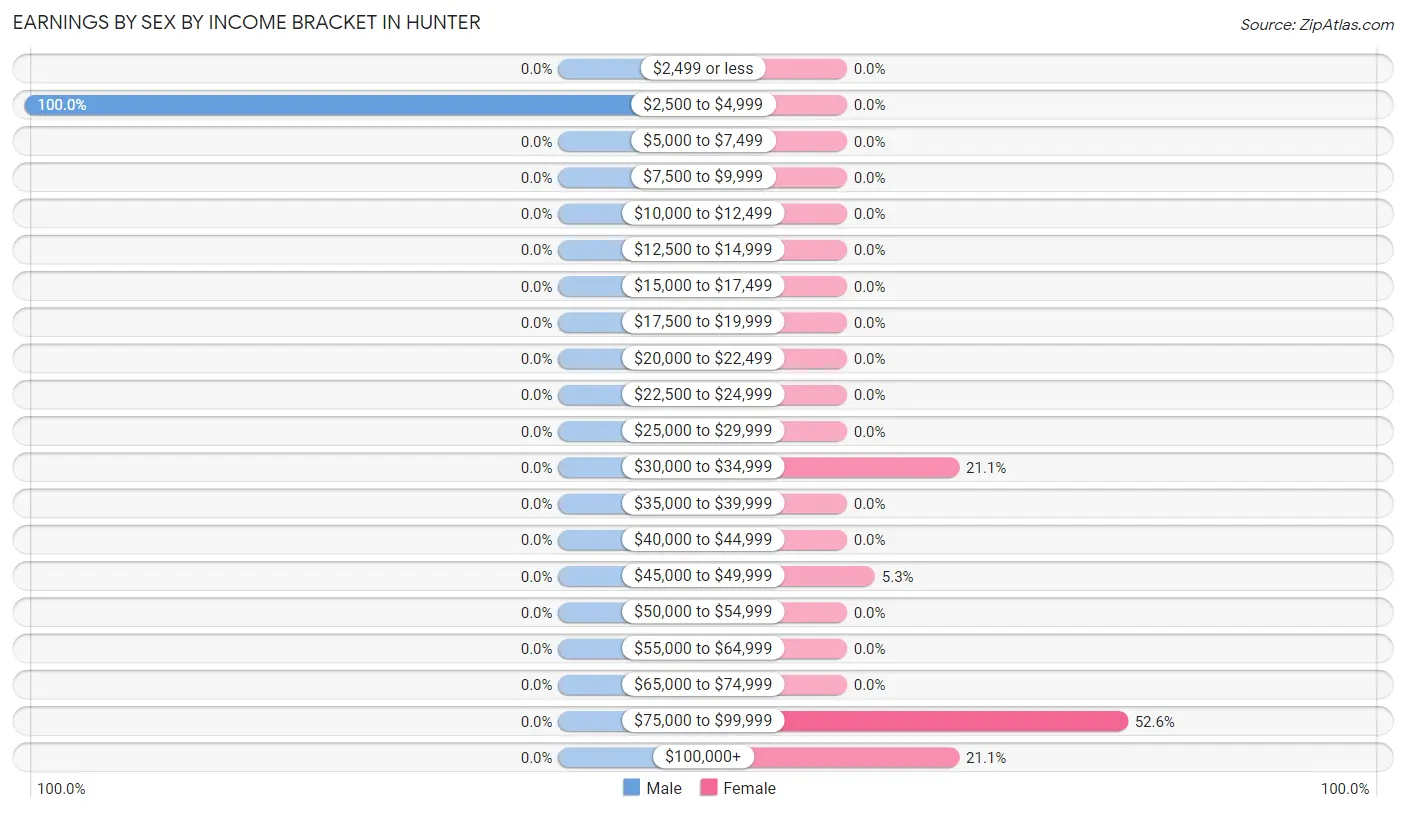
Earnings by Sex by Income Bracket in Hunter
The most common earnings brackets in Hunter are $2,500 to $4,999 for men (2 | 100.0%) and $75,000 to $99,999 for women (10 | 52.6%).
| Income | Male | Female |
| $2,499 or less | 0 (0.0%) | 0 (0.0%) |
| $2,500 to $4,999 | 2 (100.0%) | 0 (0.0%) |
| $5,000 to $7,499 | 0 (0.0%) | 0 (0.0%) |
| $7,500 to $9,999 | 0 (0.0%) | 0 (0.0%) |
| $10,000 to $12,499 | 0 (0.0%) | 0 (0.0%) |
| $12,500 to $14,999 | 0 (0.0%) | 0 (0.0%) |
| $15,000 to $17,499 | 0 (0.0%) | 0 (0.0%) |
| $17,500 to $19,999 | 0 (0.0%) | 0 (0.0%) |
| $20,000 to $22,499 | 0 (0.0%) | 0 (0.0%) |
| $22,500 to $24,999 | 0 (0.0%) | 0 (0.0%) |
| $25,000 to $29,999 | 0 (0.0%) | 0 (0.0%) |
| $30,000 to $34,999 | 0 (0.0%) | 4 (21.0%) |
| $35,000 to $39,999 | 0 (0.0%) | 0 (0.0%) |
| $40,000 to $44,999 | 0 (0.0%) | 0 (0.0%) |
| $45,000 to $49,999 | 0 (0.0%) | 1 (5.3%) |
| $50,000 to $54,999 | 0 (0.0%) | 0 (0.0%) |
| $55,000 to $64,999 | 0 (0.0%) | 0 (0.0%) |
| $65,000 to $74,999 | 0 (0.0%) | 0 (0.0%) |
| $75,000 to $99,999 | 0 (0.0%) | 10 (52.6%) |
| $100,000+ | 0 (0.0%) | 4 (21.0%) |
| Total | 2 (100.0%) | 19 (100.0%) |
Earnings by Sex by Educational Attainment in Hunter
| Educational Attainment | Male Income | Female Income |
| Less than High School | - | - |
| High School Diploma | - | - |
| College or Associate's Degree | - | - |
| Bachelor's Degree | - | - |
| Graduate Degree | - | - |
| Total | - | - |
Family Income in Hunter
Family Income Brackets in Hunter
According to the Hunter family income data, there are 8 families falling into the $75,000 to $99,999 income range, which is the most common income bracket and makes up 32.0% of all families.
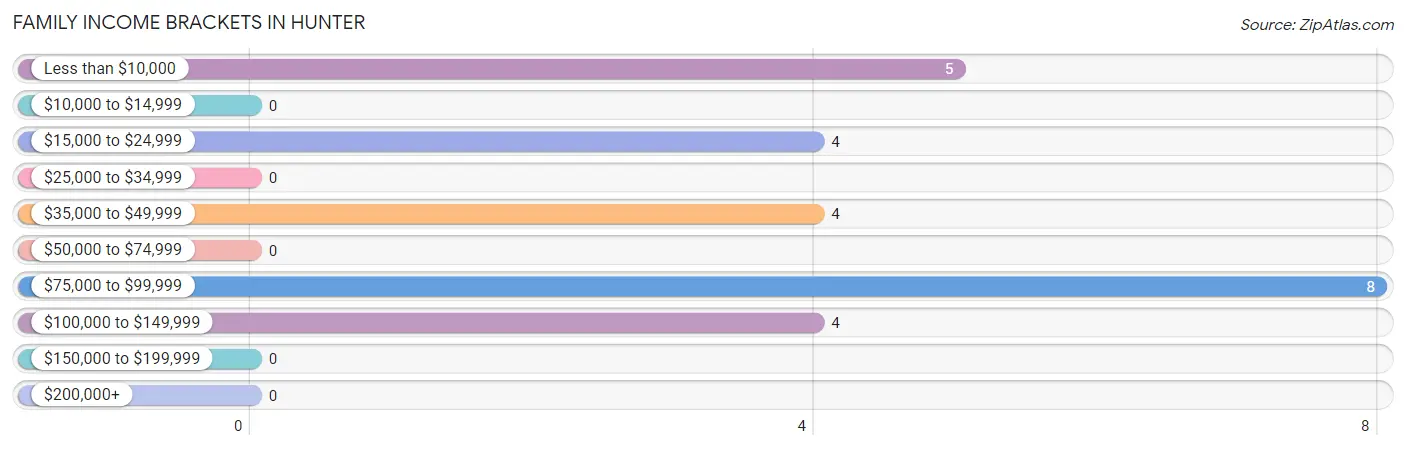
| Income Bracket | # Families | % Families |
| Less than $10,000 | 5 | 20.0% |
| $10,000 to $14,999 | 0 | 0.0% |
| $15,000 to $24,999 | 4 | 16.0% |
| $25,000 to $34,999 | 0 | 0.0% |
| $35,000 to $49,999 | 4 | 16.0% |
| $50,000 to $74,999 | 0 | 0.0% |
| $75,000 to $99,999 | 8 | 32.0% |
| $100,000 to $149,999 | 4 | 16.0% |
| $150,000 to $199,999 | 0 | 0.0% |
| $200,000+ | 0 | 0.0% |
Family Income by Famaliy Size in Hunter
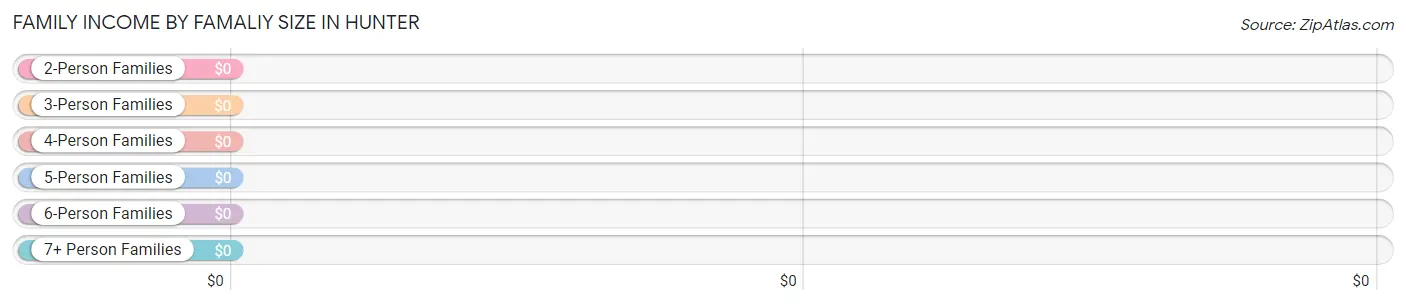
| Income Bracket | # Families | Median Income |
| 2-Person Families | 8 (32.0%) | $0 |
| 3-Person Families | 17 (68.0%) | $0 |
| 4-Person Families | 0 (0.0%) | $0 |
| 5-Person Families | 0 (0.0%) | $0 |
| 6-Person Families | 0 (0.0%) | $0 |
| 7+ Person Families | 0 (0.0%) | $0 |
| Total | 25 (100.0%) | $0 |
Family Income by Number of Earners in Hunter
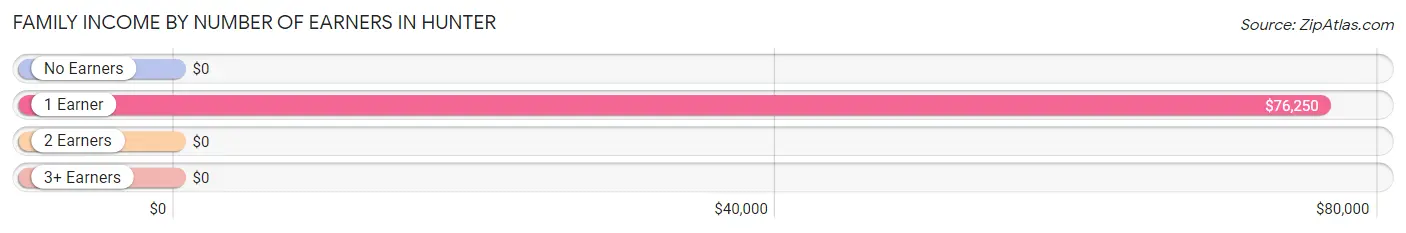
| Number of Earners | # Families | Median Income |
| No Earners | 9 (36.0%) | $0 |
| 1 Earner | 16 (64.0%) | $76,250 |
| 2 Earners | 0 (0.0%) | $0 |
| 3+ Earners | 0 (0.0%) | $0 |
| Total | 25 (100.0%) | $0 |
Household Income in Hunter
Household Income Brackets in Hunter
With 8 households falling in the category, the $75,000 to $99,999 income range is the most frequent in Hunter, accounting for 24.2% of all households.
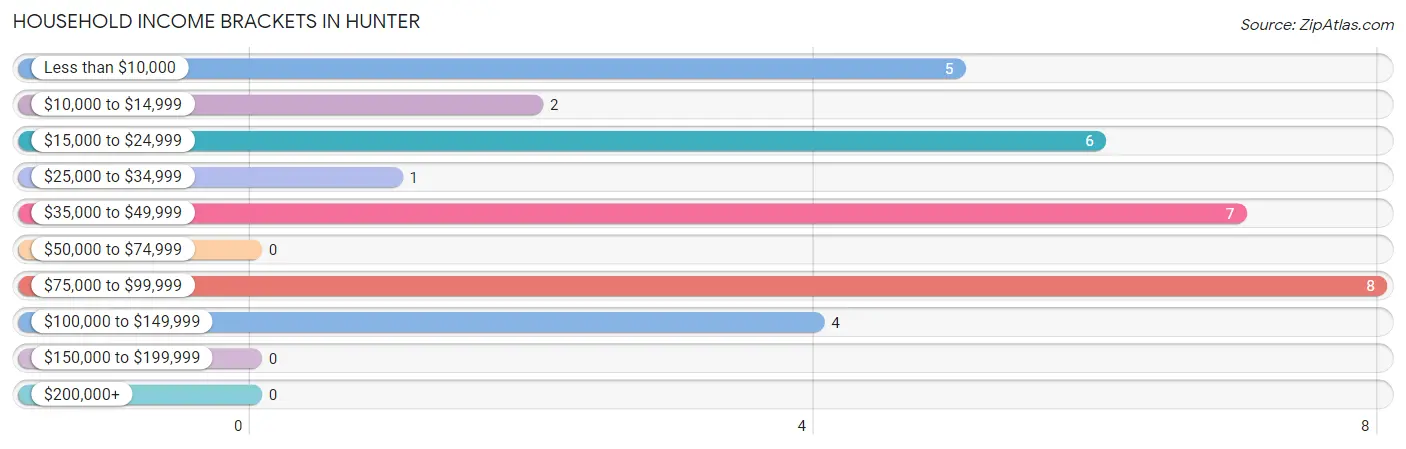
| Income Bracket | # Households | % Households |
| Less than $10,000 | 5 | 15.2% |
| $10,000 to $14,999 | 2 | 6.1% |
| $15,000 to $24,999 | 6 | 18.2% |
| $25,000 to $34,999 | 1 | 3.0% |
| $35,000 to $49,999 | 7 | 21.2% |
| $50,000 to $74,999 | 0 | 0.0% |
| $75,000 to $99,999 | 8 | 24.2% |
| $100,000 to $149,999 | 4 | 12.1% |
| $150,000 to $199,999 | 0 | 0.0% |
| $200,000+ | 0 | 0.0% |
Household Income by Householder Age in Hunter
The median household income in Hunter is $36,563, with the highest median household income of $19,583 found in the 65+ years age bracket for the primary householder. A total of 11 households (33.3%) fall into this category.
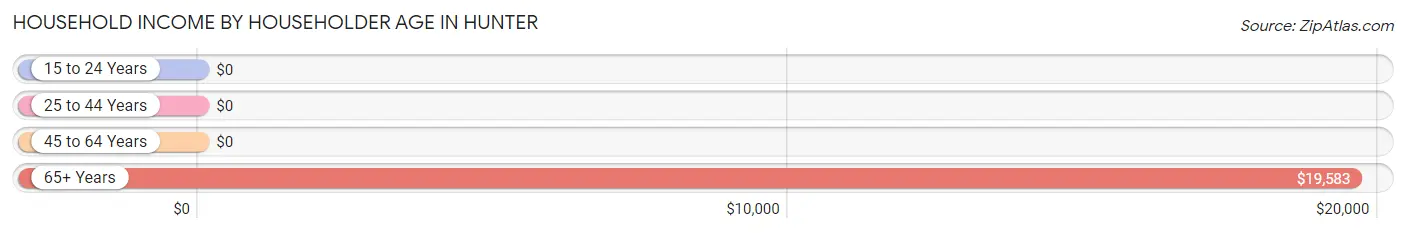
| Income Bracket | # Households | Median Income |
| 15 to 24 Years | 0 (0.0%) | $0 |
| 25 to 44 Years | 17 (51.5%) | $0 |
| 45 to 64 Years | 5 (15.1%) | $0 |
| 65+ Years | 11 (33.3%) | $19,583 |
| Total | 33 (100.0%) | $36,563 |
Poverty in Hunter
Income Below Poverty by Sex and Age in Hunter
With 5.9% poverty level for males and 64.9% for females among the residents of Hunter, 65 to 74 year old males and 12 to 14 year old females are the most vulnerable to poverty, with 2 males (28.6%) and 20 females (100.0%) in their respective age groups living below the poverty level.
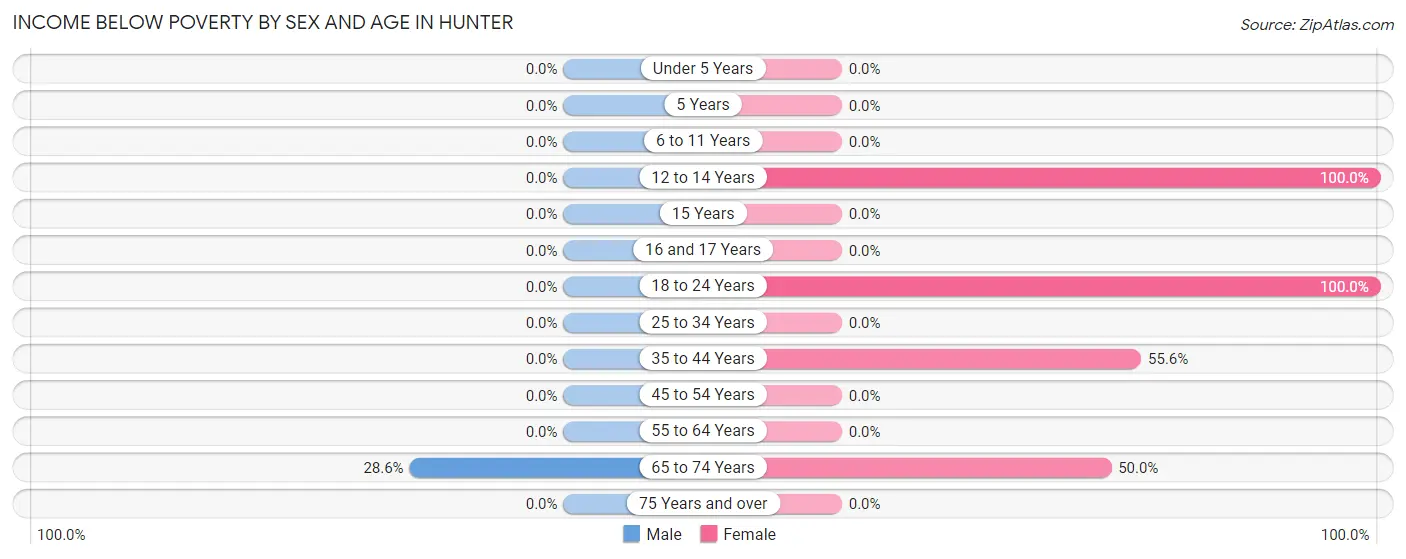
| Age Bracket | Male | Female |
| Under 5 Years | 0 (0.0%) | 0 (0.0%) |
| 5 Years | 0 (0.0%) | 0 (0.0%) |
| 6 to 11 Years | 0 (0.0%) | 0 (0.0%) |
| 12 to 14 Years | 0 (0.0%) | 20 (100.0%) |
| 15 Years | 0 (0.0%) | 0 (0.0%) |
| 16 and 17 Years | 0 (0.0%) | 0 (0.0%) |
| 18 to 24 Years | 0 (0.0%) | 20 (100.0%) |
| 25 to 34 Years | 0 (0.0%) | 0 (0.0%) |
| 35 to 44 Years | 0 (0.0%) | 5 (55.6%) |
| 45 to 54 Years | 0 (0.0%) | 0 (0.0%) |
| 55 to 64 Years | 0 (0.0%) | 0 (0.0%) |
| 65 to 74 Years | 2 (28.6%) | 3 (50.0%) |
| 75 Years and over | 0 (0.0%) | 0 (0.0%) |
| Total | 2 (5.9%) | 48 (64.9%) |
Income Above Poverty by Sex and Age in Hunter
According to the poverty statistics in Hunter, males aged under 5 years and females aged 6 to 11 years are the age groups that are most secure financially, with 100.0% of males and 100.0% of females in these age groups living above the poverty line.
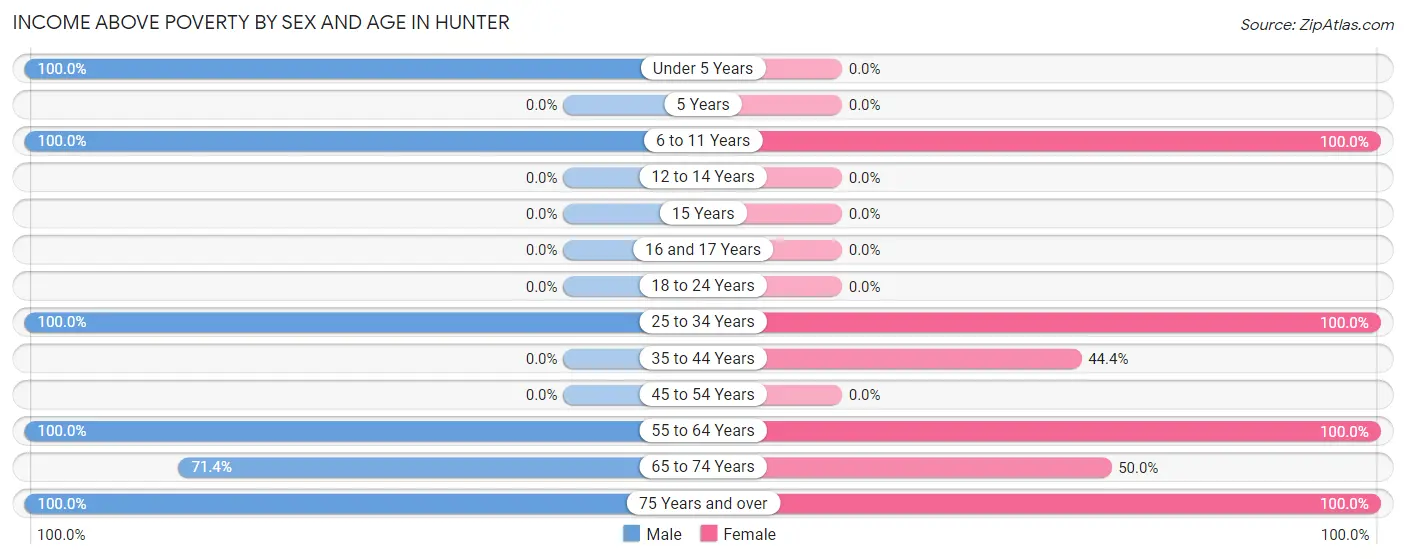
| Age Bracket | Male | Female |
| Under 5 Years | 7 (100.0%) | 0 (0.0%) |
| 5 Years | 0 (0.0%) | 0 (0.0%) |
| 6 to 11 Years | 3 (100.0%) | 3 (100.0%) |
| 12 to 14 Years | 0 (0.0%) | 0 (0.0%) |
| 15 Years | 0 (0.0%) | 0 (0.0%) |
| 16 and 17 Years | 0 (0.0%) | 0 (0.0%) |
| 18 to 24 Years | 0 (0.0%) | 0 (0.0%) |
| 25 to 34 Years | 8 (100.0%) | 10 (100.0%) |
| 35 to 44 Years | 0 (0.0%) | 4 (44.4%) |
| 45 to 54 Years | 0 (0.0%) | 0 (0.0%) |
| 55 to 64 Years | 7 (100.0%) | 5 (100.0%) |
| 65 to 74 Years | 5 (71.4%) | 3 (50.0%) |
| 75 Years and over | 2 (100.0%) | 1 (100.0%) |
| Total | 32 (94.1%) | 26 (35.1%) |
Income Below Poverty Among Married-Couple Families in Hunter
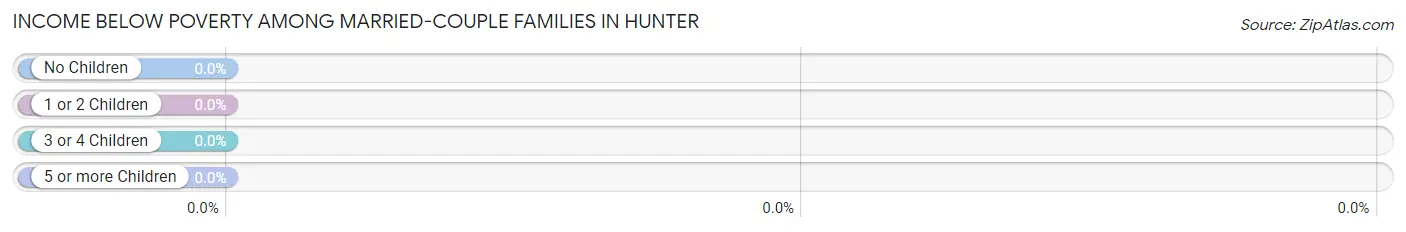
| Children | Above Poverty | Below Poverty |
| No Children | 8 (100.0%) | 0 (0.0%) |
| 1 or 2 Children | 8 (100.0%) | 0 (0.0%) |
| 3 or 4 Children | 0 (0.0%) | 0 (0.0%) |
| 5 or more Children | 0 (0.0%) | 0 (0.0%) |
| Total | 16 (100.0%) | 0 (0.0%) |
Income Below Poverty Among Single-Parent Households in Hunter
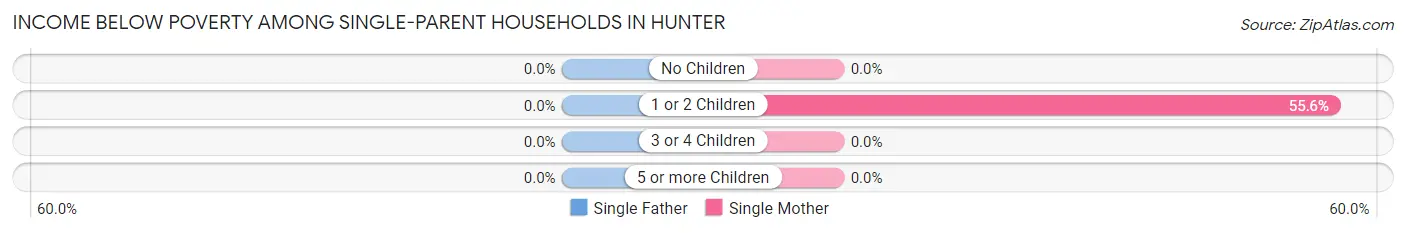
| Children | Single Father | Single Mother |
| No Children | 0 (0.0%) | 0 (0.0%) |
| 1 or 2 Children | 0 (0.0%) | 5 (55.6%) |
| 3 or 4 Children | 0 (0.0%) | 0 (0.0%) |
| 5 or more Children | 0 (0.0%) | 0 (0.0%) |
| Total | 0 (0.0%) | 5 (55.6%) |
Income Below Poverty Among Married-Couple vs Single-Parent Households in Hunter
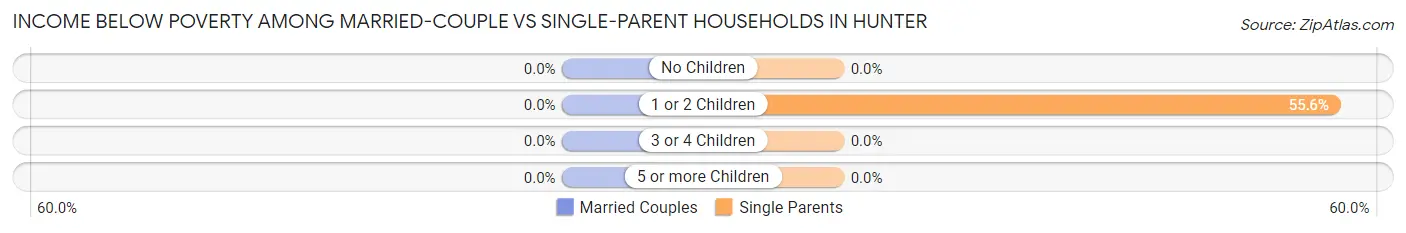
| Children | Married-Couple Families | Single-Parent Households |
| No Children | 0 (0.0%) | 0 (0.0%) |
| 1 or 2 Children | 0 (0.0%) | 5 (55.6%) |
| 3 or 4 Children | 0 (0.0%) | 0 (0.0%) |
| 5 or more Children | 0 (0.0%) | 0 (0.0%) |
| Total | 0 (0.0%) | 5 (55.6%) |
Race in Hunter
The most populous races in Hunter are White / Caucasian (68 | 63.0%), and Two or more Races (40 | 37.0%).
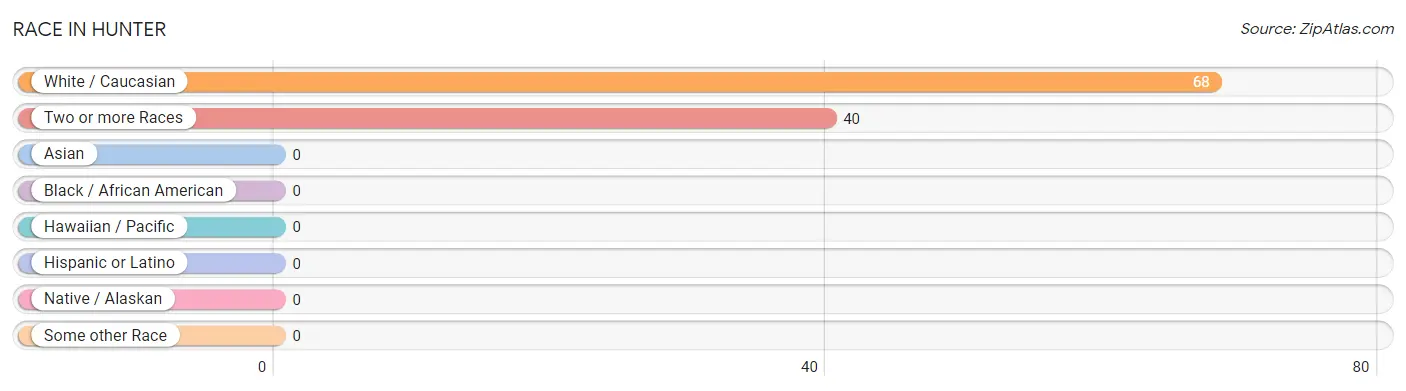
| Race | # Population | % Population |
| Asian | 0 | 0.0% |
| Black / African American | 0 | 0.0% |
| Hawaiian / Pacific | 0 | 0.0% |
| Hispanic or Latino | 0 | 0.0% |
| Native / Alaskan | 0 | 0.0% |
| White / Caucasian | 68 | 63.0% |
| Two or more Races | 40 | 37.0% |
| Some other Race | 0 | 0.0% |
| Total | 108 | 100.0% |
Ancestry in Hunter
The most populous ancestries reported in Hunter are German (44 | 40.7%), Irish (27 | 25.0%), French Canadian (2 | 1.8%), American (1 | 0.9%), and Czechoslovakian (1 | 0.9%), together accounting for 69.4% of all Hunter residents.
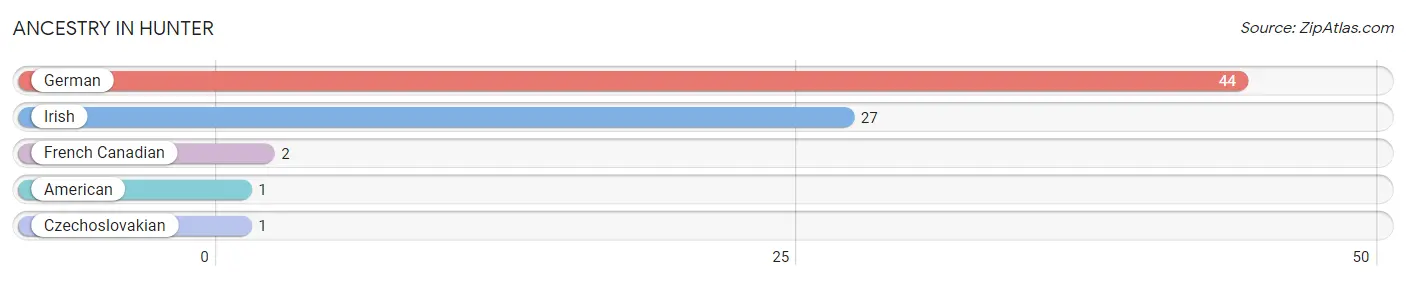
| Ancestry | # Population | % Population |
| American | 1 | 0.9% |
| Czechoslovakian | 1 | 0.9% |
| French Canadian | 2 | 1.8% |
| German | 44 | 40.7% |
| Irish | 27 | 25.0% | View All 5 Rows |
Immigrants in Hunter

| Immigration Origin | # Population | % Population | View All 0 Rows |
Sex and Age in Hunter
Sex and Age in Hunter
The most populous age groups in Hunter are 30 to 34 Years (8 | 23.5%) for men and 10 to 14 Years (20 | 27.0%) for women.
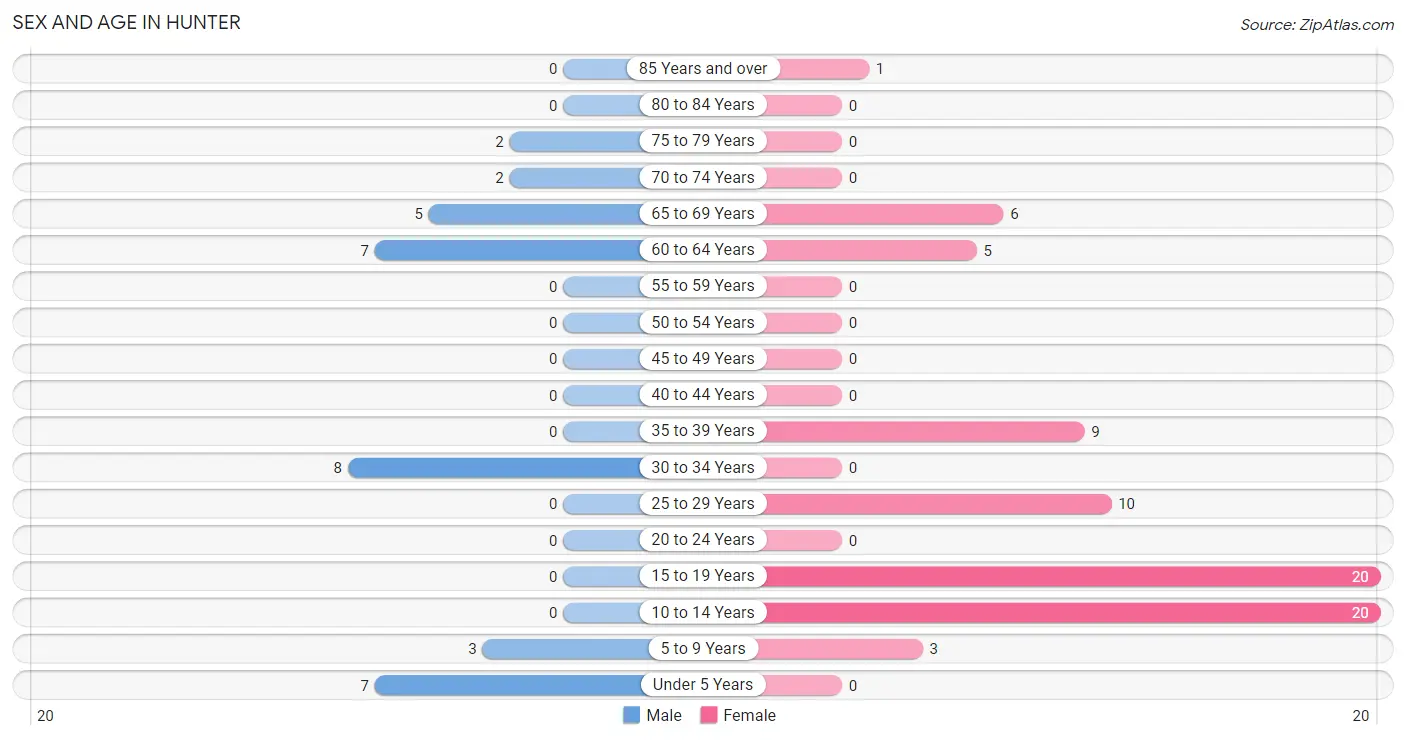
| Age Bracket | Male | Female |
| Under 5 Years | 7 (20.6%) | 0 (0.0%) |
| 5 to 9 Years | 3 (8.8%) | 3 (4.1%) |
| 10 to 14 Years | 0 (0.0%) | 20 (27.0%) |
| 15 to 19 Years | 0 (0.0%) | 20 (27.0%) |
| 20 to 24 Years | 0 (0.0%) | 0 (0.0%) |
| 25 to 29 Years | 0 (0.0%) | 10 (13.5%) |
| 30 to 34 Years | 8 (23.5%) | 0 (0.0%) |
| 35 to 39 Years | 0 (0.0%) | 9 (12.2%) |
| 40 to 44 Years | 0 (0.0%) | 0 (0.0%) |
| 45 to 49 Years | 0 (0.0%) | 0 (0.0%) |
| 50 to 54 Years | 0 (0.0%) | 0 (0.0%) |
| 55 to 59 Years | 0 (0.0%) | 0 (0.0%) |
| 60 to 64 Years | 7 (20.6%) | 5 (6.8%) |
| 65 to 69 Years | 5 (14.7%) | 6 (8.1%) |
| 70 to 74 Years | 2 (5.9%) | 0 (0.0%) |
| 75 to 79 Years | 2 (5.9%) | 0 (0.0%) |
| 80 to 84 Years | 0 (0.0%) | 0 (0.0%) |
| 85 Years and over | 0 (0.0%) | 1 (1.3%) |
| Total | 34 (100.0%) | 74 (100.0%) |
Families and Households in Hunter
Median Family Size in Hunter
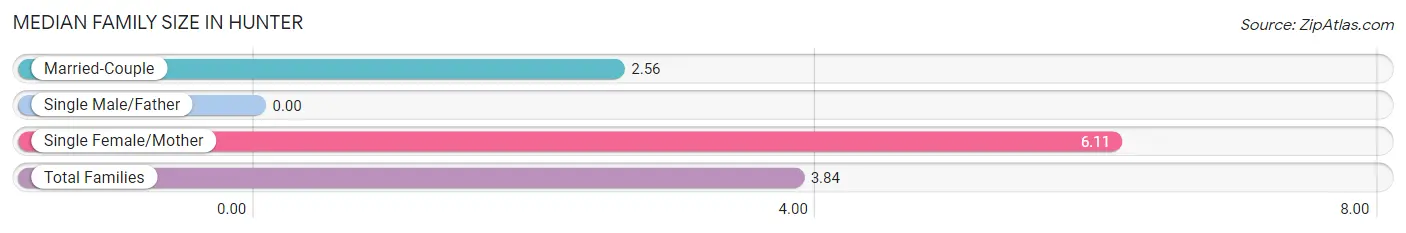
| Family Type | # Families | Family Size |
| Married-Couple | 16 (64.0%) | 2.56 |
| Single Male/Father | 0 (0.0%) | - |
| Single Female/Mother | 9 (36.0%) | 6.11 |
| Total Families | 25 (100.0%) | 3.84 |
Median Household Size in Hunter
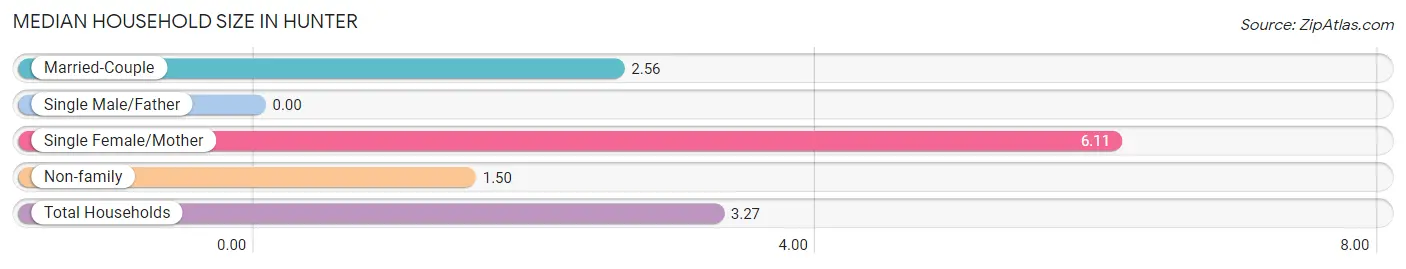
| Household Type | # Households | Household Size |
| Married-Couple | 16 (48.5%) | 2.56 |
| Single Male/Father | 0 (0.0%) | - |
| Single Female/Mother | 9 (27.3%) | 6.11 |
| Non-family | 8 (24.2%) | 1.50 |
| Total Households | 33 (100.0%) | 3.27 |
Household Size by Marriage Status in Hunter
Out of a total of 33 households in Hunter, 25 (75.8%) are family households, while 8 (24.2%) are nonfamily households. The most numerous type of family households are 3-person households, comprising 17, and the most common type of nonfamily households are 1-person households, comprising 4.
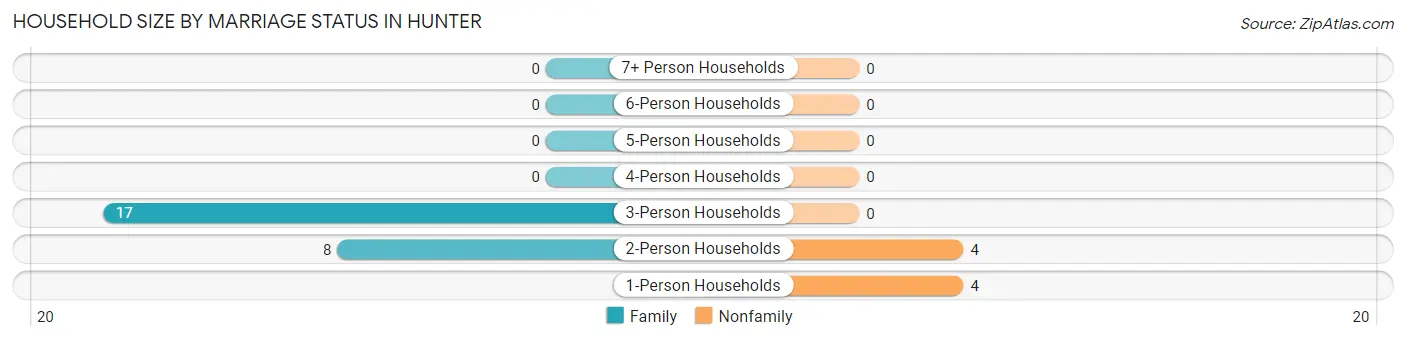
| Household Size | Family Households | Nonfamily Households |
| 1-Person Households | - | 4 (12.1%) |
| 2-Person Households | 8 (24.2%) | 4 (12.1%) |
| 3-Person Households | 17 (51.5%) | 0 (0.0%) |
| 4-Person Households | 0 (0.0%) | 0 (0.0%) |
| 5-Person Households | 0 (0.0%) | 0 (0.0%) |
| 6-Person Households | 0 (0.0%) | 0 (0.0%) |
| 7+ Person Households | 0 (0.0%) | 0 (0.0%) |
| Total | 25 (75.8%) | 8 (24.2%) |
Female Fertility in Hunter
Fertility by Age in Hunter
| Age Bracket | Women with Births | Births / 1,000 Women |
| 15 to 19 years | 0 (0.0%) | 0.0 |
| 20 to 34 years | 0 (0.0%) | 0.0 |
| 35 to 50 years | 0 (0.0%) | 0.0 |
| Total | 0 (0.0%) | 0.0 |
Fertility by Age by Marriage Status in Hunter
| Age Bracket | Married | Unmarried |
| 15 to 19 years | 0 (0.0%) | 0 (0.0%) |
| 20 to 34 years | 0 (0.0%) | 0 (0.0%) |
| 35 to 50 years | 0 (0.0%) | 0 (0.0%) |
| Total | 0 (0.0%) | 0 (0.0%) |
Fertility by Education in Hunter
| Educational Attainment | Women with Births | Births / 1,000 Women |
| Less than High School | 0 (0.0%) | 0.0 |
| High School Diploma | 0 (0.0%) | 0.0 |
| College or Associate's Degree | 0 (0.0%) | 0.0 |
| Bachelor's Degree | 0 (0.0%) | 0.0 |
| Graduate Degree | 0 (0.0%) | 0.0 |
| Total | 0 (0.0%) | 0.0 |
Fertility by Education by Marriage Status in Hunter
| Educational Attainment | Married | Unmarried |
| Less than High School | 0 (0.0%) | 0 (0.0%) |
| High School Diploma | 0 (0.0%) | 0 (0.0%) |
| College or Associate's Degree | 0 (0.0%) | 0 (0.0%) |
| Bachelor's Degree | 0 (0.0%) | 0 (0.0%) |
| Graduate Degree | 0 (0.0%) | 0 (0.0%) |
| Total | 0 (0.0%) | 0 (0.0%) |
Employment Characteristics in Hunter
Employment by Class of Employer in Hunter
Among the 21 employed individuals in Hunter, private company employees (11 | 52.4%), not-for-profit organizations (4 | 19.1%), and local government employees (4 | 19.1%) make up the most common classes of employment.
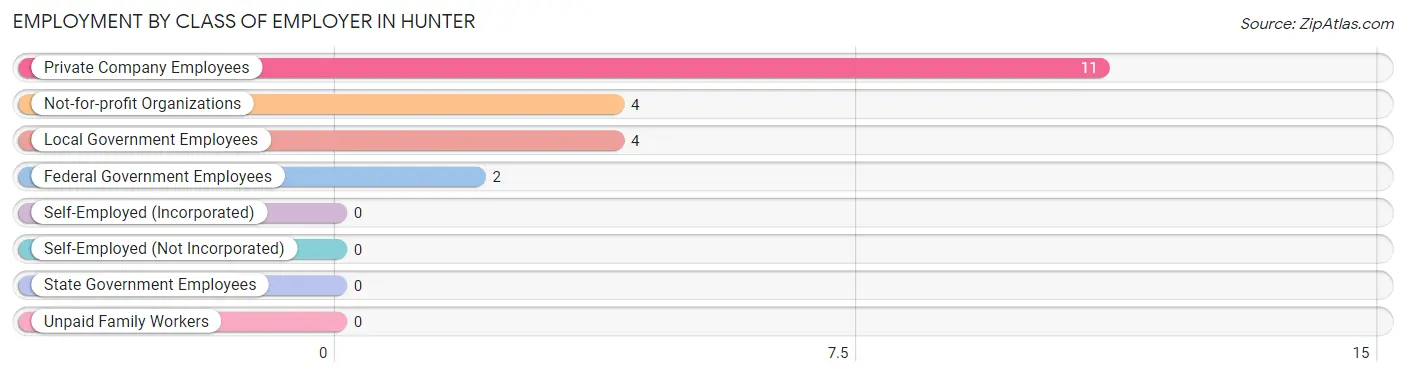
| Employer Class | # Employees | % Employees |
| Private Company Employees | 11 | 52.4% |
| Self-Employed (Incorporated) | 0 | 0.0% |
| Self-Employed (Not Incorporated) | 0 | 0.0% |
| Not-for-profit Organizations | 4 | 19.1% |
| Local Government Employees | 4 | 19.1% |
| State Government Employees | 0 | 0.0% |
| Federal Government Employees | 2 | 9.5% |
| Unpaid Family Workers | 0 | 0.0% |
| Total | 21 | 100.0% |
Employment Status by Age in Hunter
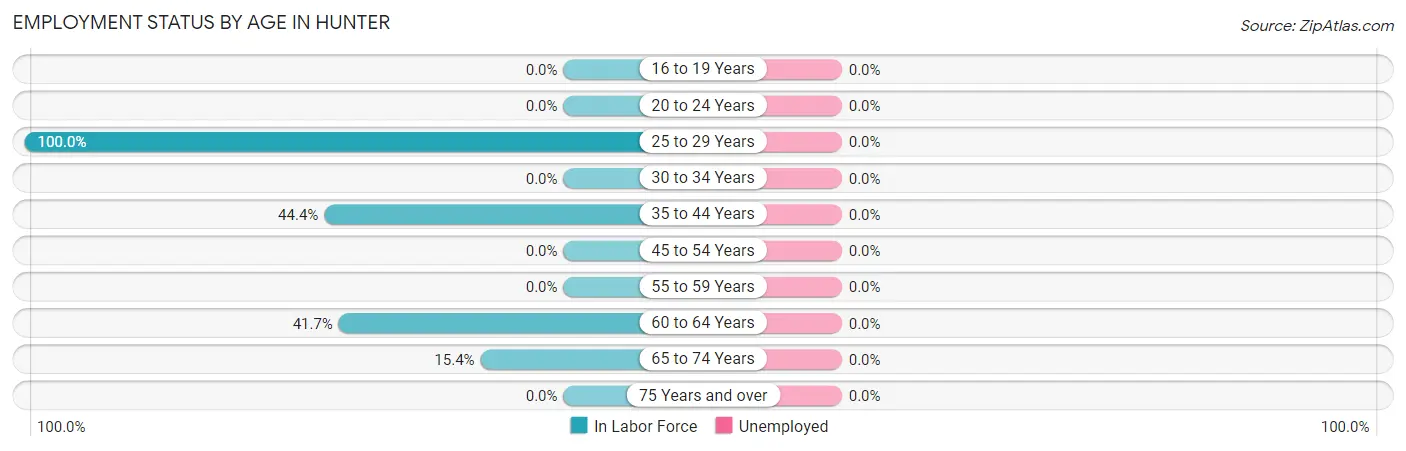
| Age Bracket | In Labor Force | Unemployed |
| 16 to 19 Years | 0 (0.0%) | 0 (0.0%) |
| 20 to 24 Years | 0 (0.0%) | 0 (0.0%) |
| 25 to 29 Years | 10 (100.0%) | 0 (0.0%) |
| 30 to 34 Years | 0 (0.0%) | 0 (0.0%) |
| 35 to 44 Years | 4 (44.4%) | 0 (0.0%) |
| 45 to 54 Years | 0 (0.0%) | 0 (0.0%) |
| 55 to 59 Years | 0 (0.0%) | 0 (0.0%) |
| 60 to 64 Years | 5 (41.7%) | 0 (0.0%) |
| 65 to 74 Years | 2 (15.4%) | 0 (0.0%) |
| 75 Years and over | 0 (0.0%) | 0 (0.0%) |
| Total | 21 (28.0%) | 0 (0.0%) |
Employment Status by Educational Attainment in Hunter
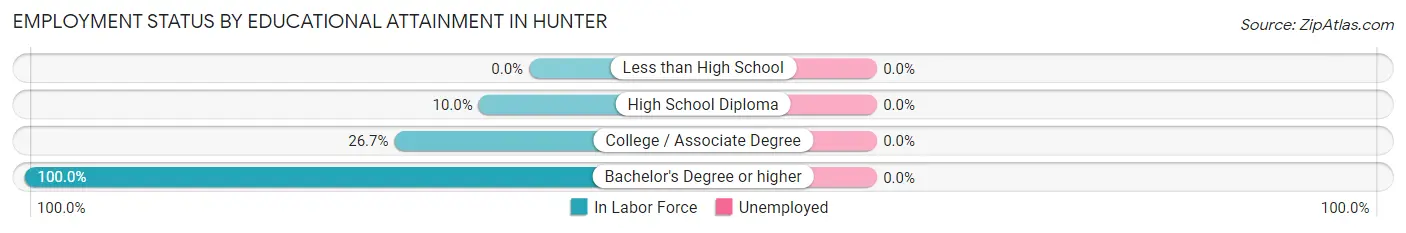
| Educational Attainment | In Labor Force | Unemployed |
| Less than High School | 0 (0.0%) | 0 (0.0%) |
| High School Diploma | 1 (10.0%) | 0 (0.0%) |
| College / Associate Degree | 4 (26.7%) | 0 (0.0%) |
| Bachelor's Degree or higher | 14 (100.0%) | 0 (0.0%) |
| Total | 19 (48.7%) | 0 (0.0%) |
Employment Occupations by Sex in Hunter
Management, Business, Science and Arts Occupations
The most common Management, Business, Science and Arts occupations in Hunter are Health Diagnosing & Treating (18 | 85.7%), and Health Technologists (8 | 38.1%).
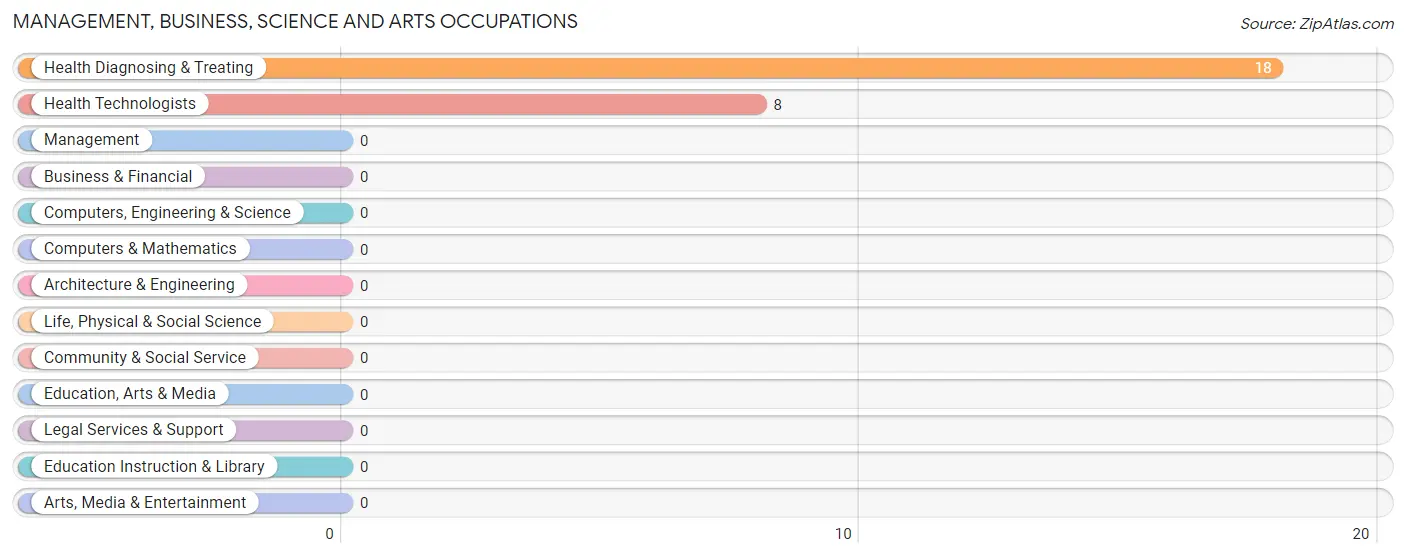
Management, Business, Science and Arts Occupations by Sex
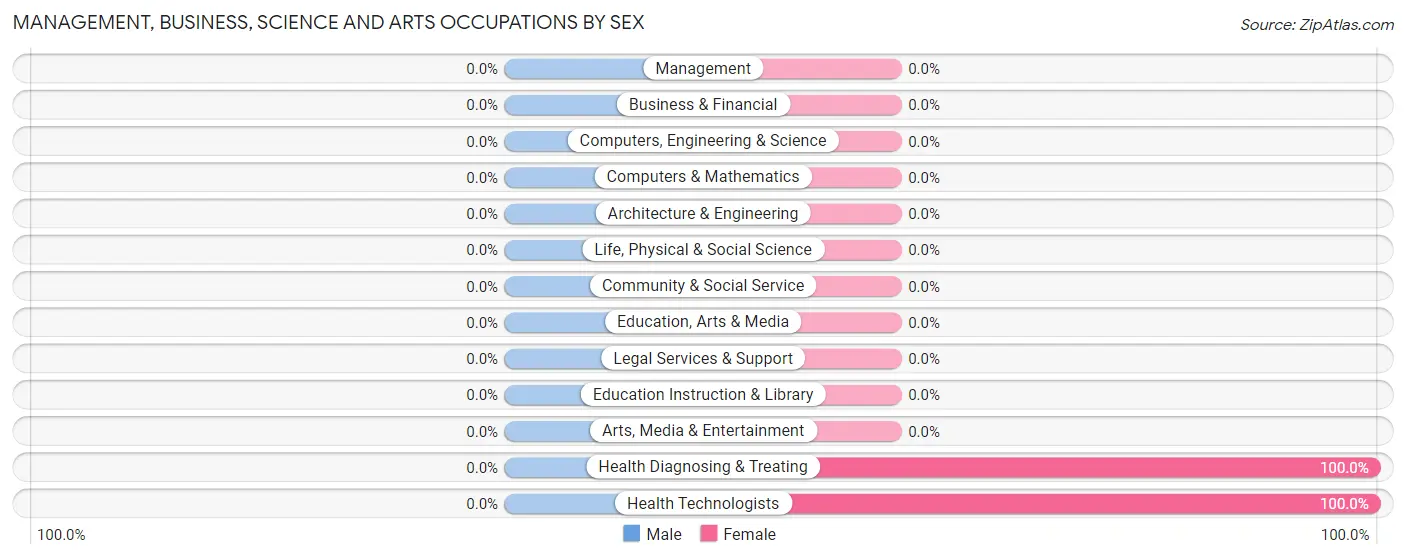
| Occupation | Male | Female |
| Management | 0 (0.0%) | 0 (0.0%) |
| Business & Financial | 0 (0.0%) | 0 (0.0%) |
| Computers, Engineering & Science | 0 (0.0%) | 0 (0.0%) |
| Computers & Mathematics | 0 (0.0%) | 0 (0.0%) |
| Architecture & Engineering | 0 (0.0%) | 0 (0.0%) |
| Life, Physical & Social Science | 0 (0.0%) | 0 (0.0%) |
| Community & Social Service | 0 (0.0%) | 0 (0.0%) |
| Education, Arts & Media | 0 (0.0%) | 0 (0.0%) |
| Legal Services & Support | 0 (0.0%) | 0 (0.0%) |
| Education Instruction & Library | 0 (0.0%) | 0 (0.0%) |
| Arts, Media & Entertainment | 0 (0.0%) | 0 (0.0%) |
| Health Diagnosing & Treating | 0 (0.0%) | 18 (100.0%) |
| Health Technologists | 0 (0.0%) | 8 (100.0%) |
| Total (Category) | 0 (0.0%) | 18 (100.0%) |
| Total (Overall) | 2 (9.5%) | 19 (90.5%) |
Services Occupations
Services Occupations by Sex
| Occupation | Male | Female |
| Healthcare Support | 0 (0.0%) | 0 (0.0%) |
| Security & Protection | 0 (0.0%) | 0 (0.0%) |
| Firefighting & Prevention | 0 (0.0%) | 0 (0.0%) |
| Law Enforcement | 0 (0.0%) | 0 (0.0%) |
| Food Preparation & Serving | 0 (0.0%) | 0 (0.0%) |
| Cleaning & Maintenance | 0 (0.0%) | 0 (0.0%) |
| Personal Care & Service | 0 (0.0%) | 0 (0.0%) |
| Total (Category) | 0 (0.0%) | 0 (0.0%) |
| Total (Overall) | 2 (9.5%) | 19 (90.5%) |
Sales and Office Occupations
The most common Sales and Office occupations in Hunter are , and Office & Administration (2 | 9.5%).
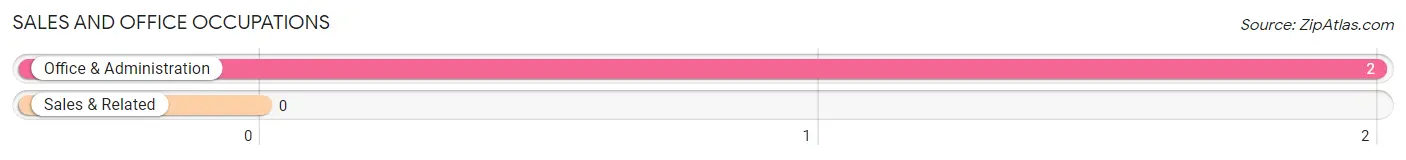
Sales and Office Occupations by Sex
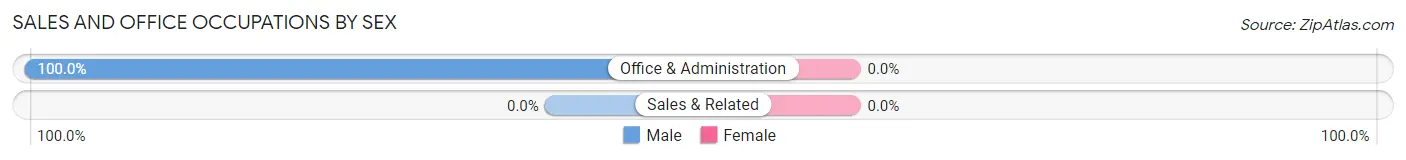
| Occupation | Male | Female |
| Sales & Related | 0 (0.0%) | 0 (0.0%) |
| Office & Administration | 2 (100.0%) | 0 (0.0%) |
| Total (Category) | 2 (100.0%) | 0 (0.0%) |
| Total (Overall) | 2 (9.5%) | 19 (90.5%) |
Natural Resources, Construction and Maintenance Occupations
Natural Resources, Construction and Maintenance Occupations by Sex
| Occupation | Male | Female |
| Farming, Fishing & Forestry | 0 (0.0%) | 0 (0.0%) |
| Construction & Extraction | 0 (0.0%) | 0 (0.0%) |
| Installation, Maintenance & Repair | 0 (0.0%) | 0 (0.0%) |
| Total (Category) | 0 (0.0%) | 0 (0.0%) |
| Total (Overall) | 2 (9.5%) | 19 (90.5%) |
Production, Transportation and Moving Occupations
The most common Production, Transportation and Moving occupations in Hunter are , and Production (1 | 4.8%).
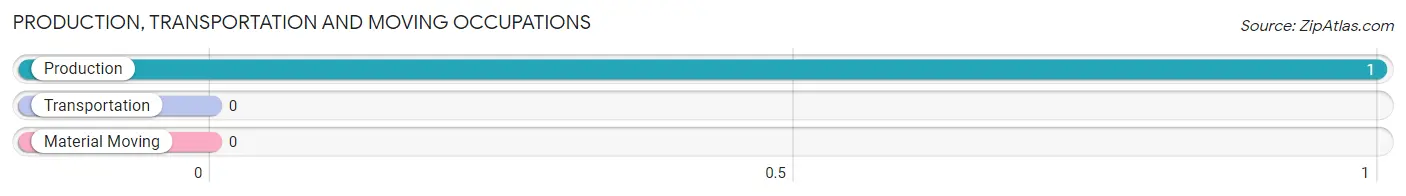
Production, Transportation and Moving Occupations by Sex
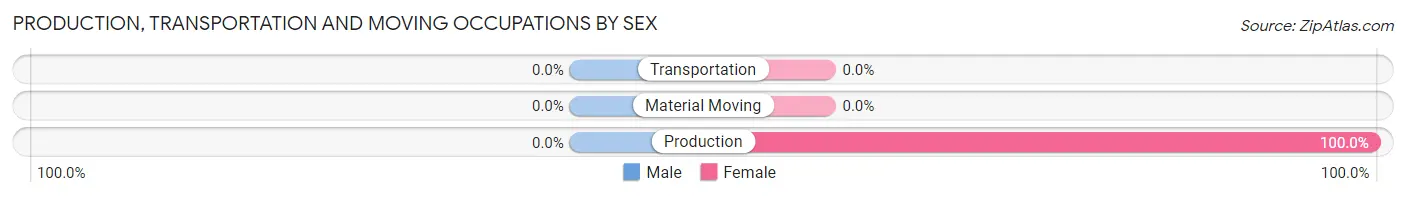
| Occupation | Male | Female |
| Production | 0 (0.0%) | 1 (100.0%) |
| Transportation | 0 (0.0%) | 0 (0.0%) |
| Material Moving | 0 (0.0%) | 0 (0.0%) |
| Total (Category) | 0 (0.0%) | 1 (100.0%) |
| Total (Overall) | 2 (9.5%) | 19 (90.5%) |
Employment Industries by Sex in Hunter
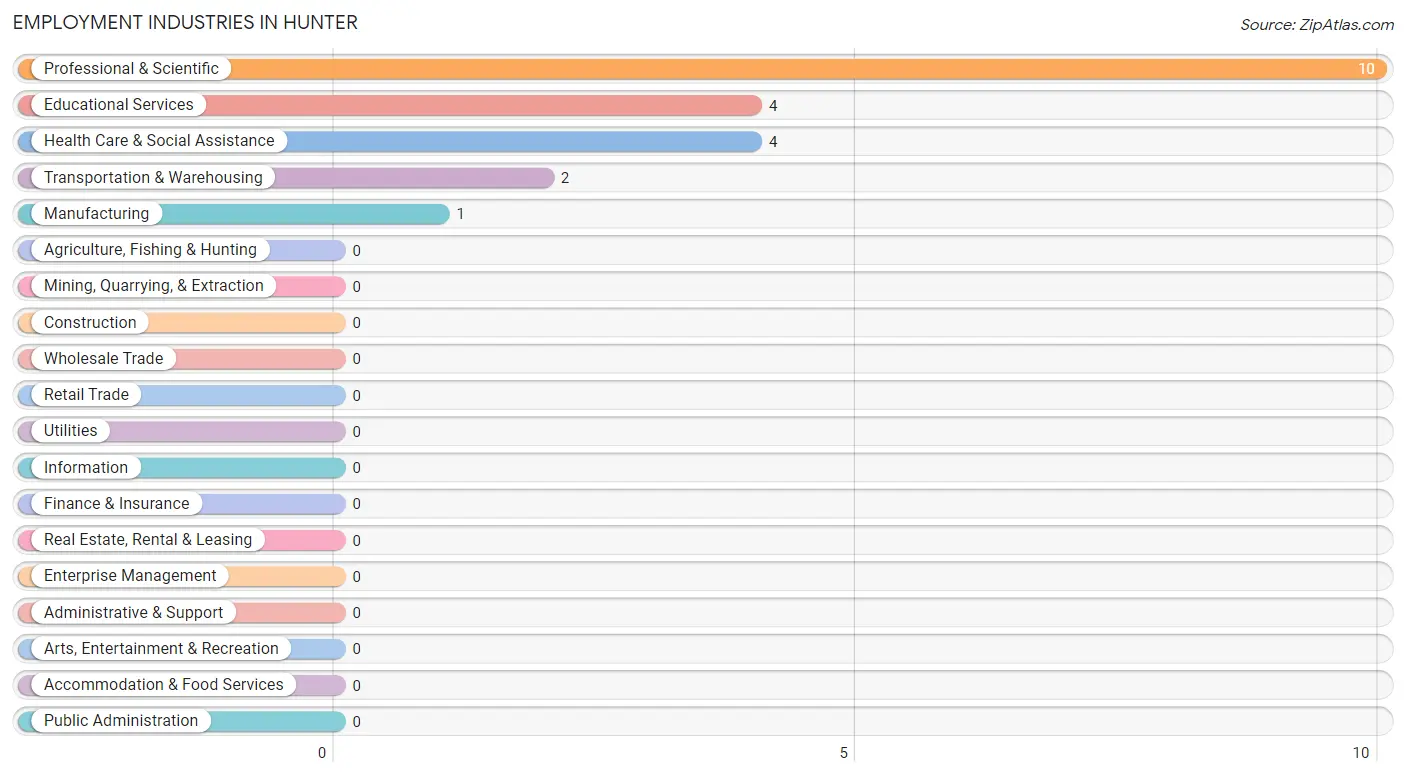
Employment Industries in Hunter
The major employment industries in Hunter include Professional & Scientific (10 | 47.6%), Educational Services (4 | 19.1%), Health Care & Social Assistance (4 | 19.1%), Transportation & Warehousing (2 | 9.5%), and Manufacturing (1 | 4.8%).
Employment Industries by Sex in Hunter
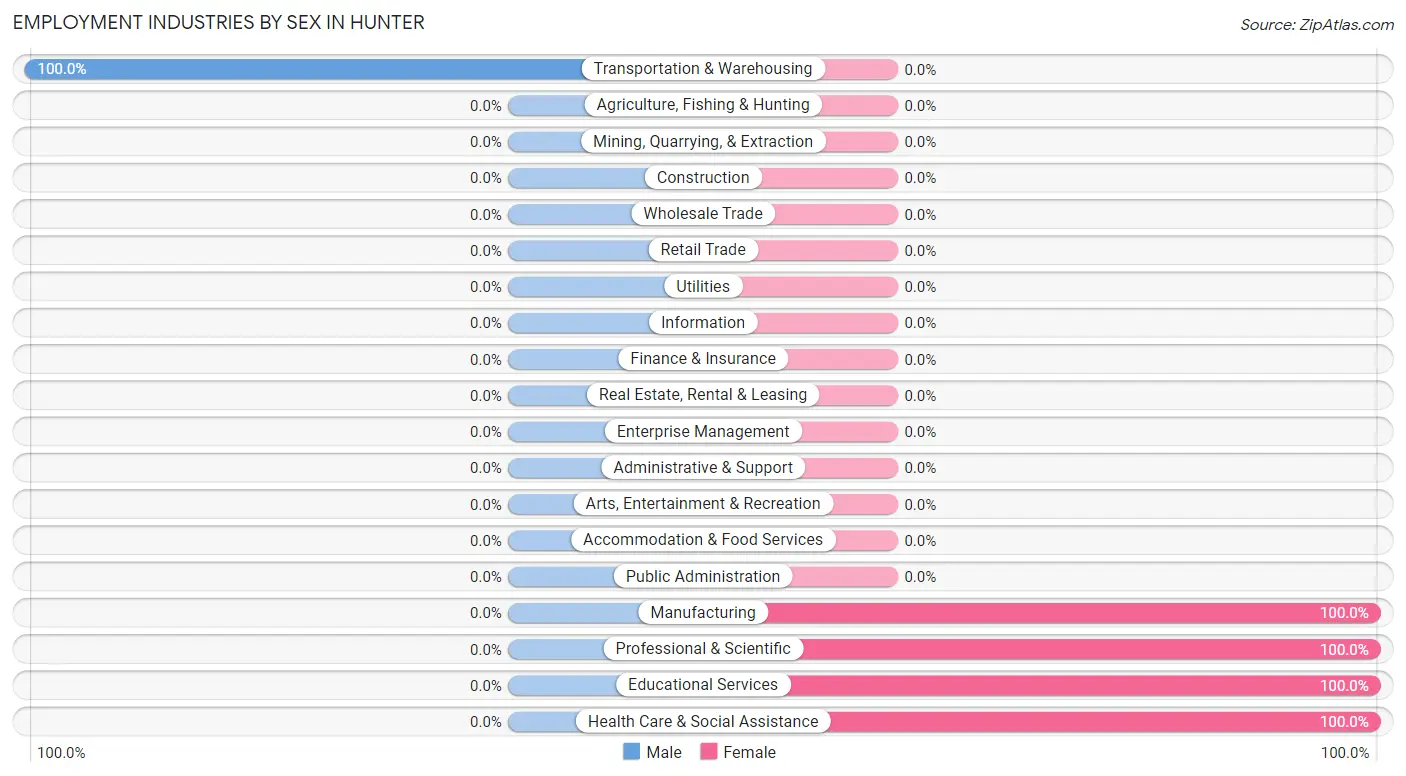
| Industry | Male | Female |
| Agriculture, Fishing & Hunting | 0 (0.0%) | 0 (0.0%) |
| Mining, Quarrying, & Extraction | 0 (0.0%) | 0 (0.0%) |
| Construction | 0 (0.0%) | 0 (0.0%) |
| Manufacturing | 0 (0.0%) | 1 (100.0%) |
| Wholesale Trade | 0 (0.0%) | 0 (0.0%) |
| Retail Trade | 0 (0.0%) | 0 (0.0%) |
| Transportation & Warehousing | 2 (100.0%) | 0 (0.0%) |
| Utilities | 0 (0.0%) | 0 (0.0%) |
| Information | 0 (0.0%) | 0 (0.0%) |
| Finance & Insurance | 0 (0.0%) | 0 (0.0%) |
| Real Estate, Rental & Leasing | 0 (0.0%) | 0 (0.0%) |
| Professional & Scientific | 0 (0.0%) | 10 (100.0%) |
| Enterprise Management | 0 (0.0%) | 0 (0.0%) |
| Administrative & Support | 0 (0.0%) | 0 (0.0%) |
| Educational Services | 0 (0.0%) | 4 (100.0%) |
| Health Care & Social Assistance | 0 (0.0%) | 4 (100.0%) |
| Arts, Entertainment & Recreation | 0 (0.0%) | 0 (0.0%) |
| Accommodation & Food Services | 0 (0.0%) | 0 (0.0%) |
| Public Administration | 0 (0.0%) | 0 (0.0%) |
| Total | 2 (9.5%) | 19 (90.5%) |
Education in Hunter
School Enrollment in Hunter
The most common levels of schooling among the 33 students in Hunter are middle school (20 | 60.6%), nursery / preschool (7 | 21.2%), and elementary school (6 | 18.2%).
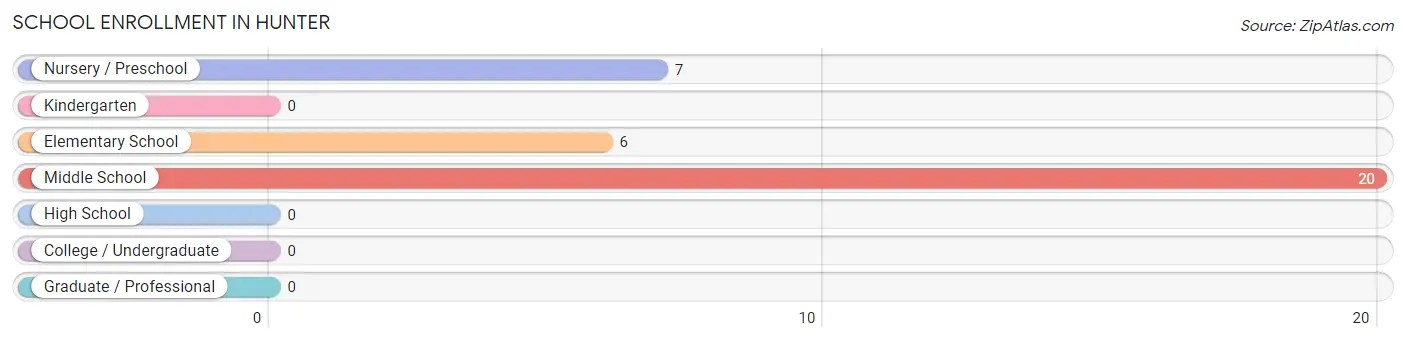
| School Level | # Students | % Students |
| Nursery / Preschool | 7 | 21.2% |
| Kindergarten | 0 | 0.0% |
| Elementary School | 6 | 18.2% |
| Middle School | 20 | 60.6% |
| High School | 0 | 0.0% |
| College / Undergraduate | 0 | 0.0% |
| Graduate / Professional | 0 | 0.0% |
| Total | 33 | 100.0% |
School Enrollment by Age by Funding Source in Hunter
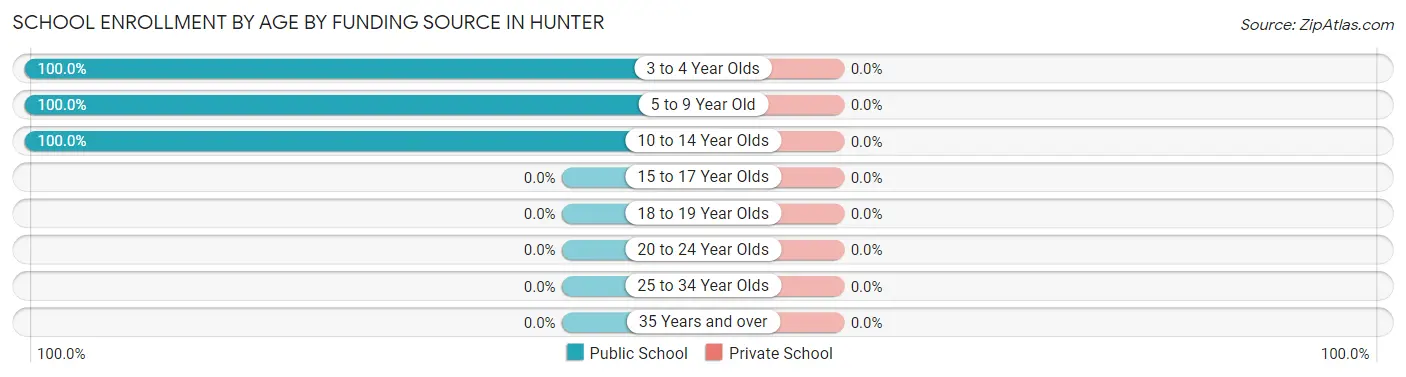
| Age Bracket | Public School | Private School |
| 3 to 4 Year Olds | 7 (100.0%) | 0 (0.0%) |
| 5 to 9 Year Old | 6 (100.0%) | 0 (0.0%) |
| 10 to 14 Year Olds | 20 (100.0%) | 0 (0.0%) |
| 15 to 17 Year Olds | 0 (0.0%) | 0 (0.0%) |
| 18 to 19 Year Olds | 0 (0.0%) | 0 (0.0%) |
| 20 to 24 Year Olds | 0 (0.0%) | 0 (0.0%) |
| 25 to 34 Year Olds | 0 (0.0%) | 0 (0.0%) |
| 35 Years and over | 0 (0.0%) | 0 (0.0%) |
| Total | 33 (100.0%) | 0 (0.0%) |
Educational Attainment by Field of Study in Hunter
Science & technology (14 | 93.3%), and business (1 | 6.7%) are the most common fields of study among 15 individuals in Hunter who have obtained a bachelor's degree or higher.
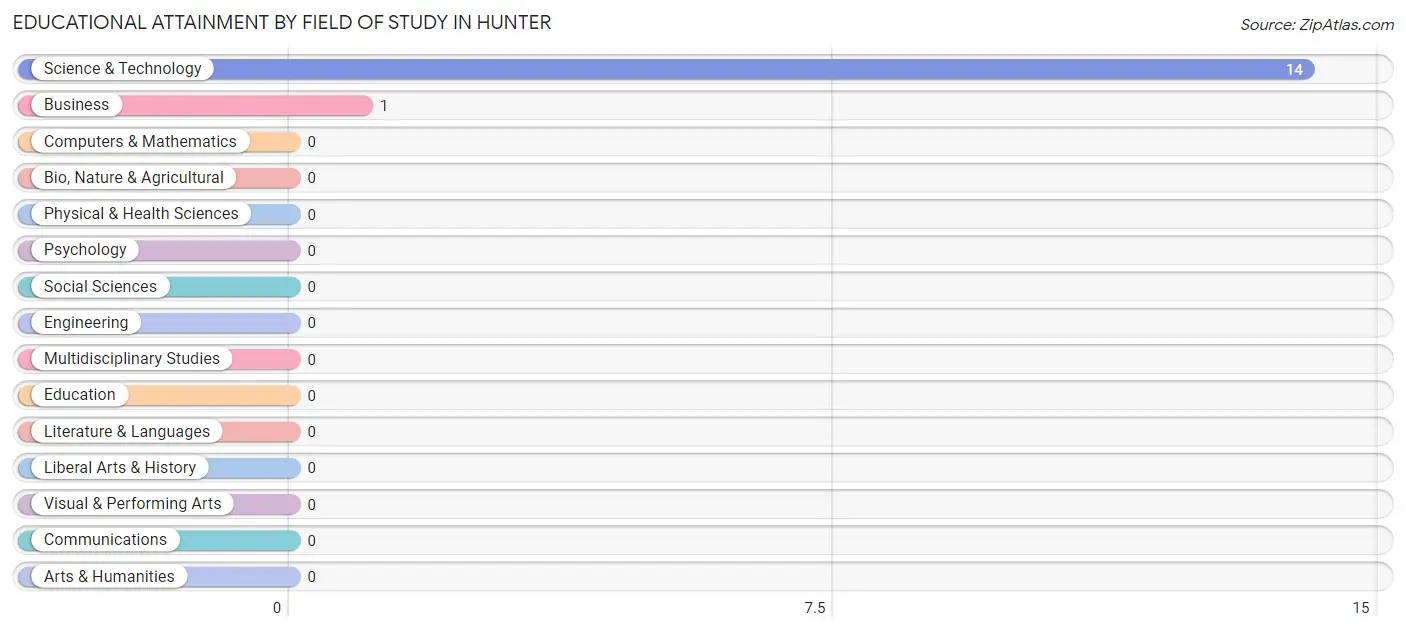
| Field of Study | # Graduates | % Graduates |
| Computers & Mathematics | 0 | 0.0% |
| Bio, Nature & Agricultural | 0 | 0.0% |
| Physical & Health Sciences | 0 | 0.0% |
| Psychology | 0 | 0.0% |
| Social Sciences | 0 | 0.0% |
| Engineering | 0 | 0.0% |
| Multidisciplinary Studies | 0 | 0.0% |
| Science & Technology | 14 | 93.3% |
| Business | 1 | 6.7% |
| Education | 0 | 0.0% |
| Literature & Languages | 0 | 0.0% |
| Liberal Arts & History | 0 | 0.0% |
| Visual & Performing Arts | 0 | 0.0% |
| Communications | 0 | 0.0% |
| Arts & Humanities | 0 | 0.0% |
| Total | 15 | 100.0% |
Transportation & Commute in Hunter
Vehicle Availability by Sex in Hunter
The most prevalent vehicle ownership categories in Hunter are males with 2 vehicles (2, accounting for 100.0%) and females with 2 vehicles (8, making up 10.5%).
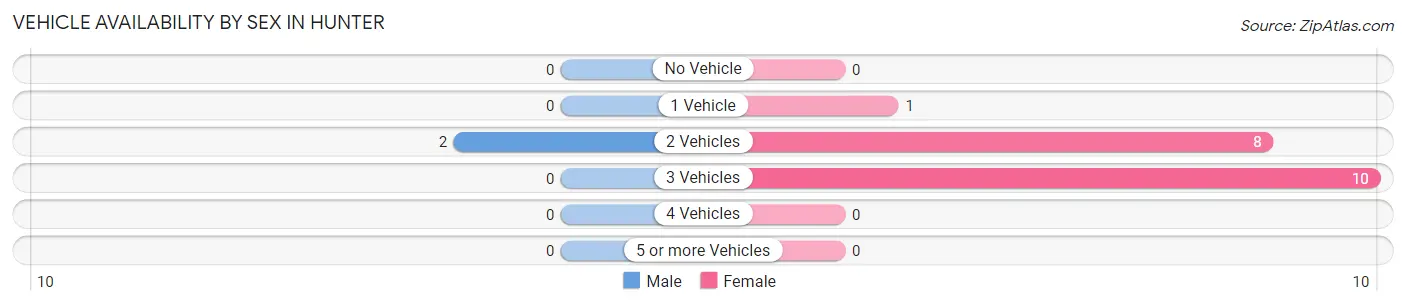
| Vehicles Available | Male | Female |
| No Vehicle | 0 (0.0%) | 0 (0.0%) |
| 1 Vehicle | 0 (0.0%) | 1 (5.3%) |
| 2 Vehicles | 2 (100.0%) | 8 (42.1%) |
| 3 Vehicles | 0 (0.0%) | 10 (52.6%) |
| 4 Vehicles | 0 (0.0%) | 0 (0.0%) |
| 5 or more Vehicles | 0 (0.0%) | 0 (0.0%) |
| Total | 2 (100.0%) | 19 (100.0%) |
Commute Time in Hunter
The most frequently occuring commute durations in Hunter are 45 to 59 minutes (10 commuters, 47.6%), 20 to 24 minutes (5 commuters, 23.8%), and 30 to 34 minutes (4 commuters, 19.1%).
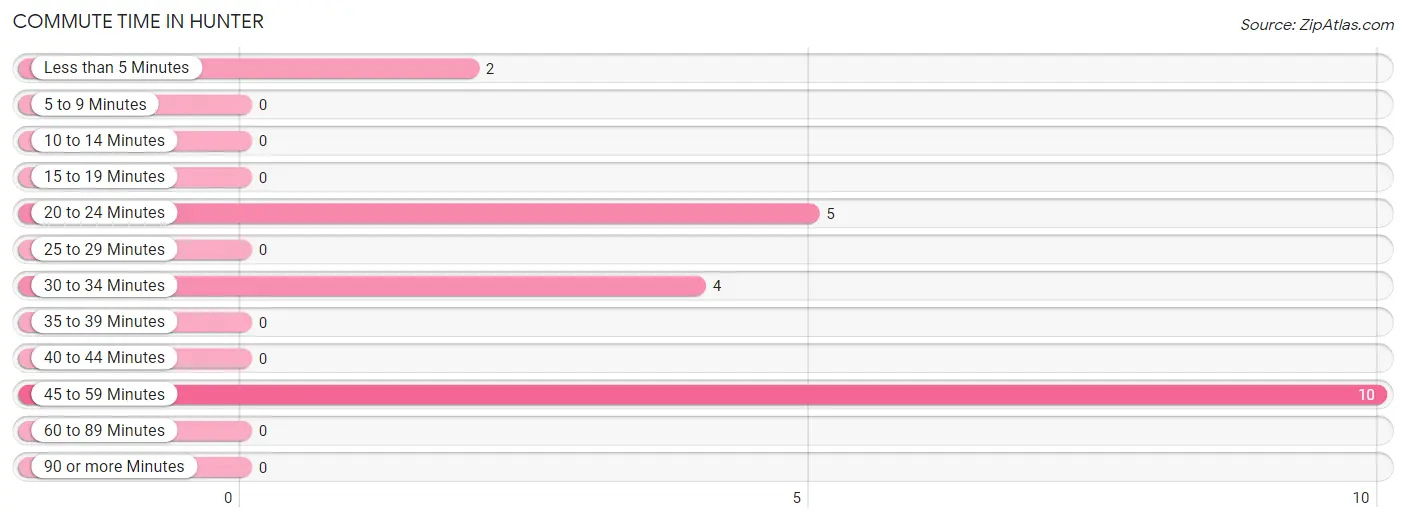
| Commute Time | # Commuters | % Commuters |
| Less than 5 Minutes | 2 | 9.5% |
| 5 to 9 Minutes | 0 | 0.0% |
| 10 to 14 Minutes | 0 | 0.0% |
| 15 to 19 Minutes | 0 | 0.0% |
| 20 to 24 Minutes | 5 | 23.8% |
| 25 to 29 Minutes | 0 | 0.0% |
| 30 to 34 Minutes | 4 | 19.1% |
| 35 to 39 Minutes | 0 | 0.0% |
| 40 to 44 Minutes | 0 | 0.0% |
| 45 to 59 Minutes | 10 | 47.6% |
| 60 to 89 Minutes | 0 | 0.0% |
| 90 or more Minutes | 0 | 0.0% |
Commute Time by Sex in Hunter
The most common commute times in Hunter are less than 5 minutes (2 commuters, 100.0%) for males and 45 to 59 minutes (10 commuters, 52.6%) for females.
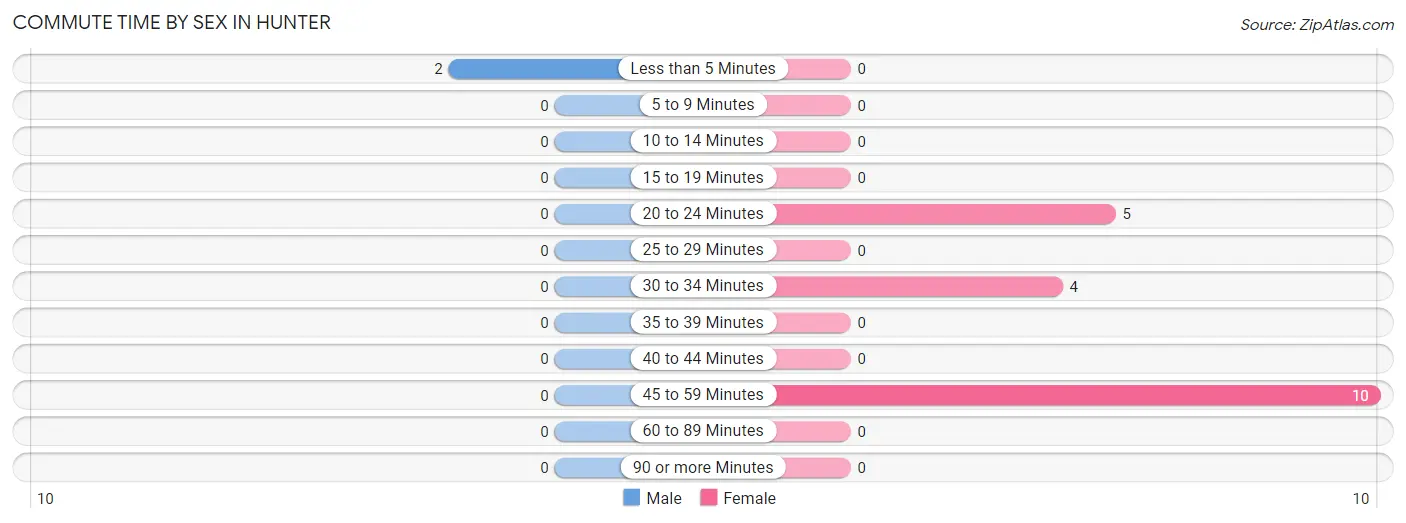
| Commute Time | Male | Female |
| Less than 5 Minutes | 2 (100.0%) | 0 (0.0%) |
| 5 to 9 Minutes | 0 (0.0%) | 0 (0.0%) |
| 10 to 14 Minutes | 0 (0.0%) | 0 (0.0%) |
| 15 to 19 Minutes | 0 (0.0%) | 0 (0.0%) |
| 20 to 24 Minutes | 0 (0.0%) | 5 (26.3%) |
| 25 to 29 Minutes | 0 (0.0%) | 0 (0.0%) |
| 30 to 34 Minutes | 0 (0.0%) | 4 (21.0%) |
| 35 to 39 Minutes | 0 (0.0%) | 0 (0.0%) |
| 40 to 44 Minutes | 0 (0.0%) | 0 (0.0%) |
| 45 to 59 Minutes | 0 (0.0%) | 10 (52.6%) |
| 60 to 89 Minutes | 0 (0.0%) | 0 (0.0%) |
| 90 or more Minutes | 0 (0.0%) | 0 (0.0%) |
Time of Departure to Work by Sex in Hunter
The most frequent times of departure to work in Hunter are 8:00 AM to 8:29 AM (2, 100.0%) for males and 7:00 AM to 7:29 AM (10, 52.6%) for females.
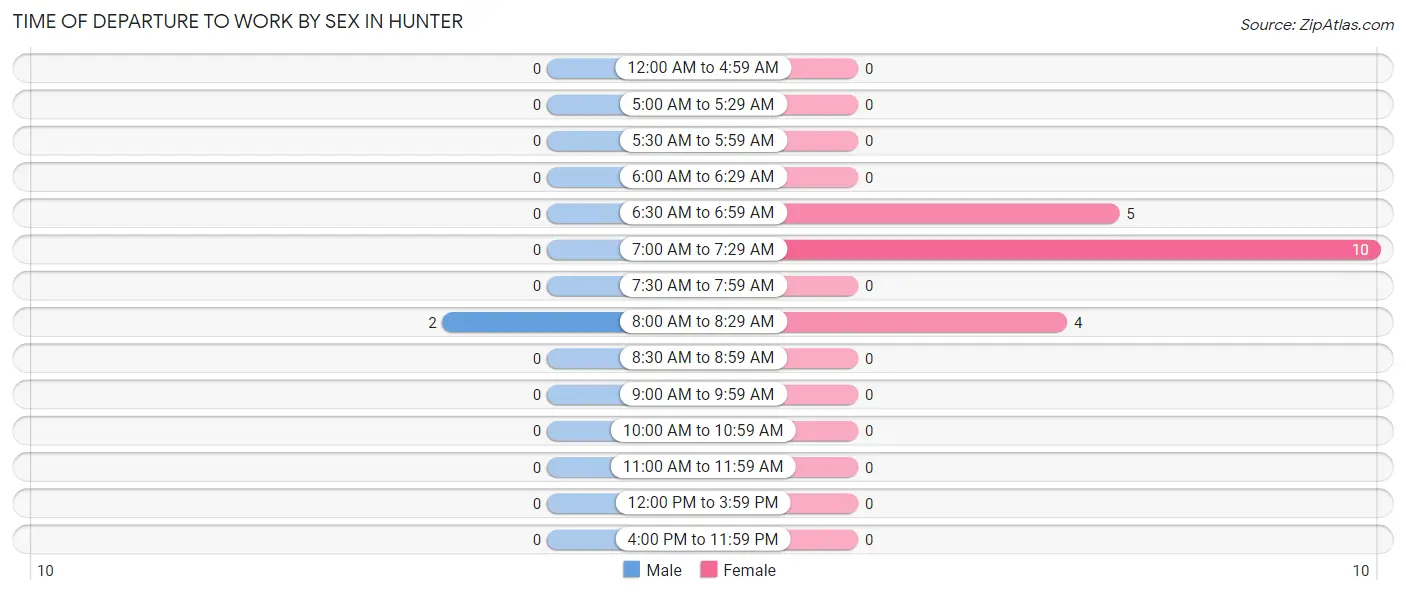
| Time of Departure | Male | Female |
| 12:00 AM to 4:59 AM | 0 (0.0%) | 0 (0.0%) |
| 5:00 AM to 5:29 AM | 0 (0.0%) | 0 (0.0%) |
| 5:30 AM to 5:59 AM | 0 (0.0%) | 0 (0.0%) |
| 6:00 AM to 6:29 AM | 0 (0.0%) | 0 (0.0%) |
| 6:30 AM to 6:59 AM | 0 (0.0%) | 5 (26.3%) |
| 7:00 AM to 7:29 AM | 0 (0.0%) | 10 (52.6%) |
| 7:30 AM to 7:59 AM | 0 (0.0%) | 0 (0.0%) |
| 8:00 AM to 8:29 AM | 2 (100.0%) | 4 (21.0%) |
| 8:30 AM to 8:59 AM | 0 (0.0%) | 0 (0.0%) |
| 9:00 AM to 9:59 AM | 0 (0.0%) | 0 (0.0%) |
| 10:00 AM to 10:59 AM | 0 (0.0%) | 0 (0.0%) |
| 11:00 AM to 11:59 AM | 0 (0.0%) | 0 (0.0%) |
| 12:00 PM to 3:59 PM | 0 (0.0%) | 0 (0.0%) |
| 4:00 PM to 11:59 PM | 0 (0.0%) | 0 (0.0%) |
| Total | 2 (100.0%) | 19 (100.0%) |
Housing Occupancy in Hunter
Occupancy by Ownership in Hunter
Of the total 33 dwellings in Hunter, owner-occupied units account for 33 (100.0%), while renter-occupied units make up 0 (0.0%).
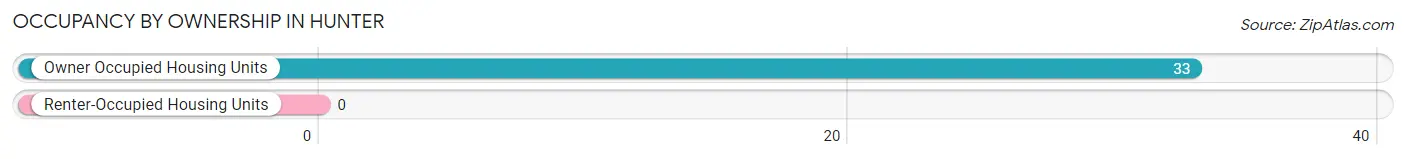
| Occupancy | # Housing Units | % Housing Units |
| Owner Occupied Housing Units | 33 | 100.0% |
| Renter-Occupied Housing Units | 0 | 0.0% |
| Total Occupied Housing Units | 33 | 100.0% |
Occupancy by Household Size in Hunter
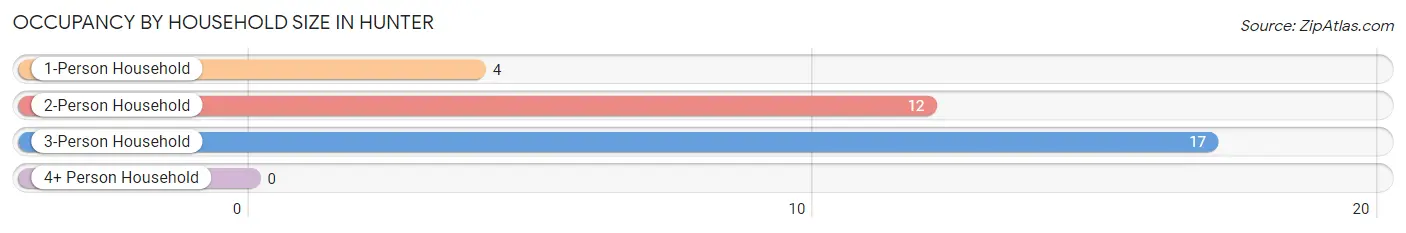
| Household Size | # Housing Units | % Housing Units |
| 1-Person Household | 4 | 12.1% |
| 2-Person Household | 12 | 36.4% |
| 3-Person Household | 17 | 51.5% |
| 4+ Person Household | 0 | 0.0% |
| Total Housing Units | 33 | 100.0% |
Occupancy by Ownership by Household Size in Hunter
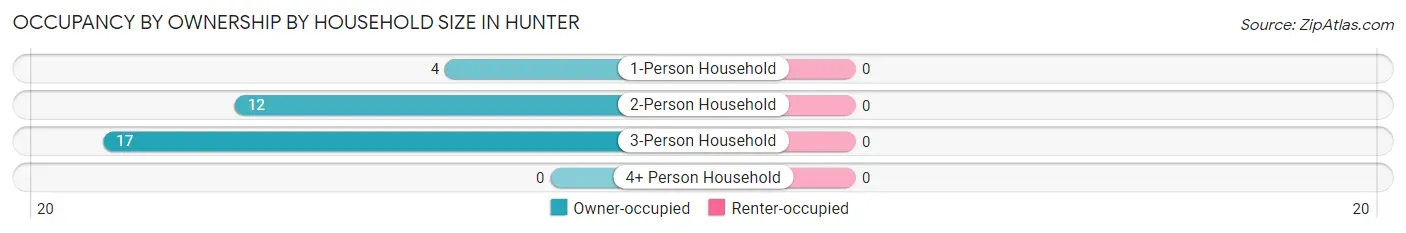
| Household Size | Owner-occupied | Renter-occupied |
| 1-Person Household | 4 (100.0%) | 0 (0.0%) |
| 2-Person Household | 12 (100.0%) | 0 (0.0%) |
| 3-Person Household | 17 (100.0%) | 0 (0.0%) |
| 4+ Person Household | 0 (0.0%) | 0 (0.0%) |
| Total Housing Units | 33 (100.0%) | 0 (0.0%) |
Occupancy by Educational Attainment in Hunter
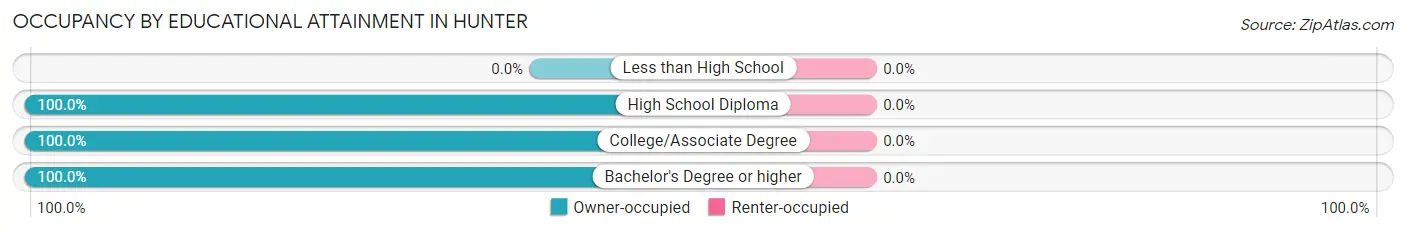
| Household Size | Owner-occupied | Renter-occupied |
| Less than High School | 0 (0.0%) | 0 (0.0%) |
| High School Diploma | 11 (100.0%) | 0 (0.0%) |
| College/Associate Degree | 17 (100.0%) | 0 (0.0%) |
| Bachelor's Degree or higher | 5 (100.0%) | 0 (0.0%) |
Occupancy by Age of Householder in Hunter
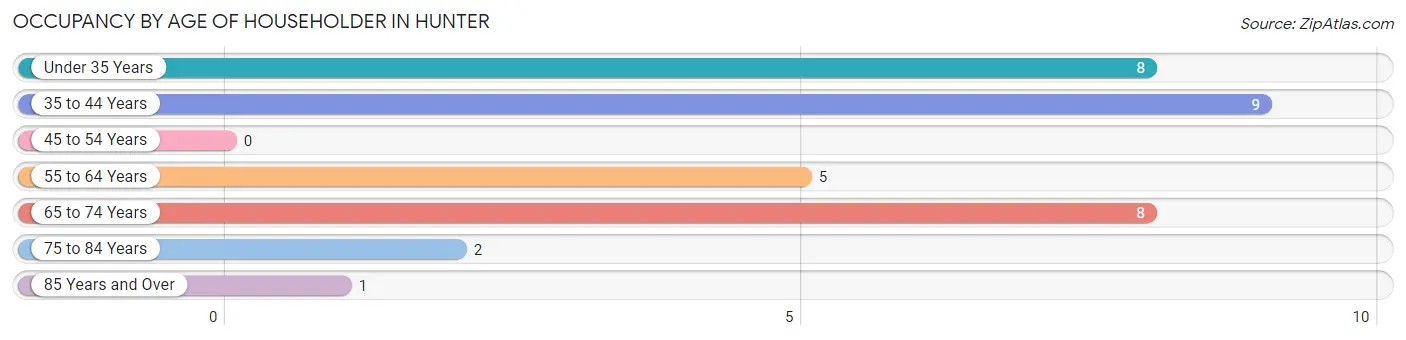
| Age Bracket | # Households | % Households |
| Under 35 Years | 8 | 24.2% |
| 35 to 44 Years | 9 | 27.3% |
| 45 to 54 Years | 0 | 0.0% |
| 55 to 64 Years | 5 | 15.1% |
| 65 to 74 Years | 8 | 24.2% |
| 75 to 84 Years | 2 | 6.1% |
| 85 Years and Over | 1 | 3.0% |
| Total | 33 | 100.0% |
Housing Finances in Hunter
Median Income by Occupancy in Hunter
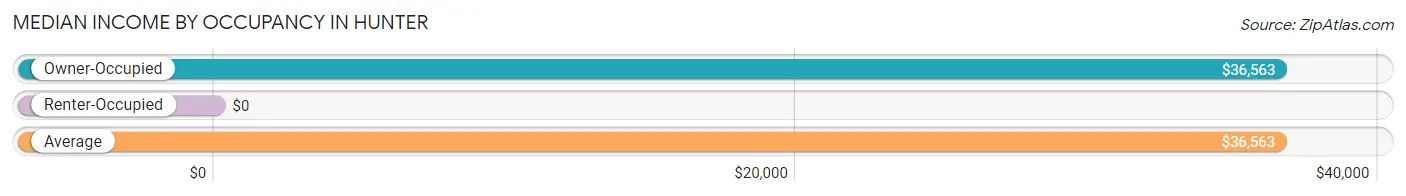
| Occupancy Type | # Households | Median Income |
| Owner-Occupied | 33 (100.0%) | $36,563 |
| Renter-Occupied | 0 (0.0%) | $0 |
| Average | 33 (100.0%) | $36,563 |
Occupancy by Householder Income Bracket in Hunter
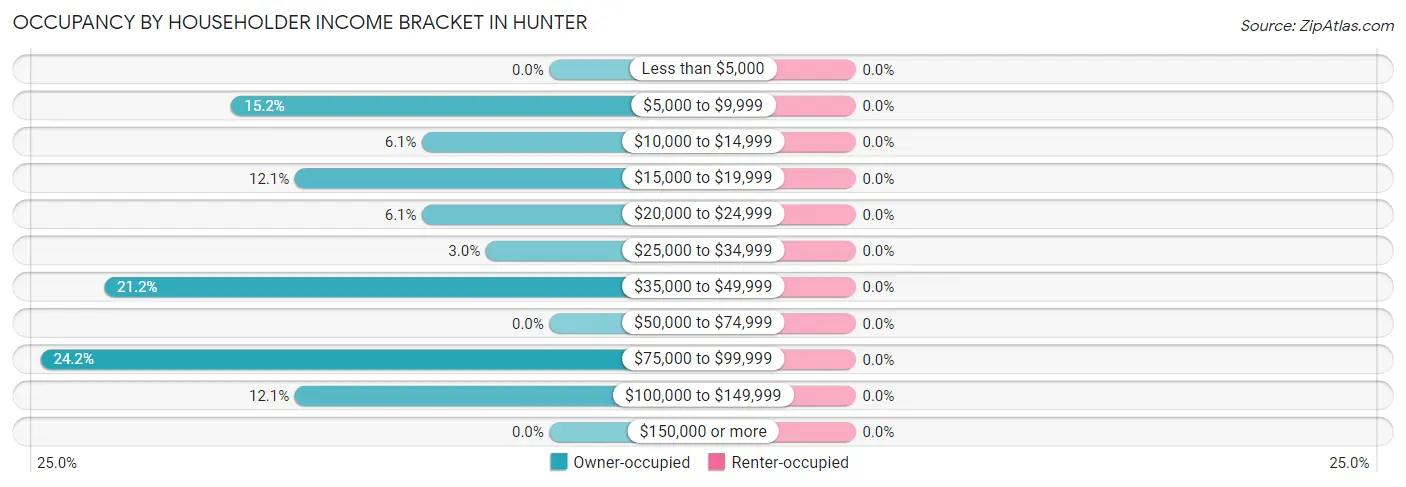
| Income Bracket | Owner-occupied | Renter-occupied |
| Less than $5,000 | 0 (0.0%) | 0 (0.0%) |
| $5,000 to $9,999 | 5 (15.1%) | 0 (0.0%) |
| $10,000 to $14,999 | 2 (6.1%) | 0 (0.0%) |
| $15,000 to $19,999 | 4 (12.1%) | 0 (0.0%) |
| $20,000 to $24,999 | 2 (6.1%) | 0 (0.0%) |
| $25,000 to $34,999 | 1 (3.0%) | 0 (0.0%) |
| $35,000 to $49,999 | 7 (21.2%) | 0 (0.0%) |
| $50,000 to $74,999 | 0 (0.0%) | 0 (0.0%) |
| $75,000 to $99,999 | 8 (24.2%) | 0 (0.0%) |
| $100,000 to $149,999 | 4 (12.1%) | 0 (0.0%) |
| $150,000 or more | 0 (0.0%) | 0 (0.0%) |
| Total | 33 (100.0%) | 0 (0.0%) |
Monthly Housing Cost Tiers in Hunter
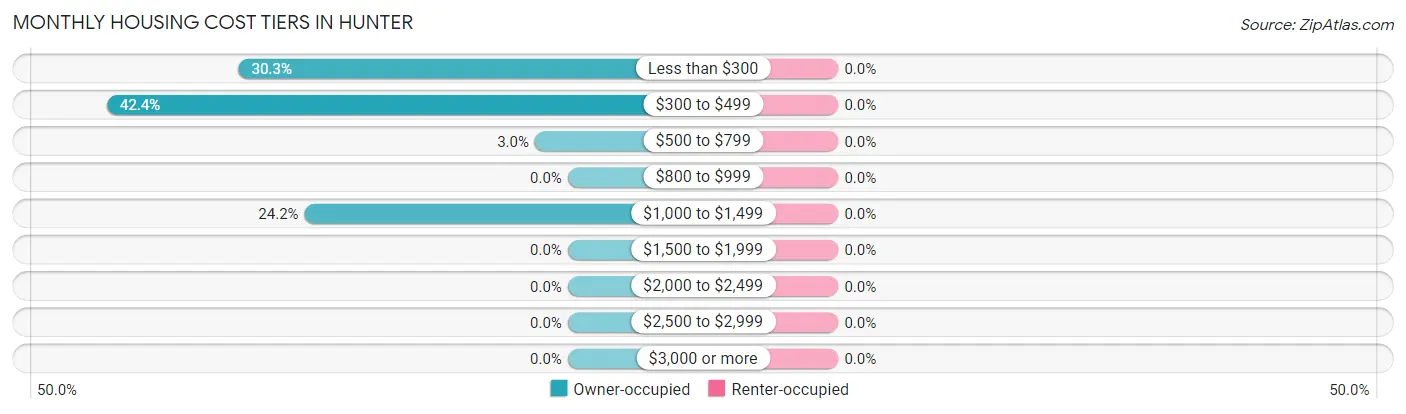
| Monthly Cost | Owner-occupied | Renter-occupied |
| Less than $300 | 10 (30.3%) | 0 (0.0%) |
| $300 to $499 | 14 (42.4%) | 0 (0.0%) |
| $500 to $799 | 1 (3.0%) | 0 (0.0%) |
| $800 to $999 | 0 (0.0%) | 0 (0.0%) |
| $1,000 to $1,499 | 8 (24.2%) | 0 (0.0%) |
| $1,500 to $1,999 | 0 (0.0%) | 0 (0.0%) |
| $2,000 to $2,499 | 0 (0.0%) | 0 (0.0%) |
| $2,500 to $2,999 | 0 (0.0%) | 0 (0.0%) |
| $3,000 or more | 0 (0.0%) | 0 (0.0%) |
| Total | 33 (100.0%) | 0 (0.0%) |
Physical Housing Characteristics in Hunter
Housing Structures in Hunter
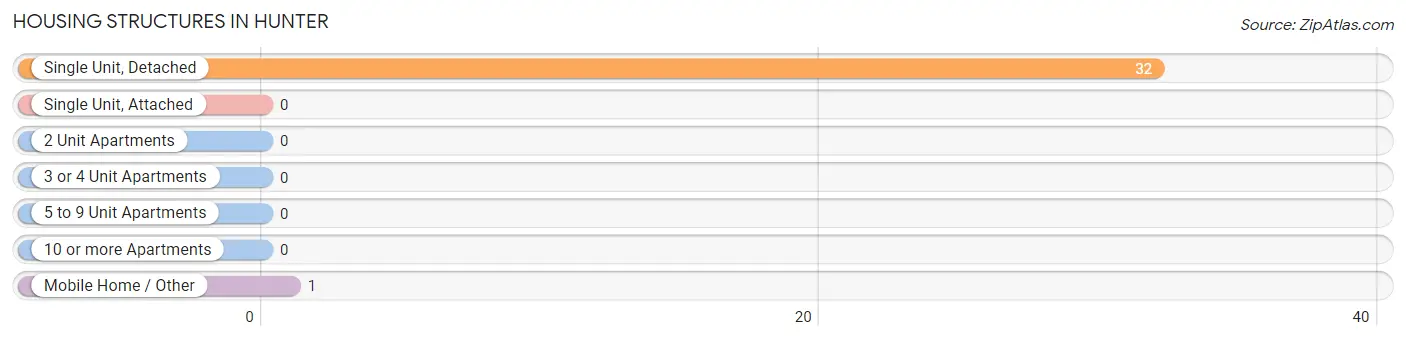
| Structure Type | # Housing Units | % Housing Units |
| Single Unit, Detached | 32 | 97.0% |
| Single Unit, Attached | 0 | 0.0% |
| 2 Unit Apartments | 0 | 0.0% |
| 3 or 4 Unit Apartments | 0 | 0.0% |
| 5 to 9 Unit Apartments | 0 | 0.0% |
| 10 or more Apartments | 0 | 0.0% |
| Mobile Home / Other | 1 | 3.0% |
| Total | 33 | 100.0% |
Housing Structures by Occupancy in Hunter
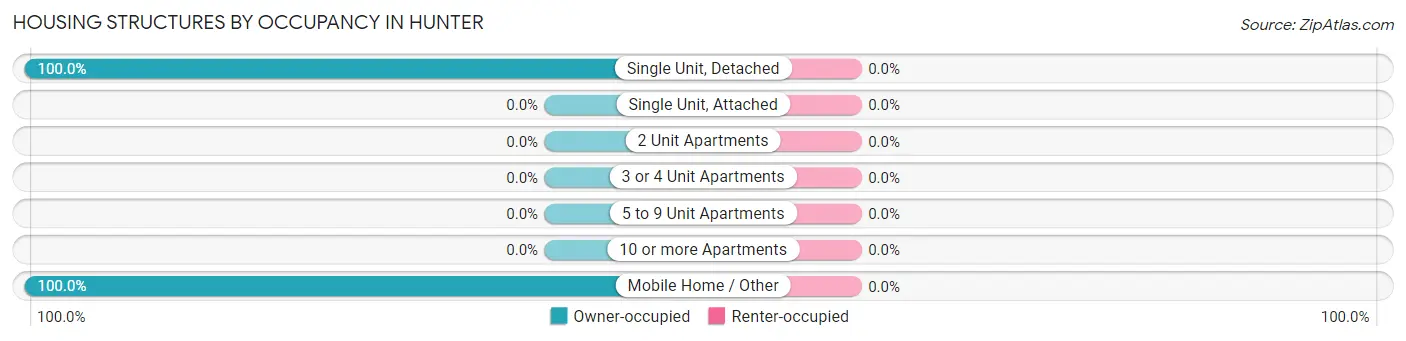
| Structure Type | Owner-occupied | Renter-occupied |
| Single Unit, Detached | 32 (100.0%) | 0 (0.0%) |
| Single Unit, Attached | 0 (0.0%) | 0 (0.0%) |
| 2 Unit Apartments | 0 (0.0%) | 0 (0.0%) |
| 3 or 4 Unit Apartments | 0 (0.0%) | 0 (0.0%) |
| 5 to 9 Unit Apartments | 0 (0.0%) | 0 (0.0%) |
| 10 or more Apartments | 0 (0.0%) | 0 (0.0%) |
| Mobile Home / Other | 1 (100.0%) | 0 (0.0%) |
| Total | 33 (100.0%) | 0 (0.0%) |
Housing Structures by Number of Rooms in Hunter
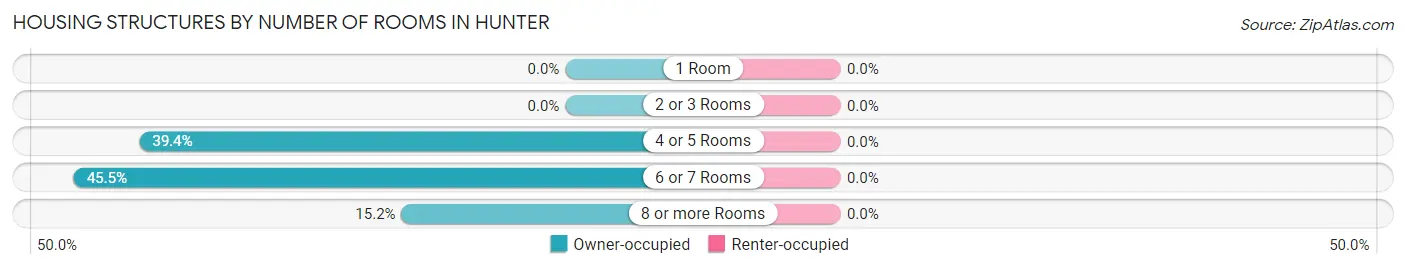
| Number of Rooms | Owner-occupied | Renter-occupied |
| 1 Room | 0 (0.0%) | 0 (0.0%) |
| 2 or 3 Rooms | 0 (0.0%) | 0 (0.0%) |
| 4 or 5 Rooms | 13 (39.4%) | 0 (0.0%) |
| 6 or 7 Rooms | 15 (45.5%) | 0 (0.0%) |
| 8 or more Rooms | 5 (15.1%) | 0 (0.0%) |
| Total | 33 (100.0%) | 0 (0.0%) |
Housing Structure by Heating Type in Hunter
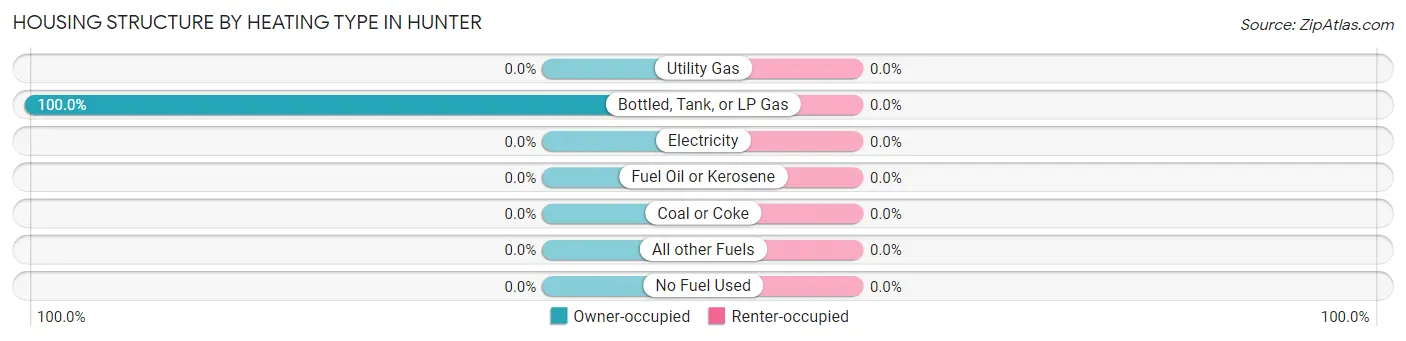
| Heating Type | Owner-occupied | Renter-occupied |
| Utility Gas | 0 (0.0%) | 0 (0.0%) |
| Bottled, Tank, or LP Gas | 33 (100.0%) | 0 (0.0%) |
| Electricity | 0 (0.0%) | 0 (0.0%) |
| Fuel Oil or Kerosene | 0 (0.0%) | 0 (0.0%) |
| Coal or Coke | 0 (0.0%) | 0 (0.0%) |
| All other Fuels | 0 (0.0%) | 0 (0.0%) |
| No Fuel Used | 0 (0.0%) | 0 (0.0%) |
| Total | 33 (100.0%) | 0 (0.0%) |
Household Vehicle Usage in Hunter
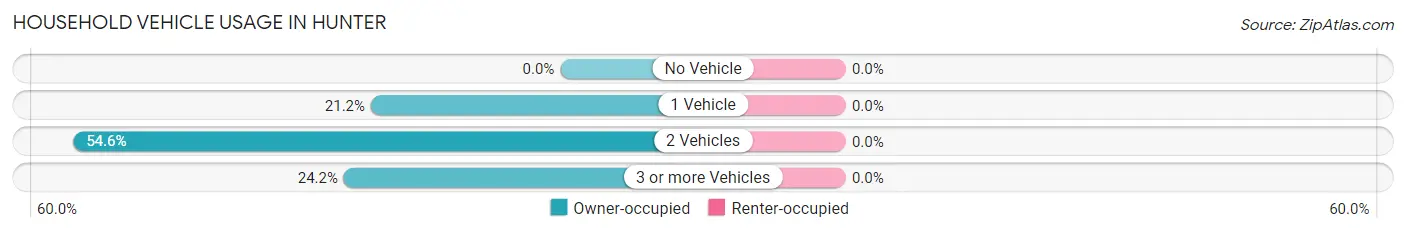
| Vehicles per Household | Owner-occupied | Renter-occupied |
| No Vehicle | 0 (0.0%) | 0 (0.0%) |
| 1 Vehicle | 7 (21.2%) | 0 (0.0%) |
| 2 Vehicles | 18 (54.5%) | 0 (0.0%) |
| 3 or more Vehicles | 8 (24.2%) | 0 (0.0%) |
| Total | 33 (100.0%) | 0 (0.0%) |
Real Estate & Mortgages in Hunter
Real Estate and Mortgage Overview in Hunter
| Characteristic | Without Mortgage | With Mortgage |
| Housing Units | 25 | 8 |
| Median Property Value | $27,100 | $0 |
| Median Household Income | - | - |
| Monthly Housing Costs | $331 | $0 |
| Real Estate Taxes | $465 | $0 |
Property Value by Mortgage Status in Hunter
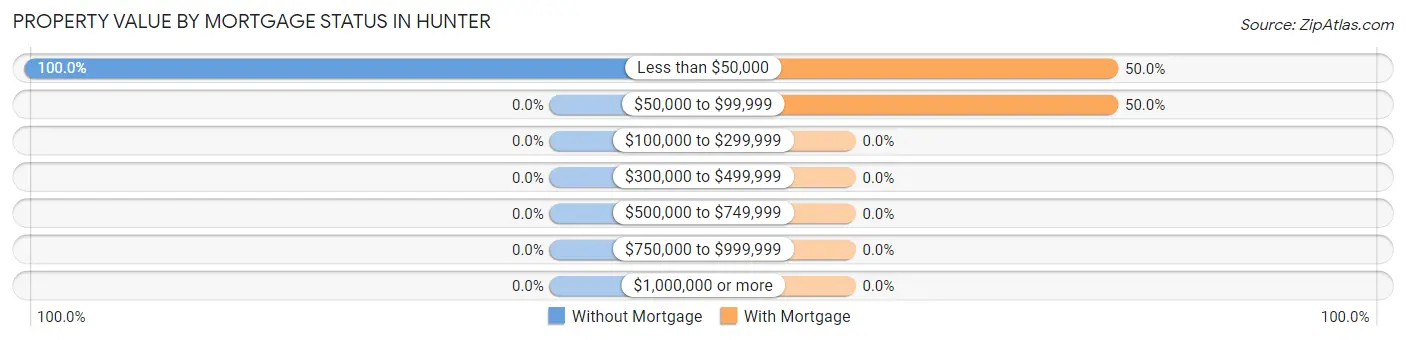
| Property Value | Without Mortgage | With Mortgage |
| Less than $50,000 | 25 (100.0%) | 4 (50.0%) |
| $50,000 to $99,999 | 0 (0.0%) | 4 (50.0%) |
| $100,000 to $299,999 | 0 (0.0%) | 0 (0.0%) |
| $300,000 to $499,999 | 0 (0.0%) | 0 (0.0%) |
| $500,000 to $749,999 | 0 (0.0%) | 0 (0.0%) |
| $750,000 to $999,999 | 0 (0.0%) | 0 (0.0%) |
| $1,000,000 or more | 0 (0.0%) | 0 (0.0%) |
| Total | 25 (100.0%) | 8 (100.0%) |
Household Income by Mortgage Status in Hunter
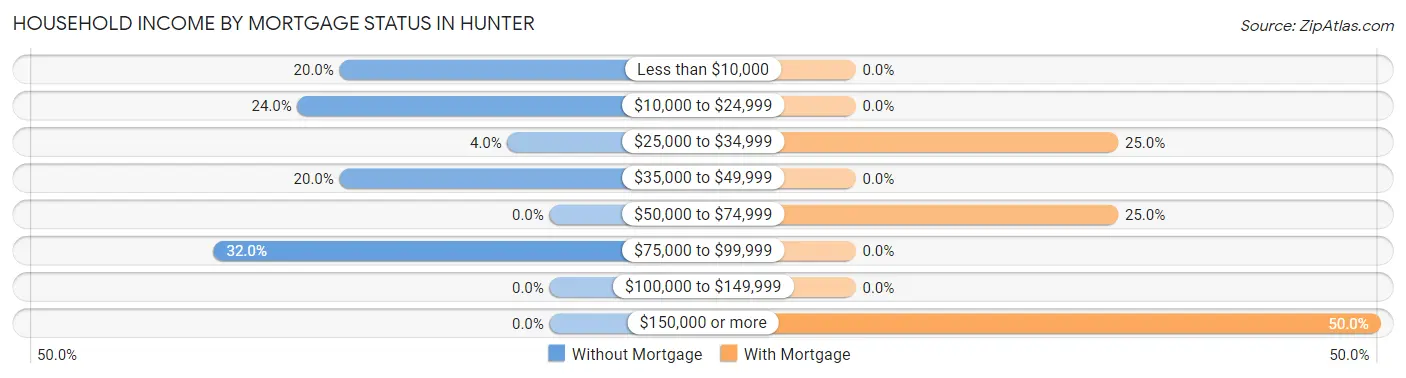
| Household Income | Without Mortgage | With Mortgage |
| Less than $10,000 | 5 (20.0%) | 0 (0.0%) |
| $10,000 to $24,999 | 6 (24.0%) | 0 (0.0%) |
| $25,000 to $34,999 | 1 (4.0%) | 2 (25.0%) |
| $35,000 to $49,999 | 5 (20.0%) | 0 (0.0%) |
| $50,000 to $74,999 | 0 (0.0%) | 2 (25.0%) |
| $75,000 to $99,999 | 8 (32.0%) | 0 (0.0%) |
| $100,000 to $149,999 | 0 (0.0%) | 0 (0.0%) |
| $150,000 or more | 0 (0.0%) | 4 (50.0%) |
| Total | 25 (100.0%) | 8 (100.0%) |
Property Value to Household Income Ratio in Hunter
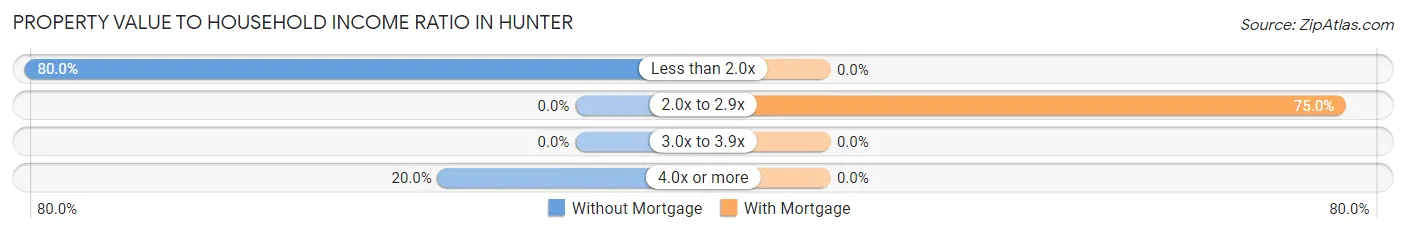
| Value-to-Income Ratio | Without Mortgage | With Mortgage |
| Less than 2.0x | 20 (80.0%) | 0 (0.0%) |
| 2.0x to 2.9x | 0 (0.0%) | 6 (75.0%) |
| 3.0x to 3.9x | 0 (0.0%) | 0 (0.0%) |
| 4.0x or more | 5 (20.0%) | 0 (0.0%) |
| Total | 25 (100.0%) | 8 (100.0%) |
Real Estate Taxes by Mortgage Status in Hunter
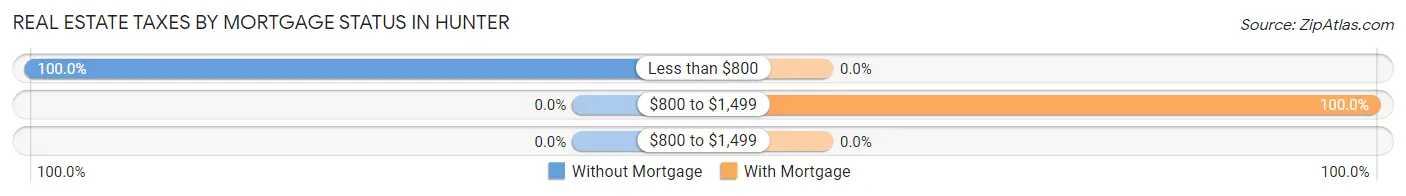
| Property Taxes | Without Mortgage | With Mortgage |
| Less than $800 | 25 (100.0%) | 0 (0.0%) |
| $800 to $1,499 | 0 (0.0%) | 8 (100.0%) |
| $800 to $1,499 | 0 (0.0%) | 0 (0.0%) |
| Total | 25 (100.0%) | 8 (100.0%) |
Health & Disability in Hunter
Health Insurance Coverage by Age in Hunter
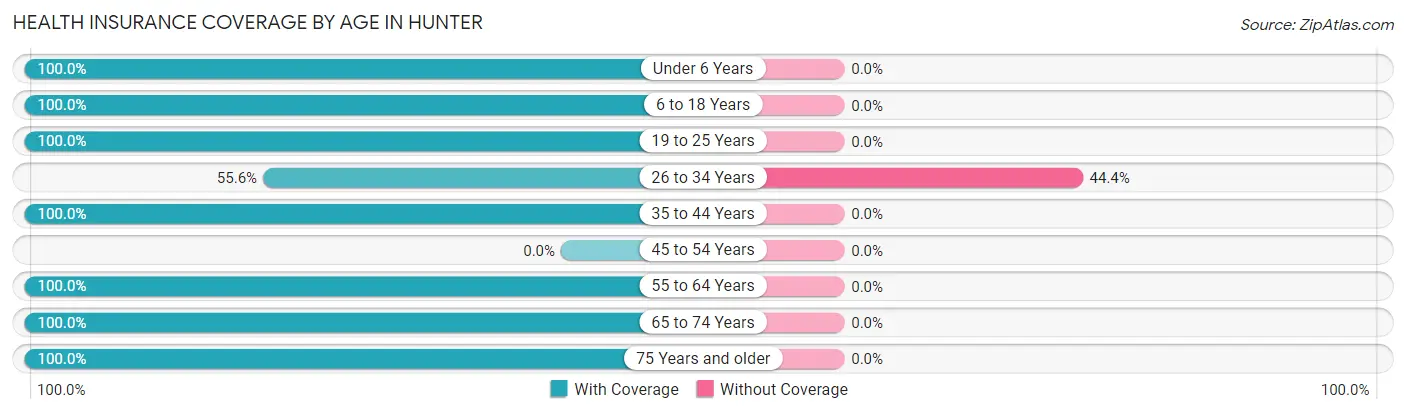
| Age Bracket | With Coverage | Without Coverage |
| Under 6 Years | 7 (100.0%) | 0 (0.0%) |
| 6 to 18 Years | 26 (100.0%) | 0 (0.0%) |
| 19 to 25 Years | 20 (100.0%) | 0 (0.0%) |
| 26 to 34 Years | 10 (55.6%) | 8 (44.4%) |
| 35 to 44 Years | 9 (100.0%) | 0 (0.0%) |
| 45 to 54 Years | 0 (0.0%) | 0 (0.0%) |
| 55 to 64 Years | 12 (100.0%) | 0 (0.0%) |
| 65 to 74 Years | 13 (100.0%) | 0 (0.0%) |
| 75 Years and older | 3 (100.0%) | 0 (0.0%) |
| Total | 100 (92.6%) | 8 (7.4%) |
Health Insurance Coverage by Citizenship Status in Hunter
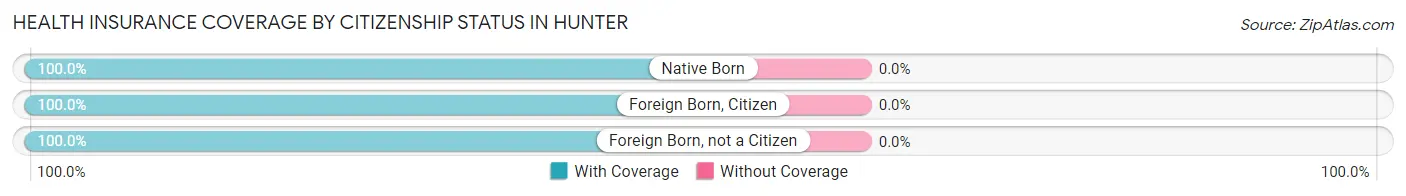
| Citizenship Status | With Coverage | Without Coverage |
| Native Born | 7 (100.0%) | 0 (0.0%) |
| Foreign Born, Citizen | 26 (100.0%) | 0 (0.0%) |
| Foreign Born, not a Citizen | 20 (100.0%) | 0 (0.0%) |
Health Insurance Coverage by Household Income in Hunter
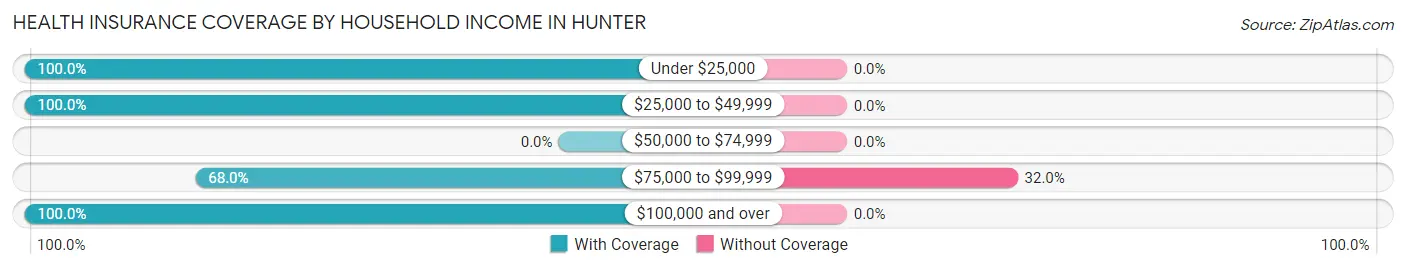
| Household Income | With Coverage | Without Coverage |
| Under $25,000 | 58 (100.0%) | 0 (0.0%) |
| $25,000 to $49,999 | 17 (100.0%) | 0 (0.0%) |
| $50,000 to $74,999 | 0 (0.0%) | 0 (0.0%) |
| $75,000 to $99,999 | 17 (68.0%) | 8 (32.0%) |
| $100,000 and over | 8 (100.0%) | 0 (0.0%) |
Public vs Private Health Insurance Coverage by Age in Hunter
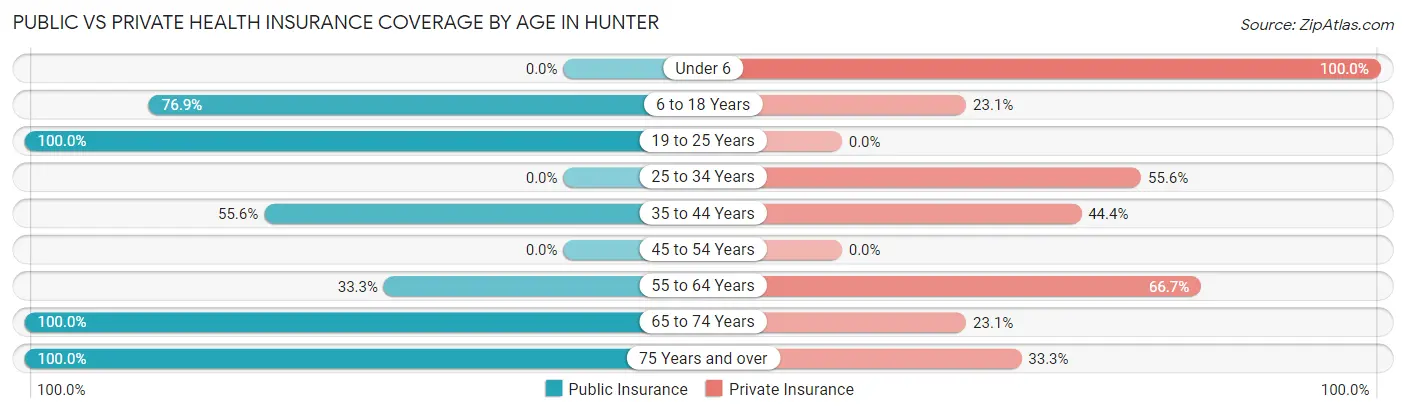
| Age Bracket | Public Insurance | Private Insurance |
| Under 6 | 0 (0.0%) | 7 (100.0%) |
| 6 to 18 Years | 20 (76.9%) | 6 (23.1%) |
| 19 to 25 Years | 20 (100.0%) | 0 (0.0%) |
| 25 to 34 Years | 0 (0.0%) | 10 (55.6%) |
| 35 to 44 Years | 5 (55.6%) | 4 (44.4%) |
| 45 to 54 Years | 0 (0.0%) | 0 (0.0%) |
| 55 to 64 Years | 4 (33.3%) | 8 (66.7%) |
| 65 to 74 Years | 13 (100.0%) | 3 (23.1%) |
| 75 Years and over | 3 (100.0%) | 1 (33.3%) |
| Total | 65 (60.2%) | 39 (36.1%) |
Disability Status by Sex by Age in Hunter
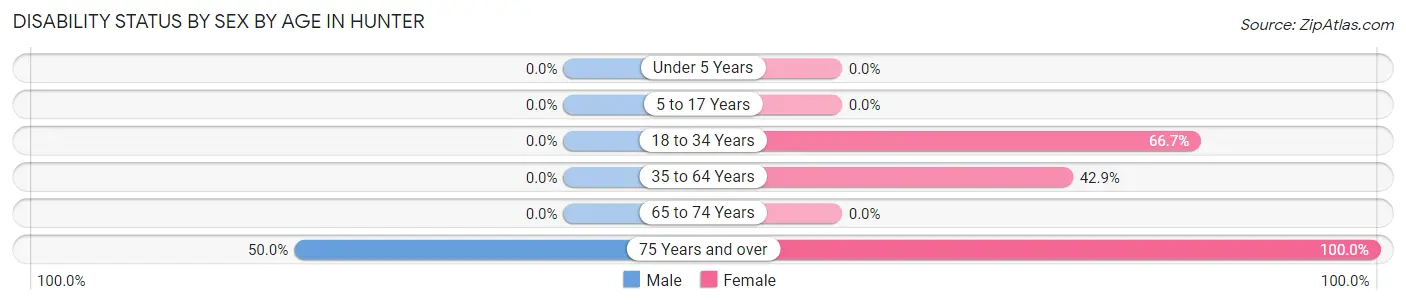
| Age Bracket | Male | Female |
| Under 5 Years | 0 (0.0%) | 0 (0.0%) |
| 5 to 17 Years | 0 (0.0%) | 0 (0.0%) |
| 18 to 34 Years | 0 (0.0%) | 20 (66.7%) |
| 35 to 64 Years | 0 (0.0%) | 6 (42.9%) |
| 65 to 74 Years | 0 (0.0%) | 0 (0.0%) |
| 75 Years and over | 1 (50.0%) | 1 (100.0%) |
Disability Class by Sex by Age in Hunter
Disability Class: Hearing Difficulty
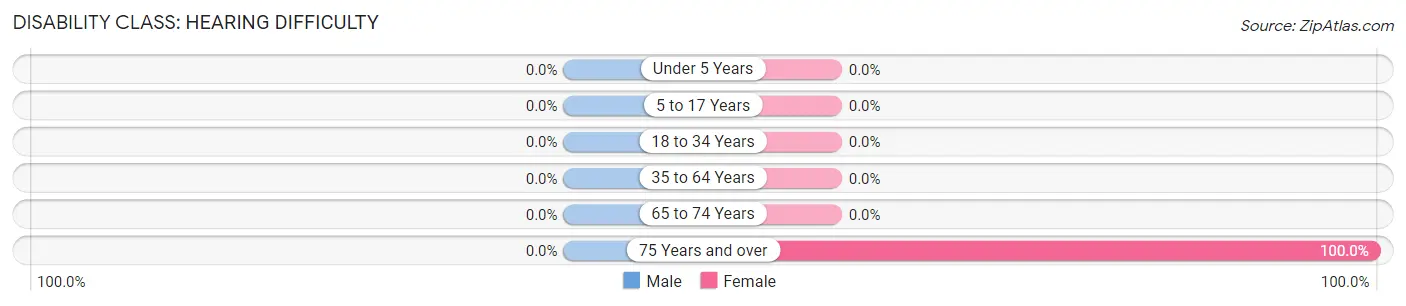
| Age Bracket | Male | Female |
| Under 5 Years | 0 (0.0%) | 0 (0.0%) |
| 5 to 17 Years | 0 (0.0%) | 0 (0.0%) |
| 18 to 34 Years | 0 (0.0%) | 0 (0.0%) |
| 35 to 64 Years | 0 (0.0%) | 0 (0.0%) |
| 65 to 74 Years | 0 (0.0%) | 0 (0.0%) |
| 75 Years and over | 0 (0.0%) | 1 (100.0%) |
Disability Class: Vision Difficulty
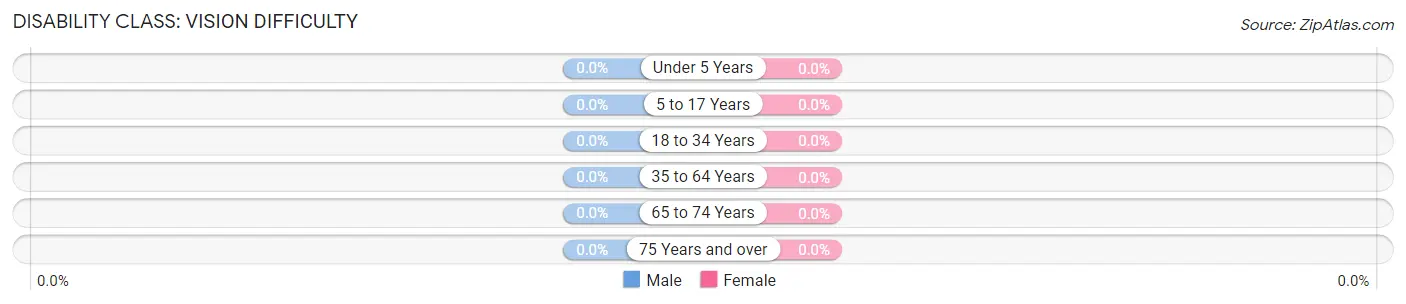
| Age Bracket | Male | Female |
| Under 5 Years | 0 (0.0%) | 0 (0.0%) |
| 5 to 17 Years | 0 (0.0%) | 0 (0.0%) |
| 18 to 34 Years | 0 (0.0%) | 0 (0.0%) |
| 35 to 64 Years | 0 (0.0%) | 0 (0.0%) |
| 65 to 74 Years | 0 (0.0%) | 0 (0.0%) |
| 75 Years and over | 0 (0.0%) | 0 (0.0%) |
Disability Class: Cognitive Difficulty
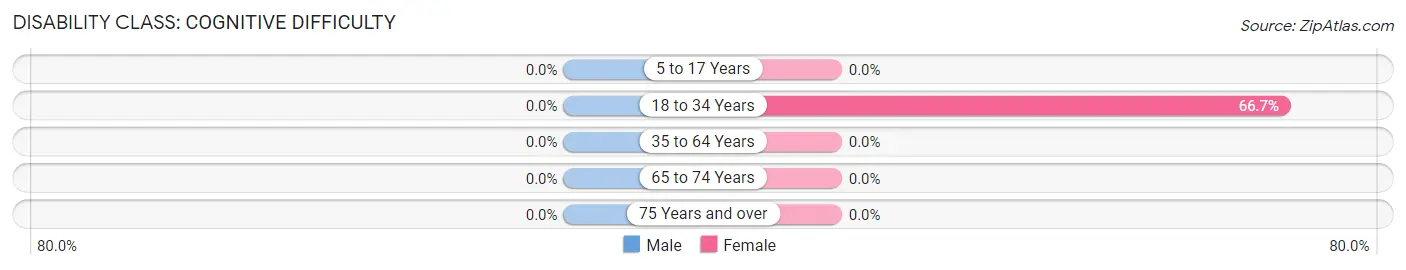
| Age Bracket | Male | Female |
| 5 to 17 Years | 0 (0.0%) | 0 (0.0%) |
| 18 to 34 Years | 0 (0.0%) | 20 (66.7%) |
| 35 to 64 Years | 0 (0.0%) | 0 (0.0%) |
| 65 to 74 Years | 0 (0.0%) | 0 (0.0%) |
| 75 Years and over | 0 (0.0%) | 0 (0.0%) |
Disability Class: Ambulatory Difficulty
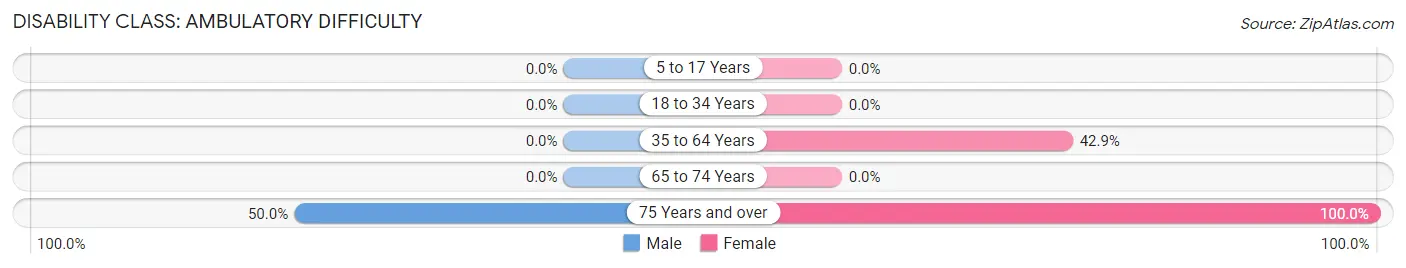
| Age Bracket | Male | Female |
| 5 to 17 Years | 0 (0.0%) | 0 (0.0%) |
| 18 to 34 Years | 0 (0.0%) | 0 (0.0%) |
| 35 to 64 Years | 0 (0.0%) | 6 (42.9%) |
| 65 to 74 Years | 0 (0.0%) | 0 (0.0%) |
| 75 Years and over | 1 (50.0%) | 1 (100.0%) |
Disability Class: Self-Care Difficulty
| Age Bracket | Male | Female |
| 5 to 17 Years | 0 (0.0%) | 0 (0.0%) |
| 18 to 34 Years | 0 (0.0%) | 0 (0.0%) |
| 35 to 64 Years | 0 (0.0%) | 0 (0.0%) |
| 65 to 74 Years | 0 (0.0%) | 0 (0.0%) |
| 75 Years and over | 0 (0.0%) | 0 (0.0%) |
Technology Access in Hunter
Computing Device Access in Hunter
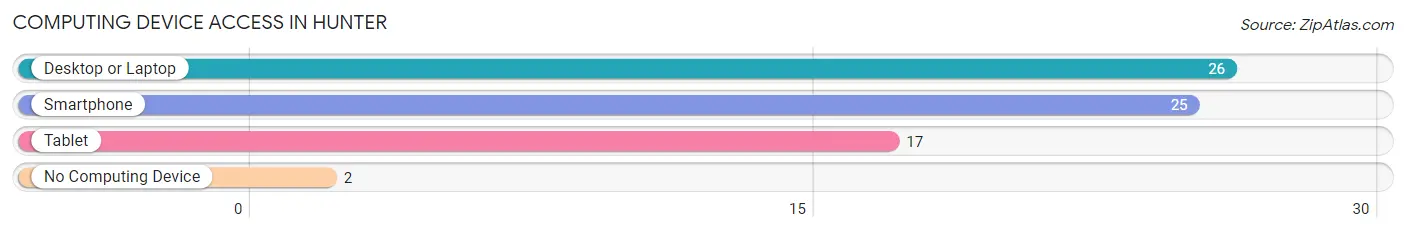
| Device Type | # Households | % Households |
| Desktop or Laptop | 26 | 78.8% |
| Smartphone | 25 | 75.8% |
| Tablet | 17 | 51.5% |
| No Computing Device | 2 | 6.1% |
| Total | 33 | 100.0% |
Internet Access in Hunter
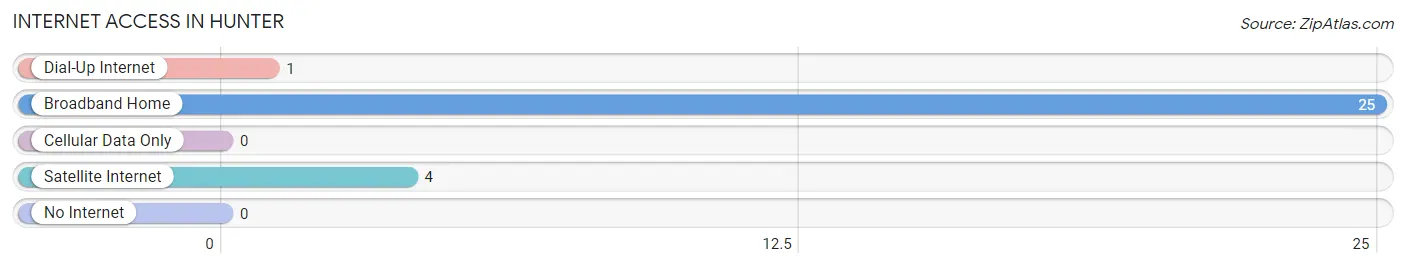
| Internet Type | # Households | % Households |
| Dial-Up Internet | 1 | 3.0% |
| Broadband Home | 25 | 75.8% |
| Cellular Data Only | 0 | 0.0% |
| Satellite Internet | 4 | 12.1% |
| No Internet | 0 | 0.0% |
| Total | 33 | 100.0% |
Hunter Summary
Hunter, Kansas is a small town located in the northwest corner of the state, in the county of Sherman. It is situated on the banks of the Little Arkansas River, and is surrounded by rolling hills and prairies. The town was founded in 1887, and has a population of just over 500 people.
Hunter is a rural community, and the economy is largely based on agriculture. The town is home to several farms, and the surrounding area is used for cattle and sheep grazing. The town also has a few small businesses, including a grocery store, a hardware store, and a few restaurants.
The geography of Hunter is typical of the Great Plains region. The town is located in the High Plains, and is surrounded by flat, grassy plains. The Little Arkansas River runs through the town, and is a popular spot for fishing and swimming. The town is also home to several small lakes, which are used for recreational activities.
The climate in Hunter is typical of the Great Plains region. Summers are hot and dry, with temperatures reaching into the 90s. Winters are cold and dry, with temperatures often dropping below zero. The town receives an average of 18 inches of precipitation per year.
The population of Hunter is predominantly white, with a small percentage of African Americans and Hispanics. The median household income is around $35,000, and the median home value is around $90,000. The town has a low unemployment rate, and the majority of the population is employed in the agricultural sector.
Hunter is served by the Sherman County School District, which includes two elementary schools, one middle school, and one high school. The town also has a public library, and several churches. The town is home to a few small parks, and is a popular destination for outdoor activities such as camping, fishing, and hunting.
Hunter is a small, rural town with a rich history and a strong sense of community. The town is home to a diverse population, and the economy is largely based on agriculture. The town is surrounded by beautiful scenery, and is a popular destination for outdoor activities. Hunter is a great place to live, work, and raise a family.
Common Questions
What is Per Capita Income in Hunter?
Per Capita income in Hunter is $15,600.
What is the Median Household income in Hunter?
Median Household Income in Hunter is $36,563.
What is Inequality or Gini Index in Hunter?
Inequality or Gini Index in Hunter is 0.40.
What is the Total Population of Hunter?
Total Population of Hunter is 108.
What is the Total Male Population of Hunter?
Total Male Population of Hunter is 34.
What is the Total Female Population of Hunter?
Total Female Population of Hunter is 74.
What is the Ratio of Males per 100 Females in Hunter?
There are 45.95 Males per 100 Females in Hunter.
What is the Ratio of Females per 100 Males in Hunter?
There are 217.65 Females per 100 Males in Hunter.
What is the Median Population Age in Hunter?
Median Population Age in Hunter is 29.1 Years.
What is the Average Family Size in Hunter
Average Family Size in Hunter is 3.8 People.
What is the Average Household Size in Hunter
Average Household Size in Hunter is 3.3 People.
How Large is the Labor Force in Hunter?
There are 21 People in the Labor Forcein in Hunter.
What is the Percentage of People in the Labor Force in Hunter?
28.0% of People are in the Labor Force in Hunter.