Fishers, IN Map & Demographics
Fishers Map

Fishers Overview
$56,089
PER CAPITA INCOME
$144,626
AVG FAMILY INCOME
$126,548
AVG HOUSEHOLD INCOME
34.8%
WAGE / INCOME GAP [ % ]
65.2¢/ $1
WAGE / INCOME GAP [ $ ]
0.40
INEQUALITY / GINI INDEX
99,041
TOTAL POPULATION
48,911
MALE POPULATION
50,130
FEMALE POPULATION
97.57
MALES / 100 FEMALES
102.49
FEMALES / 100 MALES
37.1
MEDIAN AGE
3.2
AVG FAMILY SIZE
2.8
AVG HOUSEHOLD SIZE
54,832
LABOR FORCE [ PEOPLE ]
73.0%
PERCENT IN LABOR FORCE
2.5%
UNEMPLOYMENT RATE
Fishers Area Codes
Income in Fishers
Income Overview in Fishers
Per Capita Income in Fishers is $56,089, while median incomes of families and households are $144,626 and $126,548 respectively.
| Characteristic | Number | Measure |
| Per Capita Income | 99,041 | $56,089 |
| Median Family Income | 27,235 | $144,626 |
| Mean Family Income | 27,235 | $173,998 |
| Median Household Income | 35,747 | $126,548 |
| Mean Household Income | 35,747 | $153,245 |
| Income Deficit | 27,235 | $0 |
| Wage / Income Gap (%) | 99,041 | 34.83% |
| Wage / Income Gap ($) | 99,041 | 65.17¢ per $1 |
| Gini / Inequality Index | 99,041 | 0.40 |
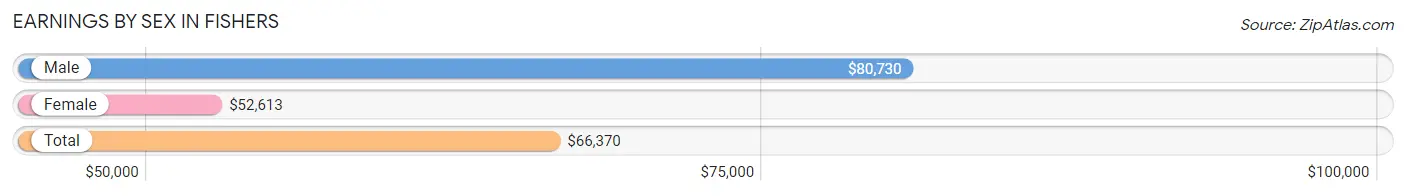
Earnings by Sex in Fishers
Average Earnings in Fishers are $66,370, $80,730 for men and $52,613 for women, a difference of 34.8%.
| Sex | Number | Average Earnings |
| Male | 31,248 (55.0%) | $80,730 |
| Female | 25,539 (45.0%) | $52,613 |
| Total | 56,787 (100.0%) | $66,370 |
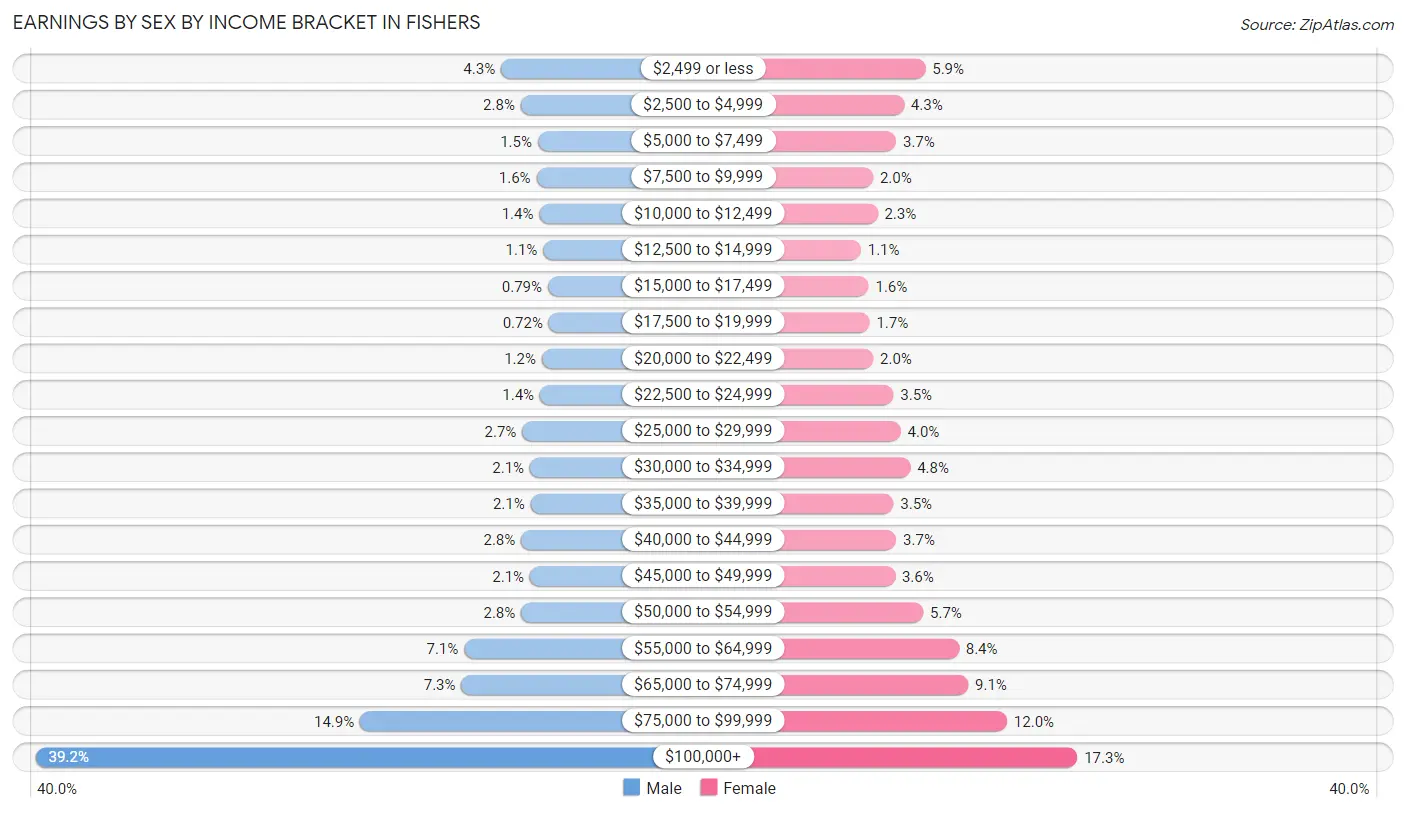
Earnings by Sex by Income Bracket in Fishers
The most common earnings brackets in Fishers are $100,000+ for men (12,244 | 39.2%) and $100,000+ for women (4,410 | 17.3%).
| Income | Male | Female |
| $2,499 or less | 1,345 (4.3%) | 1,501 (5.9%) |
| $2,500 to $4,999 | 880 (2.8%) | 1,094 (4.3%) |
| $5,000 to $7,499 | 480 (1.5%) | 943 (3.7%) |
| $7,500 to $9,999 | 513 (1.6%) | 501 (2.0%) |
| $10,000 to $12,499 | 446 (1.4%) | 588 (2.3%) |
| $12,500 to $14,999 | 356 (1.1%) | 268 (1.1%) |
| $15,000 to $17,499 | 246 (0.8%) | 416 (1.6%) |
| $17,500 to $19,999 | 224 (0.7%) | 434 (1.7%) |
| $20,000 to $22,499 | 388 (1.2%) | 502 (2.0%) |
| $22,500 to $24,999 | 432 (1.4%) | 891 (3.5%) |
| $25,000 to $29,999 | 848 (2.7%) | 1,029 (4.0%) |
| $30,000 to $34,999 | 666 (2.1%) | 1,214 (4.8%) |
| $35,000 to $39,999 | 650 (2.1%) | 892 (3.5%) |
| $40,000 to $44,999 | 872 (2.8%) | 946 (3.7%) |
| $45,000 to $49,999 | 666 (2.1%) | 922 (3.6%) |
| $50,000 to $54,999 | 872 (2.8%) | 1,460 (5.7%) |
| $55,000 to $64,999 | 2,205 (7.1%) | 2,142 (8.4%) |
| $65,000 to $74,999 | 2,271 (7.3%) | 2,322 (9.1%) |
| $75,000 to $99,999 | 4,644 (14.9%) | 3,064 (12.0%) |
| $100,000+ | 12,244 (39.2%) | 4,410 (17.3%) |
| Total | 31,248 (100.0%) | 25,539 (100.0%) |
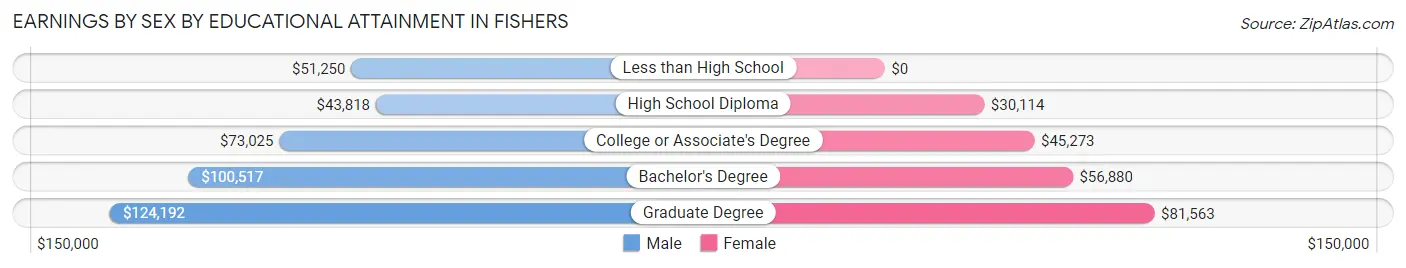
Earnings by Sex by Educational Attainment in Fishers
Average earnings in Fishers are $94,966 for men and $57,068 for women, a difference of 39.9%. Men with an educational attainment of graduate degree enjoy the highest average annual earnings of $124,192, while those with high school diploma education earn the least with $43,818. Women with an educational attainment of graduate degree earn the most with the average annual earnings of $81,563, while those with high school diploma education have the smallest earnings of $30,114.
| Educational Attainment | Male Income | Female Income |
| Less than High School | $51,250 | $0 |
| High School Diploma | $43,818 | $30,114 |
| College or Associate's Degree | $73,025 | $45,273 |
| Bachelor's Degree | $100,517 | $56,880 |
| Graduate Degree | $124,192 | $81,563 |
| Total | $94,966 | $57,068 |
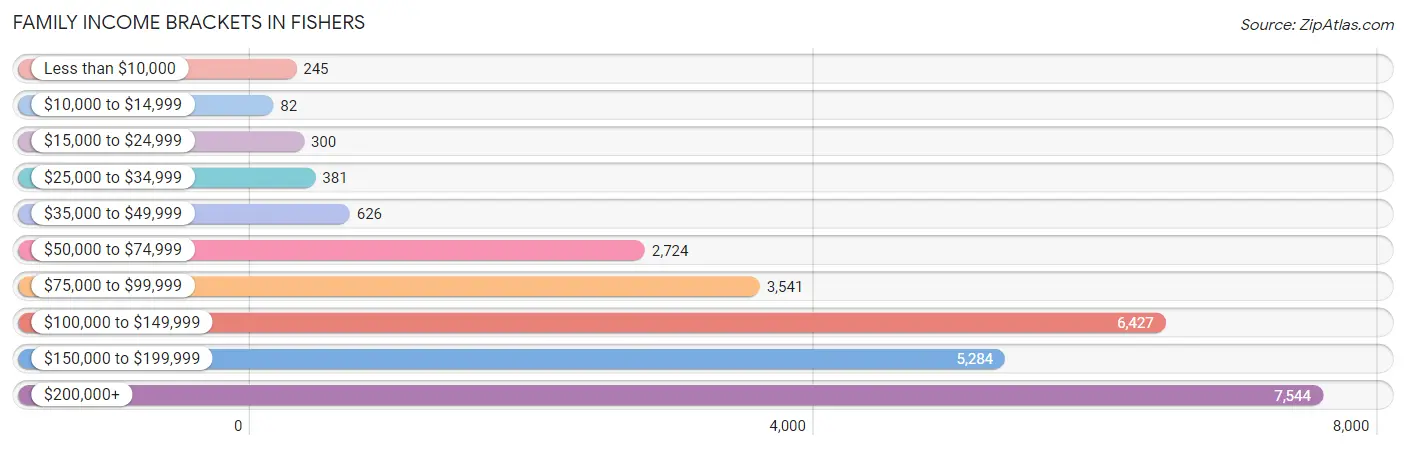
Family Income in Fishers
Family Income Brackets in Fishers
According to the Fishers family income data, there are 7,544 families falling into the $200,000+ income range, which is the most common income bracket and makes up 27.7% of all families. Conversely, the $10,000 to $14,999 income bracket is the least frequent group with only 82 families (0.3%) belonging to this category.
| Income Bracket | # Families | % Families |
| Less than $10,000 | 245 | 0.9% |
| $10,000 to $14,999 | 82 | 0.3% |
| $15,000 to $24,999 | 300 | 1.1% |
| $25,000 to $34,999 | 381 | 1.4% |
| $35,000 to $49,999 | 626 | 2.3% |
| $50,000 to $74,999 | 2,724 | 10.0% |
| $75,000 to $99,999 | 3,541 | 13.0% |
| $100,000 to $149,999 | 6,427 | 23.6% |
| $150,000 to $199,999 | 5,284 | 19.4% |
| $200,000+ | 7,544 | 27.7% |
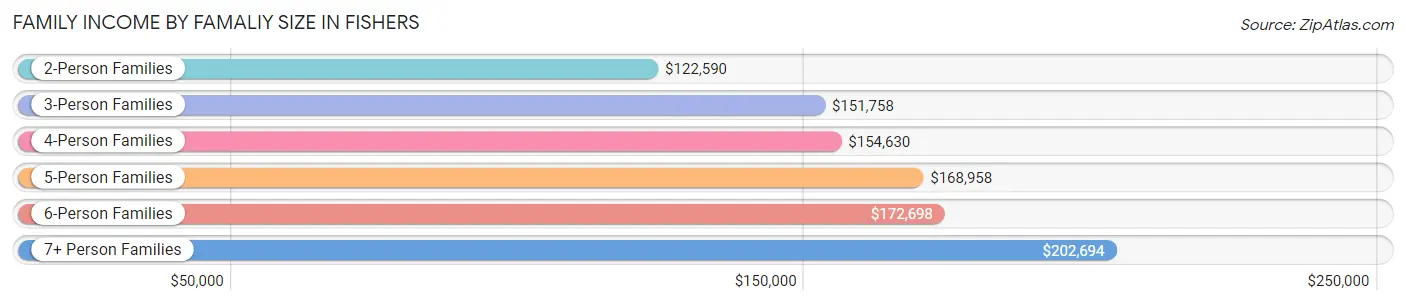
Family Income by Famaliy Size in Fishers
7+ person families (444 | 1.6%) account for the highest median family income in Fishers with $202,694 per family, while 2-person families (10,292 | 37.8%) have the highest median income of $61,295 per family member.
| Income Bracket | # Families | Median Income |
| 2-Person Families | 10,292 (37.8%) | $122,590 |
| 3-Person Families | 6,617 (24.3%) | $151,758 |
| 4-Person Families | 6,571 (24.1%) | $154,630 |
| 5-Person Families | 2,661 (9.8%) | $168,958 |
| 6-Person Families | 650 (2.4%) | $172,698 |
| 7+ Person Families | 444 (1.6%) | $202,694 |
| Total | 27,235 (100.0%) | $144,626 |
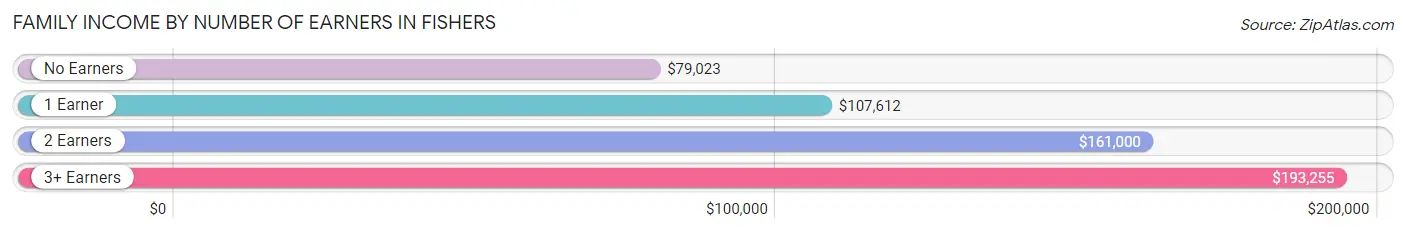
Family Income by Number of Earners in Fishers
The median family income in Fishers is $144,626, with families comprising 3+ earners (3,479) having the highest median family income of $193,255, while families with no earners (2,481) have the lowest median family income of $79,023, accounting for 12.8% and 9.1% of families, respectively.
| Number of Earners | # Families | Median Income |
| No Earners | 2,481 (9.1%) | $79,023 |
| 1 Earner | 6,649 (24.4%) | $107,612 |
| 2 Earners | 14,626 (53.7%) | $161,000 |
| 3+ Earners | 3,479 (12.8%) | $193,255 |
| Total | 27,235 (100.0%) | $144,626 |
Household Income in Fishers
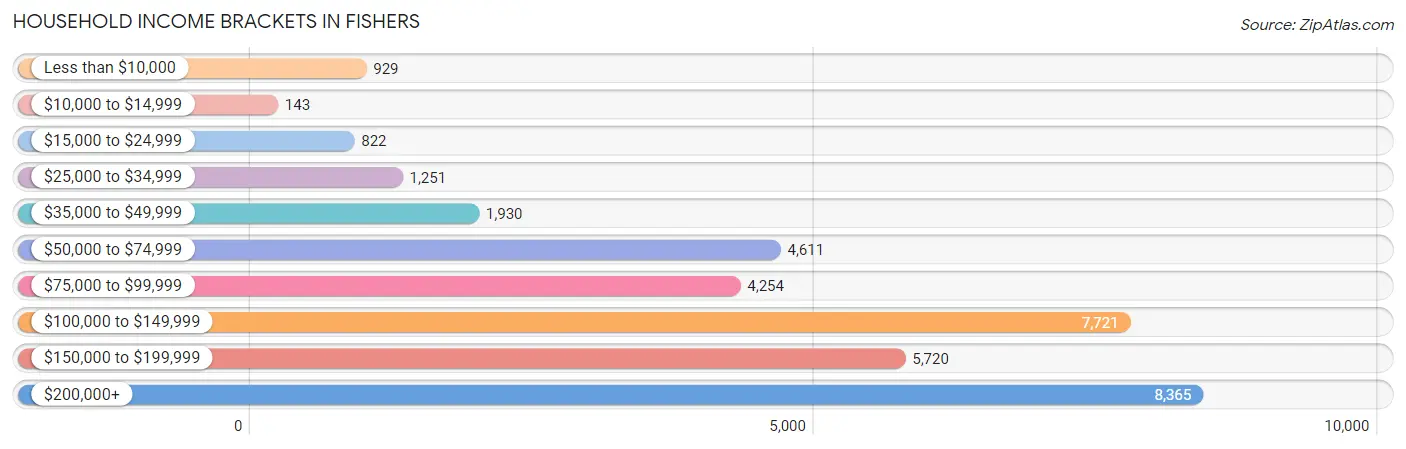
Household Income Brackets in Fishers
With 8,365 households falling in the category, the $200,000+ income range is the most frequent in Fishers, accounting for 23.4% of all households. In contrast, only 143 households (0.4%) fall into the $10,000 to $14,999 income bracket, making it the least populous group.
| Income Bracket | # Households | % Households |
| Less than $10,000 | 929 | 2.6% |
| $10,000 to $14,999 | 143 | 0.4% |
| $15,000 to $24,999 | 822 | 2.3% |
| $25,000 to $34,999 | 1,251 | 3.5% |
| $35,000 to $49,999 | 1,930 | 5.4% |
| $50,000 to $74,999 | 4,611 | 12.9% |
| $75,000 to $99,999 | 4,254 | 11.9% |
| $100,000 to $149,999 | 7,721 | 21.6% |
| $150,000 to $199,999 | 5,720 | 16.0% |
| $200,000+ | 8,365 | 23.4% |
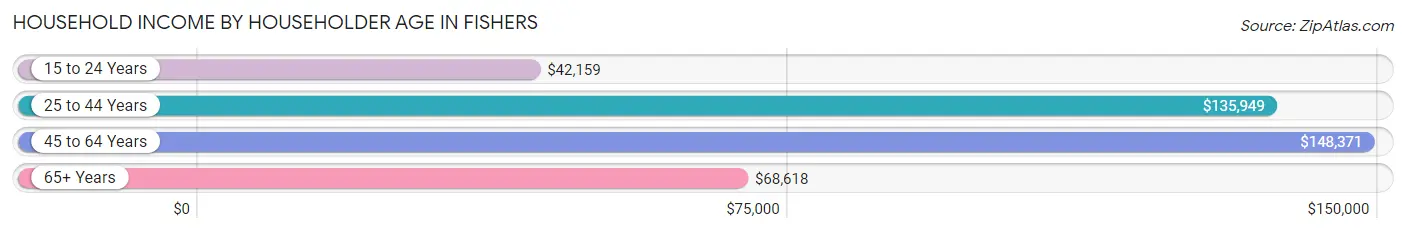
Household Income by Householder Age in Fishers
The median household income in Fishers is $126,548, with the highest median household income of $148,371 found in the 45 to 64 years age bracket for the primary householder. A total of 13,985 households (39.1%) fall into this category. Meanwhile, the 15 to 24 years age bracket for the primary householder has the lowest median household income of $42,159, with 631 households (1.8%) in this group.
| Income Bracket | # Households | Median Income |
| 15 to 24 Years | 631 (1.8%) | $42,159 |
| 25 to 44 Years | 14,943 (41.8%) | $135,949 |
| 45 to 64 Years | 13,985 (39.1%) | $148,371 |
| 65+ Years | 6,188 (17.3%) | $68,618 |
| Total | 35,747 (100.0%) | $126,548 |
Poverty in Fishers
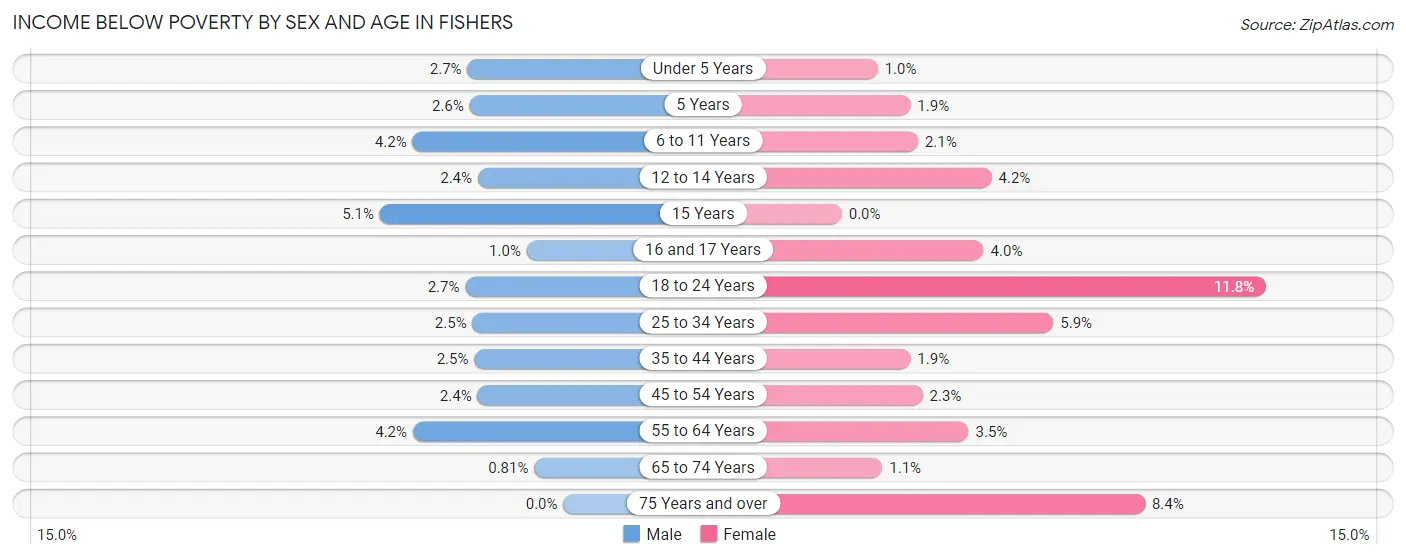
Income Below Poverty by Sex and Age in Fishers
With 2.7% poverty level for males and 3.6% for females among the residents of Fishers, 15 year old males and 18 to 24 year old females are the most vulnerable to poverty, with 59 males (5.1%) and 407 females (11.8%) in their respective age groups living below the poverty level.
| Age Bracket | Male | Female |
| Under 5 Years | 73 (2.7%) | 31 (1.0%) |
| 5 Years | 18 (2.6%) | 11 (1.9%) |
| 6 to 11 Years | 202 (4.2%) | 107 (2.1%) |
| 12 to 14 Years | 58 (2.4%) | 98 (4.2%) |
| 15 Years | 59 (5.1%) | 0 (0.0%) |
| 16 and 17 Years | 16 (1.0%) | 64 (4.0%) |
| 18 to 24 Years | 122 (2.7%) | 407 (11.8%) |
| 25 to 34 Years | 132 (2.5%) | 351 (5.9%) |
| 35 to 44 Years | 214 (2.5%) | 153 (1.9%) |
| 45 to 54 Years | 169 (2.4%) | 171 (2.2%) |
| 55 to 64 Years | 236 (4.2%) | 184 (3.5%) |
| 65 to 74 Years | 25 (0.8%) | 41 (1.1%) |
| 75 Years and over | 0 (0.0%) | 206 (8.4%) |
| Total | 1,324 (2.7%) | 1,824 (3.6%) |
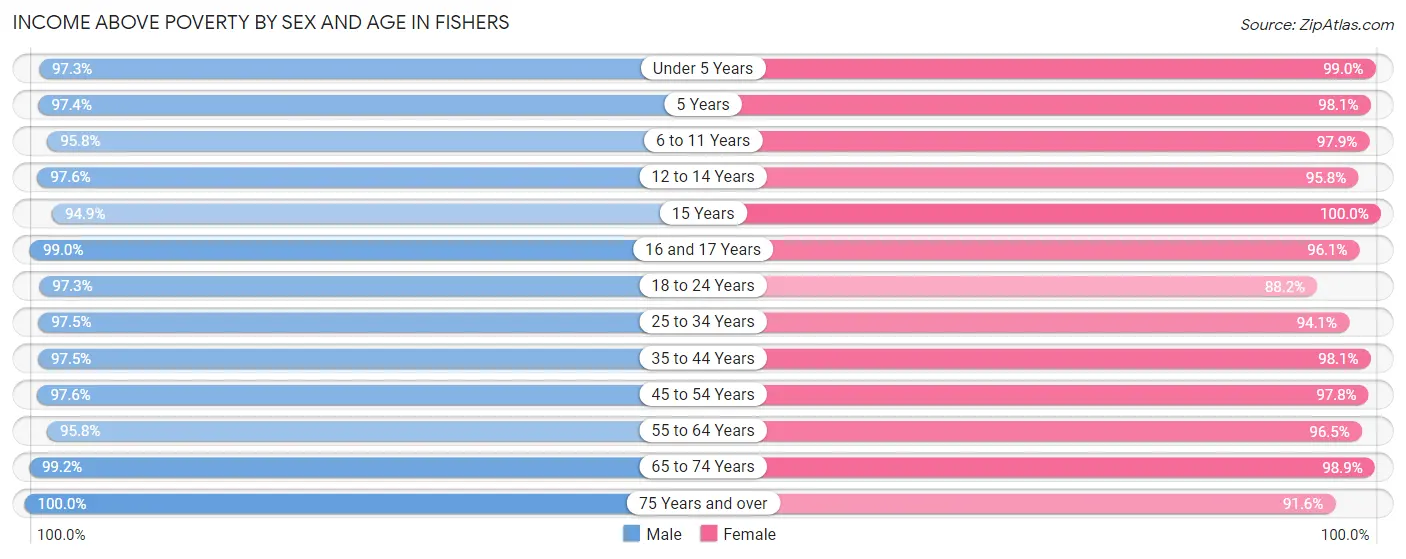
Income Above Poverty by Sex and Age in Fishers
According to the poverty statistics in Fishers, males aged 75 years and over and females aged 15 years are the age groups that are most secure financially, with 100.0% of males and 100.0% of females in these age groups living above the poverty line.
| Age Bracket | Male | Female |
| Under 5 Years | 2,658 (97.3%) | 3,057 (99.0%) |
| 5 Years | 672 (97.4%) | 565 (98.1%) |
| 6 to 11 Years | 4,607 (95.8%) | 4,952 (97.9%) |
| 12 to 14 Years | 2,383 (97.6%) | 2,251 (95.8%) |
| 15 Years | 1,096 (94.9%) | 957 (100.0%) |
| 16 and 17 Years | 1,558 (99.0%) | 1,558 (96.1%) |
| 18 to 24 Years | 4,349 (97.3%) | 3,040 (88.2%) |
| 25 to 34 Years | 5,094 (97.5%) | 5,604 (94.1%) |
| 35 to 44 Years | 8,419 (97.5%) | 7,873 (98.1%) |
| 45 to 54 Years | 6,906 (97.6%) | 7,418 (97.8%) |
| 55 to 64 Years | 5,397 (95.8%) | 5,023 (96.5%) |
| 65 to 74 Years | 3,051 (99.2%) | 3,598 (98.9%) |
| 75 Years and over | 1,300 (100.0%) | 2,234 (91.6%) |
| Total | 47,490 (97.3%) | 48,130 (96.4%) |
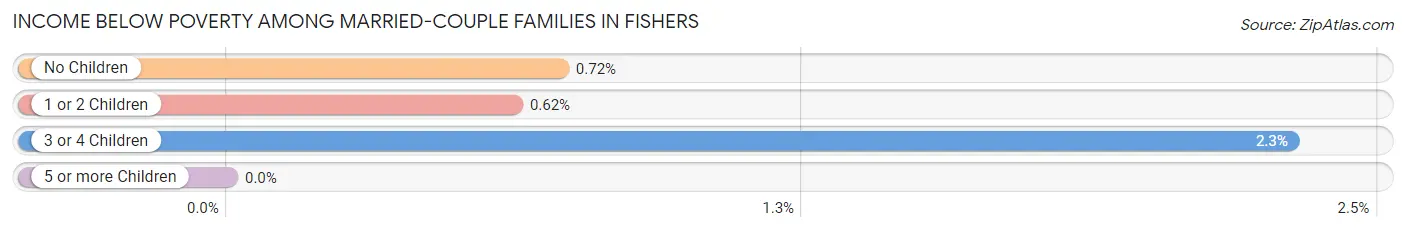
Income Below Poverty Among Married-Couple Families in Fishers
The poverty statistics for married-couple families in Fishers show that 0.8% or 192 of the total 23,468 families live below the poverty line. Families with 3 or 4 children have the highest poverty rate of 2.3%, comprising of 52 families. On the other hand, families with 5 or more children have the lowest poverty rate of 0.0%, which includes 0 families.
| Children | Above Poverty | Below Poverty |
| No Children | 10,829 (99.3%) | 78 (0.7%) |
| 1 or 2 Children | 9,934 (99.4%) | 62 (0.6%) |
| 3 or 4 Children | 2,199 (97.7%) | 52 (2.3%) |
| 5 or more Children | 314 (100.0%) | 0 (0.0%) |
| Total | 23,276 (99.2%) | 192 (0.8%) |
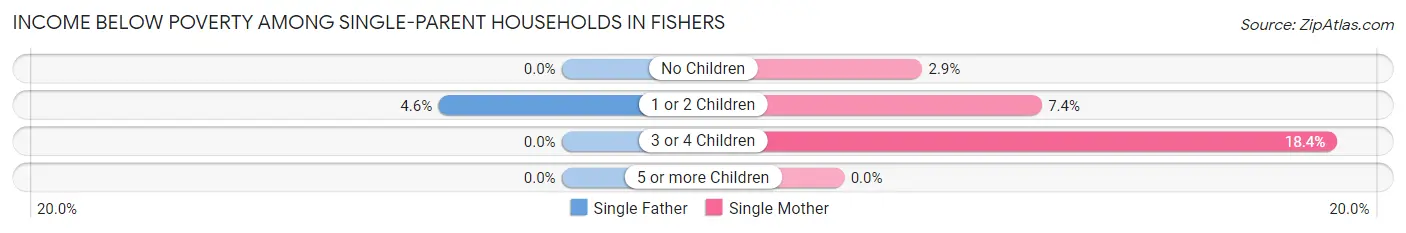
Income Below Poverty Among Single-Parent Households in Fishers
According to the poverty data in Fishers, 3.0% or 41 single-father households and 7.6% or 183 single-mother households are living below the poverty line. Among single-father households, those with 1 or 2 children have the highest poverty rate, with 41 households (4.6%) experiencing poverty. Likewise, among single-mother households, those with 3 or 4 children have the highest poverty rate, with 75 households (18.4%) falling below the poverty line.
| Children | Single Father | Single Mother |
| No Children | 0 (0.0%) | 25 (2.9%) |
| 1 or 2 Children | 41 (4.6%) | 83 (7.4%) |
| 3 or 4 Children | 0 (0.0%) | 75 (18.4%) |
| 5 or more Children | 0 (0.0%) | 0 (0.0%) |
| Total | 41 (3.0%) | 183 (7.6%) |
Income Below Poverty Among Married-Couple vs Single-Parent Households in Fishers
The poverty data for Fishers shows that 192 of the married-couple family households (0.8%) and 224 of the single-parent households (5.9%) are living below the poverty level. Within the married-couple family households, those with 3 or 4 children have the highest poverty rate, with 52 households (2.3%) falling below the poverty line. Among the single-parent households, those with 3 or 4 children have the highest poverty rate, with 75 household (16.9%) living below poverty.
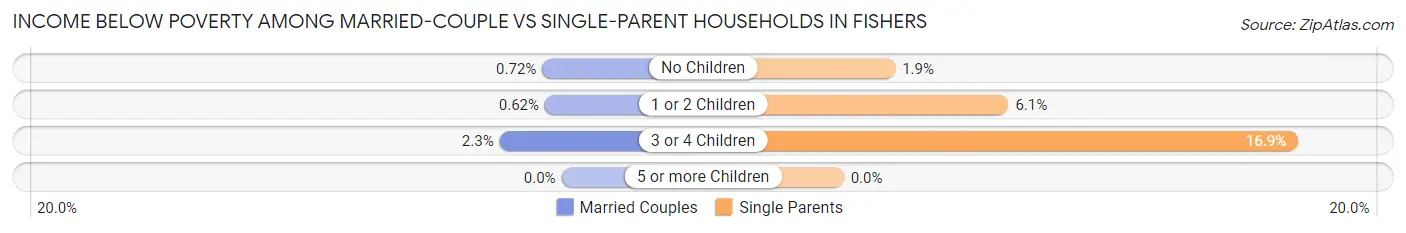
| Children | Married-Couple Families | Single-Parent Households |
| No Children | 78 (0.7%) | 25 (1.9%) |
| 1 or 2 Children | 62 (0.6%) | 124 (6.1%) |
| 3 or 4 Children | 52 (2.3%) | 75 (16.9%) |
| 5 or more Children | 0 (0.0%) | 0 (0.0%) |
| Total | 192 (0.8%) | 224 (5.9%) |
Race in Fishers
The most populous races in Fishers are White / Caucasian (81,297 | 82.1%), Asian (7,781 | 7.9%), and Black / African American (5,057 | 5.1%).
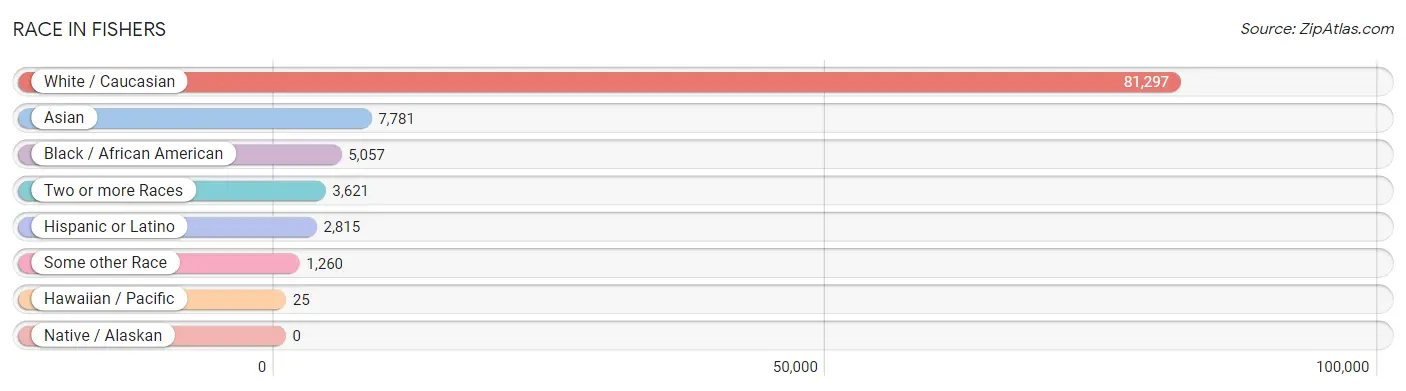
| Race | # Population | % Population |
| Asian | 7,781 | 7.9% |
| Black / African American | 5,057 | 5.1% |
| Hawaiian / Pacific | 25 | 0.0% |
| Hispanic or Latino | 2,815 | 2.8% |
| Native / Alaskan | 0 | 0.0% |
| White / Caucasian | 81,297 | 82.1% |
| Two or more Races | 3,621 | 3.7% |
| Some other Race | 1,260 | 1.3% |
| Total | 99,041 | 100.0% |
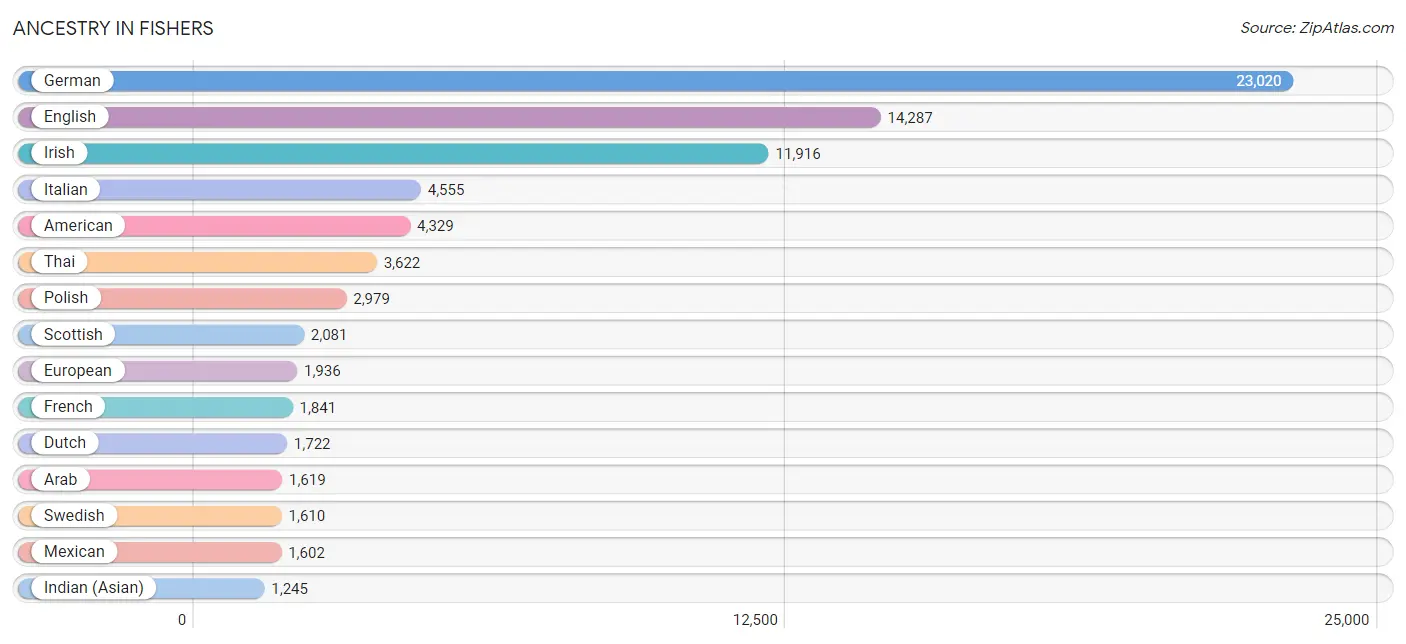
Ancestry in Fishers
The most populous ancestries reported in Fishers are German (23,020 | 23.2%), English (14,287 | 14.4%), Irish (11,916 | 12.0%), Italian (4,555 | 4.6%), and American (4,329 | 4.4%), together accounting for 58.7% of all Fishers residents.
| Ancestry | # Population | % Population |
| African | 251 | 0.3% |
| American | 4,329 | 4.4% |
| Arab | 1,619 | 1.6% |
| Armenian | 77 | 0.1% |
| Assyrian / Chaldean / Syriac | 21 | 0.0% |
| Australian | 25 | 0.0% |
| Austrian | 77 | 0.1% |
| Bahamian | 30 | 0.0% |
| Bangladeshi | 70 | 0.1% |
| Belgian | 162 | 0.2% |
| Bhutanese | 512 | 0.5% |
| Bolivian | 12 | 0.0% |
| Brazilian | 137 | 0.1% |
| British | 725 | 0.7% |
| Burmese | 572 | 0.6% |
| Canadian | 198 | 0.2% |
| Celtic | 33 | 0.0% |
| Central American | 106 | 0.1% |
| Cherokee | 52 | 0.1% |
| Chilean | 74 | 0.1% |
| Chippewa | 8 | 0.0% |
| Colombian | 66 | 0.1% |
| Croatian | 163 | 0.2% |
| Czech | 744 | 0.7% |
| Czechoslovakian | 67 | 0.1% |
| Danish | 1,024 | 1.0% |
| Dominican | 48 | 0.1% |
| Dutch | 1,722 | 1.7% |
| Eastern European | 269 | 0.3% |
| Egyptian | 196 | 0.2% |
| English | 14,287 | 14.4% |
| European | 1,936 | 1.9% |
| Filipino | 8 | 0.0% |
| Finnish | 75 | 0.1% |
| French | 1,841 | 1.9% |
| French Canadian | 762 | 0.8% |
| German | 23,020 | 23.2% |
| Greek | 486 | 0.5% |
| Guamanian / Chamorro | 25 | 0.0% |
| Guatemalan | 67 | 0.1% |
| Hungarian | 352 | 0.4% |
| Indian (Asian) | 1,245 | 1.3% |
| Indonesian | 152 | 0.2% |
| Iranian | 72 | 0.1% |
| Iraqi | 21 | 0.0% |
| Irish | 11,916 | 12.0% |
| Israeli | 30 | 0.0% |
| Italian | 4,555 | 4.6% |
| Jamaican | 41 | 0.0% |
| Japanese | 45 | 0.1% |
| Jordanian | 440 | 0.4% |
| Korean | 718 | 0.7% |
| Laotian | 303 | 0.3% |
| Latvian | 68 | 0.1% |
| Lebanese | 170 | 0.2% |
| Liberian | 18 | 0.0% |
| Lithuanian | 250 | 0.3% |
| Luxembourger | 23 | 0.0% |
| Macedonian | 50 | 0.1% |
| Malaysian | 167 | 0.2% |
| Mexican | 1,602 | 1.6% |
| Mexican American Indian | 16 | 0.0% |
| Mongolian | 26 | 0.0% |
| Moroccan | 35 | 0.0% |
| Navajo | 52 | 0.1% |
| New Zealander | 33 | 0.0% |
| Nicaraguan | 16 | 0.0% |
| Nigerian | 125 | 0.1% |
| Northern European | 49 | 0.1% |
| Norwegian | 729 | 0.7% |
| Pakistani | 20 | 0.0% |
| Palestinian | 57 | 0.1% |
| Panamanian | 23 | 0.0% |
| Pennsylvania German | 233 | 0.2% |
| Peruvian | 69 | 0.1% |
| Polish | 2,979 | 3.0% |
| Portuguese | 156 | 0.2% |
| Puerto Rican | 249 | 0.3% |
| Romanian | 325 | 0.3% |
| Russian | 351 | 0.4% |
| Scandinavian | 360 | 0.4% |
| Scotch-Irish | 386 | 0.4% |
| Scottish | 2,081 | 2.1% |
| Senegalese | 64 | 0.1% |
| Serbian | 140 | 0.1% |
| Slovak | 311 | 0.3% |
| Slovene | 72 | 0.1% |
| South American | 581 | 0.6% |
| Spanish | 48 | 0.1% |
| Sri Lankan | 898 | 0.9% |
| Subsaharan African | 458 | 0.5% |
| Swedish | 1,610 | 1.6% |
| Swiss | 592 | 0.6% |
| Syrian | 200 | 0.2% |
| Thai | 3,622 | 3.7% |
| Trinidadian and Tobagonian | 46 | 0.1% |
| Ukrainian | 154 | 0.2% |
| Venezuelan | 360 | 0.4% |
| Vietnamese | 100 | 0.1% |
| Welsh | 958 | 1.0% |
| Yugoslavian | 67 | 0.1% | View All 101 Rows |
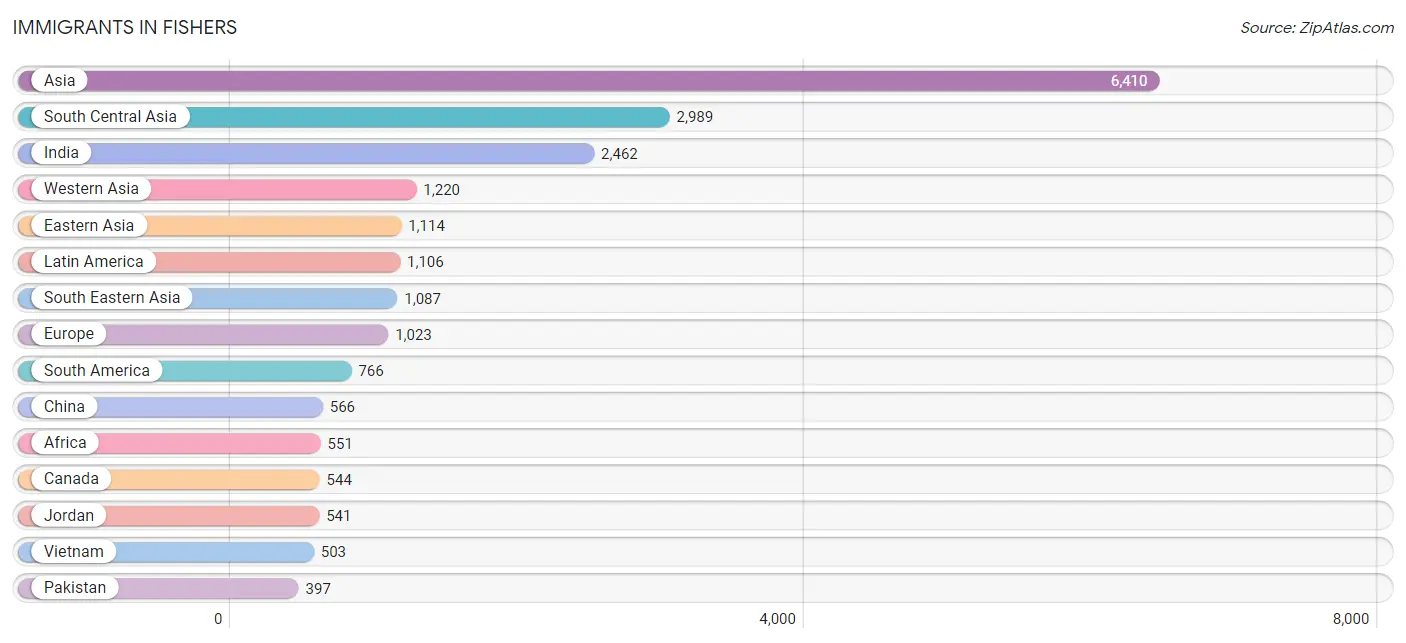
Immigrants in Fishers
The most numerous immigrant groups reported in Fishers came from Asia (6,410 | 6.5%), South Central Asia (2,989 | 3.0%), India (2,462 | 2.5%), Western Asia (1,220 | 1.2%), and Eastern Asia (1,114 | 1.1%), together accounting for 14.3% of all Fishers residents.
| Immigration Origin | # Population | % Population |
| Afghanistan | 49 | 0.1% |
| Africa | 551 | 0.6% |
| Asia | 6,410 | 6.5% |
| Australia | 11 | 0.0% |
| Bangladesh | 60 | 0.1% |
| Bosnia and Herzegovina | 40 | 0.0% |
| Brazil | 312 | 0.3% |
| Cambodia | 14 | 0.0% |
| Canada | 544 | 0.5% |
| Caribbean | 18 | 0.0% |
| Central America | 322 | 0.3% |
| Chile | 43 | 0.0% |
| China | 566 | 0.6% |
| Colombia | 29 | 0.0% |
| Eastern Africa | 11 | 0.0% |
| Eastern Asia | 1,114 | 1.1% |
| Eastern Europe | 360 | 0.4% |
| Egypt | 187 | 0.2% |
| England | 176 | 0.2% |
| Ethiopia | 11 | 0.0% |
| Europe | 1,023 | 1.0% |
| France | 24 | 0.0% |
| Germany | 121 | 0.1% |
| Greece | 130 | 0.1% |
| Guatemala | 27 | 0.0% |
| India | 2,462 | 2.5% |
| Indonesia | 73 | 0.1% |
| Iran | 21 | 0.0% |
| Iraq | 21 | 0.0% |
| Ireland | 31 | 0.0% |
| Jamaica | 18 | 0.0% |
| Japan | 247 | 0.3% |
| Jordan | 541 | 0.5% |
| Korea | 301 | 0.3% |
| Kuwait | 140 | 0.1% |
| Latin America | 1,106 | 1.1% |
| Malaysia | 14 | 0.0% |
| Mexico | 272 | 0.3% |
| Nigeria | 28 | 0.0% |
| Northern Africa | 346 | 0.4% |
| Northern Europe | 388 | 0.4% |
| Oceania | 44 | 0.0% |
| Pakistan | 397 | 0.4% |
| Panama | 23 | 0.0% |
| Peru | 36 | 0.0% |
| Philippines | 311 | 0.3% |
| Poland | 52 | 0.1% |
| Romania | 105 | 0.1% |
| Russia | 99 | 0.1% |
| Saudi Arabia | 139 | 0.1% |
| Serbia | 14 | 0.0% |
| Sierra Leone | 28 | 0.0% |
| South Africa | 67 | 0.1% |
| South America | 766 | 0.8% |
| South Central Asia | 2,989 | 3.0% |
| South Eastern Asia | 1,087 | 1.1% |
| Southern Europe | 130 | 0.1% |
| Sweden | 12 | 0.0% |
| Syria | 379 | 0.4% |
| Taiwan | 8 | 0.0% |
| Thailand | 20 | 0.0% |
| Ukraine | 50 | 0.1% |
| Venezuela | 346 | 0.4% |
| Vietnam | 503 | 0.5% |
| Western Africa | 121 | 0.1% |
| Western Asia | 1,220 | 1.2% |
| Western Europe | 145 | 0.2% | View All 67 Rows |
Sex and Age in Fishers
Sex and Age in Fishers
The most populous age groups in Fishers are 35 to 39 Years (4,679 | 9.6%) for men and 35 to 39 Years (4,465 | 8.9%) for women.
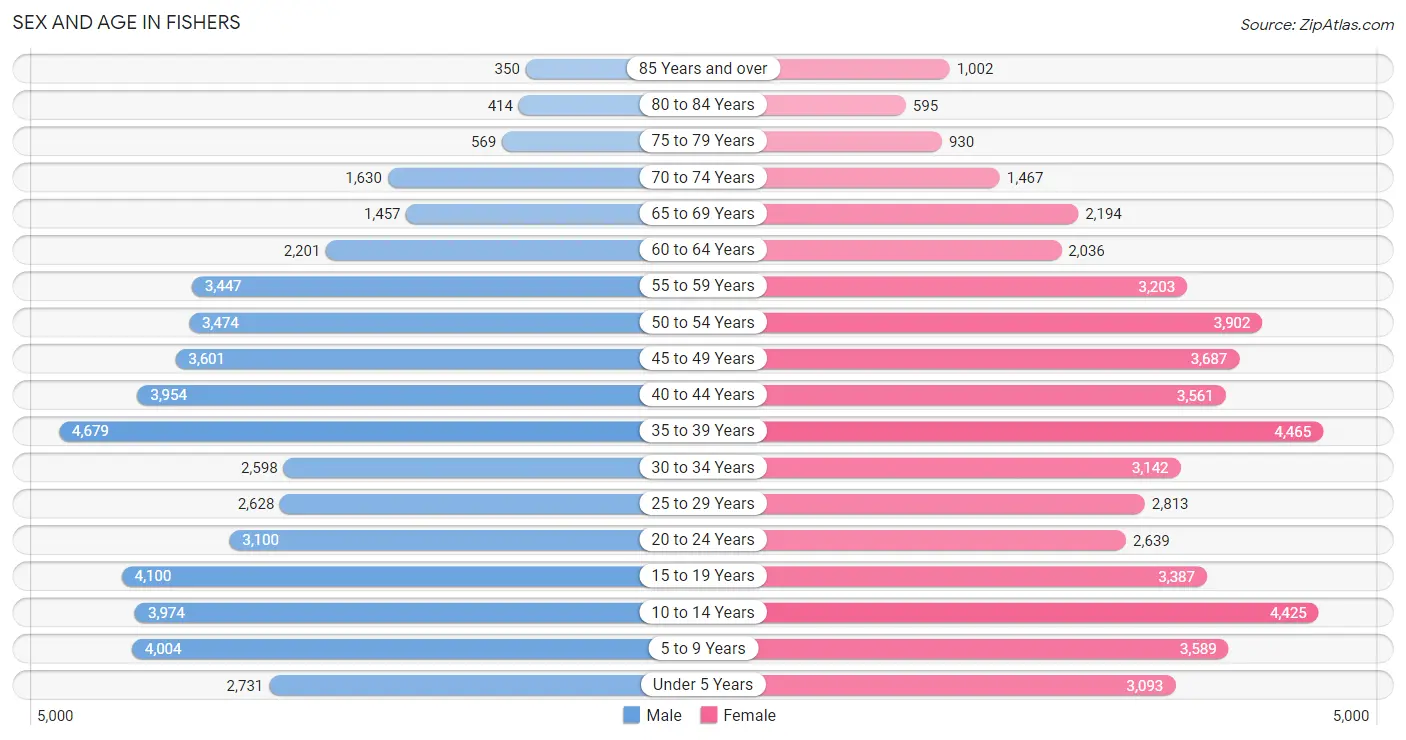
| Age Bracket | Male | Female |
| Under 5 Years | 2,731 (5.6%) | 3,093 (6.2%) |
| 5 to 9 Years | 4,004 (8.2%) | 3,589 (7.2%) |
| 10 to 14 Years | 3,974 (8.1%) | 4,425 (8.8%) |
| 15 to 19 Years | 4,100 (8.4%) | 3,387 (6.8%) |
| 20 to 24 Years | 3,100 (6.3%) | 2,639 (5.3%) |
| 25 to 29 Years | 2,628 (5.4%) | 2,813 (5.6%) |
| 30 to 34 Years | 2,598 (5.3%) | 3,142 (6.3%) |
| 35 to 39 Years | 4,679 (9.6%) | 4,465 (8.9%) |
| 40 to 44 Years | 3,954 (8.1%) | 3,561 (7.1%) |
| 45 to 49 Years | 3,601 (7.4%) | 3,687 (7.3%) |
| 50 to 54 Years | 3,474 (7.1%) | 3,902 (7.8%) |
| 55 to 59 Years | 3,447 (7.0%) | 3,203 (6.4%) |
| 60 to 64 Years | 2,201 (4.5%) | 2,036 (4.1%) |
| 65 to 69 Years | 1,457 (3.0%) | 2,194 (4.4%) |
| 70 to 74 Years | 1,630 (3.3%) | 1,467 (2.9%) |
| 75 to 79 Years | 569 (1.2%) | 930 (1.9%) |
| 80 to 84 Years | 414 (0.9%) | 595 (1.2%) |
| 85 Years and over | 350 (0.7%) | 1,002 (2.0%) |
| Total | 48,911 (100.0%) | 50,130 (100.0%) |
Families and Households in Fishers
Median Family Size in Fishers
The median family size in Fishers is 3.21 persons per family, with married-couple families (23,468 | 86.2%) accounting for the largest median family size of 3.25 persons per family. On the other hand, single male/father families (1,370 | 5.0%) represent the smallest median family size with 2.76 persons per family.
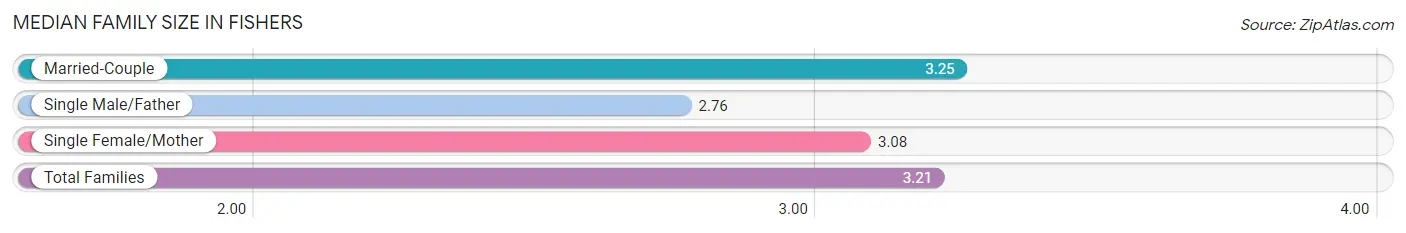
| Family Type | # Families | Family Size |
| Married-Couple | 23,468 (86.2%) | 3.25 |
| Single Male/Father | 1,370 (5.0%) | 2.76 |
| Single Female/Mother | 2,397 (8.8%) | 3.08 |
| Total Families | 27,235 (100.0%) | 3.21 |
Median Household Size in Fishers
The median household size in Fishers is 2.76 persons per household, with single female/mother households (2,397 | 6.7%) accounting for the largest median household size of 3.3 persons per household. non-family households (8,512 | 23.8%) represent the smallest median household size with 1.19 persons per household.
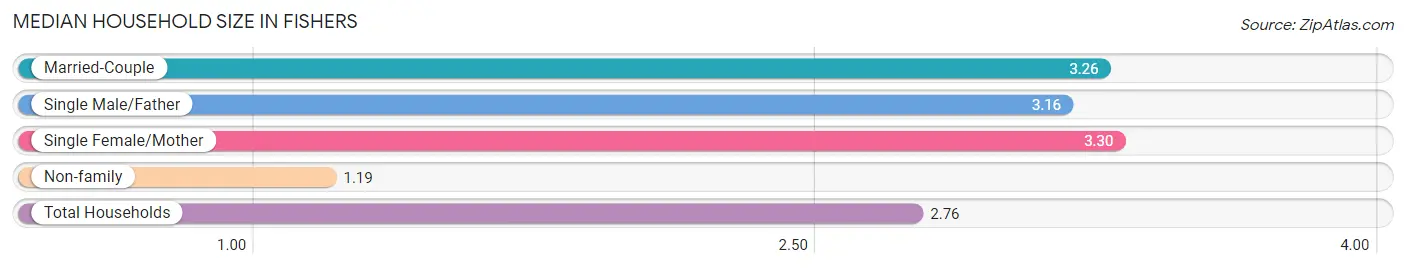
| Household Type | # Households | Household Size |
| Married-Couple | 23,468 (65.6%) | 3.26 |
| Single Male/Father | 1,370 (3.8%) | 3.16 |
| Single Female/Mother | 2,397 (6.7%) | 3.30 |
| Non-family | 8,512 (23.8%) | 1.19 |
| Total Households | 35,747 (100.0%) | 2.76 |
Household Size by Marriage Status in Fishers
Out of a total of 35,747 households in Fishers, 27,235 (76.2%) are family households, while 8,512 (23.8%) are nonfamily households. The most numerous type of family households are 2-person households, comprising 9,882, and the most common type of nonfamily households are 1-person households, comprising 7,144.
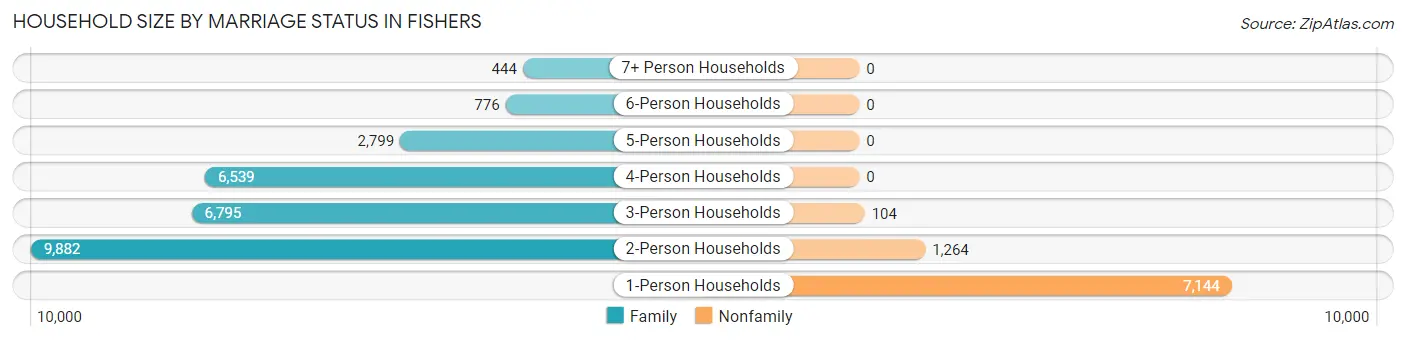
| Household Size | Family Households | Nonfamily Households |
| 1-Person Households | - | 7,144 (20.0%) |
| 2-Person Households | 9,882 (27.6%) | 1,264 (3.5%) |
| 3-Person Households | 6,795 (19.0%) | 104 (0.3%) |
| 4-Person Households | 6,539 (18.3%) | 0 (0.0%) |
| 5-Person Households | 2,799 (7.8%) | 0 (0.0%) |
| 6-Person Households | 776 (2.2%) | 0 (0.0%) |
| 7+ Person Households | 444 (1.2%) | 0 (0.0%) |
| Total | 27,235 (76.2%) | 8,512 (23.8%) |
Female Fertility in Fishers
Fertility by Age in Fishers
Average fertility rate in Fishers is 54.0 births per 1,000 women. Women in the age bracket of 20 to 34 years have the highest fertility rate with 102.0 births per 1,000 women. Women in the age bracket of 20 to 34 years acount for 66.8% of all women with births.
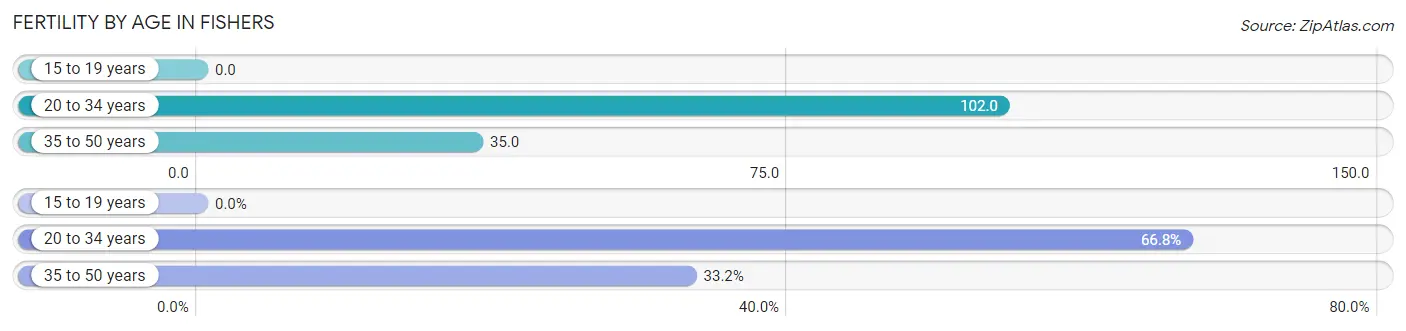
| Age Bracket | Women with Births | Births / 1,000 Women |
| 15 to 19 years | 0 (0.0%) | 0.0 |
| 20 to 34 years | 875 (66.8%) | 102.0 |
| 35 to 50 years | 434 (33.2%) | 35.0 |
| Total | 1,309 (100.0%) | 54.0 |
Fertility by Age by Marriage Status in Fishers
94.7% of women with births (1,309) in Fishers are married. The highest percentage of unmarried women with births falls into 35 to 50 years age bracket with 6.2% of them unmarried at the time of birth, while the lowest percentage of unmarried women with births belong to 20 to 34 years age bracket with 4.8% of them unmarried.
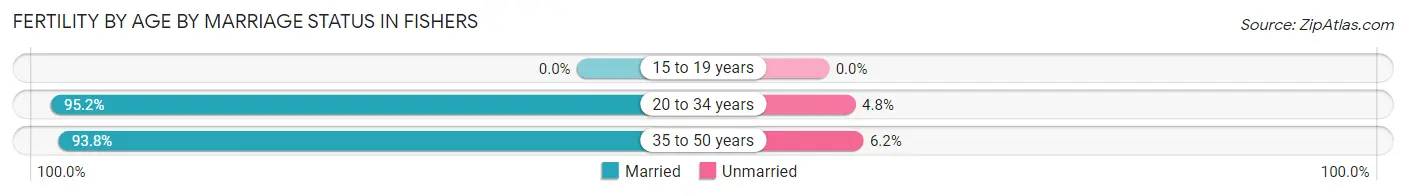
| Age Bracket | Married | Unmarried |
| 15 to 19 years | 0 (0.0%) | 0 (0.0%) |
| 20 to 34 years | 833 (95.2%) | 42 (4.8%) |
| 35 to 50 years | 407 (93.8%) | 27 (6.2%) |
| Total | 1,240 (94.7%) | 69 (5.3%) |
Fertility by Education in Fishers
Average fertility rate in Fishers is 54.0 births per 1,000 women. Women with the education attainment of college or associate's degree have the highest fertility rate of 76.0 births per 1,000 women, while women with the education attainment of less than high school have the lowest fertility at 6.0 births per 1,000 women. Women with the education attainment of bachelor's degree represent 47.1% of all women with births.
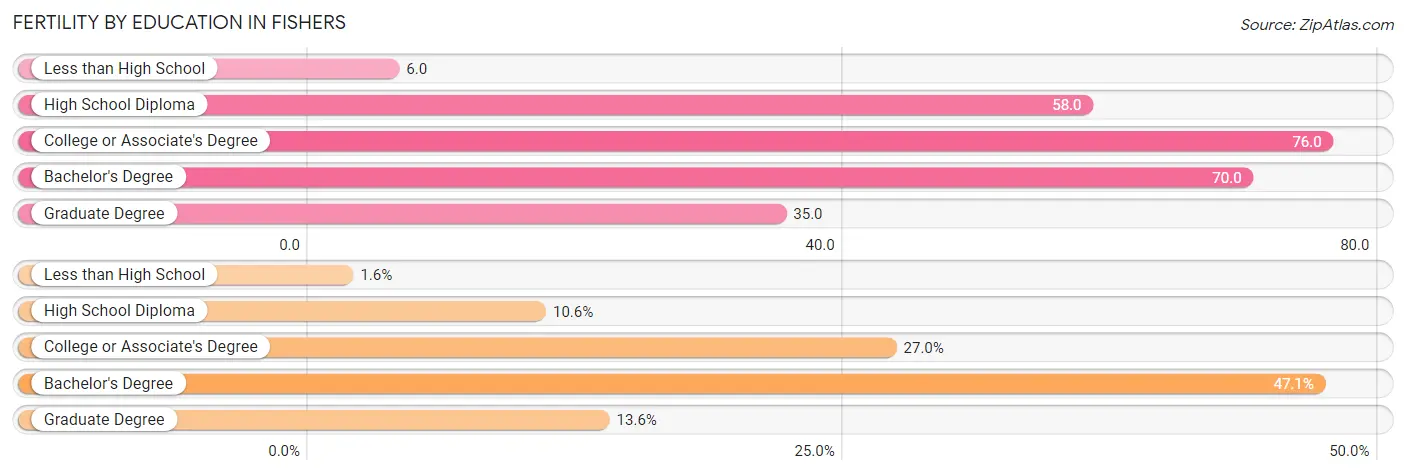
| Educational Attainment | Women with Births | Births / 1,000 Women |
| Less than High School | 21 (1.6%) | 6.0 |
| High School Diploma | 139 (10.6%) | 58.0 |
| College or Associate's Degree | 354 (27.0%) | 76.0 |
| Bachelor's Degree | 617 (47.1%) | 70.0 |
| Graduate Degree | 178 (13.6%) | 35.0 |
| Total | 1,309 (100.0%) | 54.0 |
Fertility by Education by Marriage Status in Fishers
5.3% of women with births in Fishers are unmarried. Women with the educational attainment of less than high school are most likely to be married with 100.0% of them married at childbirth, while women with the educational attainment of high school diploma are least likely to be married with 12.2% of them unmarried at childbirth.
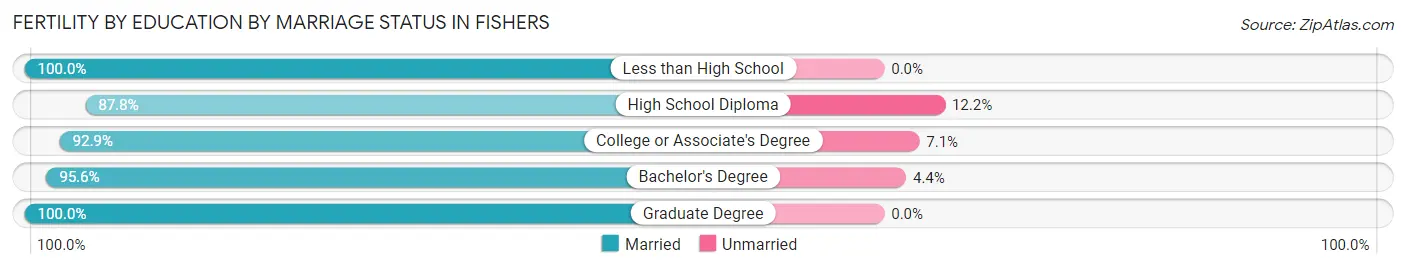
| Educational Attainment | Married | Unmarried |
| Less than High School | 21 (100.0%) | 0 (0.0%) |
| High School Diploma | 122 (87.8%) | 17 (12.2%) |
| College or Associate's Degree | 329 (92.9%) | 25 (7.1%) |
| Bachelor's Degree | 590 (95.6%) | 27 (4.4%) |
| Graduate Degree | 178 (100.0%) | 0 (0.0%) |
| Total | 1,240 (94.7%) | 69 (5.3%) |
Employment Characteristics in Fishers
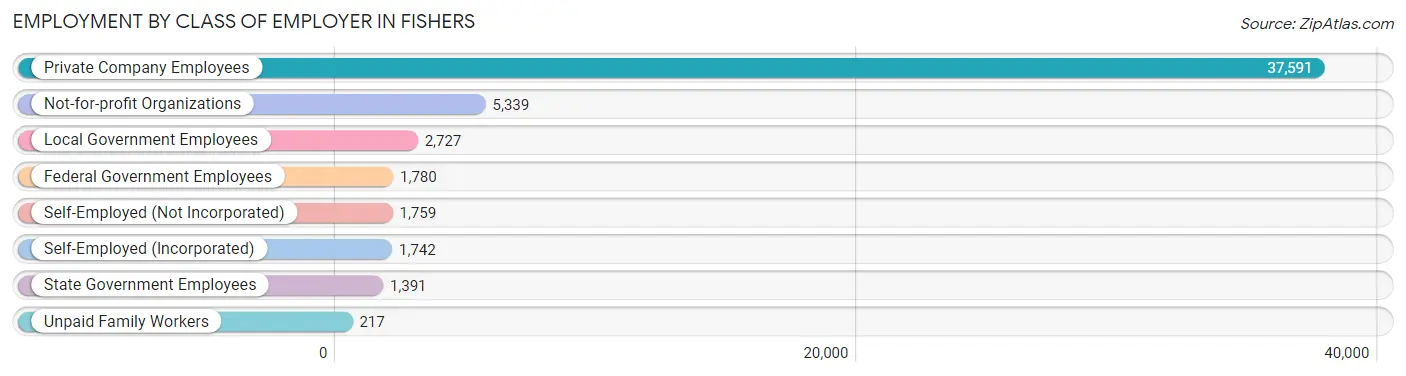
Employment by Class of Employer in Fishers
Among the 52,546 employed individuals in Fishers, private company employees (37,591 | 71.5%), not-for-profit organizations (5,339 | 10.2%), and local government employees (2,727 | 5.2%) make up the most common classes of employment.
| Employer Class | # Employees | % Employees |
| Private Company Employees | 37,591 | 71.5% |
| Self-Employed (Incorporated) | 1,742 | 3.3% |
| Self-Employed (Not Incorporated) | 1,759 | 3.4% |
| Not-for-profit Organizations | 5,339 | 10.2% |
| Local Government Employees | 2,727 | 5.2% |
| State Government Employees | 1,391 | 2.6% |
| Federal Government Employees | 1,780 | 3.4% |
| Unpaid Family Workers | 217 | 0.4% |
| Total | 52,546 | 100.0% |
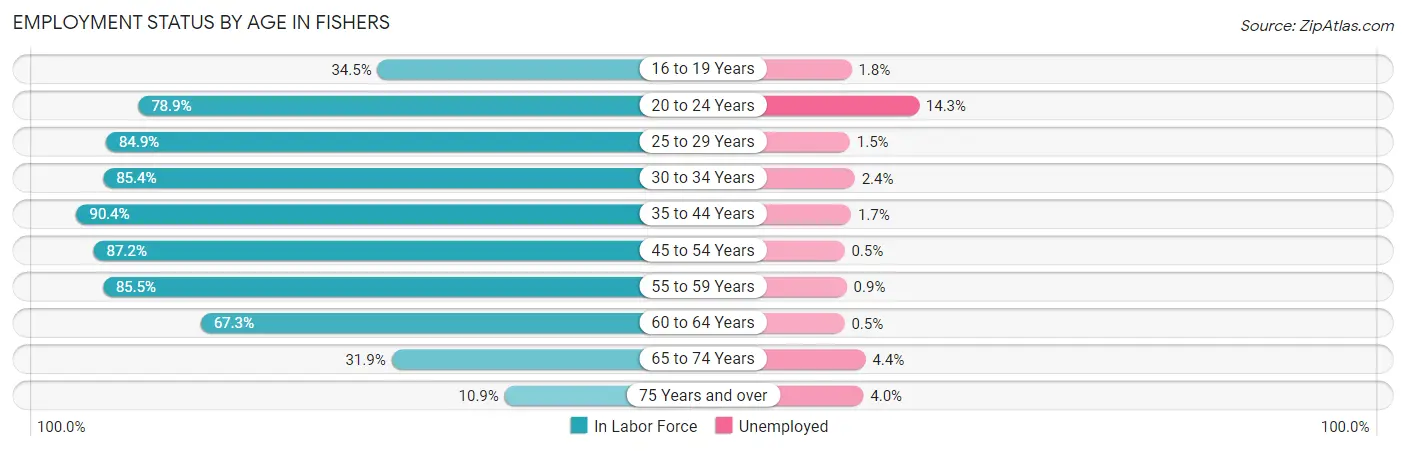
Employment Status by Age in Fishers
According to the labor force statistics for Fishers, out of the total population over 16 years of age (75,113), 73.0% or 54,832 individuals are in the labor force, with 2.5% or 1,371 of them unemployed. The age group with the highest labor force participation rate is 35 to 44 years, with 90.4% or 15,060 individuals in the labor force. Within the labor force, the 20 to 24 years age range has the highest percentage of unemployed individuals, with 14.3% or 648 of them being unemployed.
| Age Bracket | In Labor Force | Unemployed |
| 16 to 19 Years | 1,854 (34.5%) | 33 (1.8%) |
| 20 to 24 Years | 4,528 (78.9%) | 648 (14.3%) |
| 25 to 29 Years | 4,619 (84.9%) | 69 (1.5%) |
| 30 to 34 Years | 4,902 (85.4%) | 118 (2.4%) |
| 35 to 44 Years | 15,060 (90.4%) | 256 (1.7%) |
| 45 to 54 Years | 12,787 (87.2%) | 64 (0.5%) |
| 55 to 59 Years | 5,686 (85.5%) | 51 (0.9%) |
| 60 to 64 Years | 2,852 (67.3%) | 14 (0.5%) |
| 65 to 74 Years | 2,153 (31.9%) | 95 (4.4%) |
| 75 Years and over | 421 (10.9%) | 17 (4.0%) |
| Total | 54,832 (73.0%) | 1,371 (2.5%) |
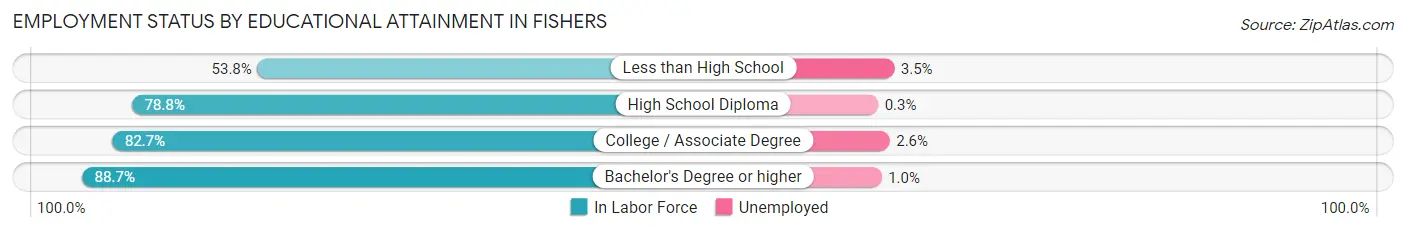
Employment Status by Educational Attainment in Fishers
According to labor force statistics for Fishers, 86.0% of individuals (45,916) out of the total population between 25 and 64 years of age (53,391) are in the labor force, with 1.2% or 551 of them being unemployed. The group with the highest labor force participation rate are those with the educational attainment of bachelor's degree or higher, with 88.7% or 32,487 individuals in the labor force. Within the labor force, individuals with less than high school education have the highest percentage of unemployment, with 3.5% or 17 of them being unemployed.
| Educational Attainment | In Labor Force | Unemployed |
| Less than High School | 492 (53.8%) | 32 (3.5%) |
| High School Diploma | 3,578 (78.8%) | 14 (0.3%) |
| College / Associate Degree | 9,354 (82.7%) | 294 (2.6%) |
| Bachelor's Degree or higher | 32,487 (88.7%) | 366 (1.0%) |
| Total | 45,916 (86.0%) | 641 (1.2%) |
Employment Occupations by Sex in Fishers
Management, Business, Science and Arts Occupations
The most common Management, Business, Science and Arts occupations in Fishers are Management (9,624 | 18.1%), Community & Social Service (5,884 | 11.1%), Computers, Engineering & Science (5,853 | 11.0%), Business & Financial (5,416 | 10.2%), and Health Diagnosing & Treating (5,050 | 9.5%).
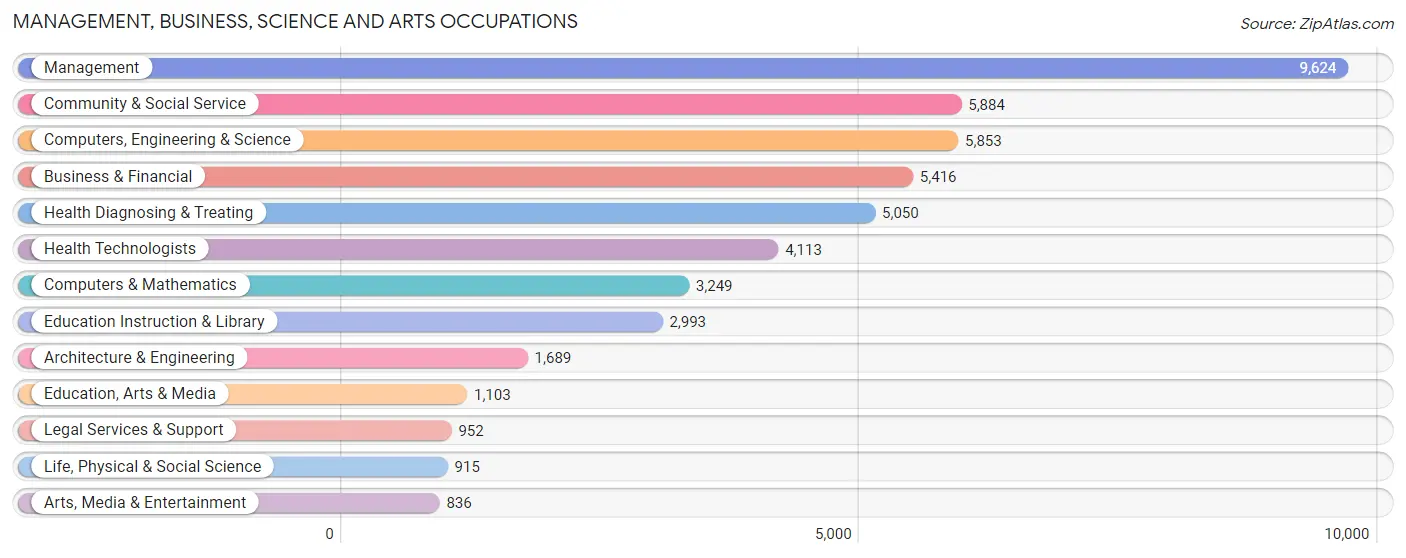
Management, Business, Science and Arts Occupations by Sex
Within the Management, Business, Science and Arts occupations in Fishers, the most male-oriented occupations are Architecture & Engineering (93.2%), Computers, Engineering & Science (79.8%), and Computers & Mathematics (76.6%), while the most female-oriented occupations are Health Diagnosing & Treating (73.6%), Education Instruction & Library (72.6%), and Education, Arts & Media (71.2%).
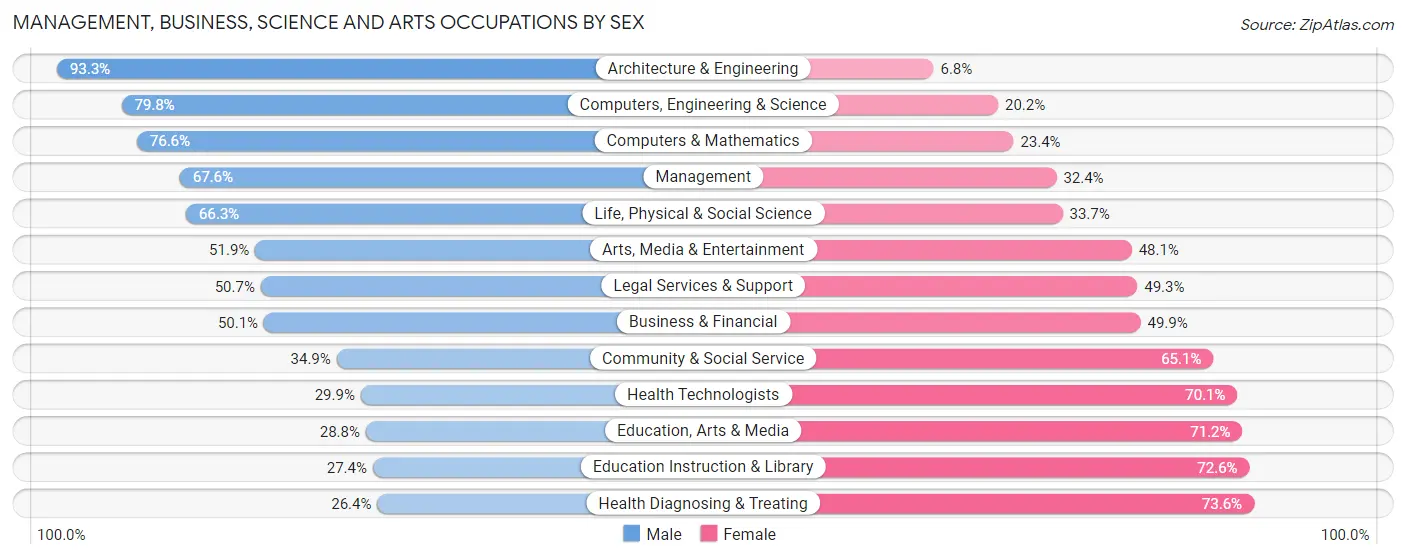
| Occupation | Male | Female |
| Management | 6,507 (67.6%) | 3,117 (32.4%) |
| Business & Financial | 2,712 (50.1%) | 2,704 (49.9%) |
| Computers, Engineering & Science | 4,670 (79.8%) | 1,183 (20.2%) |
| Computers & Mathematics | 2,488 (76.6%) | 761 (23.4%) |
| Architecture & Engineering | 1,575 (93.2%) | 114 (6.8%) |
| Life, Physical & Social Science | 607 (66.3%) | 308 (33.7%) |
| Community & Social Service | 2,054 (34.9%) | 3,830 (65.1%) |
| Education, Arts & Media | 318 (28.8%) | 785 (71.2%) |
| Legal Services & Support | 483 (50.7%) | 469 (49.3%) |
| Education Instruction & Library | 819 (27.4%) | 2,174 (72.6%) |
| Arts, Media & Entertainment | 434 (51.9%) | 402 (48.1%) |
| Health Diagnosing & Treating | 1,334 (26.4%) | 3,716 (73.6%) |
| Health Technologists | 1,229 (29.9%) | 2,884 (70.1%) |
| Total (Category) | 17,277 (54.3%) | 14,550 (45.7%) |
| Total (Overall) | 29,399 (55.4%) | 23,622 (44.6%) |
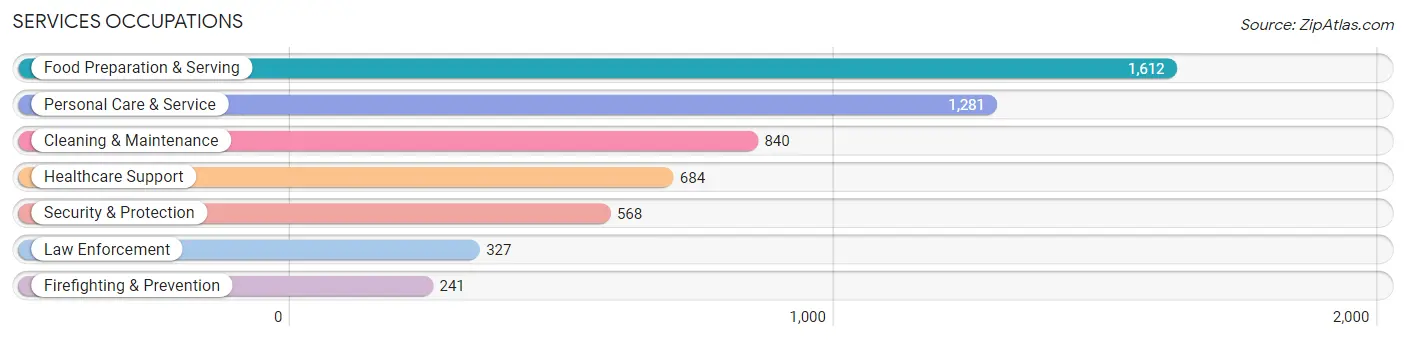
Services Occupations
The most common Services occupations in Fishers are Food Preparation & Serving (1,612 | 3.0%), Personal Care & Service (1,281 | 2.4%), Cleaning & Maintenance (840 | 1.6%), Healthcare Support (684 | 1.3%), and Security & Protection (568 | 1.1%).
Services Occupations by Sex
Within the Services occupations in Fishers, the most male-oriented occupations are Firefighting & Prevention (100.0%), Security & Protection (93.5%), and Law Enforcement (88.7%), while the most female-oriented occupations are Personal Care & Service (89.5%), Healthcare Support (89.3%), and Food Preparation & Serving (61.2%).
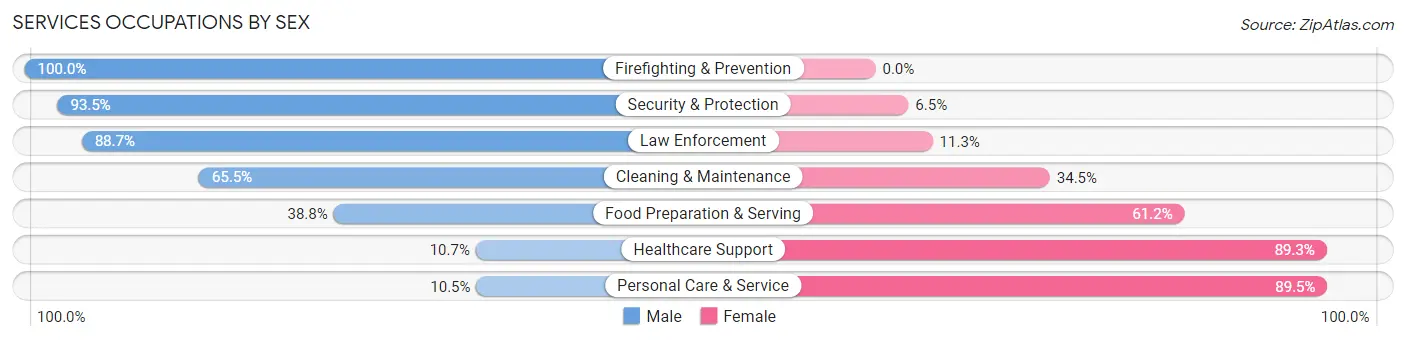
| Occupation | Male | Female |
| Healthcare Support | 73 (10.7%) | 611 (89.3%) |
| Security & Protection | 531 (93.5%) | 37 (6.5%) |
| Firefighting & Prevention | 241 (100.0%) | 0 (0.0%) |
| Law Enforcement | 290 (88.7%) | 37 (11.3%) |
| Food Preparation & Serving | 626 (38.8%) | 986 (61.2%) |
| Cleaning & Maintenance | 550 (65.5%) | 290 (34.5%) |
| Personal Care & Service | 135 (10.5%) | 1,146 (89.5%) |
| Total (Category) | 1,915 (38.4%) | 3,070 (61.6%) |
| Total (Overall) | 29,399 (55.4%) | 23,622 (44.6%) |
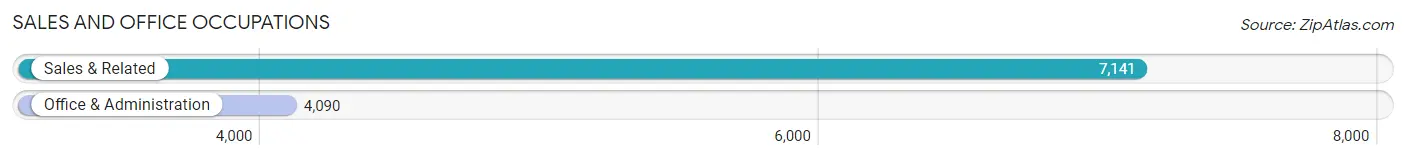
Sales and Office Occupations
The most common Sales and Office occupations in Fishers are Sales & Related (7,141 | 13.5%), and Office & Administration (4,090 | 7.7%).
Sales and Office Occupations by Sex
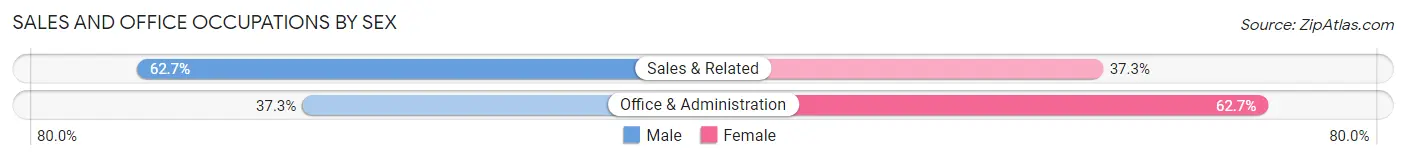
| Occupation | Male | Female |
| Sales & Related | 4,480 (62.7%) | 2,661 (37.3%) |
| Office & Administration | 1,526 (37.3%) | 2,564 (62.7%) |
| Total (Category) | 6,006 (53.5%) | 5,225 (46.5%) |
| Total (Overall) | 29,399 (55.4%) | 23,622 (44.6%) |
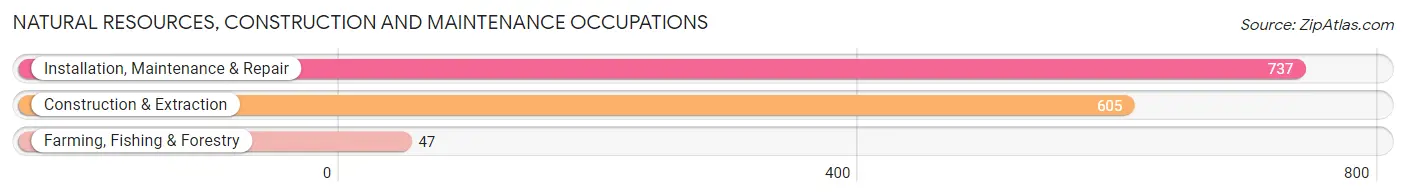
Natural Resources, Construction and Maintenance Occupations
The most common Natural Resources, Construction and Maintenance occupations in Fishers are Installation, Maintenance & Repair (737 | 1.4%), Construction & Extraction (605 | 1.1%), and Farming, Fishing & Forestry (47 | 0.1%).
Natural Resources, Construction and Maintenance Occupations by Sex
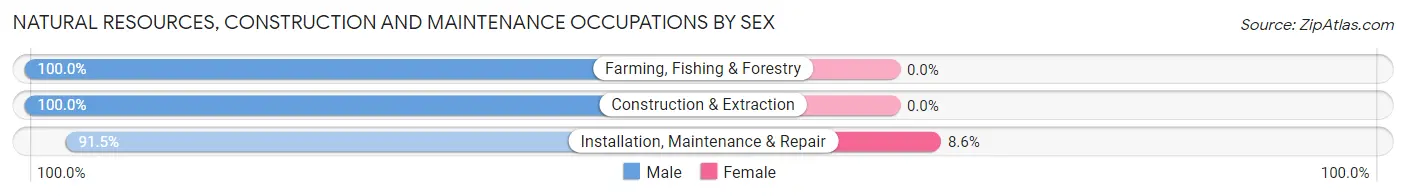
| Occupation | Male | Female |
| Farming, Fishing & Forestry | 47 (100.0%) | 0 (0.0%) |
| Construction & Extraction | 605 (100.0%) | 0 (0.0%) |
| Installation, Maintenance & Repair | 674 (91.4%) | 63 (8.6%) |
| Total (Category) | 1,326 (95.5%) | 63 (4.5%) |
| Total (Overall) | 29,399 (55.4%) | 23,622 (44.6%) |
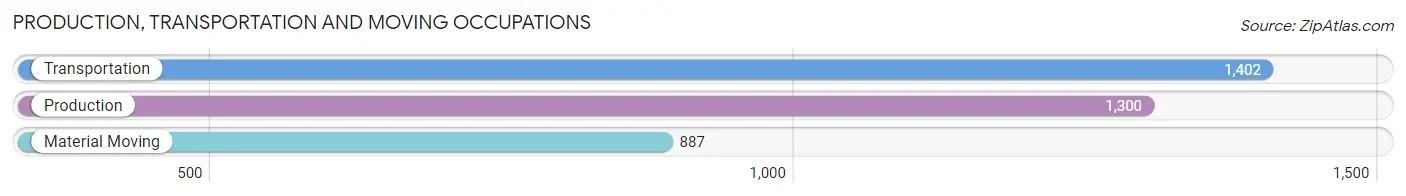
Production, Transportation and Moving Occupations
The most common Production, Transportation and Moving occupations in Fishers are Transportation (1,402 | 2.6%), Production (1,300 | 2.5%), and Material Moving (887 | 1.7%).
Production, Transportation and Moving Occupations by Sex
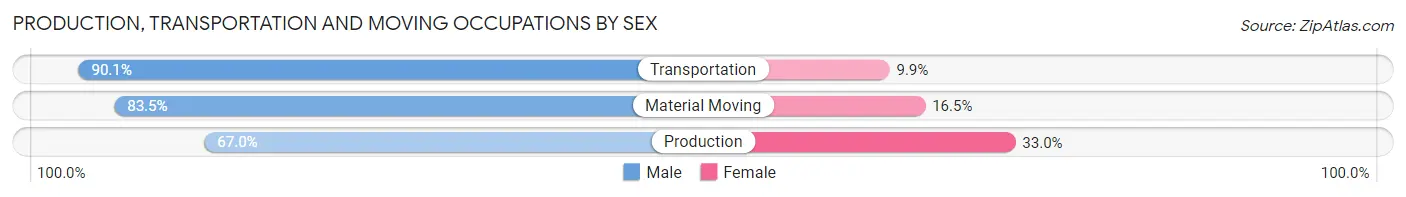
| Occupation | Male | Female |
| Production | 871 (67.0%) | 429 (33.0%) |
| Transportation | 1,263 (90.1%) | 139 (9.9%) |
| Material Moving | 741 (83.5%) | 146 (16.5%) |
| Total (Category) | 2,875 (80.1%) | 714 (19.9%) |
| Total (Overall) | 29,399 (55.4%) | 23,622 (44.6%) |
Employment Industries by Sex in Fishers
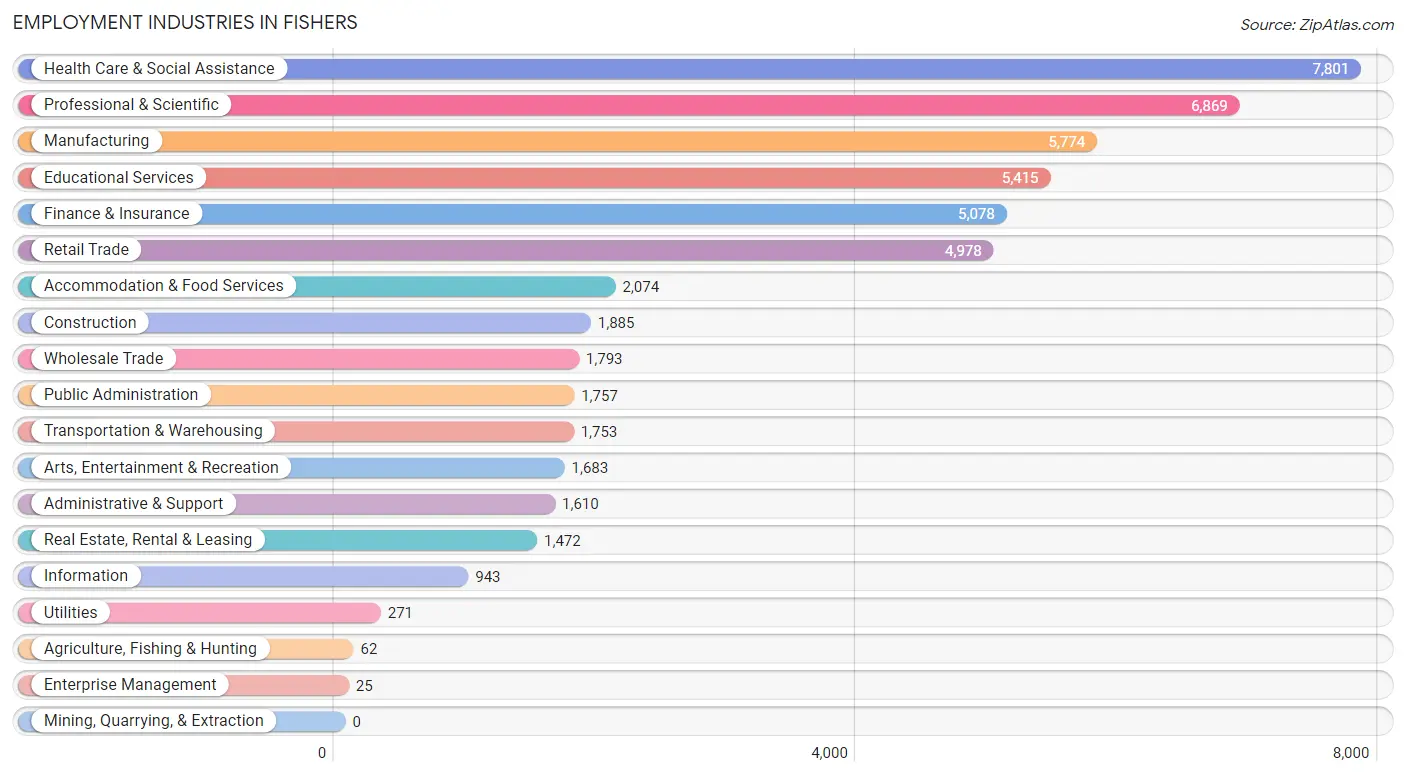
Employment Industries in Fishers
The major employment industries in Fishers include Health Care & Social Assistance (7,801 | 14.7%), Professional & Scientific (6,869 | 13.0%), Manufacturing (5,774 | 10.9%), Educational Services (5,415 | 10.2%), and Finance & Insurance (5,078 | 9.6%).
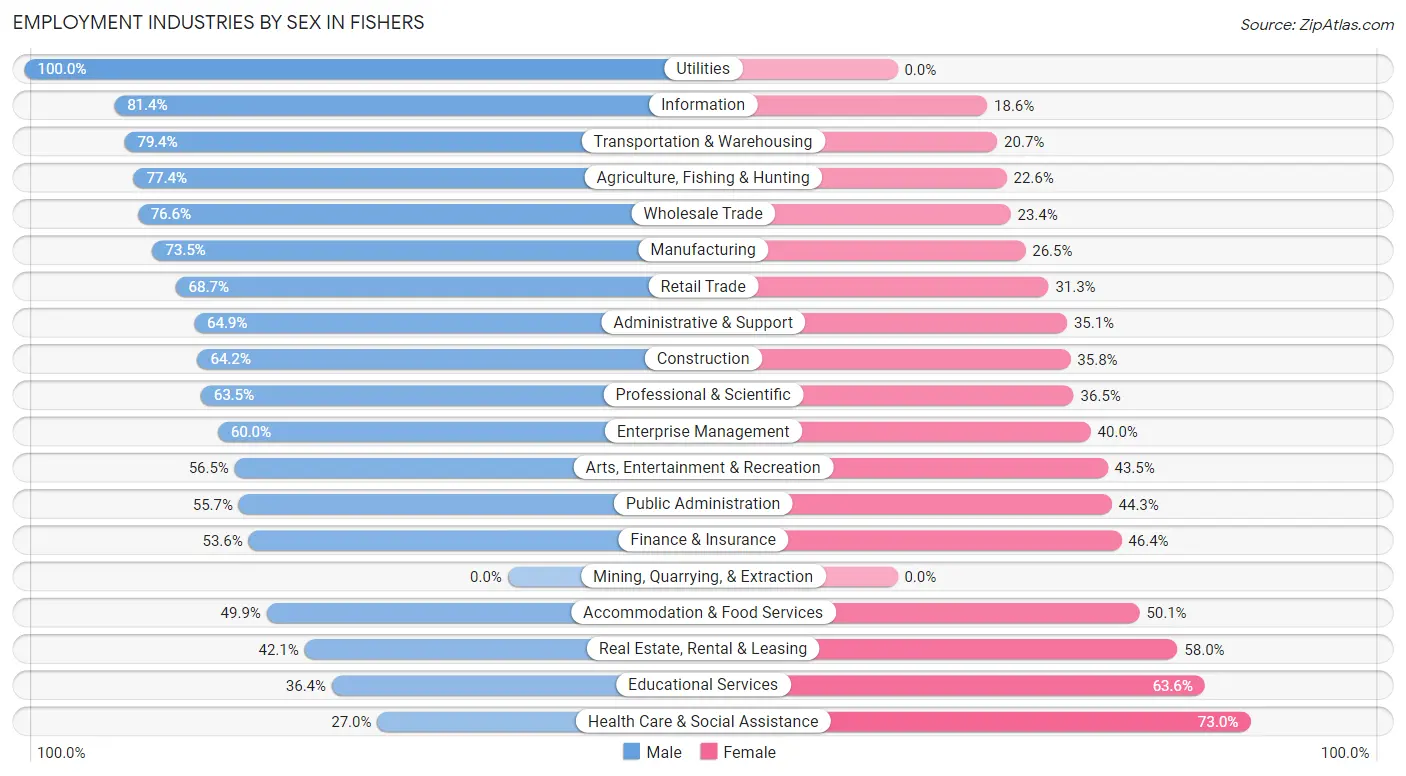
Employment Industries by Sex in Fishers
The Fishers industries that see more men than women are Utilities (100.0%), Information (81.4%), and Transportation & Warehousing (79.3%), whereas the industries that tend to have a higher number of women are Health Care & Social Assistance (73.0%), Educational Services (63.6%), and Real Estate, Rental & Leasing (58.0%).
| Industry | Male | Female |
| Agriculture, Fishing & Hunting | 48 (77.4%) | 14 (22.6%) |
| Mining, Quarrying, & Extraction | 0 (0.0%) | 0 (0.0%) |
| Construction | 1,210 (64.2%) | 675 (35.8%) |
| Manufacturing | 4,246 (73.5%) | 1,528 (26.5%) |
| Wholesale Trade | 1,373 (76.6%) | 420 (23.4%) |
| Retail Trade | 3,422 (68.7%) | 1,556 (31.3%) |
| Transportation & Warehousing | 1,391 (79.3%) | 362 (20.6%) |
| Utilities | 271 (100.0%) | 0 (0.0%) |
| Information | 768 (81.4%) | 175 (18.6%) |
| Finance & Insurance | 2,724 (53.6%) | 2,354 (46.4%) |
| Real Estate, Rental & Leasing | 619 (42.0%) | 853 (58.0%) |
| Professional & Scientific | 4,363 (63.5%) | 2,506 (36.5%) |
| Enterprise Management | 15 (60.0%) | 10 (40.0%) |
| Administrative & Support | 1,045 (64.9%) | 565 (35.1%) |
| Educational Services | 1,971 (36.4%) | 3,444 (63.6%) |
| Health Care & Social Assistance | 2,106 (27.0%) | 5,695 (73.0%) |
| Arts, Entertainment & Recreation | 951 (56.5%) | 732 (43.5%) |
| Accommodation & Food Services | 1,035 (49.9%) | 1,039 (50.1%) |
| Public Administration | 978 (55.7%) | 779 (44.3%) |
| Total | 29,399 (55.4%) | 23,622 (44.6%) |
Education in Fishers
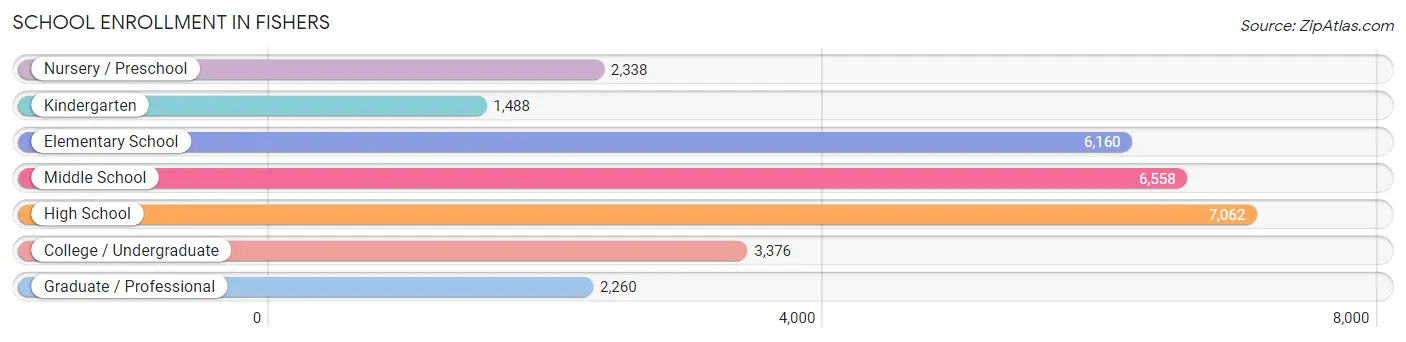
School Enrollment in Fishers
The most common levels of schooling among the 29,242 students in Fishers are high school (7,062 | 24.1%), middle school (6,558 | 22.4%), and elementary school (6,160 | 21.1%).
| School Level | # Students | % Students |
| Nursery / Preschool | 2,338 | 8.0% |
| Kindergarten | 1,488 | 5.1% |
| Elementary School | 6,160 | 21.1% |
| Middle School | 6,558 | 22.4% |
| High School | 7,062 | 24.1% |
| College / Undergraduate | 3,376 | 11.6% |
| Graduate / Professional | 2,260 | 7.7% |
| Total | 29,242 | 100.0% |
School Enrollment by Age by Funding Source in Fishers
Out of a total of 29,242 students who are enrolled in schools in Fishers, 5,410 (18.5%) attend a private institution, while the remaining 23,832 (81.5%) are enrolled in public schools. The age group of 3 to 4 year olds has the highest likelihood of being enrolled in private schools, with 1,025 (58.7% in the age bracket) enrolled. Conversely, the age group of 18 to 19 year olds has the lowest likelihood of being enrolled in a private school, with 1,726 (93.9% in the age bracket) attending a public institution.
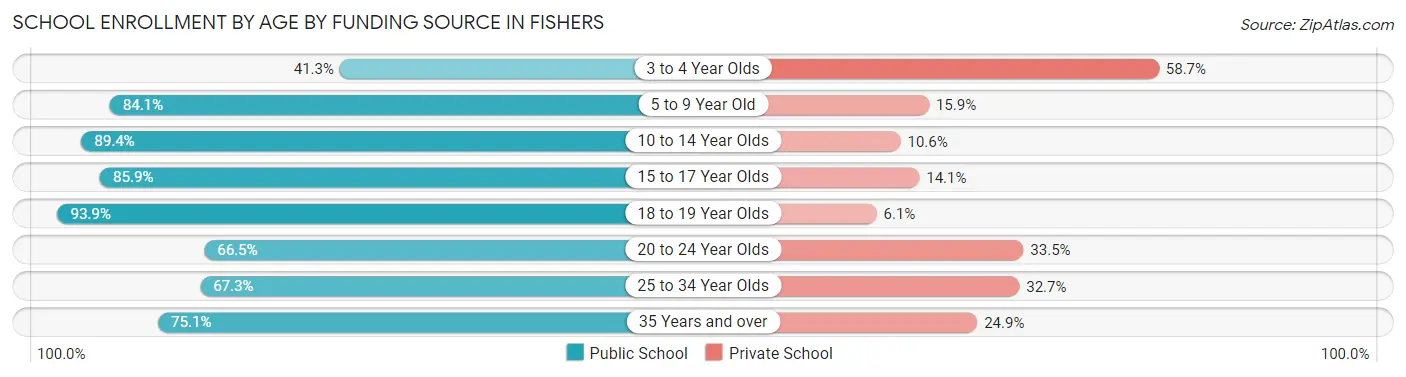
| Age Bracket | Public School | Private School |
| 3 to 4 Year Olds | 721 (41.3%) | 1,025 (58.7%) |
| 5 to 9 Year Old | 6,070 (84.1%) | 1,147 (15.9%) |
| 10 to 14 Year Olds | 7,356 (89.4%) | 871 (10.6%) |
| 15 to 17 Year Olds | 4,432 (85.9%) | 726 (14.1%) |
| 18 to 19 Year Olds | 1,726 (93.9%) | 113 (6.1%) |
| 20 to 24 Year Olds | 1,500 (66.5%) | 755 (33.5%) |
| 25 to 34 Year Olds | 578 (67.3%) | 281 (32.7%) |
| 35 Years and over | 1,458 (75.1%) | 483 (24.9%) |
| Total | 23,832 (81.5%) | 5,410 (18.5%) |
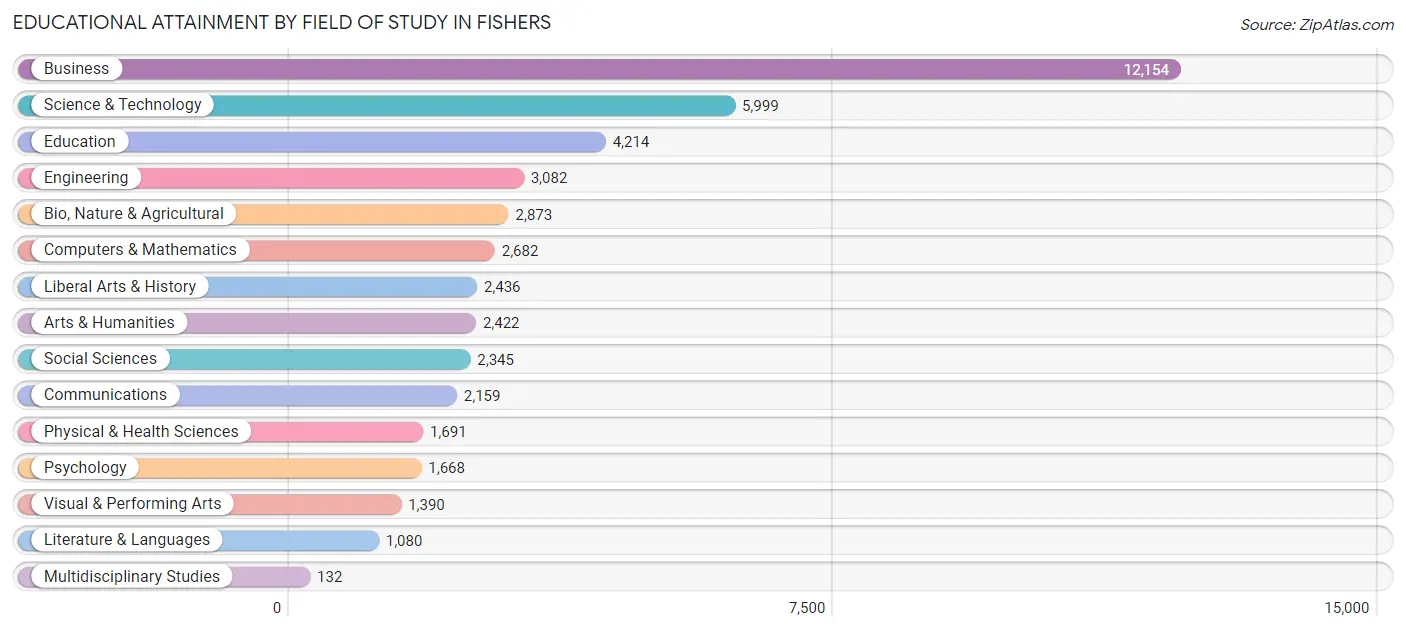
Educational Attainment by Field of Study in Fishers
Business (12,154 | 26.2%), science & technology (5,999 | 13.0%), education (4,214 | 9.1%), engineering (3,082 | 6.7%), and bio, nature & agricultural (2,873 | 6.2%) are the most common fields of study among 46,327 individuals in Fishers who have obtained a bachelor's degree or higher.
| Field of Study | # Graduates | % Graduates |
| Computers & Mathematics | 2,682 | 5.8% |
| Bio, Nature & Agricultural | 2,873 | 6.2% |
| Physical & Health Sciences | 1,691 | 3.6% |
| Psychology | 1,668 | 3.6% |
| Social Sciences | 2,345 | 5.1% |
| Engineering | 3,082 | 6.7% |
| Multidisciplinary Studies | 132 | 0.3% |
| Science & Technology | 5,999 | 13.0% |
| Business | 12,154 | 26.2% |
| Education | 4,214 | 9.1% |
| Literature & Languages | 1,080 | 2.3% |
| Liberal Arts & History | 2,436 | 5.3% |
| Visual & Performing Arts | 1,390 | 3.0% |
| Communications | 2,159 | 4.7% |
| Arts & Humanities | 2,422 | 5.2% |
| Total | 46,327 | 100.0% |
Transportation & Commute in Fishers
Vehicle Availability by Sex in Fishers
The most prevalent vehicle ownership categories in Fishers are males with 2 vehicles (16,338, accounting for 55.4%) and females with 2 vehicles (12,424, making up 70.9%).
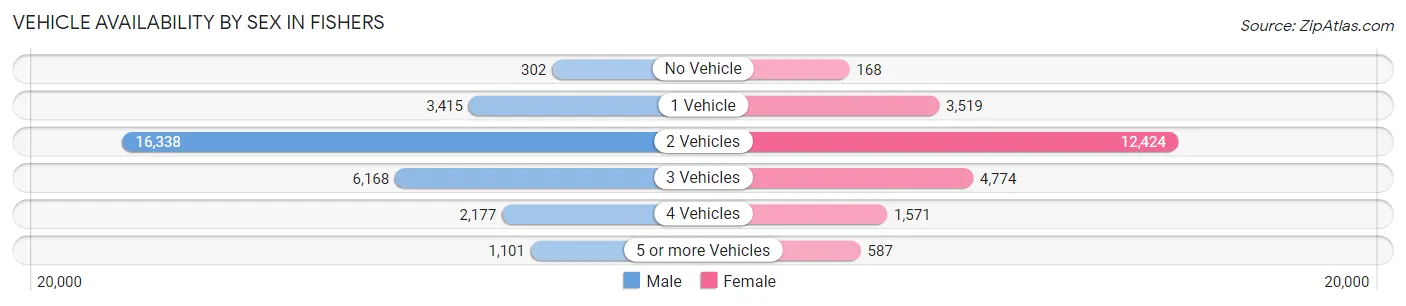
| Vehicles Available | Male | Female |
| No Vehicle | 302 (1.0%) | 168 (0.7%) |
| 1 Vehicle | 3,415 (11.6%) | 3,519 (15.3%) |
| 2 Vehicles | 16,338 (55.4%) | 12,424 (53.9%) |
| 3 Vehicles | 6,168 (20.9%) | 4,774 (20.7%) |
| 4 Vehicles | 2,177 (7.4%) | 1,571 (6.8%) |
| 5 or more Vehicles | 1,101 (3.7%) | 587 (2.5%) |
| Total | 29,501 (100.0%) | 23,043 (100.0%) |
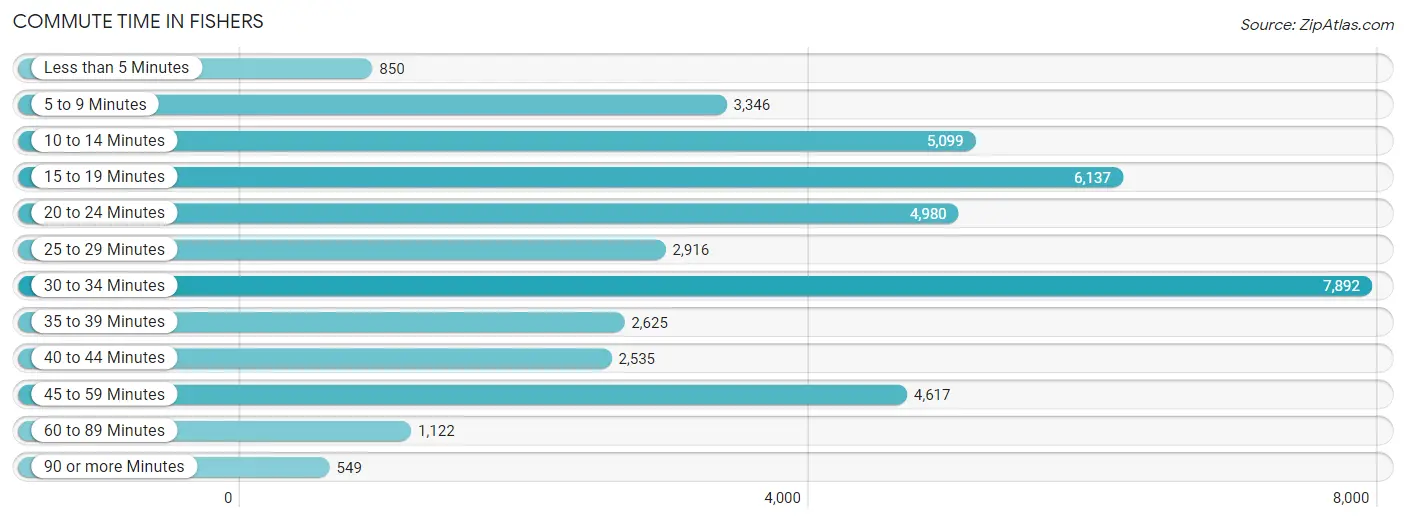
Commute Time in Fishers
The most frequently occuring commute durations in Fishers are 30 to 34 minutes (7,892 commuters, 18.5%), 15 to 19 minutes (6,137 commuters, 14.4%), and 10 to 14 minutes (5,099 commuters, 11.9%).
| Commute Time | # Commuters | % Commuters |
| Less than 5 Minutes | 850 | 2.0% |
| 5 to 9 Minutes | 3,346 | 7.8% |
| 10 to 14 Minutes | 5,099 | 11.9% |
| 15 to 19 Minutes | 6,137 | 14.4% |
| 20 to 24 Minutes | 4,980 | 11.7% |
| 25 to 29 Minutes | 2,916 | 6.8% |
| 30 to 34 Minutes | 7,892 | 18.5% |
| 35 to 39 Minutes | 2,625 | 6.1% |
| 40 to 44 Minutes | 2,535 | 5.9% |
| 45 to 59 Minutes | 4,617 | 10.8% |
| 60 to 89 Minutes | 1,122 | 2.6% |
| 90 or more Minutes | 549 | 1.3% |
Commute Time by Sex in Fishers
The most common commute times in Fishers are 30 to 34 minutes (5,106 commuters, 21.2%) for males and 15 to 19 minutes (2,969 commuters, 16.0%) for females.
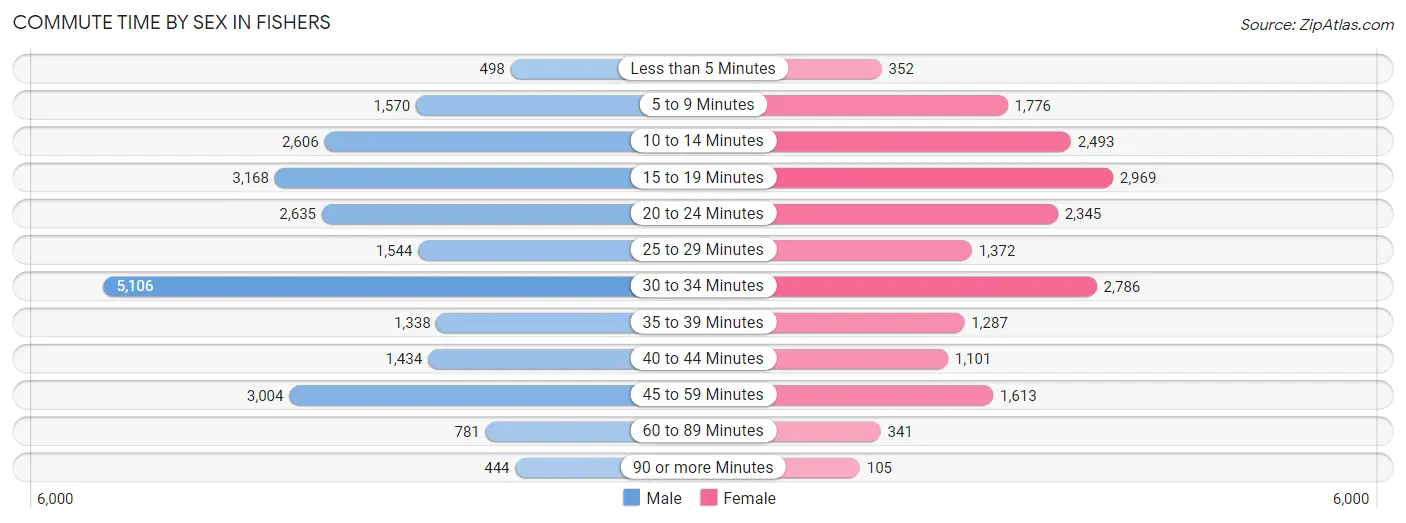
| Commute Time | Male | Female |
| Less than 5 Minutes | 498 (2.1%) | 352 (1.9%) |
| 5 to 9 Minutes | 1,570 (6.5%) | 1,776 (9.6%) |
| 10 to 14 Minutes | 2,606 (10.8%) | 2,493 (13.5%) |
| 15 to 19 Minutes | 3,168 (13.1%) | 2,969 (16.0%) |
| 20 to 24 Minutes | 2,635 (10.9%) | 2,345 (12.7%) |
| 25 to 29 Minutes | 1,544 (6.4%) | 1,372 (7.4%) |
| 30 to 34 Minutes | 5,106 (21.2%) | 2,786 (15.0%) |
| 35 to 39 Minutes | 1,338 (5.6%) | 1,287 (6.9%) |
| 40 to 44 Minutes | 1,434 (5.9%) | 1,101 (5.9%) |
| 45 to 59 Minutes | 3,004 (12.4%) | 1,613 (8.7%) |
| 60 to 89 Minutes | 781 (3.2%) | 341 (1.8%) |
| 90 or more Minutes | 444 (1.8%) | 105 (0.6%) |
Time of Departure to Work by Sex in Fishers
The most frequent times of departure to work in Fishers are 7:00 AM to 7:29 AM (3,857, 16.0%) for males and 8:00 AM to 8:29 AM (3,594, 19.4%) for females.
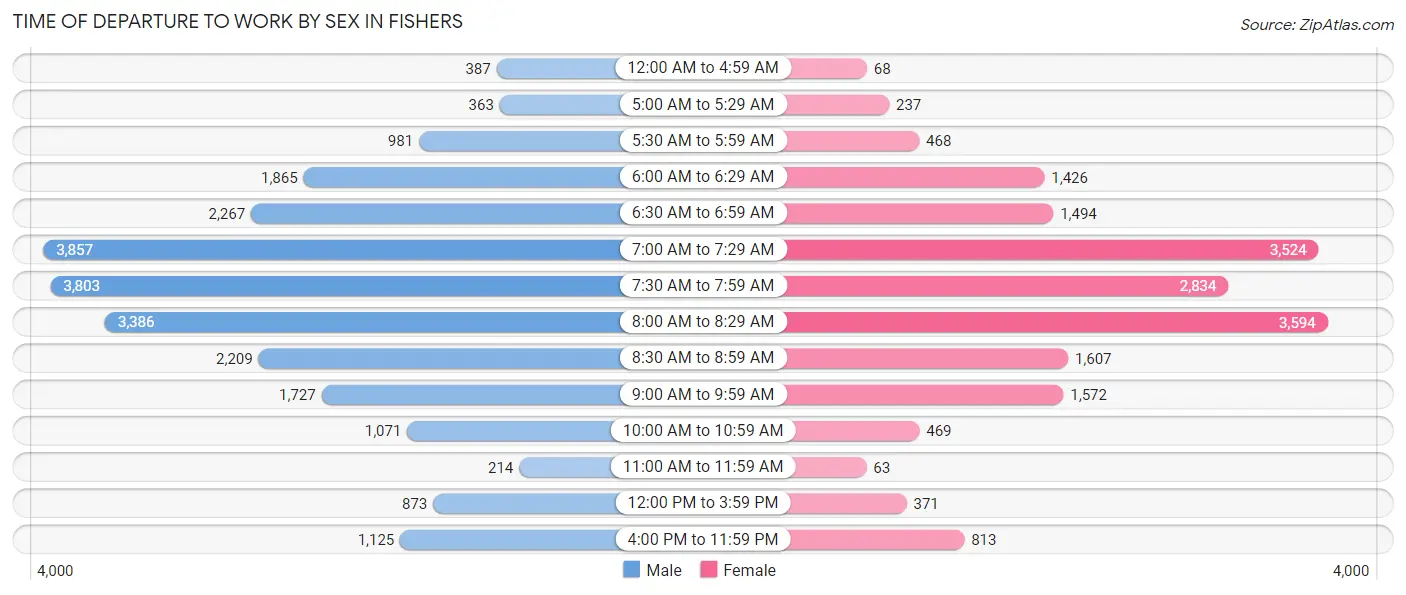
| Time of Departure | Male | Female |
| 12:00 AM to 4:59 AM | 387 (1.6%) | 68 (0.4%) |
| 5:00 AM to 5:29 AM | 363 (1.5%) | 237 (1.3%) |
| 5:30 AM to 5:59 AM | 981 (4.1%) | 468 (2.5%) |
| 6:00 AM to 6:29 AM | 1,865 (7.7%) | 1,426 (7.7%) |
| 6:30 AM to 6:59 AM | 2,267 (9.4%) | 1,494 (8.1%) |
| 7:00 AM to 7:29 AM | 3,857 (16.0%) | 3,524 (19.0%) |
| 7:30 AM to 7:59 AM | 3,803 (15.8%) | 2,834 (15.3%) |
| 8:00 AM to 8:29 AM | 3,386 (14.0%) | 3,594 (19.4%) |
| 8:30 AM to 8:59 AM | 2,209 (9.2%) | 1,607 (8.7%) |
| 9:00 AM to 9:59 AM | 1,727 (7.2%) | 1,572 (8.5%) |
| 10:00 AM to 10:59 AM | 1,071 (4.4%) | 469 (2.5%) |
| 11:00 AM to 11:59 AM | 214 (0.9%) | 63 (0.3%) |
| 12:00 PM to 3:59 PM | 873 (3.6%) | 371 (2.0%) |
| 4:00 PM to 11:59 PM | 1,125 (4.7%) | 813 (4.4%) |
| Total | 24,128 (100.0%) | 18,540 (100.0%) |
Housing Occupancy in Fishers
Occupancy by Ownership in Fishers
Of the total 35,747 dwellings in Fishers, owner-occupied units account for 27,568 (77.1%), while renter-occupied units make up 8,179 (22.9%).
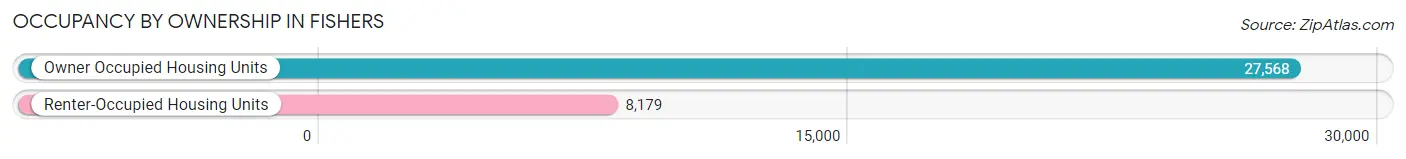
| Occupancy | # Housing Units | % Housing Units |
| Owner Occupied Housing Units | 27,568 | 77.1% |
| Renter-Occupied Housing Units | 8,179 | 22.9% |
| Total Occupied Housing Units | 35,747 | 100.0% |
Occupancy by Household Size in Fishers
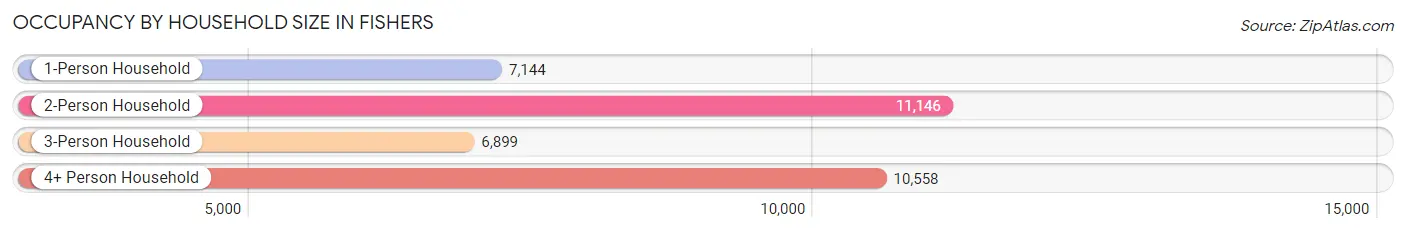
| Household Size | # Housing Units | % Housing Units |
| 1-Person Household | 7,144 | 20.0% |
| 2-Person Household | 11,146 | 31.2% |
| 3-Person Household | 6,899 | 19.3% |
| 4+ Person Household | 10,558 | 29.5% |
| Total Housing Units | 35,747 | 100.0% |
Occupancy by Ownership by Household Size in Fishers
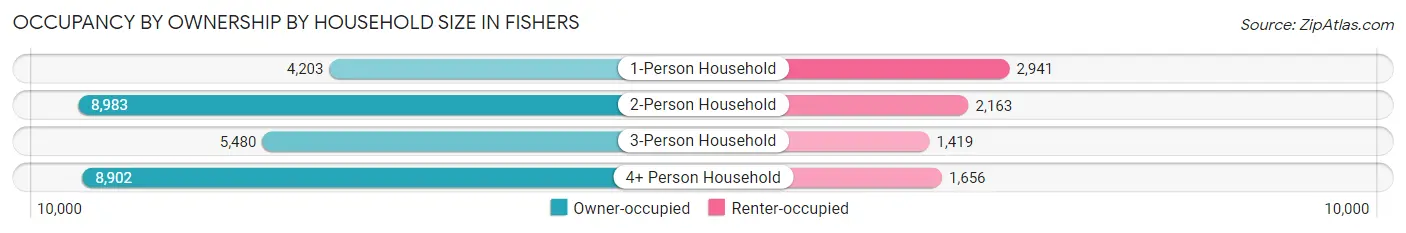
| Household Size | Owner-occupied | Renter-occupied |
| 1-Person Household | 4,203 (58.8%) | 2,941 (41.2%) |
| 2-Person Household | 8,983 (80.6%) | 2,163 (19.4%) |
| 3-Person Household | 5,480 (79.4%) | 1,419 (20.6%) |
| 4+ Person Household | 8,902 (84.3%) | 1,656 (15.7%) |
| Total Housing Units | 27,568 (77.1%) | 8,179 (22.9%) |
Occupancy by Educational Attainment in Fishers
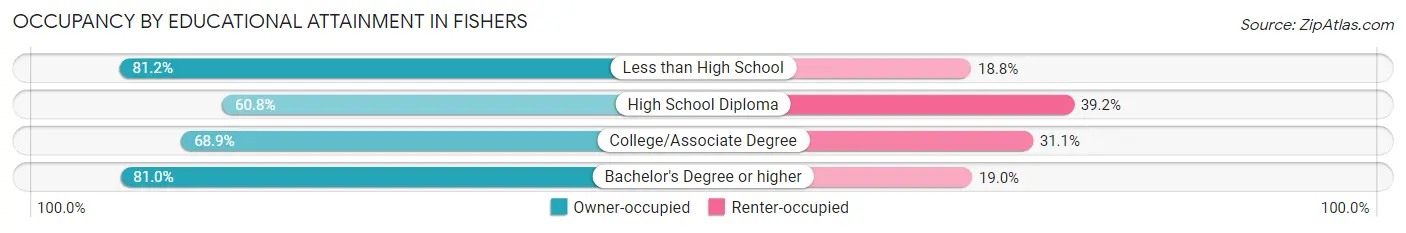
| Household Size | Owner-occupied | Renter-occupied |
| Less than High School | 302 (81.2%) | 70 (18.8%) |
| High School Diploma | 1,635 (60.8%) | 1,053 (39.2%) |
| College/Associate Degree | 4,848 (68.9%) | 2,184 (31.1%) |
| Bachelor's Degree or higher | 20,783 (81.0%) | 4,872 (19.0%) |
Occupancy by Age of Householder in Fishers
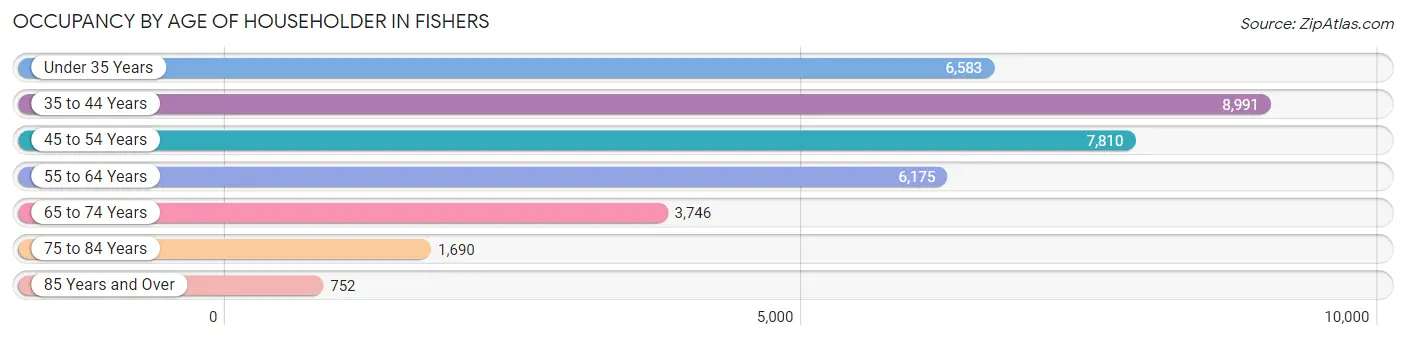
| Age Bracket | # Households | % Households |
| Under 35 Years | 6,583 | 18.4% |
| 35 to 44 Years | 8,991 | 25.2% |
| 45 to 54 Years | 7,810 | 21.8% |
| 55 to 64 Years | 6,175 | 17.3% |
| 65 to 74 Years | 3,746 | 10.5% |
| 75 to 84 Years | 1,690 | 4.7% |
| 85 Years and Over | 752 | 2.1% |
| Total | 35,747 | 100.0% |
Housing Finances in Fishers
Median Income by Occupancy in Fishers
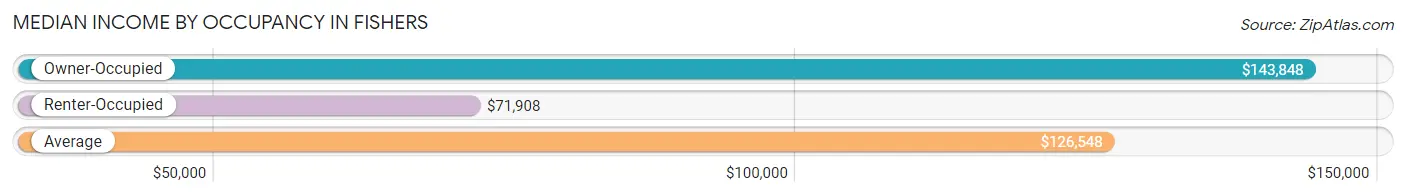
| Occupancy Type | # Households | Median Income |
| Owner-Occupied | 27,568 (77.1%) | $143,848 |
| Renter-Occupied | 8,179 (22.9%) | $71,908 |
| Average | 35,747 (100.0%) | $126,548 |
Occupancy by Householder Income Bracket in Fishers
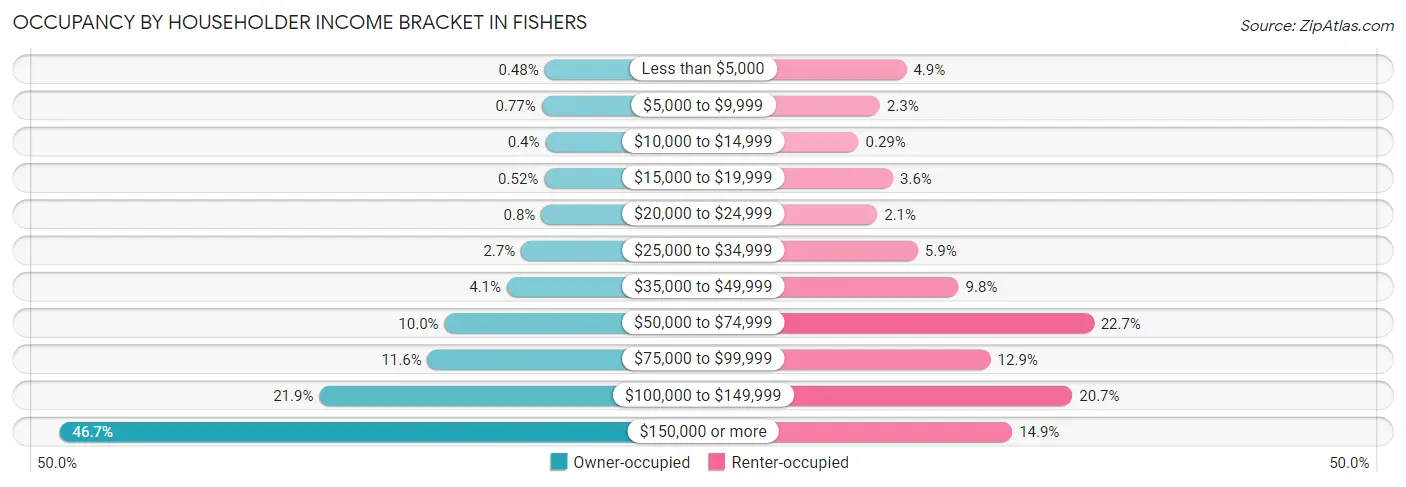
| Income Bracket | Owner-occupied | Renter-occupied |
| Less than $5,000 | 133 (0.5%) | 397 (4.9%) |
| $5,000 to $9,999 | 211 (0.8%) | 190 (2.3%) |
| $10,000 to $14,999 | 109 (0.4%) | 24 (0.3%) |
| $15,000 to $19,999 | 144 (0.5%) | 293 (3.6%) |
| $20,000 to $24,999 | 221 (0.8%) | 169 (2.1%) |
| $25,000 to $34,999 | 751 (2.7%) | 486 (5.9%) |
| $35,000 to $49,999 | 1,122 (4.1%) | 803 (9.8%) |
| $50,000 to $74,999 | 2,762 (10.0%) | 1,855 (22.7%) |
| $75,000 to $99,999 | 3,205 (11.6%) | 1,053 (12.9%) |
| $100,000 to $149,999 | 6,048 (21.9%) | 1,689 (20.6%) |
| $150,000 or more | 12,862 (46.7%) | 1,220 (14.9%) |
| Total | 27,568 (100.0%) | 8,179 (100.0%) |
Monthly Housing Cost Tiers in Fishers
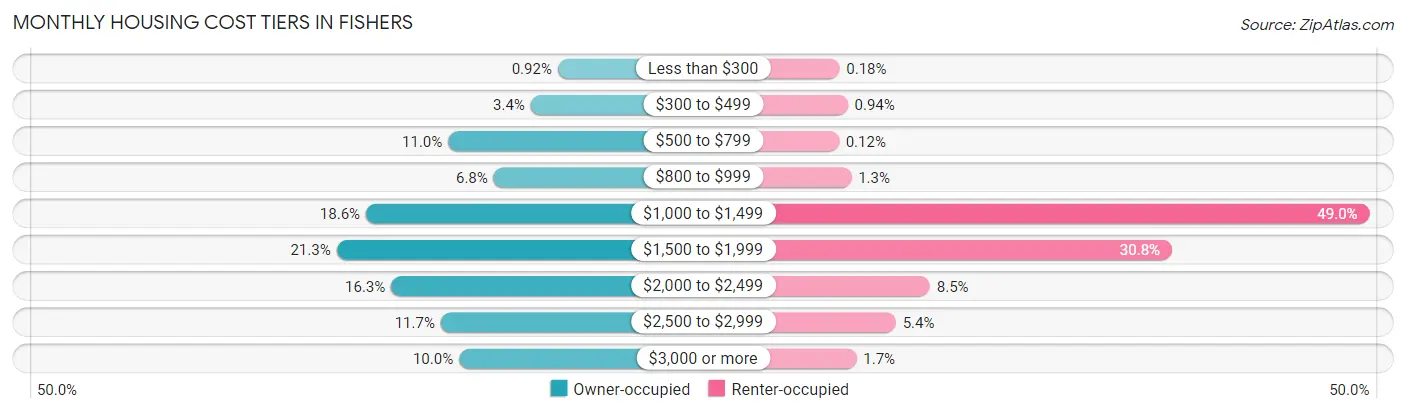
| Monthly Cost | Owner-occupied | Renter-occupied |
| Less than $300 | 255 (0.9%) | 15 (0.2%) |
| $300 to $499 | 941 (3.4%) | 77 (0.9%) |
| $500 to $799 | 3,036 (11.0%) | 10 (0.1%) |
| $800 to $999 | 1,881 (6.8%) | 104 (1.3%) |
| $1,000 to $1,499 | 5,122 (18.6%) | 4,005 (49.0%) |
| $1,500 to $1,999 | 5,870 (21.3%) | 2,518 (30.8%) |
| $2,000 to $2,499 | 4,482 (16.3%) | 696 (8.5%) |
| $2,500 to $2,999 | 3,222 (11.7%) | 439 (5.4%) |
| $3,000 or more | 2,759 (10.0%) | 142 (1.7%) |
| Total | 27,568 (100.0%) | 8,179 (100.0%) |
Physical Housing Characteristics in Fishers
Housing Structures in Fishers
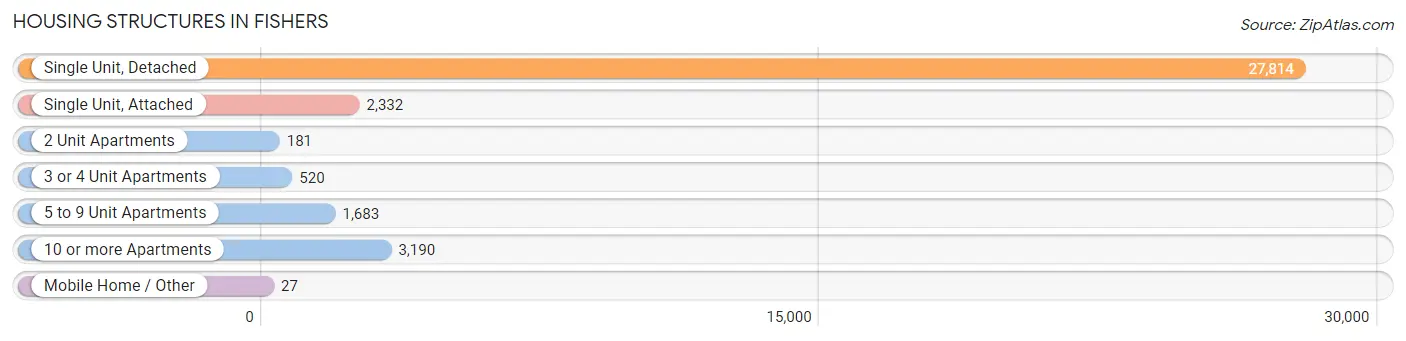
| Structure Type | # Housing Units | % Housing Units |
| Single Unit, Detached | 27,814 | 77.8% |
| Single Unit, Attached | 2,332 | 6.5% |
| 2 Unit Apartments | 181 | 0.5% |
| 3 or 4 Unit Apartments | 520 | 1.5% |
| 5 to 9 Unit Apartments | 1,683 | 4.7% |
| 10 or more Apartments | 3,190 | 8.9% |
| Mobile Home / Other | 27 | 0.1% |
| Total | 35,747 | 100.0% |
Housing Structures by Occupancy in Fishers
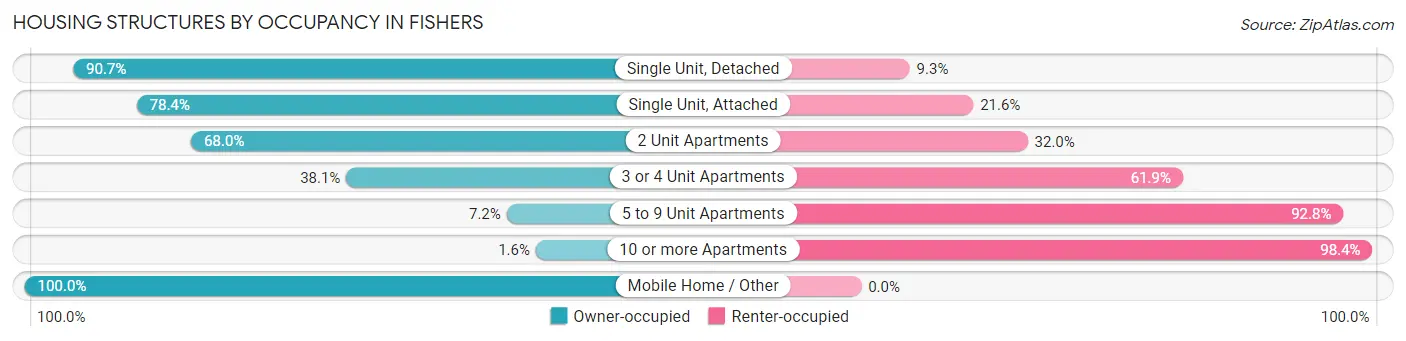
| Structure Type | Owner-occupied | Renter-occupied |
| Single Unit, Detached | 25,220 (90.7%) | 2,594 (9.3%) |
| Single Unit, Attached | 1,829 (78.4%) | 503 (21.6%) |
| 2 Unit Apartments | 123 (68.0%) | 58 (32.0%) |
| 3 or 4 Unit Apartments | 198 (38.1%) | 322 (61.9%) |
| 5 to 9 Unit Apartments | 121 (7.2%) | 1,562 (92.8%) |
| 10 or more Apartments | 50 (1.6%) | 3,140 (98.4%) |
| Mobile Home / Other | 27 (100.0%) | 0 (0.0%) |
| Total | 27,568 (77.1%) | 8,179 (22.9%) |
Housing Structures by Number of Rooms in Fishers
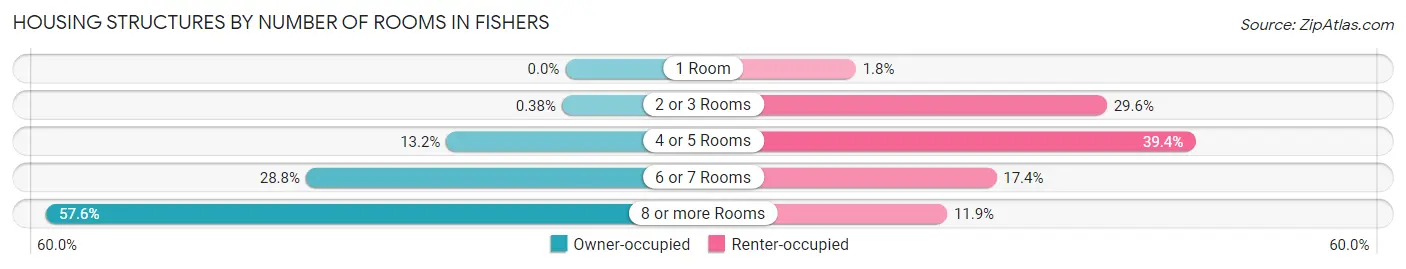
| Number of Rooms | Owner-occupied | Renter-occupied |
| 1 Room | 0 (0.0%) | 143 (1.8%) |
| 2 or 3 Rooms | 106 (0.4%) | 2,422 (29.6%) |
| 4 or 5 Rooms | 3,641 (13.2%) | 3,223 (39.4%) |
| 6 or 7 Rooms | 7,938 (28.8%) | 1,419 (17.3%) |
| 8 or more Rooms | 15,883 (57.6%) | 972 (11.9%) |
| Total | 27,568 (100.0%) | 8,179 (100.0%) |
Housing Structure by Heating Type in Fishers
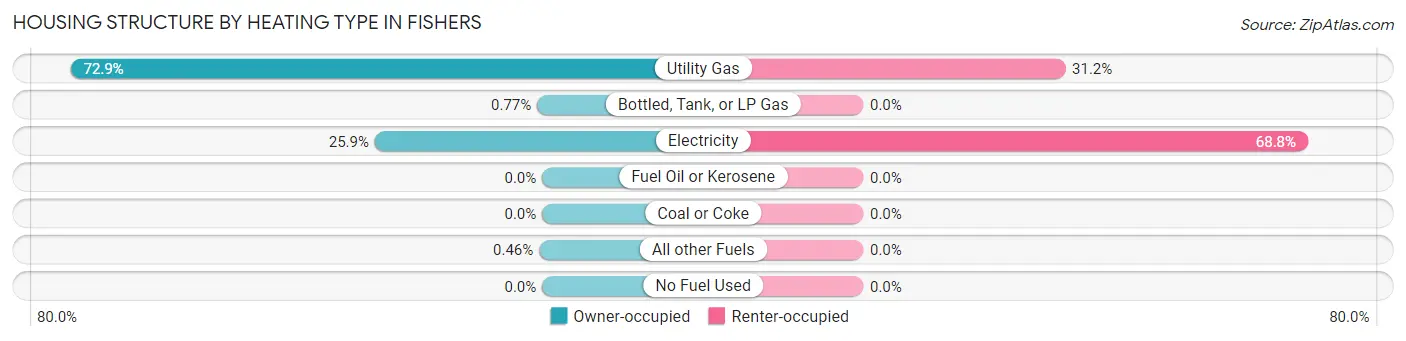
| Heating Type | Owner-occupied | Renter-occupied |
| Utility Gas | 20,100 (72.9%) | 2,555 (31.2%) |
| Bottled, Tank, or LP Gas | 211 (0.8%) | 0 (0.0%) |
| Electricity | 7,129 (25.9%) | 5,624 (68.8%) |
| Fuel Oil or Kerosene | 0 (0.0%) | 0 (0.0%) |
| Coal or Coke | 0 (0.0%) | 0 (0.0%) |
| All other Fuels | 128 (0.5%) | 0 (0.0%) |
| No Fuel Used | 0 (0.0%) | 0 (0.0%) |
| Total | 27,568 (100.0%) | 8,179 (100.0%) |
Household Vehicle Usage in Fishers
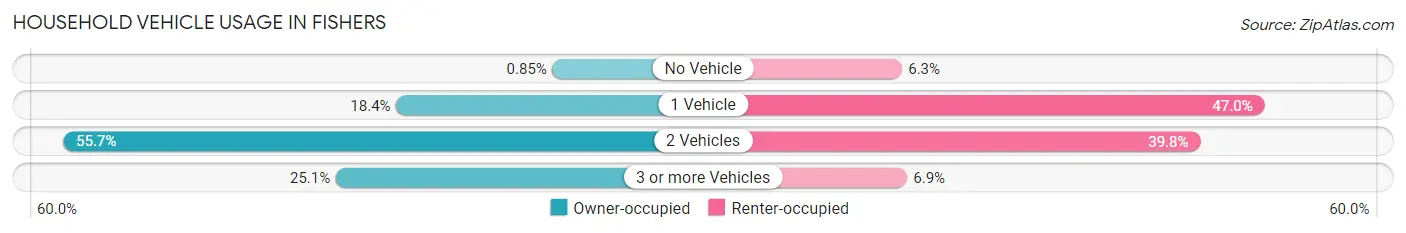
| Vehicles per Household | Owner-occupied | Renter-occupied |
| No Vehicle | 235 (0.9%) | 516 (6.3%) |
| 1 Vehicle | 5,060 (18.3%) | 3,845 (47.0%) |
| 2 Vehicles | 15,351 (55.7%) | 3,255 (39.8%) |
| 3 or more Vehicles | 6,922 (25.1%) | 563 (6.9%) |
| Total | 27,568 (100.0%) | 8,179 (100.0%) |
Real Estate & Mortgages in Fishers
Real Estate and Mortgage Overview in Fishers
| Characteristic | Without Mortgage | With Mortgage |
| Housing Units | 5,776 | 21,792 |
| Median Property Value | $318,000 | $344,500 |
| Median Household Income | $105,692 | $10,987 |
| Monthly Housing Costs | $677 | $2,759 |
| Real Estate Taxes | $3,259 | $199 |
Property Value by Mortgage Status in Fishers
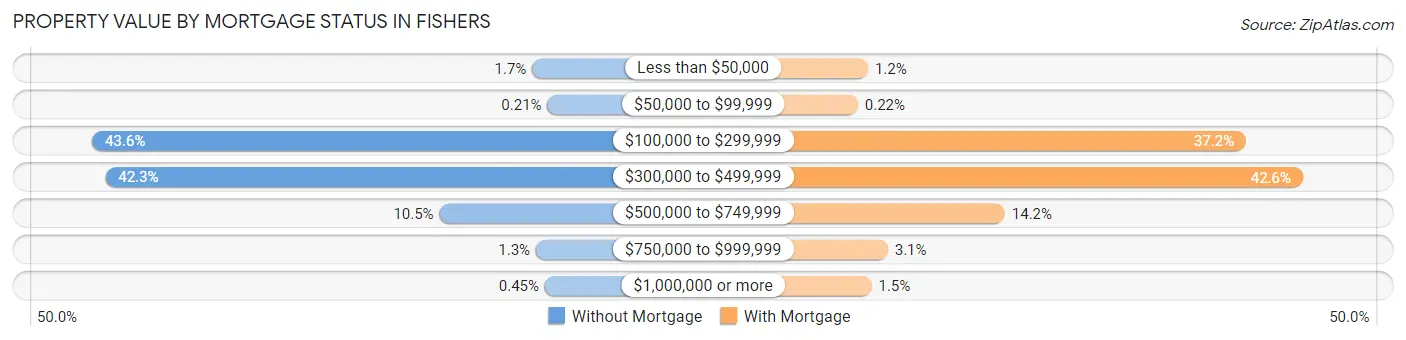
| Property Value | Without Mortgage | With Mortgage |
| Less than $50,000 | 96 (1.7%) | 258 (1.2%) |
| $50,000 to $99,999 | 12 (0.2%) | 49 (0.2%) |
| $100,000 to $299,999 | 2,517 (43.6%) | 8,104 (37.2%) |
| $300,000 to $499,999 | 2,444 (42.3%) | 9,281 (42.6%) |
| $500,000 to $749,999 | 606 (10.5%) | 3,099 (14.2%) |
| $750,000 to $999,999 | 75 (1.3%) | 670 (3.1%) |
| $1,000,000 or more | 26 (0.4%) | 331 (1.5%) |
| Total | 5,776 (100.0%) | 21,792 (100.0%) |
Household Income by Mortgage Status in Fishers
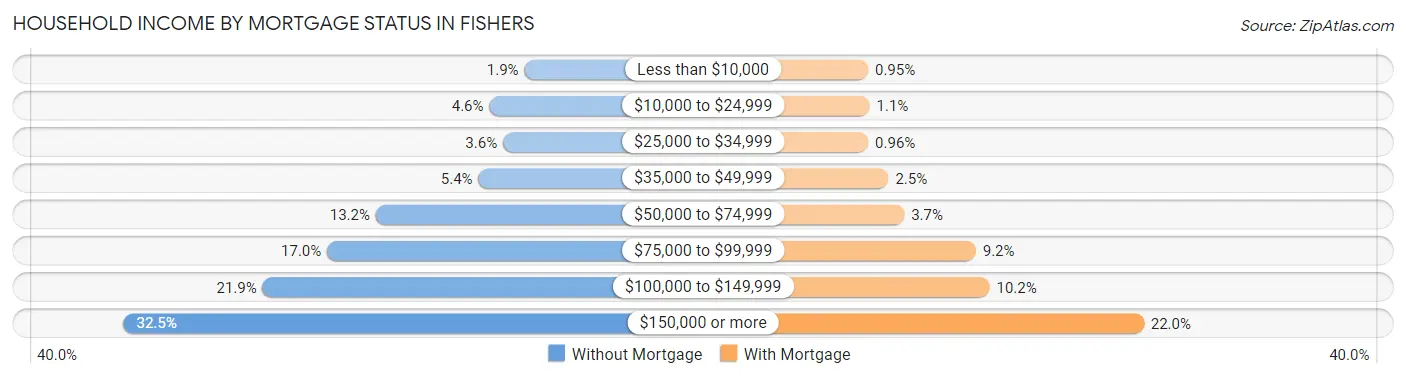
| Household Income | Without Mortgage | With Mortgage |
| Less than $10,000 | 111 (1.9%) | 207 (0.9%) |
| $10,000 to $24,999 | 265 (4.6%) | 233 (1.1%) |
| $25,000 to $34,999 | 205 (3.5%) | 209 (1.0%) |
| $35,000 to $49,999 | 313 (5.4%) | 546 (2.5%) |
| $50,000 to $74,999 | 765 (13.2%) | 809 (3.7%) |
| $75,000 to $99,999 | 979 (17.0%) | 1,997 (9.2%) |
| $100,000 to $149,999 | 1,263 (21.9%) | 2,226 (10.2%) |
| $150,000 or more | 1,875 (32.5%) | 4,785 (22.0%) |
| Total | 5,776 (100.0%) | 21,792 (100.0%) |
Property Value to Household Income Ratio in Fishers
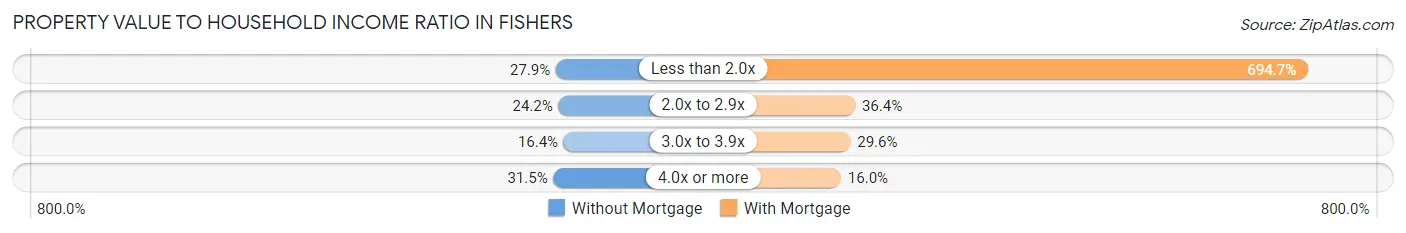
| Value-to-Income Ratio | Without Mortgage | With Mortgage |
| Less than 2.0x | 1,610 (27.9%) | 151,379 (694.7%) |
| 2.0x to 2.9x | 1,399 (24.2%) | 7,927 (36.4%) |
| 3.0x to 3.9x | 947 (16.4%) | 6,459 (29.6%) |
| 4.0x or more | 1,820 (31.5%) | 3,483 (16.0%) |
| Total | 5,776 (100.0%) | 21,792 (100.0%) |
Real Estate Taxes by Mortgage Status in Fishers
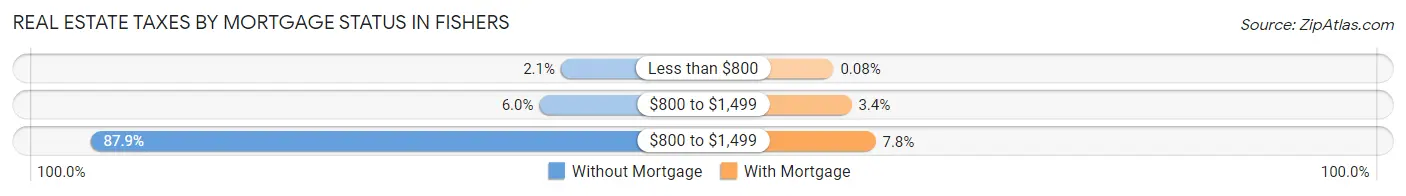
| Property Taxes | Without Mortgage | With Mortgage |
| Less than $800 | 119 (2.1%) | 17 (0.1%) |
| $800 to $1,499 | 346 (6.0%) | 734 (3.4%) |
| $800 to $1,499 | 5,079 (87.9%) | 1,691 (7.8%) |
| Total | 5,776 (100.0%) | 21,792 (100.0%) |
Health & Disability in Fishers
Health Insurance Coverage by Age in Fishers
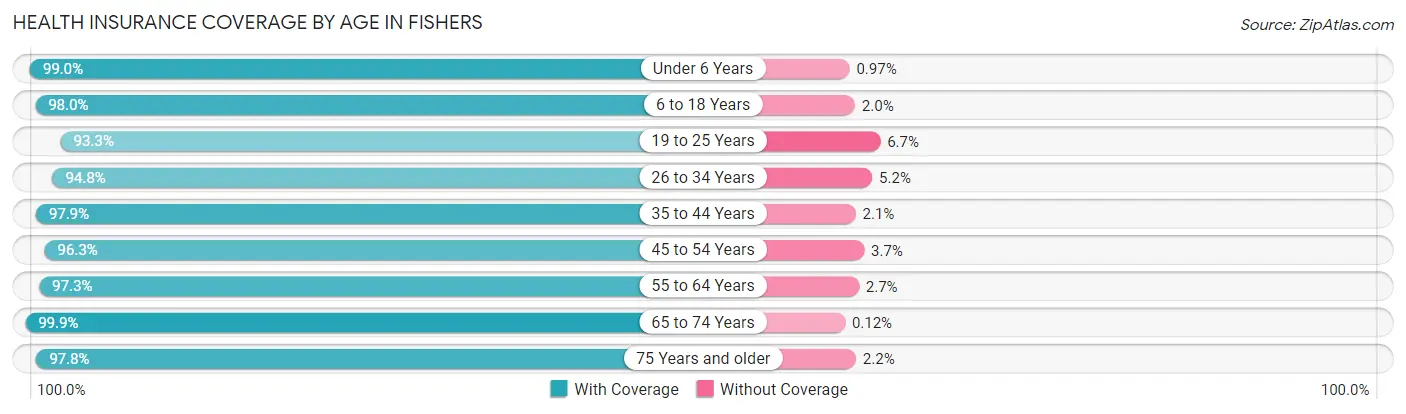
| Age Bracket | With Coverage | Without Coverage |
| Under 6 Years | 7,021 (99.0%) | 69 (1.0%) |
| 6 to 18 Years | 20,957 (98.0%) | 423 (2.0%) |
| 19 to 25 Years | 7,172 (93.3%) | 515 (6.7%) |
| 26 to 34 Years | 9,528 (94.8%) | 523 (5.2%) |
| 35 to 44 Years | 15,904 (97.9%) | 342 (2.1%) |
| 45 to 54 Years | 14,076 (96.3%) | 541 (3.7%) |
| 55 to 64 Years | 10,545 (97.3%) | 295 (2.7%) |
| 65 to 74 Years | 6,707 (99.9%) | 8 (0.1%) |
| 75 Years and older | 3,659 (97.8%) | 81 (2.2%) |
| Total | 95,569 (97.2%) | 2,797 (2.8%) |
Health Insurance Coverage by Citizenship Status in Fishers
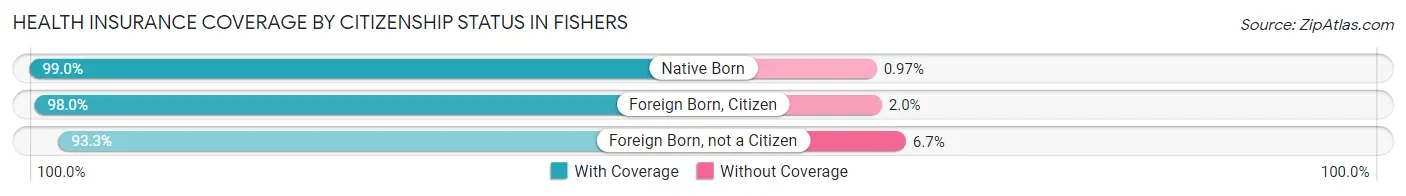
| Citizenship Status | With Coverage | Without Coverage |
| Native Born | 7,021 (99.0%) | 69 (1.0%) |
| Foreign Born, Citizen | 20,957 (98.0%) | 423 (2.0%) |
| Foreign Born, not a Citizen | 7,172 (93.3%) | 515 (6.7%) |
Health Insurance Coverage by Household Income in Fishers
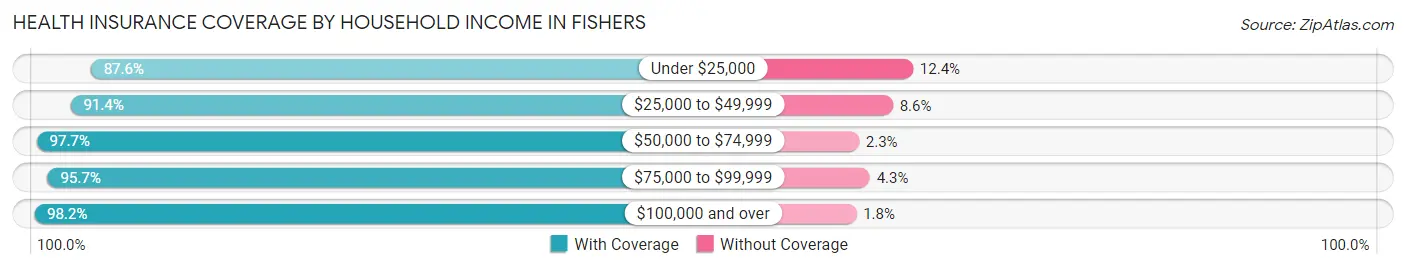
| Household Income | With Coverage | Without Coverage |
| Under $25,000 | 2,905 (87.6%) | 411 (12.4%) |
| $25,000 to $49,999 | 4,784 (91.4%) | 450 (8.6%) |
| $50,000 to $74,999 | 9,580 (97.7%) | 222 (2.3%) |
| $75,000 to $99,999 | 11,211 (95.7%) | 502 (4.3%) |
| $100,000 and over | 67,086 (98.2%) | 1,212 (1.8%) |
Public vs Private Health Insurance Coverage by Age in Fishers
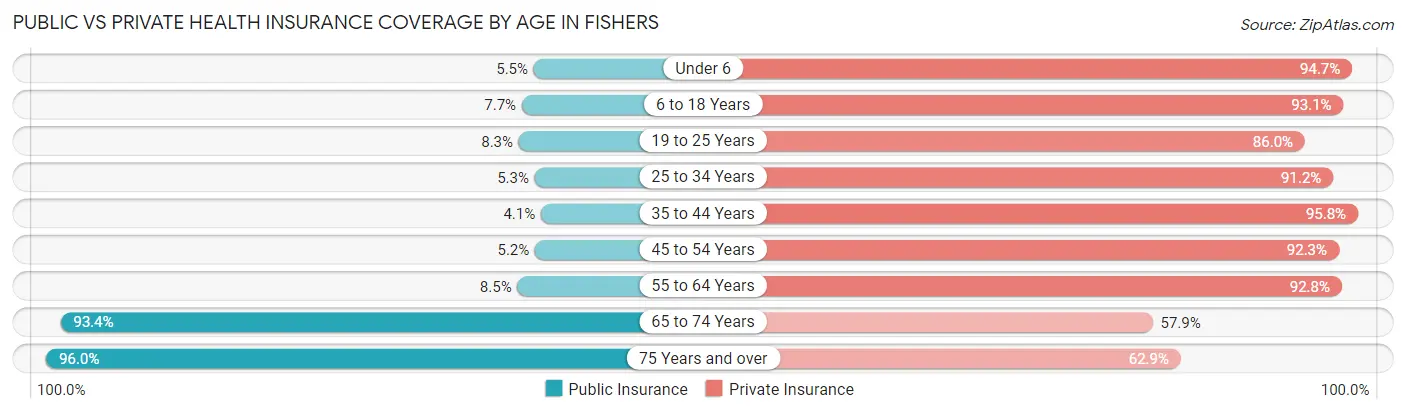
| Age Bracket | Public Insurance | Private Insurance |
| Under 6 | 388 (5.5%) | 6,716 (94.7%) |
| 6 to 18 Years | 1,644 (7.7%) | 19,905 (93.1%) |
| 19 to 25 Years | 635 (8.3%) | 6,607 (86.0%) |
| 25 to 34 Years | 533 (5.3%) | 9,167 (91.2%) |
| 35 to 44 Years | 672 (4.1%) | 15,564 (95.8%) |
| 45 to 54 Years | 766 (5.2%) | 13,485 (92.3%) |
| 55 to 64 Years | 922 (8.5%) | 10,060 (92.8%) |
| 65 to 74 Years | 6,270 (93.4%) | 3,885 (57.9%) |
| 75 Years and over | 3,591 (96.0%) | 2,353 (62.9%) |
| Total | 15,421 (15.7%) | 87,742 (89.2%) |
Disability Status by Sex by Age in Fishers
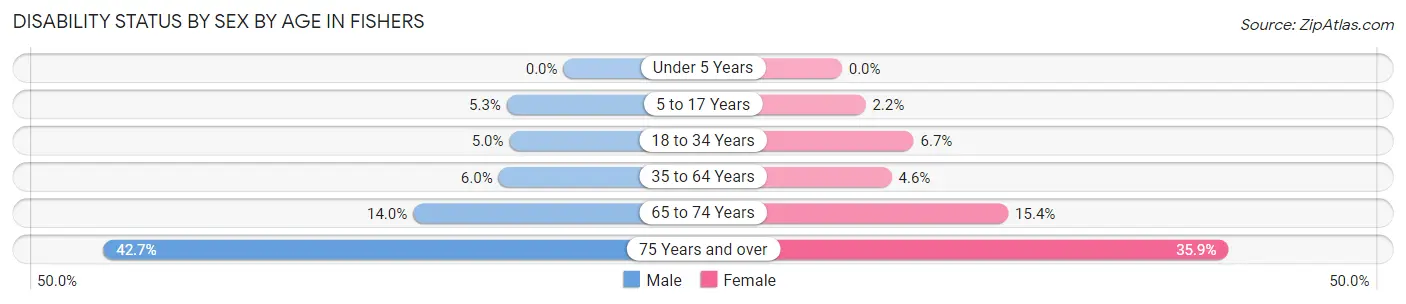
| Age Bracket | Male | Female |
| Under 5 Years | 0 (0.0%) | 0 (0.0%) |
| 5 to 17 Years | 563 (5.3%) | 233 (2.2%) |
| 18 to 34 Years | 485 (5.0%) | 626 (6.7%) |
| 35 to 64 Years | 1,258 (6.0%) | 962 (4.6%) |
| 65 to 74 Years | 429 (14.0%) | 562 (15.4%) |
| 75 Years and over | 555 (42.7%) | 875 (35.9%) |
Disability Class by Sex by Age in Fishers
Disability Class: Hearing Difficulty
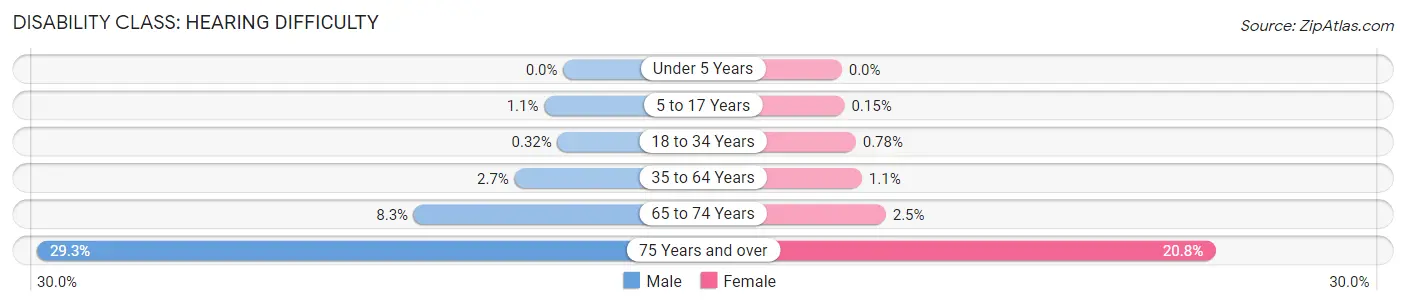
| Age Bracket | Male | Female |
| Under 5 Years | 0 (0.0%) | 0 (0.0%) |
| 5 to 17 Years | 113 (1.1%) | 16 (0.2%) |
| 18 to 34 Years | 31 (0.3%) | 73 (0.8%) |
| 35 to 64 Years | 567 (2.7%) | 232 (1.1%) |
| 65 to 74 Years | 256 (8.3%) | 89 (2.5%) |
| 75 Years and over | 381 (29.3%) | 507 (20.8%) |
Disability Class: Vision Difficulty
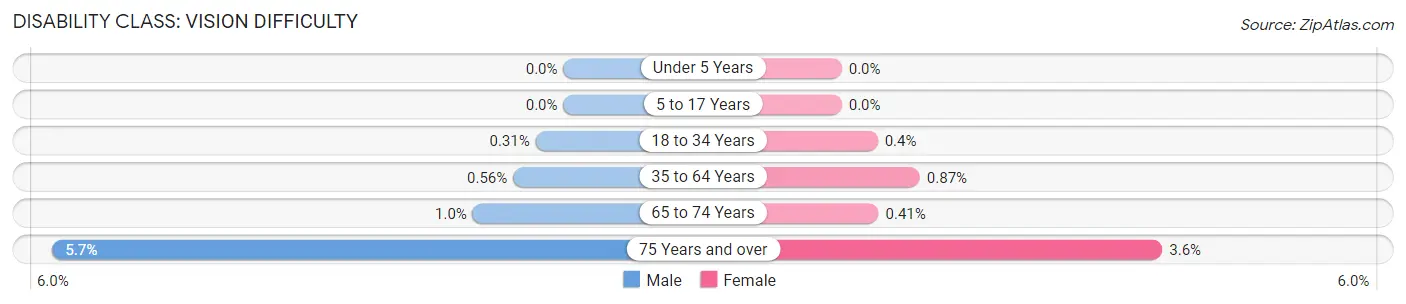
| Age Bracket | Male | Female |
| Under 5 Years | 0 (0.0%) | 0 (0.0%) |
| 5 to 17 Years | 0 (0.0%) | 0 (0.0%) |
| 18 to 34 Years | 30 (0.3%) | 38 (0.4%) |
| 35 to 64 Years | 118 (0.6%) | 181 (0.9%) |
| 65 to 74 Years | 31 (1.0%) | 15 (0.4%) |
| 75 Years and over | 74 (5.7%) | 87 (3.6%) |
Disability Class: Cognitive Difficulty
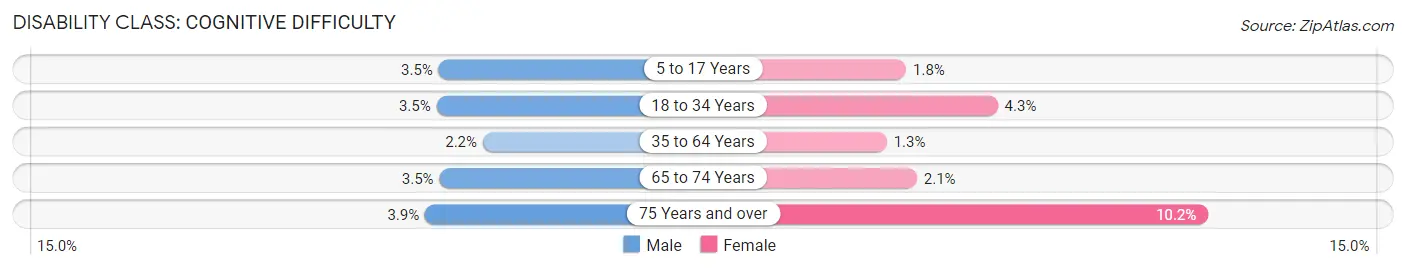
| Age Bracket | Male | Female |
| 5 to 17 Years | 372 (3.5%) | 190 (1.8%) |
| 18 to 34 Years | 342 (3.5%) | 408 (4.3%) |
| 35 to 64 Years | 469 (2.2%) | 259 (1.3%) |
| 65 to 74 Years | 106 (3.5%) | 76 (2.1%) |
| 75 Years and over | 50 (3.8%) | 249 (10.2%) |
Disability Class: Ambulatory Difficulty
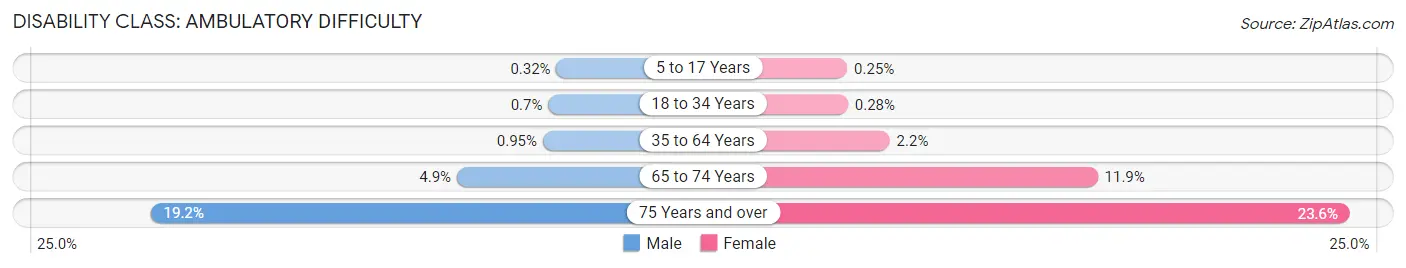
| Age Bracket | Male | Female |
| 5 to 17 Years | 34 (0.3%) | 27 (0.3%) |
| 18 to 34 Years | 68 (0.7%) | 26 (0.3%) |
| 35 to 64 Years | 198 (0.9%) | 462 (2.2%) |
| 65 to 74 Years | 152 (4.9%) | 432 (11.9%) |
| 75 Years and over | 249 (19.2%) | 575 (23.6%) |
Disability Class: Self-Care Difficulty
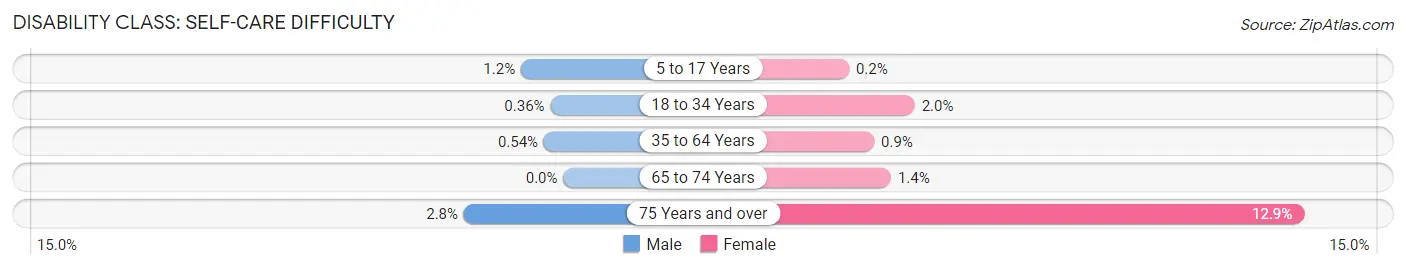
| Age Bracket | Male | Female |
| 5 to 17 Years | 126 (1.2%) | 21 (0.2%) |
| 18 to 34 Years | 35 (0.4%) | 191 (2.0%) |
| 35 to 64 Years | 112 (0.5%) | 187 (0.9%) |
| 65 to 74 Years | 0 (0.0%) | 50 (1.4%) |
| 75 Years and over | 36 (2.8%) | 314 (12.9%) |
Technology Access in Fishers
Computing Device Access in Fishers
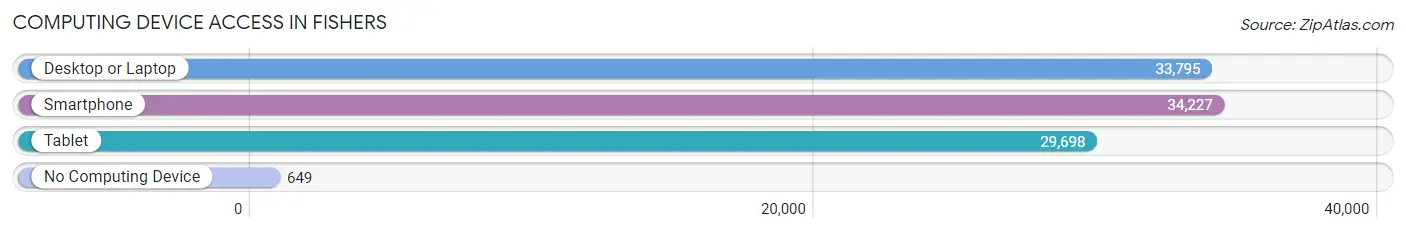
| Device Type | # Households | % Households |
| Desktop or Laptop | 33,795 | 94.5% |
| Smartphone | 34,227 | 95.8% |
| Tablet | 29,698 | 83.1% |
| No Computing Device | 649 | 1.8% |
| Total | 35,747 | 100.0% |
Internet Access in Fishers
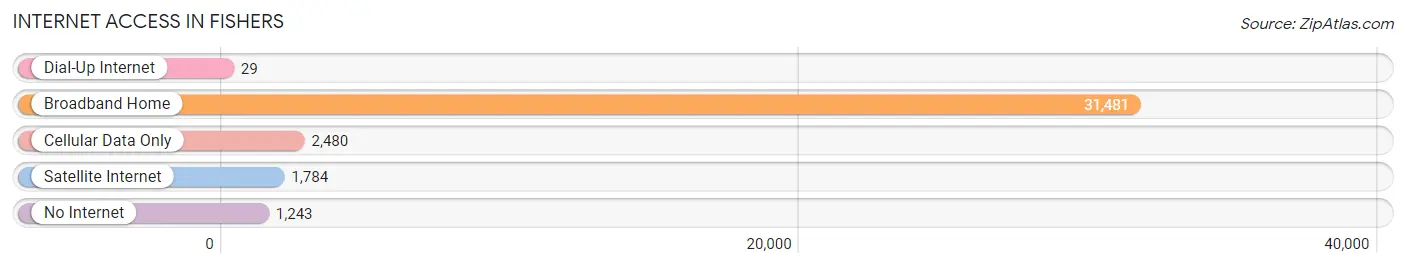
| Internet Type | # Households | % Households |
| Dial-Up Internet | 29 | 0.1% |
| Broadband Home | 31,481 | 88.1% |
| Cellular Data Only | 2,480 | 6.9% |
| Satellite Internet | 1,784 | 5.0% |
| No Internet | 1,243 | 3.5% |
| Total | 35,747 | 100.0% |
Fishers Summary
Fishers, Indiana is a city located in Hamilton County, Indiana, United States. It is a suburb of Indianapolis and is located in the northeastern part of the state. The population of Fishers was 76,794 as of the 2019 census, making it the largest city in Hamilton County.
History
Fishers was first settled in 1802 by William Conner and his family. Conner had previously served in the Revolutionary War and was granted a land patent for the area. The area was originally known as Conner’s Settlement and was later renamed Fishers Switch in 1872. The name was changed to Fishers Station in 1891 and then to Fishers in 1908.
The city was officially incorporated in 1915 and was initially a farming community. The city began to grow in the 1950s and 1960s as the Indianapolis metropolitan area expanded. The city experienced rapid growth in the 1990s and 2000s, becoming one of the fastest-growing cities in the state.
Geography
Fishers is located in the northeastern part of Indiana, approximately 20 miles northeast of Indianapolis. The city is situated in the White River Valley and is bordered by the White River to the east and the Fall Creek to the west. The city covers an area of 36.2 square miles and has a population density of 2,093 people per square mile.
Economy
Fishers is a major economic center in the Indianapolis metropolitan area. The city is home to several large employers, including Roche Diagnostics, Allison Transmission, and Conner Prairie Interactive History Park. The city also has a thriving retail sector, with several large shopping centers and retail outlets.
The city’s economy is also supported by a strong tourism industry. Fishers is home to several attractions, including the Nickel Plate District Amphitheater, the Conner Prairie Interactive History Park, and the Fishers Farmers Market.
Demographics
As of the 2019 census, the population of Fishers was 76,794. The racial makeup of the city was 79.2% White, 8.2% African American, 5.3% Asian, and 4.3% Hispanic or Latino. The median household income was $90,945 and the median home value was $246,400.
Fishers is a diverse and vibrant city with a strong economy and a growing population. The city is home to a variety of businesses, attractions, and amenities, making it an attractive place to live and work.
Common Questions
What is Per Capita Income in Fishers?
Per Capita income in Fishers is $56,089.
What is the Median Family Income in Fishers?
Median Family Income in Fishers is $144,626.
What is the Median Household income in Fishers?
Median Household Income in Fishers is $126,548.
What is Income or Wage Gap in Fishers?
Income or Wage Gap in Fishers is 34.8%.
Women in Fishers earn 65.2 cents for every dollar earned by a man.
What is Inequality or Gini Index in Fishers?
Inequality or Gini Index in Fishers is 0.40.
What is the Total Population of Fishers?
Total Population of Fishers is 99,041.
What is the Total Male Population of Fishers?
Total Male Population of Fishers is 48,911.
What is the Total Female Population of Fishers?
Total Female Population of Fishers is 50,130.
What is the Ratio of Males per 100 Females in Fishers?
There are 97.57 Males per 100 Females in Fishers.
What is the Ratio of Females per 100 Males in Fishers?
There are 102.49 Females per 100 Males in Fishers.
What is the Median Population Age in Fishers?
Median Population Age in Fishers is 37.1 Years.
What is the Average Family Size in Fishers
Average Family Size in Fishers is 3.2 People.
What is the Average Household Size in Fishers
Average Household Size in Fishers is 2.8 People.
How Large is the Labor Force in Fishers?
There are 54,832 People in the Labor Forcein in Fishers.
What is the Percentage of People in the Labor Force in Fishers?
73.0% of People are in the Labor Force in Fishers.
What is the Unemployment Rate in Fishers?
Unemployment Rate in Fishers is 2.5%.