Millcreek, UT Map & Demographics
Millcreek Map
Millcreek Overview
$50,927
PER CAPITA INCOME
$113,292
AVG FAMILY INCOME
$88,186
AVG HOUSEHOLD INCOME
31.5%
WAGE / INCOME GAP [ % ]
68.5¢/ $1
WAGE / INCOME GAP [ $ ]
$10,284
FAMILY INCOME DEFICIT
0.48
INEQUALITY / GINI INDEX
63,520
TOTAL POPULATION
31,517
MALE POPULATION
32,003
FEMALE POPULATION
98.48
MALES / 100 FEMALES
101.54
FEMALES / 100 MALES
37.6
MEDIAN AGE
3.1
AVG FAMILY SIZE
2.5
AVG HOUSEHOLD SIZE
35,325
LABOR FORCE [ PEOPLE ]
68.2%
PERCENT IN LABOR FORCE
4.0%
UNEMPLOYMENT RATE
Income in Millcreek
Income Overview in Millcreek
Per Capita Income in Millcreek is $50,927, while median incomes of families and households are $113,292 and $88,186 respectively.
| Characteristic | Number | Measure |
| Per Capita Income | 63,520 | $50,927 |
| Median Family Income | 15,468 | $113,292 |
| Mean Family Income | 15,468 | $151,560 |
| Median Household Income | 25,500 | $88,186 |
| Mean Household Income | 25,500 | $123,408 |
| Income Deficit | 15,468 | $10,284 |
| Wage / Income Gap (%) | 63,520 | 31.50% |
| Wage / Income Gap ($) | 63,520 | 68.50¢ per $1 |
| Gini / Inequality Index | 63,520 | 0.48 |
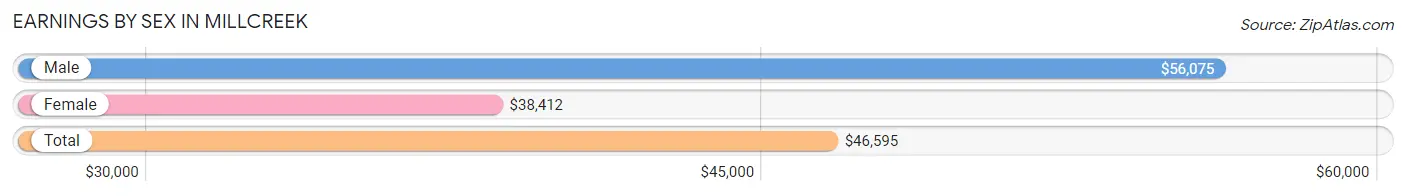
Earnings by Sex in Millcreek
Average Earnings in Millcreek are $46,595, $56,075 for men and $38,412 for women, a difference of 31.5%.
| Sex | Number | Average Earnings |
| Male | 20,341 (54.5%) | $56,075 |
| Female | 17,007 (45.5%) | $38,412 |
| Total | 37,348 (100.0%) | $46,595 |
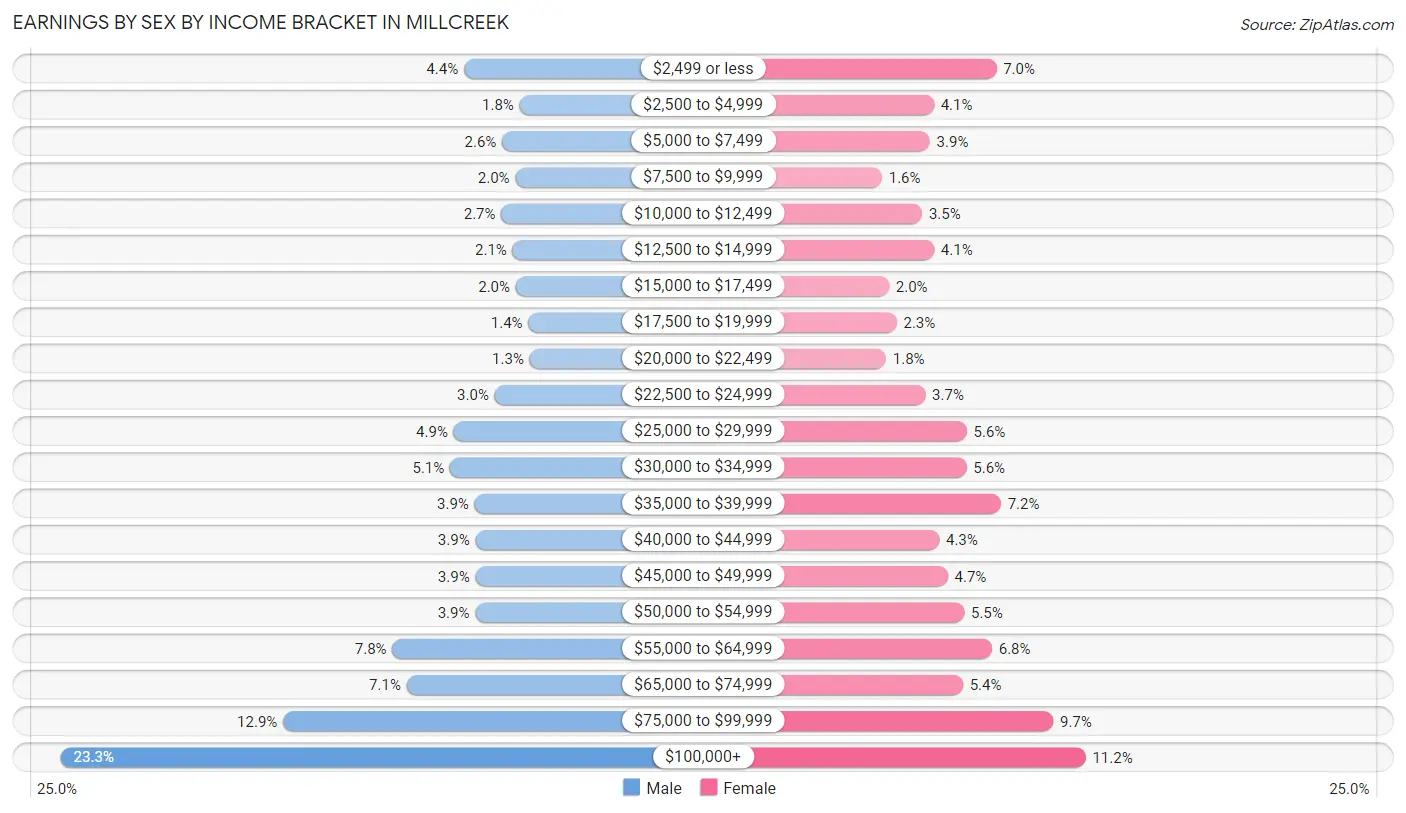
Earnings by Sex by Income Bracket in Millcreek
The most common earnings brackets in Millcreek are $100,000+ for men (4,741 | 23.3%) and $100,000+ for women (1,901 | 11.2%).
| Income | Male | Female |
| $2,499 or less | 899 (4.4%) | 1,190 (7.0%) |
| $2,500 to $4,999 | 368 (1.8%) | 692 (4.1%) |
| $5,000 to $7,499 | 535 (2.6%) | 660 (3.9%) |
| $7,500 to $9,999 | 408 (2.0%) | 279 (1.6%) |
| $10,000 to $12,499 | 543 (2.7%) | 598 (3.5%) |
| $12,500 to $14,999 | 435 (2.1%) | 694 (4.1%) |
| $15,000 to $17,499 | 405 (2.0%) | 335 (2.0%) |
| $17,500 to $19,999 | 284 (1.4%) | 397 (2.3%) |
| $20,000 to $22,499 | 272 (1.3%) | 311 (1.8%) |
| $22,500 to $24,999 | 607 (3.0%) | 625 (3.7%) |
| $25,000 to $29,999 | 996 (4.9%) | 954 (5.6%) |
| $30,000 to $34,999 | 1,032 (5.1%) | 953 (5.6%) |
| $35,000 to $39,999 | 797 (3.9%) | 1,227 (7.2%) |
| $40,000 to $44,999 | 790 (3.9%) | 734 (4.3%) |
| $45,000 to $49,999 | 790 (3.9%) | 803 (4.7%) |
| $50,000 to $54,999 | 792 (3.9%) | 933 (5.5%) |
| $55,000 to $64,999 | 1,581 (7.8%) | 1,154 (6.8%) |
| $65,000 to $74,999 | 1,445 (7.1%) | 924 (5.4%) |
| $75,000 to $99,999 | 2,621 (12.9%) | 1,643 (9.7%) |
| $100,000+ | 4,741 (23.3%) | 1,901 (11.2%) |
| Total | 20,341 (100.0%) | 17,007 (100.0%) |
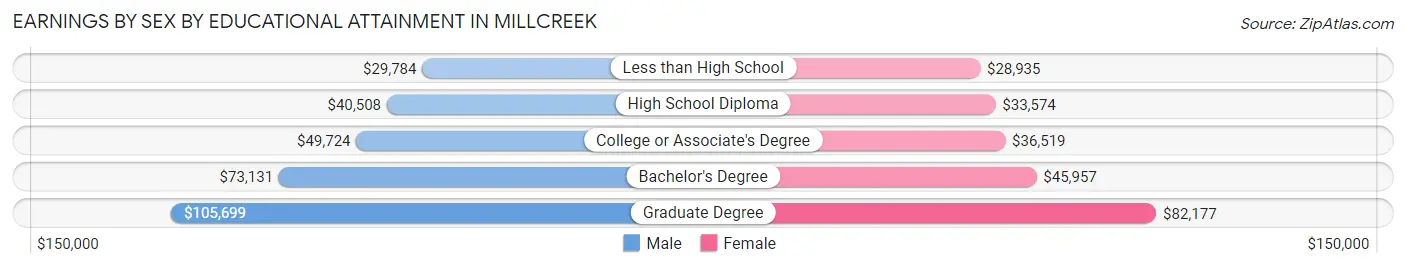
Earnings by Sex by Educational Attainment in Millcreek
Average earnings in Millcreek are $64,816 for men and $44,256 for women, a difference of 31.7%. Men with an educational attainment of graduate degree enjoy the highest average annual earnings of $105,699, while those with less than high school education earn the least with $29,784. Women with an educational attainment of graduate degree earn the most with the average annual earnings of $82,177, while those with less than high school education have the smallest earnings of $28,935.
| Educational Attainment | Male Income | Female Income |
| Less than High School | $29,784 | $28,935 |
| High School Diploma | $40,508 | $33,574 |
| College or Associate's Degree | $49,724 | $36,519 |
| Bachelor's Degree | $73,131 | $45,957 |
| Graduate Degree | $105,699 | $82,177 |
| Total | $64,816 | $44,256 |
Family Income in Millcreek
Family Income Brackets in Millcreek
According to the Millcreek family income data, there are 3,449 families falling into the $100,000 to $149,999 income range, which is the most common income bracket and makes up 22.3% of all families. Conversely, the $10,000 to $14,999 income bracket is the least frequent group with only 247 families (1.6%) belonging to this category.
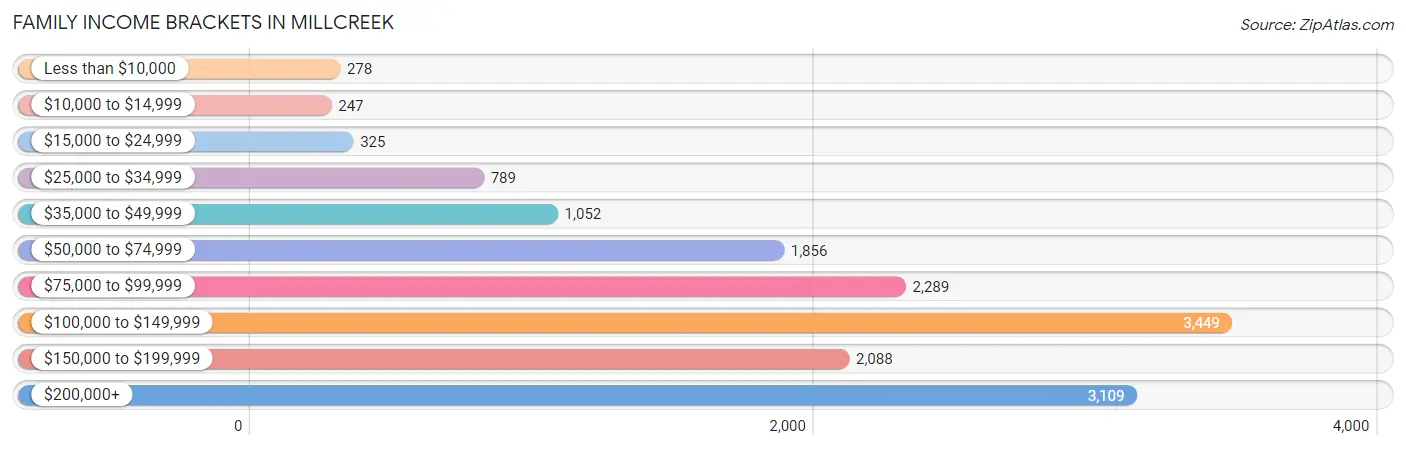
| Income Bracket | # Families | % Families |
| Less than $10,000 | 278 | 1.8% |
| $10,000 to $14,999 | 247 | 1.6% |
| $15,000 to $24,999 | 325 | 2.1% |
| $25,000 to $34,999 | 789 | 5.1% |
| $35,000 to $49,999 | 1,052 | 6.8% |
| $50,000 to $74,999 | 1,856 | 12.0% |
| $75,000 to $99,999 | 2,289 | 14.8% |
| $100,000 to $149,999 | 3,449 | 22.3% |
| $150,000 to $199,999 | 2,088 | 13.5% |
| $200,000+ | 3,109 | 20.1% |
Family Income by Famaliy Size in Millcreek
7+ person families (317 | 2.1%) account for the highest median family income in Millcreek with $161,552 per family, while 2-person families (7,671 | 49.6%) have the highest median income of $48,664 per family member.
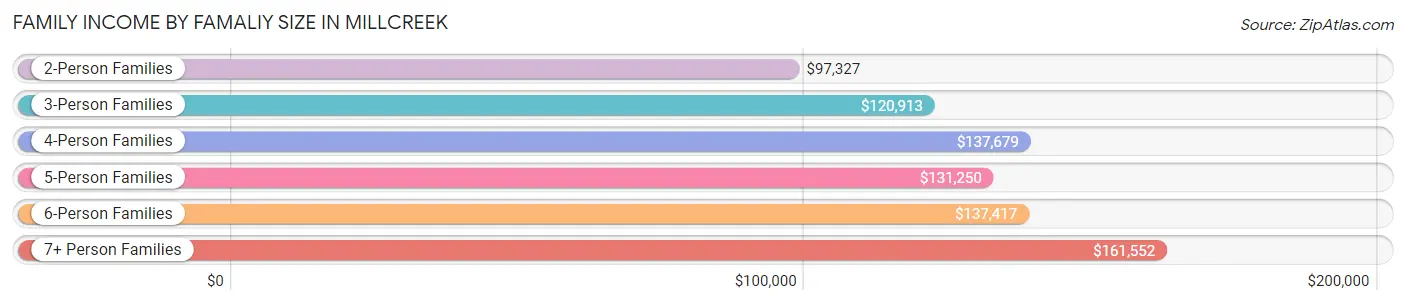
| Income Bracket | # Families | Median Income |
| 2-Person Families | 7,671 (49.6%) | $97,327 |
| 3-Person Families | 2,776 (17.9%) | $120,913 |
| 4-Person Families | 2,885 (18.6%) | $137,679 |
| 5-Person Families | 1,106 (7.1%) | $131,250 |
| 6-Person Families | 713 (4.6%) | $137,417 |
| 7+ Person Families | 317 (2.1%) | $161,552 |
| Total | 15,468 (100.0%) | $113,292 |
Family Income by Number of Earners in Millcreek
The median family income in Millcreek is $113,292, with families comprising 3+ earners (2,235) having the highest median family income of $155,585, while families with no earners (1,891) have the lowest median family income of $61,964, accounting for 14.4% and 12.2% of families, respectively.
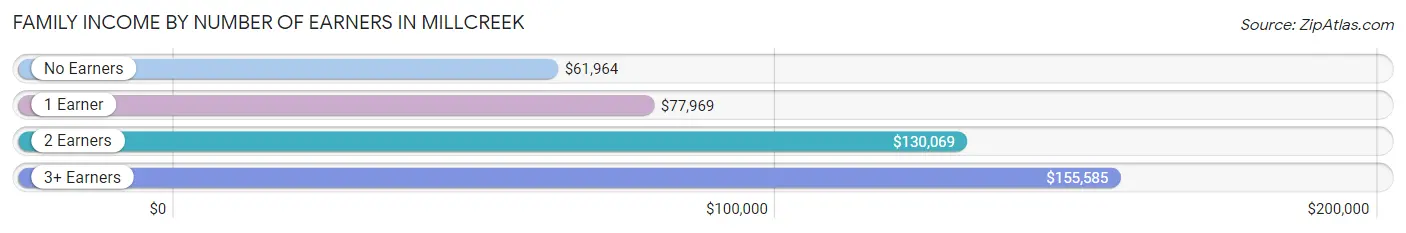
| Number of Earners | # Families | Median Income |
| No Earners | 1,891 (12.2%) | $61,964 |
| 1 Earner | 4,201 (27.2%) | $77,969 |
| 2 Earners | 7,141 (46.2%) | $130,069 |
| 3+ Earners | 2,235 (14.4%) | $155,585 |
| Total | 15,468 (100.0%) | $113,292 |
Household Income in Millcreek
Household Income Brackets in Millcreek
With 4,590 households falling in the category, the $100,000 to $149,999 income range is the most frequent in Millcreek, accounting for 18.0% of all households. In contrast, only 790 households (3.1%) fall into the $10,000 to $14,999 income bracket, making it the least populous group.
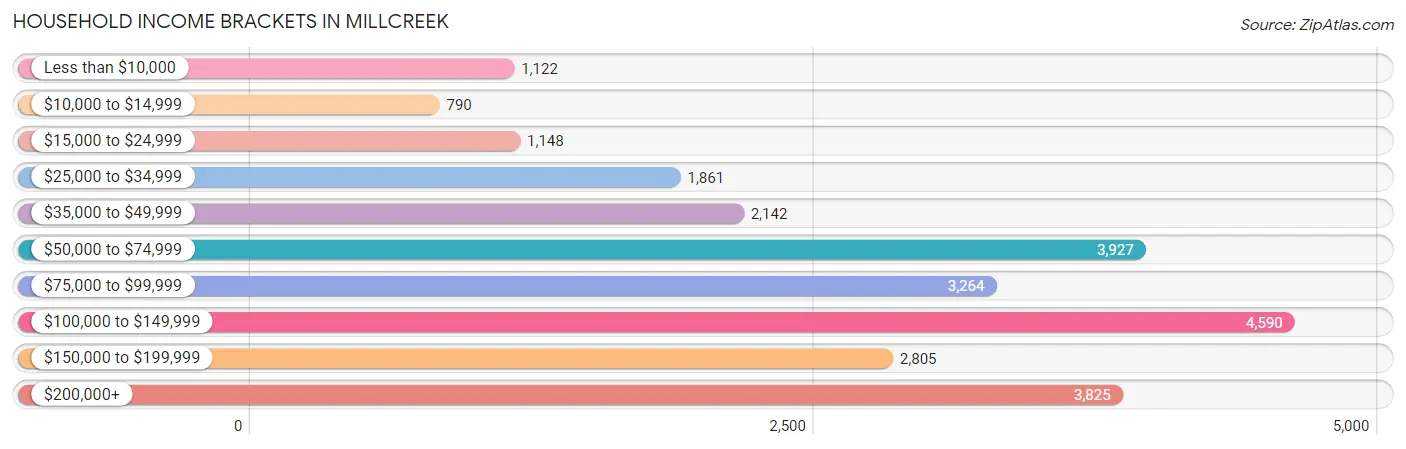
| Income Bracket | # Households | % Households |
| Less than $10,000 | 1,122 | 4.4% |
| $10,000 to $14,999 | 790 | 3.1% |
| $15,000 to $24,999 | 1,148 | 4.5% |
| $25,000 to $34,999 | 1,861 | 7.3% |
| $35,000 to $49,999 | 2,142 | 8.4% |
| $50,000 to $74,999 | 3,927 | 15.4% |
| $75,000 to $99,999 | 3,264 | 12.8% |
| $100,000 to $149,999 | 4,590 | 18.0% |
| $150,000 to $199,999 | 2,805 | 11.0% |
| $200,000+ | 3,825 | 15.0% |
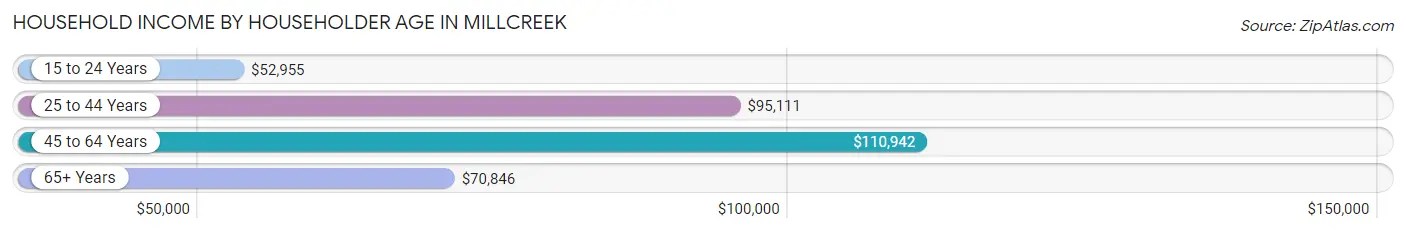
Household Income by Householder Age in Millcreek
The median household income in Millcreek is $88,186, with the highest median household income of $110,942 found in the 45 to 64 years age bracket for the primary householder. A total of 8,058 households (31.6%) fall into this category. Meanwhile, the 15 to 24 years age bracket for the primary householder has the lowest median household income of $52,955, with 822 households (3.2%) in this group.
| Income Bracket | # Households | Median Income |
| 15 to 24 Years | 822 (3.2%) | $52,955 |
| 25 to 44 Years | 10,106 (39.6%) | $95,111 |
| 45 to 64 Years | 8,058 (31.6%) | $110,942 |
| 65+ Years | 6,514 (25.6%) | $70,846 |
| Total | 25,500 (100.0%) | $88,186 |
Poverty in Millcreek
Income Below Poverty by Sex and Age in Millcreek
With 7.8% poverty level for males and 8.7% for females among the residents of Millcreek, 16 and 17 year old males and 5 year old females are the most vulnerable to poverty, with 110 males (14.9%) and 78 females (25.7%) in their respective age groups living below the poverty level.
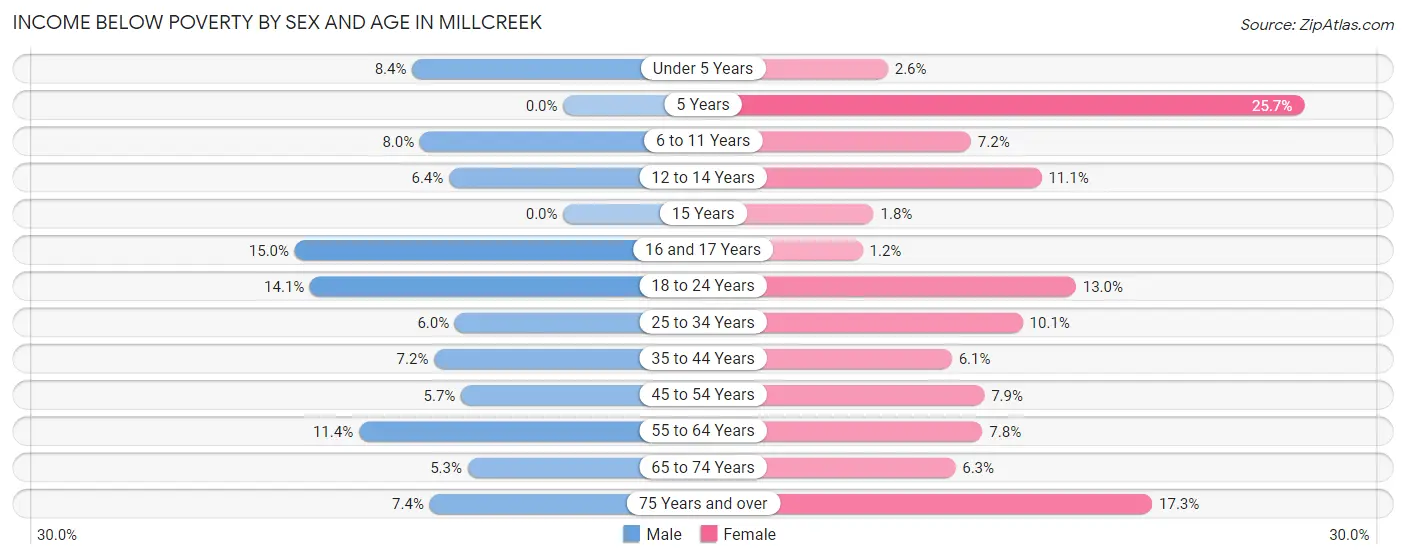
| Age Bracket | Male | Female |
| Under 5 Years | 159 (8.4%) | 47 (2.6%) |
| 5 Years | 0 (0.0%) | 78 (25.7%) |
| 6 to 11 Years | 169 (8.0%) | 146 (7.2%) |
| 12 to 14 Years | 61 (6.4%) | 133 (11.1%) |
| 15 Years | 0 (0.0%) | 8 (1.8%) |
| 16 and 17 Years | 110 (14.9%) | 9 (1.2%) |
| 18 to 24 Years | 387 (14.1%) | 323 (13.0%) |
| 25 to 34 Years | 332 (6.0%) | 505 (10.1%) |
| 35 to 44 Years | 360 (7.2%) | 302 (6.1%) |
| 45 to 54 Years | 221 (5.7%) | 256 (7.9%) |
| 55 to 64 Years | 362 (11.4%) | 283 (7.8%) |
| 65 to 74 Years | 126 (5.3%) | 181 (6.3%) |
| 75 Years and over | 132 (7.4%) | 490 (17.3%) |
| Total | 2,419 (7.8%) | 2,761 (8.7%) |
Income Above Poverty by Sex and Age in Millcreek
According to the poverty statistics in Millcreek, males aged 5 years and females aged 16 and 17 years are the age groups that are most secure financially, with 100.0% of males and 98.8% of females in these age groups living above the poverty line.
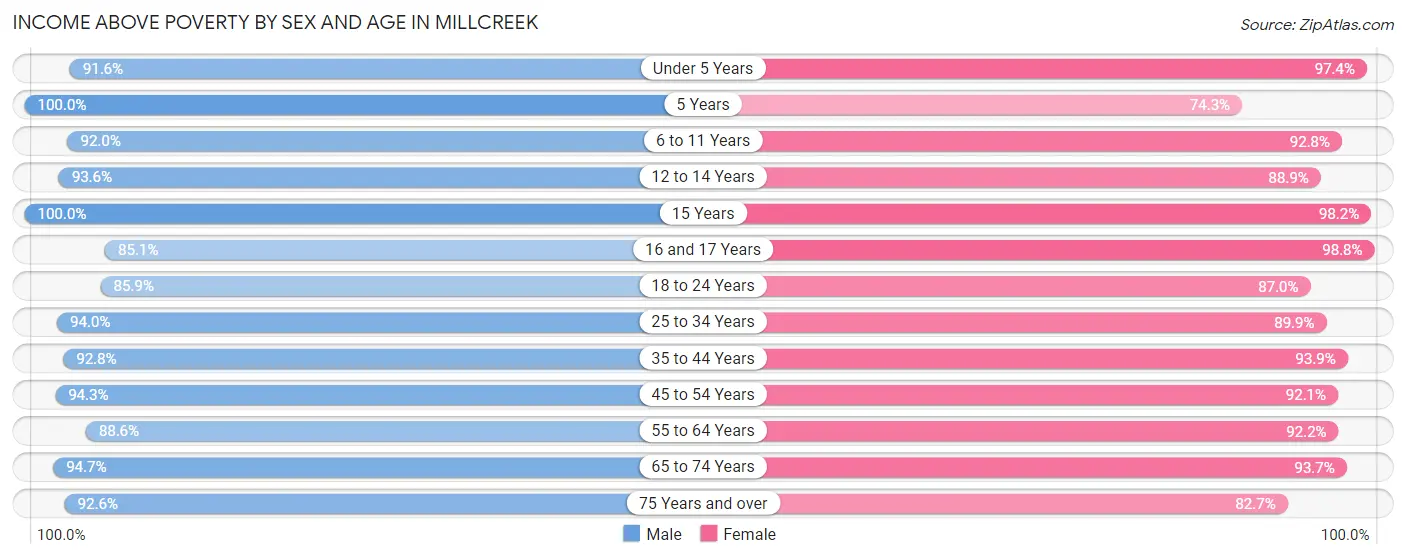
| Age Bracket | Male | Female |
| Under 5 Years | 1,732 (91.6%) | 1,791 (97.4%) |
| 5 Years | 411 (100.0%) | 225 (74.3%) |
| 6 to 11 Years | 1,948 (92.0%) | 1,885 (92.8%) |
| 12 to 14 Years | 898 (93.6%) | 1,063 (88.9%) |
| 15 Years | 456 (100.0%) | 445 (98.2%) |
| 16 and 17 Years | 626 (85.1%) | 770 (98.8%) |
| 18 to 24 Years | 2,357 (85.9%) | 2,156 (87.0%) |
| 25 to 34 Years | 5,178 (94.0%) | 4,508 (89.9%) |
| 35 to 44 Years | 4,649 (92.8%) | 4,633 (93.9%) |
| 45 to 54 Years | 3,660 (94.3%) | 2,971 (92.1%) |
| 55 to 64 Years | 2,820 (88.6%) | 3,331 (92.2%) |
| 65 to 74 Years | 2,243 (94.7%) | 2,685 (93.7%) |
| 75 Years and over | 1,643 (92.6%) | 2,346 (82.7%) |
| Total | 28,621 (92.2%) | 28,809 (91.2%) |
Income Below Poverty Among Married-Couple Families in Millcreek
The poverty statistics for married-couple families in Millcreek show that 4.2% or 509 of the total 12,103 families live below the poverty line. Families with 1 or 2 children have the highest poverty rate of 6.3%, comprising of 232 families. On the other hand, families with 5 or more children have the lowest poverty rate of 0.0%, which includes 0 families.
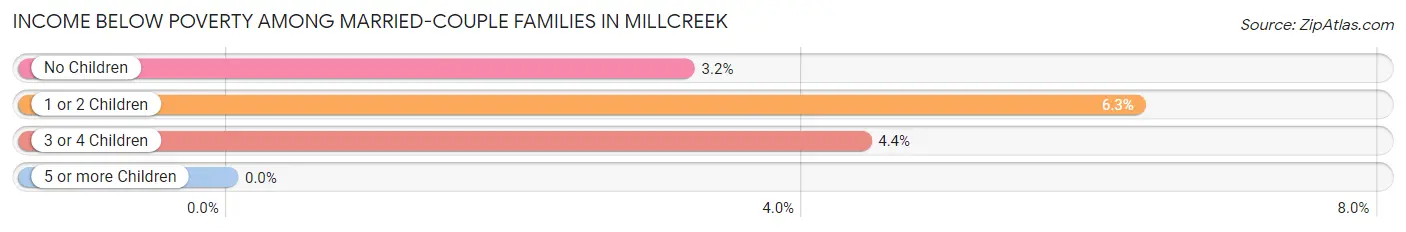
| Children | Above Poverty | Below Poverty |
| No Children | 6,945 (96.8%) | 228 (3.2%) |
| 1 or 2 Children | 3,437 (93.7%) | 232 (6.3%) |
| 3 or 4 Children | 1,062 (95.6%) | 49 (4.4%) |
| 5 or more Children | 150 (100.0%) | 0 (0.0%) |
| Total | 11,594 (95.8%) | 509 (4.2%) |
Income Below Poverty Among Single-Parent Households in Millcreek
According to the poverty data in Millcreek, 5.3% or 56 single-father households and 12.7% or 292 single-mother households are living below the poverty line. Among single-father households, those with 1 or 2 children have the highest poverty rate, with 39 households (7.4%) experiencing poverty. Likewise, among single-mother households, those with 3 or 4 children have the highest poverty rate, with 77 households (43.8%) falling below the poverty line.
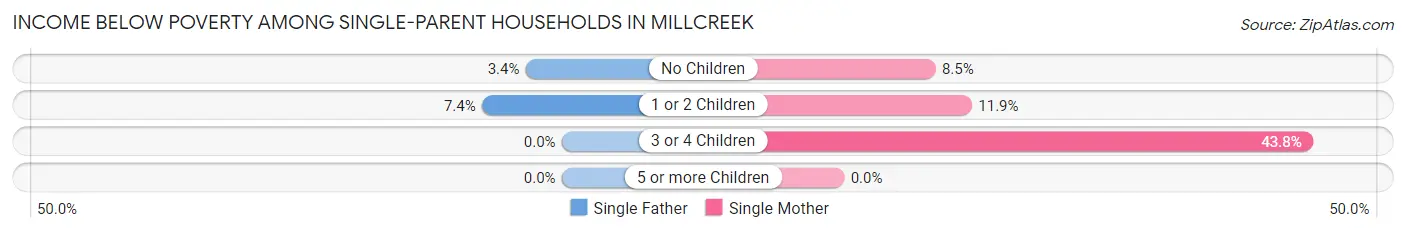
| Children | Single Father | Single Mother |
| No Children | 17 (3.4%) | 91 (8.5%) |
| 1 or 2 Children | 39 (7.4%) | 124 (11.9%) |
| 3 or 4 Children | 0 (0.0%) | 77 (43.8%) |
| 5 or more Children | 0 (0.0%) | 0 (0.0%) |
| Total | 56 (5.3%) | 292 (12.7%) |
Income Below Poverty Among Married-Couple vs Single-Parent Households in Millcreek
The poverty data for Millcreek shows that 509 of the married-couple family households (4.2%) and 348 of the single-parent households (10.3%) are living below the poverty level. Within the married-couple family households, those with 1 or 2 children have the highest poverty rate, with 232 households (6.3%) falling below the poverty line. Among the single-parent households, those with 3 or 4 children have the highest poverty rate, with 77 household (36.7%) living below poverty.
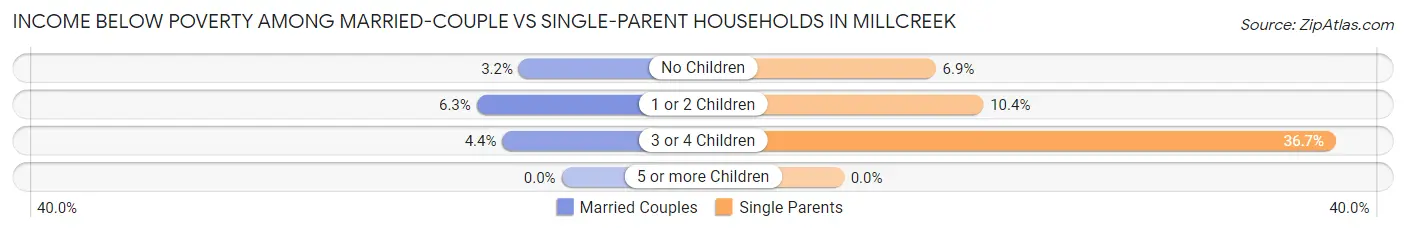
| Children | Married-Couple Families | Single-Parent Households |
| No Children | 228 (3.2%) | 108 (6.9%) |
| 1 or 2 Children | 232 (6.3%) | 163 (10.4%) |
| 3 or 4 Children | 49 (4.4%) | 77 (36.7%) |
| 5 or more Children | 0 (0.0%) | 0 (0.0%) |
| Total | 509 (4.2%) | 348 (10.3%) |
Race in Millcreek
The most populous races in Millcreek are White / Caucasian (51,787 | 81.5%), Hispanic or Latino (5,433 | 8.6%), and Two or more Races (4,619 | 7.3%).
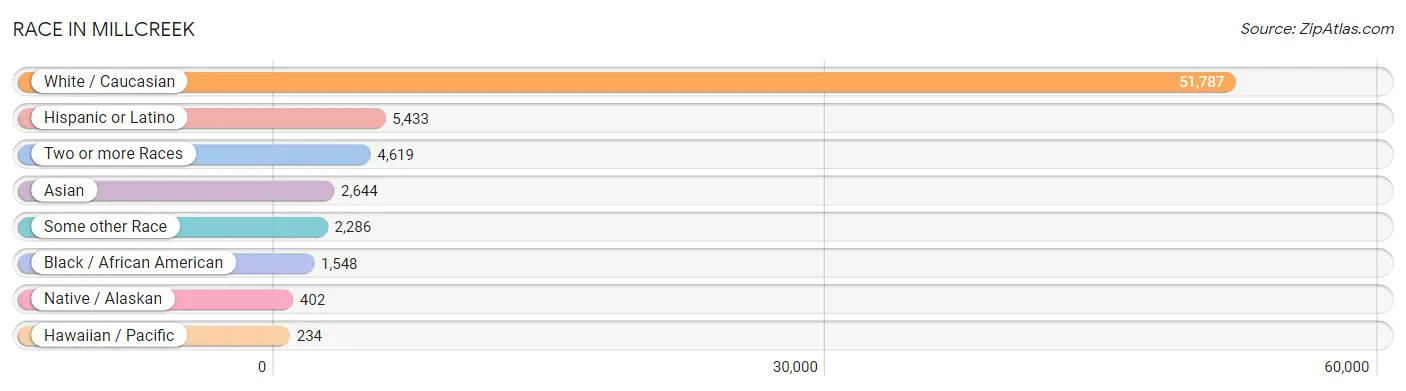
| Race | # Population | % Population |
| Asian | 2,644 | 4.2% |
| Black / African American | 1,548 | 2.4% |
| Hawaiian / Pacific | 234 | 0.4% |
| Hispanic or Latino | 5,433 | 8.6% |
| Native / Alaskan | 402 | 0.6% |
| White / Caucasian | 51,787 | 81.5% |
| Two or more Races | 4,619 | 7.3% |
| Some other Race | 2,286 | 3.6% |
| Total | 63,520 | 100.0% |
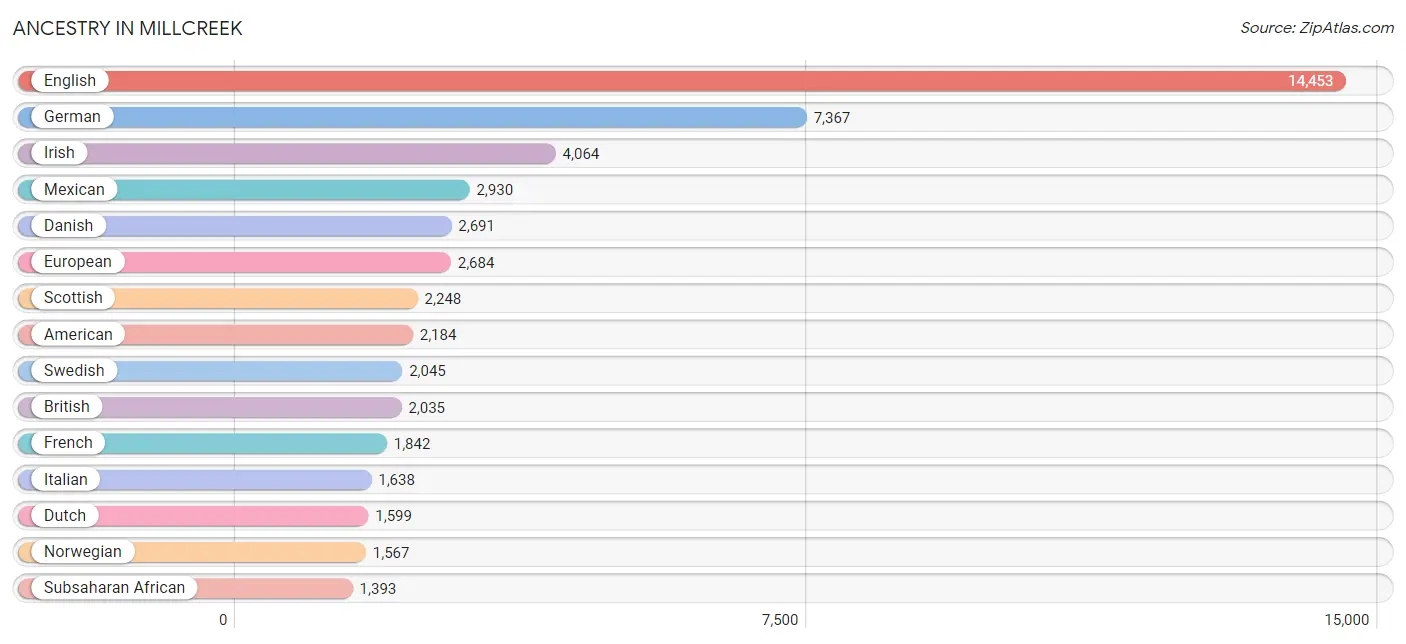
Ancestry in Millcreek
The most populous ancestries reported in Millcreek are English (14,453 | 22.8%), German (7,367 | 11.6%), Irish (4,064 | 6.4%), Mexican (2,930 | 4.6%), and Danish (2,691 | 4.2%), together accounting for 49.6% of all Millcreek residents.
| Ancestry | # Population | % Population |
| African | 1,018 | 1.6% |
| Albanian | 42 | 0.1% |
| American | 2,184 | 3.4% |
| Apache | 11 | 0.0% |
| Arab | 1,191 | 1.9% |
| Argentinean | 108 | 0.2% |
| Armenian | 86 | 0.1% |
| Australian | 61 | 0.1% |
| Austrian | 135 | 0.2% |
| Basque | 13 | 0.0% |
| Belgian | 17 | 0.0% |
| Belizean | 26 | 0.0% |
| Bhutanese | 591 | 0.9% |
| Blackfeet | 25 | 0.0% |
| Bolivian | 72 | 0.1% |
| Brazilian | 438 | 0.7% |
| British | 2,035 | 3.2% |
| British West Indian | 27 | 0.0% |
| Burmese | 493 | 0.8% |
| Cajun | 60 | 0.1% |
| Canadian | 85 | 0.1% |
| Carpatho Rusyn | 18 | 0.0% |
| Celtic | 39 | 0.1% |
| Central American | 567 | 0.9% |
| Central American Indian | 20 | 0.0% |
| Cherokee | 232 | 0.4% |
| Chilean | 83 | 0.1% |
| Chippewa | 10 | 0.0% |
| Choctaw | 13 | 0.0% |
| Colombian | 192 | 0.3% |
| Costa Rican | 9 | 0.0% |
| Croatian | 98 | 0.2% |
| Cuban | 320 | 0.5% |
| Cypriot | 38 | 0.1% |
| Czech | 164 | 0.3% |
| Czechoslovakian | 12 | 0.0% |
| Danish | 2,691 | 4.2% |
| Dominican | 53 | 0.1% |
| Dutch | 1,599 | 2.5% |
| Eastern European | 191 | 0.3% |
| Ecuadorian | 8 | 0.0% |
| Egyptian | 199 | 0.3% |
| English | 14,453 | 22.8% |
| Estonian | 30 | 0.1% |
| Ethiopian | 100 | 0.2% |
| European | 2,684 | 4.2% |
| Filipino | 21 | 0.0% |
| Finnish | 119 | 0.2% |
| French | 1,842 | 2.9% |
| French American Indian | 13 | 0.0% |
| French Canadian | 128 | 0.2% |
| German | 7,367 | 11.6% |
| Greek | 649 | 1.0% |
| Guatemalan | 101 | 0.2% |
| Haitian | 20 | 0.0% |
| Honduran | 143 | 0.2% |
| Hopi | 30 | 0.1% |
| Hungarian | 298 | 0.5% |
| Icelander | 183 | 0.3% |
| Indian (Asian) | 902 | 1.4% |
| Iranian | 468 | 0.7% |
| Iraqi | 533 | 0.8% |
| Irish | 4,064 | 6.4% |
| Iroquois | 6 | 0.0% |
| Italian | 1,638 | 2.6% |
| Jamaican | 57 | 0.1% |
| Japanese | 10 | 0.0% |
| Jordanian | 224 | 0.4% |
| Kenyan | 29 | 0.1% |
| Korean | 497 | 0.8% |
| Laotian | 44 | 0.1% |
| Latvian | 186 | 0.3% |
| Lebanese | 105 | 0.2% |
| Liberian | 30 | 0.1% |
| Lithuanian | 70 | 0.1% |
| Lumbee | 6 | 0.0% |
| Luxembourger | 25 | 0.0% |
| Mexican | 2,930 | 4.6% |
| Mexican American Indian | 73 | 0.1% |
| Mongolian | 35 | 0.1% |
| Native Hawaiian | 141 | 0.2% |
| Navajo | 228 | 0.4% |
| New Zealander | 8 | 0.0% |
| Nicaraguan | 11 | 0.0% |
| Nigerian | 39 | 0.1% |
| Northern European | 312 | 0.5% |
| Norwegian | 1,567 | 2.5% |
| Pakistani | 154 | 0.2% |
| Palestinian | 18 | 0.0% |
| Peruvian | 138 | 0.2% |
| Polish | 585 | 0.9% |
| Portuguese | 98 | 0.2% |
| Pueblo | 18 | 0.0% |
| Puerto Rican | 117 | 0.2% |
| Russian | 374 | 0.6% |
| Salvadoran | 250 | 0.4% |
| Samoan | 83 | 0.1% |
| Scandinavian | 885 | 1.4% |
| Scotch-Irish | 911 | 1.4% |
| Scottish | 2,248 | 3.5% |
| Shoshone | 16 | 0.0% |
| Slavic | 34 | 0.1% |
| Slovak | 57 | 0.1% |
| Slovene | 25 | 0.0% |
| South African | 9 | 0.0% |
| South American | 745 | 1.2% |
| South American Indian | 13 | 0.0% |
| Spaniard | 147 | 0.2% |
| Spanish | 331 | 0.5% |
| Sri Lankan | 135 | 0.2% |
| Subsaharan African | 1,393 | 2.2% |
| Sudanese | 119 | 0.2% |
| Swedish | 2,045 | 3.2% |
| Swiss | 594 | 0.9% |
| Syrian | 203 | 0.3% |
| Thai | 847 | 1.3% |
| Tongan | 63 | 0.1% |
| Turkish | 59 | 0.1% |
| Ukrainian | 98 | 0.2% |
| Uruguayan | 15 | 0.0% |
| Ute | 64 | 0.1% |
| Venezuelan | 129 | 0.2% |
| Welsh | 1,121 | 1.8% |
| Yakama | 8 | 0.0% |
| Yugoslavian | 137 | 0.2% | View All 125 Rows |
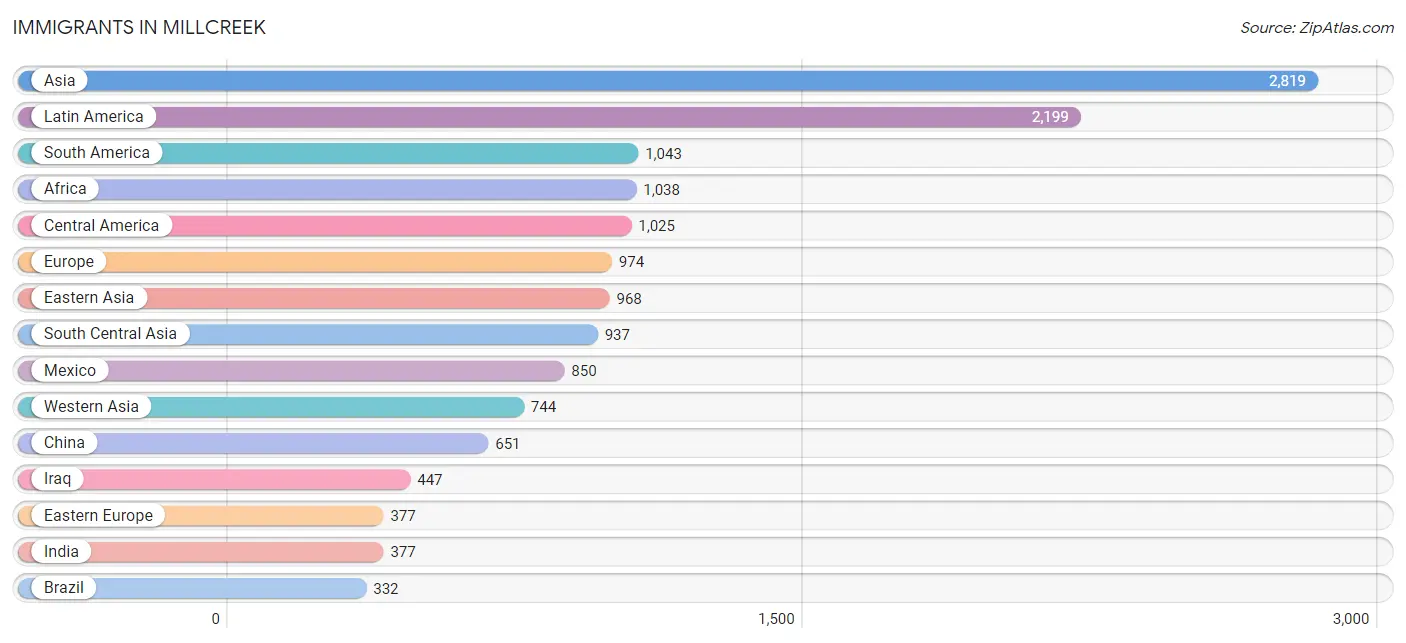
Immigrants in Millcreek
The most numerous immigrant groups reported in Millcreek came from Asia (2,819 | 4.4%), Latin America (2,199 | 3.5%), South America (1,043 | 1.6%), Africa (1,038 | 1.6%), and Central America (1,025 | 1.6%), together accounting for 12.8% of all Millcreek residents.
| Immigration Origin | # Population | % Population |
| Africa | 1,038 | 1.6% |
| Argentina | 72 | 0.1% |
| Armenia | 33 | 0.1% |
| Asia | 2,819 | 4.4% |
| Australia | 10 | 0.0% |
| Austria | 10 | 0.0% |
| Bolivia | 12 | 0.0% |
| Bosnia and Herzegovina | 106 | 0.2% |
| Brazil | 332 | 0.5% |
| Canada | 90 | 0.1% |
| Caribbean | 131 | 0.2% |
| Central America | 1,025 | 1.6% |
| Chile | 67 | 0.1% |
| China | 651 | 1.0% |
| Colombia | 147 | 0.2% |
| Congo | 2 | 0.0% |
| Costa Rica | 9 | 0.0% |
| Cuba | 100 | 0.2% |
| Czechoslovakia | 58 | 0.1% |
| Eastern Africa | 281 | 0.4% |
| Eastern Asia | 968 | 1.5% |
| Eastern Europe | 377 | 0.6% |
| Ecuador | 21 | 0.0% |
| Egypt | 40 | 0.1% |
| El Salvador | 36 | 0.1% |
| England | 110 | 0.2% |
| Ethiopia | 92 | 0.1% |
| Europe | 974 | 1.5% |
| Fiji | 10 | 0.0% |
| France | 42 | 0.1% |
| Germany | 169 | 0.3% |
| Greece | 9 | 0.0% |
| Guatemala | 76 | 0.1% |
| Honduras | 54 | 0.1% |
| Hong Kong | 19 | 0.0% |
| India | 377 | 0.6% |
| Indonesia | 4 | 0.0% |
| Iran | 224 | 0.4% |
| Iraq | 447 | 0.7% |
| Ireland | 14 | 0.0% |
| Israel | 26 | 0.0% |
| Japan | 56 | 0.1% |
| Jordan | 82 | 0.1% |
| Korea | 261 | 0.4% |
| Kuwait | 69 | 0.1% |
| Latin America | 2,199 | 3.5% |
| Liberia | 30 | 0.1% |
| Mexico | 850 | 1.3% |
| Middle Africa | 2 | 0.0% |
| Nepal | 138 | 0.2% |
| Netherlands | 102 | 0.2% |
| Nigeria | 17 | 0.0% |
| Northern Africa | 150 | 0.2% |
| Northern Europe | 251 | 0.4% |
| Norway | 19 | 0.0% |
| Oceania | 65 | 0.1% |
| Pakistan | 126 | 0.2% |
| Peru | 129 | 0.2% |
| Philippines | 69 | 0.1% |
| Poland | 40 | 0.1% |
| Russia | 83 | 0.1% |
| Saudi Arabia | 18 | 0.0% |
| Scotland | 20 | 0.0% |
| Singapore | 17 | 0.0% |
| Somalia | 32 | 0.1% |
| South Africa | 13 | 0.0% |
| South America | 1,043 | 1.6% |
| South Central Asia | 937 | 1.5% |
| South Eastern Asia | 152 | 0.2% |
| Southern Europe | 14 | 0.0% |
| Spain | 5 | 0.0% |
| Sudan | 105 | 0.2% |
| Sweden | 26 | 0.0% |
| Switzerland | 9 | 0.0% |
| Syria | 60 | 0.1% |
| Taiwan | 22 | 0.0% |
| Trinidad and Tobago | 31 | 0.1% |
| Turkey | 3 | 0.0% |
| Uruguay | 15 | 0.0% |
| Venezuela | 248 | 0.4% |
| Vietnam | 62 | 0.1% |
| Western Africa | 280 | 0.4% |
| Western Asia | 744 | 1.2% |
| Western Europe | 332 | 0.5% |
| Zimbabwe | 12 | 0.0% | View All 85 Rows |
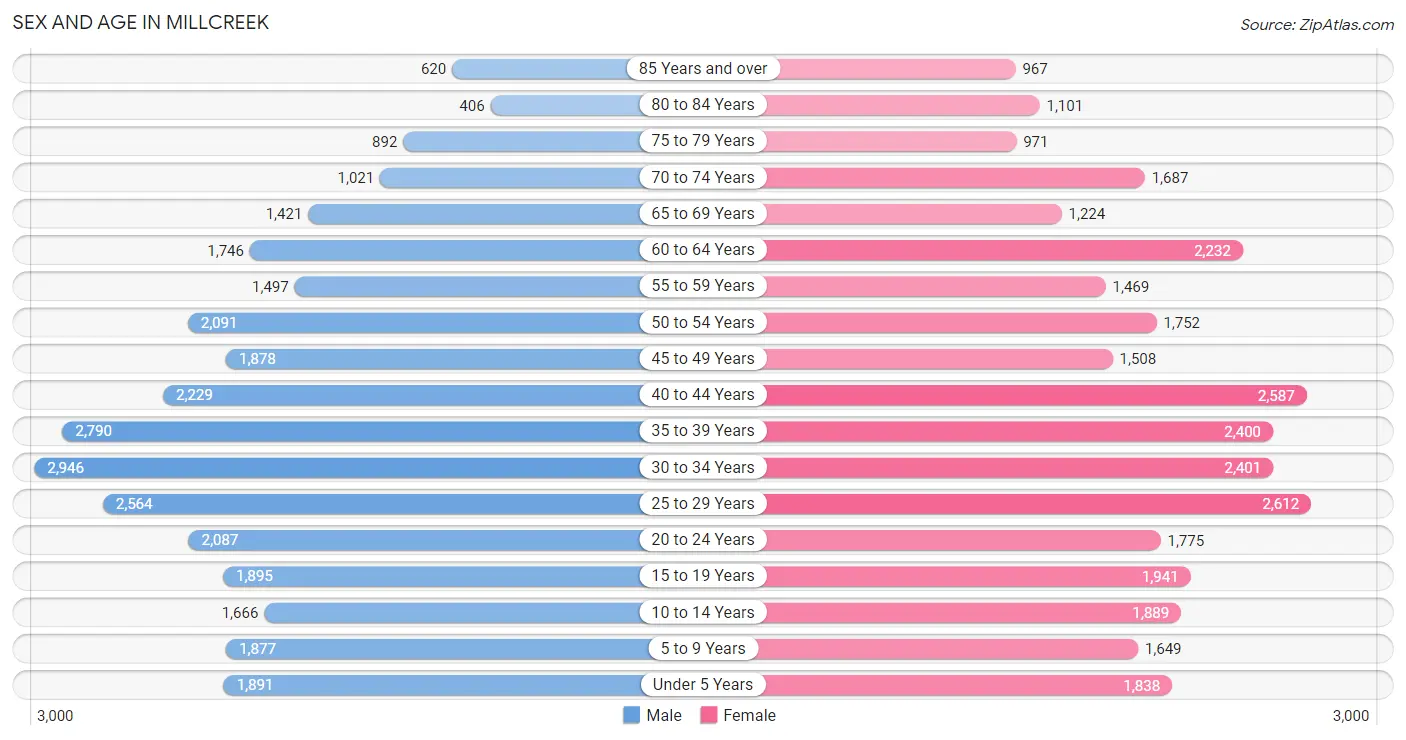
Sex and Age in Millcreek
Sex and Age in Millcreek
The most populous age groups in Millcreek are 30 to 34 Years (2,946 | 9.3%) for men and 25 to 29 Years (2,612 | 8.2%) for women.
| Age Bracket | Male | Female |
| Under 5 Years | 1,891 (6.0%) | 1,838 (5.7%) |
| 5 to 9 Years | 1,877 (6.0%) | 1,649 (5.1%) |
| 10 to 14 Years | 1,666 (5.3%) | 1,889 (5.9%) |
| 15 to 19 Years | 1,895 (6.0%) | 1,941 (6.1%) |
| 20 to 24 Years | 2,087 (6.6%) | 1,775 (5.6%) |
| 25 to 29 Years | 2,564 (8.1%) | 2,612 (8.2%) |
| 30 to 34 Years | 2,946 (9.3%) | 2,401 (7.5%) |
| 35 to 39 Years | 2,790 (8.8%) | 2,400 (7.5%) |
| 40 to 44 Years | 2,229 (7.1%) | 2,587 (8.1%) |
| 45 to 49 Years | 1,878 (6.0%) | 1,508 (4.7%) |
| 50 to 54 Years | 2,091 (6.6%) | 1,752 (5.5%) |
| 55 to 59 Years | 1,497 (4.8%) | 1,469 (4.6%) |
| 60 to 64 Years | 1,746 (5.5%) | 2,232 (7.0%) |
| 65 to 69 Years | 1,421 (4.5%) | 1,224 (3.8%) |
| 70 to 74 Years | 1,021 (3.2%) | 1,687 (5.3%) |
| 75 to 79 Years | 892 (2.8%) | 971 (3.0%) |
| 80 to 84 Years | 406 (1.3%) | 1,101 (3.4%) |
| 85 Years and over | 620 (2.0%) | 967 (3.0%) |
| Total | 31,517 (100.0%) | 32,003 (100.0%) |
Families and Households in Millcreek
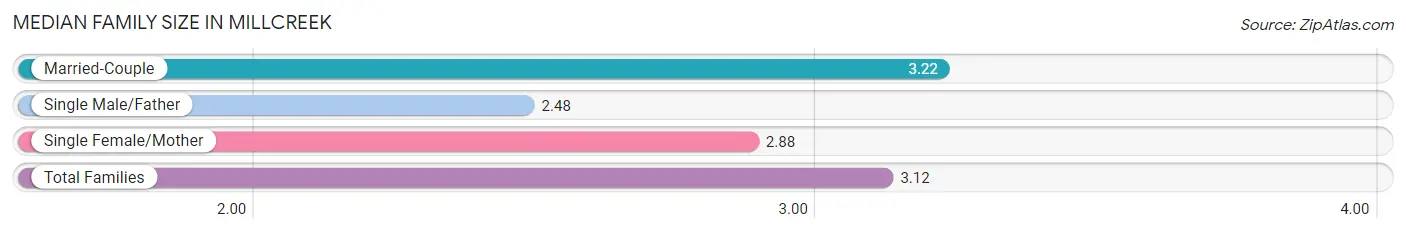
Median Family Size in Millcreek
The median family size in Millcreek is 3.12 persons per family, with married-couple families (12,103 | 78.2%) accounting for the largest median family size of 3.22 persons per family. On the other hand, single male/father families (1,063 | 6.9%) represent the smallest median family size with 2.48 persons per family.
| Family Type | # Families | Family Size |
| Married-Couple | 12,103 (78.2%) | 3.22 |
| Single Male/Father | 1,063 (6.9%) | 2.48 |
| Single Female/Mother | 2,302 (14.9%) | 2.88 |
| Total Families | 15,468 (100.0%) | 3.12 |
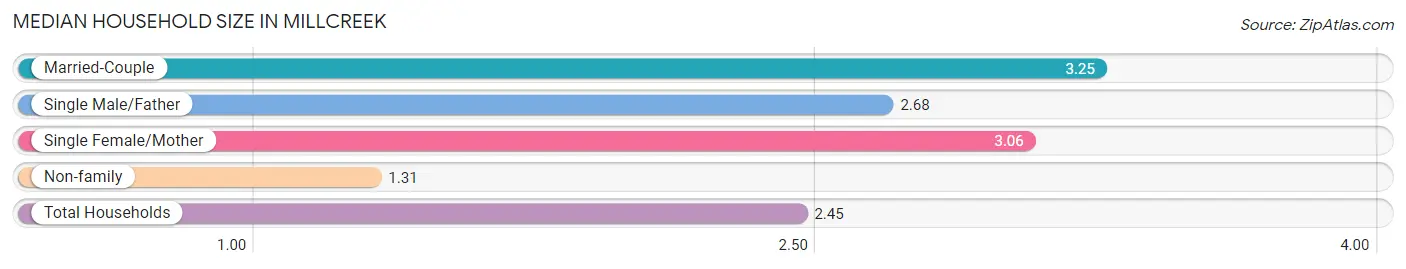
Median Household Size in Millcreek
The median household size in Millcreek is 2.45 persons per household, with married-couple households (12,103 | 47.5%) accounting for the largest median household size of 3.25 persons per household. non-family households (10,032 | 39.3%) represent the smallest median household size with 1.31 persons per household.
| Household Type | # Households | Household Size |
| Married-Couple | 12,103 (47.5%) | 3.25 |
| Single Male/Father | 1,063 (4.2%) | 2.68 |
| Single Female/Mother | 2,302 (9.0%) | 3.06 |
| Non-family | 10,032 (39.3%) | 1.31 |
| Total Households | 25,500 (100.0%) | 2.45 |
Household Size by Marriage Status in Millcreek
Out of a total of 25,500 households in Millcreek, 15,468 (60.7%) are family households, while 10,032 (39.3%) are nonfamily households. The most numerous type of family households are 2-person households, comprising 7,360, and the most common type of nonfamily households are 1-person households, comprising 7,895.

| Household Size | Family Households | Nonfamily Households |
| 1-Person Households | - | 7,895 (31.0%) |
| 2-Person Households | 7,360 (28.9%) | 1,729 (6.8%) |
| 3-Person Households | 2,705 (10.6%) | 265 (1.0%) |
| 4-Person Households | 3,103 (12.2%) | 103 (0.4%) |
| 5-Person Households | 1,196 (4.7%) | 40 (0.2%) |
| 6-Person Households | 787 (3.1%) | 0 (0.0%) |
| 7+ Person Households | 317 (1.2%) | 0 (0.0%) |
| Total | 15,468 (60.7%) | 10,032 (39.3%) |
Female Fertility in Millcreek
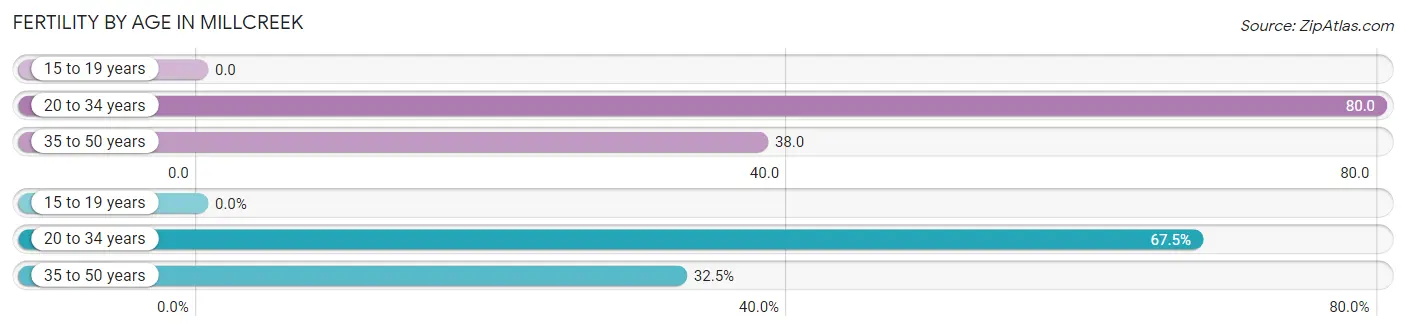
Fertility by Age in Millcreek
Average fertility rate in Millcreek is 51.0 births per 1,000 women. Women in the age bracket of 20 to 34 years have the highest fertility rate with 80.0 births per 1,000 women. Women in the age bracket of 20 to 34 years acount for 67.5% of all women with births.
| Age Bracket | Women with Births | Births / 1,000 Women |
| 15 to 19 years | 0 (0.0%) | 0.0 |
| 20 to 34 years | 542 (67.5%) | 80.0 |
| 35 to 50 years | 261 (32.5%) | 38.0 |
| Total | 803 (100.0%) | 51.0 |
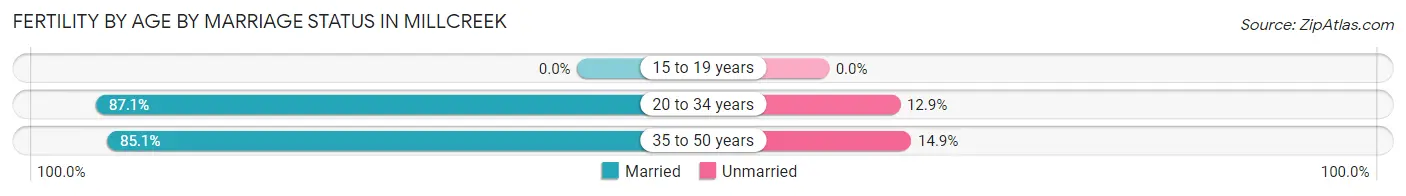
Fertility by Age by Marriage Status in Millcreek
86.4% of women with births (803) in Millcreek are married. The highest percentage of unmarried women with births falls into 35 to 50 years age bracket with 14.9% of them unmarried at the time of birth, while the lowest percentage of unmarried women with births belong to 20 to 34 years age bracket with 12.9% of them unmarried.
| Age Bracket | Married | Unmarried |
| 15 to 19 years | 0 (0.0%) | 0 (0.0%) |
| 20 to 34 years | 472 (87.1%) | 70 (12.9%) |
| 35 to 50 years | 222 (85.1%) | 39 (14.9%) |
| Total | 694 (86.4%) | 109 (13.6%) |
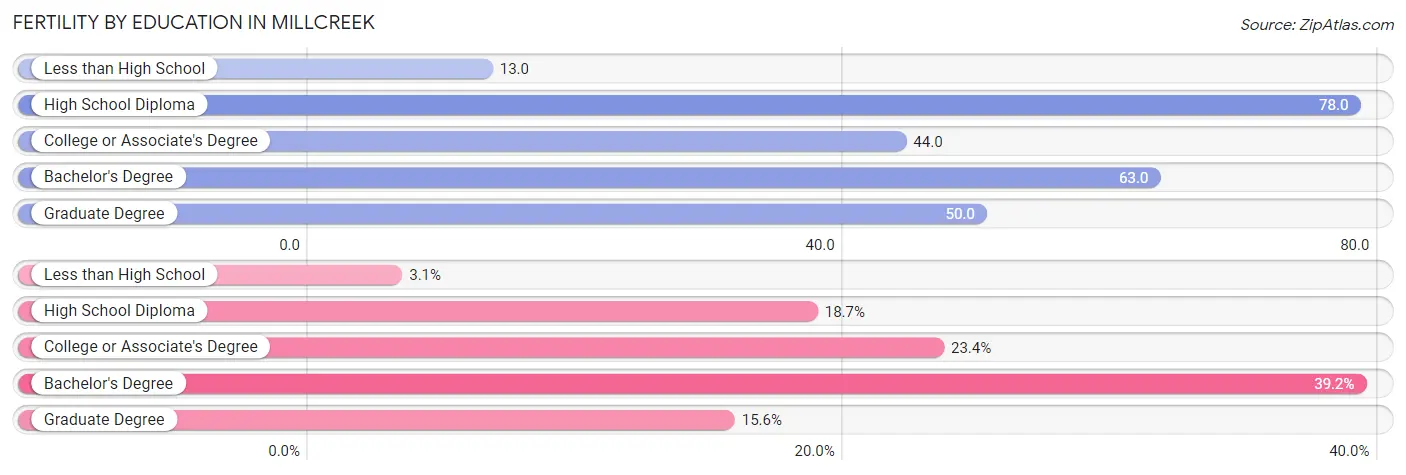
Fertility by Education in Millcreek
Average fertility rate in Millcreek is 51.0 births per 1,000 women. Women with the education attainment of high school diploma have the highest fertility rate of 78.0 births per 1,000 women, while women with the education attainment of less than high school have the lowest fertility at 13.0 births per 1,000 women. Women with the education attainment of bachelor's degree represent 39.2% of all women with births.
| Educational Attainment | Women with Births | Births / 1,000 Women |
| Less than High School | 25 (3.1%) | 13.0 |
| High School Diploma | 150 (18.7%) | 78.0 |
| College or Associate's Degree | 188 (23.4%) | 44.0 |
| Bachelor's Degree | 315 (39.2%) | 63.0 |
| Graduate Degree | 125 (15.6%) | 50.0 |
| Total | 803 (100.0%) | 51.0 |
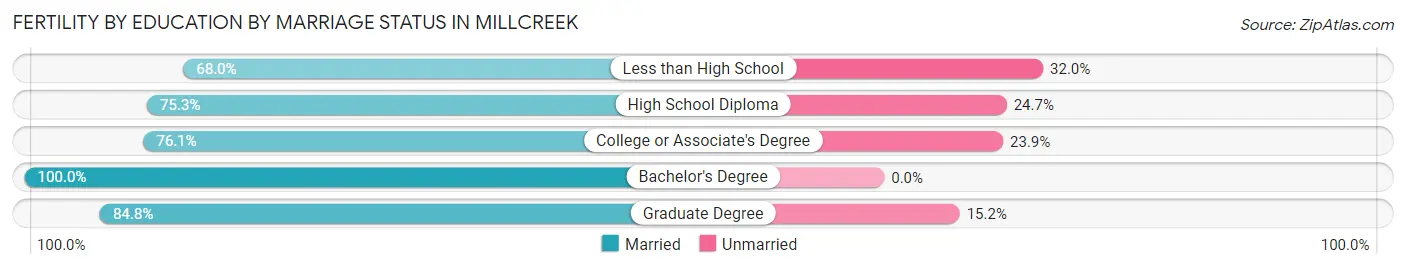
Fertility by Education by Marriage Status in Millcreek
13.6% of women with births in Millcreek are unmarried. Women with the educational attainment of bachelor's degree are most likely to be married with 100.0% of them married at childbirth, while women with the educational attainment of less than high school are least likely to be married with 32.0% of them unmarried at childbirth.
| Educational Attainment | Married | Unmarried |
| Less than High School | 17 (68.0%) | 8 (32.0%) |
| High School Diploma | 113 (75.3%) | 37 (24.7%) |
| College or Associate's Degree | 143 (76.1%) | 45 (23.9%) |
| Bachelor's Degree | 315 (100.0%) | 0 (0.0%) |
| Graduate Degree | 106 (84.8%) | 19 (15.2%) |
| Total | 694 (86.4%) | 109 (13.6%) |
Employment Characteristics in Millcreek
Employment by Class of Employer in Millcreek
Among the 33,164 employed individuals in Millcreek, private company employees (20,788 | 62.7%), not-for-profit organizations (3,232 | 9.8%), and state government employees (2,585 | 7.8%) make up the most common classes of employment.
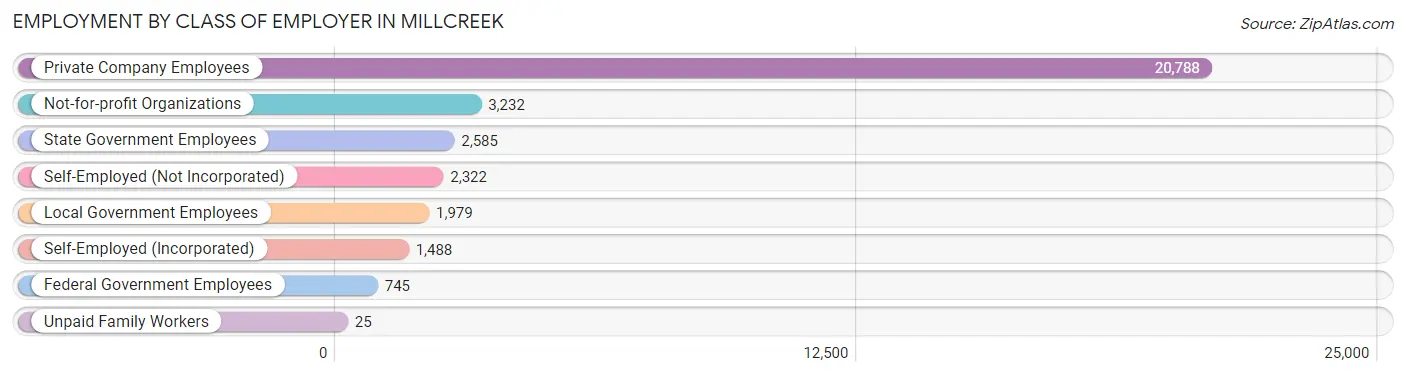
| Employer Class | # Employees | % Employees |
| Private Company Employees | 20,788 | 62.7% |
| Self-Employed (Incorporated) | 1,488 | 4.5% |
| Self-Employed (Not Incorporated) | 2,322 | 7.0% |
| Not-for-profit Organizations | 3,232 | 9.8% |
| Local Government Employees | 1,979 | 6.0% |
| State Government Employees | 2,585 | 7.8% |
| Federal Government Employees | 745 | 2.2% |
| Unpaid Family Workers | 25 | 0.1% |
| Total | 33,164 | 100.0% |
Employment Status by Age in Millcreek
According to the labor force statistics for Millcreek, out of the total population over 16 years of age (51,796), 68.2% or 35,325 individuals are in the labor force, with 4.0% or 1,413 of them unemployed. The age group with the highest labor force participation rate is 30 to 34 years, with 93.6% or 5,005 individuals in the labor force. Within the labor force, the 20 to 24 years age range has the highest percentage of unemployed individuals, with 13.0% or 419 of them being unemployed.
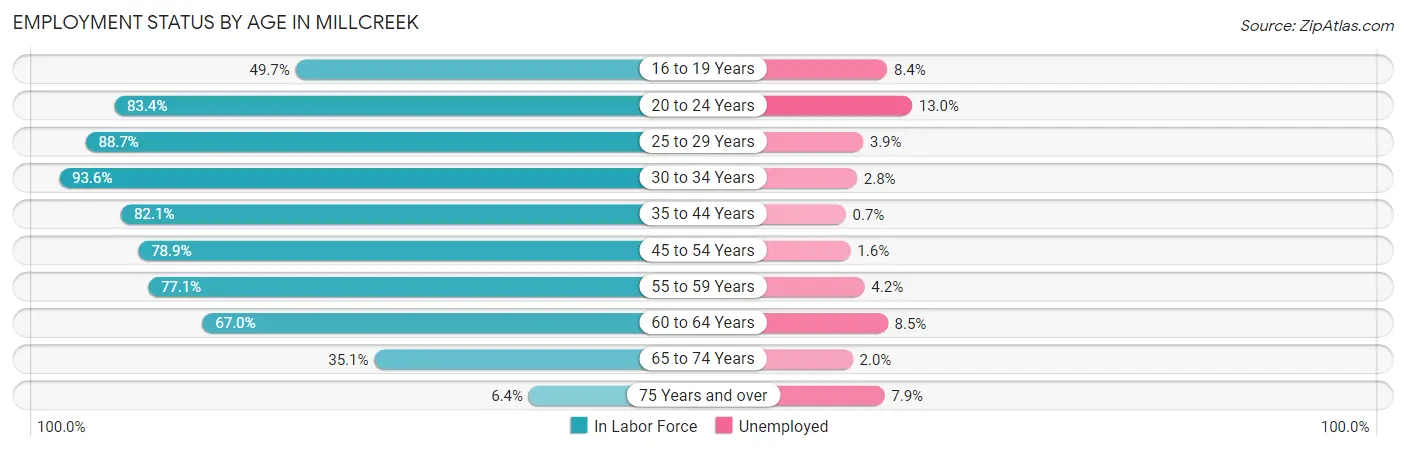
| Age Bracket | In Labor Force | Unemployed |
| 16 to 19 Years | 1,452 (49.7%) | 122 (8.4%) |
| 20 to 24 Years | 3,221 (83.4%) | 419 (13.0%) |
| 25 to 29 Years | 4,591 (88.7%) | 179 (3.9%) |
| 30 to 34 Years | 5,005 (93.6%) | 140 (2.8%) |
| 35 to 44 Years | 8,215 (82.1%) | 58 (0.7%) |
| 45 to 54 Years | 5,704 (78.9%) | 91 (1.6%) |
| 55 to 59 Years | 2,287 (77.1%) | 96 (4.2%) |
| 60 to 64 Years | 2,665 (67.0%) | 227 (8.5%) |
| 65 to 74 Years | 1,879 (35.1%) | 38 (2.0%) |
| 75 Years and over | 317 (6.4%) | 25 (7.9%) |
| Total | 35,325 (68.2%) | 1,413 (4.0%) |
Employment Status by Educational Attainment in Millcreek
According to labor force statistics for Millcreek, 82.0% of individuals (28,456) out of the total population between 25 and 64 years of age (34,702) are in the labor force, with 2.8% or 797 of them being unemployed. The group with the highest labor force participation rate are those with the educational attainment of bachelor's degree or higher, with 86.3% or 16,078 individuals in the labor force. Within the labor force, individuals with high school diploma education have the highest percentage of unemployment, with 5.6% or 207 of them being unemployed.
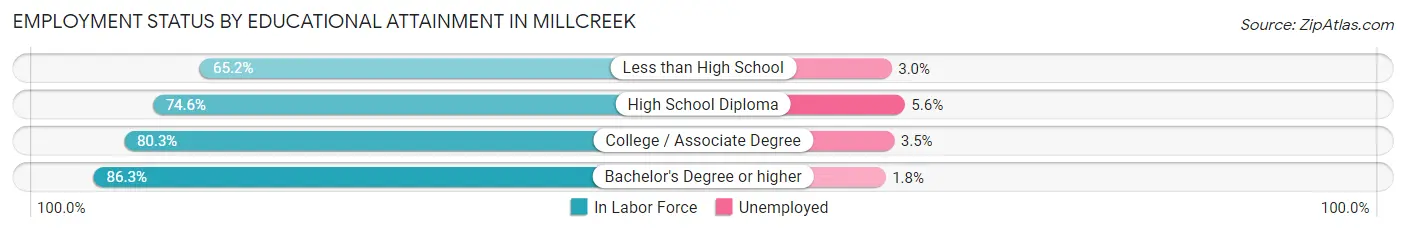
| Educational Attainment | In Labor Force | Unemployed |
| Less than High School | 1,007 (65.2%) | 46 (3.0%) |
| High School Diploma | 3,701 (74.6%) | 278 (5.6%) |
| College / Associate Degree | 7,681 (80.3%) | 335 (3.5%) |
| Bachelor's Degree or higher | 16,078 (86.3%) | 335 (1.8%) |
| Total | 28,456 (82.0%) | 972 (2.8%) |
Employment Occupations by Sex in Millcreek
Management, Business, Science and Arts Occupations
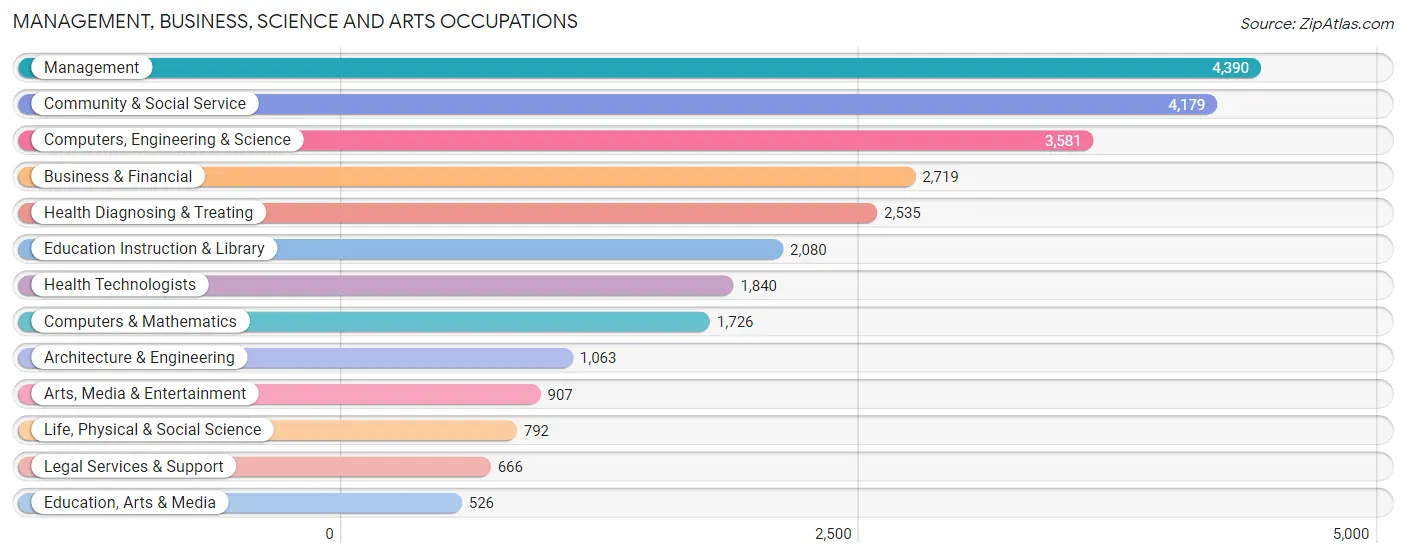
The most common Management, Business, Science and Arts occupations in Millcreek are Management (4,390 | 13.0%), Community & Social Service (4,179 | 12.3%), Computers, Engineering & Science (3,581 | 10.6%), Business & Financial (2,719 | 8.0%), and Health Diagnosing & Treating (2,535 | 7.5%).
Management, Business, Science and Arts Occupations by Sex
Within the Management, Business, Science and Arts occupations in Millcreek, the most male-oriented occupations are Architecture & Engineering (88.4%), Computers, Engineering & Science (80.3%), and Computers & Mathematics (80.3%), while the most female-oriented occupations are Education Instruction & Library (68.3%), Health Diagnosing & Treating (67.8%), and Health Technologists (62.1%).
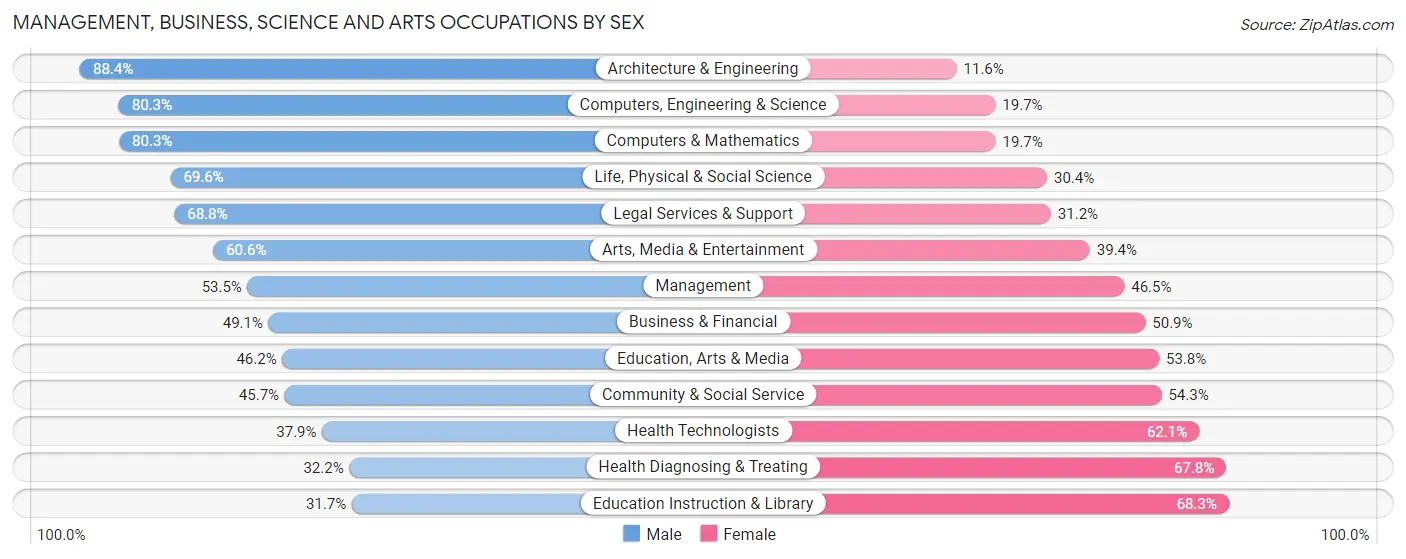
| Occupation | Male | Female |
| Management | 2,347 (53.5%) | 2,043 (46.5%) |
| Business & Financial | 1,334 (49.1%) | 1,385 (50.9%) |
| Computers, Engineering & Science | 2,877 (80.3%) | 704 (19.7%) |
| Computers & Mathematics | 1,386 (80.3%) | 340 (19.7%) |
| Architecture & Engineering | 940 (88.4%) | 123 (11.6%) |
| Life, Physical & Social Science | 551 (69.6%) | 241 (30.4%) |
| Community & Social Service | 1,910 (45.7%) | 2,269 (54.3%) |
| Education, Arts & Media | 243 (46.2%) | 283 (53.8%) |
| Legal Services & Support | 458 (68.8%) | 208 (31.2%) |
| Education Instruction & Library | 659 (31.7%) | 1,421 (68.3%) |
| Arts, Media & Entertainment | 550 (60.6%) | 357 (39.4%) |
| Health Diagnosing & Treating | 817 (32.2%) | 1,718 (67.8%) |
| Health Technologists | 697 (37.9%) | 1,143 (62.1%) |
| Total (Category) | 9,285 (53.3%) | 8,119 (46.7%) |
| Total (Overall) | 18,520 (54.6%) | 15,390 (45.4%) |
Services Occupations
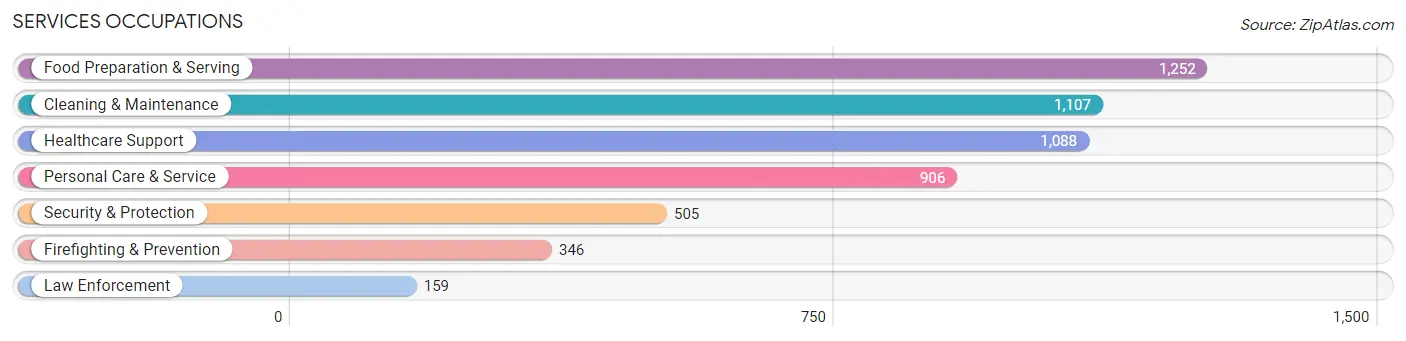
The most common Services occupations in Millcreek are Food Preparation & Serving (1,252 | 3.7%), Cleaning & Maintenance (1,107 | 3.3%), Healthcare Support (1,088 | 3.2%), Personal Care & Service (906 | 2.7%), and Security & Protection (505 | 1.5%).
Services Occupations by Sex
Within the Services occupations in Millcreek, the most male-oriented occupations are Law Enforcement (70.4%), Cleaning & Maintenance (68.7%), and Security & Protection (66.5%), while the most female-oriented occupations are Healthcare Support (83.1%), Personal Care & Service (82.6%), and Food Preparation & Serving (45.8%).
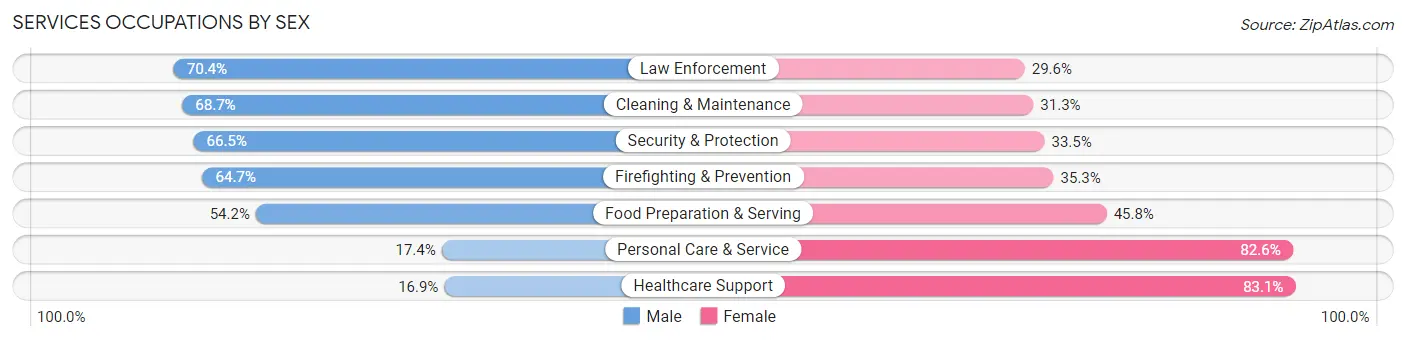
| Occupation | Male | Female |
| Healthcare Support | 184 (16.9%) | 904 (83.1%) |
| Security & Protection | 336 (66.5%) | 169 (33.5%) |
| Firefighting & Prevention | 224 (64.7%) | 122 (35.3%) |
| Law Enforcement | 112 (70.4%) | 47 (29.6%) |
| Food Preparation & Serving | 679 (54.2%) | 573 (45.8%) |
| Cleaning & Maintenance | 761 (68.7%) | 346 (31.3%) |
| Personal Care & Service | 158 (17.4%) | 748 (82.6%) |
| Total (Category) | 2,118 (43.6%) | 2,740 (56.4%) |
| Total (Overall) | 18,520 (54.6%) | 15,390 (45.4%) |
Sales and Office Occupations
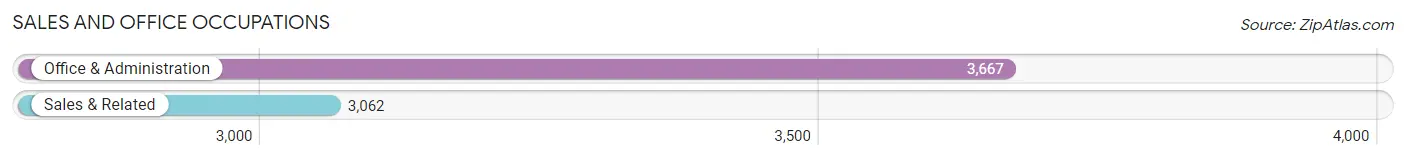
The most common Sales and Office occupations in Millcreek are Office & Administration (3,667 | 10.8%), and Sales & Related (3,062 | 9.0%).
Sales and Office Occupations by Sex
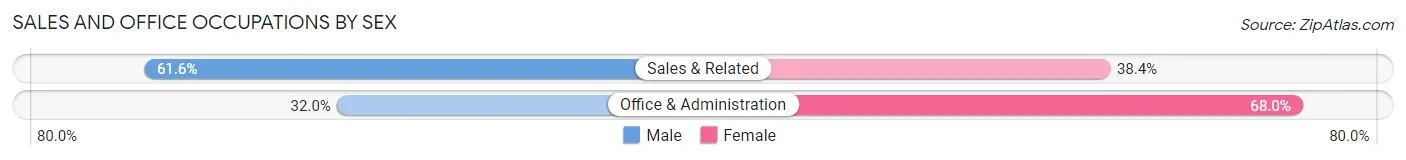
| Occupation | Male | Female |
| Sales & Related | 1,887 (61.6%) | 1,175 (38.4%) |
| Office & Administration | 1,173 (32.0%) | 2,494 (68.0%) |
| Total (Category) | 3,060 (45.5%) | 3,669 (54.5%) |
| Total (Overall) | 18,520 (54.6%) | 15,390 (45.4%) |
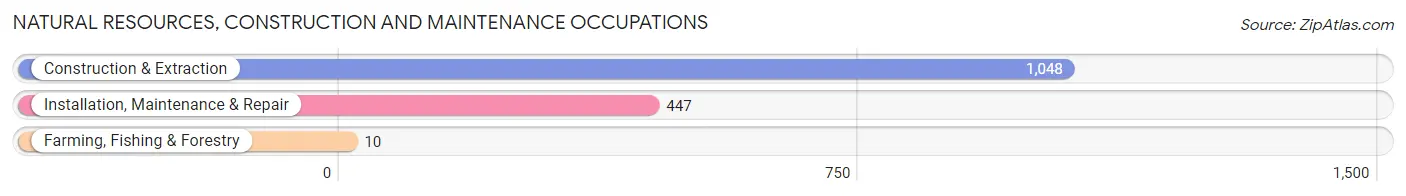
Natural Resources, Construction and Maintenance Occupations
The most common Natural Resources, Construction and Maintenance occupations in Millcreek are Construction & Extraction (1,048 | 3.1%), Installation, Maintenance & Repair (447 | 1.3%), and Farming, Fishing & Forestry (10 | 0.0%).
Natural Resources, Construction and Maintenance Occupations by Sex
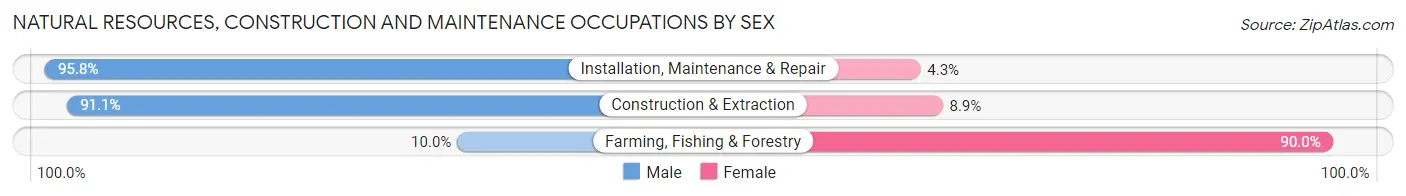
| Occupation | Male | Female |
| Farming, Fishing & Forestry | 1 (10.0%) | 9 (90.0%) |
| Construction & Extraction | 955 (91.1%) | 93 (8.9%) |
| Installation, Maintenance & Repair | 428 (95.8%) | 19 (4.3%) |
| Total (Category) | 1,384 (92.0%) | 121 (8.0%) |
| Total (Overall) | 18,520 (54.6%) | 15,390 (45.4%) |
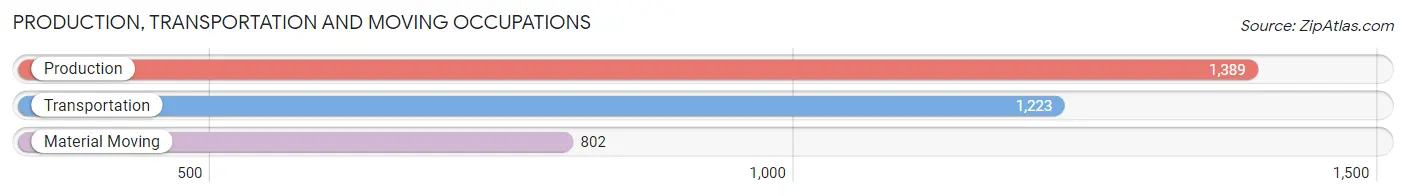
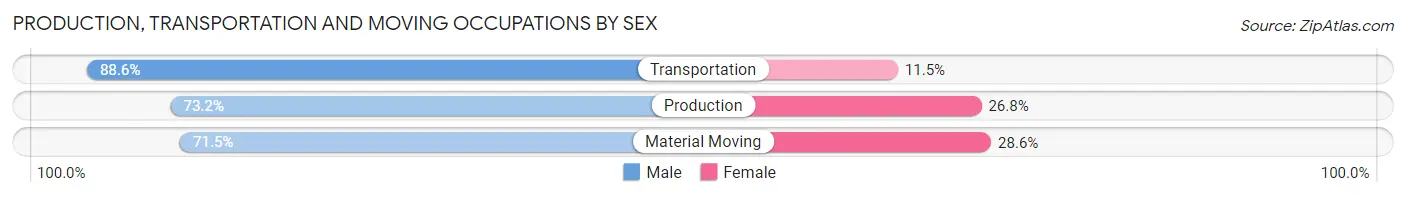
Production, Transportation and Moving Occupations
The most common Production, Transportation and Moving occupations in Millcreek are Production (1,389 | 4.1%), Transportation (1,223 | 3.6%), and Material Moving (802 | 2.4%).
Production, Transportation and Moving Occupations by Sex
| Occupation | Male | Female |
| Production | 1,017 (73.2%) | 372 (26.8%) |
| Transportation | 1,083 (88.5%) | 140 (11.5%) |
| Material Moving | 573 (71.5%) | 229 (28.5%) |
| Total (Category) | 2,673 (78.3%) | 741 (21.7%) |
| Total (Overall) | 18,520 (54.6%) | 15,390 (45.4%) |
Employment Industries by Sex in Millcreek
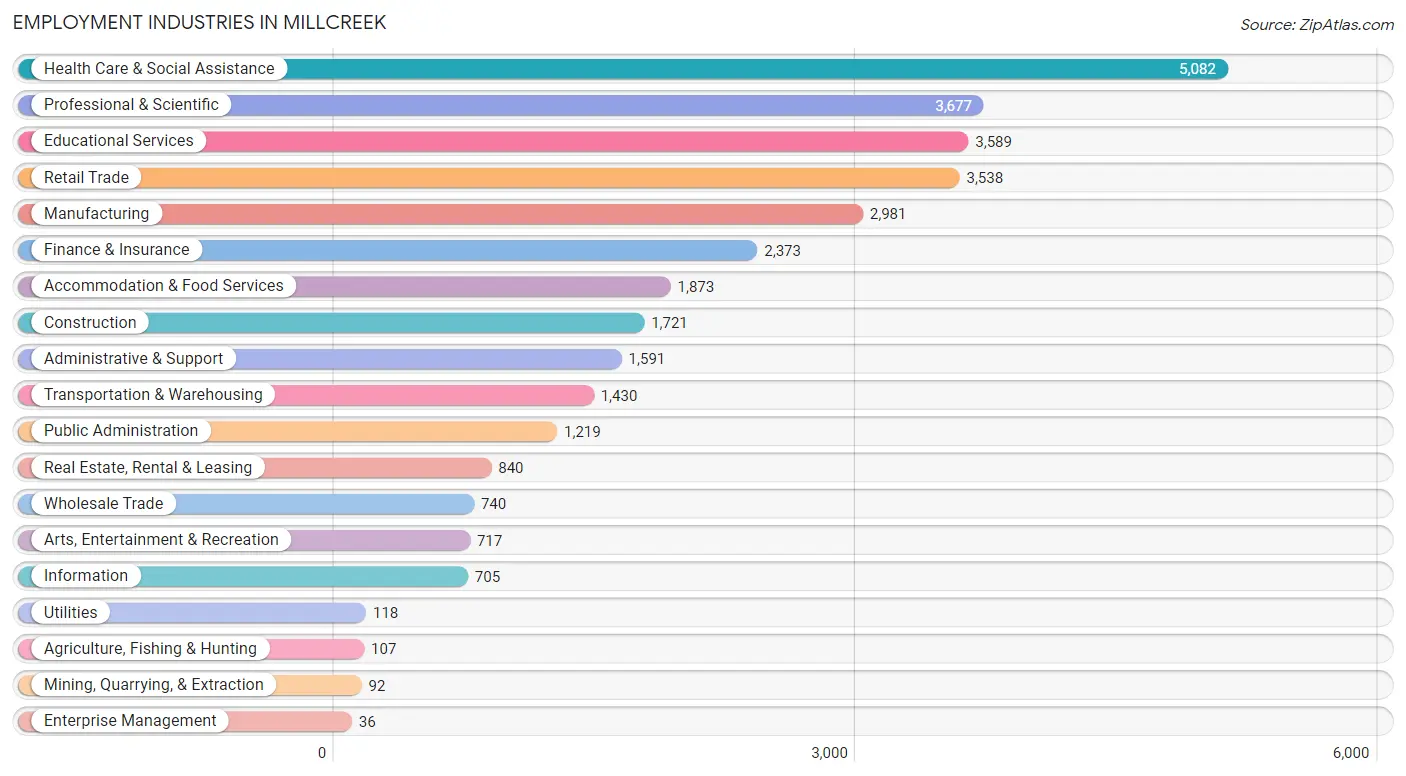
Employment Industries in Millcreek
The major employment industries in Millcreek include Health Care & Social Assistance (5,082 | 15.0%), Professional & Scientific (3,677 | 10.8%), Educational Services (3,589 | 10.6%), Retail Trade (3,538 | 10.4%), and Manufacturing (2,981 | 8.8%).
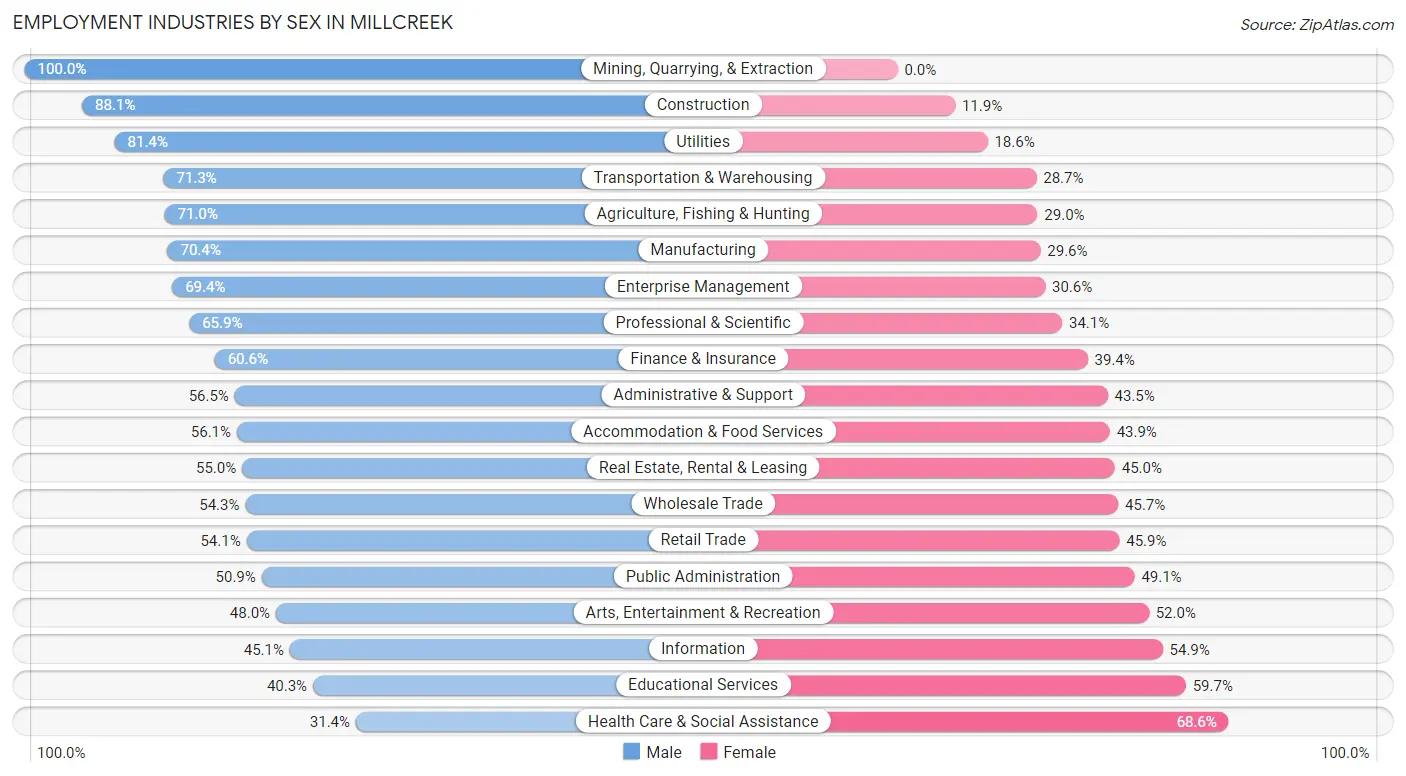
Employment Industries by Sex in Millcreek
The Millcreek industries that see more men than women are Mining, Quarrying, & Extraction (100.0%), Construction (88.1%), and Utilities (81.4%), whereas the industries that tend to have a higher number of women are Health Care & Social Assistance (68.6%), Educational Services (59.7%), and Information (54.9%).
| Industry | Male | Female |
| Agriculture, Fishing & Hunting | 76 (71.0%) | 31 (29.0%) |
| Mining, Quarrying, & Extraction | 92 (100.0%) | 0 (0.0%) |
| Construction | 1,516 (88.1%) | 205 (11.9%) |
| Manufacturing | 2,099 (70.4%) | 882 (29.6%) |
| Wholesale Trade | 402 (54.3%) | 338 (45.7%) |
| Retail Trade | 1,913 (54.1%) | 1,625 (45.9%) |
| Transportation & Warehousing | 1,019 (71.3%) | 411 (28.7%) |
| Utilities | 96 (81.4%) | 22 (18.6%) |
| Information | 318 (45.1%) | 387 (54.9%) |
| Finance & Insurance | 1,439 (60.6%) | 934 (39.4%) |
| Real Estate, Rental & Leasing | 462 (55.0%) | 378 (45.0%) |
| Professional & Scientific | 2,424 (65.9%) | 1,253 (34.1%) |
| Enterprise Management | 25 (69.4%) | 11 (30.6%) |
| Administrative & Support | 899 (56.5%) | 692 (43.5%) |
| Educational Services | 1,447 (40.3%) | 2,142 (59.7%) |
| Health Care & Social Assistance | 1,598 (31.4%) | 3,484 (68.6%) |
| Arts, Entertainment & Recreation | 344 (48.0%) | 373 (52.0%) |
| Accommodation & Food Services | 1,050 (56.1%) | 823 (43.9%) |
| Public Administration | 621 (50.9%) | 598 (49.1%) |
| Total | 18,520 (54.6%) | 15,390 (45.4%) |
Education in Millcreek
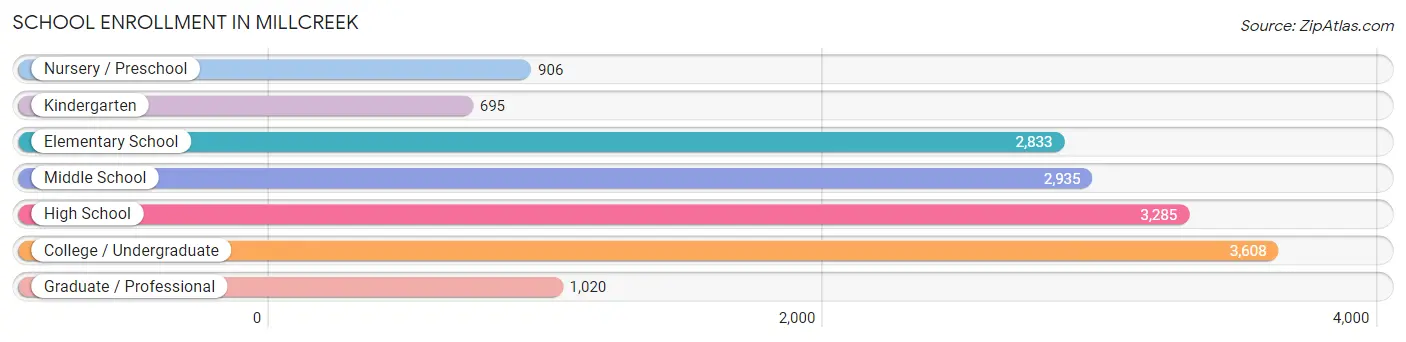
School Enrollment in Millcreek
The most common levels of schooling among the 15,282 students in Millcreek are college / undergraduate (3,608 | 23.6%), high school (3,285 | 21.5%), and middle school (2,935 | 19.2%).
| School Level | # Students | % Students |
| Nursery / Preschool | 906 | 5.9% |
| Kindergarten | 695 | 4.5% |
| Elementary School | 2,833 | 18.5% |
| Middle School | 2,935 | 19.2% |
| High School | 3,285 | 21.5% |
| College / Undergraduate | 3,608 | 23.6% |
| Graduate / Professional | 1,020 | 6.7% |
| Total | 15,282 | 100.0% |
School Enrollment by Age by Funding Source in Millcreek
Out of a total of 15,282 students who are enrolled in schools in Millcreek, 2,781 (18.2%) attend a private institution, while the remaining 12,501 (81.8%) are enrolled in public schools. The age group of 3 to 4 year olds has the highest likelihood of being enrolled in private schools, with 467 (64.7% in the age bracket) enrolled. Conversely, the age group of 18 to 19 year olds has the lowest likelihood of being enrolled in a private school, with 922 (91.1% in the age bracket) attending a public institution.
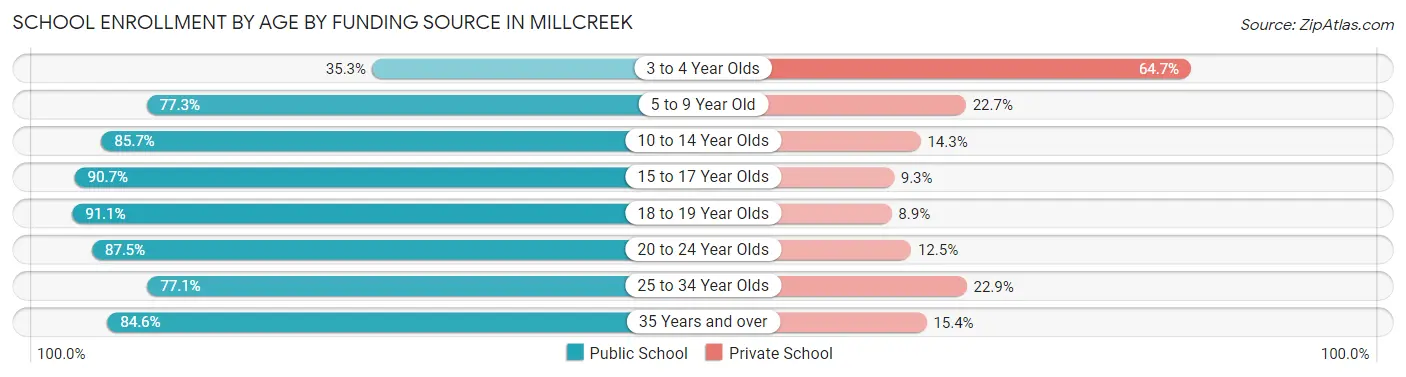
| Age Bracket | Public School | Private School |
| 3 to 4 Year Olds | 255 (35.3%) | 467 (64.7%) |
| 5 to 9 Year Old | 2,585 (77.3%) | 761 (22.7%) |
| 10 to 14 Year Olds | 3,037 (85.7%) | 507 (14.3%) |
| 15 to 17 Year Olds | 2,195 (90.7%) | 226 (9.3%) |
| 18 to 19 Year Olds | 922 (91.1%) | 90 (8.9%) |
| 20 to 24 Year Olds | 1,409 (87.5%) | 202 (12.5%) |
| 25 to 34 Year Olds | 1,345 (77.1%) | 399 (22.9%) |
| 35 Years and over | 746 (84.6%) | 136 (15.4%) |
| Total | 12,501 (81.8%) | 2,781 (18.2%) |
Educational Attainment by Field of Study in Millcreek
Business (3,807 | 14.7%), social sciences (3,049 | 11.8%), science & technology (2,396 | 9.3%), engineering (1,946 | 7.5%), and education (1,689 | 6.5%) are the most common fields of study among 25,845 individuals in Millcreek who have obtained a bachelor's degree or higher.
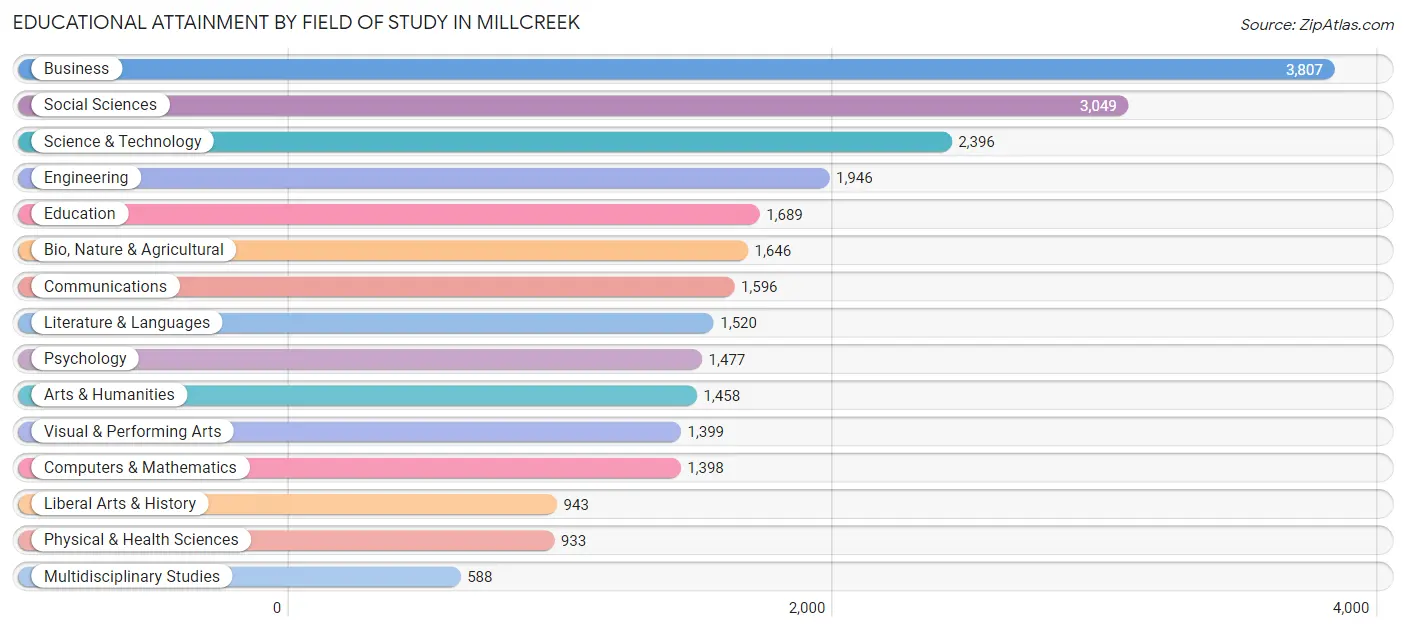
| Field of Study | # Graduates | % Graduates |
| Computers & Mathematics | 1,398 | 5.4% |
| Bio, Nature & Agricultural | 1,646 | 6.4% |
| Physical & Health Sciences | 933 | 3.6% |
| Psychology | 1,477 | 5.7% |
| Social Sciences | 3,049 | 11.8% |
| Engineering | 1,946 | 7.5% |
| Multidisciplinary Studies | 588 | 2.3% |
| Science & Technology | 2,396 | 9.3% |
| Business | 3,807 | 14.7% |
| Education | 1,689 | 6.5% |
| Literature & Languages | 1,520 | 5.9% |
| Liberal Arts & History | 943 | 3.6% |
| Visual & Performing Arts | 1,399 | 5.4% |
| Communications | 1,596 | 6.2% |
| Arts & Humanities | 1,458 | 5.6% |
| Total | 25,845 | 100.0% |
Transportation & Commute in Millcreek
Vehicle Availability by Sex in Millcreek
The most prevalent vehicle ownership categories in Millcreek are males with 2 vehicles (8,175, accounting for 45.0%) and females with 2 vehicles (6,557, making up 54.9%).
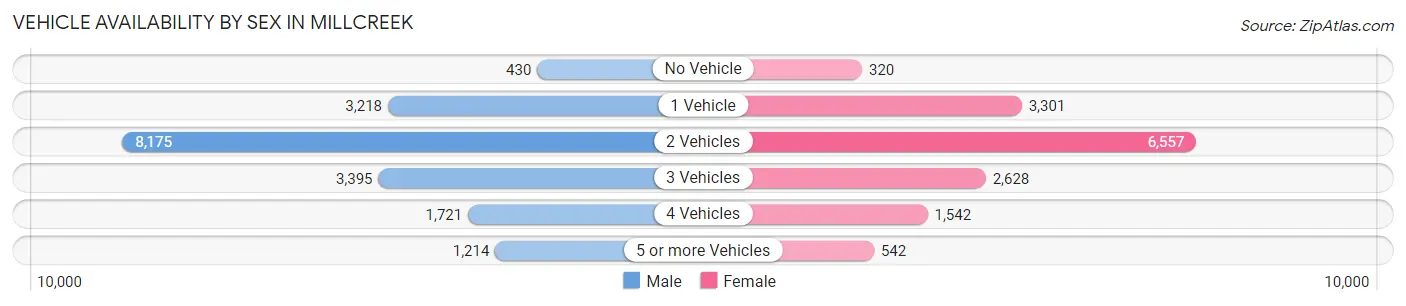
| Vehicles Available | Male | Female |
| No Vehicle | 430 (2.4%) | 320 (2.1%) |
| 1 Vehicle | 3,218 (17.7%) | 3,301 (22.2%) |
| 2 Vehicles | 8,175 (45.0%) | 6,557 (44.0%) |
| 3 Vehicles | 3,395 (18.7%) | 2,628 (17.6%) |
| 4 Vehicles | 1,721 (9.5%) | 1,542 (10.4%) |
| 5 or more Vehicles | 1,214 (6.7%) | 542 (3.6%) |
| Total | 18,153 (100.0%) | 14,890 (100.0%) |
Commute Time in Millcreek
The most frequently occuring commute durations in Millcreek are 15 to 19 minutes (6,444 commuters, 23.5%), 20 to 24 minutes (5,993 commuters, 21.9%), and 10 to 14 minutes (3,925 commuters, 14.3%).
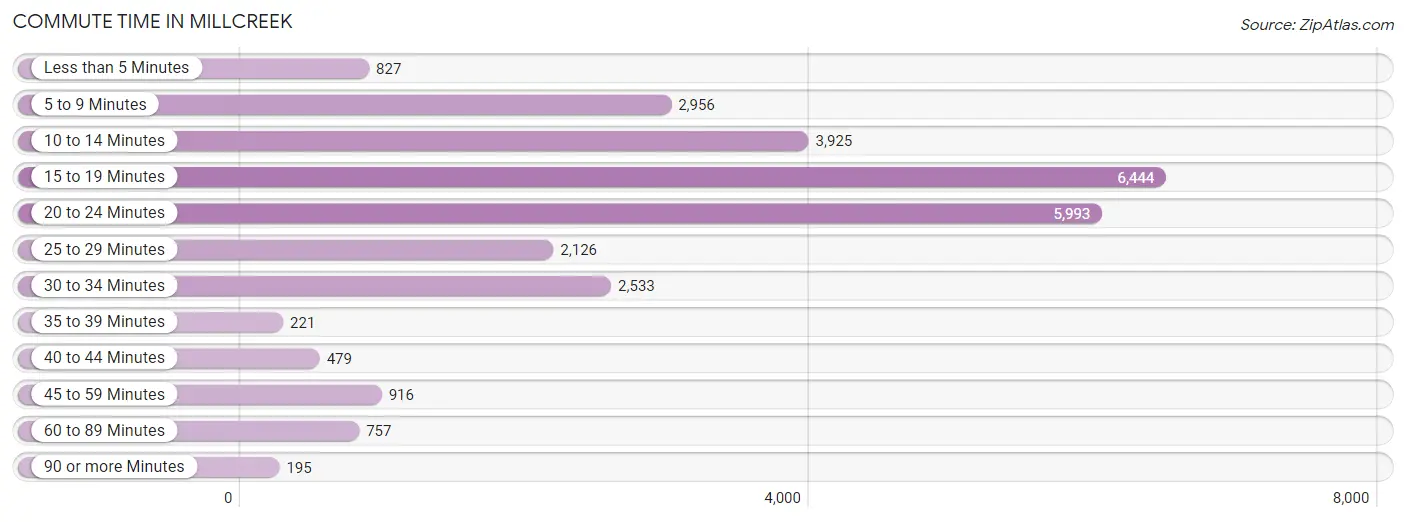
| Commute Time | # Commuters | % Commuters |
| Less than 5 Minutes | 827 | 3.0% |
| 5 to 9 Minutes | 2,956 | 10.8% |
| 10 to 14 Minutes | 3,925 | 14.3% |
| 15 to 19 Minutes | 6,444 | 23.5% |
| 20 to 24 Minutes | 5,993 | 21.9% |
| 25 to 29 Minutes | 2,126 | 7.8% |
| 30 to 34 Minutes | 2,533 | 9.2% |
| 35 to 39 Minutes | 221 | 0.8% |
| 40 to 44 Minutes | 479 | 1.8% |
| 45 to 59 Minutes | 916 | 3.4% |
| 60 to 89 Minutes | 757 | 2.8% |
| 90 or more Minutes | 195 | 0.7% |
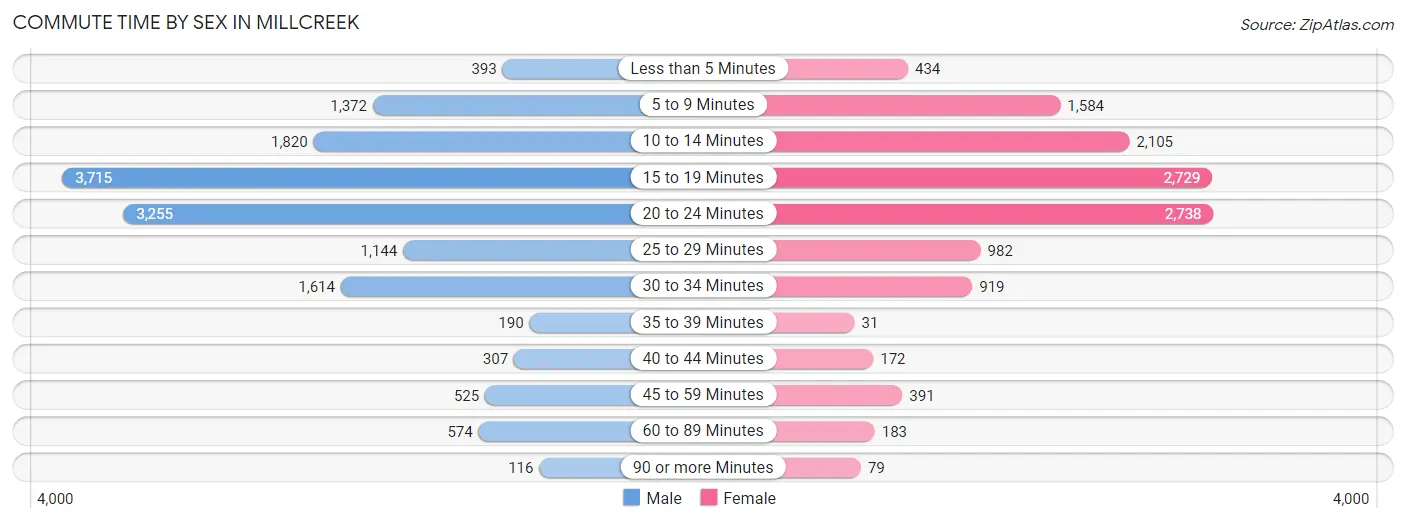
Commute Time by Sex in Millcreek
The most common commute times in Millcreek are 15 to 19 minutes (3,715 commuters, 24.7%) for males and 20 to 24 minutes (2,738 commuters, 22.2%) for females.
| Commute Time | Male | Female |
| Less than 5 Minutes | 393 (2.6%) | 434 (3.5%) |
| 5 to 9 Minutes | 1,372 (9.1%) | 1,584 (12.8%) |
| 10 to 14 Minutes | 1,820 (12.1%) | 2,105 (17.1%) |
| 15 to 19 Minutes | 3,715 (24.7%) | 2,729 (22.1%) |
| 20 to 24 Minutes | 3,255 (21.7%) | 2,738 (22.2%) |
| 25 to 29 Minutes | 1,144 (7.6%) | 982 (8.0%) |
| 30 to 34 Minutes | 1,614 (10.7%) | 919 (7.4%) |
| 35 to 39 Minutes | 190 (1.3%) | 31 (0.3%) |
| 40 to 44 Minutes | 307 (2.0%) | 172 (1.4%) |
| 45 to 59 Minutes | 525 (3.5%) | 391 (3.2%) |
| 60 to 89 Minutes | 574 (3.8%) | 183 (1.5%) |
| 90 or more Minutes | 116 (0.8%) | 79 (0.6%) |
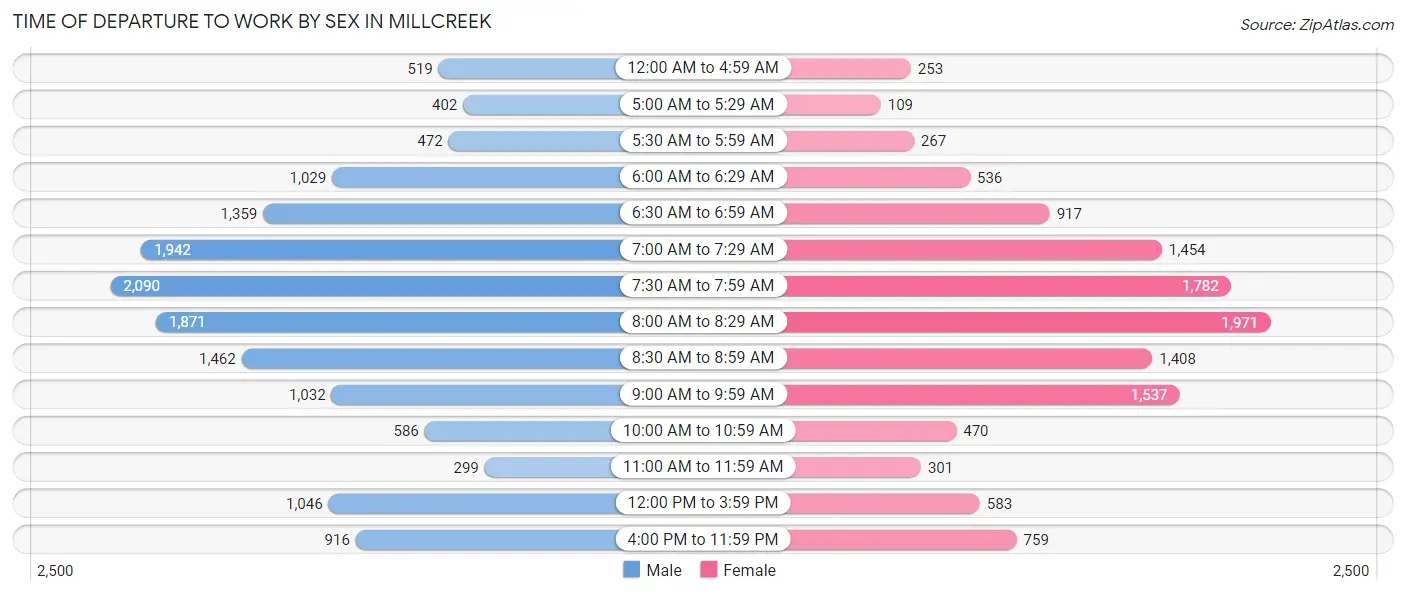
Time of Departure to Work by Sex in Millcreek
The most frequent times of departure to work in Millcreek are 7:30 AM to 7:59 AM (2,090, 13.9%) for males and 8:00 AM to 8:29 AM (1,971, 16.0%) for females.
| Time of Departure | Male | Female |
| 12:00 AM to 4:59 AM | 519 (3.5%) | 253 (2.1%) |
| 5:00 AM to 5:29 AM | 402 (2.7%) | 109 (0.9%) |
| 5:30 AM to 5:59 AM | 472 (3.1%) | 267 (2.2%) |
| 6:00 AM to 6:29 AM | 1,029 (6.9%) | 536 (4.3%) |
| 6:30 AM to 6:59 AM | 1,359 (9.0%) | 917 (7.4%) |
| 7:00 AM to 7:29 AM | 1,942 (12.9%) | 1,454 (11.8%) |
| 7:30 AM to 7:59 AM | 2,090 (13.9%) | 1,782 (14.4%) |
| 8:00 AM to 8:29 AM | 1,871 (12.4%) | 1,971 (16.0%) |
| 8:30 AM to 8:59 AM | 1,462 (9.7%) | 1,408 (11.4%) |
| 9:00 AM to 9:59 AM | 1,032 (6.9%) | 1,537 (12.4%) |
| 10:00 AM to 10:59 AM | 586 (3.9%) | 470 (3.8%) |
| 11:00 AM to 11:59 AM | 299 (2.0%) | 301 (2.4%) |
| 12:00 PM to 3:59 PM | 1,046 (7.0%) | 583 (4.7%) |
| 4:00 PM to 11:59 PM | 916 (6.1%) | 759 (6.1%) |
| Total | 15,025 (100.0%) | 12,347 (100.0%) |
Housing Occupancy in Millcreek
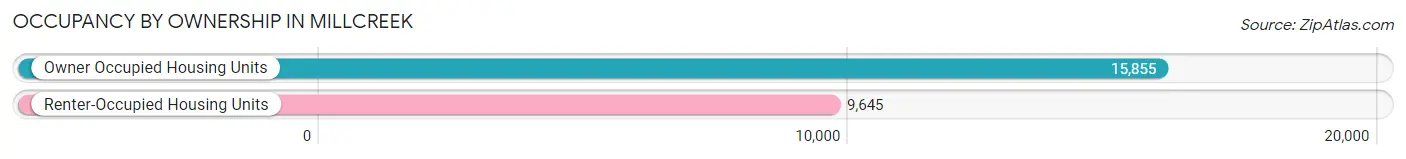
Occupancy by Ownership in Millcreek
Of the total 25,500 dwellings in Millcreek, owner-occupied units account for 15,855 (62.2%), while renter-occupied units make up 9,645 (37.8%).
| Occupancy | # Housing Units | % Housing Units |
| Owner Occupied Housing Units | 15,855 | 62.2% |
| Renter-Occupied Housing Units | 9,645 | 37.8% |
| Total Occupied Housing Units | 25,500 | 100.0% |
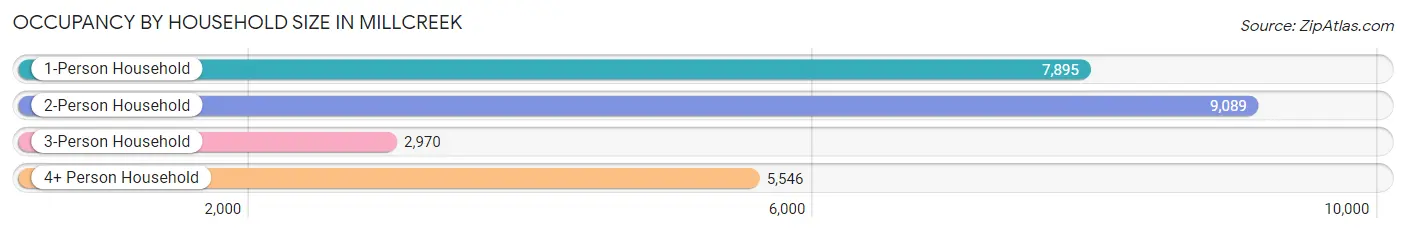
Occupancy by Household Size in Millcreek
| Household Size | # Housing Units | % Housing Units |
| 1-Person Household | 7,895 | 31.0% |
| 2-Person Household | 9,089 | 35.6% |
| 3-Person Household | 2,970 | 11.7% |
| 4+ Person Household | 5,546 | 21.7% |
| Total Housing Units | 25,500 | 100.0% |
Occupancy by Ownership by Household Size in Millcreek
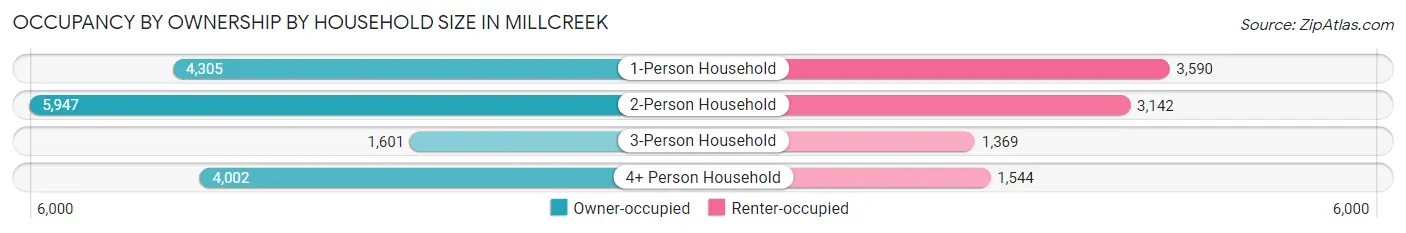
| Household Size | Owner-occupied | Renter-occupied |
| 1-Person Household | 4,305 (54.5%) | 3,590 (45.5%) |
| 2-Person Household | 5,947 (65.4%) | 3,142 (34.6%) |
| 3-Person Household | 1,601 (53.9%) | 1,369 (46.1%) |
| 4+ Person Household | 4,002 (72.2%) | 1,544 (27.8%) |
| Total Housing Units | 15,855 (62.2%) | 9,645 (37.8%) |
Occupancy by Educational Attainment in Millcreek
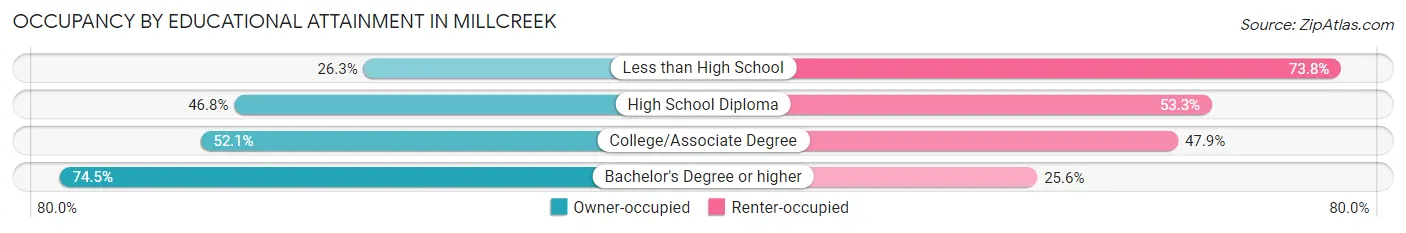
| Household Size | Owner-occupied | Renter-occupied |
| Less than High School | 231 (26.3%) | 649 (73.8%) |
| High School Diploma | 1,793 (46.8%) | 2,042 (53.2%) |
| College/Associate Degree | 3,836 (52.1%) | 3,523 (47.9%) |
| Bachelor's Degree or higher | 9,995 (74.5%) | 3,431 (25.6%) |
Occupancy by Age of Householder in Millcreek
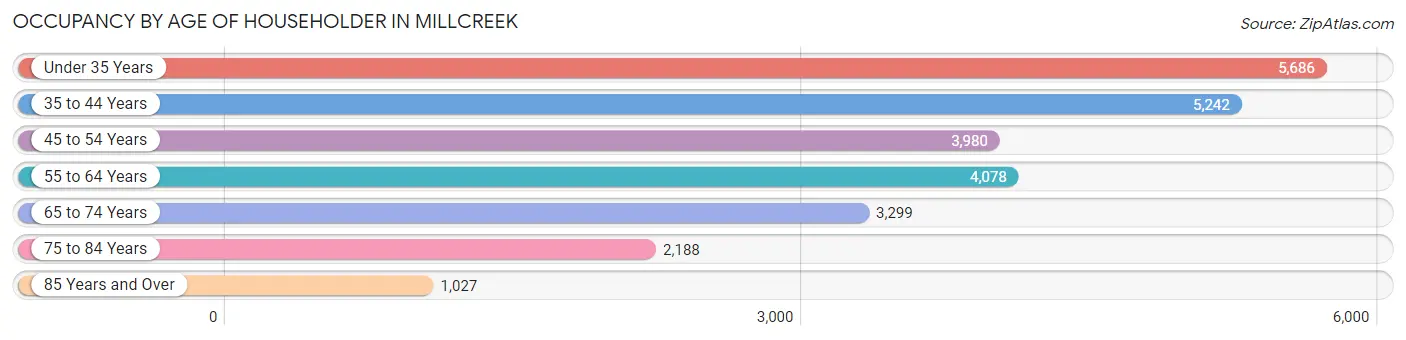
| Age Bracket | # Households | % Households |
| Under 35 Years | 5,686 | 22.3% |
| 35 to 44 Years | 5,242 | 20.6% |
| 45 to 54 Years | 3,980 | 15.6% |
| 55 to 64 Years | 4,078 | 16.0% |
| 65 to 74 Years | 3,299 | 12.9% |
| 75 to 84 Years | 2,188 | 8.6% |
| 85 Years and Over | 1,027 | 4.0% |
| Total | 25,500 | 100.0% |
Housing Finances in Millcreek
Median Income by Occupancy in Millcreek
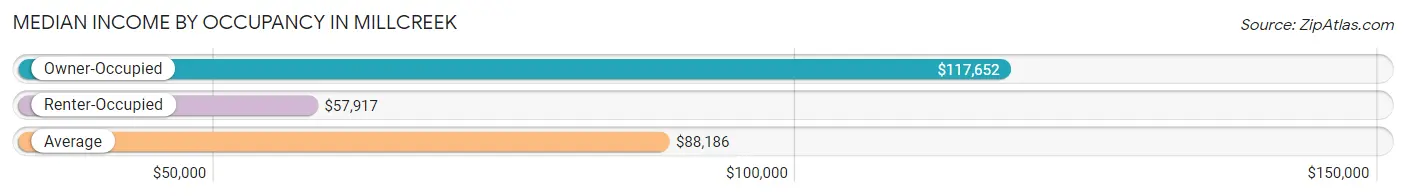
| Occupancy Type | # Households | Median Income |
| Owner-Occupied | 15,855 (62.2%) | $117,652 |
| Renter-Occupied | 9,645 (37.8%) | $57,917 |
| Average | 25,500 (100.0%) | $88,186 |
Occupancy by Householder Income Bracket in Millcreek
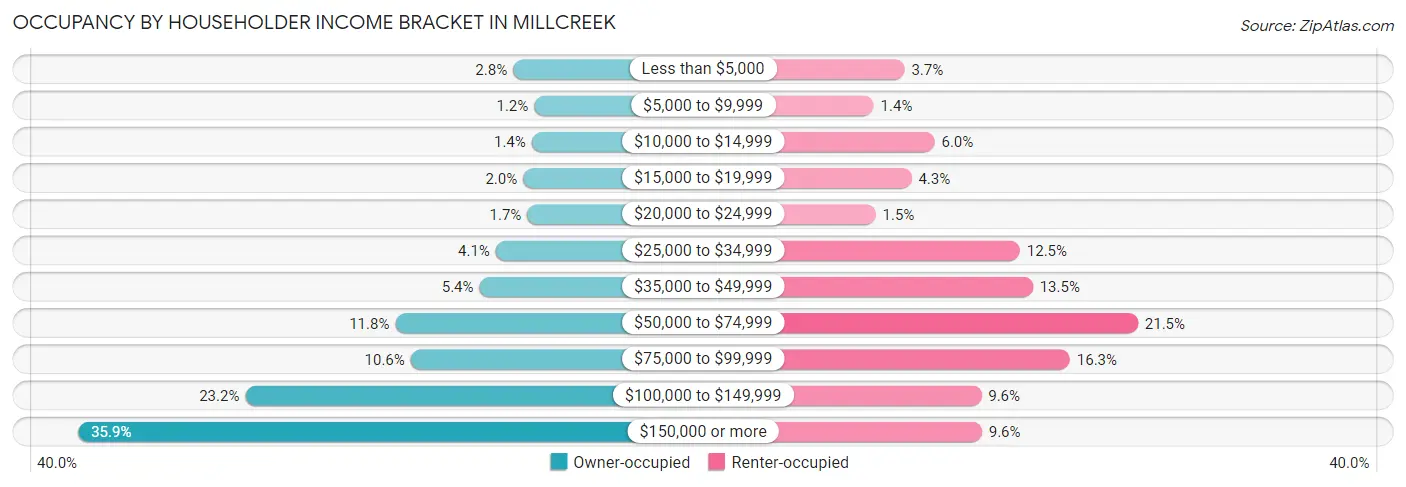
| Income Bracket | Owner-occupied | Renter-occupied |
| Less than $5,000 | 442 (2.8%) | 360 (3.7%) |
| $5,000 to $9,999 | 187 (1.2%) | 133 (1.4%) |
| $10,000 to $14,999 | 217 (1.4%) | 581 (6.0%) |
| $15,000 to $19,999 | 320 (2.0%) | 411 (4.3%) |
| $20,000 to $24,999 | 271 (1.7%) | 148 (1.5%) |
| $25,000 to $34,999 | 652 (4.1%) | 1,208 (12.5%) |
| $35,000 to $49,999 | 849 (5.3%) | 1,302 (13.5%) |
| $50,000 to $74,999 | 1,864 (11.8%) | 2,075 (21.5%) |
| $75,000 to $99,999 | 1,679 (10.6%) | 1,575 (16.3%) |
| $100,000 to $149,999 | 3,677 (23.2%) | 924 (9.6%) |
| $150,000 or more | 5,697 (35.9%) | 928 (9.6%) |
| Total | 15,855 (100.0%) | 9,645 (100.0%) |
Monthly Housing Cost Tiers in Millcreek
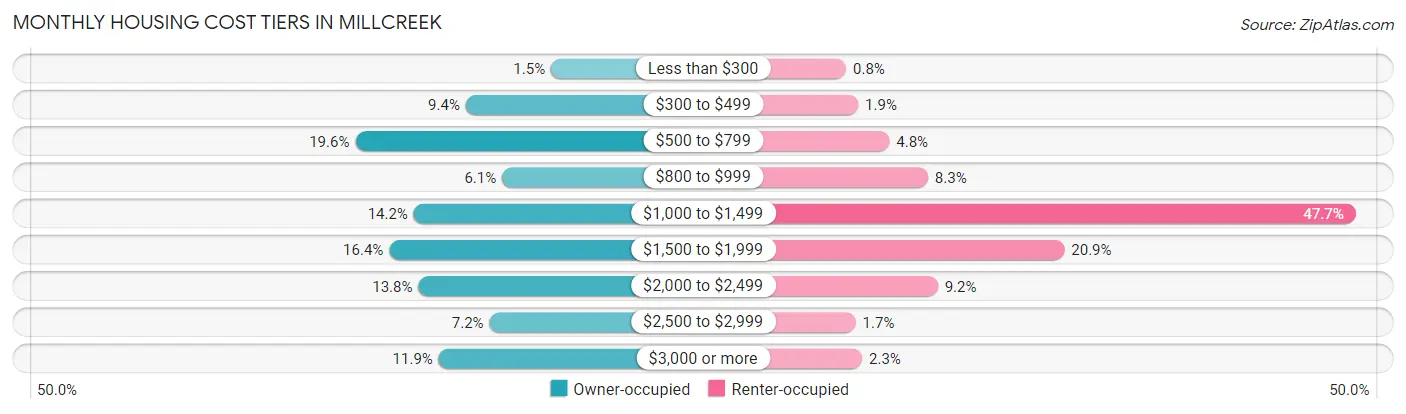
| Monthly Cost | Owner-occupied | Renter-occupied |
| Less than $300 | 244 (1.5%) | 77 (0.8%) |
| $300 to $499 | 1,489 (9.4%) | 184 (1.9%) |
| $500 to $799 | 3,101 (19.6%) | 461 (4.8%) |
| $800 to $999 | 960 (6.0%) | 803 (8.3%) |
| $1,000 to $1,499 | 2,248 (14.2%) | 4,601 (47.7%) |
| $1,500 to $1,999 | 2,606 (16.4%) | 2,015 (20.9%) |
| $2,000 to $2,499 | 2,181 (13.8%) | 890 (9.2%) |
| $2,500 to $2,999 | 1,143 (7.2%) | 162 (1.7%) |
| $3,000 or more | 1,883 (11.9%) | 219 (2.3%) |
| Total | 15,855 (100.0%) | 9,645 (100.0%) |
Physical Housing Characteristics in Millcreek
Housing Structures in Millcreek
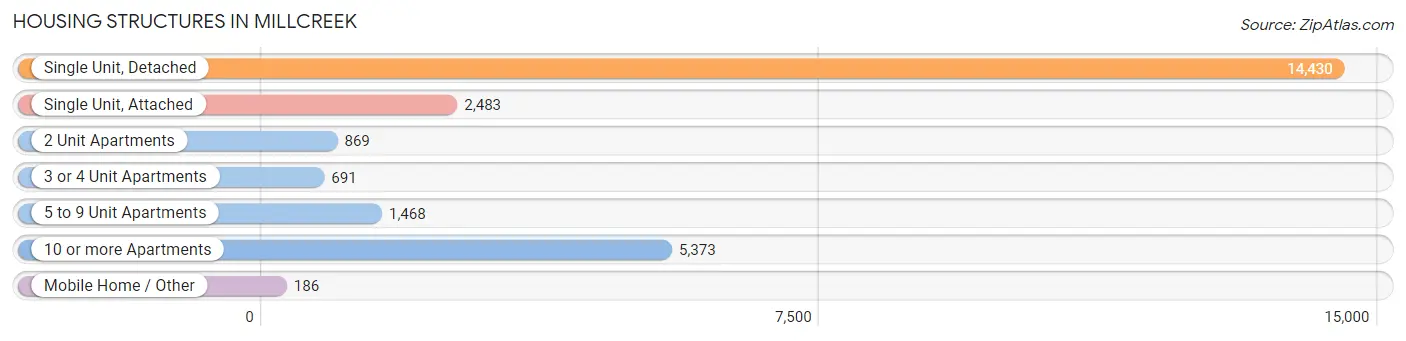
| Structure Type | # Housing Units | % Housing Units |
| Single Unit, Detached | 14,430 | 56.6% |
| Single Unit, Attached | 2,483 | 9.7% |
| 2 Unit Apartments | 869 | 3.4% |
| 3 or 4 Unit Apartments | 691 | 2.7% |
| 5 to 9 Unit Apartments | 1,468 | 5.8% |
| 10 or more Apartments | 5,373 | 21.1% |
| Mobile Home / Other | 186 | 0.7% |
| Total | 25,500 | 100.0% |
Housing Structures by Occupancy in Millcreek
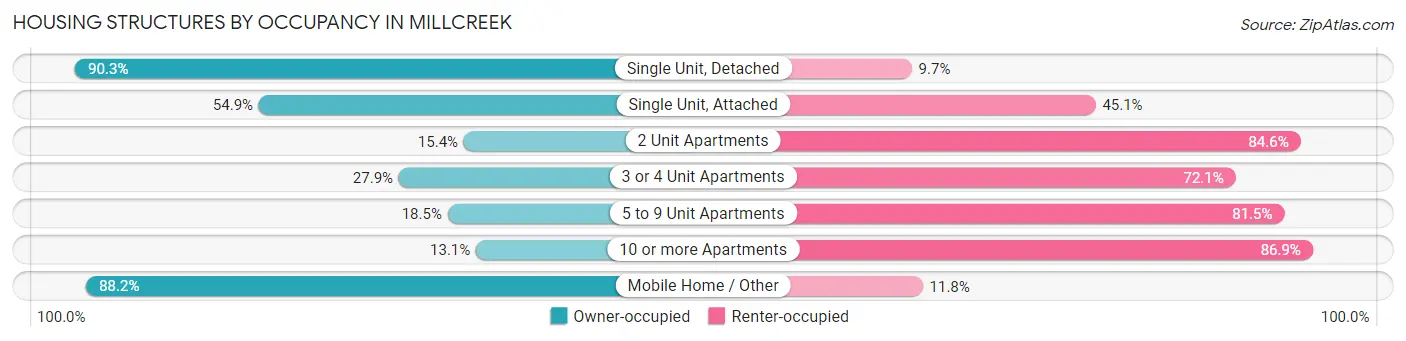
| Structure Type | Owner-occupied | Renter-occupied |
| Single Unit, Detached | 13,027 (90.3%) | 1,403 (9.7%) |
| Single Unit, Attached | 1,363 (54.9%) | 1,120 (45.1%) |
| 2 Unit Apartments | 134 (15.4%) | 735 (84.6%) |
| 3 or 4 Unit Apartments | 193 (27.9%) | 498 (72.1%) |
| 5 to 9 Unit Apartments | 272 (18.5%) | 1,196 (81.5%) |
| 10 or more Apartments | 702 (13.1%) | 4,671 (86.9%) |
| Mobile Home / Other | 164 (88.2%) | 22 (11.8%) |
| Total | 15,855 (62.2%) | 9,645 (37.8%) |
Housing Structures by Number of Rooms in Millcreek
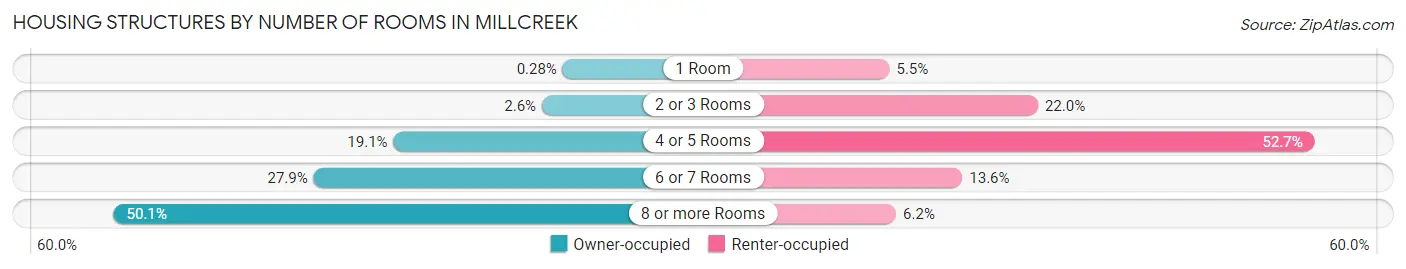
| Number of Rooms | Owner-occupied | Renter-occupied |
| 1 Room | 45 (0.3%) | 531 (5.5%) |
| 2 or 3 Rooms | 411 (2.6%) | 2,120 (22.0%) |
| 4 or 5 Rooms | 3,024 (19.1%) | 5,081 (52.7%) |
| 6 or 7 Rooms | 4,428 (27.9%) | 1,311 (13.6%) |
| 8 or more Rooms | 7,947 (50.1%) | 602 (6.2%) |
| Total | 15,855 (100.0%) | 9,645 (100.0%) |
Housing Structure by Heating Type in Millcreek
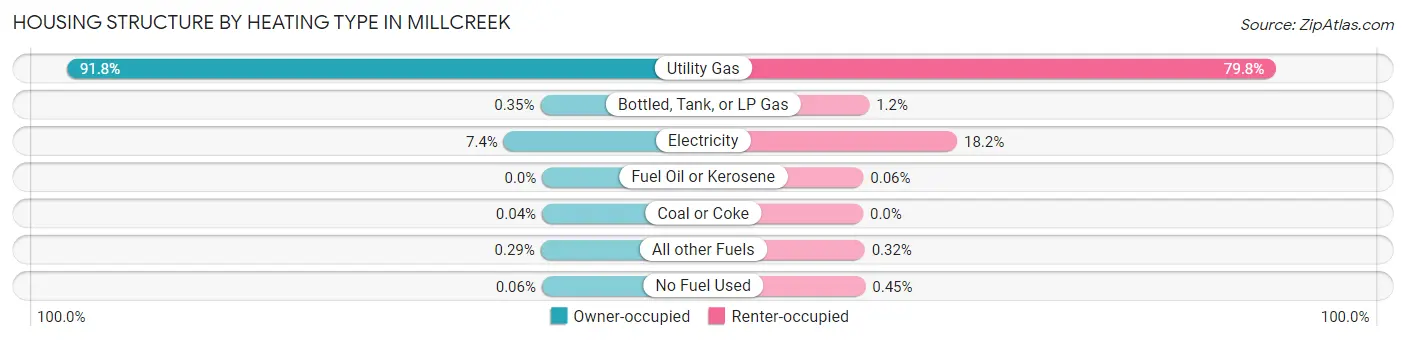
| Heating Type | Owner-occupied | Renter-occupied |
| Utility Gas | 14,559 (91.8%) | 7,698 (79.8%) |
| Bottled, Tank, or LP Gas | 55 (0.4%) | 115 (1.2%) |
| Electricity | 1,178 (7.4%) | 1,752 (18.2%) |
| Fuel Oil or Kerosene | 0 (0.0%) | 6 (0.1%) |
| Coal or Coke | 7 (0.0%) | 0 (0.0%) |
| All other Fuels | 46 (0.3%) | 31 (0.3%) |
| No Fuel Used | 10 (0.1%) | 43 (0.4%) |
| Total | 15,855 (100.0%) | 9,645 (100.0%) |
Household Vehicle Usage in Millcreek
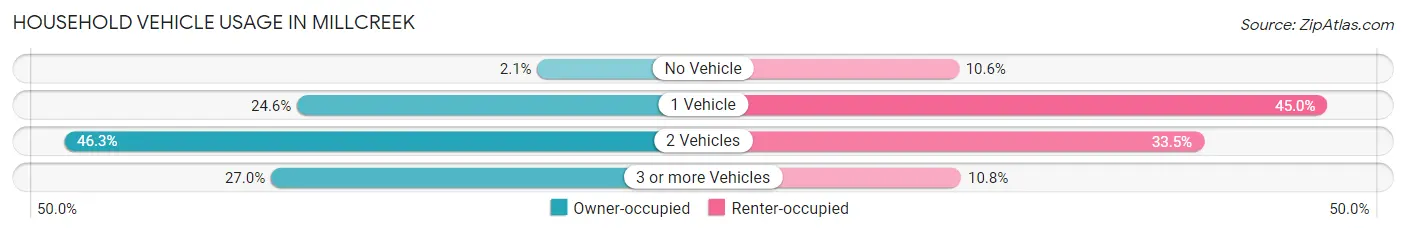
| Vehicles per Household | Owner-occupied | Renter-occupied |
| No Vehicle | 338 (2.1%) | 1,024 (10.6%) |
| 1 Vehicle | 3,894 (24.6%) | 4,343 (45.0%) |
| 2 Vehicles | 7,342 (46.3%) | 3,232 (33.5%) |
| 3 or more Vehicles | 4,281 (27.0%) | 1,046 (10.8%) |
| Total | 15,855 (100.0%) | 9,645 (100.0%) |
Real Estate & Mortgages in Millcreek
Real Estate and Mortgage Overview in Millcreek
| Characteristic | Without Mortgage | With Mortgage |
| Housing Units | 5,829 | 10,026 |
| Median Property Value | $516,600 | $502,300 |
| Median Household Income | $93,534 | $4,320 |
| Monthly Housing Costs | $577 | $1,874 |
| Real Estate Taxes | $3,280 | $200 |
Property Value by Mortgage Status in Millcreek
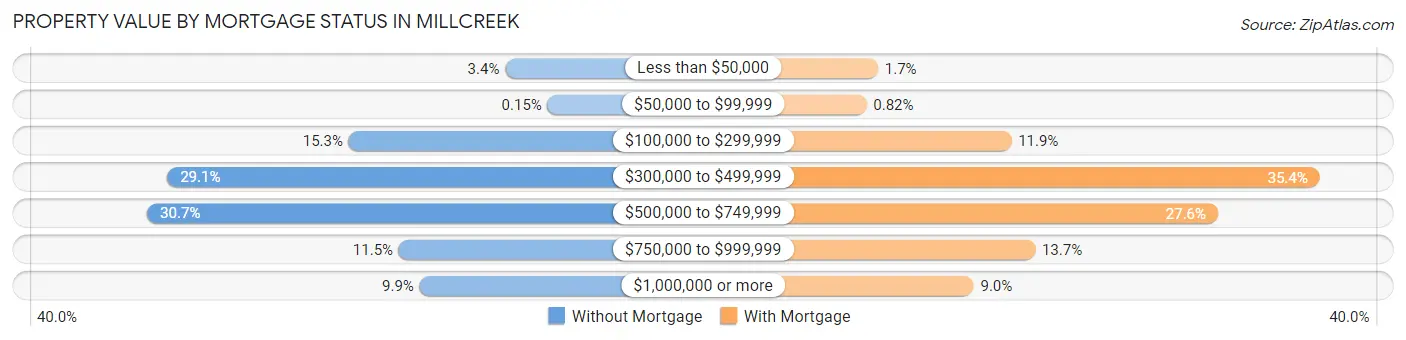
| Property Value | Without Mortgage | With Mortgage |
| Less than $50,000 | 197 (3.4%) | 170 (1.7%) |
| $50,000 to $99,999 | 9 (0.2%) | 82 (0.8%) |
| $100,000 to $299,999 | 892 (15.3%) | 1,189 (11.9%) |
| $300,000 to $499,999 | 1,698 (29.1%) | 3,546 (35.4%) |
| $500,000 to $749,999 | 1,787 (30.7%) | 2,767 (27.6%) |
| $750,000 to $999,999 | 669 (11.5%) | 1,371 (13.7%) |
| $1,000,000 or more | 577 (9.9%) | 901 (9.0%) |
| Total | 5,829 (100.0%) | 10,026 (100.0%) |
Household Income by Mortgage Status in Millcreek
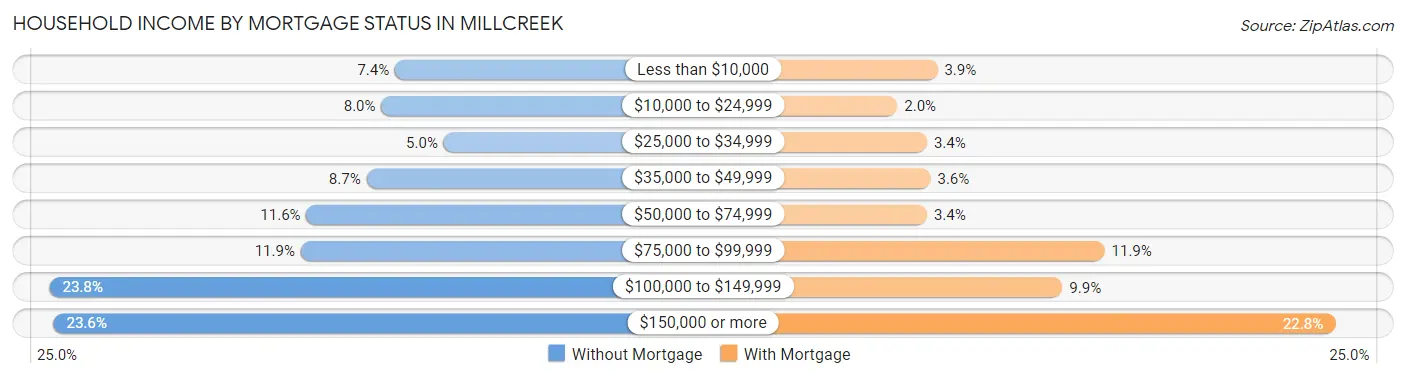
| Household Income | Without Mortgage | With Mortgage |
| Less than $10,000 | 429 (7.4%) | 391 (3.9%) |
| $10,000 to $24,999 | 467 (8.0%) | 200 (2.0%) |
| $25,000 to $34,999 | 294 (5.0%) | 341 (3.4%) |
| $35,000 to $49,999 | 508 (8.7%) | 358 (3.6%) |
| $50,000 to $74,999 | 675 (11.6%) | 341 (3.4%) |
| $75,000 to $99,999 | 691 (11.8%) | 1,189 (11.9%) |
| $100,000 to $149,999 | 1,388 (23.8%) | 988 (9.9%) |
| $150,000 or more | 1,377 (23.6%) | 2,289 (22.8%) |
| Total | 5,829 (100.0%) | 10,026 (100.0%) |
Property Value to Household Income Ratio in Millcreek
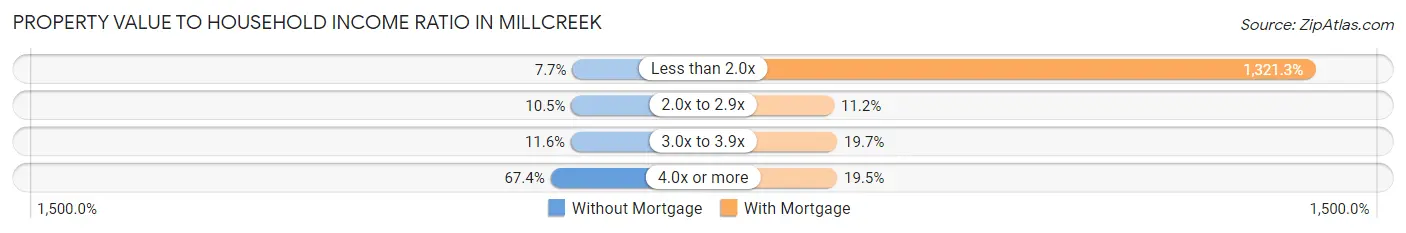
| Value-to-Income Ratio | Without Mortgage | With Mortgage |
| Less than 2.0x | 451 (7.7%) | 132,474 (1,321.3%) |
| 2.0x to 2.9x | 614 (10.5%) | 1,125 (11.2%) |
| 3.0x to 3.9x | 676 (11.6%) | 1,977 (19.7%) |
| 4.0x or more | 3,929 (67.4%) | 1,950 (19.5%) |
| Total | 5,829 (100.0%) | 10,026 (100.0%) |
Real Estate Taxes by Mortgage Status in Millcreek
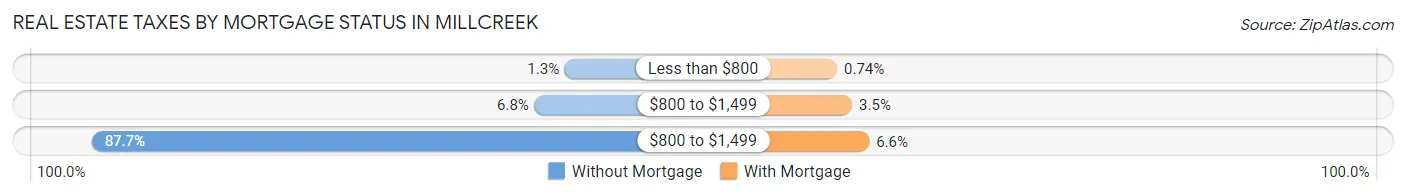
| Property Taxes | Without Mortgage | With Mortgage |
| Less than $800 | 76 (1.3%) | 74 (0.7%) |
| $800 to $1,499 | 398 (6.8%) | 350 (3.5%) |
| $800 to $1,499 | 5,114 (87.7%) | 663 (6.6%) |
| Total | 5,829 (100.0%) | 10,026 (100.0%) |
Health & Disability in Millcreek
Health Insurance Coverage by Age in Millcreek
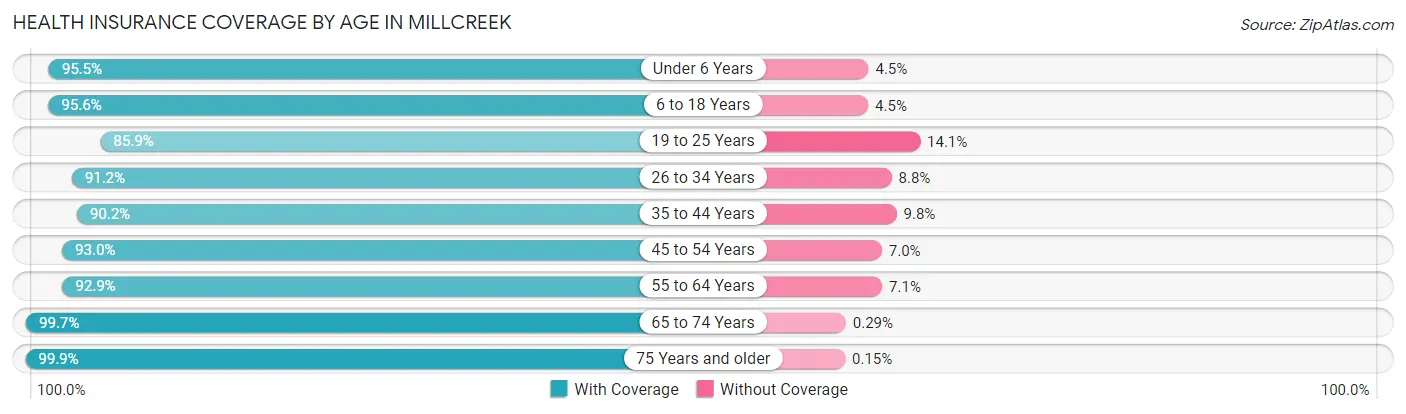
| Age Bracket | With Coverage | Without Coverage |
| Under 6 Years | 4,242 (95.5%) | 201 (4.5%) |
| 6 to 18 Years | 9,154 (95.6%) | 426 (4.4%) |
| 19 to 25 Years | 4,597 (85.9%) | 757 (14.1%) |
| 26 to 34 Years | 8,710 (91.2%) | 843 (8.8%) |
| 35 to 44 Years | 8,973 (90.2%) | 971 (9.8%) |
| 45 to 54 Years | 6,610 (93.0%) | 498 (7.0%) |
| 55 to 64 Years | 6,316 (92.9%) | 480 (7.1%) |
| 65 to 74 Years | 5,220 (99.7%) | 15 (0.3%) |
| 75 Years and older | 4,604 (99.9%) | 7 (0.2%) |
| Total | 58,426 (93.3%) | 4,198 (6.7%) |
Health Insurance Coverage by Citizenship Status in Millcreek
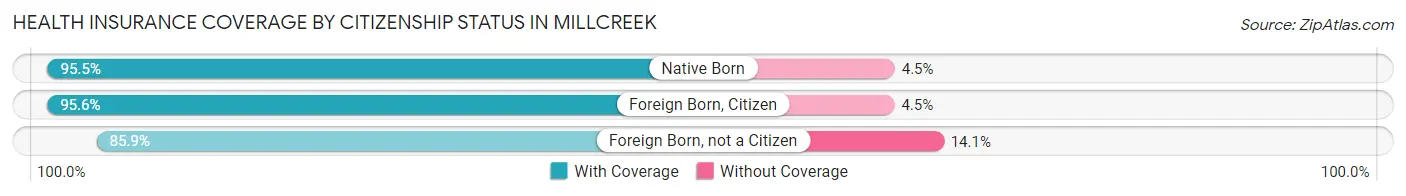
| Citizenship Status | With Coverage | Without Coverage |
| Native Born | 4,242 (95.5%) | 201 (4.5%) |
| Foreign Born, Citizen | 9,154 (95.6%) | 426 (4.4%) |
| Foreign Born, not a Citizen | 4,597 (85.9%) | 757 (14.1%) |
Health Insurance Coverage by Household Income in Millcreek
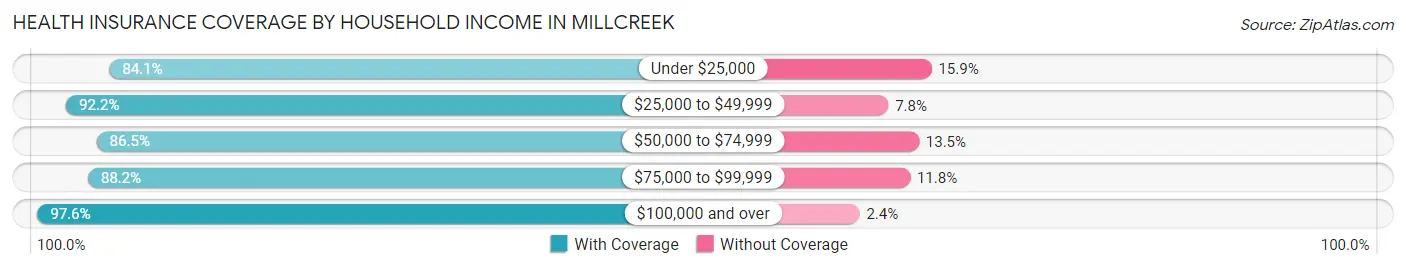
| Household Income | With Coverage | Without Coverage |
| Under $25,000 | 3,897 (84.1%) | 735 (15.9%) |
| $25,000 to $49,999 | 6,625 (92.2%) | 557 (7.8%) |
| $50,000 to $74,999 | 6,864 (86.5%) | 1,071 (13.5%) |
| $75,000 to $99,999 | 7,560 (88.2%) | 1,015 (11.8%) |
| $100,000 and over | 33,265 (97.6%) | 810 (2.4%) |
Public vs Private Health Insurance Coverage by Age in Millcreek
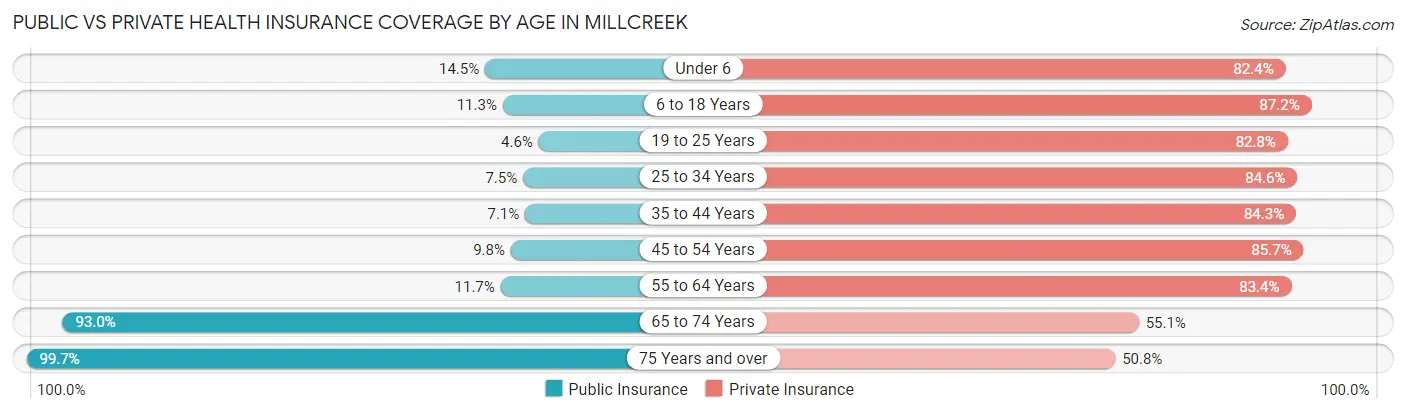
| Age Bracket | Public Insurance | Private Insurance |
| Under 6 | 646 (14.5%) | 3,659 (82.4%) |
| 6 to 18 Years | 1,078 (11.3%) | 8,353 (87.2%) |
| 19 to 25 Years | 245 (4.6%) | 4,431 (82.8%) |
| 25 to 34 Years | 715 (7.5%) | 8,077 (84.6%) |
| 35 to 44 Years | 706 (7.1%) | 8,383 (84.3%) |
| 45 to 54 Years | 694 (9.8%) | 6,091 (85.7%) |
| 55 to 64 Years | 792 (11.7%) | 5,670 (83.4%) |
| 65 to 74 Years | 4,867 (93.0%) | 2,885 (55.1%) |
| 75 Years and over | 4,595 (99.7%) | 2,340 (50.7%) |
| Total | 14,338 (22.9%) | 49,889 (79.7%) |
Disability Status by Sex by Age in Millcreek
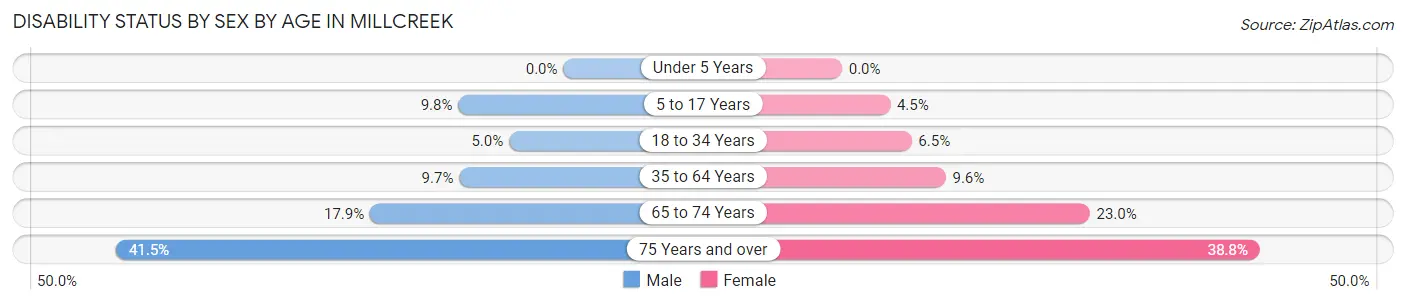
| Age Bracket | Male | Female |
| Under 5 Years | 0 (0.0%) | 0 (0.0%) |
| 5 to 17 Years | 460 (9.8%) | 213 (4.5%) |
| 18 to 34 Years | 416 (5.0%) | 482 (6.5%) |
| 35 to 64 Years | 1,166 (9.7%) | 1,134 (9.6%) |
| 65 to 74 Years | 425 (17.9%) | 659 (23.0%) |
| 75 Years and over | 737 (41.5%) | 1,100 (38.8%) |
Disability Class by Sex by Age in Millcreek
Disability Class: Hearing Difficulty
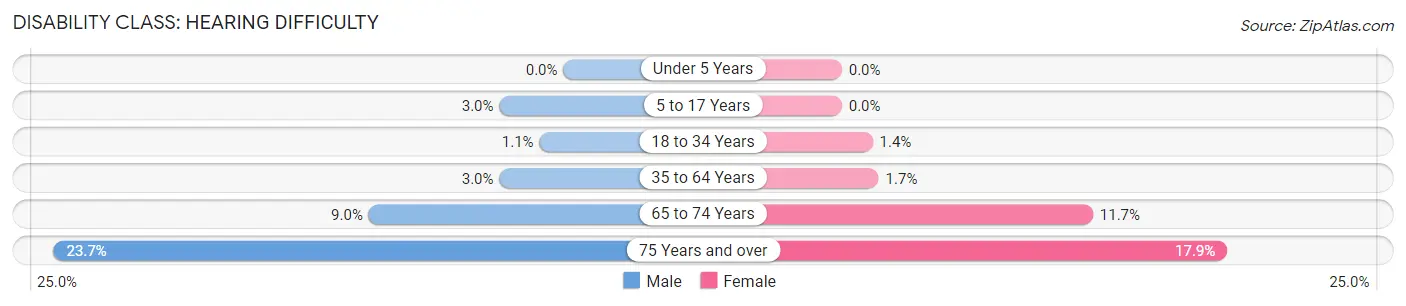
| Age Bracket | Male | Female |
| Under 5 Years | 0 (0.0%) | 0 (0.0%) |
| 5 to 17 Years | 140 (3.0%) | 0 (0.0%) |
| 18 to 34 Years | 92 (1.1%) | 107 (1.4%) |
| 35 to 64 Years | 359 (3.0%) | 201 (1.7%) |
| 65 to 74 Years | 214 (9.0%) | 334 (11.7%) |
| 75 Years and over | 420 (23.7%) | 507 (17.9%) |
Disability Class: Vision Difficulty
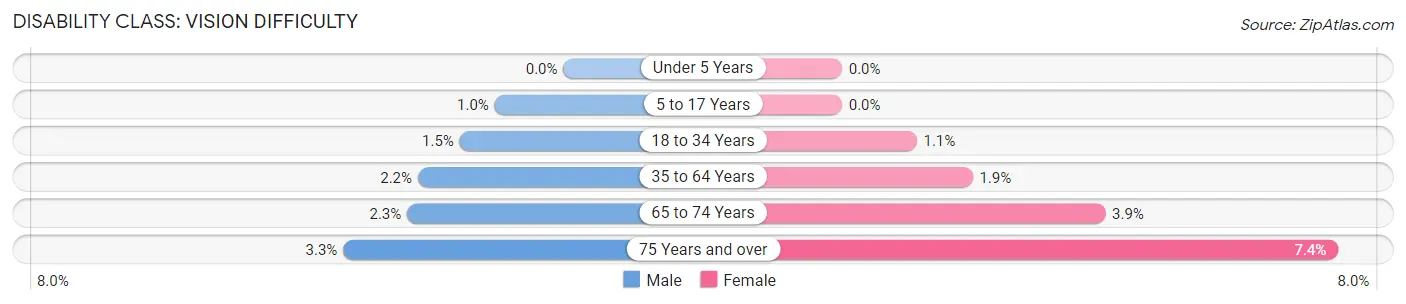
| Age Bracket | Male | Female |
| Under 5 Years | 0 (0.0%) | 0 (0.0%) |
| 5 to 17 Years | 48 (1.0%) | 0 (0.0%) |
| 18 to 34 Years | 127 (1.5%) | 83 (1.1%) |
| 35 to 64 Years | 261 (2.2%) | 229 (1.9%) |
| 65 to 74 Years | 55 (2.3%) | 112 (3.9%) |
| 75 Years and over | 58 (3.3%) | 209 (7.4%) |
Disability Class: Cognitive Difficulty
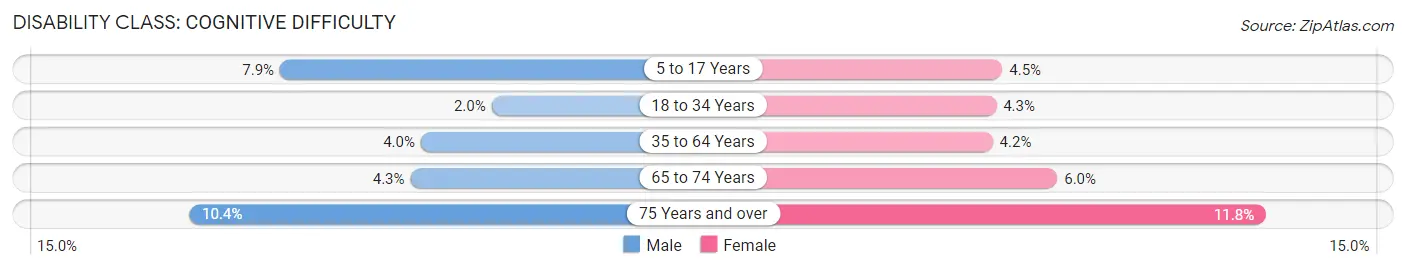
| Age Bracket | Male | Female |
| 5 to 17 Years | 372 (7.9%) | 213 (4.5%) |
| 18 to 34 Years | 165 (2.0%) | 321 (4.3%) |
| 35 to 64 Years | 479 (4.0%) | 495 (4.2%) |
| 65 to 74 Years | 101 (4.3%) | 172 (6.0%) |
| 75 Years and over | 185 (10.4%) | 335 (11.8%) |
Disability Class: Ambulatory Difficulty
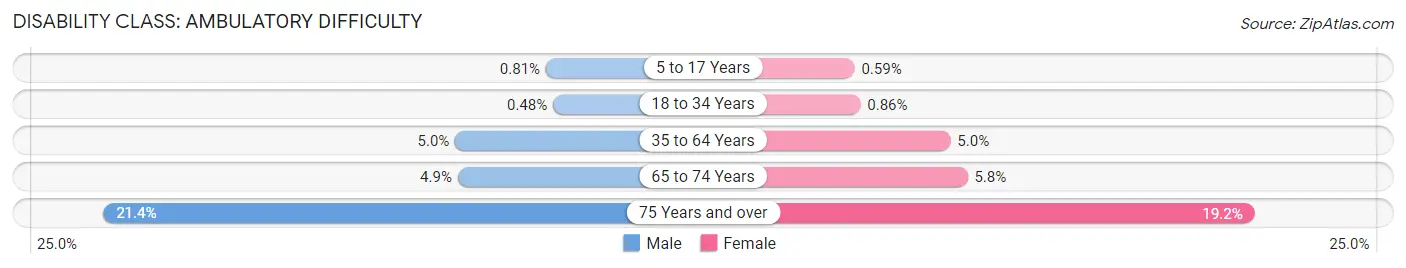
| Age Bracket | Male | Female |
| 5 to 17 Years | 38 (0.8%) | 28 (0.6%) |
| 18 to 34 Years | 40 (0.5%) | 64 (0.9%) |
| 35 to 64 Years | 606 (5.0%) | 593 (5.0%) |
| 65 to 74 Years | 116 (4.9%) | 167 (5.8%) |
| 75 Years and over | 379 (21.3%) | 543 (19.2%) |
Disability Class: Self-Care Difficulty
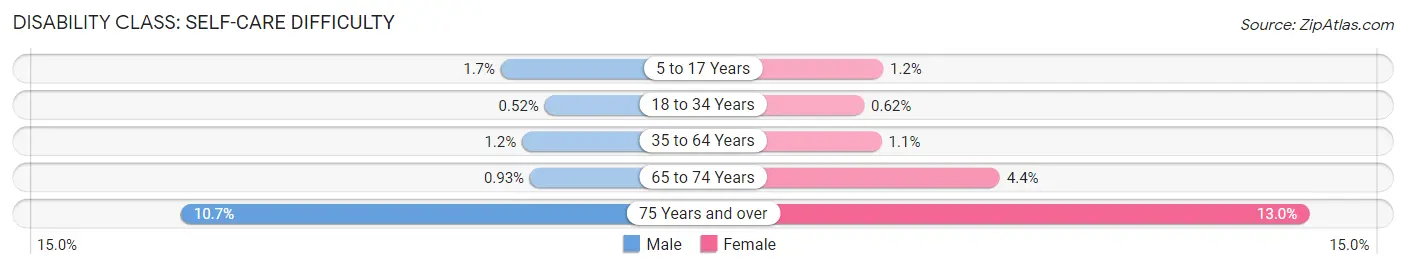
| Age Bracket | Male | Female |
| 5 to 17 Years | 82 (1.7%) | 55 (1.1%) |
| 18 to 34 Years | 43 (0.5%) | 46 (0.6%) |
| 35 to 64 Years | 139 (1.1%) | 131 (1.1%) |
| 65 to 74 Years | 22 (0.9%) | 126 (4.4%) |
| 75 Years and over | 189 (10.6%) | 369 (13.0%) |
Technology Access in Millcreek
Computing Device Access in Millcreek
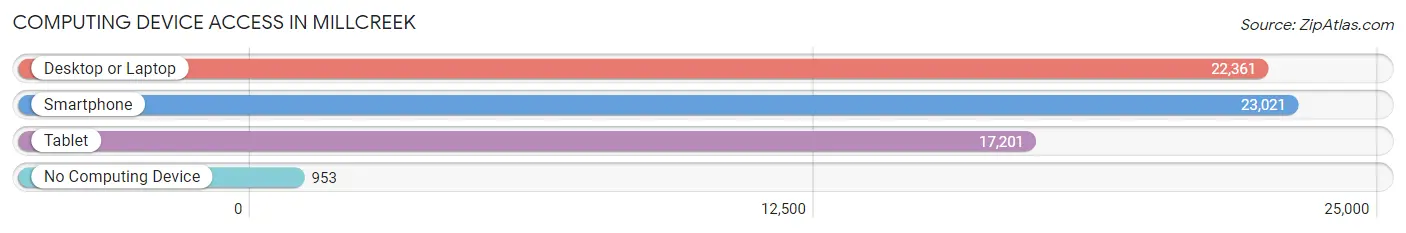
| Device Type | # Households | % Households |
| Desktop or Laptop | 22,361 | 87.7% |
| Smartphone | 23,021 | 90.3% |
| Tablet | 17,201 | 67.4% |
| No Computing Device | 953 | 3.7% |
| Total | 25,500 | 100.0% |
Internet Access in Millcreek
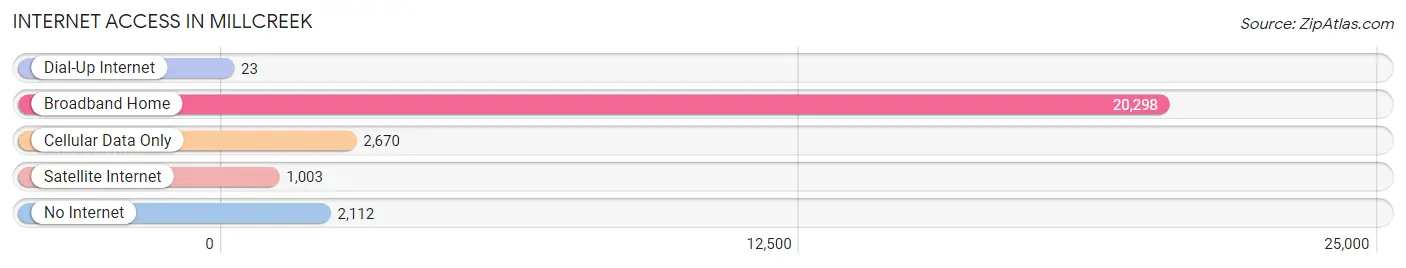
| Internet Type | # Households | % Households |
| Dial-Up Internet | 23 | 0.1% |
| Broadband Home | 20,298 | 79.6% |
| Cellular Data Only | 2,670 | 10.5% |
| Satellite Internet | 1,003 | 3.9% |
| No Internet | 2,112 | 8.3% |
| Total | 25,500 | 100.0% |
Millcreek Summary
Millcreek, Utah is a city located in Salt Lake County, Utah, United States. It is part of the Salt Lake City metropolitan area. The population was estimated to be 33,764 in 2019.
History
Millcreek was originally part of the larger city of South Salt Lake, but was incorporated as its own city in 2016. The area was first settled in the late 1800s by Mormon pioneers, and the area was known as Mill Creek. The area was primarily used for farming and ranching, and the first school was built in 1891.
In the early 1900s, the area began to develop as a residential area, and the first subdivision was built in 1912. The area continued to grow, and by the 1950s, it was a thriving community.
In the 1970s, the area began to experience rapid growth, and by the 1980s, it was one of the fastest growing areas in the state. The population continued to grow, and in 2016, the area was incorporated as its own city.
Geography
Millcreek is located in the Salt Lake Valley, and is bordered by Salt Lake City to the north, South Salt Lake to the east, Murray to the south, and Holladay to the west. The city covers an area of 8.3 square miles, and is located at an elevation of 4,400 feet.
The city is located in a semi-arid climate, and experiences hot summers and cold winters. The average annual precipitation is 17.5 inches, and the average annual snowfall is 54.3 inches.
Economy
Millcreek has a diverse economy, with a variety of industries represented. The largest employers in the city are the University of Utah, Intermountain Healthcare, and the Salt Lake City School District. Other major employers include the Salt Lake County government, the Salt Lake City International Airport, and the Salt Lake City Corporation.
The city also has a thriving retail sector, with a variety of shopping centers, restaurants, and other businesses. The city is also home to several industrial parks, which provide jobs in manufacturing, warehousing, and other industries.
Demographics
As of the 2019 census, the population of Millcreek was estimated to be 33,764. The population is predominantly white (77.3%), followed by Hispanic or Latino (14.2%), Asian (4.2%), and African American (2.2%). The median household income is $63,945, and the median home value is $346,400.
The city is served by the Granite School District, and is home to several public and private schools. The city is also home to the University of Utah, which is one of the largest universities in the state.
Millcreek is a vibrant and diverse city, with a variety of businesses, schools, and other amenities. The city is a great place to live, work, and play, and is a great place to call home.
Common Questions
What is Per Capita Income in Millcreek?
Per Capita income in Millcreek is $50,927.
What is the Median Family Income in Millcreek?
Median Family Income in Millcreek is $113,292.
What is the Median Household income in Millcreek?
Median Household Income in Millcreek is $88,186.
What is Income or Wage Gap in Millcreek?
Income or Wage Gap in Millcreek is 31.5%.
Women in Millcreek earn 68.5 cents for every dollar earned by a man.
What is Family Income Deficit in Millcreek?
Family Income Deficit in Millcreek is $10,284.
Families that are below poverty line in Millcreek earn $10,284 less on average than the poverty threshold level.
What is Inequality or Gini Index in Millcreek?
Inequality or Gini Index in Millcreek is 0.48.
What is the Total Population of Millcreek?
Total Population of Millcreek is 63,520.
What is the Total Male Population of Millcreek?
Total Male Population of Millcreek is 31,517.
What is the Total Female Population of Millcreek?
Total Female Population of Millcreek is 32,003.
What is the Ratio of Males per 100 Females in Millcreek?
There are 98.48 Males per 100 Females in Millcreek.
What is the Ratio of Females per 100 Males in Millcreek?
There are 101.54 Females per 100 Males in Millcreek.
What is the Median Population Age in Millcreek?
Median Population Age in Millcreek is 37.6 Years.
What is the Average Family Size in Millcreek
Average Family Size in Millcreek is 3.1 People.
What is the Average Household Size in Millcreek
Average Household Size in Millcreek is 2.5 People.
How Large is the Labor Force in Millcreek?
There are 35,325 People in the Labor Forcein in Millcreek.
What is the Percentage of People in the Labor Force in Millcreek?
68.2% of People are in the Labor Force in Millcreek.
What is the Unemployment Rate in Millcreek?
Unemployment Rate in Millcreek is 4.0%.