Jersey Village, TX Map & Demographics
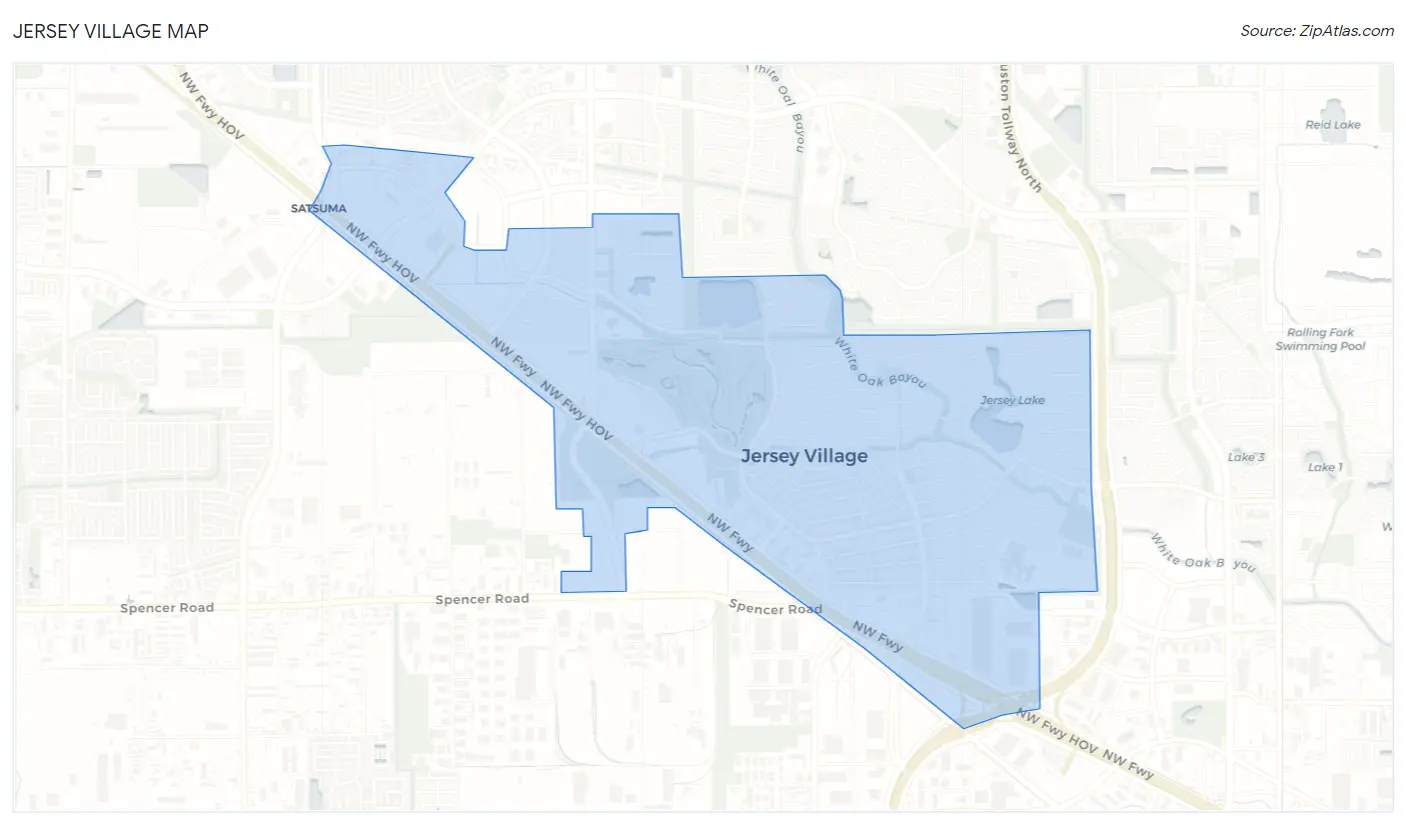
Jersey Village Map
Jersey Village Overview
$49,948
PER CAPITA INCOME
$106,806
AVG FAMILY INCOME
$88,101
AVG HOUSEHOLD INCOME
5.7%
WAGE / INCOME GAP [ % ]
94.3¢/ $1
WAGE / INCOME GAP [ $ ]
0.45
INEQUALITY / GINI INDEX
7,763
TOTAL POPULATION
3,735
MALE POPULATION
4,028
FEMALE POPULATION
92.73
MALES / 100 FEMALES
107.84
FEMALES / 100 MALES
37.3
MEDIAN AGE
2.9
AVG FAMILY SIZE
2.3
AVG HOUSEHOLD SIZE
4,064
LABOR FORCE [ PEOPLE ]
65.5%
PERCENT IN LABOR FORCE
4.2%
UNEMPLOYMENT RATE
Income in Jersey Village
Income Overview in Jersey Village
Per Capita Income in Jersey Village is $49,948, while median incomes of families and households are $106,806 and $88,101 respectively.
| Characteristic | Number | Measure |
| Per Capita Income | 7,763 | $49,948 |
| Median Family Income | 2,147 | $106,806 |
| Mean Family Income | 2,147 | $144,534 |
| Median Household Income | 3,356 | $88,101 |
| Mean Household Income | 3,356 | $115,942 |
| Income Deficit | 2,147 | $0 |
| Wage / Income Gap (%) | 7,763 | 5.68% |
| Wage / Income Gap ($) | 7,763 | 94.32¢ per $1 |
| Gini / Inequality Index | 7,763 | 0.45 |
Earnings by Sex in Jersey Village
Average Earnings in Jersey Village are $50,114, $49,776 for men and $52,775 for women, a difference of 5.7%.
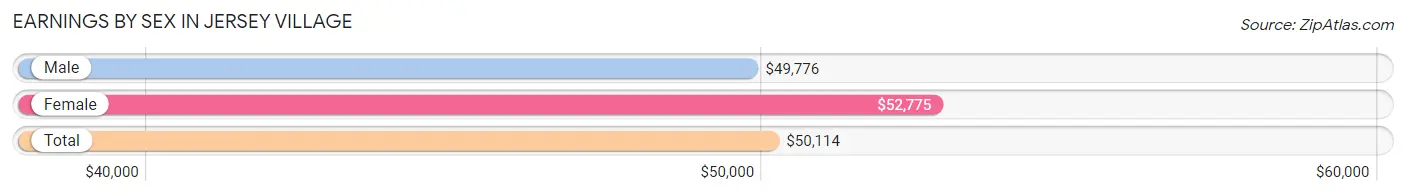
| Sex | Number | Average Earnings |
| Male | 2,361 (54.8%) | $49,776 |
| Female | 1,948 (45.2%) | $52,775 |
| Total | 4,309 (100.0%) | $50,114 |
Earnings by Sex by Income Bracket in Jersey Village
The most common earnings brackets in Jersey Village are $100,000+ for men (572 | 24.2%) and $55,000 to $64,999 for women (291 | 14.9%).
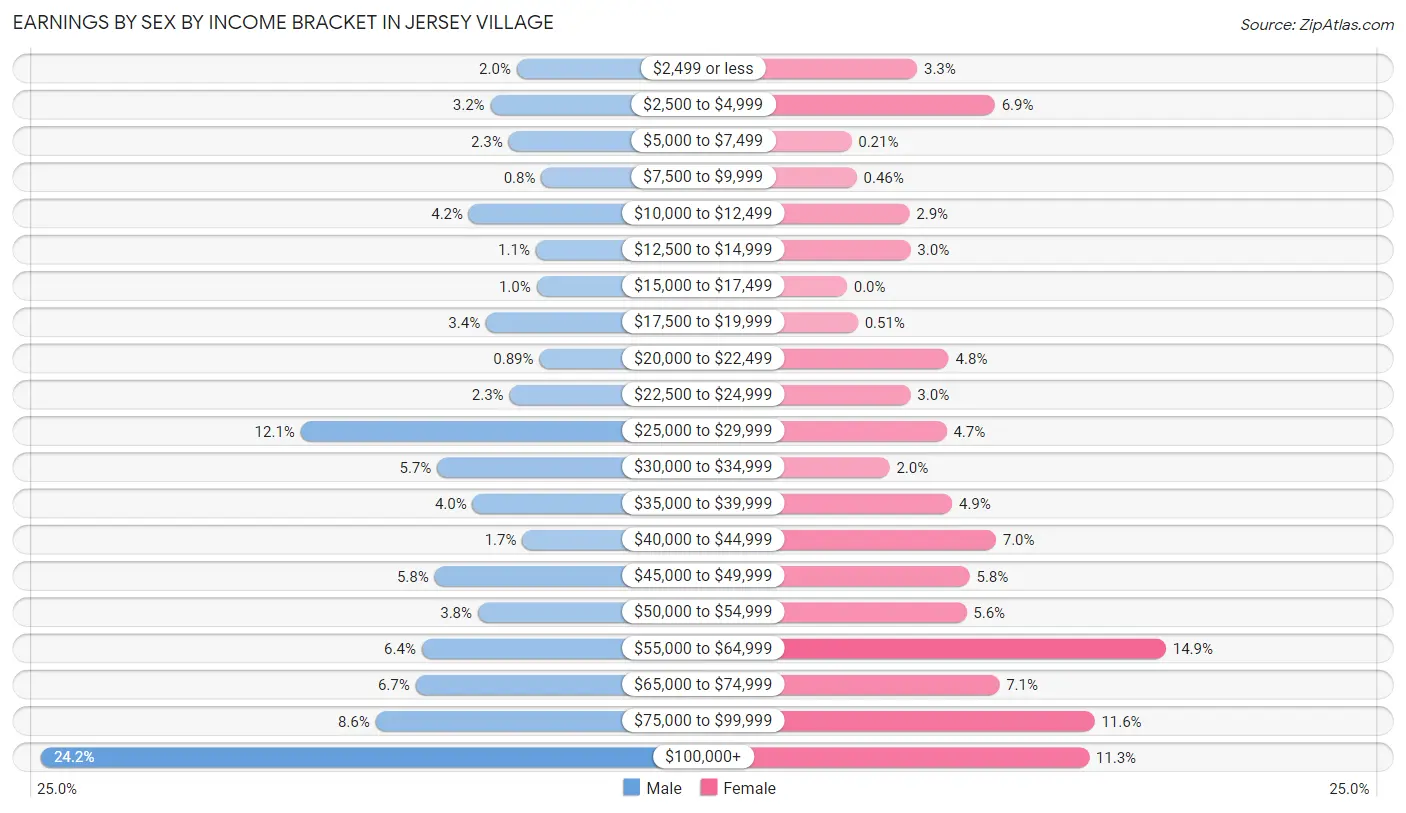
| Income | Male | Female |
| $2,499 or less | 46 (1.9%) | 64 (3.3%) |
| $2,500 to $4,999 | 75 (3.2%) | 135 (6.9%) |
| $5,000 to $7,499 | 55 (2.3%) | 4 (0.2%) |
| $7,500 to $9,999 | 19 (0.8%) | 9 (0.5%) |
| $10,000 to $12,499 | 99 (4.2%) | 57 (2.9%) |
| $12,500 to $14,999 | 25 (1.1%) | 58 (3.0%) |
| $15,000 to $17,499 | 24 (1.0%) | 0 (0.0%) |
| $17,500 to $19,999 | 80 (3.4%) | 10 (0.5%) |
| $20,000 to $22,499 | 21 (0.9%) | 93 (4.8%) |
| $22,500 to $24,999 | 54 (2.3%) | 58 (3.0%) |
| $25,000 to $29,999 | 285 (12.1%) | 91 (4.7%) |
| $30,000 to $34,999 | 134 (5.7%) | 39 (2.0%) |
| $35,000 to $39,999 | 95 (4.0%) | 96 (4.9%) |
| $40,000 to $44,999 | 40 (1.7%) | 136 (7.0%) |
| $45,000 to $49,999 | 137 (5.8%) | 112 (5.8%) |
| $50,000 to $54,999 | 89 (3.8%) | 109 (5.6%) |
| $55,000 to $64,999 | 151 (6.4%) | 291 (14.9%) |
| $65,000 to $74,999 | 158 (6.7%) | 139 (7.1%) |
| $75,000 to $99,999 | 202 (8.6%) | 226 (11.6%) |
| $100,000+ | 572 (24.2%) | 221 (11.3%) |
| Total | 2,361 (100.0%) | 1,948 (100.0%) |
Earnings by Sex by Educational Attainment in Jersey Village
Average earnings in Jersey Village are $62,692 for men and $53,475 for women, a difference of 14.7%. Men with an educational attainment of graduate degree enjoy the highest average annual earnings of $122,841, while those with high school diploma education earn the least with $33,478. Women with an educational attainment of graduate degree earn the most with the average annual earnings of $78,125, while those with high school diploma education have the smallest earnings of $44,051.
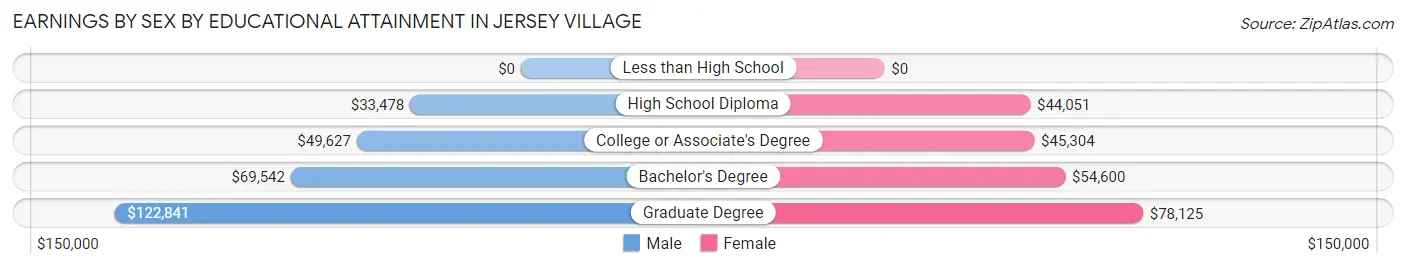
| Educational Attainment | Male Income | Female Income |
| Less than High School | - | - |
| High School Diploma | $33,478 | $44,051 |
| College or Associate's Degree | $49,627 | $45,304 |
| Bachelor's Degree | $69,542 | $54,600 |
| Graduate Degree | $122,841 | $78,125 |
| Total | $62,692 | $53,475 |
Family Income in Jersey Village
Family Income Brackets in Jersey Village
According to the Jersey Village family income data, there are 447 families falling into the $100,000 to $149,999 income range, which is the most common income bracket and makes up 20.8% of all families. Conversely, the less than $10,000 income bracket is the least frequent group with only 4 families (0.2%) belonging to this category.
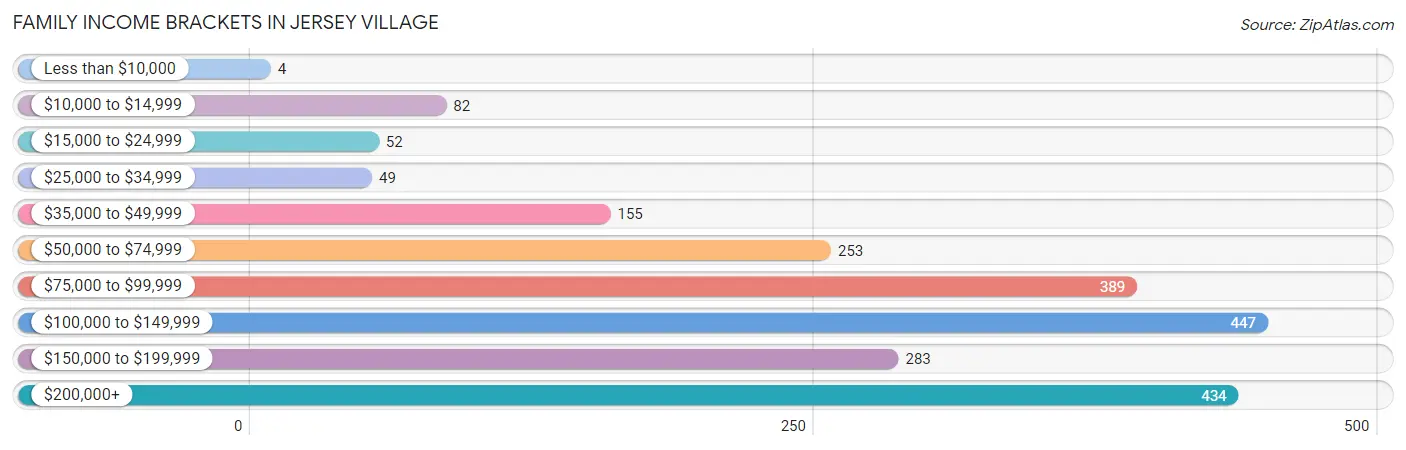
| Income Bracket | # Families | % Families |
| Less than $10,000 | 4 | 0.2% |
| $10,000 to $14,999 | 82 | 3.8% |
| $15,000 to $24,999 | 52 | 2.4% |
| $25,000 to $34,999 | 49 | 2.3% |
| $35,000 to $49,999 | 155 | 7.2% |
| $50,000 to $74,999 | 253 | 11.8% |
| $75,000 to $99,999 | 389 | 18.1% |
| $100,000 to $149,999 | 447 | 20.8% |
| $150,000 to $199,999 | 283 | 13.2% |
| $200,000+ | 434 | 20.2% |
Family Income by Famaliy Size in Jersey Village
5-person families (144 | 6.7%) account for the highest median family income in Jersey Village with $156,250 per family, while 2-person families (1,184 | 55.1%) have the highest median income of $50,000 per family member.
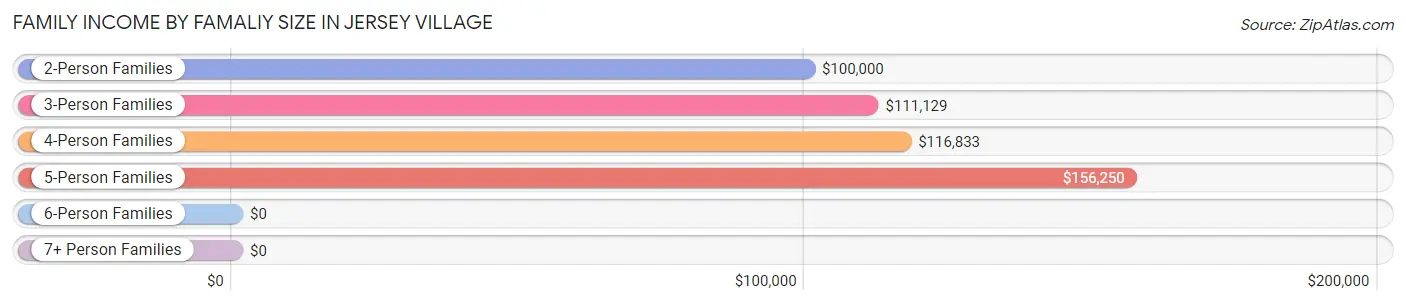
| Income Bracket | # Families | Median Income |
| 2-Person Families | 1,184 (55.1%) | $100,000 |
| 3-Person Families | 386 (18.0%) | $111,129 |
| 4-Person Families | 412 (19.2%) | $116,833 |
| 5-Person Families | 144 (6.7%) | $156,250 |
| 6-Person Families | 11 (0.5%) | $0 |
| 7+ Person Families | 10 (0.5%) | $0 |
| Total | 2,147 (100.0%) | $106,806 |
Family Income by Number of Earners in Jersey Village
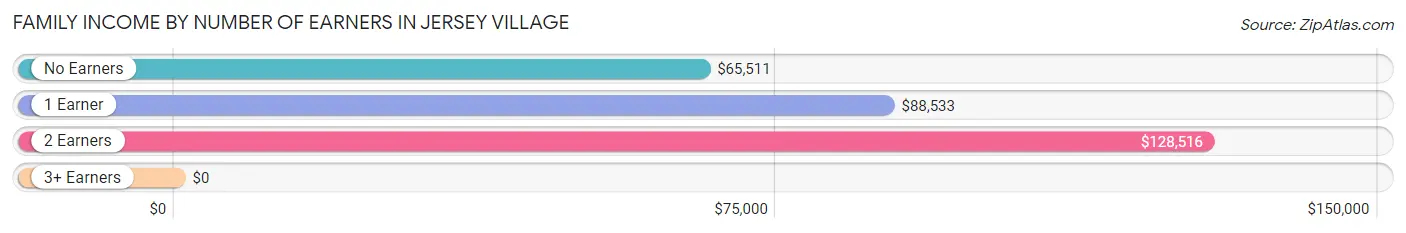
| Number of Earners | # Families | Median Income |
| No Earners | 289 (13.5%) | $65,511 |
| 1 Earner | 630 (29.3%) | $88,533 |
| 2 Earners | 1,111 (51.7%) | $128,516 |
| 3+ Earners | 117 (5.4%) | $0 |
| Total | 2,147 (100.0%) | $106,806 |
Household Income in Jersey Village
Household Income Brackets in Jersey Village
With 634 households falling in the category, the $75,000 to $99,999 income range is the most frequent in Jersey Village, accounting for 18.9% of all households. In contrast, only 54 households (1.6%) fall into the less than $10,000 income bracket, making it the least populous group.
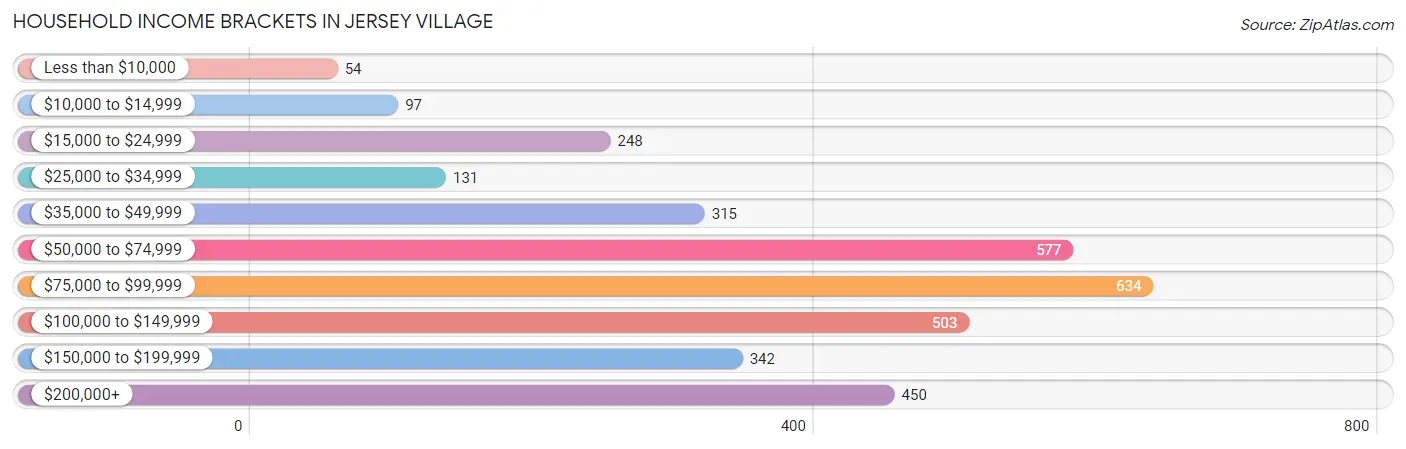
| Income Bracket | # Households | % Households |
| Less than $10,000 | 54 | 1.6% |
| $10,000 to $14,999 | 97 | 2.9% |
| $15,000 to $24,999 | 248 | 7.4% |
| $25,000 to $34,999 | 131 | 3.9% |
| $35,000 to $49,999 | 315 | 9.4% |
| $50,000 to $74,999 | 577 | 17.2% |
| $75,000 to $99,999 | 634 | 18.9% |
| $100,000 to $149,999 | 503 | 15.0% |
| $150,000 to $199,999 | 342 | 10.2% |
| $200,000+ | 450 | 13.4% |
Household Income by Householder Age in Jersey Village
The median household income in Jersey Village is $88,101, with the highest median household income of $115,417 found in the 45 to 64 years age bracket for the primary householder. A total of 952 households (28.4%) fall into this category. Meanwhile, the 65+ years age bracket for the primary householder has the lowest median household income of $67,917, with 1,056 households (31.5%) in this group.
| Income Bracket | # Households | Median Income |
| 15 to 24 Years | 305 (9.1%) | $90,801 |
| 25 to 44 Years | 1,043 (31.1%) | $77,708 |
| 45 to 64 Years | 952 (28.4%) | $115,417 |
| 65+ Years | 1,056 (31.5%) | $67,917 |
| Total | 3,356 (100.0%) | $88,101 |
Poverty in Jersey Village
Income Below Poverty by Sex and Age in Jersey Village
With 6.2% poverty level for males and 7.3% for females among the residents of Jersey Village, 6 to 11 year old males and 12 to 14 year old females are the most vulnerable to poverty, with 73 males (26.7%) and 50 females (38.8%) in their respective age groups living below the poverty level.
| Age Bracket | Male | Female |
| Under 5 Years | 0 (0.0%) | 0 (0.0%) |
| 5 Years | 0 (0.0%) | 0 (0.0%) |
| 6 to 11 Years | 73 (26.7%) | 0 (0.0%) |
| 12 to 14 Years | 0 (0.0%) | 50 (38.8%) |
| 15 Years | 0 (0.0%) | 0 (0.0%) |
| 16 and 17 Years | 0 (0.0%) | 0 (0.0%) |
| 18 to 24 Years | 10 (2.4%) | 40 (10.1%) |
| 25 to 34 Years | 22 (4.5%) | 36 (7.8%) |
| 35 to 44 Years | 54 (9.3%) | 45 (9.3%) |
| 45 to 54 Years | 24 (6.0%) | 27 (7.9%) |
| 55 to 64 Years | 9 (2.1%) | 14 (2.8%) |
| 65 to 74 Years | 23 (5.9%) | 30 (4.8%) |
| 75 Years and over | 14 (5.3%) | 47 (13.0%) |
| Total | 229 (6.2%) | 289 (7.3%) |
Income Above Poverty by Sex and Age in Jersey Village
According to the poverty statistics in Jersey Village, males aged under 5 years and females aged under 5 years are the age groups that are most secure financially, with 100.0% of males and 100.0% of females in these age groups living above the poverty line.
| Age Bracket | Male | Female |
| Under 5 Years | 175 (100.0%) | 295 (100.0%) |
| 5 Years | 23 (100.0%) | 83 (100.0%) |
| 6 to 11 Years | 200 (73.3%) | 247 (100.0%) |
| 12 to 14 Years | 205 (100.0%) | 79 (61.2%) |
| 15 Years | 0 (0.0%) | 11 (100.0%) |
| 16 and 17 Years | 34 (100.0%) | 41 (100.0%) |
| 18 to 24 Years | 414 (97.6%) | 357 (89.9%) |
| 25 to 34 Years | 464 (95.5%) | 426 (92.2%) |
| 35 to 44 Years | 524 (90.7%) | 437 (90.7%) |
| 45 to 54 Years | 373 (94.0%) | 313 (92.1%) |
| 55 to 64 Years | 415 (97.9%) | 489 (97.2%) |
| 65 to 74 Years | 367 (94.1%) | 591 (95.2%) |
| 75 Years and over | 251 (94.7%) | 314 (87.0%) |
| Total | 3,445 (93.8%) | 3,683 (92.7%) |
Income Below Poverty Among Married-Couple Families in Jersey Village
The poverty statistics for married-couple families in Jersey Village show that 5.0% or 90 of the total 1,786 families live below the poverty line. Families with 1 or 2 children have the highest poverty rate of 14.2%, comprising of 70 families. On the other hand, families with 3 or 4 children have the lowest poverty rate of 0.0%, which includes 0 families.
| Children | Above Poverty | Below Poverty |
| No Children | 1,170 (98.3%) | 20 (1.7%) |
| 1 or 2 Children | 424 (85.8%) | 70 (14.2%) |
| 3 or 4 Children | 92 (100.0%) | 0 (0.0%) |
| 5 or more Children | 10 (100.0%) | 0 (0.0%) |
| Total | 1,696 (95.0%) | 90 (5.0%) |
Income Below Poverty Among Single-Parent Households in Jersey Village
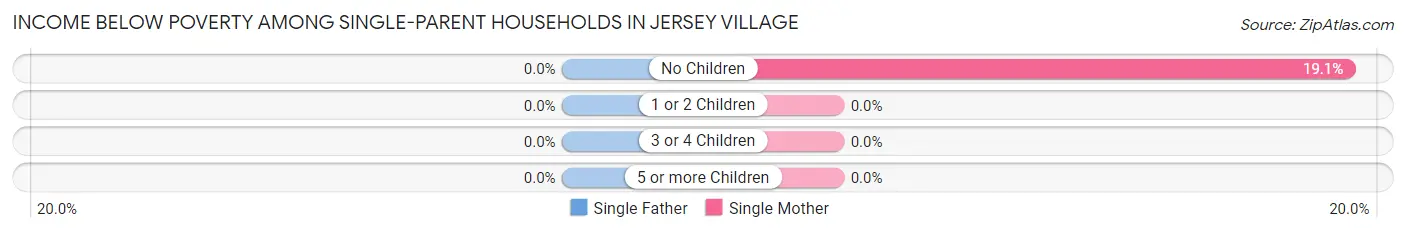
| Children | Single Father | Single Mother |
| No Children | 0 (0.0%) | 16 (19.1%) |
| 1 or 2 Children | 0 (0.0%) | 0 (0.0%) |
| 3 or 4 Children | 0 (0.0%) | 0 (0.0%) |
| 5 or more Children | 0 (0.0%) | 0 (0.0%) |
| Total | 0 (0.0%) | 16 (7.8%) |
Income Below Poverty Among Married-Couple vs Single-Parent Households in Jersey Village
The poverty data for Jersey Village shows that 90 of the married-couple family households (5.0%) and 16 of the single-parent households (4.4%) are living below the poverty level. Within the married-couple family households, those with 1 or 2 children have the highest poverty rate, with 70 households (14.2%) falling below the poverty line. Among the single-parent households, those with no children have the highest poverty rate, with 16 household (10.5%) living below poverty.
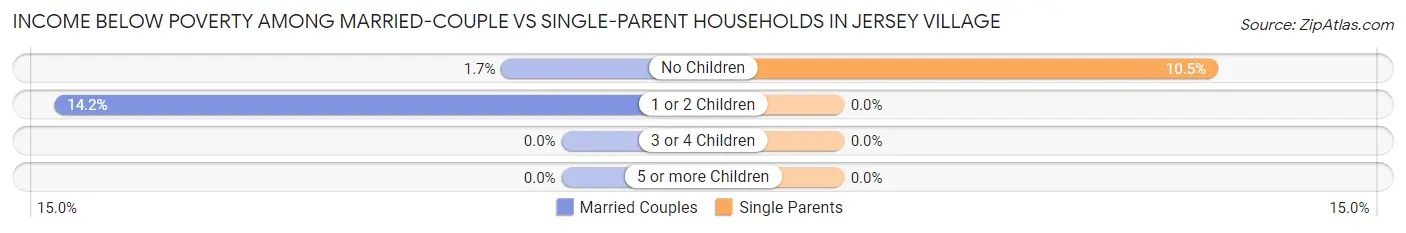
| Children | Married-Couple Families | Single-Parent Households |
| No Children | 20 (1.7%) | 16 (10.5%) |
| 1 or 2 Children | 70 (14.2%) | 0 (0.0%) |
| 3 or 4 Children | 0 (0.0%) | 0 (0.0%) |
| 5 or more Children | 0 (0.0%) | 0 (0.0%) |
| Total | 90 (5.0%) | 16 (4.4%) |
Race in Jersey Village
The most populous races in Jersey Village are White / Caucasian (5,144 | 66.3%), Hispanic or Latino (1,888 | 24.3%), and Black / African American (857 | 11.0%).
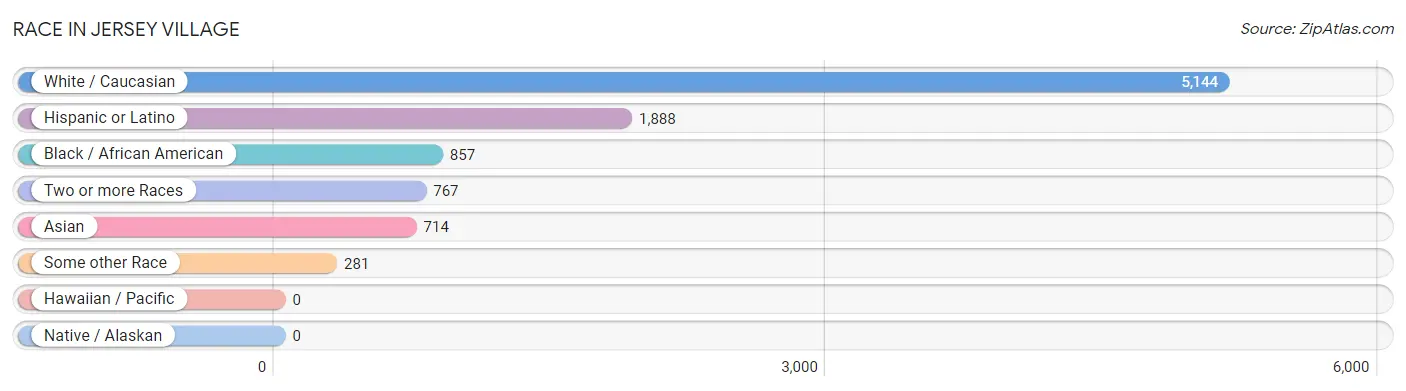
| Race | # Population | % Population |
| Asian | 714 | 9.2% |
| Black / African American | 857 | 11.0% |
| Hawaiian / Pacific | 0 | 0.0% |
| Hispanic or Latino | 1,888 | 24.3% |
| Native / Alaskan | 0 | 0.0% |
| White / Caucasian | 5,144 | 66.3% |
| Two or more Races | 767 | 9.9% |
| Some other Race | 281 | 3.6% |
| Total | 7,763 | 100.0% |
Ancestry in Jersey Village
The most populous ancestries reported in Jersey Village are Mexican (1,148 | 14.8%), German (932 | 12.0%), Irish (729 | 9.4%), English (720 | 9.3%), and American (518 | 6.7%), together accounting for 52.1% of all Jersey Village residents.
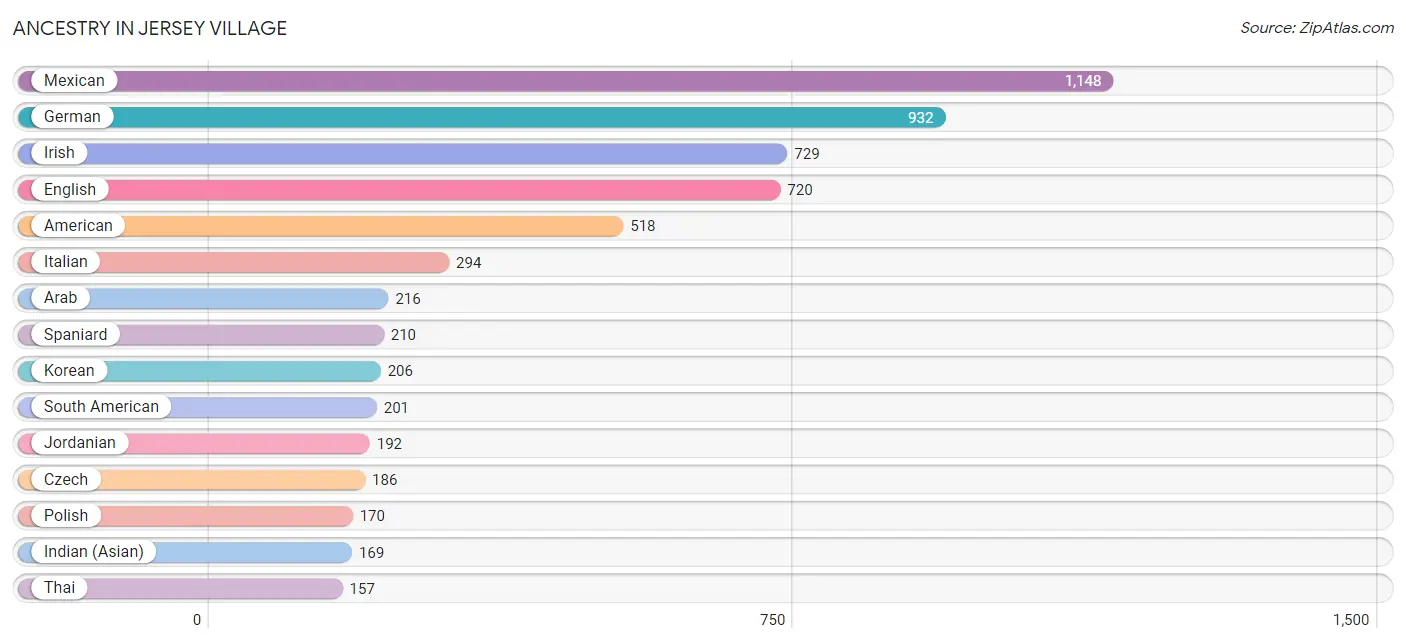
| Ancestry | # Population | % Population |
| African | 45 | 0.6% |
| American | 518 | 6.7% |
| Arab | 216 | 2.8% |
| Bhutanese | 22 | 0.3% |
| Bolivian | 9 | 0.1% |
| Brazilian | 20 | 0.3% |
| British | 95 | 1.2% |
| Burmese | 17 | 0.2% |
| Cajun | 15 | 0.2% |
| Canadian | 9 | 0.1% |
| Central American | 67 | 0.9% |
| Colombian | 67 | 0.9% |
| Czech | 186 | 2.4% |
| Czechoslovakian | 35 | 0.4% |
| Danish | 39 | 0.5% |
| Dominican | 93 | 1.2% |
| Dutch | 25 | 0.3% |
| Ecuadorian | 10 | 0.1% |
| Egyptian | 20 | 0.3% |
| English | 720 | 9.3% |
| European | 119 | 1.5% |
| Finnish | 9 | 0.1% |
| French | 65 | 0.8% |
| French Canadian | 25 | 0.3% |
| German | 932 | 12.0% |
| Greek | 42 | 0.5% |
| Honduran | 32 | 0.4% |
| Icelander | 40 | 0.5% |
| Indian (Asian) | 169 | 2.2% |
| Irish | 729 | 9.4% |
| Italian | 294 | 3.8% |
| Jamaican | 12 | 0.2% |
| Jordanian | 192 | 2.5% |
| Korean | 206 | 2.6% |
| Lebanese | 4 | 0.1% |
| Lithuanian | 8 | 0.1% |
| Mexican | 1,148 | 14.8% |
| New Zealander | 21 | 0.3% |
| Nicaraguan | 11 | 0.1% |
| Northern European | 10 | 0.1% |
| Norwegian | 20 | 0.3% |
| Peruvian | 48 | 0.6% |
| Polish | 170 | 2.2% |
| Portuguese | 98 | 1.3% |
| Puerto Rican | 87 | 1.1% |
| Russian | 9 | 0.1% |
| Salvadoran | 24 | 0.3% |
| Scandinavian | 30 | 0.4% |
| Scotch-Irish | 96 | 1.2% |
| Scottish | 62 | 0.8% |
| South American | 201 | 2.6% |
| Spaniard | 210 | 2.7% |
| Spanish | 25 | 0.3% |
| Spanish American | 34 | 0.4% |
| Sri Lankan | 97 | 1.3% |
| Subsaharan African | 45 | 0.6% |
| Swedish | 87 | 1.1% |
| Swiss | 105 | 1.3% |
| Thai | 157 | 2.0% |
| Turkish | 32 | 0.4% |
| Venezuelan | 67 | 0.9% |
| Welsh | 56 | 0.7% | View All 62 Rows |
Immigrants in Jersey Village
The most numerous immigrant groups reported in Jersey Village came from Asia (713 | 9.2%), Latin America (575 | 7.4%), Central America (367 | 4.7%), Mexico (331 | 4.3%), and Western Asia (208 | 2.7%), together accounting for 28.3% of all Jersey Village residents.
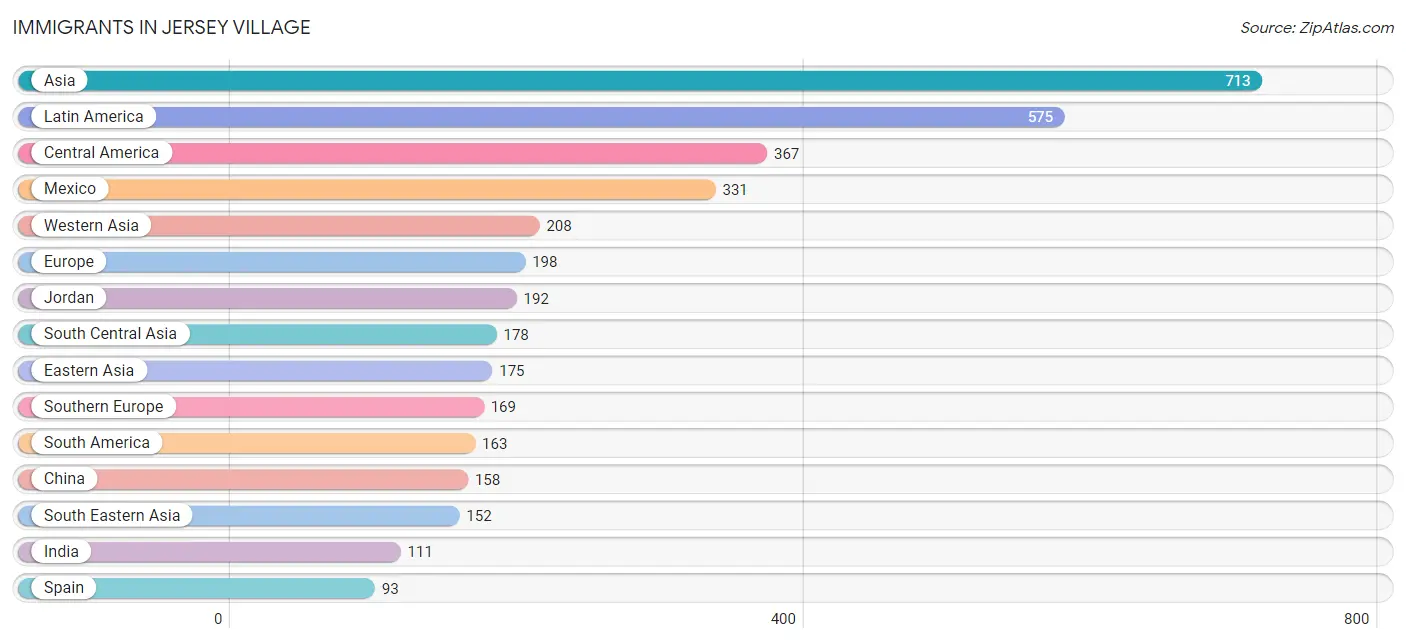
| Immigration Origin | # Population | % Population |
| Africa | 32 | 0.4% |
| Argentina | 15 | 0.2% |
| Asia | 713 | 9.2% |
| Brazil | 20 | 0.3% |
| Canada | 9 | 0.1% |
| Caribbean | 45 | 0.6% |
| Central America | 367 | 4.7% |
| China | 158 | 2.0% |
| Colombia | 45 | 0.6% |
| Costa Rica | 4 | 0.1% |
| Dominican Republic | 45 | 0.6% |
| Eastern Africa | 12 | 0.2% |
| Eastern Asia | 175 | 2.2% |
| Eastern Europe | 9 | 0.1% |
| Egypt | 20 | 0.3% |
| Europe | 198 | 2.5% |
| Greece | 34 | 0.4% |
| Honduras | 32 | 0.4% |
| Hong Kong | 81 | 1.0% |
| India | 111 | 1.4% |
| Ireland | 10 | 0.1% |
| Jordan | 192 | 2.5% |
| Korea | 17 | 0.2% |
| Latin America | 575 | 7.4% |
| Mexico | 331 | 4.3% |
| Northern Africa | 20 | 0.3% |
| Northern Europe | 20 | 0.3% |
| Pakistan | 67 | 0.9% |
| Philippines | 89 | 1.1% |
| Portugal | 42 | 0.5% |
| Russia | 9 | 0.1% |
| Saudi Arabia | 8 | 0.1% |
| South America | 163 | 2.1% |
| South Central Asia | 178 | 2.3% |
| South Eastern Asia | 152 | 2.0% |
| Southern Europe | 169 | 2.2% |
| Spain | 93 | 1.2% |
| Taiwan | 22 | 0.3% |
| Turkey | 8 | 0.1% |
| Venezuela | 83 | 1.1% |
| Vietnam | 63 | 0.8% |
| Western Asia | 208 | 2.7% | View All 42 Rows |
Sex and Age in Jersey Village
Sex and Age in Jersey Village
The most populous age groups in Jersey Village are 20 to 24 Years (344 | 9.2%) for men and 70 to 74 Years (360 | 8.9%) for women.
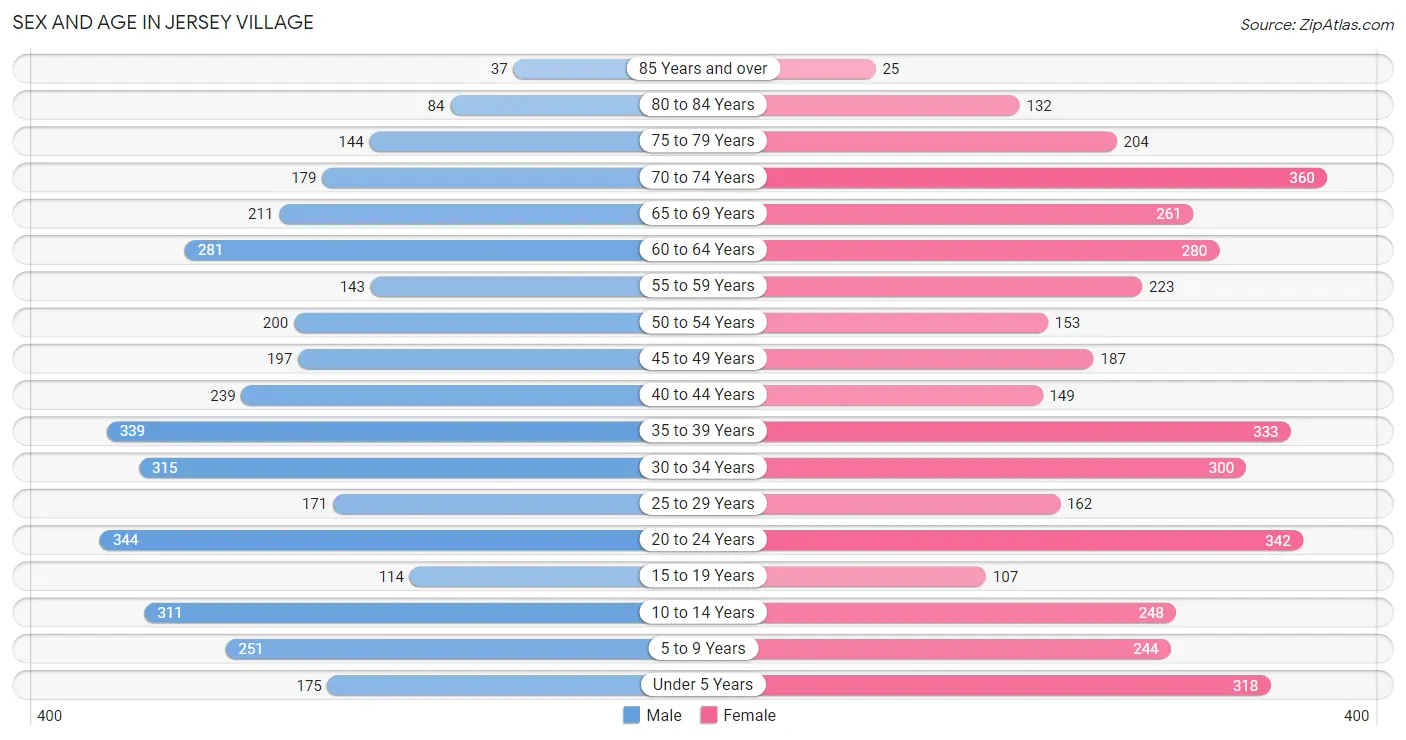
| Age Bracket | Male | Female |
| Under 5 Years | 175 (4.7%) | 318 (7.9%) |
| 5 to 9 Years | 251 (6.7%) | 244 (6.1%) |
| 10 to 14 Years | 311 (8.3%) | 248 (6.2%) |
| 15 to 19 Years | 114 (3.0%) | 107 (2.7%) |
| 20 to 24 Years | 344 (9.2%) | 342 (8.5%) |
| 25 to 29 Years | 171 (4.6%) | 162 (4.0%) |
| 30 to 34 Years | 315 (8.4%) | 300 (7.4%) |
| 35 to 39 Years | 339 (9.1%) | 333 (8.3%) |
| 40 to 44 Years | 239 (6.4%) | 149 (3.7%) |
| 45 to 49 Years | 197 (5.3%) | 187 (4.6%) |
| 50 to 54 Years | 200 (5.3%) | 153 (3.8%) |
| 55 to 59 Years | 143 (3.8%) | 223 (5.5%) |
| 60 to 64 Years | 281 (7.5%) | 280 (7.0%) |
| 65 to 69 Years | 211 (5.7%) | 261 (6.5%) |
| 70 to 74 Years | 179 (4.8%) | 360 (8.9%) |
| 75 to 79 Years | 144 (3.9%) | 204 (5.1%) |
| 80 to 84 Years | 84 (2.2%) | 132 (3.3%) |
| 85 Years and over | 37 (1.0%) | 25 (0.6%) |
| Total | 3,735 (100.0%) | 4,028 (100.0%) |
Families and Households in Jersey Village
Median Family Size in Jersey Village
The median family size in Jersey Village is 2.85 persons per family, with single female/mother families (205 | 9.6%) accounting for the largest median family size of 3.05 persons per family. On the other hand, single male/father families (156 | 7.3%) represent the smallest median family size with 2.80 persons per family.
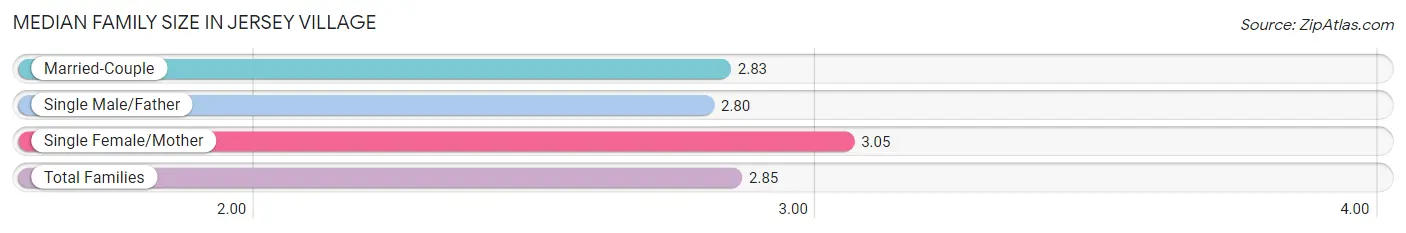
| Family Type | # Families | Family Size |
| Married-Couple | 1,786 (83.2%) | 2.83 |
| Single Male/Father | 156 (7.3%) | 2.80 |
| Single Female/Mother | 205 (9.6%) | 3.05 |
| Total Families | 2,147 (100.0%) | 2.85 |
Median Household Size in Jersey Village
The median household size in Jersey Village is 2.31 persons per household, with single female/mother households (205 | 6.1%) accounting for the largest median household size of 3.21 persons per household. non-family households (1,209 | 36.0%) represent the smallest median household size with 1.27 persons per household.
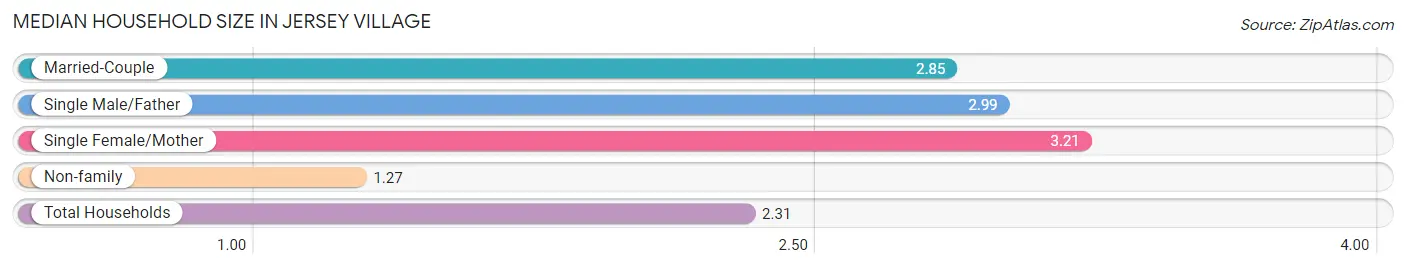
| Household Type | # Households | Household Size |
| Married-Couple | 1,786 (53.2%) | 2.85 |
| Single Male/Father | 156 (4.6%) | 2.99 |
| Single Female/Mother | 205 (6.1%) | 3.21 |
| Non-family | 1,209 (36.0%) | 1.27 |
| Total Households | 3,356 (100.0%) | 2.31 |
Household Size by Marriage Status in Jersey Village
Out of a total of 3,356 households in Jersey Village, 2,147 (64.0%) are family households, while 1,209 (36.0%) are nonfamily households. The most numerous type of family households are 2-person households, comprising 1,161, and the most common type of nonfamily households are 1-person households, comprising 1,009.
| Household Size | Family Households | Nonfamily Households |
| 1-Person Households | - | 1,009 (30.1%) |
| 2-Person Households | 1,161 (34.6%) | 147 (4.4%) |
| 3-Person Households | 396 (11.8%) | 0 (0.0%) |
| 4-Person Households | 383 (11.4%) | 53 (1.6%) |
| 5-Person Households | 180 (5.4%) | 0 (0.0%) |
| 6-Person Households | 17 (0.5%) | 0 (0.0%) |
| 7+ Person Households | 10 (0.3%) | 0 (0.0%) |
| Total | 2,147 (64.0%) | 1,209 (36.0%) |
Female Fertility in Jersey Village
Fertility by Age in Jersey Village
Average fertility rate in Jersey Village is 58.0 births per 1,000 women. Women in the age bracket of 20 to 34 years have the highest fertility rate with 90.0 births per 1,000 women. Women in the age bracket of 20 to 34 years acount for 75.8% of all women with births.
| Age Bracket | Women with Births | Births / 1,000 Women |
| 15 to 19 years | 0 (0.0%) | 0.0 |
| 20 to 34 years | 72 (75.8%) | 90.0 |
| 35 to 50 years | 23 (24.2%) | 32.0 |
| Total | 95 (100.0%) | 58.0 |
Fertility by Age by Marriage Status in Jersey Village
| Age Bracket | Married | Unmarried |
| 15 to 19 years | 0 (0.0%) | 0 (0.0%) |
| 20 to 34 years | 72 (100.0%) | 0 (0.0%) |
| 35 to 50 years | 23 (100.0%) | 0 (0.0%) |
| Total | 95 (100.0%) | 0 (0.0%) |
Fertility by Education in Jersey Village
| Educational Attainment | Women with Births | Births / 1,000 Women |
| Less than High School | 0 (0.0%) | 0.0 |
| High School Diploma | 0 (0.0%) | 0.0 |
| College or Associate's Degree | 0 (0.0%) | 0.0 |
| Bachelor's Degree | 39 (41.0%) | 92.0 |
| Graduate Degree | 56 (59.0%) | 242.0 |
| Total | 95 (100.0%) | 58.0 |
Fertility by Education by Marriage Status in Jersey Village
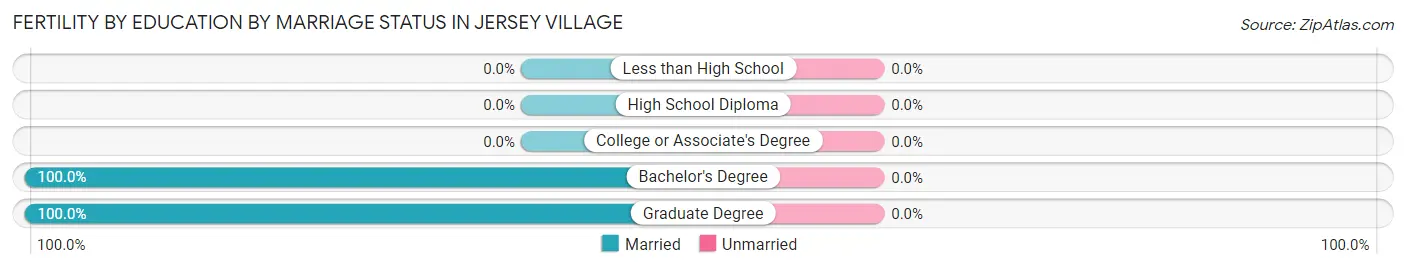
| Educational Attainment | Married | Unmarried |
| Less than High School | 0 (0.0%) | 0 (0.0%) |
| High School Diploma | 0 (0.0%) | 0 (0.0%) |
| College or Associate's Degree | 0 (0.0%) | 0 (0.0%) |
| Bachelor's Degree | 39 (100.0%) | 0 (0.0%) |
| Graduate Degree | 56 (100.0%) | 0 (0.0%) |
| Total | 95 (100.0%) | 0 (0.0%) |
Employment Characteristics in Jersey Village
Employment by Class of Employer in Jersey Village
Among the 3,722 employed individuals in Jersey Village, private company employees (2,796 | 75.1%), local government employees (284 | 7.6%), and self-employed (not incorporated) (273 | 7.3%) make up the most common classes of employment.
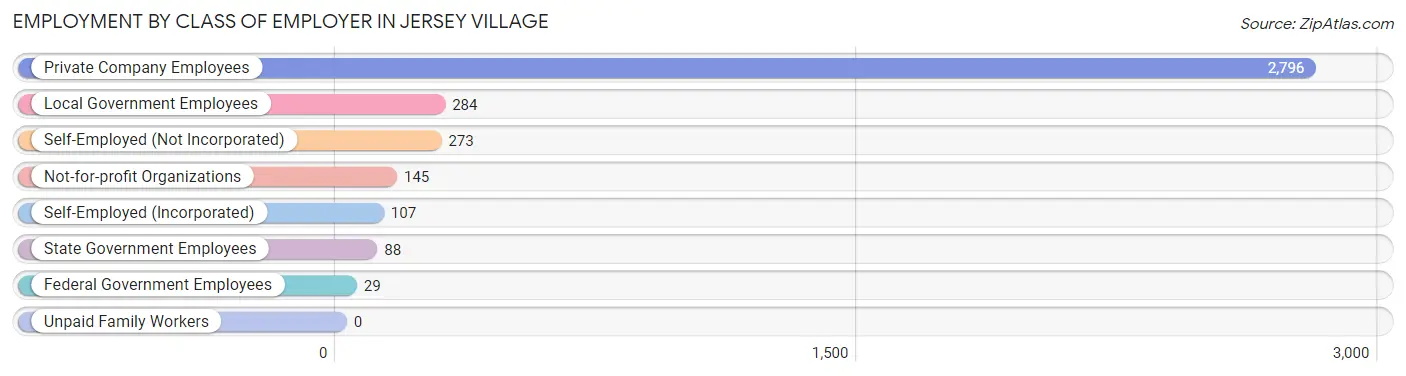
| Employer Class | # Employees | % Employees |
| Private Company Employees | 2,796 | 75.1% |
| Self-Employed (Incorporated) | 107 | 2.9% |
| Self-Employed (Not Incorporated) | 273 | 7.3% |
| Not-for-profit Organizations | 145 | 3.9% |
| Local Government Employees | 284 | 7.6% |
| State Government Employees | 88 | 2.4% |
| Federal Government Employees | 29 | 0.8% |
| Unpaid Family Workers | 0 | 0.0% |
| Total | 3,722 | 100.0% |
Employment Status by Age in Jersey Village
According to the labor force statistics for Jersey Village, out of the total population over 16 years of age (6,205), 65.5% or 4,064 individuals are in the labor force, with 4.2% or 171 of them unemployed. The age group with the highest labor force participation rate is 20 to 24 years, with 89.9% or 617 individuals in the labor force. Within the labor force, the 30 to 34 years age range has the highest percentage of unemployed individuals, with 9.6% or 51 of them being unemployed.
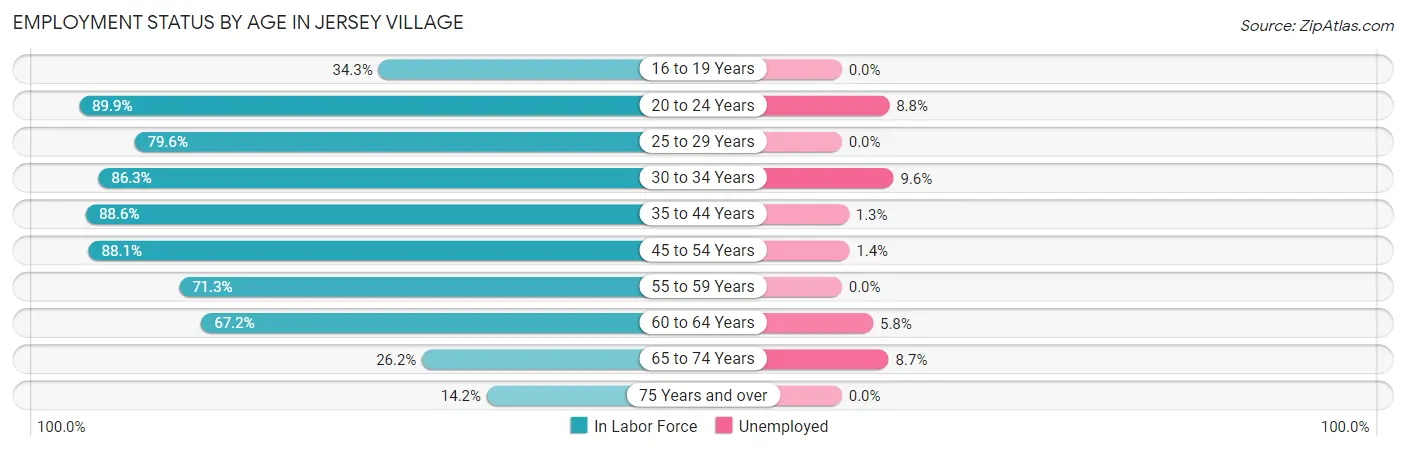
| Age Bracket | In Labor Force | Unemployed |
| 16 to 19 Years | 72 (34.3%) | 0 (0.0%) |
| 20 to 24 Years | 617 (89.9%) | 54 (8.8%) |
| 25 to 29 Years | 265 (79.6%) | 0 (0.0%) |
| 30 to 34 Years | 531 (86.3%) | 51 (9.6%) |
| 35 to 44 Years | 939 (88.6%) | 12 (1.3%) |
| 45 to 54 Years | 649 (88.1%) | 9 (1.4%) |
| 55 to 59 Years | 261 (71.3%) | 0 (0.0%) |
| 60 to 64 Years | 377 (67.2%) | 22 (5.8%) |
| 65 to 74 Years | 265 (26.2%) | 23 (8.7%) |
| 75 Years and over | 89 (14.2%) | 0 (0.0%) |
| Total | 4,064 (65.5%) | 171 (4.2%) |
Employment Status by Educational Attainment in Jersey Village
According to labor force statistics for Jersey Village, 82.3% of individuals (3,022) out of the total population between 25 and 64 years of age (3,672) are in the labor force, with 3.1% or 94 of them being unemployed. The group with the highest labor force participation rate are those with the educational attainment of bachelor's degree or higher, with 87.2% or 1,577 individuals in the labor force. Within the labor force, individuals with college / associate degree education have the highest percentage of unemployment, with 6.5% or 61 of them being unemployed.
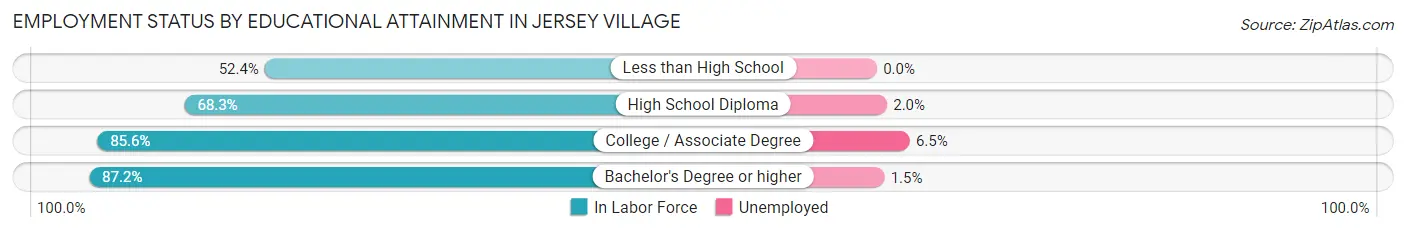
| Educational Attainment | In Labor Force | Unemployed |
| Less than High School | 55 (52.4%) | 0 (0.0%) |
| High School Diploma | 457 (68.3%) | 13 (2.0%) |
| College / Associate Degree | 932 (85.6%) | 71 (6.5%) |
| Bachelor's Degree or higher | 1,577 (87.2%) | 27 (1.5%) |
| Total | 3,022 (82.3%) | 114 (3.1%) |
Employment Occupations by Sex in Jersey Village
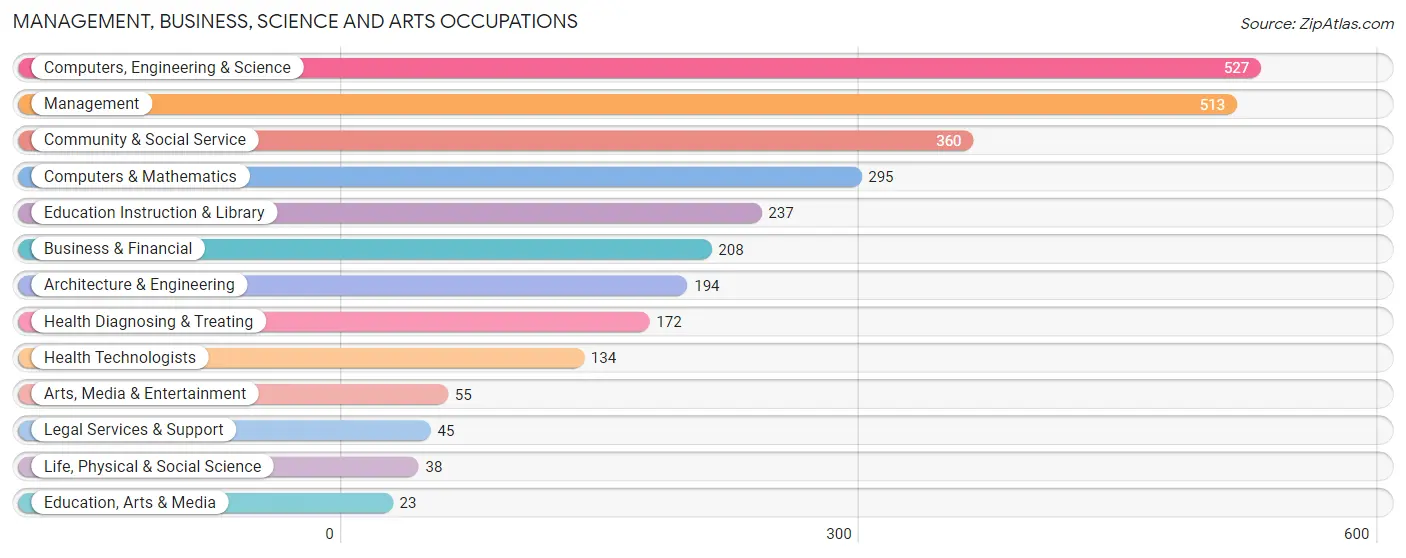
Management, Business, Science and Arts Occupations
The most common Management, Business, Science and Arts occupations in Jersey Village are Computers, Engineering & Science (527 | 13.5%), Management (513 | 13.2%), Community & Social Service (360 | 9.2%), Computers & Mathematics (295 | 7.6%), and Education Instruction & Library (237 | 6.1%).
Management, Business, Science and Arts Occupations by Sex
Within the Management, Business, Science and Arts occupations in Jersey Village, the most male-oriented occupations are Life, Physical & Social Science (100.0%), Architecture & Engineering (86.6%), and Computers, Engineering & Science (77.6%), while the most female-oriented occupations are Health Diagnosing & Treating (86.1%), Health Technologists (82.1%), and Education Instruction & Library (75.5%).
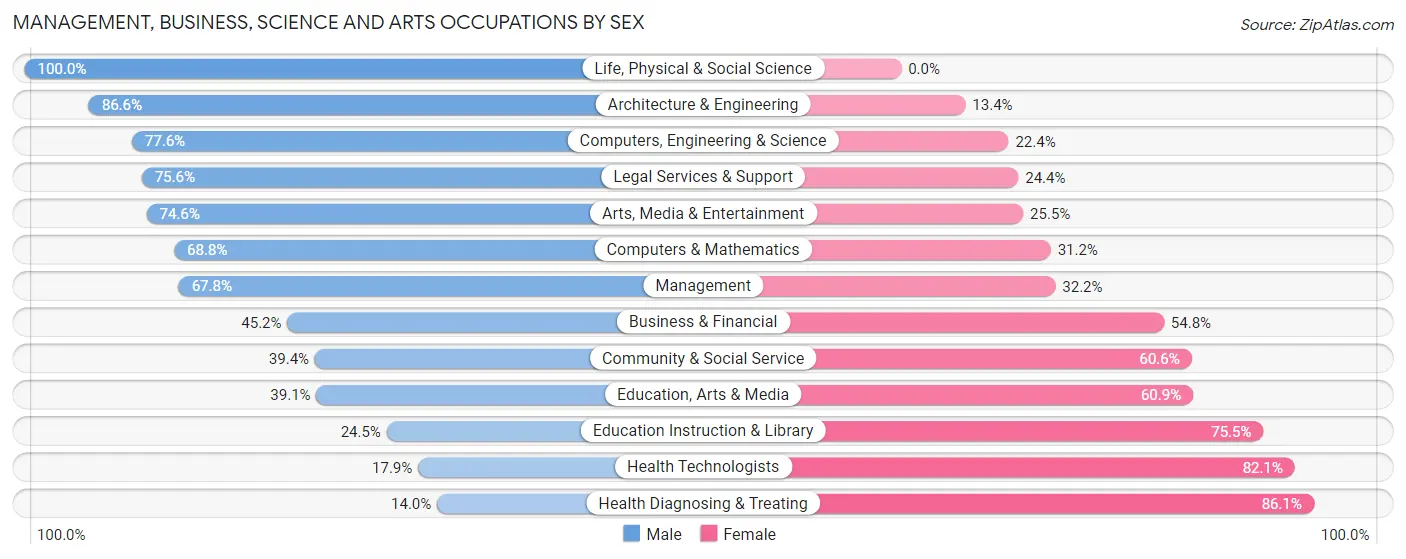
| Occupation | Male | Female |
| Management | 348 (67.8%) | 165 (32.2%) |
| Business & Financial | 94 (45.2%) | 114 (54.8%) |
| Computers, Engineering & Science | 409 (77.6%) | 118 (22.4%) |
| Computers & Mathematics | 203 (68.8%) | 92 (31.2%) |
| Architecture & Engineering | 168 (86.6%) | 26 (13.4%) |
| Life, Physical & Social Science | 38 (100.0%) | 0 (0.0%) |
| Community & Social Service | 142 (39.4%) | 218 (60.6%) |
| Education, Arts & Media | 9 (39.1%) | 14 (60.9%) |
| Legal Services & Support | 34 (75.6%) | 11 (24.4%) |
| Education Instruction & Library | 58 (24.5%) | 179 (75.5%) |
| Arts, Media & Entertainment | 41 (74.6%) | 14 (25.5%) |
| Health Diagnosing & Treating | 24 (14.0%) | 148 (86.1%) |
| Health Technologists | 24 (17.9%) | 110 (82.1%) |
| Total (Category) | 1,017 (57.1%) | 763 (42.9%) |
| Total (Overall) | 2,148 (55.2%) | 1,746 (44.8%) |
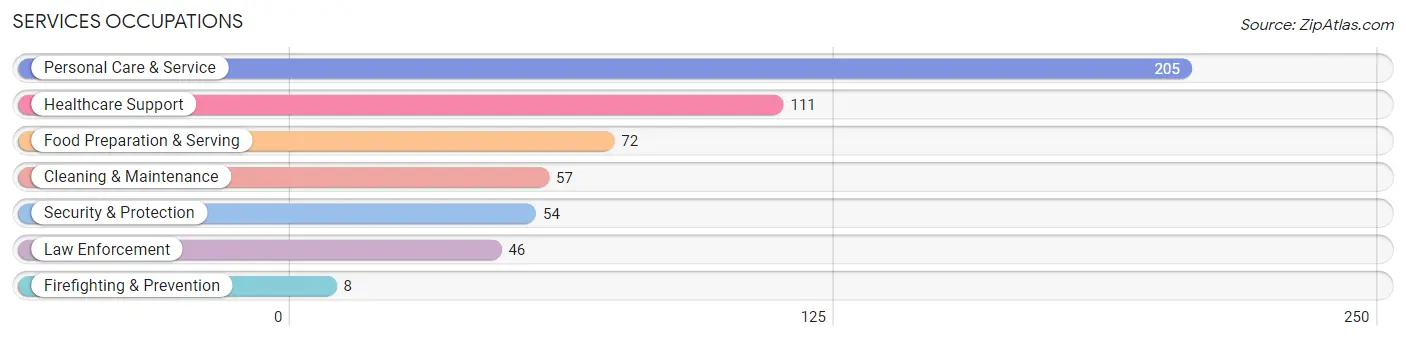
Services Occupations
The most common Services occupations in Jersey Village are Personal Care & Service (205 | 5.3%), Healthcare Support (111 | 2.9%), Food Preparation & Serving (72 | 1.8%), Cleaning & Maintenance (57 | 1.5%), and Security & Protection (54 | 1.4%).
Services Occupations by Sex
Within the Services occupations in Jersey Village, the most male-oriented occupations are Cleaning & Maintenance (86.0%), Food Preparation & Serving (79.2%), and Law Enforcement (76.1%), while the most female-oriented occupations are Healthcare Support (100.0%), Firefighting & Prevention (100.0%), and Personal Care & Service (72.7%).
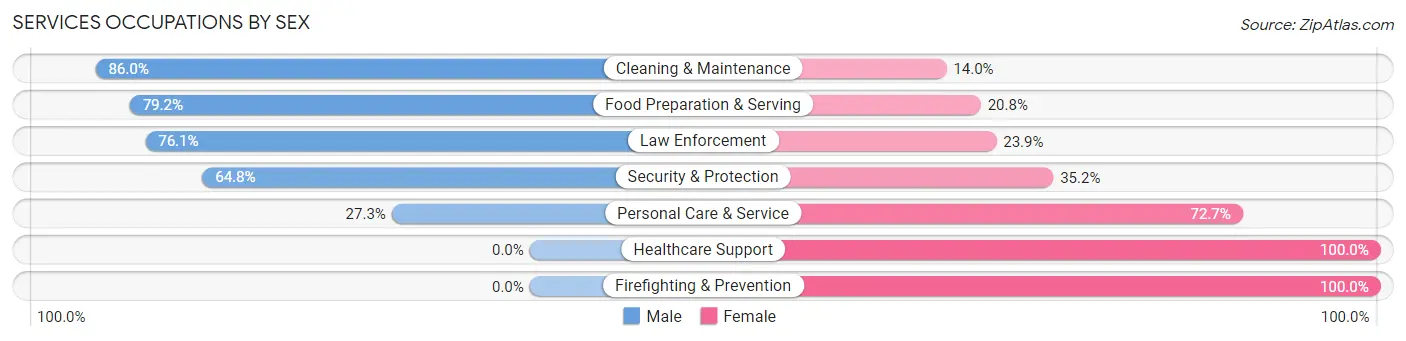
| Occupation | Male | Female |
| Healthcare Support | 0 (0.0%) | 111 (100.0%) |
| Security & Protection | 35 (64.8%) | 19 (35.2%) |
| Firefighting & Prevention | 0 (0.0%) | 8 (100.0%) |
| Law Enforcement | 35 (76.1%) | 11 (23.9%) |
| Food Preparation & Serving | 57 (79.2%) | 15 (20.8%) |
| Cleaning & Maintenance | 49 (86.0%) | 8 (14.0%) |
| Personal Care & Service | 56 (27.3%) | 149 (72.7%) |
| Total (Category) | 197 (39.5%) | 302 (60.5%) |
| Total (Overall) | 2,148 (55.2%) | 1,746 (44.8%) |
Sales and Office Occupations
The most common Sales and Office occupations in Jersey Village are Office & Administration (689 | 17.7%), and Sales & Related (457 | 11.7%).

Sales and Office Occupations by Sex
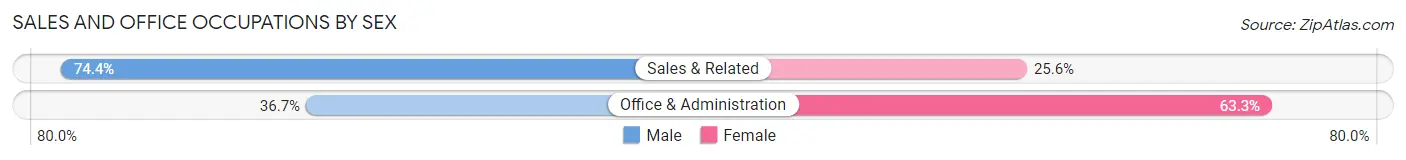
| Occupation | Male | Female |
| Sales & Related | 340 (74.4%) | 117 (25.6%) |
| Office & Administration | 253 (36.7%) | 436 (63.3%) |
| Total (Category) | 593 (51.7%) | 553 (48.2%) |
| Total (Overall) | 2,148 (55.2%) | 1,746 (44.8%) |
Natural Resources, Construction and Maintenance Occupations
The most common Natural Resources, Construction and Maintenance occupations in Jersey Village are Construction & Extraction (115 | 2.9%), and Installation, Maintenance & Repair (56 | 1.4%).
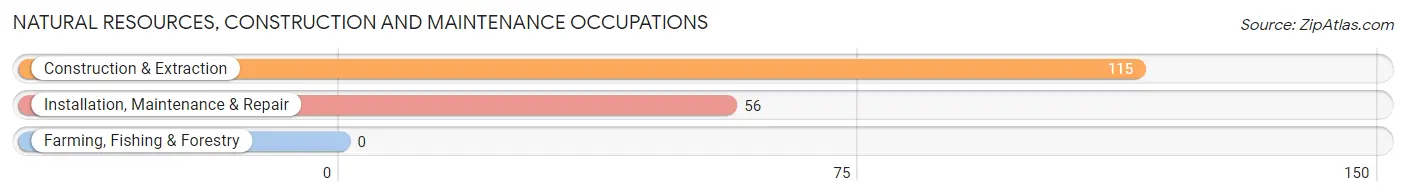
Natural Resources, Construction and Maintenance Occupations by Sex
| Occupation | Male | Female |
| Farming, Fishing & Forestry | 0 (0.0%) | 0 (0.0%) |
| Construction & Extraction | 115 (100.0%) | 0 (0.0%) |
| Installation, Maintenance & Repair | 56 (100.0%) | 0 (0.0%) |
| Total (Category) | 171 (100.0%) | 0 (0.0%) |
| Total (Overall) | 2,148 (55.2%) | 1,746 (44.8%) |
Production, Transportation and Moving Occupations
The most common Production, Transportation and Moving occupations in Jersey Village are Material Moving (129 | 3.3%), Transportation (93 | 2.4%), and Production (76 | 1.9%).
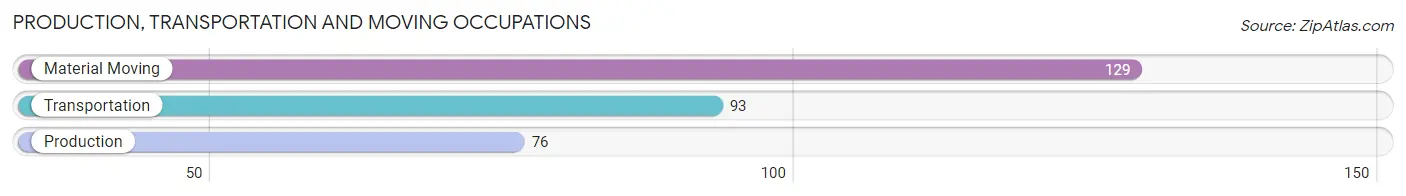
Production, Transportation and Moving Occupations by Sex
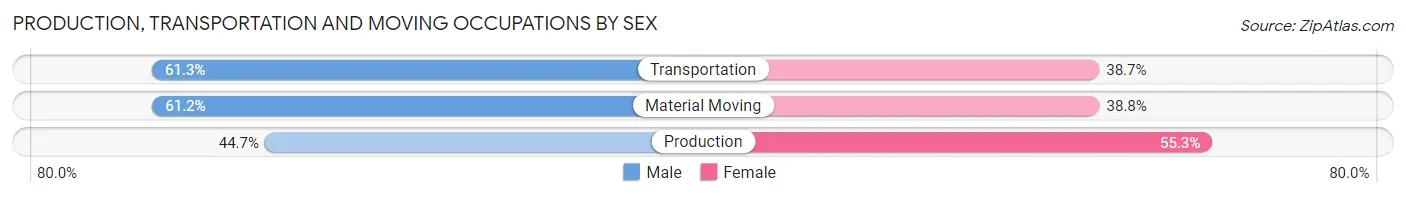
| Occupation | Male | Female |
| Production | 34 (44.7%) | 42 (55.3%) |
| Transportation | 57 (61.3%) | 36 (38.7%) |
| Material Moving | 79 (61.2%) | 50 (38.8%) |
| Total (Category) | 170 (57.1%) | 128 (42.9%) |
| Total (Overall) | 2,148 (55.2%) | 1,746 (44.8%) |
Employment Industries by Sex in Jersey Village
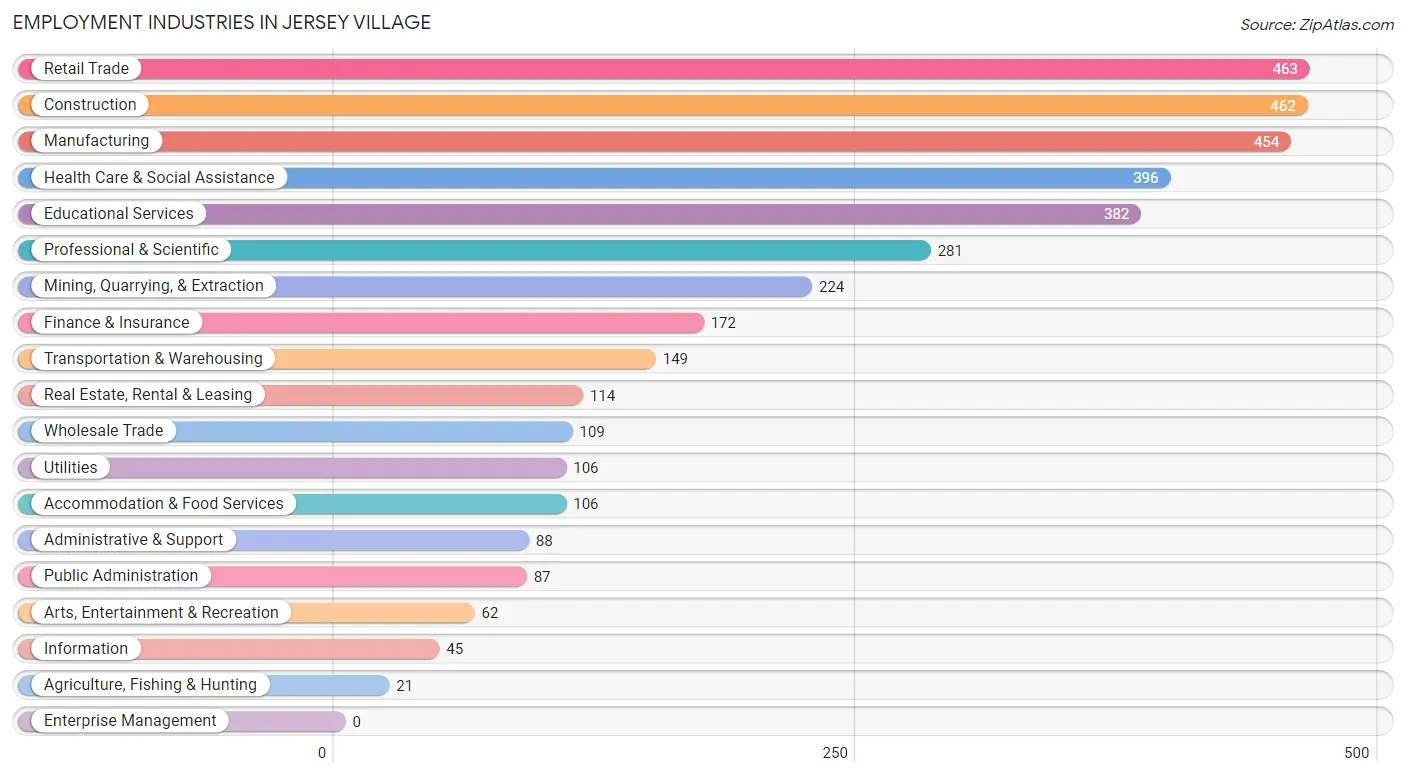
Employment Industries in Jersey Village
The major employment industries in Jersey Village include Retail Trade (463 | 11.9%), Construction (462 | 11.9%), Manufacturing (454 | 11.7%), Health Care & Social Assistance (396 | 10.2%), and Educational Services (382 | 9.8%).
Employment Industries by Sex in Jersey Village
The Jersey Village industries that see more men than women are Wholesale Trade (100.0%), Arts, Entertainment & Recreation (100.0%), and Accommodation & Food Services (85.9%), whereas the industries that tend to have a higher number of women are Agriculture, Fishing & Hunting (100.0%), Health Care & Social Assistance (72.0%), and Educational Services (71.5%).
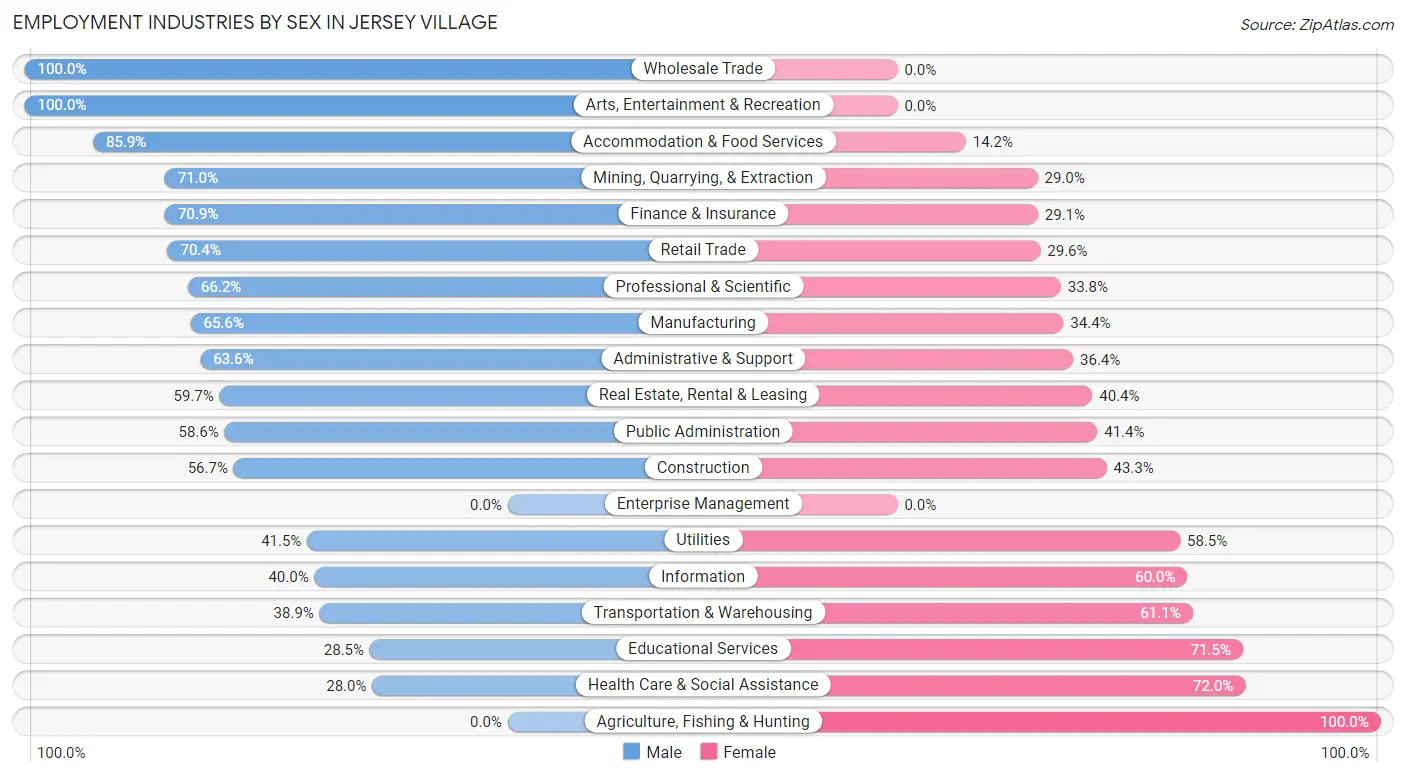
| Industry | Male | Female |
| Agriculture, Fishing & Hunting | 0 (0.0%) | 21 (100.0%) |
| Mining, Quarrying, & Extraction | 159 (71.0%) | 65 (29.0%) |
| Construction | 262 (56.7%) | 200 (43.3%) |
| Manufacturing | 298 (65.6%) | 156 (34.4%) |
| Wholesale Trade | 109 (100.0%) | 0 (0.0%) |
| Retail Trade | 326 (70.4%) | 137 (29.6%) |
| Transportation & Warehousing | 58 (38.9%) | 91 (61.1%) |
| Utilities | 44 (41.5%) | 62 (58.5%) |
| Information | 18 (40.0%) | 27 (60.0%) |
| Finance & Insurance | 122 (70.9%) | 50 (29.1%) |
| Real Estate, Rental & Leasing | 68 (59.7%) | 46 (40.4%) |
| Professional & Scientific | 186 (66.2%) | 95 (33.8%) |
| Enterprise Management | 0 (0.0%) | 0 (0.0%) |
| Administrative & Support | 56 (63.6%) | 32 (36.4%) |
| Educational Services | 109 (28.5%) | 273 (71.5%) |
| Health Care & Social Assistance | 111 (28.0%) | 285 (72.0%) |
| Arts, Entertainment & Recreation | 62 (100.0%) | 0 (0.0%) |
| Accommodation & Food Services | 91 (85.9%) | 15 (14.1%) |
| Public Administration | 51 (58.6%) | 36 (41.4%) |
| Total | 2,148 (55.2%) | 1,746 (44.8%) |
Education in Jersey Village
School Enrollment in Jersey Village
The most common levels of schooling among the 1,830 students in Jersey Village are college / undergraduate (576 | 31.5%), middle school (437 | 23.9%), and elementary school (243 | 13.3%).
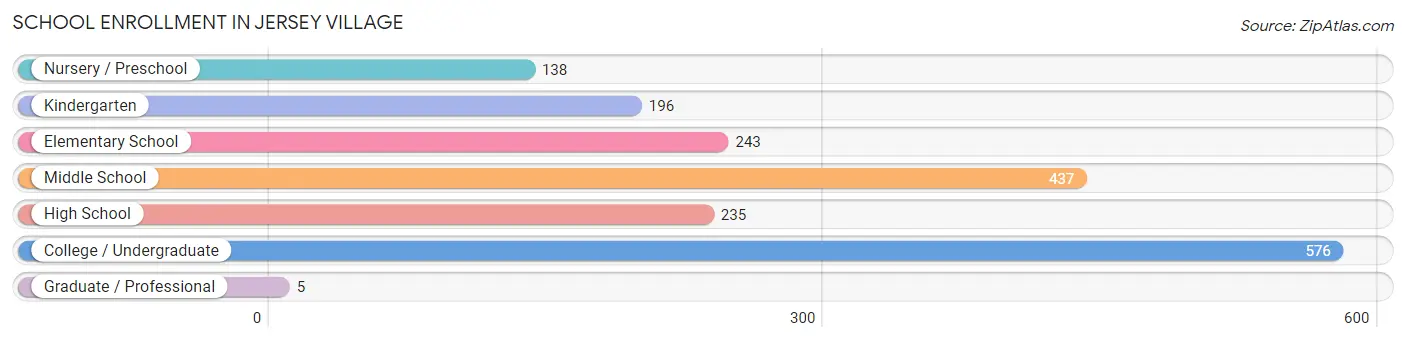
| School Level | # Students | % Students |
| Nursery / Preschool | 138 | 7.5% |
| Kindergarten | 196 | 10.7% |
| Elementary School | 243 | 13.3% |
| Middle School | 437 | 23.9% |
| High School | 235 | 12.8% |
| College / Undergraduate | 576 | 31.5% |
| Graduate / Professional | 5 | 0.3% |
| Total | 1,830 | 100.0% |
School Enrollment by Age by Funding Source in Jersey Village
Out of a total of 1,830 students who are enrolled in schools in Jersey Village, 218 (11.9%) attend a private institution, while the remaining 1,612 (88.1%) are enrolled in public schools. The age group of 3 to 4 year olds has the highest likelihood of being enrolled in private schools, with 69 (100.0% in the age bracket) enrolled. Conversely, the age group of 20 to 24 year olds has the lowest likelihood of being enrolled in a private school, with 418 (100.0% in the age bracket) attending a public institution.
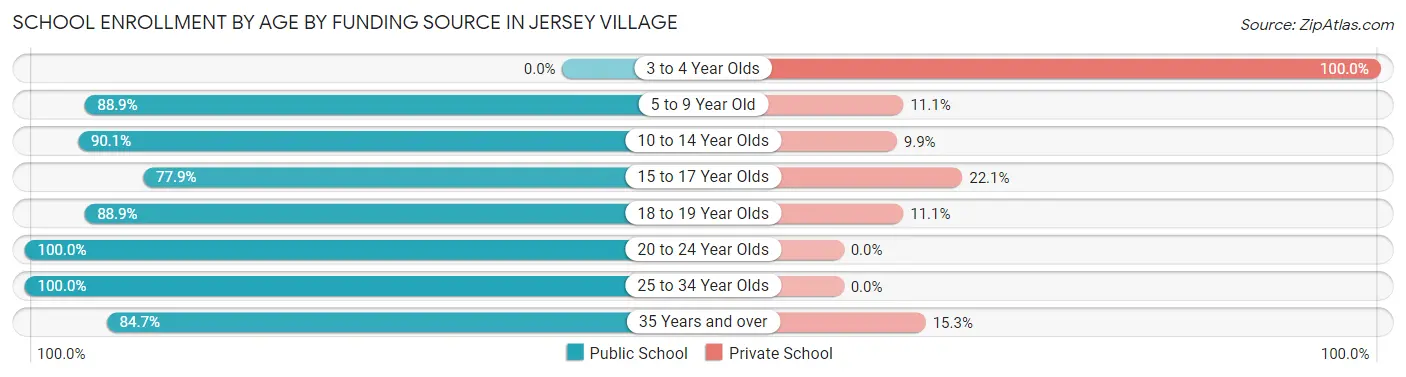
| Age Bracket | Public School | Private School |
| 3 to 4 Year Olds | 0 (0.0%) | 69 (100.0%) |
| 5 to 9 Year Old | 383 (88.9%) | 48 (11.1%) |
| 10 to 14 Year Olds | 491 (90.1%) | 54 (9.9%) |
| 15 to 17 Year Olds | 67 (77.9%) | 19 (22.1%) |
| 18 to 19 Year Olds | 120 (88.9%) | 15 (11.1%) |
| 20 to 24 Year Olds | 418 (100.0%) | 0 (0.0%) |
| 25 to 34 Year Olds | 61 (100.0%) | 0 (0.0%) |
| 35 Years and over | 72 (84.7%) | 13 (15.3%) |
| Total | 1,612 (88.1%) | 218 (11.9%) |
Educational Attainment by Field of Study in Jersey Village
Business (646 | 24.2%), engineering (422 | 15.8%), education (275 | 10.3%), computers & mathematics (214 | 8.0%), and science & technology (169 | 6.3%) are the most common fields of study among 2,665 individuals in Jersey Village who have obtained a bachelor's degree or higher.
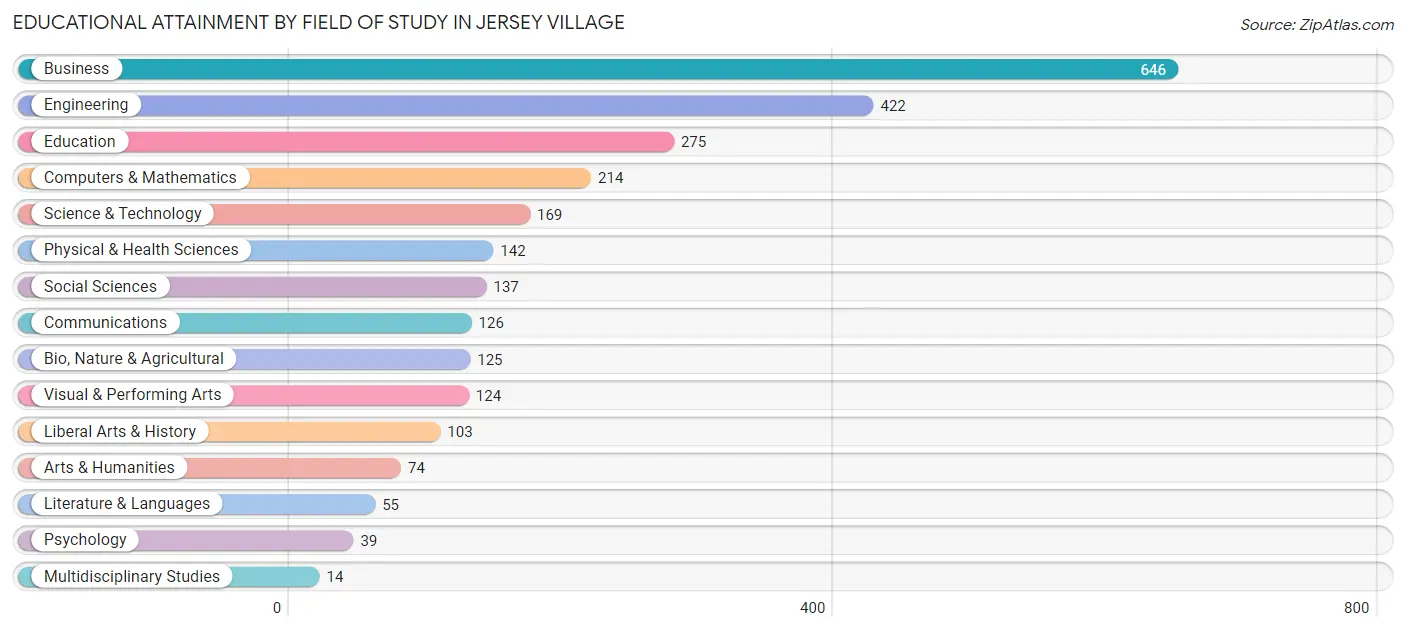
| Field of Study | # Graduates | % Graduates |
| Computers & Mathematics | 214 | 8.0% |
| Bio, Nature & Agricultural | 125 | 4.7% |
| Physical & Health Sciences | 142 | 5.3% |
| Psychology | 39 | 1.5% |
| Social Sciences | 137 | 5.1% |
| Engineering | 422 | 15.8% |
| Multidisciplinary Studies | 14 | 0.5% |
| Science & Technology | 169 | 6.3% |
| Business | 646 | 24.2% |
| Education | 275 | 10.3% |
| Literature & Languages | 55 | 2.1% |
| Liberal Arts & History | 103 | 3.9% |
| Visual & Performing Arts | 124 | 4.6% |
| Communications | 126 | 4.7% |
| Arts & Humanities | 74 | 2.8% |
| Total | 2,665 | 100.0% |
Transportation & Commute in Jersey Village
Vehicle Availability by Sex in Jersey Village
The most prevalent vehicle ownership categories in Jersey Village are males with 2 vehicles (1,006, accounting for 49.4%) and females with 2 vehicles (882, making up 59.9%).
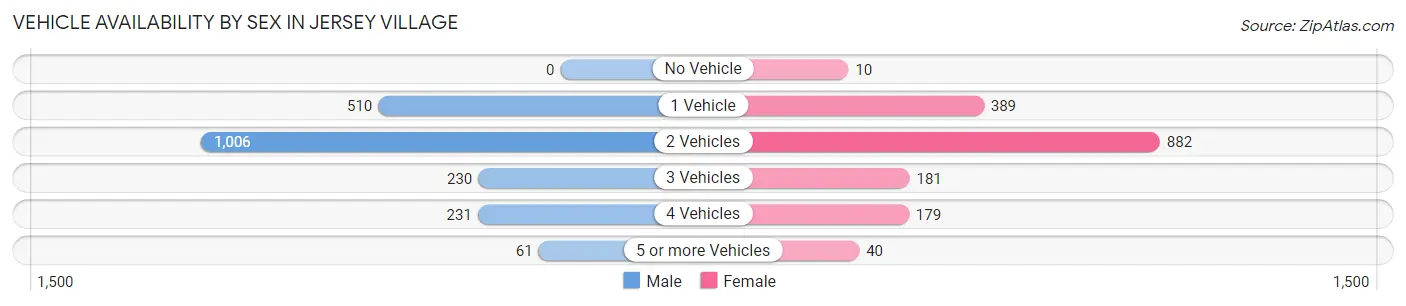
| Vehicles Available | Male | Female |
| No Vehicle | 0 (0.0%) | 10 (0.6%) |
| 1 Vehicle | 510 (25.0%) | 389 (23.1%) |
| 2 Vehicles | 1,006 (49.4%) | 882 (52.5%) |
| 3 Vehicles | 230 (11.3%) | 181 (10.8%) |
| 4 Vehicles | 231 (11.3%) | 179 (10.6%) |
| 5 or more Vehicles | 61 (3.0%) | 40 (2.4%) |
| Total | 2,038 (100.0%) | 1,681 (100.0%) |
Commute Time in Jersey Village
The most frequently occuring commute durations in Jersey Village are 30 to 34 minutes (775 commuters, 23.6%), 25 to 29 minutes (423 commuters, 12.9%), and 15 to 19 minutes (370 commuters, 11.3%).
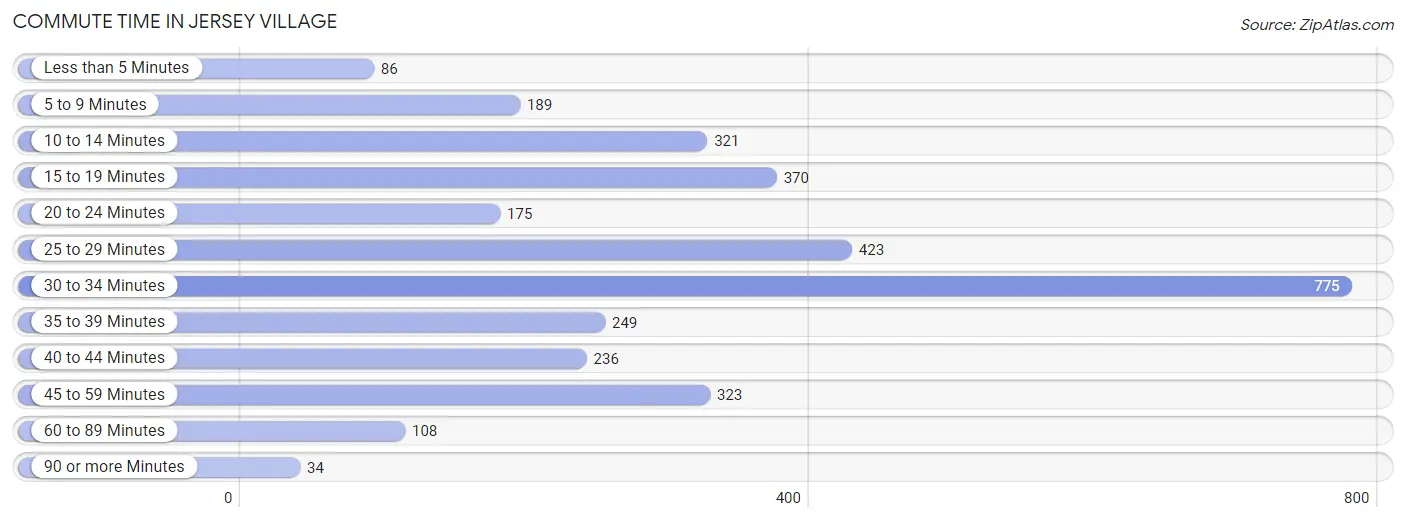
| Commute Time | # Commuters | % Commuters |
| Less than 5 Minutes | 86 | 2.6% |
| 5 to 9 Minutes | 189 | 5.8% |
| 10 to 14 Minutes | 321 | 9.8% |
| 15 to 19 Minutes | 370 | 11.3% |
| 20 to 24 Minutes | 175 | 5.3% |
| 25 to 29 Minutes | 423 | 12.9% |
| 30 to 34 Minutes | 775 | 23.6% |
| 35 to 39 Minutes | 249 | 7.6% |
| 40 to 44 Minutes | 236 | 7.2% |
| 45 to 59 Minutes | 323 | 9.8% |
| 60 to 89 Minutes | 108 | 3.3% |
| 90 or more Minutes | 34 | 1.0% |
Commute Time by Sex in Jersey Village
The most common commute times in Jersey Village are 30 to 34 minutes (337 commuters, 18.4%) for males and 30 to 34 minutes (438 commuters, 30.0%) for females.
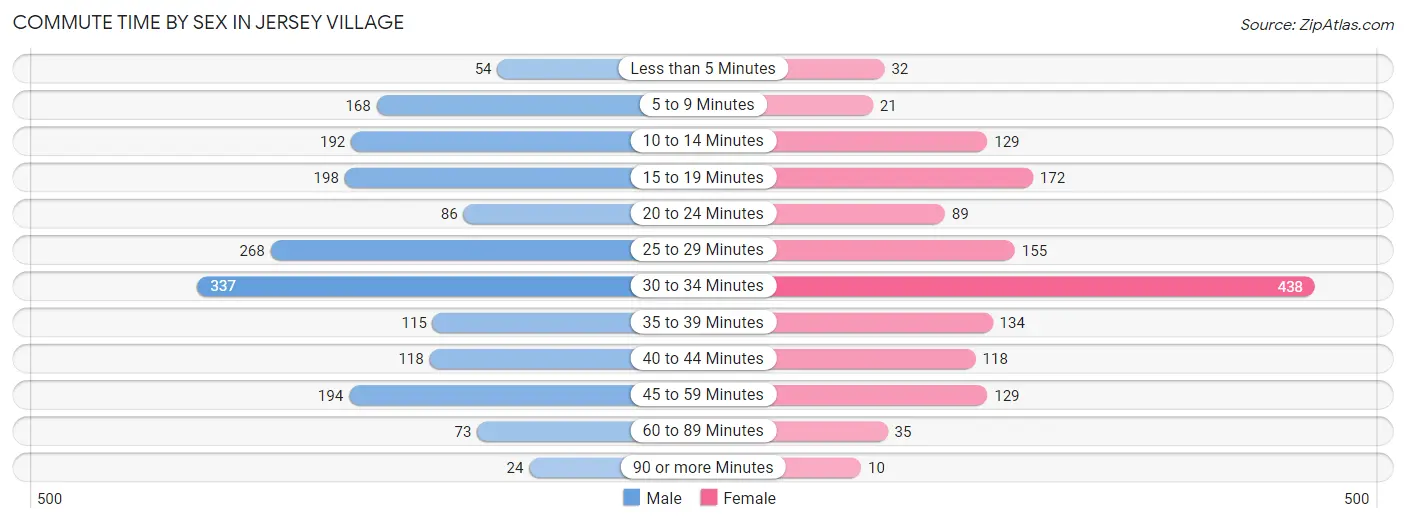
| Commute Time | Male | Female |
| Less than 5 Minutes | 54 (3.0%) | 32 (2.2%) |
| 5 to 9 Minutes | 168 (9.2%) | 21 (1.4%) |
| 10 to 14 Minutes | 192 (10.5%) | 129 (8.8%) |
| 15 to 19 Minutes | 198 (10.8%) | 172 (11.8%) |
| 20 to 24 Minutes | 86 (4.7%) | 89 (6.1%) |
| 25 to 29 Minutes | 268 (14.7%) | 155 (10.6%) |
| 30 to 34 Minutes | 337 (18.4%) | 438 (30.0%) |
| 35 to 39 Minutes | 115 (6.3%) | 134 (9.2%) |
| 40 to 44 Minutes | 118 (6.5%) | 118 (8.1%) |
| 45 to 59 Minutes | 194 (10.6%) | 129 (8.8%) |
| 60 to 89 Minutes | 73 (4.0%) | 35 (2.4%) |
| 90 or more Minutes | 24 (1.3%) | 10 (0.7%) |
Time of Departure to Work by Sex in Jersey Village
The most frequent times of departure to work in Jersey Village are 12:00 PM to 3:59 PM (347, 19.0%) for males and 6:30 AM to 6:59 AM (246, 16.8%) for females.
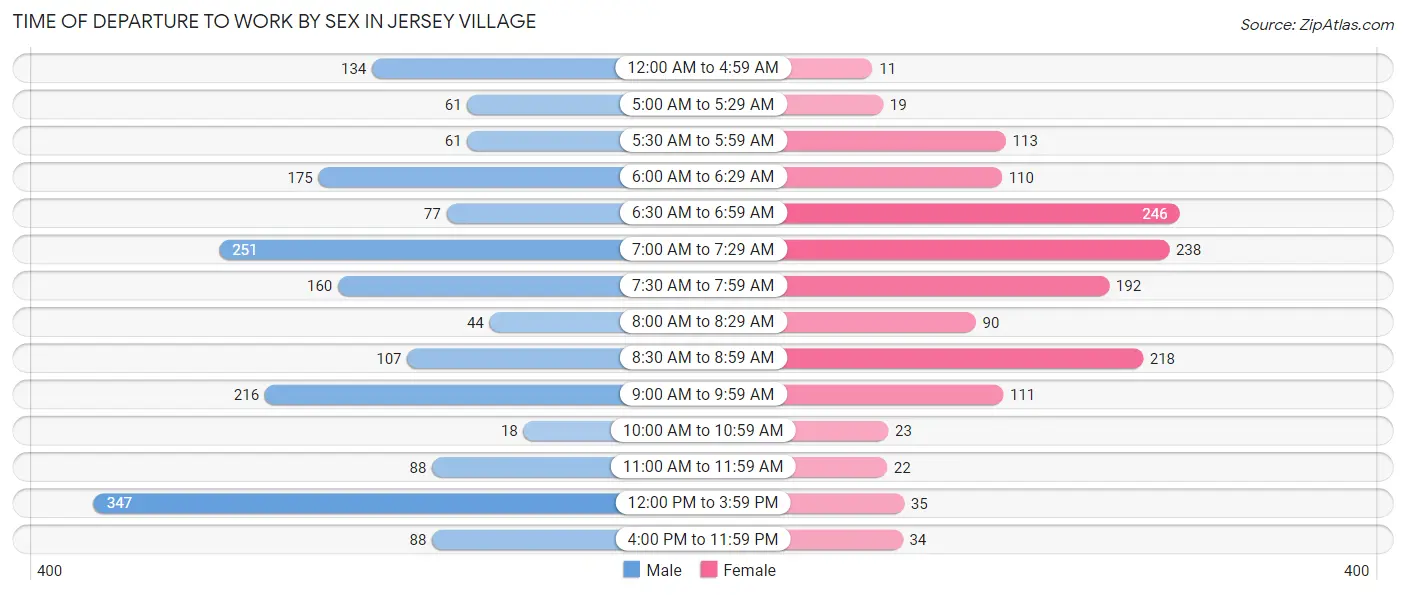
| Time of Departure | Male | Female |
| 12:00 AM to 4:59 AM | 134 (7.3%) | 11 (0.7%) |
| 5:00 AM to 5:29 AM | 61 (3.3%) | 19 (1.3%) |
| 5:30 AM to 5:59 AM | 61 (3.3%) | 113 (7.7%) |
| 6:00 AM to 6:29 AM | 175 (9.6%) | 110 (7.5%) |
| 6:30 AM to 6:59 AM | 77 (4.2%) | 246 (16.8%) |
| 7:00 AM to 7:29 AM | 251 (13.7%) | 238 (16.3%) |
| 7:30 AM to 7:59 AM | 160 (8.8%) | 192 (13.1%) |
| 8:00 AM to 8:29 AM | 44 (2.4%) | 90 (6.2%) |
| 8:30 AM to 8:59 AM | 107 (5.9%) | 218 (14.9%) |
| 9:00 AM to 9:59 AM | 216 (11.8%) | 111 (7.6%) |
| 10:00 AM to 10:59 AM | 18 (1.0%) | 23 (1.6%) |
| 11:00 AM to 11:59 AM | 88 (4.8%) | 22 (1.5%) |
| 12:00 PM to 3:59 PM | 347 (19.0%) | 35 (2.4%) |
| 4:00 PM to 11:59 PM | 88 (4.8%) | 34 (2.3%) |
| Total | 1,827 (100.0%) | 1,462 (100.0%) |
Housing Occupancy in Jersey Village
Occupancy by Ownership in Jersey Village
Of the total 3,356 dwellings in Jersey Village, owner-occupied units account for 1,805 (53.8%), while renter-occupied units make up 1,551 (46.2%).
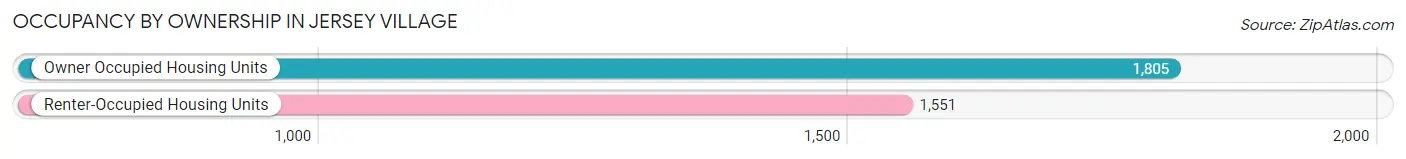
| Occupancy | # Housing Units | % Housing Units |
| Owner Occupied Housing Units | 1,805 | 53.8% |
| Renter-Occupied Housing Units | 1,551 | 46.2% |
| Total Occupied Housing Units | 3,356 | 100.0% |
Occupancy by Household Size in Jersey Village
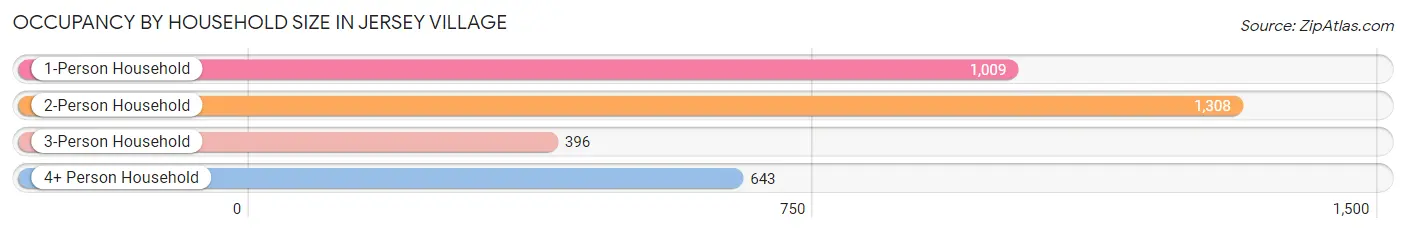
| Household Size | # Housing Units | % Housing Units |
| 1-Person Household | 1,009 | 30.1% |
| 2-Person Household | 1,308 | 39.0% |
| 3-Person Household | 396 | 11.8% |
| 4+ Person Household | 643 | 19.2% |
| Total Housing Units | 3,356 | 100.0% |
Occupancy by Ownership by Household Size in Jersey Village
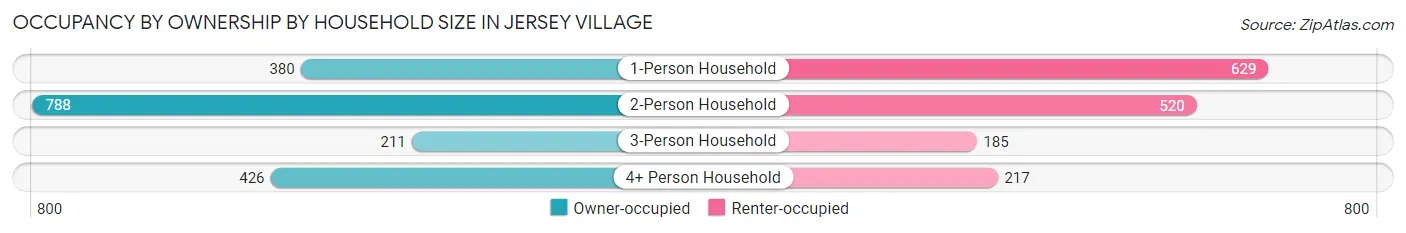
| Household Size | Owner-occupied | Renter-occupied |
| 1-Person Household | 380 (37.7%) | 629 (62.3%) |
| 2-Person Household | 788 (60.2%) | 520 (39.8%) |
| 3-Person Household | 211 (53.3%) | 185 (46.7%) |
| 4+ Person Household | 426 (66.2%) | 217 (33.8%) |
| Total Housing Units | 1,805 (53.8%) | 1,551 (46.2%) |
Occupancy by Educational Attainment in Jersey Village
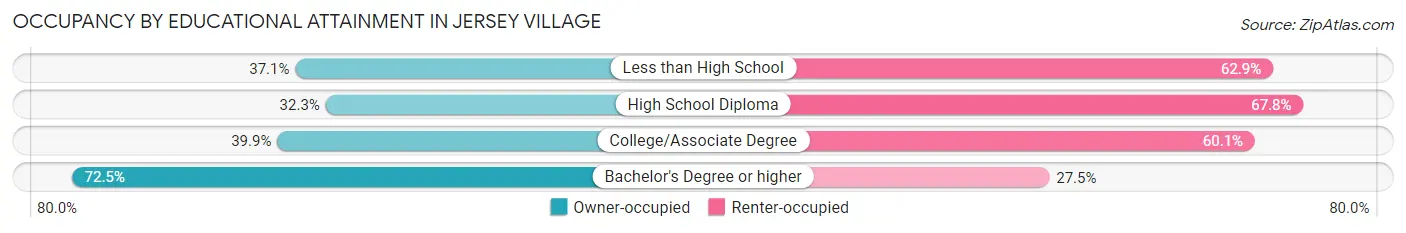
| Household Size | Owner-occupied | Renter-occupied |
| Less than High School | 53 (37.1%) | 90 (62.9%) |
| High School Diploma | 169 (32.3%) | 355 (67.7%) |
| College/Associate Degree | 450 (39.9%) | 677 (60.1%) |
| Bachelor's Degree or higher | 1,133 (72.5%) | 429 (27.5%) |
Occupancy by Age of Householder in Jersey Village
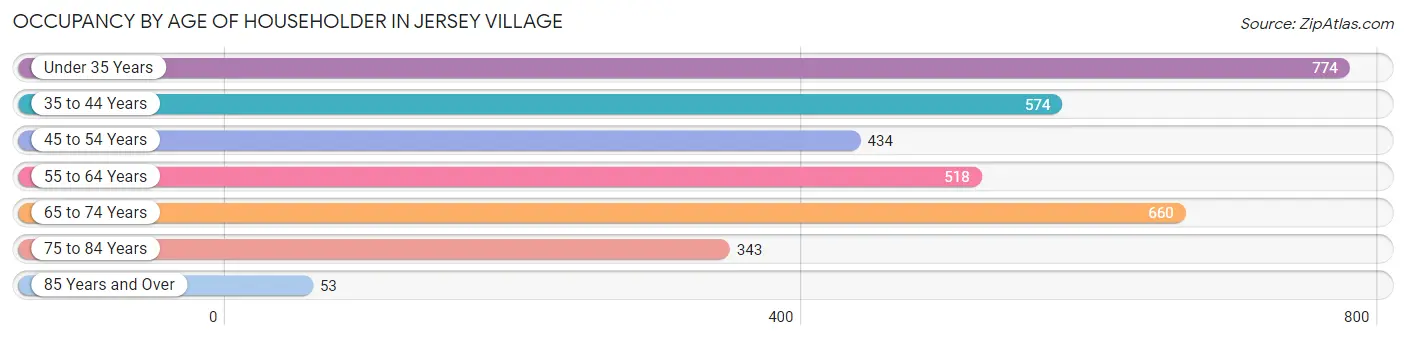
| Age Bracket | # Households | % Households |
| Under 35 Years | 774 | 23.1% |
| 35 to 44 Years | 574 | 17.1% |
| 45 to 54 Years | 434 | 12.9% |
| 55 to 64 Years | 518 | 15.4% |
| 65 to 74 Years | 660 | 19.7% |
| 75 to 84 Years | 343 | 10.2% |
| 85 Years and Over | 53 | 1.6% |
| Total | 3,356 | 100.0% |
Housing Finances in Jersey Village
Median Income by Occupancy in Jersey Village
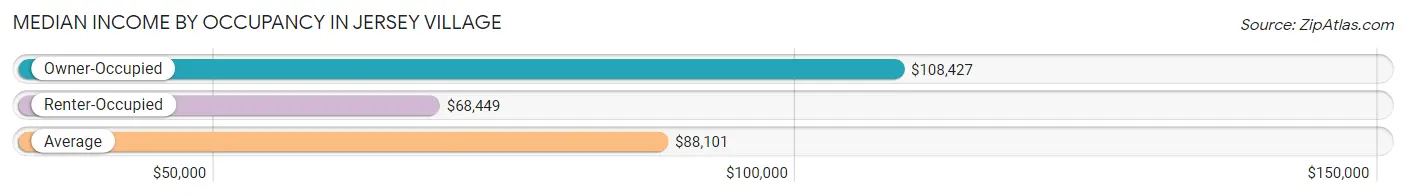
| Occupancy Type | # Households | Median Income |
| Owner-Occupied | 1,805 (53.8%) | $108,427 |
| Renter-Occupied | 1,551 (46.2%) | $68,449 |
| Average | 3,356 (100.0%) | $88,101 |
Occupancy by Householder Income Bracket in Jersey Village
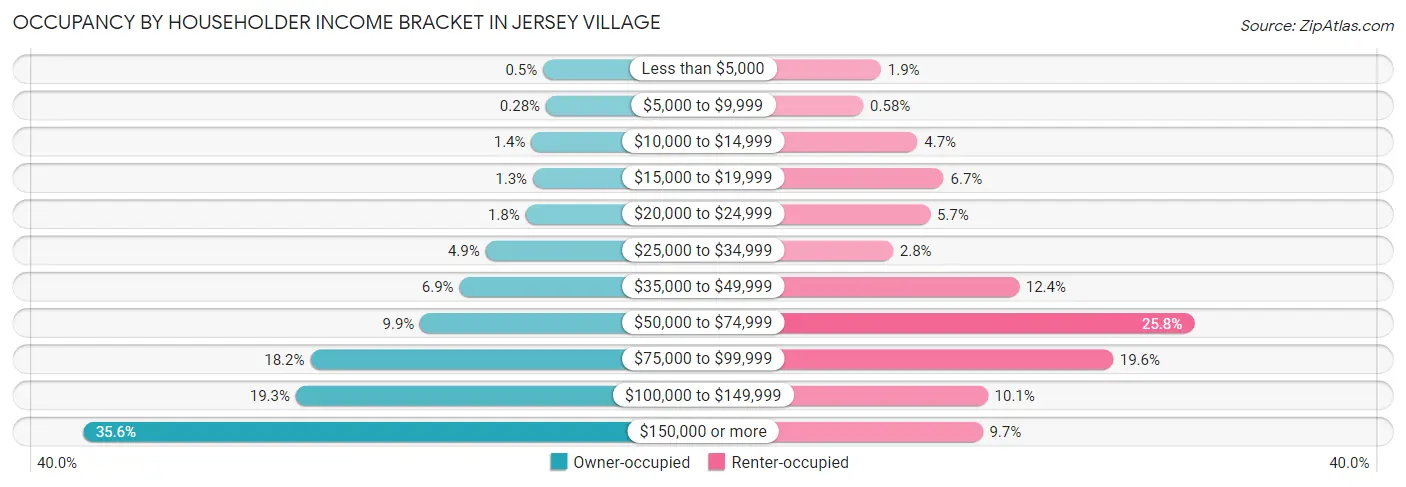
| Income Bracket | Owner-occupied | Renter-occupied |
| Less than $5,000 | 9 (0.5%) | 30 (1.9%) |
| $5,000 to $9,999 | 5 (0.3%) | 9 (0.6%) |
| $10,000 to $14,999 | 25 (1.4%) | 73 (4.7%) |
| $15,000 to $19,999 | 23 (1.3%) | 104 (6.7%) |
| $20,000 to $24,999 | 33 (1.8%) | 88 (5.7%) |
| $25,000 to $34,999 | 88 (4.9%) | 44 (2.8%) |
| $35,000 to $49,999 | 124 (6.9%) | 193 (12.4%) |
| $50,000 to $74,999 | 178 (9.9%) | 400 (25.8%) |
| $75,000 to $99,999 | 329 (18.2%) | 304 (19.6%) |
| $100,000 to $149,999 | 349 (19.3%) | 156 (10.1%) |
| $150,000 or more | 642 (35.6%) | 150 (9.7%) |
| Total | 1,805 (100.0%) | 1,551 (100.0%) |
Monthly Housing Cost Tiers in Jersey Village
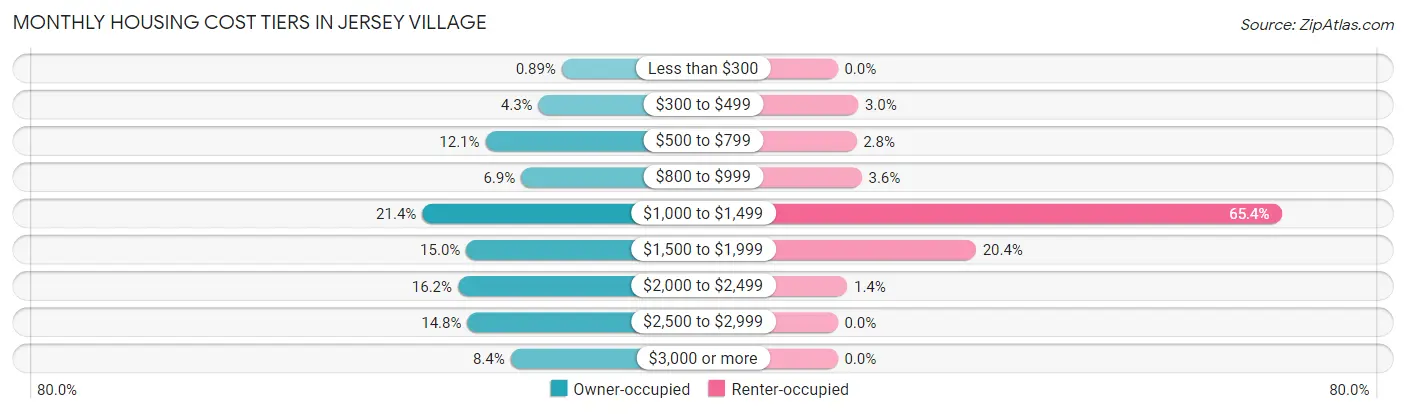
| Monthly Cost | Owner-occupied | Renter-occupied |
| Less than $300 | 16 (0.9%) | 0 (0.0%) |
| $300 to $499 | 78 (4.3%) | 47 (3.0%) |
| $500 to $799 | 219 (12.1%) | 43 (2.8%) |
| $800 to $999 | 124 (6.9%) | 55 (3.5%) |
| $1,000 to $1,499 | 387 (21.4%) | 1,014 (65.4%) |
| $1,500 to $1,999 | 270 (15.0%) | 316 (20.4%) |
| $2,000 to $2,499 | 292 (16.2%) | 22 (1.4%) |
| $2,500 to $2,999 | 267 (14.8%) | 0 (0.0%) |
| $3,000 or more | 152 (8.4%) | 0 (0.0%) |
| Total | 1,805 (100.0%) | 1,551 (100.0%) |
Physical Housing Characteristics in Jersey Village
Housing Structures in Jersey Village
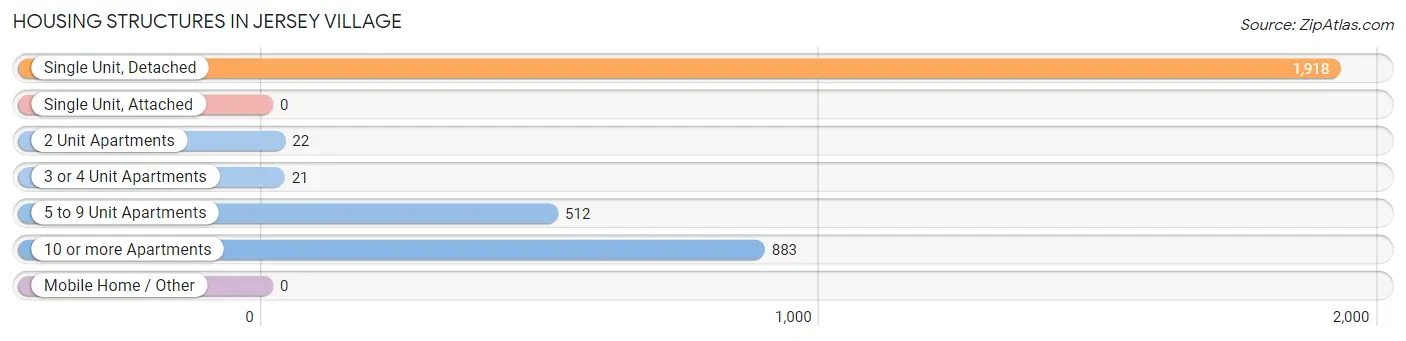
| Structure Type | # Housing Units | % Housing Units |
| Single Unit, Detached | 1,918 | 57.2% |
| Single Unit, Attached | 0 | 0.0% |
| 2 Unit Apartments | 22 | 0.7% |
| 3 or 4 Unit Apartments | 21 | 0.6% |
| 5 to 9 Unit Apartments | 512 | 15.3% |
| 10 or more Apartments | 883 | 26.3% |
| Mobile Home / Other | 0 | 0.0% |
| Total | 3,356 | 100.0% |
Housing Structures by Occupancy in Jersey Village
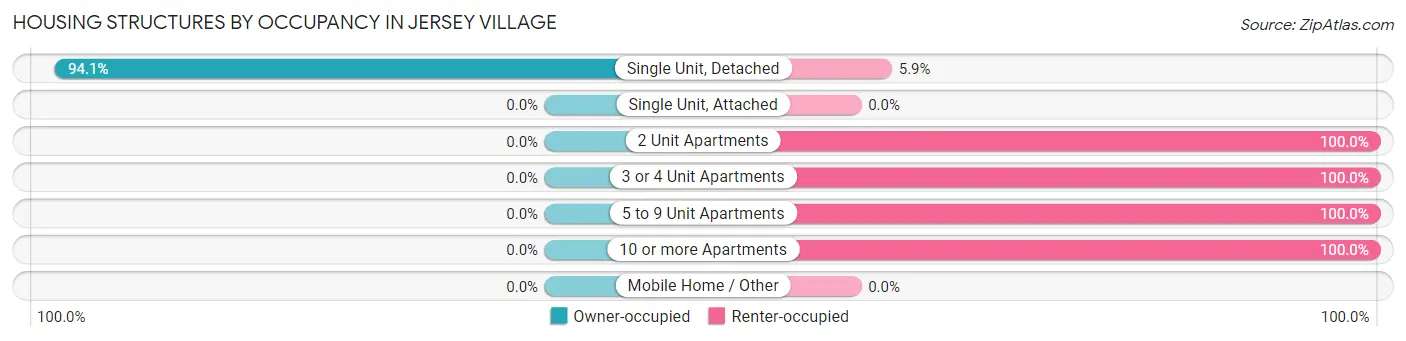
| Structure Type | Owner-occupied | Renter-occupied |
| Single Unit, Detached | 1,805 (94.1%) | 113 (5.9%) |
| Single Unit, Attached | 0 (0.0%) | 0 (0.0%) |
| 2 Unit Apartments | 0 (0.0%) | 22 (100.0%) |
| 3 or 4 Unit Apartments | 0 (0.0%) | 21 (100.0%) |
| 5 to 9 Unit Apartments | 0 (0.0%) | 512 (100.0%) |
| 10 or more Apartments | 0 (0.0%) | 883 (100.0%) |
| Mobile Home / Other | 0 (0.0%) | 0 (0.0%) |
| Total | 1,805 (53.8%) | 1,551 (46.2%) |
Housing Structures by Number of Rooms in Jersey Village
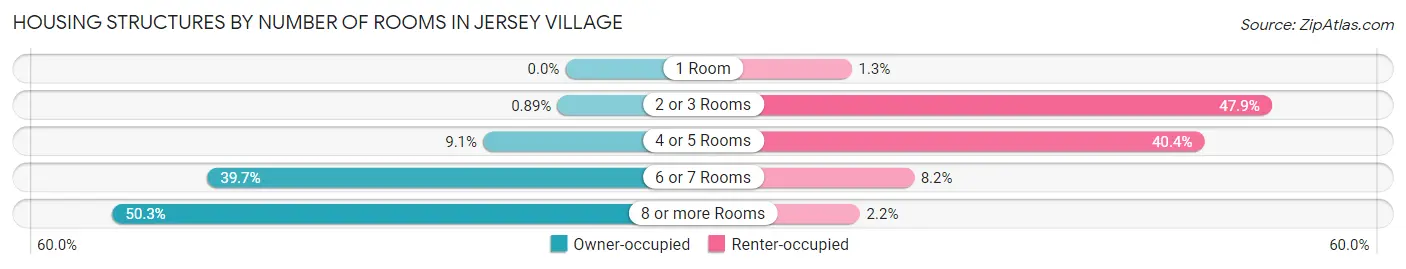
| Number of Rooms | Owner-occupied | Renter-occupied |
| 1 Room | 0 (0.0%) | 20 (1.3%) |
| 2 or 3 Rooms | 16 (0.9%) | 743 (47.9%) |
| 4 or 5 Rooms | 165 (9.1%) | 627 (40.4%) |
| 6 or 7 Rooms | 717 (39.7%) | 127 (8.2%) |
| 8 or more Rooms | 907 (50.2%) | 34 (2.2%) |
| Total | 1,805 (100.0%) | 1,551 (100.0%) |
Housing Structure by Heating Type in Jersey Village
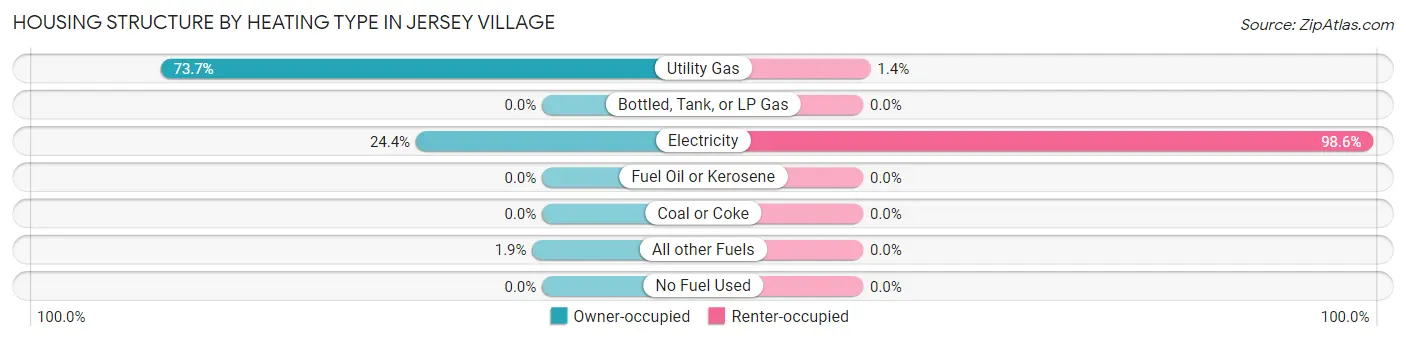
| Heating Type | Owner-occupied | Renter-occupied |
| Utility Gas | 1,331 (73.7%) | 22 (1.4%) |
| Bottled, Tank, or LP Gas | 0 (0.0%) | 0 (0.0%) |
| Electricity | 440 (24.4%) | 1,529 (98.6%) |
| Fuel Oil or Kerosene | 0 (0.0%) | 0 (0.0%) |
| Coal or Coke | 0 (0.0%) | 0 (0.0%) |
| All other Fuels | 34 (1.9%) | 0 (0.0%) |
| No Fuel Used | 0 (0.0%) | 0 (0.0%) |
| Total | 1,805 (100.0%) | 1,551 (100.0%) |
Household Vehicle Usage in Jersey Village
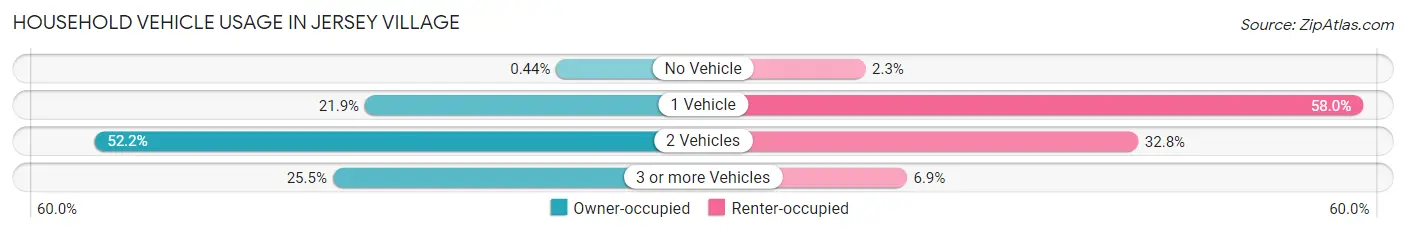
| Vehicles per Household | Owner-occupied | Renter-occupied |
| No Vehicle | 8 (0.4%) | 35 (2.3%) |
| 1 Vehicle | 395 (21.9%) | 900 (58.0%) |
| 2 Vehicles | 942 (52.2%) | 509 (32.8%) |
| 3 or more Vehicles | 460 (25.5%) | 107 (6.9%) |
| Total | 1,805 (100.0%) | 1,551 (100.0%) |
Real Estate & Mortgages in Jersey Village
Real Estate and Mortgage Overview in Jersey Village
| Characteristic | Without Mortgage | With Mortgage |
| Housing Units | 895 | 910 |
| Median Property Value | $306,200 | $347,500 |
| Median Household Income | $96,287 | $417 |
| Monthly Housing Costs | $1,016 | $143 |
| Real Estate Taxes | $4,977 | $12 |
Property Value by Mortgage Status in Jersey Village
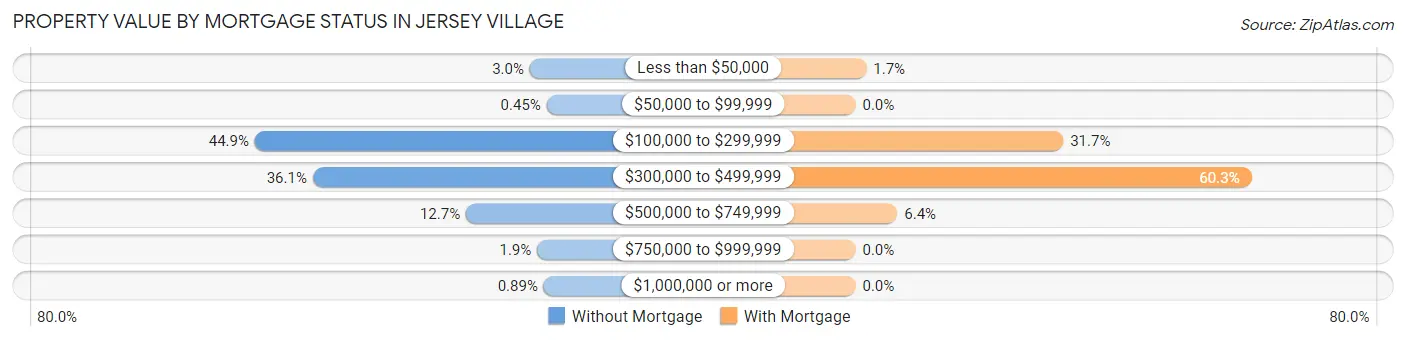
| Property Value | Without Mortgage | With Mortgage |
| Less than $50,000 | 27 (3.0%) | 15 (1.7%) |
| $50,000 to $99,999 | 4 (0.4%) | 0 (0.0%) |
| $100,000 to $299,999 | 402 (44.9%) | 288 (31.7%) |
| $300,000 to $499,999 | 323 (36.1%) | 549 (60.3%) |
| $500,000 to $749,999 | 114 (12.7%) | 58 (6.4%) |
| $750,000 to $999,999 | 17 (1.9%) | 0 (0.0%) |
| $1,000,000 or more | 8 (0.9%) | 0 (0.0%) |
| Total | 895 (100.0%) | 910 (100.0%) |
Household Income by Mortgage Status in Jersey Village
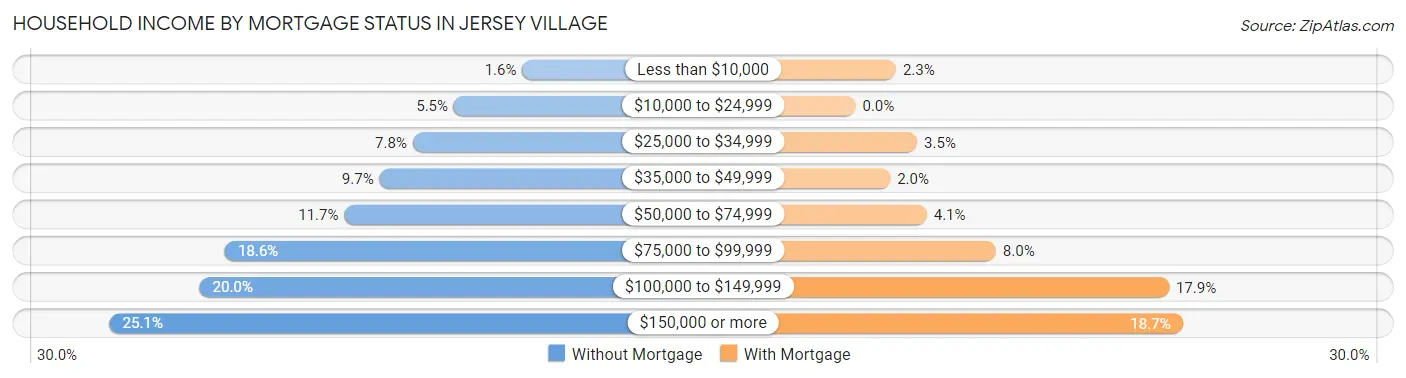
| Household Income | Without Mortgage | With Mortgage |
| Less than $10,000 | 14 (1.6%) | 21 (2.3%) |
| $10,000 to $24,999 | 49 (5.5%) | 0 (0.0%) |
| $25,000 to $34,999 | 70 (7.8%) | 32 (3.5%) |
| $35,000 to $49,999 | 87 (9.7%) | 18 (2.0%) |
| $50,000 to $74,999 | 105 (11.7%) | 37 (4.1%) |
| $75,000 to $99,999 | 166 (18.5%) | 73 (8.0%) |
| $100,000 to $149,999 | 179 (20.0%) | 163 (17.9%) |
| $150,000 or more | 225 (25.1%) | 170 (18.7%) |
| Total | 895 (100.0%) | 910 (100.0%) |
Property Value to Household Income Ratio in Jersey Village
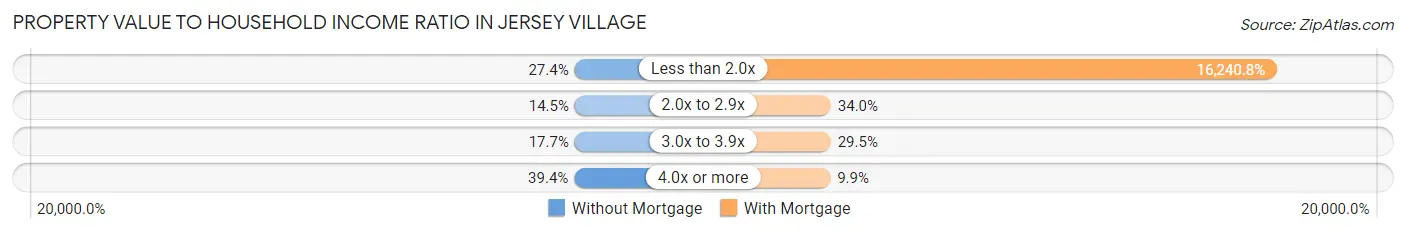
| Value-to-Income Ratio | Without Mortgage | With Mortgage |
| Less than 2.0x | 245 (27.4%) | 147,791 (16,240.8%) |
| 2.0x to 2.9x | 130 (14.5%) | 309 (34.0%) |
| 3.0x to 3.9x | 158 (17.6%) | 268 (29.4%) |
| 4.0x or more | 353 (39.4%) | 90 (9.9%) |
| Total | 895 (100.0%) | 910 (100.0%) |
Real Estate Taxes by Mortgage Status in Jersey Village
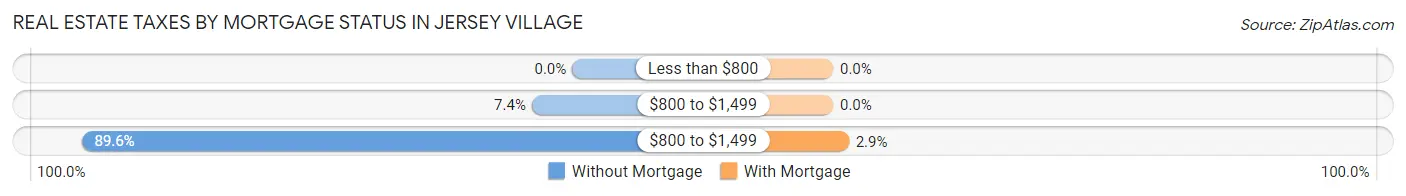
| Property Taxes | Without Mortgage | With Mortgage |
| Less than $800 | 0 (0.0%) | 0 (0.0%) |
| $800 to $1,499 | 66 (7.4%) | 0 (0.0%) |
| $800 to $1,499 | 802 (89.6%) | 26 (2.9%) |
| Total | 895 (100.0%) | 910 (100.0%) |
Health & Disability in Jersey Village
Health Insurance Coverage by Age in Jersey Village
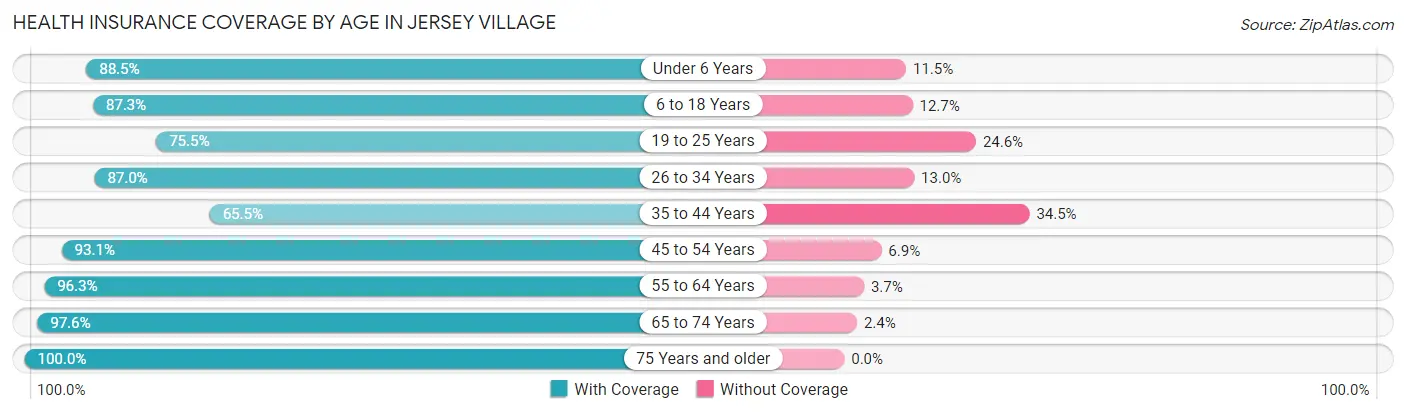
| Age Bracket | With Coverage | Without Coverage |
| Under 6 Years | 530 (88.5%) | 69 (11.5%) |
| 6 to 18 Years | 1,001 (87.3%) | 146 (12.7%) |
| 19 to 25 Years | 624 (75.4%) | 203 (24.5%) |
| 26 to 34 Years | 721 (87.0%) | 108 (13.0%) |
| 35 to 44 Years | 694 (65.5%) | 366 (34.5%) |
| 45 to 54 Years | 686 (93.1%) | 51 (6.9%) |
| 55 to 64 Years | 893 (96.3%) | 34 (3.7%) |
| 65 to 74 Years | 987 (97.6%) | 24 (2.4%) |
| 75 Years and older | 626 (100.0%) | 0 (0.0%) |
| Total | 6,762 (87.1%) | 1,001 (12.9%) |
Health Insurance Coverage by Citizenship Status in Jersey Village
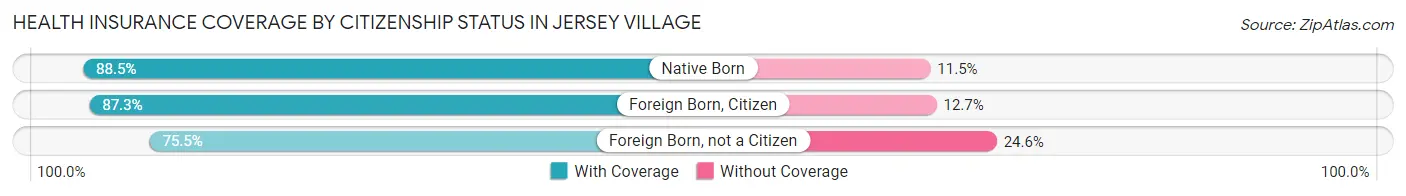
| Citizenship Status | With Coverage | Without Coverage |
| Native Born | 530 (88.5%) | 69 (11.5%) |
| Foreign Born, Citizen | 1,001 (87.3%) | 146 (12.7%) |
| Foreign Born, not a Citizen | 624 (75.4%) | 203 (24.5%) |
Health Insurance Coverage by Household Income in Jersey Village
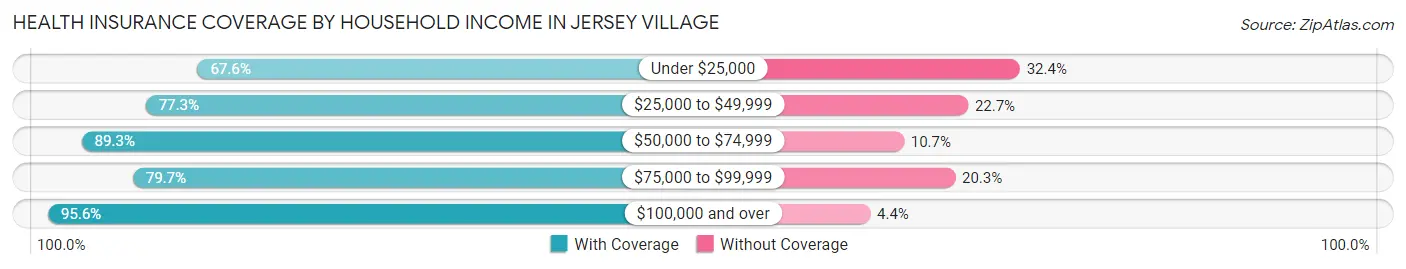
| Household Income | With Coverage | Without Coverage |
| Under $25,000 | 436 (67.6%) | 209 (32.4%) |
| $25,000 to $49,999 | 780 (77.3%) | 229 (22.7%) |
| $50,000 to $74,999 | 928 (89.3%) | 111 (10.7%) |
| $75,000 to $99,999 | 1,136 (79.7%) | 289 (20.3%) |
| $100,000 and over | 3,476 (95.6%) | 159 (4.4%) |
Public vs Private Health Insurance Coverage by Age in Jersey Village
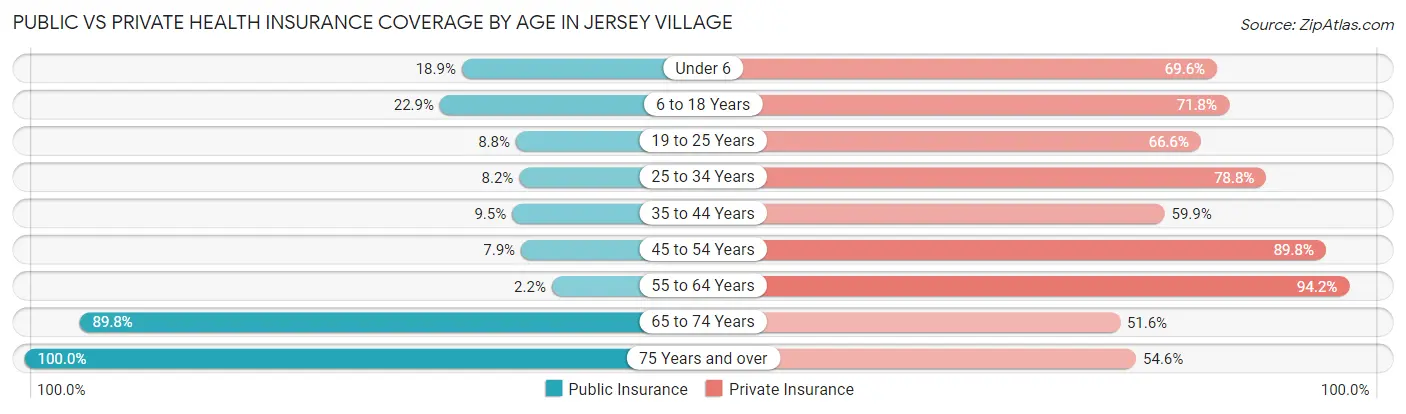
| Age Bracket | Public Insurance | Private Insurance |
| Under 6 | 113 (18.9%) | 417 (69.6%) |
| 6 to 18 Years | 263 (22.9%) | 824 (71.8%) |
| 19 to 25 Years | 73 (8.8%) | 551 (66.6%) |
| 25 to 34 Years | 68 (8.2%) | 653 (78.8%) |
| 35 to 44 Years | 101 (9.5%) | 635 (59.9%) |
| 45 to 54 Years | 58 (7.9%) | 662 (89.8%) |
| 55 to 64 Years | 20 (2.2%) | 873 (94.2%) |
| 65 to 74 Years | 908 (89.8%) | 522 (51.6%) |
| 75 Years and over | 626 (100.0%) | 342 (54.6%) |
| Total | 2,230 (28.7%) | 5,479 (70.6%) |
Disability Status by Sex by Age in Jersey Village
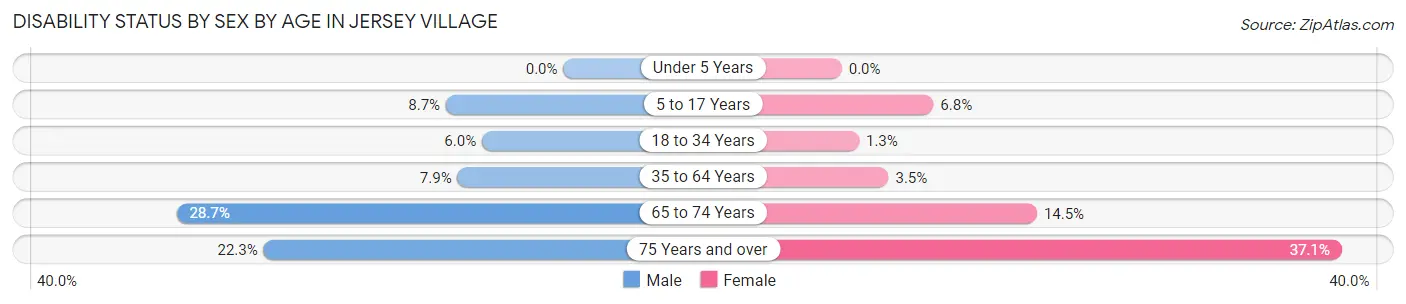
| Age Bracket | Male | Female |
| Under 5 Years | 0 (0.0%) | 0 (0.0%) |
| 5 to 17 Years | 52 (8.7%) | 37 (6.8%) |
| 18 to 34 Years | 55 (6.0%) | 11 (1.3%) |
| 35 to 64 Years | 110 (7.9%) | 46 (3.5%) |
| 65 to 74 Years | 112 (28.7%) | 90 (14.5%) |
| 75 Years and over | 59 (22.3%) | 134 (37.1%) |
Disability Class by Sex by Age in Jersey Village
Disability Class: Hearing Difficulty
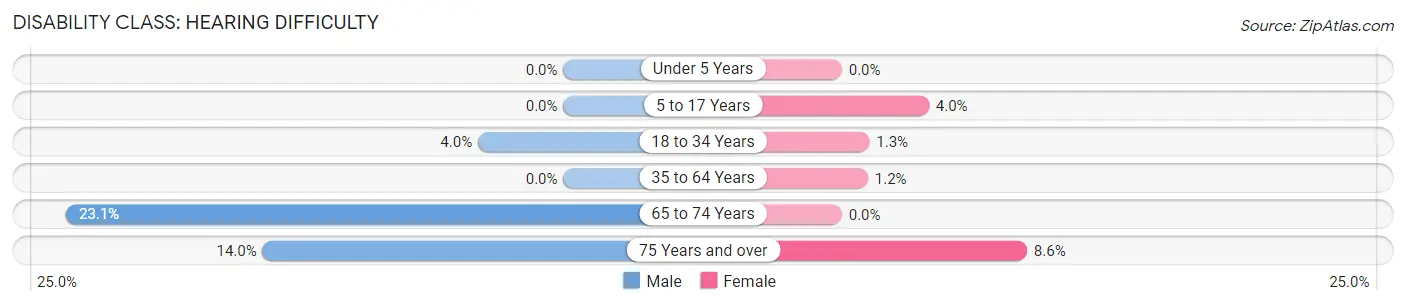
| Age Bracket | Male | Female |
| Under 5 Years | 0 (0.0%) | 0 (0.0%) |
| 5 to 17 Years | 0 (0.0%) | 22 (4.0%) |
| 18 to 34 Years | 36 (4.0%) | 11 (1.3%) |
| 35 to 64 Years | 0 (0.0%) | 16 (1.2%) |
| 65 to 74 Years | 90 (23.1%) | 0 (0.0%) |
| 75 Years and over | 37 (14.0%) | 31 (8.6%) |
Disability Class: Vision Difficulty
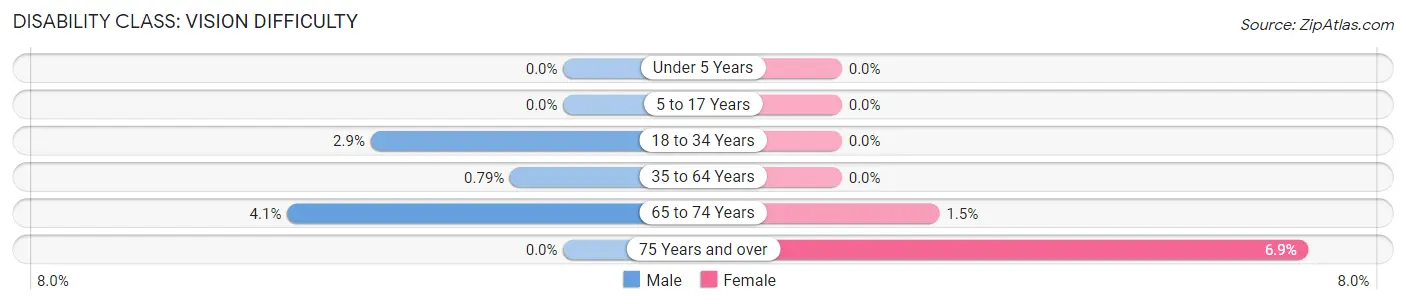
| Age Bracket | Male | Female |
| Under 5 Years | 0 (0.0%) | 0 (0.0%) |
| 5 to 17 Years | 0 (0.0%) | 0 (0.0%) |
| 18 to 34 Years | 26 (2.9%) | 0 (0.0%) |
| 35 to 64 Years | 11 (0.8%) | 0 (0.0%) |
| 65 to 74 Years | 16 (4.1%) | 9 (1.5%) |
| 75 Years and over | 0 (0.0%) | 25 (6.9%) |
Disability Class: Cognitive Difficulty
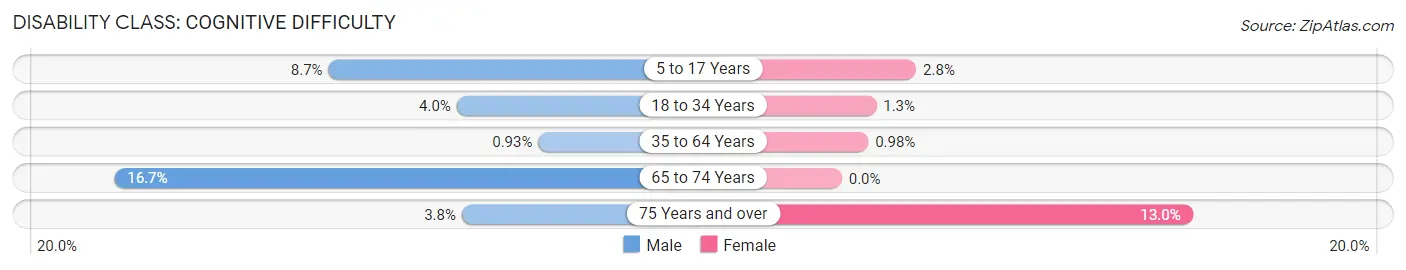
| Age Bracket | Male | Female |
| 5 to 17 Years | 52 (8.7%) | 15 (2.8%) |
| 18 to 34 Years | 36 (4.0%) | 11 (1.3%) |
| 35 to 64 Years | 13 (0.9%) | 13 (1.0%) |
| 65 to 74 Years | 65 (16.7%) | 0 (0.0%) |
| 75 Years and over | 10 (3.8%) | 47 (13.0%) |
Disability Class: Ambulatory Difficulty
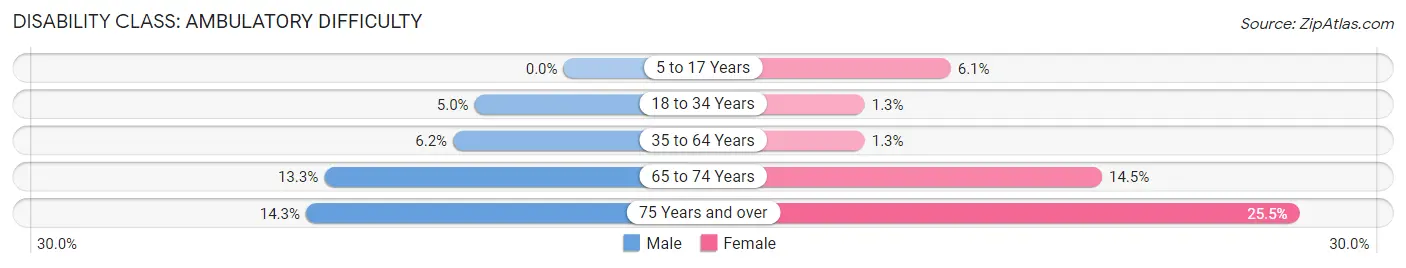
| Age Bracket | Male | Female |
| 5 to 17 Years | 0 (0.0%) | 33 (6.1%) |
| 18 to 34 Years | 45 (5.0%) | 11 (1.3%) |
| 35 to 64 Years | 86 (6.1%) | 17 (1.3%) |
| 65 to 74 Years | 52 (13.3%) | 90 (14.5%) |
| 75 Years and over | 38 (14.3%) | 92 (25.5%) |
Disability Class: Self-Care Difficulty
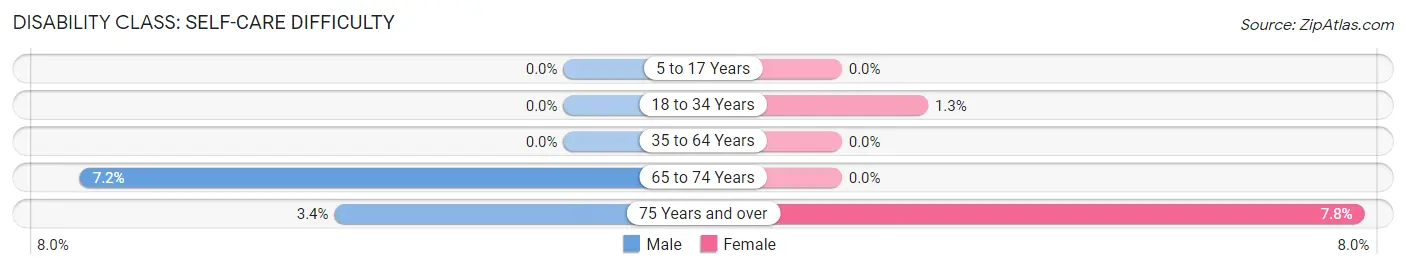
| Age Bracket | Male | Female |
| 5 to 17 Years | 0 (0.0%) | 0 (0.0%) |
| 18 to 34 Years | 0 (0.0%) | 11 (1.3%) |
| 35 to 64 Years | 0 (0.0%) | 0 (0.0%) |
| 65 to 74 Years | 28 (7.2%) | 0 (0.0%) |
| 75 Years and over | 9 (3.4%) | 28 (7.8%) |
Technology Access in Jersey Village
Computing Device Access in Jersey Village
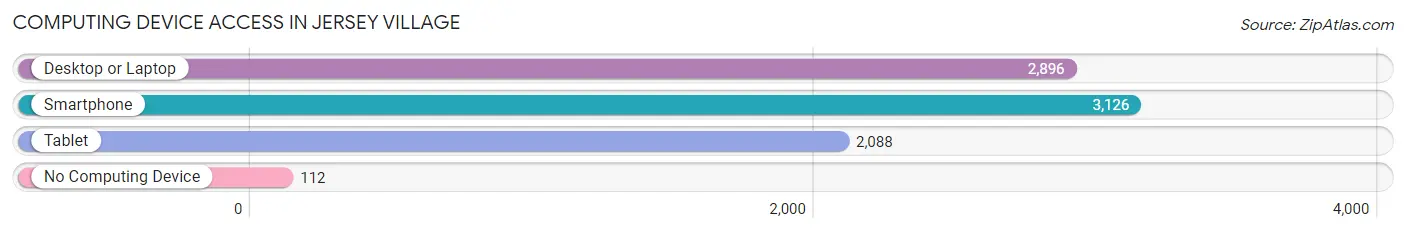
| Device Type | # Households | % Households |
| Desktop or Laptop | 2,896 | 86.3% |
| Smartphone | 3,126 | 93.1% |
| Tablet | 2,088 | 62.2% |
| No Computing Device | 112 | 3.3% |
| Total | 3,356 | 100.0% |
Internet Access in Jersey Village
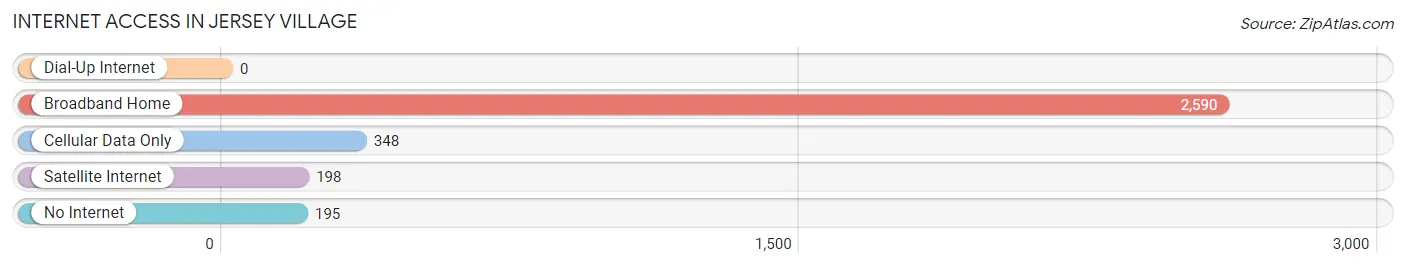
| Internet Type | # Households | % Households |
| Dial-Up Internet | 0 | 0.0% |
| Broadband Home | 2,590 | 77.2% |
| Cellular Data Only | 348 | 10.4% |
| Satellite Internet | 198 | 5.9% |
| No Internet | 195 | 5.8% |
| Total | 3,356 | 100.0% |
Jersey Village Summary
Jersey Village is a city located in Harris County, Texas, United States. It is a suburb of Houston and is part of the Houston–The Woodlands–Sugar Land metropolitan area. As of the 2010 census, the city had a population of 8,620.
History
The area that is now Jersey Village was originally part of the John and Mary Moore League, which was granted to the Moore family in 1824. The area was settled in the late 19th century by German and Czech immigrants. The first post office was established in 1891, and the community was named Jersey for the Jersey cattle that were raised in the area.
In the 1950s, the area began to experience rapid growth due to its proximity to Houston. The city was incorporated in 1956, and the first mayor was elected in 1957.
Geography
Jersey Village is located in northwestern Harris County at 29°51'25" North, 95°37'17" West (29.856944, -95.621389). It is bordered to the north by Cypress, to the east by Houston, to the south by the city of Bellaire, and to the west by the city of Fairbanks.
According to the United States Census Bureau, the city has a total area of 5.2 square miles (13.5 km2), of which 5.1 square miles (13.2 km2) is land and 0.1 square miles (0.3 km2) (1.90%) is water.
Economy
The economy of Jersey Village is largely based on retail and services. The city is home to several shopping centers, including Jersey Village Shopping Center, Jersey Meadows Shopping Center, and Jersey Village Plaza. The city is also home to several restaurants, including the popular Jersey Village Bar-B-Q.
Demographics
As of the 2010 census, there were 8,620 people, 3,093 households, and 2,323 families residing in the city. The population density was 1,689.2 people per square mile (651.3/km2). There were 3,309 housing units at an average density of 648.3 per square mile (250.2/km2). The racial makeup of the city was 73.2% White, 8.3% African American, 0.4% Native American, 8.2% Asian, 0.1% Pacific Islander, 6.2% from other races, and 3.6% from two or more races. Hispanic or Latino of any race were 18.2% of the population.
There were 3,093 households, out of which 37.2% had children under the age of 18 living with them, 57.2% were married couples living together, 11.7% had a female householder with no husband present, and 26.2% were non-families. 21.2% of all households were made up of individuals, and 6.2% had someone living alone who was 65 years of age or older. The average household size was 2.78 and the average family size was 3.25.
In the city, the population was spread out, with 28.2% under the age of 18, 8.2% from 18 to 24, 30.2% from 25 to 44, 24.2% from 45 to 64, and 9.2% who were 65 years of age or older. The median age was 35 years. For every 100 females, there were 95.2 males. For every 100 females age 18 and over, there were 92.2 males.
The median income for a household in the city was $62,917, and the median income for a family was $71,917. Males had a median income of $50,000 versus $37,500 for females. The per capita income for the city was $27,917. About 4.2% of families and 5.2% of the population were below the poverty line, including 6.2% of those under age 18 and 4.2% of those age 65 or over.
Common Questions
What is Per Capita Income in Jersey Village?
Per Capita income in Jersey Village is $49,948.
What is the Median Family Income in Jersey Village?
Median Family Income in Jersey Village is $106,806.
What is the Median Household income in Jersey Village?
Median Household Income in Jersey Village is $88,101.
What is Income or Wage Gap in Jersey Village?
Income or Wage Gap in Jersey Village is 5.7%.
Women in Jersey Village earn 94.3 cents for every dollar earned by a man.
What is Inequality or Gini Index in Jersey Village?
Inequality or Gini Index in Jersey Village is 0.45.
What is the Total Population of Jersey Village?
Total Population of Jersey Village is 7,763.
What is the Total Male Population of Jersey Village?
Total Male Population of Jersey Village is 3,735.
What is the Total Female Population of Jersey Village?
Total Female Population of Jersey Village is 4,028.
What is the Ratio of Males per 100 Females in Jersey Village?
There are 92.73 Males per 100 Females in Jersey Village.
What is the Ratio of Females per 100 Males in Jersey Village?
There are 107.84 Females per 100 Males in Jersey Village.
What is the Median Population Age in Jersey Village?
Median Population Age in Jersey Village is 37.3 Years.
What is the Average Family Size in Jersey Village
Average Family Size in Jersey Village is 2.9 People.
What is the Average Household Size in Jersey Village
Average Household Size in Jersey Village is 2.3 People.
How Large is the Labor Force in Jersey Village?
There are 4,064 People in the Labor Forcein in Jersey Village.
What is the Percentage of People in the Labor Force in Jersey Village?
65.5% of People are in the Labor Force in Jersey Village.
What is the Unemployment Rate in Jersey Village?
Unemployment Rate in Jersey Village is 4.2%.