Summerlin South, NV Map & Demographics
Summerlin South Map
Summerlin South Overview
$74,995
PER CAPITA INCOME
$138,264
AVG FAMILY INCOME
$110,911
AVG HOUSEHOLD INCOME
9.6%
WAGE / INCOME GAP [ % ]
90.4¢/ $1
WAGE / INCOME GAP [ $ ]
0.51
INEQUALITY / GINI INDEX
29,724
TOTAL POPULATION
15,100
MALE POPULATION
14,624
FEMALE POPULATION
103.25
MALES / 100 FEMALES
96.85
FEMALES / 100 MALES
46.7
MEDIAN AGE
2.9
AVG FAMILY SIZE
2.3
AVG HOUSEHOLD SIZE
14,590
LABOR FORCE [ PEOPLE ]
59.0%
PERCENT IN LABOR FORCE
3.3%
UNEMPLOYMENT RATE
Income in Summerlin South
Income Overview in Summerlin South
Per Capita Income in Summerlin South is $74,995, while median incomes of families and households are $138,264 and $110,911 respectively.
| Characteristic | Number | Measure |
| Per Capita Income | 29,724 | $74,995 |
| Median Family Income | 7,849 | $138,264 |
| Mean Family Income | 7,849 | $206,893 |
| Median Household Income | 12,838 | $110,911 |
| Mean Household Income | 12,838 | $170,525 |
| Income Deficit | 7,849 | $0 |
| Wage / Income Gap (%) | 29,724 | 9.63% |
| Wage / Income Gap ($) | 29,724 | 90.37¢ per $1 |
| Gini / Inequality Index | 29,724 | 0.51 |
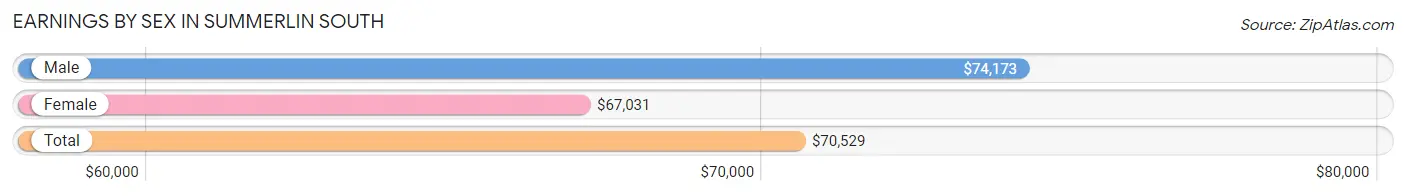
Earnings by Sex in Summerlin South
Average Earnings in Summerlin South are $70,529, $74,173 for men and $67,031 for women, a difference of 9.6%.
| Sex | Number | Average Earnings |
| Male | 8,189 (54.1%) | $74,173 |
| Female | 6,951 (45.9%) | $67,031 |
| Total | 15,140 (100.0%) | $70,529 |
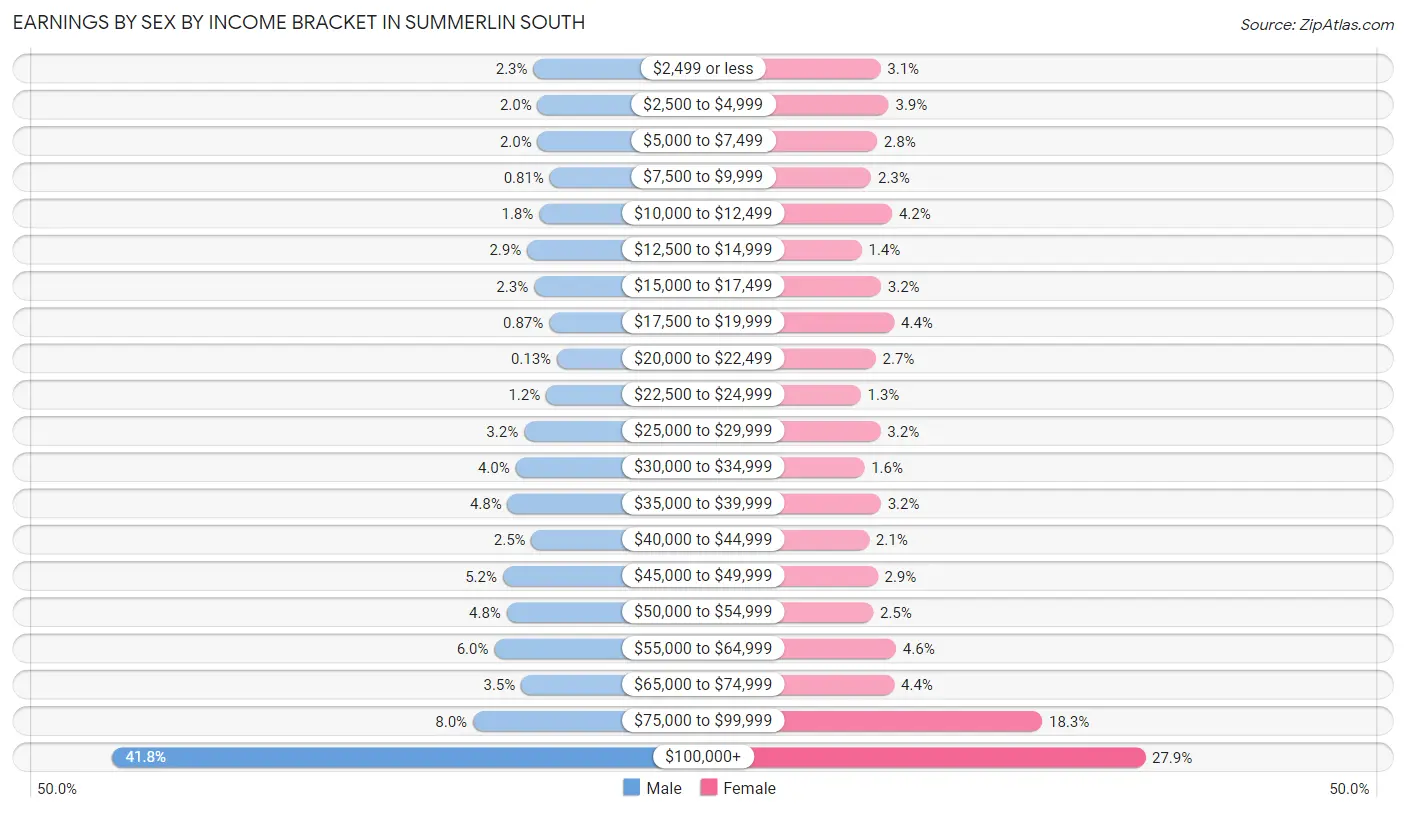
Earnings by Sex by Income Bracket in Summerlin South
The most common earnings brackets in Summerlin South are $100,000+ for men (3,419 | 41.7%) and $100,000+ for women (1,942 | 27.9%).
| Income | Male | Female |
| $2,499 or less | 192 (2.3%) | 218 (3.1%) |
| $2,500 to $4,999 | 160 (1.9%) | 272 (3.9%) |
| $5,000 to $7,499 | 160 (1.9%) | 196 (2.8%) |
| $7,500 to $9,999 | 66 (0.8%) | 158 (2.3%) |
| $10,000 to $12,499 | 147 (1.8%) | 294 (4.2%) |
| $12,500 to $14,999 | 240 (2.9%) | 96 (1.4%) |
| $15,000 to $17,499 | 187 (2.3%) | 222 (3.2%) |
| $17,500 to $19,999 | 71 (0.9%) | 308 (4.4%) |
| $20,000 to $22,499 | 11 (0.1%) | 188 (2.7%) |
| $22,500 to $24,999 | 94 (1.1%) | 90 (1.3%) |
| $25,000 to $29,999 | 264 (3.2%) | 219 (3.2%) |
| $30,000 to $34,999 | 328 (4.0%) | 113 (1.6%) |
| $35,000 to $39,999 | 390 (4.8%) | 221 (3.2%) |
| $40,000 to $44,999 | 206 (2.5%) | 144 (2.1%) |
| $45,000 to $49,999 | 426 (5.2%) | 200 (2.9%) |
| $50,000 to $54,999 | 396 (4.8%) | 171 (2.5%) |
| $55,000 to $64,999 | 491 (6.0%) | 320 (4.6%) |
| $65,000 to $74,999 | 286 (3.5%) | 308 (4.4%) |
| $75,000 to $99,999 | 655 (8.0%) | 1,271 (18.3%) |
| $100,000+ | 3,419 (41.7%) | 1,942 (27.9%) |
| Total | 8,189 (100.0%) | 6,951 (100.0%) |
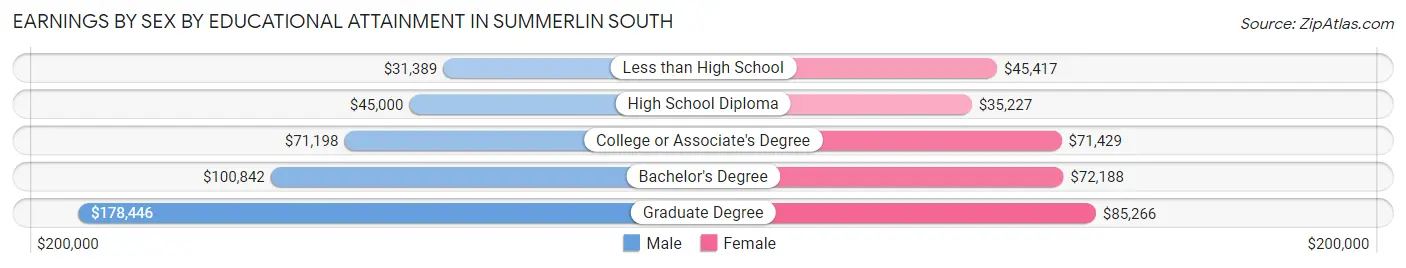
Earnings by Sex by Educational Attainment in Summerlin South
Average earnings in Summerlin South are $86,944 for men and $75,072 for women, a difference of 13.7%. Men with an educational attainment of graduate degree enjoy the highest average annual earnings of $178,446, while those with less than high school education earn the least with $31,389. Women with an educational attainment of graduate degree earn the most with the average annual earnings of $85,266, while those with high school diploma education have the smallest earnings of $35,227.
| Educational Attainment | Male Income | Female Income |
| Less than High School | $31,389 | $45,417 |
| High School Diploma | $45,000 | $35,227 |
| College or Associate's Degree | $71,198 | $71,429 |
| Bachelor's Degree | $100,842 | $72,188 |
| Graduate Degree | $178,446 | $85,266 |
| Total | $86,944 | $75,072 |
Family Income in Summerlin South
Family Income Brackets in Summerlin South
According to the Summerlin South family income data, there are 2,567 families falling into the $200,000+ income range, which is the most common income bracket and makes up 32.7% of all families. Conversely, the $10,000 to $14,999 income bracket is the least frequent group with only 55 families (0.7%) belonging to this category.
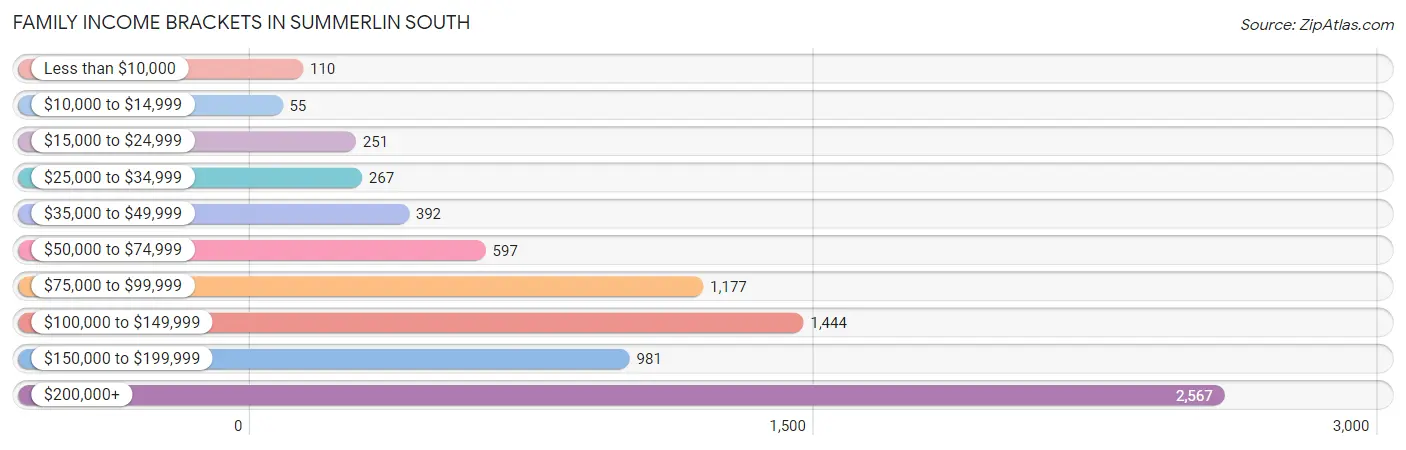
| Income Bracket | # Families | % Families |
| Less than $10,000 | 110 | 1.4% |
| $10,000 to $14,999 | 55 | 0.7% |
| $15,000 to $24,999 | 251 | 3.2% |
| $25,000 to $34,999 | 267 | 3.4% |
| $35,000 to $49,999 | 392 | 5.0% |
| $50,000 to $74,999 | 597 | 7.6% |
| $75,000 to $99,999 | 1,177 | 15.0% |
| $100,000 to $149,999 | 1,444 | 18.4% |
| $150,000 to $199,999 | 981 | 12.5% |
| $200,000+ | 2,567 | 32.7% |
Family Income by Famaliy Size in Summerlin South
6-person families (89 | 1.1%) account for the highest median family income in Summerlin South with $244,345 per family, while 2-person families (4,132 | 52.6%) have the highest median income of $57,666 per family member.
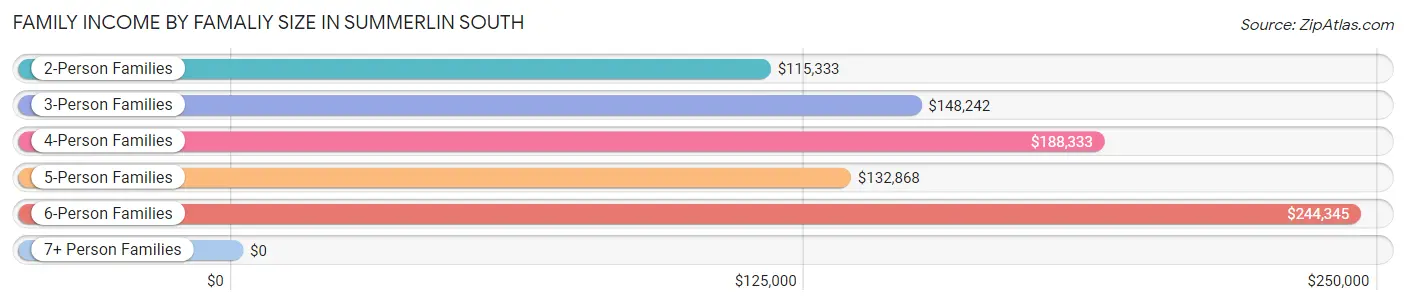
| Income Bracket | # Families | Median Income |
| 2-Person Families | 4,132 (52.6%) | $115,333 |
| 3-Person Families | 1,857 (23.7%) | $148,242 |
| 4-Person Families | 1,222 (15.6%) | $188,333 |
| 5-Person Families | 505 (6.4%) | $132,868 |
| 6-Person Families | 89 (1.1%) | $244,345 |
| 7+ Person Families | 44 (0.6%) | $0 |
| Total | 7,849 (100.0%) | $138,264 |
Family Income by Number of Earners in Summerlin South
The median family income in Summerlin South is $138,264, with families comprising 3+ earners (577) having the highest median family income of $247,038, while families with 1 earner (2,229) have the lowest median family income of $96,476, accounting for 7.3% and 28.4% of families, respectively.
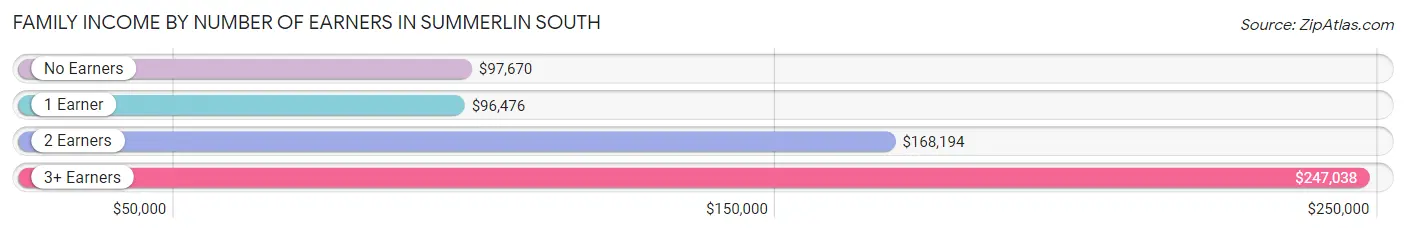
| Number of Earners | # Families | Median Income |
| No Earners | 1,640 (20.9%) | $97,670 |
| 1 Earner | 2,229 (28.4%) | $96,476 |
| 2 Earners | 3,403 (43.4%) | $168,194 |
| 3+ Earners | 577 (7.3%) | $247,038 |
| Total | 7,849 (100.0%) | $138,264 |
Household Income in Summerlin South
Household Income Brackets in Summerlin South
With 3,120 households falling in the category, the $200,000+ income range is the most frequent in Summerlin South, accounting for 24.3% of all households. In contrast, only 90 households (0.7%) fall into the $10,000 to $14,999 income bracket, making it the least populous group.
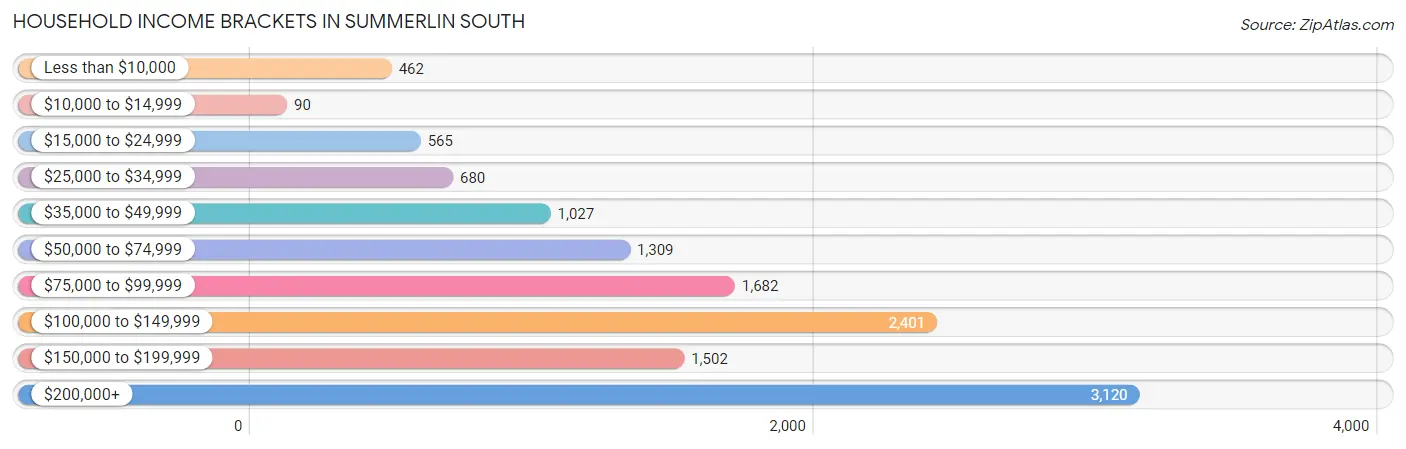
| Income Bracket | # Households | % Households |
| Less than $10,000 | 462 | 3.6% |
| $10,000 to $14,999 | 90 | 0.7% |
| $15,000 to $24,999 | 565 | 4.4% |
| $25,000 to $34,999 | 680 | 5.3% |
| $35,000 to $49,999 | 1,027 | 8.0% |
| $50,000 to $74,999 | 1,309 | 10.2% |
| $75,000 to $99,999 | 1,682 | 13.1% |
| $100,000 to $149,999 | 2,401 | 18.7% |
| $150,000 to $199,999 | 1,502 | 11.7% |
| $200,000+ | 3,120 | 24.3% |
Household Income by Householder Age in Summerlin South
The median household income in Summerlin South is $110,911, with the highest median household income of $140,809 found in the 45 to 64 years age bracket for the primary householder. A total of 4,810 households (37.5%) fall into this category. Meanwhile, the 15 to 24 years age bracket for the primary householder has the lowest median household income of $53,606, with 93 households (0.7%) in this group.
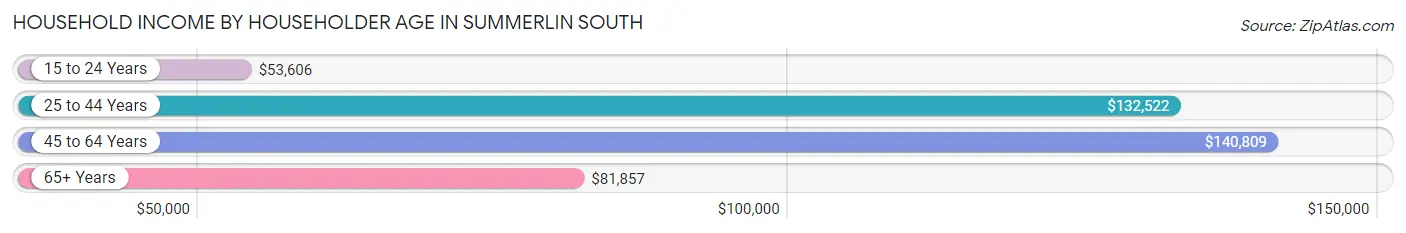
| Income Bracket | # Households | Median Income |
| 15 to 24 Years | 93 (0.7%) | $53,606 |
| 25 to 44 Years | 3,215 (25.0%) | $132,522 |
| 45 to 64 Years | 4,810 (37.5%) | $140,809 |
| 65+ Years | 4,720 (36.8%) | $81,857 |
| Total | 12,838 (100.0%) | $110,911 |
Poverty in Summerlin South
Income Below Poverty by Sex and Age in Summerlin South
With 6.1% poverty level for males and 6.5% for females among the residents of Summerlin South, 15 year old males and 6 to 11 year old females are the most vulnerable to poverty, with 61 males (33.5%) and 85 females (13.2%) in their respective age groups living below the poverty level.
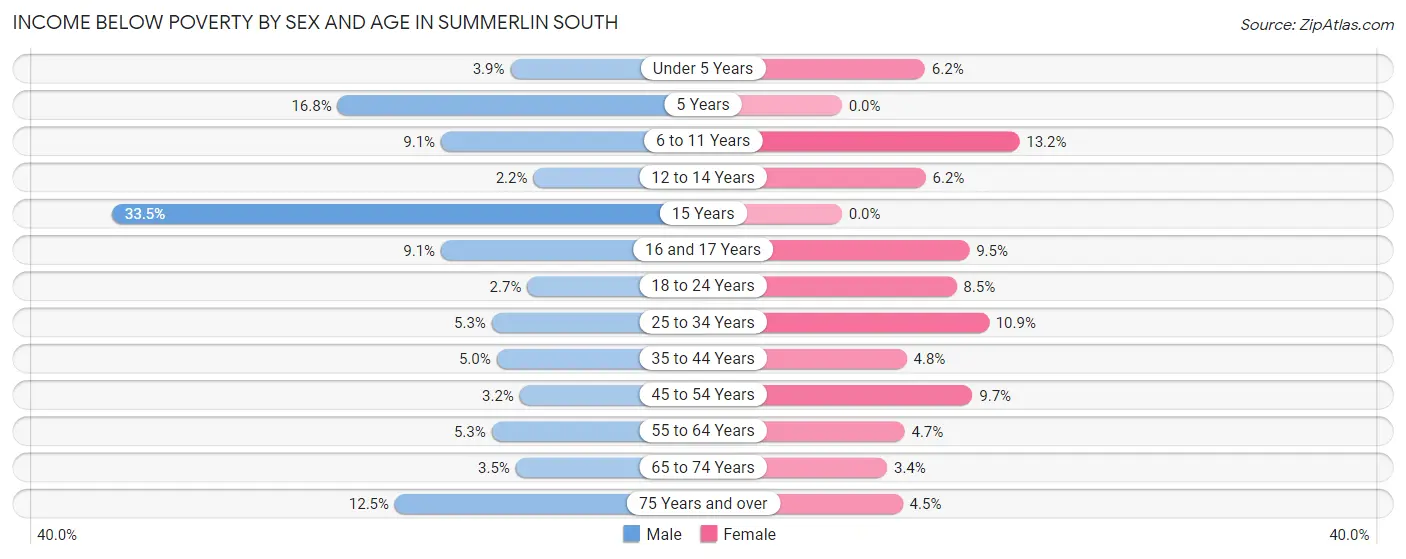
| Age Bracket | Male | Female |
| Under 5 Years | 31 (3.9%) | 39 (6.2%) |
| 5 Years | 56 (16.8%) | 0 (0.0%) |
| 6 to 11 Years | 100 (9.1%) | 85 (13.2%) |
| 12 to 14 Years | 12 (2.2%) | 24 (6.2%) |
| 15 Years | 61 (33.5%) | 0 (0.0%) |
| 16 and 17 Years | 14 (9.1%) | 42 (9.5%) |
| 18 to 24 Years | 32 (2.7%) | 43 (8.5%) |
| 25 to 34 Years | 65 (5.3%) | 151 (10.9%) |
| 35 to 44 Years | 110 (5.0%) | 95 (4.8%) |
| 45 to 54 Years | 69 (3.2%) | 200 (9.7%) |
| 55 to 64 Years | 99 (5.3%) | 84 (4.7%) |
| 65 to 74 Years | 57 (3.5%) | 76 (3.4%) |
| 75 Years and over | 214 (12.5%) | 97 (4.5%) |
| Total | 920 (6.1%) | 936 (6.5%) |
Income Above Poverty by Sex and Age in Summerlin South
According to the poverty statistics in Summerlin South, males aged 12 to 14 years and females aged 5 years are the age groups that are most secure financially, with 97.8% of males and 100.0% of females in these age groups living above the poverty line.
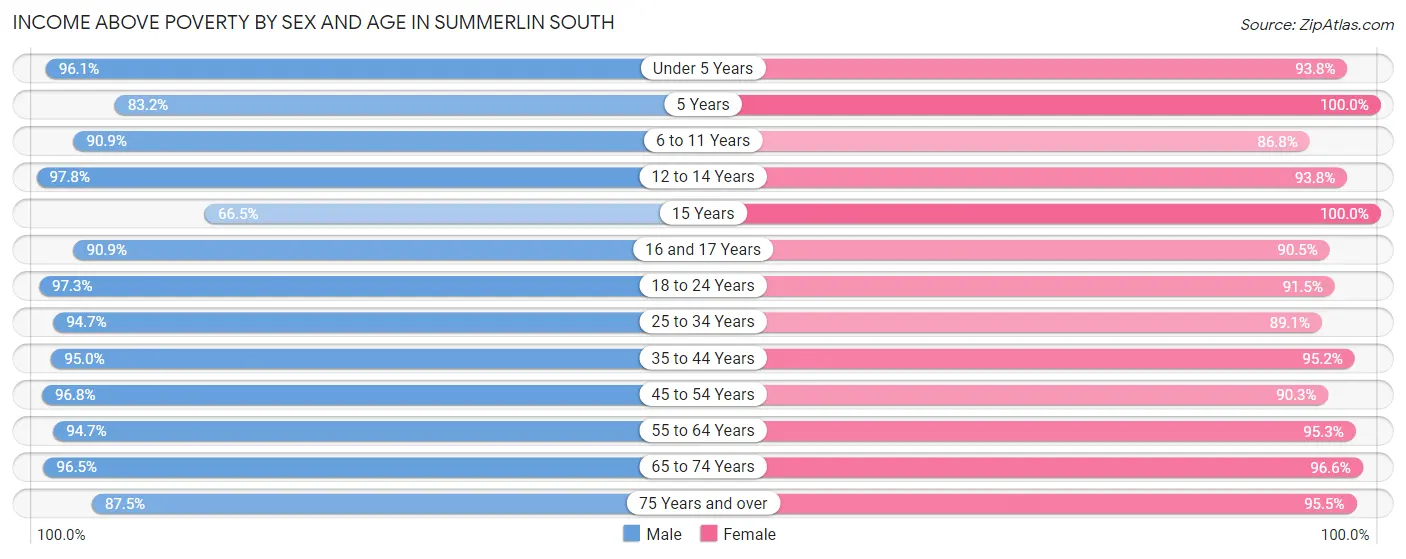
| Age Bracket | Male | Female |
| Under 5 Years | 756 (96.1%) | 593 (93.8%) |
| 5 Years | 278 (83.2%) | 70 (100.0%) |
| 6 to 11 Years | 1,000 (90.9%) | 560 (86.8%) |
| 12 to 14 Years | 525 (97.8%) | 362 (93.8%) |
| 15 Years | 121 (66.5%) | 158 (100.0%) |
| 16 and 17 Years | 140 (90.9%) | 402 (90.5%) |
| 18 to 24 Years | 1,160 (97.3%) | 462 (91.5%) |
| 25 to 34 Years | 1,156 (94.7%) | 1,233 (89.1%) |
| 35 to 44 Years | 2,109 (95.0%) | 1,880 (95.2%) |
| 45 to 54 Years | 2,062 (96.8%) | 1,865 (90.3%) |
| 55 to 64 Years | 1,759 (94.7%) | 1,717 (95.3%) |
| 65 to 74 Years | 1,553 (96.5%) | 2,187 (96.6%) |
| 75 Years and over | 1,497 (87.5%) | 2,049 (95.5%) |
| Total | 14,116 (93.9%) | 13,538 (93.5%) |
Income Below Poverty Among Married-Couple Families in Summerlin South
The poverty statistics for married-couple families in Summerlin South show that 3.3% or 213 of the total 6,461 families live below the poverty line. Families with 3 or 4 children have the highest poverty rate of 6.5%, comprising of 24 families. On the other hand, families with no children have the lowest poverty rate of 3.0%, which includes 127 families.
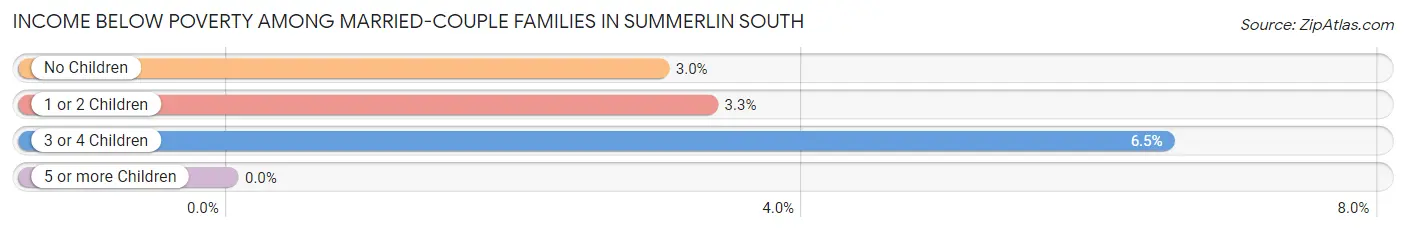
| Children | Above Poverty | Below Poverty |
| No Children | 4,112 (97.0%) | 127 (3.0%) |
| 1 or 2 Children | 1,792 (96.7%) | 62 (3.3%) |
| 3 or 4 Children | 344 (93.5%) | 24 (6.5%) |
| 5 or more Children | 0 (0.0%) | 0 (0.0%) |
| Total | 6,248 (96.7%) | 213 (3.3%) |
Income Below Poverty Among Single-Parent Households in Summerlin South
According to the poverty data in Summerlin South, 1.5% or 7 single-father households and 15.0% or 136 single-mother households are living below the poverty line. Among single-father households, those with 1 or 2 children have the highest poverty rate, with 7 households (3.6%) experiencing poverty. Likewise, among single-mother households, those with 3 or 4 children have the highest poverty rate, with 15 households (57.7%) falling below the poverty line.
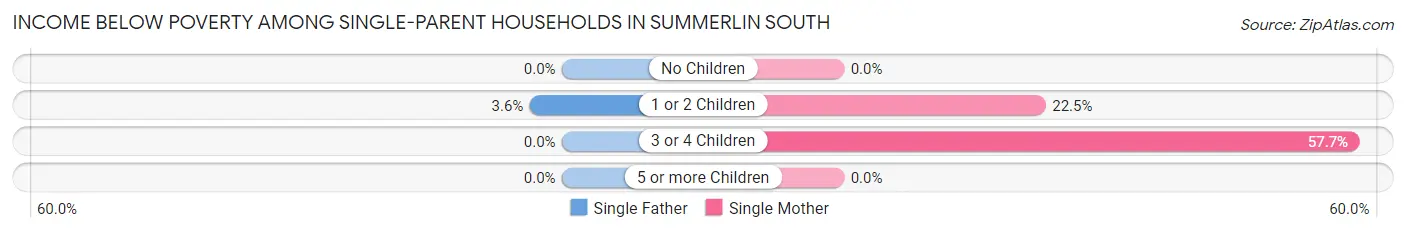
| Children | Single Father | Single Mother |
| No Children | 0 (0.0%) | 0 (0.0%) |
| 1 or 2 Children | 7 (3.6%) | 121 (22.5%) |
| 3 or 4 Children | 0 (0.0%) | 15 (57.7%) |
| 5 or more Children | 0 (0.0%) | 0 (0.0%) |
| Total | 7 (1.5%) | 136 (15.0%) |
Income Below Poverty Among Married-Couple vs Single-Parent Households in Summerlin South
The poverty data for Summerlin South shows that 213 of the married-couple family households (3.3%) and 143 of the single-parent households (10.3%) are living below the poverty level. Within the married-couple family households, those with 3 or 4 children have the highest poverty rate, with 24 households (6.5%) falling below the poverty line. Among the single-parent households, those with 1 or 2 children have the highest poverty rate, with 128 household (17.5%) living below poverty.
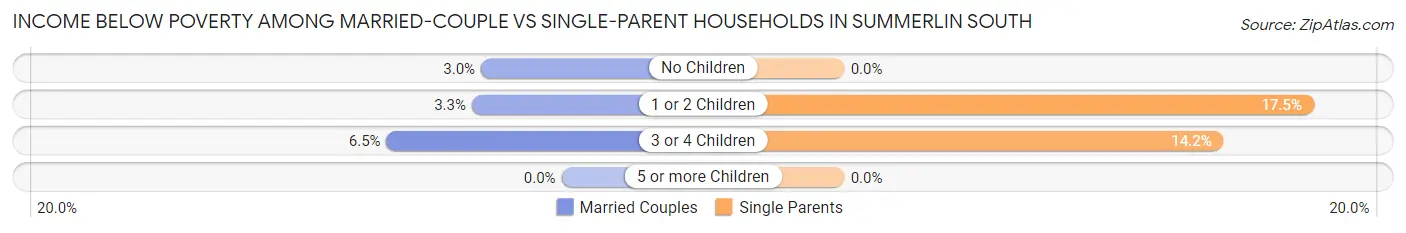
| Children | Married-Couple Families | Single-Parent Households |
| No Children | 127 (3.0%) | 0 (0.0%) |
| 1 or 2 Children | 62 (3.3%) | 128 (17.5%) |
| 3 or 4 Children | 24 (6.5%) | 15 (14.1%) |
| 5 or more Children | 0 (0.0%) | 0 (0.0%) |
| Total | 213 (3.3%) | 143 (10.3%) |
Race in Summerlin South
The most populous races in Summerlin South are White / Caucasian (21,149 | 71.2%), Hispanic or Latino (3,806 | 12.8%), and Asian (3,699 | 12.4%).
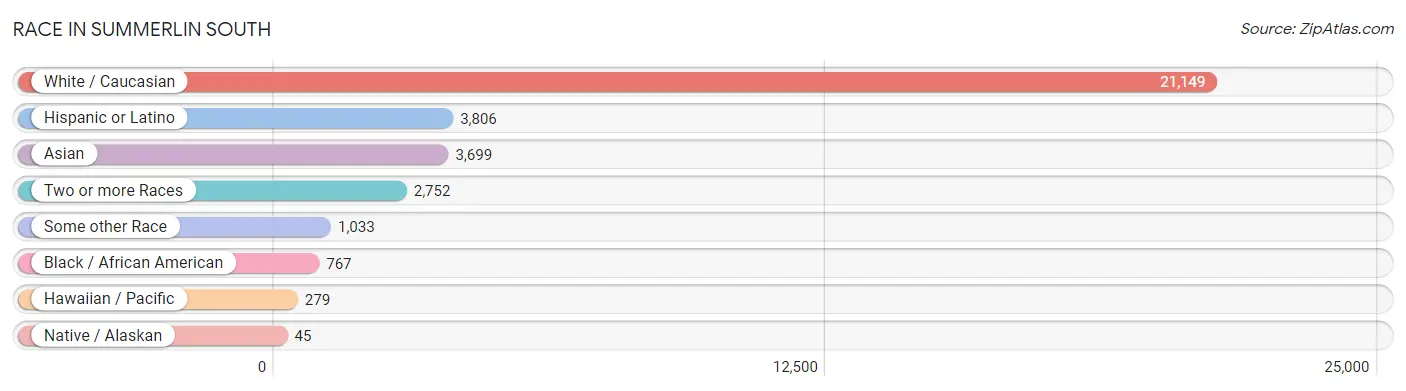
| Race | # Population | % Population |
| Asian | 3,699 | 12.4% |
| Black / African American | 767 | 2.6% |
| Hawaiian / Pacific | 279 | 0.9% |
| Hispanic or Latino | 3,806 | 12.8% |
| Native / Alaskan | 45 | 0.2% |
| White / Caucasian | 21,149 | 71.2% |
| Two or more Races | 2,752 | 9.3% |
| Some other Race | 1,033 | 3.5% |
| Total | 29,724 | 100.0% |
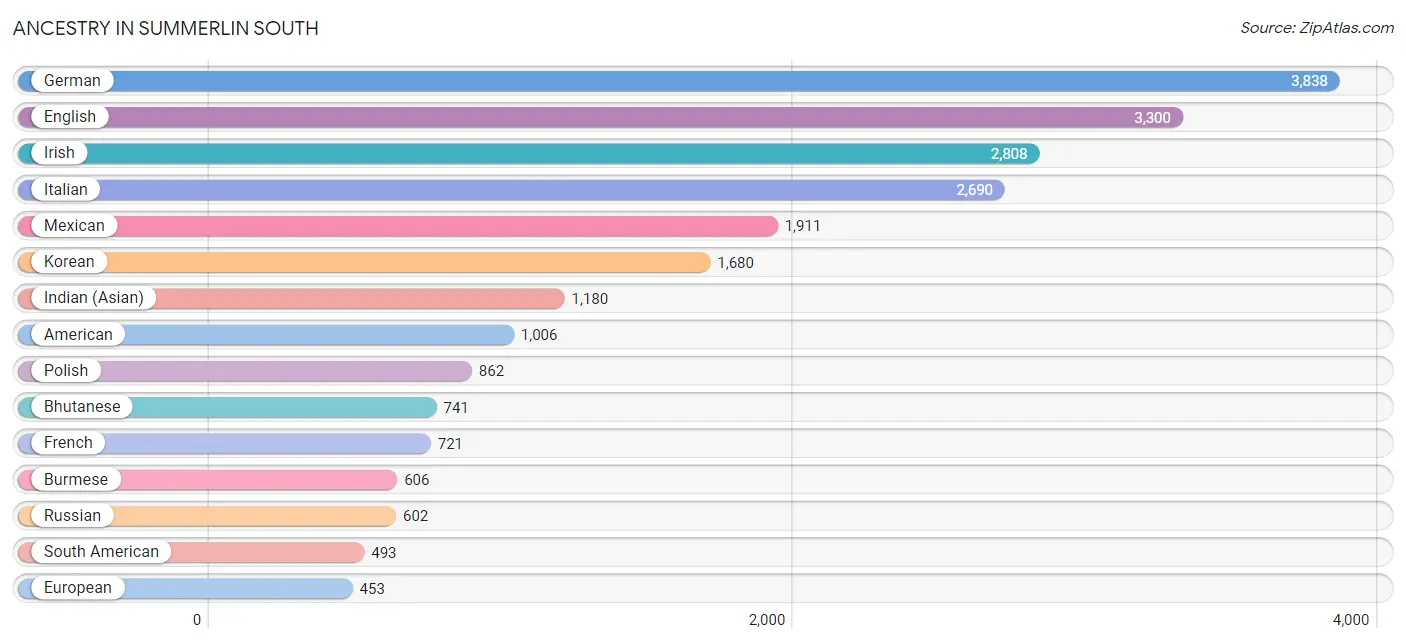
Ancestry in Summerlin South
The most populous ancestries reported in Summerlin South are German (3,838 | 12.9%), English (3,300 | 11.1%), Irish (2,808 | 9.5%), Italian (2,690 | 9.0%), and Mexican (1,911 | 6.4%), together accounting for 48.9% of all Summerlin South residents.
| Ancestry | # Population | % Population |
| African | 37 | 0.1% |
| American | 1,006 | 3.4% |
| Apache | 6 | 0.0% |
| Arab | 192 | 0.6% |
| Argentinean | 73 | 0.3% |
| Armenian | 127 | 0.4% |
| Assyrian / Chaldean / Syriac | 23 | 0.1% |
| Australian | 19 | 0.1% |
| Austrian | 127 | 0.4% |
| Basque | 72 | 0.2% |
| Belgian | 56 | 0.2% |
| Belizean | 14 | 0.1% |
| Bhutanese | 741 | 2.5% |
| Brazilian | 23 | 0.1% |
| British | 195 | 0.7% |
| Bulgarian | 57 | 0.2% |
| Burmese | 606 | 2.0% |
| Canadian | 210 | 0.7% |
| Central American | 152 | 0.5% |
| Cherokee | 14 | 0.1% |
| Choctaw | 25 | 0.1% |
| Colombian | 279 | 0.9% |
| Creek | 34 | 0.1% |
| Croatian | 123 | 0.4% |
| Cuban | 314 | 1.1% |
| Czech | 229 | 0.8% |
| Czechoslovakian | 79 | 0.3% |
| Danish | 152 | 0.5% |
| Dominican | 170 | 0.6% |
| Dutch | 391 | 1.3% |
| Eastern European | 85 | 0.3% |
| Egyptian | 30 | 0.1% |
| English | 3,300 | 11.1% |
| Ethiopian | 8 | 0.0% |
| European | 453 | 1.5% |
| Filipino | 99 | 0.3% |
| Finnish | 126 | 0.4% |
| French | 721 | 2.4% |
| French Canadian | 31 | 0.1% |
| German | 3,838 | 12.9% |
| Greek | 210 | 0.7% |
| Guamanian / Chamorro | 246 | 0.8% |
| Guatemalan | 30 | 0.1% |
| Hungarian | 260 | 0.9% |
| Icelander | 91 | 0.3% |
| Indian (Asian) | 1,180 | 4.0% |
| Iranian | 143 | 0.5% |
| Iraqi | 25 | 0.1% |
| Irish | 2,808 | 9.5% |
| Israeli | 93 | 0.3% |
| Italian | 2,690 | 9.0% |
| Jamaican | 128 | 0.4% |
| Korean | 1,680 | 5.7% |
| Laotian | 34 | 0.1% |
| Lebanese | 48 | 0.2% |
| Lithuanian | 73 | 0.3% |
| Malaysian | 20 | 0.1% |
| Mexican | 1,911 | 6.4% |
| Moroccan | 59 | 0.2% |
| Native Hawaiian | 207 | 0.7% |
| Nicaraguan | 38 | 0.1% |
| Northern European | 11 | 0.0% |
| Norwegian | 274 | 0.9% |
| Okinawan | 38 | 0.1% |
| Pakistani | 78 | 0.3% |
| Peruvian | 141 | 0.5% |
| Pima | 6 | 0.0% |
| Polish | 862 | 2.9% |
| Portuguese | 132 | 0.4% |
| Puerto Rican | 333 | 1.1% |
| Romanian | 164 | 0.5% |
| Russian | 602 | 2.0% |
| Salvadoran | 84 | 0.3% |
| Scandinavian | 253 | 0.9% |
| Scotch-Irish | 135 | 0.4% |
| Scottish | 241 | 0.8% |
| Serbian | 12 | 0.0% |
| Slavic | 28 | 0.1% |
| Slovak | 69 | 0.2% |
| Slovene | 17 | 0.1% |
| South African | 3 | 0.0% |
| South American | 493 | 1.7% |
| Spaniard | 123 | 0.4% |
| Spanish | 186 | 0.6% |
| Sri Lankan | 361 | 1.2% |
| Subsaharan African | 48 | 0.2% |
| Swedish | 368 | 1.2% |
| Swiss | 208 | 0.7% |
| Syrian | 16 | 0.1% |
| Thai | 137 | 0.5% |
| Turkish | 9 | 0.0% |
| Ukrainian | 122 | 0.4% |
| Welsh | 89 | 0.3% |
| Yugoslavian | 26 | 0.1% | View All 94 Rows |
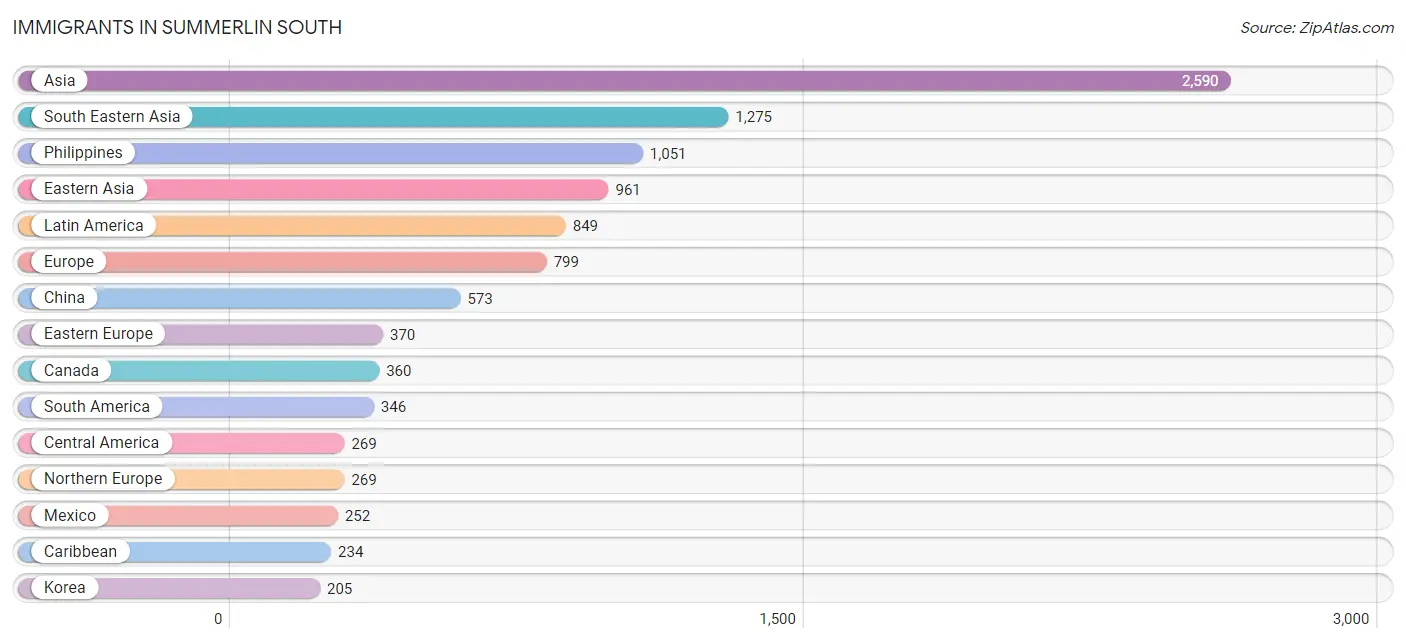
Immigrants in Summerlin South
The most numerous immigrant groups reported in Summerlin South came from Asia (2,590 | 8.7%), South Eastern Asia (1,275 | 4.3%), Philippines (1,051 | 3.5%), Eastern Asia (961 | 3.2%), and Latin America (849 | 2.9%), together accounting for 22.6% of all Summerlin South residents.
| Immigration Origin | # Population | % Population |
| Africa | 150 | 0.5% |
| Argentina | 31 | 0.1% |
| Armenia | 8 | 0.0% |
| Asia | 2,590 | 8.7% |
| Australia | 10 | 0.0% |
| Belgium | 26 | 0.1% |
| Brazil | 34 | 0.1% |
| Canada | 360 | 1.2% |
| Caribbean | 234 | 0.8% |
| Central America | 269 | 0.9% |
| China | 573 | 1.9% |
| Colombia | 140 | 0.5% |
| Croatia | 5 | 0.0% |
| Cuba | 178 | 0.6% |
| Czechoslovakia | 102 | 0.3% |
| Eastern Africa | 11 | 0.0% |
| Eastern Asia | 961 | 3.2% |
| Eastern Europe | 370 | 1.2% |
| Egypt | 68 | 0.2% |
| England | 167 | 0.6% |
| Eritrea | 8 | 0.0% |
| Europe | 799 | 2.7% |
| France | 5 | 0.0% |
| Germany | 68 | 0.2% |
| Greece | 27 | 0.1% |
| Guatemala | 17 | 0.1% |
| Hong Kong | 113 | 0.4% |
| Hungary | 73 | 0.3% |
| India | 42 | 0.1% |
| Indonesia | 24 | 0.1% |
| Iran | 27 | 0.1% |
| Iraq | 16 | 0.1% |
| Israel | 74 | 0.3% |
| Jamaica | 12 | 0.0% |
| Japan | 183 | 0.6% |
| Kazakhstan | 67 | 0.2% |
| Korea | 205 | 0.7% |
| Latin America | 849 | 2.9% |
| Lebanon | 20 | 0.1% |
| Mexico | 252 | 0.9% |
| Moldova | 32 | 0.1% |
| Morocco | 45 | 0.2% |
| Nepal | 29 | 0.1% |
| Northern Africa | 113 | 0.4% |
| Northern Europe | 269 | 0.9% |
| Oceania | 10 | 0.0% |
| Pakistan | 38 | 0.1% |
| Peru | 141 | 0.5% |
| Philippines | 1,051 | 3.5% |
| Poland | 16 | 0.1% |
| Romania | 29 | 0.1% |
| Russia | 76 | 0.3% |
| Serbia | 7 | 0.0% |
| Singapore | 1 | 0.0% |
| South Africa | 26 | 0.1% |
| South America | 346 | 1.2% |
| South Central Asia | 203 | 0.7% |
| South Eastern Asia | 1,275 | 4.3% |
| Southern Europe | 27 | 0.1% |
| Sweden | 38 | 0.1% |
| Switzerland | 17 | 0.1% |
| Taiwan | 140 | 0.5% |
| Thailand | 13 | 0.0% |
| Ukraine | 20 | 0.1% |
| Vietnam | 186 | 0.6% |
| Western Asia | 151 | 0.5% |
| Western Europe | 116 | 0.4% |
| Zimbabwe | 3 | 0.0% | View All 68 Rows |
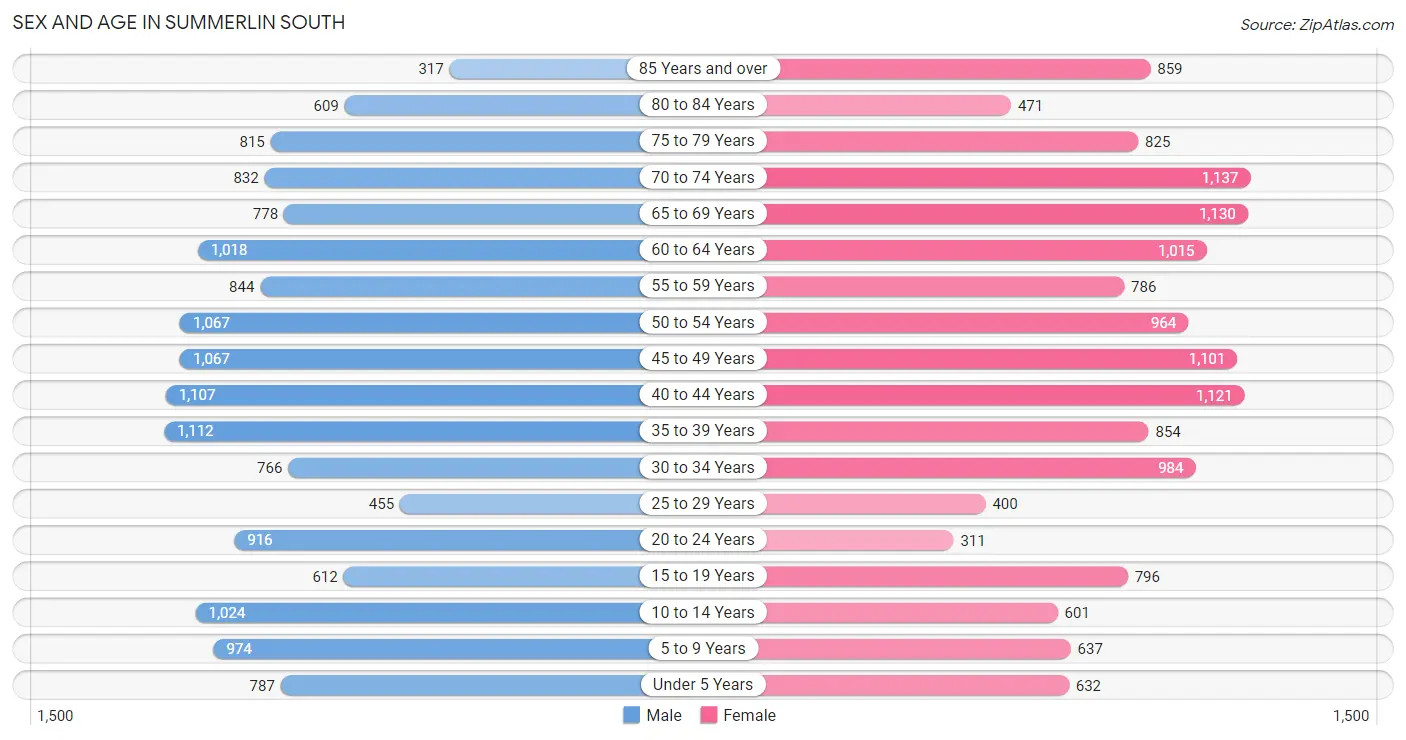
Sex and Age in Summerlin South
Sex and Age in Summerlin South
The most populous age groups in Summerlin South are 35 to 39 Years (1,112 | 7.4%) for men and 70 to 74 Years (1,137 | 7.8%) for women.
| Age Bracket | Male | Female |
| Under 5 Years | 787 (5.2%) | 632 (4.3%) |
| 5 to 9 Years | 974 (6.5%) | 637 (4.4%) |
| 10 to 14 Years | 1,024 (6.8%) | 601 (4.1%) |
| 15 to 19 Years | 612 (4.1%) | 796 (5.4%) |
| 20 to 24 Years | 916 (6.1%) | 311 (2.1%) |
| 25 to 29 Years | 455 (3.0%) | 400 (2.7%) |
| 30 to 34 Years | 766 (5.1%) | 984 (6.7%) |
| 35 to 39 Years | 1,112 (7.4%) | 854 (5.8%) |
| 40 to 44 Years | 1,107 (7.3%) | 1,121 (7.7%) |
| 45 to 49 Years | 1,067 (7.1%) | 1,101 (7.5%) |
| 50 to 54 Years | 1,067 (7.1%) | 964 (6.6%) |
| 55 to 59 Years | 844 (5.6%) | 786 (5.4%) |
| 60 to 64 Years | 1,018 (6.7%) | 1,015 (6.9%) |
| 65 to 69 Years | 778 (5.1%) | 1,130 (7.7%) |
| 70 to 74 Years | 832 (5.5%) | 1,137 (7.8%) |
| 75 to 79 Years | 815 (5.4%) | 825 (5.6%) |
| 80 to 84 Years | 609 (4.0%) | 471 (3.2%) |
| 85 Years and over | 317 (2.1%) | 859 (5.9%) |
| Total | 15,100 (100.0%) | 14,624 (100.0%) |
Families and Households in Summerlin South
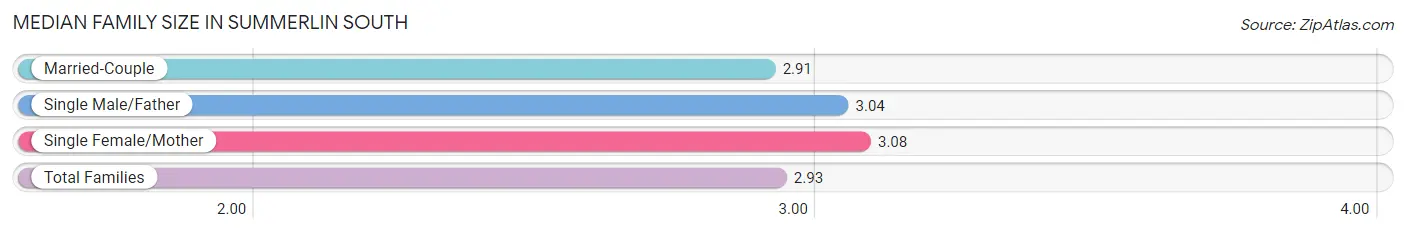
Median Family Size in Summerlin South
The median family size in Summerlin South is 2.93 persons per family, with single female/mother families (907 | 11.6%) accounting for the largest median family size of 3.08 persons per family. On the other hand, married-couple families (6,461 | 82.3%) represent the smallest median family size with 2.91 persons per family.
| Family Type | # Families | Family Size |
| Married-Couple | 6,461 (82.3%) | 2.91 |
| Single Male/Father | 481 (6.1%) | 3.04 |
| Single Female/Mother | 907 (11.6%) | 3.08 |
| Total Families | 7,849 (100.0%) | 2.93 |
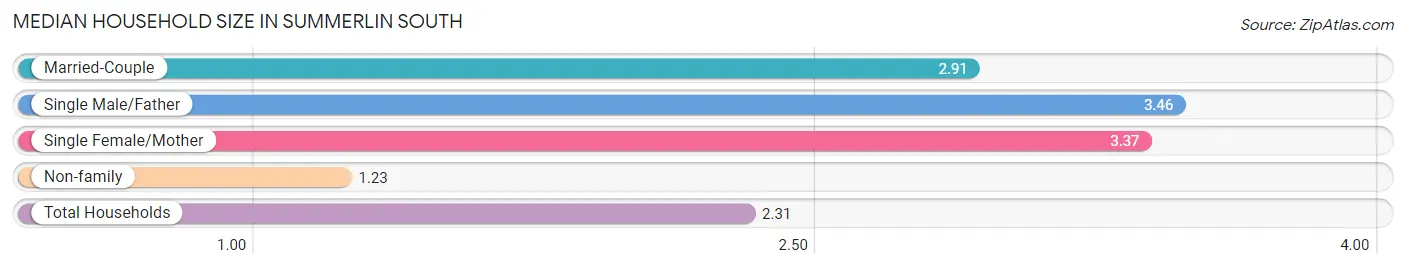
Median Household Size in Summerlin South
The median household size in Summerlin South is 2.31 persons per household, with single male/father households (481 | 3.7%) accounting for the largest median household size of 3.46 persons per household. non-family households (4,989 | 38.9%) represent the smallest median household size with 1.23 persons per household.
| Household Type | # Households | Household Size |
| Married-Couple | 6,461 (50.3%) | 2.91 |
| Single Male/Father | 481 (3.7%) | 3.46 |
| Single Female/Mother | 907 (7.1%) | 3.37 |
| Non-family | 4,989 (38.9%) | 1.23 |
| Total Households | 12,838 (100.0%) | 2.31 |
Household Size by Marriage Status in Summerlin South
Out of a total of 12,838 households in Summerlin South, 7,849 (61.1%) are family households, while 4,989 (38.9%) are nonfamily households. The most numerous type of family households are 2-person households, comprising 4,010, and the most common type of nonfamily households are 1-person households, comprising 4,191.
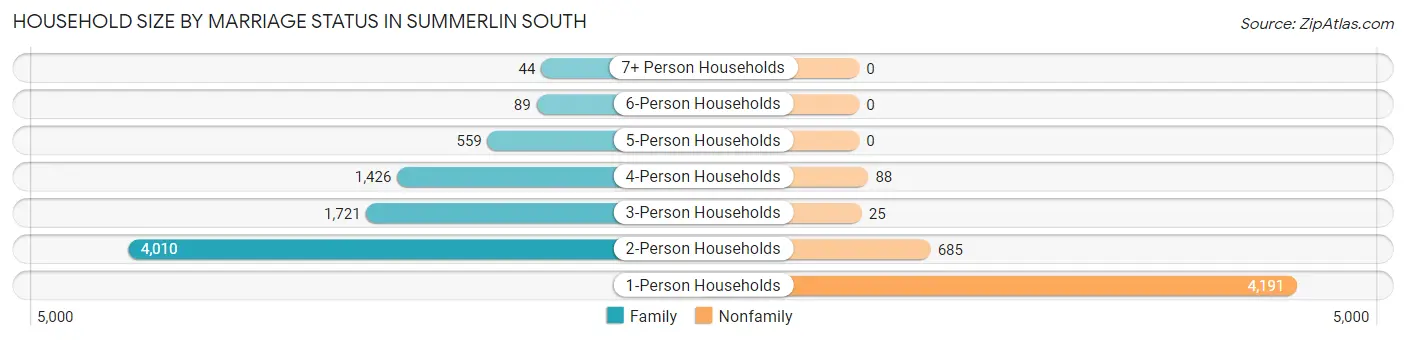
| Household Size | Family Households | Nonfamily Households |
| 1-Person Households | - | 4,191 (32.7%) |
| 2-Person Households | 4,010 (31.2%) | 685 (5.3%) |
| 3-Person Households | 1,721 (13.4%) | 25 (0.2%) |
| 4-Person Households | 1,426 (11.1%) | 88 (0.7%) |
| 5-Person Households | 559 (4.3%) | 0 (0.0%) |
| 6-Person Households | 89 (0.7%) | 0 (0.0%) |
| 7+ Person Households | 44 (0.3%) | 0 (0.0%) |
| Total | 7,849 (61.1%) | 4,989 (38.9%) |
Female Fertility in Summerlin South
Fertility by Age in Summerlin South
Average fertility rate in Summerlin South is 69.0 births per 1,000 women. Women in the age bracket of 20 to 34 years have the highest fertility rate with 195.0 births per 1,000 women. Women in the age bracket of 20 to 34 years acount for 83.3% of all women with births.
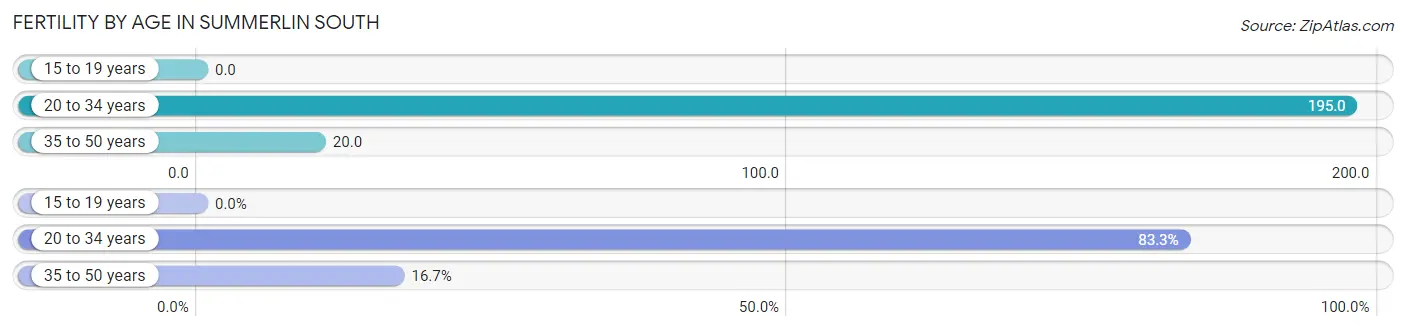
| Age Bracket | Women with Births | Births / 1,000 Women |
| 15 to 19 years | 0 (0.0%) | 0.0 |
| 20 to 34 years | 330 (83.3%) | 195.0 |
| 35 to 50 years | 66 (16.7%) | 20.0 |
| Total | 396 (100.0%) | 69.0 |
Fertility by Age by Marriage Status in Summerlin South
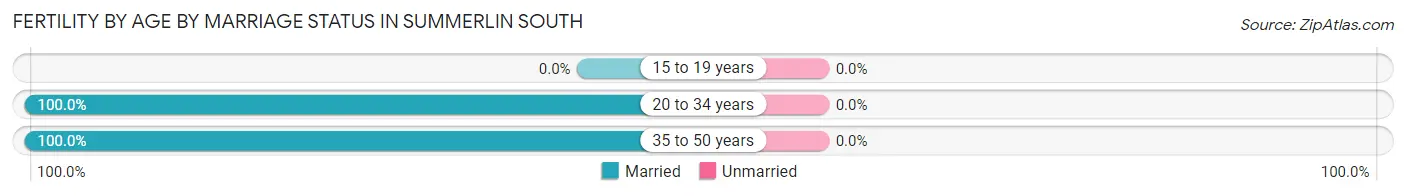
| Age Bracket | Married | Unmarried |
| 15 to 19 years | 0 (0.0%) | 0 (0.0%) |
| 20 to 34 years | 330 (100.0%) | 0 (0.0%) |
| 35 to 50 years | 66 (100.0%) | 0 (0.0%) |
| Total | 396 (100.0%) | 0 (0.0%) |
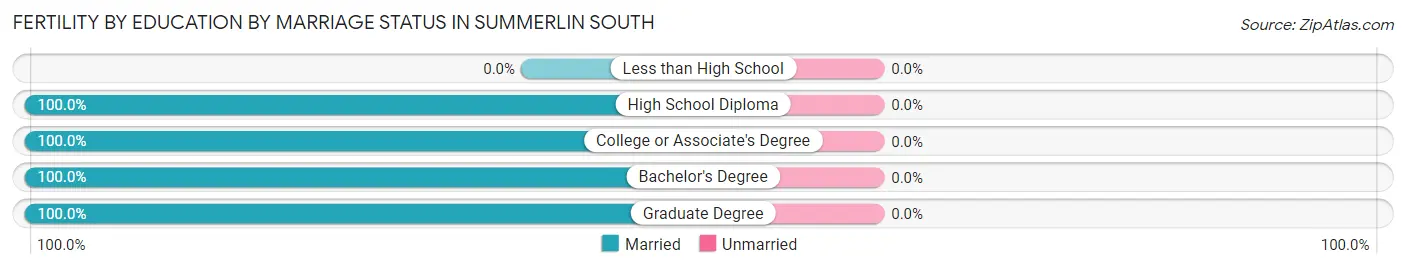
Fertility by Education in Summerlin South
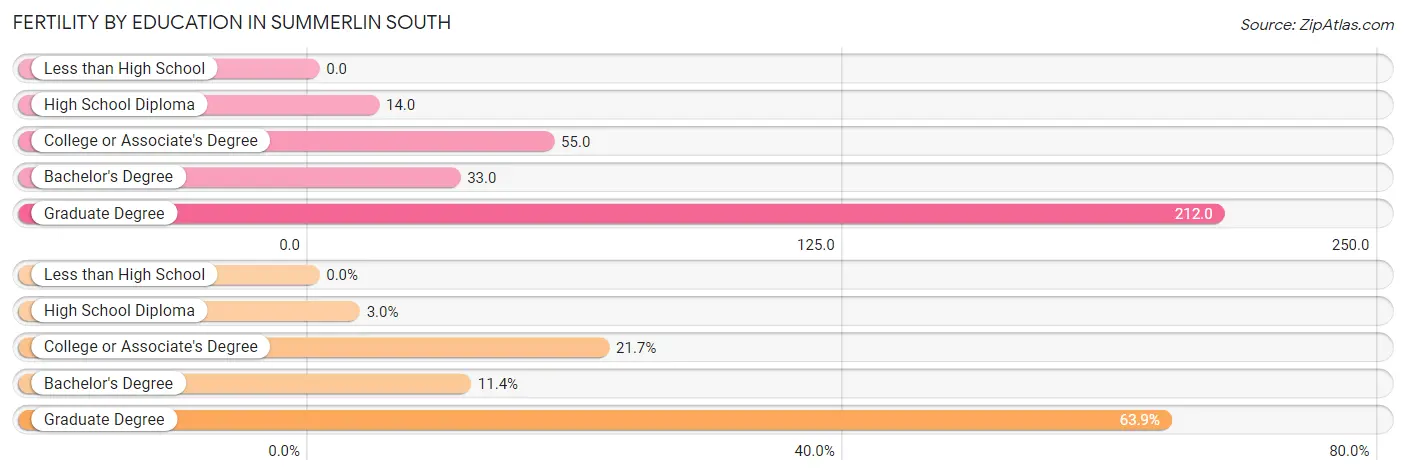
| Educational Attainment | Women with Births | Births / 1,000 Women |
| Less than High School | 0 (0.0%) | 0.0 |
| High School Diploma | 12 (3.0%) | 14.0 |
| College or Associate's Degree | 86 (21.7%) | 55.0 |
| Bachelor's Degree | 45 (11.4%) | 33.0 |
| Graduate Degree | 253 (63.9%) | 212.0 |
| Total | 396 (100.0%) | 69.0 |
Fertility by Education by Marriage Status in Summerlin South
| Educational Attainment | Married | Unmarried |
| Less than High School | 0 (0.0%) | 0 (0.0%) |
| High School Diploma | 12 (100.0%) | 0 (0.0%) |
| College or Associate's Degree | 86 (100.0%) | 0 (0.0%) |
| Bachelor's Degree | 45 (100.0%) | 0 (0.0%) |
| Graduate Degree | 253 (100.0%) | 0 (0.0%) |
| Total | 396 (100.0%) | 0 (0.0%) |
Employment Characteristics in Summerlin South
Employment by Class of Employer in Summerlin South
Among the 13,953 employed individuals in Summerlin South, private company employees (10,150 | 72.7%), self-employed (incorporated) (1,591 | 11.4%), and local government employees (686 | 4.9%) make up the most common classes of employment.
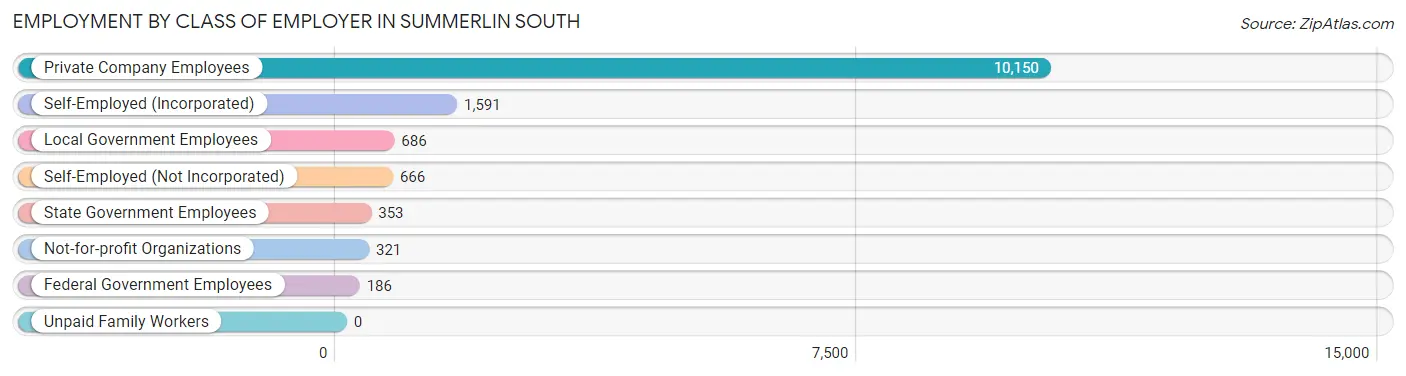
| Employer Class | # Employees | % Employees |
| Private Company Employees | 10,150 | 72.7% |
| Self-Employed (Incorporated) | 1,591 | 11.4% |
| Self-Employed (Not Incorporated) | 666 | 4.8% |
| Not-for-profit Organizations | 321 | 2.3% |
| Local Government Employees | 686 | 4.9% |
| State Government Employees | 353 | 2.5% |
| Federal Government Employees | 186 | 1.3% |
| Unpaid Family Workers | 0 | 0.0% |
| Total | 13,953 | 100.0% |
Employment Status by Age in Summerlin South
According to the labor force statistics for Summerlin South, out of the total population over 16 years of age (24,729), 59.0% or 14,590 individuals are in the labor force, with 3.3% or 481 of them unemployed. The age group with the highest labor force participation rate is 30 to 34 years, with 90.2% or 1,578 individuals in the labor force. Within the labor force, the 16 to 19 years age range has the highest percentage of unemployed individuals, with 30.8% or 122 of them being unemployed.
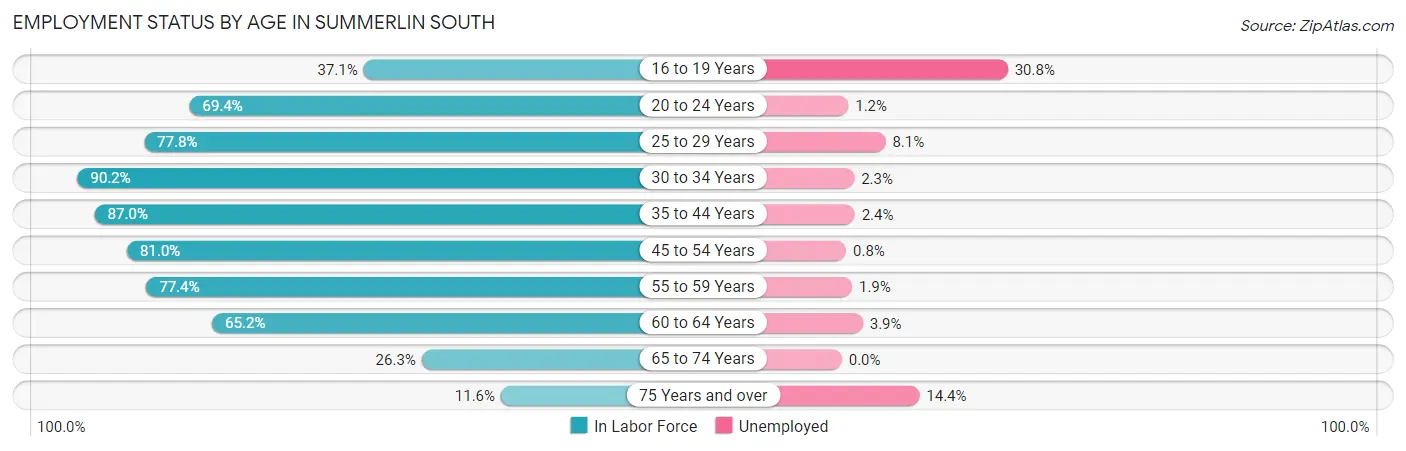
| Age Bracket | In Labor Force | Unemployed |
| 16 to 19 Years | 396 (37.1%) | 122 (30.8%) |
| 20 to 24 Years | 852 (69.4%) | 10 (1.2%) |
| 25 to 29 Years | 665 (77.8%) | 54 (8.1%) |
| 30 to 34 Years | 1,578 (90.2%) | 36 (2.3%) |
| 35 to 44 Years | 3,649 (87.0%) | 88 (2.4%) |
| 45 to 54 Years | 3,401 (81.0%) | 27 (0.8%) |
| 55 to 59 Years | 1,262 (77.4%) | 24 (1.9%) |
| 60 to 64 Years | 1,326 (65.2%) | 52 (3.9%) |
| 65 to 74 Years | 1,020 (26.3%) | 0 (0.0%) |
| 75 Years and over | 452 (11.6%) | 65 (14.4%) |
| Total | 14,590 (59.0%) | 481 (3.3%) |
Employment Status by Educational Attainment in Summerlin South
According to labor force statistics for Summerlin South, 81.0% of individuals (11,875) out of the total population between 25 and 64 years of age (14,661) are in the labor force, with 2.4% or 285 of them being unemployed. The group with the highest labor force participation rate are those with the educational attainment of bachelor's degree or higher, with 84.4% or 6,386 individuals in the labor force. Within the labor force, individuals with college / associate degree education have the highest percentage of unemployment, with 3.6% or 117 of them being unemployed.
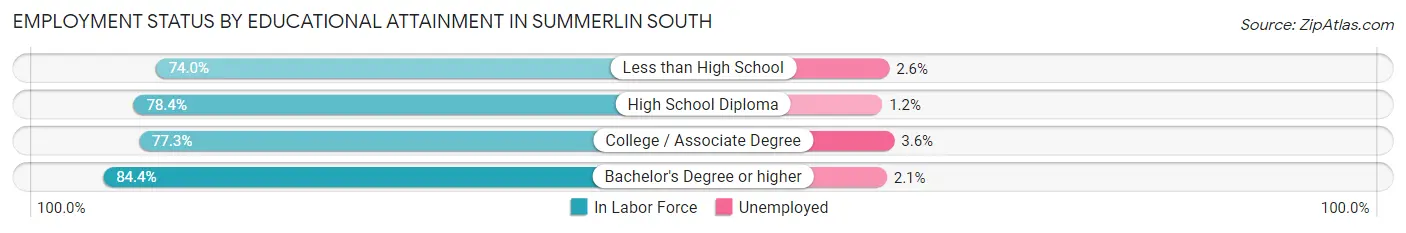
| Educational Attainment | In Labor Force | Unemployed |
| Less than High School | 423 (74.0%) | 15 (2.6%) |
| High School Diploma | 1,829 (78.4%) | 28 (1.2%) |
| College / Associate Degree | 3,239 (77.3%) | 151 (3.6%) |
| Bachelor's Degree or higher | 6,386 (84.4%) | 159 (2.1%) |
| Total | 11,875 (81.0%) | 352 (2.4%) |
Employment Occupations by Sex in Summerlin South
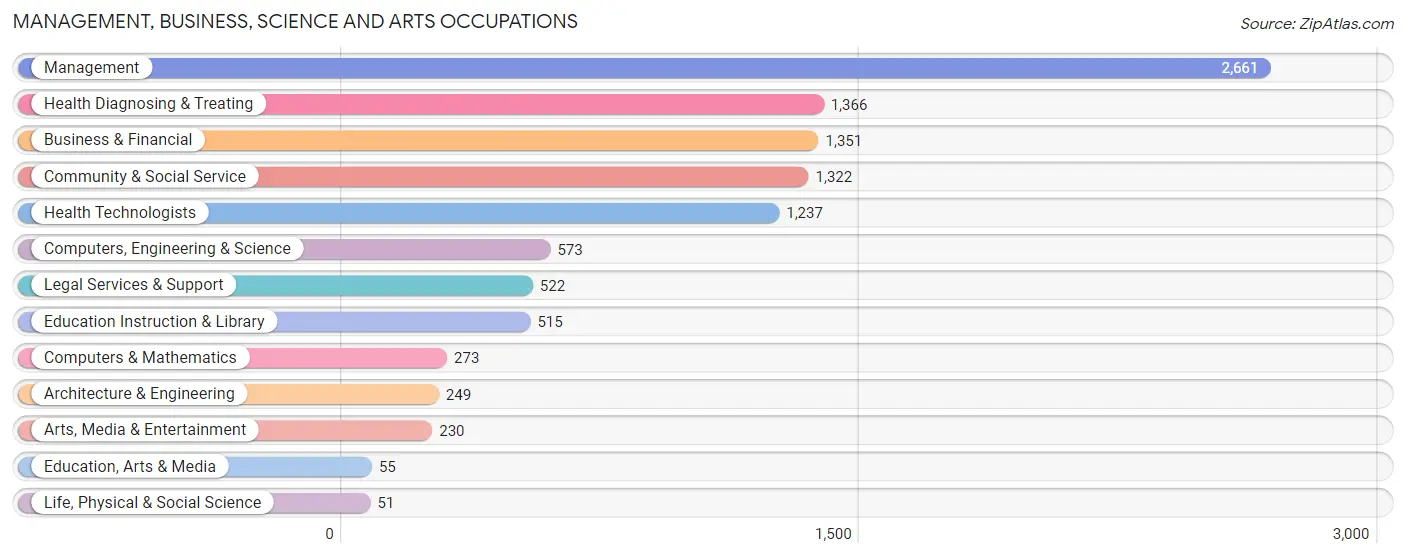
Management, Business, Science and Arts Occupations
The most common Management, Business, Science and Arts occupations in Summerlin South are Management (2,661 | 18.9%), Health Diagnosing & Treating (1,366 | 9.7%), Business & Financial (1,351 | 9.6%), Community & Social Service (1,322 | 9.4%), and Health Technologists (1,237 | 8.8%).
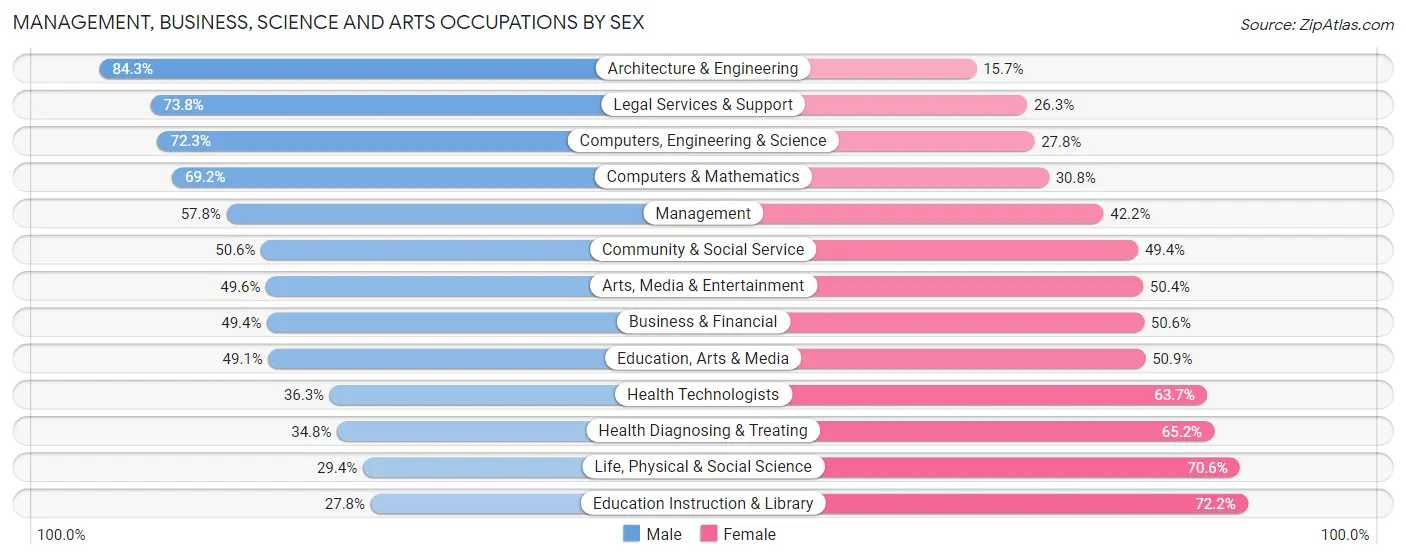
Management, Business, Science and Arts Occupations by Sex
Within the Management, Business, Science and Arts occupations in Summerlin South, the most male-oriented occupations are Architecture & Engineering (84.3%), Legal Services & Support (73.8%), and Computers, Engineering & Science (72.3%), while the most female-oriented occupations are Education Instruction & Library (72.2%), Life, Physical & Social Science (70.6%), and Health Diagnosing & Treating (65.2%).
| Occupation | Male | Female |
| Management | 1,539 (57.8%) | 1,122 (42.2%) |
| Business & Financial | 667 (49.4%) | 684 (50.6%) |
| Computers, Engineering & Science | 414 (72.3%) | 159 (27.8%) |
| Computers & Mathematics | 189 (69.2%) | 84 (30.8%) |
| Architecture & Engineering | 210 (84.3%) | 39 (15.7%) |
| Life, Physical & Social Science | 15 (29.4%) | 36 (70.6%) |
| Community & Social Service | 669 (50.6%) | 653 (49.4%) |
| Education, Arts & Media | 27 (49.1%) | 28 (50.9%) |
| Legal Services & Support | 385 (73.8%) | 137 (26.3%) |
| Education Instruction & Library | 143 (27.8%) | 372 (72.2%) |
| Arts, Media & Entertainment | 114 (49.6%) | 116 (50.4%) |
| Health Diagnosing & Treating | 475 (34.8%) | 891 (65.2%) |
| Health Technologists | 449 (36.3%) | 788 (63.7%) |
| Total (Category) | 3,764 (51.7%) | 3,509 (48.2%) |
| Total (Overall) | 7,696 (54.5%) | 6,415 (45.5%) |
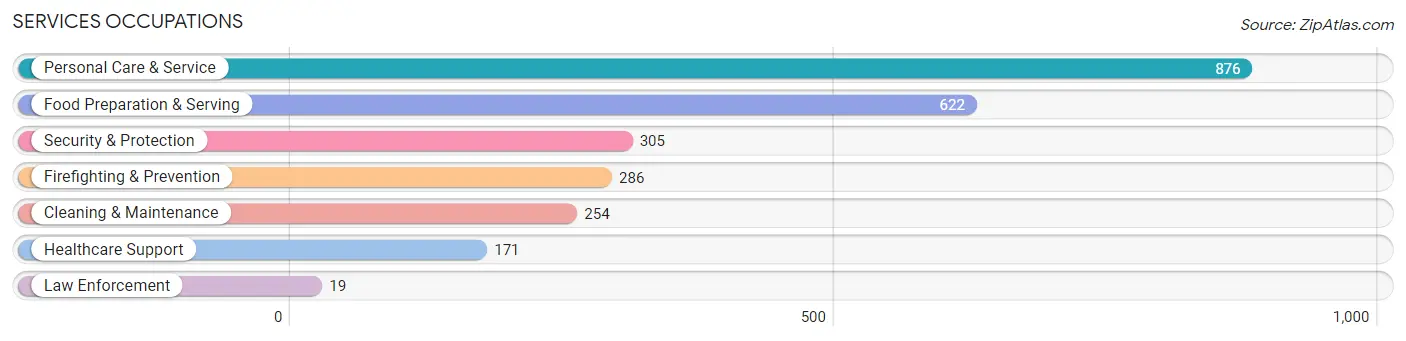
Services Occupations
The most common Services occupations in Summerlin South are Personal Care & Service (876 | 6.2%), Food Preparation & Serving (622 | 4.4%), Security & Protection (305 | 2.2%), Firefighting & Prevention (286 | 2.0%), and Cleaning & Maintenance (254 | 1.8%).
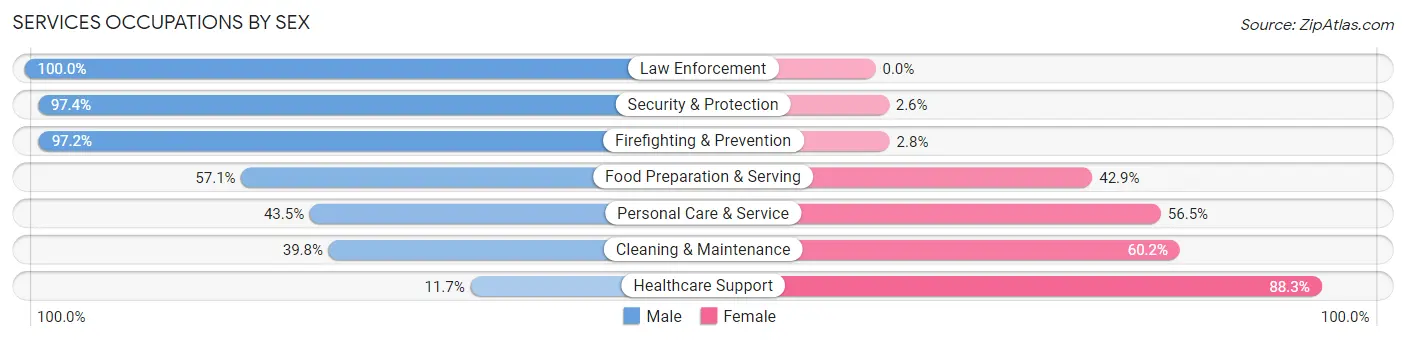
Services Occupations by Sex
Within the Services occupations in Summerlin South, the most male-oriented occupations are Law Enforcement (100.0%), Security & Protection (97.4%), and Firefighting & Prevention (97.2%), while the most female-oriented occupations are Healthcare Support (88.3%), Cleaning & Maintenance (60.2%), and Personal Care & Service (56.5%).
| Occupation | Male | Female |
| Healthcare Support | 20 (11.7%) | 151 (88.3%) |
| Security & Protection | 297 (97.4%) | 8 (2.6%) |
| Firefighting & Prevention | 278 (97.2%) | 8 (2.8%) |
| Law Enforcement | 19 (100.0%) | 0 (0.0%) |
| Food Preparation & Serving | 355 (57.1%) | 267 (42.9%) |
| Cleaning & Maintenance | 101 (39.8%) | 153 (60.2%) |
| Personal Care & Service | 381 (43.5%) | 495 (56.5%) |
| Total (Category) | 1,154 (51.8%) | 1,074 (48.2%) |
| Total (Overall) | 7,696 (54.5%) | 6,415 (45.5%) |
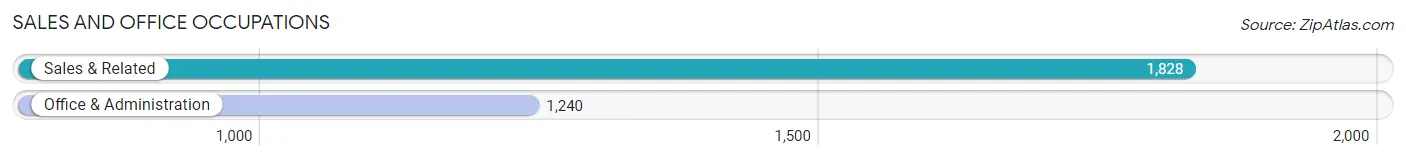
Sales and Office Occupations
The most common Sales and Office occupations in Summerlin South are Sales & Related (1,828 | 13.0%), and Office & Administration (1,240 | 8.8%).
Sales and Office Occupations by Sex
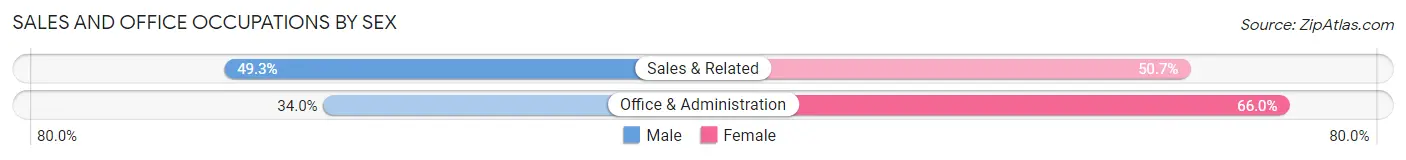
| Occupation | Male | Female |
| Sales & Related | 901 (49.3%) | 927 (50.7%) |
| Office & Administration | 422 (34.0%) | 818 (66.0%) |
| Total (Category) | 1,323 (43.1%) | 1,745 (56.9%) |
| Total (Overall) | 7,696 (54.5%) | 6,415 (45.5%) |
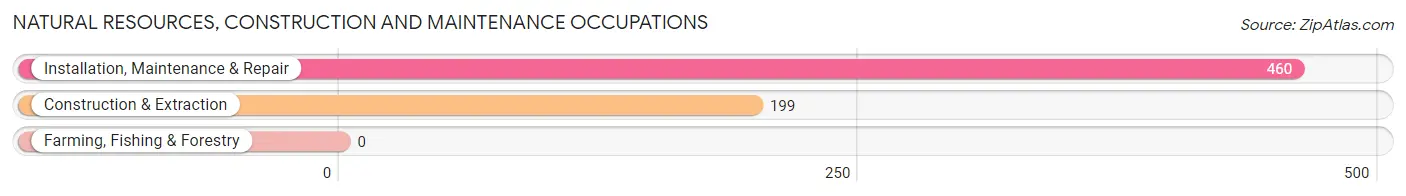
Natural Resources, Construction and Maintenance Occupations
The most common Natural Resources, Construction and Maintenance occupations in Summerlin South are Installation, Maintenance & Repair (460 | 3.3%), and Construction & Extraction (199 | 1.4%).
Natural Resources, Construction and Maintenance Occupations by Sex
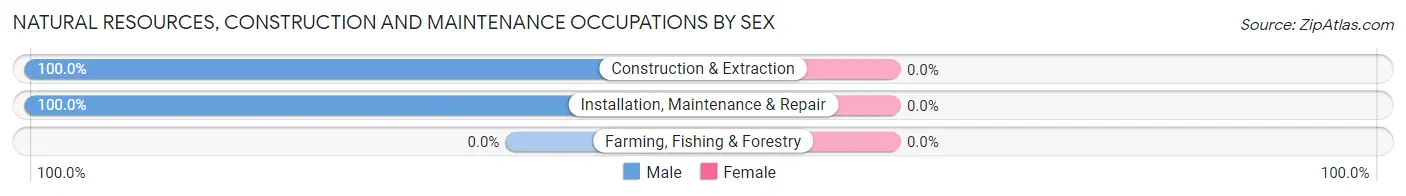
| Occupation | Male | Female |
| Farming, Fishing & Forestry | 0 (0.0%) | 0 (0.0%) |
| Construction & Extraction | 199 (100.0%) | 0 (0.0%) |
| Installation, Maintenance & Repair | 460 (100.0%) | 0 (0.0%) |
| Total (Category) | 659 (100.0%) | 0 (0.0%) |
| Total (Overall) | 7,696 (54.5%) | 6,415 (45.5%) |
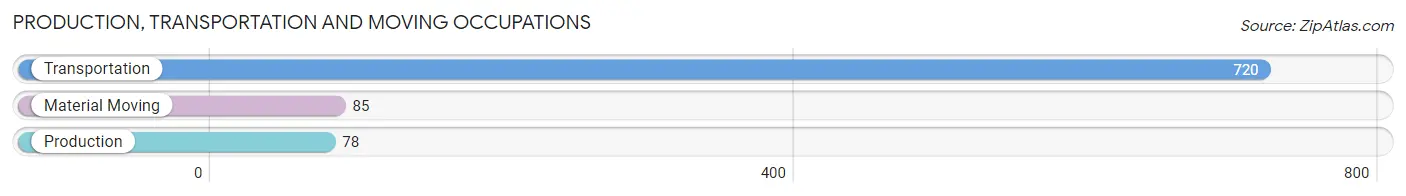
Production, Transportation and Moving Occupations
The most common Production, Transportation and Moving occupations in Summerlin South are Transportation (720 | 5.1%), Material Moving (85 | 0.6%), and Production (78 | 0.5%).
Production, Transportation and Moving Occupations by Sex
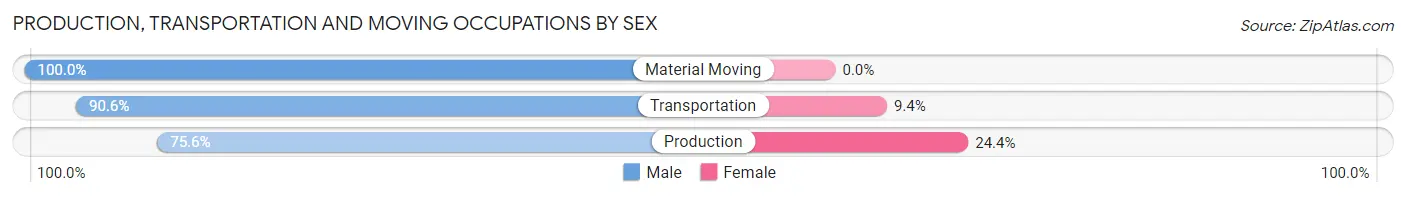
| Occupation | Male | Female |
| Production | 59 (75.6%) | 19 (24.4%) |
| Transportation | 652 (90.6%) | 68 (9.4%) |
| Material Moving | 85 (100.0%) | 0 (0.0%) |
| Total (Category) | 796 (90.1%) | 87 (9.9%) |
| Total (Overall) | 7,696 (54.5%) | 6,415 (45.5%) |
Employment Industries by Sex in Summerlin South
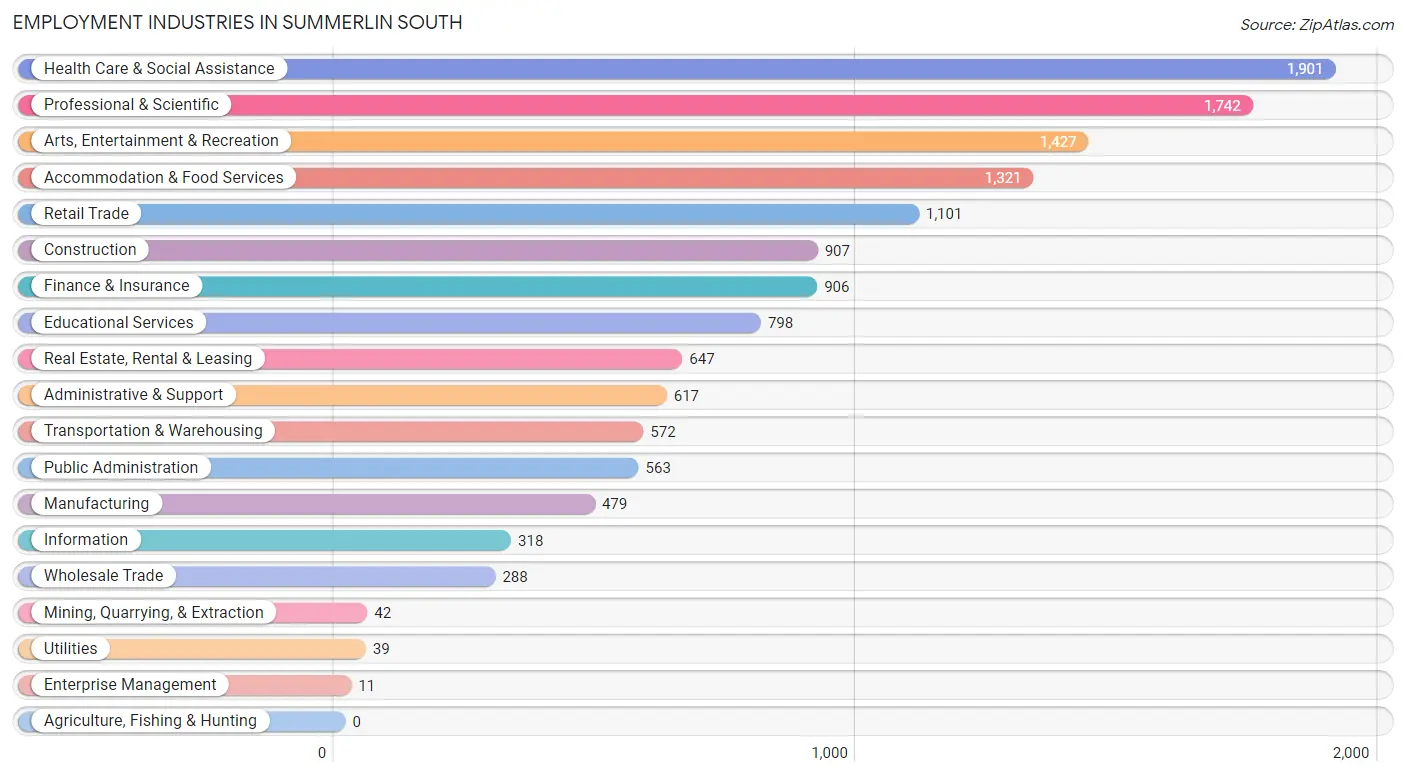
Employment Industries in Summerlin South
The major employment industries in Summerlin South include Health Care & Social Assistance (1,901 | 13.5%), Professional & Scientific (1,742 | 12.3%), Arts, Entertainment & Recreation (1,427 | 10.1%), Accommodation & Food Services (1,321 | 9.4%), and Retail Trade (1,101 | 7.8%).
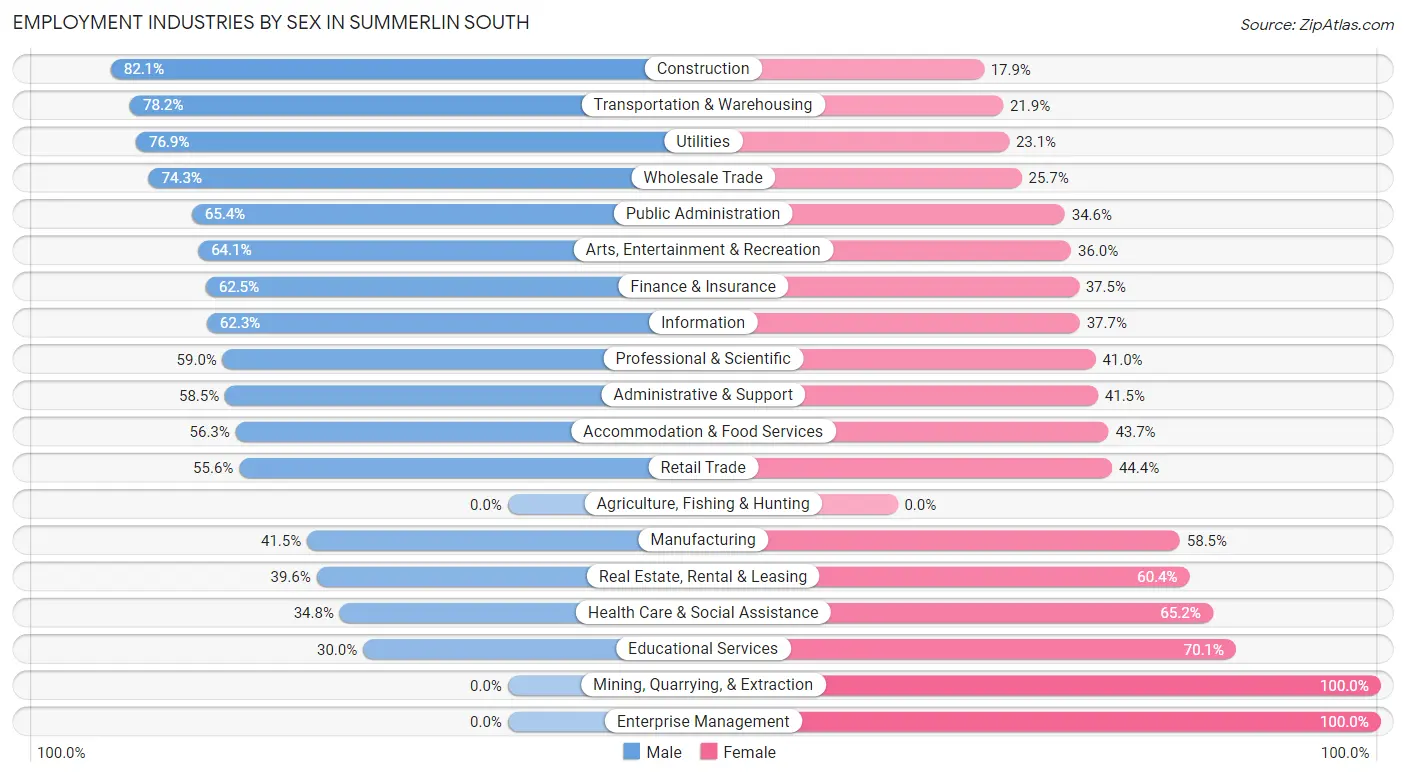
Employment Industries by Sex in Summerlin South
The Summerlin South industries that see more men than women are Construction (82.1%), Transportation & Warehousing (78.1%), and Utilities (76.9%), whereas the industries that tend to have a higher number of women are Mining, Quarrying, & Extraction (100.0%), Enterprise Management (100.0%), and Educational Services (70.1%).
| Industry | Male | Female |
| Agriculture, Fishing & Hunting | 0 (0.0%) | 0 (0.0%) |
| Mining, Quarrying, & Extraction | 0 (0.0%) | 42 (100.0%) |
| Construction | 745 (82.1%) | 162 (17.9%) |
| Manufacturing | 199 (41.5%) | 280 (58.5%) |
| Wholesale Trade | 214 (74.3%) | 74 (25.7%) |
| Retail Trade | 612 (55.6%) | 489 (44.4%) |
| Transportation & Warehousing | 447 (78.1%) | 125 (21.8%) |
| Utilities | 30 (76.9%) | 9 (23.1%) |
| Information | 198 (62.3%) | 120 (37.7%) |
| Finance & Insurance | 566 (62.5%) | 340 (37.5%) |
| Real Estate, Rental & Leasing | 256 (39.6%) | 391 (60.4%) |
| Professional & Scientific | 1,028 (59.0%) | 714 (41.0%) |
| Enterprise Management | 0 (0.0%) | 11 (100.0%) |
| Administrative & Support | 361 (58.5%) | 256 (41.5%) |
| Educational Services | 239 (29.9%) | 559 (70.1%) |
| Health Care & Social Assistance | 661 (34.8%) | 1,240 (65.2%) |
| Arts, Entertainment & Recreation | 914 (64.0%) | 513 (35.9%) |
| Accommodation & Food Services | 744 (56.3%) | 577 (43.7%) |
| Public Administration | 368 (65.4%) | 195 (34.6%) |
| Total | 7,696 (54.5%) | 6,415 (45.5%) |
Education in Summerlin South
School Enrollment in Summerlin South
The most common levels of schooling among the 5,758 students in Summerlin South are middle school (1,337 | 23.2%), high school (1,236 | 21.5%), and elementary school (1,108 | 19.2%).
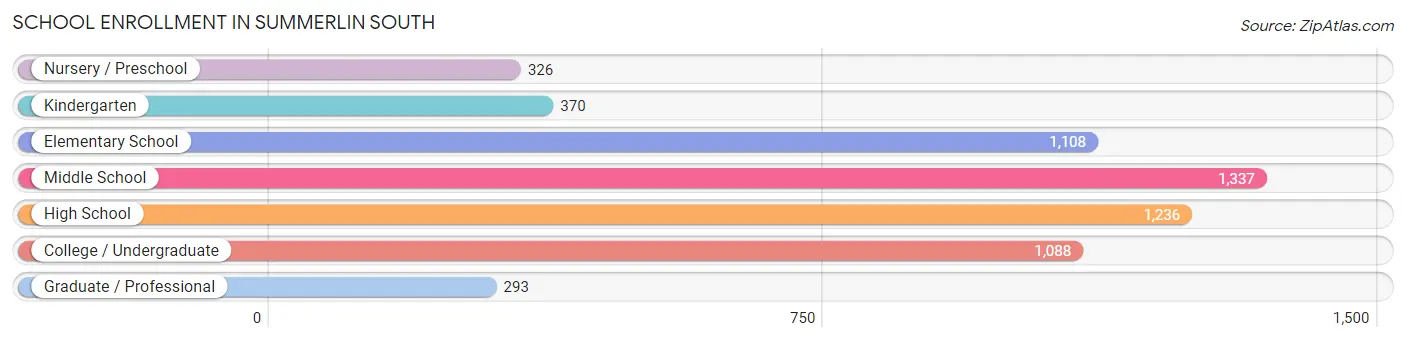
| School Level | # Students | % Students |
| Nursery / Preschool | 326 | 5.7% |
| Kindergarten | 370 | 6.4% |
| Elementary School | 1,108 | 19.2% |
| Middle School | 1,337 | 23.2% |
| High School | 1,236 | 21.5% |
| College / Undergraduate | 1,088 | 18.9% |
| Graduate / Professional | 293 | 5.1% |
| Total | 5,758 | 100.0% |
School Enrollment by Age by Funding Source in Summerlin South
Out of a total of 5,758 students who are enrolled in schools in Summerlin South, 2,338 (40.6%) attend a private institution, while the remaining 3,420 (59.4%) are enrolled in public schools. The age group of 3 to 4 year olds has the highest likelihood of being enrolled in private schools, with 160 (77.7% in the age bracket) enrolled. Conversely, the age group of 18 to 19 year olds has the lowest likelihood of being enrolled in a private school, with 312 (81.5% in the age bracket) attending a public institution.
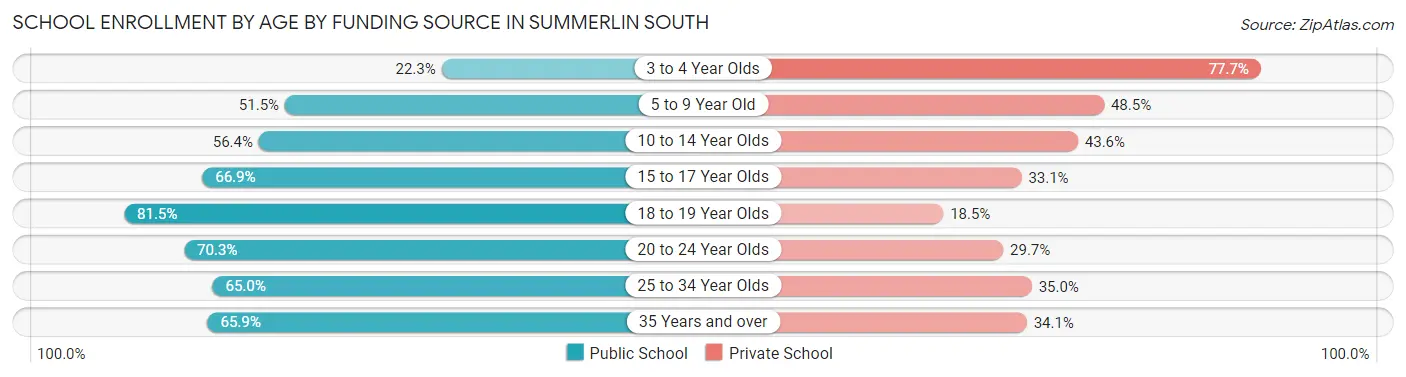
| Age Bracket | Public School | Private School |
| 3 to 4 Year Olds | 46 (22.3%) | 160 (77.7%) |
| 5 to 9 Year Old | 787 (51.5%) | 741 (48.5%) |
| 10 to 14 Year Olds | 901 (56.4%) | 697 (43.6%) |
| 15 to 17 Year Olds | 590 (66.9%) | 292 (33.1%) |
| 18 to 19 Year Olds | 312 (81.5%) | 71 (18.5%) |
| 20 to 24 Year Olds | 355 (70.3%) | 150 (29.7%) |
| 25 to 34 Year Olds | 167 (65.0%) | 90 (35.0%) |
| 35 Years and over | 263 (65.9%) | 136 (34.1%) |
| Total | 3,420 (59.4%) | 2,338 (40.6%) |
Educational Attainment by Field of Study in Summerlin South
Business (3,585 | 30.0%), education (1,228 | 10.3%), science & technology (1,033 | 8.6%), bio, nature & agricultural (967 | 8.1%), and social sciences (951 | 8.0%) are the most common fields of study among 11,958 individuals in Summerlin South who have obtained a bachelor's degree or higher.
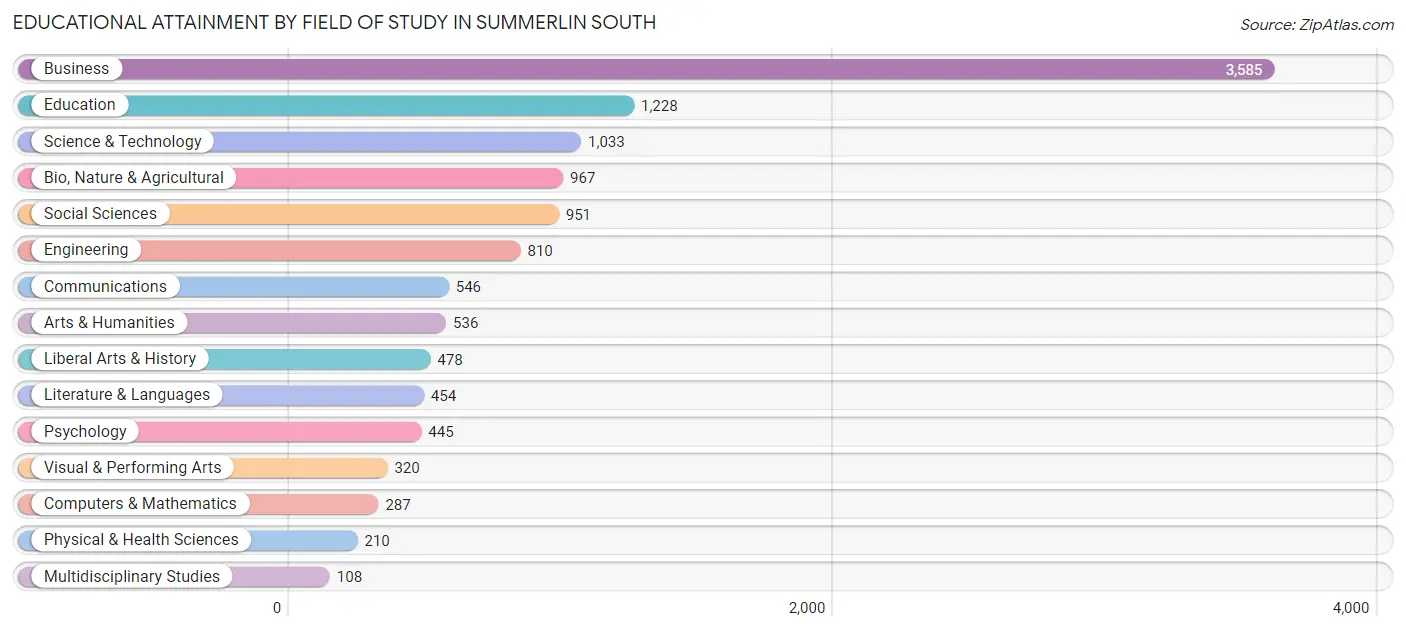
| Field of Study | # Graduates | % Graduates |
| Computers & Mathematics | 287 | 2.4% |
| Bio, Nature & Agricultural | 967 | 8.1% |
| Physical & Health Sciences | 210 | 1.8% |
| Psychology | 445 | 3.7% |
| Social Sciences | 951 | 8.0% |
| Engineering | 810 | 6.8% |
| Multidisciplinary Studies | 108 | 0.9% |
| Science & Technology | 1,033 | 8.6% |
| Business | 3,585 | 30.0% |
| Education | 1,228 | 10.3% |
| Literature & Languages | 454 | 3.8% |
| Liberal Arts & History | 478 | 4.0% |
| Visual & Performing Arts | 320 | 2.7% |
| Communications | 546 | 4.6% |
| Arts & Humanities | 536 | 4.5% |
| Total | 11,958 | 100.0% |
Transportation & Commute in Summerlin South
Vehicle Availability by Sex in Summerlin South
The most prevalent vehicle ownership categories in Summerlin South are males with 2 vehicles (3,855, accounting for 50.4%) and females with 2 vehicles (2,964, making up 61.1%).
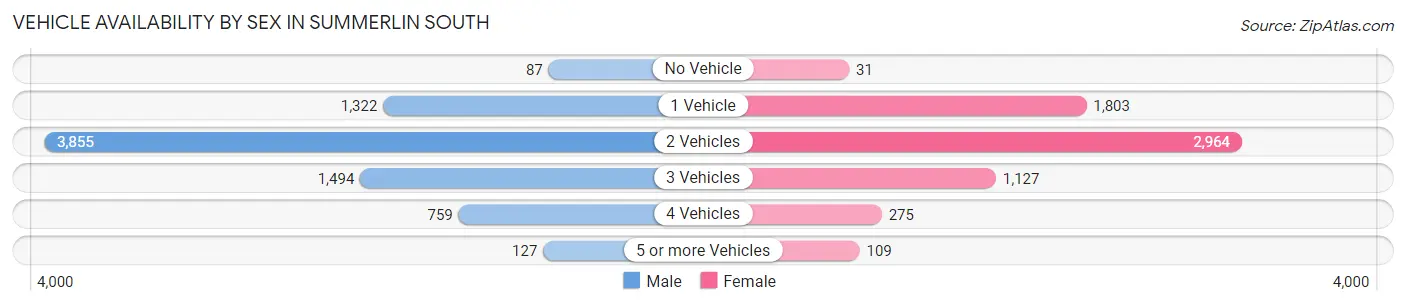
| Vehicles Available | Male | Female |
| No Vehicle | 87 (1.1%) | 31 (0.5%) |
| 1 Vehicle | 1,322 (17.3%) | 1,803 (28.6%) |
| 2 Vehicles | 3,855 (50.4%) | 2,964 (47.0%) |
| 3 Vehicles | 1,494 (19.5%) | 1,127 (17.9%) |
| 4 Vehicles | 759 (9.9%) | 275 (4.4%) |
| 5 or more Vehicles | 127 (1.7%) | 109 (1.7%) |
| Total | 7,644 (100.0%) | 6,309 (100.0%) |
Commute Time in Summerlin South
The most frequently occuring commute durations in Summerlin South are 20 to 24 minutes (2,285 commuters, 19.5%), 15 to 19 minutes (2,281 commuters, 19.5%), and 30 to 34 minutes (2,164 commuters, 18.5%).
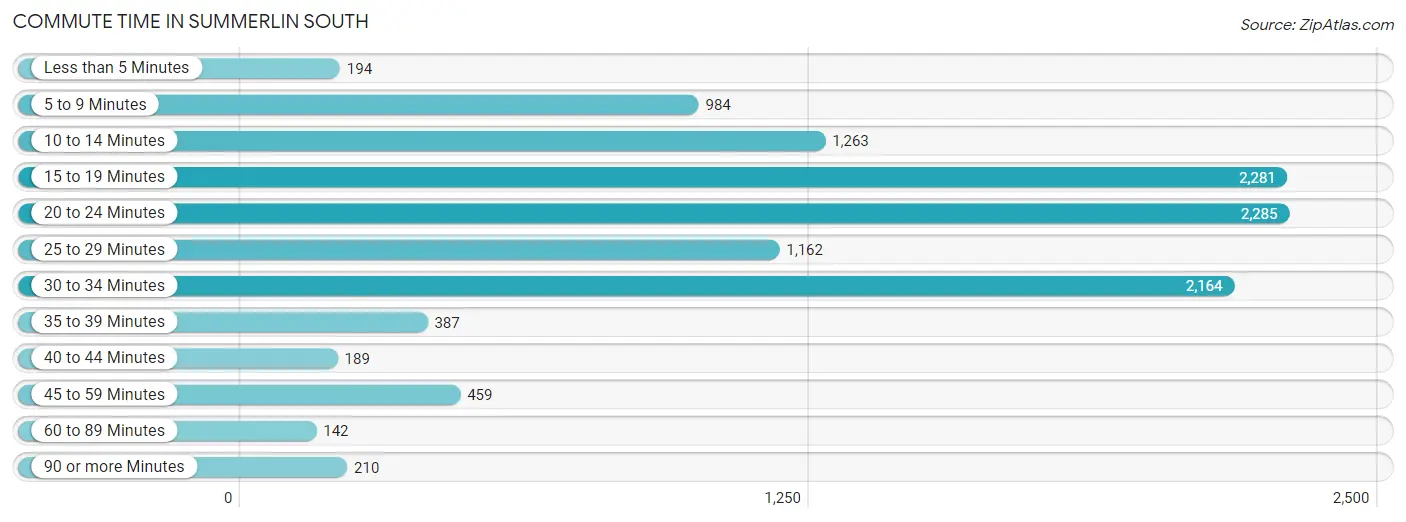
| Commute Time | # Commuters | % Commuters |
| Less than 5 Minutes | 194 | 1.7% |
| 5 to 9 Minutes | 984 | 8.4% |
| 10 to 14 Minutes | 1,263 | 10.8% |
| 15 to 19 Minutes | 2,281 | 19.5% |
| 20 to 24 Minutes | 2,285 | 19.5% |
| 25 to 29 Minutes | 1,162 | 9.9% |
| 30 to 34 Minutes | 2,164 | 18.5% |
| 35 to 39 Minutes | 387 | 3.3% |
| 40 to 44 Minutes | 189 | 1.6% |
| 45 to 59 Minutes | 459 | 3.9% |
| 60 to 89 Minutes | 142 | 1.2% |
| 90 or more Minutes | 210 | 1.8% |
Commute Time by Sex in Summerlin South
The most common commute times in Summerlin South are 20 to 24 minutes (1,286 commuters, 19.6%) for males and 30 to 34 minutes (1,090 commuters, 21.1%) for females.
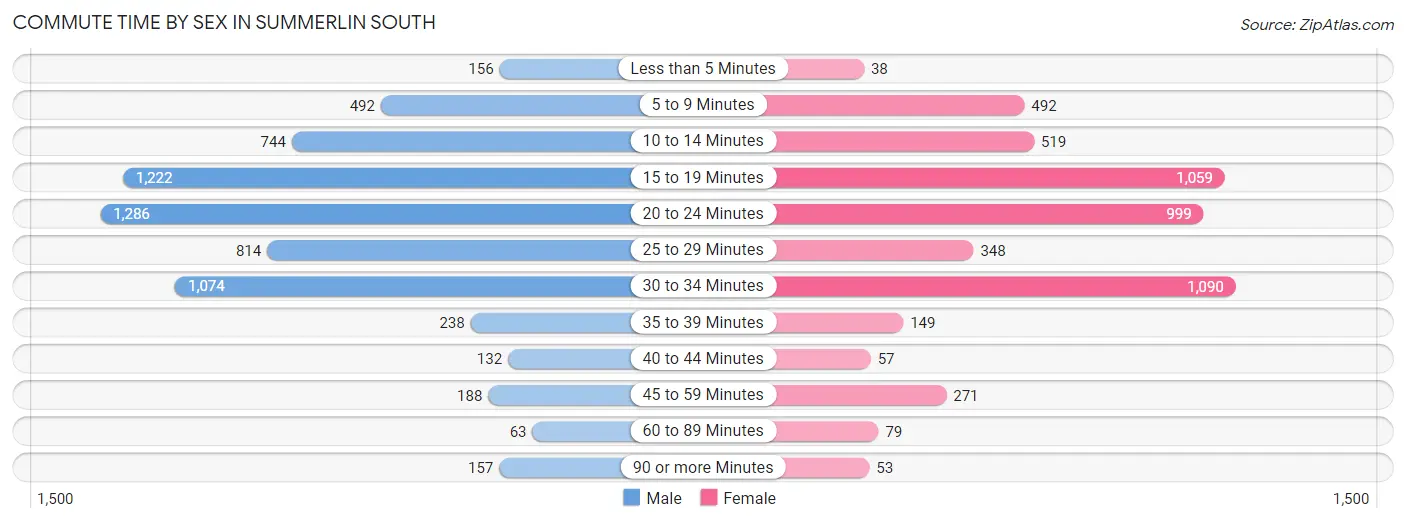
| Commute Time | Male | Female |
| Less than 5 Minutes | 156 (2.4%) | 38 (0.7%) |
| 5 to 9 Minutes | 492 (7.5%) | 492 (9.6%) |
| 10 to 14 Minutes | 744 (11.3%) | 519 (10.1%) |
| 15 to 19 Minutes | 1,222 (18.6%) | 1,059 (20.5%) |
| 20 to 24 Minutes | 1,286 (19.6%) | 999 (19.4%) |
| 25 to 29 Minutes | 814 (12.4%) | 348 (6.8%) |
| 30 to 34 Minutes | 1,074 (16.4%) | 1,090 (21.1%) |
| 35 to 39 Minutes | 238 (3.6%) | 149 (2.9%) |
| 40 to 44 Minutes | 132 (2.0%) | 57 (1.1%) |
| 45 to 59 Minutes | 188 (2.9%) | 271 (5.3%) |
| 60 to 89 Minutes | 63 (1.0%) | 79 (1.5%) |
| 90 or more Minutes | 157 (2.4%) | 53 (1.0%) |
Time of Departure to Work by Sex in Summerlin South
The most frequent times of departure to work in Summerlin South are 7:30 AM to 7:59 AM (1,043, 15.9%) for males and 9:00 AM to 9:59 AM (778, 15.1%) for females.
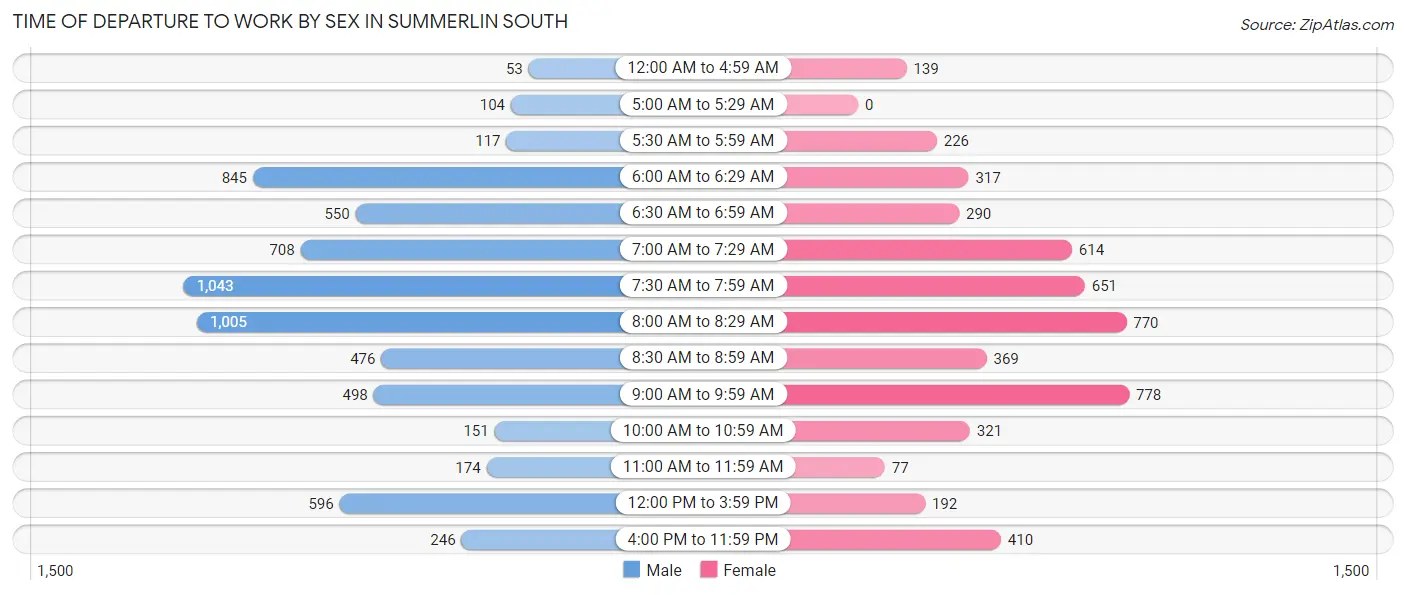
| Time of Departure | Male | Female |
| 12:00 AM to 4:59 AM | 53 (0.8%) | 139 (2.7%) |
| 5:00 AM to 5:29 AM | 104 (1.6%) | 0 (0.0%) |
| 5:30 AM to 5:59 AM | 117 (1.8%) | 226 (4.4%) |
| 6:00 AM to 6:29 AM | 845 (12.9%) | 317 (6.1%) |
| 6:30 AM to 6:59 AM | 550 (8.4%) | 290 (5.6%) |
| 7:00 AM to 7:29 AM | 708 (10.8%) | 614 (11.9%) |
| 7:30 AM to 7:59 AM | 1,043 (15.9%) | 651 (12.6%) |
| 8:00 AM to 8:29 AM | 1,005 (15.3%) | 770 (14.9%) |
| 8:30 AM to 8:59 AM | 476 (7.2%) | 369 (7.2%) |
| 9:00 AM to 9:59 AM | 498 (7.6%) | 778 (15.1%) |
| 10:00 AM to 10:59 AM | 151 (2.3%) | 321 (6.2%) |
| 11:00 AM to 11:59 AM | 174 (2.6%) | 77 (1.5%) |
| 12:00 PM to 3:59 PM | 596 (9.1%) | 192 (3.7%) |
| 4:00 PM to 11:59 PM | 246 (3.7%) | 410 (8.0%) |
| Total | 6,566 (100.0%) | 5,154 (100.0%) |
Housing Occupancy in Summerlin South
Occupancy by Ownership in Summerlin South
Of the total 12,838 dwellings in Summerlin South, owner-occupied units account for 9,277 (72.3%), while renter-occupied units make up 3,561 (27.7%).
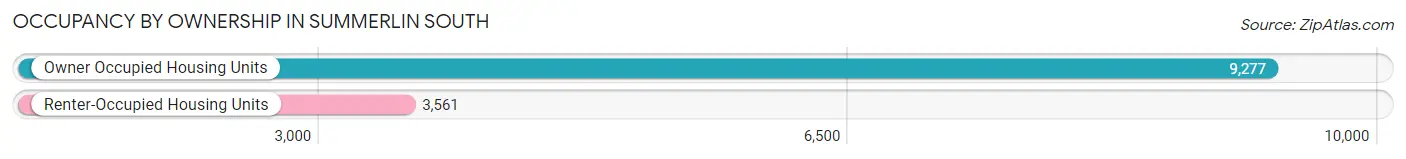
| Occupancy | # Housing Units | % Housing Units |
| Owner Occupied Housing Units | 9,277 | 72.3% |
| Renter-Occupied Housing Units | 3,561 | 27.7% |
| Total Occupied Housing Units | 12,838 | 100.0% |
Occupancy by Household Size in Summerlin South
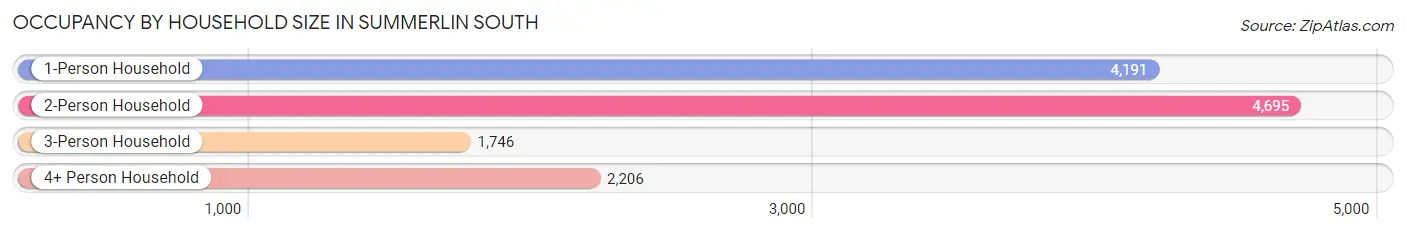
| Household Size | # Housing Units | % Housing Units |
| 1-Person Household | 4,191 | 32.7% |
| 2-Person Household | 4,695 | 36.6% |
| 3-Person Household | 1,746 | 13.6% |
| 4+ Person Household | 2,206 | 17.2% |
| Total Housing Units | 12,838 | 100.0% |
Occupancy by Ownership by Household Size in Summerlin South
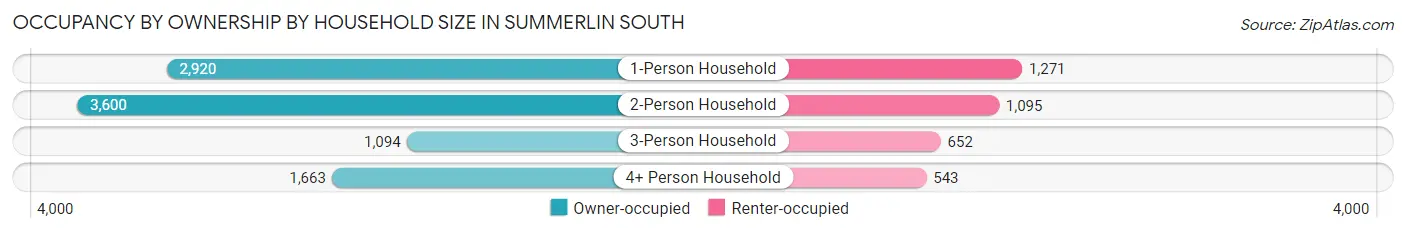
| Household Size | Owner-occupied | Renter-occupied |
| 1-Person Household | 2,920 (69.7%) | 1,271 (30.3%) |
| 2-Person Household | 3,600 (76.7%) | 1,095 (23.3%) |
| 3-Person Household | 1,094 (62.7%) | 652 (37.3%) |
| 4+ Person Household | 1,663 (75.4%) | 543 (24.6%) |
| Total Housing Units | 9,277 (72.3%) | 3,561 (27.7%) |
Occupancy by Educational Attainment in Summerlin South
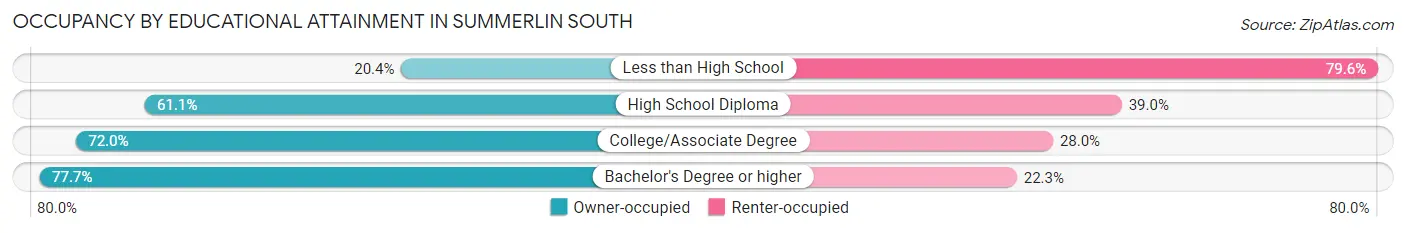
| Household Size | Owner-occupied | Renter-occupied |
| Less than High School | 80 (20.4%) | 312 (79.6%) |
| High School Diploma | 1,000 (61.1%) | 638 (39.0%) |
| College/Associate Degree | 2,507 (72.0%) | 977 (28.0%) |
| Bachelor's Degree or higher | 5,690 (77.7%) | 1,634 (22.3%) |
Occupancy by Age of Householder in Summerlin South
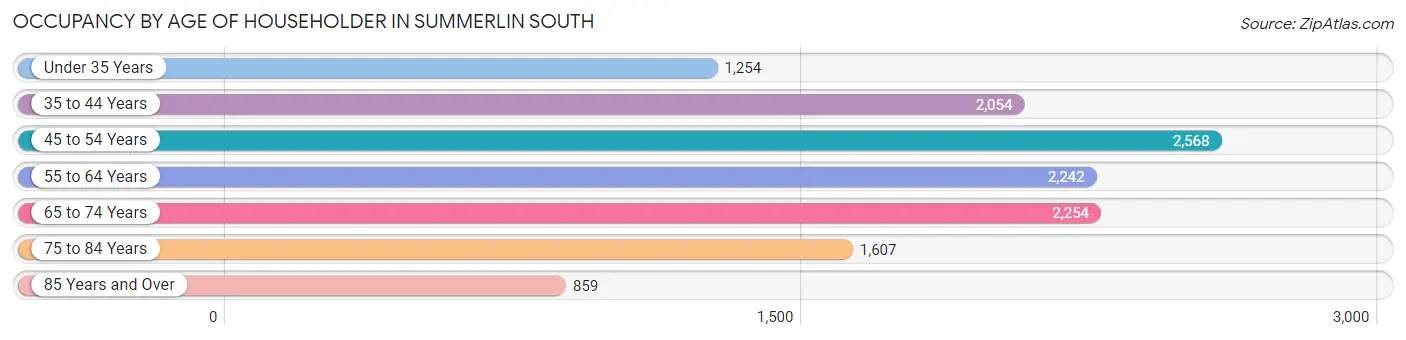
| Age Bracket | # Households | % Households |
| Under 35 Years | 1,254 | 9.8% |
| 35 to 44 Years | 2,054 | 16.0% |
| 45 to 54 Years | 2,568 | 20.0% |
| 55 to 64 Years | 2,242 | 17.5% |
| 65 to 74 Years | 2,254 | 17.6% |
| 75 to 84 Years | 1,607 | 12.5% |
| 85 Years and Over | 859 | 6.7% |
| Total | 12,838 | 100.0% |
Housing Finances in Summerlin South
Median Income by Occupancy in Summerlin South
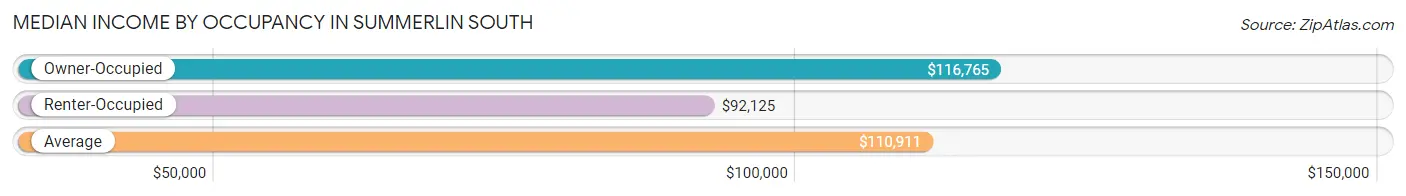
| Occupancy Type | # Households | Median Income |
| Owner-Occupied | 9,277 (72.3%) | $116,765 |
| Renter-Occupied | 3,561 (27.7%) | $92,125 |
| Average | 12,838 (100.0%) | $110,911 |
Occupancy by Householder Income Bracket in Summerlin South
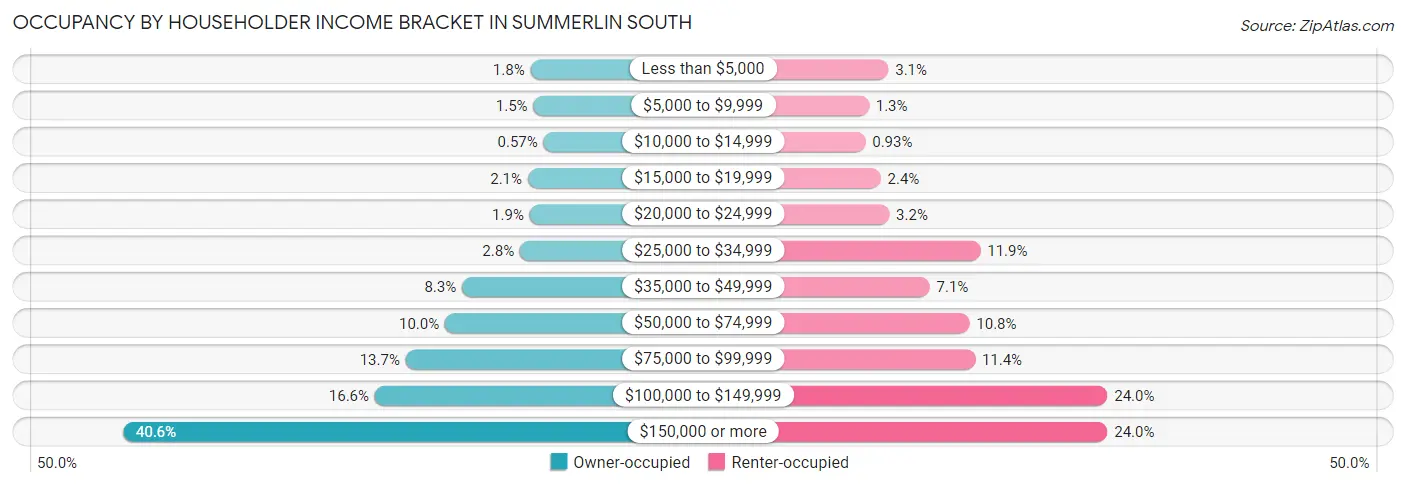
| Income Bracket | Owner-occupied | Renter-occupied |
| Less than $5,000 | 169 (1.8%) | 111 (3.1%) |
| $5,000 to $9,999 | 143 (1.5%) | 45 (1.3%) |
| $10,000 to $14,999 | 53 (0.6%) | 33 (0.9%) |
| $15,000 to $19,999 | 192 (2.1%) | 85 (2.4%) |
| $20,000 to $24,999 | 175 (1.9%) | 114 (3.2%) |
| $25,000 to $34,999 | 262 (2.8%) | 423 (11.9%) |
| $35,000 to $49,999 | 774 (8.3%) | 251 (7.0%) |
| $50,000 to $74,999 | 924 (10.0%) | 386 (10.8%) |
| $75,000 to $99,999 | 1,271 (13.7%) | 405 (11.4%) |
| $100,000 to $149,999 | 1,544 (16.6%) | 854 (24.0%) |
| $150,000 or more | 3,770 (40.6%) | 854 (24.0%) |
| Total | 9,277 (100.0%) | 3,561 (100.0%) |
Monthly Housing Cost Tiers in Summerlin South
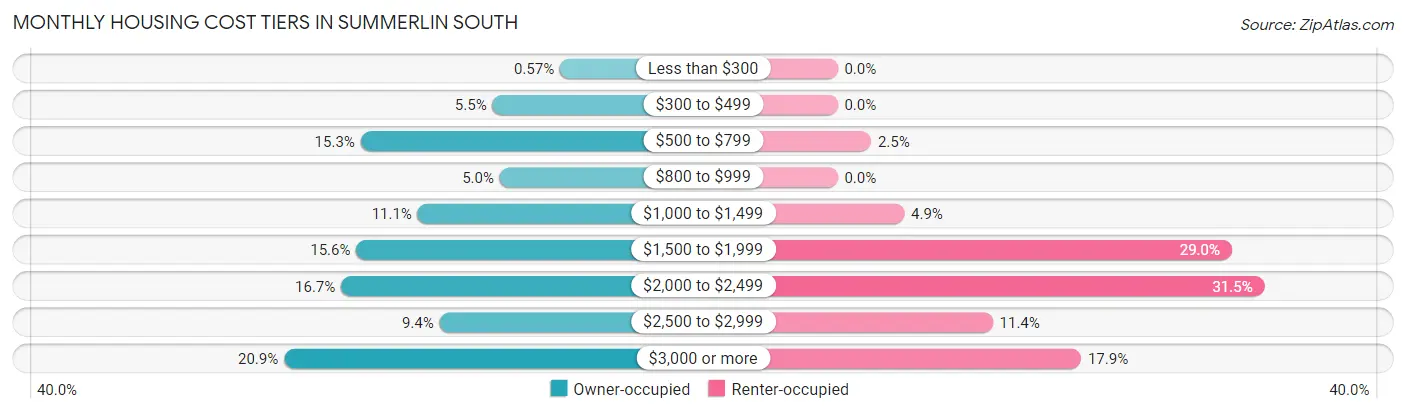
| Monthly Cost | Owner-occupied | Renter-occupied |
| Less than $300 | 53 (0.6%) | 0 (0.0%) |
| $300 to $499 | 514 (5.5%) | 0 (0.0%) |
| $500 to $799 | 1,415 (15.2%) | 88 (2.5%) |
| $800 to $999 | 464 (5.0%) | 0 (0.0%) |
| $1,000 to $1,499 | 1,025 (11.1%) | 175 (4.9%) |
| $1,500 to $1,999 | 1,444 (15.6%) | 1,034 (29.0%) |
| $2,000 to $2,499 | 1,548 (16.7%) | 1,120 (31.5%) |
| $2,500 to $2,999 | 876 (9.4%) | 407 (11.4%) |
| $3,000 or more | 1,938 (20.9%) | 639 (17.9%) |
| Total | 9,277 (100.0%) | 3,561 (100.0%) |
Physical Housing Characteristics in Summerlin South
Housing Structures in Summerlin South
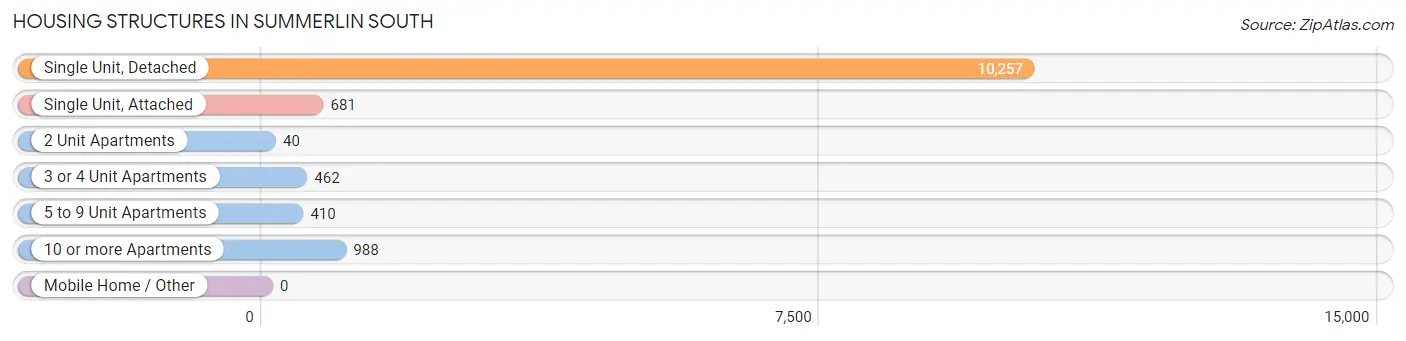
| Structure Type | # Housing Units | % Housing Units |
| Single Unit, Detached | 10,257 | 79.9% |
| Single Unit, Attached | 681 | 5.3% |
| 2 Unit Apartments | 40 | 0.3% |
| 3 or 4 Unit Apartments | 462 | 3.6% |
| 5 to 9 Unit Apartments | 410 | 3.2% |
| 10 or more Apartments | 988 | 7.7% |
| Mobile Home / Other | 0 | 0.0% |
| Total | 12,838 | 100.0% |
Housing Structures by Occupancy in Summerlin South
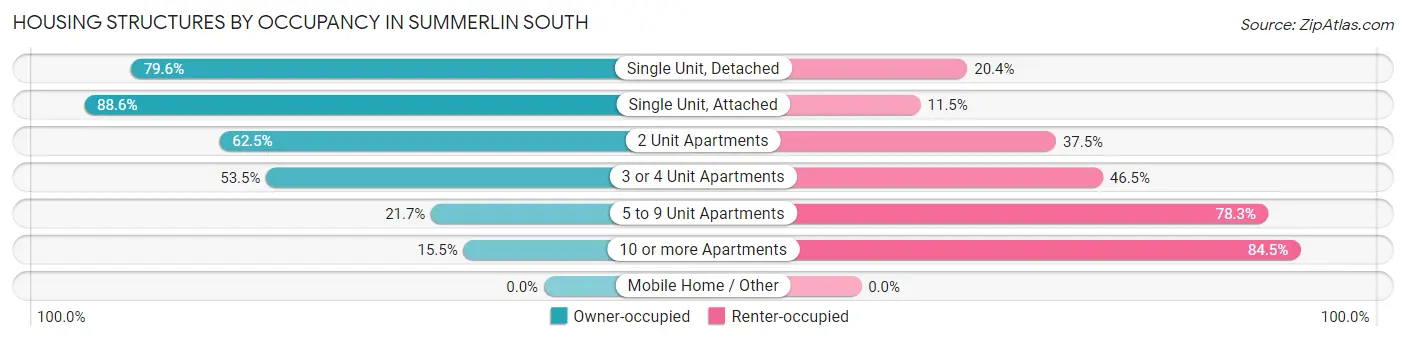
| Structure Type | Owner-occupied | Renter-occupied |
| Single Unit, Detached | 8,160 (79.6%) | 2,097 (20.4%) |
| Single Unit, Attached | 603 (88.5%) | 78 (11.5%) |
| 2 Unit Apartments | 25 (62.5%) | 15 (37.5%) |
| 3 or 4 Unit Apartments | 247 (53.5%) | 215 (46.5%) |
| 5 to 9 Unit Apartments | 89 (21.7%) | 321 (78.3%) |
| 10 or more Apartments | 153 (15.5%) | 835 (84.5%) |
| Mobile Home / Other | 0 (0.0%) | 0 (0.0%) |
| Total | 9,277 (72.3%) | 3,561 (27.7%) |
Housing Structures by Number of Rooms in Summerlin South
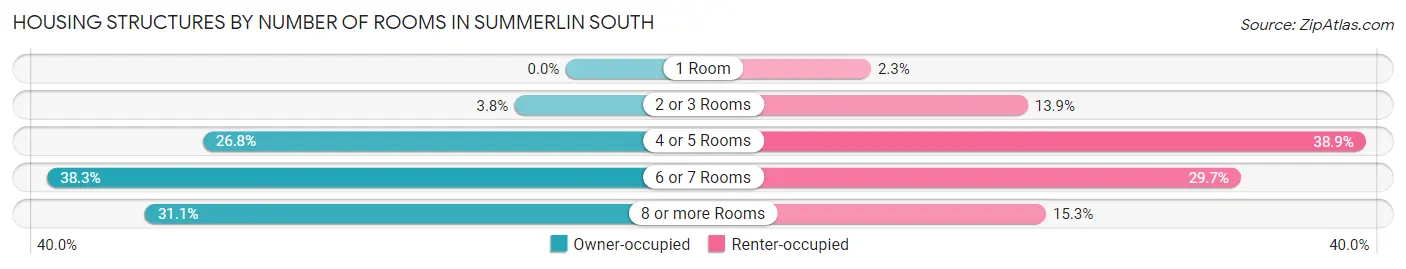
| Number of Rooms | Owner-occupied | Renter-occupied |
| 1 Room | 0 (0.0%) | 82 (2.3%) |
| 2 or 3 Rooms | 351 (3.8%) | 495 (13.9%) |
| 4 or 5 Rooms | 2,487 (26.8%) | 1,385 (38.9%) |
| 6 or 7 Rooms | 3,555 (38.3%) | 1,056 (29.6%) |
| 8 or more Rooms | 2,884 (31.1%) | 543 (15.2%) |
| Total | 9,277 (100.0%) | 3,561 (100.0%) |
Housing Structure by Heating Type in Summerlin South
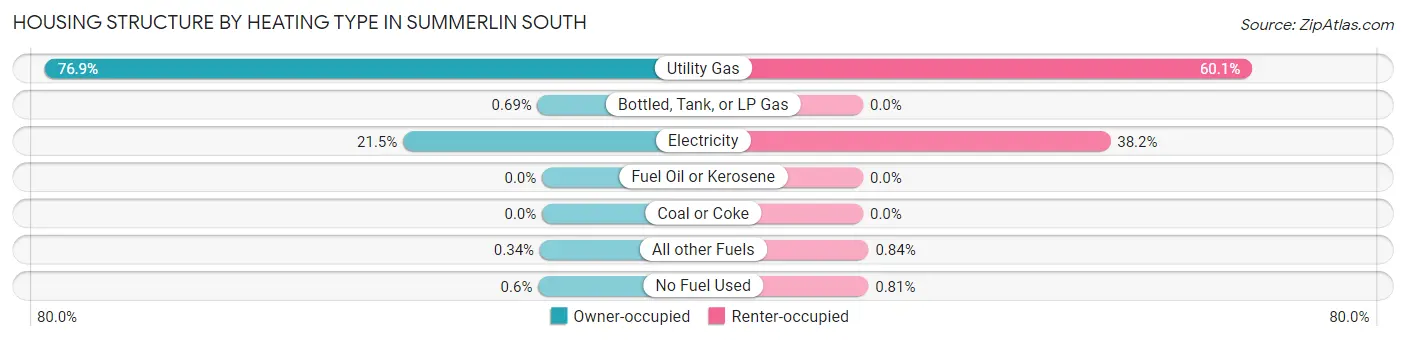
| Heating Type | Owner-occupied | Renter-occupied |
| Utility Gas | 7,131 (76.9%) | 2,141 (60.1%) |
| Bottled, Tank, or LP Gas | 64 (0.7%) | 0 (0.0%) |
| Electricity | 1,994 (21.5%) | 1,361 (38.2%) |
| Fuel Oil or Kerosene | 0 (0.0%) | 0 (0.0%) |
| Coal or Coke | 0 (0.0%) | 0 (0.0%) |
| All other Fuels | 32 (0.3%) | 30 (0.8%) |
| No Fuel Used | 56 (0.6%) | 29 (0.8%) |
| Total | 9,277 (100.0%) | 3,561 (100.0%) |
Household Vehicle Usage in Summerlin South
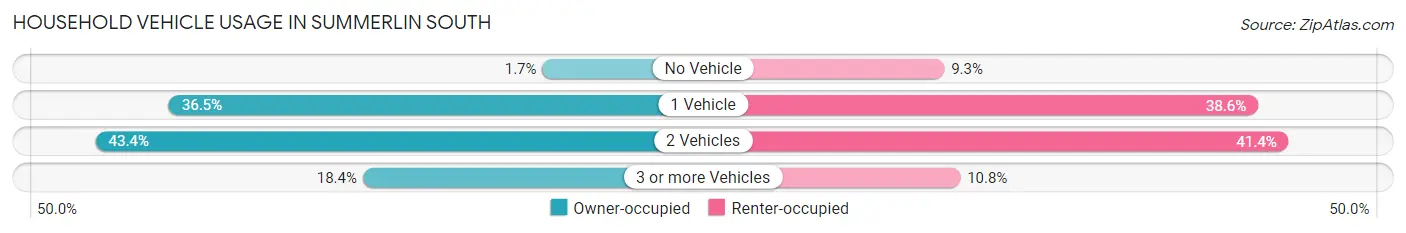
| Vehicles per Household | Owner-occupied | Renter-occupied |
| No Vehicle | 155 (1.7%) | 330 (9.3%) |
| 1 Vehicle | 3,389 (36.5%) | 1,373 (38.6%) |
| 2 Vehicles | 4,023 (43.4%) | 1,475 (41.4%) |
| 3 or more Vehicles | 1,710 (18.4%) | 383 (10.8%) |
| Total | 9,277 (100.0%) | 3,561 (100.0%) |
Real Estate & Mortgages in Summerlin South
Real Estate and Mortgage Overview in Summerlin South
| Characteristic | Without Mortgage | With Mortgage |
| Housing Units | 3,188 | 6,089 |
| Median Property Value | $634,300 | $577,200 |
| Median Household Income | $88,235 | $2,869 |
| Monthly Housing Costs | $676 | $1,898 |
| Real Estate Taxes | $3,796 | $77 |
Property Value by Mortgage Status in Summerlin South
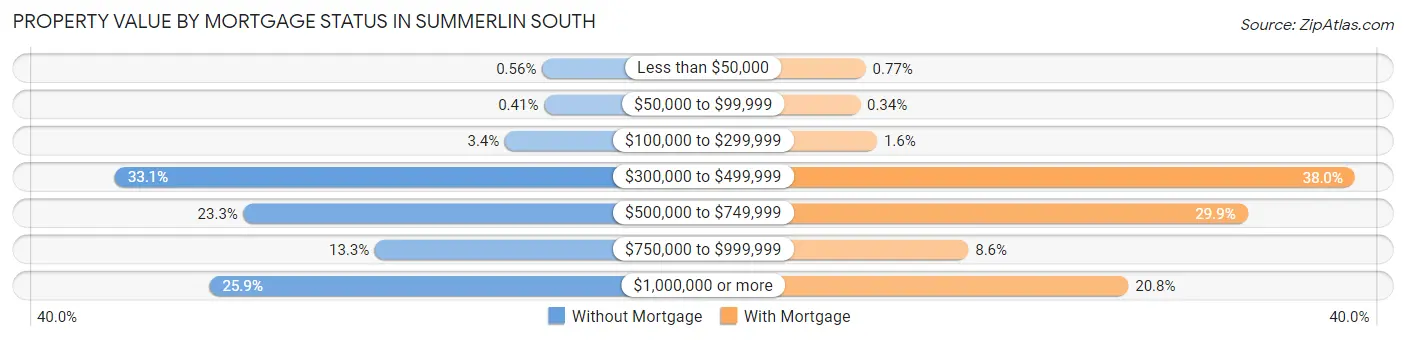
| Property Value | Without Mortgage | With Mortgage |
| Less than $50,000 | 18 (0.6%) | 47 (0.8%) |
| $50,000 to $99,999 | 13 (0.4%) | 21 (0.3%) |
| $100,000 to $299,999 | 108 (3.4%) | 99 (1.6%) |
| $300,000 to $499,999 | 1,056 (33.1%) | 2,316 (38.0%) |
| $500,000 to $749,999 | 743 (23.3%) | 1,818 (29.9%) |
| $750,000 to $999,999 | 424 (13.3%) | 523 (8.6%) |
| $1,000,000 or more | 826 (25.9%) | 1,265 (20.8%) |
| Total | 3,188 (100.0%) | 6,089 (100.0%) |
Household Income by Mortgage Status in Summerlin South
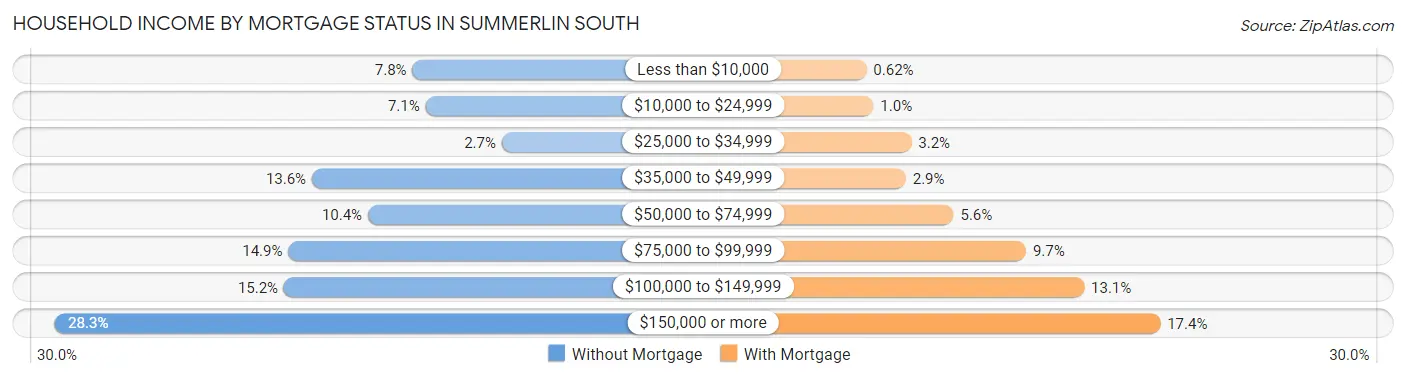
| Household Income | Without Mortgage | With Mortgage |
| Less than $10,000 | 250 (7.8%) | 38 (0.6%) |
| $10,000 to $24,999 | 226 (7.1%) | 62 (1.0%) |
| $25,000 to $34,999 | 87 (2.7%) | 194 (3.2%) |
| $35,000 to $49,999 | 433 (13.6%) | 175 (2.9%) |
| $50,000 to $74,999 | 331 (10.4%) | 341 (5.6%) |
| $75,000 to $99,999 | 476 (14.9%) | 593 (9.7%) |
| $100,000 to $149,999 | 484 (15.2%) | 795 (13.1%) |
| $150,000 or more | 901 (28.3%) | 1,060 (17.4%) |
| Total | 3,188 (100.0%) | 6,089 (100.0%) |
Property Value to Household Income Ratio in Summerlin South
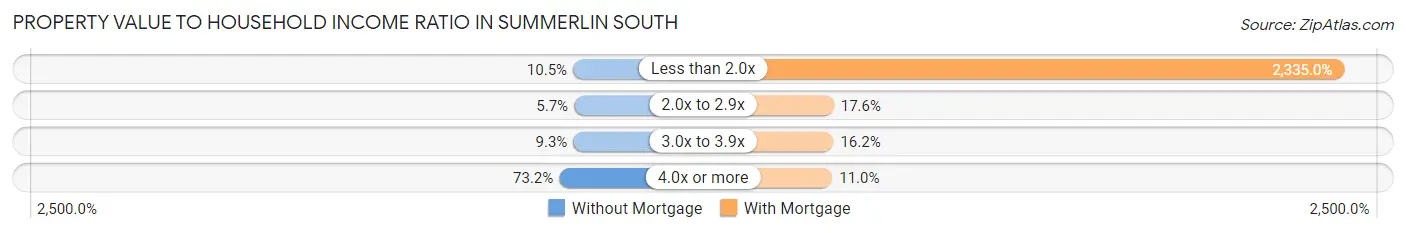
| Value-to-Income Ratio | Without Mortgage | With Mortgage |
| Less than 2.0x | 335 (10.5%) | 142,179 (2,335.0%) |
| 2.0x to 2.9x | 183 (5.7%) | 1,070 (17.6%) |
| 3.0x to 3.9x | 296 (9.3%) | 986 (16.2%) |
| 4.0x or more | 2,335 (73.2%) | 667 (11.0%) |
| Total | 3,188 (100.0%) | 6,089 (100.0%) |
Real Estate Taxes by Mortgage Status in Summerlin South
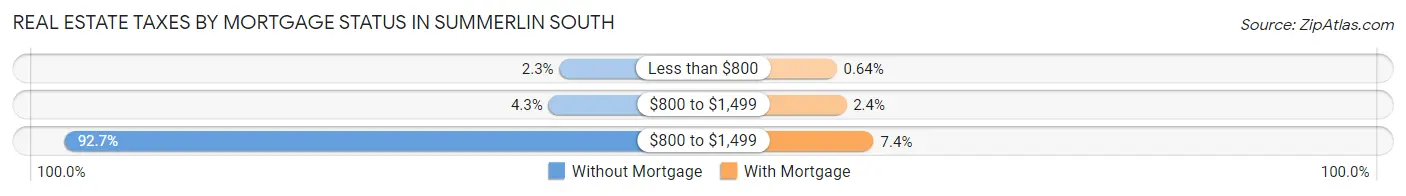
| Property Taxes | Without Mortgage | With Mortgage |
| Less than $800 | 74 (2.3%) | 39 (0.6%) |
| $800 to $1,499 | 137 (4.3%) | 147 (2.4%) |
| $800 to $1,499 | 2,954 (92.7%) | 452 (7.4%) |
| Total | 3,188 (100.0%) | 6,089 (100.0%) |
Health & Disability in Summerlin South
Health Insurance Coverage by Age in Summerlin South

| Age Bracket | With Coverage | Without Coverage |
| Under 6 Years | 1,743 (95.6%) | 80 (4.4%) |
| 6 to 18 Years | 3,810 (93.4%) | 268 (6.6%) |
| 19 to 25 Years | 1,525 (94.8%) | 84 (5.2%) |
| 26 to 34 Years | 2,191 (91.9%) | 194 (8.1%) |
| 35 to 44 Years | 3,718 (88.8%) | 468 (11.2%) |
| 45 to 54 Years | 4,032 (96.1%) | 164 (3.9%) |
| 55 to 64 Years | 3,454 (94.4%) | 205 (5.6%) |
| 65 to 74 Years | 3,812 (98.4%) | 61 (1.6%) |
| 75 Years and older | 3,843 (99.6%) | 14 (0.4%) |
| Total | 28,128 (94.8%) | 1,538 (5.2%) |
Health Insurance Coverage by Citizenship Status in Summerlin South
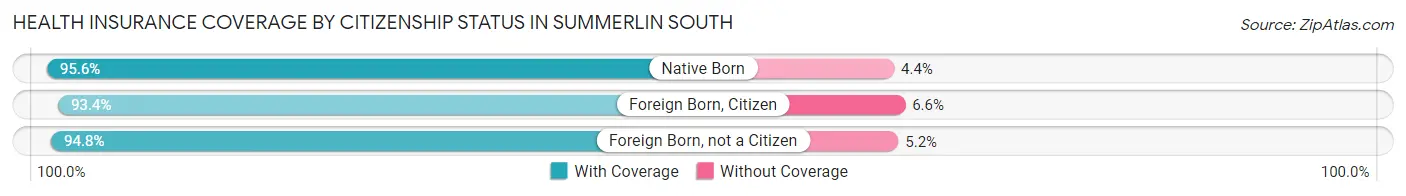
| Citizenship Status | With Coverage | Without Coverage |
| Native Born | 1,743 (95.6%) | 80 (4.4%) |
| Foreign Born, Citizen | 3,810 (93.4%) | 268 (6.6%) |
| Foreign Born, not a Citizen | 1,525 (94.8%) | 84 (5.2%) |
Health Insurance Coverage by Household Income in Summerlin South
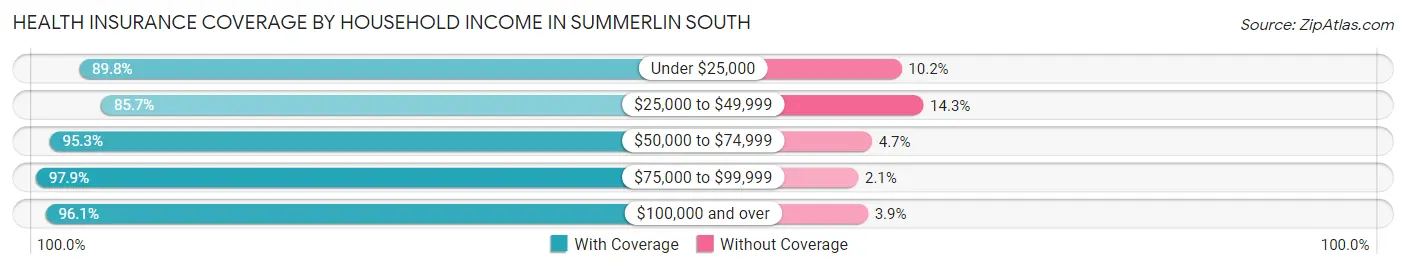
| Household Income | With Coverage | Without Coverage |
| Under $25,000 | 1,606 (89.8%) | 183 (10.2%) |
| $25,000 to $49,999 | 2,563 (85.7%) | 428 (14.3%) |
| $50,000 to $74,999 | 2,749 (95.3%) | 135 (4.7%) |
| $75,000 to $99,999 | 3,848 (97.9%) | 83 (2.1%) |
| $100,000 and over | 17,362 (96.1%) | 709 (3.9%) |
Public vs Private Health Insurance Coverage by Age in Summerlin South
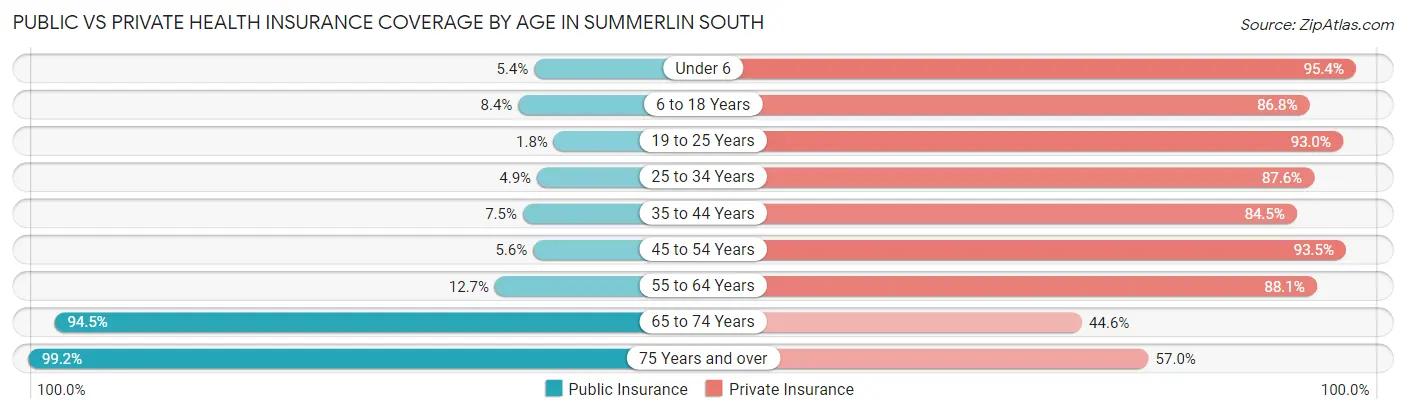
| Age Bracket | Public Insurance | Private Insurance |
| Under 6 | 99 (5.4%) | 1,739 (95.4%) |
| 6 to 18 Years | 342 (8.4%) | 3,538 (86.8%) |
| 19 to 25 Years | 29 (1.8%) | 1,496 (93.0%) |
| 25 to 34 Years | 117 (4.9%) | 2,090 (87.6%) |
| 35 to 44 Years | 315 (7.5%) | 3,535 (84.5%) |
| 45 to 54 Years | 236 (5.6%) | 3,925 (93.5%) |
| 55 to 64 Years | 465 (12.7%) | 3,224 (88.1%) |
| 65 to 74 Years | 3,658 (94.5%) | 1,728 (44.6%) |
| 75 Years and over | 3,826 (99.2%) | 2,197 (57.0%) |
| Total | 9,087 (30.6%) | 23,472 (79.1%) |
Disability Status by Sex by Age in Summerlin South
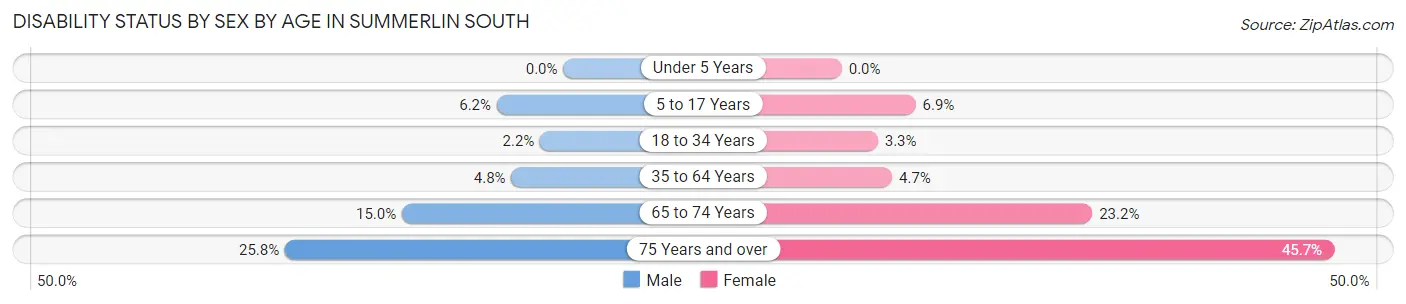
| Age Bracket | Male | Female |
| Under 5 Years | 0 (0.0%) | 0 (0.0%) |
| 5 to 17 Years | 144 (6.2%) | 126 (6.9%) |
| 18 to 34 Years | 52 (2.1%) | 63 (3.3%) |
| 35 to 64 Years | 299 (4.8%) | 273 (4.7%) |
| 65 to 74 Years | 241 (15.0%) | 526 (23.2%) |
| 75 Years and over | 442 (25.8%) | 980 (45.7%) |
Disability Class by Sex by Age in Summerlin South
Disability Class: Hearing Difficulty
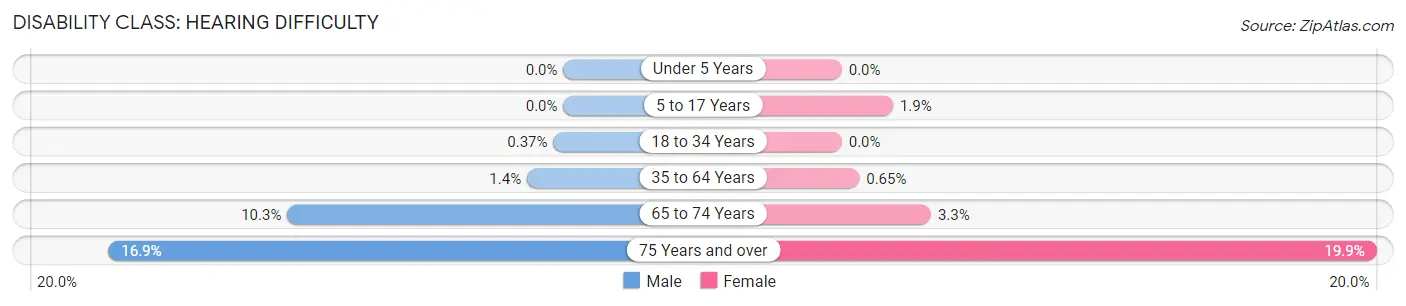
| Age Bracket | Male | Female |
| Under 5 Years | 0 (0.0%) | 0 (0.0%) |
| 5 to 17 Years | 0 (0.0%) | 35 (1.9%) |
| 18 to 34 Years | 9 (0.4%) | 0 (0.0%) |
| 35 to 64 Years | 84 (1.3%) | 38 (0.6%) |
| 65 to 74 Years | 165 (10.2%) | 75 (3.3%) |
| 75 Years and over | 289 (16.9%) | 426 (19.9%) |
Disability Class: Vision Difficulty
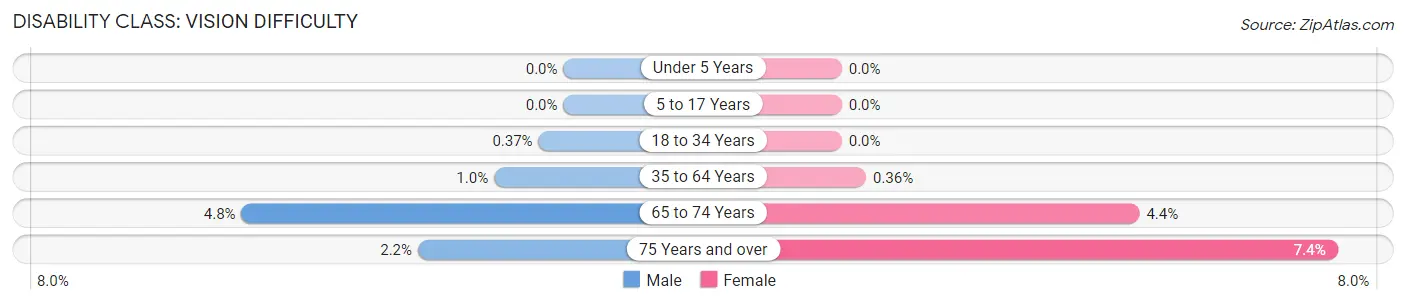
| Age Bracket | Male | Female |
| Under 5 Years | 0 (0.0%) | 0 (0.0%) |
| 5 to 17 Years | 0 (0.0%) | 0 (0.0%) |
| 18 to 34 Years | 9 (0.4%) | 0 (0.0%) |
| 35 to 64 Years | 64 (1.0%) | 21 (0.4%) |
| 65 to 74 Years | 77 (4.8%) | 100 (4.4%) |
| 75 Years and over | 37 (2.2%) | 158 (7.4%) |
Disability Class: Cognitive Difficulty
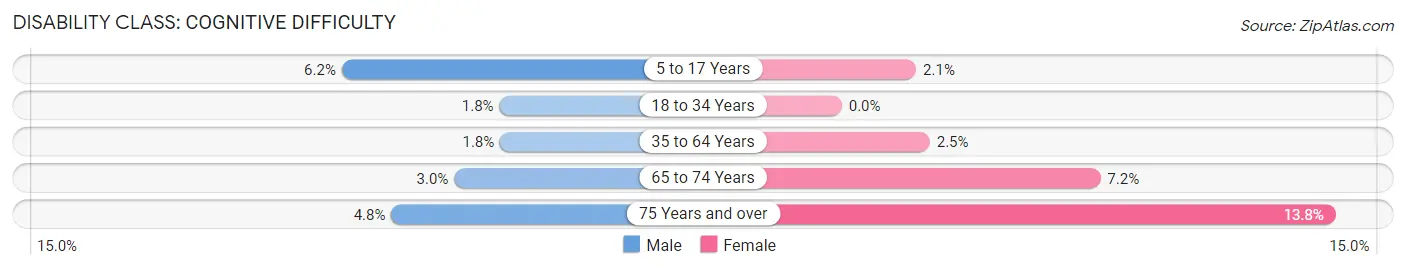
| Age Bracket | Male | Female |
| 5 to 17 Years | 144 (6.2%) | 38 (2.1%) |
| 18 to 34 Years | 43 (1.8%) | 0 (0.0%) |
| 35 to 64 Years | 109 (1.8%) | 143 (2.5%) |
| 65 to 74 Years | 49 (3.0%) | 163 (7.2%) |
| 75 Years and over | 82 (4.8%) | 295 (13.8%) |
Disability Class: Ambulatory Difficulty
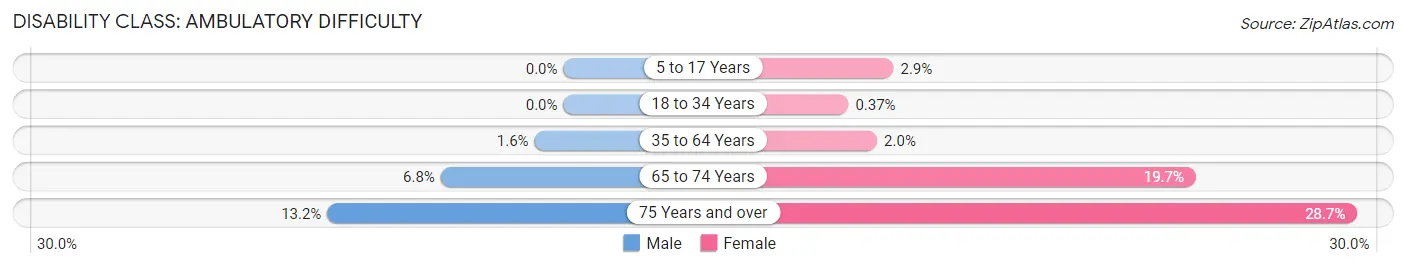
| Age Bracket | Male | Female |
| 5 to 17 Years | 0 (0.0%) | 53 (2.9%) |
| 18 to 34 Years | 0 (0.0%) | 7 (0.4%) |
| 35 to 64 Years | 100 (1.6%) | 115 (2.0%) |
| 65 to 74 Years | 110 (6.8%) | 446 (19.7%) |
| 75 Years and over | 225 (13.2%) | 616 (28.7%) |
Disability Class: Self-Care Difficulty
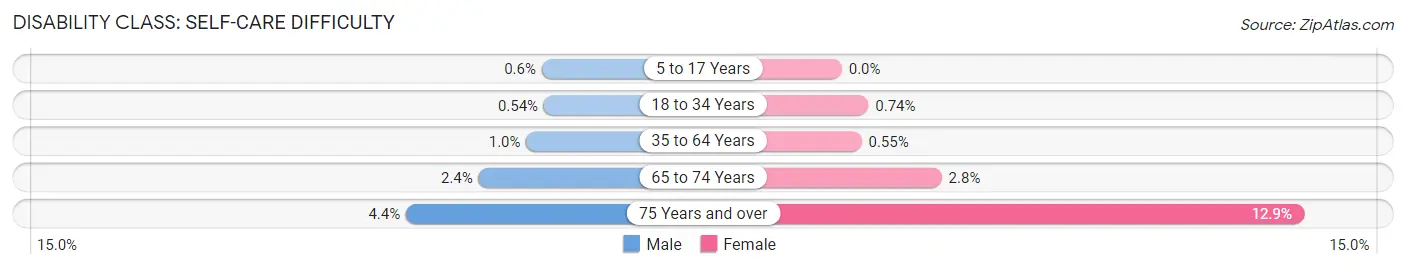
| Age Bracket | Male | Female |
| 5 to 17 Years | 14 (0.6%) | 0 (0.0%) |
| 18 to 34 Years | 13 (0.5%) | 14 (0.7%) |
| 35 to 64 Years | 64 (1.0%) | 32 (0.5%) |
| 65 to 74 Years | 38 (2.4%) | 63 (2.8%) |
| 75 Years and over | 75 (4.4%) | 276 (12.9%) |
Technology Access in Summerlin South
Computing Device Access in Summerlin South
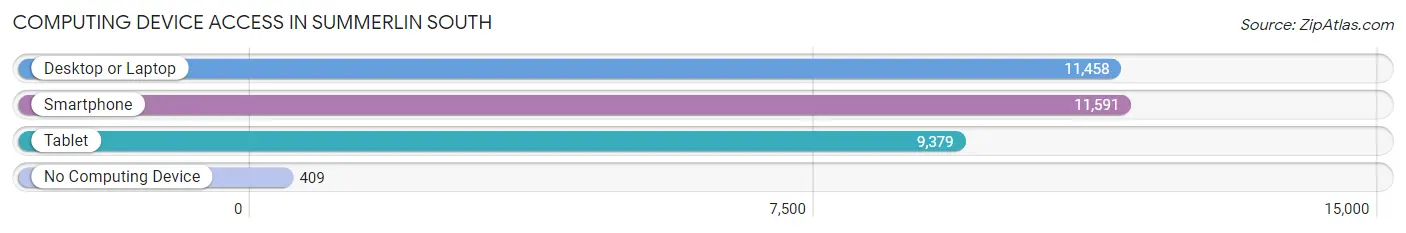
| Device Type | # Households | % Households |
| Desktop or Laptop | 11,458 | 89.2% |
| Smartphone | 11,591 | 90.3% |
| Tablet | 9,379 | 73.1% |
| No Computing Device | 409 | 3.2% |
| Total | 12,838 | 100.0% |
Internet Access in Summerlin South
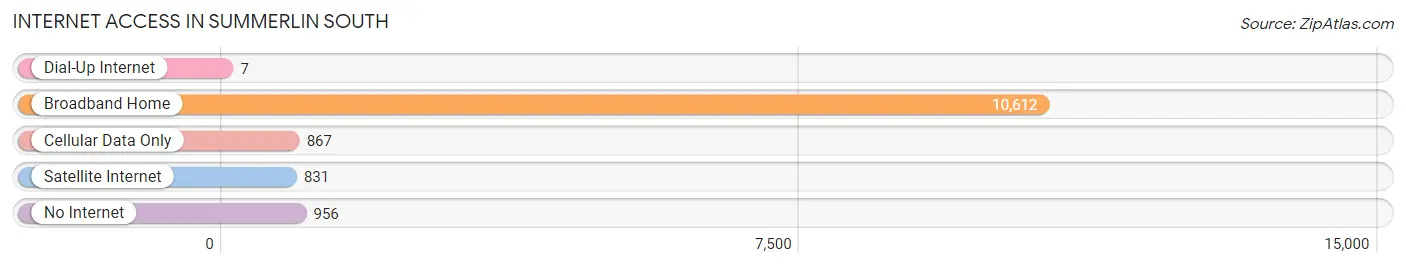
| Internet Type | # Households | % Households |
| Dial-Up Internet | 7 | 0.1% |
| Broadband Home | 10,612 | 82.7% |
| Cellular Data Only | 867 | 6.8% |
| Satellite Internet | 831 | 6.5% |
| No Internet | 956 | 7.4% |
| Total | 12,838 | 100.0% |
Summerlin South Summary
Introduction
Summerlin South is a census-designated place (CDP) located in Clark County, Nevada. It is a part of the Las Vegas metropolitan area and is located in the western part of the state. The population of Summerlin South was 24,085 at the 2010 census. It is one of the fastest growing areas in the state and is home to many businesses and residential developments.
History
Summerlin South was first established in 1990 as a master-planned community. It was developed by the Howard Hughes Corporation and is named after the late aviator and businessman Howard Hughes. The area was originally planned to be a retirement community, but it has since become a popular residential area for families and young professionals.
The area was originally part of the Las Vegas Valley, but it was annexed by Clark County in 1996. Since then, the area has seen rapid growth and development. The population of Summerlin South has grown from just over 4,000 in 2000 to over 24,000 in 2010.
Geography
Summerlin South is located in the western part of Clark County, Nevada. It is bordered by the Las Vegas Valley to the east, the Spring Mountains to the west, and the Red Rock Canyon National Conservation Area to the south. The area is located at an elevation of 2,400 feet (731 m) above sea level.
The climate in Summerlin South is arid and hot, with temperatures ranging from the mid-90s in the summer to the mid-50s in the winter. The area receives an average of 4.5 inches (11.4 cm) of precipitation per year.
Economy
Summerlin South is home to a variety of businesses and industries. The area is home to several large employers, including the Howard Hughes Corporation, the Las Vegas Sands Corporation, and the University of Nevada, Las Vegas. The area is also home to several retail stores, restaurants, and other businesses.
The area is also home to several residential developments, including the Summerlin master-planned community. The area is also home to several golf courses, parks, and other recreational facilities.
Demographics
As of the 2010 census, the population of Summerlin South was 24,085. The racial makeup of the area was 79.3% White, 8.2% African American, 0.7% Native American, 4.2% Asian, 0.2% Pacific Islander, and 6.6% from other races. Hispanic or Latino of any race were 16.3% of the population.
The median household income in Summerlin South was $76,945, and the median family income was $86,945. The per capita income for the area was $35,945.
Conclusion
Summerlin South is a rapidly growing area in Clark County, Nevada. It is home to many businesses and residential developments, and is a popular area for families and young professionals. The area has a diverse population and a strong economy, and is a great place to live and work.
Common Questions
What is Per Capita Income in Summerlin South?
Per Capita income in Summerlin South is $74,995.
What is the Median Family Income in Summerlin South?
Median Family Income in Summerlin South is $138,264.
What is the Median Household income in Summerlin South?
Median Household Income in Summerlin South is $110,911.
What is Income or Wage Gap in Summerlin South?
Income or Wage Gap in Summerlin South is 9.6%.
Women in Summerlin South earn 90.4 cents for every dollar earned by a man.
What is Inequality or Gini Index in Summerlin South?
Inequality or Gini Index in Summerlin South is 0.51.
What is the Total Population of Summerlin South?
Total Population of Summerlin South is 29,724.
What is the Total Male Population of Summerlin South?
Total Male Population of Summerlin South is 15,100.
What is the Total Female Population of Summerlin South?
Total Female Population of Summerlin South is 14,624.
What is the Ratio of Males per 100 Females in Summerlin South?
There are 103.25 Males per 100 Females in Summerlin South.
What is the Ratio of Females per 100 Males in Summerlin South?
There are 96.85 Females per 100 Males in Summerlin South.
What is the Median Population Age in Summerlin South?
Median Population Age in Summerlin South is 46.7 Years.
What is the Average Family Size in Summerlin South
Average Family Size in Summerlin South is 2.9 People.
What is the Average Household Size in Summerlin South
Average Household Size in Summerlin South is 2.3 People.
How Large is the Labor Force in Summerlin South?
There are 14,590 People in the Labor Forcein in Summerlin South.
What is the Percentage of People in the Labor Force in Summerlin South?
59.0% of People are in the Labor Force in Summerlin South.
What is the Unemployment Rate in Summerlin South?
Unemployment Rate in Summerlin South is 3.3%.