Bismarck, ND Map & Demographics
Bismarck Map
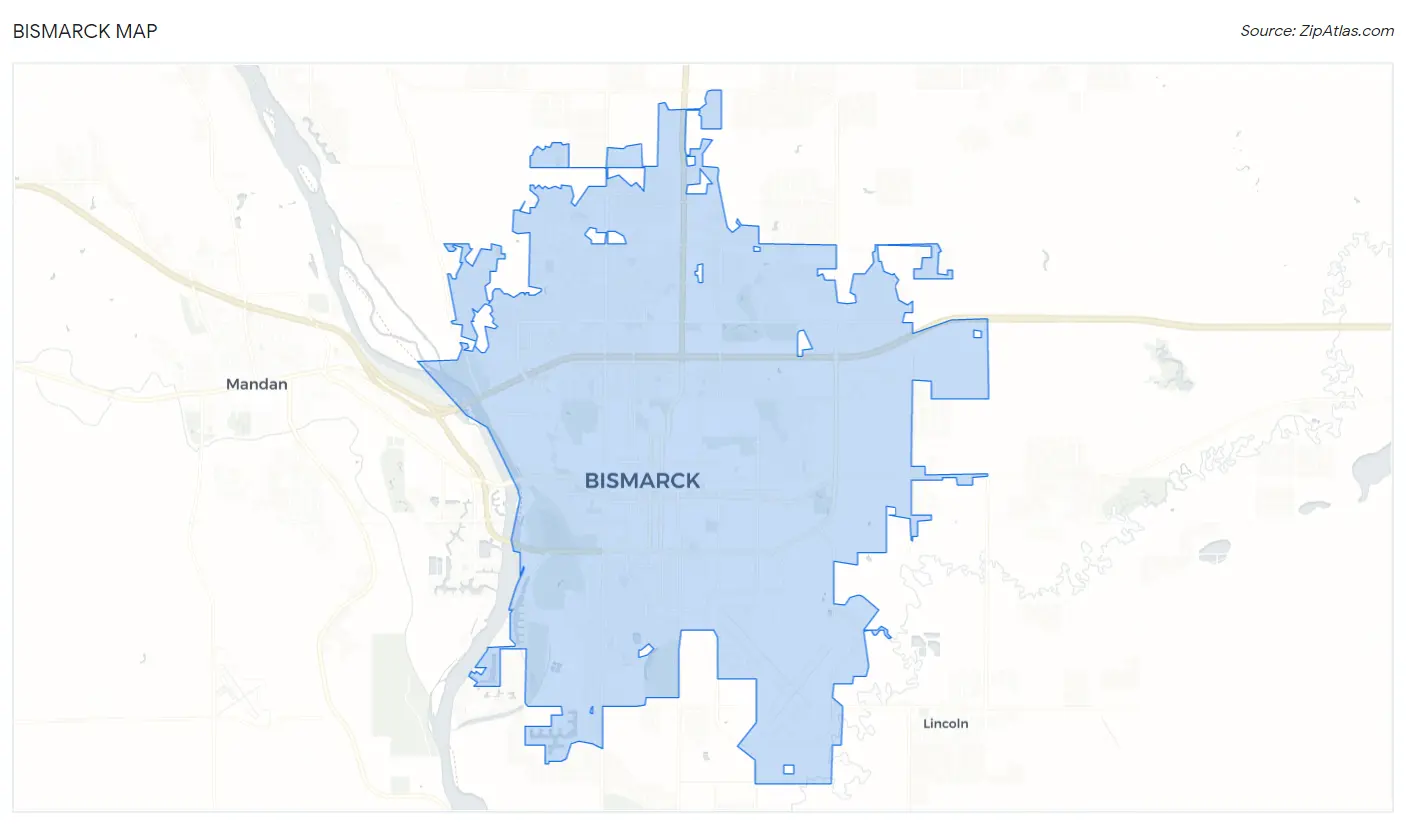
Bismarck Overview
$43,144
PER CAPITA INCOME
$103,456
AVG FAMILY INCOME
$76,014
AVG HOUSEHOLD INCOME
17.6%
WAGE / INCOME GAP [ % ]
82.4¢/ $1
WAGE / INCOME GAP [ $ ]
$10,845
FAMILY INCOME DEFICIT
0.43
INEQUALITY / GINI INDEX
73,694
TOTAL POPULATION
36,664
MALE POPULATION
37,030
FEMALE POPULATION
99.01
MALES / 100 FEMALES
101.00
FEMALES / 100 MALES
38.0
MEDIAN AGE
3.0
AVG FAMILY SIZE
2.2
AVG HOUSEHOLD SIZE
39,072
LABOR FORCE [ PEOPLE ]
65.8%
PERCENT IN LABOR FORCE
3.1%
UNEMPLOYMENT RATE
Bismarck Area Codes
Income in Bismarck
Income Overview in Bismarck
Per Capita Income in Bismarck is $43,144, while median incomes of families and households are $103,456 and $76,014 respectively.
| Characteristic | Number | Measure |
| Per Capita Income | 73,694 | $43,144 |
| Median Family Income | 18,028 | $103,456 |
| Mean Family Income | 18,028 | $120,611 |
| Median Household Income | 31,716 | $76,014 |
| Mean Household Income | 31,716 | $97,414 |
| Income Deficit | 18,028 | $10,845 |
| Wage / Income Gap (%) | 73,694 | 17.56% |
| Wage / Income Gap ($) | 73,694 | 82.44¢ per $1 |
| Gini / Inequality Index | 73,694 | 0.43 |
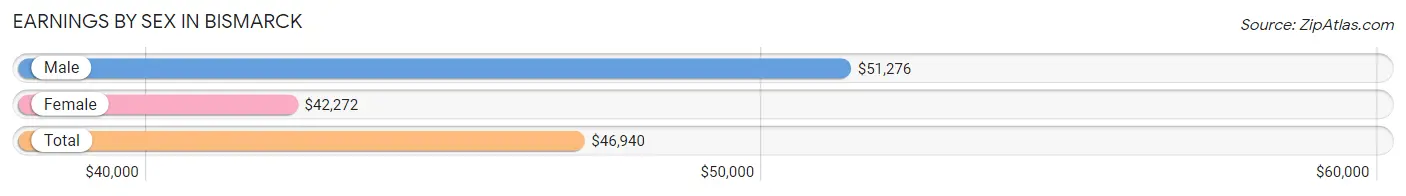
Earnings by Sex in Bismarck
Average Earnings in Bismarck are $46,940, $51,276 for men and $42,272 for women, a difference of 17.6%.
| Sex | Number | Average Earnings |
| Male | 21,968 (52.8%) | $51,276 |
| Female | 19,628 (47.2%) | $42,272 |
| Total | 41,596 (100.0%) | $46,940 |
Earnings by Sex by Income Bracket in Bismarck
The most common earnings brackets in Bismarck are $100,000+ for men (3,907 | 17.8%) and $55,000 to $64,999 for women (2,298 | 11.7%).
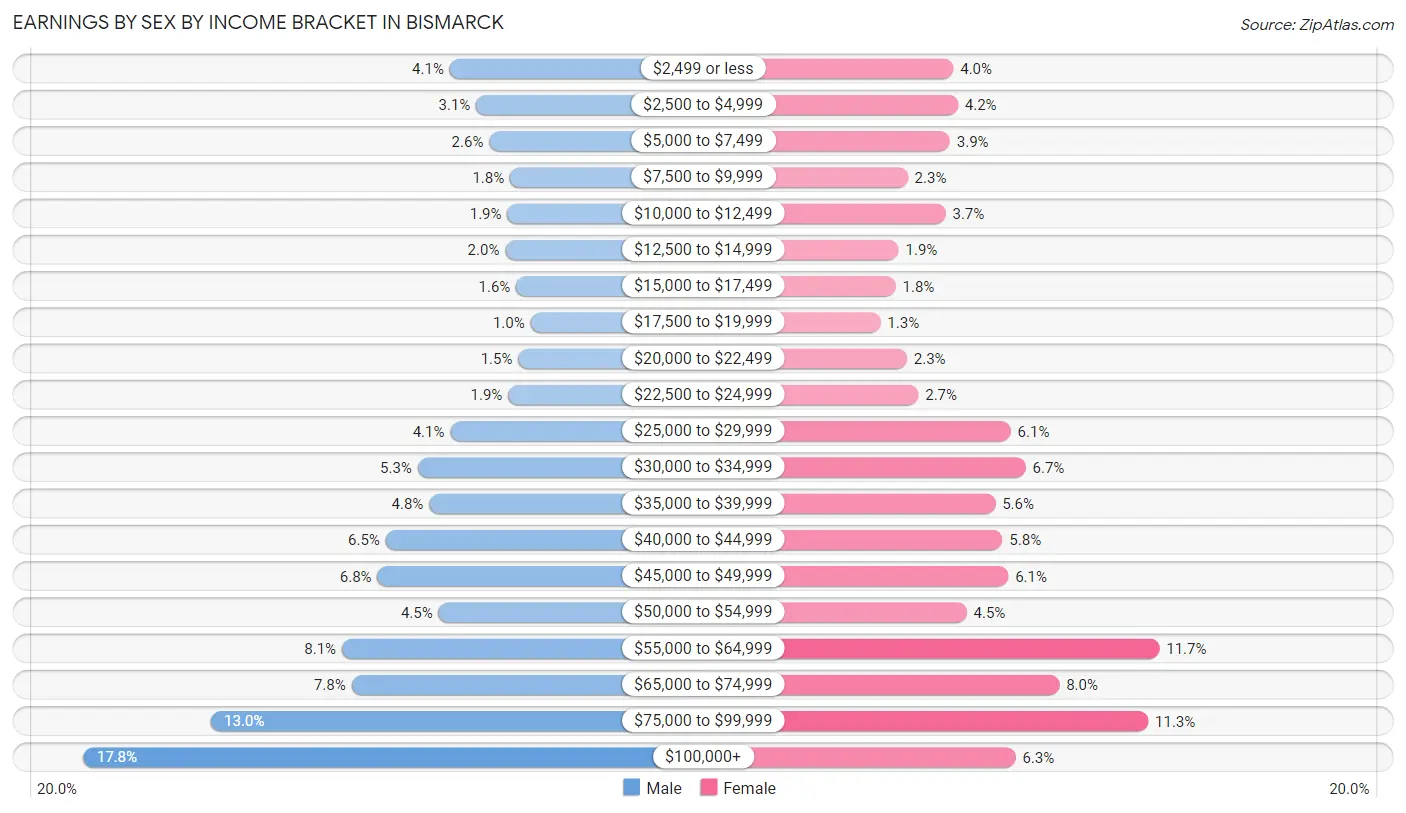
| Income | Male | Female |
| $2,499 or less | 895 (4.1%) | 783 (4.0%) |
| $2,500 to $4,999 | 676 (3.1%) | 816 (4.2%) |
| $5,000 to $7,499 | 570 (2.6%) | 758 (3.9%) |
| $7,500 to $9,999 | 397 (1.8%) | 447 (2.3%) |
| $10,000 to $12,499 | 419 (1.9%) | 726 (3.7%) |
| $12,500 to $14,999 | 437 (2.0%) | 380 (1.9%) |
| $15,000 to $17,499 | 347 (1.6%) | 359 (1.8%) |
| $17,500 to $19,999 | 229 (1.0%) | 247 (1.3%) |
| $20,000 to $22,499 | 329 (1.5%) | 442 (2.2%) |
| $22,500 to $24,999 | 412 (1.9%) | 526 (2.7%) |
| $25,000 to $29,999 | 890 (4.1%) | 1,205 (6.1%) |
| $30,000 to $34,999 | 1,157 (5.3%) | 1,315 (6.7%) |
| $35,000 to $39,999 | 1,064 (4.8%) | 1,092 (5.6%) |
| $40,000 to $44,999 | 1,422 (6.5%) | 1,145 (5.8%) |
| $45,000 to $49,999 | 1,490 (6.8%) | 1,187 (6.0%) |
| $50,000 to $54,999 | 987 (4.5%) | 882 (4.5%) |
| $55,000 to $64,999 | 1,781 (8.1%) | 2,298 (11.7%) |
| $65,000 to $74,999 | 1,702 (7.7%) | 1,563 (8.0%) |
| $75,000 to $99,999 | 2,857 (13.0%) | 2,216 (11.3%) |
| $100,000+ | 3,907 (17.8%) | 1,241 (6.3%) |
| Total | 21,968 (100.0%) | 19,628 (100.0%) |
Earnings by Sex by Educational Attainment in Bismarck
Average earnings in Bismarck are $58,654 for men and $49,061 for women, a difference of 16.4%. Men with an educational attainment of graduate degree enjoy the highest average annual earnings of $92,946, while those with less than high school education earn the least with $41,589. Women with an educational attainment of graduate degree earn the most with the average annual earnings of $71,832, while those with high school diploma education have the smallest earnings of $33,333.
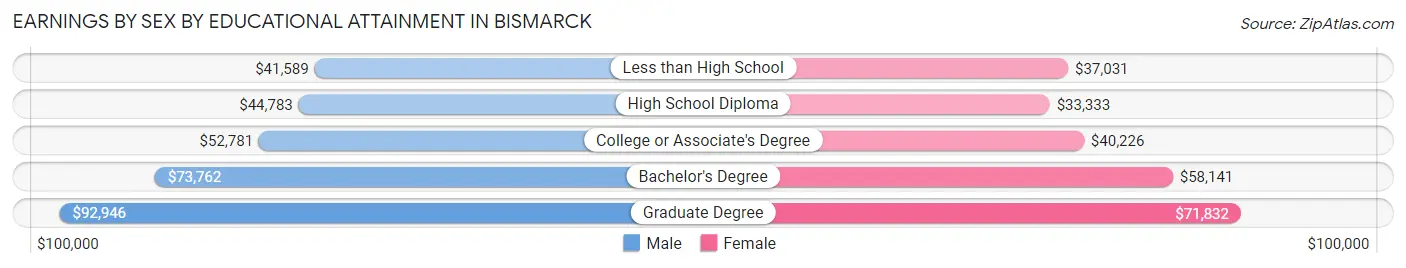
| Educational Attainment | Male Income | Female Income |
| Less than High School | $41,589 | $37,031 |
| High School Diploma | $44,783 | $33,333 |
| College or Associate's Degree | $52,781 | $40,226 |
| Bachelor's Degree | $73,762 | $58,141 |
| Graduate Degree | $92,946 | $71,832 |
| Total | $58,654 | $49,061 |
Family Income in Bismarck
Family Income Brackets in Bismarck
According to the Bismarck family income data, there are 5,066 families falling into the $100,000 to $149,999 income range, which is the most common income bracket and makes up 28.1% of all families. Conversely, the less than $10,000 income bracket is the least frequent group with only 180 families (1.0%) belonging to this category.
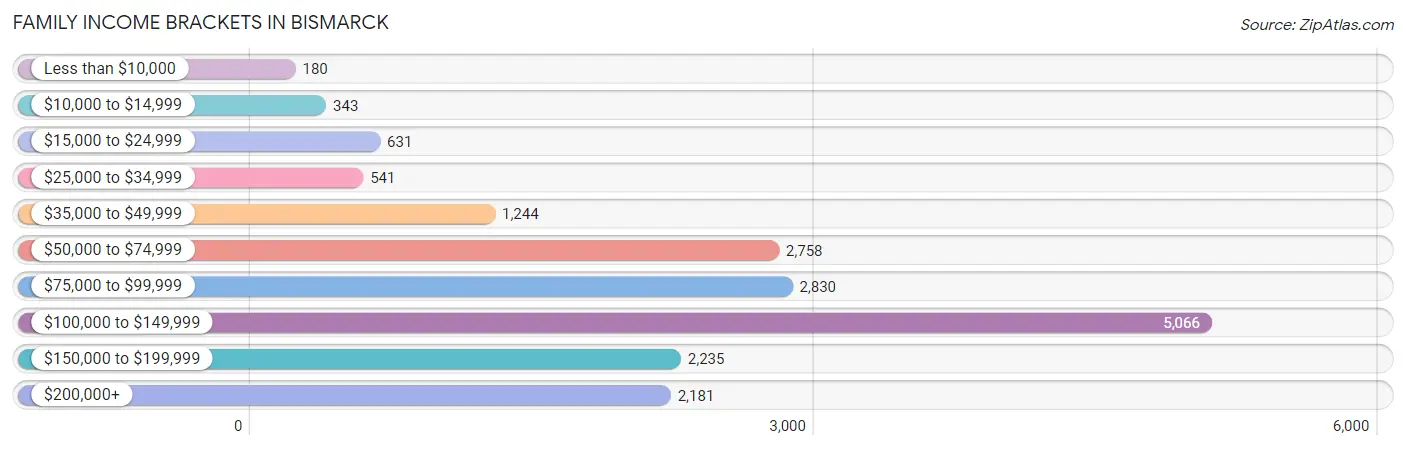
| Income Bracket | # Families | % Families |
| Less than $10,000 | 180 | 1.0% |
| $10,000 to $14,999 | 343 | 1.9% |
| $15,000 to $24,999 | 631 | 3.5% |
| $25,000 to $34,999 | 541 | 3.0% |
| $35,000 to $49,999 | 1,244 | 6.9% |
| $50,000 to $74,999 | 2,758 | 15.3% |
| $75,000 to $99,999 | 2,830 | 15.7% |
| $100,000 to $149,999 | 5,066 | 28.1% |
| $150,000 to $199,999 | 2,235 | 12.4% |
| $200,000+ | 2,181 | 12.1% |
Family Income by Famaliy Size in Bismarck
4-person families (2,816 | 15.6%) account for the highest median family income in Bismarck with $140,186 per family, while 2-person families (9,086 | 50.4%) have the highest median income of $46,268 per family member.
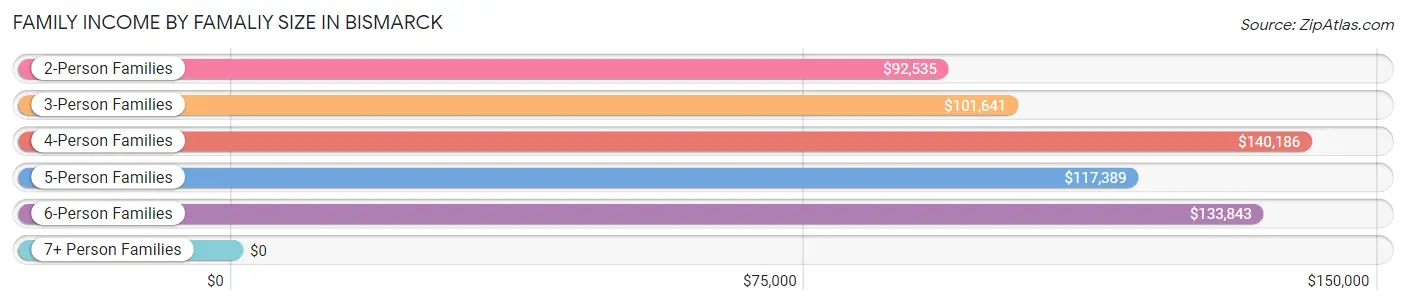
| Income Bracket | # Families | Median Income |
| 2-Person Families | 9,086 (50.4%) | $92,535 |
| 3-Person Families | 3,868 (21.5%) | $101,641 |
| 4-Person Families | 2,816 (15.6%) | $140,186 |
| 5-Person Families | 1,775 (9.9%) | $117,389 |
| 6-Person Families | 409 (2.3%) | $133,843 |
| 7+ Person Families | 74 (0.4%) | $0 |
| Total | 18,028 (100.0%) | $103,456 |
Family Income by Number of Earners in Bismarck
The median family income in Bismarck is $103,456, with families comprising 3+ earners (1,871) having the highest median family income of $158,563, while families with no earners (2,859) have the lowest median family income of $65,188, accounting for 10.4% and 15.9% of families, respectively.
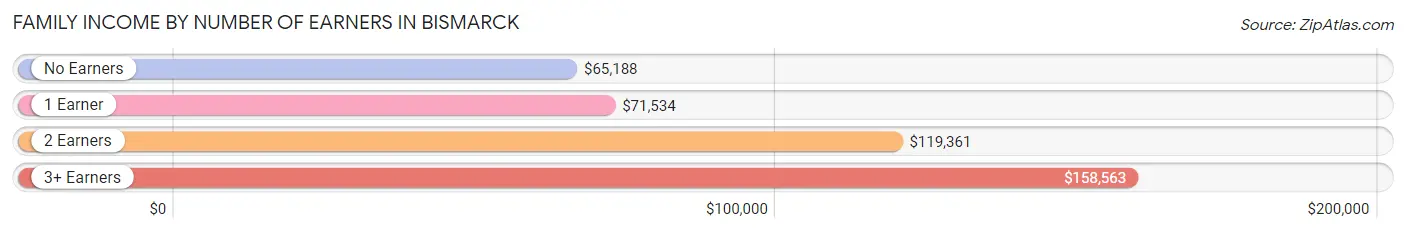
| Number of Earners | # Families | Median Income |
| No Earners | 2,859 (15.9%) | $65,188 |
| 1 Earner | 4,755 (26.4%) | $71,534 |
| 2 Earners | 8,543 (47.4%) | $119,361 |
| 3+ Earners | 1,871 (10.4%) | $158,563 |
| Total | 18,028 (100.0%) | $103,456 |
Household Income in Bismarck
Household Income Brackets in Bismarck
With 6,438 households falling in the category, the $100,000 to $149,999 income range is the most frequent in Bismarck, accounting for 20.3% of all households. In contrast, only 1,205 households (3.8%) fall into the $10,000 to $14,999 income bracket, making it the least populous group.
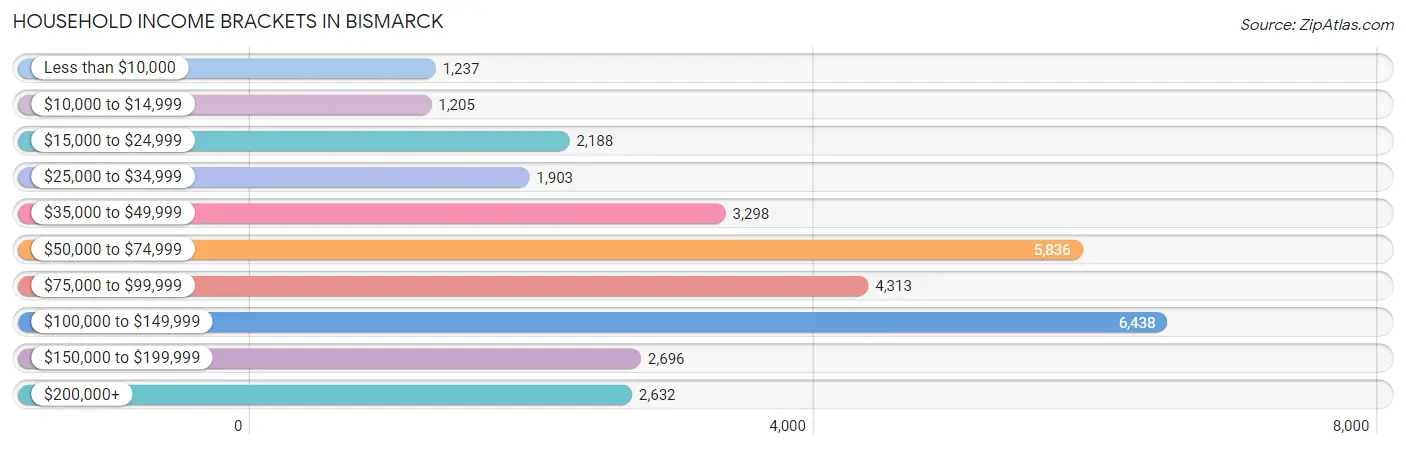
| Income Bracket | # Households | % Households |
| Less than $10,000 | 1,237 | 3.9% |
| $10,000 to $14,999 | 1,205 | 3.8% |
| $15,000 to $24,999 | 2,188 | 6.9% |
| $25,000 to $34,999 | 1,903 | 6.0% |
| $35,000 to $49,999 | 3,298 | 10.4% |
| $50,000 to $74,999 | 5,836 | 18.4% |
| $75,000 to $99,999 | 4,313 | 13.6% |
| $100,000 to $149,999 | 6,438 | 20.3% |
| $150,000 to $199,999 | 2,696 | 8.5% |
| $200,000+ | 2,632 | 8.3% |
Household Income by Householder Age in Bismarck
The median household income in Bismarck is $76,014, with the highest median household income of $91,226 found in the 25 to 44 years age bracket for the primary householder. A total of 11,162 households (35.2%) fall into this category. Meanwhile, the 15 to 24 years age bracket for the primary householder has the lowest median household income of $46,159, with 2,099 households (6.6%) in this group.
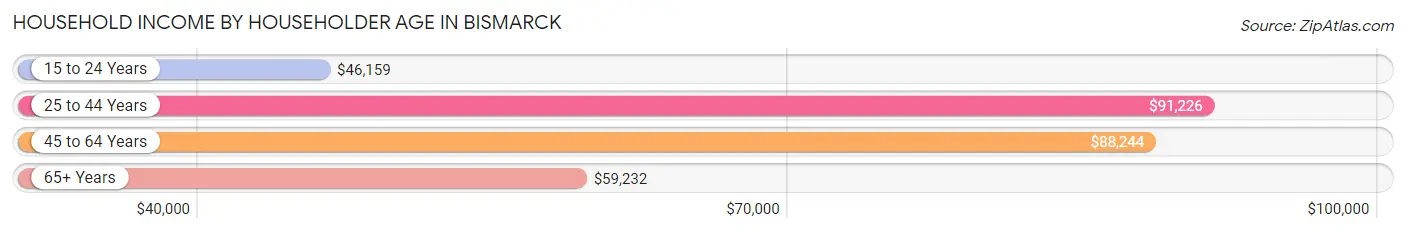
| Income Bracket | # Households | Median Income |
| 15 to 24 Years | 2,099 (6.6%) | $46,159 |
| 25 to 44 Years | 11,162 (35.2%) | $91,226 |
| 45 to 64 Years | 9,769 (30.8%) | $88,244 |
| 65+ Years | 8,686 (27.4%) | $59,232 |
| Total | 31,716 (100.0%) | $76,014 |
Poverty in Bismarck
Income Below Poverty by Sex and Age in Bismarck
With 7.4% poverty level for males and 10.9% for females among the residents of Bismarck, 15 year old males and 18 to 24 year old females are the most vulnerable to poverty, with 67 males (24.8%) and 772 females (24.1%) in their respective age groups living below the poverty level.
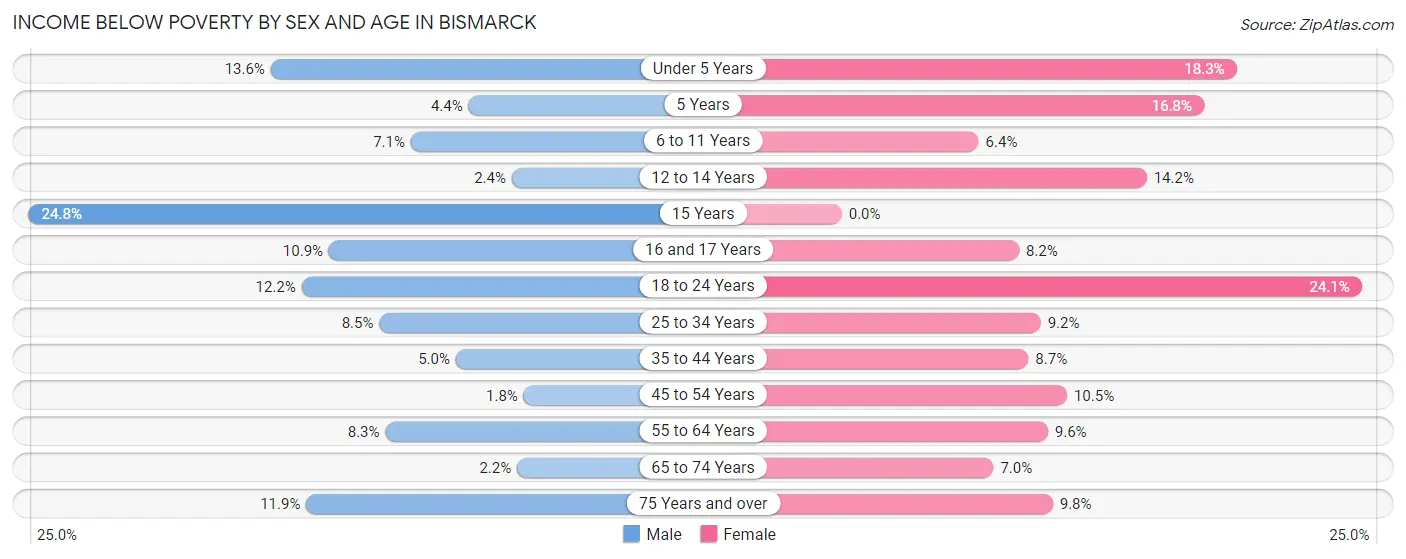
| Age Bracket | Male | Female |
| Under 5 Years | 315 (13.6%) | 335 (18.3%) |
| 5 Years | 21 (4.4%) | 81 (16.8%) |
| 6 to 11 Years | 202 (7.1%) | 149 (6.4%) |
| 12 to 14 Years | 31 (2.4%) | 229 (14.1%) |
| 15 Years | 67 (24.8%) | 0 (0.0%) |
| 16 and 17 Years | 135 (10.9%) | 60 (8.2%) |
| 18 to 24 Years | 383 (12.1%) | 772 (24.1%) |
| 25 to 34 Years | 425 (8.5%) | 452 (9.2%) |
| 35 to 44 Years | 257 (5.0%) | 394 (8.7%) |
| 45 to 54 Years | 67 (1.8%) | 395 (10.4%) |
| 55 to 64 Years | 370 (8.3%) | 452 (9.6%) |
| 65 to 74 Years | 68 (2.1%) | 273 (7.0%) |
| 75 Years and over | 269 (11.9%) | 344 (9.8%) |
| Total | 2,610 (7.4%) | 3,936 (10.9%) |
Income Above Poverty by Sex and Age in Bismarck
According to the poverty statistics in Bismarck, males aged 45 to 54 years and females aged 15 years are the age groups that are most secure financially, with 98.2% of males and 100.0% of females in these age groups living above the poverty line.
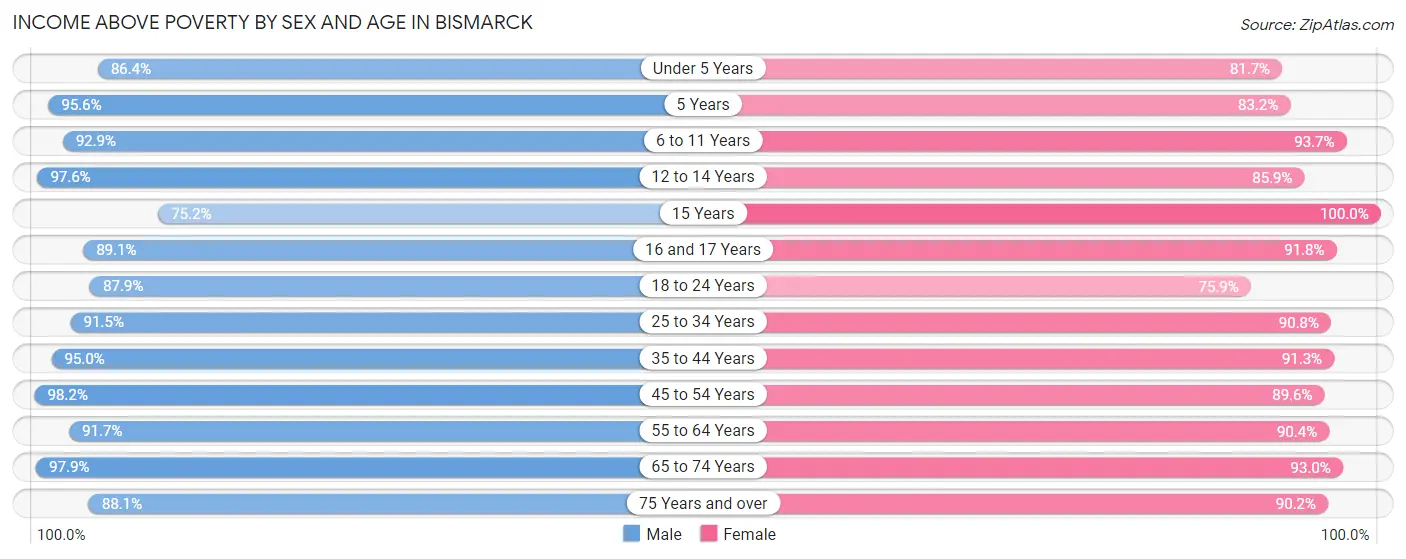
| Age Bracket | Male | Female |
| Under 5 Years | 2,004 (86.4%) | 1,495 (81.7%) |
| 5 Years | 456 (95.6%) | 401 (83.2%) |
| 6 to 11 Years | 2,651 (92.9%) | 2,199 (93.6%) |
| 12 to 14 Years | 1,267 (97.6%) | 1,389 (85.9%) |
| 15 Years | 203 (75.2%) | 449 (100.0%) |
| 16 and 17 Years | 1,106 (89.1%) | 670 (91.8%) |
| 18 to 24 Years | 2,770 (87.8%) | 2,428 (75.9%) |
| 25 to 34 Years | 4,554 (91.5%) | 4,446 (90.8%) |
| 35 to 44 Years | 4,892 (95.0%) | 4,157 (91.3%) |
| 45 to 54 Years | 3,570 (98.2%) | 3,384 (89.5%) |
| 55 to 64 Years | 4,108 (91.7%) | 4,278 (90.4%) |
| 65 to 74 Years | 3,101 (97.9%) | 3,606 (93.0%) |
| 75 Years and over | 1,985 (88.1%) | 3,171 (90.2%) |
| Total | 32,667 (92.6%) | 32,073 (89.1%) |
Income Below Poverty Among Married-Couple Families in Bismarck
The poverty statistics for married-couple families in Bismarck show that 2.2% or 318 of the total 14,194 families live below the poverty line. Families with 3 or 4 children have the highest poverty rate of 5.3%, comprising of 82 families. On the other hand, families with 5 or more children have the lowest poverty rate of 0.0%, which includes 0 families.
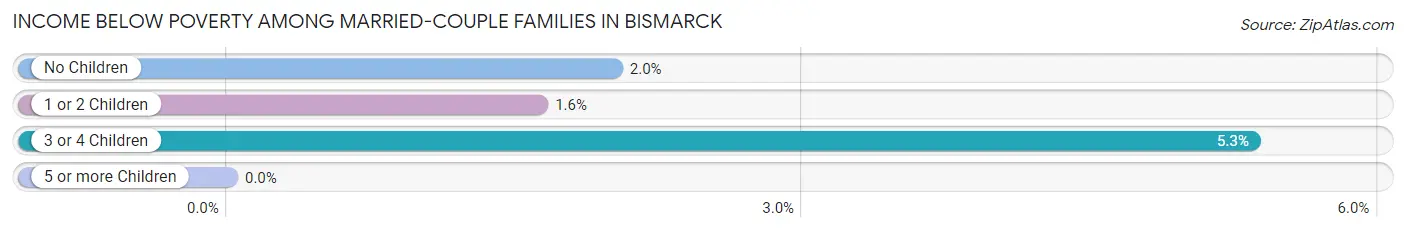
| Children | Above Poverty | Below Poverty |
| No Children | 7,862 (98.0%) | 161 (2.0%) |
| 1 or 2 Children | 4,552 (98.4%) | 75 (1.6%) |
| 3 or 4 Children | 1,453 (94.7%) | 82 (5.3%) |
| 5 or more Children | 9 (100.0%) | 0 (0.0%) |
| Total | 13,876 (97.8%) | 318 (2.2%) |
Income Below Poverty Among Single-Parent Households in Bismarck
According to the poverty data in Bismarck, 5.6% or 67 single-father households and 22.0% or 579 single-mother households are living below the poverty line. Among single-father households, those with 3 or 4 children have the highest poverty rate, with 24 households (32.9%) experiencing poverty. Likewise, among single-mother households, those with 3 or 4 children have the highest poverty rate, with 278 households (68.0%) falling below the poverty line.
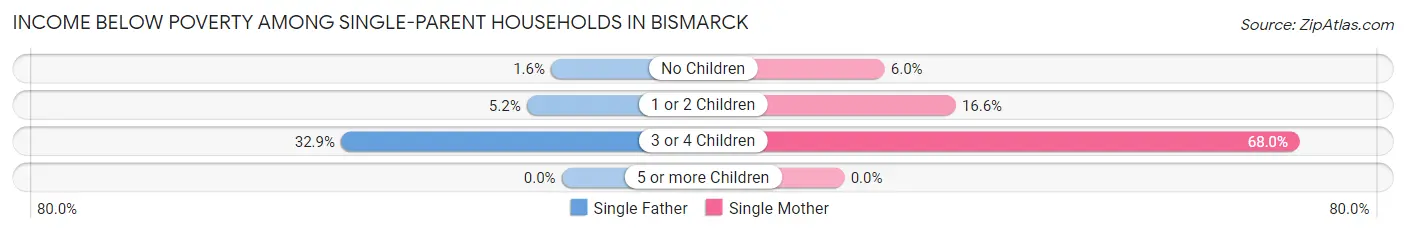
| Children | Single Father | Single Mother |
| No Children | 7 (1.6%) | 38 (6.0%) |
| 1 or 2 Children | 36 (5.2%) | 263 (16.6%) |
| 3 or 4 Children | 24 (32.9%) | 278 (68.0%) |
| 5 or more Children | 0 (0.0%) | 0 (0.0%) |
| Total | 67 (5.6%) | 579 (22.0%) |
Income Below Poverty Among Married-Couple vs Single-Parent Households in Bismarck
The poverty data for Bismarck shows that 318 of the married-couple family households (2.2%) and 646 of the single-parent households (16.9%) are living below the poverty level. Within the married-couple family households, those with 3 or 4 children have the highest poverty rate, with 82 households (5.3%) falling below the poverty line. Among the single-parent households, those with 3 or 4 children have the highest poverty rate, with 302 household (62.7%) living below poverty.
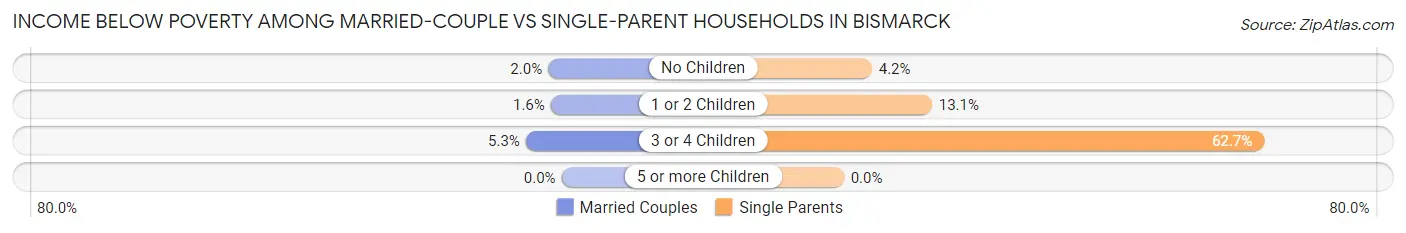
| Children | Married-Couple Families | Single-Parent Households |
| No Children | 161 (2.0%) | 45 (4.2%) |
| 1 or 2 Children | 75 (1.6%) | 299 (13.1%) |
| 3 or 4 Children | 82 (5.3%) | 302 (62.7%) |
| 5 or more Children | 0 (0.0%) | 0 (0.0%) |
| Total | 318 (2.2%) | 646 (16.9%) |
Race in Bismarck
The most populous races in Bismarck are White / Caucasian (63,411 | 86.1%), Two or more Races (3,447 | 4.7%), and Native / Alaskan (2,990 | 4.1%).
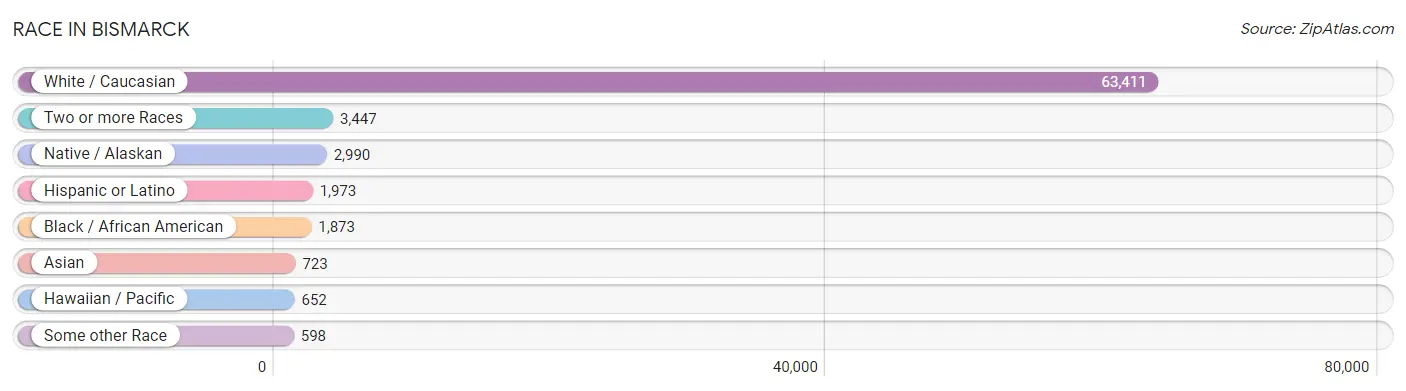
| Race | # Population | % Population |
| Asian | 723 | 1.0% |
| Black / African American | 1,873 | 2.5% |
| Hawaiian / Pacific | 652 | 0.9% |
| Hispanic or Latino | 1,973 | 2.7% |
| Native / Alaskan | 2,990 | 4.1% |
| White / Caucasian | 63,411 | 86.1% |
| Two or more Races | 3,447 | 4.7% |
| Some other Race | 598 | 0.8% |
| Total | 73,694 | 100.0% |
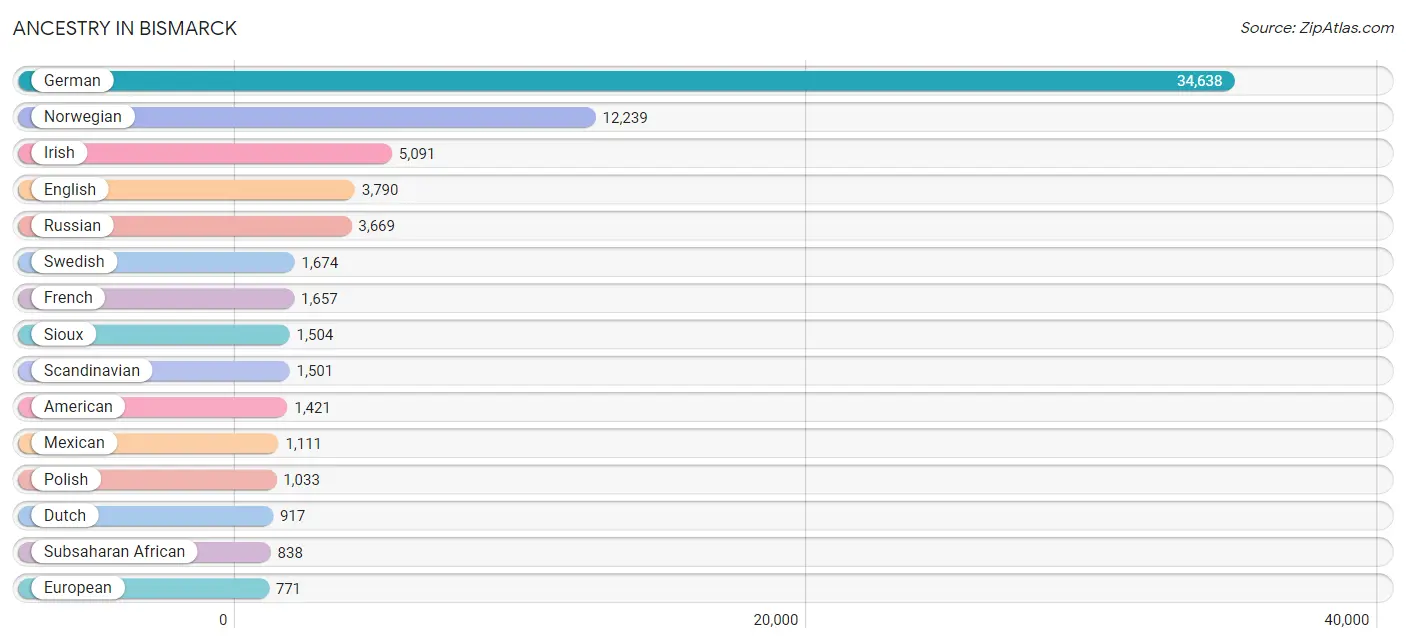
Ancestry in Bismarck
The most populous ancestries reported in Bismarck are German (34,638 | 47.0%), Norwegian (12,239 | 16.6%), Irish (5,091 | 6.9%), English (3,790 | 5.1%), and Russian (3,669 | 5.0%), together accounting for 80.6% of all Bismarck residents.
| Ancestry | # Population | % Population |
| Afghan | 23 | 0.0% |
| African | 450 | 0.6% |
| Alaska Native | 2 | 0.0% |
| Albanian | 33 | 0.0% |
| Aleut | 2 | 0.0% |
| American | 1,421 | 1.9% |
| Arab | 253 | 0.3% |
| Armenian | 20 | 0.0% |
| Austrian | 81 | 0.1% |
| Belgian | 47 | 0.1% |
| Bhutanese | 66 | 0.1% |
| Blackfeet | 90 | 0.1% |
| British | 484 | 0.7% |
| Burmese | 58 | 0.1% |
| Canadian | 92 | 0.1% |
| Central American | 276 | 0.4% |
| Central American Indian | 4 | 0.0% |
| Cherokee | 163 | 0.2% |
| Chippewa | 586 | 0.8% |
| Colombian | 31 | 0.0% |
| Creek | 2 | 0.0% |
| Croatian | 118 | 0.2% |
| Crow | 69 | 0.1% |
| Cuban | 25 | 0.0% |
| Czech | 534 | 0.7% |
| Czechoslovakian | 43 | 0.1% |
| Danish | 562 | 0.8% |
| Dominican | 26 | 0.0% |
| Dutch | 917 | 1.2% |
| Eastern European | 53 | 0.1% |
| Ecuadorian | 20 | 0.0% |
| English | 3,790 | 5.1% |
| Ethiopian | 15 | 0.0% |
| European | 771 | 1.1% |
| Fijian | 90 | 0.1% |
| Filipino | 11 | 0.0% |
| Finnish | 289 | 0.4% |
| French | 1,657 | 2.2% |
| French American Indian | 54 | 0.1% |
| French Canadian | 666 | 0.9% |
| German | 34,638 | 47.0% |
| German Russian | 736 | 1.0% |
| Ghanaian | 14 | 0.0% |
| Greek | 27 | 0.0% |
| Guamanian / Chamorro | 25 | 0.0% |
| Haitian | 400 | 0.5% |
| Hungarian | 383 | 0.5% |
| Icelander | 128 | 0.2% |
| Indian (Asian) | 111 | 0.2% |
| Inupiat | 2 | 0.0% |
| Irish | 5,091 | 6.9% |
| Iroquois | 9 | 0.0% |
| Israeli | 2 | 0.0% |
| Italian | 612 | 0.8% |
| Jamaican | 18 | 0.0% |
| Jordanian | 15 | 0.0% |
| Kenyan | 115 | 0.2% |
| Korean | 372 | 0.5% |
| Latvian | 14 | 0.0% |
| Lebanese | 146 | 0.2% |
| Liberian | 33 | 0.0% |
| Lithuanian | 13 | 0.0% |
| Luxembourger | 1 | 0.0% |
| Mexican | 1,111 | 1.5% |
| Native Hawaiian | 8 | 0.0% |
| Navajo | 110 | 0.2% |
| Nigerian | 37 | 0.1% |
| Northern European | 51 | 0.1% |
| Norwegian | 12,239 | 16.6% |
| Pakistani | 141 | 0.2% |
| Panamanian | 159 | 0.2% |
| Pennsylvania German | 74 | 0.1% |
| Peruvian | 26 | 0.0% |
| Polish | 1,033 | 1.4% |
| Portuguese | 17 | 0.0% |
| Puerto Rican | 269 | 0.4% |
| Romanian | 261 | 0.4% |
| Russian | 3,669 | 5.0% |
| Salvadoran | 117 | 0.2% |
| Samoan | 42 | 0.1% |
| Scandinavian | 1,501 | 2.0% |
| Scotch-Irish | 420 | 0.6% |
| Scottish | 698 | 0.9% |
| Serbian | 52 | 0.1% |
| Sioux | 1,504 | 2.0% |
| Slovak | 44 | 0.1% |
| Slovene | 15 | 0.0% |
| Somali | 126 | 0.2% |
| South American | 77 | 0.1% |
| Spaniard | 31 | 0.0% |
| Spanish | 62 | 0.1% |
| Sri Lankan | 124 | 0.2% |
| Subsaharan African | 838 | 1.1% |
| Sudanese | 7 | 0.0% |
| Swedish | 1,674 | 2.3% |
| Swiss | 108 | 0.2% |
| Syrian | 92 | 0.1% |
| Thai | 102 | 0.1% |
| Ukrainian | 372 | 0.5% |
| Welsh | 173 | 0.2% |
| Yaqui | 3 | 0.0% |
| Yugoslavian | 37 | 0.1% | View All 102 Rows |
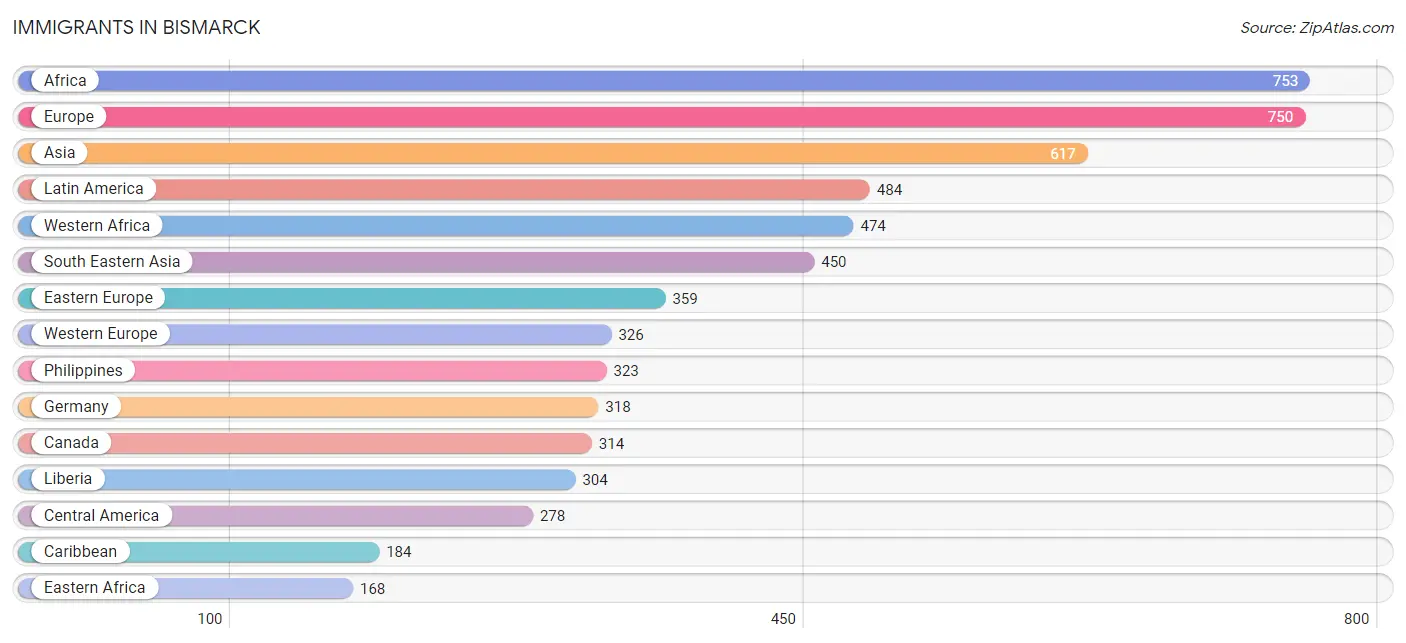
Immigrants in Bismarck
The most numerous immigrant groups reported in Bismarck came from Africa (753 | 1.0%), Europe (750 | 1.0%), Asia (617 | 0.8%), Latin America (484 | 0.7%), and Western Africa (474 | 0.6%), together accounting for 4.2% of all Bismarck residents.
| Immigration Origin | # Population | % Population |
| Afghanistan | 22 | 0.0% |
| Africa | 753 | 1.0% |
| Asia | 617 | 0.8% |
| Bangladesh | 3 | 0.0% |
| Cameroon | 26 | 0.0% |
| Canada | 314 | 0.4% |
| Caribbean | 184 | 0.3% |
| Central America | 278 | 0.4% |
| China | 68 | 0.1% |
| Colombia | 15 | 0.0% |
| Croatia | 121 | 0.2% |
| Cuba | 4 | 0.0% |
| Dominican Republic | 13 | 0.0% |
| Eastern Africa | 168 | 0.2% |
| Eastern Asia | 93 | 0.1% |
| Eastern Europe | 359 | 0.5% |
| El Salvador | 48 | 0.1% |
| Ethiopia | 13 | 0.0% |
| Europe | 750 | 1.0% |
| Germany | 318 | 0.4% |
| Ghana | 10 | 0.0% |
| Haiti | 167 | 0.2% |
| Honduras | 21 | 0.0% |
| India | 30 | 0.0% |
| Kenya | 86 | 0.1% |
| Korea | 25 | 0.0% |
| Latin America | 484 | 0.7% |
| Liberia | 304 | 0.4% |
| Malaysia | 5 | 0.0% |
| Mexico | 80 | 0.1% |
| Middle Africa | 26 | 0.0% |
| Nepal | 15 | 0.0% |
| Netherlands | 8 | 0.0% |
| Nigeria | 23 | 0.0% |
| Northern Africa | 7 | 0.0% |
| Northern Europe | 41 | 0.1% |
| Oceania | 69 | 0.1% |
| Pakistan | 4 | 0.0% |
| Panama | 129 | 0.2% |
| Peru | 7 | 0.0% |
| Philippines | 323 | 0.4% |
| Romania | 81 | 0.1% |
| Russia | 60 | 0.1% |
| Serbia | 39 | 0.1% |
| Somalia | 69 | 0.1% |
| South Africa | 78 | 0.1% |
| South America | 22 | 0.0% |
| South Central Asia | 74 | 0.1% |
| South Eastern Asia | 450 | 0.6% |
| Sudan | 7 | 0.0% |
| Taiwan | 6 | 0.0% |
| Thailand | 106 | 0.1% |
| Ukraine | 48 | 0.1% |
| Vietnam | 16 | 0.0% |
| Western Africa | 474 | 0.6% |
| Western Europe | 326 | 0.4% | View All 56 Rows |
Sex and Age in Bismarck
Sex and Age in Bismarck
The most populous age groups in Bismarck are 35 to 39 Years (2,950 | 8.1%) for men and 35 to 39 Years (2,599 | 7.0%) for women.
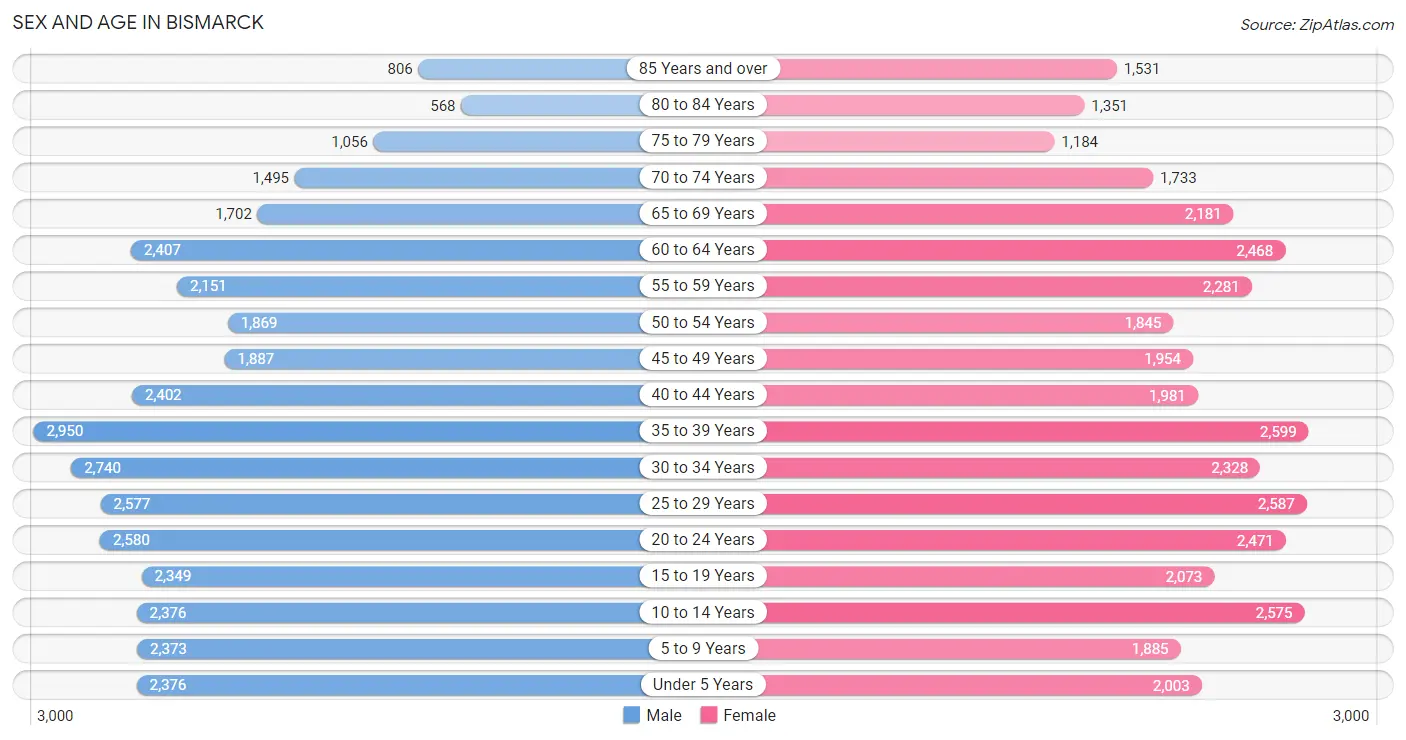
| Age Bracket | Male | Female |
| Under 5 Years | 2,376 (6.5%) | 2,003 (5.4%) |
| 5 to 9 Years | 2,373 (6.5%) | 1,885 (5.1%) |
| 10 to 14 Years | 2,376 (6.5%) | 2,575 (7.0%) |
| 15 to 19 Years | 2,349 (6.4%) | 2,073 (5.6%) |
| 20 to 24 Years | 2,580 (7.0%) | 2,471 (6.7%) |
| 25 to 29 Years | 2,577 (7.0%) | 2,587 (7.0%) |
| 30 to 34 Years | 2,740 (7.5%) | 2,328 (6.3%) |
| 35 to 39 Years | 2,950 (8.1%) | 2,599 (7.0%) |
| 40 to 44 Years | 2,402 (6.6%) | 1,981 (5.3%) |
| 45 to 49 Years | 1,887 (5.1%) | 1,954 (5.3%) |
| 50 to 54 Years | 1,869 (5.1%) | 1,845 (5.0%) |
| 55 to 59 Years | 2,151 (5.9%) | 2,281 (6.2%) |
| 60 to 64 Years | 2,407 (6.6%) | 2,468 (6.7%) |
| 65 to 69 Years | 1,702 (4.6%) | 2,181 (5.9%) |
| 70 to 74 Years | 1,495 (4.1%) | 1,733 (4.7%) |
| 75 to 79 Years | 1,056 (2.9%) | 1,184 (3.2%) |
| 80 to 84 Years | 568 (1.5%) | 1,351 (3.6%) |
| 85 Years and over | 806 (2.2%) | 1,531 (4.1%) |
| Total | 36,664 (100.0%) | 37,030 (100.0%) |
Families and Households in Bismarck
Median Family Size in Bismarck
The median family size in Bismarck is 2.98 persons per family, with married-couple families (14,194 | 78.7%) accounting for the largest median family size of 3.02 persons per family. On the other hand, single male/father families (1,205 | 6.7%) represent the smallest median family size with 2.68 persons per family.
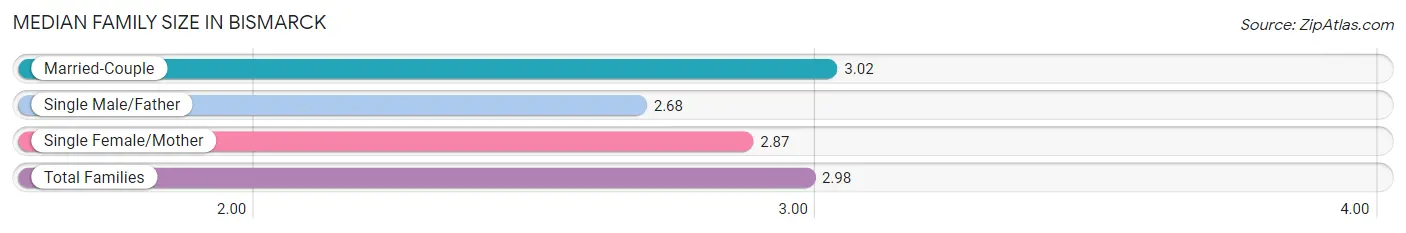
| Family Type | # Families | Family Size |
| Married-Couple | 14,194 (78.7%) | 3.02 |
| Single Male/Father | 1,205 (6.7%) | 2.68 |
| Single Female/Mother | 2,629 (14.6%) | 2.87 |
| Total Families | 18,028 (100.0%) | 2.98 |
Median Household Size in Bismarck
The median household size in Bismarck is 2.25 persons per household, with single male/father households (1,205 | 3.8%) accounting for the largest median household size of 3.08 persons per household. non-family households (13,688 | 43.2%) represent the smallest median household size with 1.21 persons per household.
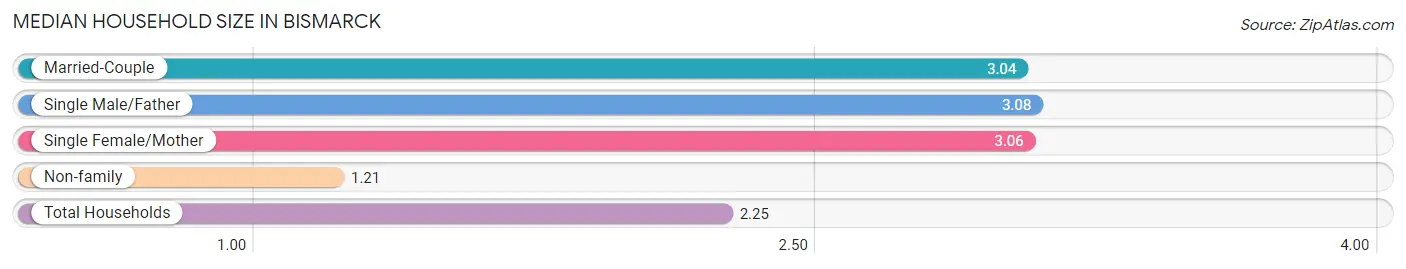
| Household Type | # Households | Household Size |
| Married-Couple | 14,194 (44.8%) | 3.04 |
| Single Male/Father | 1,205 (3.8%) | 3.08 |
| Single Female/Mother | 2,629 (8.3%) | 3.06 |
| Non-family | 13,688 (43.2%) | 1.21 |
| Total Households | 31,716 (100.0%) | 2.25 |
Household Size by Marriage Status in Bismarck
Out of a total of 31,716 households in Bismarck, 18,028 (56.8%) are family households, while 13,688 (43.2%) are nonfamily households. The most numerous type of family households are 2-person households, comprising 8,588, and the most common type of nonfamily households are 1-person households, comprising 11,253.
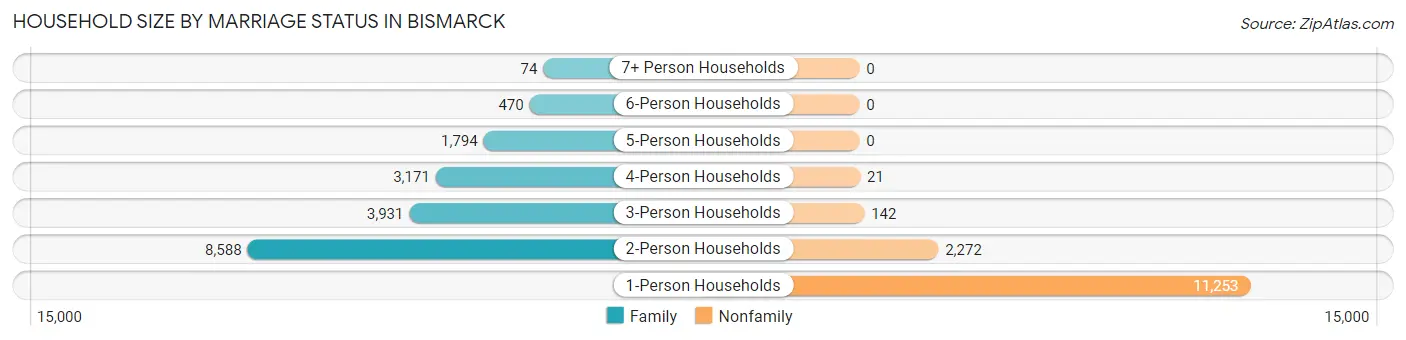
| Household Size | Family Households | Nonfamily Households |
| 1-Person Households | - | 11,253 (35.5%) |
| 2-Person Households | 8,588 (27.1%) | 2,272 (7.2%) |
| 3-Person Households | 3,931 (12.4%) | 142 (0.4%) |
| 4-Person Households | 3,171 (10.0%) | 21 (0.1%) |
| 5-Person Households | 1,794 (5.7%) | 0 (0.0%) |
| 6-Person Households | 470 (1.5%) | 0 (0.0%) |
| 7+ Person Households | 74 (0.2%) | 0 (0.0%) |
| Total | 18,028 (56.8%) | 13,688 (43.2%) |
Female Fertility in Bismarck
Fertility by Age in Bismarck
Average fertility rate in Bismarck is 82.0 births per 1,000 women. Women in the age bracket of 20 to 34 years have the highest fertility rate with 129.0 births per 1,000 women. Women in the age bracket of 20 to 34 years acount for 71.7% of all women with births.
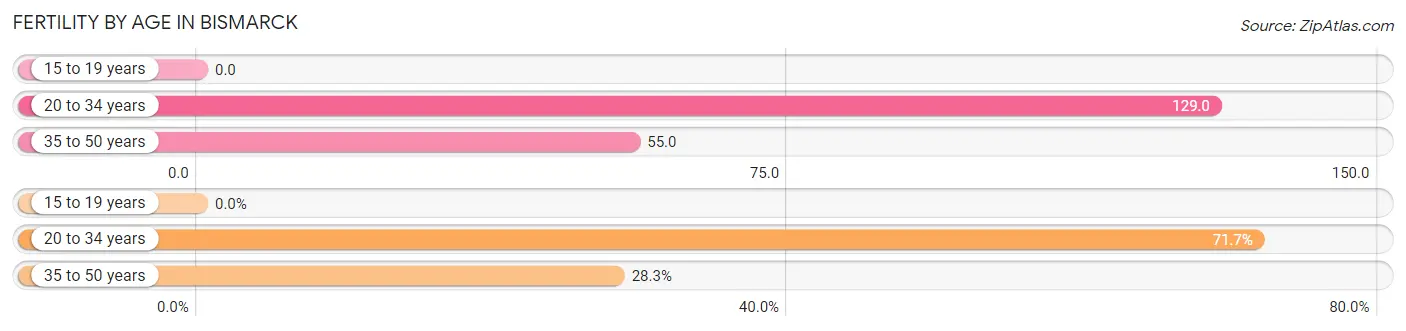
| Age Bracket | Women with Births | Births / 1,000 Women |
| 15 to 19 years | 0 (0.0%) | 0.0 |
| 20 to 34 years | 951 (71.7%) | 129.0 |
| 35 to 50 years | 375 (28.3%) | 55.0 |
| Total | 1,326 (100.0%) | 82.0 |
Fertility by Age by Marriage Status in Bismarck
78.0% of women with births (1,326) in Bismarck are married. The highest percentage of unmarried women with births falls into 35 to 50 years age bracket with 47.2% of them unmarried at the time of birth, while the lowest percentage of unmarried women with births belong to 20 to 34 years age bracket with 12.1% of them unmarried.
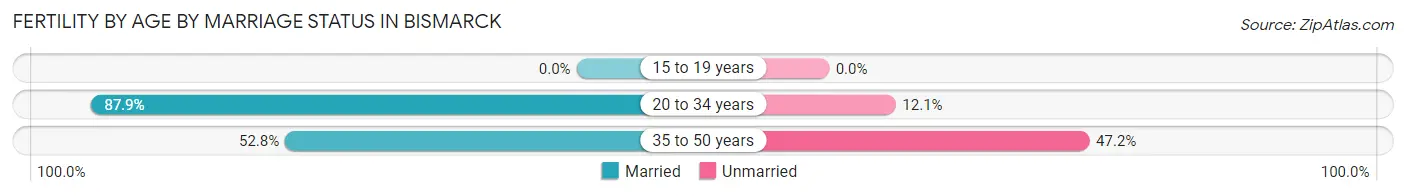
| Age Bracket | Married | Unmarried |
| 15 to 19 years | 0 (0.0%) | 0 (0.0%) |
| 20 to 34 years | 836 (87.9%) | 115 (12.1%) |
| 35 to 50 years | 198 (52.8%) | 177 (47.2%) |
| Total | 1,034 (78.0%) | 292 (22.0%) |
Fertility by Education in Bismarck
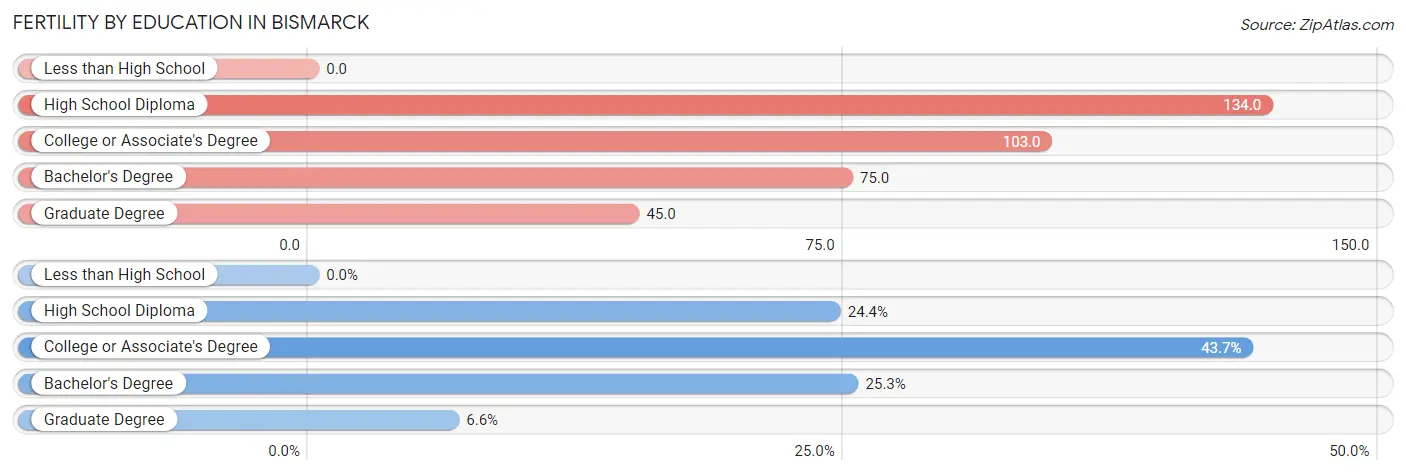
| Educational Attainment | Women with Births | Births / 1,000 Women |
| Less than High School | 0 (0.0%) | 0.0 |
| High School Diploma | 324 (24.4%) | 134.0 |
| College or Associate's Degree | 580 (43.7%) | 103.0 |
| Bachelor's Degree | 335 (25.3%) | 75.0 |
| Graduate Degree | 87 (6.6%) | 45.0 |
| Total | 1,326 (100.0%) | 82.0 |
Fertility by Education by Marriage Status in Bismarck
22.0% of women with births in Bismarck are unmarried. Women with the educational attainment of graduate degree are most likely to be married with 100.0% of them married at childbirth, while women with the educational attainment of high school diploma are least likely to be married with 54.6% of them unmarried at childbirth.
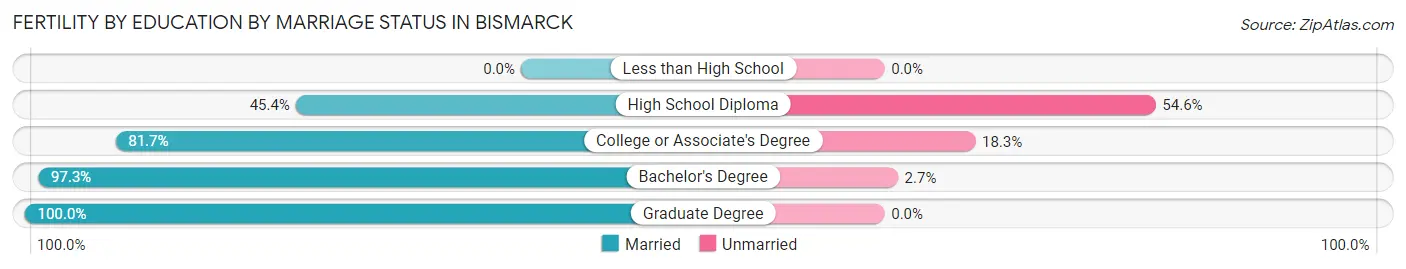
| Educational Attainment | Married | Unmarried |
| Less than High School | 0 (0.0%) | 0 (0.0%) |
| High School Diploma | 147 (45.4%) | 177 (54.6%) |
| College or Associate's Degree | 474 (81.7%) | 106 (18.3%) |
| Bachelor's Degree | 326 (97.3%) | 9 (2.7%) |
| Graduate Degree | 87 (100.0%) | 0 (0.0%) |
| Total | 1,034 (78.0%) | 292 (22.0%) |
Employment Characteristics in Bismarck
Employment by Class of Employer in Bismarck
Among the 37,422 employed individuals in Bismarck, private company employees (21,842 | 58.4%), not-for-profit organizations (4,839 | 12.9%), and state government employees (3,666 | 9.8%) make up the most common classes of employment.
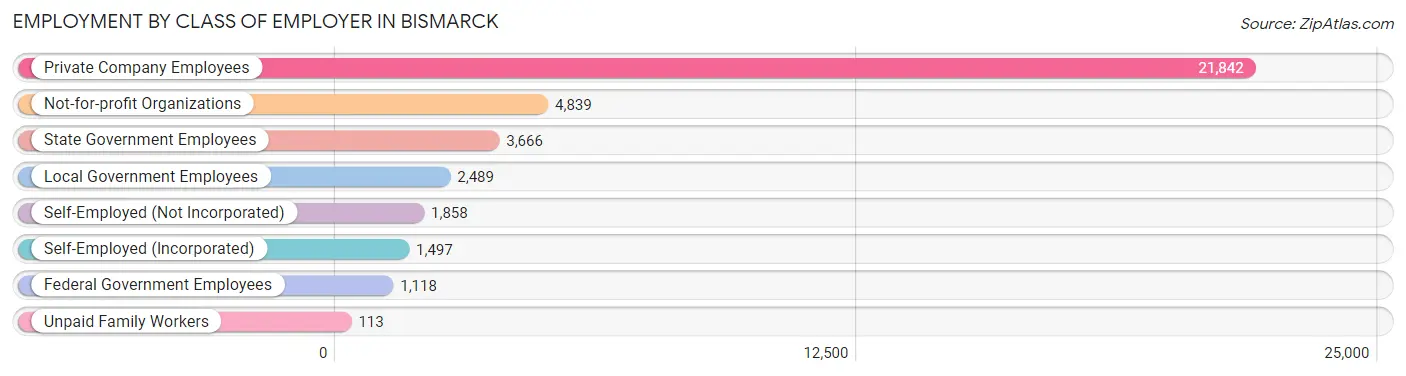
| Employer Class | # Employees | % Employees |
| Private Company Employees | 21,842 | 58.4% |
| Self-Employed (Incorporated) | 1,497 | 4.0% |
| Self-Employed (Not Incorporated) | 1,858 | 5.0% |
| Not-for-profit Organizations | 4,839 | 12.9% |
| Local Government Employees | 2,489 | 6.7% |
| State Government Employees | 3,666 | 9.8% |
| Federal Government Employees | 1,118 | 3.0% |
| Unpaid Family Workers | 113 | 0.3% |
| Total | 37,422 | 100.0% |
Employment Status by Age in Bismarck
According to the labor force statistics for Bismarck, out of the total population over 16 years of age (59,380), 65.8% or 39,072 individuals are in the labor force, with 3.1% or 1,211 of them unemployed. The age group with the highest labor force participation rate is 35 to 44 years, with 88.6% or 8,800 individuals in the labor force. Within the labor force, the 20 to 24 years age range has the highest percentage of unemployed individuals, with 11.4% or 494 of them being unemployed.
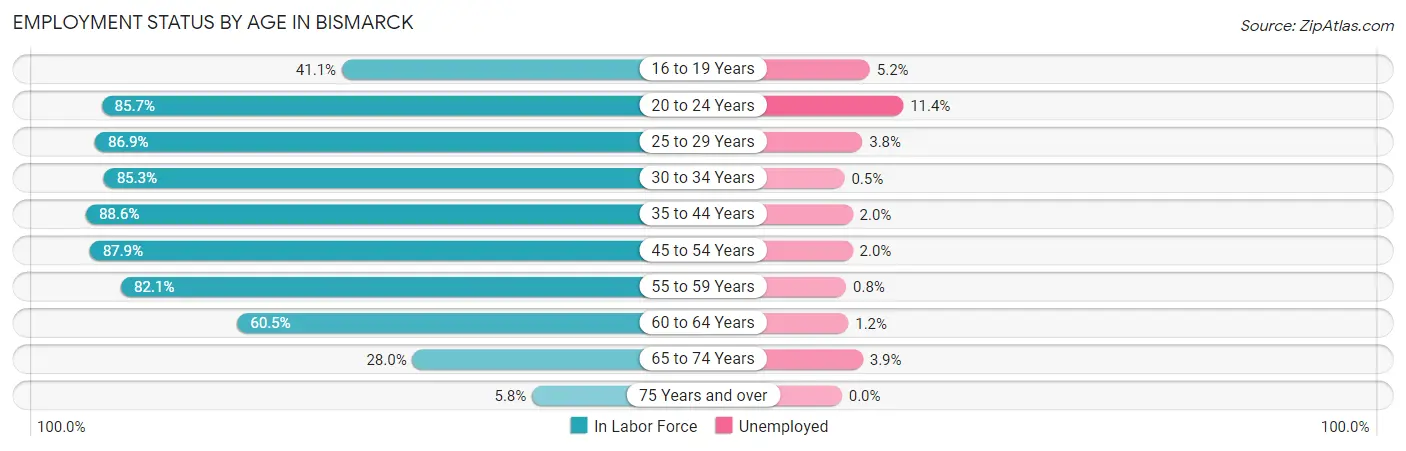
| Age Bracket | In Labor Force | Unemployed |
| 16 to 19 Years | 1,519 (41.1%) | 79 (5.2%) |
| 20 to 24 Years | 4,329 (85.7%) | 494 (11.4%) |
| 25 to 29 Years | 4,488 (86.9%) | 171 (3.8%) |
| 30 to 34 Years | 4,323 (85.3%) | 22 (0.5%) |
| 35 to 44 Years | 8,800 (88.6%) | 176 (2.0%) |
| 45 to 54 Years | 6,641 (87.9%) | 133 (2.0%) |
| 55 to 59 Years | 3,639 (82.1%) | 29 (0.8%) |
| 60 to 64 Years | 2,949 (60.5%) | 35 (1.2%) |
| 65 to 74 Years | 1,991 (28.0%) | 78 (3.9%) |
| 75 Years and over | 377 (5.8%) | 0 (0.0%) |
| Total | 39,072 (65.8%) | 1,211 (3.1%) |
Employment Status by Educational Attainment in Bismarck
According to labor force statistics for Bismarck, 83.3% of individuals (30,843) out of the total population between 25 and 64 years of age (37,026) are in the labor force, with 1.8% or 555 of them being unemployed. The group with the highest labor force participation rate are those with the educational attainment of bachelor's degree or higher, with 93.0% or 13,784 individuals in the labor force. Within the labor force, individuals with less than high school education have the highest percentage of unemployment, with 6.1% or 54 of them being unemployed.
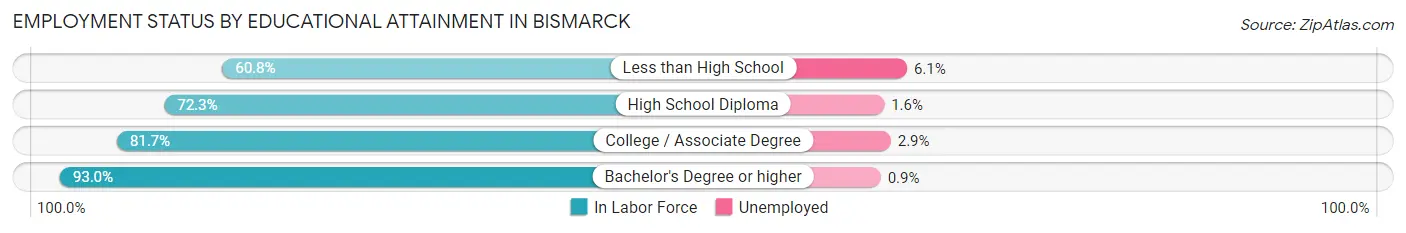
| Educational Attainment | In Labor Force | Unemployed |
| Less than High School | 891 (60.8%) | 89 (6.1%) |
| High School Diploma | 6,021 (72.3%) | 133 (1.6%) |
| College / Associate Degree | 10,140 (81.7%) | 360 (2.9%) |
| Bachelor's Degree or higher | 13,784 (93.0%) | 133 (0.9%) |
| Total | 30,843 (83.3%) | 666 (1.8%) |
Employment Occupations by Sex in Bismarck
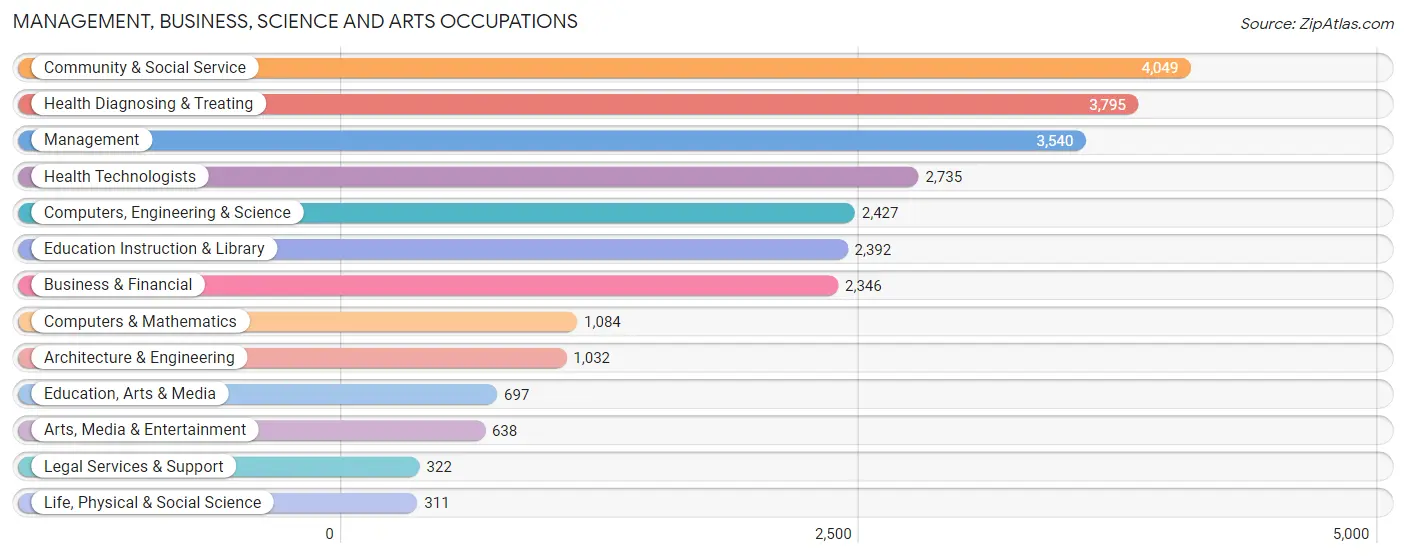
Management, Business, Science and Arts Occupations
The most common Management, Business, Science and Arts occupations in Bismarck are Community & Social Service (4,049 | 10.7%), Health Diagnosing & Treating (3,795 | 10.1%), Management (3,540 | 9.4%), Health Technologists (2,735 | 7.2%), and Computers, Engineering & Science (2,427 | 6.4%).
Management, Business, Science and Arts Occupations by Sex
Within the Management, Business, Science and Arts occupations in Bismarck, the most male-oriented occupations are Computers & Mathematics (84.0%), Computers, Engineering & Science (77.7%), and Architecture & Engineering (73.8%), while the most female-oriented occupations are Health Diagnosing & Treating (79.5%), Education Instruction & Library (77.7%), and Health Technologists (76.6%).
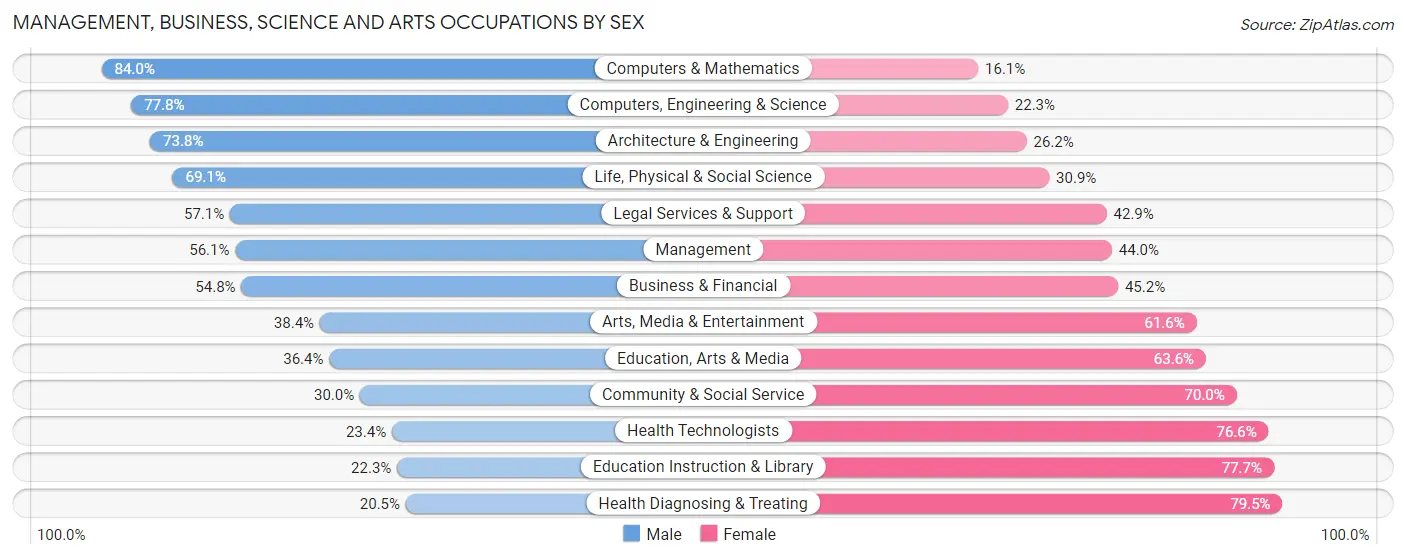
| Occupation | Male | Female |
| Management | 1,984 (56.0%) | 1,556 (44.0%) |
| Business & Financial | 1,285 (54.8%) | 1,061 (45.2%) |
| Computers, Engineering & Science | 1,887 (77.7%) | 540 (22.3%) |
| Computers & Mathematics | 910 (84.0%) | 174 (16.1%) |
| Architecture & Engineering | 762 (73.8%) | 270 (26.2%) |
| Life, Physical & Social Science | 215 (69.1%) | 96 (30.9%) |
| Community & Social Service | 1,216 (30.0%) | 2,833 (70.0%) |
| Education, Arts & Media | 254 (36.4%) | 443 (63.6%) |
| Legal Services & Support | 184 (57.1%) | 138 (42.9%) |
| Education Instruction & Library | 533 (22.3%) | 1,859 (77.7%) |
| Arts, Media & Entertainment | 245 (38.4%) | 393 (61.6%) |
| Health Diagnosing & Treating | 777 (20.5%) | 3,018 (79.5%) |
| Health Technologists | 639 (23.4%) | 2,096 (76.6%) |
| Total (Category) | 7,149 (44.3%) | 9,008 (55.7%) |
| Total (Overall) | 19,795 (52.4%) | 17,947 (47.5%) |
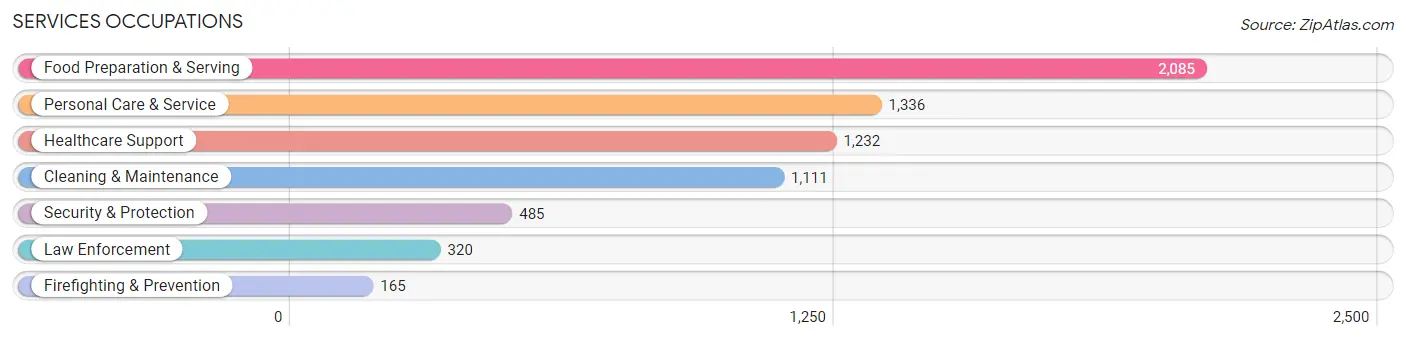
Services Occupations
The most common Services occupations in Bismarck are Food Preparation & Serving (2,085 | 5.5%), Personal Care & Service (1,336 | 3.5%), Healthcare Support (1,232 | 3.3%), Cleaning & Maintenance (1,111 | 2.9%), and Security & Protection (485 | 1.3%).
Services Occupations by Sex
Within the Services occupations in Bismarck, the most male-oriented occupations are Law Enforcement (97.5%), Security & Protection (81.7%), and Cleaning & Maintenance (64.7%), while the most female-oriented occupations are Healthcare Support (82.1%), Personal Care & Service (78.1%), and Firefighting & Prevention (49.1%).
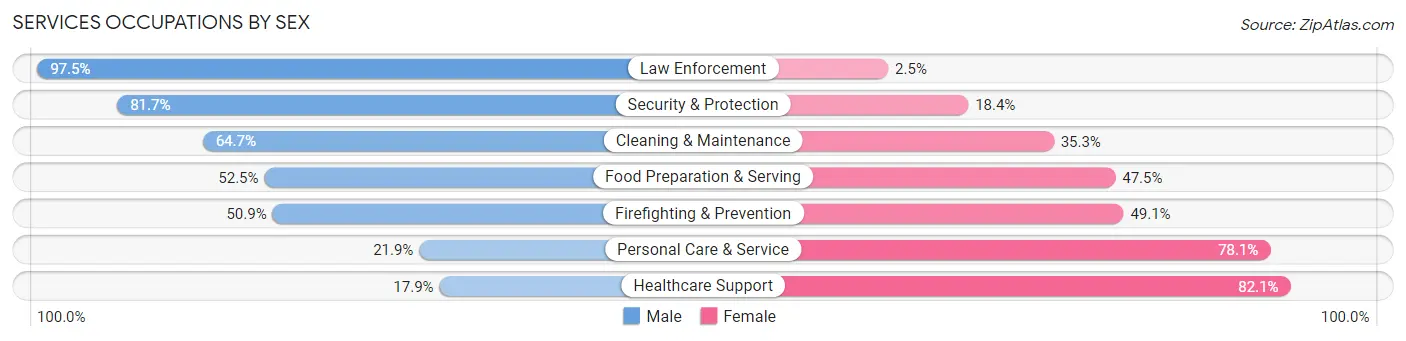
| Occupation | Male | Female |
| Healthcare Support | 220 (17.9%) | 1,012 (82.1%) |
| Security & Protection | 396 (81.7%) | 89 (18.3%) |
| Firefighting & Prevention | 84 (50.9%) | 81 (49.1%) |
| Law Enforcement | 312 (97.5%) | 8 (2.5%) |
| Food Preparation & Serving | 1,095 (52.5%) | 990 (47.5%) |
| Cleaning & Maintenance | 719 (64.7%) | 392 (35.3%) |
| Personal Care & Service | 292 (21.9%) | 1,044 (78.1%) |
| Total (Category) | 2,722 (43.6%) | 3,527 (56.4%) |
| Total (Overall) | 19,795 (52.4%) | 17,947 (47.5%) |
Sales and Office Occupations
The most common Sales and Office occupations in Bismarck are Office & Administration (4,122 | 10.9%), and Sales & Related (3,841 | 10.2%).

Sales and Office Occupations by Sex
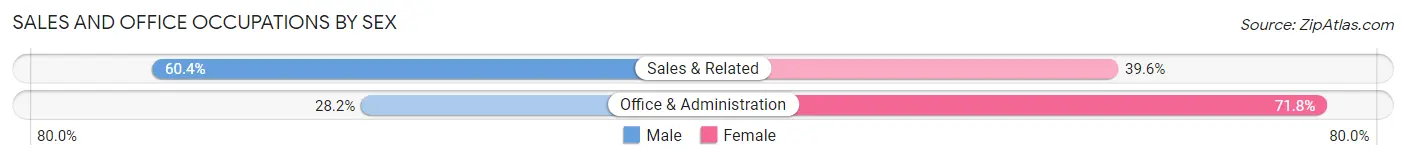
| Occupation | Male | Female |
| Sales & Related | 2,319 (60.4%) | 1,522 (39.6%) |
| Office & Administration | 1,164 (28.2%) | 2,958 (71.8%) |
| Total (Category) | 3,483 (43.7%) | 4,480 (56.3%) |
| Total (Overall) | 19,795 (52.4%) | 17,947 (47.5%) |
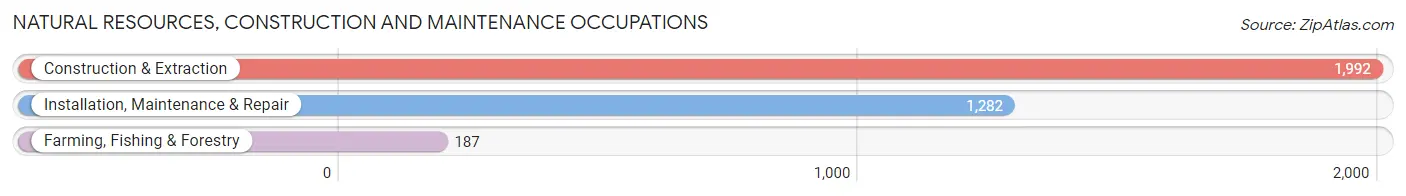
Natural Resources, Construction and Maintenance Occupations
The most common Natural Resources, Construction and Maintenance occupations in Bismarck are Construction & Extraction (1,992 | 5.3%), Installation, Maintenance & Repair (1,282 | 3.4%), and Farming, Fishing & Forestry (187 | 0.5%).
Natural Resources, Construction and Maintenance Occupations by Sex
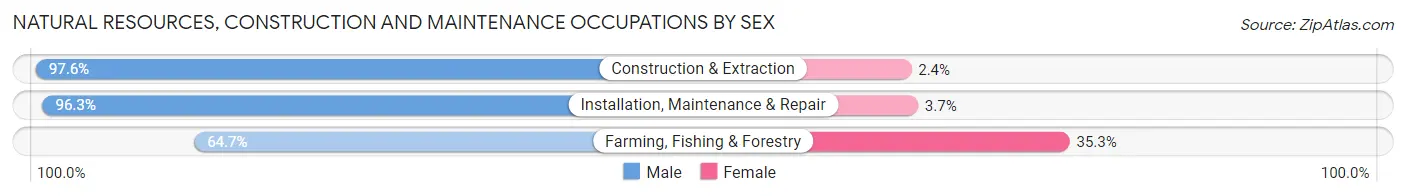
| Occupation | Male | Female |
| Farming, Fishing & Forestry | 121 (64.7%) | 66 (35.3%) |
| Construction & Extraction | 1,945 (97.6%) | 47 (2.4%) |
| Installation, Maintenance & Repair | 1,234 (96.3%) | 48 (3.7%) |
| Total (Category) | 3,300 (95.4%) | 161 (4.6%) |
| Total (Overall) | 19,795 (52.4%) | 17,947 (47.5%) |
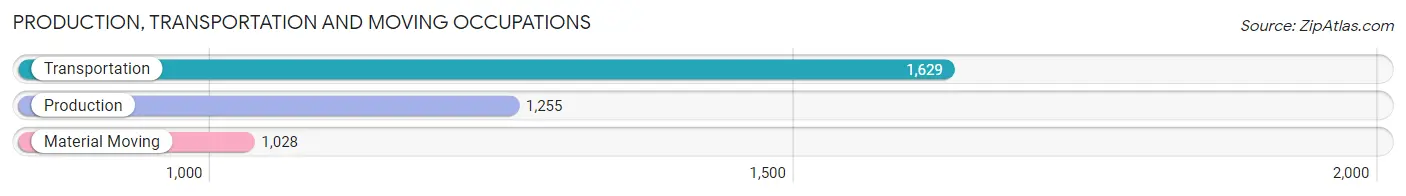
Production, Transportation and Moving Occupations
The most common Production, Transportation and Moving occupations in Bismarck are Transportation (1,629 | 4.3%), Production (1,255 | 3.3%), and Material Moving (1,028 | 2.7%).
Production, Transportation and Moving Occupations by Sex
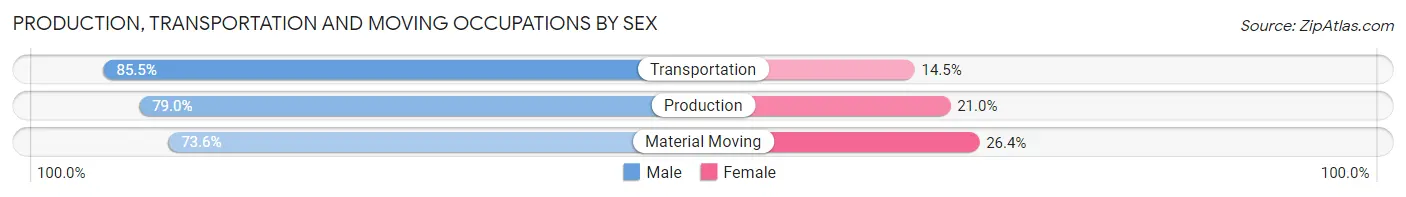
| Occupation | Male | Female |
| Production | 991 (79.0%) | 264 (21.0%) |
| Transportation | 1,393 (85.5%) | 236 (14.5%) |
| Material Moving | 757 (73.6%) | 271 (26.4%) |
| Total (Category) | 3,141 (80.3%) | 771 (19.7%) |
| Total (Overall) | 19,795 (52.4%) | 17,947 (47.5%) |
Employment Industries by Sex in Bismarck
Employment Industries in Bismarck
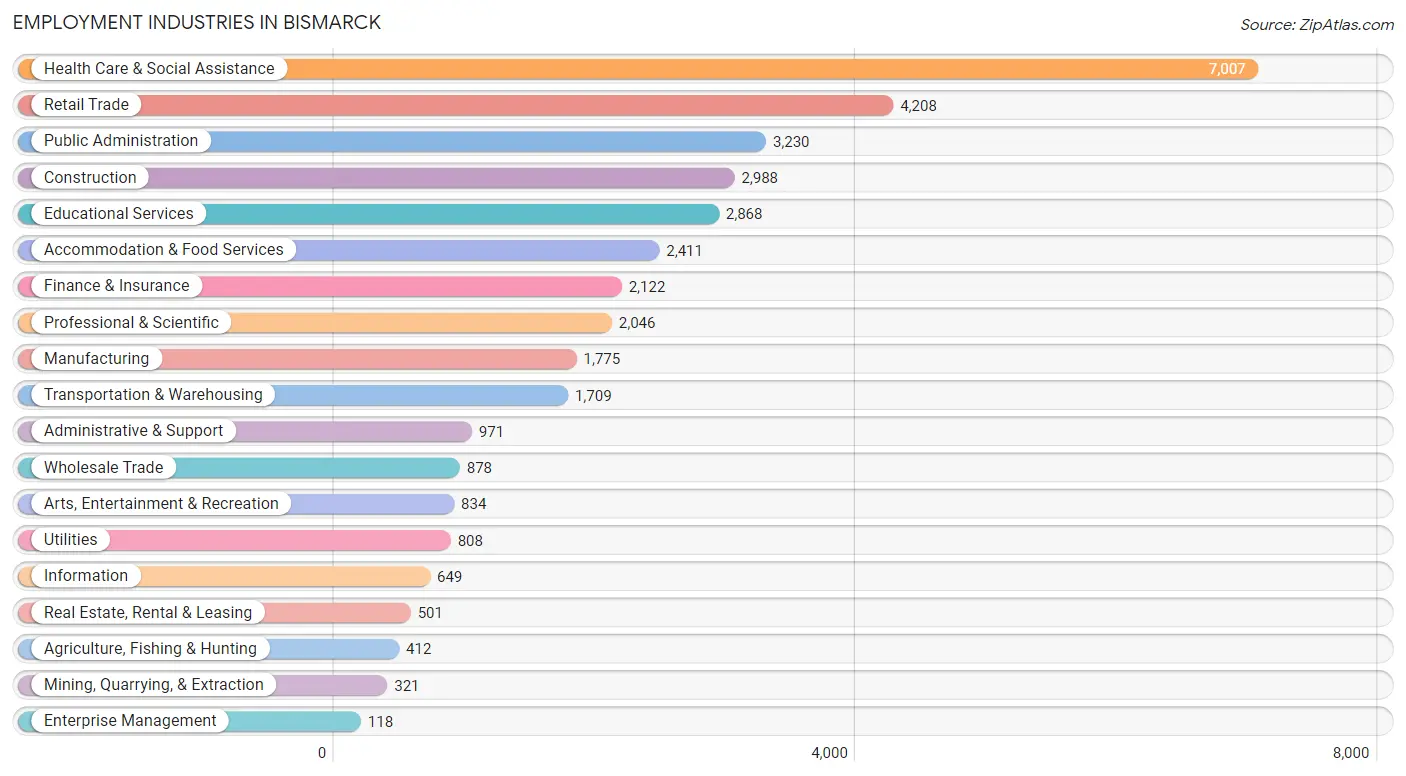
The major employment industries in Bismarck include Health Care & Social Assistance (7,007 | 18.6%), Retail Trade (4,208 | 11.2%), Public Administration (3,230 | 8.6%), Construction (2,988 | 7.9%), and Educational Services (2,868 | 7.6%).
Employment Industries by Sex in Bismarck
The Bismarck industries that see more men than women are Mining, Quarrying, & Extraction (97.5%), Construction (91.8%), and Wholesale Trade (82.2%), whereas the industries that tend to have a higher number of women are Health Care & Social Assistance (81.6%), Educational Services (73.6%), and Real Estate, Rental & Leasing (54.3%).
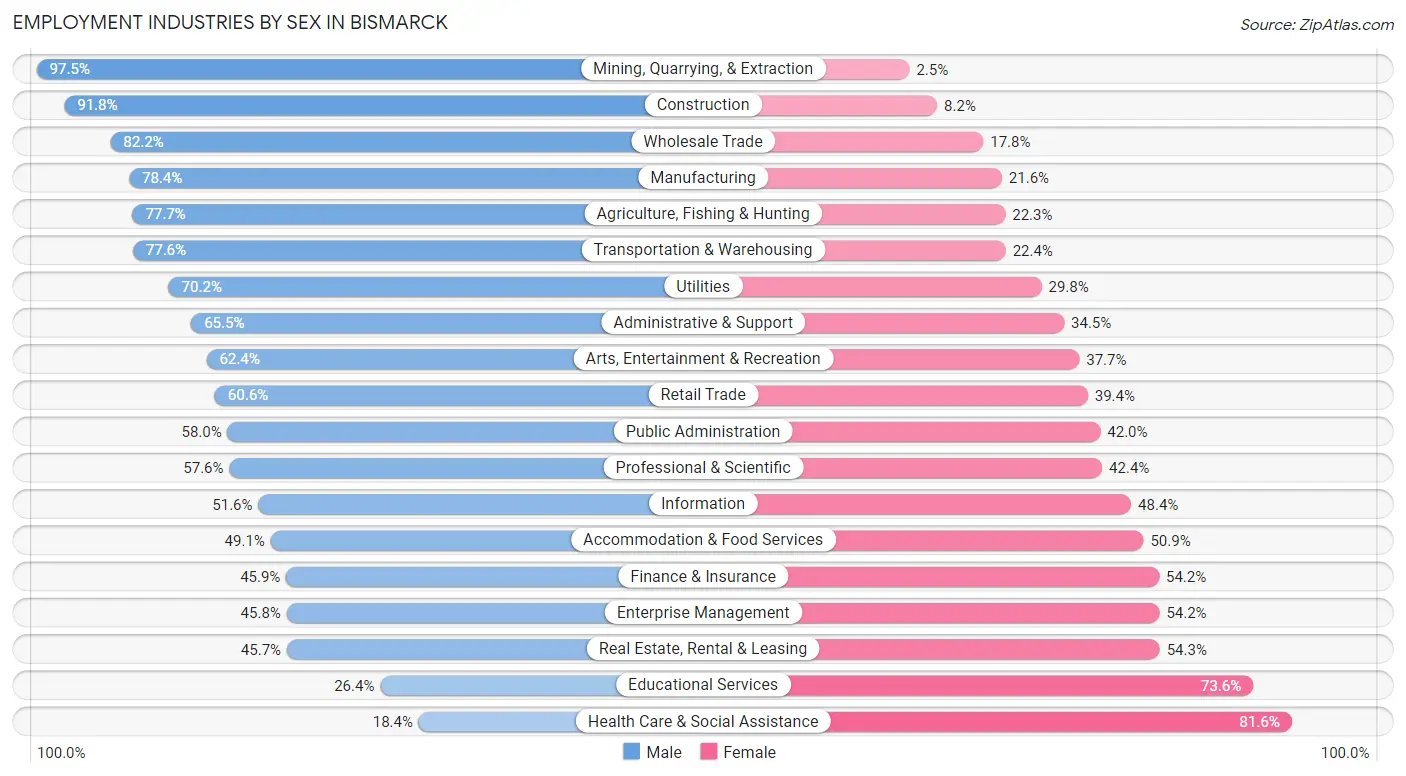
| Industry | Male | Female |
| Agriculture, Fishing & Hunting | 320 (77.7%) | 92 (22.3%) |
| Mining, Quarrying, & Extraction | 313 (97.5%) | 8 (2.5%) |
| Construction | 2,742 (91.8%) | 246 (8.2%) |
| Manufacturing | 1,391 (78.4%) | 384 (21.6%) |
| Wholesale Trade | 722 (82.2%) | 156 (17.8%) |
| Retail Trade | 2,550 (60.6%) | 1,658 (39.4%) |
| Transportation & Warehousing | 1,326 (77.6%) | 383 (22.4%) |
| Utilities | 567 (70.2%) | 241 (29.8%) |
| Information | 335 (51.6%) | 314 (48.4%) |
| Finance & Insurance | 973 (45.9%) | 1,149 (54.1%) |
| Real Estate, Rental & Leasing | 229 (45.7%) | 272 (54.3%) |
| Professional & Scientific | 1,179 (57.6%) | 867 (42.4%) |
| Enterprise Management | 54 (45.8%) | 64 (54.2%) |
| Administrative & Support | 636 (65.5%) | 335 (34.5%) |
| Educational Services | 757 (26.4%) | 2,111 (73.6%) |
| Health Care & Social Assistance | 1,290 (18.4%) | 5,717 (81.6%) |
| Arts, Entertainment & Recreation | 520 (62.4%) | 314 (37.7%) |
| Accommodation & Food Services | 1,183 (49.1%) | 1,228 (50.9%) |
| Public Administration | 1,873 (58.0%) | 1,357 (42.0%) |
| Total | 19,795 (52.4%) | 17,947 (47.5%) |
Education in Bismarck
School Enrollment in Bismarck
The most common levels of schooling among the 16,283 students in Bismarck are middle school (3,883 | 23.8%), high school (3,175 | 19.5%), and elementary school (3,008 | 18.5%).
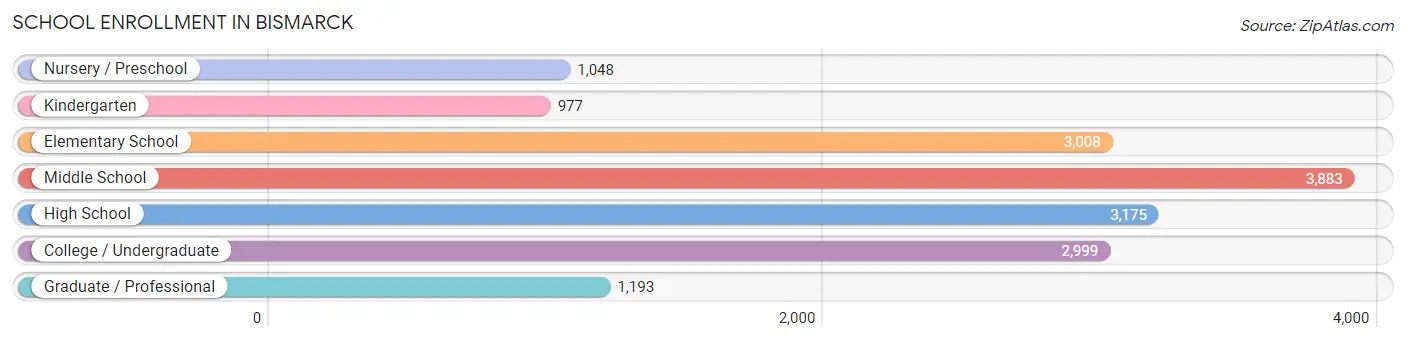
| School Level | # Students | % Students |
| Nursery / Preschool | 1,048 | 6.4% |
| Kindergarten | 977 | 6.0% |
| Elementary School | 3,008 | 18.5% |
| Middle School | 3,883 | 23.8% |
| High School | 3,175 | 19.5% |
| College / Undergraduate | 2,999 | 18.4% |
| Graduate / Professional | 1,193 | 7.3% |
| Total | 16,283 | 100.0% |
School Enrollment by Age by Funding Source in Bismarck
Out of a total of 16,283 students who are enrolled in schools in Bismarck, 2,915 (17.9%) attend a private institution, while the remaining 13,368 (82.1%) are enrolled in public schools. The age group of 3 to 4 year olds has the highest likelihood of being enrolled in private schools, with 352 (54.4% in the age bracket) enrolled. Conversely, the age group of 15 to 17 year olds has the lowest likelihood of being enrolled in a private school, with 2,394 (93.0% in the age bracket) attending a public institution.
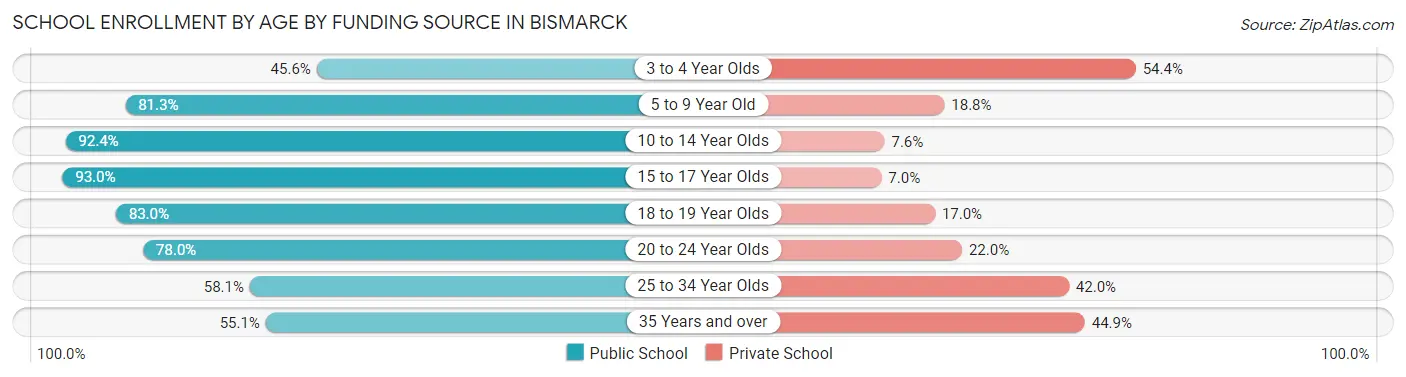
| Age Bracket | Public School | Private School |
| 3 to 4 Year Olds | 295 (45.6%) | 352 (54.4%) |
| 5 to 9 Year Old | 2,986 (81.2%) | 689 (18.8%) |
| 10 to 14 Year Olds | 4,336 (92.4%) | 357 (7.6%) |
| 15 to 17 Year Olds | 2,394 (93.0%) | 181 (7.0%) |
| 18 to 19 Year Olds | 1,035 (83.0%) | 212 (17.0%) |
| 20 to 24 Year Olds | 1,365 (78.0%) | 386 (22.0%) |
| 25 to 34 Year Olds | 494 (58.1%) | 357 (41.9%) |
| 35 Years and over | 465 (55.1%) | 379 (44.9%) |
| Total | 13,368 (82.1%) | 2,915 (17.9%) |
Educational Attainment by Field of Study in Bismarck
Business (3,840 | 18.3%), education (3,625 | 17.3%), science & technology (3,439 | 16.4%), arts & humanities (1,794 | 8.6%), and engineering (1,361 | 6.5%) are the most common fields of study among 20,984 individuals in Bismarck who have obtained a bachelor's degree or higher.
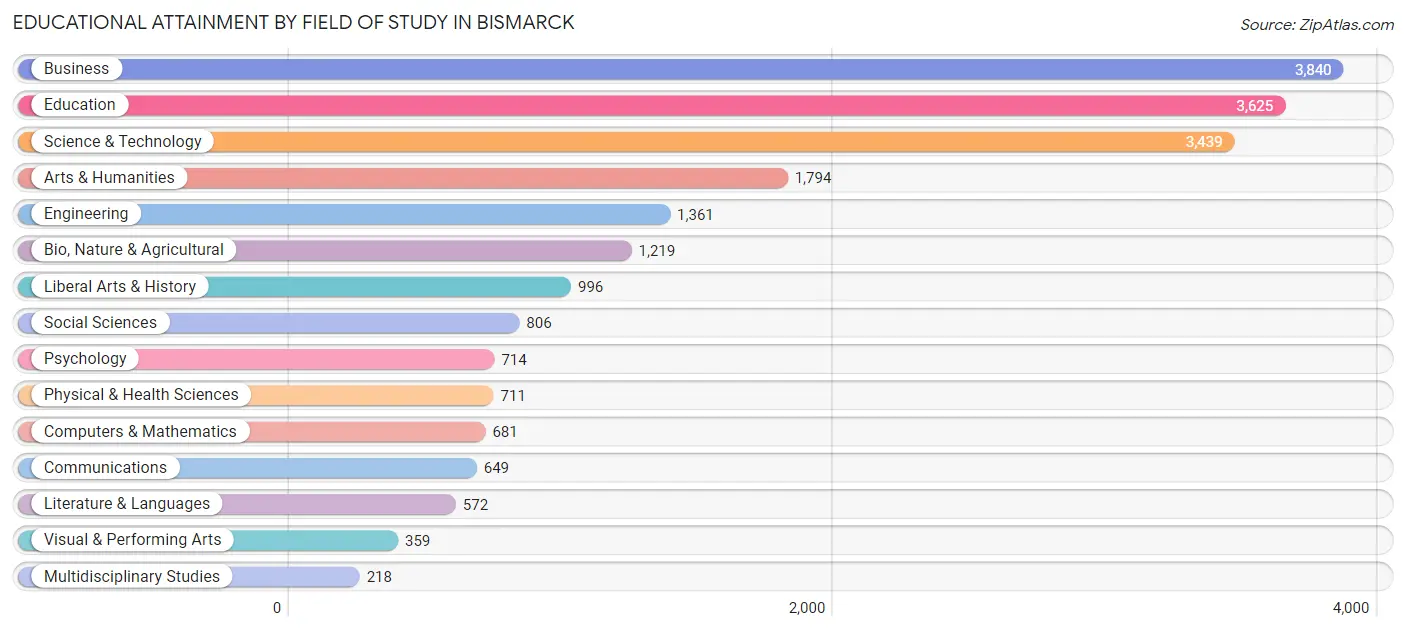
| Field of Study | # Graduates | % Graduates |
| Computers & Mathematics | 681 | 3.3% |
| Bio, Nature & Agricultural | 1,219 | 5.8% |
| Physical & Health Sciences | 711 | 3.4% |
| Psychology | 714 | 3.4% |
| Social Sciences | 806 | 3.8% |
| Engineering | 1,361 | 6.5% |
| Multidisciplinary Studies | 218 | 1.0% |
| Science & Technology | 3,439 | 16.4% |
| Business | 3,840 | 18.3% |
| Education | 3,625 | 17.3% |
| Literature & Languages | 572 | 2.7% |
| Liberal Arts & History | 996 | 4.8% |
| Visual & Performing Arts | 359 | 1.7% |
| Communications | 649 | 3.1% |
| Arts & Humanities | 1,794 | 8.6% |
| Total | 20,984 | 100.0% |
Transportation & Commute in Bismarck
Vehicle Availability by Sex in Bismarck
The most prevalent vehicle ownership categories in Bismarck are males with 2 vehicles (8,488, accounting for 43.1%) and females with 2 vehicles (7,431, making up 48.5%).
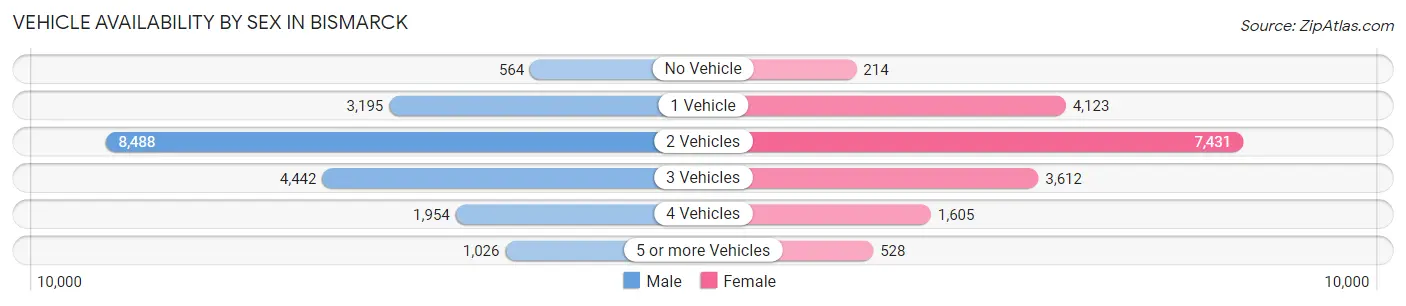
| Vehicles Available | Male | Female |
| No Vehicle | 564 (2.9%) | 214 (1.2%) |
| 1 Vehicle | 3,195 (16.2%) | 4,123 (23.5%) |
| 2 Vehicles | 8,488 (43.1%) | 7,431 (42.4%) |
| 3 Vehicles | 4,442 (22.6%) | 3,612 (20.6%) |
| 4 Vehicles | 1,954 (9.9%) | 1,605 (9.2%) |
| 5 or more Vehicles | 1,026 (5.2%) | 528 (3.0%) |
| Total | 19,669 (100.0%) | 17,513 (100.0%) |
Commute Time in Bismarck
The most frequently occuring commute durations in Bismarck are 10 to 14 minutes (11,166 commuters, 31.7%), 15 to 19 minutes (8,523 commuters, 24.2%), and 5 to 9 minutes (7,486 commuters, 21.2%).
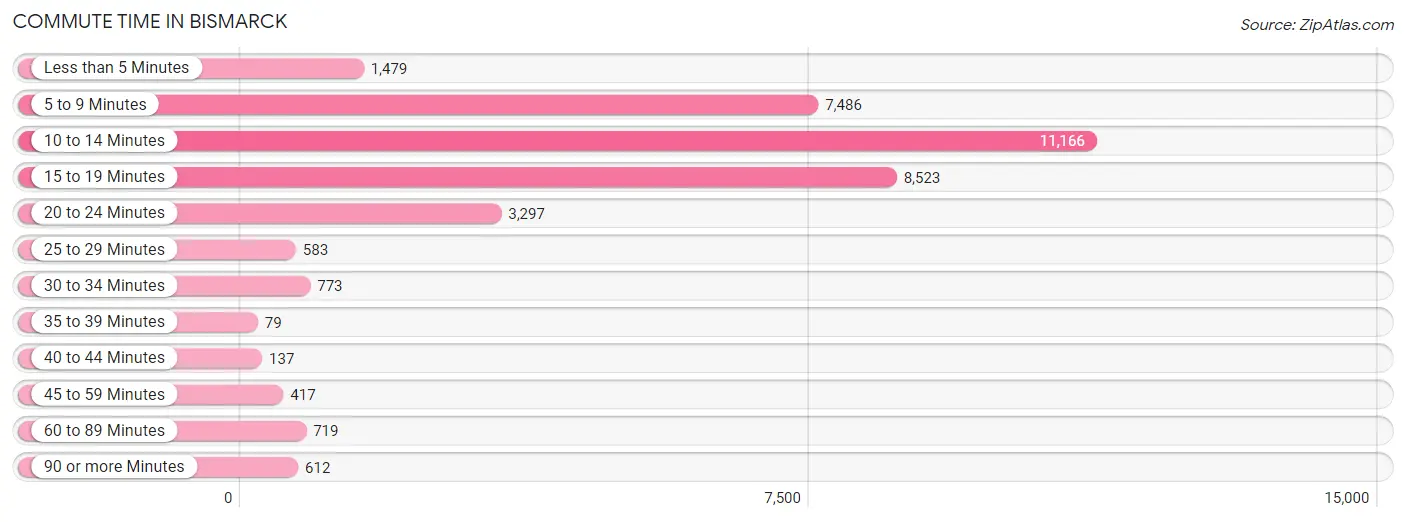
| Commute Time | # Commuters | % Commuters |
| Less than 5 Minutes | 1,479 | 4.2% |
| 5 to 9 Minutes | 7,486 | 21.2% |
| 10 to 14 Minutes | 11,166 | 31.7% |
| 15 to 19 Minutes | 8,523 | 24.2% |
| 20 to 24 Minutes | 3,297 | 9.3% |
| 25 to 29 Minutes | 583 | 1.7% |
| 30 to 34 Minutes | 773 | 2.2% |
| 35 to 39 Minutes | 79 | 0.2% |
| 40 to 44 Minutes | 137 | 0.4% |
| 45 to 59 Minutes | 417 | 1.2% |
| 60 to 89 Minutes | 719 | 2.0% |
| 90 or more Minutes | 612 | 1.7% |
Commute Time by Sex in Bismarck
The most common commute times in Bismarck are 10 to 14 minutes (6,192 commuters, 33.2%) for males and 10 to 14 minutes (4,974 commuters, 30.0%) for females.
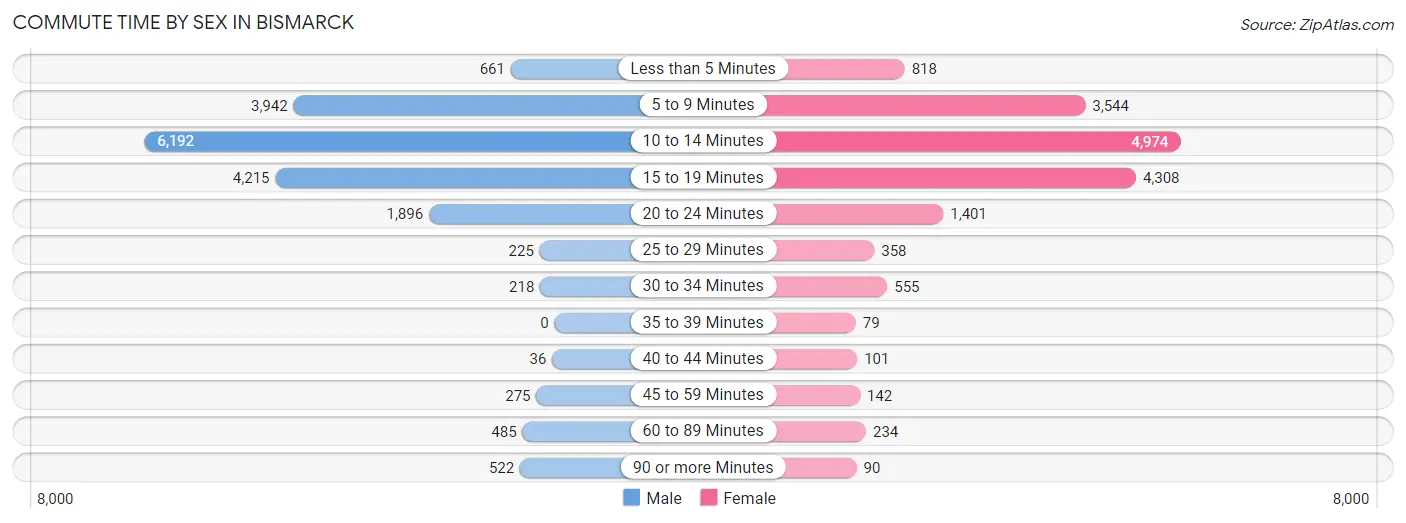
| Commute Time | Male | Female |
| Less than 5 Minutes | 661 (3.5%) | 818 (4.9%) |
| 5 to 9 Minutes | 3,942 (21.1%) | 3,544 (21.3%) |
| 10 to 14 Minutes | 6,192 (33.2%) | 4,974 (30.0%) |
| 15 to 19 Minutes | 4,215 (22.6%) | 4,308 (26.0%) |
| 20 to 24 Minutes | 1,896 (10.2%) | 1,401 (8.4%) |
| 25 to 29 Minutes | 225 (1.2%) | 358 (2.2%) |
| 30 to 34 Minutes | 218 (1.2%) | 555 (3.3%) |
| 35 to 39 Minutes | 0 (0.0%) | 79 (0.5%) |
| 40 to 44 Minutes | 36 (0.2%) | 101 (0.6%) |
| 45 to 59 Minutes | 275 (1.5%) | 142 (0.9%) |
| 60 to 89 Minutes | 485 (2.6%) | 234 (1.4%) |
| 90 or more Minutes | 522 (2.8%) | 90 (0.5%) |
Time of Departure to Work by Sex in Bismarck
The most frequent times of departure to work in Bismarck are 7:30 AM to 7:59 AM (4,171, 22.3%) for males and 7:30 AM to 7:59 AM (4,082, 24.6%) for females.
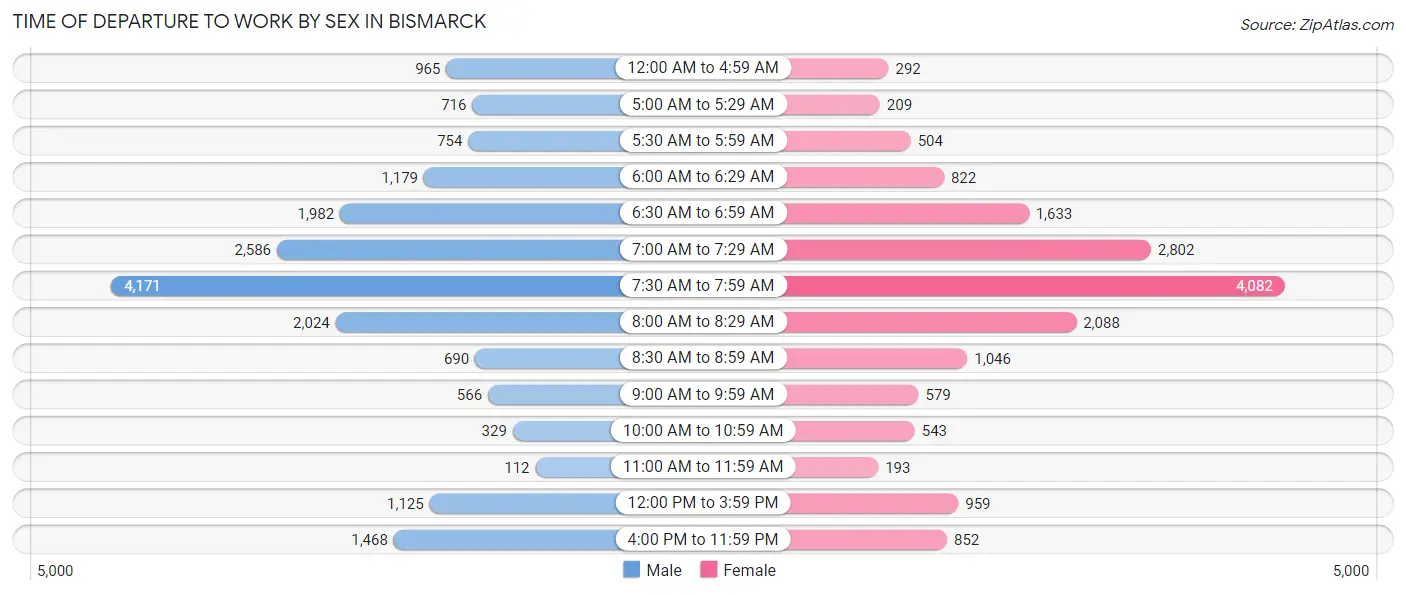
| Time of Departure | Male | Female |
| 12:00 AM to 4:59 AM | 965 (5.2%) | 292 (1.8%) |
| 5:00 AM to 5:29 AM | 716 (3.8%) | 209 (1.3%) |
| 5:30 AM to 5:59 AM | 754 (4.0%) | 504 (3.0%) |
| 6:00 AM to 6:29 AM | 1,179 (6.3%) | 822 (5.0%) |
| 6:30 AM to 6:59 AM | 1,982 (10.6%) | 1,633 (9.8%) |
| 7:00 AM to 7:29 AM | 2,586 (13.9%) | 2,802 (16.9%) |
| 7:30 AM to 7:59 AM | 4,171 (22.3%) | 4,082 (24.6%) |
| 8:00 AM to 8:29 AM | 2,024 (10.8%) | 2,088 (12.6%) |
| 8:30 AM to 8:59 AM | 690 (3.7%) | 1,046 (6.3%) |
| 9:00 AM to 9:59 AM | 566 (3.0%) | 579 (3.5%) |
| 10:00 AM to 10:59 AM | 329 (1.8%) | 543 (3.3%) |
| 11:00 AM to 11:59 AM | 112 (0.6%) | 193 (1.2%) |
| 12:00 PM to 3:59 PM | 1,125 (6.0%) | 959 (5.8%) |
| 4:00 PM to 11:59 PM | 1,468 (7.9%) | 852 (5.1%) |
| Total | 18,667 (100.0%) | 16,604 (100.0%) |
Housing Occupancy in Bismarck
Occupancy by Ownership in Bismarck
Of the total 31,716 dwellings in Bismarck, owner-occupied units account for 20,756 (65.4%), while renter-occupied units make up 10,960 (34.6%).
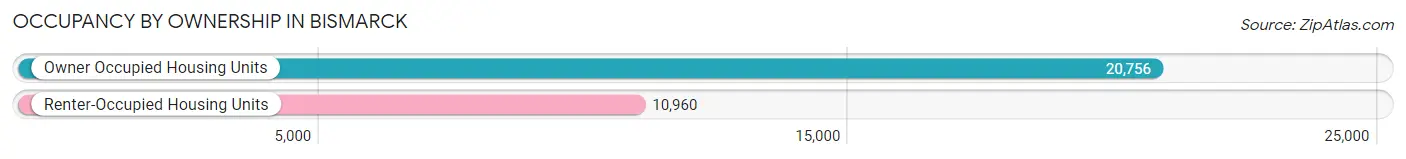
| Occupancy | # Housing Units | % Housing Units |
| Owner Occupied Housing Units | 20,756 | 65.4% |
| Renter-Occupied Housing Units | 10,960 | 34.6% |
| Total Occupied Housing Units | 31,716 | 100.0% |
Occupancy by Household Size in Bismarck
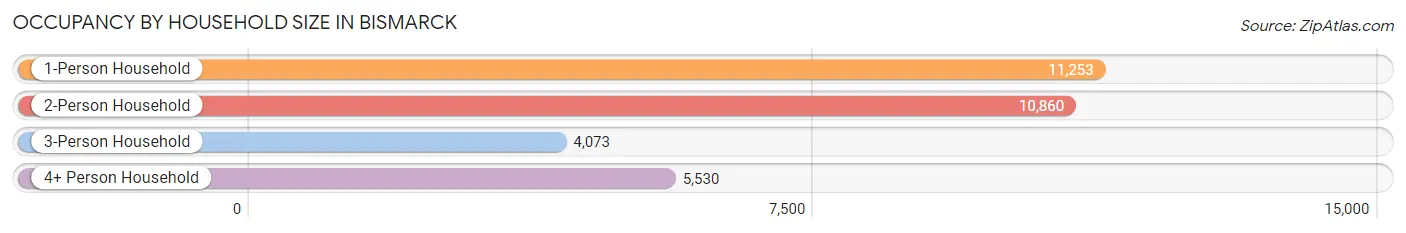
| Household Size | # Housing Units | % Housing Units |
| 1-Person Household | 11,253 | 35.5% |
| 2-Person Household | 10,860 | 34.2% |
| 3-Person Household | 4,073 | 12.8% |
| 4+ Person Household | 5,530 | 17.4% |
| Total Housing Units | 31,716 | 100.0% |
Occupancy by Ownership by Household Size in Bismarck
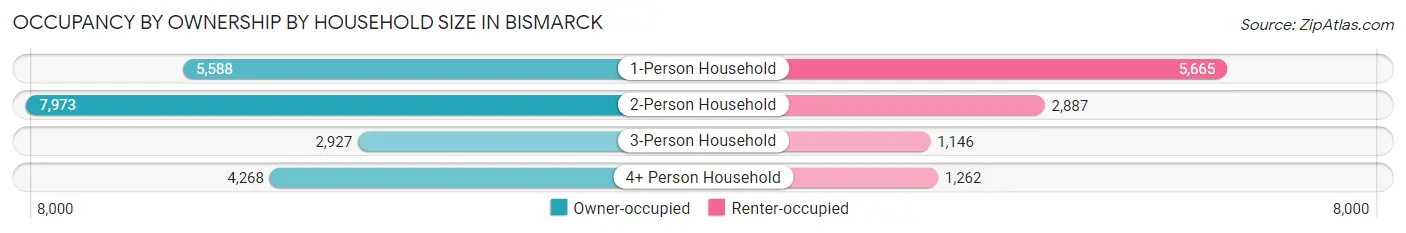
| Household Size | Owner-occupied | Renter-occupied |
| 1-Person Household | 5,588 (49.7%) | 5,665 (50.3%) |
| 2-Person Household | 7,973 (73.4%) | 2,887 (26.6%) |
| 3-Person Household | 2,927 (71.9%) | 1,146 (28.1%) |
| 4+ Person Household | 4,268 (77.2%) | 1,262 (22.8%) |
| Total Housing Units | 20,756 (65.4%) | 10,960 (34.6%) |
Occupancy by Educational Attainment in Bismarck
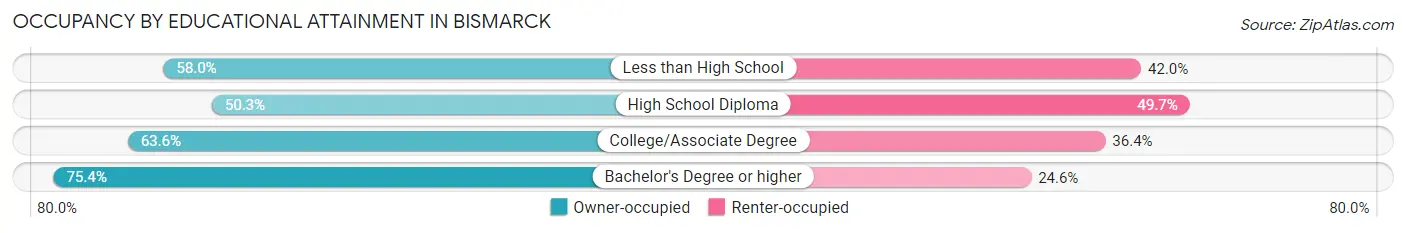
| Household Size | Owner-occupied | Renter-occupied |
| Less than High School | 661 (58.0%) | 479 (42.0%) |
| High School Diploma | 3,246 (50.3%) | 3,209 (49.7%) |
| College/Associate Degree | 7,243 (63.6%) | 4,139 (36.4%) |
| Bachelor's Degree or higher | 9,606 (75.4%) | 3,133 (24.6%) |
Occupancy by Age of Householder in Bismarck
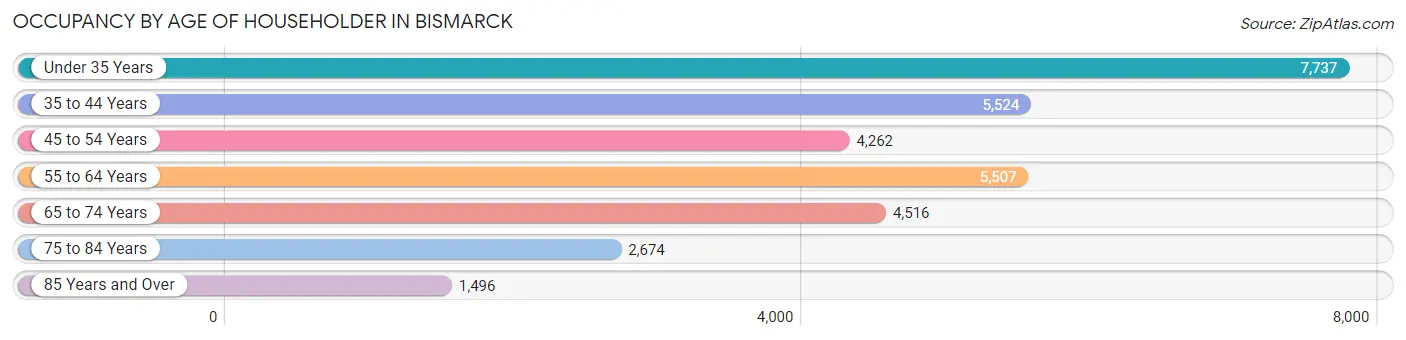
| Age Bracket | # Households | % Households |
| Under 35 Years | 7,737 | 24.4% |
| 35 to 44 Years | 5,524 | 17.4% |
| 45 to 54 Years | 4,262 | 13.4% |
| 55 to 64 Years | 5,507 | 17.4% |
| 65 to 74 Years | 4,516 | 14.2% |
| 75 to 84 Years | 2,674 | 8.4% |
| 85 Years and Over | 1,496 | 4.7% |
| Total | 31,716 | 100.0% |
Housing Finances in Bismarck
Median Income by Occupancy in Bismarck
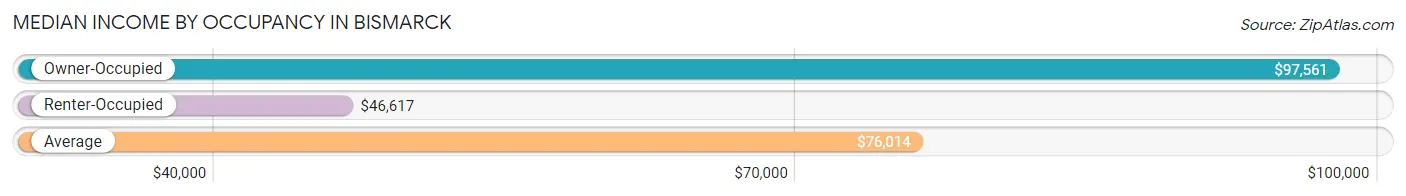
| Occupancy Type | # Households | Median Income |
| Owner-Occupied | 20,756 (65.4%) | $97,561 |
| Renter-Occupied | 10,960 (34.6%) | $46,617 |
| Average | 31,716 (100.0%) | $76,014 |
Occupancy by Householder Income Bracket in Bismarck
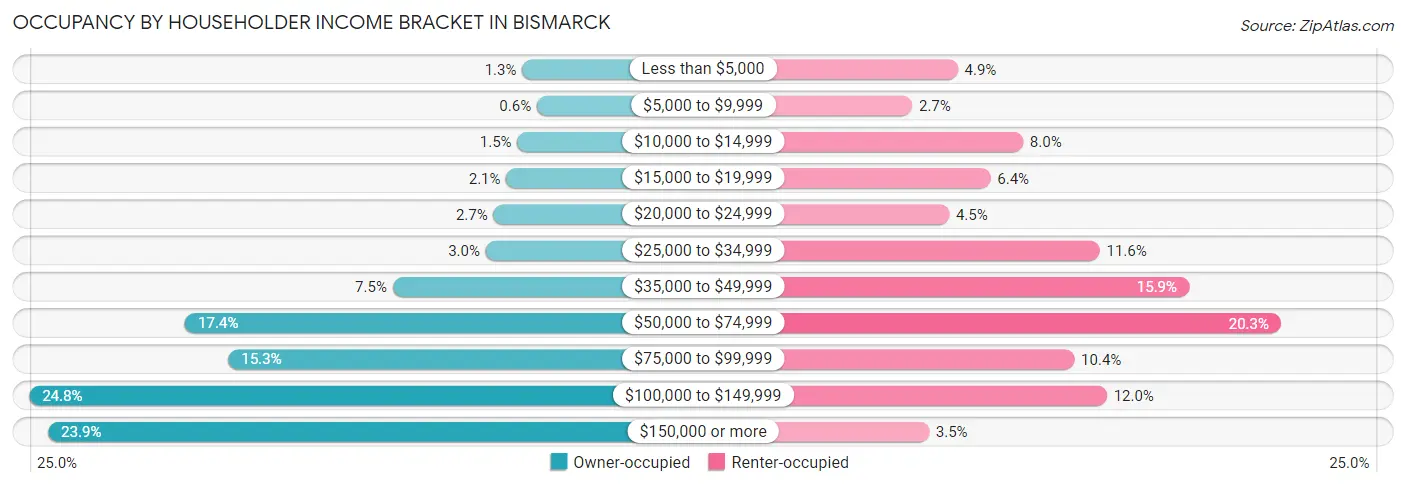
| Income Bracket | Owner-occupied | Renter-occupied |
| Less than $5,000 | 270 (1.3%) | 533 (4.9%) |
| $5,000 to $9,999 | 124 (0.6%) | 295 (2.7%) |
| $10,000 to $14,999 | 318 (1.5%) | 874 (8.0%) |
| $15,000 to $19,999 | 428 (2.1%) | 704 (6.4%) |
| $20,000 to $24,999 | 555 (2.7%) | 488 (4.4%) |
| $25,000 to $34,999 | 632 (3.0%) | 1,274 (11.6%) |
| $35,000 to $49,999 | 1,550 (7.5%) | 1,739 (15.9%) |
| $50,000 to $74,999 | 3,604 (17.4%) | 2,219 (20.3%) |
| $75,000 to $99,999 | 3,176 (15.3%) | 1,141 (10.4%) |
| $100,000 to $149,999 | 5,143 (24.8%) | 1,311 (12.0%) |
| $150,000 or more | 4,956 (23.9%) | 382 (3.5%) |
| Total | 20,756 (100.0%) | 10,960 (100.0%) |
Monthly Housing Cost Tiers in Bismarck
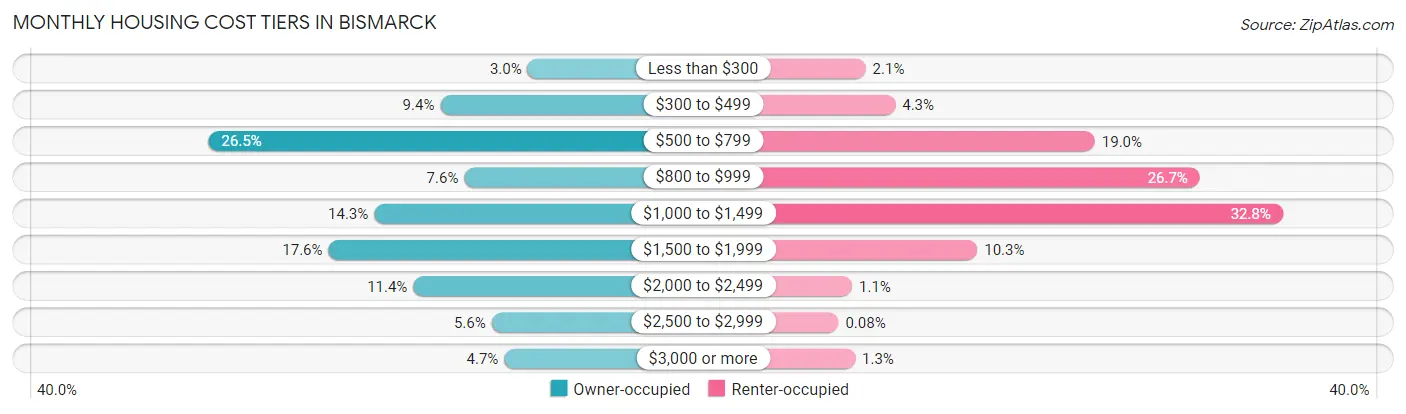
| Monthly Cost | Owner-occupied | Renter-occupied |
| Less than $300 | 615 (3.0%) | 228 (2.1%) |
| $300 to $499 | 1,949 (9.4%) | 467 (4.3%) |
| $500 to $799 | 5,492 (26.5%) | 2,078 (19.0%) |
| $800 to $999 | 1,582 (7.6%) | 2,924 (26.7%) |
| $1,000 to $1,499 | 2,960 (14.3%) | 3,594 (32.8%) |
| $1,500 to $1,999 | 3,659 (17.6%) | 1,129 (10.3%) |
| $2,000 to $2,499 | 2,363 (11.4%) | 118 (1.1%) |
| $2,500 to $2,999 | 1,165 (5.6%) | 9 (0.1%) |
| $3,000 or more | 971 (4.7%) | 142 (1.3%) |
| Total | 20,756 (100.0%) | 10,960 (100.0%) |
Physical Housing Characteristics in Bismarck
Housing Structures in Bismarck
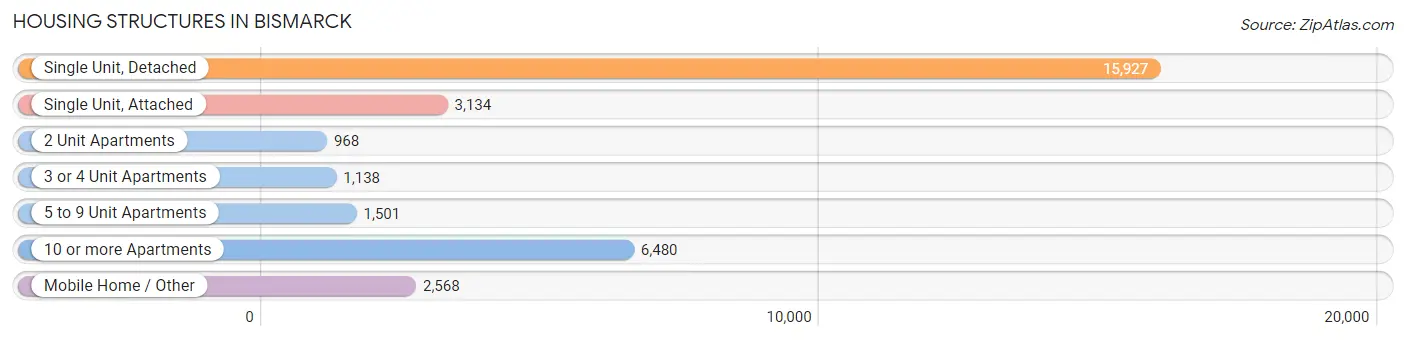
| Structure Type | # Housing Units | % Housing Units |
| Single Unit, Detached | 15,927 | 50.2% |
| Single Unit, Attached | 3,134 | 9.9% |
| 2 Unit Apartments | 968 | 3.0% |
| 3 or 4 Unit Apartments | 1,138 | 3.6% |
| 5 to 9 Unit Apartments | 1,501 | 4.7% |
| 10 or more Apartments | 6,480 | 20.4% |
| Mobile Home / Other | 2,568 | 8.1% |
| Total | 31,716 | 100.0% |
Housing Structures by Occupancy in Bismarck
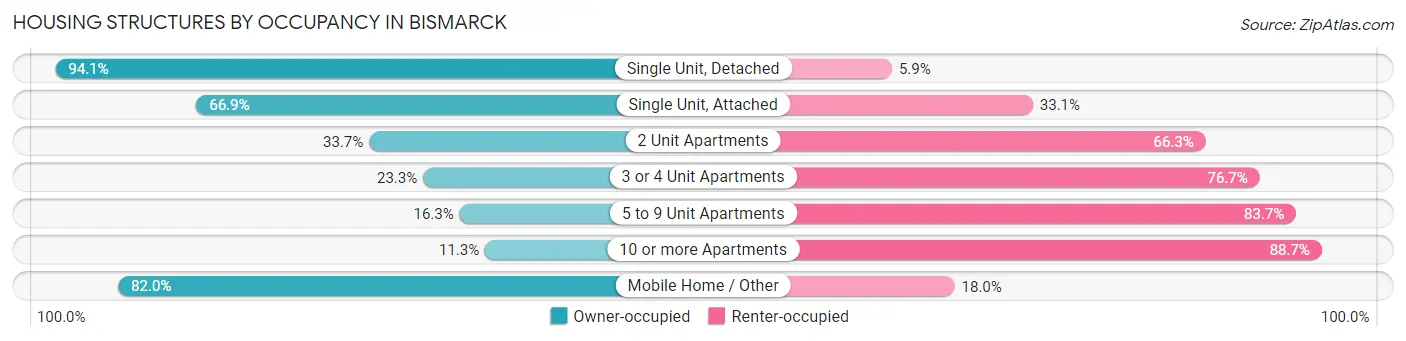
| Structure Type | Owner-occupied | Renter-occupied |
| Single Unit, Detached | 14,982 (94.1%) | 945 (5.9%) |
| Single Unit, Attached | 2,098 (66.9%) | 1,036 (33.1%) |
| 2 Unit Apartments | 326 (33.7%) | 642 (66.3%) |
| 3 or 4 Unit Apartments | 265 (23.3%) | 873 (76.7%) |
| 5 to 9 Unit Apartments | 244 (16.3%) | 1,257 (83.7%) |
| 10 or more Apartments | 735 (11.3%) | 5,745 (88.7%) |
| Mobile Home / Other | 2,106 (82.0%) | 462 (18.0%) |
| Total | 20,756 (65.4%) | 10,960 (34.6%) |
Housing Structures by Number of Rooms in Bismarck
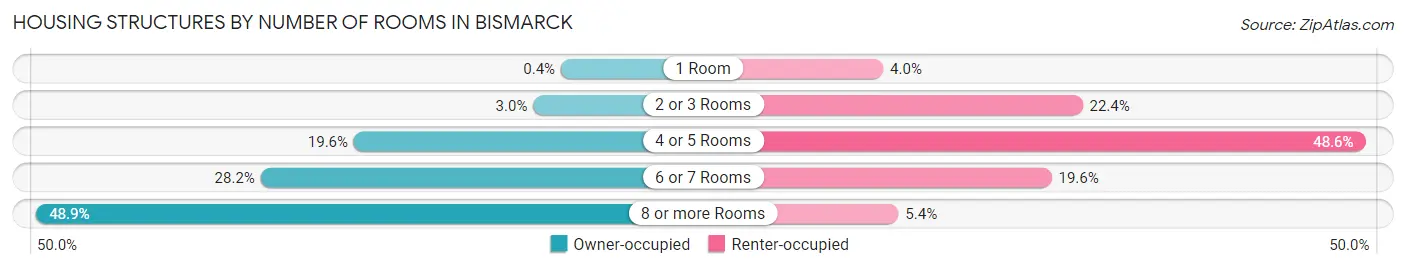
| Number of Rooms | Owner-occupied | Renter-occupied |
| 1 Room | 84 (0.4%) | 438 (4.0%) |
| 2 or 3 Rooms | 614 (3.0%) | 2,459 (22.4%) |
| 4 or 5 Rooms | 4,058 (19.6%) | 5,325 (48.6%) |
| 6 or 7 Rooms | 5,847 (28.2%) | 2,145 (19.6%) |
| 8 or more Rooms | 10,153 (48.9%) | 593 (5.4%) |
| Total | 20,756 (100.0%) | 10,960 (100.0%) |
Housing Structure by Heating Type in Bismarck
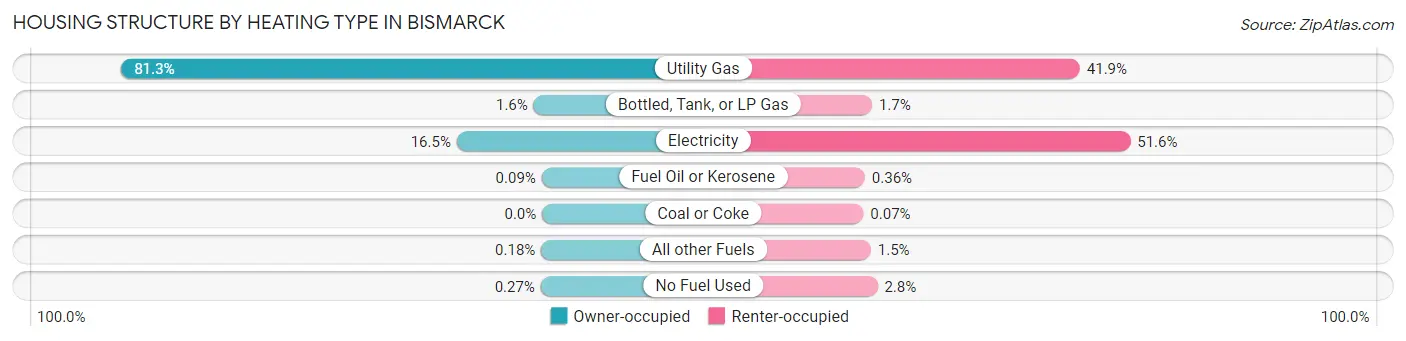
| Heating Type | Owner-occupied | Renter-occupied |
| Utility Gas | 16,878 (81.3%) | 4,592 (41.9%) |
| Bottled, Tank, or LP Gas | 340 (1.6%) | 190 (1.7%) |
| Electricity | 3,425 (16.5%) | 5,660 (51.6%) |
| Fuel Oil or Kerosene | 18 (0.1%) | 40 (0.4%) |
| Coal or Coke | 0 (0.0%) | 8 (0.1%) |
| All other Fuels | 38 (0.2%) | 165 (1.5%) |
| No Fuel Used | 57 (0.3%) | 305 (2.8%) |
| Total | 20,756 (100.0%) | 10,960 (100.0%) |
Household Vehicle Usage in Bismarck
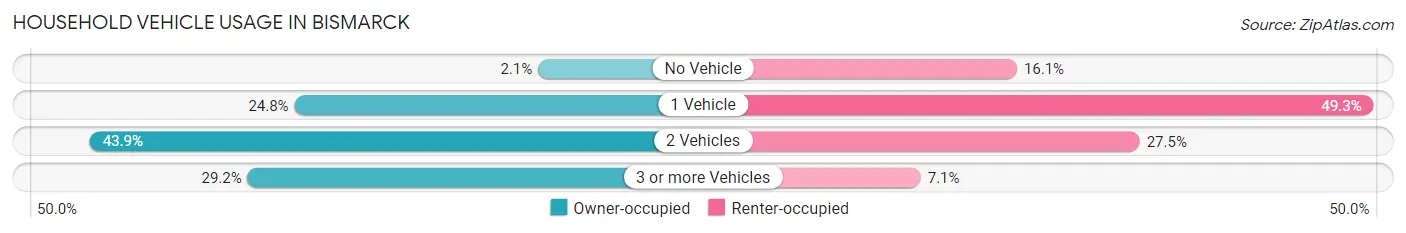
| Vehicles per Household | Owner-occupied | Renter-occupied |
| No Vehicle | 430 (2.1%) | 1,760 (16.1%) |
| 1 Vehicle | 5,150 (24.8%) | 5,408 (49.3%) |
| 2 Vehicles | 9,117 (43.9%) | 3,016 (27.5%) |
| 3 or more Vehicles | 6,059 (29.2%) | 776 (7.1%) |
| Total | 20,756 (100.0%) | 10,960 (100.0%) |
Real Estate & Mortgages in Bismarck
Real Estate and Mortgage Overview in Bismarck
| Characteristic | Without Mortgage | With Mortgage |
| Housing Units | 9,001 | 11,755 |
| Median Property Value | $259,900 | $296,600 |
| Median Household Income | $76,149 | $3,180 |
| Monthly Housing Costs | $589 | $927 |
| Real Estate Taxes | $2,522 | $282 |
Property Value by Mortgage Status in Bismarck
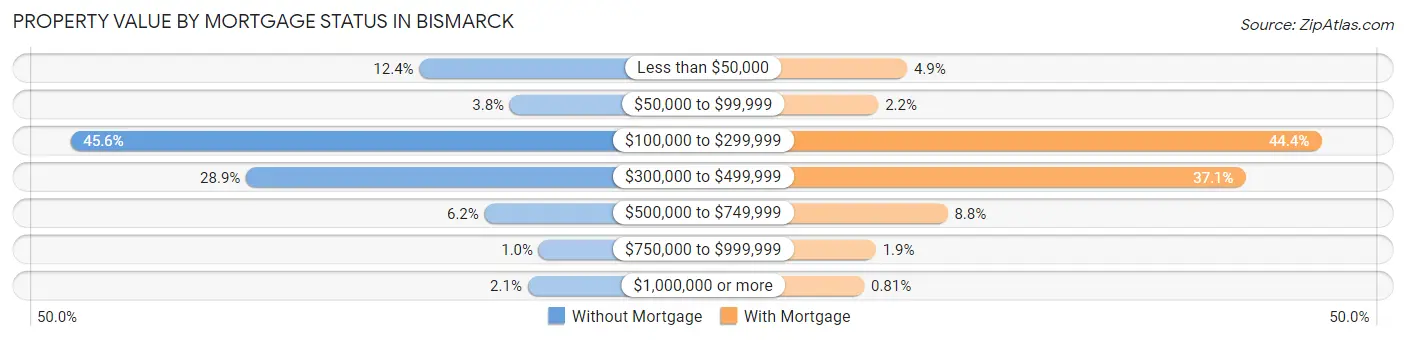
| Property Value | Without Mortgage | With Mortgage |
| Less than $50,000 | 1,116 (12.4%) | 576 (4.9%) |
| $50,000 to $99,999 | 340 (3.8%) | 254 (2.2%) |
| $100,000 to $299,999 | 4,108 (45.6%) | 5,213 (44.4%) |
| $300,000 to $499,999 | 2,601 (28.9%) | 4,363 (37.1%) |
| $500,000 to $749,999 | 557 (6.2%) | 1,028 (8.7%) |
| $750,000 to $999,999 | 92 (1.0%) | 226 (1.9%) |
| $1,000,000 or more | 187 (2.1%) | 95 (0.8%) |
| Total | 9,001 (100.0%) | 11,755 (100.0%) |
Household Income by Mortgage Status in Bismarck
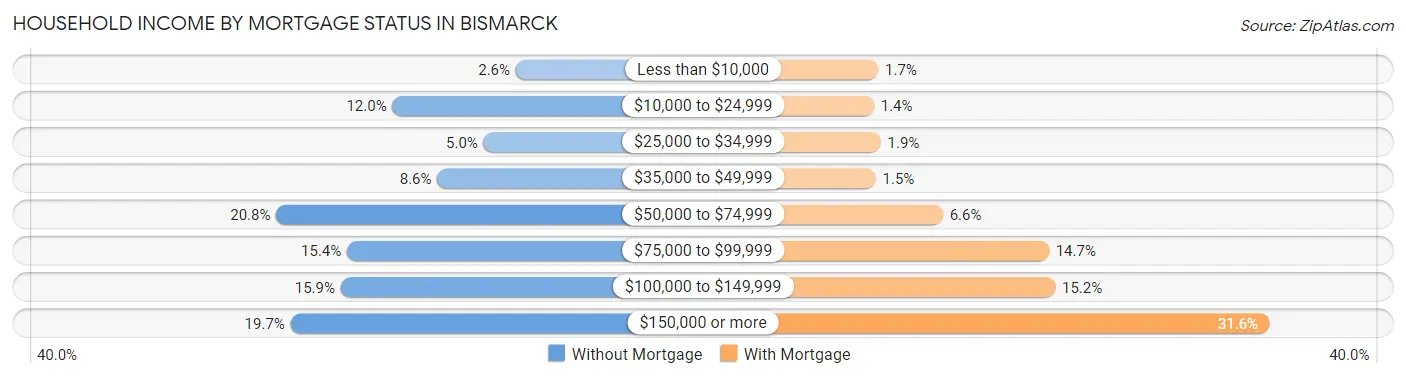
| Household Income | Without Mortgage | With Mortgage |
| Less than $10,000 | 231 (2.6%) | 202 (1.7%) |
| $10,000 to $24,999 | 1,077 (12.0%) | 163 (1.4%) |
| $25,000 to $34,999 | 452 (5.0%) | 224 (1.9%) |
| $35,000 to $49,999 | 770 (8.6%) | 180 (1.5%) |
| $50,000 to $74,999 | 1,874 (20.8%) | 780 (6.6%) |
| $75,000 to $99,999 | 1,389 (15.4%) | 1,730 (14.7%) |
| $100,000 to $149,999 | 1,432 (15.9%) | 1,787 (15.2%) |
| $150,000 or more | 1,776 (19.7%) | 3,711 (31.6%) |
| Total | 9,001 (100.0%) | 11,755 (100.0%) |
Property Value to Household Income Ratio in Bismarck
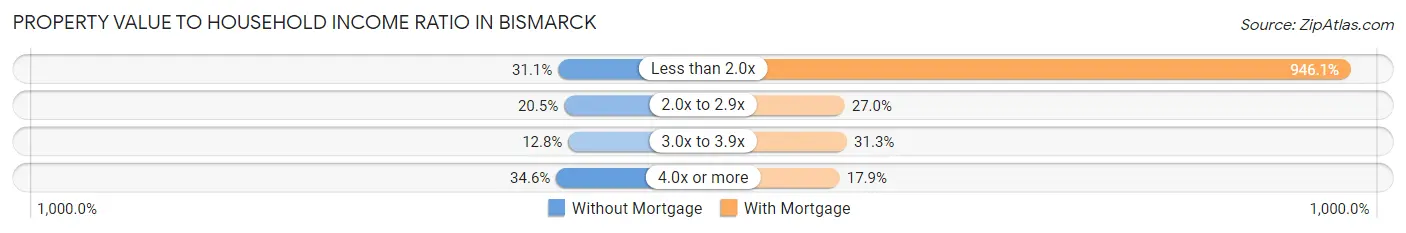
| Value-to-Income Ratio | Without Mortgage | With Mortgage |
| Less than 2.0x | 2,803 (31.1%) | 111,209 (946.1%) |
| 2.0x to 2.9x | 1,842 (20.5%) | 3,176 (27.0%) |
| 3.0x to 3.9x | 1,152 (12.8%) | 3,684 (31.3%) |
| 4.0x or more | 3,114 (34.6%) | 2,108 (17.9%) |
| Total | 9,001 (100.0%) | 11,755 (100.0%) |
Real Estate Taxes by Mortgage Status in Bismarck
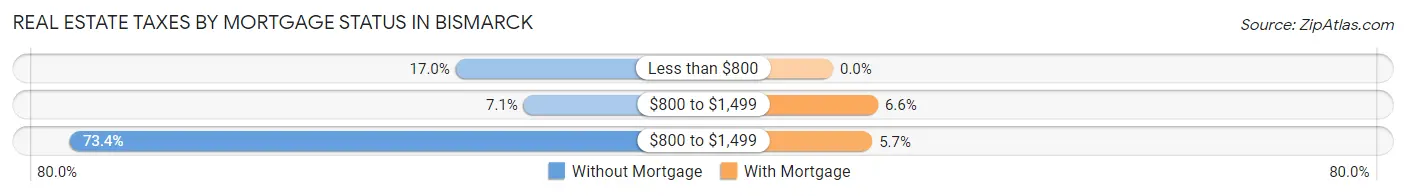
| Property Taxes | Without Mortgage | With Mortgage |
| Less than $800 | 1,532 (17.0%) | 0 (0.0%) |
| $800 to $1,499 | 636 (7.1%) | 771 (6.6%) |
| $800 to $1,499 | 6,603 (73.4%) | 674 (5.7%) |
| Total | 9,001 (100.0%) | 11,755 (100.0%) |
Health & Disability in Bismarck
Health Insurance Coverage by Age in Bismarck
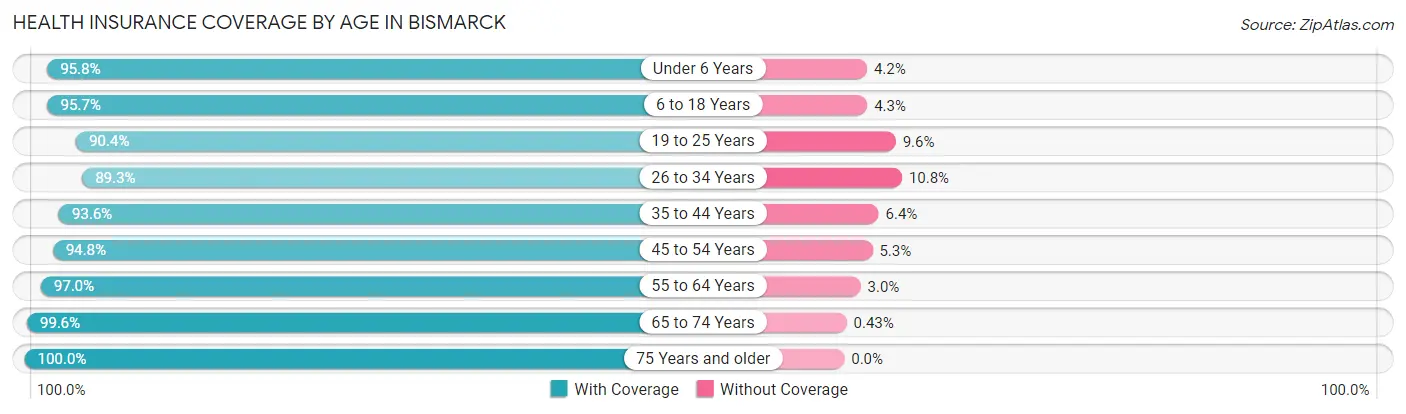
| Age Bracket | With Coverage | Without Coverage |
| Under 6 Years | 5,111 (95.8%) | 226 (4.2%) |
| 6 to 18 Years | 11,168 (95.7%) | 499 (4.3%) |
| 19 to 25 Years | 6,323 (90.4%) | 671 (9.6%) |
| 26 to 34 Years | 7,824 (89.2%) | 942 (10.7%) |
| 35 to 44 Years | 9,051 (93.6%) | 619 (6.4%) |
| 45 to 54 Years | 7,027 (94.8%) | 389 (5.2%) |
| 55 to 64 Years | 8,894 (97.0%) | 279 (3.0%) |
| 65 to 74 Years | 7,018 (99.6%) | 30 (0.4%) |
| 75 Years and older | 5,769 (100.0%) | 0 (0.0%) |
| Total | 68,185 (94.9%) | 3,655 (5.1%) |
Health Insurance Coverage by Citizenship Status in Bismarck
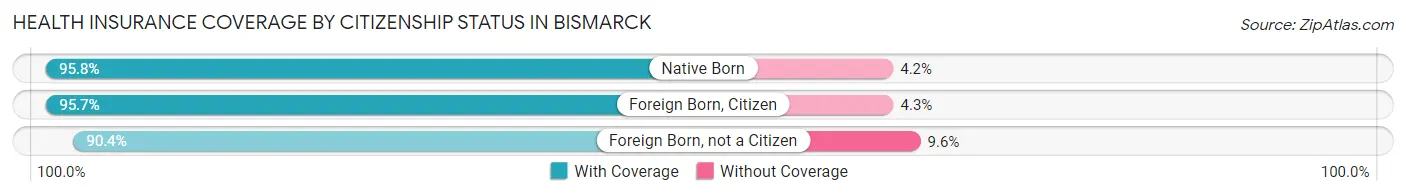
| Citizenship Status | With Coverage | Without Coverage |
| Native Born | 5,111 (95.8%) | 226 (4.2%) |
| Foreign Born, Citizen | 11,168 (95.7%) | 499 (4.3%) |
| Foreign Born, not a Citizen | 6,323 (90.4%) | 671 (9.6%) |
Health Insurance Coverage by Household Income in Bismarck
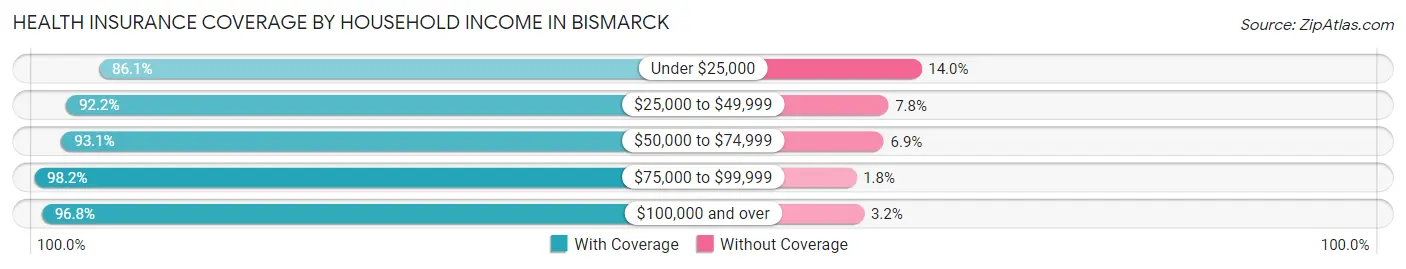
| Household Income | With Coverage | Without Coverage |
| Under $25,000 | 5,430 (86.1%) | 880 (14.0%) |
| $25,000 to $49,999 | 7,968 (92.2%) | 670 (7.8%) |
| $50,000 to $74,999 | 10,270 (93.1%) | 760 (6.9%) |
| $75,000 to $99,999 | 10,101 (98.2%) | 182 (1.8%) |
| $100,000 and over | 33,901 (96.8%) | 1,123 (3.2%) |
Public vs Private Health Insurance Coverage by Age in Bismarck
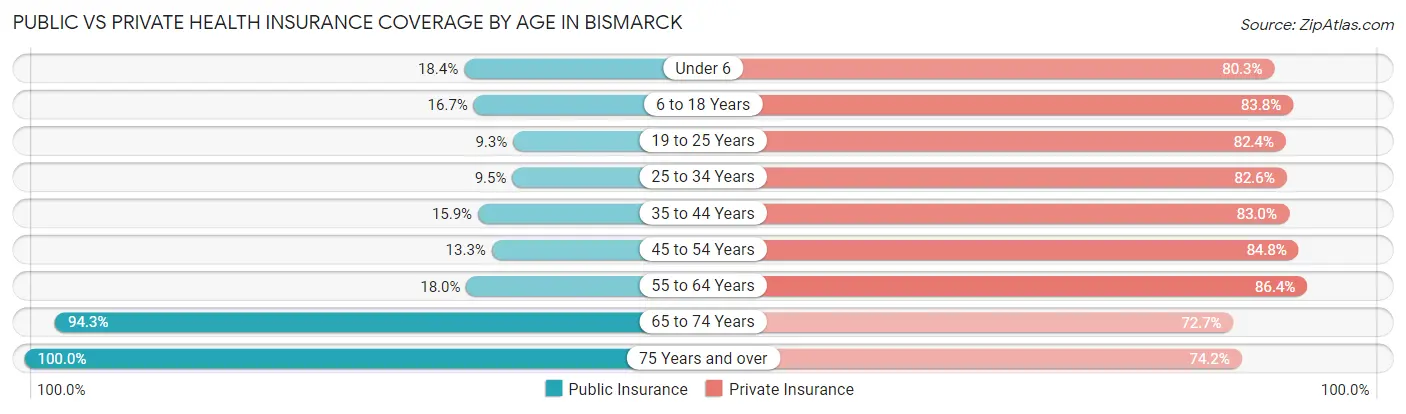
| Age Bracket | Public Insurance | Private Insurance |
| Under 6 | 984 (18.4%) | 4,284 (80.3%) |
| 6 to 18 Years | 1,943 (16.7%) | 9,772 (83.8%) |
| 19 to 25 Years | 653 (9.3%) | 5,764 (82.4%) |
| 25 to 34 Years | 830 (9.5%) | 7,236 (82.6%) |
| 35 to 44 Years | 1,533 (15.9%) | 8,023 (83.0%) |
| 45 to 54 Years | 987 (13.3%) | 6,289 (84.8%) |
| 55 to 64 Years | 1,652 (18.0%) | 7,923 (86.4%) |
| 65 to 74 Years | 6,649 (94.3%) | 5,123 (72.7%) |
| 75 Years and over | 5,769 (100.0%) | 4,280 (74.2%) |
| Total | 21,000 (29.2%) | 58,694 (81.7%) |
Disability Status by Sex by Age in Bismarck
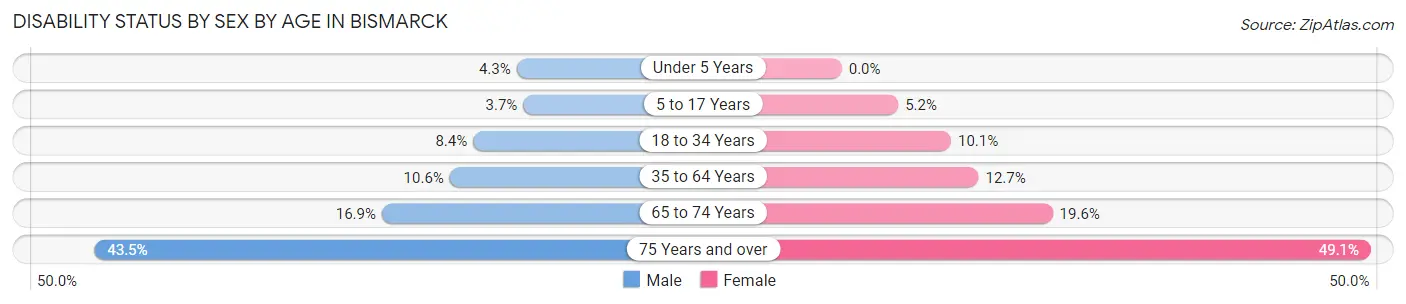
| Age Bracket | Male | Female |
| Under 5 Years | 103 (4.3%) | 0 (0.0%) |
| 5 to 17 Years | 233 (3.7%) | 295 (5.2%) |
| 18 to 34 Years | 692 (8.4%) | 836 (10.1%) |
| 35 to 64 Years | 1,394 (10.5%) | 1,655 (12.7%) |
| 65 to 74 Years | 534 (16.9%) | 759 (19.6%) |
| 75 Years and over | 981 (43.5%) | 1,726 (49.1%) |
Disability Class by Sex by Age in Bismarck
Disability Class: Hearing Difficulty
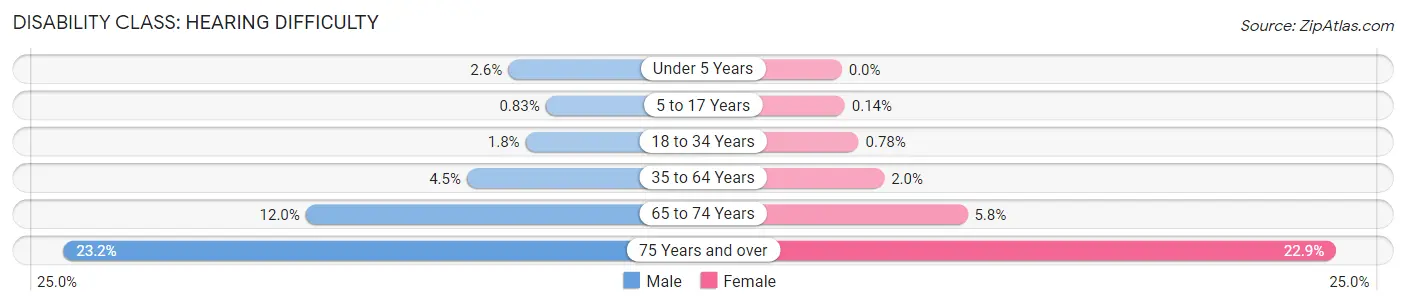
| Age Bracket | Male | Female |
| Under 5 Years | 61 (2.6%) | 0 (0.0%) |
| 5 to 17 Years | 52 (0.8%) | 8 (0.1%) |
| 18 to 34 Years | 145 (1.8%) | 64 (0.8%) |
| 35 to 64 Years | 592 (4.5%) | 257 (2.0%) |
| 65 to 74 Years | 379 (12.0%) | 226 (5.8%) |
| 75 Years and over | 523 (23.2%) | 806 (22.9%) |
Disability Class: Vision Difficulty
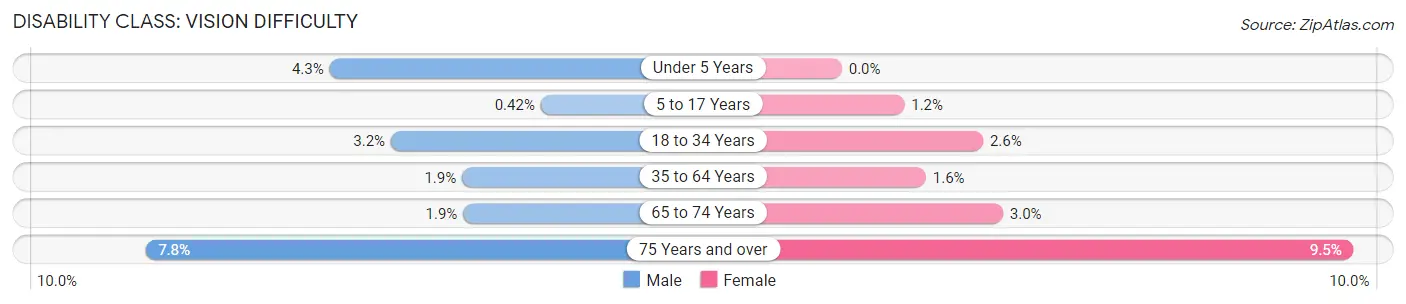
| Age Bracket | Male | Female |
| Under 5 Years | 103 (4.3%) | 0 (0.0%) |
| 5 to 17 Years | 26 (0.4%) | 65 (1.2%) |
| 18 to 34 Years | 264 (3.2%) | 216 (2.6%) |
| 35 to 64 Years | 249 (1.9%) | 203 (1.6%) |
| 65 to 74 Years | 59 (1.9%) | 116 (3.0%) |
| 75 Years and over | 175 (7.8%) | 334 (9.5%) |
Disability Class: Cognitive Difficulty
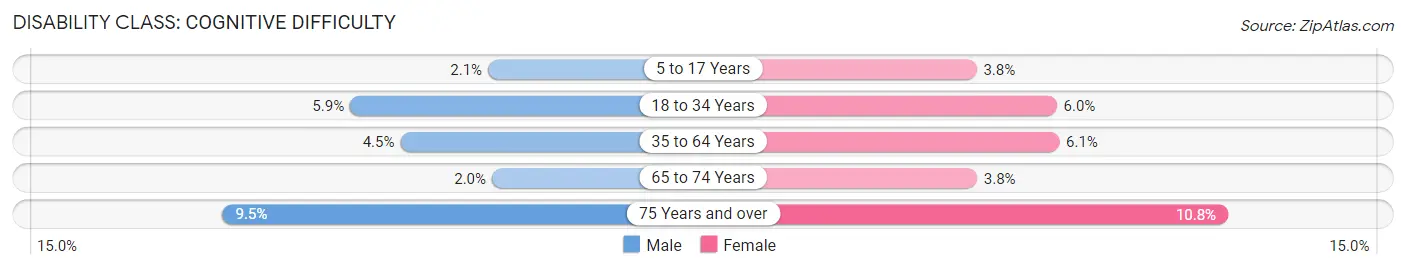
| Age Bracket | Male | Female |
| 5 to 17 Years | 131 (2.1%) | 211 (3.7%) |
| 18 to 34 Years | 491 (5.9%) | 493 (6.0%) |
| 35 to 64 Years | 600 (4.5%) | 789 (6.0%) |
| 65 to 74 Years | 63 (2.0%) | 146 (3.8%) |
| 75 Years and over | 214 (9.5%) | 378 (10.7%) |
Disability Class: Ambulatory Difficulty
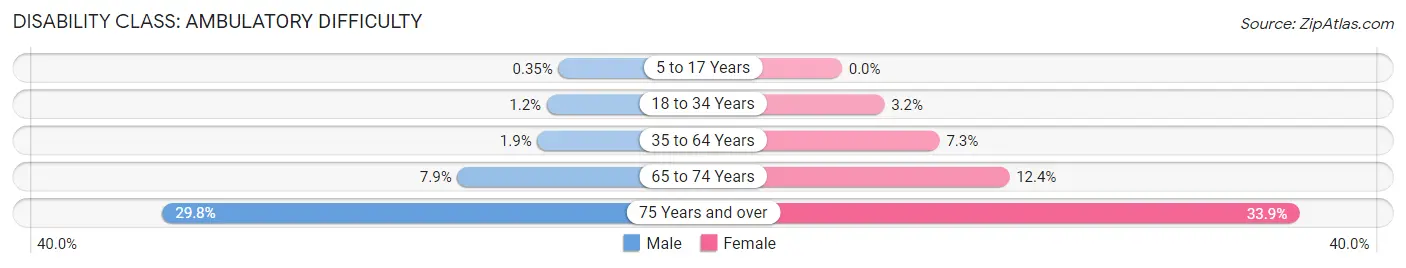
| Age Bracket | Male | Female |
| 5 to 17 Years | 22 (0.4%) | 0 (0.0%) |
| 18 to 34 Years | 101 (1.2%) | 260 (3.2%) |
| 35 to 64 Years | 254 (1.9%) | 946 (7.2%) |
| 65 to 74 Years | 249 (7.9%) | 482 (12.4%) |
| 75 Years and over | 671 (29.8%) | 1,193 (33.9%) |
Disability Class: Self-Care Difficulty
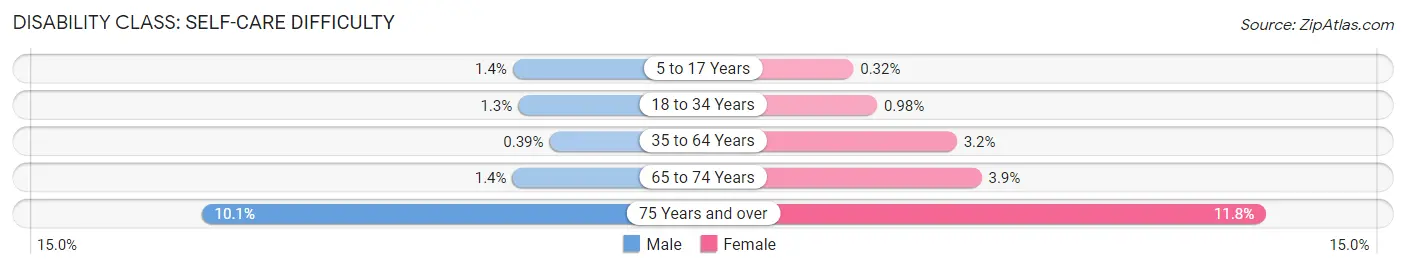
| Age Bracket | Male | Female |
| 5 to 17 Years | 88 (1.4%) | 18 (0.3%) |
| 18 to 34 Years | 104 (1.3%) | 81 (1.0%) |
| 35 to 64 Years | 51 (0.4%) | 417 (3.2%) |
| 65 to 74 Years | 45 (1.4%) | 151 (3.9%) |
| 75 Years and over | 227 (10.1%) | 415 (11.8%) |
Technology Access in Bismarck
Computing Device Access in Bismarck
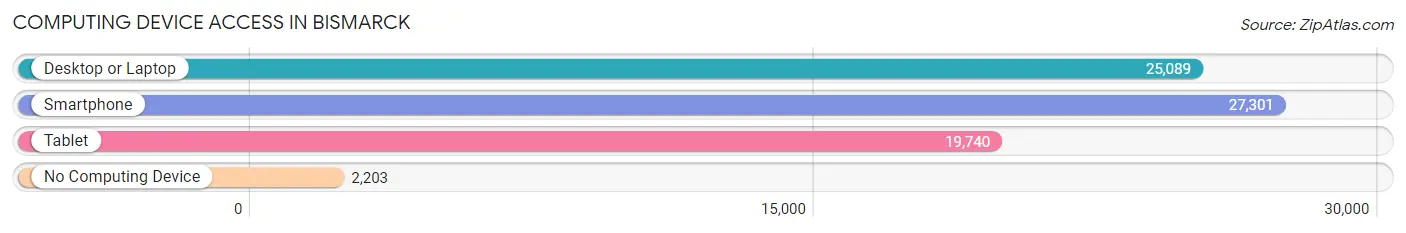
| Device Type | # Households | % Households |
| Desktop or Laptop | 25,089 | 79.1% |
| Smartphone | 27,301 | 86.1% |
| Tablet | 19,740 | 62.2% |
| No Computing Device | 2,203 | 7.0% |
| Total | 31,716 | 100.0% |
Internet Access in Bismarck
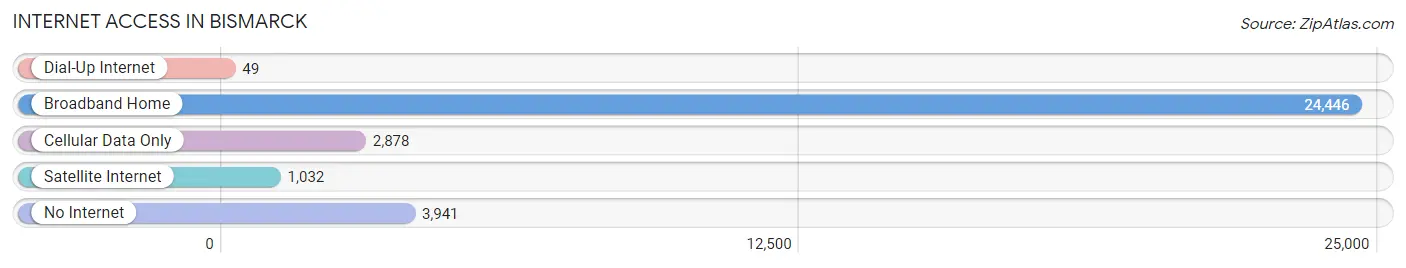
| Internet Type | # Households | % Households |
| Dial-Up Internet | 49 | 0.2% |
| Broadband Home | 24,446 | 77.1% |
| Cellular Data Only | 2,878 | 9.1% |
| Satellite Internet | 1,032 | 3.3% |
| No Internet | 3,941 | 12.4% |
| Total | 31,716 | 100.0% |
Bismarck Summary
Bismarck, North Dakota is the capital of the state and the second most populous city in the state. It is located in the south-central region of the state, along the Missouri River. The city has a population of 61,272 as of the 2019 census, making it the second most populous city in North Dakota.
History
The area that is now Bismarck was first settled by the Mandan and Hidatsa Native American tribes in the early 1800s. The first permanent settlement was established in 1872, when the Northern Pacific Railroad laid tracks through the area. The city was named after German chancellor Otto von Bismarck, and was incorporated in 1873.
In the late 1800s, Bismarck was a major trading center for the region, and the city grew rapidly. The city was the site of the first state capitol building in 1889, and the state government moved to Bismarck in 1894.
Geography
Bismarck is located in the south-central region of North Dakota, along the Missouri River. The city is situated on the east bank of the river, and is surrounded by rolling hills and prairies. The city has a total area of 28.2 square miles, of which 27.9 square miles is land and 0.3 square miles is water.
The city has a humid continental climate, with cold winters and hot summers. The average annual temperature is 45.2°F, and the average annual precipitation is 17.3 inches.
Economy
Bismarck has a diversified economy, with a mix of government, manufacturing, healthcare, and retail sectors. The city is home to several major employers, including the state government, Sanford Health, and the University of Mary.
The city is also home to several major industries, including manufacturing, healthcare, and retail. The city is home to several major manufacturing companies, including Bobcat Company, John Deere, and Caterpillar. The city is also home to several major healthcare providers, including Sanford Health and CHI St. Alexius Health.
Demographics
As of the 2019 census, Bismarck had a population of 61,272. The city has a population density of 2,150 people per square mile. The racial makeup of the city is 90.2% White, 4.2% Native American, 2.2% Asian, 1.2% African American, and 2.2% from other races.
The median household income in Bismarck is $54,845, and the median family income is $63,945. The city has a poverty rate of 11.3%, and the unemployment rate is 2.7%. The city has a high school graduation rate of 91.2%, and the median age is 35.7 years.
Common Questions
What is Per Capita Income in Bismarck?
Per Capita income in Bismarck is $43,144.
What is the Median Family Income in Bismarck?
Median Family Income in Bismarck is $103,456.
What is the Median Household income in Bismarck?
Median Household Income in Bismarck is $76,014.
What is Income or Wage Gap in Bismarck?
Income or Wage Gap in Bismarck is 17.6%.
Women in Bismarck earn 82.4 cents for every dollar earned by a man.
What is Family Income Deficit in Bismarck?
Family Income Deficit in Bismarck is $10,845.
Families that are below poverty line in Bismarck earn $10,845 less on average than the poverty threshold level.
What is Inequality or Gini Index in Bismarck?
Inequality or Gini Index in Bismarck is 0.43.
What is the Total Population of Bismarck?
Total Population of Bismarck is 73,694.
What is the Total Male Population of Bismarck?
Total Male Population of Bismarck is 36,664.
What is the Total Female Population of Bismarck?
Total Female Population of Bismarck is 37,030.
What is the Ratio of Males per 100 Females in Bismarck?
There are 99.01 Males per 100 Females in Bismarck.
What is the Ratio of Females per 100 Males in Bismarck?
There are 101.00 Females per 100 Males in Bismarck.
What is the Median Population Age in Bismarck?
Median Population Age in Bismarck is 38.0 Years.
What is the Average Family Size in Bismarck
Average Family Size in Bismarck is 3.0 People.
What is the Average Household Size in Bismarck
Average Household Size in Bismarck is 2.2 People.
How Large is the Labor Force in Bismarck?
There are 39,072 People in the Labor Forcein in Bismarck.
What is the Percentage of People in the Labor Force in Bismarck?
65.8% of People are in the Labor Force in Bismarck.
What is the Unemployment Rate in Bismarck?
Unemployment Rate in Bismarck is 3.1%.