Lawai, HI Map & Demographics
Lawai Map
Lawai Overview
$34,742
PER CAPITA INCOME
$110,375
AVG FAMILY INCOME
$99,138
AVG HOUSEHOLD INCOME
25.3%
WAGE / INCOME GAP [ % ]
74.7¢/ $1
WAGE / INCOME GAP [ $ ]
0.36
INEQUALITY / GINI INDEX
2,902
TOTAL POPULATION
1,554
MALE POPULATION
1,348
FEMALE POPULATION
115.28
MALES / 100 FEMALES
86.74
FEMALES / 100 MALES
40.1
MEDIAN AGE
3.4
AVG FAMILY SIZE
3.2
AVG HOUSEHOLD SIZE
1,309
LABOR FORCE [ PEOPLE ]
57.9%
PERCENT IN LABOR FORCE
12.2%
UNEMPLOYMENT RATE
Lawai Zip Codes
Lawai Area Codes
Income in Lawai
Income Overview in Lawai
Per Capita Income in Lawai is $34,742, while median incomes of families and households are $110,375 and $99,138 respectively.
| Characteristic | Number | Measure |
| Per Capita Income | 2,902 | $34,742 |
| Median Family Income | 721 | $110,375 |
| Mean Family Income | 721 | $111,410 |
| Median Household Income | 898 | $99,138 |
| Mean Household Income | 898 | $107,957 |
| Income Deficit | 721 | $0 |
| Wage / Income Gap (%) | 2,902 | 25.28% |
| Wage / Income Gap ($) | 2,902 | 74.72¢ per $1 |
| Gini / Inequality Index | 2,902 | 0.36 |
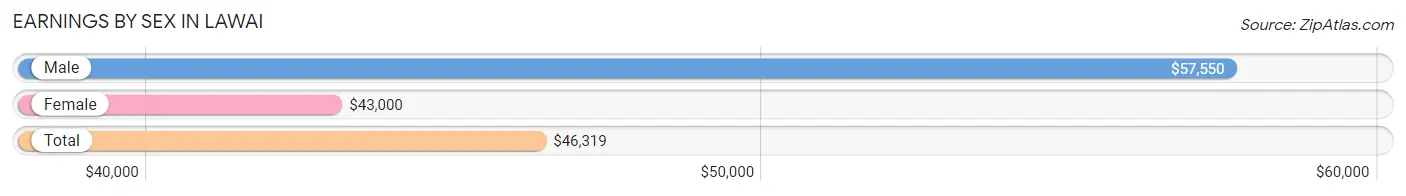
Earnings by Sex in Lawai
Average Earnings in Lawai are $46,319, $57,550 for men and $43,000 for women, a difference of 25.3%.
| Sex | Number | Average Earnings |
| Male | 799 (57.5%) | $57,550 |
| Female | 590 (42.5%) | $43,000 |
| Total | 1,389 (100.0%) | $46,319 |
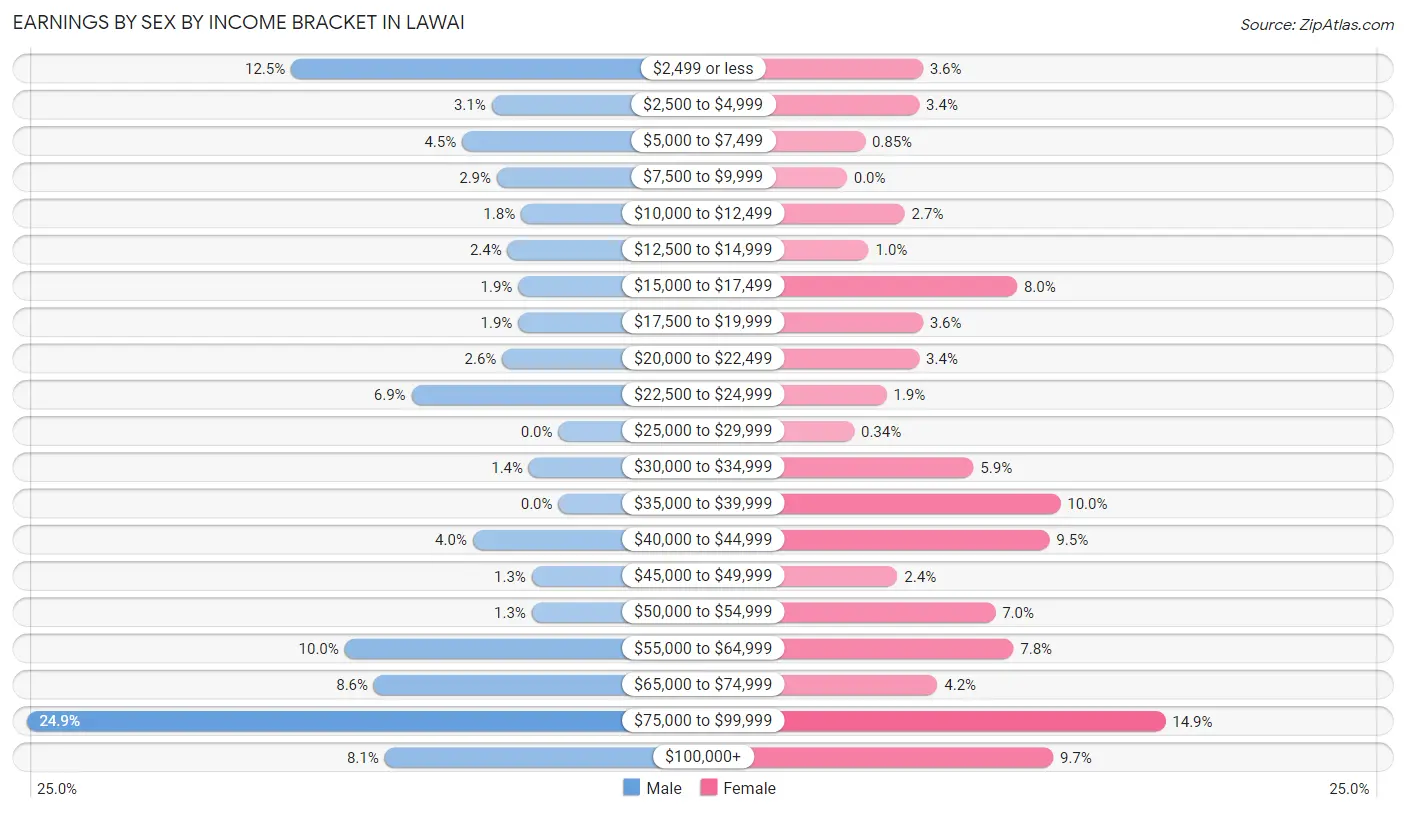
Earnings by Sex by Income Bracket in Lawai
The most common earnings brackets in Lawai are $75,000 to $99,999 for men (199 | 24.9%) and $75,000 to $99,999 for women (88 | 14.9%).
| Income | Male | Female |
| $2,499 or less | 100 (12.5%) | 21 (3.6%) |
| $2,500 to $4,999 | 25 (3.1%) | 20 (3.4%) |
| $5,000 to $7,499 | 36 (4.5%) | 5 (0.9%) |
| $7,500 to $9,999 | 23 (2.9%) | 0 (0.0%) |
| $10,000 to $12,499 | 14 (1.8%) | 16 (2.7%) |
| $12,500 to $14,999 | 19 (2.4%) | 6 (1.0%) |
| $15,000 to $17,499 | 15 (1.9%) | 47 (8.0%) |
| $17,500 to $19,999 | 15 (1.9%) | 21 (3.6%) |
| $20,000 to $22,499 | 21 (2.6%) | 20 (3.4%) |
| $22,500 to $24,999 | 55 (6.9%) | 11 (1.9%) |
| $25,000 to $29,999 | 0 (0.0%) | 2 (0.3%) |
| $30,000 to $34,999 | 11 (1.4%) | 35 (5.9%) |
| $35,000 to $39,999 | 0 (0.0%) | 59 (10.0%) |
| $40,000 to $44,999 | 32 (4.0%) | 56 (9.5%) |
| $45,000 to $49,999 | 10 (1.3%) | 14 (2.4%) |
| $50,000 to $54,999 | 10 (1.3%) | 41 (7.0%) |
| $55,000 to $64,999 | 80 (10.0%) | 46 (7.8%) |
| $65,000 to $74,999 | 69 (8.6%) | 25 (4.2%) |
| $75,000 to $99,999 | 199 (24.9%) | 88 (14.9%) |
| $100,000+ | 65 (8.1%) | 57 (9.7%) |
| Total | 799 (100.0%) | 590 (100.0%) |
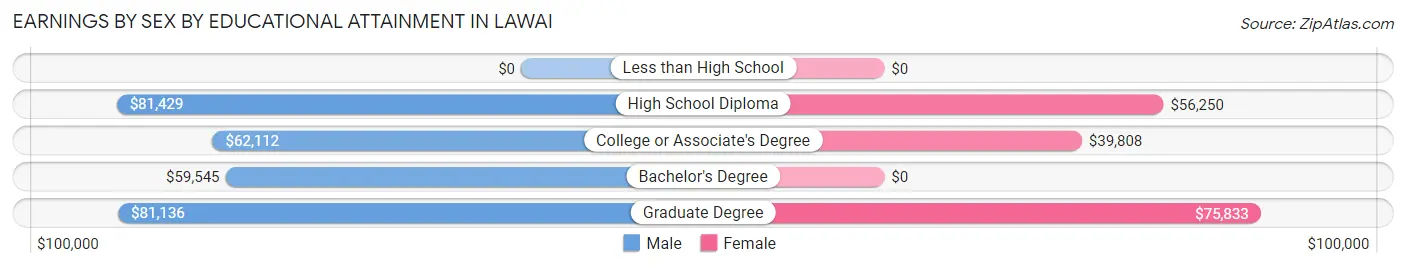
Earnings by Sex by Educational Attainment in Lawai
Average earnings in Lawai are $67,798 for men and $48,750 for women, a difference of 28.1%. Men with an educational attainment of high school diploma enjoy the highest average annual earnings of $81,429, while those with bachelor's degree education earn the least with $59,545. Women with an educational attainment of graduate degree earn the most with the average annual earnings of $75,833, while those with college or associate's degree education have the smallest earnings of $39,808.
| Educational Attainment | Male Income | Female Income |
| Less than High School | - | - |
| High School Diploma | $81,429 | $56,250 |
| College or Associate's Degree | $62,112 | $39,808 |
| Bachelor's Degree | $59,545 | $0 |
| Graduate Degree | $81,136 | $75,833 |
| Total | $67,798 | $48,750 |
Family Income in Lawai
Family Income Brackets in Lawai
According to the Lawai family income data, there are 201 families falling into the $100,000 to $149,999 income range, which is the most common income bracket and makes up 27.9% of all families.
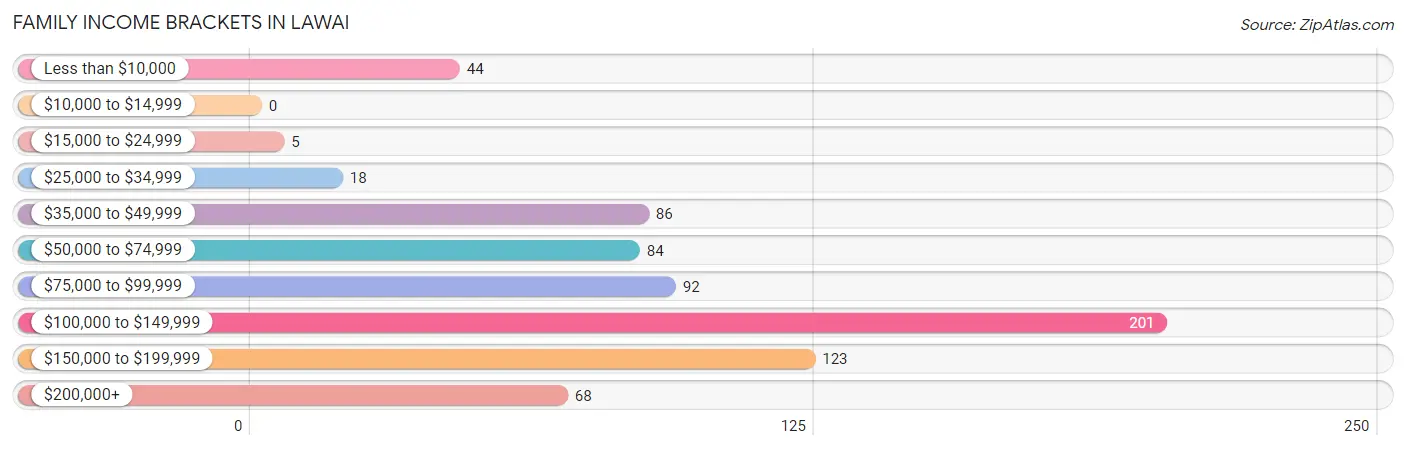
| Income Bracket | # Families | % Families |
| Less than $10,000 | 44 | 6.1% |
| $10,000 to $14,999 | 0 | 0.0% |
| $15,000 to $24,999 | 5 | 0.7% |
| $25,000 to $34,999 | 18 | 2.5% |
| $35,000 to $49,999 | 86 | 11.9% |
| $50,000 to $74,999 | 84 | 11.7% |
| $75,000 to $99,999 | 92 | 12.8% |
| $100,000 to $149,999 | 201 | 27.9% |
| $150,000 to $199,999 | 123 | 17.1% |
| $200,000+ | 68 | 9.4% |
Family Income by Famaliy Size in Lawai
5-person families (89 | 12.3%) account for the highest median family income in Lawai with $139,375 per family, while 2-person families (321 | 44.5%) have the highest median income of $58,938 per family member.
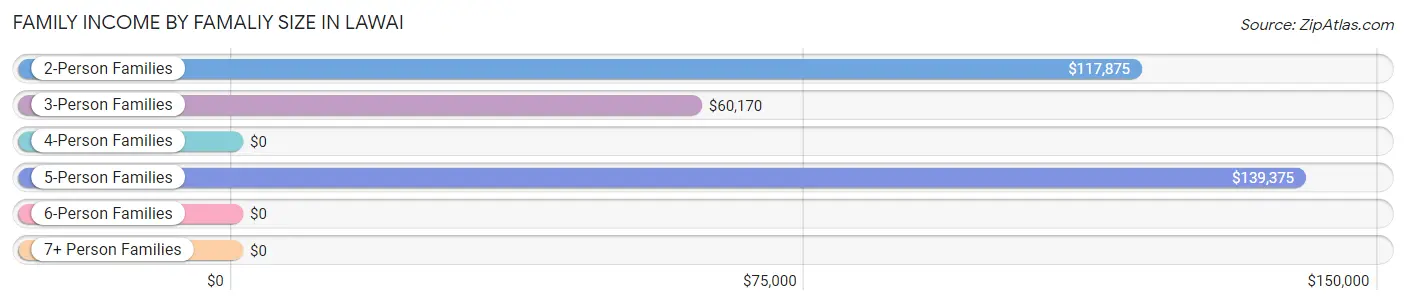
| Income Bracket | # Families | Median Income |
| 2-Person Families | 321 (44.5%) | $117,875 |
| 3-Person Families | 137 (19.0%) | $60,170 |
| 4-Person Families | 156 (21.6%) | $0 |
| 5-Person Families | 89 (12.3%) | $139,375 |
| 6-Person Families | 9 (1.3%) | $0 |
| 7+ Person Families | 9 (1.3%) | $0 |
| Total | 721 (100.0%) | $110,375 |
Family Income by Number of Earners in Lawai
The median family income in Lawai is $110,375, with families comprising 3+ earners (78) having the highest median family income of $165,671, while families with 1 earner (293) have the lowest median family income of $61,875, accounting for 10.8% and 40.6% of families, respectively.
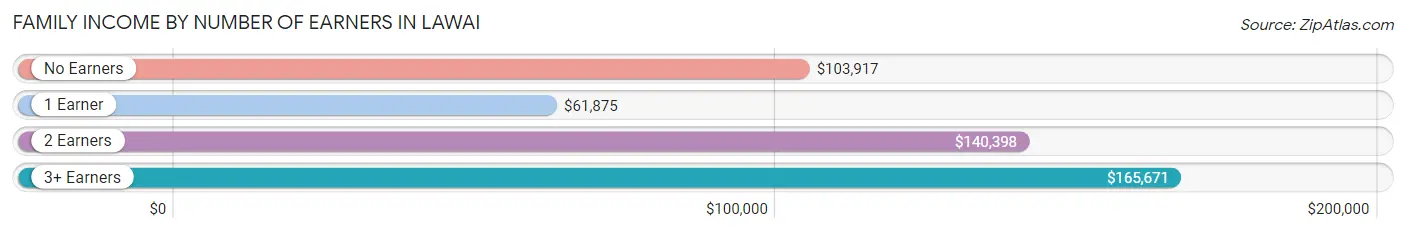
| Number of Earners | # Families | Median Income |
| No Earners | 117 (16.2%) | $103,917 |
| 1 Earner | 293 (40.6%) | $61,875 |
| 2 Earners | 233 (32.3%) | $140,398 |
| 3+ Earners | 78 (10.8%) | $165,671 |
| Total | 721 (100.0%) | $110,375 |
Household Income in Lawai
Household Income Brackets in Lawai
With 219 households falling in the category, the $100,000 to $149,999 income range is the most frequent in Lawai, accounting for 24.4% of all households.
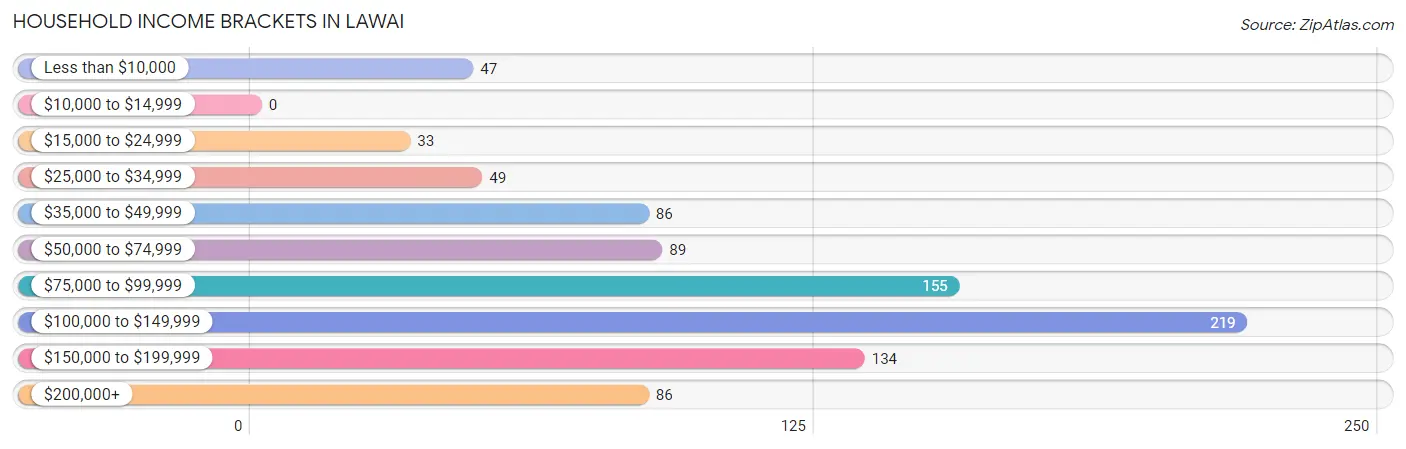
| Income Bracket | # Households | % Households |
| Less than $10,000 | 47 | 5.2% |
| $10,000 to $14,999 | 0 | 0.0% |
| $15,000 to $24,999 | 33 | 3.7% |
| $25,000 to $34,999 | 49 | 5.5% |
| $35,000 to $49,999 | 86 | 9.6% |
| $50,000 to $74,999 | 89 | 9.9% |
| $75,000 to $99,999 | 155 | 17.3% |
| $100,000 to $149,999 | 219 | 24.4% |
| $150,000 to $199,999 | 134 | 14.9% |
| $200,000+ | 86 | 9.6% |
Household Income by Householder Age in Lawai
The median household income in Lawai is $99,138, with the highest median household income of $138,036 found in the 45 to 64 years age bracket for the primary householder. A total of 298 households (33.2%) fall into this category.
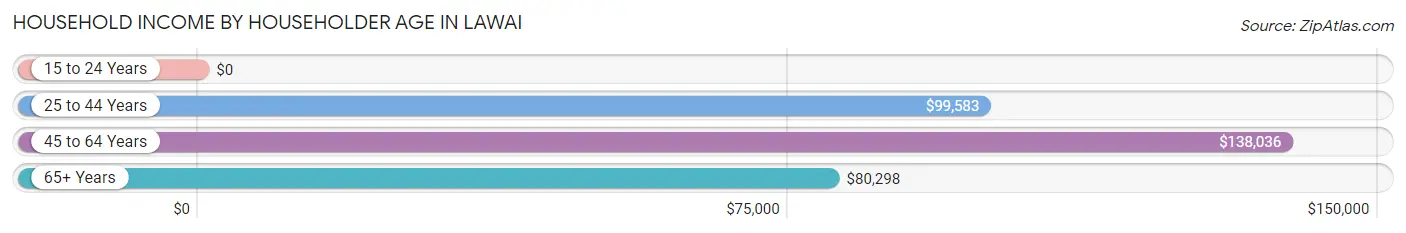
| Income Bracket | # Households | Median Income |
| 15 to 24 Years | 0 (0.0%) | $0 |
| 25 to 44 Years | 271 (30.2%) | $99,583 |
| 45 to 64 Years | 298 (33.2%) | $138,036 |
| 65+ Years | 329 (36.6%) | $80,298 |
| Total | 898 (100.0%) | $99,138 |
Poverty in Lawai
Income Below Poverty by Sex and Age in Lawai
With 9.6% poverty level for males and 8.1% for females among the residents of Lawai, 16 and 17 year old males and under 5 year old females are the most vulnerable to poverty, with 32 males (100.0%) and 43 females (32.6%) in their respective age groups living below the poverty level.
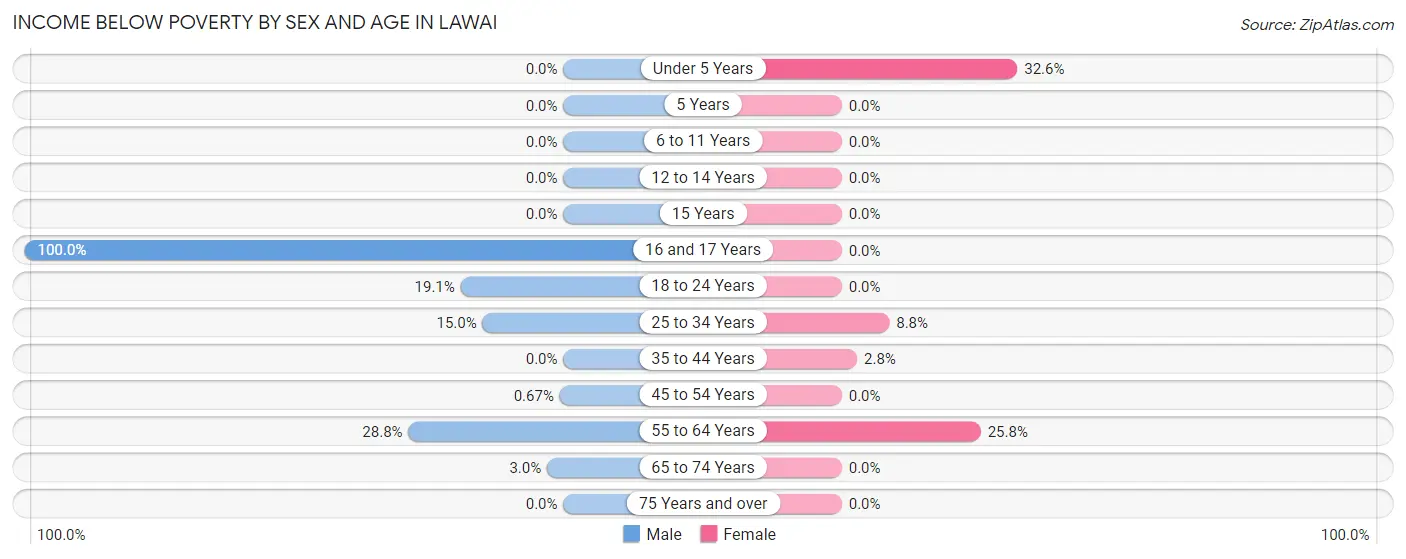
| Age Bracket | Male | Female |
| Under 5 Years | 0 (0.0%) | 43 (32.6%) |
| 5 Years | 0 (0.0%) | 0 (0.0%) |
| 6 to 11 Years | 0 (0.0%) | 0 (0.0%) |
| 12 to 14 Years | 0 (0.0%) | 0 (0.0%) |
| 15 Years | 0 (0.0%) | 0 (0.0%) |
| 16 and 17 Years | 32 (100.0%) | 0 (0.0%) |
| 18 to 24 Years | 37 (19.1%) | 0 (0.0%) |
| 25 to 34 Years | 30 (15.0%) | 12 (8.8%) |
| 35 to 44 Years | 0 (0.0%) | 5 (2.8%) |
| 45 to 54 Years | 1 (0.7%) | 0 (0.0%) |
| 55 to 64 Years | 44 (28.8%) | 49 (25.8%) |
| 65 to 74 Years | 5 (3.0%) | 0 (0.0%) |
| 75 Years and over | 0 (0.0%) | 0 (0.0%) |
| Total | 149 (9.6%) | 109 (8.1%) |
Income Above Poverty by Sex and Age in Lawai
According to the poverty statistics in Lawai, males aged under 5 years and females aged 5 years are the age groups that are most secure financially, with 100.0% of males and 100.0% of females in these age groups living above the poverty line.
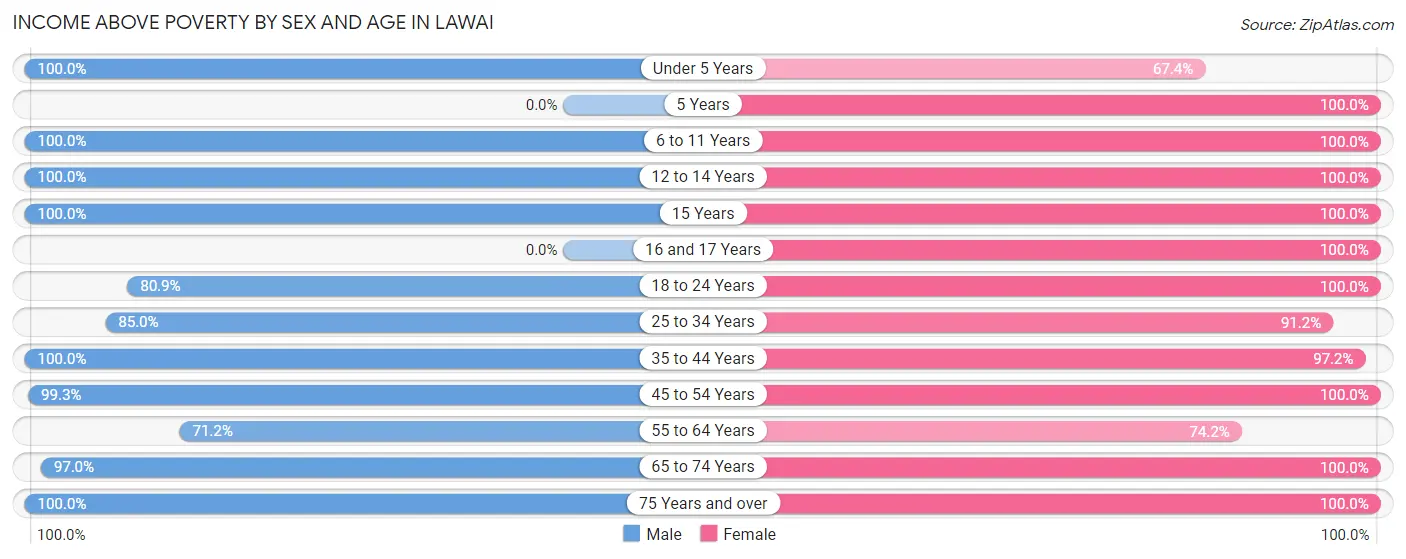
| Age Bracket | Male | Female |
| Under 5 Years | 45 (100.0%) | 89 (67.4%) |
| 5 Years | 0 (0.0%) | 16 (100.0%) |
| 6 to 11 Years | 171 (100.0%) | 99 (100.0%) |
| 12 to 14 Years | 103 (100.0%) | 35 (100.0%) |
| 15 Years | 15 (100.0%) | 26 (100.0%) |
| 16 and 17 Years | 0 (0.0%) | 12 (100.0%) |
| 18 to 24 Years | 157 (80.9%) | 105 (100.0%) |
| 25 to 34 Years | 170 (85.0%) | 124 (91.2%) |
| 35 to 44 Years | 218 (100.0%) | 171 (97.2%) |
| 45 to 54 Years | 148 (99.3%) | 125 (100.0%) |
| 55 to 64 Years | 109 (71.2%) | 141 (74.2%) |
| 65 to 74 Years | 160 (97.0%) | 180 (100.0%) |
| 75 Years and over | 109 (100.0%) | 116 (100.0%) |
| Total | 1,405 (90.4%) | 1,239 (91.9%) |
Income Below Poverty Among Married-Couple Families in Lawai
The poverty statistics for married-couple families in Lawai show that 9.4% or 57 of the total 604 families live below the poverty line. Families with 1 or 2 children have the highest poverty rate of 28.4%, comprising of 57 families. On the other hand, families with no children have the lowest poverty rate of 0.0%, which includes 0 families.
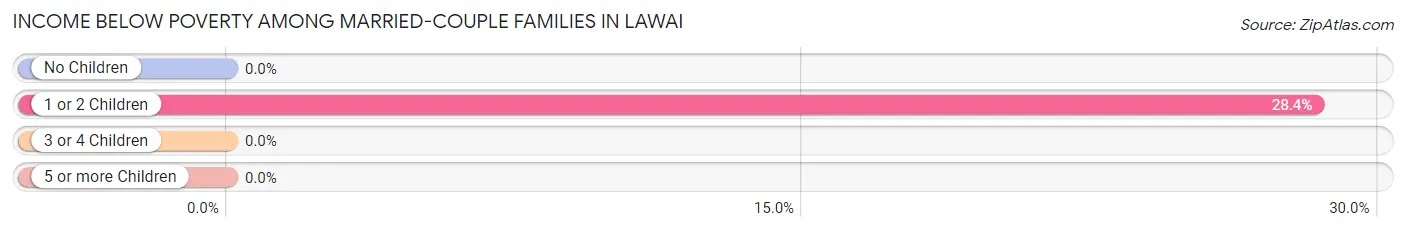
| Children | Above Poverty | Below Poverty |
| No Children | 386 (100.0%) | 0 (0.0%) |
| 1 or 2 Children | 144 (71.6%) | 57 (28.4%) |
| 3 or 4 Children | 8 (100.0%) | 0 (0.0%) |
| 5 or more Children | 9 (100.0%) | 0 (0.0%) |
| Total | 547 (90.6%) | 57 (9.4%) |
Income Below Poverty Among Single-Parent Households in Lawai
| Children | Single Father | Single Mother |
| No Children | 0 (0.0%) | 0 (0.0%) |
| 1 or 2 Children | 0 (0.0%) | 0 (0.0%) |
| 3 or 4 Children | 0 (0.0%) | 0 (0.0%) |
| 5 or more Children | 0 (0.0%) | 0 (0.0%) |
| Total | 0 (0.0%) | 0 (0.0%) |
Income Below Poverty Among Married-Couple vs Single-Parent Households in Lawai
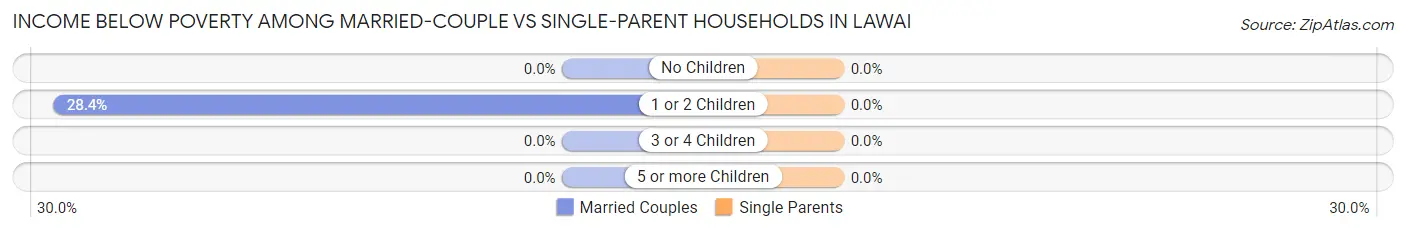
| Children | Married-Couple Families | Single-Parent Households |
| No Children | 0 (0.0%) | 0 (0.0%) |
| 1 or 2 Children | 57 (28.4%) | 0 (0.0%) |
| 3 or 4 Children | 0 (0.0%) | 0 (0.0%) |
| 5 or more Children | 0 (0.0%) | 0 (0.0%) |
| Total | 57 (9.4%) | 0 (0.0%) |
Race in Lawai
The most populous races in Lawai are White / Caucasian (1,138 | 39.2%), Two or more Races (972 | 33.5%), and Hispanic or Latino (620 | 21.4%).
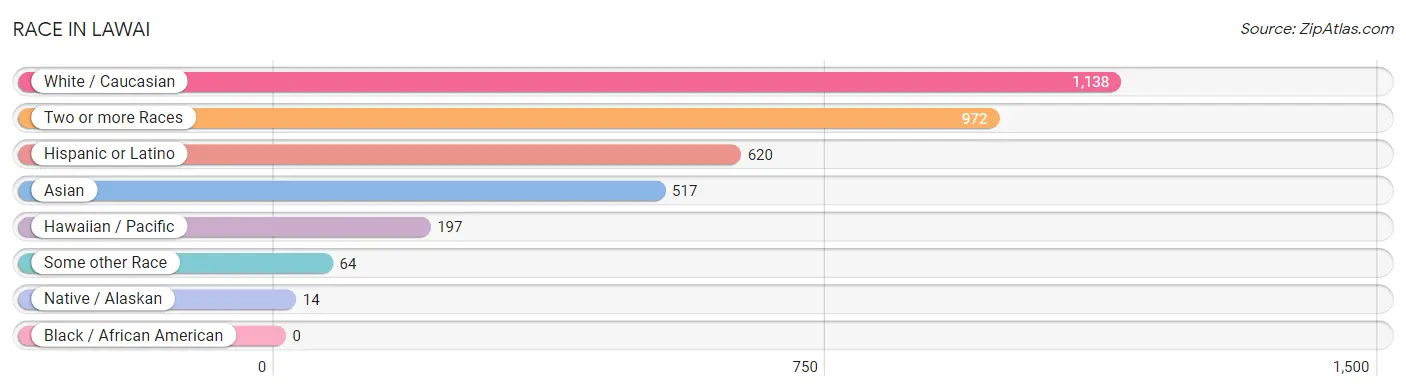
| Race | # Population | % Population |
| Asian | 517 | 17.8% |
| Black / African American | 0 | 0.0% |
| Hawaiian / Pacific | 197 | 6.8% |
| Hispanic or Latino | 620 | 21.4% |
| Native / Alaskan | 14 | 0.5% |
| White / Caucasian | 1,138 | 39.2% |
| Two or more Races | 972 | 33.5% |
| Some other Race | 64 | 2.2% |
| Total | 2,902 | 100.0% |
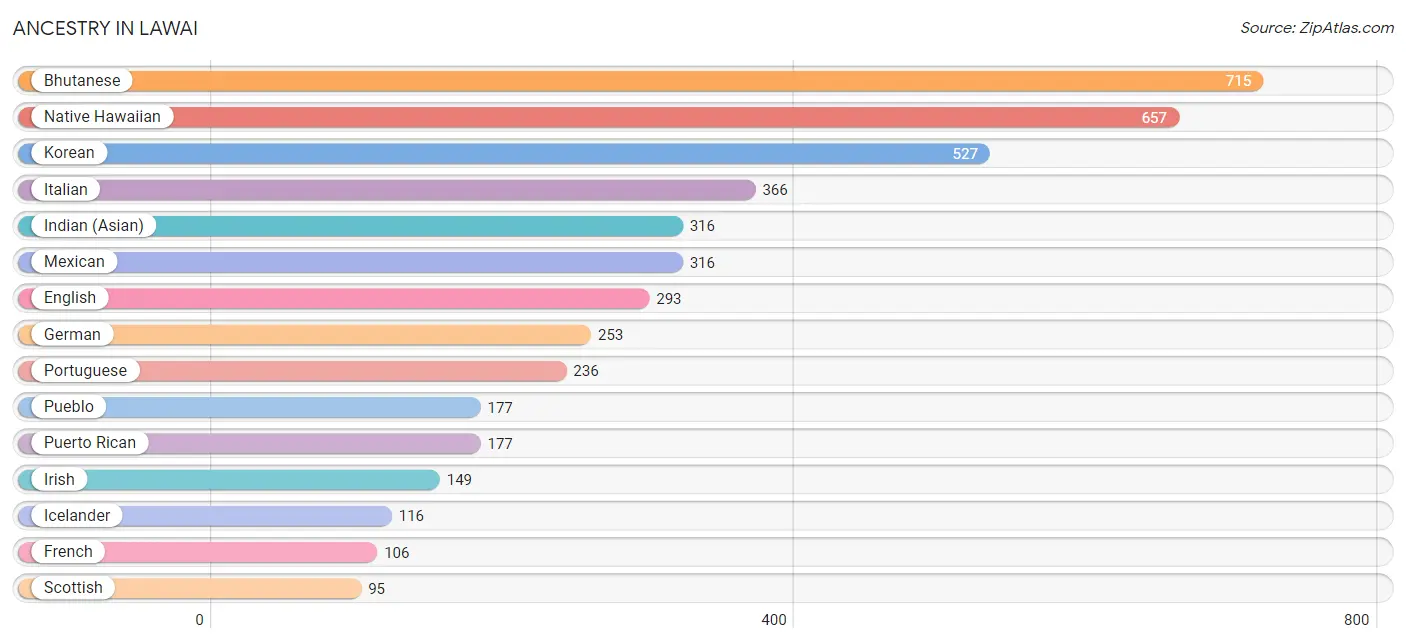
Ancestry in Lawai
The most populous ancestries reported in Lawai are Bhutanese (715 | 24.6%), Native Hawaiian (657 | 22.6%), Korean (527 | 18.2%), Italian (366 | 12.6%), and Indian (Asian) (316 | 10.9%), together accounting for 88.9% of all Lawai residents.
| Ancestry | # Population | % Population |
| American | 15 | 0.5% |
| Arab | 20 | 0.7% |
| Bhutanese | 715 | 24.6% |
| British | 12 | 0.4% |
| Burmese | 36 | 1.2% |
| Cherokee | 7 | 0.2% |
| Chinese | 4 | 0.1% |
| Chippewa | 23 | 0.8% |
| Croatian | 15 | 0.5% |
| Dutch | 38 | 1.3% |
| Eastern European | 33 | 1.1% |
| English | 293 | 10.1% |
| European | 19 | 0.6% |
| Fijian | 5 | 0.2% |
| French | 106 | 3.6% |
| German | 253 | 8.7% |
| Hungarian | 35 | 1.2% |
| Icelander | 116 | 4.0% |
| Indian (Asian) | 316 | 10.9% |
| Irish | 149 | 5.1% |
| Italian | 366 | 12.6% |
| Korean | 527 | 18.2% |
| Laotian | 3 | 0.1% |
| Lebanese | 20 | 0.7% |
| Lithuanian | 63 | 2.2% |
| Mexican | 316 | 10.9% |
| Native Hawaiian | 657 | 22.6% |
| Norwegian | 90 | 3.1% |
| Polish | 26 | 0.9% |
| Portuguese | 236 | 8.1% |
| Pueblo | 177 | 6.1% |
| Puerto Rican | 177 | 6.1% |
| Russian | 14 | 0.5% |
| Scandinavian | 29 | 1.0% |
| Scotch-Irish | 19 | 0.6% |
| Scottish | 95 | 3.3% |
| Sioux | 23 | 0.8% |
| Slovak | 5 | 0.2% |
| Spaniard | 7 | 0.2% |
| Spanish | 85 | 2.9% |
| Swedish | 39 | 1.3% | View All 41 Rows |
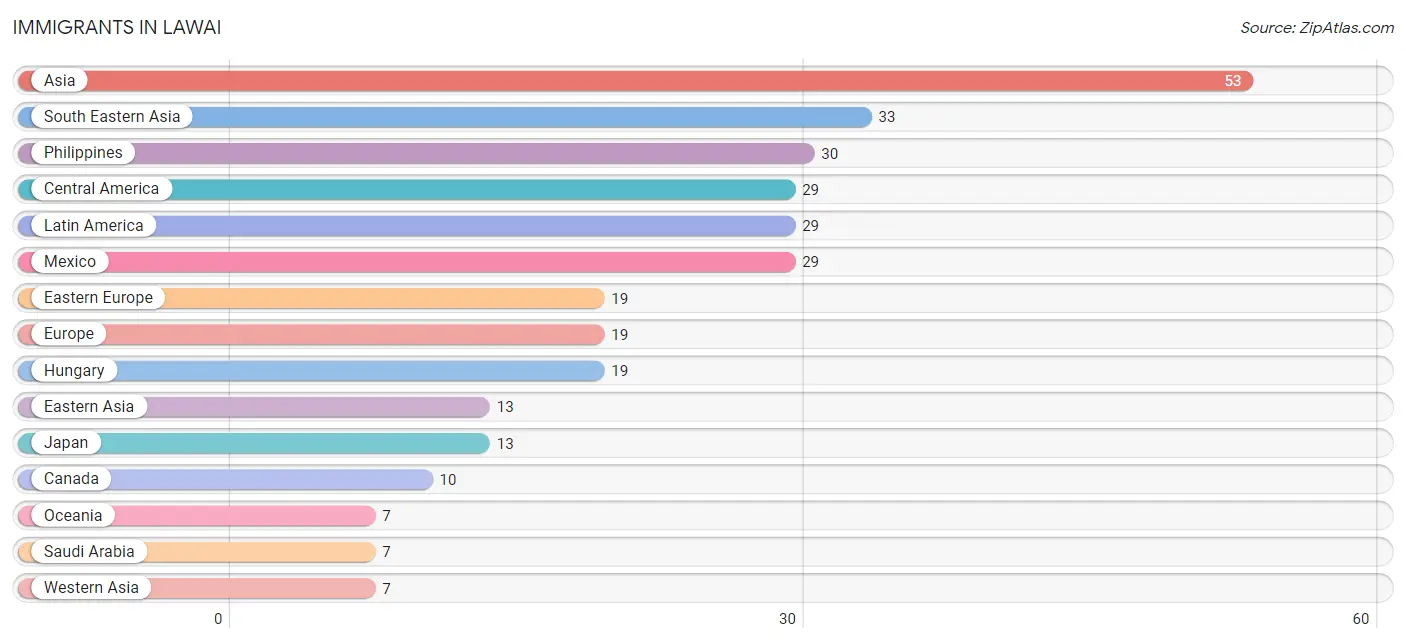
Immigrants in Lawai
The most numerous immigrant groups reported in Lawai came from Asia (53 | 1.8%), South Eastern Asia (33 | 1.1%), Philippines (30 | 1.0%), Central America (29 | 1.0%), and Latin America (29 | 1.0%), together accounting for 6.0% of all Lawai residents.
| Immigration Origin | # Population | % Population |
| Asia | 53 | 1.8% |
| Australia | 2 | 0.1% |
| Canada | 10 | 0.3% |
| Central America | 29 | 1.0% |
| Eastern Asia | 13 | 0.4% |
| Eastern Europe | 19 | 0.6% |
| Europe | 19 | 0.6% |
| Hungary | 19 | 0.6% |
| Indonesia | 3 | 0.1% |
| Japan | 13 | 0.4% |
| Latin America | 29 | 1.0% |
| Mexico | 29 | 1.0% |
| Oceania | 7 | 0.2% |
| Philippines | 30 | 1.0% |
| Saudi Arabia | 7 | 0.2% |
| South Eastern Asia | 33 | 1.1% |
| Western Asia | 7 | 0.2% | View All 17 Rows |
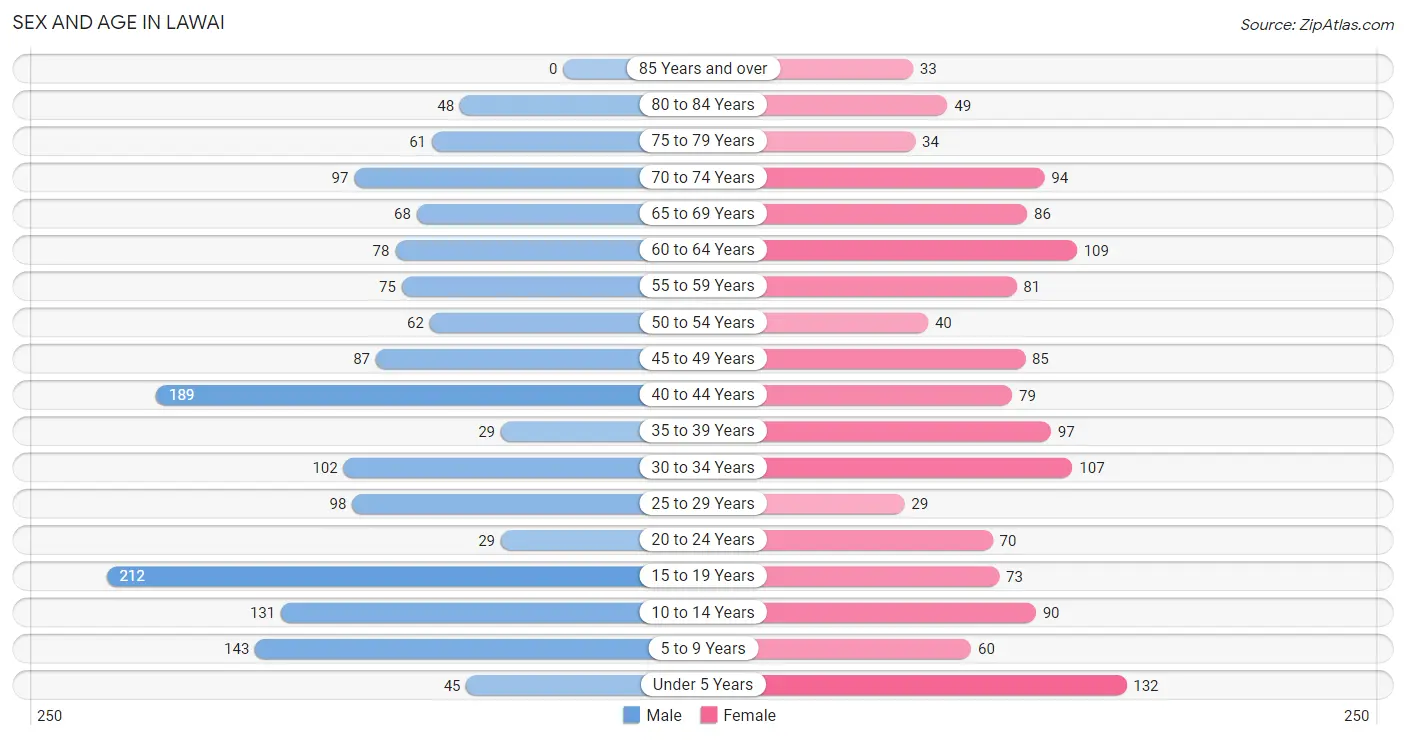
Sex and Age in Lawai
Sex and Age in Lawai
The most populous age groups in Lawai are 15 to 19 Years (212 | 13.6%) for men and Under 5 Years (132 | 9.8%) for women.
| Age Bracket | Male | Female |
| Under 5 Years | 45 (2.9%) | 132 (9.8%) |
| 5 to 9 Years | 143 (9.2%) | 60 (4.4%) |
| 10 to 14 Years | 131 (8.4%) | 90 (6.7%) |
| 15 to 19 Years | 212 (13.6%) | 73 (5.4%) |
| 20 to 24 Years | 29 (1.9%) | 70 (5.2%) |
| 25 to 29 Years | 98 (6.3%) | 29 (2.1%) |
| 30 to 34 Years | 102 (6.6%) | 107 (7.9%) |
| 35 to 39 Years | 29 (1.9%) | 97 (7.2%) |
| 40 to 44 Years | 189 (12.2%) | 79 (5.9%) |
| 45 to 49 Years | 87 (5.6%) | 85 (6.3%) |
| 50 to 54 Years | 62 (4.0%) | 40 (3.0%) |
| 55 to 59 Years | 75 (4.8%) | 81 (6.0%) |
| 60 to 64 Years | 78 (5.0%) | 109 (8.1%) |
| 65 to 69 Years | 68 (4.4%) | 86 (6.4%) |
| 70 to 74 Years | 97 (6.2%) | 94 (7.0%) |
| 75 to 79 Years | 61 (3.9%) | 34 (2.5%) |
| 80 to 84 Years | 48 (3.1%) | 49 (3.6%) |
| 85 Years and over | 0 (0.0%) | 33 (2.5%) |
| Total | 1,554 (100.0%) | 1,348 (100.0%) |
Families and Households in Lawai
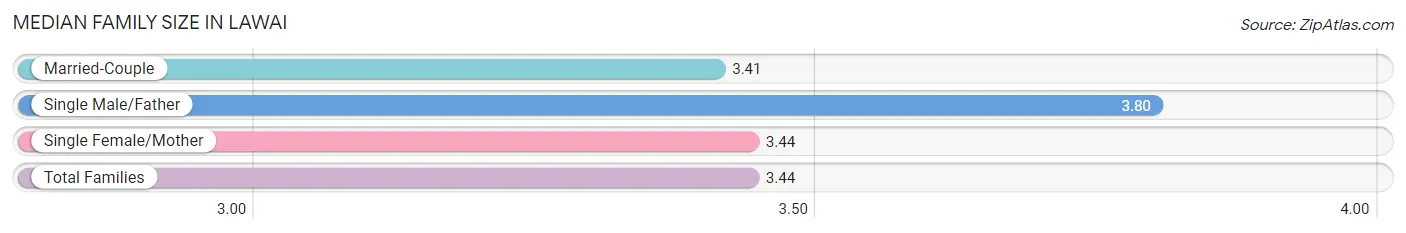
Median Family Size in Lawai
The median family size in Lawai is 3.44 persons per family, with single male/father families (56 | 7.8%) accounting for the largest median family size of 3.8 persons per family. On the other hand, married-couple families (604 | 83.8%) represent the smallest median family size with 3.41 persons per family.
| Family Type | # Families | Family Size |
| Married-Couple | 604 (83.8%) | 3.41 |
| Single Male/Father | 56 (7.8%) | 3.80 |
| Single Female/Mother | 61 (8.5%) | 3.44 |
| Total Families | 721 (100.0%) | 3.44 |
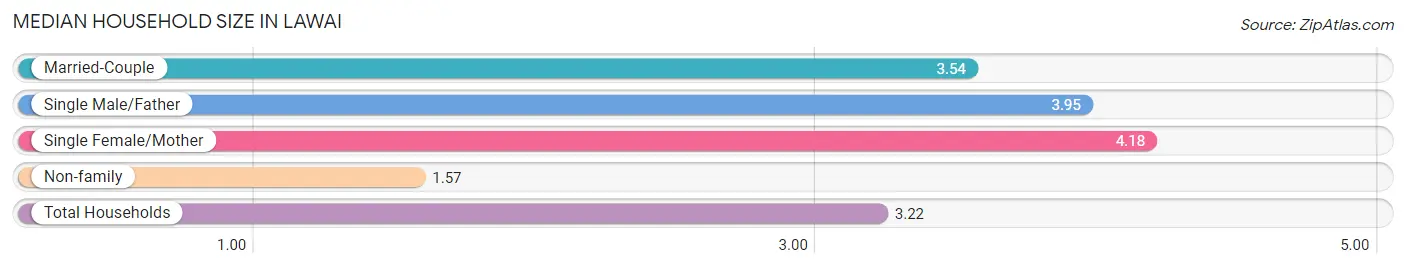
Median Household Size in Lawai
The median household size in Lawai is 3.22 persons per household, with single female/mother households (61 | 6.8%) accounting for the largest median household size of 4.18 persons per household. non-family households (177 | 19.7%) represent the smallest median household size with 1.57 persons per household.
| Household Type | # Households | Household Size |
| Married-Couple | 604 (67.3%) | 3.54 |
| Single Male/Father | 56 (6.2%) | 3.95 |
| Single Female/Mother | 61 (6.8%) | 4.18 |
| Non-family | 177 (19.7%) | 1.57 |
| Total Households | 898 (100.0%) | 3.22 |
Household Size by Marriage Status in Lawai
Out of a total of 898 households in Lawai, 721 (80.3%) are family households, while 177 (19.7%) are nonfamily households. The most numerous type of family households are 2-person households, comprising 321, and the most common type of nonfamily households are 1-person households, comprising 105.
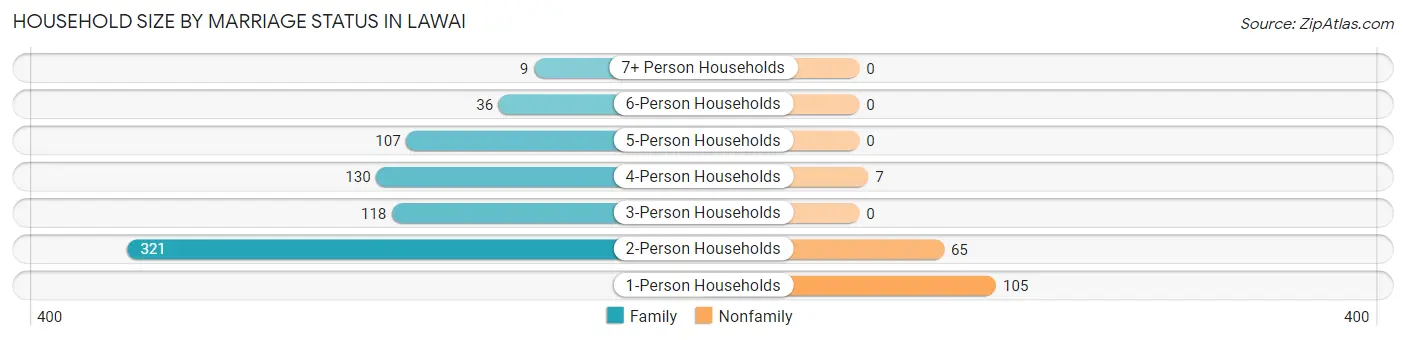
| Household Size | Family Households | Nonfamily Households |
| 1-Person Households | - | 105 (11.7%) |
| 2-Person Households | 321 (35.7%) | 65 (7.2%) |
| 3-Person Households | 118 (13.1%) | 0 (0.0%) |
| 4-Person Households | 130 (14.5%) | 7 (0.8%) |
| 5-Person Households | 107 (11.9%) | 0 (0.0%) |
| 6-Person Households | 36 (4.0%) | 0 (0.0%) |
| 7+ Person Households | 9 (1.0%) | 0 (0.0%) |
| Total | 721 (80.3%) | 177 (19.7%) |
Female Fertility in Lawai
Fertility by Age in Lawai
Average fertility rate in Lawai is 39.0 births per 1,000 women. Women in the age bracket of 15 to 19 years have the highest fertility rate with 82.0 births per 1,000 women. Women in the age bracket of 20 to 34 years acount for 71.4% of all women with births.
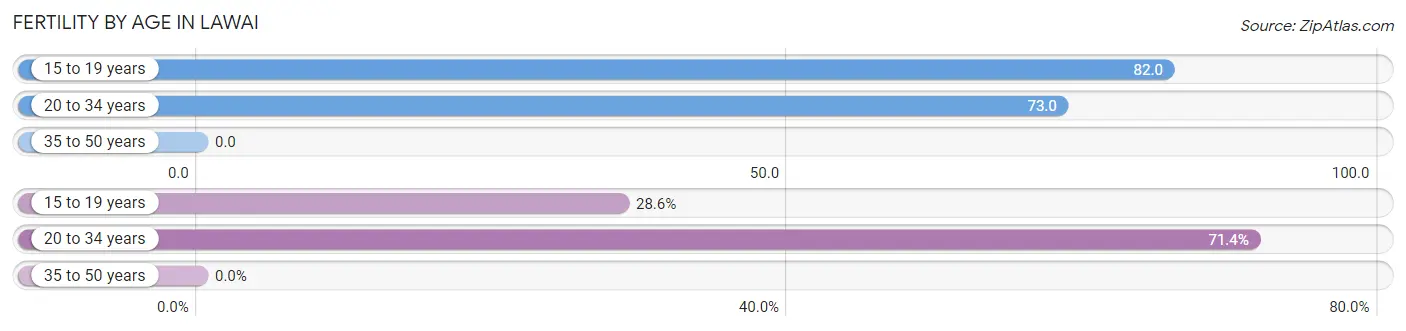
| Age Bracket | Women with Births | Births / 1,000 Women |
| 15 to 19 years | 6 (28.6%) | 82.0 |
| 20 to 34 years | 15 (71.4%) | 73.0 |
| 35 to 50 years | 0 (0.0%) | 0.0 |
| Total | 21 (100.0%) | 39.0 |
Fertility by Age by Marriage Status in Lawai
57.1% of women with births (21) in Lawai are married. The highest percentage of unmarried women with births falls into 20 to 34 years age bracket with 60.0% of them unmarried at the time of birth, while the lowest percentage of unmarried women with births belong to 15 to 19 years age bracket with 0.0% of them unmarried.
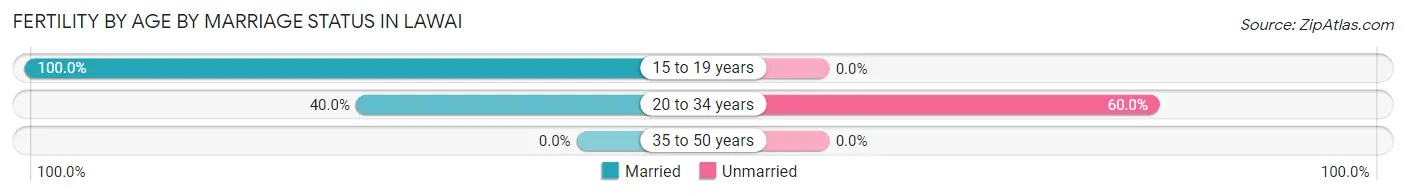
| Age Bracket | Married | Unmarried |
| 15 to 19 years | 6 (100.0%) | 0 (0.0%) |
| 20 to 34 years | 6 (40.0%) | 9 (60.0%) |
| 35 to 50 years | 0 (0.0%) | 0 (0.0%) |
| Total | 12 (57.1%) | 9 (42.9%) |
Fertility by Education in Lawai
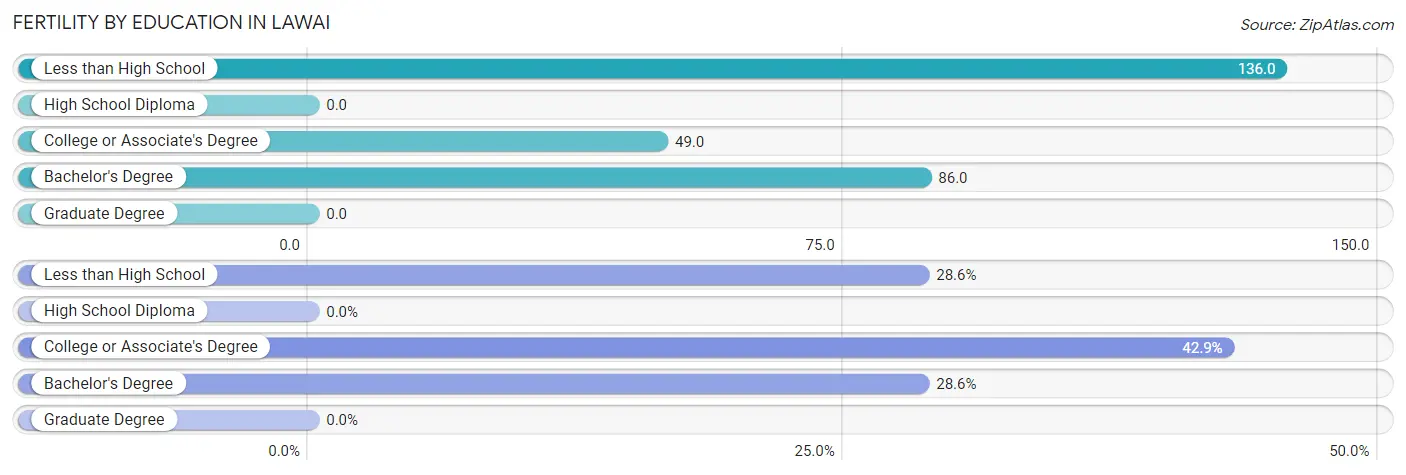
| Educational Attainment | Women with Births | Births / 1,000 Women |
| Less than High School | 6 (28.6%) | 136.0 |
| High School Diploma | 0 (0.0%) | 0.0 |
| College or Associate's Degree | 9 (42.9%) | 49.0 |
| Bachelor's Degree | 6 (28.6%) | 86.0 |
| Graduate Degree | 0 (0.0%) | 0.0 |
| Total | 21 (100.0%) | 39.0 |
Fertility by Education by Marriage Status in Lawai
42.9% of women with births in Lawai are unmarried. Women with the educational attainment of less than high school are most likely to be married with 100.0% of them married at childbirth, while women with the educational attainment of college or associate's degree are least likely to be married with 100.0% of them unmarried at childbirth.
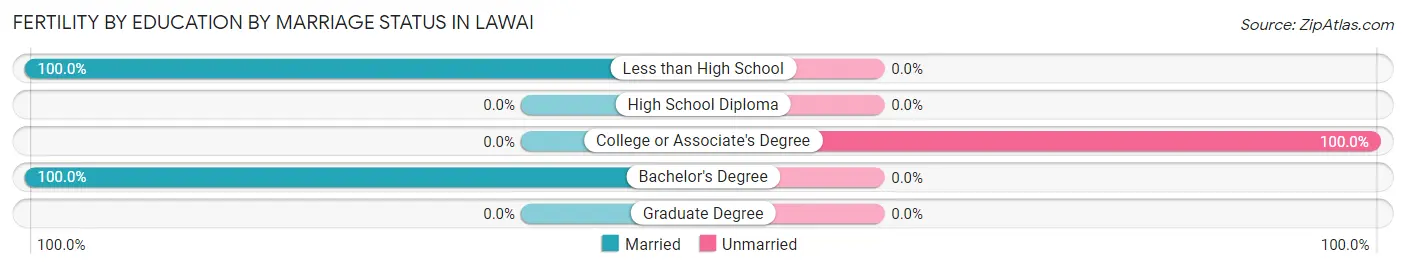
| Educational Attainment | Married | Unmarried |
| Less than High School | 6 (100.0%) | 0 (0.0%) |
| High School Diploma | 0 (0.0%) | 0 (0.0%) |
| College or Associate's Degree | 0 (0.0%) | 9 (100.0%) |
| Bachelor's Degree | 6 (100.0%) | 0 (0.0%) |
| Graduate Degree | 0 (0.0%) | 0 (0.0%) |
| Total | 12 (57.1%) | 9 (42.9%) |
Employment Characteristics in Lawai
Employment by Class of Employer in Lawai
Among the 1,078 employed individuals in Lawai, private company employees (633 | 58.7%), self-employed (not incorporated) (168 | 15.6%), and state government employees (110 | 10.2%) make up the most common classes of employment.
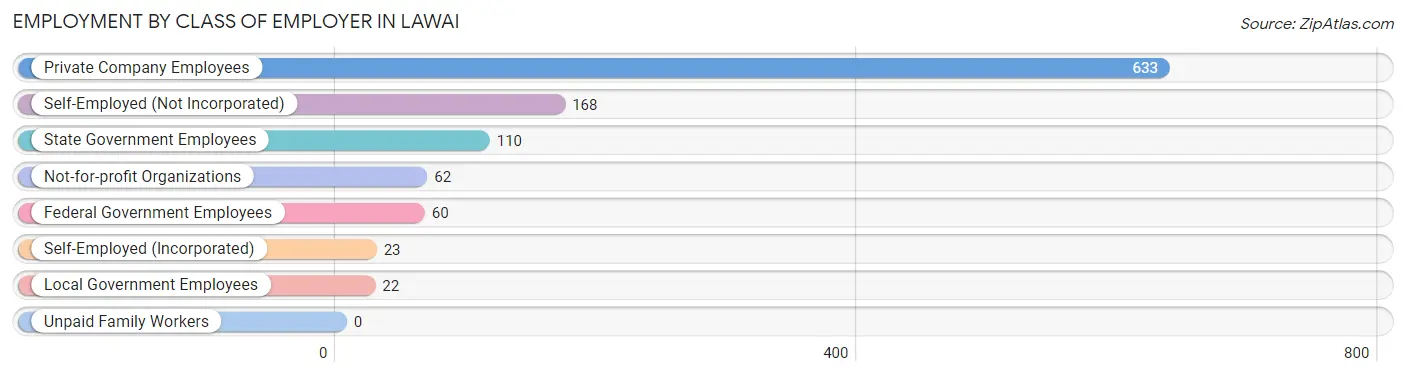
| Employer Class | # Employees | % Employees |
| Private Company Employees | 633 | 58.7% |
| Self-Employed (Incorporated) | 23 | 2.1% |
| Self-Employed (Not Incorporated) | 168 | 15.6% |
| Not-for-profit Organizations | 62 | 5.8% |
| Local Government Employees | 22 | 2.0% |
| State Government Employees | 110 | 10.2% |
| Federal Government Employees | 60 | 5.6% |
| Unpaid Family Workers | 0 | 0.0% |
| Total | 1,078 | 100.0% |
Employment Status by Age in Lawai
According to the labor force statistics for Lawai, out of the total population over 16 years of age (2,260), 57.9% or 1,309 individuals are in the labor force, with 12.2% or 160 of them unemployed. The age group with the highest labor force participation rate is 20 to 24 years, with 100.0% or 99 individuals in the labor force. Within the labor force, the 16 to 19 years age range has the highest percentage of unemployed individuals, with 58.8% or 50 of them being unemployed.
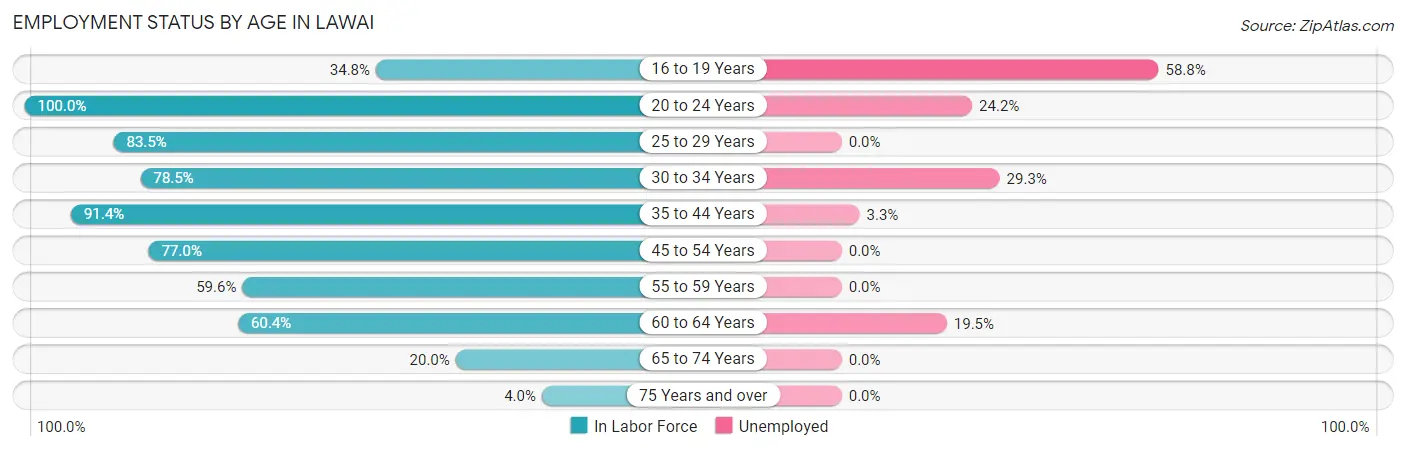
| Age Bracket | In Labor Force | Unemployed |
| 16 to 19 Years | 85 (34.8%) | 50 (58.8%) |
| 20 to 24 Years | 99 (100.0%) | 24 (24.2%) |
| 25 to 29 Years | 106 (83.5%) | 0 (0.0%) |
| 30 to 34 Years | 164 (78.5%) | 48 (29.3%) |
| 35 to 44 Years | 360 (91.4%) | 12 (3.3%) |
| 45 to 54 Years | 211 (77.0%) | 0 (0.0%) |
| 55 to 59 Years | 93 (59.6%) | 0 (0.0%) |
| 60 to 64 Years | 113 (60.4%) | 22 (19.5%) |
| 65 to 74 Years | 69 (20.0%) | 0 (0.0%) |
| 75 Years and over | 9 (4.0%) | 0 (0.0%) |
| Total | 1,309 (57.9%) | 160 (12.2%) |
Employment Status by Educational Attainment in Lawai
According to labor force statistics for Lawai, 77.7% of individuals (1,047) out of the total population between 25 and 64 years of age (1,347) are in the labor force, with 8.1% or 85 of them being unemployed. The group with the highest labor force participation rate are those with the educational attainment of less than high school, with 100.0% or 28 individuals in the labor force. Within the labor force, individuals with high school diploma education have the highest percentage of unemployment, with 10.0% or 27 of them being unemployed.
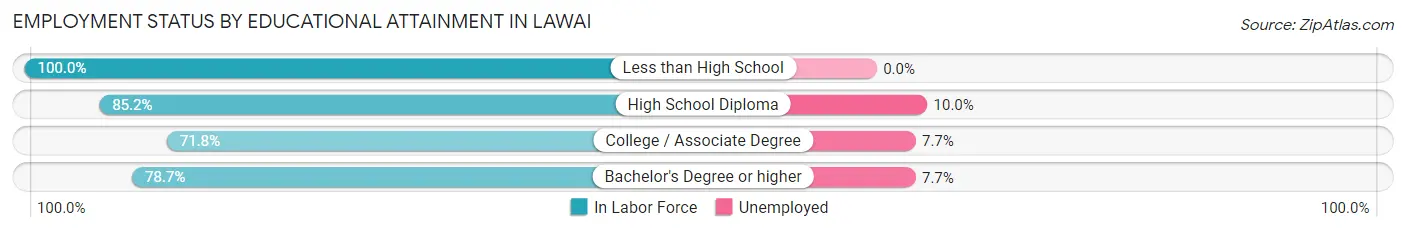
| Educational Attainment | In Labor Force | Unemployed |
| Less than High School | 28 (100.0%) | 0 (0.0%) |
| High School Diploma | 271 (85.2%) | 32 (10.0%) |
| College / Associate Degree | 409 (71.8%) | 44 (7.7%) |
| Bachelor's Degree or higher | 339 (78.7%) | 33 (7.7%) |
| Total | 1,047 (77.7%) | 109 (8.1%) |
Employment Occupations by Sex in Lawai
Management, Business, Science and Arts Occupations
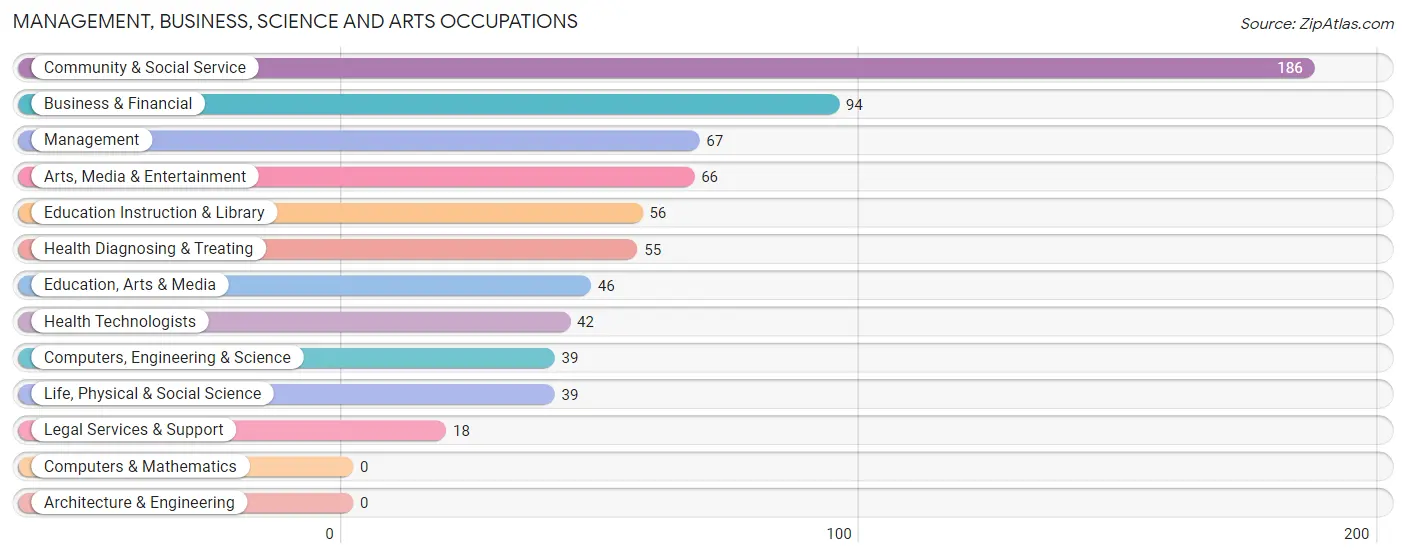
The most common Management, Business, Science and Arts occupations in Lawai are Community & Social Service (186 | 16.6%), Business & Financial (94 | 8.4%), Management (67 | 6.0%), Arts, Media & Entertainment (66 | 5.9%), and Education Instruction & Library (56 | 5.0%).
Management, Business, Science and Arts Occupations by Sex
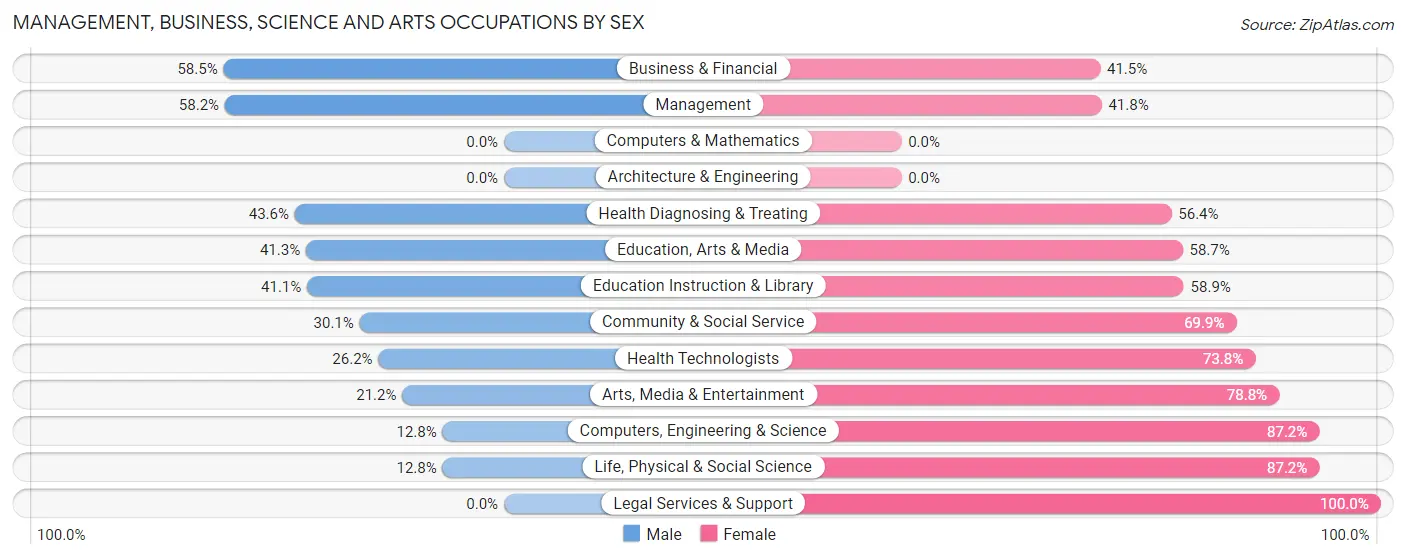
Within the Management, Business, Science and Arts occupations in Lawai, the most male-oriented occupations are Business & Financial (58.5%), Management (58.2%), and Health Diagnosing & Treating (43.6%), while the most female-oriented occupations are Legal Services & Support (100.0%), Computers, Engineering & Science (87.2%), and Life, Physical & Social Science (87.2%).
| Occupation | Male | Female |
| Management | 39 (58.2%) | 28 (41.8%) |
| Business & Financial | 55 (58.5%) | 39 (41.5%) |
| Computers, Engineering & Science | 5 (12.8%) | 34 (87.2%) |
| Computers & Mathematics | 0 (0.0%) | 0 (0.0%) |
| Architecture & Engineering | 0 (0.0%) | 0 (0.0%) |
| Life, Physical & Social Science | 5 (12.8%) | 34 (87.2%) |
| Community & Social Service | 56 (30.1%) | 130 (69.9%) |
| Education, Arts & Media | 19 (41.3%) | 27 (58.7%) |
| Legal Services & Support | 0 (0.0%) | 18 (100.0%) |
| Education Instruction & Library | 23 (41.1%) | 33 (58.9%) |
| Arts, Media & Entertainment | 14 (21.2%) | 52 (78.8%) |
| Health Diagnosing & Treating | 24 (43.6%) | 31 (56.4%) |
| Health Technologists | 11 (26.2%) | 31 (73.8%) |
| Total (Category) | 179 (40.6%) | 262 (59.4%) |
| Total (Overall) | 607 (54.1%) | 515 (45.9%) |
Services Occupations
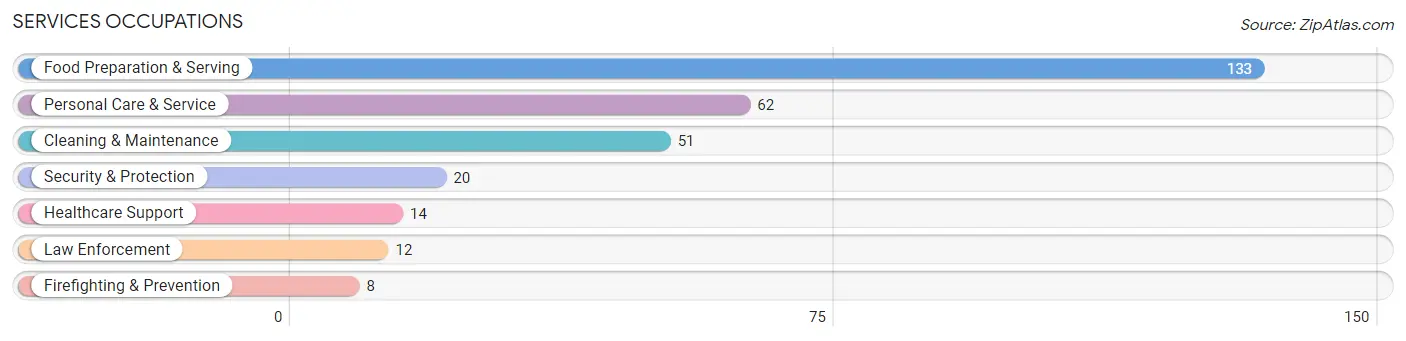
The most common Services occupations in Lawai are Food Preparation & Serving (133 | 11.8%), Personal Care & Service (62 | 5.5%), Cleaning & Maintenance (51 | 4.5%), Security & Protection (20 | 1.8%), and Healthcare Support (14 | 1.3%).
Services Occupations by Sex
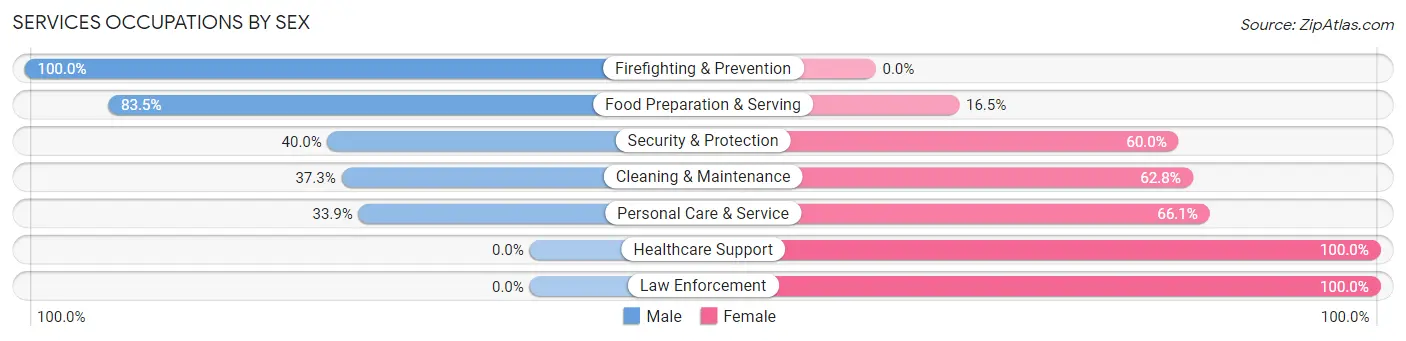
Within the Services occupations in Lawai, the most male-oriented occupations are Firefighting & Prevention (100.0%), Food Preparation & Serving (83.5%), and Security & Protection (40.0%), while the most female-oriented occupations are Healthcare Support (100.0%), Law Enforcement (100.0%), and Personal Care & Service (66.1%).
| Occupation | Male | Female |
| Healthcare Support | 0 (0.0%) | 14 (100.0%) |
| Security & Protection | 8 (40.0%) | 12 (60.0%) |
| Firefighting & Prevention | 8 (100.0%) | 0 (0.0%) |
| Law Enforcement | 0 (0.0%) | 12 (100.0%) |
| Food Preparation & Serving | 111 (83.5%) | 22 (16.5%) |
| Cleaning & Maintenance | 19 (37.2%) | 32 (62.7%) |
| Personal Care & Service | 21 (33.9%) | 41 (66.1%) |
| Total (Category) | 159 (56.8%) | 121 (43.2%) |
| Total (Overall) | 607 (54.1%) | 515 (45.9%) |
Sales and Office Occupations
The most common Sales and Office occupations in Lawai are Sales & Related (87 | 7.7%), and Office & Administration (60 | 5.3%).
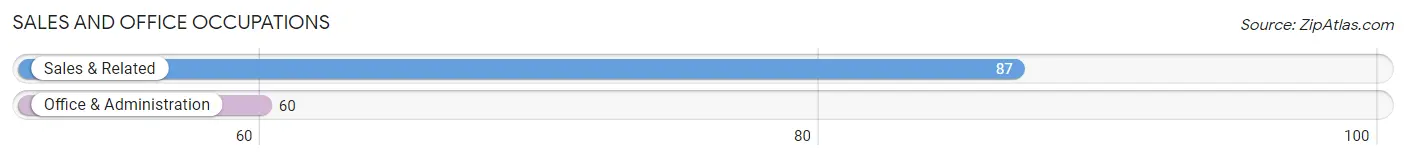
Sales and Office Occupations by Sex
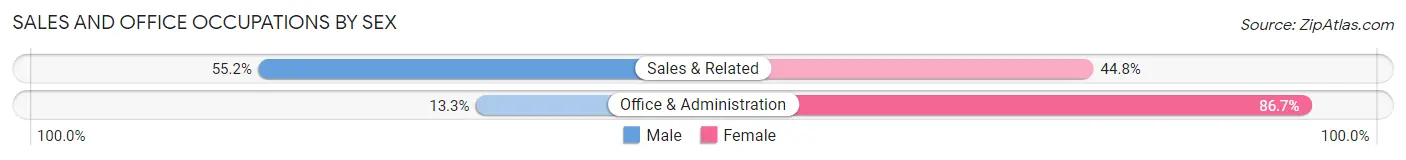
| Occupation | Male | Female |
| Sales & Related | 48 (55.2%) | 39 (44.8%) |
| Office & Administration | 8 (13.3%) | 52 (86.7%) |
| Total (Category) | 56 (38.1%) | 91 (61.9%) |
| Total (Overall) | 607 (54.1%) | 515 (45.9%) |
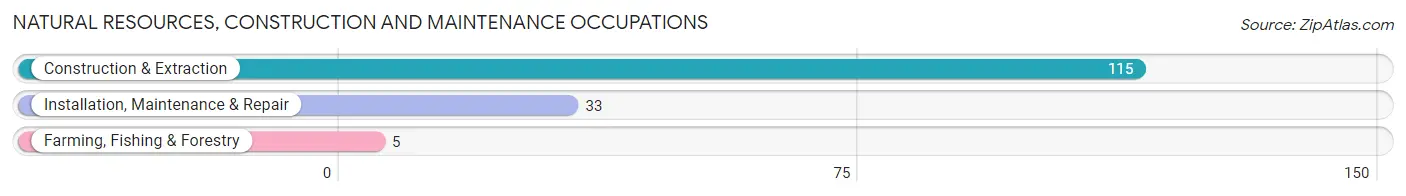
Natural Resources, Construction and Maintenance Occupations
The most common Natural Resources, Construction and Maintenance occupations in Lawai are Construction & Extraction (115 | 10.2%), Installation, Maintenance & Repair (33 | 2.9%), and Farming, Fishing & Forestry (5 | 0.4%).
Natural Resources, Construction and Maintenance Occupations by Sex
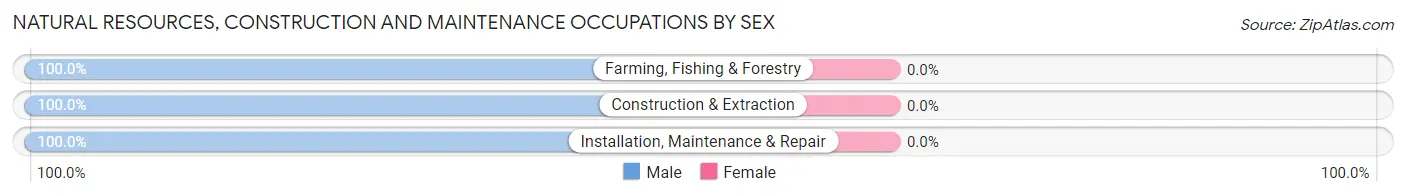
| Occupation | Male | Female |
| Farming, Fishing & Forestry | 5 (100.0%) | 0 (0.0%) |
| Construction & Extraction | 115 (100.0%) | 0 (0.0%) |
| Installation, Maintenance & Repair | 33 (100.0%) | 0 (0.0%) |
| Total (Category) | 153 (100.0%) | 0 (0.0%) |
| Total (Overall) | 607 (54.1%) | 515 (45.9%) |
Production, Transportation and Moving Occupations
The most common Production, Transportation and Moving occupations in Lawai are Production (76 | 6.8%), and Transportation (25 | 2.2%).
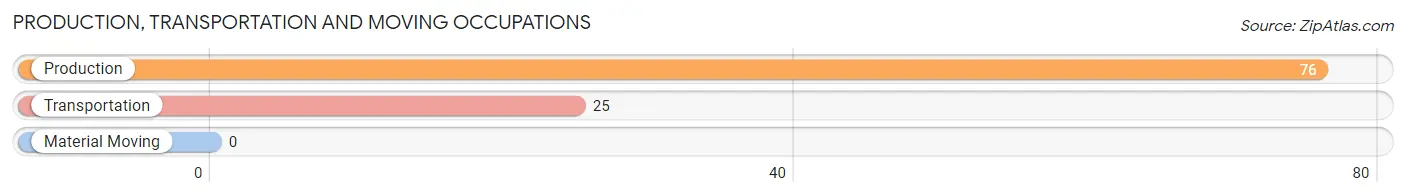
Production, Transportation and Moving Occupations by Sex

| Occupation | Male | Female |
| Production | 35 (46.1%) | 41 (53.9%) |
| Transportation | 25 (100.0%) | 0 (0.0%) |
| Material Moving | 0 (0.0%) | 0 (0.0%) |
| Total (Category) | 60 (59.4%) | 41 (40.6%) |
| Total (Overall) | 607 (54.1%) | 515 (45.9%) |
Employment Industries by Sex in Lawai
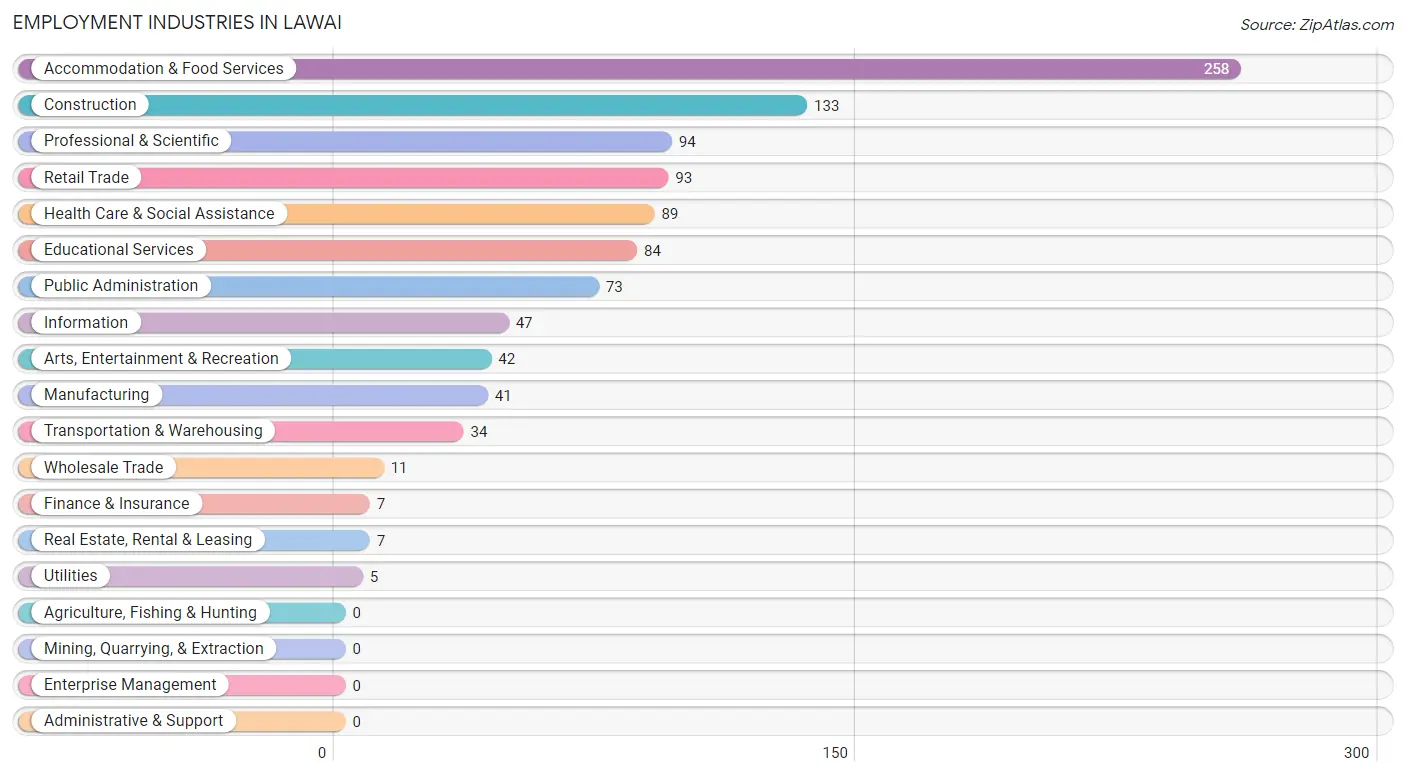
Employment Industries in Lawai
The major employment industries in Lawai include Accommodation & Food Services (258 | 23.0%), Construction (133 | 11.8%), Professional & Scientific (94 | 8.4%), Retail Trade (93 | 8.3%), and Health Care & Social Assistance (89 | 7.9%).
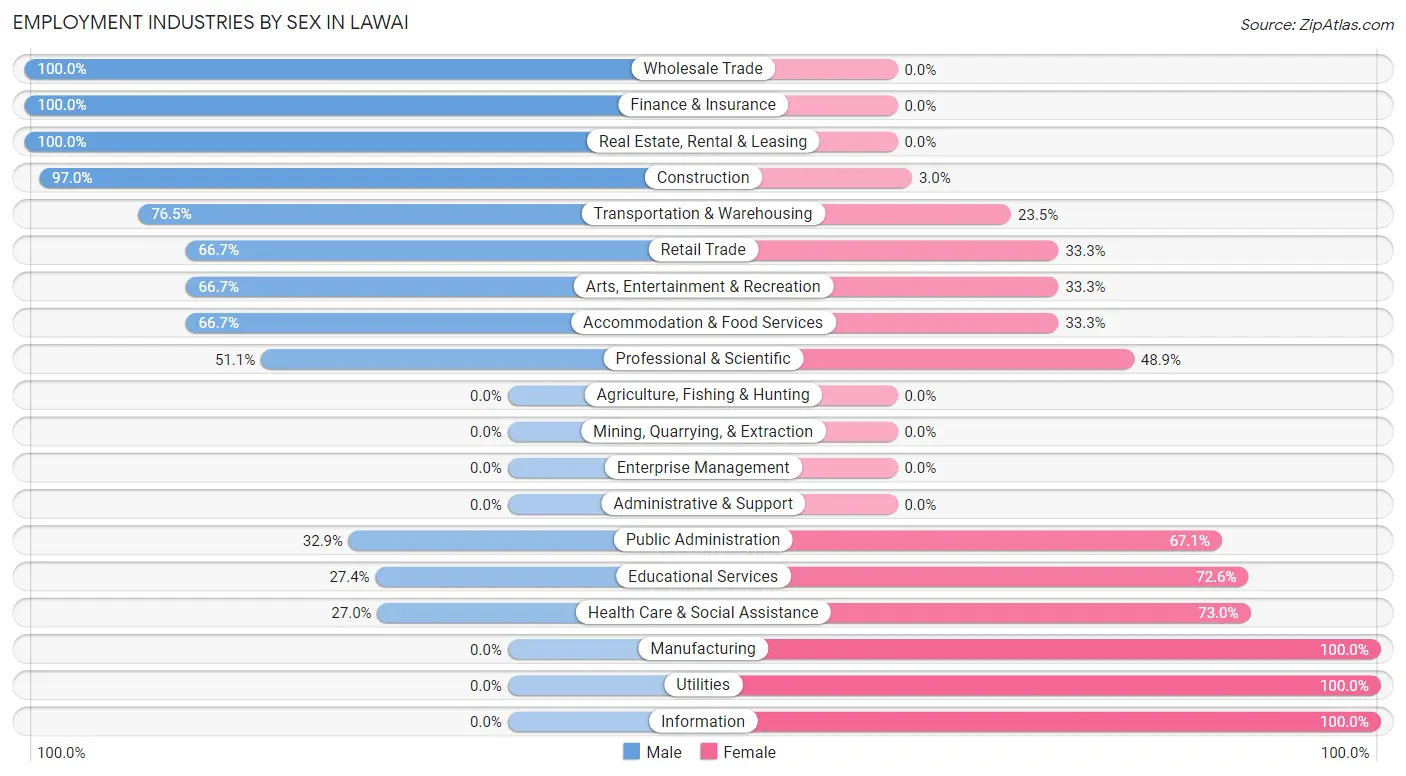
Employment Industries by Sex in Lawai
The Lawai industries that see more men than women are Wholesale Trade (100.0%), Finance & Insurance (100.0%), and Real Estate, Rental & Leasing (100.0%), whereas the industries that tend to have a higher number of women are Manufacturing (100.0%), Utilities (100.0%), and Information (100.0%).
| Industry | Male | Female |
| Agriculture, Fishing & Hunting | 0 (0.0%) | 0 (0.0%) |
| Mining, Quarrying, & Extraction | 0 (0.0%) | 0 (0.0%) |
| Construction | 129 (97.0%) | 4 (3.0%) |
| Manufacturing | 0 (0.0%) | 41 (100.0%) |
| Wholesale Trade | 11 (100.0%) | 0 (0.0%) |
| Retail Trade | 62 (66.7%) | 31 (33.3%) |
| Transportation & Warehousing | 26 (76.5%) | 8 (23.5%) |
| Utilities | 0 (0.0%) | 5 (100.0%) |
| Information | 0 (0.0%) | 47 (100.0%) |
| Finance & Insurance | 7 (100.0%) | 0 (0.0%) |
| Real Estate, Rental & Leasing | 7 (100.0%) | 0 (0.0%) |
| Professional & Scientific | 48 (51.1%) | 46 (48.9%) |
| Enterprise Management | 0 (0.0%) | 0 (0.0%) |
| Administrative & Support | 0 (0.0%) | 0 (0.0%) |
| Educational Services | 23 (27.4%) | 61 (72.6%) |
| Health Care & Social Assistance | 24 (27.0%) | 65 (73.0%) |
| Arts, Entertainment & Recreation | 28 (66.7%) | 14 (33.3%) |
| Accommodation & Food Services | 172 (66.7%) | 86 (33.3%) |
| Public Administration | 24 (32.9%) | 49 (67.1%) |
| Total | 607 (54.1%) | 515 (45.9%) |
Education in Lawai
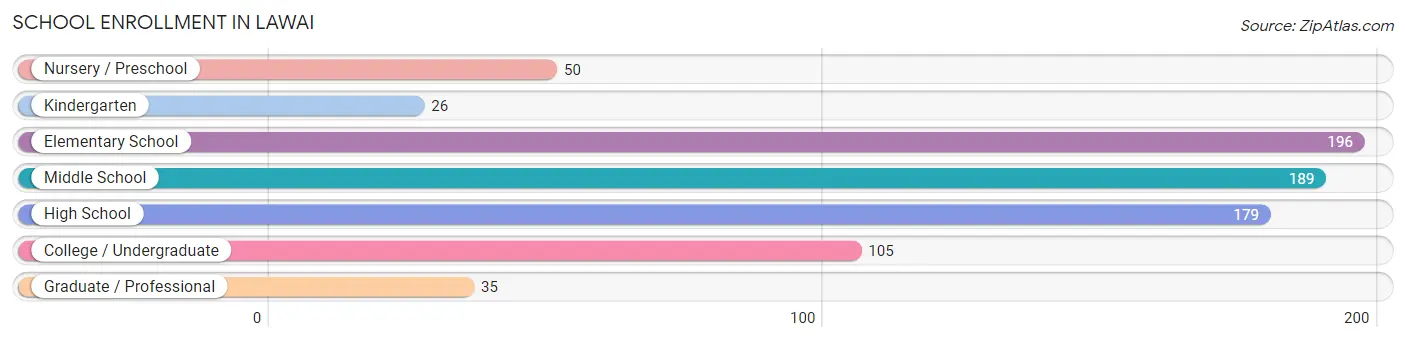
School Enrollment in Lawai
The most common levels of schooling among the 780 students in Lawai are elementary school (196 | 25.1%), middle school (189 | 24.2%), and high school (179 | 23.0%).
| School Level | # Students | % Students |
| Nursery / Preschool | 50 | 6.4% |
| Kindergarten | 26 | 3.3% |
| Elementary School | 196 | 25.1% |
| Middle School | 189 | 24.2% |
| High School | 179 | 23.0% |
| College / Undergraduate | 105 | 13.5% |
| Graduate / Professional | 35 | 4.5% |
| Total | 780 | 100.0% |
School Enrollment by Age by Funding Source in Lawai
Out of a total of 780 students who are enrolled in schools in Lawai, 104 (13.3%) attend a private institution, while the remaining 676 (86.7%) are enrolled in public schools. The age group of 35 years and over has the highest likelihood of being enrolled in private schools, with 14 (100.0% in the age bracket) enrolled. Conversely, the age group of 5 to 9 year old has the lowest likelihood of being enrolled in a private school, with 203 (100.0% in the age bracket) attending a public institution.
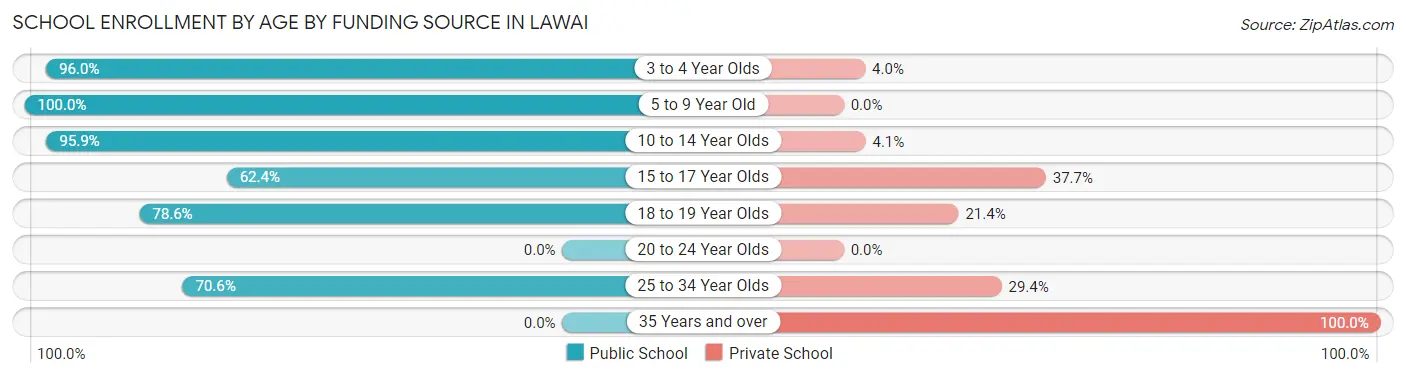
| Age Bracket | Public School | Private School |
| 3 to 4 Year Olds | 48 (96.0%) | 2 (4.0%) |
| 5 to 9 Year Old | 203 (100.0%) | 0 (0.0%) |
| 10 to 14 Year Olds | 212 (95.9%) | 9 (4.1%) |
| 15 to 17 Year Olds | 53 (62.4%) | 32 (37.7%) |
| 18 to 19 Year Olds | 136 (78.6%) | 37 (21.4%) |
| 20 to 24 Year Olds | 0 (0.0%) | 0 (0.0%) |
| 25 to 34 Year Olds | 24 (70.6%) | 10 (29.4%) |
| 35 Years and over | 0 (0.0%) | 14 (100.0%) |
| Total | 676 (86.7%) | 104 (13.3%) |
Educational Attainment by Field of Study in Lawai
Bio, nature & agricultural (177 | 24.5%), literature & languages (107 | 14.8%), social sciences (83 | 11.5%), education (76 | 10.5%), and business (49 | 6.8%) are the most common fields of study among 723 individuals in Lawai who have obtained a bachelor's degree or higher.
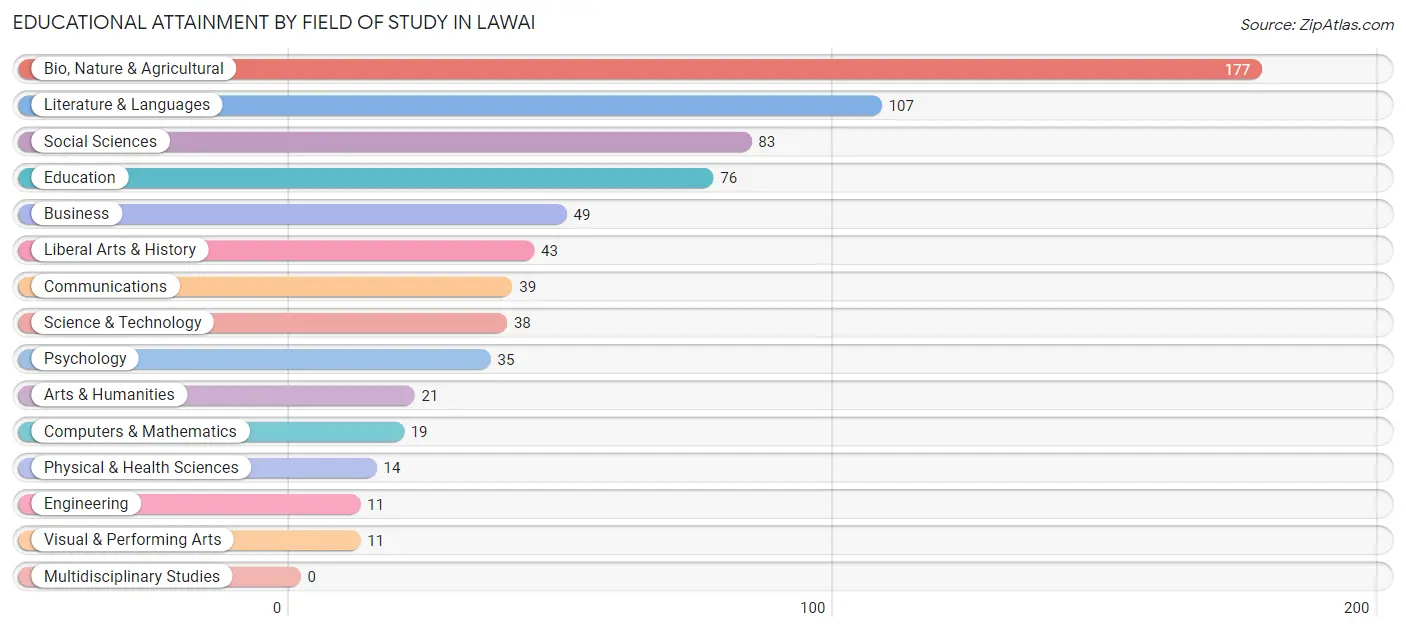
| Field of Study | # Graduates | % Graduates |
| Computers & Mathematics | 19 | 2.6% |
| Bio, Nature & Agricultural | 177 | 24.5% |
| Physical & Health Sciences | 14 | 1.9% |
| Psychology | 35 | 4.8% |
| Social Sciences | 83 | 11.5% |
| Engineering | 11 | 1.5% |
| Multidisciplinary Studies | 0 | 0.0% |
| Science & Technology | 38 | 5.3% |
| Business | 49 | 6.8% |
| Education | 76 | 10.5% |
| Literature & Languages | 107 | 14.8% |
| Liberal Arts & History | 43 | 5.9% |
| Visual & Performing Arts | 11 | 1.5% |
| Communications | 39 | 5.4% |
| Arts & Humanities | 21 | 2.9% |
| Total | 723 | 100.0% |
Transportation & Commute in Lawai
Vehicle Availability by Sex in Lawai
The most prevalent vehicle ownership categories in Lawai are males with 3 vehicles (239, accounting for 39.2%) and females with 3 vehicles (98, making up 51.5%).
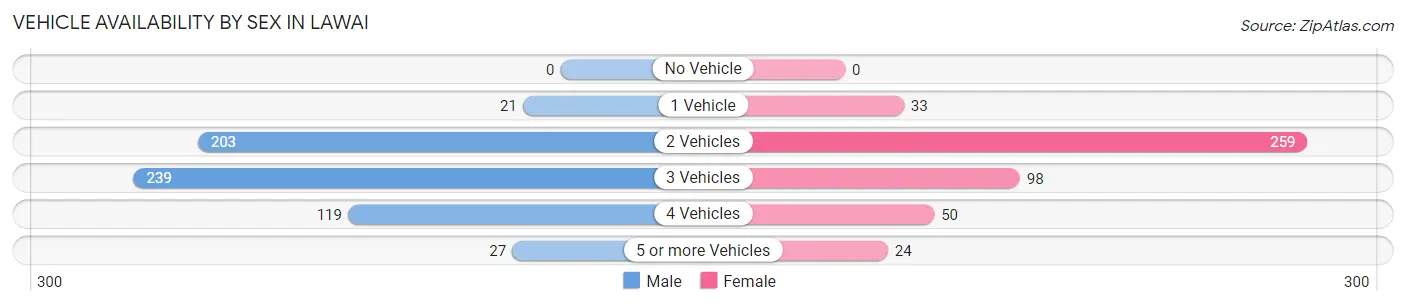
| Vehicles Available | Male | Female |
| No Vehicle | 0 (0.0%) | 0 (0.0%) |
| 1 Vehicle | 21 (3.5%) | 33 (7.1%) |
| 2 Vehicles | 203 (33.3%) | 259 (55.8%) |
| 3 Vehicles | 239 (39.2%) | 98 (21.1%) |
| 4 Vehicles | 119 (19.5%) | 50 (10.8%) |
| 5 or more Vehicles | 27 (4.4%) | 24 (5.2%) |
| Total | 609 (100.0%) | 464 (100.0%) |
Commute Time in Lawai
The most frequently occuring commute durations in Lawai are 30 to 34 minutes (234 commuters, 26.0%), 10 to 14 minutes (228 commuters, 25.4%), and 20 to 24 minutes (162 commuters, 18.0%).
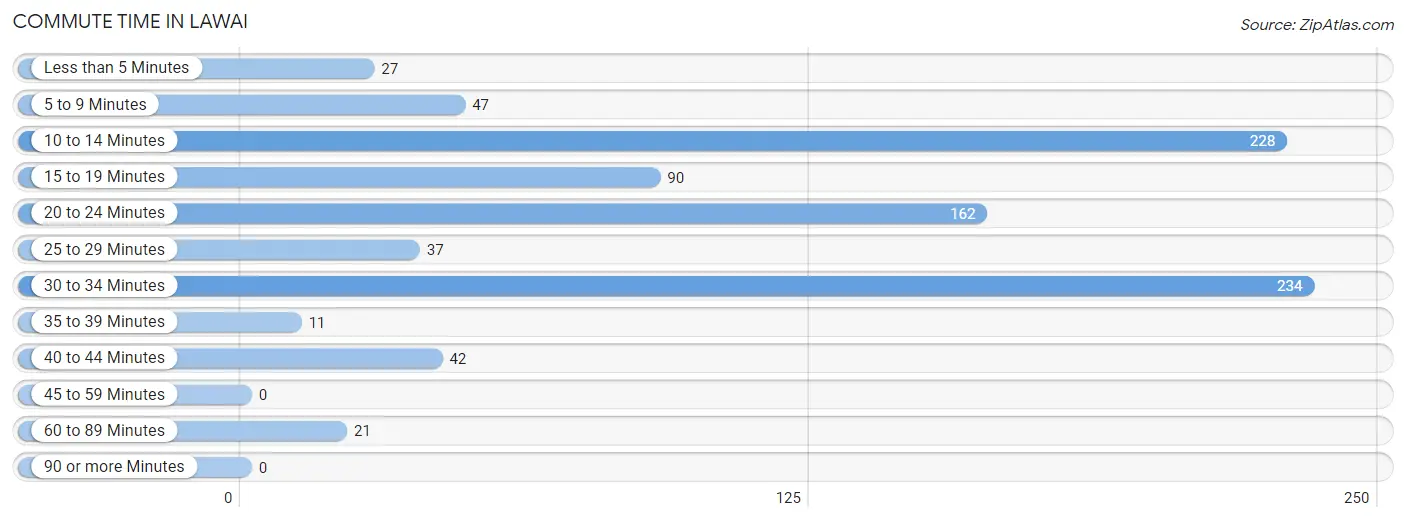
| Commute Time | # Commuters | % Commuters |
| Less than 5 Minutes | 27 | 3.0% |
| 5 to 9 Minutes | 47 | 5.2% |
| 10 to 14 Minutes | 228 | 25.4% |
| 15 to 19 Minutes | 90 | 10.0% |
| 20 to 24 Minutes | 162 | 18.0% |
| 25 to 29 Minutes | 37 | 4.1% |
| 30 to 34 Minutes | 234 | 26.0% |
| 35 to 39 Minutes | 11 | 1.2% |
| 40 to 44 Minutes | 42 | 4.7% |
| 45 to 59 Minutes | 0 | 0.0% |
| 60 to 89 Minutes | 21 | 2.3% |
| 90 or more Minutes | 0 | 0.0% |
Commute Time by Sex in Lawai
The most common commute times in Lawai are 10 to 14 minutes (184 commuters, 34.3%) for males and 30 to 34 minutes (113 commuters, 31.2%) for females.
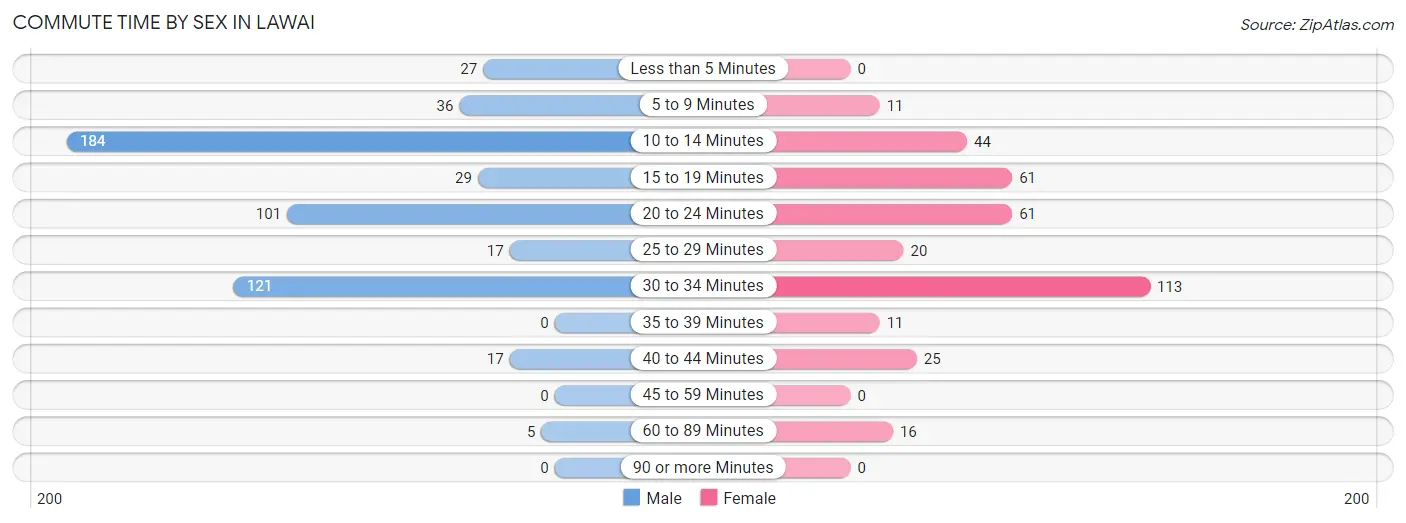
| Commute Time | Male | Female |
| Less than 5 Minutes | 27 (5.0%) | 0 (0.0%) |
| 5 to 9 Minutes | 36 (6.7%) | 11 (3.0%) |
| 10 to 14 Minutes | 184 (34.3%) | 44 (12.1%) |
| 15 to 19 Minutes | 29 (5.4%) | 61 (16.9%) |
| 20 to 24 Minutes | 101 (18.8%) | 61 (16.9%) |
| 25 to 29 Minutes | 17 (3.2%) | 20 (5.5%) |
| 30 to 34 Minutes | 121 (22.5%) | 113 (31.2%) |
| 35 to 39 Minutes | 0 (0.0%) | 11 (3.0%) |
| 40 to 44 Minutes | 17 (3.2%) | 25 (6.9%) |
| 45 to 59 Minutes | 0 (0.0%) | 0 (0.0%) |
| 60 to 89 Minutes | 5 (0.9%) | 16 (4.4%) |
| 90 or more Minutes | 0 (0.0%) | 0 (0.0%) |
Time of Departure to Work by Sex in Lawai
The most frequent times of departure to work in Lawai are 7:00 AM to 7:29 AM (140, 26.1%) for males and 7:00 AM to 7:29 AM (79, 21.8%) for females.
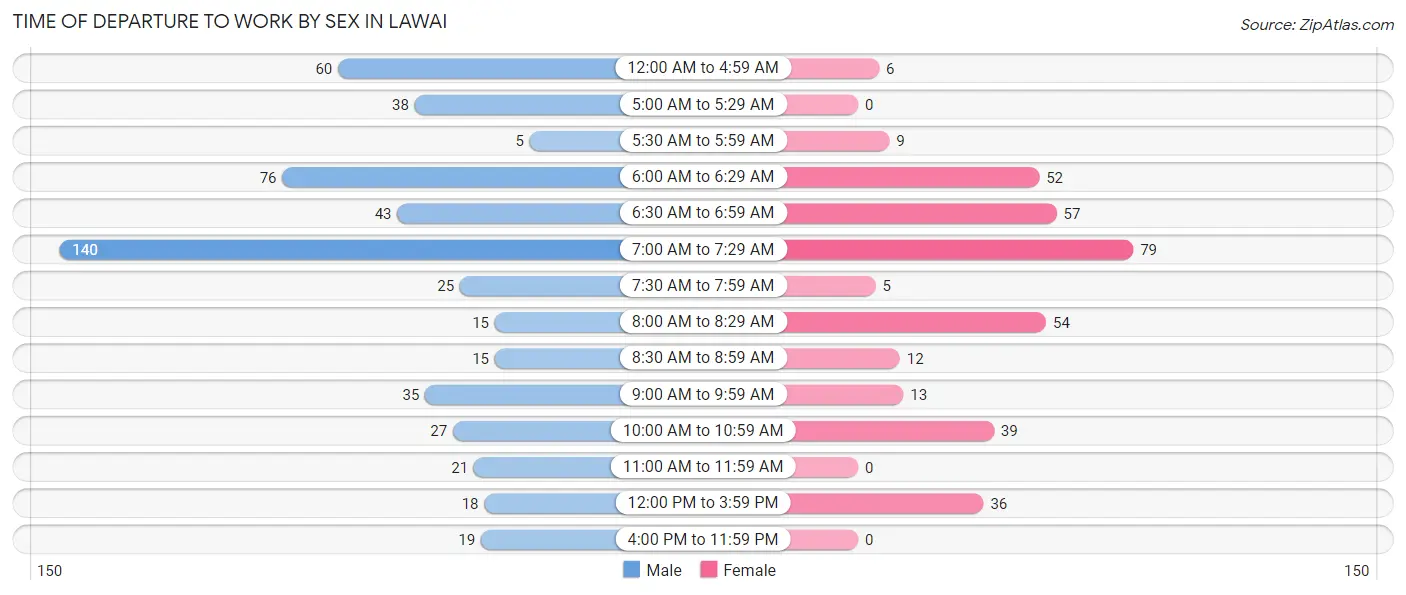
| Time of Departure | Male | Female |
| 12:00 AM to 4:59 AM | 60 (11.2%) | 6 (1.7%) |
| 5:00 AM to 5:29 AM | 38 (7.1%) | 0 (0.0%) |
| 5:30 AM to 5:59 AM | 5 (0.9%) | 9 (2.5%) |
| 6:00 AM to 6:29 AM | 76 (14.1%) | 52 (14.4%) |
| 6:30 AM to 6:59 AM | 43 (8.0%) | 57 (15.8%) |
| 7:00 AM to 7:29 AM | 140 (26.1%) | 79 (21.8%) |
| 7:30 AM to 7:59 AM | 25 (4.7%) | 5 (1.4%) |
| 8:00 AM to 8:29 AM | 15 (2.8%) | 54 (14.9%) |
| 8:30 AM to 8:59 AM | 15 (2.8%) | 12 (3.3%) |
| 9:00 AM to 9:59 AM | 35 (6.5%) | 13 (3.6%) |
| 10:00 AM to 10:59 AM | 27 (5.0%) | 39 (10.8%) |
| 11:00 AM to 11:59 AM | 21 (3.9%) | 0 (0.0%) |
| 12:00 PM to 3:59 PM | 18 (3.4%) | 36 (9.9%) |
| 4:00 PM to 11:59 PM | 19 (3.5%) | 0 (0.0%) |
| Total | 537 (100.0%) | 362 (100.0%) |
Housing Occupancy in Lawai
Occupancy by Ownership in Lawai
Of the total 898 dwellings in Lawai, owner-occupied units account for 607 (67.6%), while renter-occupied units make up 291 (32.4%).
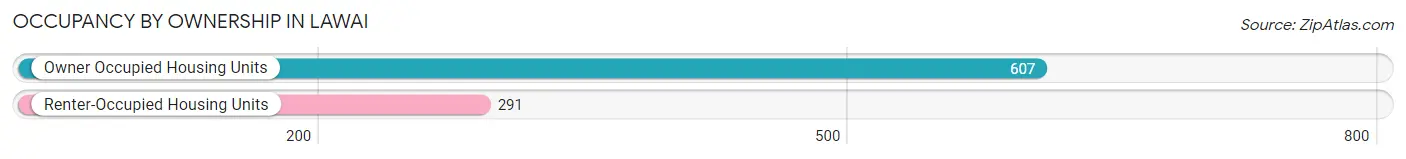
| Occupancy | # Housing Units | % Housing Units |
| Owner Occupied Housing Units | 607 | 67.6% |
| Renter-Occupied Housing Units | 291 | 32.4% |
| Total Occupied Housing Units | 898 | 100.0% |
Occupancy by Household Size in Lawai
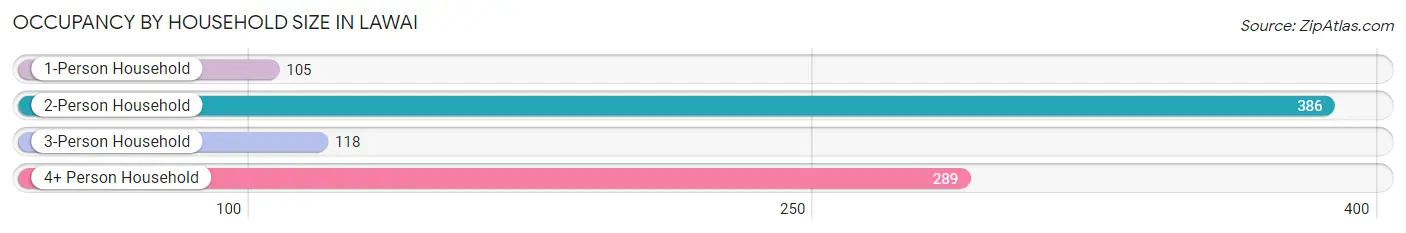
| Household Size | # Housing Units | % Housing Units |
| 1-Person Household | 105 | 11.7% |
| 2-Person Household | 386 | 43.0% |
| 3-Person Household | 118 | 13.1% |
| 4+ Person Household | 289 | 32.2% |
| Total Housing Units | 898 | 100.0% |
Occupancy by Ownership by Household Size in Lawai
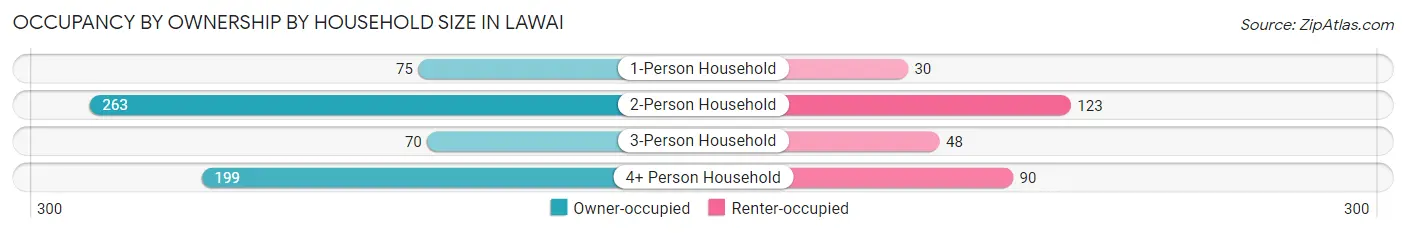
| Household Size | Owner-occupied | Renter-occupied |
| 1-Person Household | 75 (71.4%) | 30 (28.6%) |
| 2-Person Household | 263 (68.1%) | 123 (31.9%) |
| 3-Person Household | 70 (59.3%) | 48 (40.7%) |
| 4+ Person Household | 199 (68.9%) | 90 (31.1%) |
| Total Housing Units | 607 (67.6%) | 291 (32.4%) |
Occupancy by Educational Attainment in Lawai
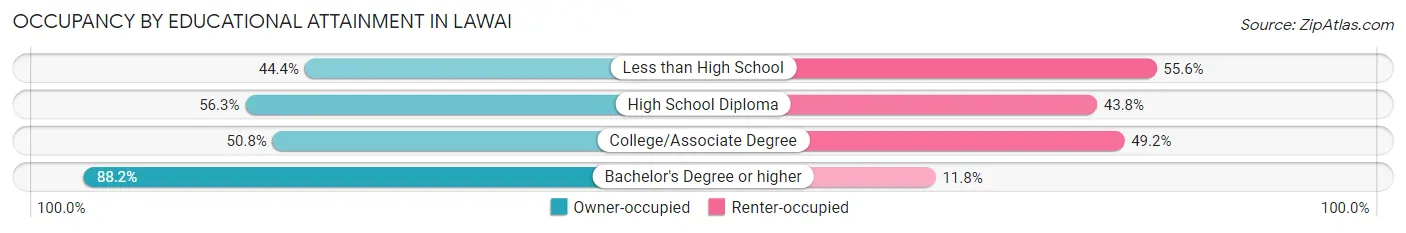
| Household Size | Owner-occupied | Renter-occupied |
| Less than High School | 12 (44.4%) | 15 (55.6%) |
| High School Diploma | 63 (56.2%) | 49 (43.8%) |
| College/Associate Degree | 187 (50.8%) | 181 (49.2%) |
| Bachelor's Degree or higher | 345 (88.2%) | 46 (11.8%) |
Occupancy by Age of Householder in Lawai
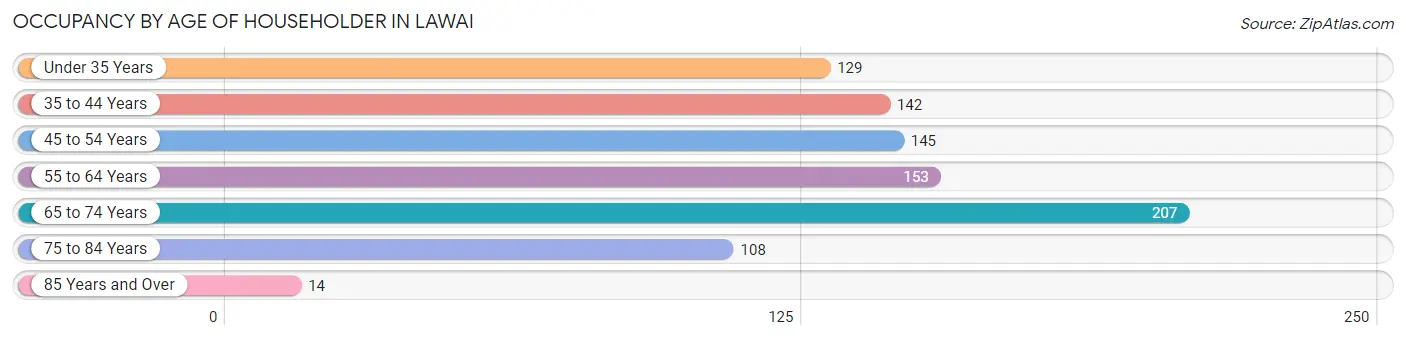
| Age Bracket | # Households | % Households |
| Under 35 Years | 129 | 14.4% |
| 35 to 44 Years | 142 | 15.8% |
| 45 to 54 Years | 145 | 16.2% |
| 55 to 64 Years | 153 | 17.0% |
| 65 to 74 Years | 207 | 23.1% |
| 75 to 84 Years | 108 | 12.0% |
| 85 Years and Over | 14 | 1.6% |
| Total | 898 | 100.0% |
Housing Finances in Lawai
Median Income by Occupancy in Lawai
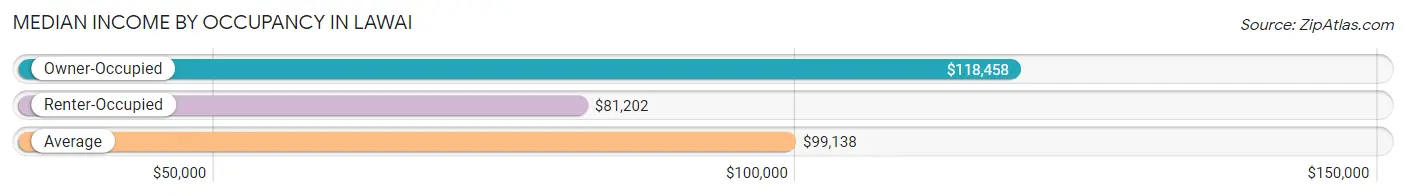
| Occupancy Type | # Households | Median Income |
| Owner-Occupied | 607 (67.6%) | $118,458 |
| Renter-Occupied | 291 (32.4%) | $81,202 |
| Average | 898 (100.0%) | $99,138 |
Occupancy by Householder Income Bracket in Lawai
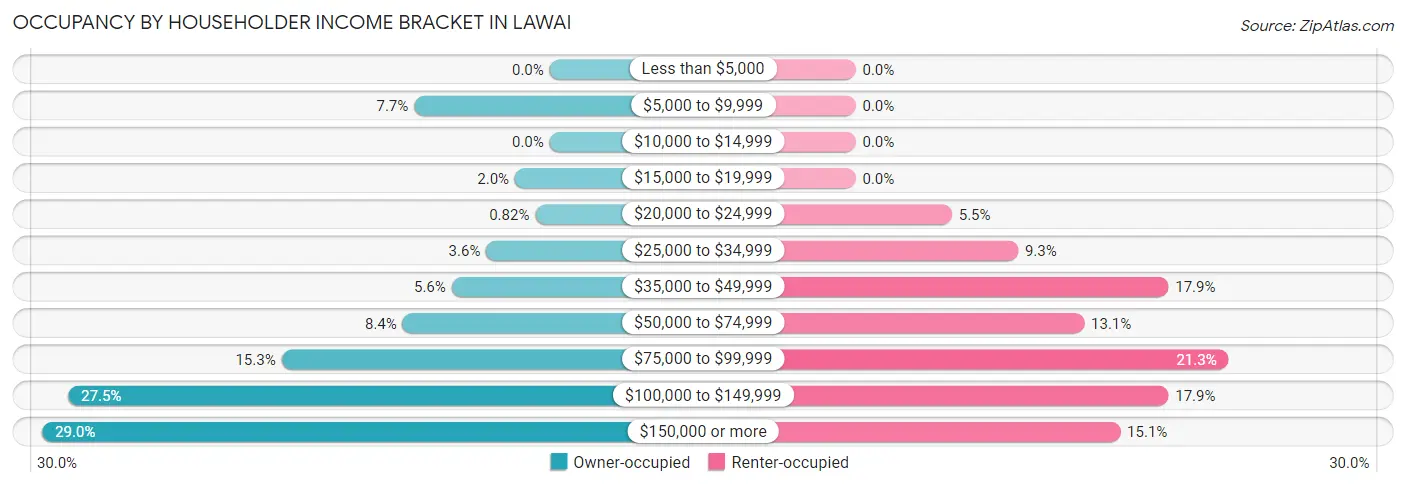
| Income Bracket | Owner-occupied | Renter-occupied |
| Less than $5,000 | 0 (0.0%) | 0 (0.0%) |
| $5,000 to $9,999 | 47 (7.7%) | 0 (0.0%) |
| $10,000 to $14,999 | 0 (0.0%) | 0 (0.0%) |
| $15,000 to $19,999 | 12 (2.0%) | 0 (0.0%) |
| $20,000 to $24,999 | 5 (0.8%) | 16 (5.5%) |
| $25,000 to $34,999 | 22 (3.6%) | 27 (9.3%) |
| $35,000 to $49,999 | 34 (5.6%) | 52 (17.9%) |
| $50,000 to $74,999 | 51 (8.4%) | 38 (13.1%) |
| $75,000 to $99,999 | 93 (15.3%) | 62 (21.3%) |
| $100,000 to $149,999 | 167 (27.5%) | 52 (17.9%) |
| $150,000 or more | 176 (29.0%) | 44 (15.1%) |
| Total | 607 (100.0%) | 291 (100.0%) |
Monthly Housing Cost Tiers in Lawai
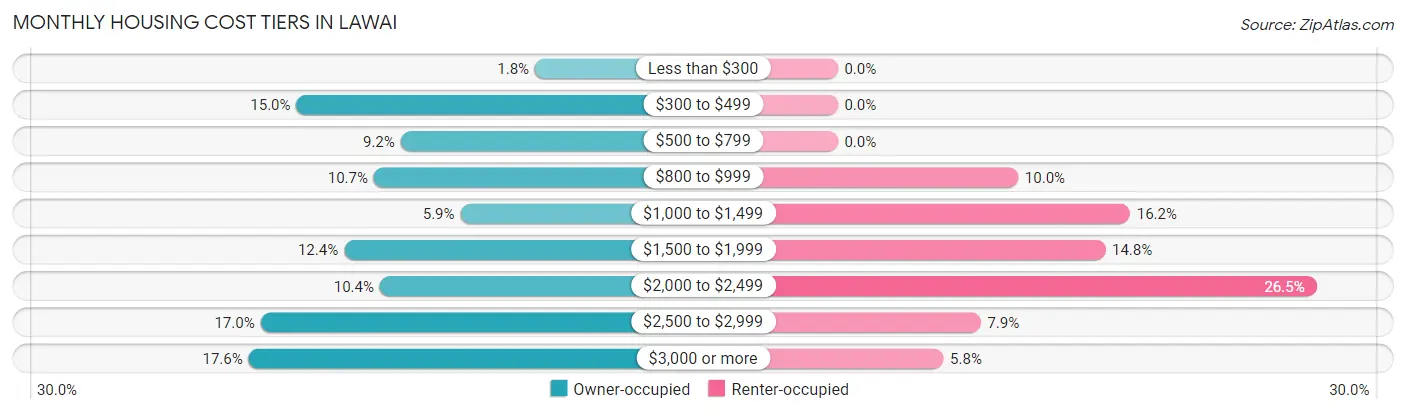
| Monthly Cost | Owner-occupied | Renter-occupied |
| Less than $300 | 11 (1.8%) | 0 (0.0%) |
| $300 to $499 | 91 (15.0%) | 0 (0.0%) |
| $500 to $799 | 56 (9.2%) | 0 (0.0%) |
| $800 to $999 | 65 (10.7%) | 29 (10.0%) |
| $1,000 to $1,499 | 36 (5.9%) | 47 (16.2%) |
| $1,500 to $1,999 | 75 (12.4%) | 43 (14.8%) |
| $2,000 to $2,499 | 63 (10.4%) | 77 (26.5%) |
| $2,500 to $2,999 | 103 (17.0%) | 23 (7.9%) |
| $3,000 or more | 107 (17.6%) | 17 (5.8%) |
| Total | 607 (100.0%) | 291 (100.0%) |
Physical Housing Characteristics in Lawai
Housing Structures in Lawai
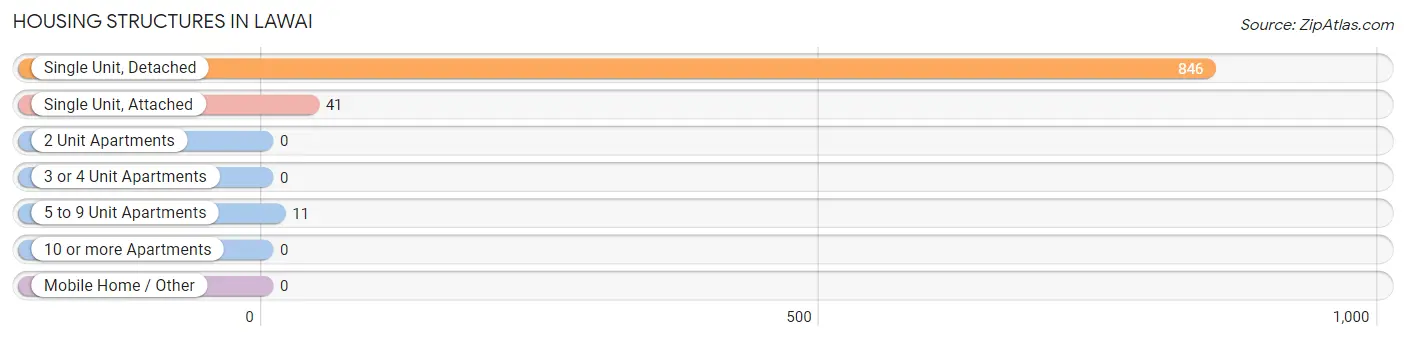
| Structure Type | # Housing Units | % Housing Units |
| Single Unit, Detached | 846 | 94.2% |
| Single Unit, Attached | 41 | 4.6% |
| 2 Unit Apartments | 0 | 0.0% |
| 3 or 4 Unit Apartments | 0 | 0.0% |
| 5 to 9 Unit Apartments | 11 | 1.2% |
| 10 or more Apartments | 0 | 0.0% |
| Mobile Home / Other | 0 | 0.0% |
| Total | 898 | 100.0% |
Housing Structures by Occupancy in Lawai
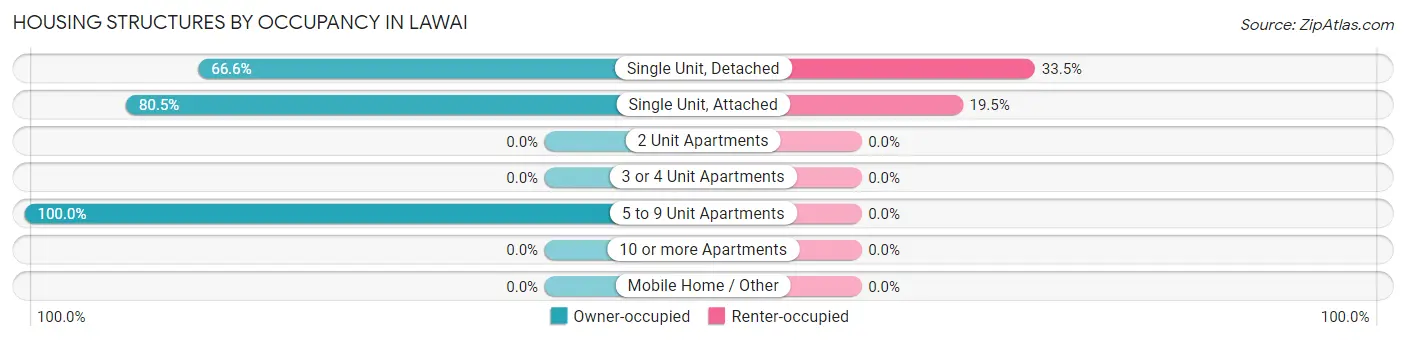
| Structure Type | Owner-occupied | Renter-occupied |
| Single Unit, Detached | 563 (66.5%) | 283 (33.5%) |
| Single Unit, Attached | 33 (80.5%) | 8 (19.5%) |
| 2 Unit Apartments | 0 (0.0%) | 0 (0.0%) |
| 3 or 4 Unit Apartments | 0 (0.0%) | 0 (0.0%) |
| 5 to 9 Unit Apartments | 11 (100.0%) | 0 (0.0%) |
| 10 or more Apartments | 0 (0.0%) | 0 (0.0%) |
| Mobile Home / Other | 0 (0.0%) | 0 (0.0%) |
| Total | 607 (67.6%) | 291 (32.4%) |
Housing Structures by Number of Rooms in Lawai
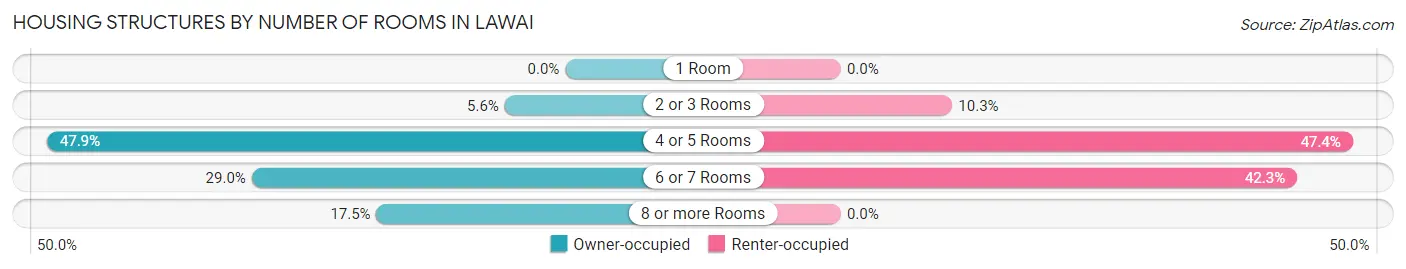
| Number of Rooms | Owner-occupied | Renter-occupied |
| 1 Room | 0 (0.0%) | 0 (0.0%) |
| 2 or 3 Rooms | 34 (5.6%) | 30 (10.3%) |
| 4 or 5 Rooms | 291 (47.9%) | 138 (47.4%) |
| 6 or 7 Rooms | 176 (29.0%) | 123 (42.3%) |
| 8 or more Rooms | 106 (17.5%) | 0 (0.0%) |
| Total | 607 (100.0%) | 291 (100.0%) |
Housing Structure by Heating Type in Lawai
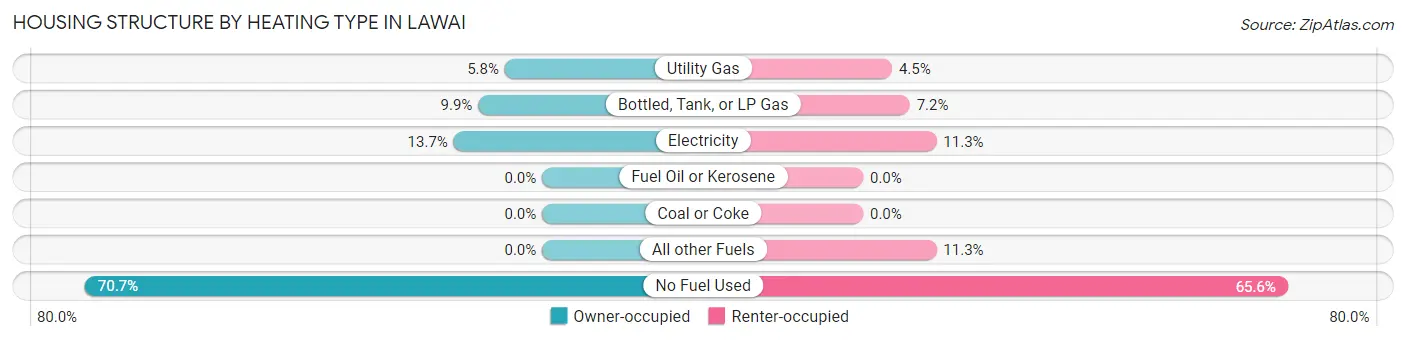
| Heating Type | Owner-occupied | Renter-occupied |
| Utility Gas | 35 (5.8%) | 13 (4.5%) |
| Bottled, Tank, or LP Gas | 60 (9.9%) | 21 (7.2%) |
| Electricity | 83 (13.7%) | 33 (11.3%) |
| Fuel Oil or Kerosene | 0 (0.0%) | 0 (0.0%) |
| Coal or Coke | 0 (0.0%) | 0 (0.0%) |
| All other Fuels | 0 (0.0%) | 33 (11.3%) |
| No Fuel Used | 429 (70.7%) | 191 (65.6%) |
| Total | 607 (100.0%) | 291 (100.0%) |
Household Vehicle Usage in Lawai
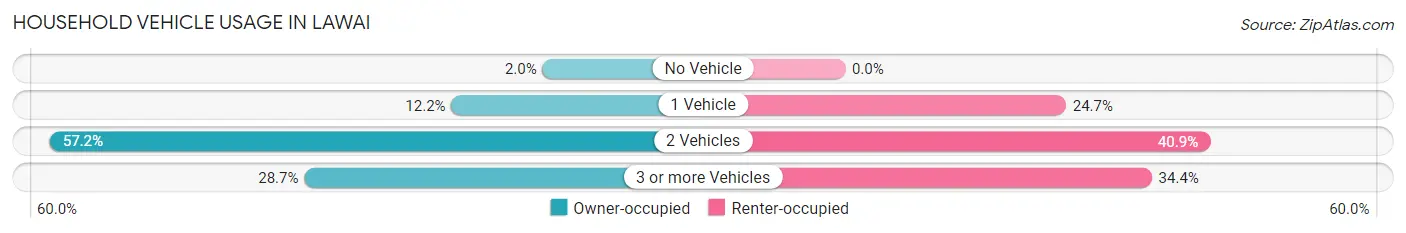
| Vehicles per Household | Owner-occupied | Renter-occupied |
| No Vehicle | 12 (2.0%) | 0 (0.0%) |
| 1 Vehicle | 74 (12.2%) | 72 (24.7%) |
| 2 Vehicles | 347 (57.2%) | 119 (40.9%) |
| 3 or more Vehicles | 174 (28.7%) | 100 (34.4%) |
| Total | 607 (100.0%) | 291 (100.0%) |
Real Estate & Mortgages in Lawai
Real Estate and Mortgage Overview in Lawai
| Characteristic | Without Mortgage | With Mortgage |
| Housing Units | 225 | 382 |
| Median Property Value | $942,700 | $802,600 |
| Median Household Income | $86,375 | $126 |
| Monthly Housing Costs | $530 | $107 |
| Real Estate Taxes | $1,610 | $0 |
Property Value by Mortgage Status in Lawai
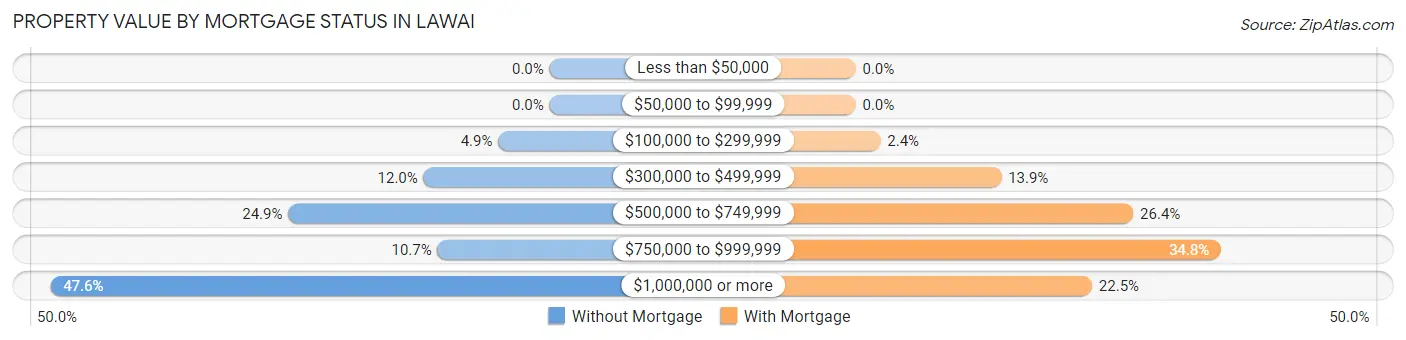
| Property Value | Without Mortgage | With Mortgage |
| Less than $50,000 | 0 (0.0%) | 0 (0.0%) |
| $50,000 to $99,999 | 0 (0.0%) | 0 (0.0%) |
| $100,000 to $299,999 | 11 (4.9%) | 9 (2.4%) |
| $300,000 to $499,999 | 27 (12.0%) | 53 (13.9%) |
| $500,000 to $749,999 | 56 (24.9%) | 101 (26.4%) |
| $750,000 to $999,999 | 24 (10.7%) | 133 (34.8%) |
| $1,000,000 or more | 107 (47.6%) | 86 (22.5%) |
| Total | 225 (100.0%) | 382 (100.0%) |
Household Income by Mortgage Status in Lawai
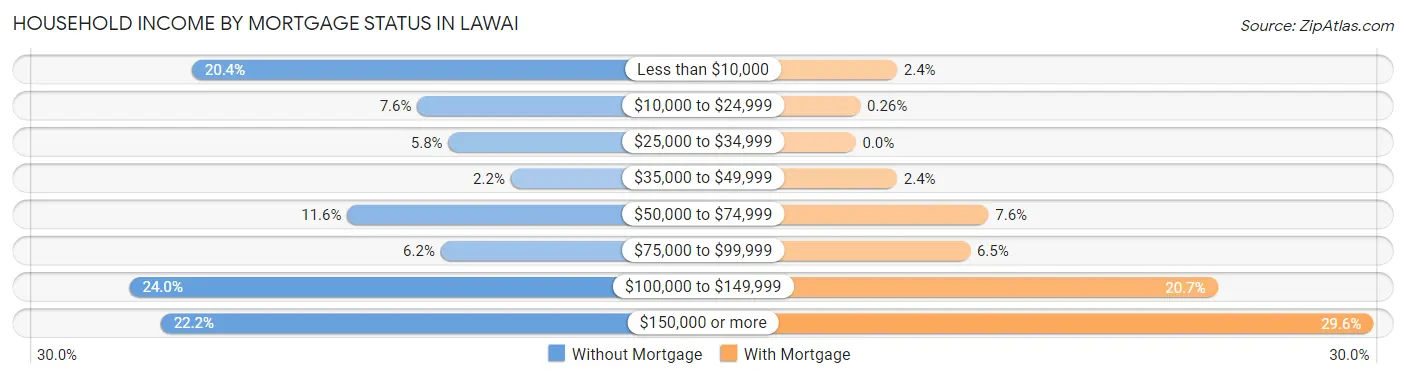
| Household Income | Without Mortgage | With Mortgage |
| Less than $10,000 | 46 (20.4%) | 9 (2.4%) |
| $10,000 to $24,999 | 17 (7.6%) | 1 (0.3%) |
| $25,000 to $34,999 | 13 (5.8%) | 0 (0.0%) |
| $35,000 to $49,999 | 5 (2.2%) | 9 (2.4%) |
| $50,000 to $74,999 | 26 (11.6%) | 29 (7.6%) |
| $75,000 to $99,999 | 14 (6.2%) | 25 (6.5%) |
| $100,000 to $149,999 | 54 (24.0%) | 79 (20.7%) |
| $150,000 or more | 50 (22.2%) | 113 (29.6%) |
| Total | 225 (100.0%) | 382 (100.0%) |
Property Value to Household Income Ratio in Lawai
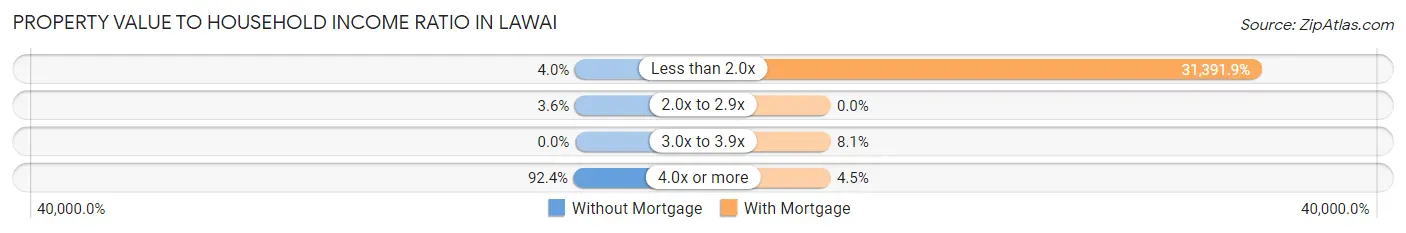
| Value-to-Income Ratio | Without Mortgage | With Mortgage |
| Less than 2.0x | 9 (4.0%) | 119,917 (31,391.9%) |
| 2.0x to 2.9x | 8 (3.6%) | 0 (0.0%) |
| 3.0x to 3.9x | 0 (0.0%) | 31 (8.1%) |
| 4.0x or more | 208 (92.4%) | 17 (4.4%) |
| Total | 225 (100.0%) | 382 (100.0%) |
Real Estate Taxes by Mortgage Status in Lawai
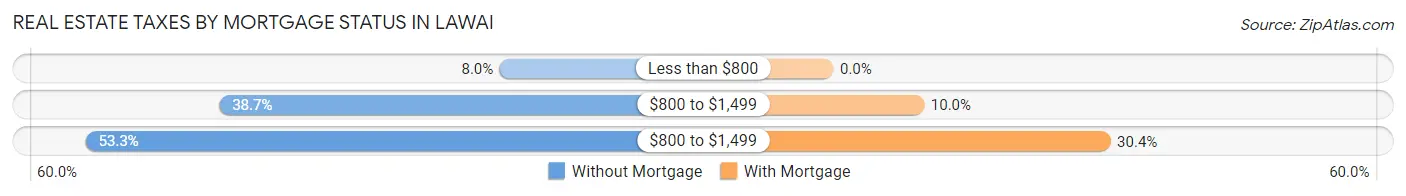
| Property Taxes | Without Mortgage | With Mortgage |
| Less than $800 | 18 (8.0%) | 0 (0.0%) |
| $800 to $1,499 | 87 (38.7%) | 38 (10.0%) |
| $800 to $1,499 | 120 (53.3%) | 116 (30.4%) |
| Total | 225 (100.0%) | 382 (100.0%) |
Health & Disability in Lawai
Health Insurance Coverage by Age in Lawai
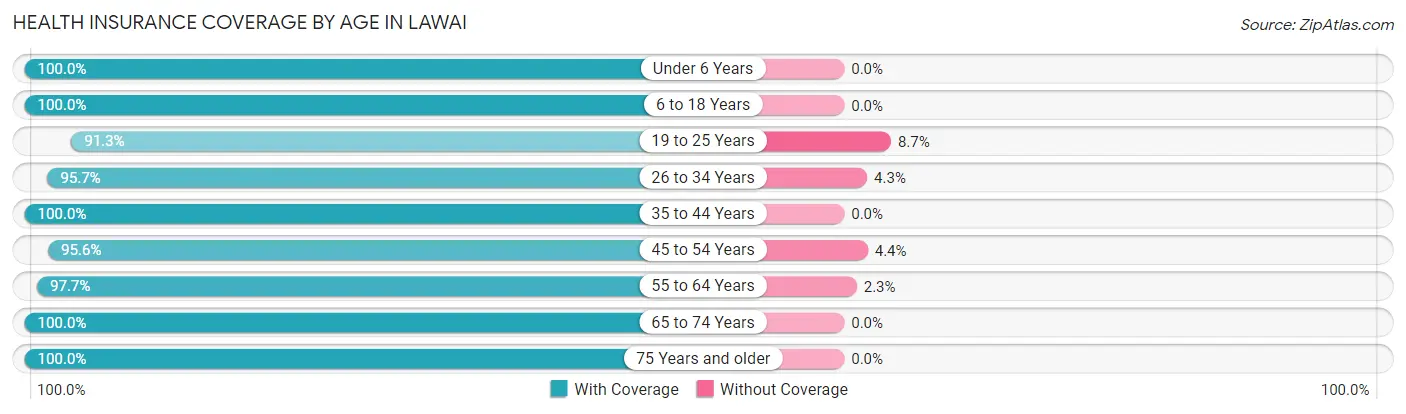
| Age Bracket | With Coverage | Without Coverage |
| Under 6 Years | 193 (100.0%) | 0 (0.0%) |
| 6 to 18 Years | 551 (100.0%) | 0 (0.0%) |
| 19 to 25 Years | 220 (91.3%) | 21 (8.7%) |
| 26 to 34 Years | 292 (95.7%) | 13 (4.3%) |
| 35 to 44 Years | 394 (100.0%) | 0 (0.0%) |
| 45 to 54 Years | 262 (95.6%) | 12 (4.4%) |
| 55 to 64 Years | 335 (97.7%) | 8 (2.3%) |
| 65 to 74 Years | 345 (100.0%) | 0 (0.0%) |
| 75 Years and older | 225 (100.0%) | 0 (0.0%) |
| Total | 2,817 (98.1%) | 54 (1.9%) |
Health Insurance Coverage by Citizenship Status in Lawai
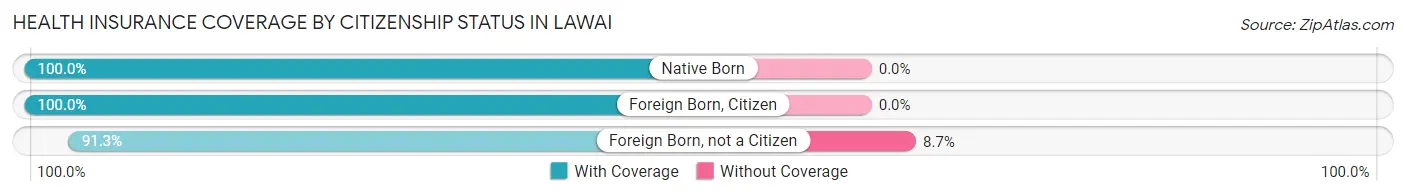
| Citizenship Status | With Coverage | Without Coverage |
| Native Born | 193 (100.0%) | 0 (0.0%) |
| Foreign Born, Citizen | 551 (100.0%) | 0 (0.0%) |
| Foreign Born, not a Citizen | 220 (91.3%) | 21 (8.7%) |
Health Insurance Coverage by Household Income in Lawai
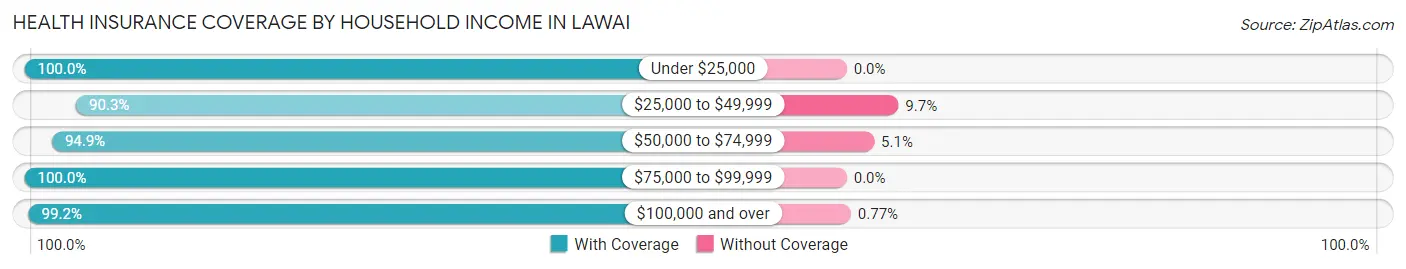
| Household Income | With Coverage | Without Coverage |
| Under $25,000 | 200 (100.0%) | 0 (0.0%) |
| $25,000 to $49,999 | 271 (90.3%) | 29 (9.7%) |
| $50,000 to $74,999 | 222 (94.9%) | 12 (5.1%) |
| $75,000 to $99,999 | 429 (100.0%) | 0 (0.0%) |
| $100,000 and over | 1,685 (99.2%) | 13 (0.8%) |
Public vs Private Health Insurance Coverage by Age in Lawai
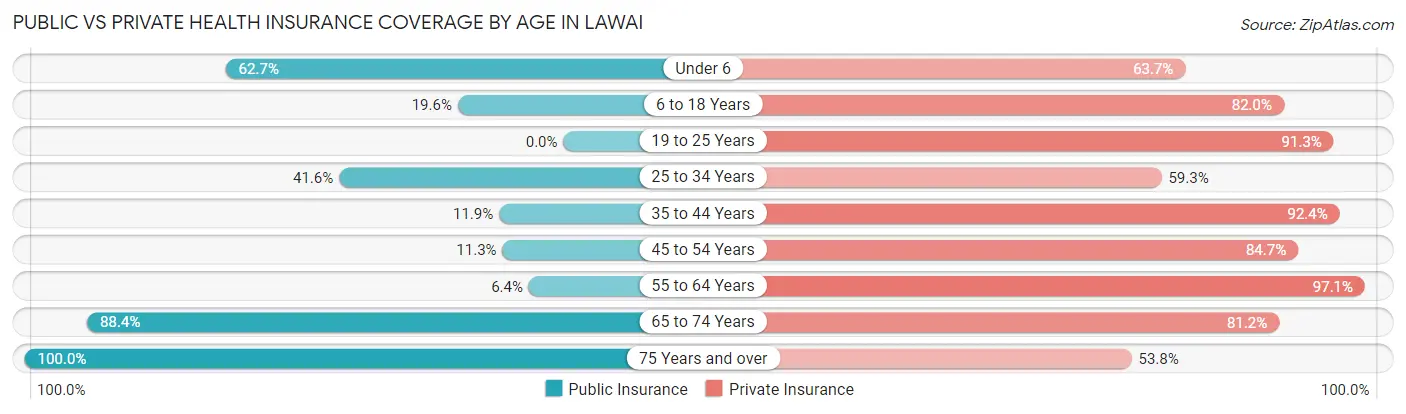
| Age Bracket | Public Insurance | Private Insurance |
| Under 6 | 121 (62.7%) | 123 (63.7%) |
| 6 to 18 Years | 108 (19.6%) | 452 (82.0%) |
| 19 to 25 Years | 0 (0.0%) | 220 (91.3%) |
| 25 to 34 Years | 127 (41.6%) | 181 (59.3%) |
| 35 to 44 Years | 47 (11.9%) | 364 (92.4%) |
| 45 to 54 Years | 31 (11.3%) | 232 (84.7%) |
| 55 to 64 Years | 22 (6.4%) | 333 (97.1%) |
| 65 to 74 Years | 305 (88.4%) | 280 (81.2%) |
| 75 Years and over | 225 (100.0%) | 121 (53.8%) |
| Total | 986 (34.3%) | 2,306 (80.3%) |
Disability Status by Sex by Age in Lawai
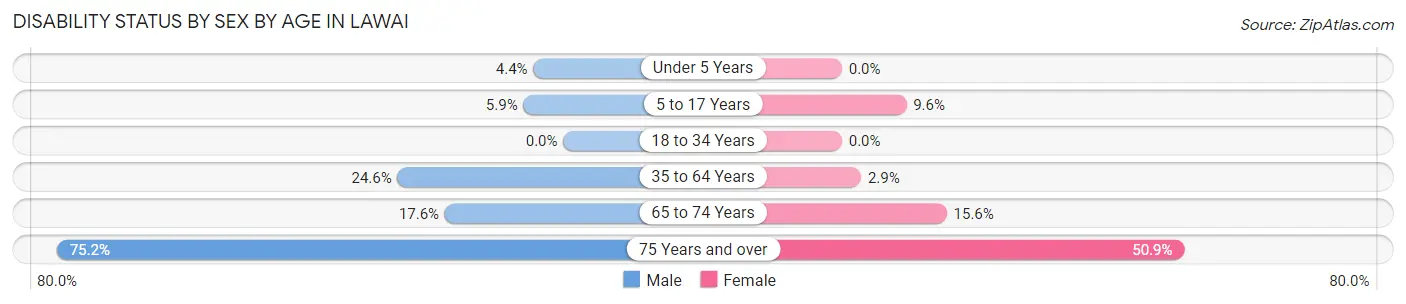
| Age Bracket | Male | Female |
| Under 5 Years | 2 (4.4%) | 0 (0.0%) |
| 5 to 17 Years | 19 (5.9%) | 18 (9.6%) |
| 18 to 34 Years | 0 (0.0%) | 0 (0.0%) |
| 35 to 64 Years | 128 (24.6%) | 14 (2.9%) |
| 65 to 74 Years | 29 (17.6%) | 28 (15.6%) |
| 75 Years and over | 82 (75.2%) | 59 (50.9%) |
Disability Class by Sex by Age in Lawai
Disability Class: Hearing Difficulty
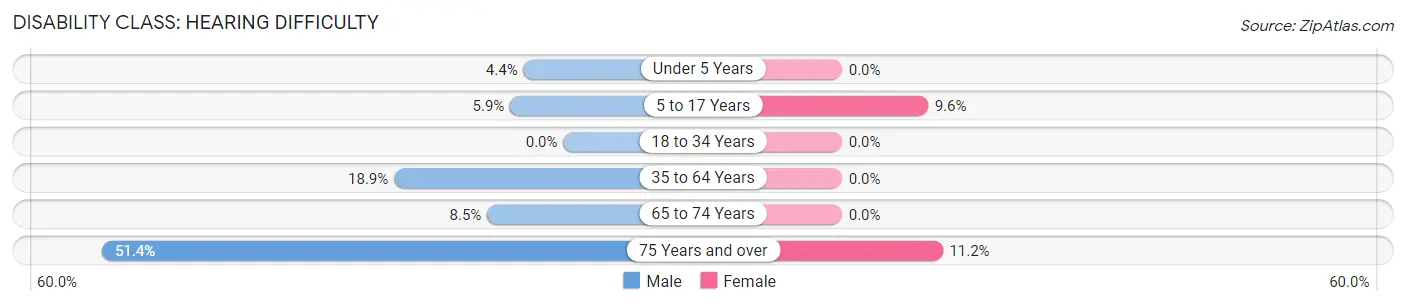
| Age Bracket | Male | Female |
| Under 5 Years | 2 (4.4%) | 0 (0.0%) |
| 5 to 17 Years | 19 (5.9%) | 18 (9.6%) |
| 18 to 34 Years | 0 (0.0%) | 0 (0.0%) |
| 35 to 64 Years | 98 (18.9%) | 0 (0.0%) |
| 65 to 74 Years | 14 (8.5%) | 0 (0.0%) |
| 75 Years and over | 56 (51.4%) | 13 (11.2%) |
Disability Class: Vision Difficulty
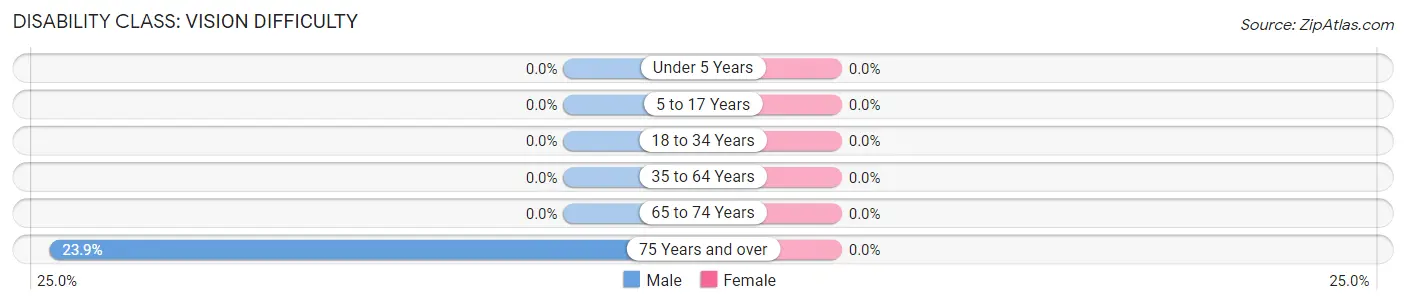
| Age Bracket | Male | Female |
| Under 5 Years | 0 (0.0%) | 0 (0.0%) |
| 5 to 17 Years | 0 (0.0%) | 0 (0.0%) |
| 18 to 34 Years | 0 (0.0%) | 0 (0.0%) |
| 35 to 64 Years | 0 (0.0%) | 0 (0.0%) |
| 65 to 74 Years | 0 (0.0%) | 0 (0.0%) |
| 75 Years and over | 26 (23.8%) | 0 (0.0%) |
Disability Class: Cognitive Difficulty
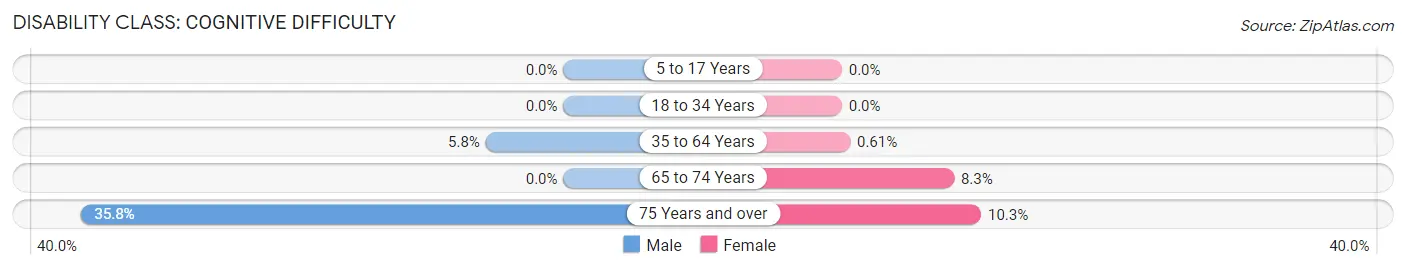
| Age Bracket | Male | Female |
| 5 to 17 Years | 0 (0.0%) | 0 (0.0%) |
| 18 to 34 Years | 0 (0.0%) | 0 (0.0%) |
| 35 to 64 Years | 30 (5.8%) | 3 (0.6%) |
| 65 to 74 Years | 0 (0.0%) | 15 (8.3%) |
| 75 Years and over | 39 (35.8%) | 12 (10.3%) |
Disability Class: Ambulatory Difficulty
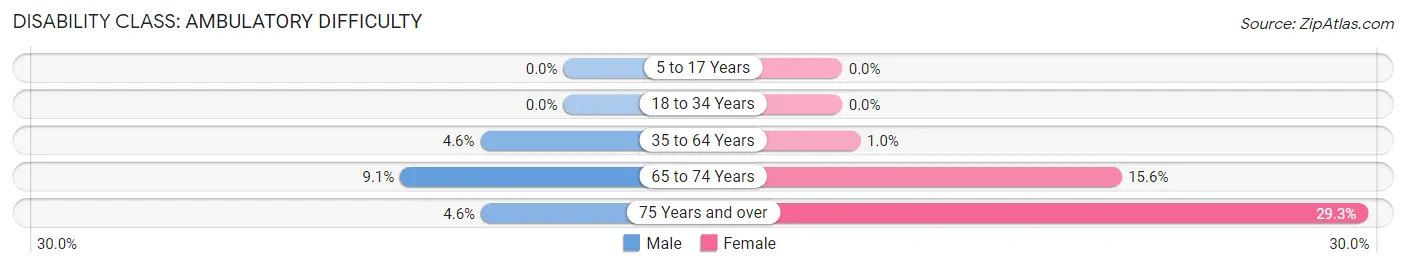
| Age Bracket | Male | Female |
| 5 to 17 Years | 0 (0.0%) | 0 (0.0%) |
| 18 to 34 Years | 0 (0.0%) | 0 (0.0%) |
| 35 to 64 Years | 24 (4.6%) | 5 (1.0%) |
| 65 to 74 Years | 15 (9.1%) | 28 (15.6%) |
| 75 Years and over | 5 (4.6%) | 34 (29.3%) |
Disability Class: Self-Care Difficulty
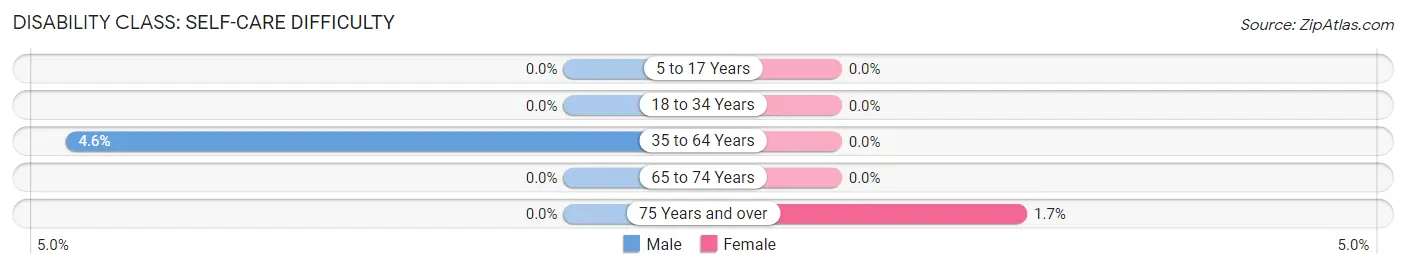
| Age Bracket | Male | Female |
| 5 to 17 Years | 0 (0.0%) | 0 (0.0%) |
| 18 to 34 Years | 0 (0.0%) | 0 (0.0%) |
| 35 to 64 Years | 24 (4.6%) | 0 (0.0%) |
| 65 to 74 Years | 0 (0.0%) | 0 (0.0%) |
| 75 Years and over | 0 (0.0%) | 2 (1.7%) |
Technology Access in Lawai
Computing Device Access in Lawai
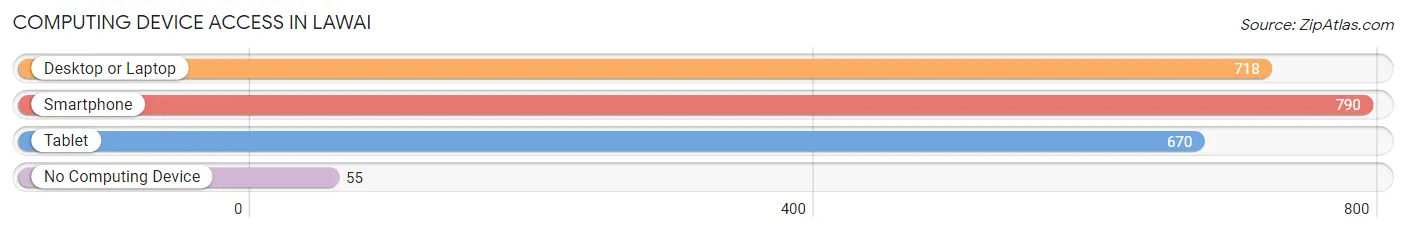
| Device Type | # Households | % Households |
| Desktop or Laptop | 718 | 80.0% |
| Smartphone | 790 | 88.0% |
| Tablet | 670 | 74.6% |
| No Computing Device | 55 | 6.1% |
| Total | 898 | 100.0% |
Internet Access in Lawai
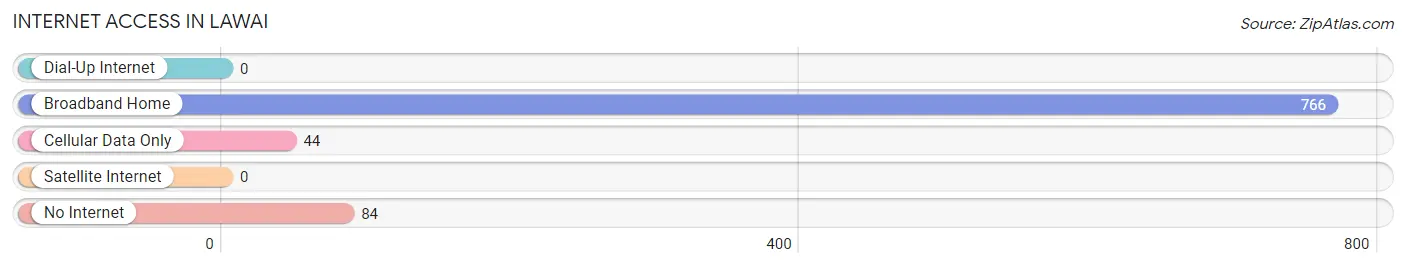
| Internet Type | # Households | % Households |
| Dial-Up Internet | 0 | 0.0% |
| Broadband Home | 766 | 85.3% |
| Cellular Data Only | 44 | 4.9% |
| Satellite Internet | 0 | 0.0% |
| No Internet | 84 | 9.3% |
| Total | 898 | 100.0% |
Lawai Summary
Lawai is a small unincorporated community located in the Hawaiian island of Kauai. It is situated on the south shore of the island, between the towns of Koloa and Poipu. The population of Lawai was 1,845 as of the 2010 census.
History
The area of Lawai has a long and rich history. It was first settled by Polynesian voyagers in the late 1700s. The first settlers were likely from the Marquesas Islands, and they brought with them their culture and traditions. The area was used for fishing and farming, and the settlers built a number of heiau (temples) in the area.
In the early 1800s, the area was taken over by the Kingdom of Hawaii. The Hawaiian monarchy established a number of plantations in the area, and the population of Lawai began to grow. The area was also used for sugarcane and pineapple production.
In the late 1800s, the area was taken over by the United States. The US government established a number of military bases in the area, and the population of Lawai continued to grow.
Geography
Lawai is located on the south shore of Kauai, between the towns of Koloa and Poipu. The area is characterized by its lush tropical vegetation and stunning beaches. The area is also home to a number of rivers and streams, as well as the Lawai Valley.
The climate in Lawai is tropical, with temperatures ranging from the mid-70s to the mid-80s throughout the year. The area receives an average of about 20 inches of rain per year.
Economy
The economy of Lawai is largely based on tourism. The area is home to a number of resorts and hotels, as well as a number of restaurants and shops. The area is also home to a number of agricultural operations, including sugarcane and pineapple production.
Demographics
As of the 2010 census, the population of Lawai was 1,845. The racial makeup of the area was 57.3% White, 0.7% African American, 0.3% Native American, 8.2% Asian, 0.2% Pacific Islander, and 33.5% from other races. The median household income in Lawai was $50,945, and the median family income was $58,945. The per capita income in Lawai was $25,945.
Conclusion
Lawai is a small unincorporated community located on the south shore of Kauai. It has a long and rich history, and is characterized by its lush tropical vegetation and stunning beaches. The economy of Lawai is largely based on tourism, and the area is home to a number of resorts and hotels. The population of Lawai was 1,845 as of the 2010 census, and the median household income was $50,945.
Common Questions
What is Per Capita Income in Lawai?
Per Capita income in Lawai is $34,742.
What is the Median Family Income in Lawai?
Median Family Income in Lawai is $110,375.
What is the Median Household income in Lawai?
Median Household Income in Lawai is $99,138.
What is Income or Wage Gap in Lawai?
Income or Wage Gap in Lawai is 25.3%.
Women in Lawai earn 74.7 cents for every dollar earned by a man.
What is Inequality or Gini Index in Lawai?
Inequality or Gini Index in Lawai is 0.36.
What is the Total Population of Lawai?
Total Population of Lawai is 2,902.
What is the Total Male Population of Lawai?
Total Male Population of Lawai is 1,554.
What is the Total Female Population of Lawai?
Total Female Population of Lawai is 1,348.
What is the Ratio of Males per 100 Females in Lawai?
There are 115.28 Males per 100 Females in Lawai.
What is the Ratio of Females per 100 Males in Lawai?
There are 86.74 Females per 100 Males in Lawai.
What is the Median Population Age in Lawai?
Median Population Age in Lawai is 40.1 Years.
What is the Average Family Size in Lawai
Average Family Size in Lawai is 3.4 People.
What is the Average Household Size in Lawai
Average Household Size in Lawai is 3.2 People.
How Large is the Labor Force in Lawai?
There are 1,309 People in the Labor Forcein in Lawai.
What is the Percentage of People in the Labor Force in Lawai?
57.9% of People are in the Labor Force in Lawai.
What is the Unemployment Rate in Lawai?
Unemployment Rate in Lawai is 12.2%.