Iowa Colony, TX Map & Demographics
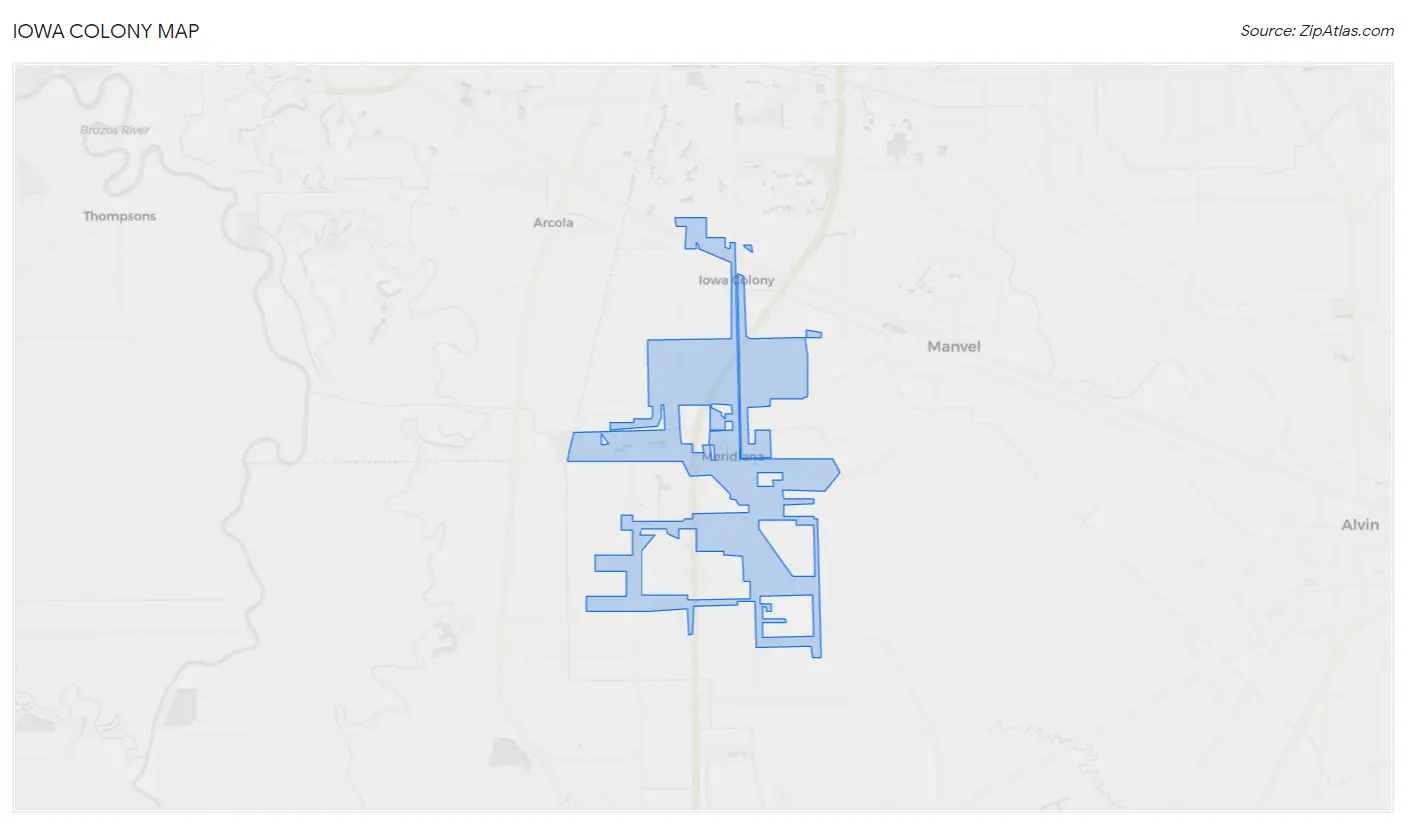
Iowa Colony Map
Iowa Colony Overview
$44,521
PER CAPITA INCOME
$110,125
AVG FAMILY INCOME
$110,000
AVG HOUSEHOLD INCOME
39.0%
WAGE / INCOME GAP [ % ]
61.0¢/ $1
WAGE / INCOME GAP [ $ ]
0.36
INEQUALITY / GINI INDEX
9,500
TOTAL POPULATION
4,879
MALE POPULATION
4,621
FEMALE POPULATION
105.58
MALES / 100 FEMALES
94.71
FEMALES / 100 MALES
33.1
MEDIAN AGE
3.6
AVG FAMILY SIZE
3.3
AVG HOUSEHOLD SIZE
4,992
LABOR FORCE [ PEOPLE ]
72.7%
PERCENT IN LABOR FORCE
7.6%
UNEMPLOYMENT RATE
Income in Iowa Colony
Income Overview in Iowa Colony
Per Capita Income in Iowa Colony is $44,521, while median incomes of families and households are $110,125 and $110,000 respectively.
| Characteristic | Number | Measure |
| Per Capita Income | 9,500 | $44,521 |
| Median Family Income | 2,448 | $110,125 |
| Mean Family Income | 2,448 | $148,579 |
| Median Household Income | 2,918 | $110,000 |
| Mean Household Income | 2,918 | $140,914 |
| Income Deficit | 2,448 | $0 |
| Wage / Income Gap (%) | 9,500 | 39.01% |
| Wage / Income Gap ($) | 9,500 | 60.99¢ per $1 |
| Gini / Inequality Index | 9,500 | 0.36 |
Earnings by Sex in Iowa Colony
Average Earnings in Iowa Colony are $64,733, $73,468 for men and $44,808 for women, a difference of 39.0%.
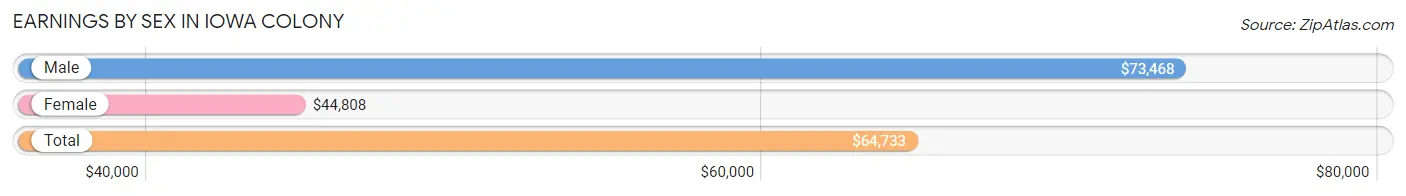
| Sex | Number | Average Earnings |
| Male | 2,517 (48.6%) | $73,468 |
| Female | 2,658 (51.4%) | $44,808 |
| Total | 5,175 (100.0%) | $64,733 |
Earnings by Sex by Income Bracket in Iowa Colony
The most common earnings brackets in Iowa Colony are $100,000+ for men (833 | 33.1%) and $100,000+ for women (527 | 19.8%).
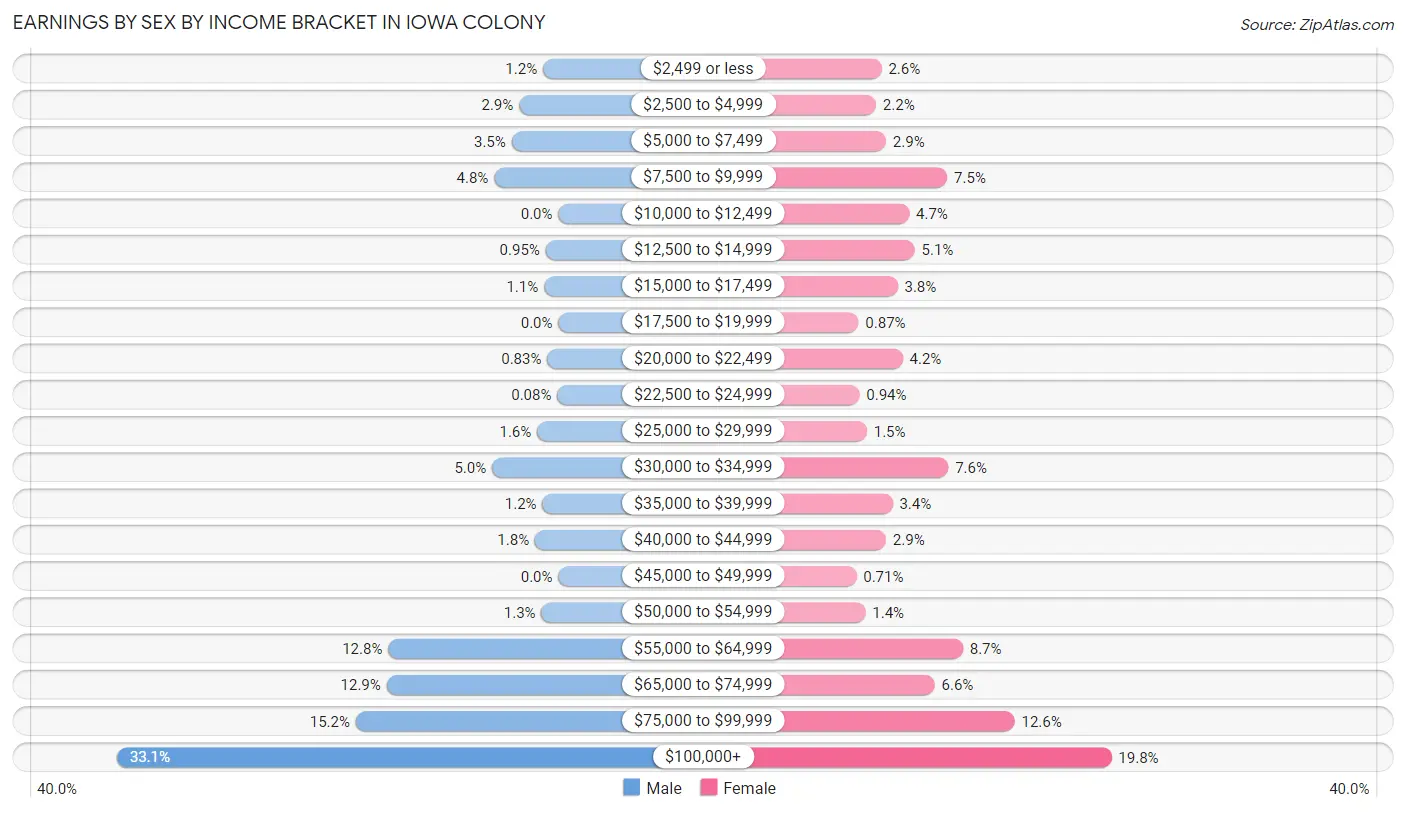
| Income | Male | Female |
| $2,499 or less | 29 (1.1%) | 69 (2.6%) |
| $2,500 to $4,999 | 74 (2.9%) | 58 (2.2%) |
| $5,000 to $7,499 | 88 (3.5%) | 78 (2.9%) |
| $7,500 to $9,999 | 121 (4.8%) | 200 (7.5%) |
| $10,000 to $12,499 | 0 (0.0%) | 124 (4.7%) |
| $12,500 to $14,999 | 24 (0.9%) | 135 (5.1%) |
| $15,000 to $17,499 | 27 (1.1%) | 101 (3.8%) |
| $17,500 to $19,999 | 0 (0.0%) | 23 (0.9%) |
| $20,000 to $22,499 | 21 (0.8%) | 111 (4.2%) |
| $22,500 to $24,999 | 2 (0.1%) | 25 (0.9%) |
| $25,000 to $29,999 | 40 (1.6%) | 40 (1.5%) |
| $30,000 to $34,999 | 125 (5.0%) | 202 (7.6%) |
| $35,000 to $39,999 | 30 (1.2%) | 91 (3.4%) |
| $40,000 to $44,999 | 44 (1.8%) | 78 (2.9%) |
| $45,000 to $49,999 | 0 (0.0%) | 19 (0.7%) |
| $50,000 to $54,999 | 32 (1.3%) | 37 (1.4%) |
| $55,000 to $64,999 | 321 (12.8%) | 231 (8.7%) |
| $65,000 to $74,999 | 324 (12.9%) | 175 (6.6%) |
| $75,000 to $99,999 | 382 (15.2%) | 334 (12.6%) |
| $100,000+ | 833 (33.1%) | 527 (19.8%) |
| Total | 2,517 (100.0%) | 2,658 (100.0%) |
Earnings by Sex by Educational Attainment in Iowa Colony
Average earnings in Iowa Colony are $83,002 for men and $58,429 for women, a difference of 29.6%. Men with an educational attainment of graduate degree enjoy the highest average annual earnings of $113,785, while those with high school diploma education earn the least with $72,328. Women with an educational attainment of graduate degree earn the most with the average annual earnings of $143,478, while those with college or associate's degree education have the smallest earnings of $37,317.
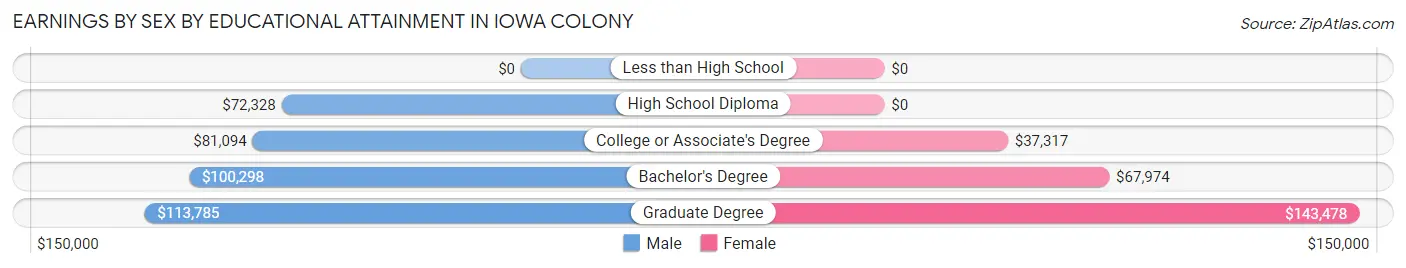
| Educational Attainment | Male Income | Female Income |
| Less than High School | - | - |
| High School Diploma | $72,328 | $0 |
| College or Associate's Degree | $81,094 | $37,317 |
| Bachelor's Degree | $100,298 | $67,974 |
| Graduate Degree | $113,785 | $143,478 |
| Total | $83,002 | $58,429 |
Family Income in Iowa Colony
Family Income Brackets in Iowa Colony
According to the Iowa Colony family income data, there are 627 families falling into the $200,000+ income range, which is the most common income bracket and makes up 25.6% of all families.
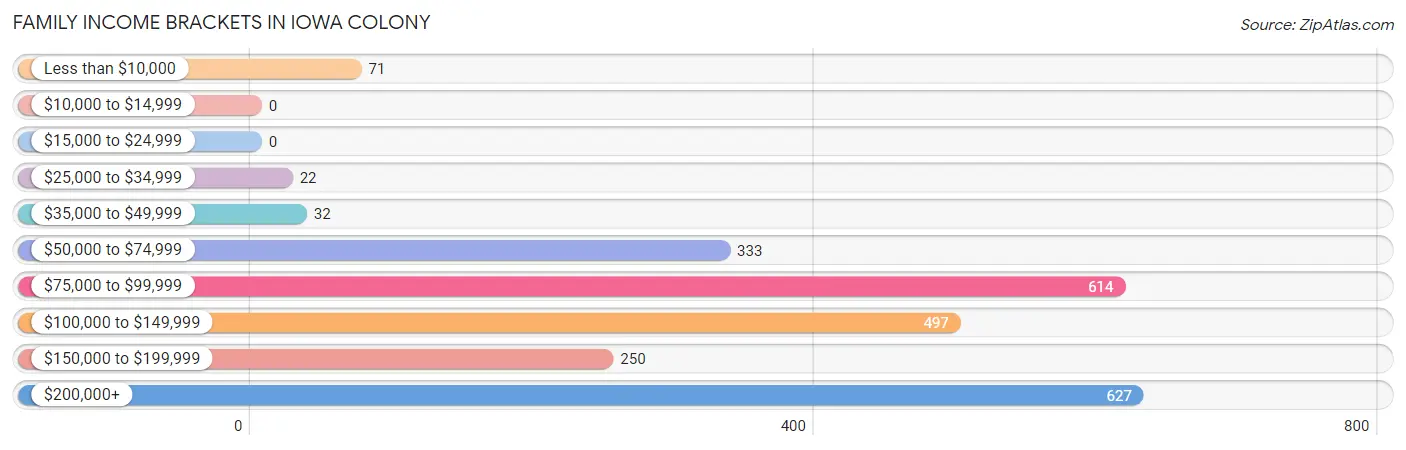
| Income Bracket | # Families | % Families |
| Less than $10,000 | 71 | 2.9% |
| $10,000 to $14,999 | 0 | 0.0% |
| $15,000 to $24,999 | 0 | 0.0% |
| $25,000 to $34,999 | 22 | 0.9% |
| $35,000 to $49,999 | 32 | 1.3% |
| $50,000 to $74,999 | 333 | 13.6% |
| $75,000 to $99,999 | 614 | 25.1% |
| $100,000 to $149,999 | 497 | 20.3% |
| $150,000 to $199,999 | 250 | 10.2% |
| $200,000+ | 627 | 25.6% |
Family Income by Famaliy Size in Iowa Colony
5-person families (337 | 13.8%) account for the highest median family income in Iowa Colony with $178,614 per family, while 2-person families (803 | 32.8%) have the highest median income of $58,038 per family member.
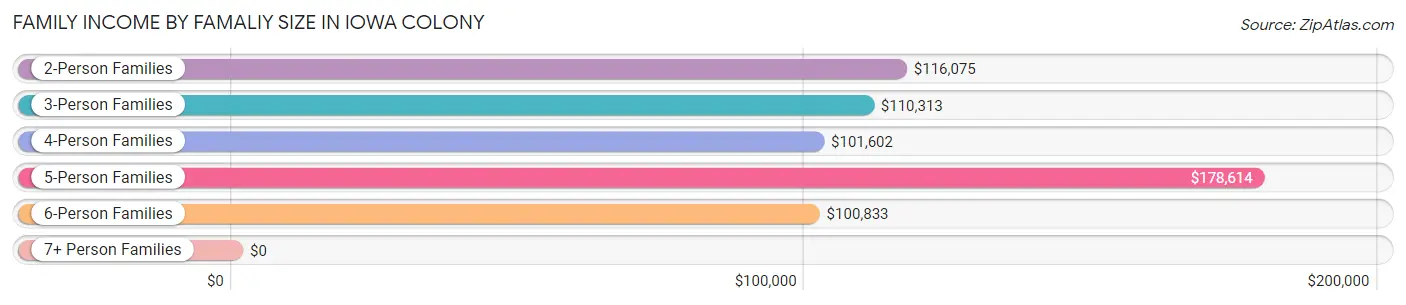
| Income Bracket | # Families | Median Income |
| 2-Person Families | 803 (32.8%) | $116,075 |
| 3-Person Families | 538 (22.0%) | $110,313 |
| 4-Person Families | 709 (29.0%) | $101,602 |
| 5-Person Families | 337 (13.8%) | $178,614 |
| 6-Person Families | 56 (2.3%) | $100,833 |
| 7+ Person Families | 5 (0.2%) | $0 |
| Total | 2,448 (100.0%) | $110,125 |
Family Income by Number of Earners in Iowa Colony
The median family income in Iowa Colony is $110,125, with families comprising 3+ earners (383) having the highest median family income of $173,839, while families with no earners (64) have the lowest median family income of $2,499, accounting for 15.7% and 2.6% of families, respectively.
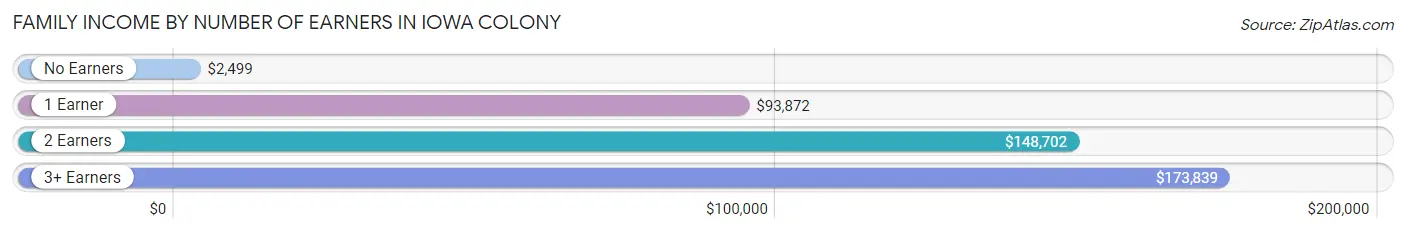
| Number of Earners | # Families | Median Income |
| No Earners | 64 (2.6%) | $2,499 |
| 1 Earner | 908 (37.1%) | $93,872 |
| 2 Earners | 1,093 (44.7%) | $148,702 |
| 3+ Earners | 383 (15.7%) | $173,839 |
| Total | 2,448 (100.0%) | $110,125 |
Household Income in Iowa Colony
Household Income Brackets in Iowa Colony
With 706 households falling in the category, the $75,000 to $99,999 income range is the most frequent in Iowa Colony, accounting for 24.2% of all households. In contrast, only 9 households (0.3%) fall into the $15,000 to $24,999 income bracket, making it the least populous group.
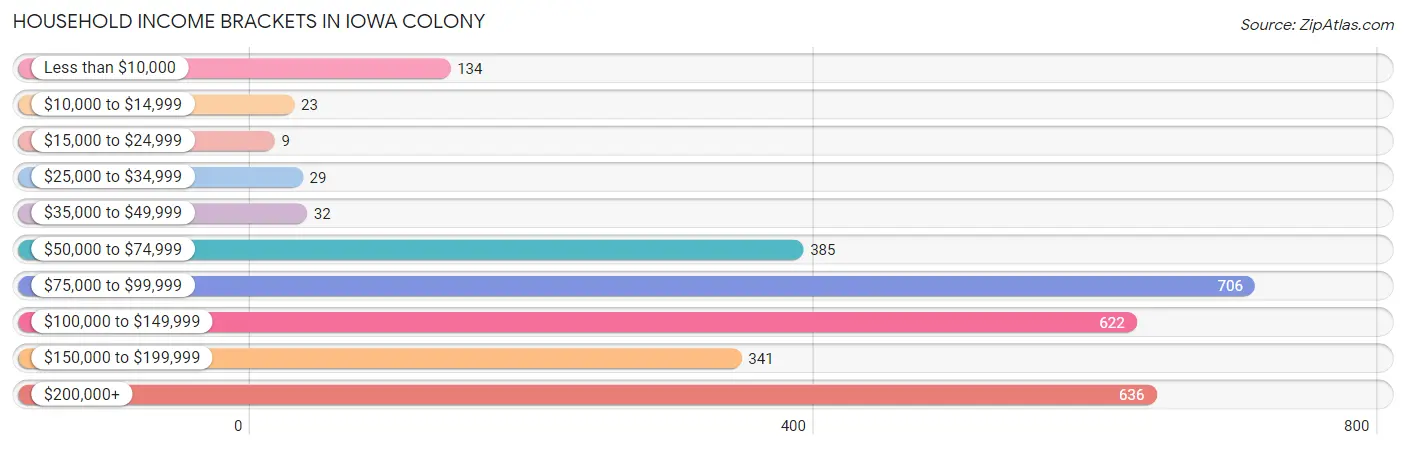
| Income Bracket | # Households | % Households |
| Less than $10,000 | 134 | 4.6% |
| $10,000 to $14,999 | 23 | 0.8% |
| $15,000 to $24,999 | 9 | 0.3% |
| $25,000 to $34,999 | 29 | 1.0% |
| $35,000 to $49,999 | 32 | 1.1% |
| $50,000 to $74,999 | 385 | 13.2% |
| $75,000 to $99,999 | 706 | 24.2% |
| $100,000 to $149,999 | 622 | 21.3% |
| $150,000 to $199,999 | 341 | 11.7% |
| $200,000+ | 636 | 21.8% |
Household Income by Householder Age in Iowa Colony
The median household income in Iowa Colony is $110,000, with the highest median household income of $138,102 found in the 45 to 64 years age bracket for the primary householder. A total of 1,047 households (35.9%) fall into this category. Meanwhile, the 15 to 24 years age bracket for the primary householder has the lowest median household income of $0, with 95 households (3.3%) in this group.
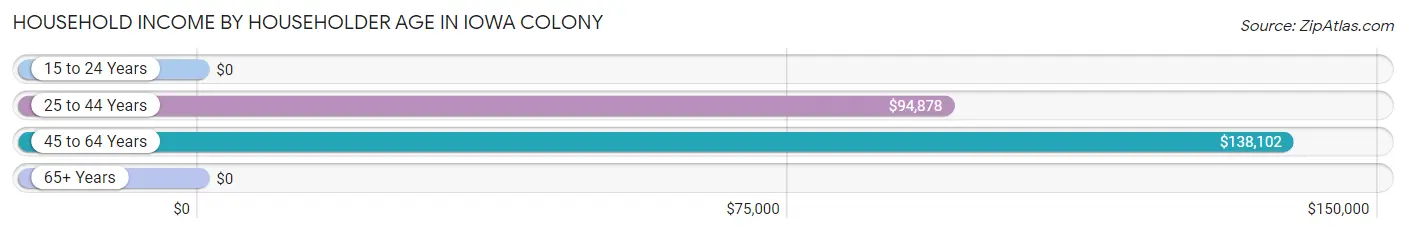
| Income Bracket | # Households | Median Income |
| 15 to 24 Years | 95 (3.3%) | $0 |
| 25 to 44 Years | 1,475 (50.5%) | $94,878 |
| 45 to 64 Years | 1,047 (35.9%) | $138,102 |
| 65+ Years | 301 (10.3%) | $0 |
| Total | 2,918 (100.0%) | $110,000 |
Poverty in Iowa Colony
Income Below Poverty by Sex and Age in Iowa Colony
With 4.2% poverty level for males and 3.4% for females among the residents of Iowa Colony, 75 year old and over males and 65 to 74 year old females are the most vulnerable to poverty, with 20 males (16.0%) and 67 females (31.6%) in their respective age groups living below the poverty level.
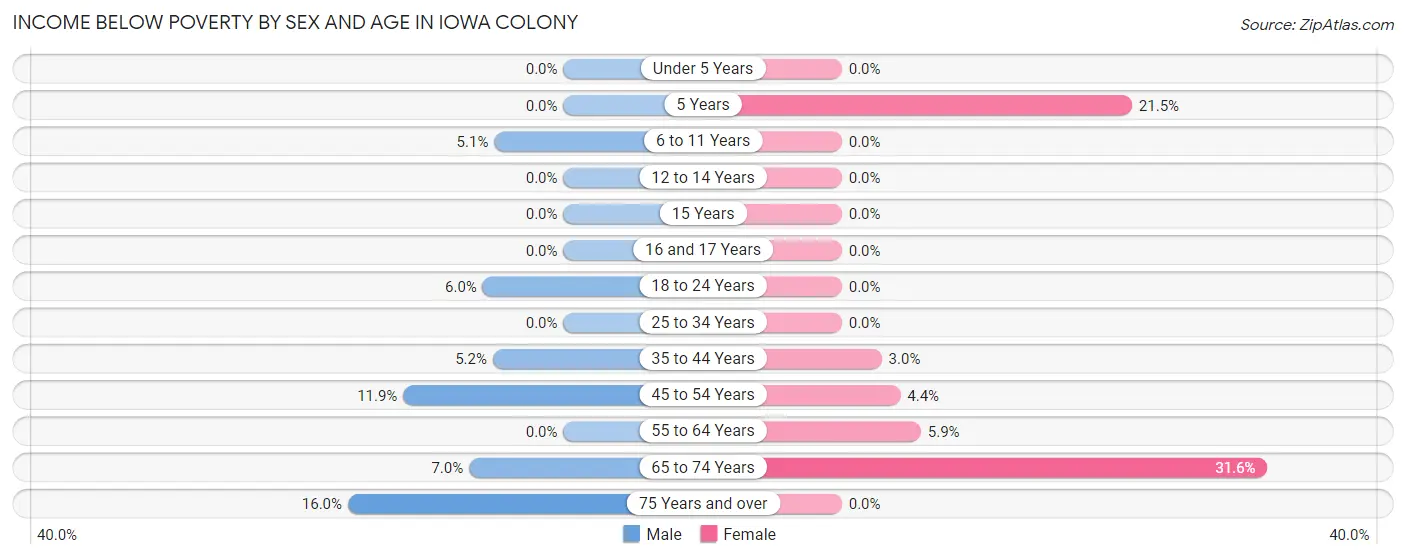
| Age Bracket | Male | Female |
| Under 5 Years | 0 (0.0%) | 0 (0.0%) |
| 5 Years | 0 (0.0%) | 14 (21.5%) |
| 6 to 11 Years | 22 (5.1%) | 0 (0.0%) |
| 12 to 14 Years | 0 (0.0%) | 0 (0.0%) |
| 15 Years | 0 (0.0%) | 0 (0.0%) |
| 16 and 17 Years | 0 (0.0%) | 0 (0.0%) |
| 18 to 24 Years | 27 (6.0%) | 0 (0.0%) |
| 25 to 34 Years | 0 (0.0%) | 0 (0.0%) |
| 35 to 44 Years | 31 (5.2%) | 30 (3.0%) |
| 45 to 54 Years | 81 (11.9%) | 26 (4.3%) |
| 55 to 64 Years | 0 (0.0%) | 20 (5.9%) |
| 65 to 74 Years | 21 (7.0%) | 67 (31.6%) |
| 75 Years and over | 20 (16.0%) | 0 (0.0%) |
| Total | 202 (4.2%) | 157 (3.4%) |
Income Above Poverty by Sex and Age in Iowa Colony
According to the poverty statistics in Iowa Colony, males aged under 5 years and females aged under 5 years are the age groups that are most secure financially, with 100.0% of males and 100.0% of females in these age groups living above the poverty line.
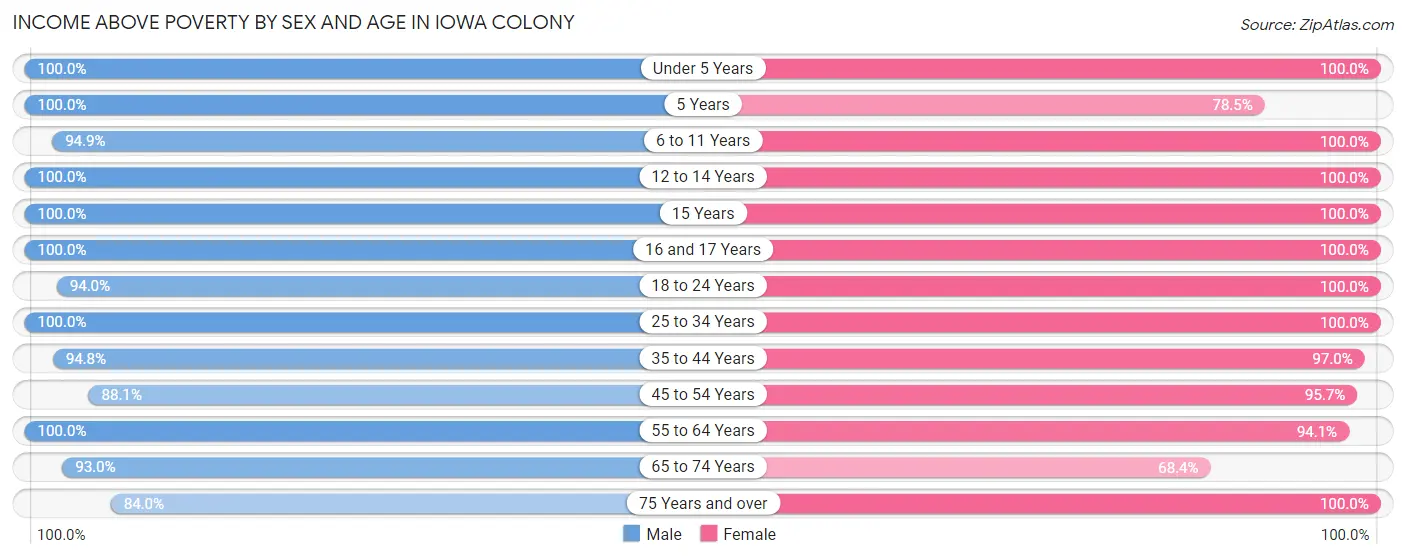
| Age Bracket | Male | Female |
| Under 5 Years | 369 (100.0%) | 198 (100.0%) |
| 5 Years | 141 (100.0%) | 51 (78.5%) |
| 6 to 11 Years | 407 (94.9%) | 474 (100.0%) |
| 12 to 14 Years | 441 (100.0%) | 394 (100.0%) |
| 15 Years | 46 (100.0%) | 60 (100.0%) |
| 16 and 17 Years | 238 (100.0%) | 83 (100.0%) |
| 18 to 24 Years | 424 (94.0%) | 618 (100.0%) |
| 25 to 34 Years | 688 (100.0%) | 513 (100.0%) |
| 35 to 44 Years | 561 (94.8%) | 982 (97.0%) |
| 45 to 54 Years | 600 (88.1%) | 572 (95.7%) |
| 55 to 64 Years | 362 (100.0%) | 321 (94.1%) |
| 65 to 74 Years | 279 (93.0%) | 145 (68.4%) |
| 75 Years and over | 105 (84.0%) | 53 (100.0%) |
| Total | 4,661 (95.9%) | 4,464 (96.6%) |
Income Below Poverty Among Married-Couple Families in Iowa Colony
The poverty statistics for married-couple families in Iowa Colony show that 3.1% or 52 of the total 1,658 families live below the poverty line. Families with 1 or 2 children have the highest poverty rate of 4.3%, comprising of 31 families. On the other hand, families with 3 or 4 children have the lowest poverty rate of 0.0%, which includes 0 families.
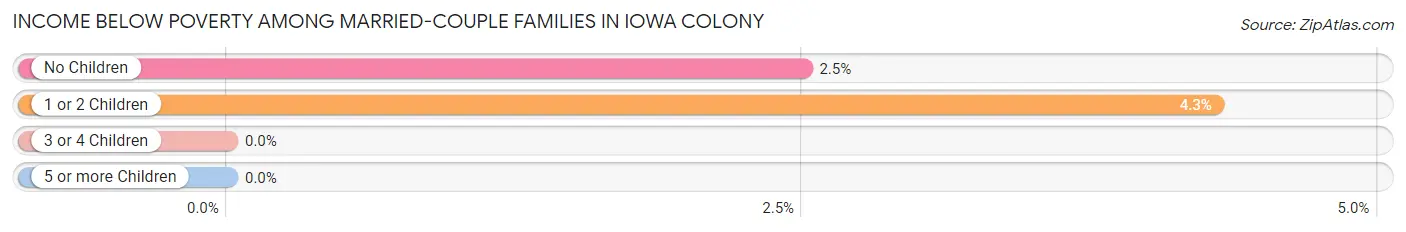
| Children | Above Poverty | Below Poverty |
| No Children | 820 (97.5%) | 21 (2.5%) |
| 1 or 2 Children | 692 (95.7%) | 31 (4.3%) |
| 3 or 4 Children | 94 (100.0%) | 0 (0.0%) |
| 5 or more Children | 0 (0.0%) | 0 (0.0%) |
| Total | 1,606 (96.9%) | 52 (3.1%) |
Income Below Poverty Among Single-Parent Households in Iowa Colony
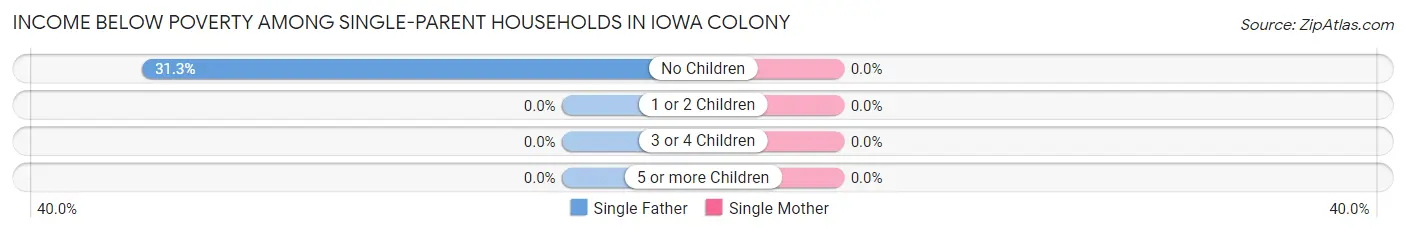
| Children | Single Father | Single Mother |
| No Children | 20 (31.2%) | 0 (0.0%) |
| 1 or 2 Children | 0 (0.0%) | 0 (0.0%) |
| 3 or 4 Children | 0 (0.0%) | 0 (0.0%) |
| 5 or more Children | 0 (0.0%) | 0 (0.0%) |
| Total | 20 (7.8%) | 0 (0.0%) |
Income Below Poverty Among Married-Couple vs Single-Parent Households in Iowa Colony
The poverty data for Iowa Colony shows that 52 of the married-couple family households (3.1%) and 20 of the single-parent households (2.5%) are living below the poverty level. Within the married-couple family households, those with 1 or 2 children have the highest poverty rate, with 31 households (4.3%) falling below the poverty line. Among the single-parent households, those with no children have the highest poverty rate, with 20 household (10.8%) living below poverty.
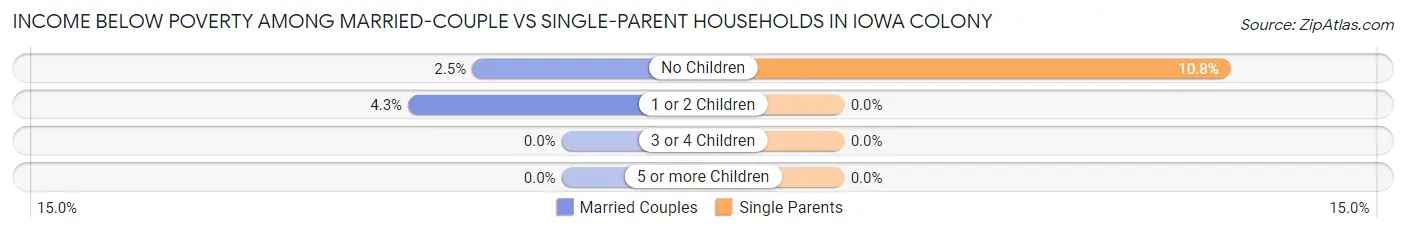
| Children | Married-Couple Families | Single-Parent Households |
| No Children | 21 (2.5%) | 20 (10.8%) |
| 1 or 2 Children | 31 (4.3%) | 0 (0.0%) |
| 3 or 4 Children | 0 (0.0%) | 0 (0.0%) |
| 5 or more Children | 0 (0.0%) | 0 (0.0%) |
| Total | 52 (3.1%) | 20 (2.5%) |
Race in Iowa Colony
The most populous races in Iowa Colony are Black / African American (3,738 | 39.4%), White / Caucasian (3,188 | 33.6%), and Hispanic or Latino (2,120 | 22.3%).
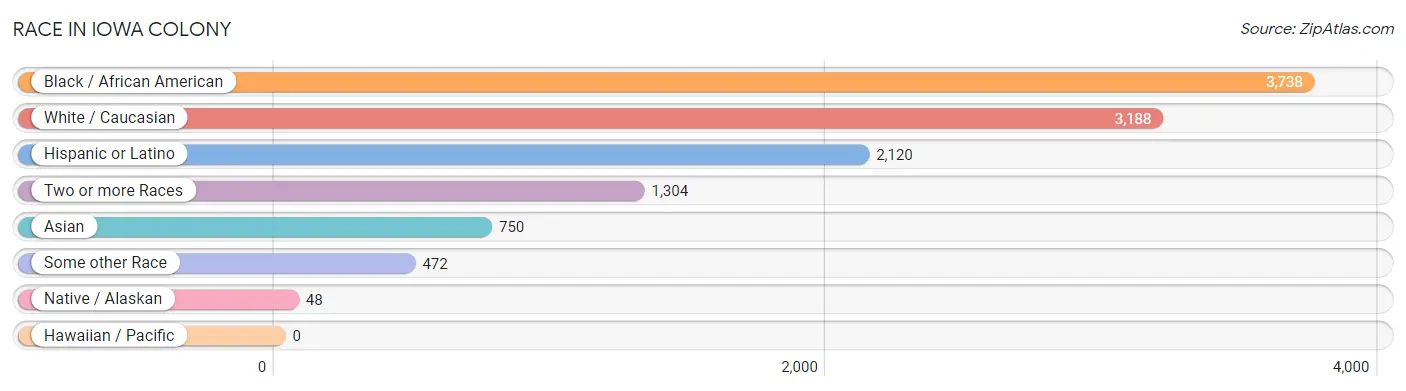
| Race | # Population | % Population |
| Asian | 750 | 7.9% |
| Black / African American | 3,738 | 39.4% |
| Hawaiian / Pacific | 0 | 0.0% |
| Hispanic or Latino | 2,120 | 22.3% |
| Native / Alaskan | 48 | 0.5% |
| White / Caucasian | 3,188 | 33.6% |
| Two or more Races | 1,304 | 13.7% |
| Some other Race | 472 | 5.0% |
| Total | 9,500 | 100.0% |
Ancestry in Iowa Colony
The most populous ancestries reported in Iowa Colony are Mexican (1,611 | 17.0%), German (759 | 8.0%), English (551 | 5.8%), Puerto Rican (345 | 3.6%), and Subsaharan African (282 | 3.0%), together accounting for 37.3% of all Iowa Colony residents.
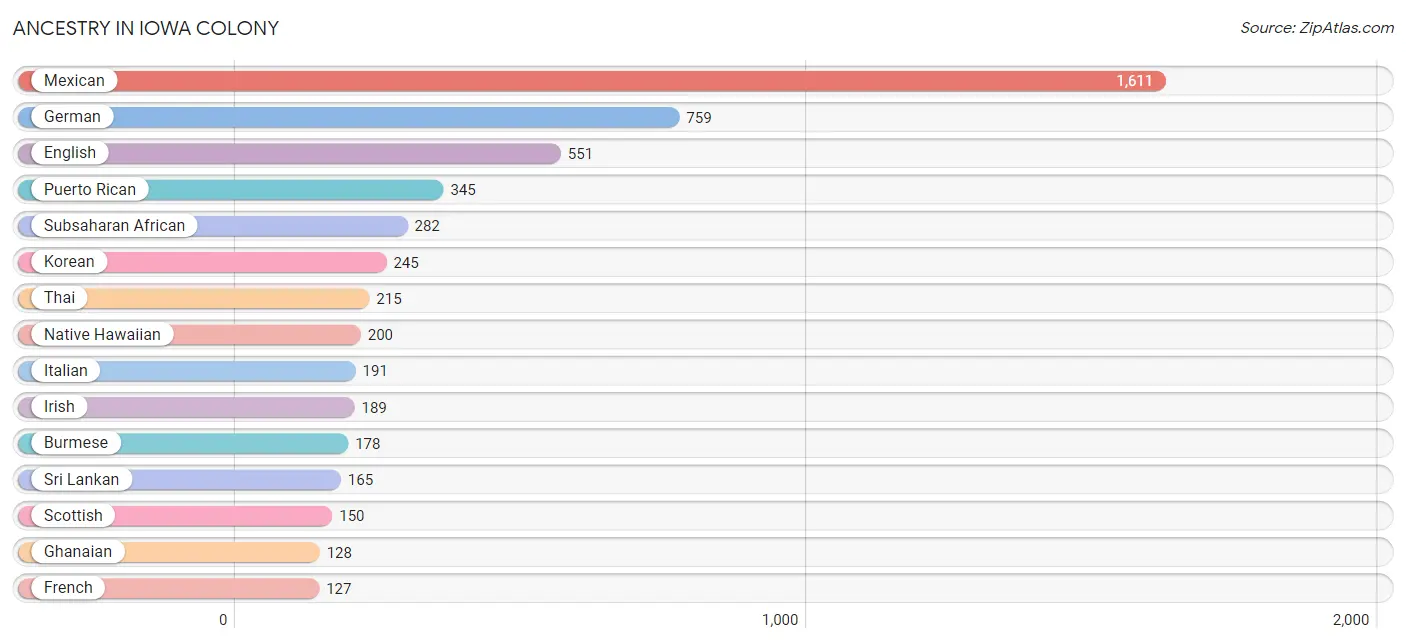
| Ancestry | # Population | % Population |
| African | 74 | 0.8% |
| American | 91 | 1.0% |
| Austrian | 10 | 0.1% |
| Bhutanese | 80 | 0.8% |
| Brazilian | 24 | 0.3% |
| British | 40 | 0.4% |
| Burmese | 178 | 1.9% |
| Cajun | 8 | 0.1% |
| Canadian | 47 | 0.5% |
| Central American | 33 | 0.4% |
| Cherokee | 65 | 0.7% |
| Cuban | 2 | 0.0% |
| Czech | 27 | 0.3% |
| Delaware | 11 | 0.1% |
| English | 551 | 5.8% |
| European | 8 | 0.1% |
| French | 127 | 1.3% |
| French Canadian | 56 | 0.6% |
| German | 759 | 8.0% |
| Ghanaian | 128 | 1.3% |
| Honduran | 22 | 0.2% |
| Hungarian | 29 | 0.3% |
| Icelander | 127 | 1.3% |
| Indian (Asian) | 7 | 0.1% |
| Irish | 189 | 2.0% |
| Italian | 191 | 2.0% |
| Jamaican | 17 | 0.2% |
| Japanese | 70 | 0.7% |
| Korean | 245 | 2.6% |
| Mexican | 1,611 | 17.0% |
| Native Hawaiian | 200 | 2.1% |
| Nicaraguan | 11 | 0.1% |
| Nigerian | 80 | 0.8% |
| Northern European | 37 | 0.4% |
| Peruvian | 39 | 0.4% |
| Polish | 49 | 0.5% |
| Portuguese | 12 | 0.1% |
| Puerto Rican | 345 | 3.6% |
| Scotch-Irish | 9 | 0.1% |
| Scottish | 150 | 1.6% |
| South American | 39 | 0.4% |
| Spanish | 90 | 0.9% |
| Sri Lankan | 165 | 1.7% |
| Subsaharan African | 282 | 3.0% |
| Swedish | 92 | 1.0% |
| Thai | 215 | 2.3% |
| Ukrainian | 16 | 0.2% | View All 47 Rows |
Immigrants in Iowa Colony
The most numerous immigrant groups reported in Iowa Colony came from Latin America (407 | 4.3%), Asia (390 | 4.1%), Central America (279 | 2.9%), Mexico (279 | 2.9%), and India (154 | 1.6%), together accounting for 15.9% of all Iowa Colony residents.
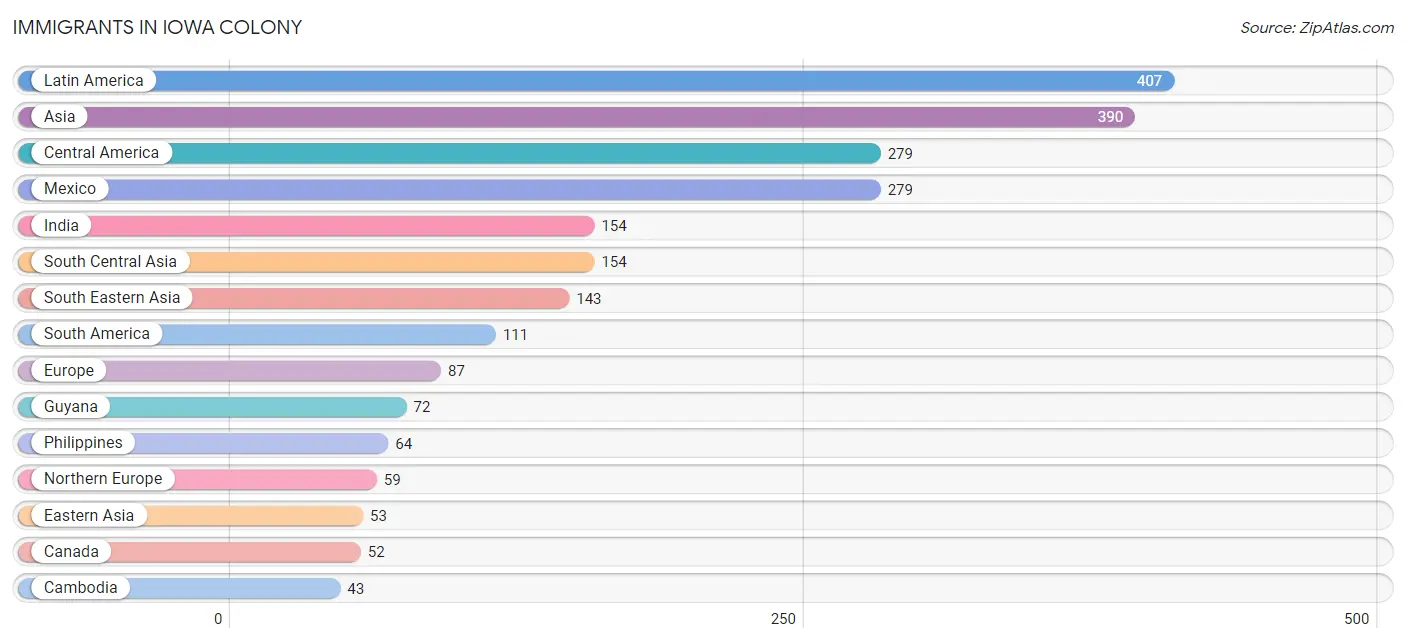
| Immigration Origin | # Population | % Population |
| Asia | 390 | 4.1% |
| Cambodia | 43 | 0.4% |
| Canada | 52 | 0.5% |
| Caribbean | 17 | 0.2% |
| Central America | 279 | 2.9% |
| Eastern Asia | 53 | 0.6% |
| Eastern Europe | 16 | 0.2% |
| England | 17 | 0.2% |
| Europe | 87 | 0.9% |
| Germany | 12 | 0.1% |
| Guyana | 72 | 0.8% |
| India | 154 | 1.6% |
| Jamaica | 17 | 0.2% |
| Japan | 12 | 0.1% |
| Korea | 41 | 0.4% |
| Latin America | 407 | 4.3% |
| Mexico | 279 | 2.9% |
| Northern Europe | 59 | 0.6% |
| Peru | 39 | 0.4% |
| Philippines | 64 | 0.7% |
| Scotland | 42 | 0.4% |
| South America | 111 | 1.2% |
| South Central Asia | 154 | 1.6% |
| South Eastern Asia | 143 | 1.5% |
| Ukraine | 16 | 0.2% |
| Vietnam | 36 | 0.4% |
| Western Asia | 40 | 0.4% |
| Western Europe | 12 | 0.1% | View All 28 Rows |
Sex and Age in Iowa Colony
Sex and Age in Iowa Colony
The most populous age groups in Iowa Colony are 10 to 14 Years (522 | 10.7%) for men and 10 to 14 Years (648 | 14.0%) for women.
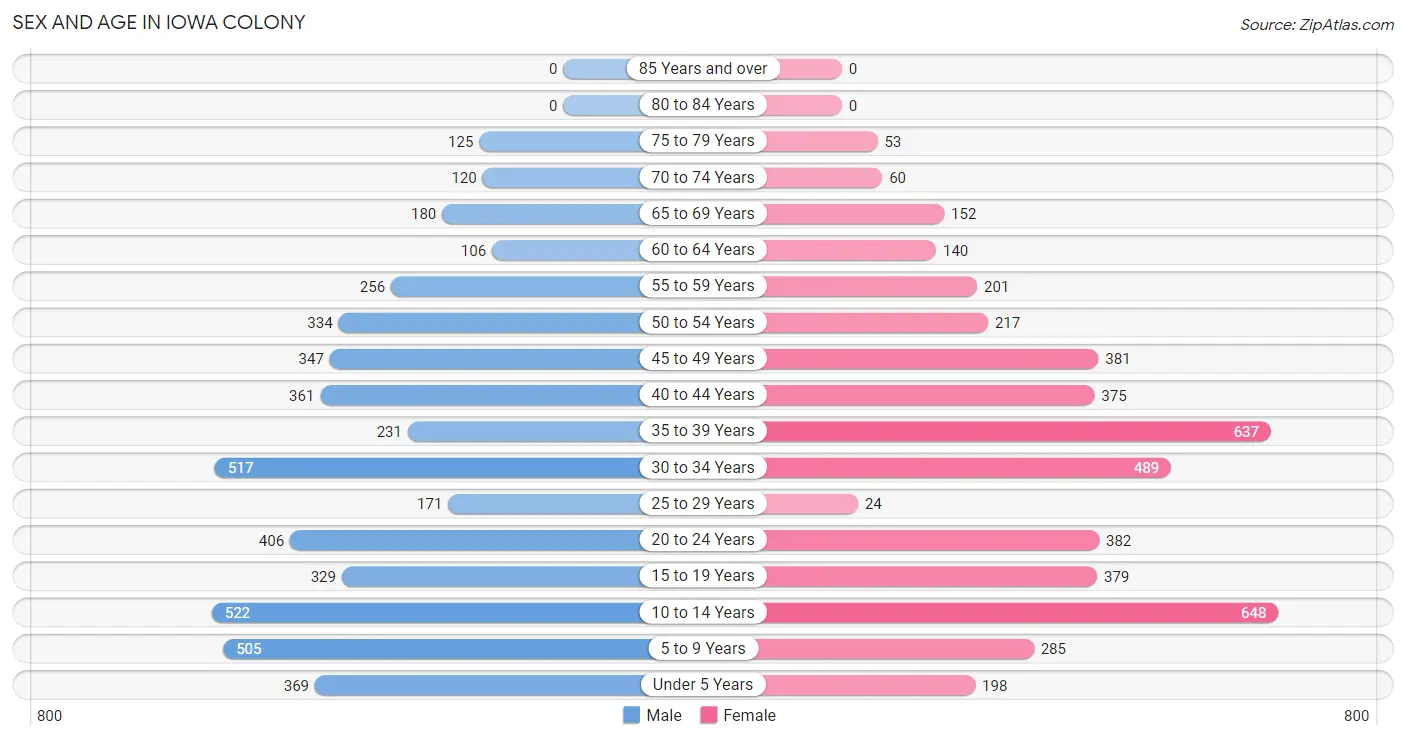
| Age Bracket | Male | Female |
| Under 5 Years | 369 (7.6%) | 198 (4.3%) |
| 5 to 9 Years | 505 (10.3%) | 285 (6.2%) |
| 10 to 14 Years | 522 (10.7%) | 648 (14.0%) |
| 15 to 19 Years | 329 (6.7%) | 379 (8.2%) |
| 20 to 24 Years | 406 (8.3%) | 382 (8.3%) |
| 25 to 29 Years | 171 (3.5%) | 24 (0.5%) |
| 30 to 34 Years | 517 (10.6%) | 489 (10.6%) |
| 35 to 39 Years | 231 (4.7%) | 637 (13.8%) |
| 40 to 44 Years | 361 (7.4%) | 375 (8.1%) |
| 45 to 49 Years | 347 (7.1%) | 381 (8.2%) |
| 50 to 54 Years | 334 (6.9%) | 217 (4.7%) |
| 55 to 59 Years | 256 (5.2%) | 201 (4.3%) |
| 60 to 64 Years | 106 (2.2%) | 140 (3.0%) |
| 65 to 69 Years | 180 (3.7%) | 152 (3.3%) |
| 70 to 74 Years | 120 (2.5%) | 60 (1.3%) |
| 75 to 79 Years | 125 (2.6%) | 53 (1.1%) |
| 80 to 84 Years | 0 (0.0%) | 0 (0.0%) |
| 85 Years and over | 0 (0.0%) | 0 (0.0%) |
| Total | 4,879 (100.0%) | 4,621 (100.0%) |
Families and Households in Iowa Colony
Median Family Size in Iowa Colony
The median family size in Iowa Colony is 3.58 persons per family, with single male/father families (255 | 10.4%) accounting for the largest median family size of 4.22 persons per family. On the other hand, married-couple families (1,658 | 67.7%) represent the smallest median family size with 3.48 persons per family.
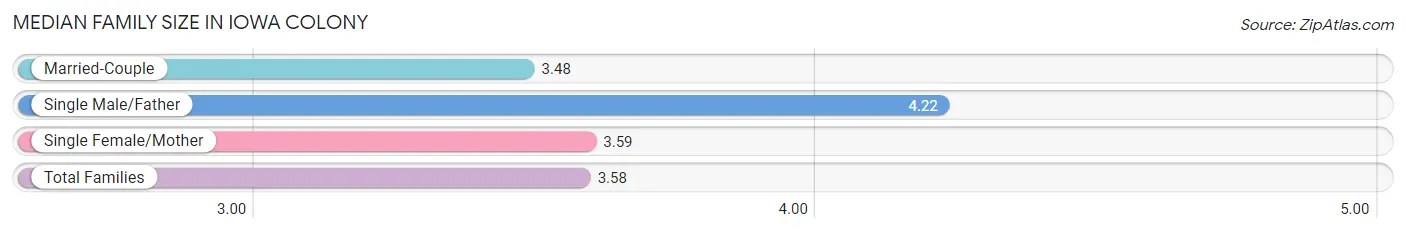
| Family Type | # Families | Family Size |
| Married-Couple | 1,658 (67.7%) | 3.48 |
| Single Male/Father | 255 (10.4%) | 4.22 |
| Single Female/Mother | 535 (21.8%) | 3.59 |
| Total Families | 2,448 (100.0%) | 3.58 |
Median Household Size in Iowa Colony
The median household size in Iowa Colony is 3.26 persons per household, with single male/father households (255 | 8.7%) accounting for the largest median household size of 4.22 persons per household. non-family households (470 | 16.1%) represent the smallest median household size with 1.30 persons per household.
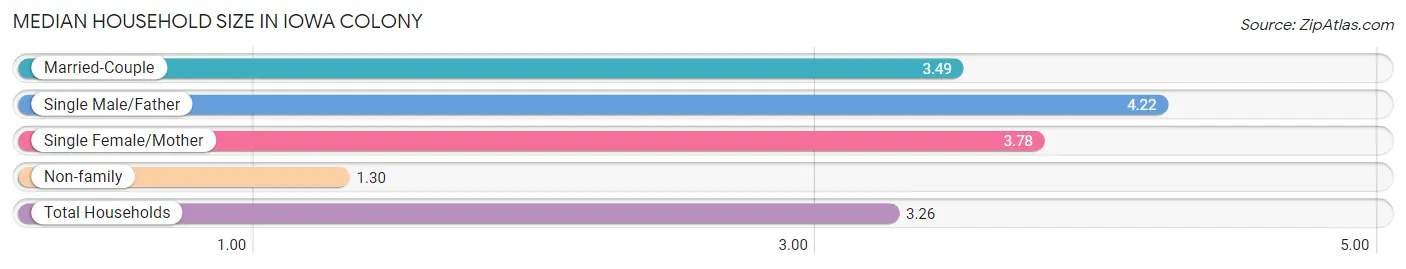
| Household Type | # Households | Household Size |
| Married-Couple | 1,658 (56.8%) | 3.49 |
| Single Male/Father | 255 (8.7%) | 4.22 |
| Single Female/Mother | 535 (18.3%) | 3.78 |
| Non-family | 470 (16.1%) | 1.30 |
| Total Households | 2,918 (100.0%) | 3.26 |
Household Size by Marriage Status in Iowa Colony
Out of a total of 2,918 households in Iowa Colony, 2,448 (83.9%) are family households, while 470 (16.1%) are nonfamily households. The most numerous type of family households are 2-person households, comprising 736, and the most common type of nonfamily households are 1-person households, comprising 333.
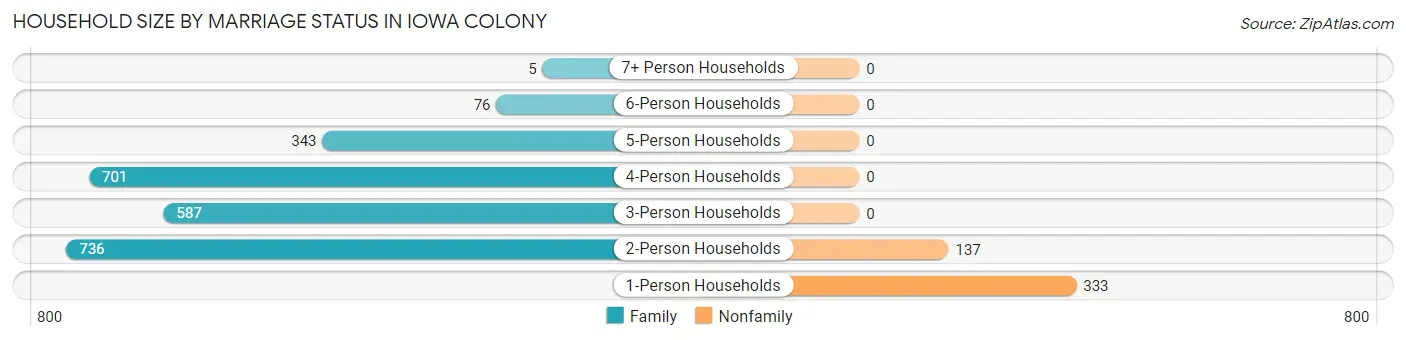
| Household Size | Family Households | Nonfamily Households |
| 1-Person Households | - | 333 (11.4%) |
| 2-Person Households | 736 (25.2%) | 137 (4.7%) |
| 3-Person Households | 587 (20.1%) | 0 (0.0%) |
| 4-Person Households | 701 (24.0%) | 0 (0.0%) |
| 5-Person Households | 343 (11.7%) | 0 (0.0%) |
| 6-Person Households | 76 (2.6%) | 0 (0.0%) |
| 7+ Person Households | 5 (0.2%) | 0 (0.0%) |
| Total | 2,448 (83.9%) | 470 (16.1%) |
Female Fertility in Iowa Colony
Fertility by Age in Iowa Colony
Average fertility rate in Iowa Colony is 32.0 births per 1,000 women. Women in the age bracket of 20 to 34 years have the highest fertility rate with 54.0 births per 1,000 women. Women in the age bracket of 20 to 34 years acount for 55.2% of all women with births.
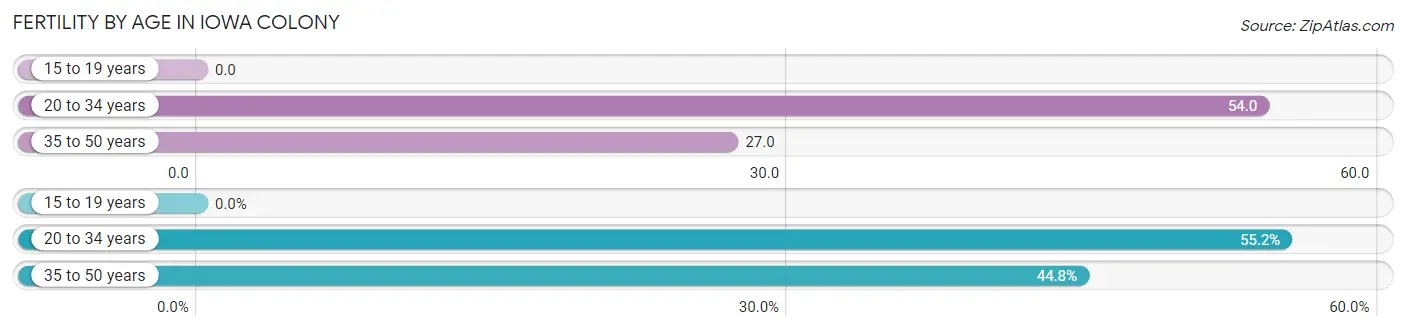
| Age Bracket | Women with Births | Births / 1,000 Women |
| 15 to 19 years | 0 (0.0%) | 0.0 |
| 20 to 34 years | 48 (55.2%) | 54.0 |
| 35 to 50 years | 39 (44.8%) | 27.0 |
| Total | 87 (100.0%) | 32.0 |
Fertility by Age by Marriage Status in Iowa Colony
72.4% of women with births (87) in Iowa Colony are married. The highest percentage of unmarried women with births falls into 20 to 34 years age bracket with 50.0% of them unmarried at the time of birth, while the lowest percentage of unmarried women with births belong to 35 to 50 years age bracket with 0.0% of them unmarried.
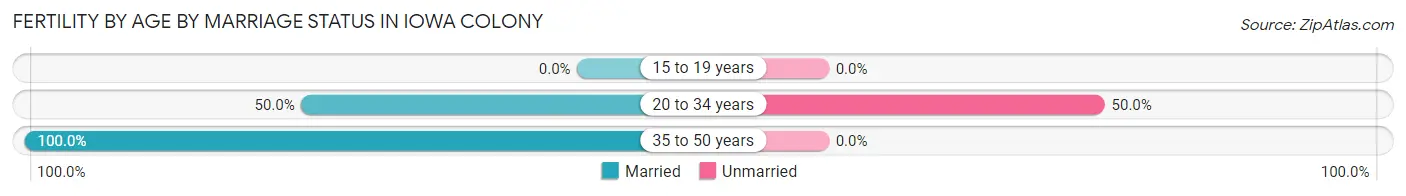
| Age Bracket | Married | Unmarried |
| 15 to 19 years | 0 (0.0%) | 0 (0.0%) |
| 20 to 34 years | 24 (50.0%) | 24 (50.0%) |
| 35 to 50 years | 39 (100.0%) | 0 (0.0%) |
| Total | 63 (72.4%) | 24 (27.6%) |
Fertility by Education in Iowa Colony
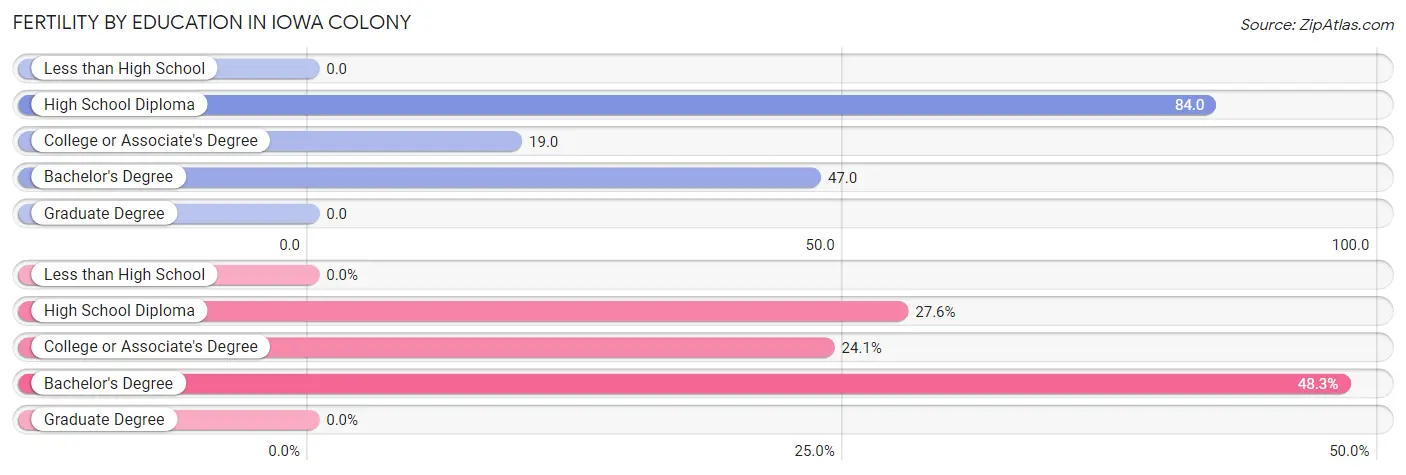
| Educational Attainment | Women with Births | Births / 1,000 Women |
| Less than High School | 0 (0.0%) | 0.0 |
| High School Diploma | 24 (27.6%) | 84.0 |
| College or Associate's Degree | 21 (24.1%) | 19.0 |
| Bachelor's Degree | 42 (48.3%) | 47.0 |
| Graduate Degree | 0 (0.0%) | 0.0 |
| Total | 87 (100.0%) | 32.0 |
Fertility by Education by Marriage Status in Iowa Colony
27.6% of women with births in Iowa Colony are unmarried. Women with the educational attainment of college or associate's degree are most likely to be married with 100.0% of them married at childbirth, while women with the educational attainment of high school diploma are least likely to be married with 100.0% of them unmarried at childbirth.
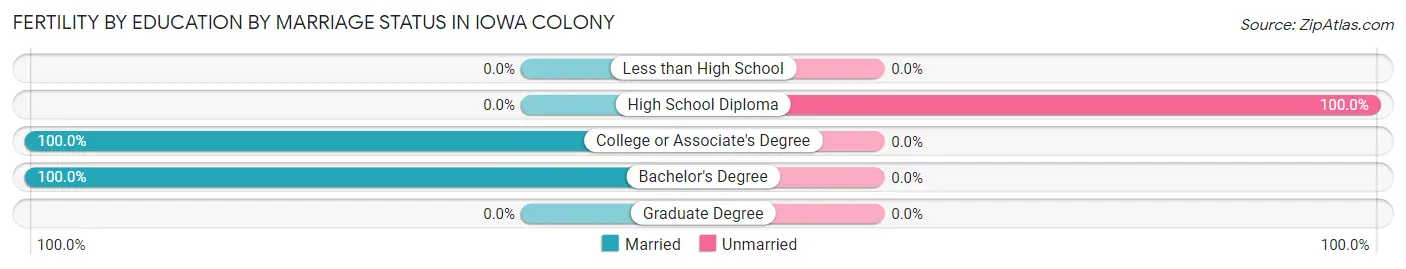
| Educational Attainment | Married | Unmarried |
| Less than High School | 0 (0.0%) | 0 (0.0%) |
| High School Diploma | 0 (0.0%) | 24 (100.0%) |
| College or Associate's Degree | 21 (100.0%) | 0 (0.0%) |
| Bachelor's Degree | 42 (100.0%) | 0 (0.0%) |
| Graduate Degree | 0 (0.0%) | 0 (0.0%) |
| Total | 63 (72.4%) | 24 (27.6%) |
Employment Characteristics in Iowa Colony
Employment by Class of Employer in Iowa Colony
Among the 4,389 employed individuals in Iowa Colony, private company employees (2,937 | 66.9%), local government employees (572 | 13.0%), and self-employed (incorporated) (225 | 5.1%) make up the most common classes of employment.
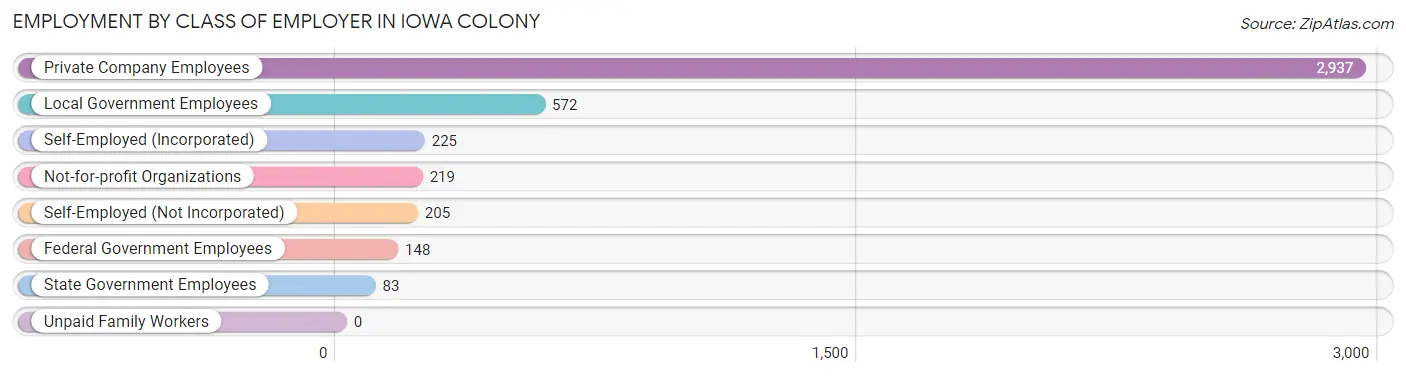
| Employer Class | # Employees | % Employees |
| Private Company Employees | 2,937 | 66.9% |
| Self-Employed (Incorporated) | 225 | 5.1% |
| Self-Employed (Not Incorporated) | 205 | 4.7% |
| Not-for-profit Organizations | 219 | 5.0% |
| Local Government Employees | 572 | 13.0% |
| State Government Employees | 83 | 1.9% |
| Federal Government Employees | 148 | 3.4% |
| Unpaid Family Workers | 0 | 0.0% |
| Total | 4,389 | 100.0% |
Employment Status by Age in Iowa Colony
According to the labor force statistics for Iowa Colony, out of the total population over 16 years of age (6,867), 72.7% or 4,992 individuals are in the labor force, with 7.6% or 379 of them unemployed. The age group with the highest labor force participation rate is 30 to 34 years, with 91.2% or 917 individuals in the labor force. Within the labor force, the 16 to 19 years age range has the highest percentage of unemployed individuals, with 84.8% or 117 of them being unemployed.
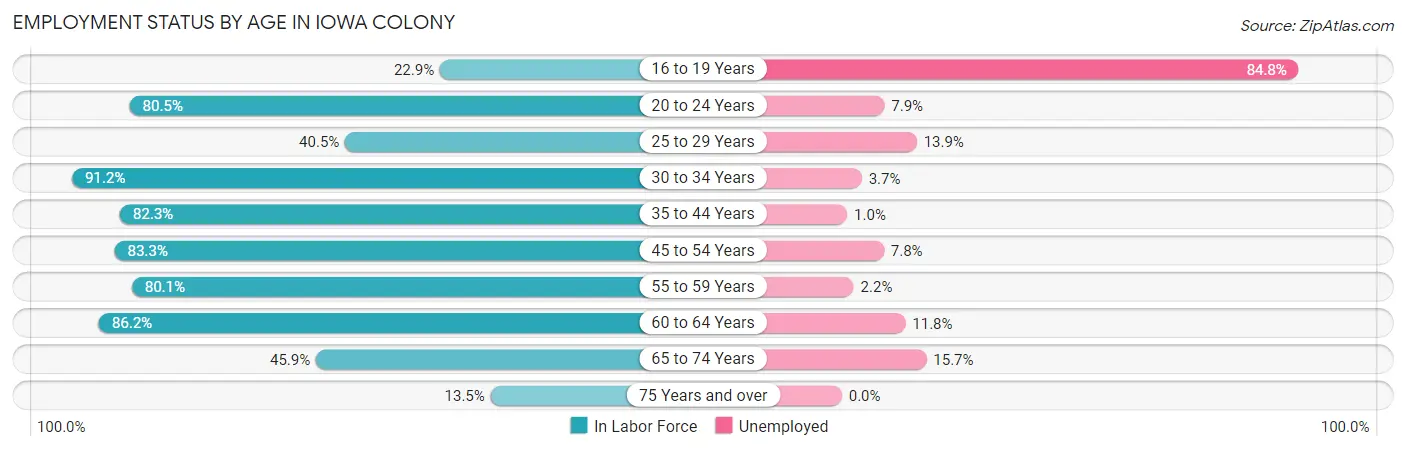
| Age Bracket | In Labor Force | Unemployed |
| 16 to 19 Years | 138 (22.9%) | 117 (84.8%) |
| 20 to 24 Years | 634 (80.5%) | 50 (7.9%) |
| 25 to 29 Years | 79 (40.5%) | 11 (13.9%) |
| 30 to 34 Years | 917 (91.2%) | 34 (3.7%) |
| 35 to 44 Years | 1,320 (82.3%) | 13 (1.0%) |
| 45 to 54 Years | 1,065 (83.3%) | 83 (7.8%) |
| 55 to 59 Years | 366 (80.1%) | 8 (2.2%) |
| 60 to 64 Years | 212 (86.2%) | 25 (11.8%) |
| 65 to 74 Years | 235 (45.9%) | 37 (15.7%) |
| 75 Years and over | 24 (13.5%) | 0 (0.0%) |
| Total | 4,992 (72.7%) | 379 (7.6%) |
Employment Status by Educational Attainment in Iowa Colony
According to labor force statistics for Iowa Colony, 82.7% of individuals (3,959) out of the total population between 25 and 64 years of age (4,787) are in the labor force, with 4.4% or 174 of them being unemployed. The group with the highest labor force participation rate are those with the educational attainment of bachelor's degree or higher, with 97.8% or 1,858 individuals in the labor force. Within the labor force, individuals with high school diploma education have the highest percentage of unemployment, with 6.8% or 45 of them being unemployed.
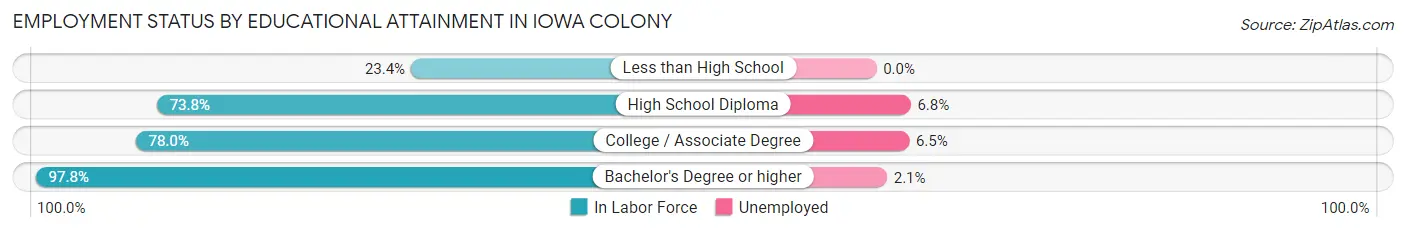
| Educational Attainment | In Labor Force | Unemployed |
| Less than High School | 49 (23.4%) | 0 (0.0%) |
| High School Diploma | 658 (73.8%) | 61 (6.8%) |
| College / Associate Degree | 1,394 (78.0%) | 116 (6.5%) |
| Bachelor's Degree or higher | 1,858 (97.8%) | 40 (2.1%) |
| Total | 3,959 (82.7%) | 211 (4.4%) |
Employment Occupations by Sex in Iowa Colony
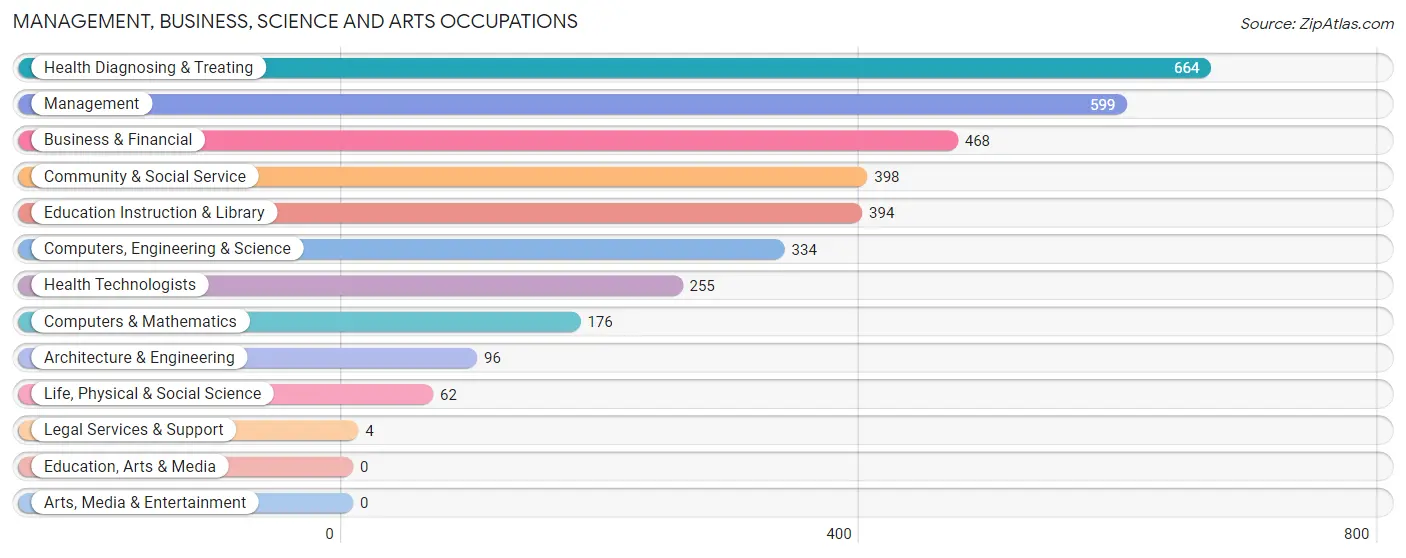
Management, Business, Science and Arts Occupations
The most common Management, Business, Science and Arts occupations in Iowa Colony are Health Diagnosing & Treating (664 | 14.5%), Management (599 | 13.1%), Business & Financial (468 | 10.2%), Community & Social Service (398 | 8.7%), and Education Instruction & Library (394 | 8.6%).
Management, Business, Science and Arts Occupations by Sex
Within the Management, Business, Science and Arts occupations in Iowa Colony, the most male-oriented occupations are Legal Services & Support (100.0%), Computers & Mathematics (81.8%), and Computers, Engineering & Science (71.9%), while the most female-oriented occupations are Health Diagnosing & Treating (84.5%), Health Technologists (84.3%), and Business & Financial (71.8%).
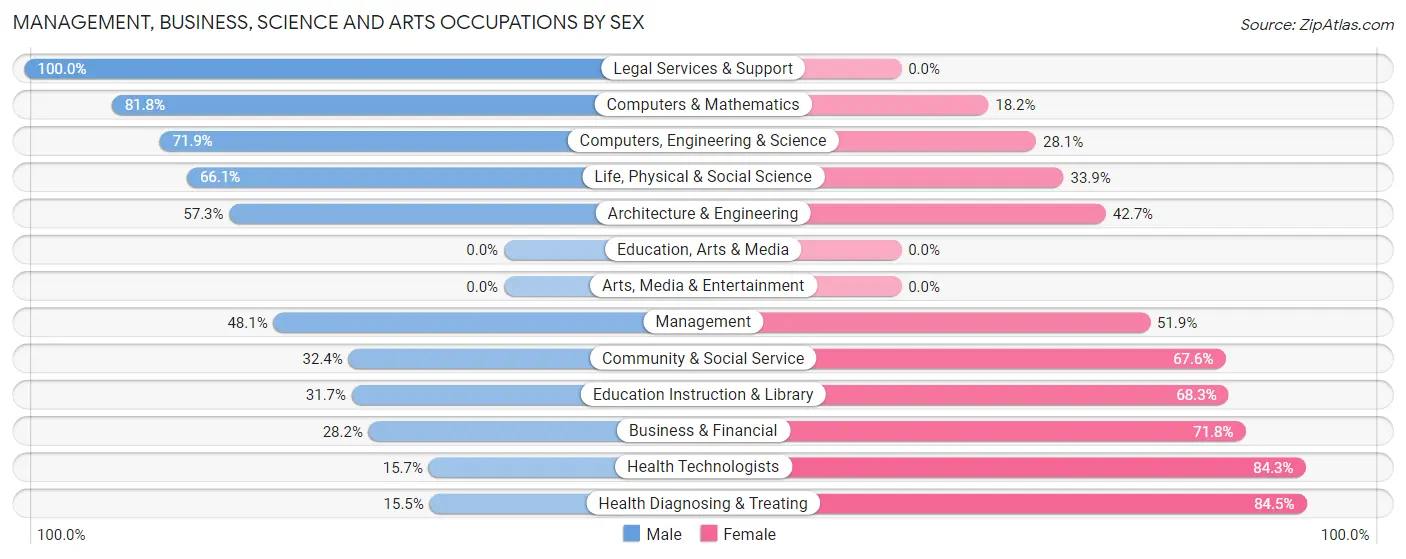
| Occupation | Male | Female |
| Management | 288 (48.1%) | 311 (51.9%) |
| Business & Financial | 132 (28.2%) | 336 (71.8%) |
| Computers, Engineering & Science | 240 (71.9%) | 94 (28.1%) |
| Computers & Mathematics | 144 (81.8%) | 32 (18.2%) |
| Architecture & Engineering | 55 (57.3%) | 41 (42.7%) |
| Life, Physical & Social Science | 41 (66.1%) | 21 (33.9%) |
| Community & Social Service | 129 (32.4%) | 269 (67.6%) |
| Education, Arts & Media | 0 (0.0%) | 0 (0.0%) |
| Legal Services & Support | 4 (100.0%) | 0 (0.0%) |
| Education Instruction & Library | 125 (31.7%) | 269 (68.3%) |
| Arts, Media & Entertainment | 0 (0.0%) | 0 (0.0%) |
| Health Diagnosing & Treating | 103 (15.5%) | 561 (84.5%) |
| Health Technologists | 40 (15.7%) | 215 (84.3%) |
| Total (Category) | 892 (36.2%) | 1,571 (63.8%) |
| Total (Overall) | 2,181 (47.5%) | 2,408 (52.5%) |
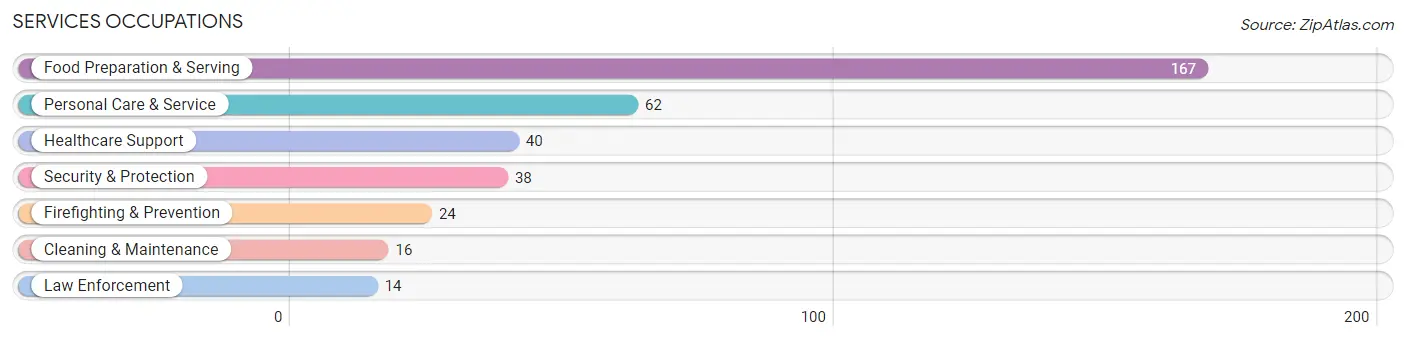
Services Occupations
The most common Services occupations in Iowa Colony are Food Preparation & Serving (167 | 3.6%), Personal Care & Service (62 | 1.3%), Healthcare Support (40 | 0.9%), Security & Protection (38 | 0.8%), and Firefighting & Prevention (24 | 0.5%).
Services Occupations by Sex
Within the Services occupations in Iowa Colony, the most male-oriented occupations are Security & Protection (100.0%), Firefighting & Prevention (100.0%), and Law Enforcement (100.0%), while the most female-oriented occupations are Food Preparation & Serving (93.4%), Healthcare Support (57.5%), and Personal Care & Service (53.2%).
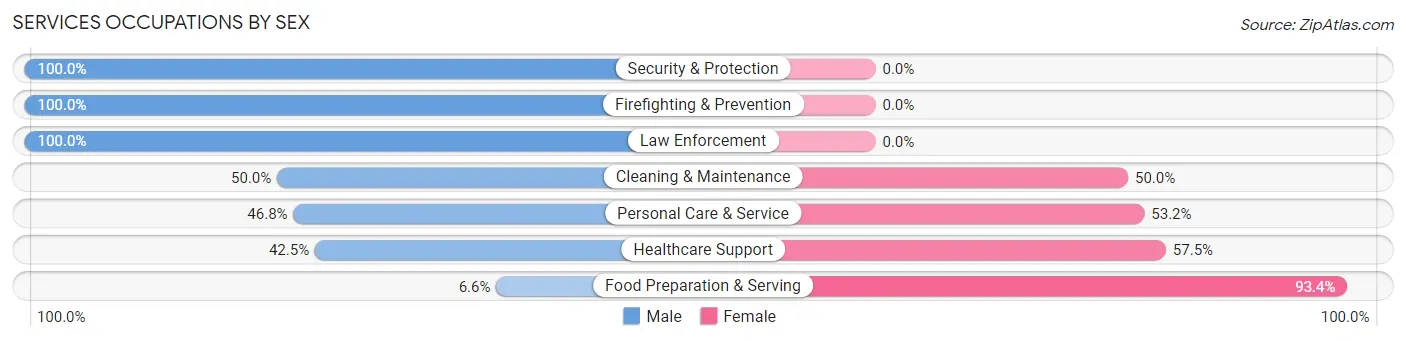
| Occupation | Male | Female |
| Healthcare Support | 17 (42.5%) | 23 (57.5%) |
| Security & Protection | 38 (100.0%) | 0 (0.0%) |
| Firefighting & Prevention | 24 (100.0%) | 0 (0.0%) |
| Law Enforcement | 14 (100.0%) | 0 (0.0%) |
| Food Preparation & Serving | 11 (6.6%) | 156 (93.4%) |
| Cleaning & Maintenance | 8 (50.0%) | 8 (50.0%) |
| Personal Care & Service | 29 (46.8%) | 33 (53.2%) |
| Total (Category) | 103 (31.9%) | 220 (68.1%) |
| Total (Overall) | 2,181 (47.5%) | 2,408 (52.5%) |
Sales and Office Occupations
The most common Sales and Office occupations in Iowa Colony are Sales & Related (639 | 13.9%), and Office & Administration (307 | 6.7%).

Sales and Office Occupations by Sex

| Occupation | Male | Female |
| Sales & Related | 296 (46.3%) | 343 (53.7%) |
| Office & Administration | 43 (14.0%) | 264 (86.0%) |
| Total (Category) | 339 (35.8%) | 607 (64.2%) |
| Total (Overall) | 2,181 (47.5%) | 2,408 (52.5%) |
Natural Resources, Construction and Maintenance Occupations
The most common Natural Resources, Construction and Maintenance occupations in Iowa Colony are Construction & Extraction (212 | 4.6%), and Installation, Maintenance & Repair (95 | 2.1%).

Natural Resources, Construction and Maintenance Occupations by Sex
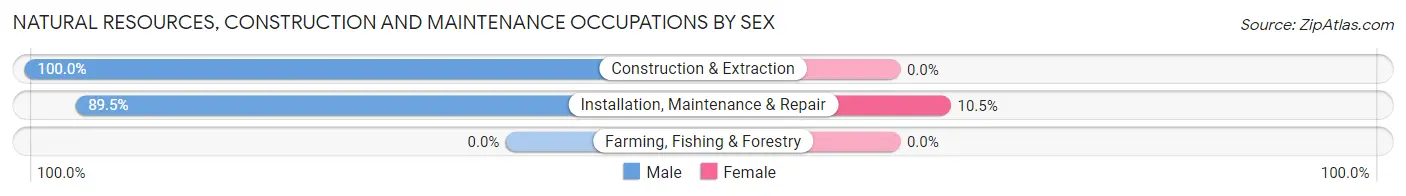
| Occupation | Male | Female |
| Farming, Fishing & Forestry | 0 (0.0%) | 0 (0.0%) |
| Construction & Extraction | 212 (100.0%) | 0 (0.0%) |
| Installation, Maintenance & Repair | 85 (89.5%) | 10 (10.5%) |
| Total (Category) | 297 (96.7%) | 10 (3.3%) |
| Total (Overall) | 2,181 (47.5%) | 2,408 (52.5%) |
Production, Transportation and Moving Occupations
The most common Production, Transportation and Moving occupations in Iowa Colony are Transportation (284 | 6.2%), Material Moving (160 | 3.5%), and Production (106 | 2.3%).
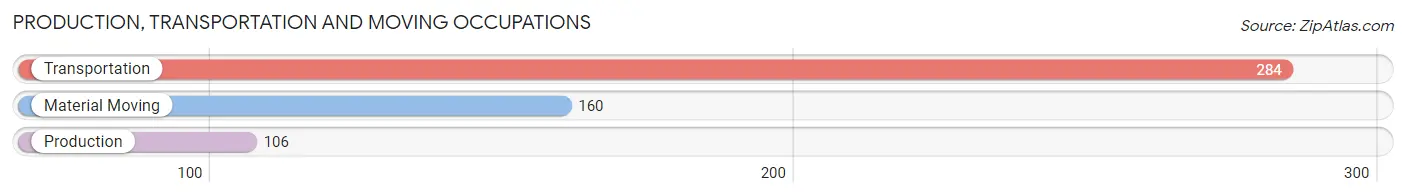
Production, Transportation and Moving Occupations by Sex
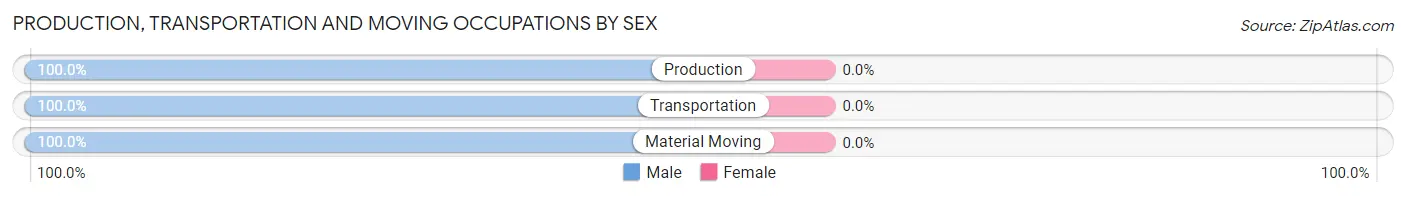
| Occupation | Male | Female |
| Production | 106 (100.0%) | 0 (0.0%) |
| Transportation | 284 (100.0%) | 0 (0.0%) |
| Material Moving | 160 (100.0%) | 0 (0.0%) |
| Total (Category) | 550 (100.0%) | 0 (0.0%) |
| Total (Overall) | 2,181 (47.5%) | 2,408 (52.5%) |
Employment Industries by Sex in Iowa Colony
Employment Industries in Iowa Colony
The major employment industries in Iowa Colony include Health Care & Social Assistance (704 | 15.3%), Finance & Insurance (551 | 12.0%), Educational Services (514 | 11.2%), Retail Trade (434 | 9.5%), and Transportation & Warehousing (417 | 9.1%).
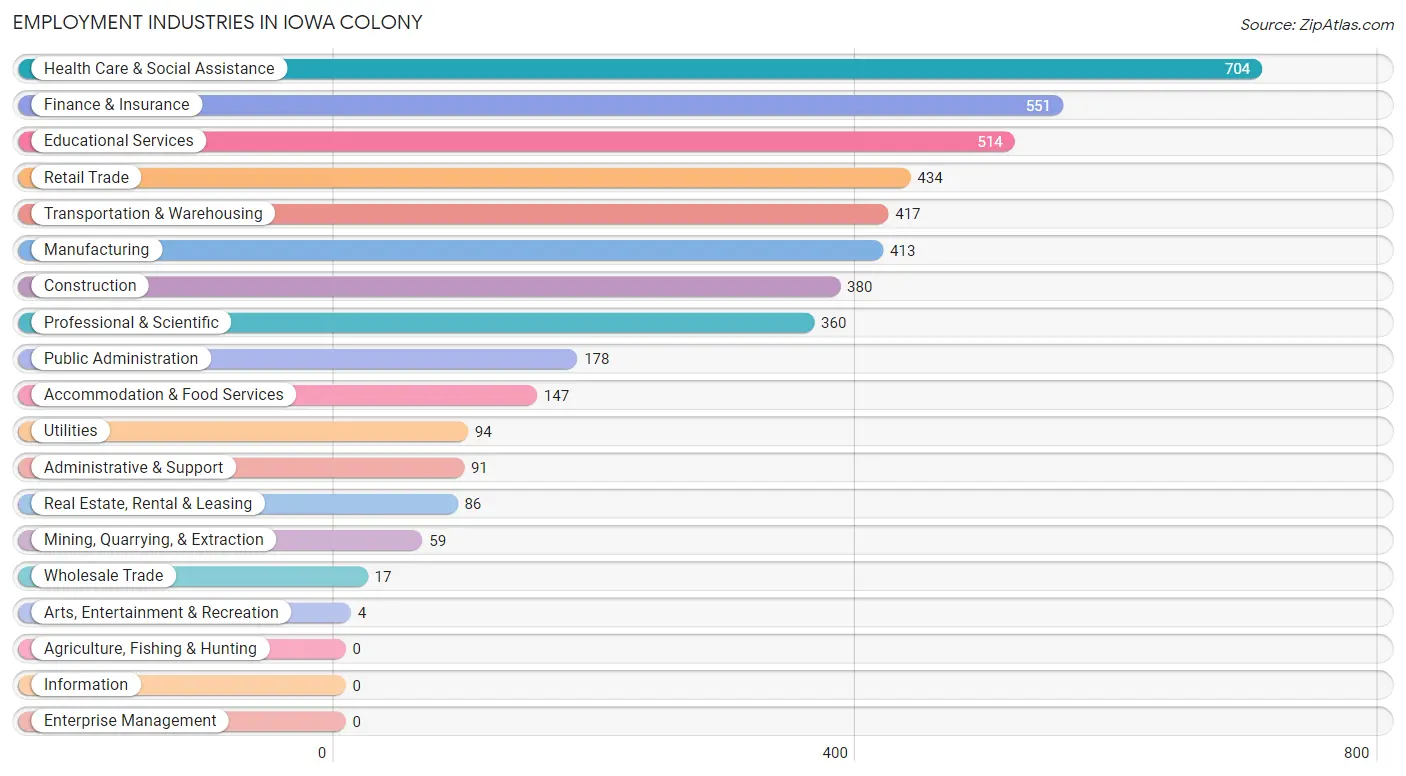
Employment Industries by Sex in Iowa Colony
The Iowa Colony industries that see more men than women are Mining, Quarrying, & Extraction (100.0%), Wholesale Trade (100.0%), and Transportation & Warehousing (91.1%), whereas the industries that tend to have a higher number of women are Real Estate, Rental & Leasing (100.0%), Arts, Entertainment & Recreation (100.0%), and Public Administration (88.8%).
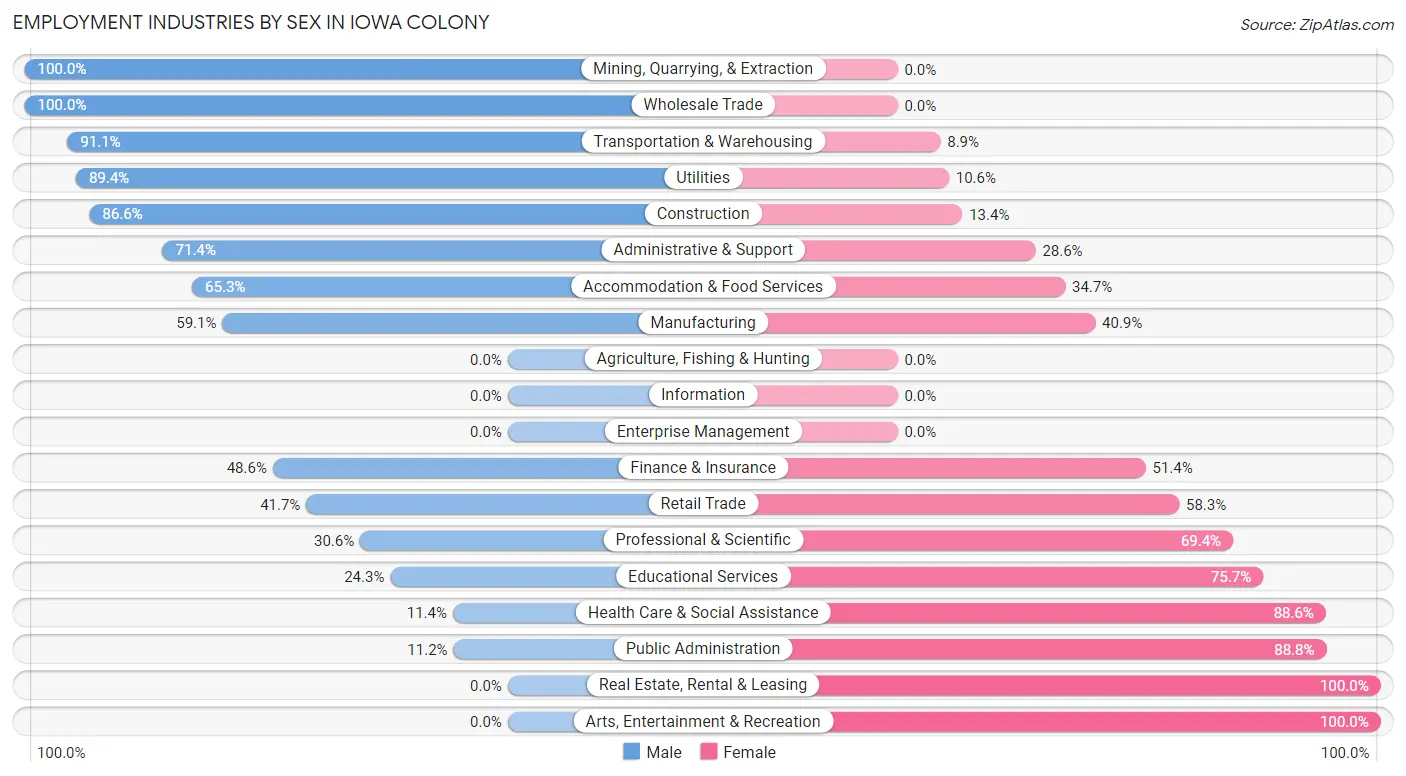
| Industry | Male | Female |
| Agriculture, Fishing & Hunting | 0 (0.0%) | 0 (0.0%) |
| Mining, Quarrying, & Extraction | 59 (100.0%) | 0 (0.0%) |
| Construction | 329 (86.6%) | 51 (13.4%) |
| Manufacturing | 244 (59.1%) | 169 (40.9%) |
| Wholesale Trade | 17 (100.0%) | 0 (0.0%) |
| Retail Trade | 181 (41.7%) | 253 (58.3%) |
| Transportation & Warehousing | 380 (91.1%) | 37 (8.9%) |
| Utilities | 84 (89.4%) | 10 (10.6%) |
| Information | 0 (0.0%) | 0 (0.0%) |
| Finance & Insurance | 268 (48.6%) | 283 (51.4%) |
| Real Estate, Rental & Leasing | 0 (0.0%) | 86 (100.0%) |
| Professional & Scientific | 110 (30.6%) | 250 (69.4%) |
| Enterprise Management | 0 (0.0%) | 0 (0.0%) |
| Administrative & Support | 65 (71.4%) | 26 (28.6%) |
| Educational Services | 125 (24.3%) | 389 (75.7%) |
| Health Care & Social Assistance | 80 (11.4%) | 624 (88.6%) |
| Arts, Entertainment & Recreation | 0 (0.0%) | 4 (100.0%) |
| Accommodation & Food Services | 96 (65.3%) | 51 (34.7%) |
| Public Administration | 20 (11.2%) | 158 (88.8%) |
| Total | 2,181 (47.5%) | 2,408 (52.5%) |
Education in Iowa Colony
School Enrollment in Iowa Colony
The most common levels of schooling among the 3,761 students in Iowa Colony are college / undergraduate (921 | 24.5%), middle school (846 | 22.5%), and high school (805 | 21.4%).
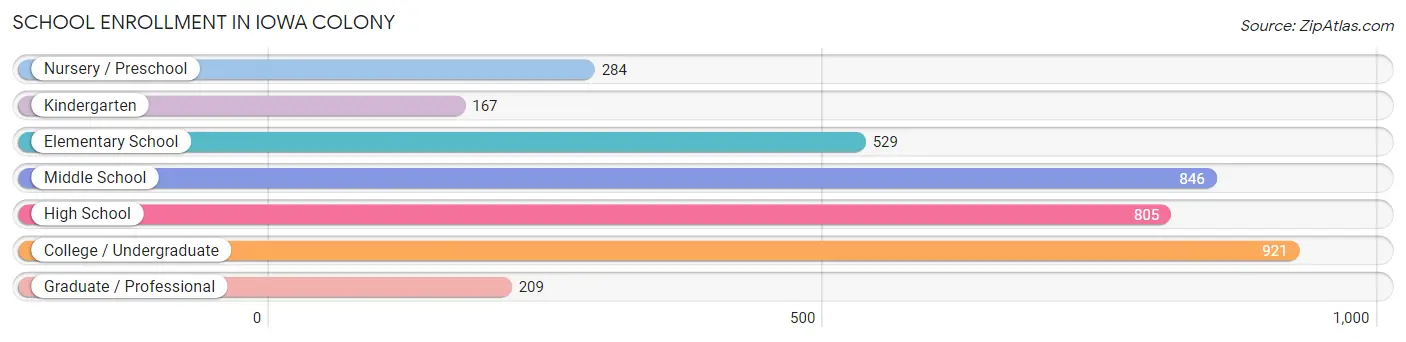
| School Level | # Students | % Students |
| Nursery / Preschool | 284 | 7.5% |
| Kindergarten | 167 | 4.4% |
| Elementary School | 529 | 14.1% |
| Middle School | 846 | 22.5% |
| High School | 805 | 21.4% |
| College / Undergraduate | 921 | 24.5% |
| Graduate / Professional | 209 | 5.6% |
| Total | 3,761 | 100.0% |
School Enrollment by Age by Funding Source in Iowa Colony
Out of a total of 3,761 students who are enrolled in schools in Iowa Colony, 380 (10.1%) attend a private institution, while the remaining 3,381 (89.9%) are enrolled in public schools. The age group of 3 to 4 year olds has the highest likelihood of being enrolled in private schools, with 74 (45.4% in the age bracket) enrolled. Conversely, the age group of 15 to 17 year olds has the lowest likelihood of being enrolled in a private school, with 411 (100.0% in the age bracket) attending a public institution.
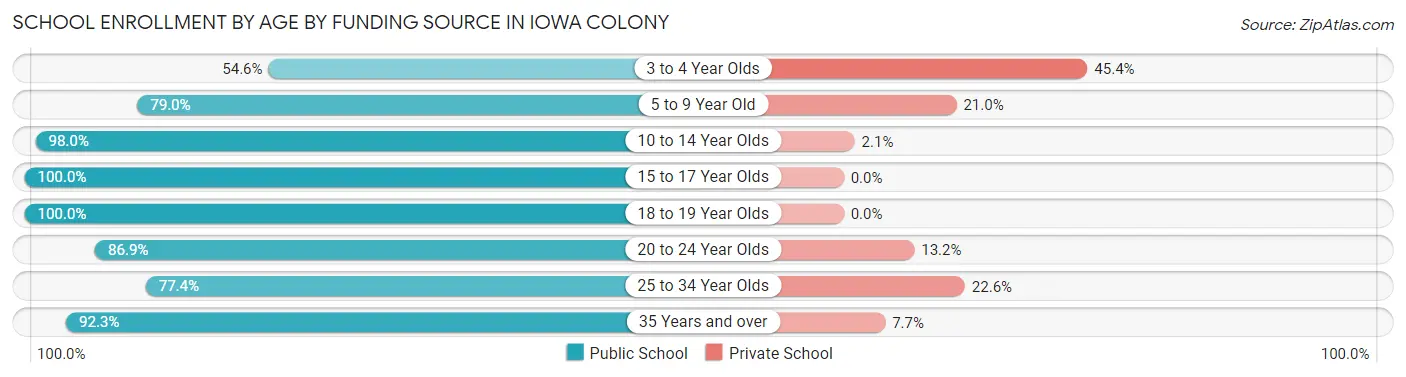
| Age Bracket | Public School | Private School |
| 3 to 4 Year Olds | 89 (54.6%) | 74 (45.4%) |
| 5 to 9 Year Old | 624 (79.0%) | 166 (21.0%) |
| 10 to 14 Year Olds | 1,146 (98.0%) | 24 (2.1%) |
| 15 to 17 Year Olds | 411 (100.0%) | 0 (0.0%) |
| 18 to 19 Year Olds | 281 (100.0%) | 0 (0.0%) |
| 20 to 24 Year Olds | 449 (86.9%) | 68 (13.2%) |
| 25 to 34 Year Olds | 72 (77.4%) | 21 (22.6%) |
| 35 Years and over | 310 (92.3%) | 26 (7.7%) |
| Total | 3,381 (89.9%) | 380 (10.1%) |
Educational Attainment by Field of Study in Iowa Colony
Business (596 | 27.0%), science & technology (386 | 17.5%), bio, nature & agricultural (260 | 11.8%), psychology (254 | 11.5%), and education (165 | 7.5%) are the most common fields of study among 2,210 individuals in Iowa Colony who have obtained a bachelor's degree or higher.
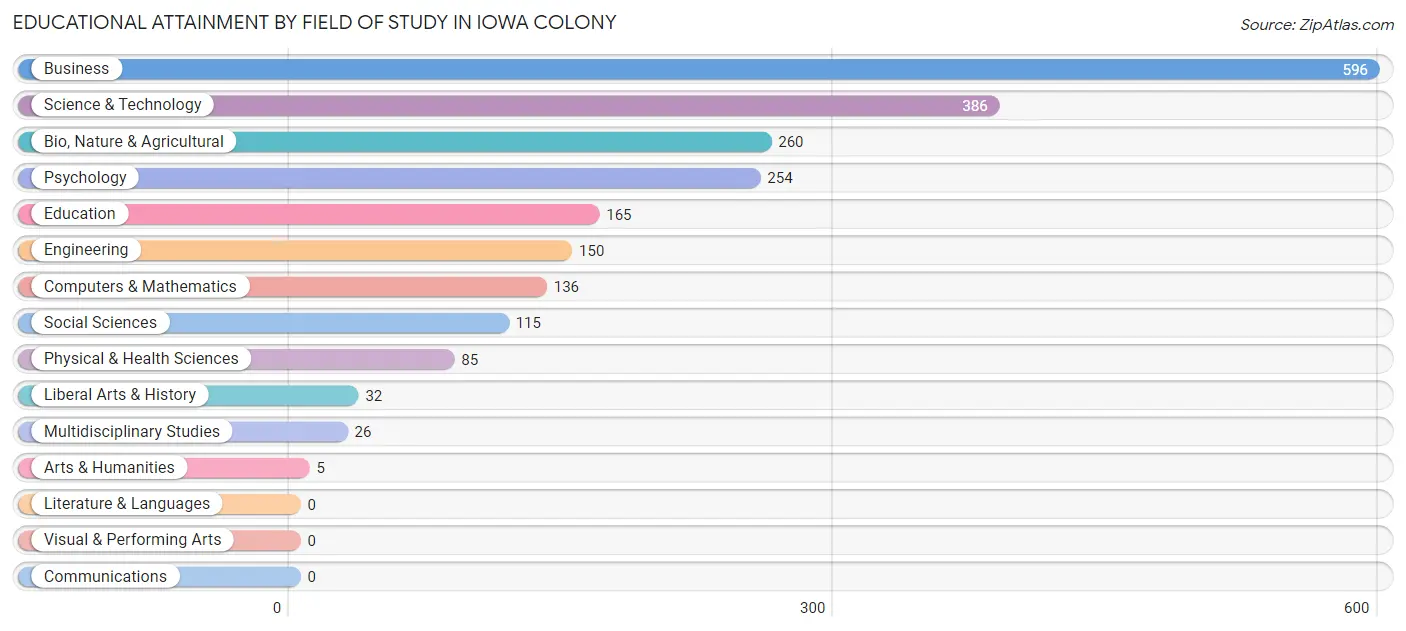
| Field of Study | # Graduates | % Graduates |
| Computers & Mathematics | 136 | 6.1% |
| Bio, Nature & Agricultural | 260 | 11.8% |
| Physical & Health Sciences | 85 | 3.8% |
| Psychology | 254 | 11.5% |
| Social Sciences | 115 | 5.2% |
| Engineering | 150 | 6.8% |
| Multidisciplinary Studies | 26 | 1.2% |
| Science & Technology | 386 | 17.5% |
| Business | 596 | 27.0% |
| Education | 165 | 7.5% |
| Literature & Languages | 0 | 0.0% |
| Liberal Arts & History | 32 | 1.5% |
| Visual & Performing Arts | 0 | 0.0% |
| Communications | 0 | 0.0% |
| Arts & Humanities | 5 | 0.2% |
| Total | 2,210 | 100.0% |
Transportation & Commute in Iowa Colony
Vehicle Availability by Sex in Iowa Colony
The most prevalent vehicle ownership categories in Iowa Colony are males with 2 vehicles (1,237, accounting for 58.8%) and females with 2 vehicles (1,015, making up 54.2%).
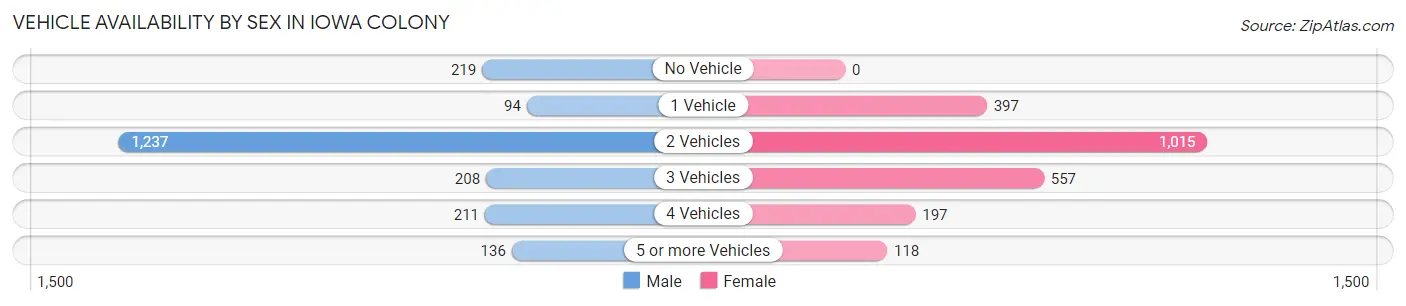
| Vehicles Available | Male | Female |
| No Vehicle | 219 (10.4%) | 0 (0.0%) |
| 1 Vehicle | 94 (4.5%) | 397 (17.4%) |
| 2 Vehicles | 1,237 (58.8%) | 1,015 (44.4%) |
| 3 Vehicles | 208 (9.9%) | 557 (24.4%) |
| 4 Vehicles | 211 (10.0%) | 197 (8.6%) |
| 5 or more Vehicles | 136 (6.5%) | 118 (5.2%) |
| Total | 2,105 (100.0%) | 2,284 (100.0%) |
Commute Time in Iowa Colony
The most frequently occuring commute durations in Iowa Colony are 20 to 24 minutes (715 commuters, 20.9%), 30 to 34 minutes (714 commuters, 20.8%), and 40 to 44 minutes (410 commuters, 12.0%).
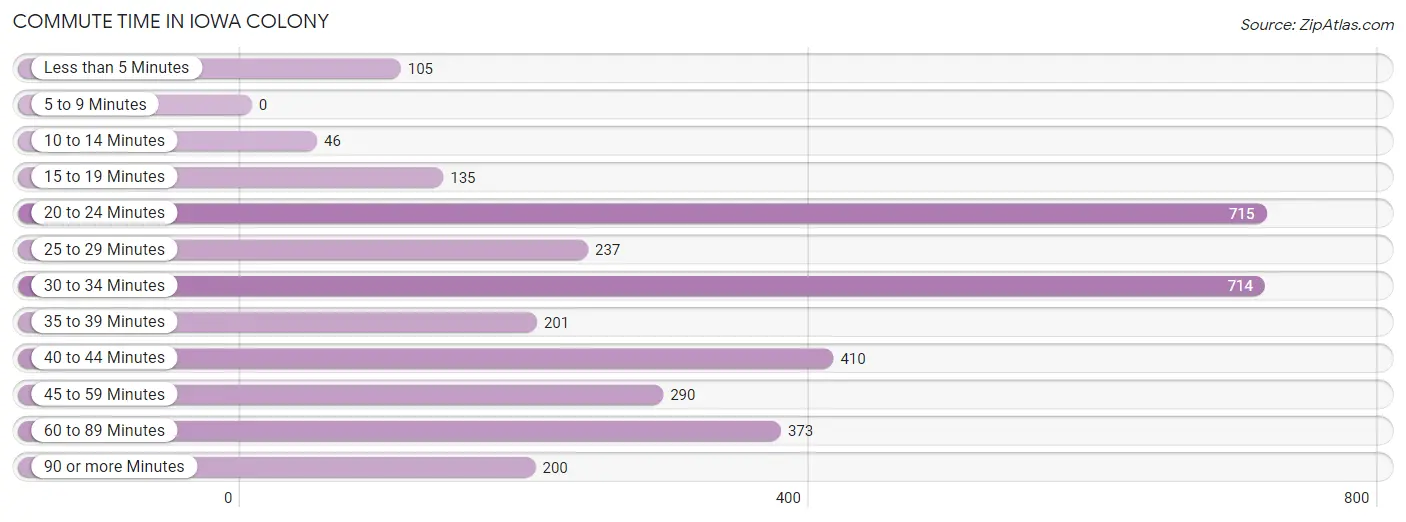
| Commute Time | # Commuters | % Commuters |
| Less than 5 Minutes | 105 | 3.1% |
| 5 to 9 Minutes | 0 | 0.0% |
| 10 to 14 Minutes | 46 | 1.3% |
| 15 to 19 Minutes | 135 | 3.9% |
| 20 to 24 Minutes | 715 | 20.9% |
| 25 to 29 Minutes | 237 | 6.9% |
| 30 to 34 Minutes | 714 | 20.8% |
| 35 to 39 Minutes | 201 | 5.9% |
| 40 to 44 Minutes | 410 | 12.0% |
| 45 to 59 Minutes | 290 | 8.5% |
| 60 to 89 Minutes | 373 | 10.9% |
| 90 or more Minutes | 200 | 5.8% |
Commute Time by Sex in Iowa Colony
The most common commute times in Iowa Colony are 30 to 34 minutes (342 commuters, 20.4%) for males and 20 to 24 minutes (478 commuters, 27.3%) for females.
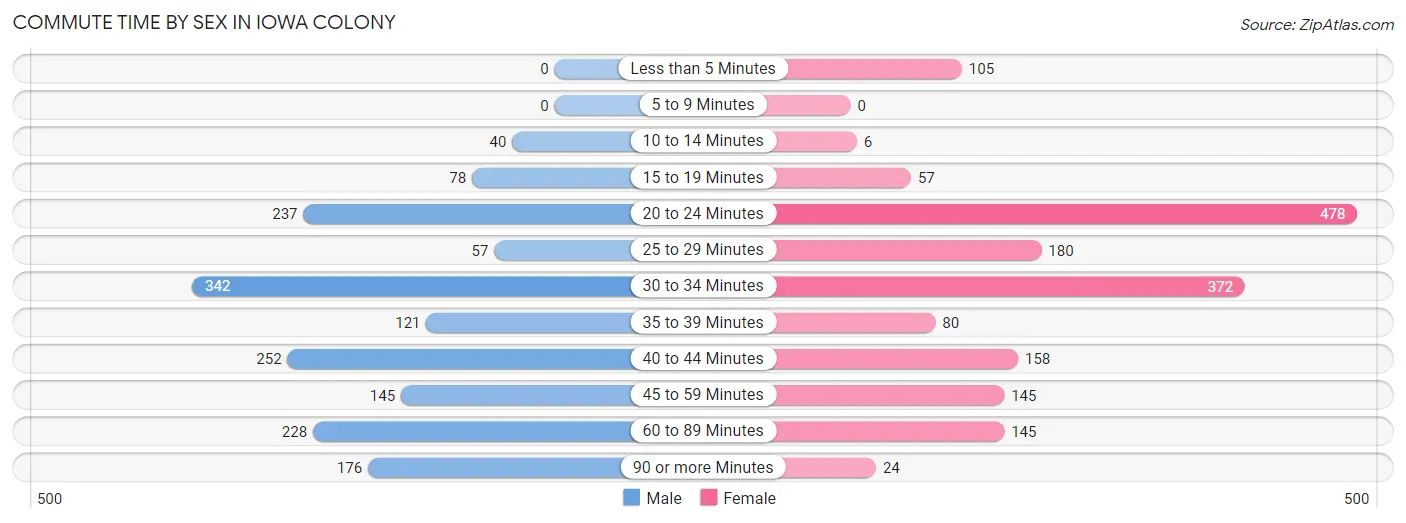
| Commute Time | Male | Female |
| Less than 5 Minutes | 0 (0.0%) | 105 (6.0%) |
| 5 to 9 Minutes | 0 (0.0%) | 0 (0.0%) |
| 10 to 14 Minutes | 40 (2.4%) | 6 (0.3%) |
| 15 to 19 Minutes | 78 (4.6%) | 57 (3.3%) |
| 20 to 24 Minutes | 237 (14.1%) | 478 (27.3%) |
| 25 to 29 Minutes | 57 (3.4%) | 180 (10.3%) |
| 30 to 34 Minutes | 342 (20.4%) | 372 (21.3%) |
| 35 to 39 Minutes | 121 (7.2%) | 80 (4.6%) |
| 40 to 44 Minutes | 252 (15.0%) | 158 (9.0%) |
| 45 to 59 Minutes | 145 (8.6%) | 145 (8.3%) |
| 60 to 89 Minutes | 228 (13.6%) | 145 (8.3%) |
| 90 or more Minutes | 176 (10.5%) | 24 (1.4%) |
Time of Departure to Work by Sex in Iowa Colony
The most frequent times of departure to work in Iowa Colony are 7:00 AM to 7:29 AM (374, 22.3%) for males and 6:30 AM to 6:59 AM (345, 19.7%) for females.
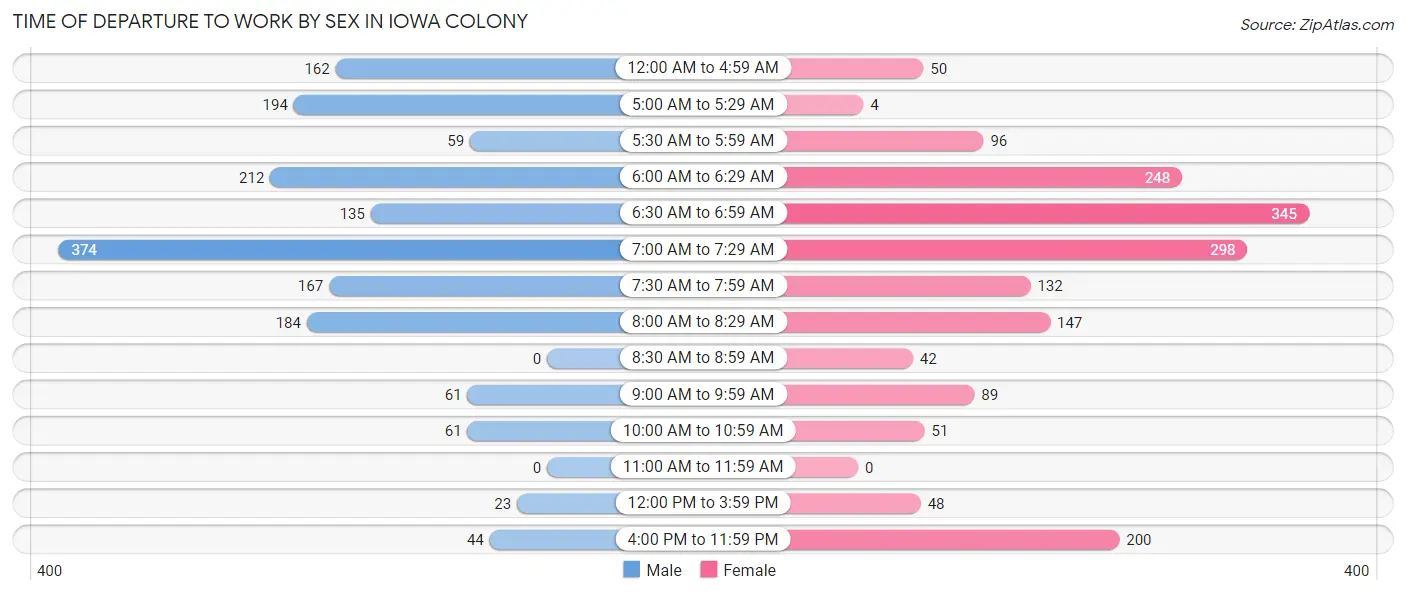
| Time of Departure | Male | Female |
| 12:00 AM to 4:59 AM | 162 (9.7%) | 50 (2.9%) |
| 5:00 AM to 5:29 AM | 194 (11.6%) | 4 (0.2%) |
| 5:30 AM to 5:59 AM | 59 (3.5%) | 96 (5.5%) |
| 6:00 AM to 6:29 AM | 212 (12.7%) | 248 (14.2%) |
| 6:30 AM to 6:59 AM | 135 (8.1%) | 345 (19.7%) |
| 7:00 AM to 7:29 AM | 374 (22.3%) | 298 (17.0%) |
| 7:30 AM to 7:59 AM | 167 (10.0%) | 132 (7.5%) |
| 8:00 AM to 8:29 AM | 184 (11.0%) | 147 (8.4%) |
| 8:30 AM to 8:59 AM | 0 (0.0%) | 42 (2.4%) |
| 9:00 AM to 9:59 AM | 61 (3.6%) | 89 (5.1%) |
| 10:00 AM to 10:59 AM | 61 (3.6%) | 51 (2.9%) |
| 11:00 AM to 11:59 AM | 0 (0.0%) | 0 (0.0%) |
| 12:00 PM to 3:59 PM | 23 (1.4%) | 48 (2.7%) |
| 4:00 PM to 11:59 PM | 44 (2.6%) | 200 (11.4%) |
| Total | 1,676 (100.0%) | 1,750 (100.0%) |
Housing Occupancy in Iowa Colony
Occupancy by Ownership in Iowa Colony
Of the total 2,918 dwellings in Iowa Colony, owner-occupied units account for 2,830 (97.0%), while renter-occupied units make up 88 (3.0%).
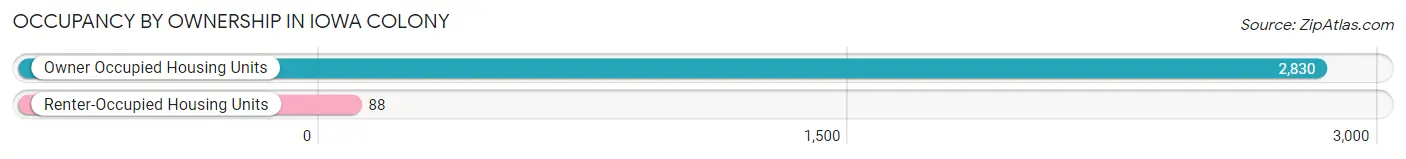
| Occupancy | # Housing Units | % Housing Units |
| Owner Occupied Housing Units | 2,830 | 97.0% |
| Renter-Occupied Housing Units | 88 | 3.0% |
| Total Occupied Housing Units | 2,918 | 100.0% |
Occupancy by Household Size in Iowa Colony
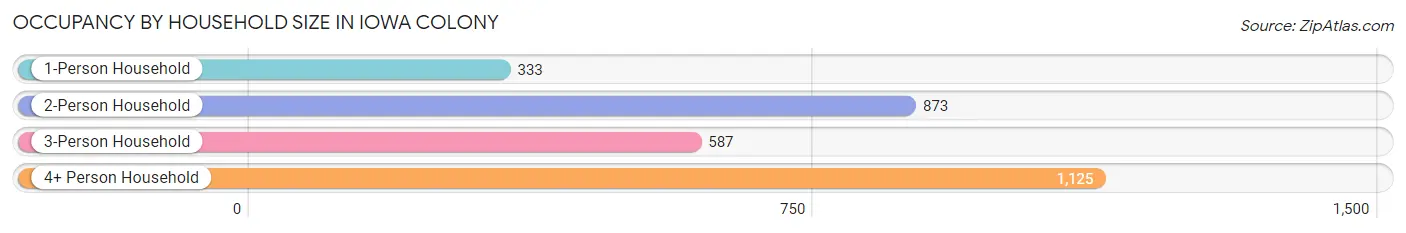
| Household Size | # Housing Units | % Housing Units |
| 1-Person Household | 333 | 11.4% |
| 2-Person Household | 873 | 29.9% |
| 3-Person Household | 587 | 20.1% |
| 4+ Person Household | 1,125 | 38.6% |
| Total Housing Units | 2,918 | 100.0% |
Occupancy by Ownership by Household Size in Iowa Colony
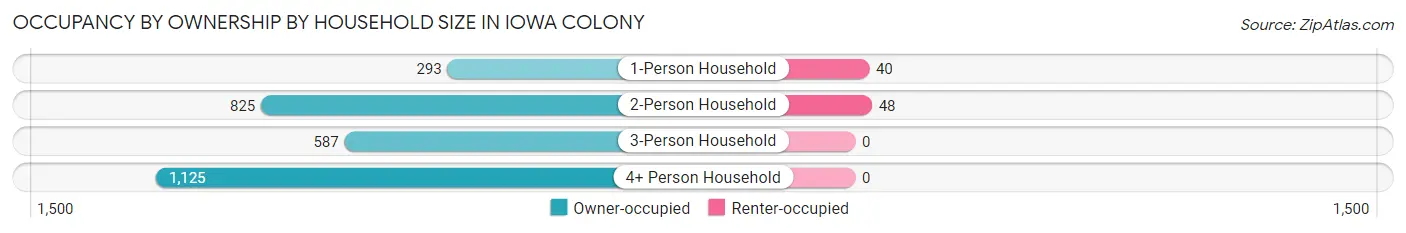
| Household Size | Owner-occupied | Renter-occupied |
| 1-Person Household | 293 (88.0%) | 40 (12.0%) |
| 2-Person Household | 825 (94.5%) | 48 (5.5%) |
| 3-Person Household | 587 (100.0%) | 0 (0.0%) |
| 4+ Person Household | 1,125 (100.0%) | 0 (0.0%) |
| Total Housing Units | 2,830 (97.0%) | 88 (3.0%) |
Occupancy by Educational Attainment in Iowa Colony
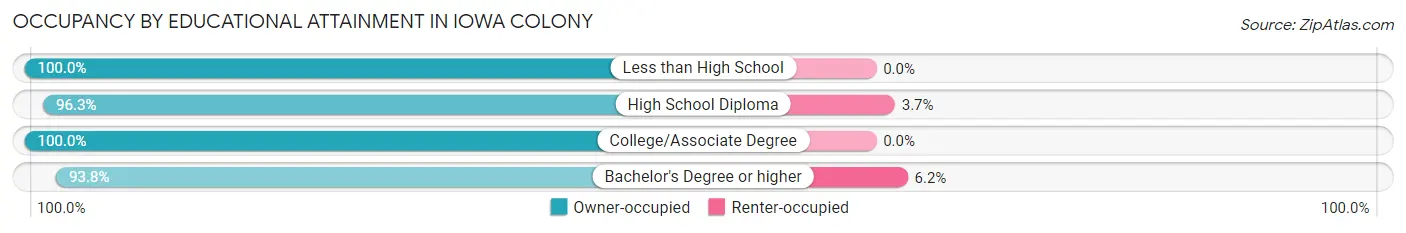
| Household Size | Owner-occupied | Renter-occupied |
| Less than High School | 44 (100.0%) | 0 (0.0%) |
| High School Diploma | 444 (96.3%) | 17 (3.7%) |
| College/Associate Degree | 1,273 (100.0%) | 0 (0.0%) |
| Bachelor's Degree or higher | 1,069 (93.8%) | 71 (6.2%) |
Occupancy by Age of Householder in Iowa Colony
| Age Bracket | # Households | % Households |
| Under 35 Years | 562 | 19.3% |
| 35 to 44 Years | 1,008 | 34.5% |
| 45 to 54 Years | 614 | 21.0% |
| 55 to 64 Years | 433 | 14.8% |
| 65 to 74 Years | 265 | 9.1% |
| 75 to 84 Years | 36 | 1.2% |
| 85 Years and Over | 0 | 0.0% |
| Total | 2,918 | 100.0% |
Housing Finances in Iowa Colony
Median Income by Occupancy in Iowa Colony
| Occupancy Type | # Households | Median Income |
| Owner-Occupied | 2,830 (97.0%) | $108,393 |
| Renter-Occupied | 88 (3.0%) | $111,824 |
| Average | 2,918 (100.0%) | $110,000 |
Occupancy by Householder Income Bracket in Iowa Colony
| Income Bracket | Owner-occupied | Renter-occupied |
| Less than $5,000 | 102 (3.6%) | 0 (0.0%) |
| $5,000 to $9,999 | 31 (1.1%) | 0 (0.0%) |
| $10,000 to $14,999 | 23 (0.8%) | 0 (0.0%) |
| $15,000 to $19,999 | 0 (0.0%) | 0 (0.0%) |
| $20,000 to $24,999 | 0 (0.0%) | 9 (10.2%) |
| $25,000 to $34,999 | 21 (0.7%) | 8 (9.1%) |
| $35,000 to $49,999 | 33 (1.2%) | 0 (0.0%) |
| $50,000 to $74,999 | 385 (13.6%) | 0 (0.0%) |
| $75,000 to $99,999 | 707 (25.0%) | 0 (0.0%) |
| $100,000 to $149,999 | 562 (19.9%) | 60 (68.2%) |
| $150,000 or more | 966 (34.1%) | 11 (12.5%) |
| Total | 2,830 (100.0%) | 88 (100.0%) |
Monthly Housing Cost Tiers in Iowa Colony
| Monthly Cost | Owner-occupied | Renter-occupied |
| Less than $300 | 37 (1.3%) | 0 (0.0%) |
| $300 to $499 | 120 (4.2%) | 0 (0.0%) |
| $500 to $799 | 120 (4.2%) | 9 (10.2%) |
| $800 to $999 | 75 (2.6%) | 19 (21.6%) |
| $1,000 to $1,499 | 163 (5.8%) | 0 (0.0%) |
| $1,500 to $1,999 | 444 (15.7%) | 0 (0.0%) |
| $2,000 to $2,499 | 821 (29.0%) | 60 (68.2%) |
| $2,500 to $2,999 | 307 (10.8%) | 0 (0.0%) |
| $3,000 or more | 743 (26.3%) | 0 (0.0%) |
| Total | 2,830 (100.0%) | 88 (100.0%) |
Physical Housing Characteristics in Iowa Colony
Housing Structures in Iowa Colony
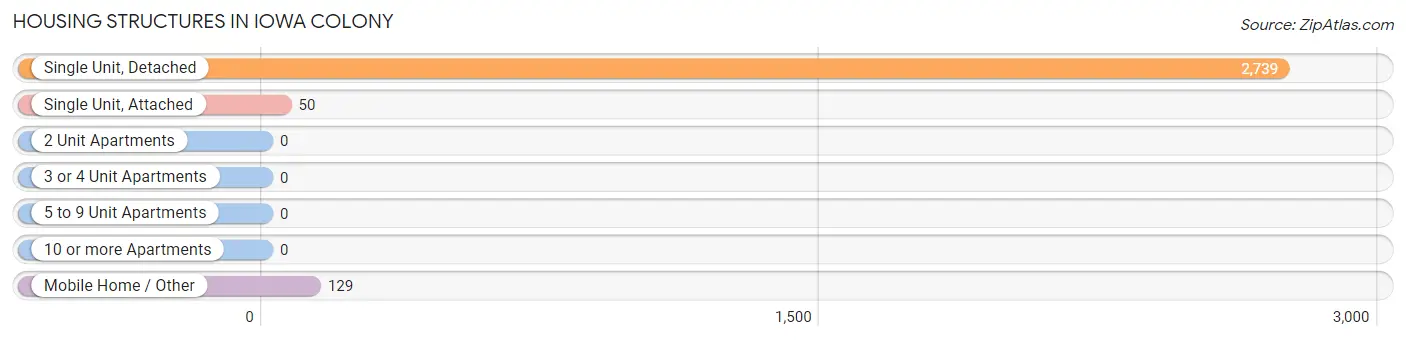
| Structure Type | # Housing Units | % Housing Units |
| Single Unit, Detached | 2,739 | 93.9% |
| Single Unit, Attached | 50 | 1.7% |
| 2 Unit Apartments | 0 | 0.0% |
| 3 or 4 Unit Apartments | 0 | 0.0% |
| 5 to 9 Unit Apartments | 0 | 0.0% |
| 10 or more Apartments | 0 | 0.0% |
| Mobile Home / Other | 129 | 4.4% |
| Total | 2,918 | 100.0% |
Housing Structures by Occupancy in Iowa Colony
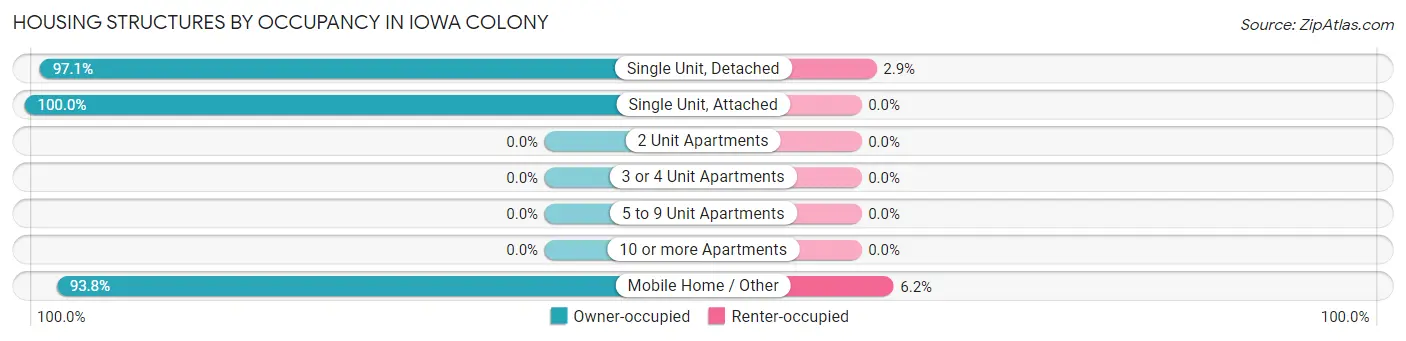
| Structure Type | Owner-occupied | Renter-occupied |
| Single Unit, Detached | 2,659 (97.1%) | 80 (2.9%) |
| Single Unit, Attached | 50 (100.0%) | 0 (0.0%) |
| 2 Unit Apartments | 0 (0.0%) | 0 (0.0%) |
| 3 or 4 Unit Apartments | 0 (0.0%) | 0 (0.0%) |
| 5 to 9 Unit Apartments | 0 (0.0%) | 0 (0.0%) |
| 10 or more Apartments | 0 (0.0%) | 0 (0.0%) |
| Mobile Home / Other | 121 (93.8%) | 8 (6.2%) |
| Total | 2,830 (97.0%) | 88 (3.0%) |
Housing Structures by Number of Rooms in Iowa Colony
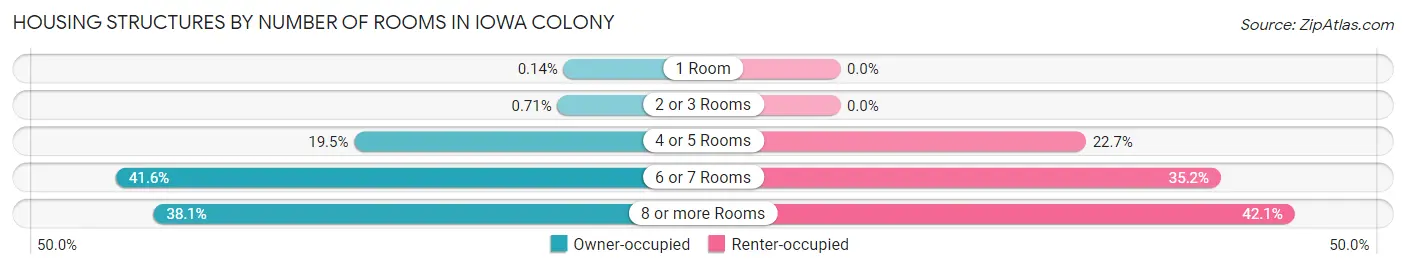
| Number of Rooms | Owner-occupied | Renter-occupied |
| 1 Room | 4 (0.1%) | 0 (0.0%) |
| 2 or 3 Rooms | 20 (0.7%) | 0 (0.0%) |
| 4 or 5 Rooms | 552 (19.5%) | 20 (22.7%) |
| 6 or 7 Rooms | 1,176 (41.5%) | 31 (35.2%) |
| 8 or more Rooms | 1,078 (38.1%) | 37 (42.0%) |
| Total | 2,830 (100.0%) | 88 (100.0%) |
Housing Structure by Heating Type in Iowa Colony
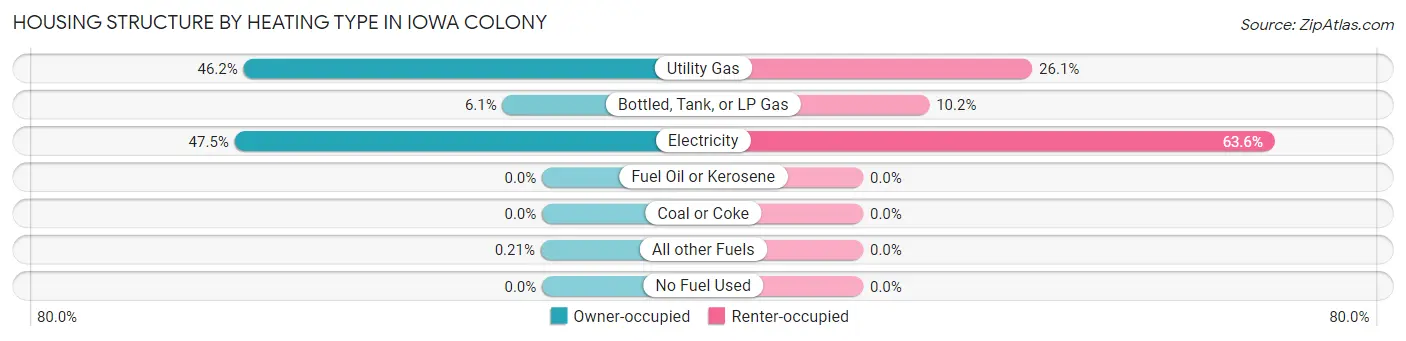
| Heating Type | Owner-occupied | Renter-occupied |
| Utility Gas | 1,306 (46.2%) | 23 (26.1%) |
| Bottled, Tank, or LP Gas | 173 (6.1%) | 9 (10.2%) |
| Electricity | 1,345 (47.5%) | 56 (63.6%) |
| Fuel Oil or Kerosene | 0 (0.0%) | 0 (0.0%) |
| Coal or Coke | 0 (0.0%) | 0 (0.0%) |
| All other Fuels | 6 (0.2%) | 0 (0.0%) |
| No Fuel Used | 0 (0.0%) | 0 (0.0%) |
| Total | 2,830 (100.0%) | 88 (100.0%) |
Household Vehicle Usage in Iowa Colony
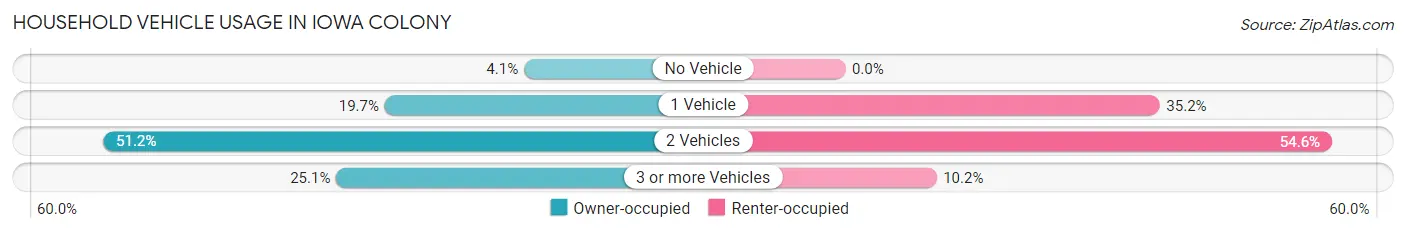
| Vehicles per Household | Owner-occupied | Renter-occupied |
| No Vehicle | 115 (4.1%) | 0 (0.0%) |
| 1 Vehicle | 556 (19.7%) | 31 (35.2%) |
| 2 Vehicles | 1,449 (51.2%) | 48 (54.5%) |
| 3 or more Vehicles | 710 (25.1%) | 9 (10.2%) |
| Total | 2,830 (100.0%) | 88 (100.0%) |
Real Estate & Mortgages in Iowa Colony
Real Estate and Mortgage Overview in Iowa Colony
| Characteristic | Without Mortgage | With Mortgage |
| Housing Units | 371 | 2,459 |
| Median Property Value | $284,500 | $317,000 |
| Median Household Income | $143,750 | $859 |
| Monthly Housing Costs | $769 | $743 |
| Real Estate Taxes | $3,250 | $127 |
Property Value by Mortgage Status in Iowa Colony
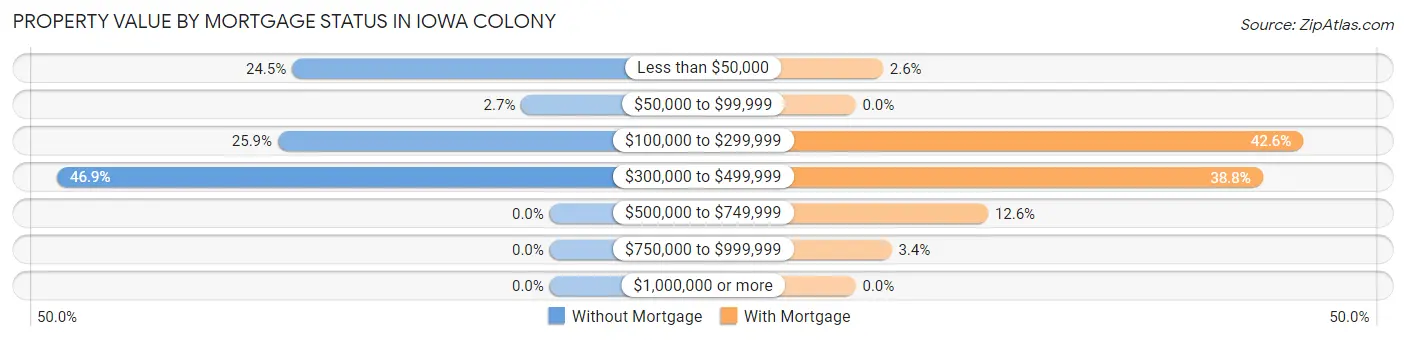
| Property Value | Without Mortgage | With Mortgage |
| Less than $50,000 | 91 (24.5%) | 64 (2.6%) |
| $50,000 to $99,999 | 10 (2.7%) | 0 (0.0%) |
| $100,000 to $299,999 | 96 (25.9%) | 1,048 (42.6%) |
| $300,000 to $499,999 | 174 (46.9%) | 953 (38.8%) |
| $500,000 to $749,999 | 0 (0.0%) | 310 (12.6%) |
| $750,000 to $999,999 | 0 (0.0%) | 84 (3.4%) |
| $1,000,000 or more | 0 (0.0%) | 0 (0.0%) |
| Total | 371 (100.0%) | 2,459 (100.0%) |
Household Income by Mortgage Status in Iowa Colony
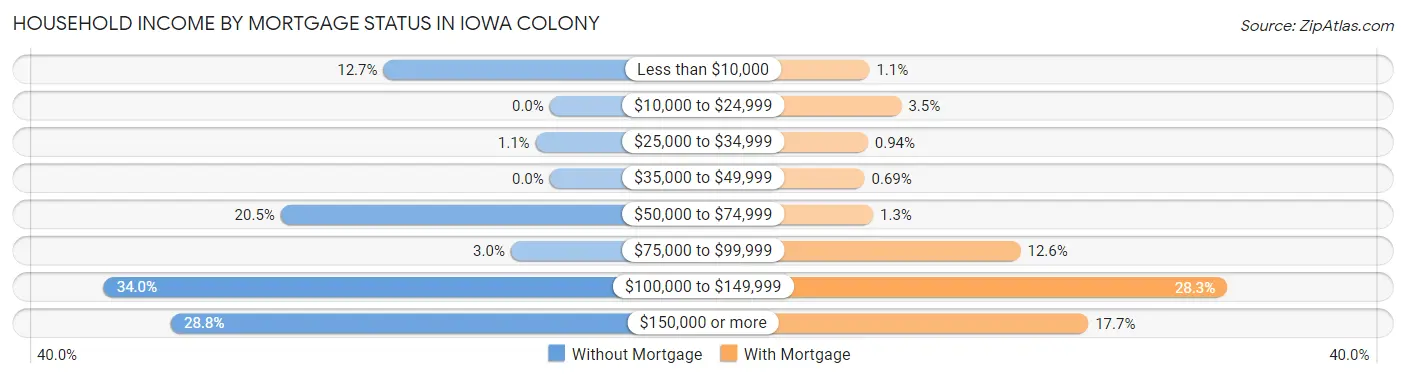
| Household Income | Without Mortgage | With Mortgage |
| Less than $10,000 | 47 (12.7%) | 26 (1.1%) |
| $10,000 to $24,999 | 0 (0.0%) | 86 (3.5%) |
| $25,000 to $34,999 | 4 (1.1%) | 23 (0.9%) |
| $35,000 to $49,999 | 0 (0.0%) | 17 (0.7%) |
| $50,000 to $74,999 | 76 (20.5%) | 33 (1.3%) |
| $75,000 to $99,999 | 11 (3.0%) | 309 (12.6%) |
| $100,000 to $149,999 | 126 (34.0%) | 696 (28.3%) |
| $150,000 or more | 107 (28.8%) | 436 (17.7%) |
| Total | 371 (100.0%) | 2,459 (100.0%) |
Property Value to Household Income Ratio in Iowa Colony
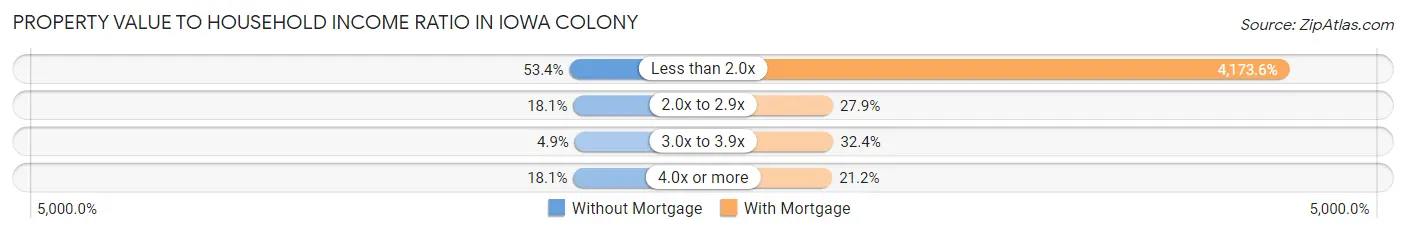
| Value-to-Income Ratio | Without Mortgage | With Mortgage |
| Less than 2.0x | 198 (53.4%) | 102,629 (4,173.6%) |
| 2.0x to 2.9x | 67 (18.1%) | 687 (27.9%) |
| 3.0x to 3.9x | 18 (4.9%) | 797 (32.4%) |
| 4.0x or more | 67 (18.1%) | 520 (21.1%) |
| Total | 371 (100.0%) | 2,459 (100.0%) |
Real Estate Taxes by Mortgage Status in Iowa Colony
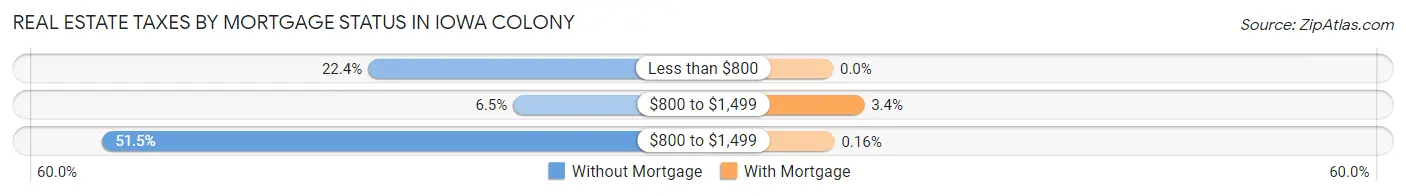
| Property Taxes | Without Mortgage | With Mortgage |
| Less than $800 | 83 (22.4%) | 0 (0.0%) |
| $800 to $1,499 | 24 (6.5%) | 84 (3.4%) |
| $800 to $1,499 | 191 (51.5%) | 4 (0.2%) |
| Total | 371 (100.0%) | 2,459 (100.0%) |
Health & Disability in Iowa Colony
Health Insurance Coverage by Age in Iowa Colony
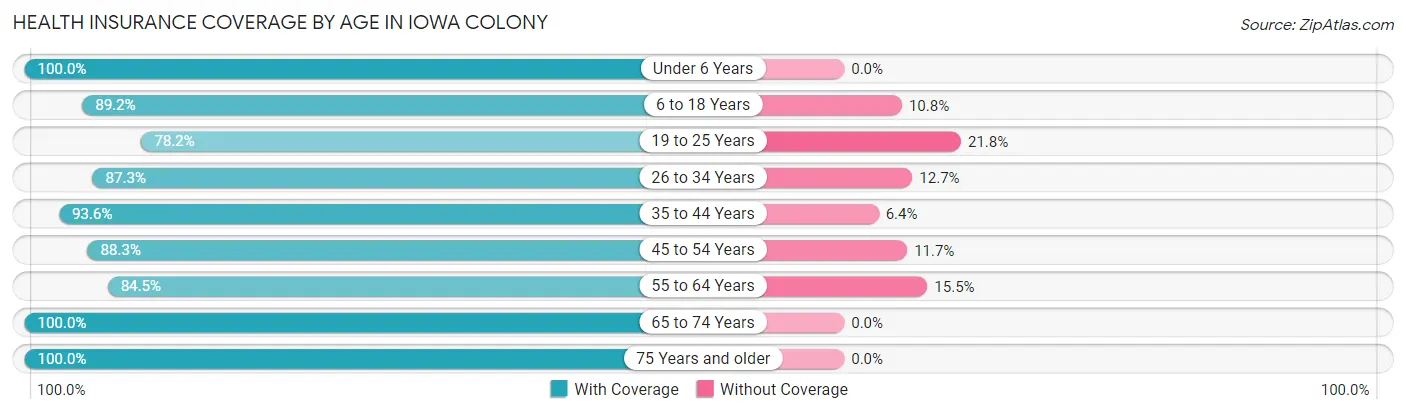
| Age Bracket | With Coverage | Without Coverage |
| Under 6 Years | 773 (100.0%) | 0 (0.0%) |
| 6 to 18 Years | 2,140 (89.2%) | 258 (10.8%) |
| 19 to 25 Years | 675 (78.2%) | 188 (21.8%) |
| 26 to 34 Years | 1,017 (87.3%) | 148 (12.7%) |
| 35 to 44 Years | 1,501 (93.6%) | 103 (6.4%) |
| 45 to 54 Years | 1,129 (88.3%) | 150 (11.7%) |
| 55 to 64 Years | 594 (84.5%) | 109 (15.5%) |
| 65 to 74 Years | 512 (100.0%) | 0 (0.0%) |
| 75 Years and older | 178 (100.0%) | 0 (0.0%) |
| Total | 8,519 (89.9%) | 956 (10.1%) |
Health Insurance Coverage by Citizenship Status in Iowa Colony
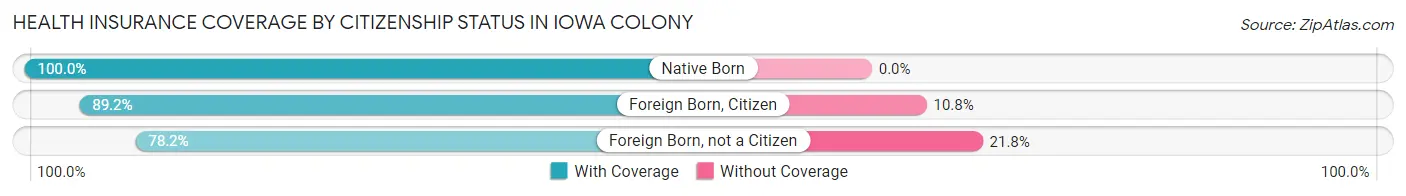
| Citizenship Status | With Coverage | Without Coverage |
| Native Born | 773 (100.0%) | 0 (0.0%) |
| Foreign Born, Citizen | 2,140 (89.2%) | 258 (10.8%) |
| Foreign Born, not a Citizen | 675 (78.2%) | 188 (21.8%) |
Health Insurance Coverage by Household Income in Iowa Colony
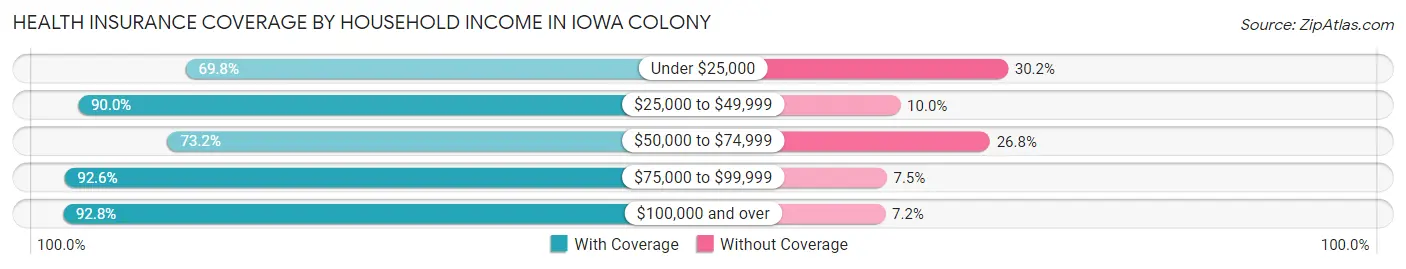
| Household Income | With Coverage | Without Coverage |
| Under $25,000 | 220 (69.8%) | 95 (30.2%) |
| $25,000 to $49,999 | 126 (90.0%) | 14 (10.0%) |
| $50,000 to $74,999 | 719 (73.2%) | 263 (26.8%) |
| $75,000 to $99,999 | 2,248 (92.5%) | 181 (7.4%) |
| $100,000 and over | 5,206 (92.8%) | 403 (7.2%) |
Public vs Private Health Insurance Coverage by Age in Iowa Colony
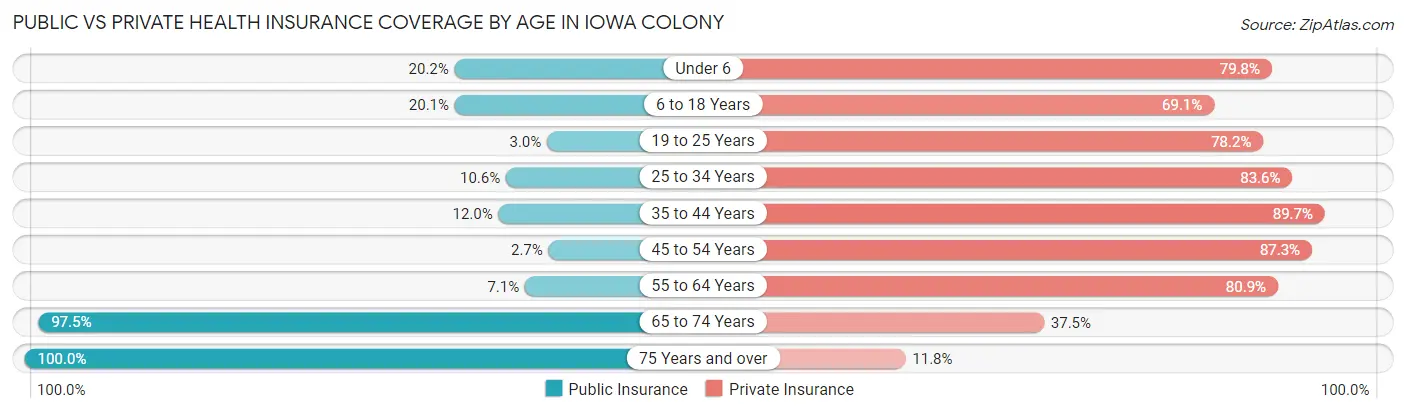
| Age Bracket | Public Insurance | Private Insurance |
| Under 6 | 156 (20.2%) | 617 (79.8%) |
| 6 to 18 Years | 483 (20.1%) | 1,657 (69.1%) |
| 19 to 25 Years | 26 (3.0%) | 675 (78.2%) |
| 25 to 34 Years | 124 (10.6%) | 974 (83.6%) |
| 35 to 44 Years | 193 (12.0%) | 1,438 (89.6%) |
| 45 to 54 Years | 35 (2.7%) | 1,116 (87.3%) |
| 55 to 64 Years | 50 (7.1%) | 569 (80.9%) |
| 65 to 74 Years | 499 (97.5%) | 192 (37.5%) |
| 75 Years and over | 178 (100.0%) | 21 (11.8%) |
| Total | 1,744 (18.4%) | 7,259 (76.6%) |
Disability Status by Sex by Age in Iowa Colony
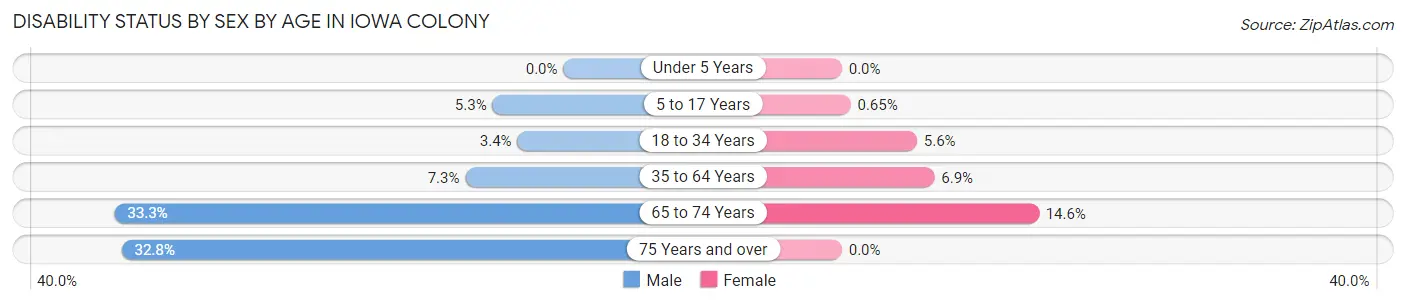
| Age Bracket | Male | Female |
| Under 5 Years | 0 (0.0%) | 0 (0.0%) |
| 5 to 17 Years | 69 (5.3%) | 7 (0.6%) |
| 18 to 34 Years | 38 (3.4%) | 63 (5.6%) |
| 35 to 64 Years | 119 (7.3%) | 134 (6.9%) |
| 65 to 74 Years | 100 (33.3%) | 31 (14.6%) |
| 75 Years and over | 41 (32.8%) | 0 (0.0%) |
Disability Class by Sex by Age in Iowa Colony
Disability Class: Hearing Difficulty
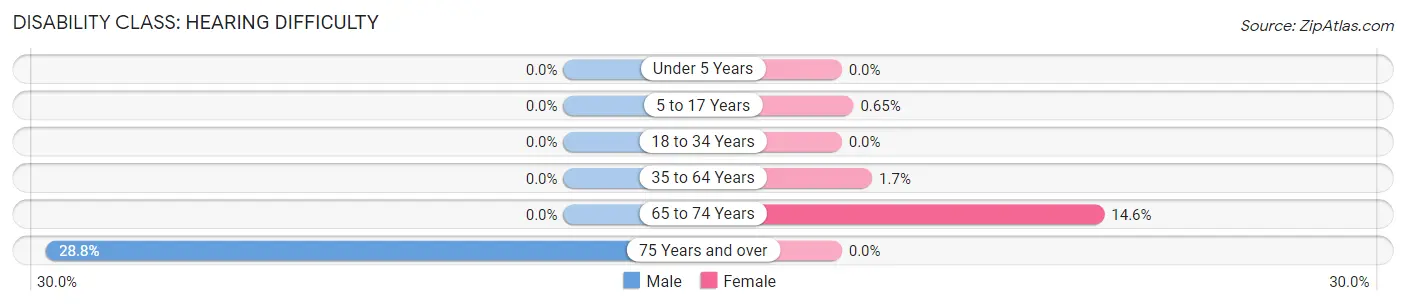
| Age Bracket | Male | Female |
| Under 5 Years | 0 (0.0%) | 0 (0.0%) |
| 5 to 17 Years | 0 (0.0%) | 7 (0.6%) |
| 18 to 34 Years | 0 (0.0%) | 0 (0.0%) |
| 35 to 64 Years | 0 (0.0%) | 33 (1.7%) |
| 65 to 74 Years | 0 (0.0%) | 31 (14.6%) |
| 75 Years and over | 36 (28.8%) | 0 (0.0%) |
Disability Class: Vision Difficulty
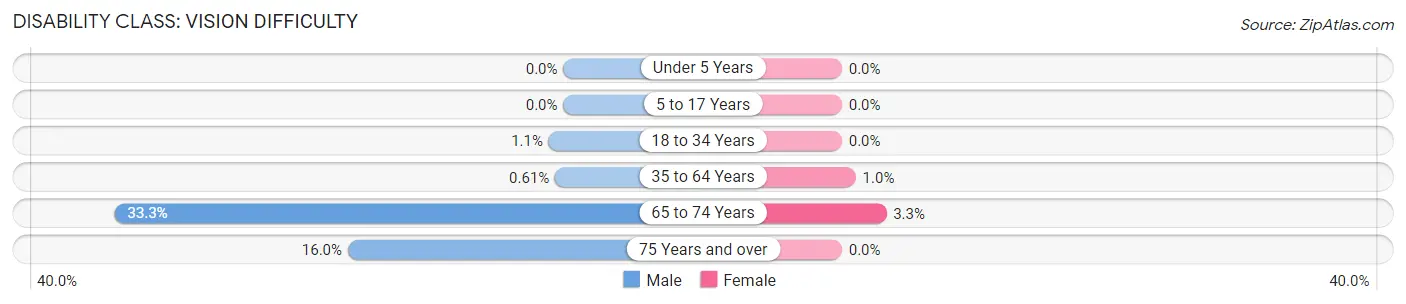
| Age Bracket | Male | Female |
| Under 5 Years | 0 (0.0%) | 0 (0.0%) |
| 5 to 17 Years | 0 (0.0%) | 0 (0.0%) |
| 18 to 34 Years | 12 (1.1%) | 0 (0.0%) |
| 35 to 64 Years | 10 (0.6%) | 20 (1.0%) |
| 65 to 74 Years | 100 (33.3%) | 7 (3.3%) |
| 75 Years and over | 20 (16.0%) | 0 (0.0%) |
Disability Class: Cognitive Difficulty
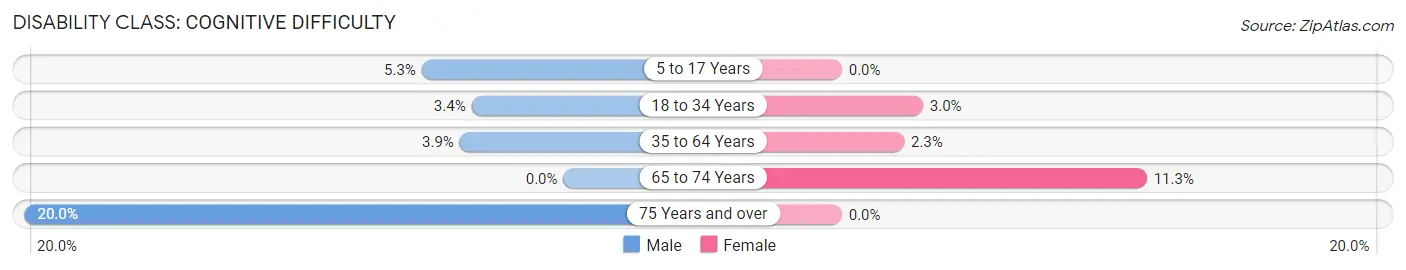
| Age Bracket | Male | Female |
| 5 to 17 Years | 69 (5.3%) | 0 (0.0%) |
| 18 to 34 Years | 38 (3.4%) | 34 (3.0%) |
| 35 to 64 Years | 63 (3.8%) | 45 (2.3%) |
| 65 to 74 Years | 0 (0.0%) | 24 (11.3%) |
| 75 Years and over | 25 (20.0%) | 0 (0.0%) |
Disability Class: Ambulatory Difficulty
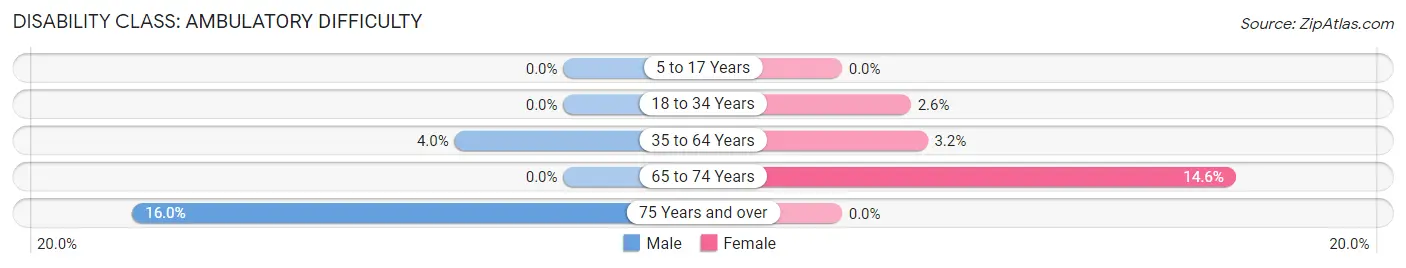
| Age Bracket | Male | Female |
| 5 to 17 Years | 0 (0.0%) | 0 (0.0%) |
| 18 to 34 Years | 0 (0.0%) | 29 (2.6%) |
| 35 to 64 Years | 66 (4.0%) | 62 (3.2%) |
| 65 to 74 Years | 0 (0.0%) | 31 (14.6%) |
| 75 Years and over | 20 (16.0%) | 0 (0.0%) |
Disability Class: Self-Care Difficulty
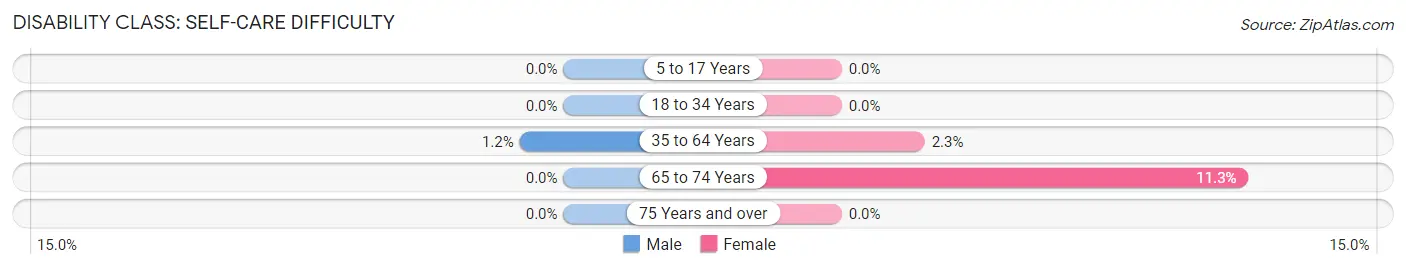
| Age Bracket | Male | Female |
| 5 to 17 Years | 0 (0.0%) | 0 (0.0%) |
| 18 to 34 Years | 0 (0.0%) | 0 (0.0%) |
| 35 to 64 Years | 20 (1.2%) | 45 (2.3%) |
| 65 to 74 Years | 0 (0.0%) | 24 (11.3%) |
| 75 Years and over | 0 (0.0%) | 0 (0.0%) |
Technology Access in Iowa Colony
Computing Device Access in Iowa Colony
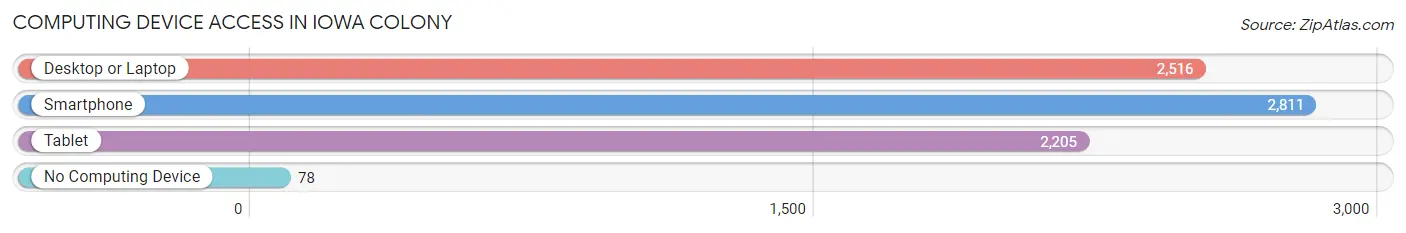
| Device Type | # Households | % Households |
| Desktop or Laptop | 2,516 | 86.2% |
| Smartphone | 2,811 | 96.3% |
| Tablet | 2,205 | 75.6% |
| No Computing Device | 78 | 2.7% |
| Total | 2,918 | 100.0% |
Internet Access in Iowa Colony
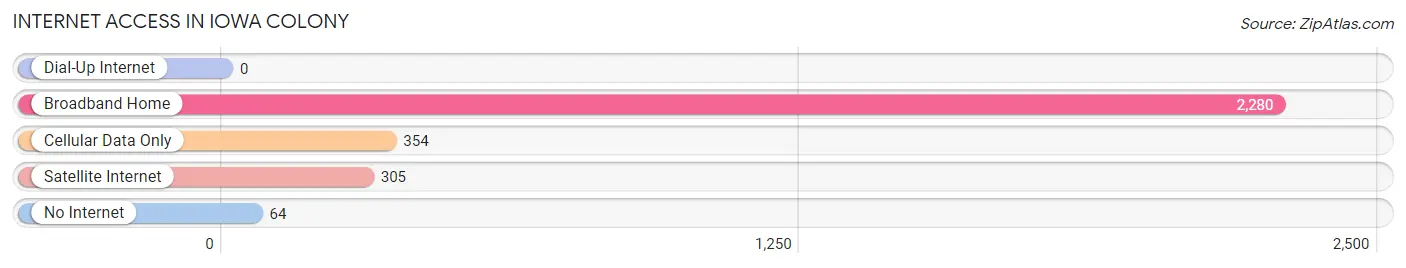
| Internet Type | # Households | % Households |
| Dial-Up Internet | 0 | 0.0% |
| Broadband Home | 2,280 | 78.1% |
| Cellular Data Only | 354 | 12.1% |
| Satellite Internet | 305 | 10.4% |
| No Internet | 64 | 2.2% |
| Total | 2,918 | 100.0% |
Iowa Colony Summary
Colony, Texas is a small unincorporated community located in Brazoria County, Texas. It is situated about 25 miles south of Houston and is part of the Houston–The Woodlands–Sugar Land metropolitan area. The population of Colony was estimated to be around 1,000 in 2020.
History
Colony was founded in 1891 by a group of settlers from the nearby town of Angleton. The settlers were looking for a place to settle and start a new life. The town was named after the colony of Angleton, which was established in 1891. The settlers built a school, a church, and a post office. The first postmaster was William H. Smith.
The town grew slowly but steadily over the years. In the early 1900s, the town had a population of around 200 people. The town was home to a variety of businesses, including a general store, a blacksmith shop, and a cotton gin.
In the 1920s, the town experienced a period of growth. The population increased to around 500 people and the town had a variety of businesses, including a bank, a hotel, and a movie theater.
In the 1940s, the town experienced a period of decline. The population decreased to around 300 people and many of the businesses closed.
In the 1950s, the town experienced a period of growth again. The population increased to around 500 people and the town had a variety of businesses, including a grocery store, a hardware store, and a gas station.
In the 1960s, the town experienced a period of decline again. The population decreased to around 300 people and many of the businesses closed.
In the 1970s, the town experienced a period of growth again. The population increased to around 500 people and the town had a variety of businesses, including a grocery store, a hardware store, and a gas station.
In the 1980s, the town experienced a period of decline again. The population decreased to around 300 people and many of the businesses closed.
In the 1990s, the town experienced a period of growth again. The population increased to around 500 people and the town had a variety of businesses, including a grocery store, a hardware store, and a gas station.
Geography
Colony is located in Brazoria County, Texas. It is situated about 25 miles south of Houston and is part of the Houston–The Woodlands–Sugar Land metropolitan area. The town is located on the banks of the San Bernard River. The town is surrounded by farmland and is home to a variety of wildlife, including deer, wild hogs, and birds.
Economy
The economy of Colony is largely based on agriculture. The town is home to a variety of farms, including cattle, poultry, and vegetable farms. The town is also home to a variety of businesses, including a grocery store, a hardware store, and a gas station.
Demographics
The population of Colony was estimated to be around 1,000 in 2020. The town is predominantly white, with around 90% of the population being white. The remaining 10% of the population is made up of African Americans, Hispanics, and other ethnicities. The median household income in Colony is around $50,000. The town has a low unemployment rate and a high rate of homeownership.
Common Questions
What is Per Capita Income in Iowa Colony?
Per Capita income in Iowa Colony is $44,521.
What is the Median Family Income in Iowa Colony?
Median Family Income in Iowa Colony is $110,125.
What is the Median Household income in Iowa Colony?
Median Household Income in Iowa Colony is $110,000.
What is Income or Wage Gap in Iowa Colony?
Income or Wage Gap in Iowa Colony is 39.0%.
Women in Iowa Colony earn 61.0 cents for every dollar earned by a man.
What is Inequality or Gini Index in Iowa Colony?
Inequality or Gini Index in Iowa Colony is 0.36.
What is the Total Population of Iowa Colony?
Total Population of Iowa Colony is 9,500.
What is the Total Male Population of Iowa Colony?
Total Male Population of Iowa Colony is 4,879.
What is the Total Female Population of Iowa Colony?
Total Female Population of Iowa Colony is 4,621.
What is the Ratio of Males per 100 Females in Iowa Colony?
There are 105.58 Males per 100 Females in Iowa Colony.
What is the Ratio of Females per 100 Males in Iowa Colony?
There are 94.71 Females per 100 Males in Iowa Colony.
What is the Median Population Age in Iowa Colony?
Median Population Age in Iowa Colony is 33.1 Years.
What is the Average Family Size in Iowa Colony
Average Family Size in Iowa Colony is 3.6 People.
What is the Average Household Size in Iowa Colony
Average Household Size in Iowa Colony is 3.3 People.
How Large is the Labor Force in Iowa Colony?
There are 4,992 People in the Labor Forcein in Iowa Colony.
What is the Percentage of People in the Labor Force in Iowa Colony?
72.7% of People are in the Labor Force in Iowa Colony.
What is the Unemployment Rate in Iowa Colony?
Unemployment Rate in Iowa Colony is 7.6%.