South Miami Heights, FL Map & Demographics
South Miami Heights Map
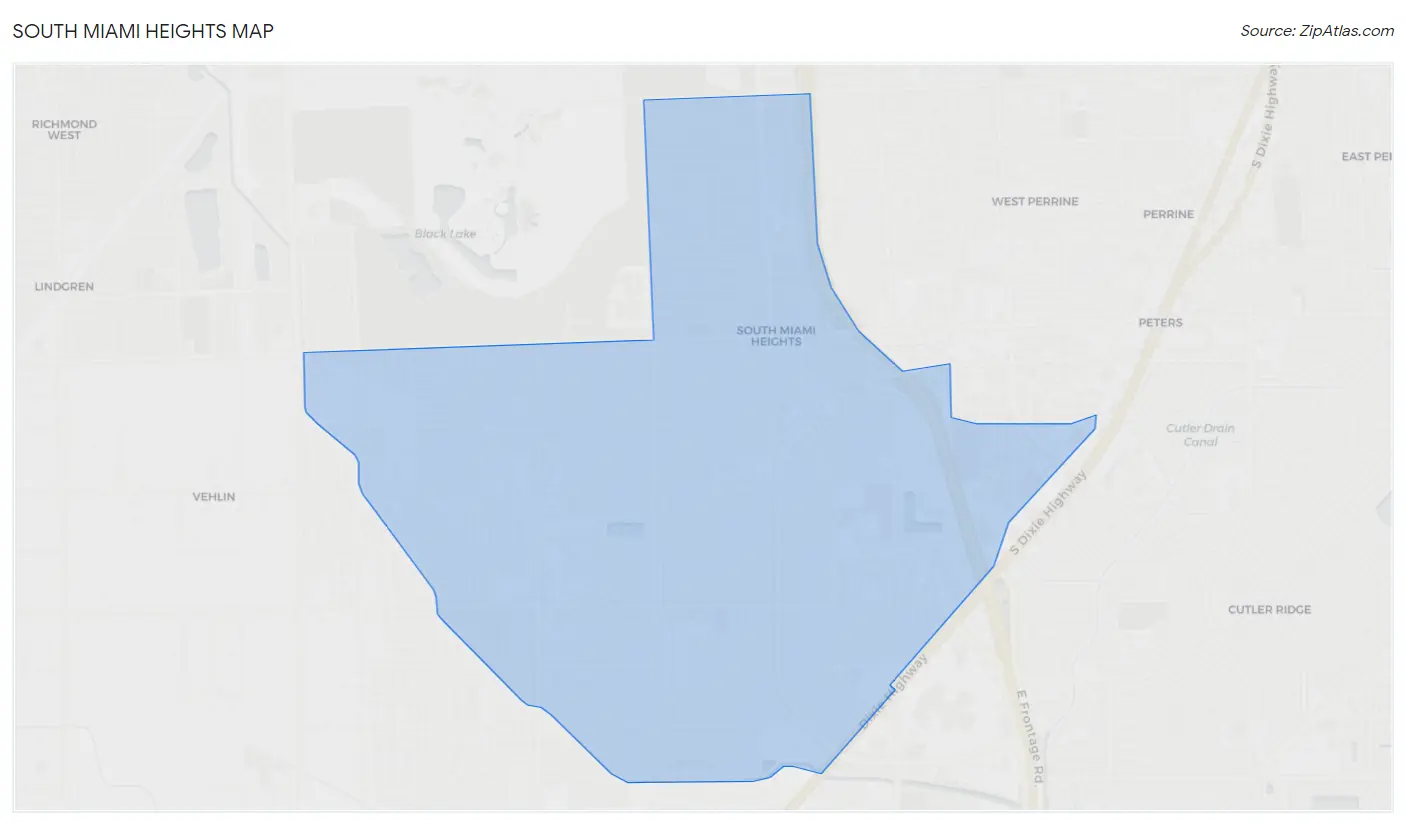
South Miami Heights Overview
$25,089
PER CAPITA INCOME
$68,835
AVG FAMILY INCOME
$59,946
AVG HOUSEHOLD INCOME
20.6%
WAGE / INCOME GAP [ % ]
79.4¢/ $1
WAGE / INCOME GAP [ $ ]
$9,045
FAMILY INCOME DEFICIT
0.46
INEQUALITY / GINI INDEX
35,705
TOTAL POPULATION
18,350
MALE POPULATION
17,355
FEMALE POPULATION
105.73
MALES / 100 FEMALES
94.58
FEMALES / 100 MALES
42.5
MEDIAN AGE
3.5
AVG FAMILY SIZE
3.1
AVG HOUSEHOLD SIZE
18,554
LABOR FORCE [ PEOPLE ]
62.8%
PERCENT IN LABOR FORCE
5.9%
UNEMPLOYMENT RATE
Income in South Miami Heights
Income Overview in South Miami Heights
Per Capita Income in South Miami Heights is $25,089, while median incomes of families and households are $68,835 and $59,946 respectively.
| Characteristic | Number | Measure |
| Per Capita Income | 35,705 | $25,089 |
| Median Family Income | 8,652 | $68,835 |
| Mean Family Income | 8,652 | $83,049 |
| Median Household Income | 11,405 | $59,946 |
| Mean Household Income | 11,405 | $73,937 |
| Income Deficit | 8,652 | $9,045 |
| Wage / Income Gap (%) | 35,705 | 20.60% |
| Wage / Income Gap ($) | 35,705 | 79.40¢ per $1 |
| Gini / Inequality Index | 35,705 | 0.46 |
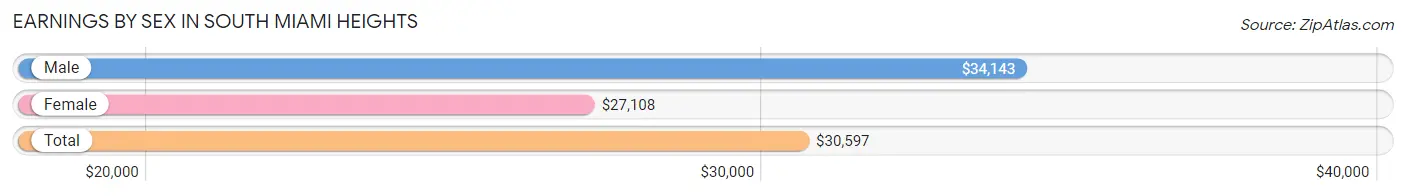
Earnings by Sex in South Miami Heights
Average Earnings in South Miami Heights are $30,597, $34,143 for men and $27,108 for women, a difference of 20.6%.
| Sex | Number | Average Earnings |
| Male | 10,006 (54.0%) | $34,143 |
| Female | 8,521 (46.0%) | $27,108 |
| Total | 18,527 (100.0%) | $30,597 |
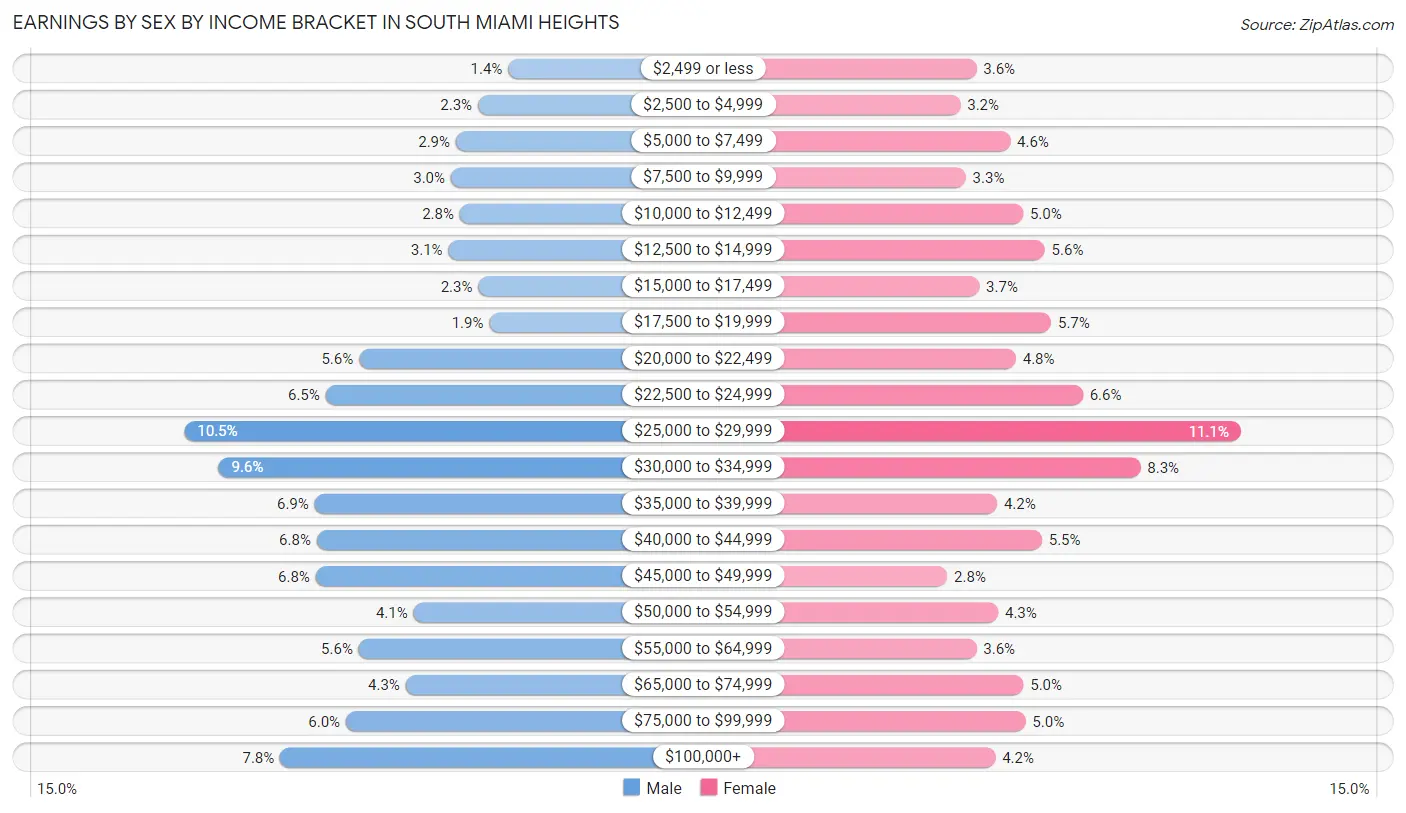
Earnings by Sex by Income Bracket in South Miami Heights
The most common earnings brackets in South Miami Heights are $25,000 to $29,999 for men (1,052 | 10.5%) and $25,000 to $29,999 for women (943 | 11.1%).
| Income | Male | Female |
| $2,499 or less | 141 (1.4%) | 310 (3.6%) |
| $2,500 to $4,999 | 226 (2.3%) | 272 (3.2%) |
| $5,000 to $7,499 | 288 (2.9%) | 391 (4.6%) |
| $7,500 to $9,999 | 302 (3.0%) | 285 (3.3%) |
| $10,000 to $12,499 | 277 (2.8%) | 422 (5.0%) |
| $12,500 to $14,999 | 309 (3.1%) | 474 (5.6%) |
| $15,000 to $17,499 | 225 (2.2%) | 317 (3.7%) |
| $17,500 to $19,999 | 194 (1.9%) | 489 (5.7%) |
| $20,000 to $22,499 | 560 (5.6%) | 405 (4.8%) |
| $22,500 to $24,999 | 654 (6.5%) | 565 (6.6%) |
| $25,000 to $29,999 | 1,052 (10.5%) | 943 (11.1%) |
| $30,000 to $34,999 | 956 (9.6%) | 703 (8.3%) |
| $35,000 to $39,999 | 685 (6.9%) | 360 (4.2%) |
| $40,000 to $44,999 | 679 (6.8%) | 467 (5.5%) |
| $45,000 to $49,999 | 682 (6.8%) | 240 (2.8%) |
| $50,000 to $54,999 | 407 (4.1%) | 362 (4.3%) |
| $55,000 to $64,999 | 561 (5.6%) | 310 (3.6%) |
| $65,000 to $74,999 | 429 (4.3%) | 423 (5.0%) |
| $75,000 to $99,999 | 597 (6.0%) | 428 (5.0%) |
| $100,000+ | 782 (7.8%) | 355 (4.2%) |
| Total | 10,006 (100.0%) | 8,521 (100.0%) |
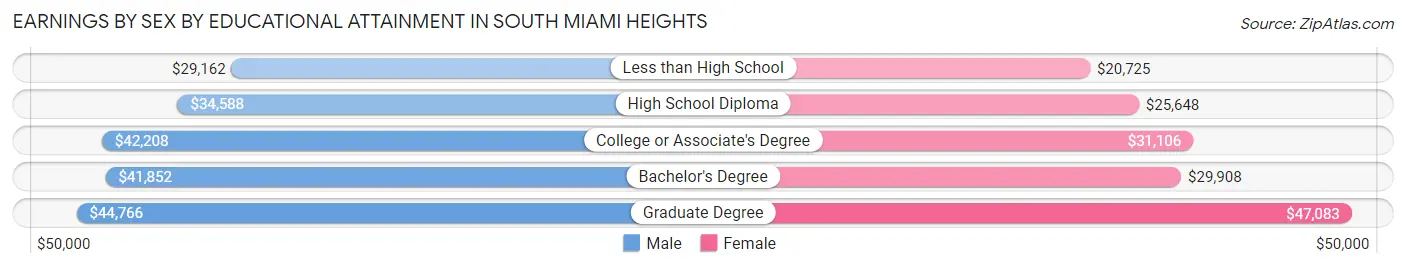
Earnings by Sex by Educational Attainment in South Miami Heights
Average earnings in South Miami Heights are $36,523 for men and $28,447 for women, a difference of 22.1%. Men with an educational attainment of graduate degree enjoy the highest average annual earnings of $44,766, while those with less than high school education earn the least with $29,162. Women with an educational attainment of graduate degree earn the most with the average annual earnings of $47,083, while those with less than high school education have the smallest earnings of $20,725.
| Educational Attainment | Male Income | Female Income |
| Less than High School | $29,162 | $20,725 |
| High School Diploma | $34,588 | $25,648 |
| College or Associate's Degree | $42,208 | $31,106 |
| Bachelor's Degree | $41,852 | $29,908 |
| Graduate Degree | $44,766 | $47,083 |
| Total | $36,523 | $28,447 |
Family Income in South Miami Heights
Family Income Brackets in South Miami Heights
According to the South Miami Heights family income data, there are 1,505 families falling into the $100,000 to $149,999 income range, which is the most common income bracket and makes up 17.4% of all families. Conversely, the less than $10,000 income bracket is the least frequent group with only 355 families (4.1%) belonging to this category.
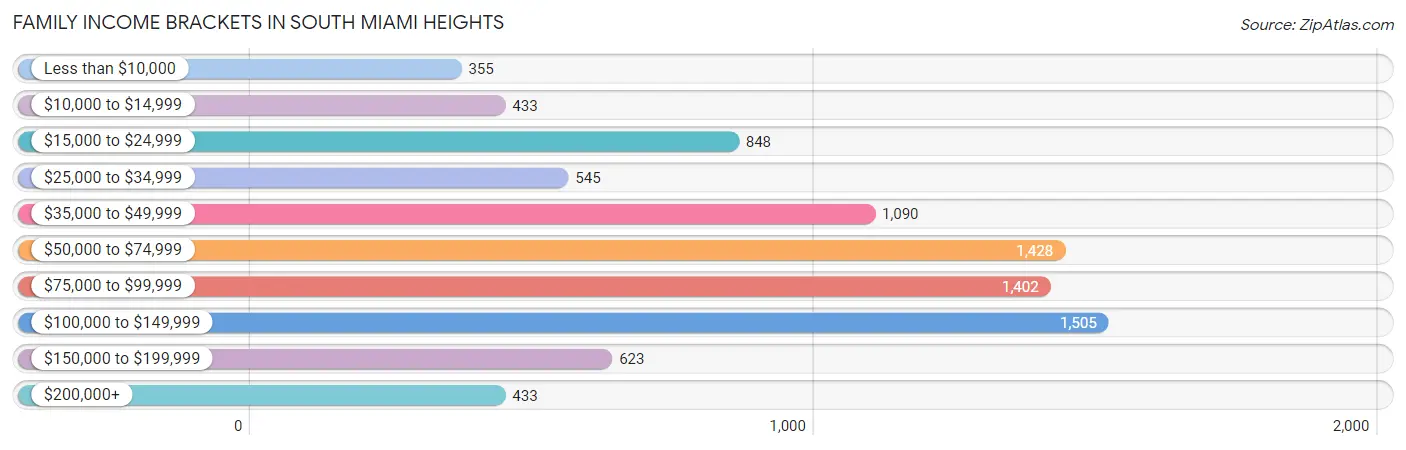
| Income Bracket | # Families | % Families |
| Less than $10,000 | 355 | 4.1% |
| $10,000 to $14,999 | 433 | 5.0% |
| $15,000 to $24,999 | 848 | 9.8% |
| $25,000 to $34,999 | 545 | 6.3% |
| $35,000 to $49,999 | 1,090 | 12.6% |
| $50,000 to $74,999 | 1,428 | 16.5% |
| $75,000 to $99,999 | 1,402 | 16.2% |
| $100,000 to $149,999 | 1,505 | 17.4% |
| $150,000 to $199,999 | 623 | 7.2% |
| $200,000+ | 433 | 5.0% |
Family Income by Famaliy Size in South Miami Heights
7+ person families (128 | 1.5%) account for the highest median family income in South Miami Heights with $117,647 per family, while 4-person families (1,704 | 19.7%) have the highest median income of $23,333 per family member.
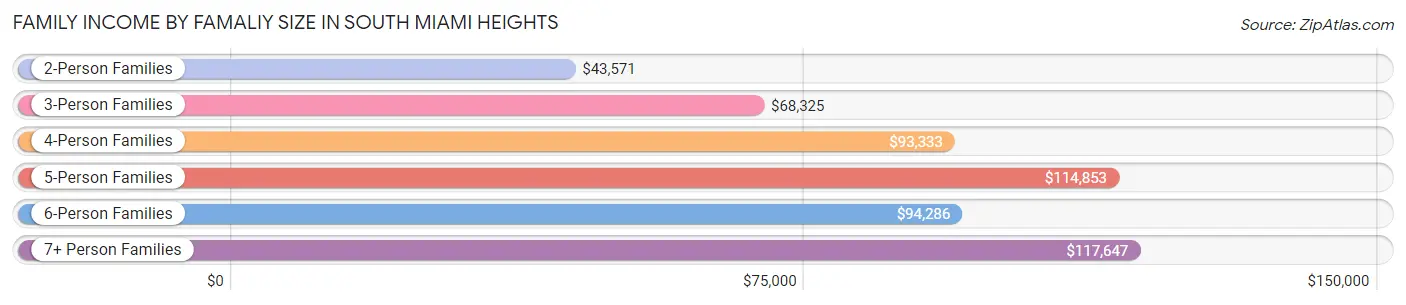
| Income Bracket | # Families | Median Income |
| 2-Person Families | 3,234 (37.4%) | $43,571 |
| 3-Person Families | 2,266 (26.2%) | $68,325 |
| 4-Person Families | 1,704 (19.7%) | $93,333 |
| 5-Person Families | 1,006 (11.6%) | $114,853 |
| 6-Person Families | 314 (3.6%) | $94,286 |
| 7+ Person Families | 128 (1.5%) | $117,647 |
| Total | 8,652 (100.0%) | $68,835 |
Family Income by Number of Earners in South Miami Heights
The median family income in South Miami Heights is $68,835, with families comprising 3+ earners (1,604) having the highest median family income of $128,007, while families with no earners (1,087) have the lowest median family income of $20,625, accounting for 18.5% and 12.6% of families, respectively.
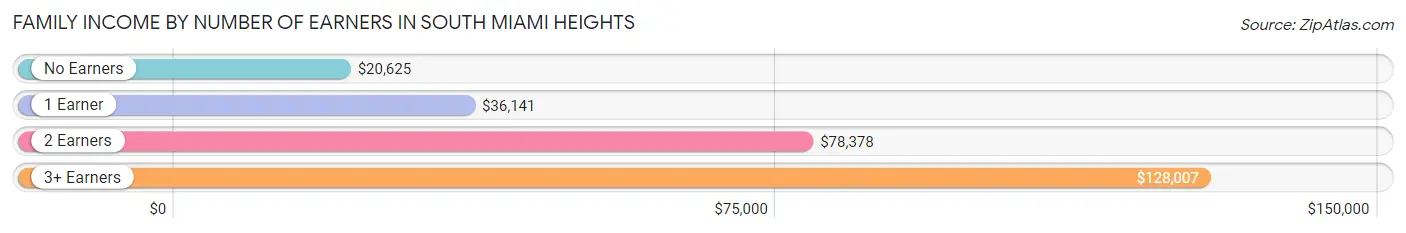
| Number of Earners | # Families | Median Income |
| No Earners | 1,087 (12.6%) | $20,625 |
| 1 Earner | 2,593 (30.0%) | $36,141 |
| 2 Earners | 3,368 (38.9%) | $78,378 |
| 3+ Earners | 1,604 (18.5%) | $128,007 |
| Total | 8,652 (100.0%) | $68,835 |
Household Income in South Miami Heights
Household Income Brackets in South Miami Heights
With 1,722 households falling in the category, the $100,000 to $149,999 income range is the most frequent in South Miami Heights, accounting for 15.1% of all households. In contrast, only 468 households (4.1%) fall into the $200,000+ income bracket, making it the least populous group.
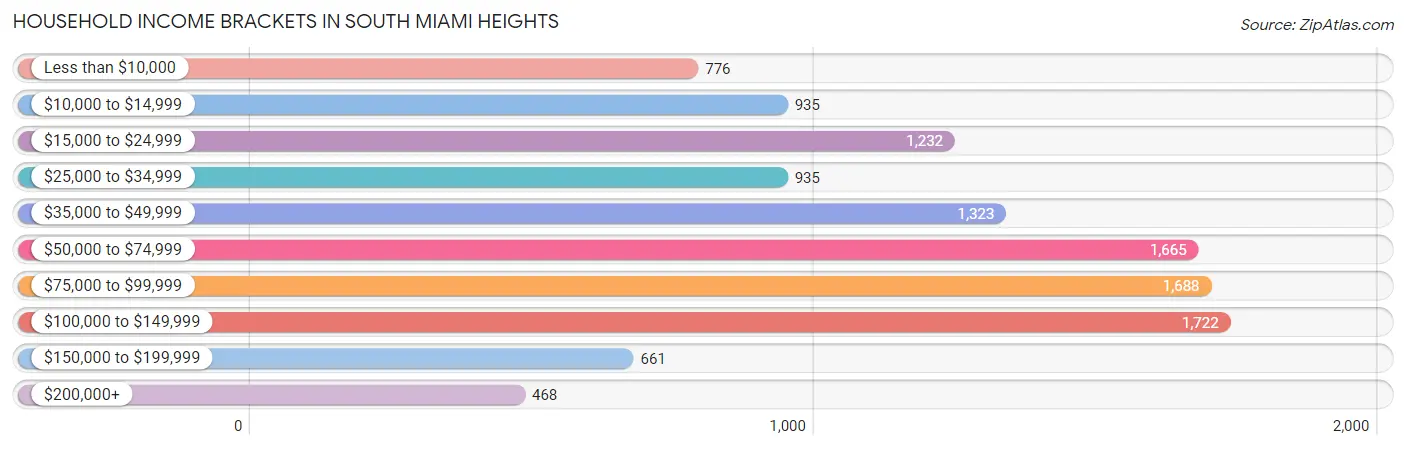
| Income Bracket | # Households | % Households |
| Less than $10,000 | 776 | 6.8% |
| $10,000 to $14,999 | 935 | 8.2% |
| $15,000 to $24,999 | 1,232 | 10.8% |
| $25,000 to $34,999 | 935 | 8.2% |
| $35,000 to $49,999 | 1,323 | 11.6% |
| $50,000 to $74,999 | 1,665 | 14.6% |
| $75,000 to $99,999 | 1,688 | 14.8% |
| $100,000 to $149,999 | 1,722 | 15.1% |
| $150,000 to $199,999 | 661 | 5.8% |
| $200,000+ | 468 | 4.1% |
Household Income by Householder Age in South Miami Heights
The median household income in South Miami Heights is $59,946, with the highest median household income of $73,160 found in the 45 to 64 years age bracket for the primary householder. A total of 5,207 households (45.7%) fall into this category. Meanwhile, the 15 to 24 years age bracket for the primary householder has the lowest median household income of $29,914, with 68 households (0.6%) in this group.
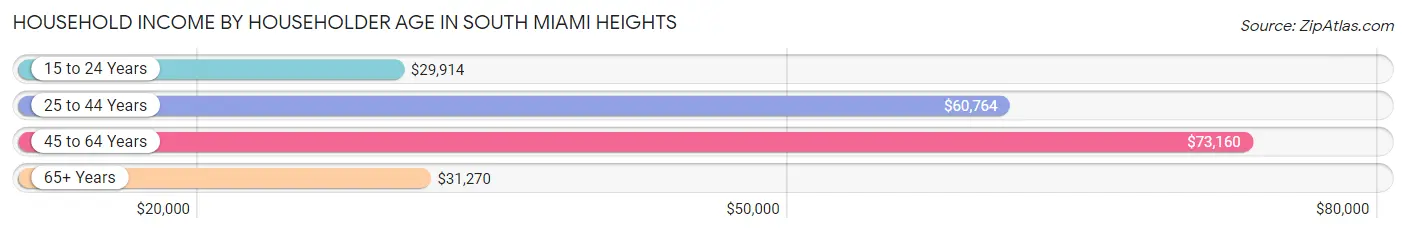
| Income Bracket | # Households | Median Income |
| 15 to 24 Years | 68 (0.6%) | $29,914 |
| 25 to 44 Years | 2,886 (25.3%) | $60,764 |
| 45 to 64 Years | 5,207 (45.7%) | $73,160 |
| 65+ Years | 3,244 (28.4%) | $31,270 |
| Total | 11,405 (100.0%) | $59,946 |
Poverty in South Miami Heights
Income Below Poverty by Sex and Age in South Miami Heights
With 16.3% poverty level for males and 20.3% for females among the residents of South Miami Heights, 16 and 17 year old males and under 5 year old females are the most vulnerable to poverty, with 127 males (33.2%) and 224 females (34.6%) in their respective age groups living below the poverty level.
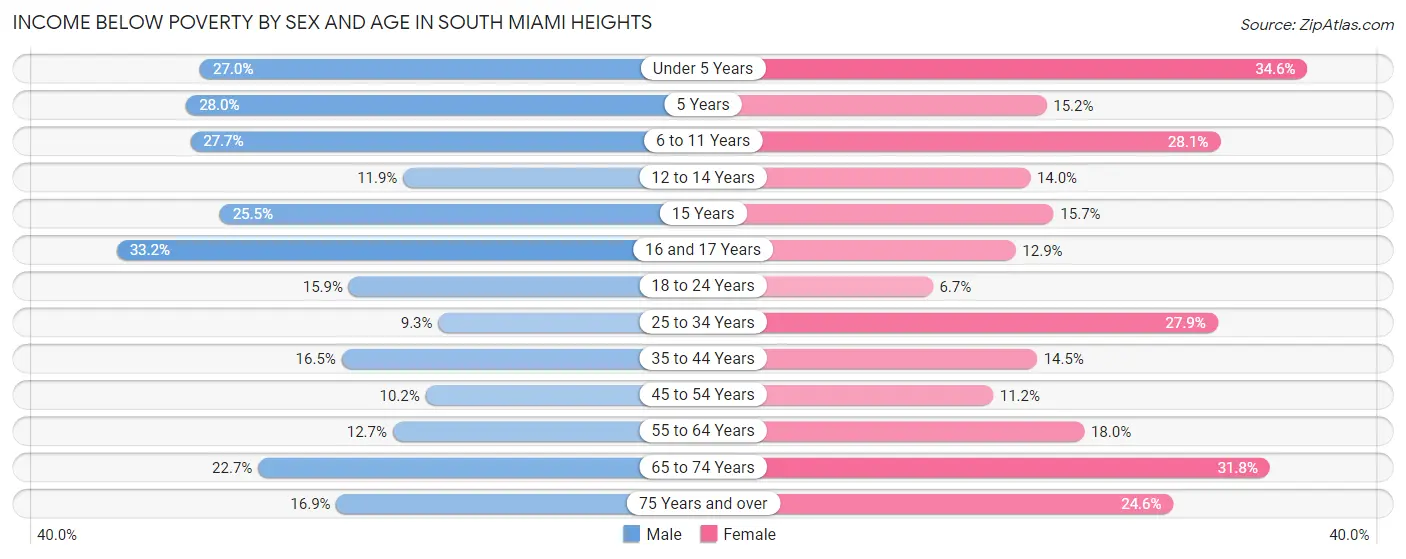
| Age Bracket | Male | Female |
| Under 5 Years | 288 (27.0%) | 224 (34.6%) |
| 5 Years | 35 (28.0%) | 39 (15.2%) |
| 6 to 11 Years | 313 (27.7%) | 332 (28.1%) |
| 12 to 14 Years | 109 (11.9%) | 56 (14.0%) |
| 15 Years | 50 (25.5%) | 22 (15.7%) |
| 16 and 17 Years | 127 (33.2%) | 62 (12.9%) |
| 18 to 24 Years | 262 (15.9%) | 76 (6.7%) |
| 25 to 34 Years | 208 (9.3%) | 684 (27.9%) |
| 35 to 44 Years | 390 (16.5%) | 275 (14.5%) |
| 45 to 54 Years | 271 (10.2%) | 303 (11.2%) |
| 55 to 64 Years | 349 (12.7%) | 452 (18.0%) |
| 65 to 74 Years | 414 (22.7%) | 577 (31.8%) |
| 75 Years and over | 153 (16.9%) | 380 (24.6%) |
| Total | 2,969 (16.3%) | 3,482 (20.3%) |
Income Above Poverty by Sex and Age in South Miami Heights
According to the poverty statistics in South Miami Heights, males aged 25 to 34 years and females aged 18 to 24 years are the age groups that are most secure financially, with 90.7% of males and 93.3% of females in these age groups living above the poverty line.
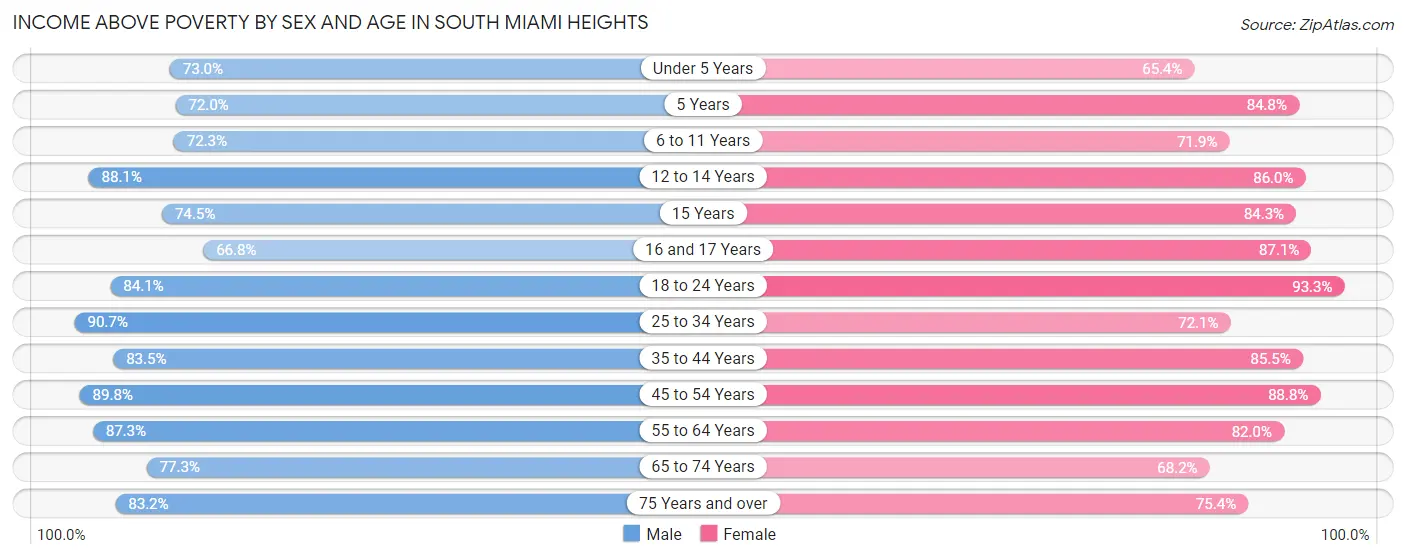
| Age Bracket | Male | Female |
| Under 5 Years | 780 (73.0%) | 424 (65.4%) |
| 5 Years | 90 (72.0%) | 218 (84.8%) |
| 6 to 11 Years | 817 (72.3%) | 850 (71.9%) |
| 12 to 14 Years | 808 (88.1%) | 345 (86.0%) |
| 15 Years | 146 (74.5%) | 118 (84.3%) |
| 16 and 17 Years | 256 (66.8%) | 419 (87.1%) |
| 18 to 24 Years | 1,383 (84.1%) | 1,054 (93.3%) |
| 25 to 34 Years | 2,034 (90.7%) | 1,768 (72.1%) |
| 35 to 44 Years | 1,980 (83.5%) | 1,625 (85.5%) |
| 45 to 54 Years | 2,378 (89.8%) | 2,401 (88.8%) |
| 55 to 64 Years | 2,408 (87.3%) | 2,062 (82.0%) |
| 65 to 74 Years | 1,413 (77.3%) | 1,239 (68.2%) |
| 75 Years and over | 755 (83.2%) | 1,164 (75.4%) |
| Total | 15,248 (83.7%) | 13,687 (79.7%) |
Income Below Poverty Among Married-Couple Families in South Miami Heights
The poverty statistics for married-couple families in South Miami Heights show that 7.9% or 446 of the total 5,636 families live below the poverty line. Families with 3 or 4 children have the highest poverty rate of 11.9%, comprising of 43 families. On the other hand, families with 1 or 2 children have the lowest poverty rate of 4.2%, which includes 80 families.
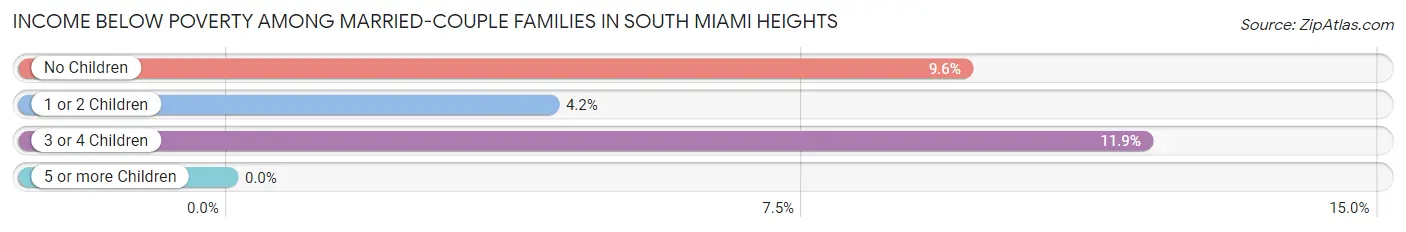
| Children | Above Poverty | Below Poverty |
| No Children | 3,044 (90.4%) | 323 (9.6%) |
| 1 or 2 Children | 1,829 (95.8%) | 80 (4.2%) |
| 3 or 4 Children | 317 (88.1%) | 43 (11.9%) |
| 5 or more Children | 0 (0.0%) | 0 (0.0%) |
| Total | 5,190 (92.1%) | 446 (7.9%) |
Income Below Poverty Among Single-Parent Households in South Miami Heights
According to the poverty data in South Miami Heights, 23.6% or 240 single-father households and 33.3% or 665 single-mother households are living below the poverty line. Among single-father households, those with 1 or 2 children have the highest poverty rate, with 240 households (42.5%) experiencing poverty. Likewise, among single-mother households, those with 3 or 4 children have the highest poverty rate, with 96 households (76.8%) falling below the poverty line.
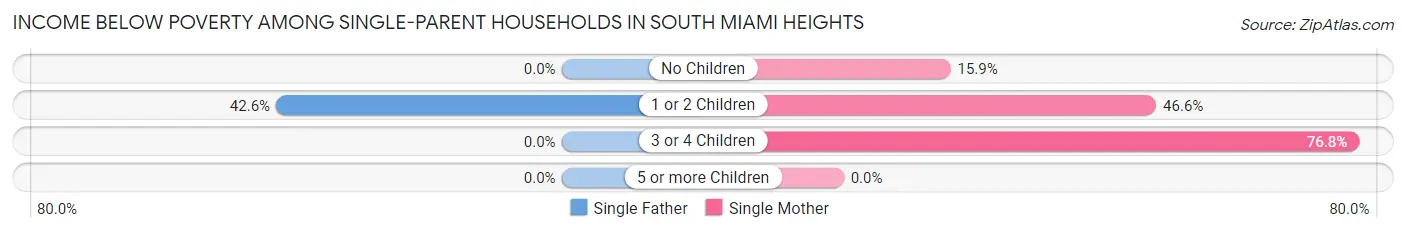
| Children | Single Father | Single Mother |
| No Children | 0 (0.0%) | 150 (15.9%) |
| 1 or 2 Children | 240 (42.5%) | 419 (46.6%) |
| 3 or 4 Children | 0 (0.0%) | 96 (76.8%) |
| 5 or more Children | 0 (0.0%) | 0 (0.0%) |
| Total | 240 (23.6%) | 665 (33.3%) |
Income Below Poverty Among Married-Couple vs Single-Parent Households in South Miami Heights
The poverty data for South Miami Heights shows that 446 of the married-couple family households (7.9%) and 905 of the single-parent households (30.0%) are living below the poverty level. Within the married-couple family households, those with 3 or 4 children have the highest poverty rate, with 43 households (11.9%) falling below the poverty line. Among the single-parent households, those with 3 or 4 children have the highest poverty rate, with 96 household (76.8%) living below poverty.
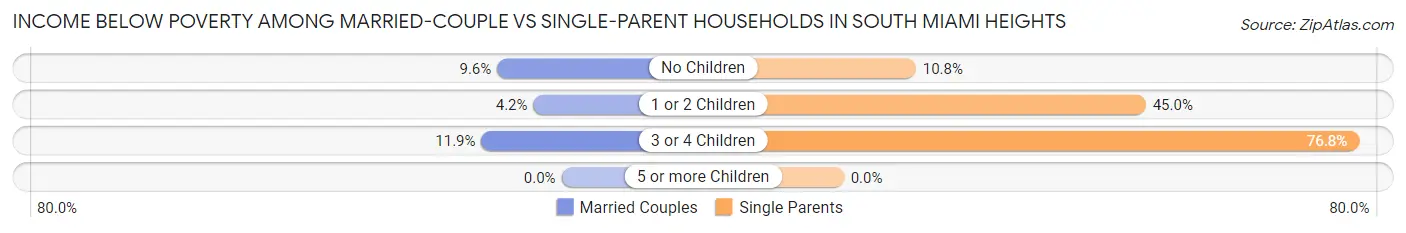
| Children | Married-Couple Families | Single-Parent Households |
| No Children | 323 (9.6%) | 150 (10.7%) |
| 1 or 2 Children | 80 (4.2%) | 659 (45.0%) |
| 3 or 4 Children | 43 (11.9%) | 96 (76.8%) |
| 5 or more Children | 0 (0.0%) | 0 (0.0%) |
| Total | 446 (7.9%) | 905 (30.0%) |
Race in South Miami Heights
The most populous races in South Miami Heights are Hispanic or Latino (26,547 | 74.4%), White / Caucasian (15,035 | 42.1%), and Two or more Races (11,112 | 31.1%).
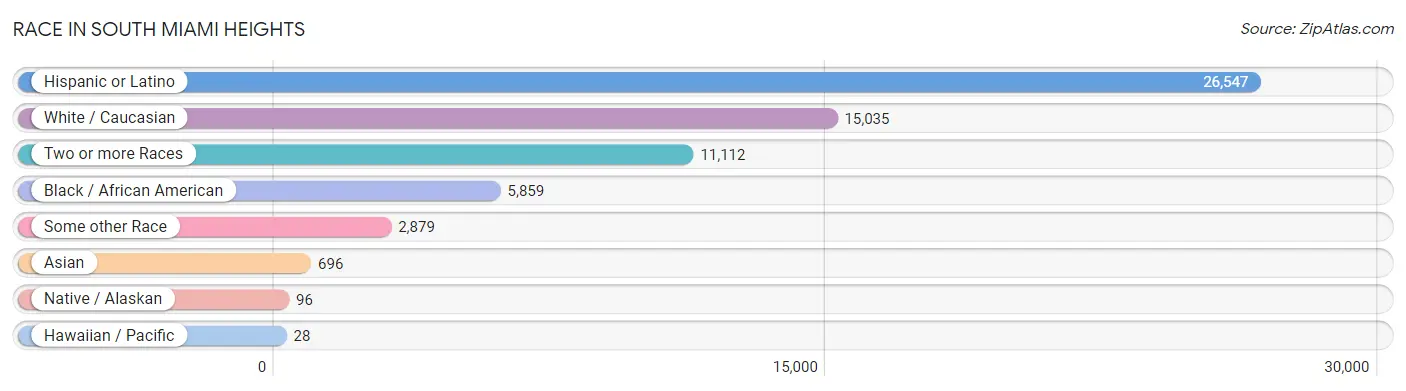
| Race | # Population | % Population |
| Asian | 696 | 1.9% |
| Black / African American | 5,859 | 16.4% |
| Hawaiian / Pacific | 28 | 0.1% |
| Hispanic or Latino | 26,547 | 74.4% |
| Native / Alaskan | 96 | 0.3% |
| White / Caucasian | 15,035 | 42.1% |
| Two or more Races | 11,112 | 31.1% |
| Some other Race | 2,879 | 8.1% |
| Total | 35,705 | 100.0% |
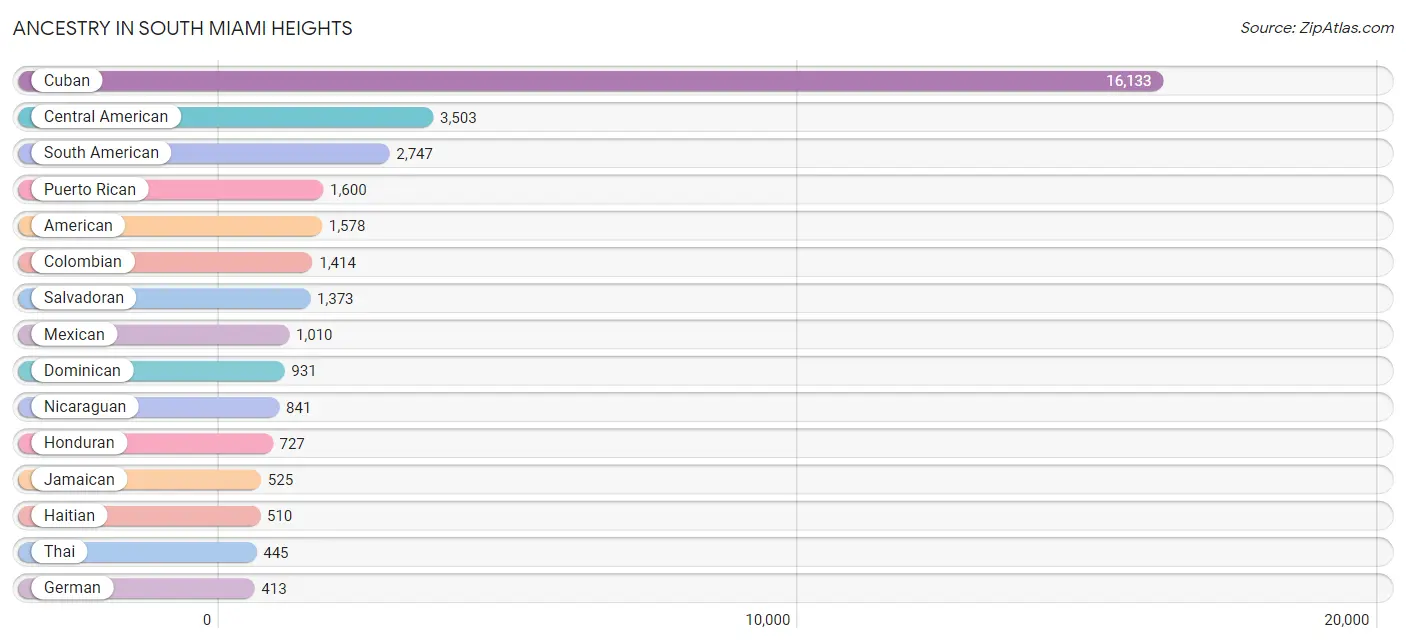
Ancestry in South Miami Heights
The most populous ancestries reported in South Miami Heights are Cuban (16,133 | 45.2%), Central American (3,503 | 9.8%), South American (2,747 | 7.7%), Puerto Rican (1,600 | 4.5%), and American (1,578 | 4.4%), together accounting for 71.6% of all South Miami Heights residents.
| Ancestry | # Population | % Population |
| African | 154 | 0.4% |
| American | 1,578 | 4.4% |
| Arab | 45 | 0.1% |
| Argentinean | 352 | 1.0% |
| Armenian | 7 | 0.0% |
| Bahamian | 44 | 0.1% |
| Belizean | 32 | 0.1% |
| Bhutanese | 11 | 0.0% |
| Bolivian | 38 | 0.1% |
| Brazilian | 91 | 0.3% |
| British | 9 | 0.0% |
| Central American | 3,503 | 9.8% |
| Cherokee | 22 | 0.1% |
| Chilean | 101 | 0.3% |
| Colombian | 1,414 | 4.0% |
| Costa Rican | 19 | 0.1% |
| Cuban | 16,133 | 45.2% |
| Danish | 22 | 0.1% |
| Dominican | 931 | 2.6% |
| Dutch | 17 | 0.1% |
| Ecuadorian | 246 | 0.7% |
| English | 161 | 0.4% |
| European | 69 | 0.2% |
| French | 128 | 0.4% |
| French American Indian | 33 | 0.1% |
| French Canadian | 31 | 0.1% |
| German | 413 | 1.2% |
| Greek | 36 | 0.1% |
| Guamanian / Chamorro | 28 | 0.1% |
| Guatemalan | 400 | 1.1% |
| Guyanese | 250 | 0.7% |
| Haitian | 510 | 1.4% |
| Honduran | 727 | 2.0% |
| Hungarian | 14 | 0.0% |
| Indian (Asian) | 40 | 0.1% |
| Irish | 307 | 0.9% |
| Italian | 395 | 1.1% |
| Jamaican | 525 | 1.5% |
| Korean | 374 | 1.1% |
| Lebanese | 38 | 0.1% |
| Lithuanian | 7 | 0.0% |
| Mexican | 1,010 | 2.8% |
| Mexican American Indian | 63 | 0.2% |
| Moroccan | 7 | 0.0% |
| Nicaraguan | 841 | 2.4% |
| Norwegian | 64 | 0.2% |
| Panamanian | 92 | 0.3% |
| Peruvian | 227 | 0.6% |
| Polish | 35 | 0.1% |
| Portuguese | 51 | 0.1% |
| Puerto Rican | 1,600 | 4.5% |
| Russian | 62 | 0.2% |
| Salvadoran | 1,373 | 3.8% |
| Scandinavian | 27 | 0.1% |
| Scotch-Irish | 72 | 0.2% |
| Scottish | 50 | 0.1% |
| South African | 15 | 0.0% |
| South American | 2,747 | 7.7% |
| Spaniard | 71 | 0.2% |
| Spanish | 64 | 0.2% |
| Sri Lankan | 15 | 0.0% |
| Subsaharan African | 183 | 0.5% |
| Swedish | 8 | 0.0% |
| Thai | 445 | 1.3% |
| Trinidadian and Tobagonian | 94 | 0.3% |
| Turkish | 2 | 0.0% |
| Uruguayan | 56 | 0.2% |
| Venezuelan | 309 | 0.9% |
| West Indian | 101 | 0.3% |
| Yugoslavian | 9 | 0.0% | View All 70 Rows |
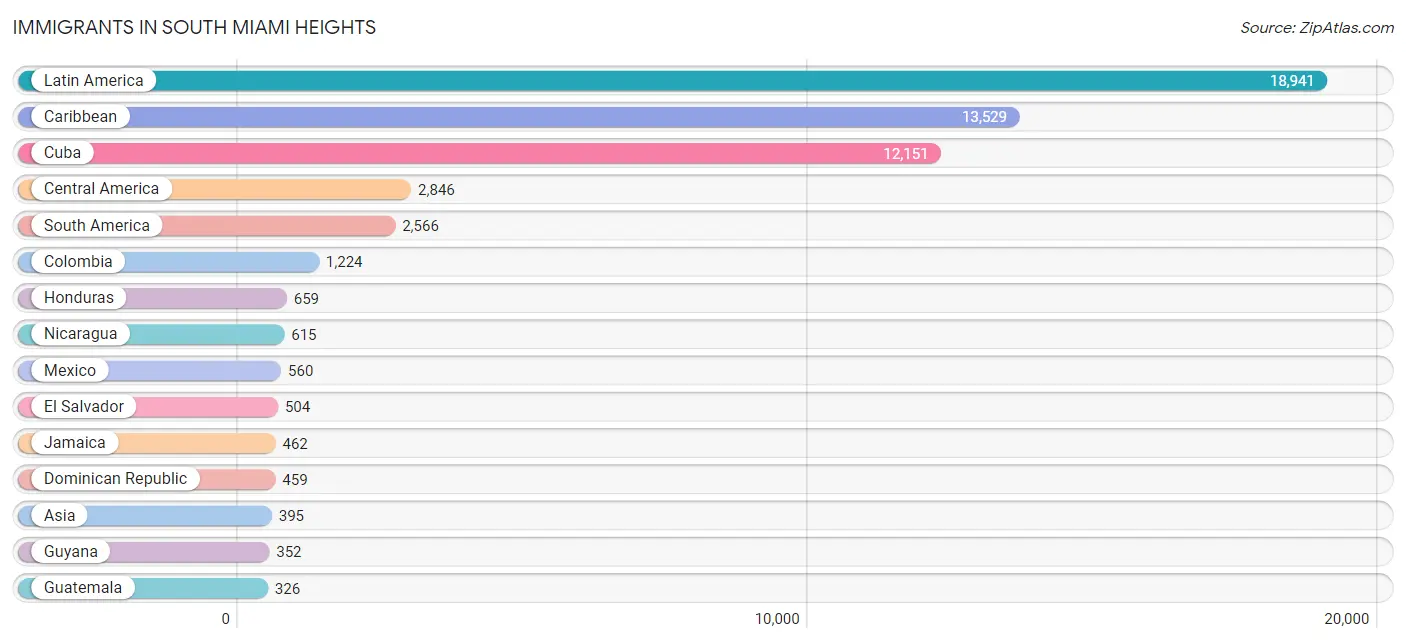
Immigrants in South Miami Heights
The most numerous immigrant groups reported in South Miami Heights came from Latin America (18,941 | 53.0%), Caribbean (13,529 | 37.9%), Cuba (12,151 | 34.0%), Central America (2,846 | 8.0%), and South America (2,566 | 7.2%), together accounting for 140.1% of all South Miami Heights residents.
| Immigration Origin | # Population | % Population |
| Argentina | 231 | 0.6% |
| Asia | 395 | 1.1% |
| Bahamas | 39 | 0.1% |
| Belize | 16 | 0.0% |
| Bolivia | 31 | 0.1% |
| Brazil | 32 | 0.1% |
| Canada | 30 | 0.1% |
| Caribbean | 13,529 | 37.9% |
| Central America | 2,846 | 8.0% |
| Chile | 66 | 0.2% |
| China | 16 | 0.0% |
| Colombia | 1,224 | 3.4% |
| Costa Rica | 23 | 0.1% |
| Cuba | 12,151 | 34.0% |
| Dominica | 66 | 0.2% |
| Dominican Republic | 459 | 1.3% |
| Eastern Asia | 16 | 0.0% |
| Ecuador | 141 | 0.4% |
| El Salvador | 504 | 1.4% |
| Europe | 129 | 0.4% |
| France | 24 | 0.1% |
| Germany | 6 | 0.0% |
| Guatemala | 326 | 0.9% |
| Guyana | 352 | 1.0% |
| Haiti | 214 | 0.6% |
| Honduras | 659 | 1.8% |
| Hong Kong | 16 | 0.0% |
| Iran | 31 | 0.1% |
| Jamaica | 462 | 1.3% |
| Latin America | 18,941 | 53.0% |
| Mexico | 560 | 1.6% |
| Nicaragua | 615 | 1.7% |
| Northern Europe | 22 | 0.1% |
| Norway | 22 | 0.1% |
| Pakistan | 47 | 0.1% |
| Panama | 92 | 0.3% |
| Peru | 183 | 0.5% |
| Philippines | 217 | 0.6% |
| South America | 2,566 | 7.2% |
| South Central Asia | 78 | 0.2% |
| South Eastern Asia | 301 | 0.8% |
| Southern Europe | 77 | 0.2% |
| Spain | 70 | 0.2% |
| Trinidad and Tobago | 138 | 0.4% |
| Uruguay | 78 | 0.2% |
| Venezuela | 224 | 0.6% |
| Vietnam | 84 | 0.2% |
| Western Europe | 30 | 0.1% | View All 48 Rows |
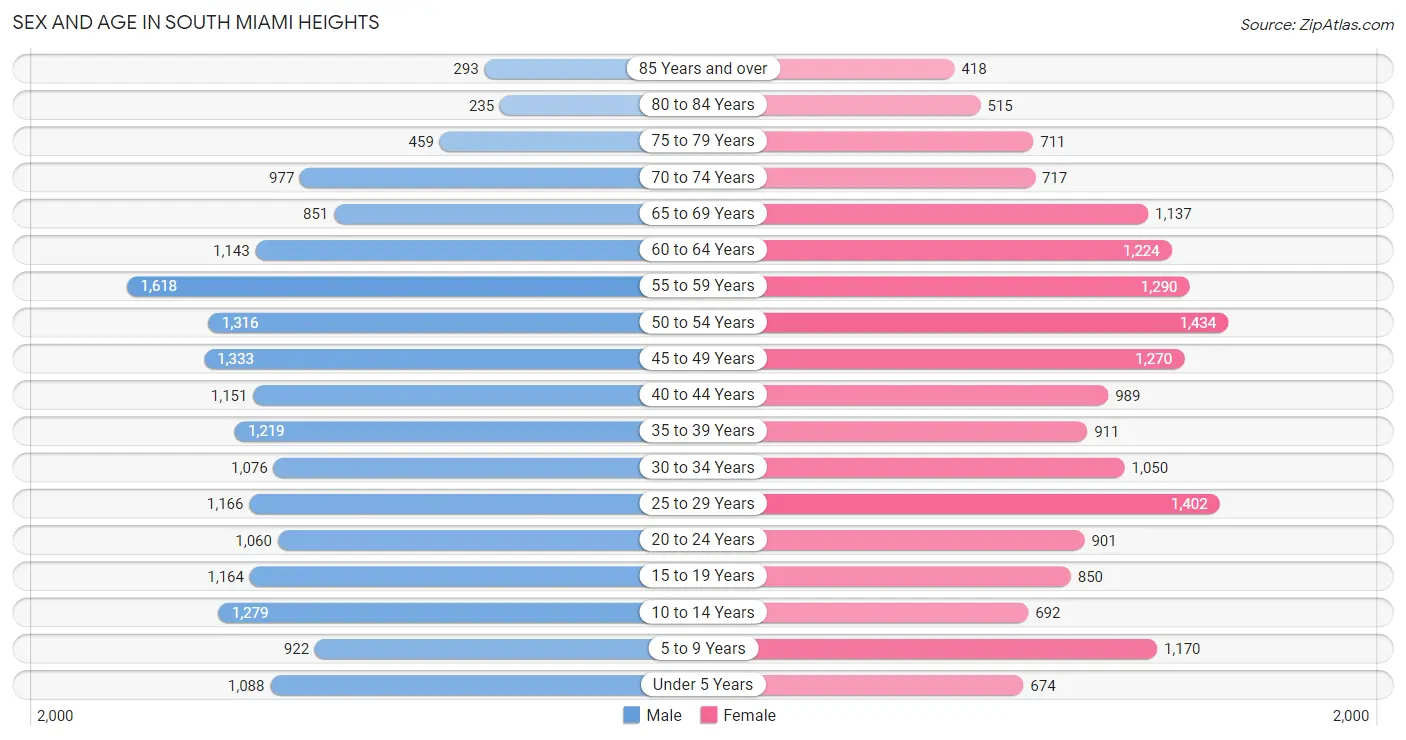
Sex and Age in South Miami Heights
Sex and Age in South Miami Heights
The most populous age groups in South Miami Heights are 55 to 59 Years (1,618 | 8.8%) for men and 50 to 54 Years (1,434 | 8.3%) for women.
| Age Bracket | Male | Female |
| Under 5 Years | 1,088 (5.9%) | 674 (3.9%) |
| 5 to 9 Years | 922 (5.0%) | 1,170 (6.7%) |
| 10 to 14 Years | 1,279 (7.0%) | 692 (4.0%) |
| 15 to 19 Years | 1,164 (6.3%) | 850 (4.9%) |
| 20 to 24 Years | 1,060 (5.8%) | 901 (5.2%) |
| 25 to 29 Years | 1,166 (6.4%) | 1,402 (8.1%) |
| 30 to 34 Years | 1,076 (5.9%) | 1,050 (6.0%) |
| 35 to 39 Years | 1,219 (6.6%) | 911 (5.2%) |
| 40 to 44 Years | 1,151 (6.3%) | 989 (5.7%) |
| 45 to 49 Years | 1,333 (7.3%) | 1,270 (7.3%) |
| 50 to 54 Years | 1,316 (7.2%) | 1,434 (8.3%) |
| 55 to 59 Years | 1,618 (8.8%) | 1,290 (7.4%) |
| 60 to 64 Years | 1,143 (6.2%) | 1,224 (7.0%) |
| 65 to 69 Years | 851 (4.6%) | 1,137 (6.6%) |
| 70 to 74 Years | 977 (5.3%) | 717 (4.1%) |
| 75 to 79 Years | 459 (2.5%) | 711 (4.1%) |
| 80 to 84 Years | 235 (1.3%) | 515 (3.0%) |
| 85 Years and over | 293 (1.6%) | 418 (2.4%) |
| Total | 18,350 (100.0%) | 17,355 (100.0%) |
Families and Households in South Miami Heights
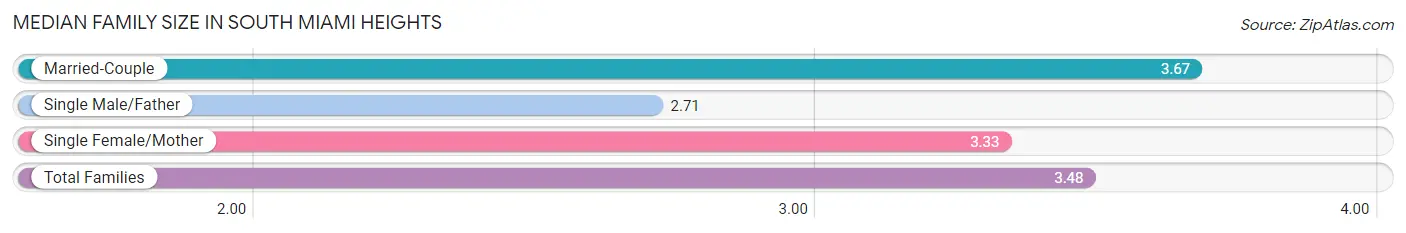
Median Family Size in South Miami Heights
The median family size in South Miami Heights is 3.48 persons per family, with married-couple families (5,636 | 65.1%) accounting for the largest median family size of 3.67 persons per family. On the other hand, single male/father families (1,017 | 11.7%) represent the smallest median family size with 2.71 persons per family.
| Family Type | # Families | Family Size |
| Married-Couple | 5,636 (65.1%) | 3.67 |
| Single Male/Father | 1,017 (11.7%) | 2.71 |
| Single Female/Mother | 1,999 (23.1%) | 3.33 |
| Total Families | 8,652 (100.0%) | 3.48 |
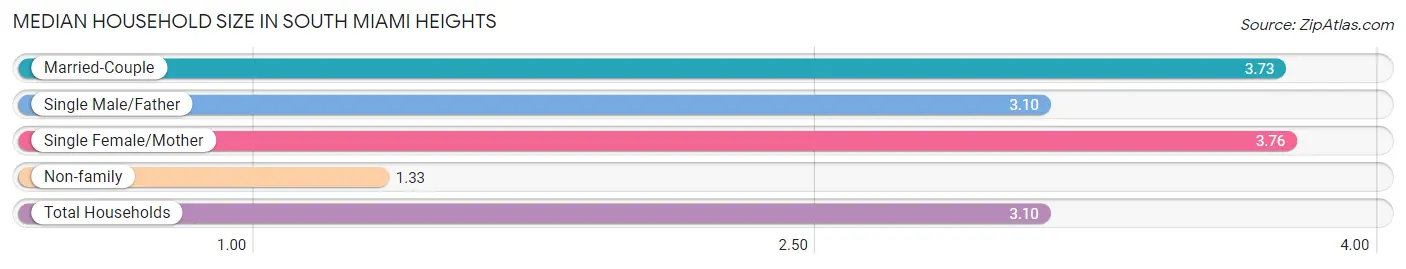
Median Household Size in South Miami Heights
The median household size in South Miami Heights is 3.10 persons per household, with single female/mother households (1,999 | 17.5%) accounting for the largest median household size of 3.76 persons per household. non-family households (2,753 | 24.1%) represent the smallest median household size with 1.33 persons per household.
| Household Type | # Households | Household Size |
| Married-Couple | 5,636 (49.4%) | 3.73 |
| Single Male/Father | 1,017 (8.9%) | 3.10 |
| Single Female/Mother | 1,999 (17.5%) | 3.76 |
| Non-family | 2,753 (24.1%) | 1.33 |
| Total Households | 11,405 (100.0%) | 3.10 |
Household Size by Marriage Status in South Miami Heights
Out of a total of 11,405 households in South Miami Heights, 8,652 (75.9%) are family households, while 2,753 (24.1%) are nonfamily households. The most numerous type of family households are 2-person households, comprising 2,659, and the most common type of nonfamily households are 1-person households, comprising 2,087.
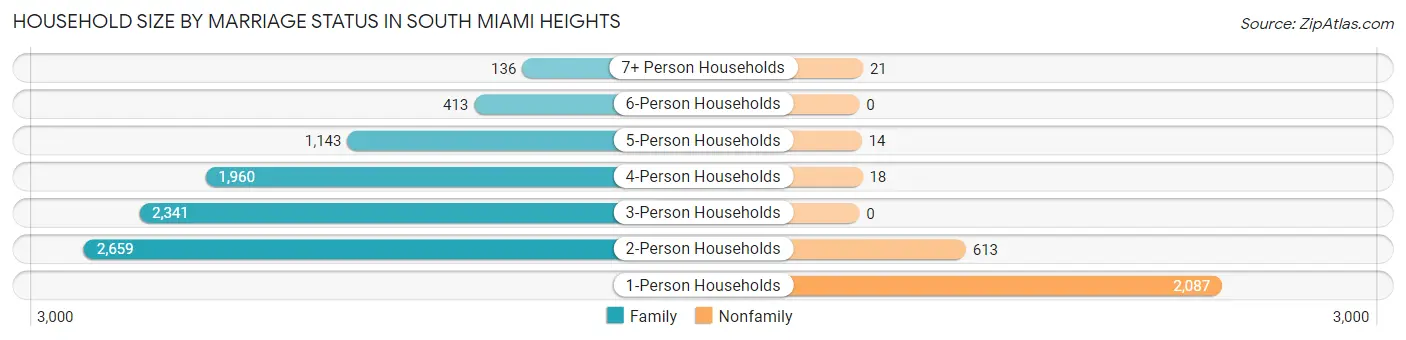
| Household Size | Family Households | Nonfamily Households |
| 1-Person Households | - | 2,087 (18.3%) |
| 2-Person Households | 2,659 (23.3%) | 613 (5.4%) |
| 3-Person Households | 2,341 (20.5%) | 0 (0.0%) |
| 4-Person Households | 1,960 (17.2%) | 18 (0.2%) |
| 5-Person Households | 1,143 (10.0%) | 14 (0.1%) |
| 6-Person Households | 413 (3.6%) | 0 (0.0%) |
| 7+ Person Households | 136 (1.2%) | 21 (0.2%) |
| Total | 8,652 (75.9%) | 2,753 (24.1%) |
Female Fertility in South Miami Heights
Fertility by Age in South Miami Heights
Average fertility rate in South Miami Heights is 23.0 births per 1,000 women. Women in the age bracket of 35 to 50 years have the highest fertility rate with 30.0 births per 1,000 women. Women in the age bracket of 35 to 50 years acount for 59.4% of all women with births.
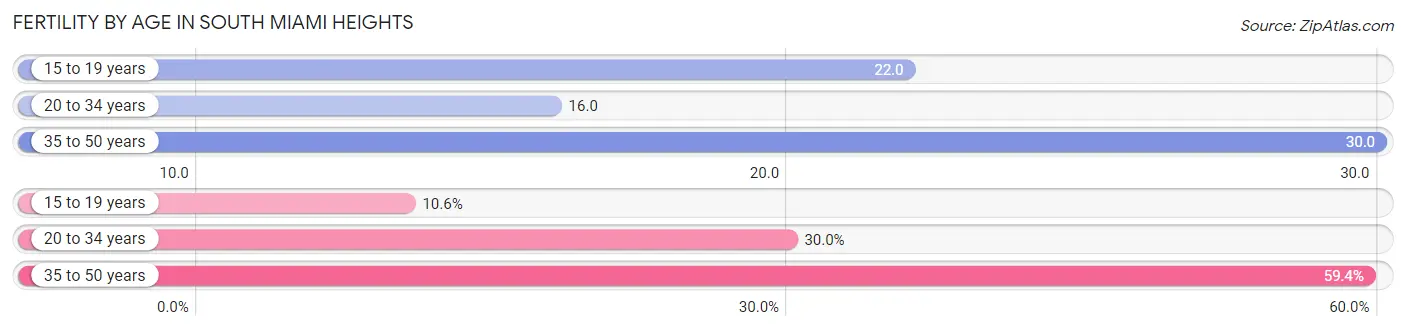
| Age Bracket | Women with Births | Births / 1,000 Women |
| 15 to 19 years | 19 (10.6%) | 22.0 |
| 20 to 34 years | 54 (30.0%) | 16.0 |
| 35 to 50 years | 107 (59.4%) | 30.0 |
| Total | 180 (100.0%) | 23.0 |
Fertility by Age by Marriage Status in South Miami Heights
68.9% of women with births (180) in South Miami Heights are married. The highest percentage of unmarried women with births falls into 15 to 19 years age bracket with 100.0% of them unmarried at the time of birth, while the lowest percentage of unmarried women with births belong to 35 to 50 years age bracket with 4.7% of them unmarried.
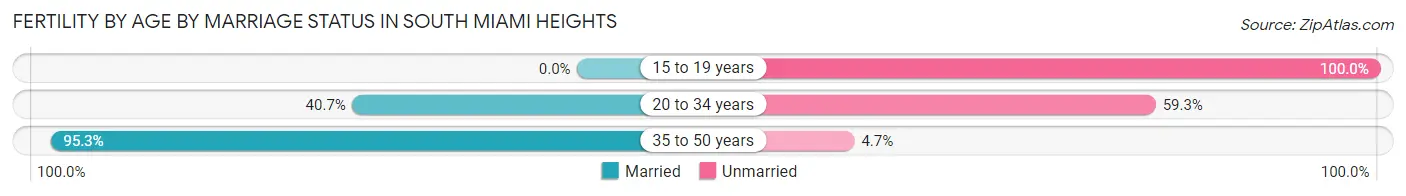
| Age Bracket | Married | Unmarried |
| 15 to 19 years | 0 (0.0%) | 19 (100.0%) |
| 20 to 34 years | 22 (40.7%) | 32 (59.3%) |
| 35 to 50 years | 102 (95.3%) | 5 (4.7%) |
| Total | 124 (68.9%) | 56 (31.1%) |
Fertility by Education in South Miami Heights
Average fertility rate in South Miami Heights is 23.0 births per 1,000 women. Women with the education attainment of graduate degree have the highest fertility rate of 48.0 births per 1,000 women, while women with the education attainment of bachelor's degree have the lowest fertility at 7.0 births per 1,000 women. Women with the education attainment of high school diploma represent 56.1% of all women with births.
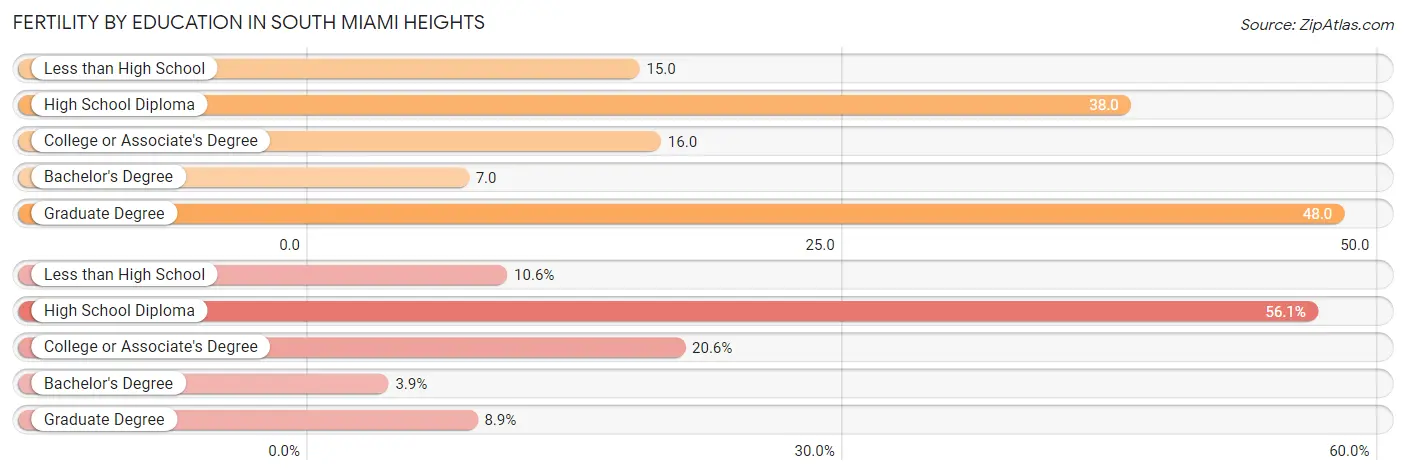
| Educational Attainment | Women with Births | Births / 1,000 Women |
| Less than High School | 19 (10.6%) | 15.0 |
| High School Diploma | 101 (56.1%) | 38.0 |
| College or Associate's Degree | 37 (20.6%) | 16.0 |
| Bachelor's Degree | 7 (3.9%) | 7.0 |
| Graduate Degree | 16 (8.9%) | 48.0 |
| Total | 180 (100.0%) | 23.0 |
Fertility by Education by Marriage Status in South Miami Heights
31.1% of women with births in South Miami Heights are unmarried. Women with the educational attainment of high school diploma are most likely to be married with 100.0% of them married at childbirth, while women with the educational attainment of less than high school are least likely to be married with 100.0% of them unmarried at childbirth.
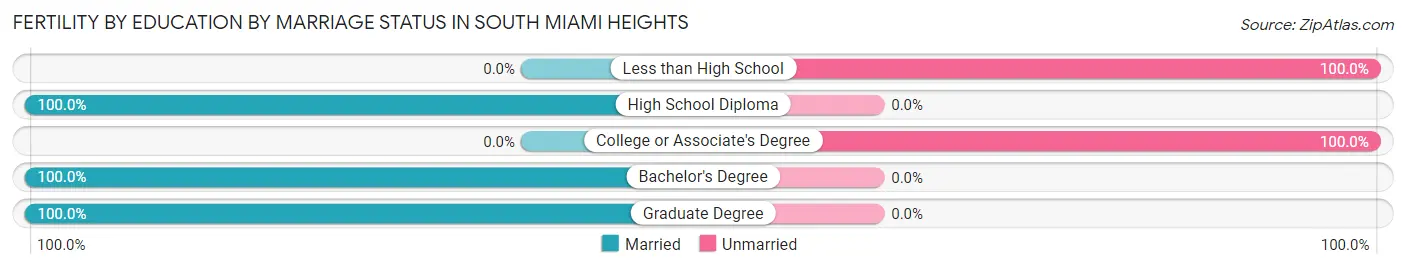
| Educational Attainment | Married | Unmarried |
| Less than High School | 0 (0.0%) | 19 (100.0%) |
| High School Diploma | 101 (100.0%) | 0 (0.0%) |
| College or Associate's Degree | 0 (0.0%) | 37 (100.0%) |
| Bachelor's Degree | 7 (100.0%) | 0 (0.0%) |
| Graduate Degree | 16 (100.0%) | 0 (0.0%) |
| Total | 124 (68.9%) | 56 (31.1%) |
Employment Characteristics in South Miami Heights
Employment by Class of Employer in South Miami Heights
Among the 17,008 employed individuals in South Miami Heights, private company employees (11,857 | 69.7%), self-employed (incorporated) (1,457 | 8.6%), and self-employed (not incorporated) (1,388 | 8.2%) make up the most common classes of employment.
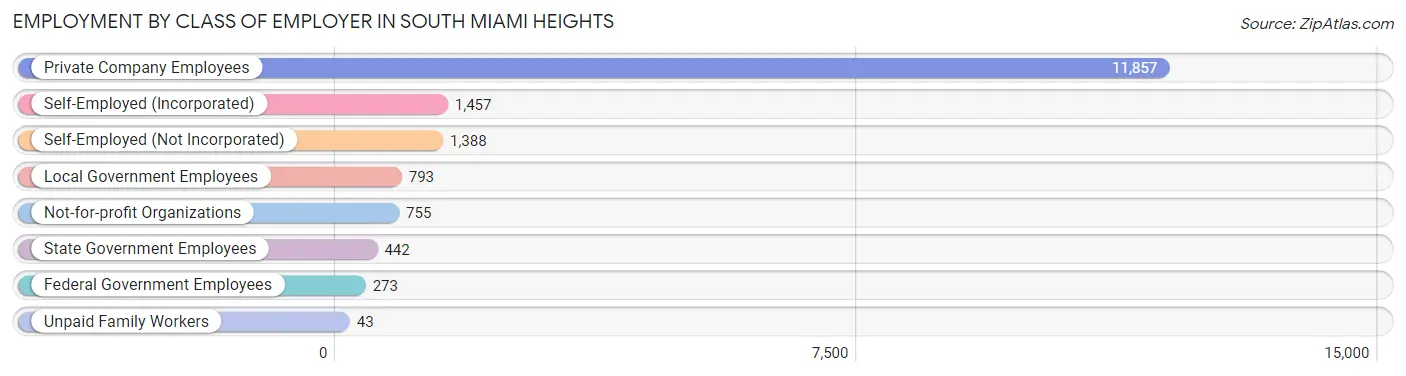
| Employer Class | # Employees | % Employees |
| Private Company Employees | 11,857 | 69.7% |
| Self-Employed (Incorporated) | 1,457 | 8.6% |
| Self-Employed (Not Incorporated) | 1,388 | 8.2% |
| Not-for-profit Organizations | 755 | 4.4% |
| Local Government Employees | 793 | 4.7% |
| State Government Employees | 442 | 2.6% |
| Federal Government Employees | 273 | 1.6% |
| Unpaid Family Workers | 43 | 0.3% |
| Total | 17,008 | 100.0% |
Employment Status by Age in South Miami Heights
According to the labor force statistics for South Miami Heights, out of the total population over 16 years of age (29,544), 62.8% or 18,554 individuals are in the labor force, with 5.9% or 1,095 of them unemployed. The age group with the highest labor force participation rate is 30 to 34 years, with 88.2% or 1,875 individuals in the labor force. Within the labor force, the 16 to 19 years age range has the highest percentage of unemployed individuals, with 11.3% or 60 of them being unemployed.
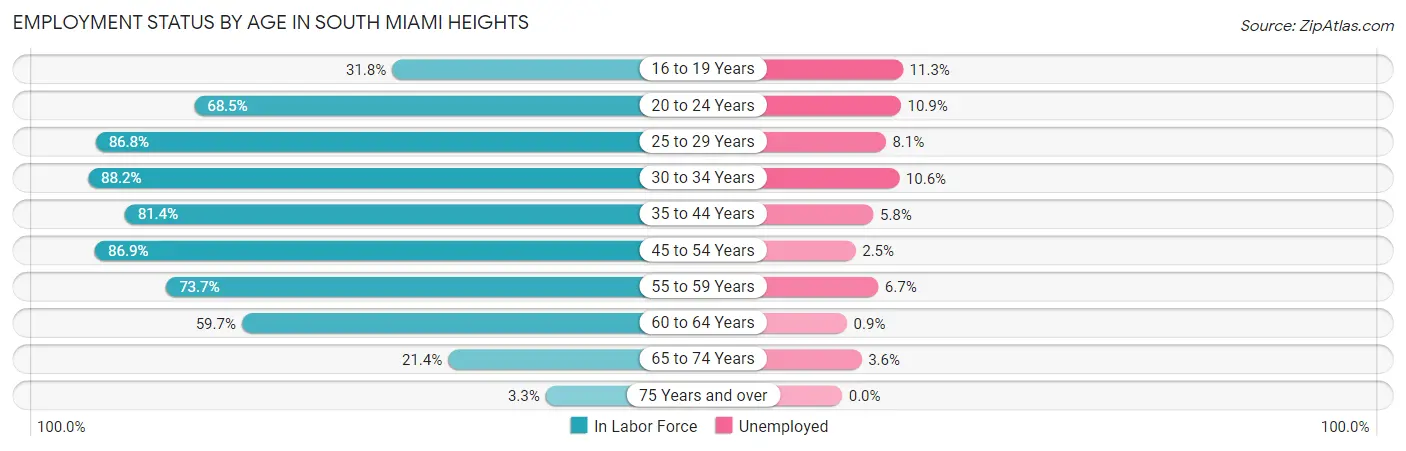
| Age Bracket | In Labor Force | Unemployed |
| 16 to 19 Years | 534 (31.8%) | 60 (11.3%) |
| 20 to 24 Years | 1,343 (68.5%) | 146 (10.9%) |
| 25 to 29 Years | 2,229 (86.8%) | 181 (8.1%) |
| 30 to 34 Years | 1,875 (88.2%) | 199 (10.6%) |
| 35 to 44 Years | 3,476 (81.4%) | 202 (5.8%) |
| 45 to 54 Years | 4,652 (86.9%) | 116 (2.5%) |
| 55 to 59 Years | 2,143 (73.7%) | 144 (6.7%) |
| 60 to 64 Years | 1,413 (59.7%) | 13 (0.9%) |
| 65 to 74 Years | 788 (21.4%) | 28 (3.6%) |
| 75 Years and over | 87 (3.3%) | 0 (0.0%) |
| Total | 18,554 (62.8%) | 1,095 (5.9%) |
Employment Status by Educational Attainment in South Miami Heights
According to labor force statistics for South Miami Heights, 80.6% of individuals (15,791) out of the total population between 25 and 64 years of age (19,592) are in the labor force, with 5.4% or 853 of them being unemployed. The group with the highest labor force participation rate are those with the educational attainment of bachelor's degree or higher, with 85.6% or 3,261 individuals in the labor force. Within the labor force, individuals with high school diploma education have the highest percentage of unemployment, with 7.3% or 473 of them being unemployed.
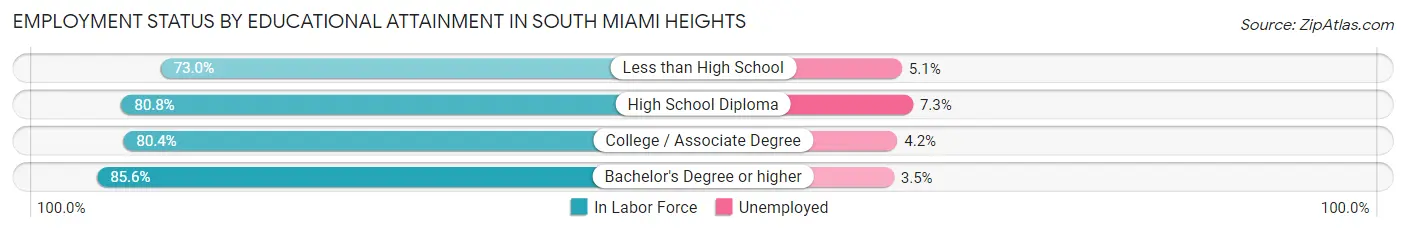
| Educational Attainment | In Labor Force | Unemployed |
| Less than High School | 1,874 (73.0%) | 131 (5.1%) |
| High School Diploma | 6,479 (80.8%) | 585 (7.3%) |
| College / Associate Degree | 4,178 (80.4%) | 218 (4.2%) |
| Bachelor's Degree or higher | 3,261 (85.6%) | 133 (3.5%) |
| Total | 15,791 (80.6%) | 1,058 (5.4%) |
Employment Occupations by Sex in South Miami Heights
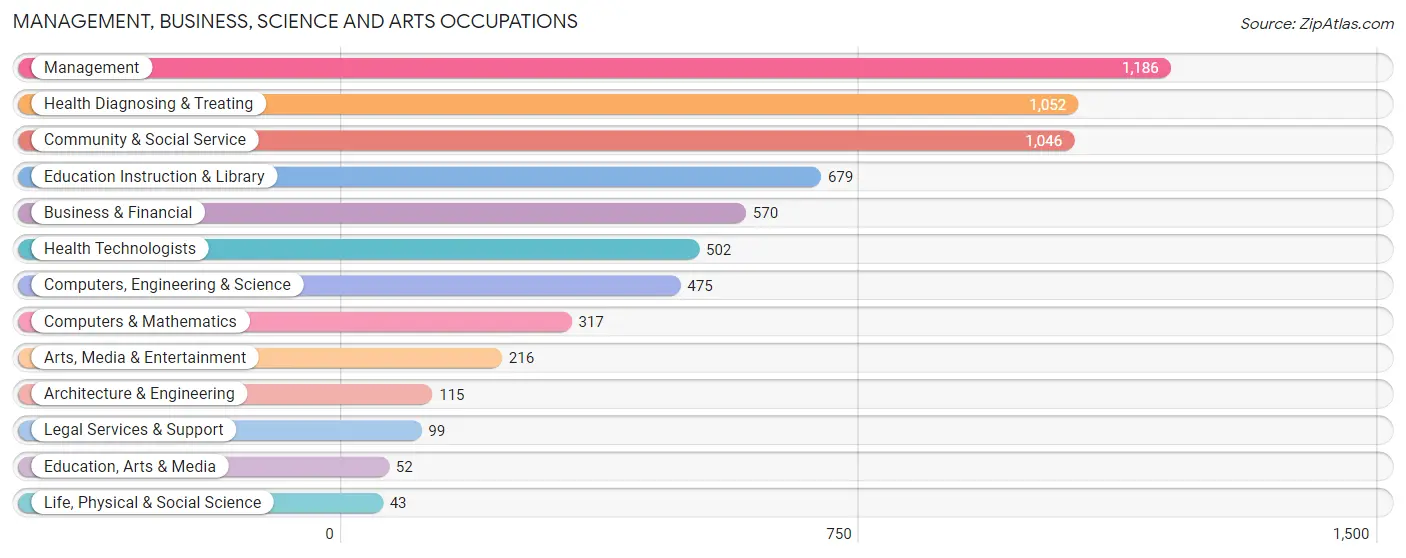
Management, Business, Science and Arts Occupations
The most common Management, Business, Science and Arts occupations in South Miami Heights are Management (1,186 | 6.8%), Health Diagnosing & Treating (1,052 | 6.0%), Community & Social Service (1,046 | 6.0%), Education Instruction & Library (679 | 3.9%), and Business & Financial (570 | 3.3%).
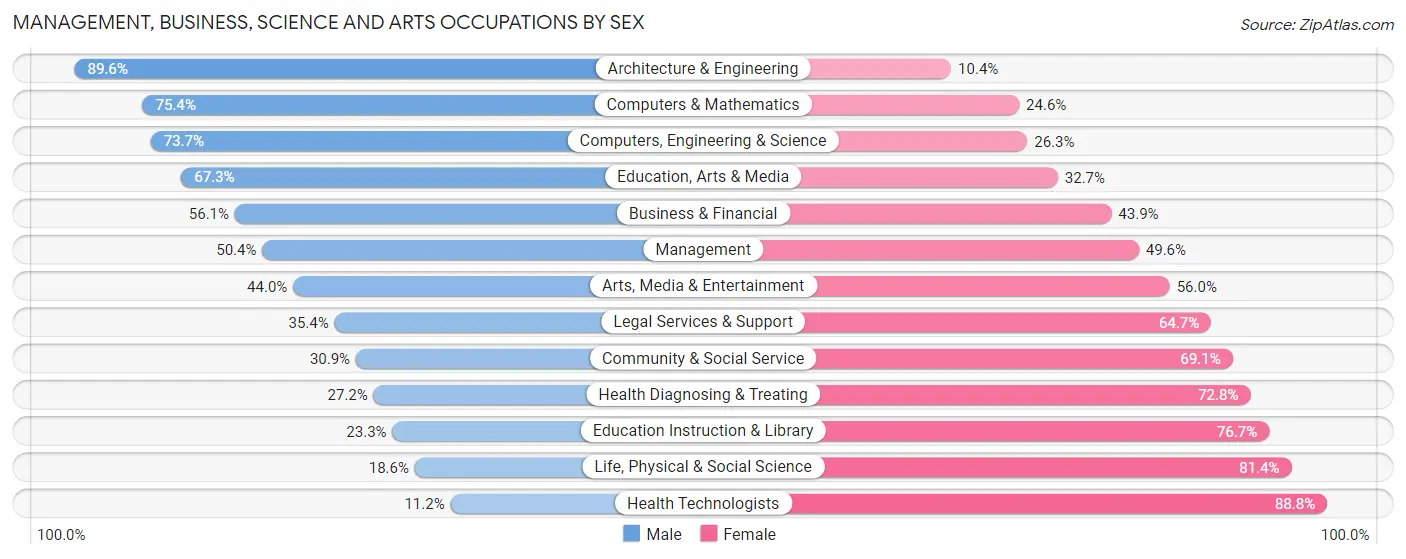
Management, Business, Science and Arts Occupations by Sex
Within the Management, Business, Science and Arts occupations in South Miami Heights, the most male-oriented occupations are Architecture & Engineering (89.6%), Computers & Mathematics (75.4%), and Computers, Engineering & Science (73.7%), while the most female-oriented occupations are Health Technologists (88.8%), Life, Physical & Social Science (81.4%), and Education Instruction & Library (76.7%).
| Occupation | Male | Female |
| Management | 598 (50.4%) | 588 (49.6%) |
| Business & Financial | 320 (56.1%) | 250 (43.9%) |
| Computers, Engineering & Science | 350 (73.7%) | 125 (26.3%) |
| Computers & Mathematics | 239 (75.4%) | 78 (24.6%) |
| Architecture & Engineering | 103 (89.6%) | 12 (10.4%) |
| Life, Physical & Social Science | 8 (18.6%) | 35 (81.4%) |
| Community & Social Service | 323 (30.9%) | 723 (69.1%) |
| Education, Arts & Media | 35 (67.3%) | 17 (32.7%) |
| Legal Services & Support | 35 (35.3%) | 64 (64.6%) |
| Education Instruction & Library | 158 (23.3%) | 521 (76.7%) |
| Arts, Media & Entertainment | 95 (44.0%) | 121 (56.0%) |
| Health Diagnosing & Treating | 286 (27.2%) | 766 (72.8%) |
| Health Technologists | 56 (11.2%) | 446 (88.8%) |
| Total (Category) | 1,877 (43.4%) | 2,452 (56.6%) |
| Total (Overall) | 9,529 (54.8%) | 7,860 (45.2%) |
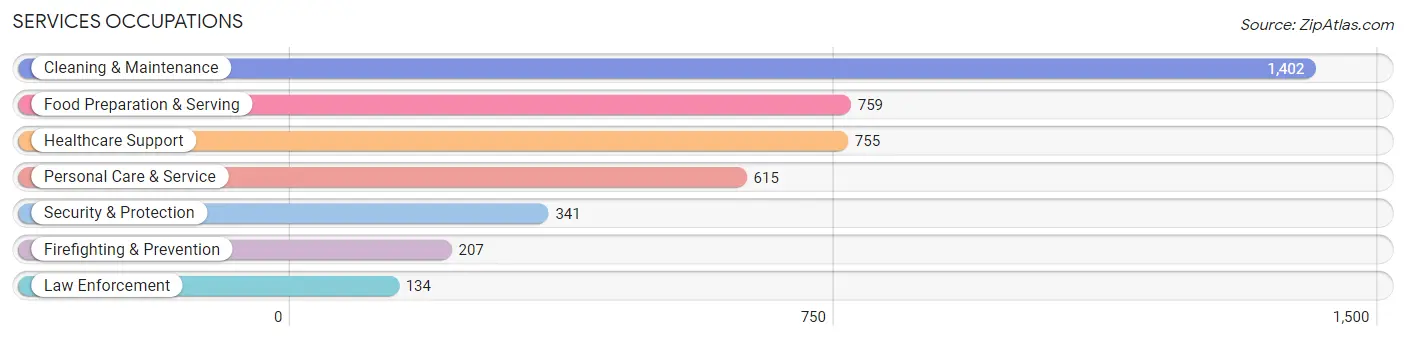
Services Occupations
The most common Services occupations in South Miami Heights are Cleaning & Maintenance (1,402 | 8.1%), Food Preparation & Serving (759 | 4.4%), Healthcare Support (755 | 4.3%), Personal Care & Service (615 | 3.5%), and Security & Protection (341 | 2.0%).
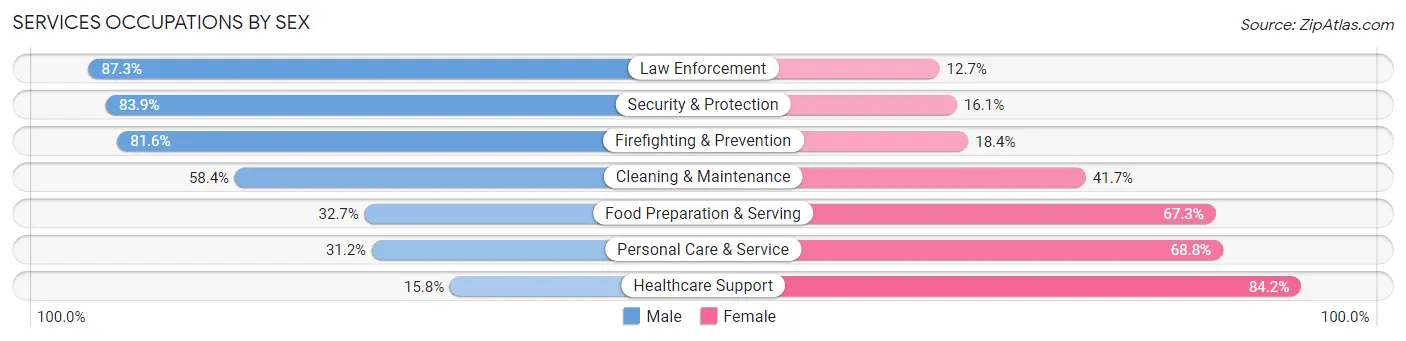
Services Occupations by Sex
Within the Services occupations in South Miami Heights, the most male-oriented occupations are Law Enforcement (87.3%), Security & Protection (83.9%), and Firefighting & Prevention (81.6%), while the most female-oriented occupations are Healthcare Support (84.2%), Personal Care & Service (68.8%), and Food Preparation & Serving (67.3%).
| Occupation | Male | Female |
| Healthcare Support | 119 (15.8%) | 636 (84.2%) |
| Security & Protection | 286 (83.9%) | 55 (16.1%) |
| Firefighting & Prevention | 169 (81.6%) | 38 (18.4%) |
| Law Enforcement | 117 (87.3%) | 17 (12.7%) |
| Food Preparation & Serving | 248 (32.7%) | 511 (67.3%) |
| Cleaning & Maintenance | 818 (58.4%) | 584 (41.6%) |
| Personal Care & Service | 192 (31.2%) | 423 (68.8%) |
| Total (Category) | 1,663 (42.9%) | 2,209 (57.1%) |
| Total (Overall) | 9,529 (54.8%) | 7,860 (45.2%) |
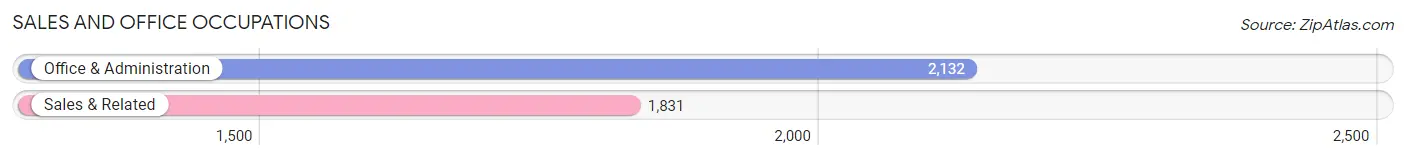
Sales and Office Occupations
The most common Sales and Office occupations in South Miami Heights are Office & Administration (2,132 | 12.3%), and Sales & Related (1,831 | 10.5%).
Sales and Office Occupations by Sex
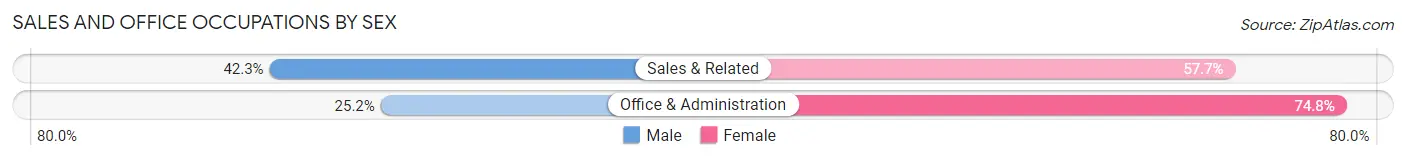
| Occupation | Male | Female |
| Sales & Related | 775 (42.3%) | 1,056 (57.7%) |
| Office & Administration | 538 (25.2%) | 1,594 (74.8%) |
| Total (Category) | 1,313 (33.1%) | 2,650 (66.9%) |
| Total (Overall) | 9,529 (54.8%) | 7,860 (45.2%) |
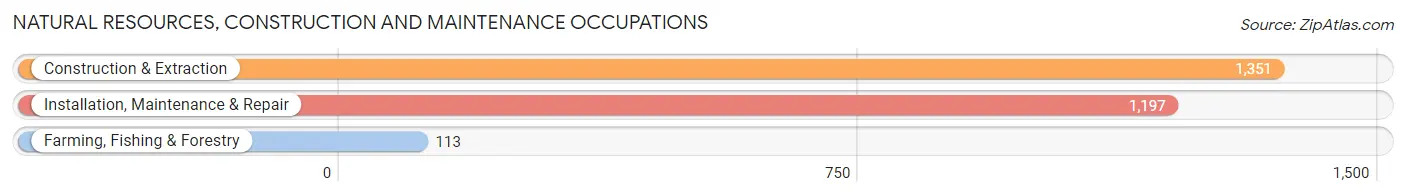
Natural Resources, Construction and Maintenance Occupations
The most common Natural Resources, Construction and Maintenance occupations in South Miami Heights are Construction & Extraction (1,351 | 7.8%), Installation, Maintenance & Repair (1,197 | 6.9%), and Farming, Fishing & Forestry (113 | 0.6%).
Natural Resources, Construction and Maintenance Occupations by Sex
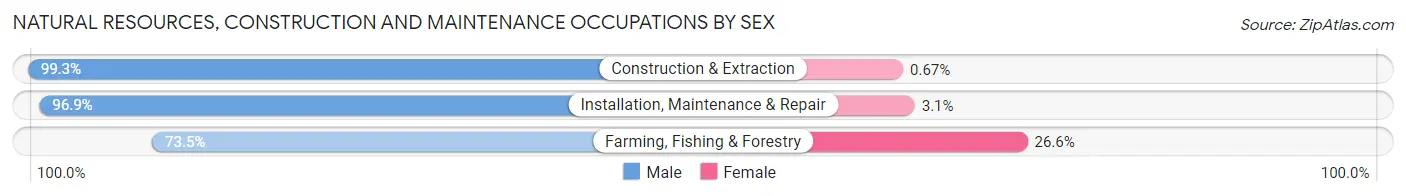
| Occupation | Male | Female |
| Farming, Fishing & Forestry | 83 (73.5%) | 30 (26.6%) |
| Construction & Extraction | 1,342 (99.3%) | 9 (0.7%) |
| Installation, Maintenance & Repair | 1,160 (96.9%) | 37 (3.1%) |
| Total (Category) | 2,585 (97.1%) | 76 (2.9%) |
| Total (Overall) | 9,529 (54.8%) | 7,860 (45.2%) |
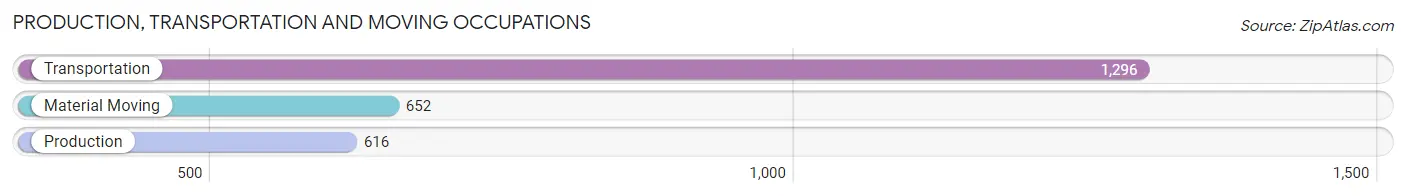
Production, Transportation and Moving Occupations
The most common Production, Transportation and Moving occupations in South Miami Heights are Transportation (1,296 | 7.4%), Material Moving (652 | 3.7%), and Production (616 | 3.5%).
Production, Transportation and Moving Occupations by Sex
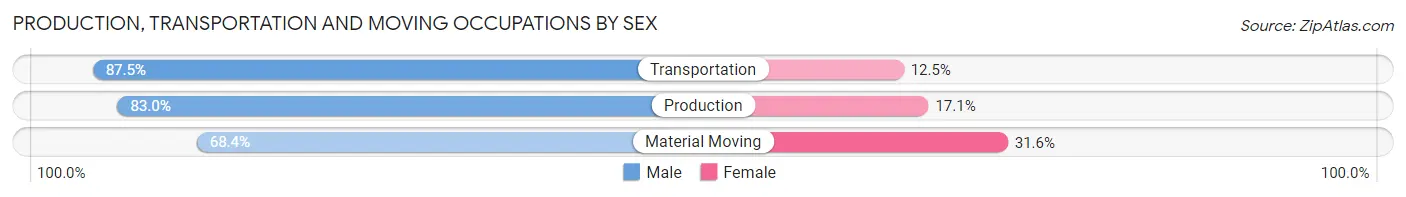
| Occupation | Male | Female |
| Production | 511 (83.0%) | 105 (17.1%) |
| Transportation | 1,134 (87.5%) | 162 (12.5%) |
| Material Moving | 446 (68.4%) | 206 (31.6%) |
| Total (Category) | 2,091 (81.6%) | 473 (18.4%) |
| Total (Overall) | 9,529 (54.8%) | 7,860 (45.2%) |
Employment Industries by Sex in South Miami Heights
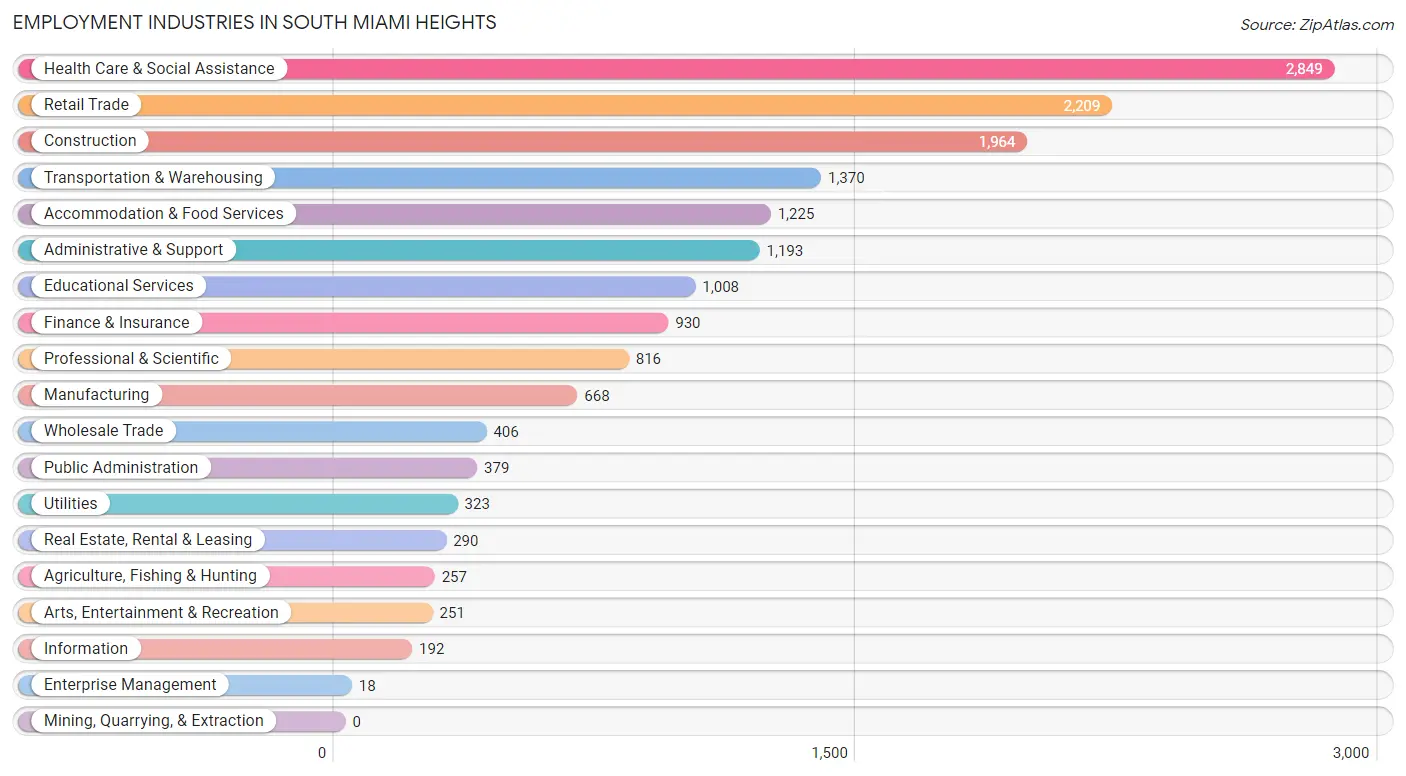
Employment Industries in South Miami Heights
The major employment industries in South Miami Heights include Health Care & Social Assistance (2,849 | 16.4%), Retail Trade (2,209 | 12.7%), Construction (1,964 | 11.3%), Transportation & Warehousing (1,370 | 7.9%), and Accommodation & Food Services (1,225 | 7.0%).
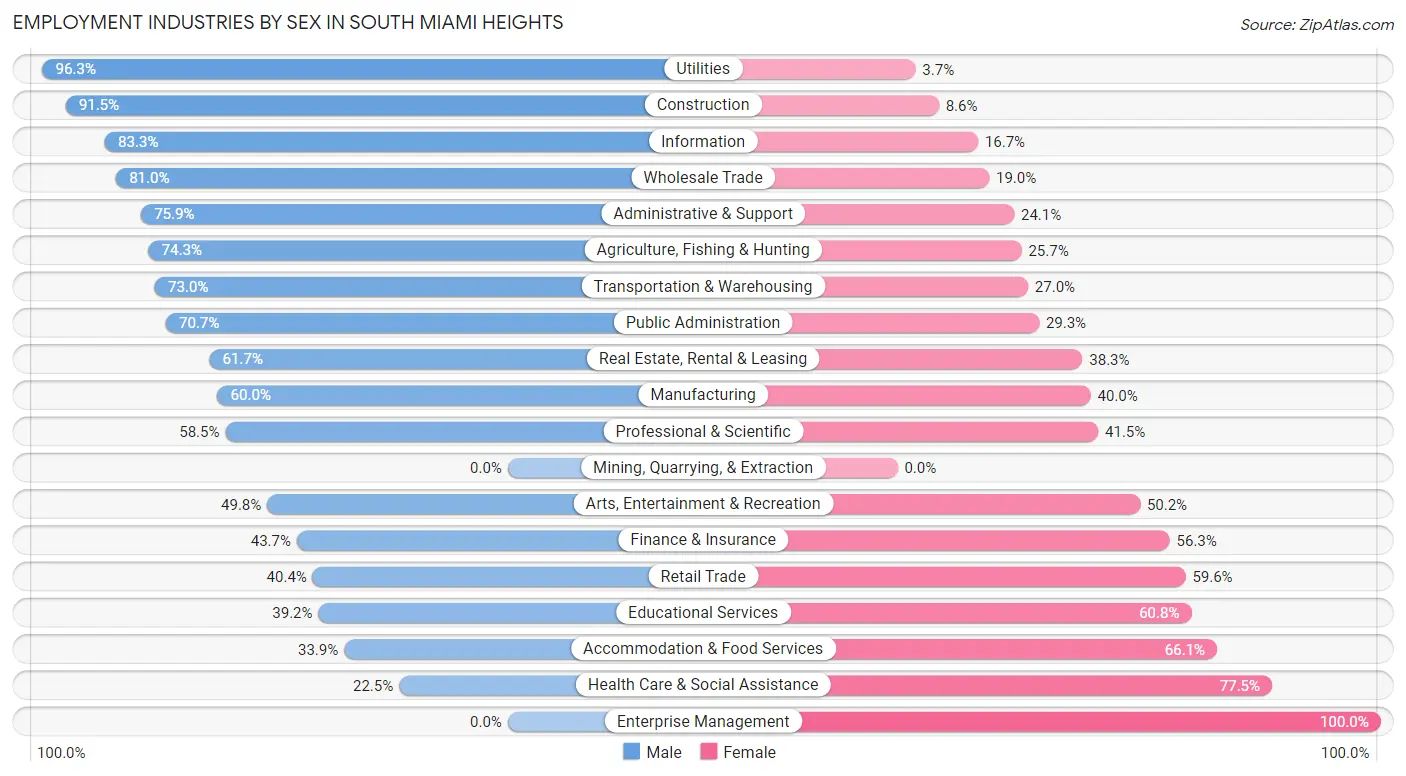
Employment Industries by Sex in South Miami Heights
The South Miami Heights industries that see more men than women are Utilities (96.3%), Construction (91.4%), and Information (83.3%), whereas the industries that tend to have a higher number of women are Enterprise Management (100.0%), Health Care & Social Assistance (77.5%), and Accommodation & Food Services (66.1%).
| Industry | Male | Female |
| Agriculture, Fishing & Hunting | 191 (74.3%) | 66 (25.7%) |
| Mining, Quarrying, & Extraction | 0 (0.0%) | 0 (0.0%) |
| Construction | 1,796 (91.4%) | 168 (8.6%) |
| Manufacturing | 401 (60.0%) | 267 (40.0%) |
| Wholesale Trade | 329 (81.0%) | 77 (19.0%) |
| Retail Trade | 892 (40.4%) | 1,317 (59.6%) |
| Transportation & Warehousing | 1,000 (73.0%) | 370 (27.0%) |
| Utilities | 311 (96.3%) | 12 (3.7%) |
| Information | 160 (83.3%) | 32 (16.7%) |
| Finance & Insurance | 406 (43.7%) | 524 (56.3%) |
| Real Estate, Rental & Leasing | 179 (61.7%) | 111 (38.3%) |
| Professional & Scientific | 477 (58.5%) | 339 (41.5%) |
| Enterprise Management | 0 (0.0%) | 18 (100.0%) |
| Administrative & Support | 905 (75.9%) | 288 (24.1%) |
| Educational Services | 395 (39.2%) | 613 (60.8%) |
| Health Care & Social Assistance | 641 (22.5%) | 2,208 (77.5%) |
| Arts, Entertainment & Recreation | 125 (49.8%) | 126 (50.2%) |
| Accommodation & Food Services | 415 (33.9%) | 810 (66.1%) |
| Public Administration | 268 (70.7%) | 111 (29.3%) |
| Total | 9,529 (54.8%) | 7,860 (45.2%) |
Education in South Miami Heights
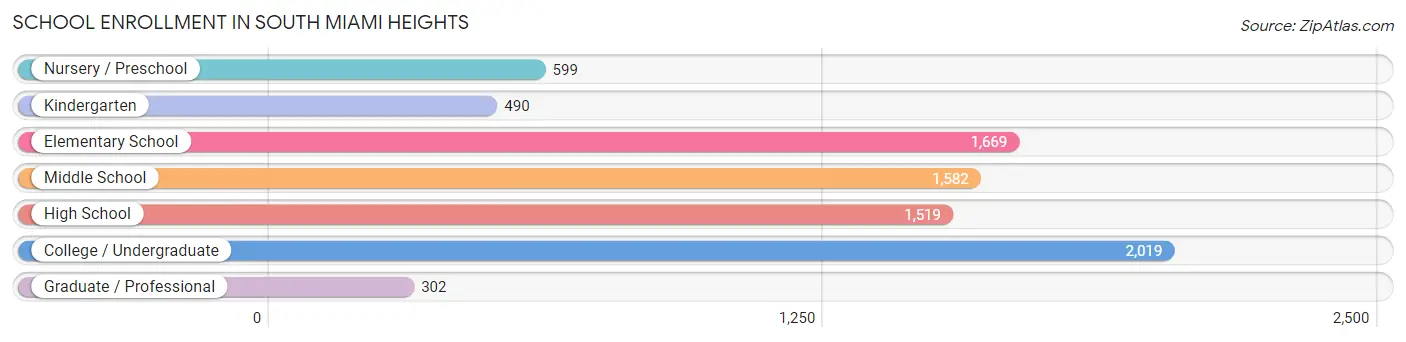
School Enrollment in South Miami Heights
The most common levels of schooling among the 8,180 students in South Miami Heights are college / undergraduate (2,019 | 24.7%), elementary school (1,669 | 20.4%), and middle school (1,582 | 19.3%).
| School Level | # Students | % Students |
| Nursery / Preschool | 599 | 7.3% |
| Kindergarten | 490 | 6.0% |
| Elementary School | 1,669 | 20.4% |
| Middle School | 1,582 | 19.3% |
| High School | 1,519 | 18.6% |
| College / Undergraduate | 2,019 | 24.7% |
| Graduate / Professional | 302 | 3.7% |
| Total | 8,180 | 100.0% |
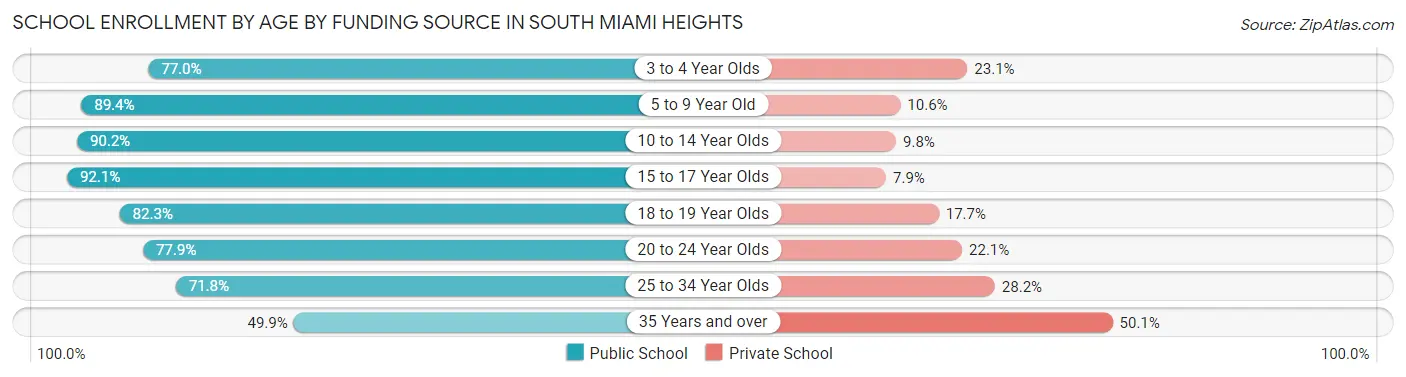
School Enrollment by Age by Funding Source in South Miami Heights
Out of a total of 8,180 students who are enrolled in schools in South Miami Heights, 1,350 (16.5%) attend a private institution, while the remaining 6,830 (83.5%) are enrolled in public schools. The age group of 35 years and over has the highest likelihood of being enrolled in private schools, with 276 (50.1% in the age bracket) enrolled. Conversely, the age group of 15 to 17 year olds has the lowest likelihood of being enrolled in a private school, with 1,084 (92.1% in the age bracket) attending a public institution.
| Age Bracket | Public School | Private School |
| 3 to 4 Year Olds | 464 (76.9%) | 139 (23.1%) |
| 5 to 9 Year Old | 1,760 (89.4%) | 208 (10.6%) |
| 10 to 14 Year Olds | 1,739 (90.2%) | 188 (9.8%) |
| 15 to 17 Year Olds | 1,084 (92.1%) | 93 (7.9%) |
| 18 to 19 Year Olds | 330 (82.3%) | 71 (17.7%) |
| 20 to 24 Year Olds | 823 (77.9%) | 233 (22.1%) |
| 25 to 34 Year Olds | 357 (71.8%) | 140 (28.2%) |
| 35 Years and over | 275 (49.9%) | 276 (50.1%) |
| Total | 6,830 (83.5%) | 1,350 (16.5%) |
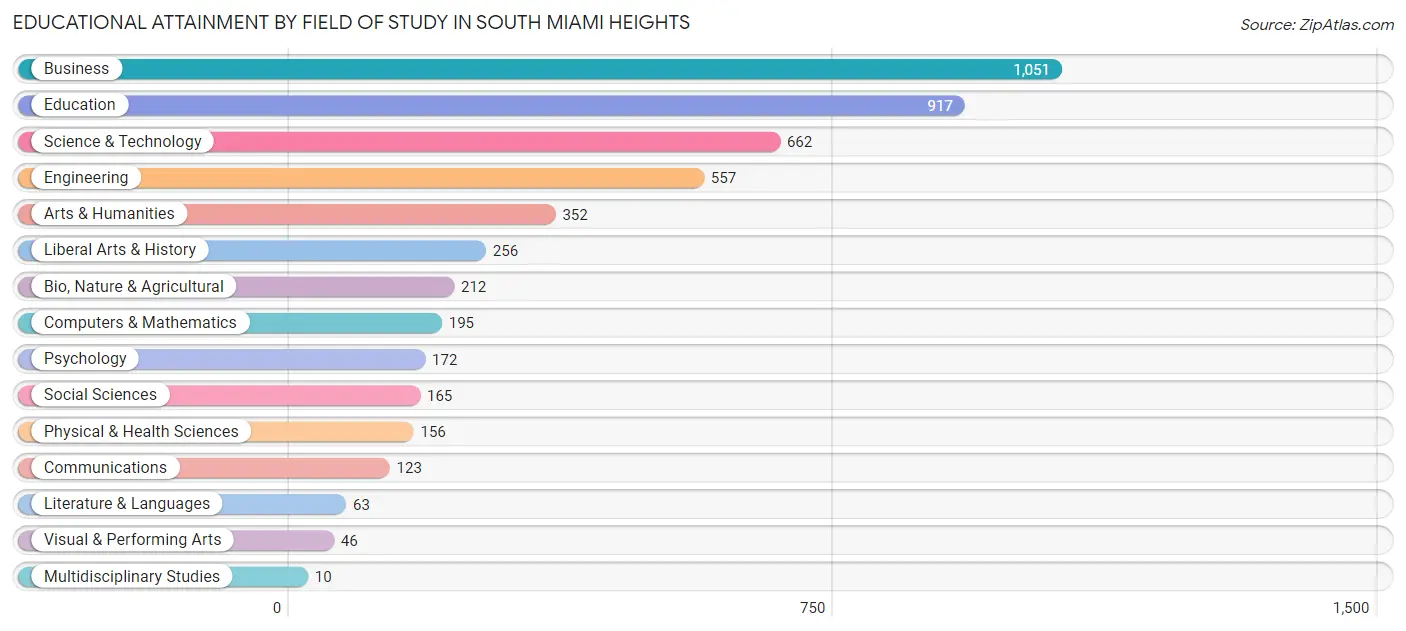
Educational Attainment by Field of Study in South Miami Heights
Business (1,051 | 21.3%), education (917 | 18.6%), science & technology (662 | 13.4%), engineering (557 | 11.3%), and arts & humanities (352 | 7.1%) are the most common fields of study among 4,937 individuals in South Miami Heights who have obtained a bachelor's degree or higher.
| Field of Study | # Graduates | % Graduates |
| Computers & Mathematics | 195 | 4.0% |
| Bio, Nature & Agricultural | 212 | 4.3% |
| Physical & Health Sciences | 156 | 3.2% |
| Psychology | 172 | 3.5% |
| Social Sciences | 165 | 3.3% |
| Engineering | 557 | 11.3% |
| Multidisciplinary Studies | 10 | 0.2% |
| Science & Technology | 662 | 13.4% |
| Business | 1,051 | 21.3% |
| Education | 917 | 18.6% |
| Literature & Languages | 63 | 1.3% |
| Liberal Arts & History | 256 | 5.2% |
| Visual & Performing Arts | 46 | 0.9% |
| Communications | 123 | 2.5% |
| Arts & Humanities | 352 | 7.1% |
| Total | 4,937 | 100.0% |
Transportation & Commute in South Miami Heights
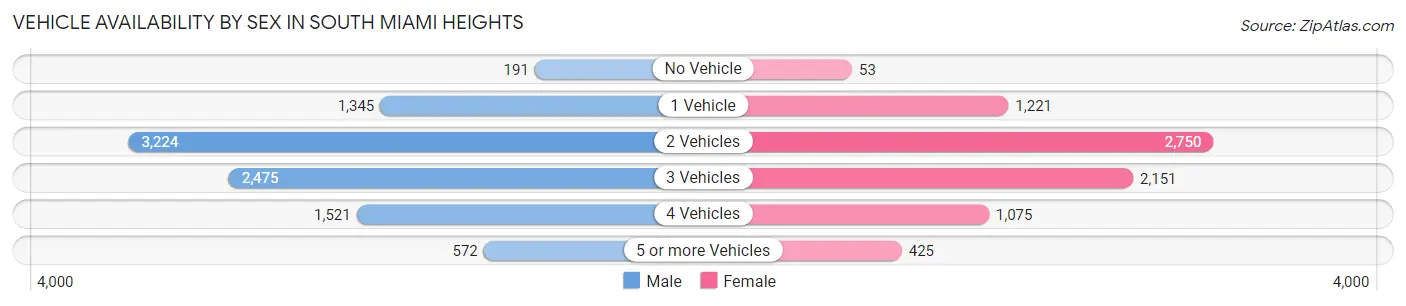
Vehicle Availability by Sex in South Miami Heights
The most prevalent vehicle ownership categories in South Miami Heights are males with 2 vehicles (3,224, accounting for 34.6%) and females with 2 vehicles (2,750, making up 42.0%).
| Vehicles Available | Male | Female |
| No Vehicle | 191 (2.1%) | 53 (0.7%) |
| 1 Vehicle | 1,345 (14.4%) | 1,221 (15.9%) |
| 2 Vehicles | 3,224 (34.6%) | 2,750 (35.8%) |
| 3 Vehicles | 2,475 (26.5%) | 2,151 (28.0%) |
| 4 Vehicles | 1,521 (16.3%) | 1,075 (14.0%) |
| 5 or more Vehicles | 572 (6.1%) | 425 (5.5%) |
| Total | 9,328 (100.0%) | 7,675 (100.0%) |
Commute Time in South Miami Heights
The most frequently occuring commute durations in South Miami Heights are 30 to 34 minutes (2,584 commuters, 16.1%), 60 to 89 minutes (2,263 commuters, 14.1%), and 20 to 24 minutes (1,923 commuters, 12.0%).
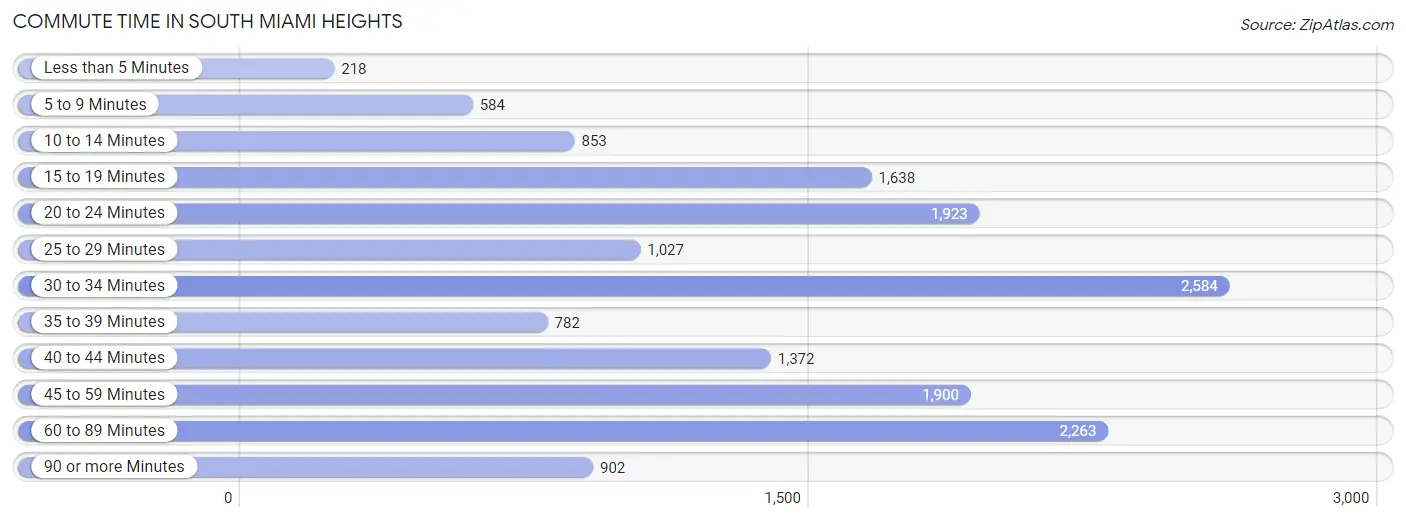
| Commute Time | # Commuters | % Commuters |
| Less than 5 Minutes | 218 | 1.4% |
| 5 to 9 Minutes | 584 | 3.6% |
| 10 to 14 Minutes | 853 | 5.3% |
| 15 to 19 Minutes | 1,638 | 10.2% |
| 20 to 24 Minutes | 1,923 | 12.0% |
| 25 to 29 Minutes | 1,027 | 6.4% |
| 30 to 34 Minutes | 2,584 | 16.1% |
| 35 to 39 Minutes | 782 | 4.9% |
| 40 to 44 Minutes | 1,372 | 8.6% |
| 45 to 59 Minutes | 1,900 | 11.8% |
| 60 to 89 Minutes | 2,263 | 14.1% |
| 90 or more Minutes | 902 | 5.6% |
Commute Time by Sex in South Miami Heights
The most common commute times in South Miami Heights are 30 to 34 minutes (1,397 commuters, 15.6%) for males and 30 to 34 minutes (1,187 commuters, 16.8%) for females.
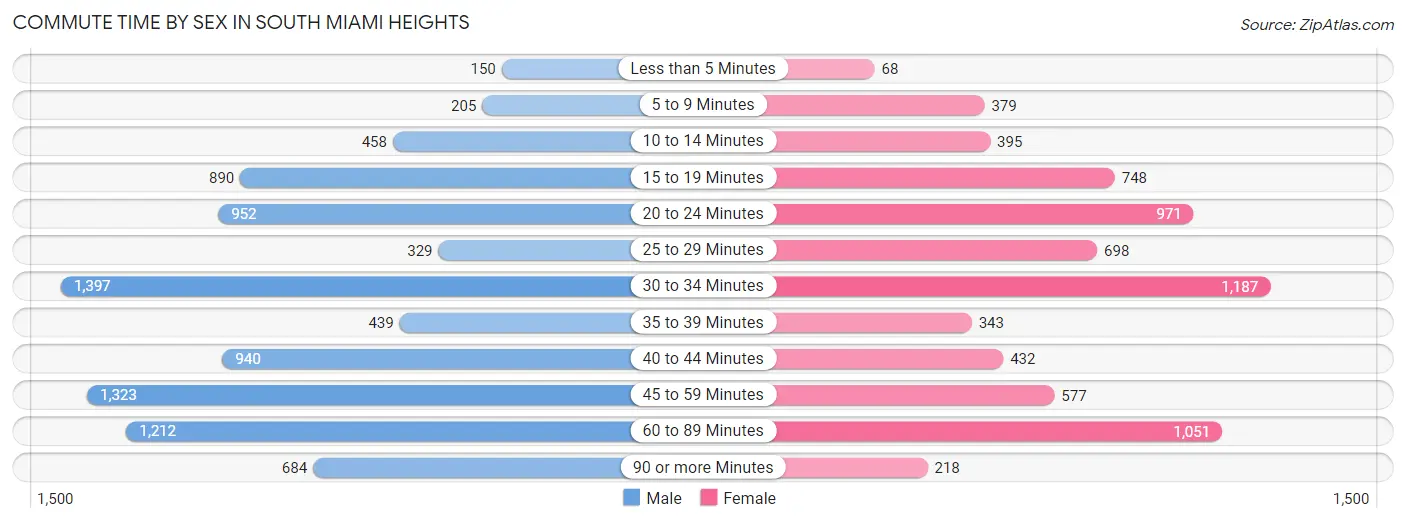
| Commute Time | Male | Female |
| Less than 5 Minutes | 150 (1.7%) | 68 (1.0%) |
| 5 to 9 Minutes | 205 (2.3%) | 379 (5.4%) |
| 10 to 14 Minutes | 458 (5.1%) | 395 (5.6%) |
| 15 to 19 Minutes | 890 (9.9%) | 748 (10.6%) |
| 20 to 24 Minutes | 952 (10.6%) | 971 (13.7%) |
| 25 to 29 Minutes | 329 (3.7%) | 698 (9.9%) |
| 30 to 34 Minutes | 1,397 (15.6%) | 1,187 (16.8%) |
| 35 to 39 Minutes | 439 (4.9%) | 343 (4.9%) |
| 40 to 44 Minutes | 940 (10.5%) | 432 (6.1%) |
| 45 to 59 Minutes | 1,323 (14.7%) | 577 (8.2%) |
| 60 to 89 Minutes | 1,212 (13.5%) | 1,051 (14.9%) |
| 90 or more Minutes | 684 (7.6%) | 218 (3.1%) |
Time of Departure to Work by Sex in South Miami Heights
The most frequent times of departure to work in South Miami Heights are 9:00 AM to 9:59 AM (1,189, 13.2%) for males and 8:00 AM to 8:29 AM (1,052, 14.9%) for females.
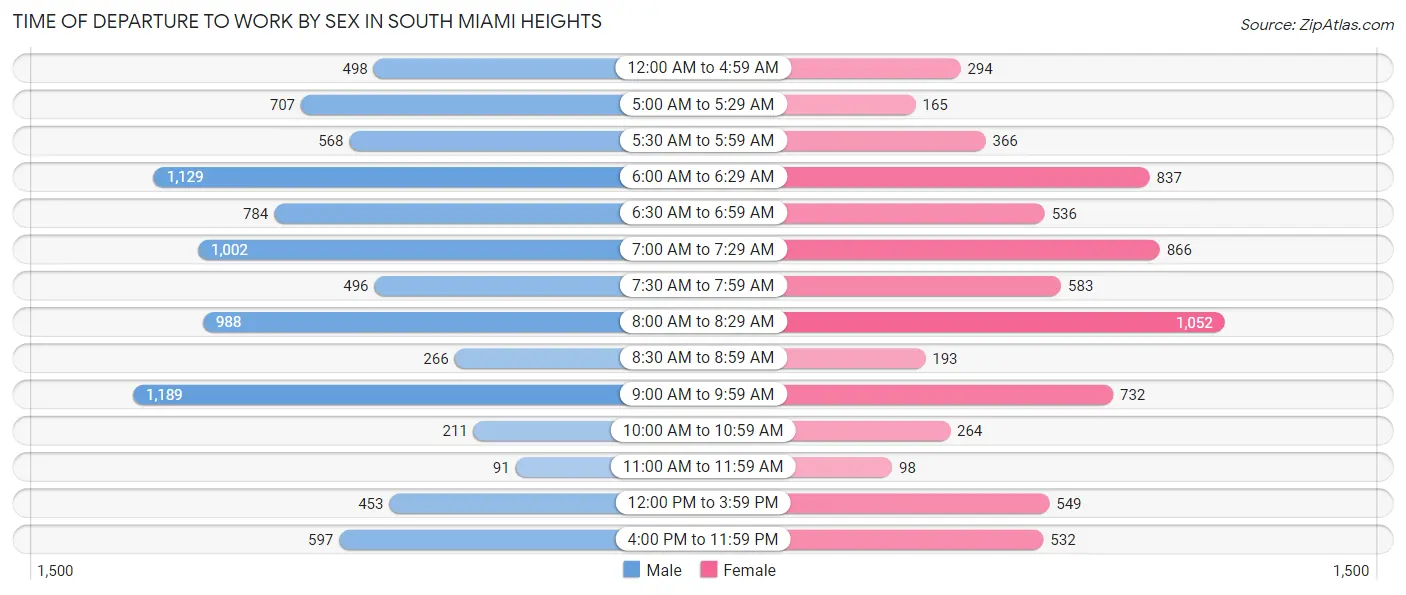
| Time of Departure | Male | Female |
| 12:00 AM to 4:59 AM | 498 (5.6%) | 294 (4.2%) |
| 5:00 AM to 5:29 AM | 707 (7.9%) | 165 (2.3%) |
| 5:30 AM to 5:59 AM | 568 (6.3%) | 366 (5.2%) |
| 6:00 AM to 6:29 AM | 1,129 (12.6%) | 837 (11.8%) |
| 6:30 AM to 6:59 AM | 784 (8.7%) | 536 (7.6%) |
| 7:00 AM to 7:29 AM | 1,002 (11.2%) | 866 (12.2%) |
| 7:30 AM to 7:59 AM | 496 (5.5%) | 583 (8.3%) |
| 8:00 AM to 8:29 AM | 988 (11.0%) | 1,052 (14.9%) |
| 8:30 AM to 8:59 AM | 266 (3.0%) | 193 (2.7%) |
| 9:00 AM to 9:59 AM | 1,189 (13.2%) | 732 (10.4%) |
| 10:00 AM to 10:59 AM | 211 (2.4%) | 264 (3.7%) |
| 11:00 AM to 11:59 AM | 91 (1.0%) | 98 (1.4%) |
| 12:00 PM to 3:59 PM | 453 (5.1%) | 549 (7.8%) |
| 4:00 PM to 11:59 PM | 597 (6.7%) | 532 (7.5%) |
| Total | 8,979 (100.0%) | 7,067 (100.0%) |
Housing Occupancy in South Miami Heights
Occupancy by Ownership in South Miami Heights
Of the total 11,405 dwellings in South Miami Heights, owner-occupied units account for 7,321 (64.2%), while renter-occupied units make up 4,084 (35.8%).
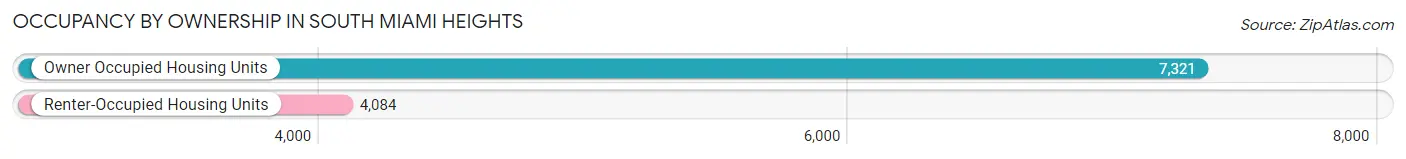
| Occupancy | # Housing Units | % Housing Units |
| Owner Occupied Housing Units | 7,321 | 64.2% |
| Renter-Occupied Housing Units | 4,084 | 35.8% |
| Total Occupied Housing Units | 11,405 | 100.0% |
Occupancy by Household Size in South Miami Heights
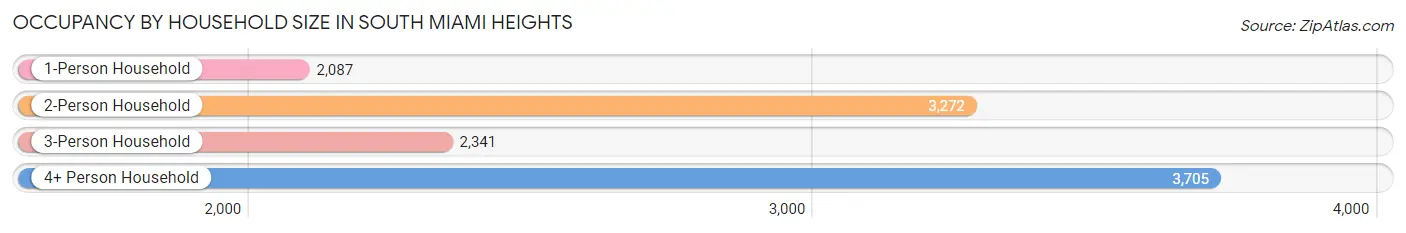
| Household Size | # Housing Units | % Housing Units |
| 1-Person Household | 2,087 | 18.3% |
| 2-Person Household | 3,272 | 28.7% |
| 3-Person Household | 2,341 | 20.5% |
| 4+ Person Household | 3,705 | 32.5% |
| Total Housing Units | 11,405 | 100.0% |
Occupancy by Ownership by Household Size in South Miami Heights
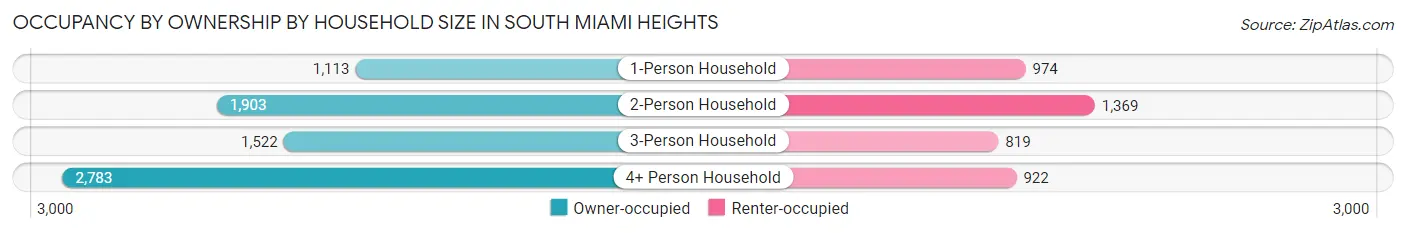
| Household Size | Owner-occupied | Renter-occupied |
| 1-Person Household | 1,113 (53.3%) | 974 (46.7%) |
| 2-Person Household | 1,903 (58.2%) | 1,369 (41.8%) |
| 3-Person Household | 1,522 (65.0%) | 819 (35.0%) |
| 4+ Person Household | 2,783 (75.1%) | 922 (24.9%) |
| Total Housing Units | 7,321 (64.2%) | 4,084 (35.8%) |
Occupancy by Educational Attainment in South Miami Heights
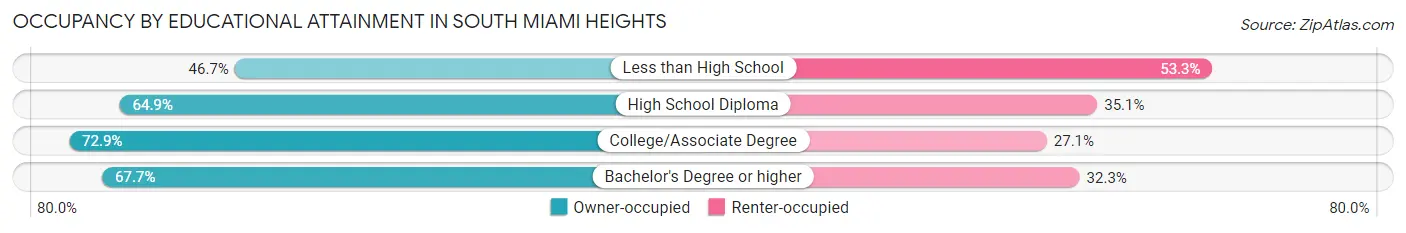
| Household Size | Owner-occupied | Renter-occupied |
| Less than High School | 957 (46.7%) | 1,093 (53.3%) |
| High School Diploma | 2,767 (64.9%) | 1,495 (35.1%) |
| College/Associate Degree | 2,074 (72.9%) | 770 (27.1%) |
| Bachelor's Degree or higher | 1,523 (67.7%) | 726 (32.3%) |
Occupancy by Age of Householder in South Miami Heights
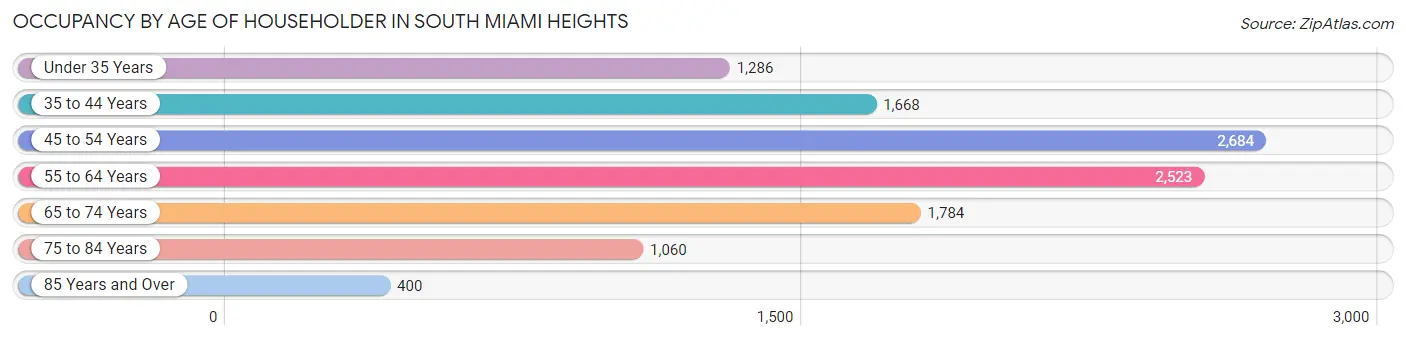
| Age Bracket | # Households | % Households |
| Under 35 Years | 1,286 | 11.3% |
| 35 to 44 Years | 1,668 | 14.6% |
| 45 to 54 Years | 2,684 | 23.5% |
| 55 to 64 Years | 2,523 | 22.1% |
| 65 to 74 Years | 1,784 | 15.6% |
| 75 to 84 Years | 1,060 | 9.3% |
| 85 Years and Over | 400 | 3.5% |
| Total | 11,405 | 100.0% |
Housing Finances in South Miami Heights
Median Income by Occupancy in South Miami Heights
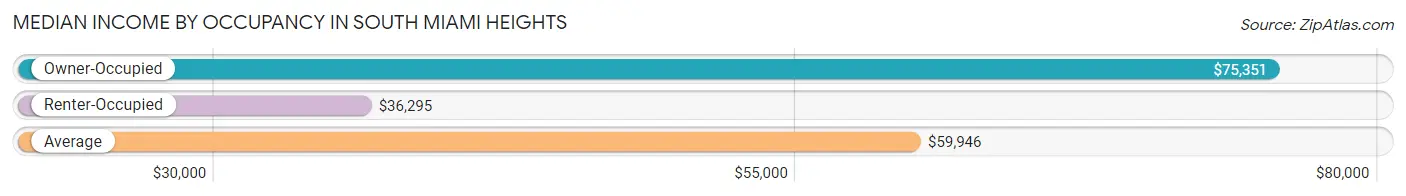
| Occupancy Type | # Households | Median Income |
| Owner-Occupied | 7,321 (64.2%) | $75,351 |
| Renter-Occupied | 4,084 (35.8%) | $36,295 |
| Average | 11,405 (100.0%) | $59,946 |
Occupancy by Householder Income Bracket in South Miami Heights
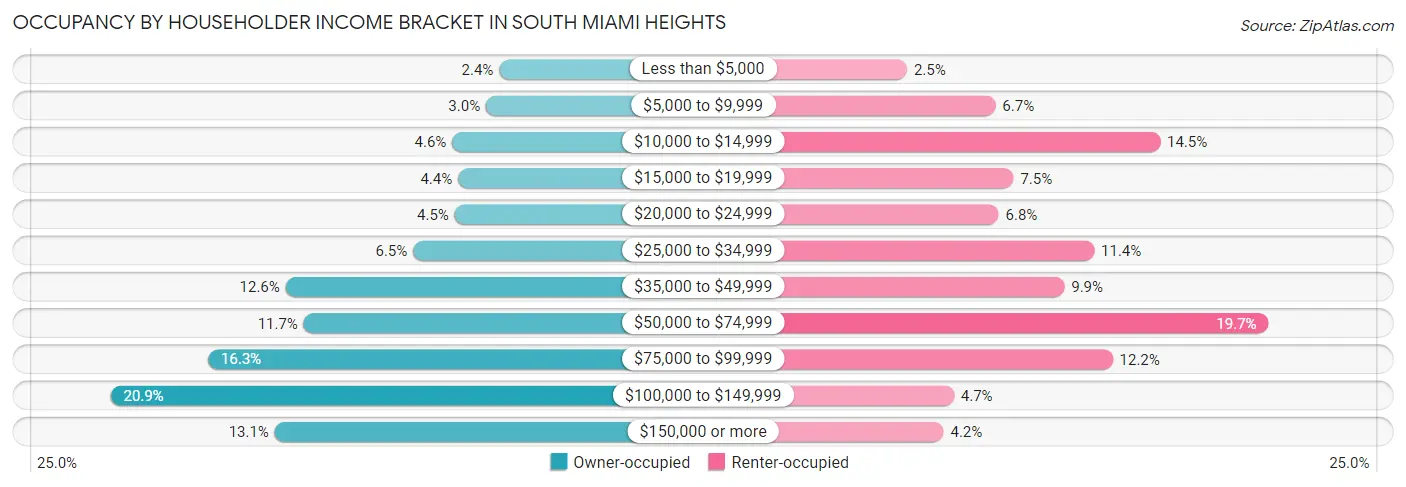
| Income Bracket | Owner-occupied | Renter-occupied |
| Less than $5,000 | 176 (2.4%) | 100 (2.5%) |
| $5,000 to $9,999 | 222 (3.0%) | 272 (6.7%) |
| $10,000 to $14,999 | 340 (4.6%) | 592 (14.5%) |
| $15,000 to $19,999 | 319 (4.4%) | 307 (7.5%) |
| $20,000 to $24,999 | 331 (4.5%) | 278 (6.8%) |
| $25,000 to $34,999 | 476 (6.5%) | 464 (11.4%) |
| $35,000 to $49,999 | 920 (12.6%) | 406 (9.9%) |
| $50,000 to $74,999 | 857 (11.7%) | 803 (19.7%) |
| $75,000 to $99,999 | 1,191 (16.3%) | 500 (12.2%) |
| $100,000 to $149,999 | 1,531 (20.9%) | 191 (4.7%) |
| $150,000 or more | 958 (13.1%) | 171 (4.2%) |
| Total | 7,321 (100.0%) | 4,084 (100.0%) |
Monthly Housing Cost Tiers in South Miami Heights
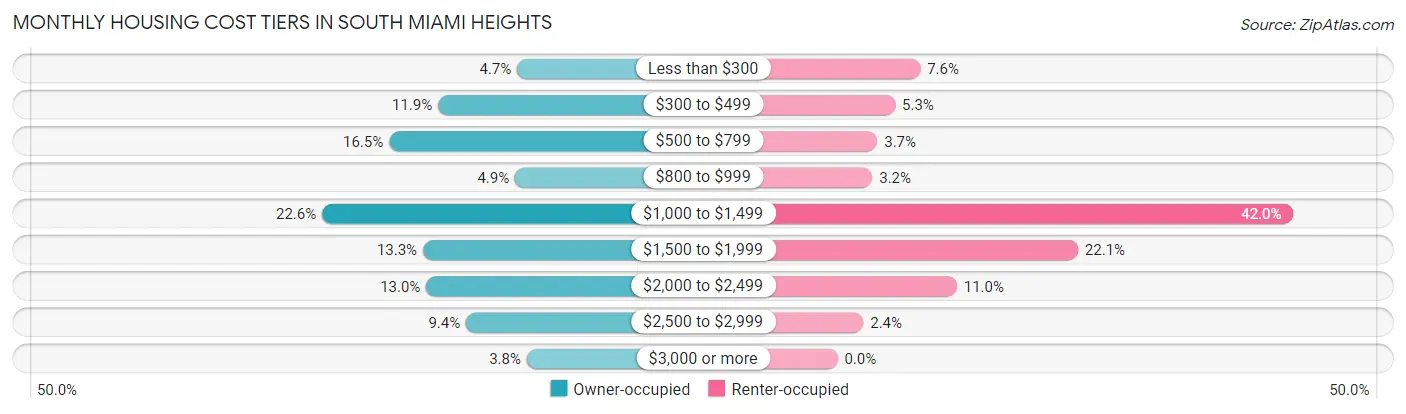
| Monthly Cost | Owner-occupied | Renter-occupied |
| Less than $300 | 341 (4.7%) | 311 (7.6%) |
| $300 to $499 | 874 (11.9%) | 217 (5.3%) |
| $500 to $799 | 1,204 (16.5%) | 150 (3.7%) |
| $800 to $999 | 355 (4.9%) | 131 (3.2%) |
| $1,000 to $1,499 | 1,656 (22.6%) | 1,714 (42.0%) |
| $1,500 to $1,999 | 976 (13.3%) | 904 (22.1%) |
| $2,000 to $2,499 | 954 (13.0%) | 449 (11.0%) |
| $2,500 to $2,999 | 685 (9.4%) | 97 (2.4%) |
| $3,000 or more | 276 (3.8%) | 0 (0.0%) |
| Total | 7,321 (100.0%) | 4,084 (100.0%) |
Physical Housing Characteristics in South Miami Heights
Housing Structures in South Miami Heights
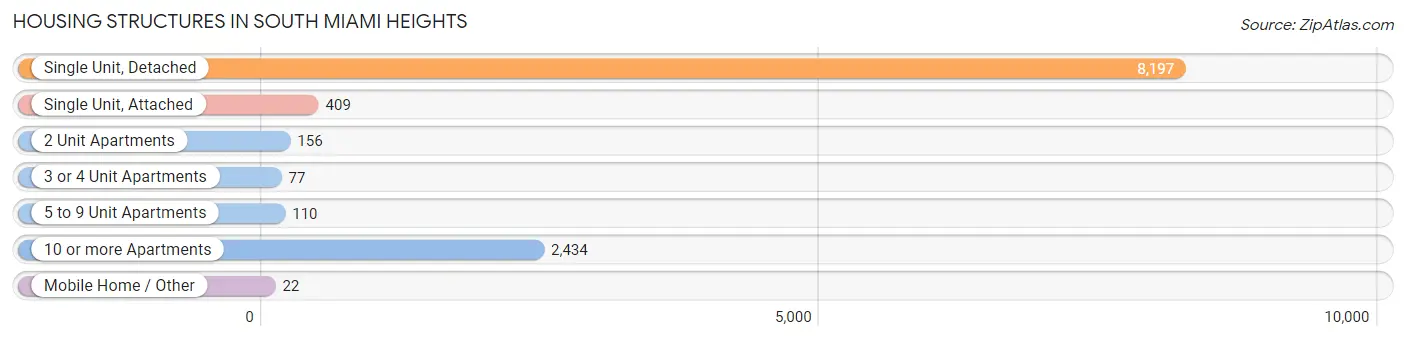
| Structure Type | # Housing Units | % Housing Units |
| Single Unit, Detached | 8,197 | 71.9% |
| Single Unit, Attached | 409 | 3.6% |
| 2 Unit Apartments | 156 | 1.4% |
| 3 or 4 Unit Apartments | 77 | 0.7% |
| 5 to 9 Unit Apartments | 110 | 1.0% |
| 10 or more Apartments | 2,434 | 21.3% |
| Mobile Home / Other | 22 | 0.2% |
| Total | 11,405 | 100.0% |
Housing Structures by Occupancy in South Miami Heights
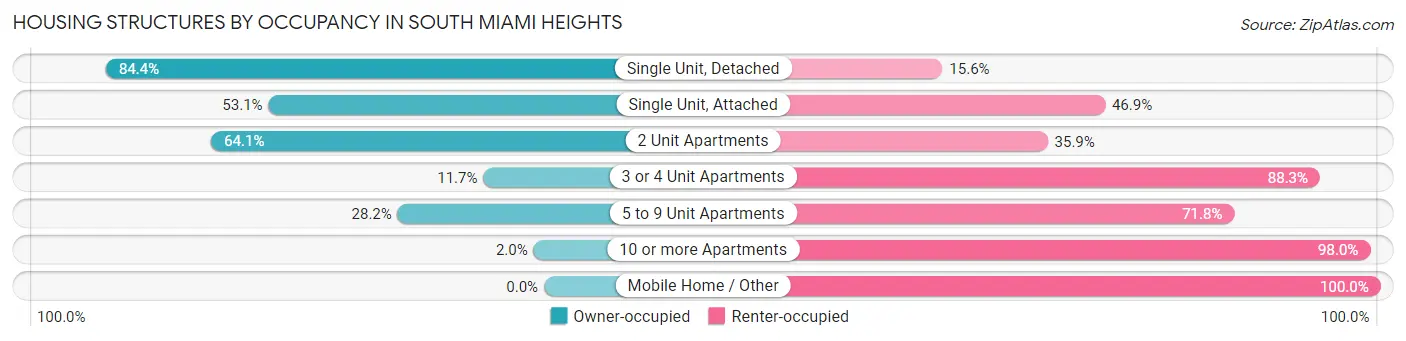
| Structure Type | Owner-occupied | Renter-occupied |
| Single Unit, Detached | 6,915 (84.4%) | 1,282 (15.6%) |
| Single Unit, Attached | 217 (53.1%) | 192 (46.9%) |
| 2 Unit Apartments | 100 (64.1%) | 56 (35.9%) |
| 3 or 4 Unit Apartments | 9 (11.7%) | 68 (88.3%) |
| 5 to 9 Unit Apartments | 31 (28.2%) | 79 (71.8%) |
| 10 or more Apartments | 49 (2.0%) | 2,385 (98.0%) |
| Mobile Home / Other | 0 (0.0%) | 22 (100.0%) |
| Total | 7,321 (64.2%) | 4,084 (35.8%) |
Housing Structures by Number of Rooms in South Miami Heights
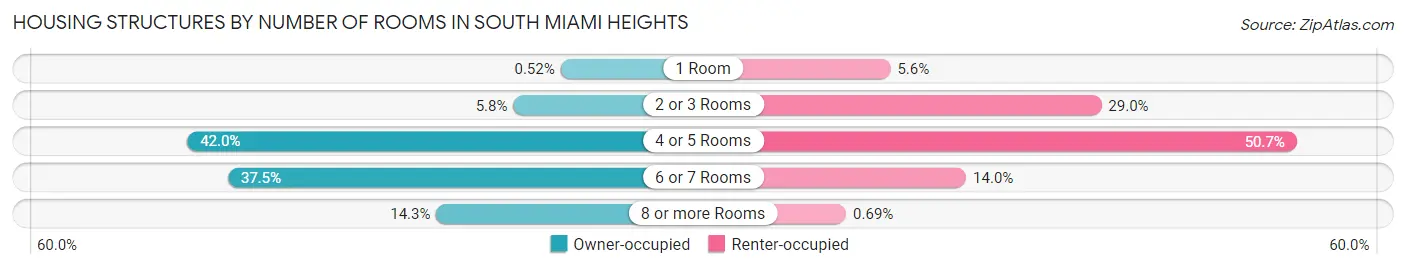
| Number of Rooms | Owner-occupied | Renter-occupied |
| 1 Room | 38 (0.5%) | 229 (5.6%) |
| 2 or 3 Rooms | 422 (5.8%) | 1,185 (29.0%) |
| 4 or 5 Rooms | 3,071 (41.9%) | 2,070 (50.7%) |
| 6 or 7 Rooms | 2,742 (37.4%) | 572 (14.0%) |
| 8 or more Rooms | 1,048 (14.3%) | 28 (0.7%) |
| Total | 7,321 (100.0%) | 4,084 (100.0%) |
Housing Structure by Heating Type in South Miami Heights
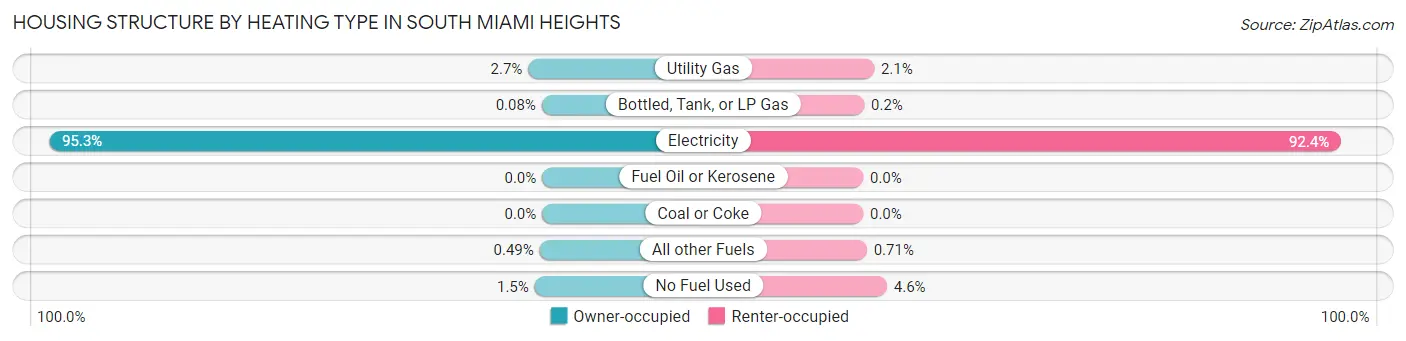
| Heating Type | Owner-occupied | Renter-occupied |
| Utility Gas | 197 (2.7%) | 86 (2.1%) |
| Bottled, Tank, or LP Gas | 6 (0.1%) | 8 (0.2%) |
| Electricity | 6,976 (95.3%) | 3,773 (92.4%) |
| Fuel Oil or Kerosene | 0 (0.0%) | 0 (0.0%) |
| Coal or Coke | 0 (0.0%) | 0 (0.0%) |
| All other Fuels | 36 (0.5%) | 29 (0.7%) |
| No Fuel Used | 106 (1.5%) | 188 (4.6%) |
| Total | 7,321 (100.0%) | 4,084 (100.0%) |
Household Vehicle Usage in South Miami Heights
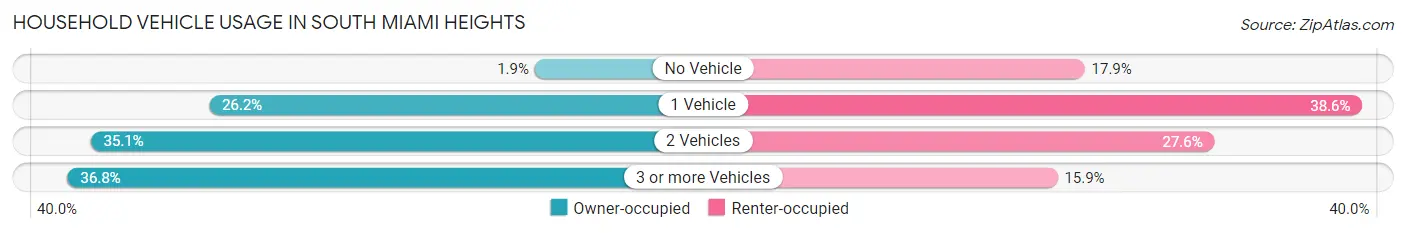
| Vehicles per Household | Owner-occupied | Renter-occupied |
| No Vehicle | 139 (1.9%) | 731 (17.9%) |
| 1 Vehicle | 1,920 (26.2%) | 1,578 (38.6%) |
| 2 Vehicles | 2,568 (35.1%) | 1,127 (27.6%) |
| 3 or more Vehicles | 2,694 (36.8%) | 648 (15.9%) |
| Total | 7,321 (100.0%) | 4,084 (100.0%) |
Real Estate & Mortgages in South Miami Heights
Real Estate and Mortgage Overview in South Miami Heights
| Characteristic | Without Mortgage | With Mortgage |
| Housing Units | 2,689 | 4,632 |
| Median Property Value | $293,800 | $340,600 |
| Median Household Income | $65,151 | $645 |
| Monthly Housing Costs | $532 | $276 |
| Real Estate Taxes | $1,655 | $29 |
Property Value by Mortgage Status in South Miami Heights
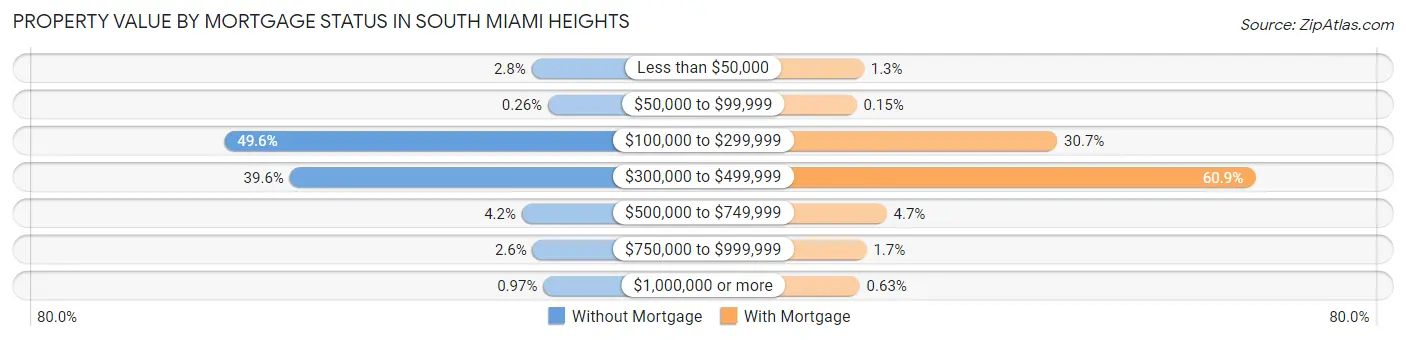
| Property Value | Without Mortgage | With Mortgage |
| Less than $50,000 | 74 (2.8%) | 58 (1.3%) |
| $50,000 to $99,999 | 7 (0.3%) | 7 (0.2%) |
| $100,000 to $299,999 | 1,333 (49.6%) | 1,423 (30.7%) |
| $300,000 to $499,999 | 1,065 (39.6%) | 2,819 (60.9%) |
| $500,000 to $749,999 | 114 (4.2%) | 219 (4.7%) |
| $750,000 to $999,999 | 70 (2.6%) | 77 (1.7%) |
| $1,000,000 or more | 26 (1.0%) | 29 (0.6%) |
| Total | 2,689 (100.0%) | 4,632 (100.0%) |
Household Income by Mortgage Status in South Miami Heights
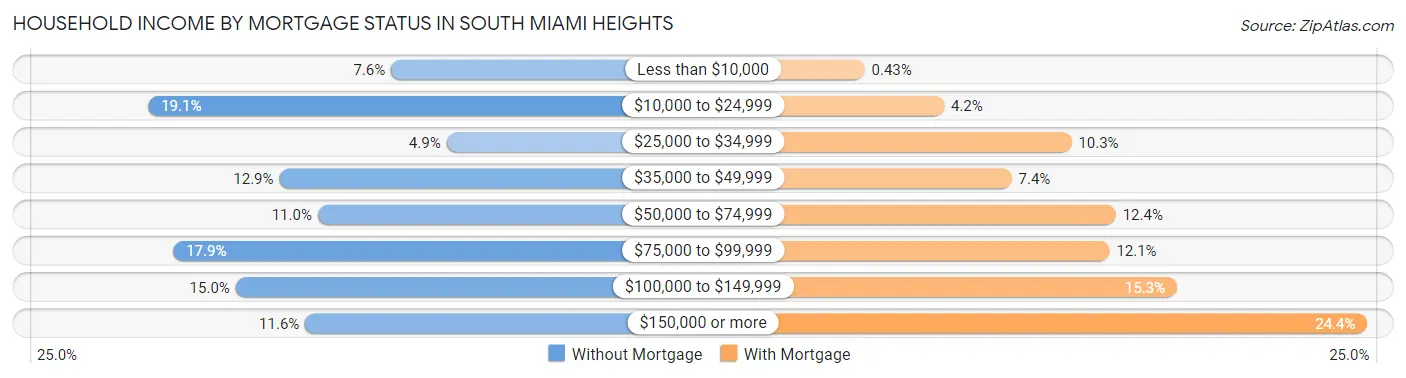
| Household Income | Without Mortgage | With Mortgage |
| Less than $10,000 | 203 (7.5%) | 20 (0.4%) |
| $10,000 to $24,999 | 514 (19.1%) | 195 (4.2%) |
| $25,000 to $34,999 | 132 (4.9%) | 476 (10.3%) |
| $35,000 to $49,999 | 346 (12.9%) | 344 (7.4%) |
| $50,000 to $74,999 | 297 (11.0%) | 574 (12.4%) |
| $75,000 to $99,999 | 482 (17.9%) | 560 (12.1%) |
| $100,000 to $149,999 | 402 (14.9%) | 709 (15.3%) |
| $150,000 or more | 313 (11.6%) | 1,129 (24.4%) |
| Total | 2,689 (100.0%) | 4,632 (100.0%) |
Property Value to Household Income Ratio in South Miami Heights
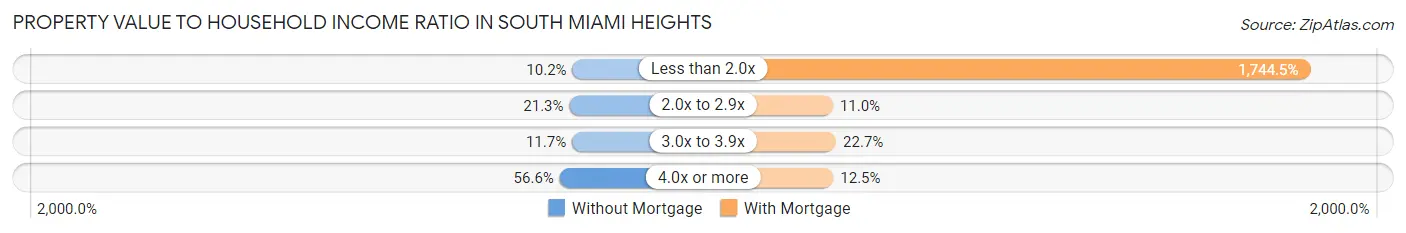
| Value-to-Income Ratio | Without Mortgage | With Mortgage |
| Less than 2.0x | 273 (10.2%) | 80,807 (1,744.5%) |
| 2.0x to 2.9x | 573 (21.3%) | 509 (11.0%) |
| 3.0x to 3.9x | 315 (11.7%) | 1,051 (22.7%) |
| 4.0x or more | 1,521 (56.6%) | 581 (12.5%) |
| Total | 2,689 (100.0%) | 4,632 (100.0%) |
Real Estate Taxes by Mortgage Status in South Miami Heights
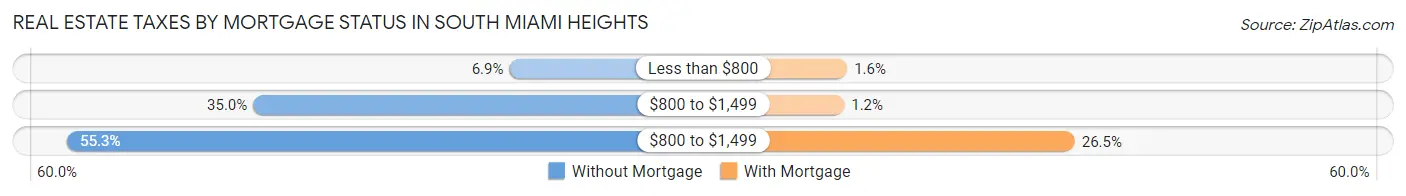
| Property Taxes | Without Mortgage | With Mortgage |
| Less than $800 | 185 (6.9%) | 72 (1.5%) |
| $800 to $1,499 | 940 (35.0%) | 57 (1.2%) |
| $800 to $1,499 | 1,488 (55.3%) | 1,227 (26.5%) |
| Total | 2,689 (100.0%) | 4,632 (100.0%) |
Health & Disability in South Miami Heights
Health Insurance Coverage by Age in South Miami Heights
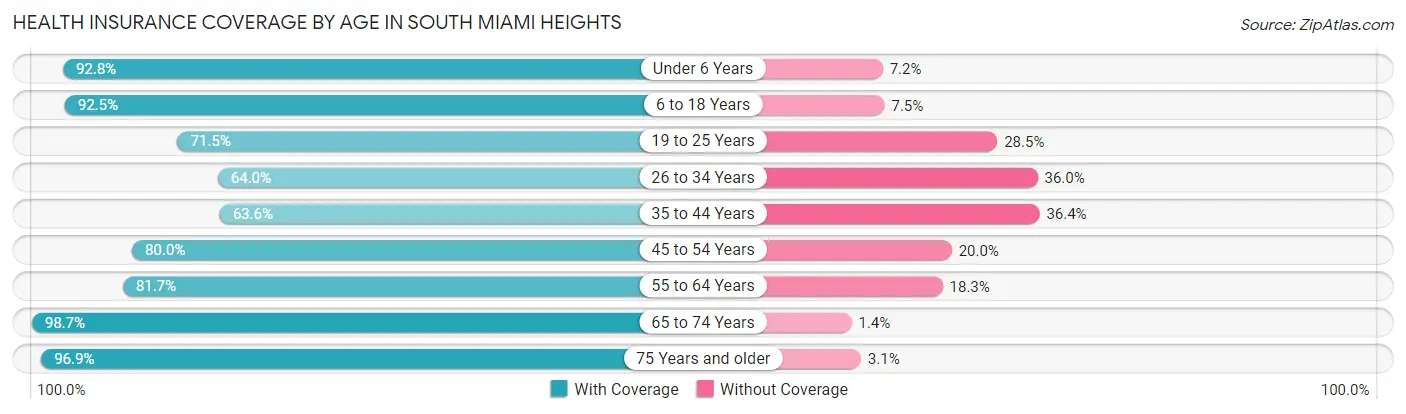
| Age Bracket | With Coverage | Without Coverage |
| Under 6 Years | 2,011 (92.8%) | 155 (7.2%) |
| 6 to 18 Years | 4,779 (92.5%) | 388 (7.5%) |
| 19 to 25 Years | 1,955 (71.5%) | 780 (28.5%) |
| 26 to 34 Years | 2,786 (64.0%) | 1,570 (36.0%) |
| 35 to 44 Years | 2,716 (63.6%) | 1,554 (36.4%) |
| 45 to 54 Years | 4,281 (80.0%) | 1,072 (20.0%) |
| 55 to 64 Years | 4,305 (81.7%) | 966 (18.3%) |
| 65 to 74 Years | 3,594 (98.7%) | 49 (1.3%) |
| 75 Years and older | 2,376 (96.9%) | 76 (3.1%) |
| Total | 28,803 (81.3%) | 6,610 (18.7%) |
Health Insurance Coverage by Citizenship Status in South Miami Heights
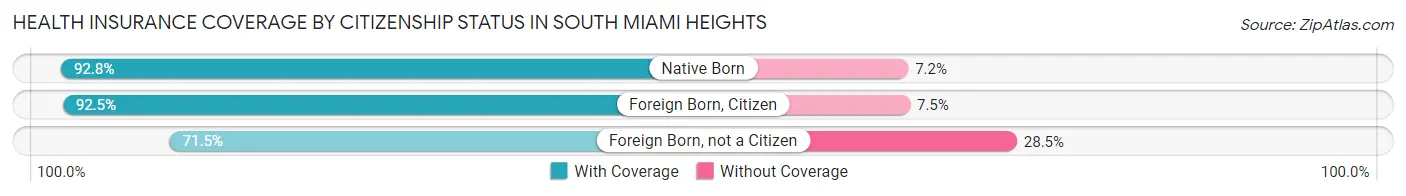
| Citizenship Status | With Coverage | Without Coverage |
| Native Born | 2,011 (92.8%) | 155 (7.2%) |
| Foreign Born, Citizen | 4,779 (92.5%) | 388 (7.5%) |
| Foreign Born, not a Citizen | 1,955 (71.5%) | 780 (28.5%) |
Health Insurance Coverage by Household Income in South Miami Heights
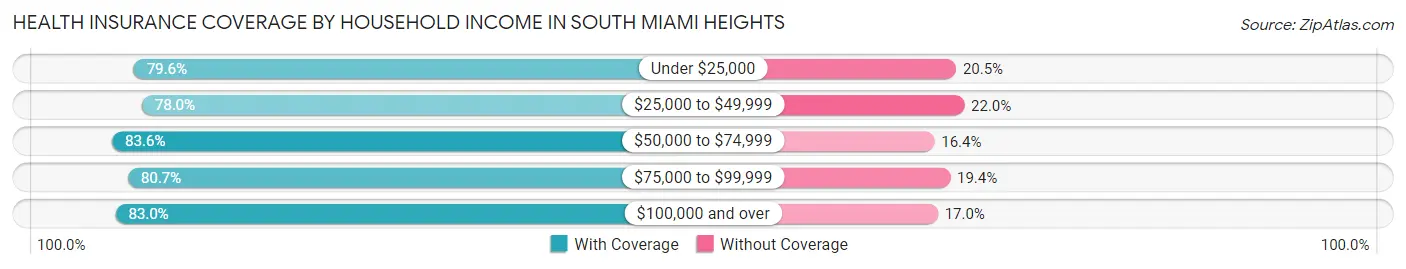
| Household Income | With Coverage | Without Coverage |
| Under $25,000 | 4,586 (79.5%) | 1,179 (20.4%) |
| $25,000 to $49,999 | 4,537 (78.0%) | 1,278 (22.0%) |
| $50,000 to $74,999 | 4,391 (83.6%) | 861 (16.4%) |
| $75,000 to $99,999 | 4,736 (80.6%) | 1,136 (19.4%) |
| $100,000 and over | 10,434 (83.0%) | 2,142 (17.0%) |
Public vs Private Health Insurance Coverage by Age in South Miami Heights
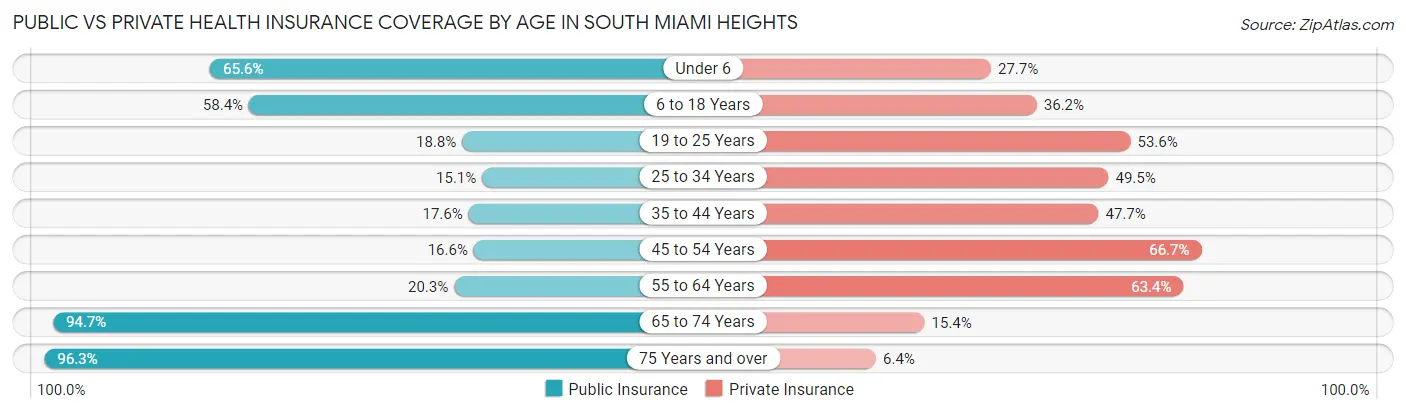
| Age Bracket | Public Insurance | Private Insurance |
| Under 6 | 1,420 (65.6%) | 600 (27.7%) |
| 6 to 18 Years | 3,016 (58.4%) | 1,871 (36.2%) |
| 19 to 25 Years | 514 (18.8%) | 1,466 (53.6%) |
| 25 to 34 Years | 657 (15.1%) | 2,157 (49.5%) |
| 35 to 44 Years | 751 (17.6%) | 2,035 (47.7%) |
| 45 to 54 Years | 890 (16.6%) | 3,572 (66.7%) |
| 55 to 64 Years | 1,069 (20.3%) | 3,341 (63.4%) |
| 65 to 74 Years | 3,451 (94.7%) | 560 (15.4%) |
| 75 Years and over | 2,362 (96.3%) | 156 (6.4%) |
| Total | 14,130 (39.9%) | 15,758 (44.5%) |
Disability Status by Sex by Age in South Miami Heights
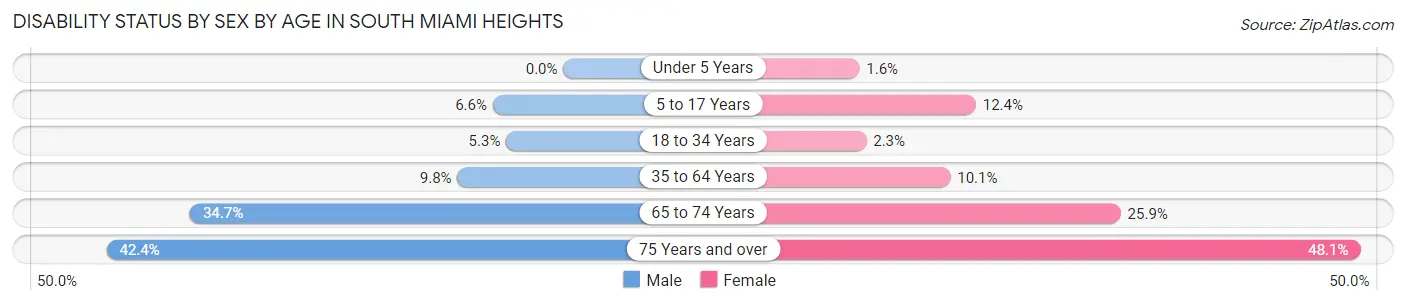
| Age Bracket | Male | Female |
| Under 5 Years | 0 (0.0%) | 11 (1.6%) |
| 5 to 17 Years | 182 (6.6%) | 309 (12.4%) |
| 18 to 34 Years | 203 (5.3%) | 81 (2.3%) |
| 35 to 64 Years | 764 (9.8%) | 717 (10.1%) |
| 65 to 74 Years | 633 (34.6%) | 470 (25.9%) |
| 75 Years and over | 385 (42.4%) | 743 (48.1%) |
Disability Class by Sex by Age in South Miami Heights
Disability Class: Hearing Difficulty
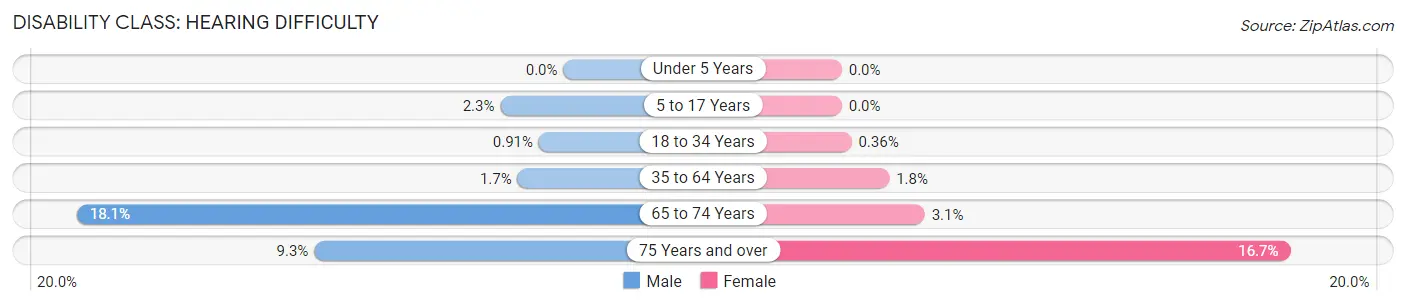
| Age Bracket | Male | Female |
| Under 5 Years | 0 (0.0%) | 0 (0.0%) |
| 5 to 17 Years | 65 (2.3%) | 0 (0.0%) |
| 18 to 34 Years | 35 (0.9%) | 13 (0.4%) |
| 35 to 64 Years | 132 (1.7%) | 125 (1.8%) |
| 65 to 74 Years | 330 (18.1%) | 56 (3.1%) |
| 75 Years and over | 84 (9.2%) | 257 (16.7%) |
Disability Class: Vision Difficulty
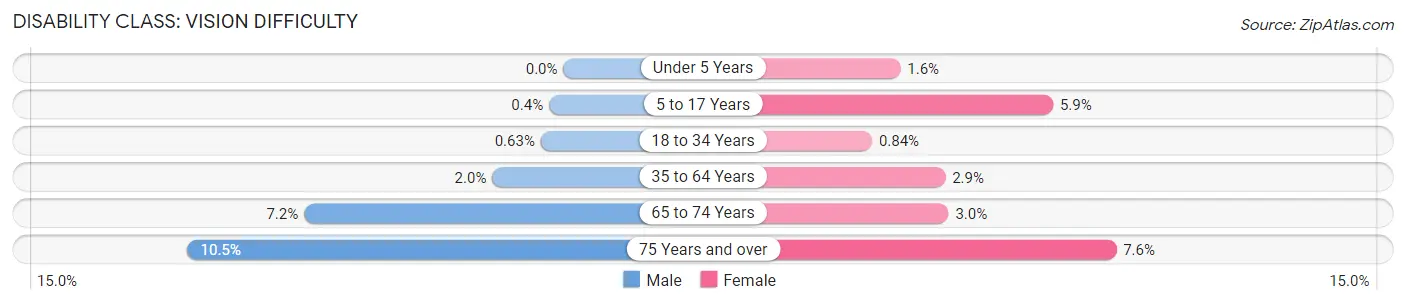
| Age Bracket | Male | Female |
| Under 5 Years | 0 (0.0%) | 11 (1.6%) |
| 5 to 17 Years | 11 (0.4%) | 146 (5.9%) |
| 18 to 34 Years | 24 (0.6%) | 30 (0.8%) |
| 35 to 64 Years | 154 (2.0%) | 205 (2.9%) |
| 65 to 74 Years | 132 (7.2%) | 54 (3.0%) |
| 75 Years and over | 95 (10.5%) | 118 (7.6%) |
Disability Class: Cognitive Difficulty
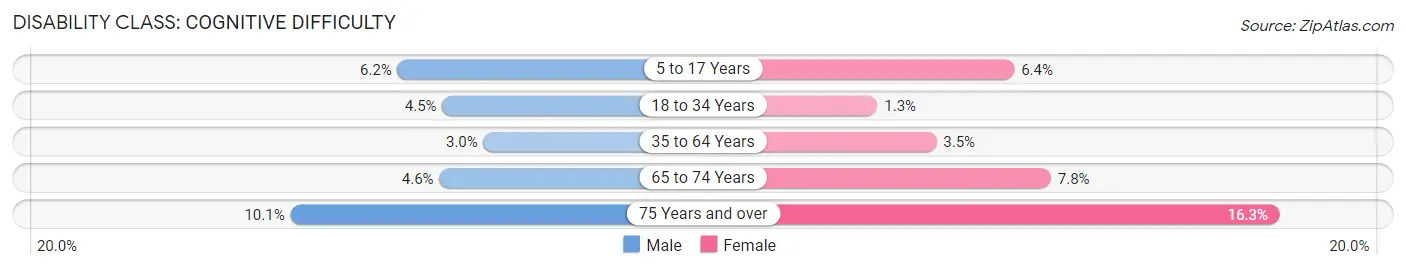
| Age Bracket | Male | Female |
| 5 to 17 Years | 171 (6.1%) | 159 (6.4%) |
| 18 to 34 Years | 172 (4.5%) | 47 (1.3%) |
| 35 to 64 Years | 230 (3.0%) | 250 (3.5%) |
| 65 to 74 Years | 84 (4.6%) | 141 (7.8%) |
| 75 Years and over | 92 (10.1%) | 251 (16.3%) |
Disability Class: Ambulatory Difficulty
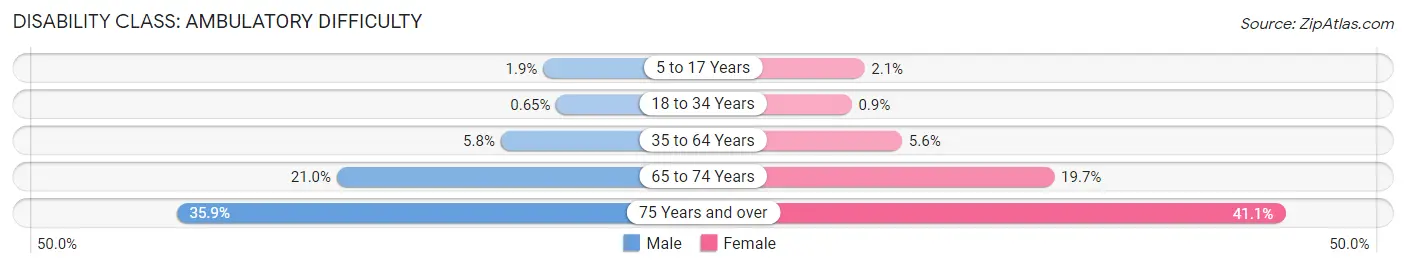
| Age Bracket | Male | Female |
| 5 to 17 Years | 52 (1.9%) | 52 (2.1%) |
| 18 to 34 Years | 25 (0.6%) | 32 (0.9%) |
| 35 to 64 Years | 452 (5.8%) | 397 (5.6%) |
| 65 to 74 Years | 384 (21.0%) | 358 (19.7%) |
| 75 Years and over | 326 (35.9%) | 635 (41.1%) |
Disability Class: Self-Care Difficulty
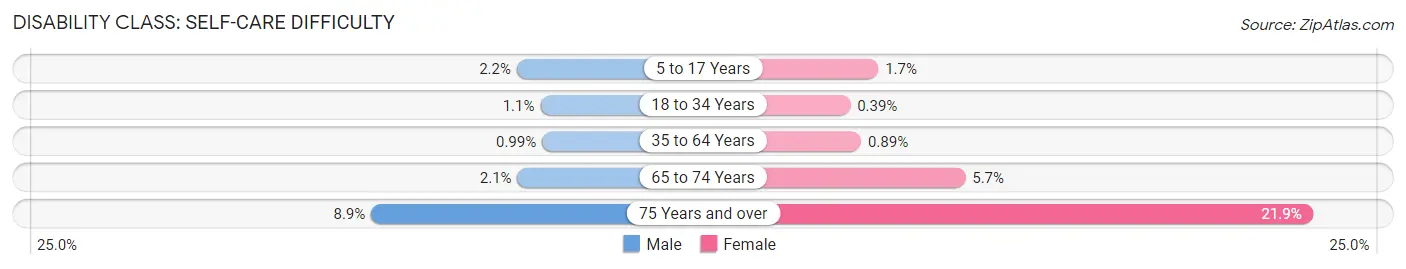
| Age Bracket | Male | Female |
| 5 to 17 Years | 60 (2.2%) | 42 (1.7%) |
| 18 to 34 Years | 41 (1.1%) | 14 (0.4%) |
| 35 to 64 Years | 77 (1.0%) | 63 (0.9%) |
| 65 to 74 Years | 39 (2.1%) | 104 (5.7%) |
| 75 Years and over | 81 (8.9%) | 338 (21.9%) |
Technology Access in South Miami Heights
Computing Device Access in South Miami Heights
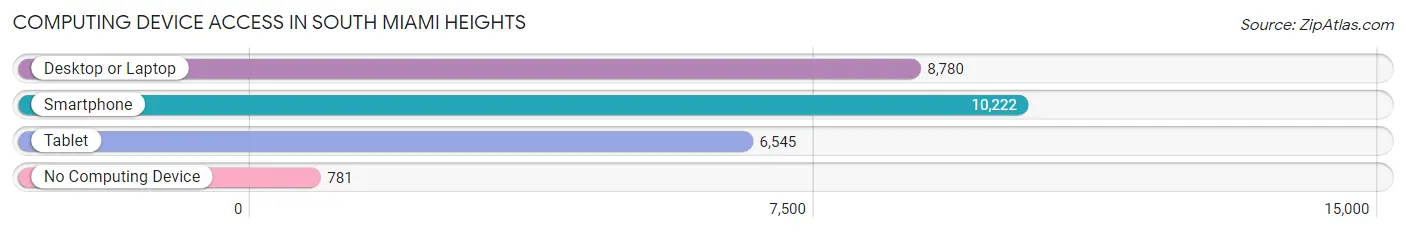
| Device Type | # Households | % Households |
| Desktop or Laptop | 8,780 | 77.0% |
| Smartphone | 10,222 | 89.6% |
| Tablet | 6,545 | 57.4% |
| No Computing Device | 781 | 6.9% |
| Total | 11,405 | 100.0% |
Internet Access in South Miami Heights
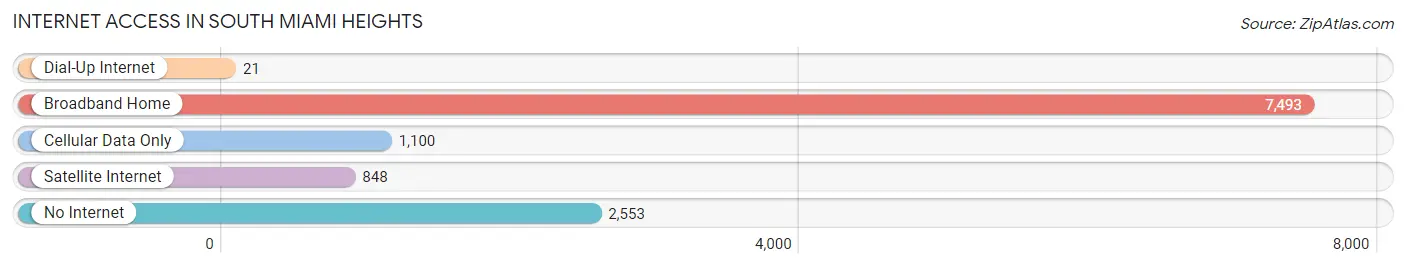
| Internet Type | # Households | % Households |
| Dial-Up Internet | 21 | 0.2% |
| Broadband Home | 7,493 | 65.7% |
| Cellular Data Only | 1,100 | 9.6% |
| Satellite Internet | 848 | 7.4% |
| No Internet | 2,553 | 22.4% |
| Total | 11,405 | 100.0% |
South Miami Heights Summary
Miami-Dade County, Florida, is home to the unincorporated community of South Miami Heights. Located in the southernmost part of the county, South Miami Heights is bordered by the cities of Cutler Bay, Palmetto Bay, and Naranja. The area is known for its diverse population, its proximity to the Everglades, and its vibrant economy.
History
The area now known as South Miami Heights was originally inhabited by the Tequesta Indians. The Tequesta were a Native American tribe that lived in the area for thousands of years before the arrival of Europeans. The first Europeans to settle in the area were Spanish explorers in the 16th century. The area was later settled by homesteaders in the late 19th century.
In the early 20th century, the area was developed as a farming community. The area was known for its large tomato farms and was home to many migrant workers. In the 1950s, the area began to experience rapid growth as more people moved to the area. The area was incorporated as the Town of South Miami Heights in 1957.
Geography
South Miami Heights is located in the southernmost part of Miami-Dade County, Florida. The area is bordered by the cities of Cutler Bay, Palmetto Bay, and Naranja. The area is located near the Everglades and is home to many species of wildlife. The area is also home to several parks, including the South Miami Heights Park and the South Miami Heights Nature Preserve.
The area is located at an elevation of 8 feet above sea level. The area has a humid subtropical climate, with hot and humid summers and mild winters. The average temperature in the area is 78 degrees Fahrenheit.
Economy
South Miami Heights is home to a vibrant economy. The area is home to many businesses, including retail stores, restaurants, and professional services. The area is also home to several industrial parks, which provide jobs for many of the area's residents.
The area is also home to several educational institutions, including Miami Dade College and Florida International University. The area is also home to several medical facilities, including Baptist Hospital and South Miami Hospital.
Demographics
As of the 2010 census, South Miami Heights had a population of 24,717. The population is diverse, with a mix of Hispanic, African American, and White residents. The median household income in the area is $41,945, and the median home value is $179,000.
Conclusion
South Miami Heights is a vibrant and diverse community located in the southernmost part of Miami-Dade County, Florida. The area is known for its proximity to the Everglades, its diverse population, and its vibrant economy. The area is home to many businesses, educational institutions, and medical facilities, providing jobs and services for many of the area's residents.
Common Questions
What is Per Capita Income in South Miami Heights?
Per Capita income in South Miami Heights is $25,089.
What is the Median Family Income in South Miami Heights?
Median Family Income in South Miami Heights is $68,835.
What is the Median Household income in South Miami Heights?
Median Household Income in South Miami Heights is $59,946.
What is Income or Wage Gap in South Miami Heights?
Income or Wage Gap in South Miami Heights is 20.6%.
Women in South Miami Heights earn 79.4 cents for every dollar earned by a man.
What is Family Income Deficit in South Miami Heights?
Family Income Deficit in South Miami Heights is $9,045.
Families that are below poverty line in South Miami Heights earn $9,045 less on average than the poverty threshold level.
What is Inequality or Gini Index in South Miami Heights?
Inequality or Gini Index in South Miami Heights is 0.46.
What is the Total Population of South Miami Heights?
Total Population of South Miami Heights is 35,705.
What is the Total Male Population of South Miami Heights?
Total Male Population of South Miami Heights is 18,350.
What is the Total Female Population of South Miami Heights?
Total Female Population of South Miami Heights is 17,355.
What is the Ratio of Males per 100 Females in South Miami Heights?
There are 105.73 Males per 100 Females in South Miami Heights.
What is the Ratio of Females per 100 Males in South Miami Heights?
There are 94.58 Females per 100 Males in South Miami Heights.
What is the Median Population Age in South Miami Heights?
Median Population Age in South Miami Heights is 42.5 Years.
What is the Average Family Size in South Miami Heights
Average Family Size in South Miami Heights is 3.5 People.
What is the Average Household Size in South Miami Heights
Average Household Size in South Miami Heights is 3.1 People.
How Large is the Labor Force in South Miami Heights?
There are 18,554 People in the Labor Forcein in South Miami Heights.
What is the Percentage of People in the Labor Force in South Miami Heights?
62.8% of People are in the Labor Force in South Miami Heights.
What is the Unemployment Rate in South Miami Heights?
Unemployment Rate in South Miami Heights is 5.9%.