Olive Branch, MS Map & Demographics
Olive Branch Map
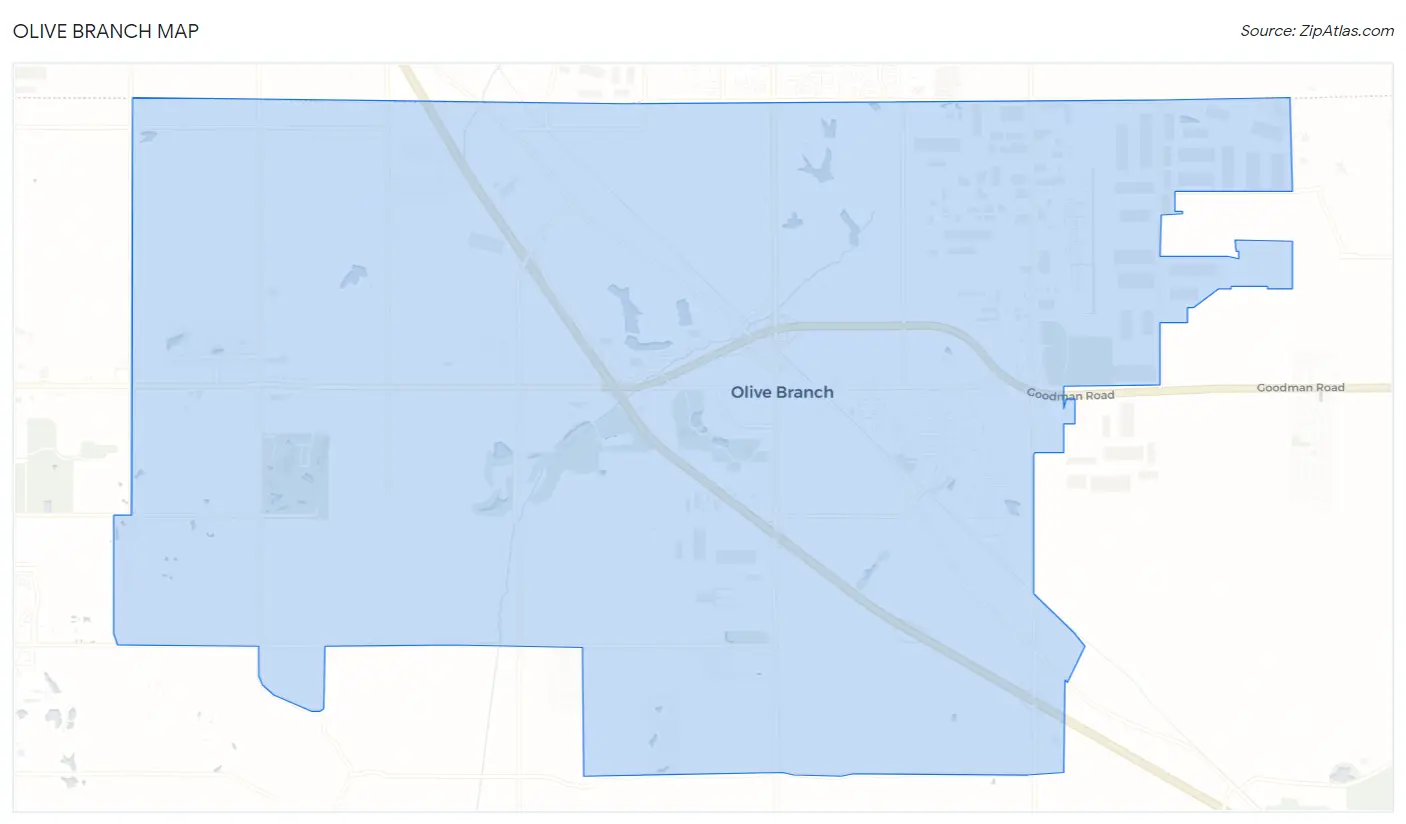
Olive Branch Overview
$40,277
PER CAPITA INCOME
$103,581
AVG FAMILY INCOME
$93,762
AVG HOUSEHOLD INCOME
30.2%
WAGE / INCOME GAP [ % ]
69.8¢/ $1
WAGE / INCOME GAP [ $ ]
0.37
INEQUALITY / GINI INDEX
45,938
TOTAL POPULATION
21,822
MALE POPULATION
24,116
FEMALE POPULATION
90.49
MALES / 100 FEMALES
110.51
FEMALES / 100 MALES
38.2
MEDIAN AGE
3.1
AVG FAMILY SIZE
2.7
AVG HOUSEHOLD SIZE
25,034
LABOR FORCE [ PEOPLE ]
69.3%
PERCENT IN LABOR FORCE
2.7%
UNEMPLOYMENT RATE
Olive Branch Zip Codes
Olive Branch Area Codes
Income in Olive Branch
Income Overview in Olive Branch
Per Capita Income in Olive Branch is $40,277, while median incomes of families and households are $103,581 and $93,762 respectively.
| Characteristic | Number | Measure |
| Per Capita Income | 45,938 | $40,277 |
| Median Family Income | 12,492 | $103,581 |
| Mean Family Income | 12,492 | $118,873 |
| Median Household Income | 17,054 | $93,762 |
| Mean Household Income | 17,054 | $107,866 |
| Income Deficit | 12,492 | $0 |
| Wage / Income Gap (%) | 45,938 | 30.15% |
| Wage / Income Gap ($) | 45,938 | 69.85¢ per $1 |
| Gini / Inequality Index | 45,938 | 0.37 |
Earnings by Sex in Olive Branch
Average Earnings in Olive Branch are $47,981, $55,645 for men and $38,866 for women, a difference of 30.1%.
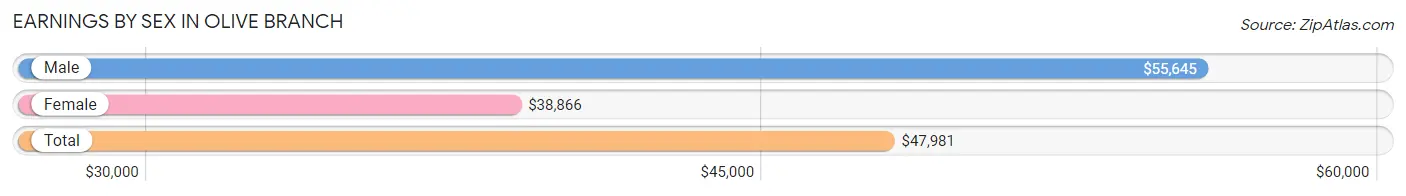
| Sex | Number | Average Earnings |
| Male | 13,299 (51.1%) | $55,645 |
| Female | 12,709 (48.9%) | $38,866 |
| Total | 26,008 (100.0%) | $47,981 |
Earnings by Sex by Income Bracket in Olive Branch
The most common earnings brackets in Olive Branch are $100,000+ for men (2,453 | 18.4%) and $75,000 to $99,999 for women (1,323 | 10.4%).
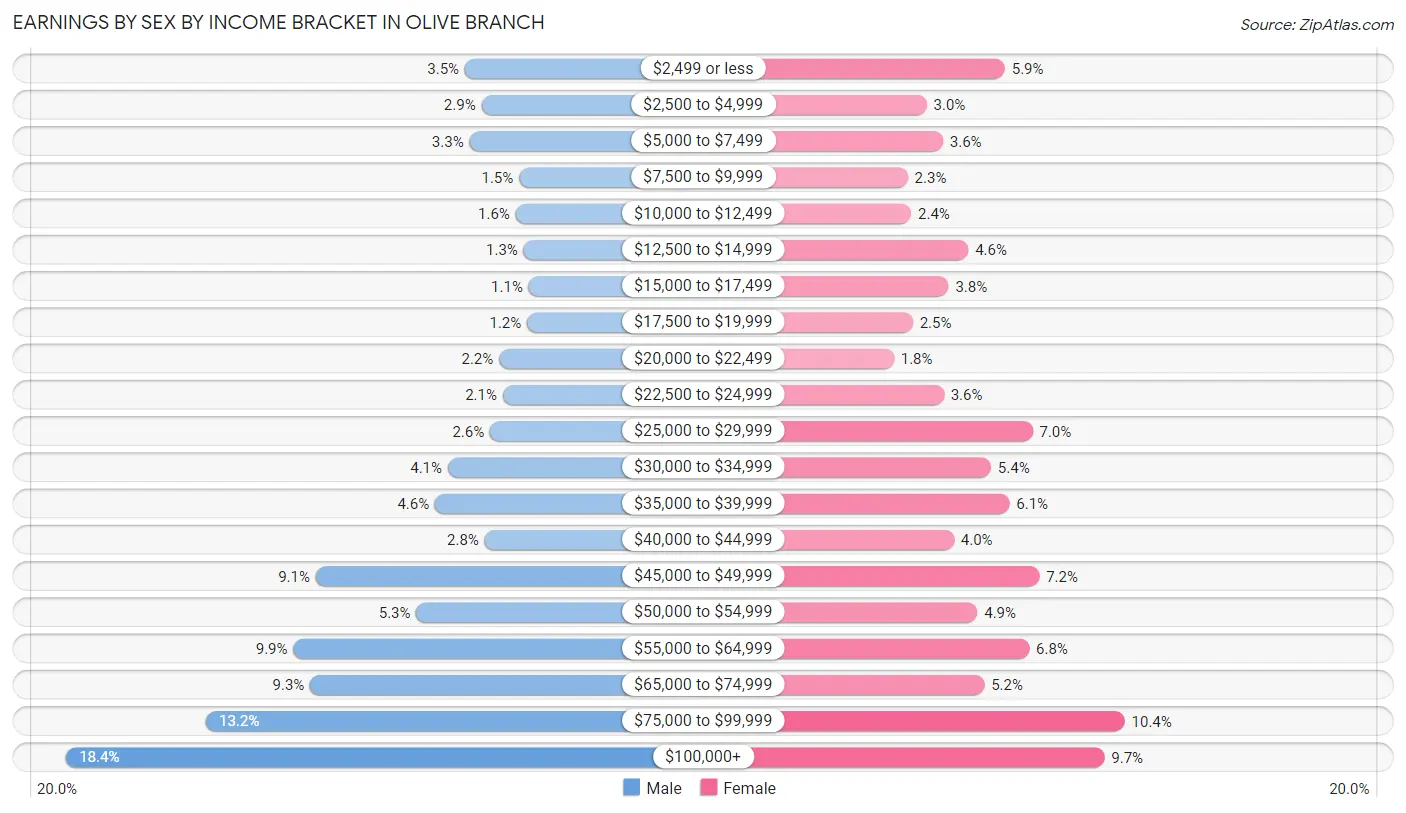
| Income | Male | Female |
| $2,499 or less | 465 (3.5%) | 752 (5.9%) |
| $2,500 to $4,999 | 383 (2.9%) | 380 (3.0%) |
| $5,000 to $7,499 | 443 (3.3%) | 457 (3.6%) |
| $7,500 to $9,999 | 196 (1.5%) | 290 (2.3%) |
| $10,000 to $12,499 | 213 (1.6%) | 306 (2.4%) |
| $12,500 to $14,999 | 173 (1.3%) | 578 (4.5%) |
| $15,000 to $17,499 | 147 (1.1%) | 484 (3.8%) |
| $17,500 to $19,999 | 155 (1.2%) | 314 (2.5%) |
| $20,000 to $22,499 | 295 (2.2%) | 224 (1.8%) |
| $22,500 to $24,999 | 276 (2.1%) | 461 (3.6%) |
| $25,000 to $29,999 | 340 (2.6%) | 884 (7.0%) |
| $30,000 to $34,999 | 551 (4.1%) | 686 (5.4%) |
| $35,000 to $39,999 | 614 (4.6%) | 774 (6.1%) |
| $40,000 to $44,999 | 367 (2.8%) | 510 (4.0%) |
| $45,000 to $49,999 | 1,209 (9.1%) | 916 (7.2%) |
| $50,000 to $54,999 | 707 (5.3%) | 621 (4.9%) |
| $55,000 to $64,999 | 1,320 (9.9%) | 868 (6.8%) |
| $65,000 to $74,999 | 1,237 (9.3%) | 654 (5.1%) |
| $75,000 to $99,999 | 1,755 (13.2%) | 1,323 (10.4%) |
| $100,000+ | 2,453 (18.4%) | 1,227 (9.7%) |
| Total | 13,299 (100.0%) | 12,709 (100.0%) |
Earnings by Sex by Educational Attainment in Olive Branch
Average earnings in Olive Branch are $60,080 for men and $45,834 for women, a difference of 23.7%. Men with an educational attainment of graduate degree enjoy the highest average annual earnings of $89,298, while those with less than high school education earn the least with $36,591. Women with an educational attainment of graduate degree earn the most with the average annual earnings of $63,849, while those with less than high school education have the smallest earnings of $18,438.
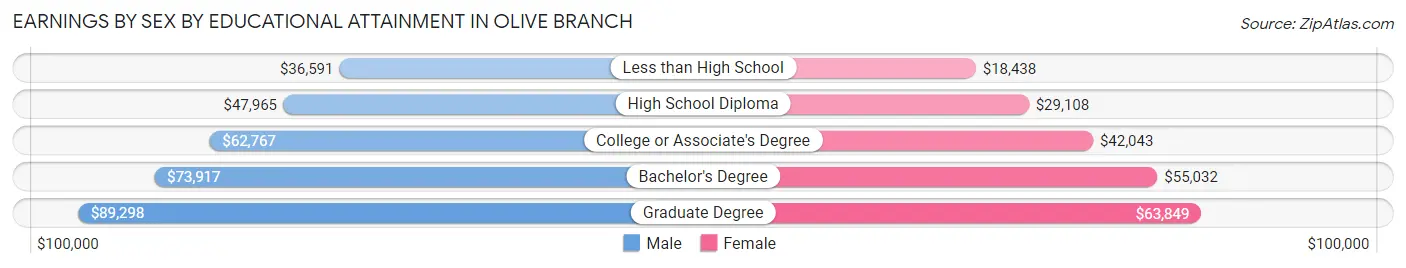
| Educational Attainment | Male Income | Female Income |
| Less than High School | $36,591 | $18,438 |
| High School Diploma | $47,965 | $29,108 |
| College or Associate's Degree | $62,767 | $42,043 |
| Bachelor's Degree | $73,917 | $55,032 |
| Graduate Degree | $89,298 | $63,849 |
| Total | $60,080 | $45,834 |
Family Income in Olive Branch
Family Income Brackets in Olive Branch
According to the Olive Branch family income data, there are 3,498 families falling into the $100,000 to $149,999 income range, which is the most common income bracket and makes up 28.0% of all families. Conversely, the $10,000 to $14,999 income bracket is the least frequent group with only 150 families (1.2%) belonging to this category.
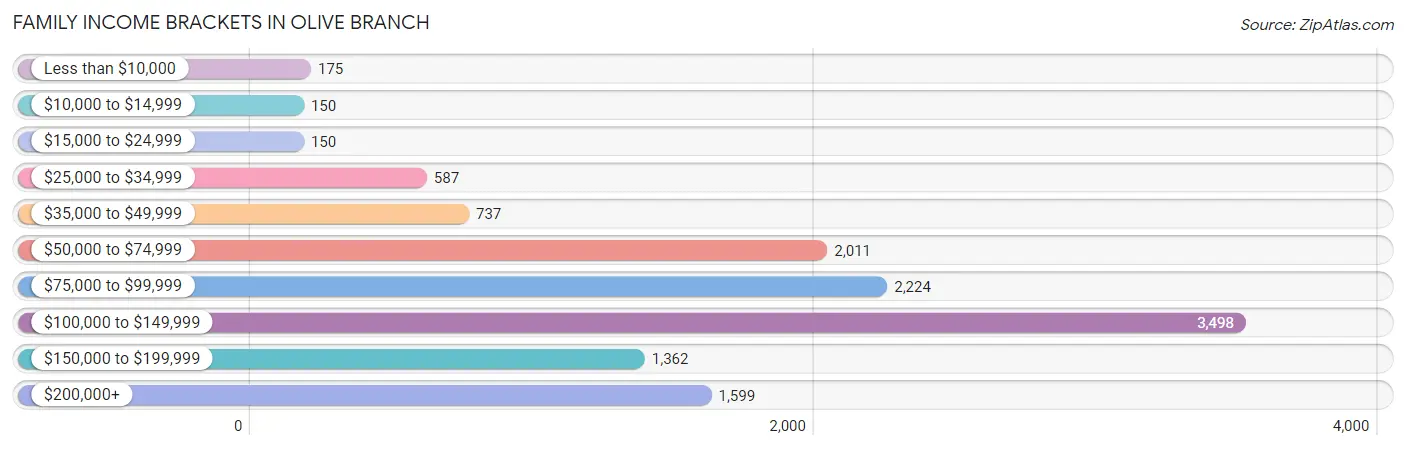
| Income Bracket | # Families | % Families |
| Less than $10,000 | 175 | 1.4% |
| $10,000 to $14,999 | 150 | 1.2% |
| $15,000 to $24,999 | 150 | 1.2% |
| $25,000 to $34,999 | 587 | 4.7% |
| $35,000 to $49,999 | 737 | 5.9% |
| $50,000 to $74,999 | 2,011 | 16.1% |
| $75,000 to $99,999 | 2,224 | 17.8% |
| $100,000 to $149,999 | 3,498 | 28.0% |
| $150,000 to $199,999 | 1,362 | 10.9% |
| $200,000+ | 1,599 | 12.8% |
Family Income by Famaliy Size in Olive Branch
5-person families (1,311 | 10.5%) account for the highest median family income in Olive Branch with $129,539 per family, while 2-person families (5,347 | 42.8%) have the highest median income of $43,787 per family member.
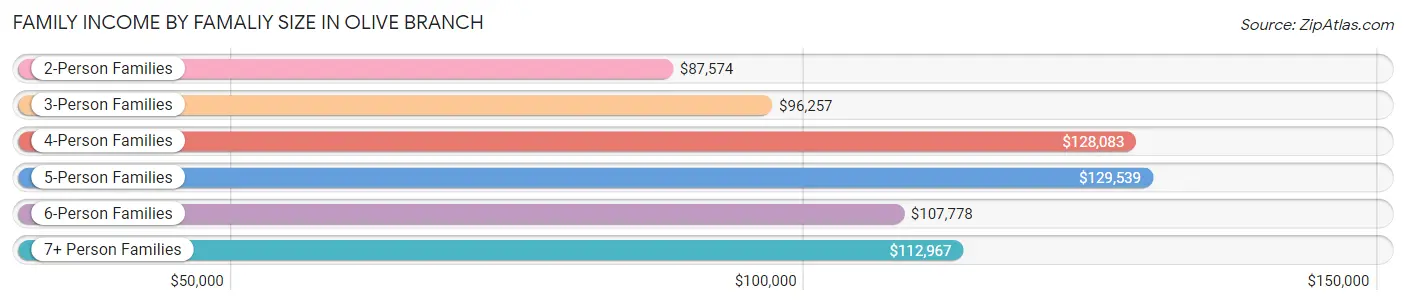
| Income Bracket | # Families | Median Income |
| 2-Person Families | 5,347 (42.8%) | $87,574 |
| 3-Person Families | 3,098 (24.8%) | $96,257 |
| 4-Person Families | 2,169 (17.4%) | $128,083 |
| 5-Person Families | 1,311 (10.5%) | $129,539 |
| 6-Person Families | 316 (2.5%) | $107,778 |
| 7+ Person Families | 251 (2.0%) | $112,967 |
| Total | 12,492 (100.0%) | $103,581 |
Family Income by Number of Earners in Olive Branch
The median family income in Olive Branch is $103,581, with families comprising 2 earners (5,443) having the highest median family income of $123,839, while families with no earners (1,291) have the lowest median family income of $58,774, accounting for 43.6% and 10.3% of families, respectively.
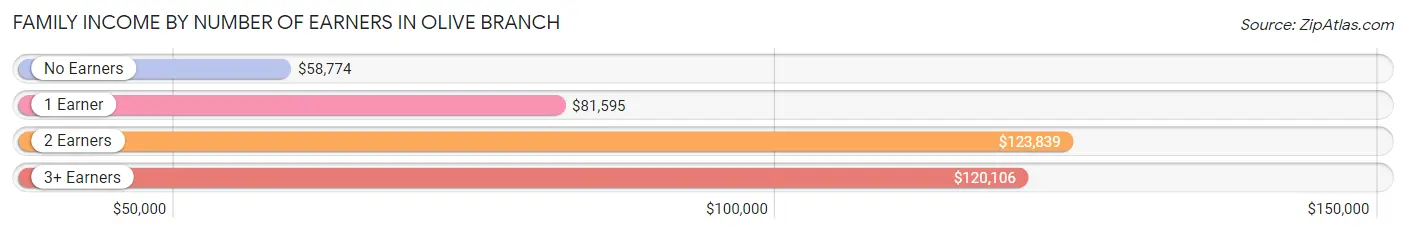
| Number of Earners | # Families | Median Income |
| No Earners | 1,291 (10.3%) | $58,774 |
| 1 Earner | 3,830 (30.7%) | $81,595 |
| 2 Earners | 5,443 (43.6%) | $123,839 |
| 3+ Earners | 1,928 (15.4%) | $120,106 |
| Total | 12,492 (100.0%) | $103,581 |
Household Income in Olive Branch
Household Income Brackets in Olive Branch
With 4,502 households falling in the category, the $100,000 to $149,999 income range is the most frequent in Olive Branch, accounting for 26.4% of all households. In contrast, only 290 households (1.7%) fall into the less than $10,000 income bracket, making it the least populous group.
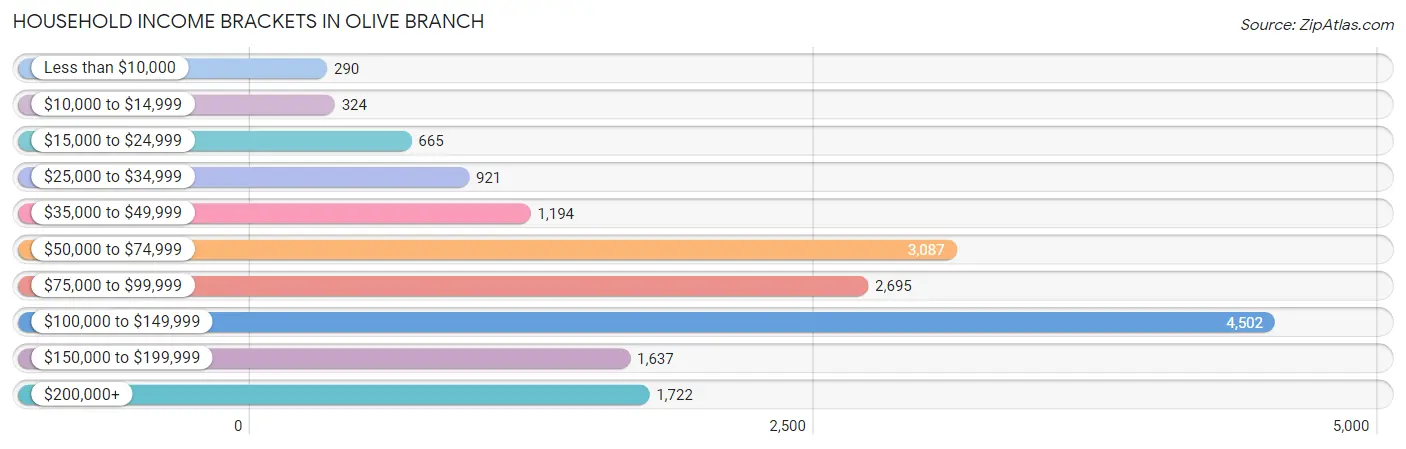
| Income Bracket | # Households | % Households |
| Less than $10,000 | 290 | 1.7% |
| $10,000 to $14,999 | 324 | 1.9% |
| $15,000 to $24,999 | 665 | 3.9% |
| $25,000 to $34,999 | 921 | 5.4% |
| $35,000 to $49,999 | 1,194 | 7.0% |
| $50,000 to $74,999 | 3,087 | 18.1% |
| $75,000 to $99,999 | 2,695 | 15.8% |
| $100,000 to $149,999 | 4,502 | 26.4% |
| $150,000 to $199,999 | 1,637 | 9.6% |
| $200,000+ | 1,722 | 10.1% |
Household Income by Householder Age in Olive Branch
The median household income in Olive Branch is $93,762, with the highest median household income of $104,733 found in the 45 to 64 years age bracket for the primary householder. A total of 6,572 households (38.5%) fall into this category. Meanwhile, the 15 to 24 years age bracket for the primary householder has the lowest median household income of $62,784, with 343 households (2.0%) in this group.
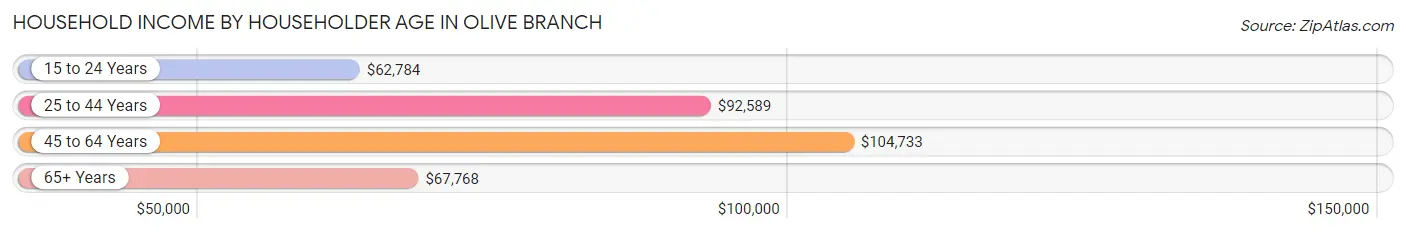
| Income Bracket | # Households | Median Income |
| 15 to 24 Years | 343 (2.0%) | $62,784 |
| 25 to 44 Years | 6,272 (36.8%) | $92,589 |
| 45 to 64 Years | 6,572 (38.5%) | $104,733 |
| 65+ Years | 3,867 (22.7%) | $67,768 |
| Total | 17,054 (100.0%) | $93,762 |
Poverty in Olive Branch
Income Below Poverty by Sex and Age in Olive Branch
With 4.6% poverty level for males and 5.5% for females among the residents of Olive Branch, 16 and 17 year old males and 15 year old females are the most vulnerable to poverty, with 85 males (11.4%) and 38 females (18.0%) in their respective age groups living below the poverty level.
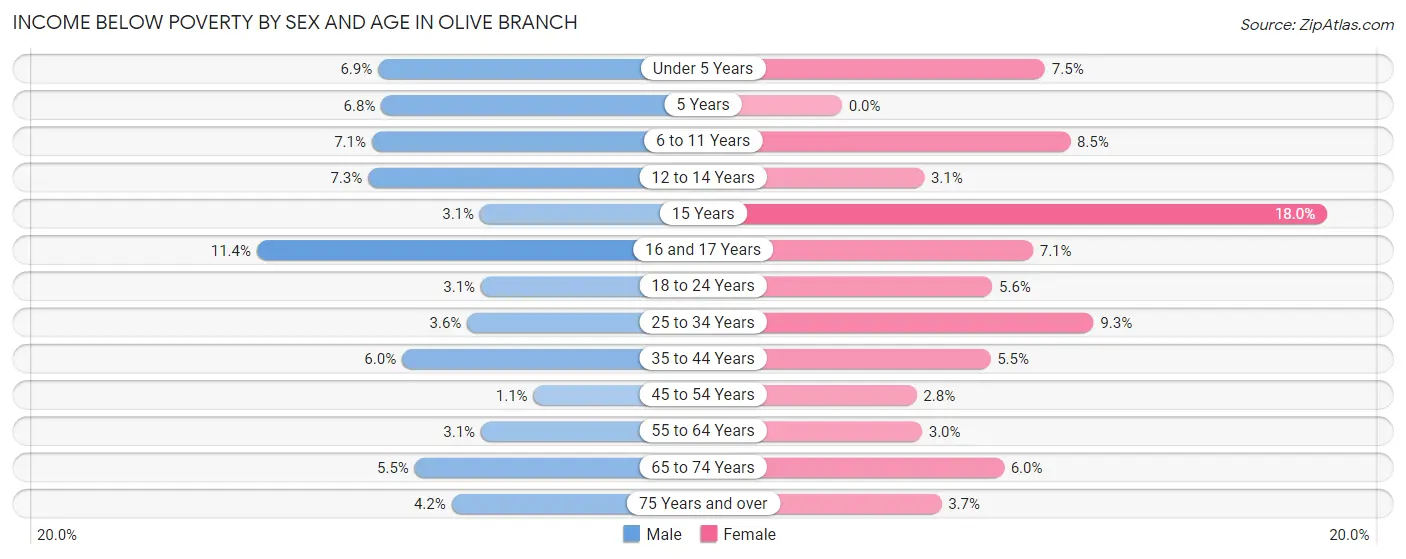
| Age Bracket | Male | Female |
| Under 5 Years | 81 (6.9%) | 109 (7.5%) |
| 5 Years | 23 (6.8%) | 0 (0.0%) |
| 6 to 11 Years | 108 (7.1%) | 155 (8.5%) |
| 12 to 14 Years | 98 (7.2%) | 26 (3.0%) |
| 15 Years | 12 (3.1%) | 38 (18.0%) |
| 16 and 17 Years | 85 (11.4%) | 49 (7.1%) |
| 18 to 24 Years | 54 (3.1%) | 126 (5.6%) |
| 25 to 34 Years | 97 (3.6%) | 269 (9.3%) |
| 35 to 44 Years | 183 (6.0%) | 191 (5.5%) |
| 45 to 54 Years | 33 (1.1%) | 87 (2.8%) |
| 55 to 64 Years | 84 (3.1%) | 89 (3.0%) |
| 65 to 74 Years | 94 (5.5%) | 127 (6.0%) |
| 75 Years and over | 50 (4.2%) | 61 (3.7%) |
| Total | 1,002 (4.6%) | 1,327 (5.5%) |
Income Above Poverty by Sex and Age in Olive Branch
According to the poverty statistics in Olive Branch, males aged 45 to 54 years and females aged 5 years are the age groups that are most secure financially, with 98.9% of males and 100.0% of females in these age groups living above the poverty line.
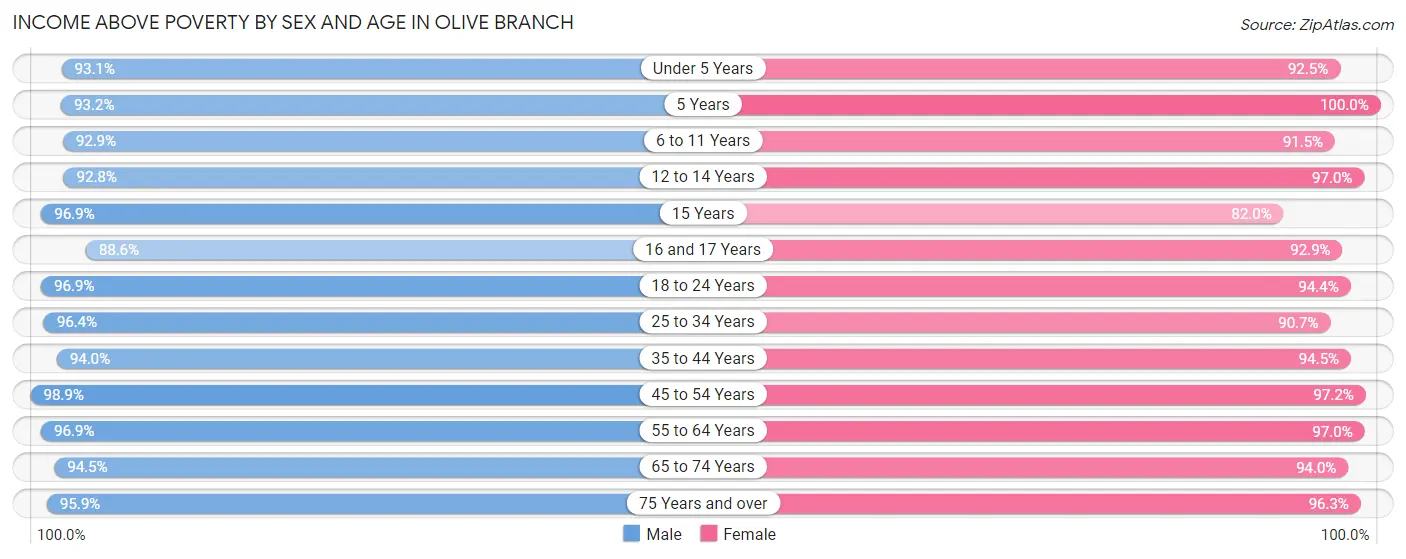
| Age Bracket | Male | Female |
| Under 5 Years | 1,097 (93.1%) | 1,336 (92.5%) |
| 5 Years | 317 (93.2%) | 408 (100.0%) |
| 6 to 11 Years | 1,410 (92.9%) | 1,674 (91.5%) |
| 12 to 14 Years | 1,254 (92.7%) | 826 (97.0%) |
| 15 Years | 375 (96.9%) | 173 (82.0%) |
| 16 and 17 Years | 662 (88.6%) | 642 (92.9%) |
| 18 to 24 Years | 1,712 (96.9%) | 2,133 (94.4%) |
| 25 to 34 Years | 2,620 (96.4%) | 2,611 (90.7%) |
| 35 to 44 Years | 2,874 (94.0%) | 3,274 (94.5%) |
| 45 to 54 Years | 2,947 (98.9%) | 3,054 (97.2%) |
| 55 to 64 Years | 2,659 (96.9%) | 2,906 (97.0%) |
| 65 to 74 Years | 1,609 (94.5%) | 1,986 (94.0%) |
| 75 Years and over | 1,156 (95.9%) | 1,590 (96.3%) |
| Total | 20,692 (95.4%) | 22,613 (94.5%) |
Income Below Poverty Among Married-Couple Families in Olive Branch
The poverty statistics for married-couple families in Olive Branch show that 3.1% or 291 of the total 9,340 families live below the poverty line. Families with 5 or more children have the highest poverty rate of 15.6%, comprising of 20 families. On the other hand, families with no children have the lowest poverty rate of 1.6%, which includes 85 families.
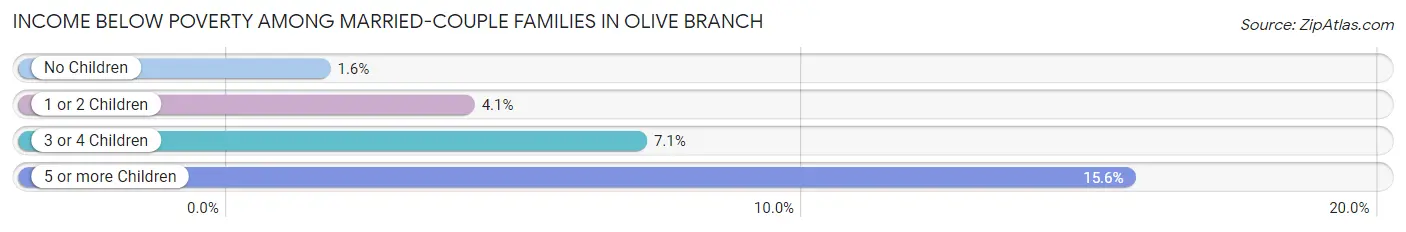
| Children | Above Poverty | Below Poverty |
| No Children | 5,186 (98.4%) | 85 (1.6%) |
| 1 or 2 Children | 3,025 (95.9%) | 130 (4.1%) |
| 3 or 4 Children | 730 (92.9%) | 56 (7.1%) |
| 5 or more Children | 108 (84.4%) | 20 (15.6%) |
| Total | 9,049 (96.9%) | 291 (3.1%) |
Income Below Poverty Among Single-Parent Households in Olive Branch
According to the poverty data in Olive Branch, 1.3% or 11 single-father households and 7.6% or 177 single-mother households are living below the poverty line. Among single-father households, those with no children have the highest poverty rate, with 11 households (3.3%) experiencing poverty. Likewise, among single-mother households, those with 1 or 2 children have the highest poverty rate, with 146 households (12.6%) falling below the poverty line.
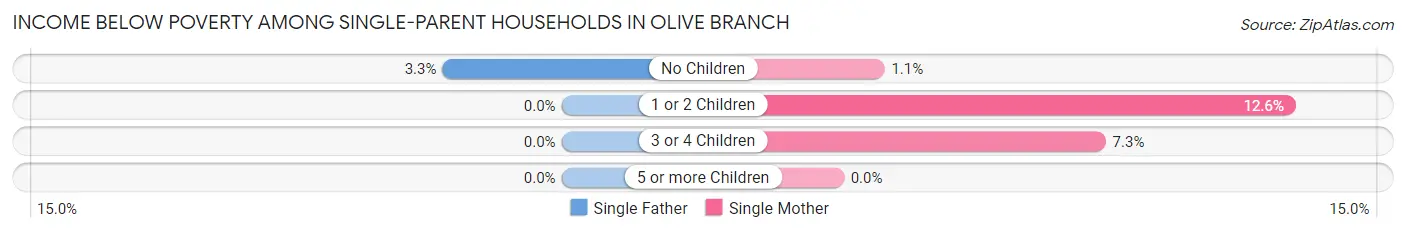
| Children | Single Father | Single Mother |
| No Children | 11 (3.3%) | 10 (1.1%) |
| 1 or 2 Children | 0 (0.0%) | 146 (12.6%) |
| 3 or 4 Children | 0 (0.0%) | 21 (7.3%) |
| 5 or more Children | 0 (0.0%) | 0 (0.0%) |
| Total | 11 (1.3%) | 177 (7.6%) |
Income Below Poverty Among Married-Couple vs Single-Parent Households in Olive Branch
The poverty data for Olive Branch shows that 291 of the married-couple family households (3.1%) and 188 of the single-parent households (6.0%) are living below the poverty level. Within the married-couple family households, those with 5 or more children have the highest poverty rate, with 20 households (15.6%) falling below the poverty line. Among the single-parent households, those with 1 or 2 children have the highest poverty rate, with 146 household (8.9%) living below poverty.
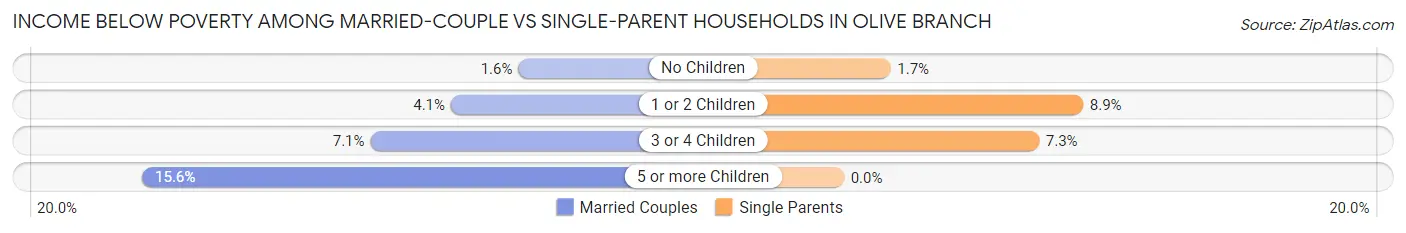
| Children | Married-Couple Families | Single-Parent Households |
| No Children | 85 (1.6%) | 21 (1.7%) |
| 1 or 2 Children | 130 (4.1%) | 146 (8.9%) |
| 3 or 4 Children | 56 (7.1%) | 21 (7.3%) |
| 5 or more Children | 20 (15.6%) | 0 (0.0%) |
| Total | 291 (3.1%) | 188 (6.0%) |
Race in Olive Branch
The most populous races in Olive Branch are White / Caucasian (27,284 | 59.4%), Black / African American (14,813 | 32.3%), and Hispanic or Latino (2,344 | 5.1%).
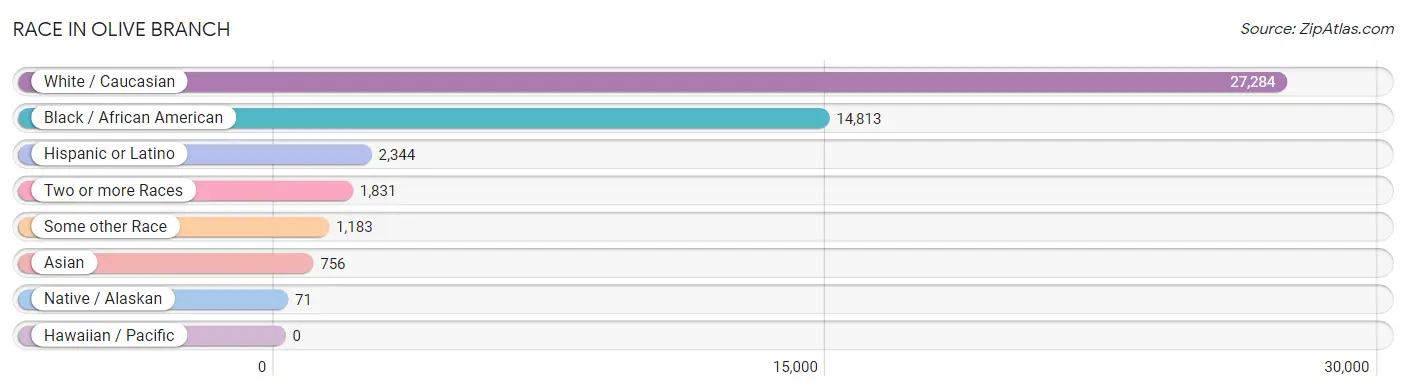
| Race | # Population | % Population |
| Asian | 756 | 1.7% |
| Black / African American | 14,813 | 32.3% |
| Hawaiian / Pacific | 0 | 0.0% |
| Hispanic or Latino | 2,344 | 5.1% |
| Native / Alaskan | 71 | 0.2% |
| White / Caucasian | 27,284 | 59.4% |
| Two or more Races | 1,831 | 4.0% |
| Some other Race | 1,183 | 2.6% |
| Total | 45,938 | 100.0% |
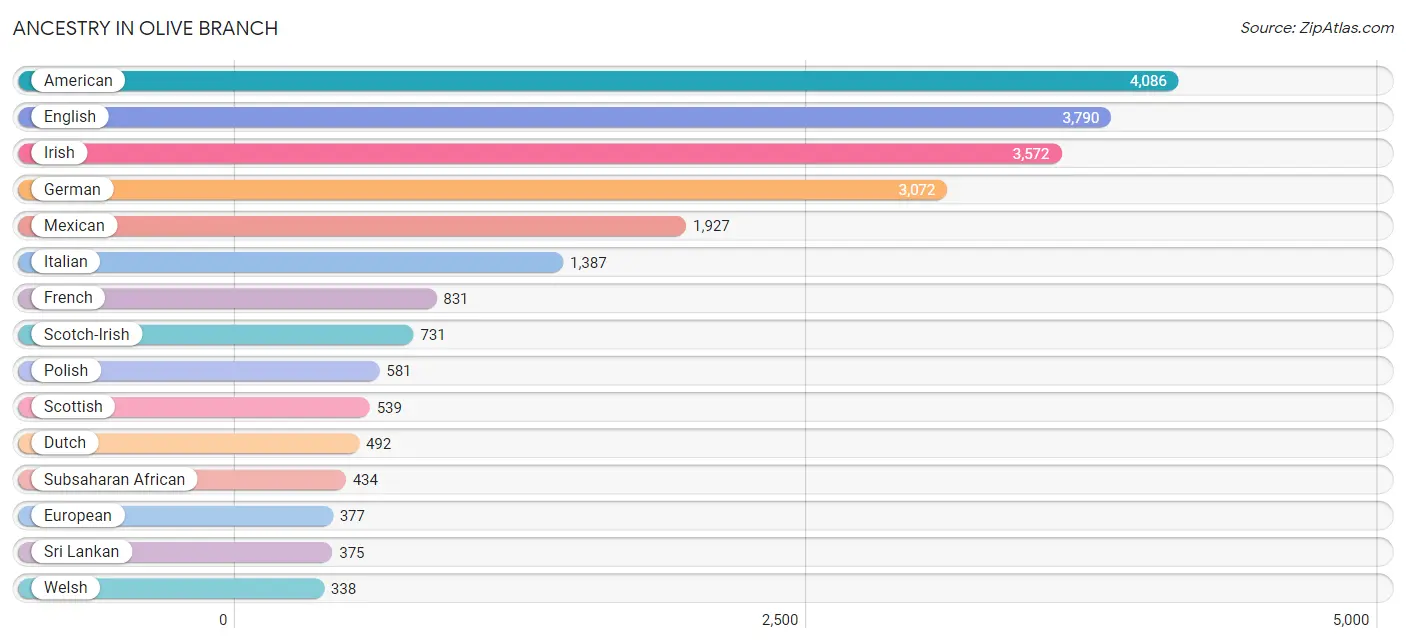
Ancestry in Olive Branch
The most populous ancestries reported in Olive Branch are American (4,086 | 8.9%), English (3,790 | 8.3%), Irish (3,572 | 7.8%), German (3,072 | 6.7%), and Mexican (1,927 | 4.2%), together accounting for 35.8% of all Olive Branch residents.
| Ancestry | # Population | % Population |
| African | 227 | 0.5% |
| Alsatian | 19 | 0.0% |
| American | 4,086 | 8.9% |
| Arab | 137 | 0.3% |
| Argentinean | 11 | 0.0% |
| Belgian | 17 | 0.0% |
| Bhutanese | 14 | 0.0% |
| Blackfeet | 22 | 0.1% |
| British | 101 | 0.2% |
| Central American | 23 | 0.1% |
| Central American Indian | 8 | 0.0% |
| Cherokee | 148 | 0.3% |
| Chilean | 28 | 0.1% |
| Choctaw | 23 | 0.1% |
| Cuban | 82 | 0.2% |
| Czech | 28 | 0.1% |
| Danish | 54 | 0.1% |
| Dominican | 46 | 0.1% |
| Dutch | 492 | 1.1% |
| Eastern European | 37 | 0.1% |
| Ecuadorian | 61 | 0.1% |
| English | 3,790 | 8.3% |
| Ethiopian | 99 | 0.2% |
| European | 377 | 0.8% |
| French | 831 | 1.8% |
| French Canadian | 99 | 0.2% |
| German | 3,072 | 6.7% |
| Greek | 163 | 0.4% |
| Guatemalan | 2 | 0.0% |
| Guyanese | 323 | 0.7% |
| Hungarian | 57 | 0.1% |
| Icelander | 10 | 0.0% |
| Indian (Asian) | 67 | 0.2% |
| Irish | 3,572 | 7.8% |
| Italian | 1,387 | 3.0% |
| Japanese | 8 | 0.0% |
| Korean | 184 | 0.4% |
| Lebanese | 7 | 0.0% |
| Mexican | 1,927 | 4.2% |
| Nigerian | 71 | 0.2% |
| Northern European | 35 | 0.1% |
| Norwegian | 202 | 0.4% |
| Pakistani | 28 | 0.1% |
| Peruvian | 34 | 0.1% |
| Polish | 581 | 1.3% |
| Portuguese | 30 | 0.1% |
| Puerto Rican | 101 | 0.2% |
| Russian | 235 | 0.5% |
| Salvadoran | 21 | 0.1% |
| Scandinavian | 44 | 0.1% |
| Scotch-Irish | 731 | 1.6% |
| Scottish | 539 | 1.2% |
| Sioux | 30 | 0.1% |
| Slovak | 22 | 0.1% |
| South African | 37 | 0.1% |
| South American | 134 | 0.3% |
| Spaniard | 8 | 0.0% |
| Spanish | 17 | 0.0% |
| Sri Lankan | 375 | 0.8% |
| Subsaharan African | 434 | 0.9% |
| Swedish | 220 | 0.5% |
| Swiss | 49 | 0.1% |
| Syrian | 19 | 0.0% |
| Thai | 153 | 0.3% |
| Ukrainian | 17 | 0.0% |
| Welsh | 338 | 0.7% | View All 66 Rows |
Immigrants in Olive Branch
The most numerous immigrant groups reported in Olive Branch came from Latin America (1,138 | 2.5%), Central America (979 | 2.1%), Mexico (967 | 2.1%), Asia (565 | 1.2%), and South Eastern Asia (303 | 0.7%), together accounting for 8.6% of all Olive Branch residents.
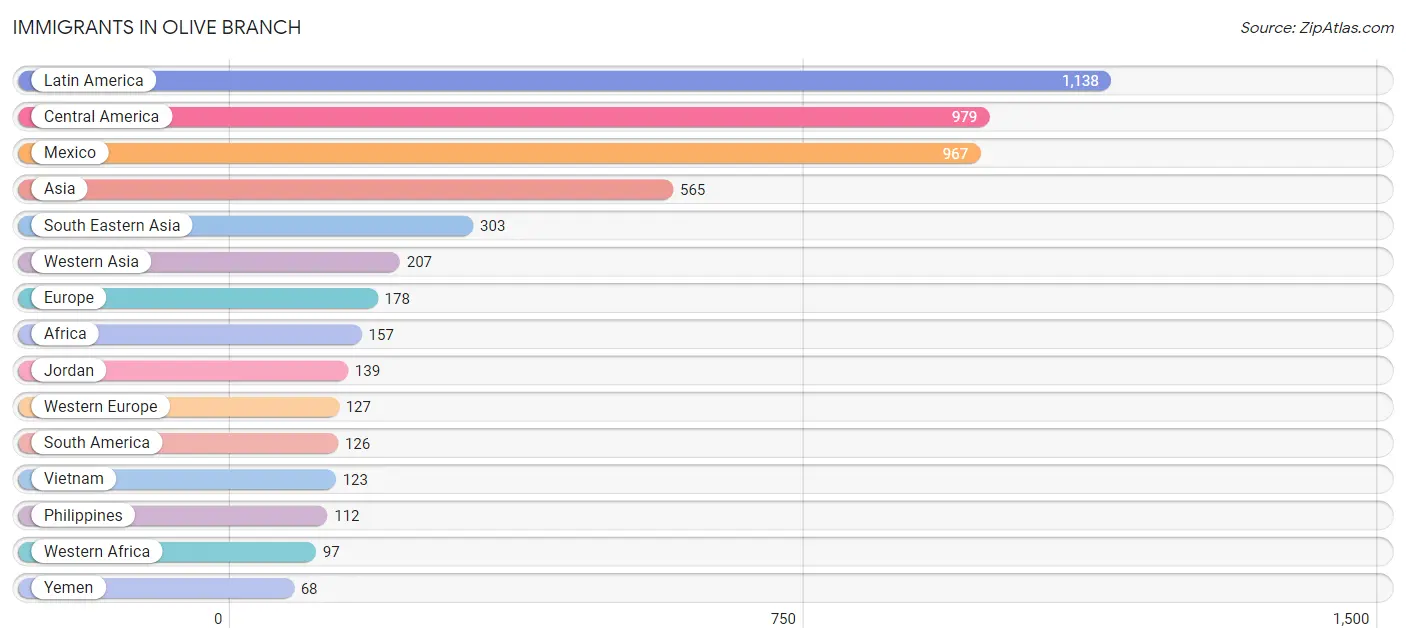
| Immigration Origin | # Population | % Population |
| Africa | 157 | 0.3% |
| Argentina | 11 | 0.0% |
| Asia | 565 | 1.2% |
| Australia | 23 | 0.1% |
| Canada | 26 | 0.1% |
| Caribbean | 33 | 0.1% |
| Central America | 979 | 2.1% |
| Chile | 28 | 0.1% |
| China | 19 | 0.0% |
| Colombia | 50 | 0.1% |
| Dominican Republic | 33 | 0.1% |
| Eastern Africa | 51 | 0.1% |
| Eastern Asia | 24 | 0.1% |
| Eastern Europe | 27 | 0.1% |
| Ecuador | 11 | 0.0% |
| El Salvador | 12 | 0.0% |
| England | 24 | 0.1% |
| Ethiopia | 46 | 0.1% |
| Europe | 178 | 0.4% |
| Germany | 66 | 0.1% |
| India | 31 | 0.1% |
| Japan | 5 | 0.0% |
| Jordan | 139 | 0.3% |
| Latin America | 1,138 | 2.5% |
| Malaysia | 40 | 0.1% |
| Mexico | 967 | 2.1% |
| Netherlands | 61 | 0.1% |
| Northern Europe | 24 | 0.1% |
| Oceania | 23 | 0.1% |
| Peru | 26 | 0.1% |
| Philippines | 112 | 0.2% |
| Russia | 27 | 0.1% |
| South Africa | 9 | 0.0% |
| South America | 126 | 0.3% |
| South Central Asia | 31 | 0.1% |
| South Eastern Asia | 303 | 0.7% |
| Thailand | 28 | 0.1% |
| Vietnam | 123 | 0.3% |
| Western Africa | 97 | 0.2% |
| Western Asia | 207 | 0.4% |
| Western Europe | 127 | 0.3% |
| Yemen | 68 | 0.2% | View All 42 Rows |
Sex and Age in Olive Branch
Sex and Age in Olive Branch
The most populous age groups in Olive Branch are 10 to 14 Years (1,878 | 8.6%) for men and 35 to 39 Years (1,755 | 7.3%) for women.
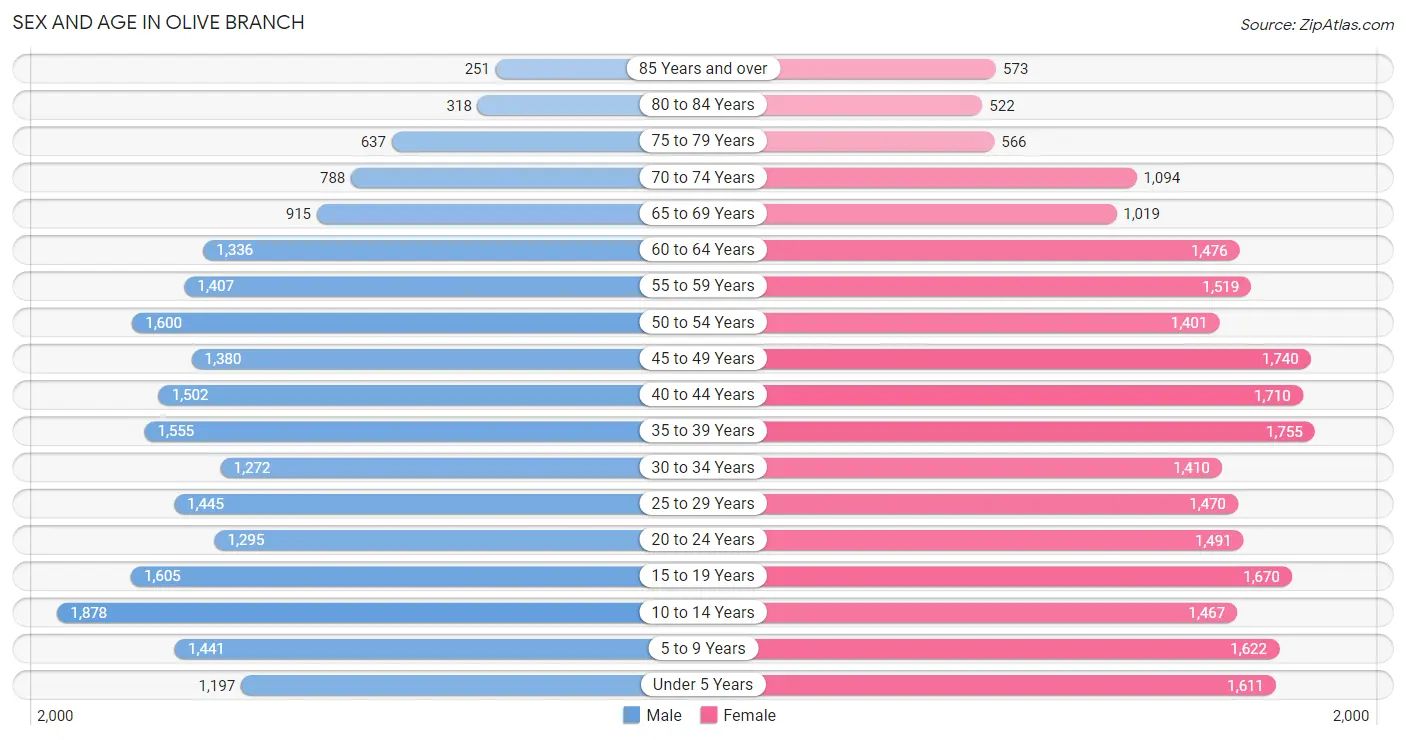
| Age Bracket | Male | Female |
| Under 5 Years | 1,197 (5.5%) | 1,611 (6.7%) |
| 5 to 9 Years | 1,441 (6.6%) | 1,622 (6.7%) |
| 10 to 14 Years | 1,878 (8.6%) | 1,467 (6.1%) |
| 15 to 19 Years | 1,605 (7.3%) | 1,670 (6.9%) |
| 20 to 24 Years | 1,295 (5.9%) | 1,491 (6.2%) |
| 25 to 29 Years | 1,445 (6.6%) | 1,470 (6.1%) |
| 30 to 34 Years | 1,272 (5.8%) | 1,410 (5.9%) |
| 35 to 39 Years | 1,555 (7.1%) | 1,755 (7.3%) |
| 40 to 44 Years | 1,502 (6.9%) | 1,710 (7.1%) |
| 45 to 49 Years | 1,380 (6.3%) | 1,740 (7.2%) |
| 50 to 54 Years | 1,600 (7.3%) | 1,401 (5.8%) |
| 55 to 59 Years | 1,407 (6.5%) | 1,519 (6.3%) |
| 60 to 64 Years | 1,336 (6.1%) | 1,476 (6.1%) |
| 65 to 69 Years | 915 (4.2%) | 1,019 (4.2%) |
| 70 to 74 Years | 788 (3.6%) | 1,094 (4.5%) |
| 75 to 79 Years | 637 (2.9%) | 566 (2.4%) |
| 80 to 84 Years | 318 (1.5%) | 522 (2.2%) |
| 85 Years and over | 251 (1.1%) | 573 (2.4%) |
| Total | 21,822 (100.0%) | 24,116 (100.0%) |
Families and Households in Olive Branch
Median Family Size in Olive Branch
The median family size in Olive Branch is 3.15 persons per family, with married-couple families (9,340 | 74.8%) accounting for the largest median family size of 3.2 persons per family. On the other hand, single female/mother families (2,337 | 18.7%) represent the smallest median family size with 2.97 persons per family.
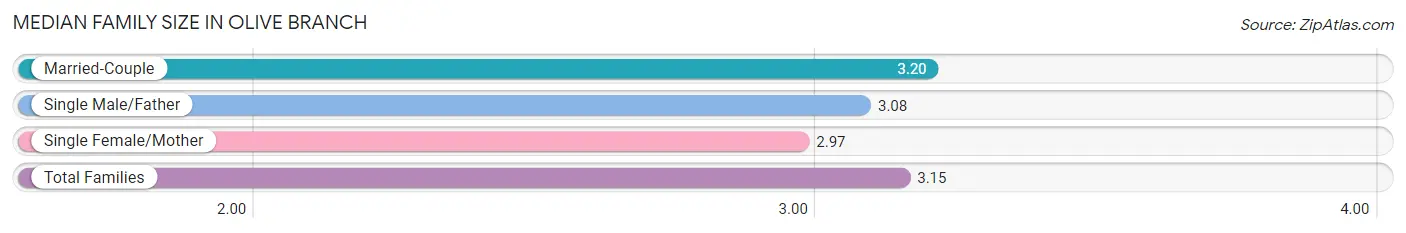
| Family Type | # Families | Family Size |
| Married-Couple | 9,340 (74.8%) | 3.20 |
| Single Male/Father | 815 (6.5%) | 3.08 |
| Single Female/Mother | 2,337 (18.7%) | 2.97 |
| Total Families | 12,492 (100.0%) | 3.15 |
Median Household Size in Olive Branch
The median household size in Olive Branch is 2.69 persons per household, with single male/father households (815 | 4.8%) accounting for the largest median household size of 3.37 persons per household. non-family households (4,562 | 26.8%) represent the smallest median household size with 1.26 persons per household.
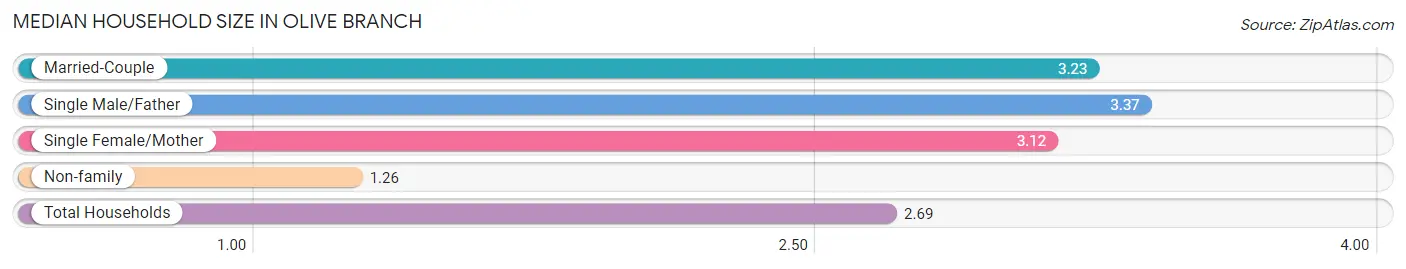
| Household Type | # Households | Household Size |
| Married-Couple | 9,340 (54.8%) | 3.23 |
| Single Male/Father | 815 (4.8%) | 3.37 |
| Single Female/Mother | 2,337 (13.7%) | 3.12 |
| Non-family | 4,562 (26.8%) | 1.26 |
| Total Households | 17,054 (100.0%) | 2.69 |
Household Size by Marriage Status in Olive Branch
Out of a total of 17,054 households in Olive Branch, 12,492 (73.3%) are family households, while 4,562 (26.8%) are nonfamily households. The most numerous type of family households are 2-person households, comprising 4,914, and the most common type of nonfamily households are 1-person households, comprising 3,901.
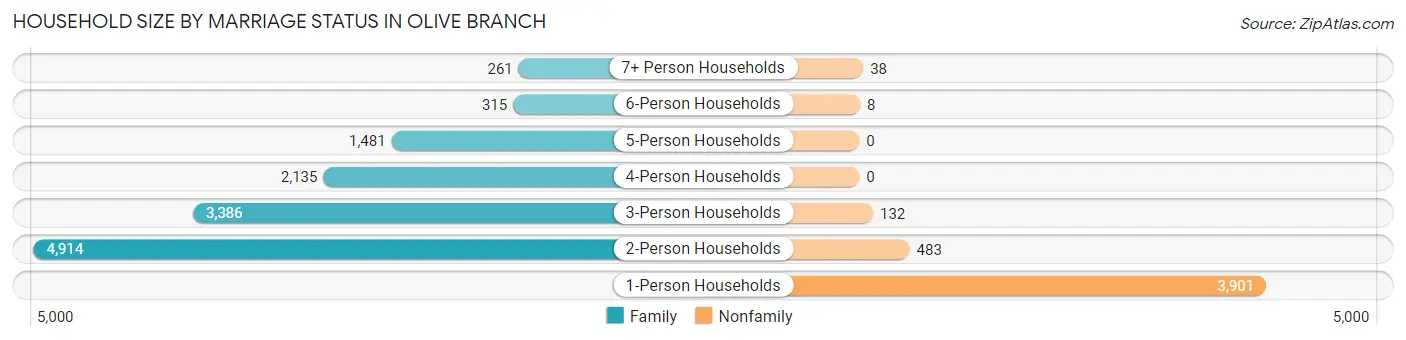
| Household Size | Family Households | Nonfamily Households |
| 1-Person Households | - | 3,901 (22.9%) |
| 2-Person Households | 4,914 (28.8%) | 483 (2.8%) |
| 3-Person Households | 3,386 (19.9%) | 132 (0.8%) |
| 4-Person Households | 2,135 (12.5%) | 0 (0.0%) |
| 5-Person Households | 1,481 (8.7%) | 0 (0.0%) |
| 6-Person Households | 315 (1.8%) | 8 (0.1%) |
| 7+ Person Households | 261 (1.5%) | 38 (0.2%) |
| Total | 12,492 (73.3%) | 4,562 (26.8%) |
Female Fertility in Olive Branch
Fertility by Age in Olive Branch
Average fertility rate in Olive Branch is 59.0 births per 1,000 women. Women in the age bracket of 20 to 34 years have the highest fertility rate with 123.0 births per 1,000 women. Women in the age bracket of 20 to 34 years acount for 78.6% of all women with births.
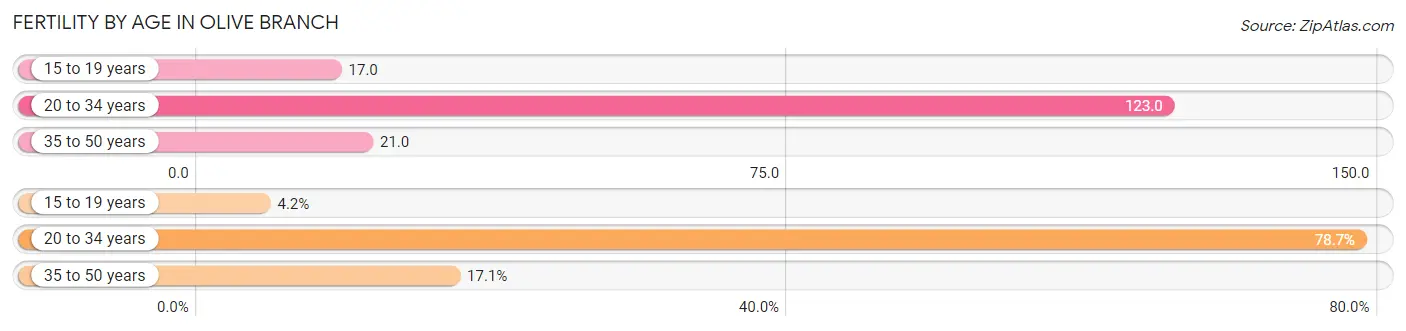
| Age Bracket | Women with Births | Births / 1,000 Women |
| 15 to 19 years | 29 (4.2%) | 17.0 |
| 20 to 34 years | 538 (78.6%) | 123.0 |
| 35 to 50 years | 117 (17.1%) | 21.0 |
| Total | 684 (100.0%) | 59.0 |
Fertility by Age by Marriage Status in Olive Branch
50.3% of women with births (684) in Olive Branch are married. The highest percentage of unmarried women with births falls into 35 to 50 years age bracket with 65.0% of them unmarried at the time of birth, while the lowest percentage of unmarried women with births belong to 15 to 19 years age bracket with 0.0% of them unmarried.
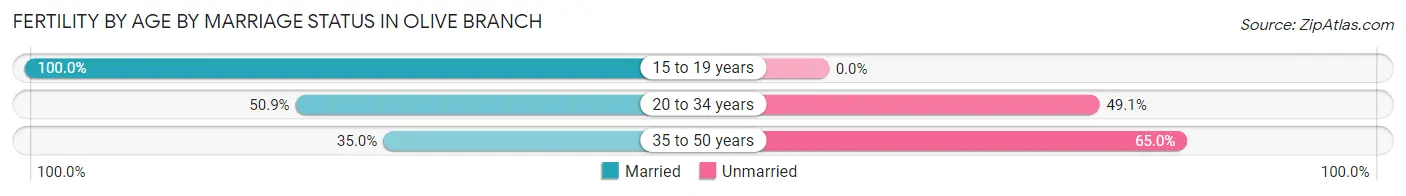
| Age Bracket | Married | Unmarried |
| 15 to 19 years | 29 (100.0%) | 0 (0.0%) |
| 20 to 34 years | 274 (50.9%) | 264 (49.1%) |
| 35 to 50 years | 41 (35.0%) | 76 (65.0%) |
| Total | 344 (50.3%) | 340 (49.7%) |
Fertility by Education in Olive Branch
Average fertility rate in Olive Branch is 59.0 births per 1,000 women. Women with the education attainment of bachelor's degree have the highest fertility rate of 84.0 births per 1,000 women, while women with the education attainment of less than high school have the lowest fertility at 18.0 births per 1,000 women. Women with the education attainment of college or associate's degree represent 46.2% of all women with births.
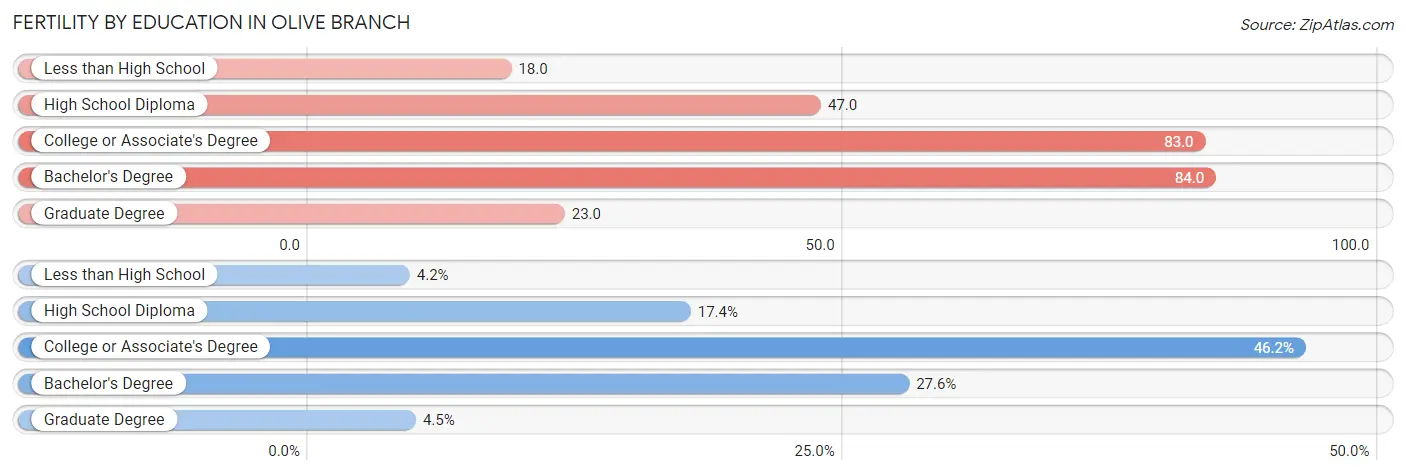
| Educational Attainment | Women with Births | Births / 1,000 Women |
| Less than High School | 29 (4.2%) | 18.0 |
| High School Diploma | 119 (17.4%) | 47.0 |
| College or Associate's Degree | 316 (46.2%) | 83.0 |
| Bachelor's Degree | 189 (27.6%) | 84.0 |
| Graduate Degree | 31 (4.5%) | 23.0 |
| Total | 684 (100.0%) | 59.0 |
Fertility by Education by Marriage Status in Olive Branch
49.7% of women with births in Olive Branch are unmarried. Women with the educational attainment of less than high school are most likely to be married with 100.0% of them married at childbirth, while women with the educational attainment of high school diploma are least likely to be married with 83.2% of them unmarried at childbirth.
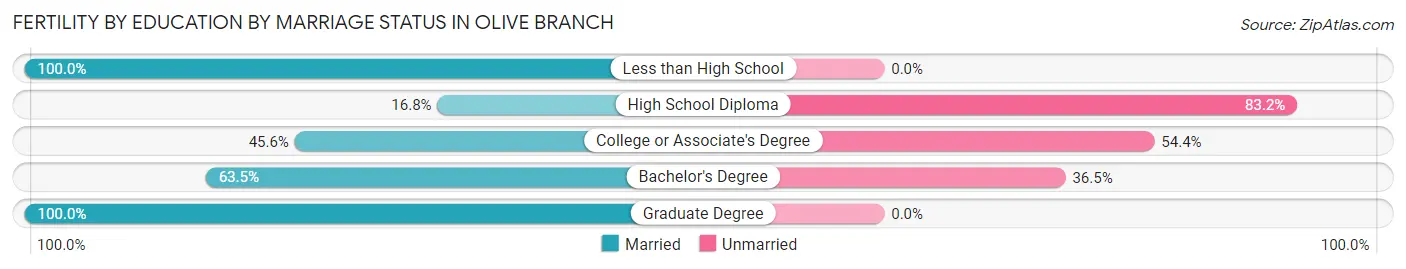
| Educational Attainment | Married | Unmarried |
| Less than High School | 29 (100.0%) | 0 (0.0%) |
| High School Diploma | 20 (16.8%) | 99 (83.2%) |
| College or Associate's Degree | 144 (45.6%) | 172 (54.4%) |
| Bachelor's Degree | 120 (63.5%) | 69 (36.5%) |
| Graduate Degree | 31 (100.0%) | 0 (0.0%) |
| Total | 344 (50.3%) | 340 (49.7%) |
Employment Characteristics in Olive Branch
Employment by Class of Employer in Olive Branch
Among the 23,921 employed individuals in Olive Branch, private company employees (17,629 | 73.7%), not-for-profit organizations (1,638 | 6.9%), and local government employees (1,257 | 5.2%) make up the most common classes of employment.
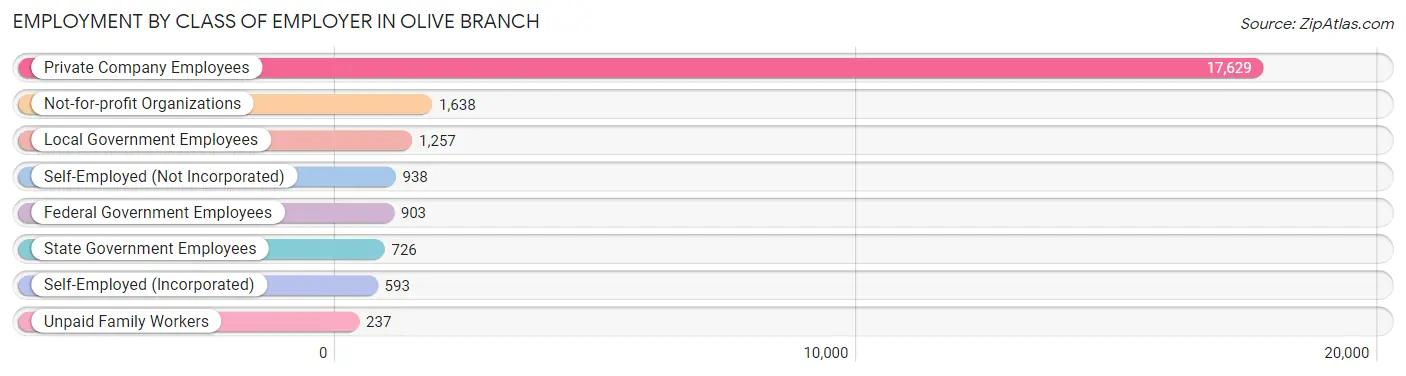
| Employer Class | # Employees | % Employees |
| Private Company Employees | 17,629 | 73.7% |
| Self-Employed (Incorporated) | 593 | 2.5% |
| Self-Employed (Not Incorporated) | 938 | 3.9% |
| Not-for-profit Organizations | 1,638 | 6.9% |
| Local Government Employees | 1,257 | 5.2% |
| State Government Employees | 726 | 3.0% |
| Federal Government Employees | 903 | 3.8% |
| Unpaid Family Workers | 237 | 1.0% |
| Total | 23,921 | 100.0% |
Employment Status by Age in Olive Branch
According to the labor force statistics for Olive Branch, out of the total population over 16 years of age (36,124), 69.3% or 25,034 individuals are in the labor force, with 2.7% or 676 of them unemployed. The age group with the highest labor force participation rate is 35 to 44 years, with 91.7% or 5,981 individuals in the labor force. Within the labor force, the 16 to 19 years age range has the highest percentage of unemployed individuals, with 8.5% or 118 of them being unemployed.
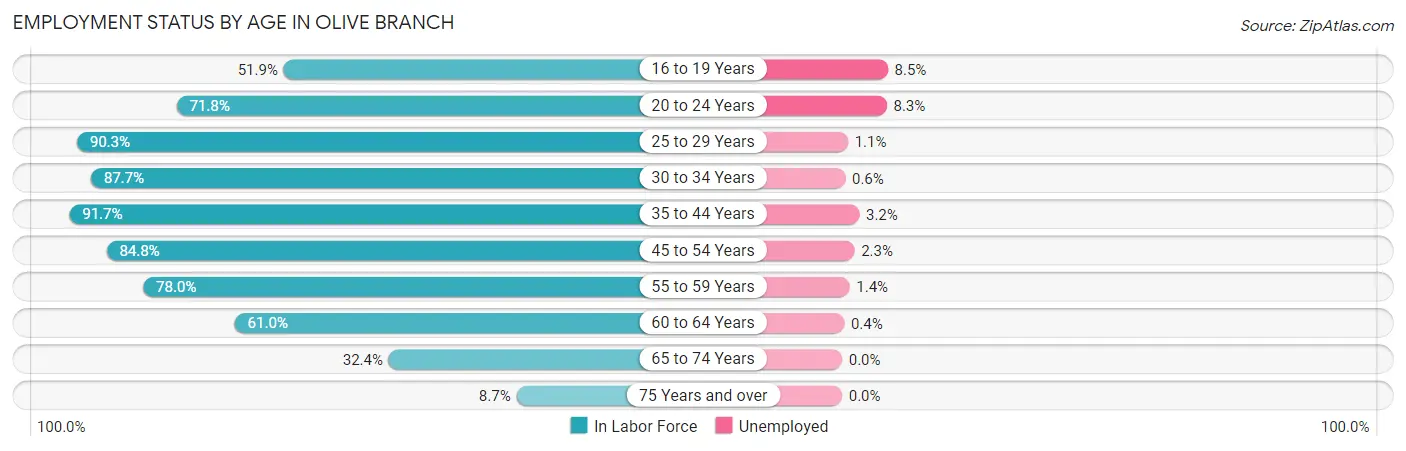
| Age Bracket | In Labor Force | Unemployed |
| 16 to 19 Years | 1,389 (51.9%) | 118 (8.5%) |
| 20 to 24 Years | 2,000 (71.8%) | 166 (8.3%) |
| 25 to 29 Years | 2,632 (90.3%) | 29 (1.1%) |
| 30 to 34 Years | 2,352 (87.7%) | 14 (0.6%) |
| 35 to 44 Years | 5,981 (91.7%) | 191 (3.2%) |
| 45 to 54 Years | 5,191 (84.8%) | 119 (2.3%) |
| 55 to 59 Years | 2,282 (78.0%) | 32 (1.4%) |
| 60 to 64 Years | 1,715 (61.0%) | 7 (0.4%) |
| 65 to 74 Years | 1,236 (32.4%) | 0 (0.0%) |
| 75 Years and over | 249 (8.7%) | 0 (0.0%) |
| Total | 25,034 (69.3%) | 676 (2.7%) |
Employment Status by Educational Attainment in Olive Branch
According to labor force statistics for Olive Branch, 84.0% of individuals (20,142) out of the total population between 25 and 64 years of age (23,978) are in the labor force, with 1.9% or 383 of them being unemployed. The group with the highest labor force participation rate are those with the educational attainment of bachelor's degree or higher, with 88.1% or 7,286 individuals in the labor force. Within the labor force, individuals with college / associate degree education have the highest percentage of unemployment, with 3.1% or 218 of them being unemployed.
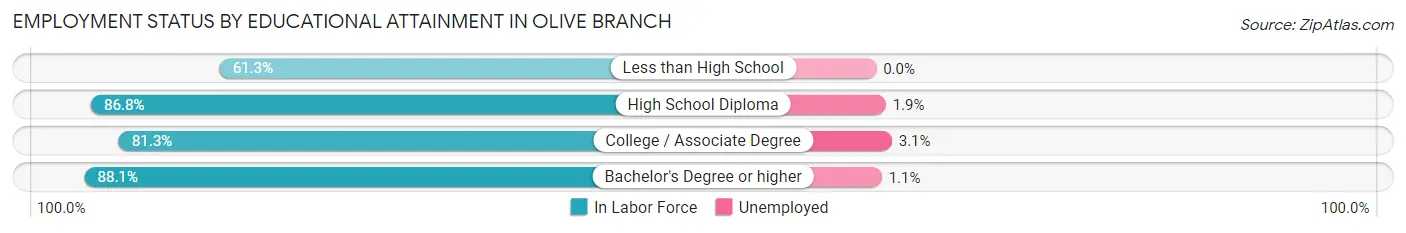
| Educational Attainment | In Labor Force | Unemployed |
| Less than High School | 691 (61.3%) | 0 (0.0%) |
| High School Diploma | 5,145 (86.8%) | 113 (1.9%) |
| College / Associate Degree | 7,035 (81.3%) | 268 (3.1%) |
| Bachelor's Degree or higher | 7,286 (88.1%) | 91 (1.1%) |
| Total | 20,142 (84.0%) | 456 (1.9%) |
Employment Occupations by Sex in Olive Branch
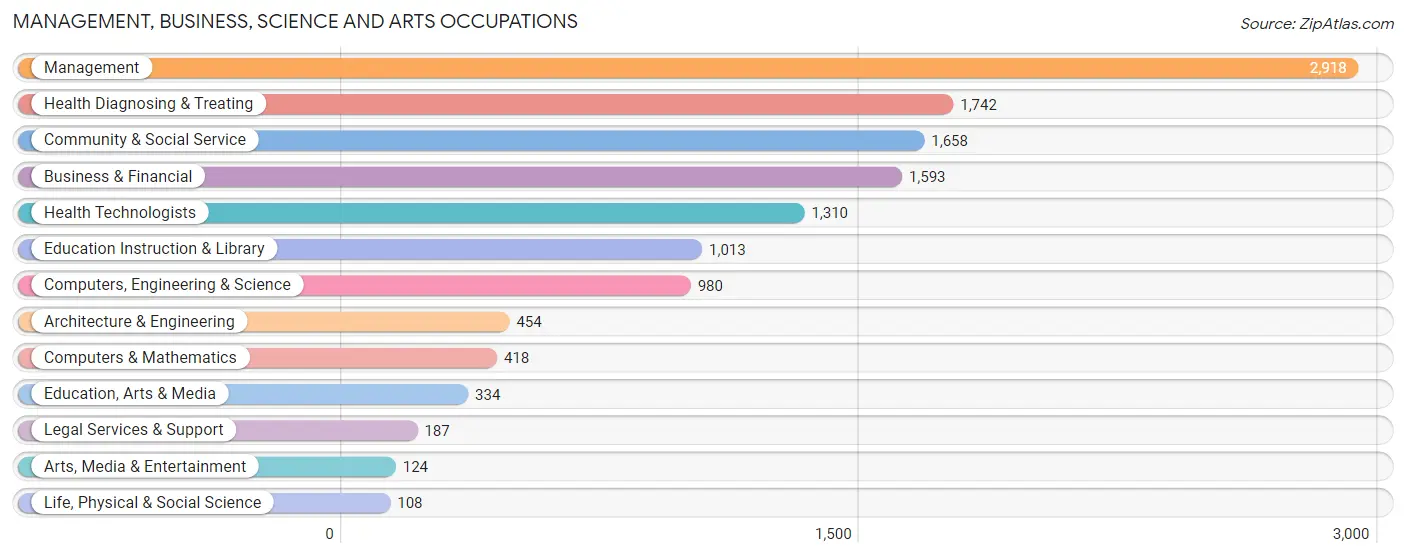
Management, Business, Science and Arts Occupations
The most common Management, Business, Science and Arts occupations in Olive Branch are Management (2,918 | 12.0%), Health Diagnosing & Treating (1,742 | 7.2%), Community & Social Service (1,658 | 6.8%), Business & Financial (1,593 | 6.6%), and Health Technologists (1,310 | 5.4%).
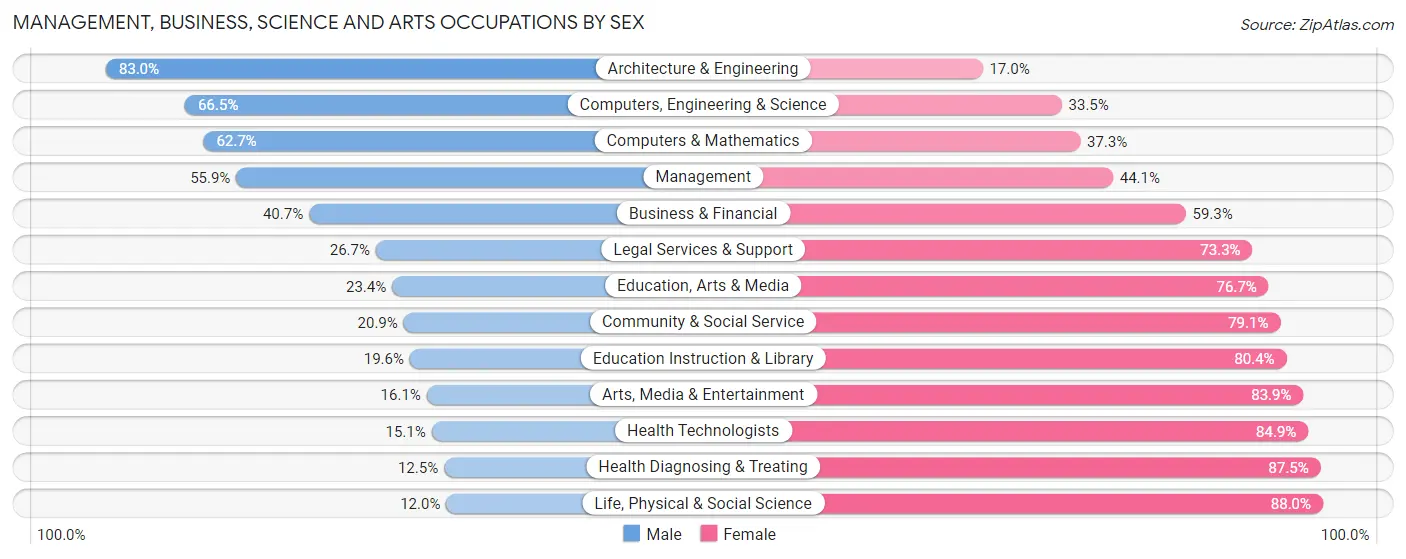
Management, Business, Science and Arts Occupations by Sex
Within the Management, Business, Science and Arts occupations in Olive Branch, the most male-oriented occupations are Architecture & Engineering (83.0%), Computers, Engineering & Science (66.5%), and Computers & Mathematics (62.7%), while the most female-oriented occupations are Life, Physical & Social Science (88.0%), Health Diagnosing & Treating (87.5%), and Health Technologists (84.9%).
| Occupation | Male | Female |
| Management | 1,630 (55.9%) | 1,288 (44.1%) |
| Business & Financial | 648 (40.7%) | 945 (59.3%) |
| Computers, Engineering & Science | 652 (66.5%) | 328 (33.5%) |
| Computers & Mathematics | 262 (62.7%) | 156 (37.3%) |
| Architecture & Engineering | 377 (83.0%) | 77 (17.0%) |
| Life, Physical & Social Science | 13 (12.0%) | 95 (88.0%) |
| Community & Social Service | 347 (20.9%) | 1,311 (79.1%) |
| Education, Arts & Media | 78 (23.4%) | 256 (76.6%) |
| Legal Services & Support | 50 (26.7%) | 137 (73.3%) |
| Education Instruction & Library | 199 (19.6%) | 814 (80.4%) |
| Arts, Media & Entertainment | 20 (16.1%) | 104 (83.9%) |
| Health Diagnosing & Treating | 218 (12.5%) | 1,524 (87.5%) |
| Health Technologists | 198 (15.1%) | 1,112 (84.9%) |
| Total (Category) | 3,495 (39.3%) | 5,396 (60.7%) |
| Total (Overall) | 12,479 (51.4%) | 11,799 (48.6%) |
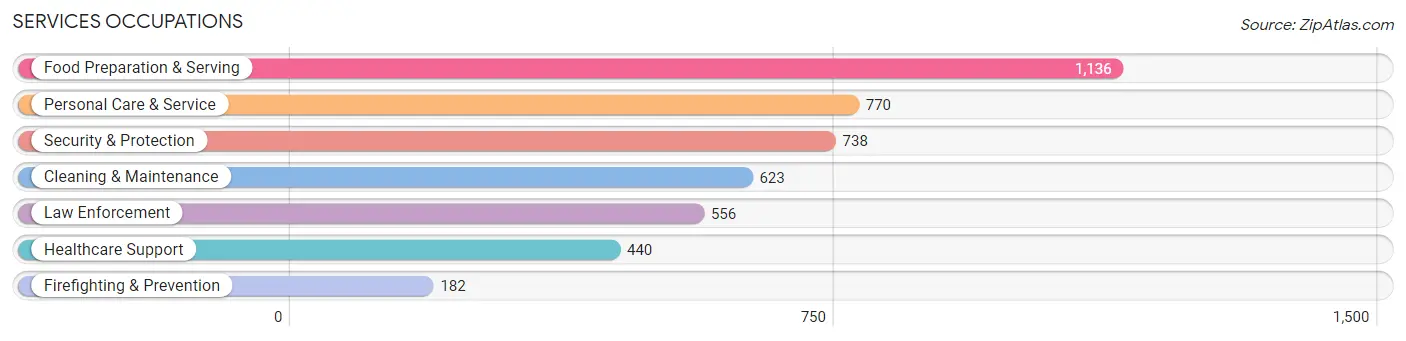
Services Occupations
The most common Services occupations in Olive Branch are Food Preparation & Serving (1,136 | 4.7%), Personal Care & Service (770 | 3.2%), Security & Protection (738 | 3.0%), Cleaning & Maintenance (623 | 2.6%), and Law Enforcement (556 | 2.3%).
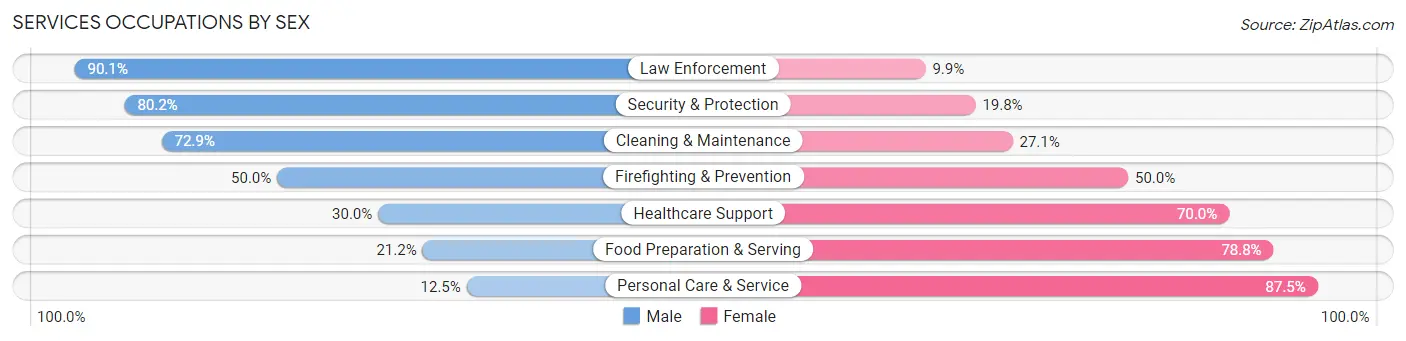
Services Occupations by Sex
Within the Services occupations in Olive Branch, the most male-oriented occupations are Law Enforcement (90.1%), Security & Protection (80.2%), and Cleaning & Maintenance (72.9%), while the most female-oriented occupations are Personal Care & Service (87.5%), Food Preparation & Serving (78.8%), and Healthcare Support (70.0%).
| Occupation | Male | Female |
| Healthcare Support | 132 (30.0%) | 308 (70.0%) |
| Security & Protection | 592 (80.2%) | 146 (19.8%) |
| Firefighting & Prevention | 91 (50.0%) | 91 (50.0%) |
| Law Enforcement | 501 (90.1%) | 55 (9.9%) |
| Food Preparation & Serving | 241 (21.2%) | 895 (78.8%) |
| Cleaning & Maintenance | 454 (72.9%) | 169 (27.1%) |
| Personal Care & Service | 96 (12.5%) | 674 (87.5%) |
| Total (Category) | 1,515 (40.9%) | 2,192 (59.1%) |
| Total (Overall) | 12,479 (51.4%) | 11,799 (48.6%) |
Sales and Office Occupations
The most common Sales and Office occupations in Olive Branch are Office & Administration (2,792 | 11.5%), and Sales & Related (1,978 | 8.2%).

Sales and Office Occupations by Sex
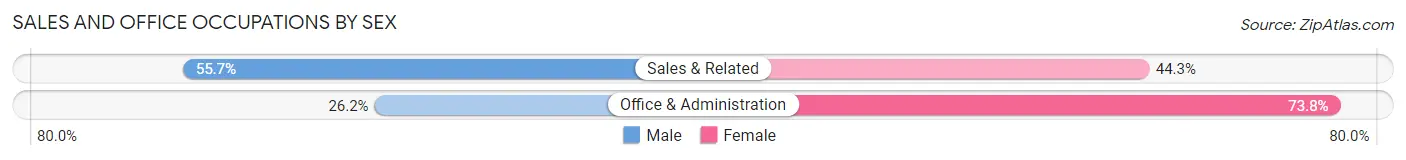
| Occupation | Male | Female |
| Sales & Related | 1,101 (55.7%) | 877 (44.3%) |
| Office & Administration | 731 (26.2%) | 2,061 (73.8%) |
| Total (Category) | 1,832 (38.4%) | 2,938 (61.6%) |
| Total (Overall) | 12,479 (51.4%) | 11,799 (48.6%) |
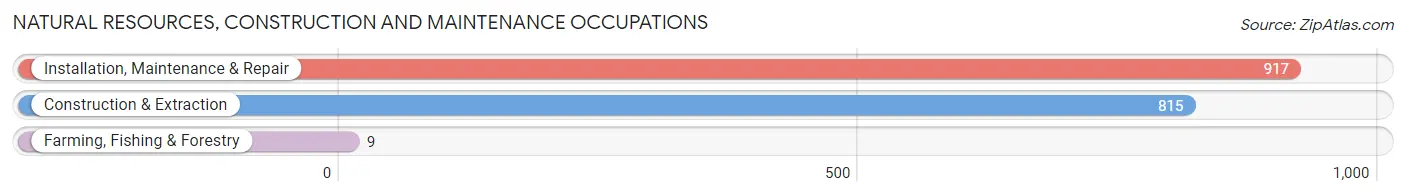
Natural Resources, Construction and Maintenance Occupations
The most common Natural Resources, Construction and Maintenance occupations in Olive Branch are Installation, Maintenance & Repair (917 | 3.8%), Construction & Extraction (815 | 3.4%), and Farming, Fishing & Forestry (9 | 0.0%).
Natural Resources, Construction and Maintenance Occupations by Sex
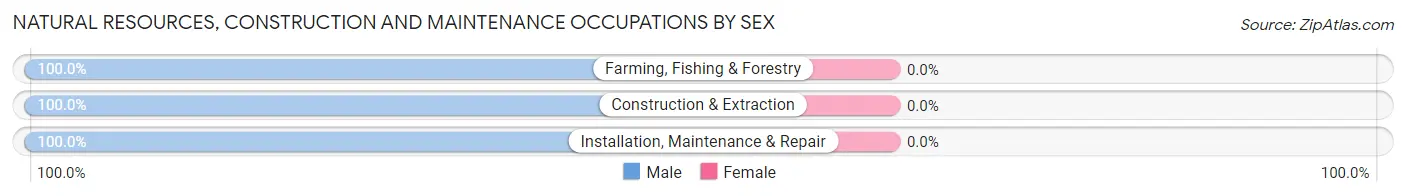
| Occupation | Male | Female |
| Farming, Fishing & Forestry | 9 (100.0%) | 0 (0.0%) |
| Construction & Extraction | 815 (100.0%) | 0 (0.0%) |
| Installation, Maintenance & Repair | 917 (100.0%) | 0 (0.0%) |
| Total (Category) | 1,741 (100.0%) | 0 (0.0%) |
| Total (Overall) | 12,479 (51.4%) | 11,799 (48.6%) |
Production, Transportation and Moving Occupations
The most common Production, Transportation and Moving occupations in Olive Branch are Material Moving (2,109 | 8.7%), Production (1,584 | 6.5%), and Transportation (1,476 | 6.1%).
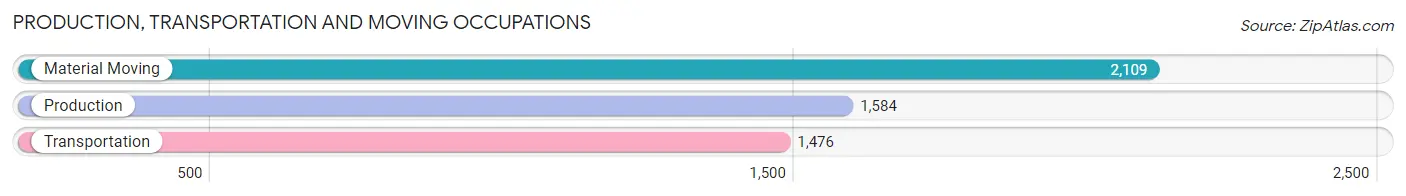
Production, Transportation and Moving Occupations by Sex
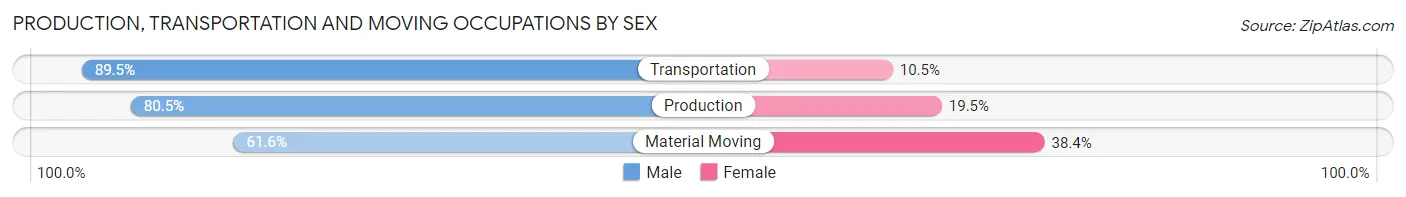
| Occupation | Male | Female |
| Production | 1,275 (80.5%) | 309 (19.5%) |
| Transportation | 1,321 (89.5%) | 155 (10.5%) |
| Material Moving | 1,300 (61.6%) | 809 (38.4%) |
| Total (Category) | 3,896 (75.4%) | 1,273 (24.6%) |
| Total (Overall) | 12,479 (51.4%) | 11,799 (48.6%) |
Employment Industries by Sex in Olive Branch
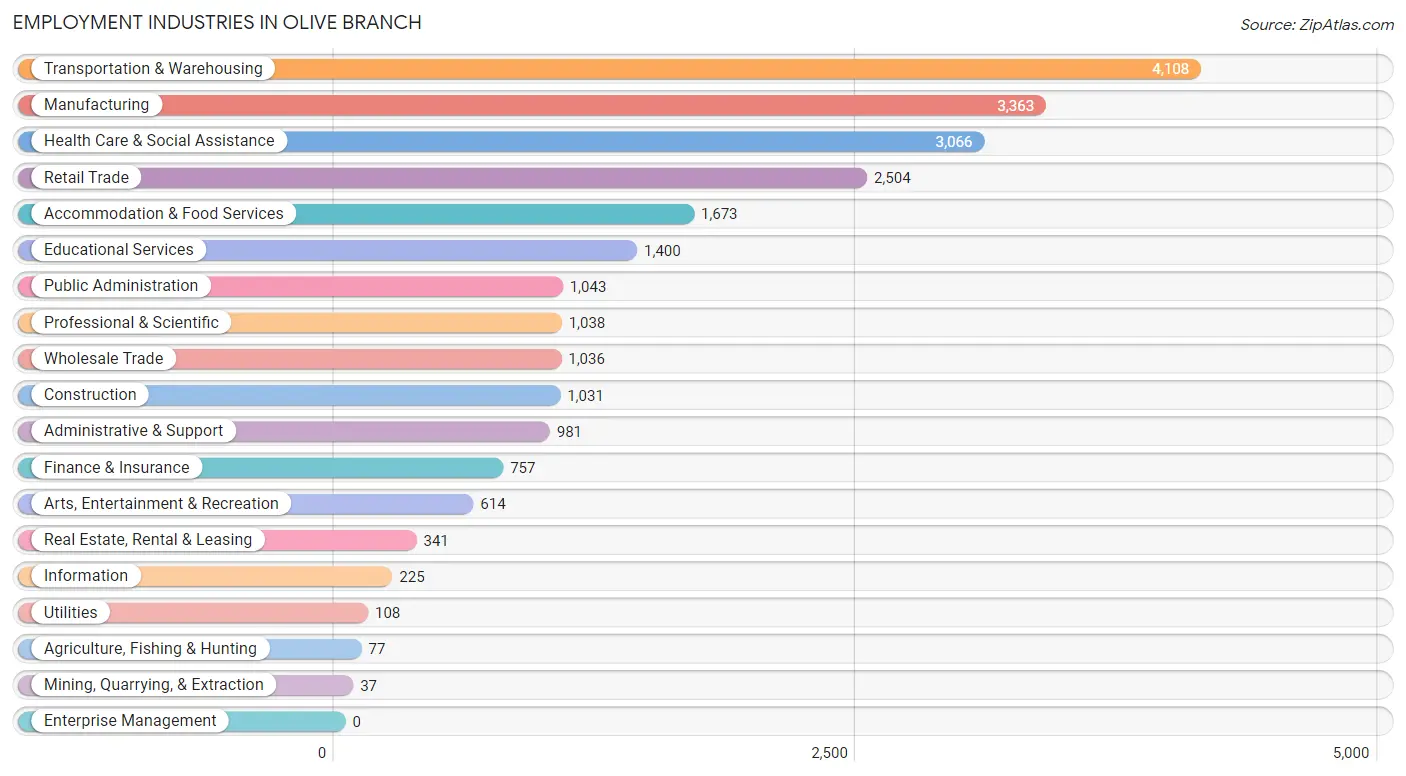
Employment Industries in Olive Branch
The major employment industries in Olive Branch include Transportation & Warehousing (4,108 | 16.9%), Manufacturing (3,363 | 13.9%), Health Care & Social Assistance (3,066 | 12.6%), Retail Trade (2,504 | 10.3%), and Accommodation & Food Services (1,673 | 6.9%).
Employment Industries by Sex in Olive Branch
The Olive Branch industries that see more men than women are Agriculture, Fishing & Hunting (100.0%), Mining, Quarrying, & Extraction (100.0%), and Utilities (100.0%), whereas the industries that tend to have a higher number of women are Health Care & Social Assistance (87.0%), Educational Services (84.5%), and Information (73.8%).
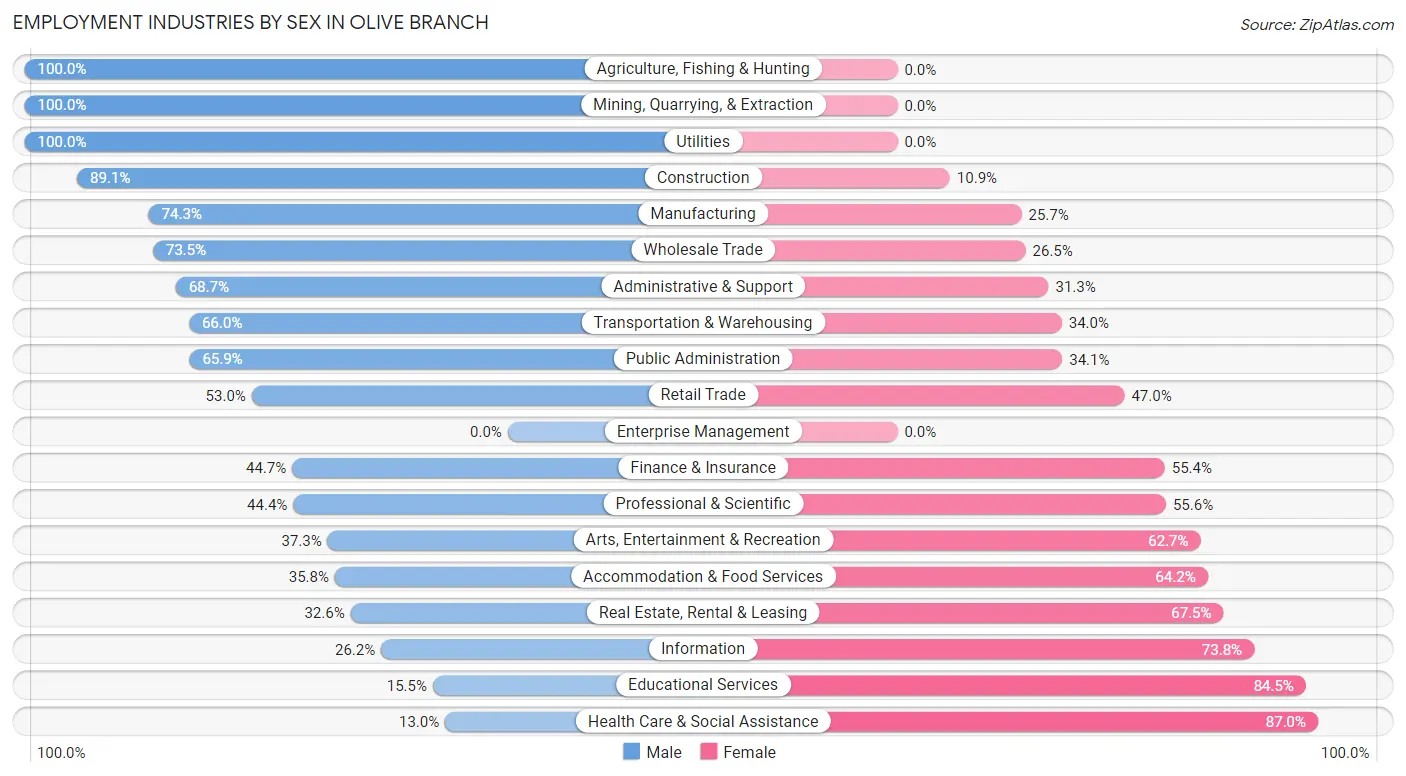
| Industry | Male | Female |
| Agriculture, Fishing & Hunting | 77 (100.0%) | 0 (0.0%) |
| Mining, Quarrying, & Extraction | 37 (100.0%) | 0 (0.0%) |
| Construction | 919 (89.1%) | 112 (10.9%) |
| Manufacturing | 2,499 (74.3%) | 864 (25.7%) |
| Wholesale Trade | 761 (73.5%) | 275 (26.5%) |
| Retail Trade | 1,327 (53.0%) | 1,177 (47.0%) |
| Transportation & Warehousing | 2,710 (66.0%) | 1,398 (34.0%) |
| Utilities | 108 (100.0%) | 0 (0.0%) |
| Information | 59 (26.2%) | 166 (73.8%) |
| Finance & Insurance | 338 (44.7%) | 419 (55.3%) |
| Real Estate, Rental & Leasing | 111 (32.6%) | 230 (67.4%) |
| Professional & Scientific | 461 (44.4%) | 577 (55.6%) |
| Enterprise Management | 0 (0.0%) | 0 (0.0%) |
| Administrative & Support | 674 (68.7%) | 307 (31.3%) |
| Educational Services | 217 (15.5%) | 1,183 (84.5%) |
| Health Care & Social Assistance | 398 (13.0%) | 2,668 (87.0%) |
| Arts, Entertainment & Recreation | 229 (37.3%) | 385 (62.7%) |
| Accommodation & Food Services | 599 (35.8%) | 1,074 (64.2%) |
| Public Administration | 687 (65.9%) | 356 (34.1%) |
| Total | 12,479 (51.4%) | 11,799 (48.6%) |
Education in Olive Branch
School Enrollment in Olive Branch
The most common levels of schooling among the 11,877 students in Olive Branch are high school (2,698 | 22.7%), middle school (2,530 | 21.3%), and elementary school (2,240 | 18.9%).
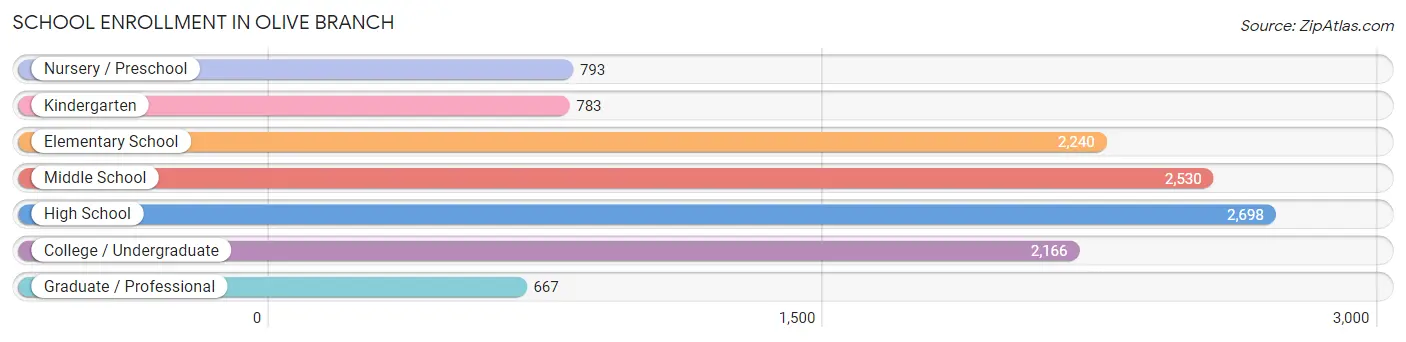
| School Level | # Students | % Students |
| Nursery / Preschool | 793 | 6.7% |
| Kindergarten | 783 | 6.6% |
| Elementary School | 2,240 | 18.9% |
| Middle School | 2,530 | 21.3% |
| High School | 2,698 | 22.7% |
| College / Undergraduate | 2,166 | 18.2% |
| Graduate / Professional | 667 | 5.6% |
| Total | 11,877 | 100.0% |
School Enrollment by Age by Funding Source in Olive Branch
Out of a total of 11,877 students who are enrolled in schools in Olive Branch, 1,936 (16.3%) attend a private institution, while the remaining 9,941 (83.7%) are enrolled in public schools. The age group of 35 years and over has the highest likelihood of being enrolled in private schools, with 358 (55.1% in the age bracket) enrolled. Conversely, the age group of 10 to 14 year olds has the lowest likelihood of being enrolled in a private school, with 2,999 (91.5% in the age bracket) attending a public institution.
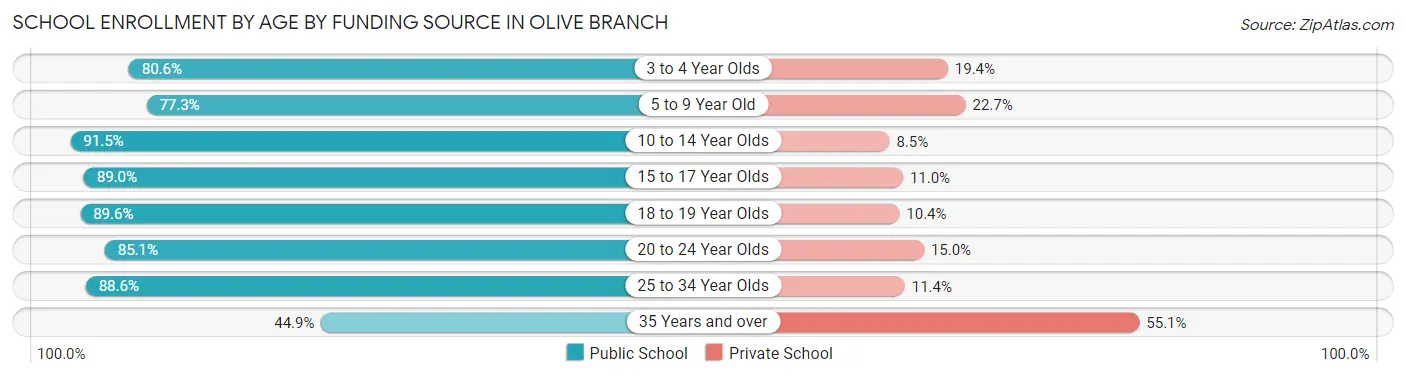
| Age Bracket | Public School | Private School |
| 3 to 4 Year Olds | 461 (80.6%) | 111 (19.4%) |
| 5 to 9 Year Old | 2,197 (77.3%) | 645 (22.7%) |
| 10 to 14 Year Olds | 2,999 (91.5%) | 280 (8.5%) |
| 15 to 17 Year Olds | 1,716 (89.0%) | 213 (11.0%) |
| 18 to 19 Year Olds | 830 (89.6%) | 96 (10.4%) |
| 20 to 24 Year Olds | 950 (85.1%) | 167 (14.9%) |
| 25 to 34 Year Olds | 498 (88.6%) | 64 (11.4%) |
| 35 Years and over | 292 (44.9%) | 358 (55.1%) |
| Total | 9,941 (83.7%) | 1,936 (16.3%) |
Educational Attainment by Field of Study in Olive Branch
Business (3,132 | 29.8%), education (1,418 | 13.5%), science & technology (1,350 | 12.9%), arts & humanities (633 | 6.0%), and bio, nature & agricultural (602 | 5.7%) are the most common fields of study among 10,501 individuals in Olive Branch who have obtained a bachelor's degree or higher.
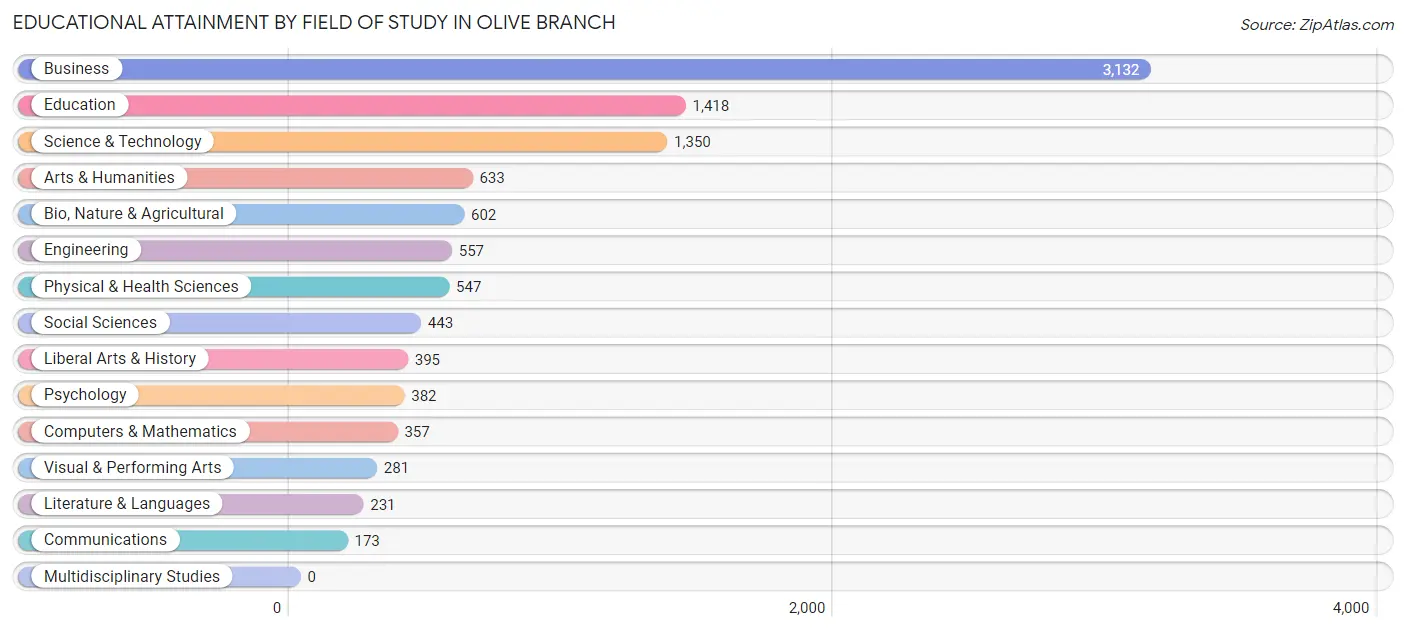
| Field of Study | # Graduates | % Graduates |
| Computers & Mathematics | 357 | 3.4% |
| Bio, Nature & Agricultural | 602 | 5.7% |
| Physical & Health Sciences | 547 | 5.2% |
| Psychology | 382 | 3.6% |
| Social Sciences | 443 | 4.2% |
| Engineering | 557 | 5.3% |
| Multidisciplinary Studies | 0 | 0.0% |
| Science & Technology | 1,350 | 12.9% |
| Business | 3,132 | 29.8% |
| Education | 1,418 | 13.5% |
| Literature & Languages | 231 | 2.2% |
| Liberal Arts & History | 395 | 3.8% |
| Visual & Performing Arts | 281 | 2.7% |
| Communications | 173 | 1.7% |
| Arts & Humanities | 633 | 6.0% |
| Total | 10,501 | 100.0% |
Transportation & Commute in Olive Branch
Vehicle Availability by Sex in Olive Branch
The most prevalent vehicle ownership categories in Olive Branch are males with 2 vehicles (4,411, accounting for 36.0%) and females with 2 vehicles (4,354, making up 37.8%).
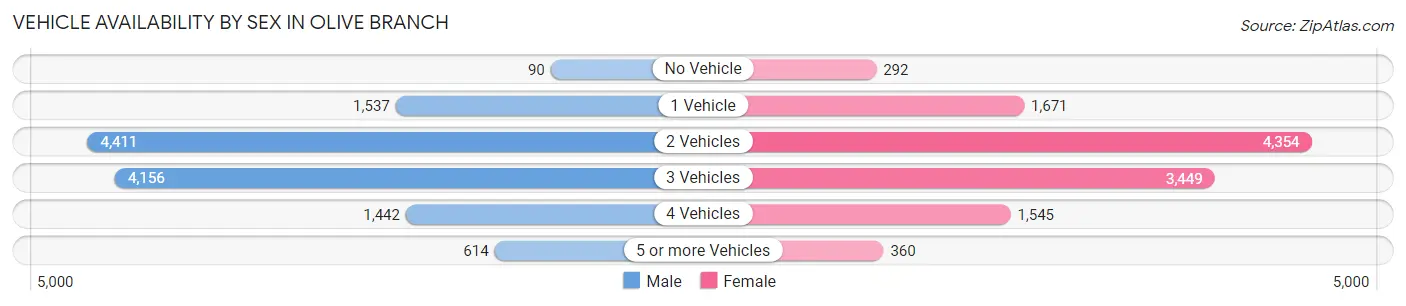
| Vehicles Available | Male | Female |
| No Vehicle | 90 (0.7%) | 292 (2.5%) |
| 1 Vehicle | 1,537 (12.6%) | 1,671 (14.3%) |
| 2 Vehicles | 4,411 (36.0%) | 4,354 (37.3%) |
| 3 Vehicles | 4,156 (33.9%) | 3,449 (29.5%) |
| 4 Vehicles | 1,442 (11.8%) | 1,545 (13.2%) |
| 5 or more Vehicles | 614 (5.0%) | 360 (3.1%) |
| Total | 12,250 (100.0%) | 11,671 (100.0%) |
Commute Time in Olive Branch
The most frequently occuring commute durations in Olive Branch are 20 to 24 minutes (3,522 commuters, 16.0%), 30 to 34 minutes (3,361 commuters, 15.2%), and 15 to 19 minutes (3,193 commuters, 14.5%).
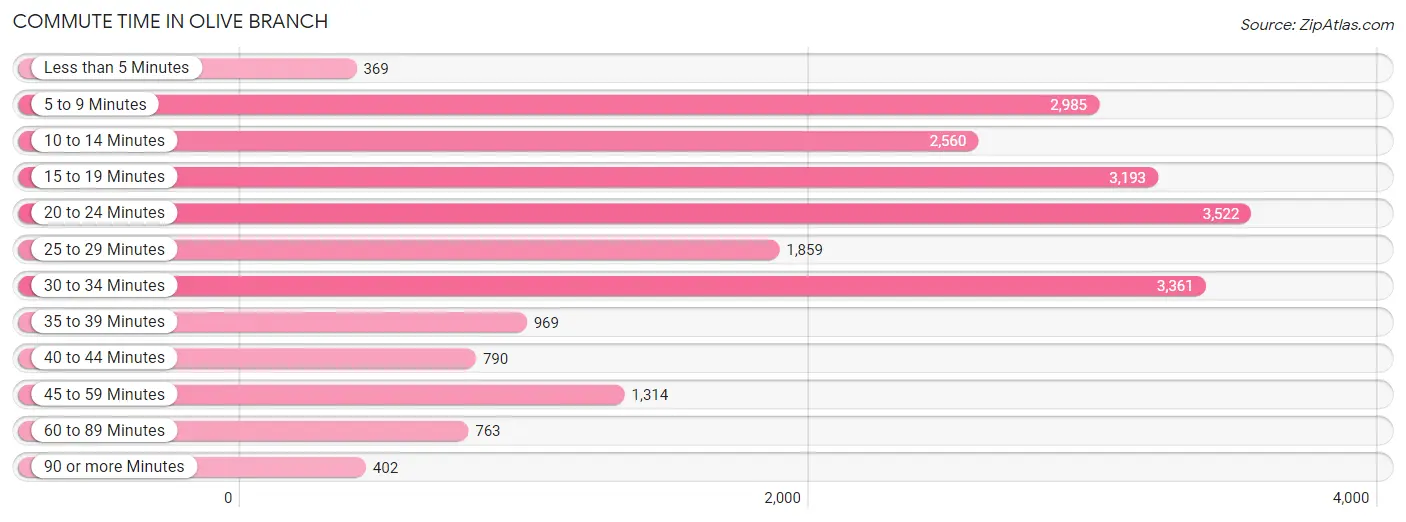
| Commute Time | # Commuters | % Commuters |
| Less than 5 Minutes | 369 | 1.7% |
| 5 to 9 Minutes | 2,985 | 13.5% |
| 10 to 14 Minutes | 2,560 | 11.6% |
| 15 to 19 Minutes | 3,193 | 14.5% |
| 20 to 24 Minutes | 3,522 | 16.0% |
| 25 to 29 Minutes | 1,859 | 8.4% |
| 30 to 34 Minutes | 3,361 | 15.2% |
| 35 to 39 Minutes | 969 | 4.4% |
| 40 to 44 Minutes | 790 | 3.6% |
| 45 to 59 Minutes | 1,314 | 5.9% |
| 60 to 89 Minutes | 763 | 3.5% |
| 90 or more Minutes | 402 | 1.8% |
Commute Time by Sex in Olive Branch
The most common commute times in Olive Branch are 20 to 24 minutes (1,939 commuters, 17.0%) for males and 5 to 9 minutes (1,829 commuters, 17.2%) for females.
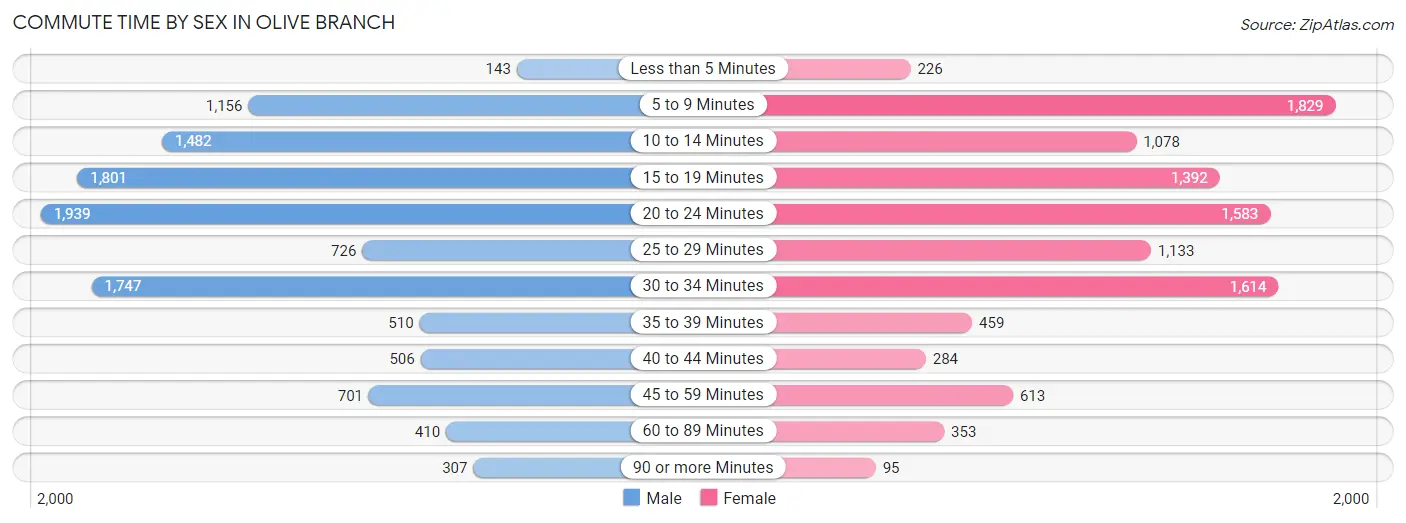
| Commute Time | Male | Female |
| Less than 5 Minutes | 143 (1.3%) | 226 (2.1%) |
| 5 to 9 Minutes | 1,156 (10.1%) | 1,829 (17.2%) |
| 10 to 14 Minutes | 1,482 (13.0%) | 1,078 (10.1%) |
| 15 to 19 Minutes | 1,801 (15.8%) | 1,392 (13.1%) |
| 20 to 24 Minutes | 1,939 (17.0%) | 1,583 (14.8%) |
| 25 to 29 Minutes | 726 (6.4%) | 1,133 (10.6%) |
| 30 to 34 Minutes | 1,747 (15.3%) | 1,614 (15.1%) |
| 35 to 39 Minutes | 510 (4.5%) | 459 (4.3%) |
| 40 to 44 Minutes | 506 (4.4%) | 284 (2.7%) |
| 45 to 59 Minutes | 701 (6.1%) | 613 (5.8%) |
| 60 to 89 Minutes | 410 (3.6%) | 353 (3.3%) |
| 90 or more Minutes | 307 (2.7%) | 95 (0.9%) |
Time of Departure to Work by Sex in Olive Branch
The most frequent times of departure to work in Olive Branch are 7:00 AM to 7:29 AM (1,595, 14.0%) for males and 7:30 AM to 7:59 AM (2,066, 19.4%) for females.
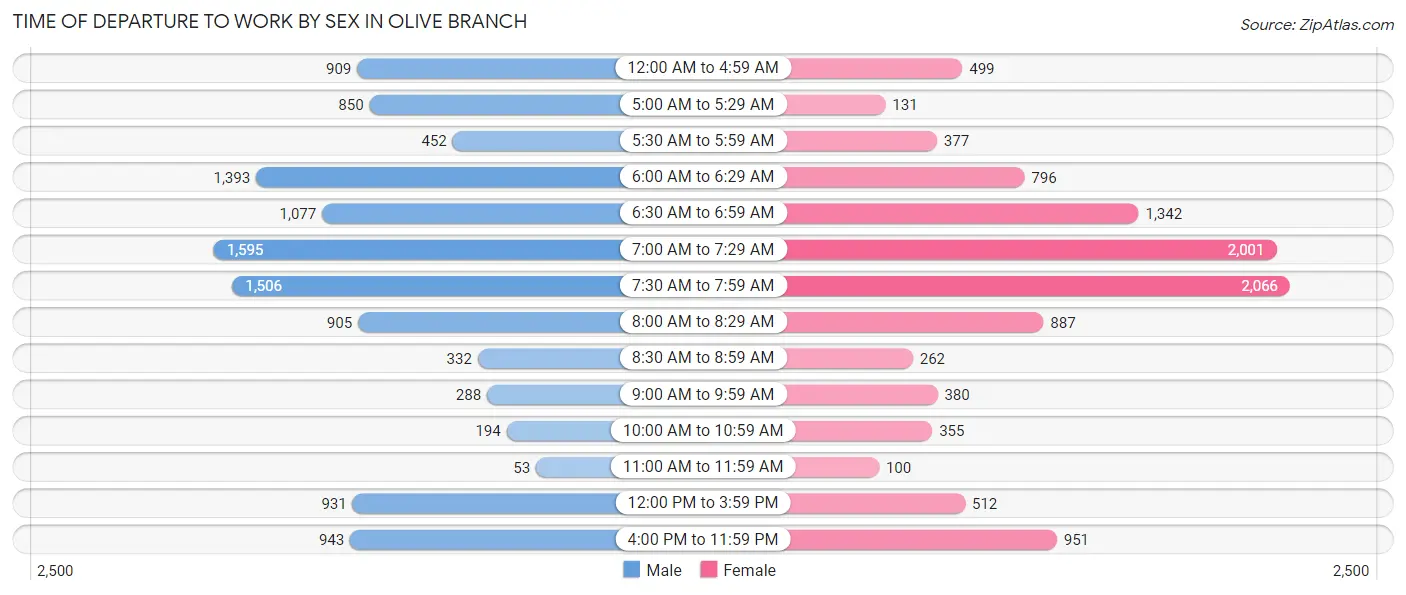
| Time of Departure | Male | Female |
| 12:00 AM to 4:59 AM | 909 (8.0%) | 499 (4.7%) |
| 5:00 AM to 5:29 AM | 850 (7.4%) | 131 (1.2%) |
| 5:30 AM to 5:59 AM | 452 (4.0%) | 377 (3.5%) |
| 6:00 AM to 6:29 AM | 1,393 (12.2%) | 796 (7.5%) |
| 6:30 AM to 6:59 AM | 1,077 (9.4%) | 1,342 (12.6%) |
| 7:00 AM to 7:29 AM | 1,595 (14.0%) | 2,001 (18.8%) |
| 7:30 AM to 7:59 AM | 1,506 (13.2%) | 2,066 (19.4%) |
| 8:00 AM to 8:29 AM | 905 (7.9%) | 887 (8.3%) |
| 8:30 AM to 8:59 AM | 332 (2.9%) | 262 (2.5%) |
| 9:00 AM to 9:59 AM | 288 (2.5%) | 380 (3.6%) |
| 10:00 AM to 10:59 AM | 194 (1.7%) | 355 (3.3%) |
| 11:00 AM to 11:59 AM | 53 (0.5%) | 100 (0.9%) |
| 12:00 PM to 3:59 PM | 931 (8.2%) | 512 (4.8%) |
| 4:00 PM to 11:59 PM | 943 (8.3%) | 951 (8.9%) |
| Total | 11,428 (100.0%) | 10,659 (100.0%) |
Housing Occupancy in Olive Branch
Occupancy by Ownership in Olive Branch
Of the total 17,054 dwellings in Olive Branch, owner-occupied units account for 13,879 (81.4%), while renter-occupied units make up 3,175 (18.6%).
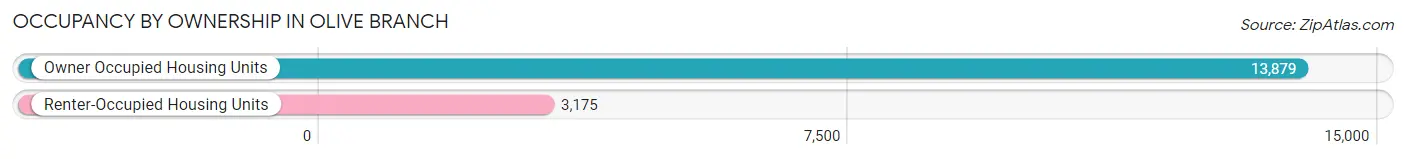
| Occupancy | # Housing Units | % Housing Units |
| Owner Occupied Housing Units | 13,879 | 81.4% |
| Renter-Occupied Housing Units | 3,175 | 18.6% |
| Total Occupied Housing Units | 17,054 | 100.0% |
Occupancy by Household Size in Olive Branch
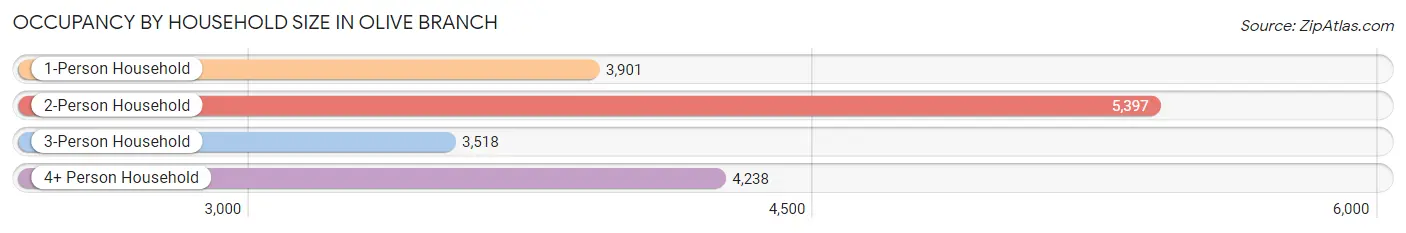
| Household Size | # Housing Units | % Housing Units |
| 1-Person Household | 3,901 | 22.9% |
| 2-Person Household | 5,397 | 31.7% |
| 3-Person Household | 3,518 | 20.6% |
| 4+ Person Household | 4,238 | 24.8% |
| Total Housing Units | 17,054 | 100.0% |
Occupancy by Ownership by Household Size in Olive Branch
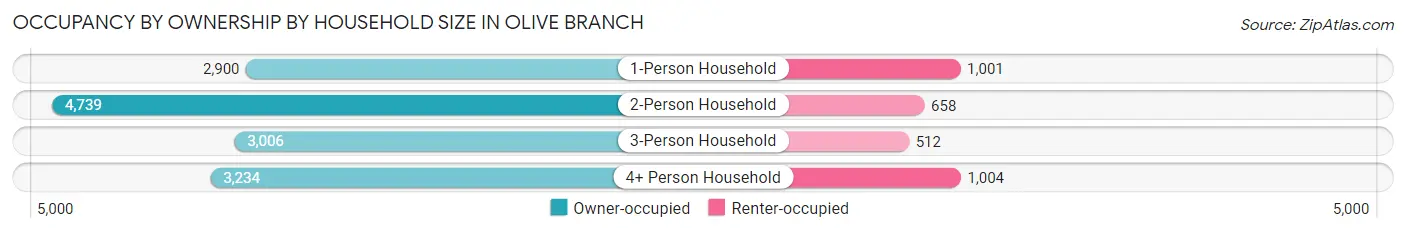
| Household Size | Owner-occupied | Renter-occupied |
| 1-Person Household | 2,900 (74.3%) | 1,001 (25.7%) |
| 2-Person Household | 4,739 (87.8%) | 658 (12.2%) |
| 3-Person Household | 3,006 (85.5%) | 512 (14.5%) |
| 4+ Person Household | 3,234 (76.3%) | 1,004 (23.7%) |
| Total Housing Units | 13,879 (81.4%) | 3,175 (18.6%) |
Occupancy by Educational Attainment in Olive Branch
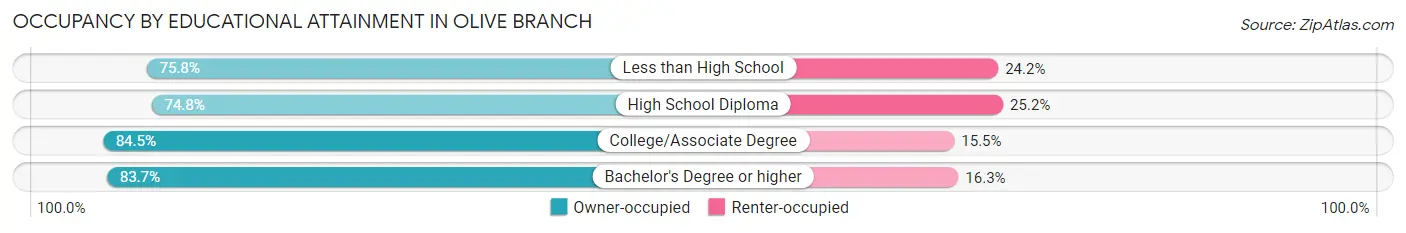
| Household Size | Owner-occupied | Renter-occupied |
| Less than High School | 567 (75.8%) | 181 (24.2%) |
| High School Diploma | 3,224 (74.8%) | 1,085 (25.2%) |
| College/Associate Degree | 4,934 (84.5%) | 905 (15.5%) |
| Bachelor's Degree or higher | 5,154 (83.7%) | 1,004 (16.3%) |
Occupancy by Age of Householder in Olive Branch
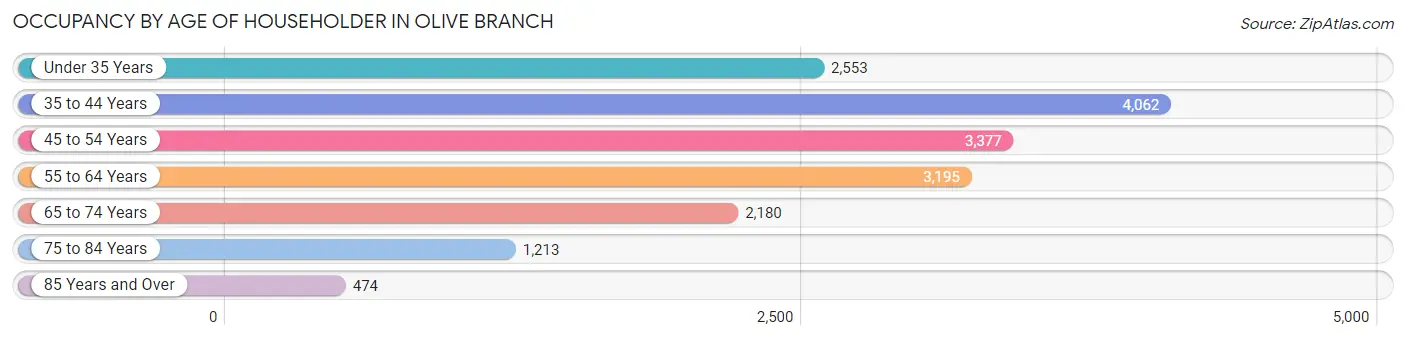
| Age Bracket | # Households | % Households |
| Under 35 Years | 2,553 | 15.0% |
| 35 to 44 Years | 4,062 | 23.8% |
| 45 to 54 Years | 3,377 | 19.8% |
| 55 to 64 Years | 3,195 | 18.7% |
| 65 to 74 Years | 2,180 | 12.8% |
| 75 to 84 Years | 1,213 | 7.1% |
| 85 Years and Over | 474 | 2.8% |
| Total | 17,054 | 100.0% |
Housing Finances in Olive Branch
Median Income by Occupancy in Olive Branch
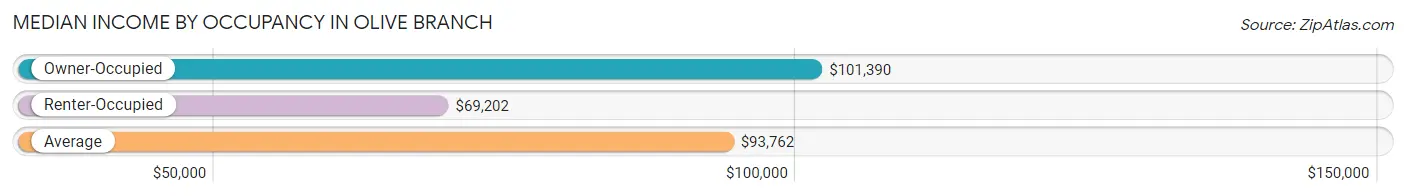
| Occupancy Type | # Households | Median Income |
| Owner-Occupied | 13,879 (81.4%) | $101,390 |
| Renter-Occupied | 3,175 (18.6%) | $69,202 |
| Average | 17,054 (100.0%) | $93,762 |
Occupancy by Householder Income Bracket in Olive Branch
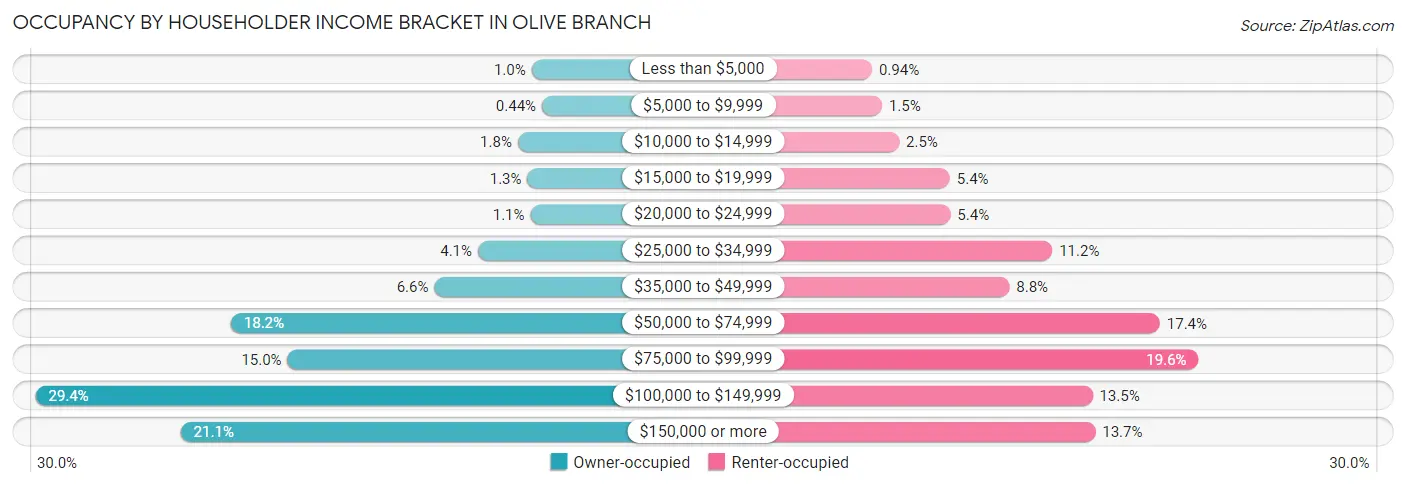
| Income Bracket | Owner-occupied | Renter-occupied |
| Less than $5,000 | 143 (1.0%) | 30 (0.9%) |
| $5,000 to $9,999 | 61 (0.4%) | 48 (1.5%) |
| $10,000 to $14,999 | 252 (1.8%) | 79 (2.5%) |
| $15,000 to $19,999 | 176 (1.3%) | 171 (5.4%) |
| $20,000 to $24,999 | 153 (1.1%) | 172 (5.4%) |
| $25,000 to $34,999 | 569 (4.1%) | 357 (11.2%) |
| $35,000 to $49,999 | 914 (6.6%) | 279 (8.8%) |
| $50,000 to $74,999 | 2,528 (18.2%) | 552 (17.4%) |
| $75,000 to $99,999 | 2,079 (15.0%) | 622 (19.6%) |
| $100,000 to $149,999 | 4,078 (29.4%) | 430 (13.5%) |
| $150,000 or more | 2,926 (21.1%) | 435 (13.7%) |
| Total | 13,879 (100.0%) | 3,175 (100.0%) |
Monthly Housing Cost Tiers in Olive Branch
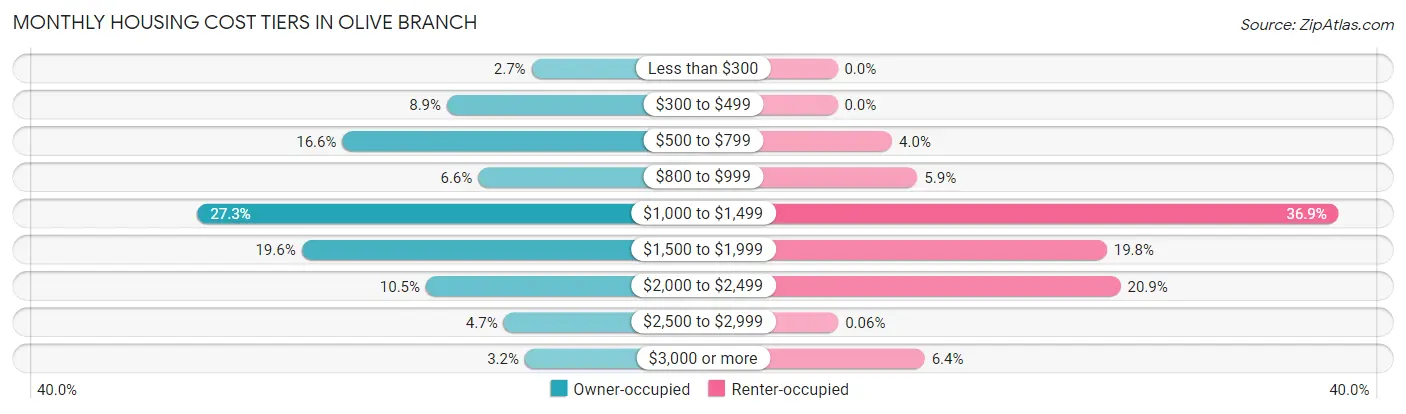
| Monthly Cost | Owner-occupied | Renter-occupied |
| Less than $300 | 371 (2.7%) | 0 (0.0%) |
| $300 to $499 | 1,235 (8.9%) | 0 (0.0%) |
| $500 to $799 | 2,304 (16.6%) | 128 (4.0%) |
| $800 to $999 | 916 (6.6%) | 187 (5.9%) |
| $1,000 to $1,499 | 3,785 (27.3%) | 1,172 (36.9%) |
| $1,500 to $1,999 | 2,722 (19.6%) | 630 (19.8%) |
| $2,000 to $2,499 | 1,451 (10.4%) | 662 (20.8%) |
| $2,500 to $2,999 | 657 (4.7%) | 2 (0.1%) |
| $3,000 or more | 438 (3.2%) | 204 (6.4%) |
| Total | 13,879 (100.0%) | 3,175 (100.0%) |
Physical Housing Characteristics in Olive Branch
Housing Structures in Olive Branch
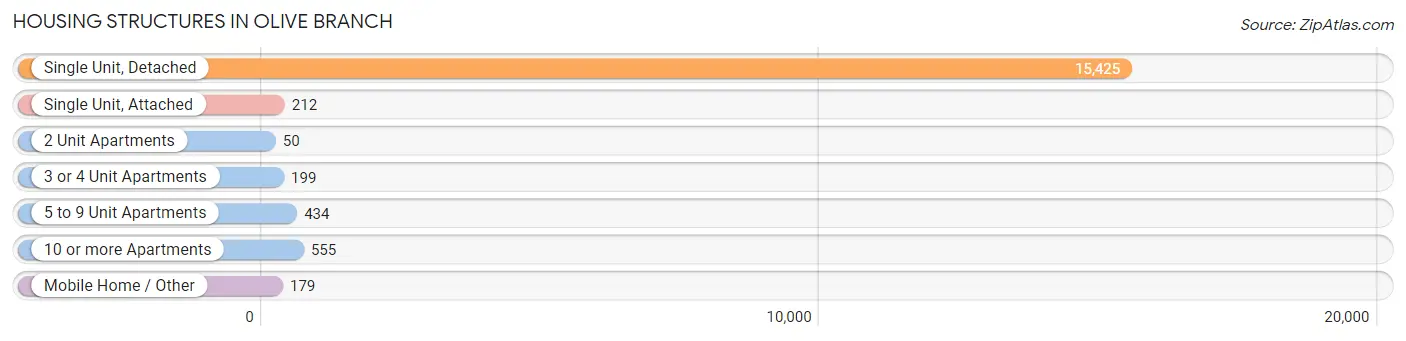
| Structure Type | # Housing Units | % Housing Units |
| Single Unit, Detached | 15,425 | 90.4% |
| Single Unit, Attached | 212 | 1.2% |
| 2 Unit Apartments | 50 | 0.3% |
| 3 or 4 Unit Apartments | 199 | 1.2% |
| 5 to 9 Unit Apartments | 434 | 2.5% |
| 10 or more Apartments | 555 | 3.3% |
| Mobile Home / Other | 179 | 1.1% |
| Total | 17,054 | 100.0% |
Housing Structures by Occupancy in Olive Branch
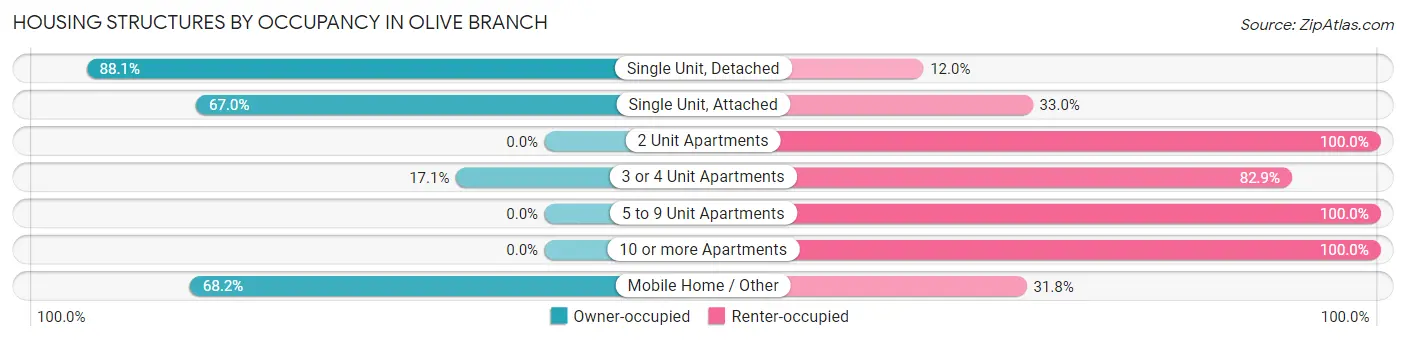
| Structure Type | Owner-occupied | Renter-occupied |
| Single Unit, Detached | 13,581 (88.0%) | 1,844 (11.9%) |
| Single Unit, Attached | 142 (67.0%) | 70 (33.0%) |
| 2 Unit Apartments | 0 (0.0%) | 50 (100.0%) |
| 3 or 4 Unit Apartments | 34 (17.1%) | 165 (82.9%) |
| 5 to 9 Unit Apartments | 0 (0.0%) | 434 (100.0%) |
| 10 or more Apartments | 0 (0.0%) | 555 (100.0%) |
| Mobile Home / Other | 122 (68.2%) | 57 (31.8%) |
| Total | 13,879 (81.4%) | 3,175 (18.6%) |
Housing Structures by Number of Rooms in Olive Branch
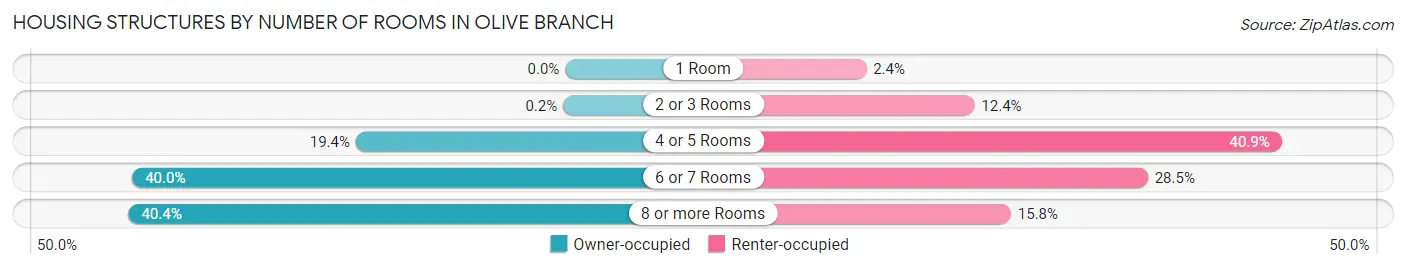
| Number of Rooms | Owner-occupied | Renter-occupied |
| 1 Room | 0 (0.0%) | 77 (2.4%) |
| 2 or 3 Rooms | 28 (0.2%) | 395 (12.4%) |
| 4 or 5 Rooms | 2,688 (19.4%) | 1,297 (40.8%) |
| 6 or 7 Rooms | 5,557 (40.0%) | 904 (28.5%) |
| 8 or more Rooms | 5,606 (40.4%) | 502 (15.8%) |
| Total | 13,879 (100.0%) | 3,175 (100.0%) |
Housing Structure by Heating Type in Olive Branch
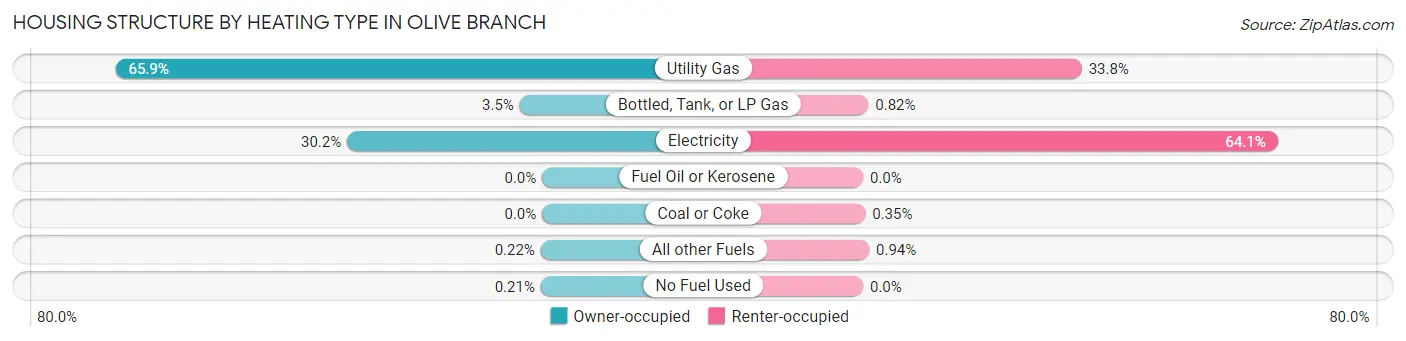
| Heating Type | Owner-occupied | Renter-occupied |
| Utility Gas | 9,151 (65.9%) | 1,073 (33.8%) |
| Bottled, Tank, or LP Gas | 482 (3.5%) | 26 (0.8%) |
| Electricity | 4,186 (30.2%) | 2,035 (64.1%) |
| Fuel Oil or Kerosene | 0 (0.0%) | 0 (0.0%) |
| Coal or Coke | 0 (0.0%) | 11 (0.4%) |
| All other Fuels | 31 (0.2%) | 30 (0.9%) |
| No Fuel Used | 29 (0.2%) | 0 (0.0%) |
| Total | 13,879 (100.0%) | 3,175 (100.0%) |
Household Vehicle Usage in Olive Branch
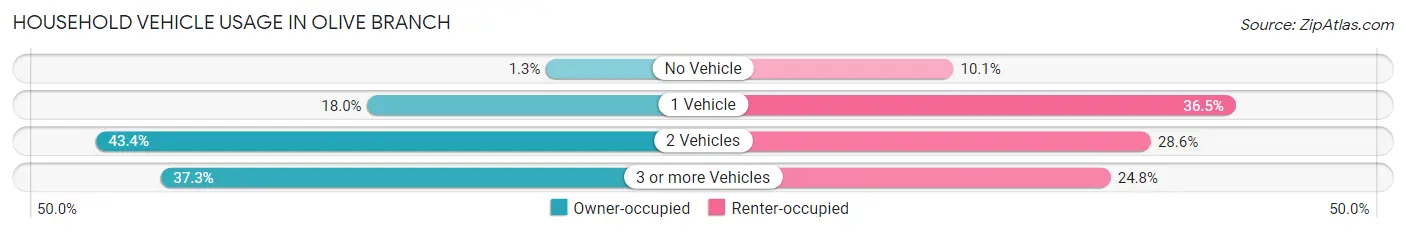
| Vehicles per Household | Owner-occupied | Renter-occupied |
| No Vehicle | 181 (1.3%) | 322 (10.1%) |
| 1 Vehicle | 2,498 (18.0%) | 1,158 (36.5%) |
| 2 Vehicles | 6,020 (43.4%) | 907 (28.6%) |
| 3 or more Vehicles | 5,180 (37.3%) | 788 (24.8%) |
| Total | 13,879 (100.0%) | 3,175 (100.0%) |
Real Estate & Mortgages in Olive Branch
Real Estate and Mortgage Overview in Olive Branch
| Characteristic | Without Mortgage | With Mortgage |
| Housing Units | 4,312 | 9,567 |
| Median Property Value | $255,800 | $239,600 |
| Median Household Income | $78,190 | $2,183 |
| Monthly Housing Costs | $556 | $431 |
| Real Estate Taxes | $1,783 | $741 |
Property Value by Mortgage Status in Olive Branch
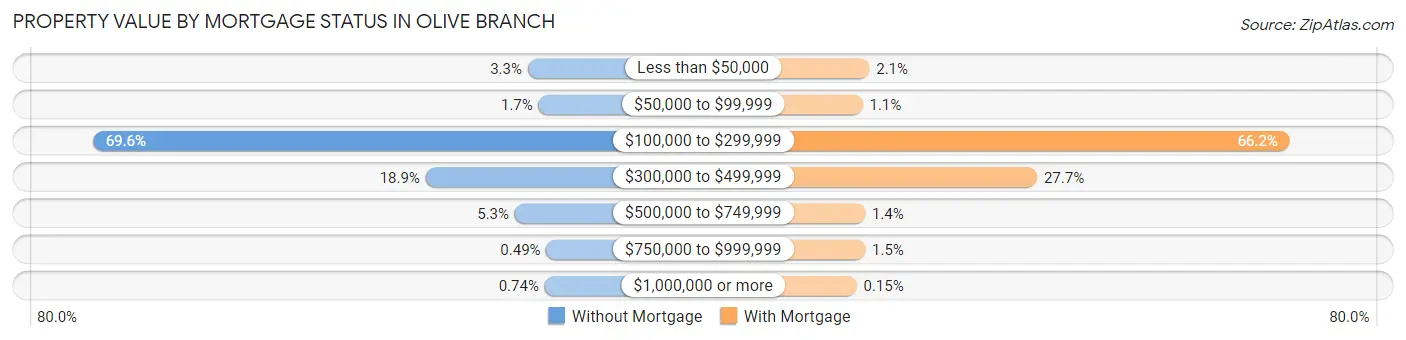
| Property Value | Without Mortgage | With Mortgage |
| Less than $50,000 | 143 (3.3%) | 200 (2.1%) |
| $50,000 to $99,999 | 72 (1.7%) | 101 (1.1%) |
| $100,000 to $299,999 | 3,002 (69.6%) | 6,329 (66.1%) |
| $300,000 to $499,999 | 814 (18.9%) | 2,645 (27.7%) |
| $500,000 to $749,999 | 228 (5.3%) | 138 (1.4%) |
| $750,000 to $999,999 | 21 (0.5%) | 140 (1.5%) |
| $1,000,000 or more | 32 (0.7%) | 14 (0.2%) |
| Total | 4,312 (100.0%) | 9,567 (100.0%) |
Household Income by Mortgage Status in Olive Branch
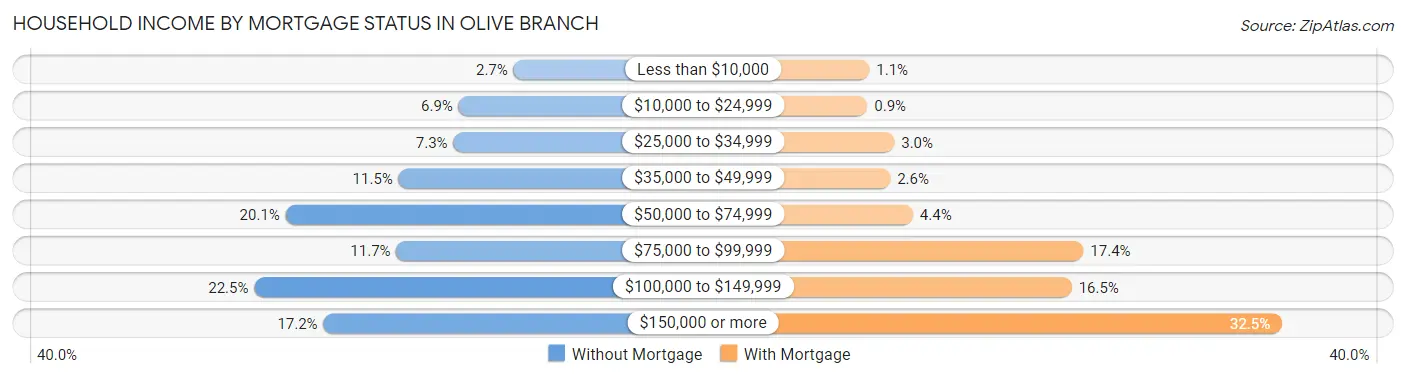
| Household Income | Without Mortgage | With Mortgage |
| Less than $10,000 | 118 (2.7%) | 100 (1.1%) |
| $10,000 to $24,999 | 299 (6.9%) | 86 (0.9%) |
| $25,000 to $34,999 | 316 (7.3%) | 282 (2.9%) |
| $35,000 to $49,999 | 496 (11.5%) | 253 (2.6%) |
| $50,000 to $74,999 | 867 (20.1%) | 418 (4.4%) |
| $75,000 to $99,999 | 503 (11.7%) | 1,661 (17.4%) |
| $100,000 to $149,999 | 970 (22.5%) | 1,576 (16.5%) |
| $150,000 or more | 743 (17.2%) | 3,108 (32.5%) |
| Total | 4,312 (100.0%) | 9,567 (100.0%) |
Property Value to Household Income Ratio in Olive Branch
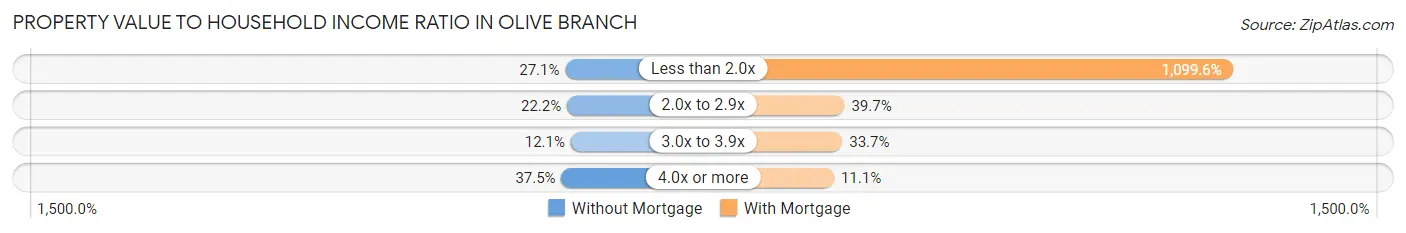
| Value-to-Income Ratio | Without Mortgage | With Mortgage |
| Less than 2.0x | 1,168 (27.1%) | 105,196 (1,099.6%) |
| 2.0x to 2.9x | 959 (22.2%) | 3,796 (39.7%) |
| 3.0x to 3.9x | 520 (12.1%) | 3,226 (33.7%) |
| 4.0x or more | 1,618 (37.5%) | 1,062 (11.1%) |
| Total | 4,312 (100.0%) | 9,567 (100.0%) |
Real Estate Taxes by Mortgage Status in Olive Branch
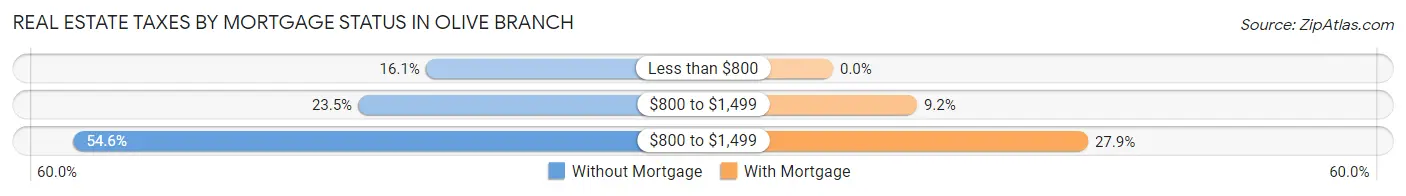
| Property Taxes | Without Mortgage | With Mortgage |
| Less than $800 | 692 (16.1%) | 0 (0.0%) |
| $800 to $1,499 | 1,012 (23.5%) | 880 (9.2%) |
| $800 to $1,499 | 2,356 (54.6%) | 2,673 (27.9%) |
| Total | 4,312 (100.0%) | 9,567 (100.0%) |
Health & Disability in Olive Branch
Health Insurance Coverage by Age in Olive Branch
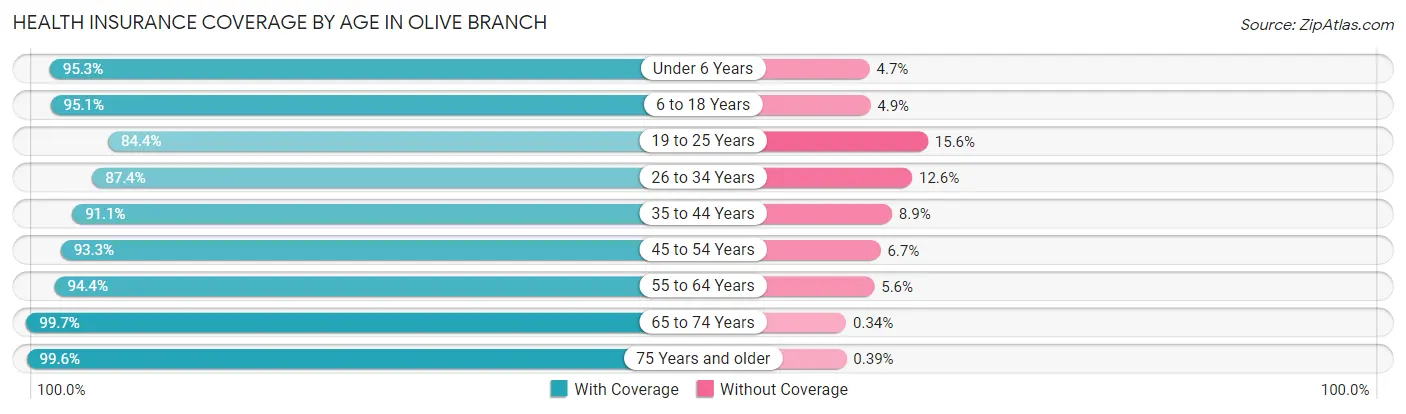
| Age Bracket | With Coverage | Without Coverage |
| Under 6 Years | 3,411 (95.3%) | 169 (4.7%) |
| 6 to 18 Years | 7,946 (95.1%) | 406 (4.9%) |
| 19 to 25 Years | 3,274 (84.4%) | 604 (15.6%) |
| 26 to 34 Years | 4,373 (87.4%) | 633 (12.6%) |
| 35 to 44 Years | 5,943 (91.1%) | 579 (8.9%) |
| 45 to 54 Years | 5,690 (93.3%) | 411 (6.7%) |
| 55 to 64 Years | 5,417 (94.4%) | 321 (5.6%) |
| 65 to 74 Years | 3,803 (99.7%) | 13 (0.3%) |
| 75 Years and older | 2,846 (99.6%) | 11 (0.4%) |
| Total | 42,703 (93.1%) | 3,147 (6.9%) |
Health Insurance Coverage by Citizenship Status in Olive Branch
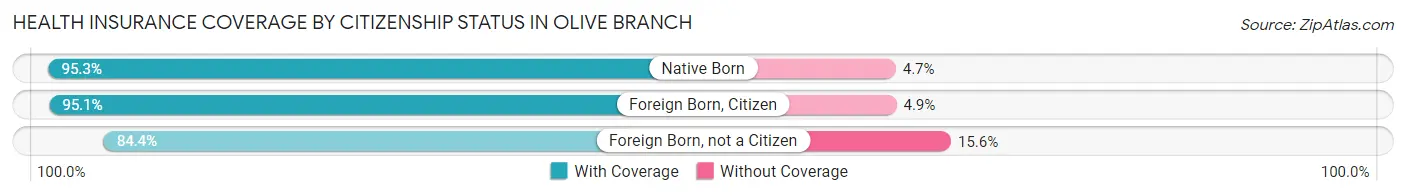
| Citizenship Status | With Coverage | Without Coverage |
| Native Born | 3,411 (95.3%) | 169 (4.7%) |
| Foreign Born, Citizen | 7,946 (95.1%) | 406 (4.9%) |
| Foreign Born, not a Citizen | 3,274 (84.4%) | 604 (15.6%) |
Health Insurance Coverage by Household Income in Olive Branch
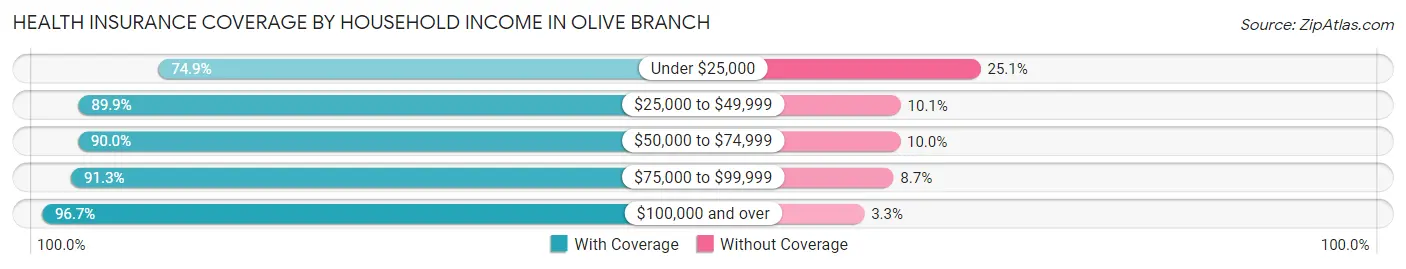
| Household Income | With Coverage | Without Coverage |
| Under $25,000 | 1,666 (74.9%) | 557 (25.1%) |
| $25,000 to $49,999 | 4,006 (89.9%) | 449 (10.1%) |
| $50,000 to $74,999 | 6,133 (90.0%) | 680 (10.0%) |
| $75,000 to $99,999 | 6,788 (91.3%) | 649 (8.7%) |
| $100,000 and over | 24,106 (96.7%) | 812 (3.3%) |
Public vs Private Health Insurance Coverage by Age in Olive Branch
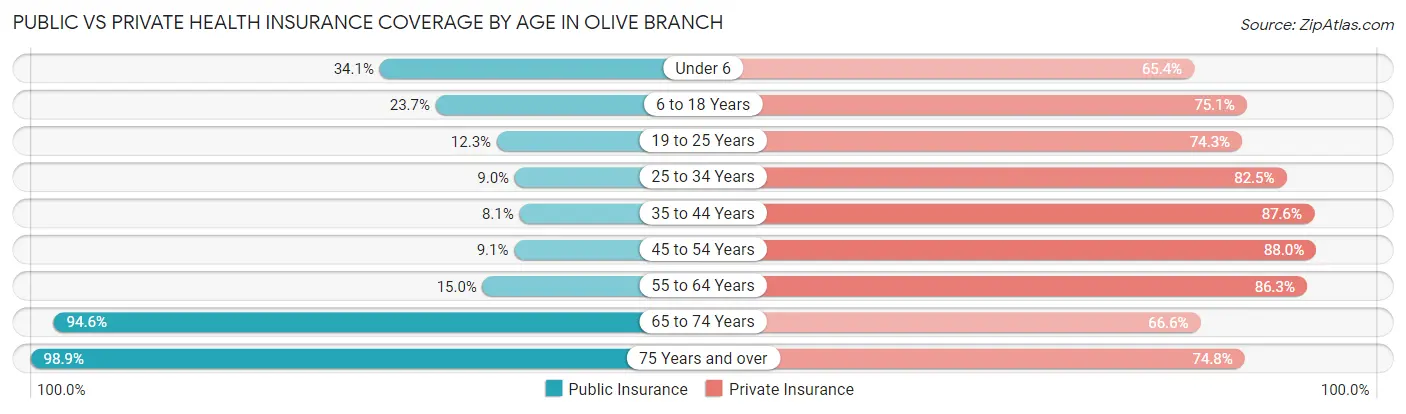
| Age Bracket | Public Insurance | Private Insurance |
| Under 6 | 1,220 (34.1%) | 2,340 (65.4%) |
| 6 to 18 Years | 1,978 (23.7%) | 6,273 (75.1%) |
| 19 to 25 Years | 478 (12.3%) | 2,880 (74.3%) |
| 25 to 34 Years | 450 (9.0%) | 4,130 (82.5%) |
| 35 to 44 Years | 530 (8.1%) | 5,713 (87.6%) |
| 45 to 54 Years | 555 (9.1%) | 5,371 (88.0%) |
| 55 to 64 Years | 859 (15.0%) | 4,952 (86.3%) |
| 65 to 74 Years | 3,610 (94.6%) | 2,540 (66.6%) |
| 75 Years and over | 2,825 (98.9%) | 2,136 (74.8%) |
| Total | 12,505 (27.3%) | 36,335 (79.2%) |
Disability Status by Sex by Age in Olive Branch
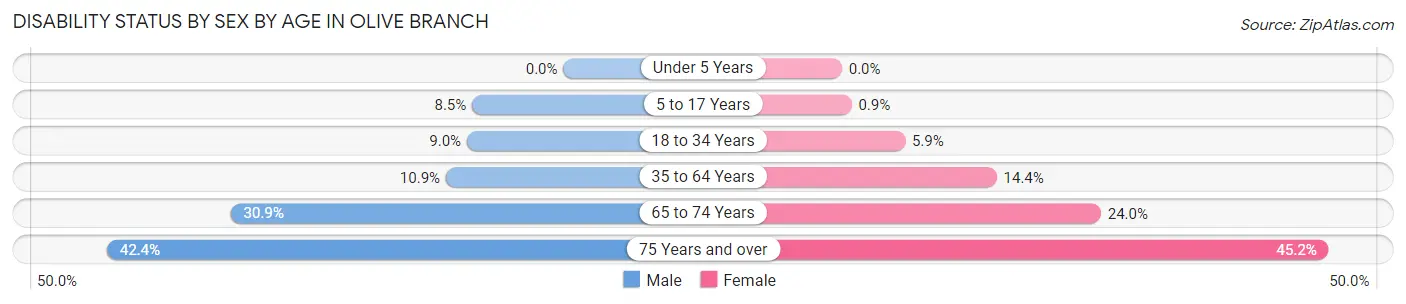
| Age Bracket | Male | Female |
| Under 5 Years | 0 (0.0%) | 0 (0.0%) |
| 5 to 17 Years | 377 (8.5%) | 36 (0.9%) |
| 18 to 34 Years | 396 (8.9%) | 301 (5.9%) |
| 35 to 64 Years | 955 (10.9%) | 1,380 (14.4%) |
| 65 to 74 Years | 526 (30.9%) | 508 (24.0%) |
| 75 Years and over | 511 (42.4%) | 746 (45.2%) |
Disability Class by Sex by Age in Olive Branch
Disability Class: Hearing Difficulty
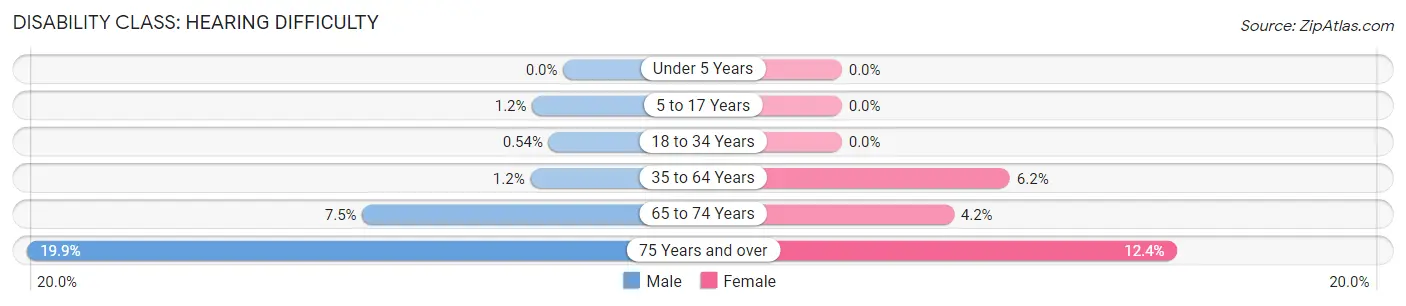
| Age Bracket | Male | Female |
| Under 5 Years | 0 (0.0%) | 0 (0.0%) |
| 5 to 17 Years | 51 (1.1%) | 0 (0.0%) |
| 18 to 34 Years | 24 (0.5%) | 0 (0.0%) |
| 35 to 64 Years | 107 (1.2%) | 599 (6.2%) |
| 65 to 74 Years | 127 (7.5%) | 88 (4.2%) |
| 75 Years and over | 240 (19.9%) | 205 (12.4%) |
Disability Class: Vision Difficulty
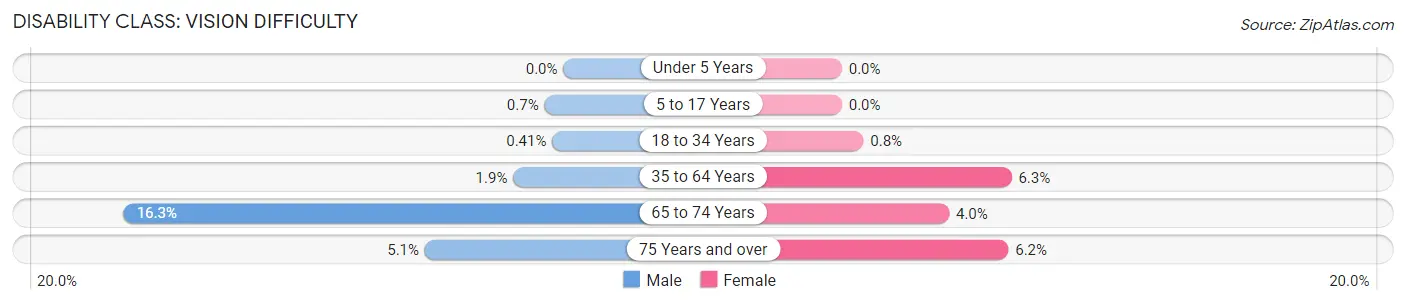
| Age Bracket | Male | Female |
| Under 5 Years | 0 (0.0%) | 0 (0.0%) |
| 5 to 17 Years | 31 (0.7%) | 0 (0.0%) |
| 18 to 34 Years | 18 (0.4%) | 41 (0.8%) |
| 35 to 64 Years | 163 (1.9%) | 605 (6.3%) |
| 65 to 74 Years | 278 (16.3%) | 84 (4.0%) |
| 75 Years and over | 62 (5.1%) | 102 (6.2%) |
Disability Class: Cognitive Difficulty
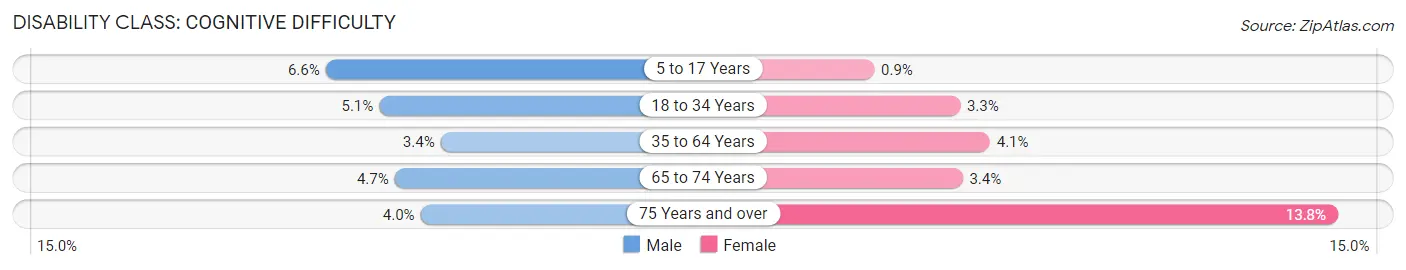
| Age Bracket | Male | Female |
| 5 to 17 Years | 295 (6.6%) | 36 (0.9%) |
| 18 to 34 Years | 227 (5.1%) | 169 (3.3%) |
| 35 to 64 Years | 300 (3.4%) | 396 (4.1%) |
| 65 to 74 Years | 80 (4.7%) | 71 (3.4%) |
| 75 Years and over | 48 (4.0%) | 228 (13.8%) |
Disability Class: Ambulatory Difficulty
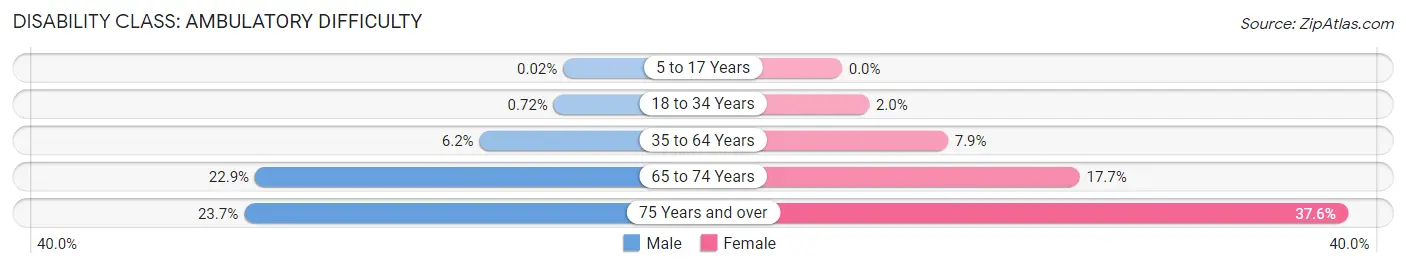
| Age Bracket | Male | Female |
| 5 to 17 Years | 1 (0.0%) | 0 (0.0%) |
| 18 to 34 Years | 32 (0.7%) | 104 (2.0%) |
| 35 to 64 Years | 546 (6.2%) | 756 (7.9%) |
| 65 to 74 Years | 390 (22.9%) | 373 (17.6%) |
| 75 Years and over | 286 (23.7%) | 620 (37.6%) |
Disability Class: Self-Care Difficulty
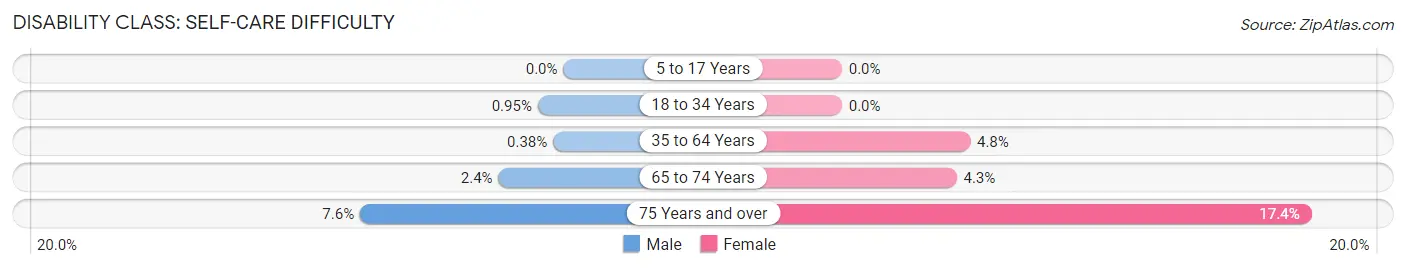
| Age Bracket | Male | Female |
| 5 to 17 Years | 0 (0.0%) | 0 (0.0%) |
| 18 to 34 Years | 42 (0.9%) | 0 (0.0%) |
| 35 to 64 Years | 33 (0.4%) | 457 (4.8%) |
| 65 to 74 Years | 41 (2.4%) | 90 (4.3%) |
| 75 Years and over | 91 (7.5%) | 288 (17.4%) |
Technology Access in Olive Branch
Computing Device Access in Olive Branch
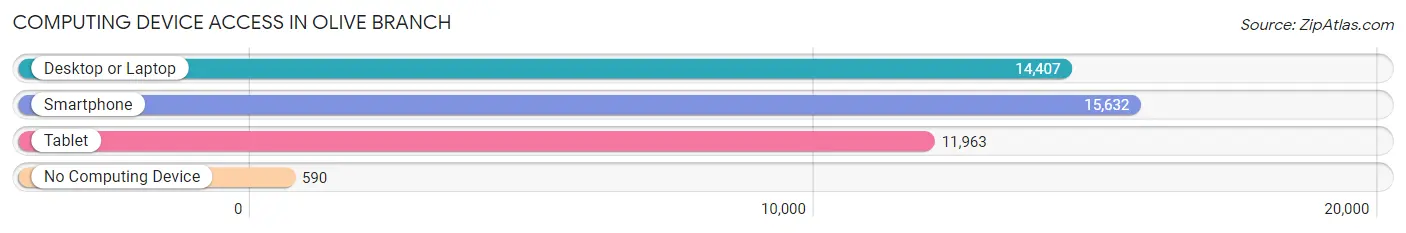
| Device Type | # Households | % Households |
| Desktop or Laptop | 14,407 | 84.5% |
| Smartphone | 15,632 | 91.7% |
| Tablet | 11,963 | 70.2% |
| No Computing Device | 590 | 3.5% |
| Total | 17,054 | 100.0% |
Internet Access in Olive Branch
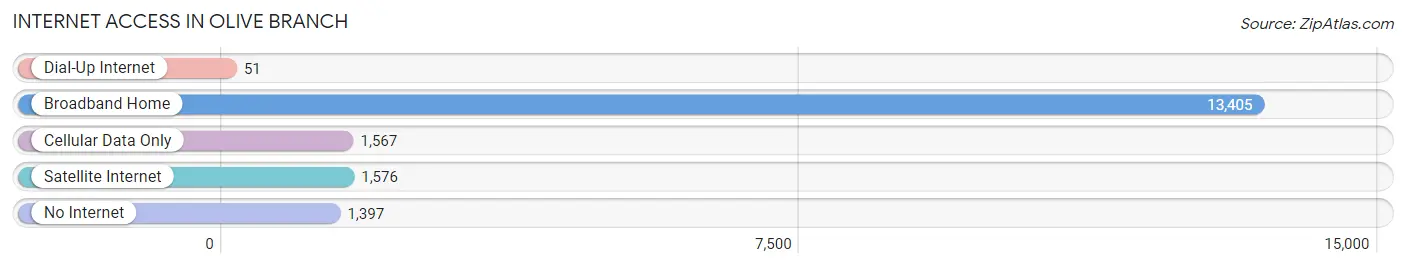
| Internet Type | # Households | % Households |
| Dial-Up Internet | 51 | 0.3% |
| Broadband Home | 13,405 | 78.6% |
| Cellular Data Only | 1,567 | 9.2% |
| Satellite Internet | 1,576 | 9.2% |
| No Internet | 1,397 | 8.2% |
| Total | 17,054 | 100.0% |
Olive Branch Summary
Olive Branch is a city located in DeSoto County, Mississippi, United States. The population was 33,484 at the 2010 census, up from 21,054 in 2000. Olive Branch is a suburb of Memphis, Tennessee, and is part of the Memphis Metropolitan Statistical Area, a region that consists of three counties in southwest Tennessee, five counties in northwest Mississippi, and two counties in eastern Arkansas.
History
The area that is now Olive Branch was first settled in the early 1800s by families from North Carolina, Virginia, and South Carolina. The first post office was established in 1836, and the town was officially incorporated in 1874. The name Olive Branch was chosen to reflect the peace and prosperity that the town hoped to bring to the area.
In the late 19th century, the town was a major center for cotton production and processing. The town was also home to several sawmills and gristmills, which provided lumber and grain for the local economy.
In the early 20th century, the town began to experience a period of growth and development. The population increased from 1,000 in 1900 to 4,000 in 1930. The town was connected to Memphis by a rail line in the 1920s, and the first paved road was built in the 1930s.
Geography
Olive Branch is located in DeSoto County, Mississippi, at the intersection of Interstate 78 and U.S. Route 78. The city is situated on the eastern edge of the Mississippi Delta, approximately 20 miles south of Memphis, Tennessee.
The city has a total area of 24.2 square miles, of which 24.1 square miles is land and 0.1 square miles is water. The city is located in the Memphis Metropolitan Statistical Area, which consists of three counties in southwest Tennessee, five counties in northwest Mississippi, and two counties in eastern Arkansas.
Economy
Olive Branch is a major center for business and industry in the Memphis Metropolitan Statistical Area. The city is home to several large employers, including FedEx, Nike, and International Paper. The city is also home to several smaller businesses, including restaurants, retail stores, and professional services.
The city's economy is largely driven by the service sector, which accounts for the majority of employment in the city. The city is also home to several manufacturing companies, including furniture and appliance makers, as well as food processing plants.
Demographics
As of the 2010 census, there were 33,484 people, 11,845 households, and 8,945 families residing in the city. The population density was 1,386.2 people per square mile. The racial makeup of the city was 68.3% White, 25.2% African American, 0.3% Native American, 1.7% Asian, 0.1% Pacific Islander, 2.2% from other races, and 2.3% from two or more races. Hispanic or Latino of any race were 5.3% of the population.
The median income for a household in the city was $50,945, and the median income for a family was $60,945. The per capita income for the city was $23,945. About 8.2% of families and 10.3% of the population were below the poverty line, including 14.2% of those under age 18 and 8.2% of those age 65 or over.
Common Questions
What is Per Capita Income in Olive Branch?
Per Capita income in Olive Branch is $40,277.
What is the Median Family Income in Olive Branch?
Median Family Income in Olive Branch is $103,581.
What is the Median Household income in Olive Branch?
Median Household Income in Olive Branch is $93,762.
What is Income or Wage Gap in Olive Branch?
Income or Wage Gap in Olive Branch is 30.2%.
Women in Olive Branch earn 69.8 cents for every dollar earned by a man.
What is Inequality or Gini Index in Olive Branch?
Inequality or Gini Index in Olive Branch is 0.37.
What is the Total Population of Olive Branch?
Total Population of Olive Branch is 45,938.
What is the Total Male Population of Olive Branch?
Total Male Population of Olive Branch is 21,822.
What is the Total Female Population of Olive Branch?
Total Female Population of Olive Branch is 24,116.
What is the Ratio of Males per 100 Females in Olive Branch?
There are 90.49 Males per 100 Females in Olive Branch.
What is the Ratio of Females per 100 Males in Olive Branch?
There are 110.51 Females per 100 Males in Olive Branch.
What is the Median Population Age in Olive Branch?
Median Population Age in Olive Branch is 38.2 Years.
What is the Average Family Size in Olive Branch
Average Family Size in Olive Branch is 3.1 People.
What is the Average Household Size in Olive Branch
Average Household Size in Olive Branch is 2.7 People.
How Large is the Labor Force in Olive Branch?
There are 25,034 People in the Labor Forcein in Olive Branch.
What is the Percentage of People in the Labor Force in Olive Branch?
69.3% of People are in the Labor Force in Olive Branch.
What is the Unemployment Rate in Olive Branch?
Unemployment Rate in Olive Branch is 2.7%.