Minneola, FL Map & Demographics
Minneola Map
Minneola Overview
$30,556
PER CAPITA INCOME
$102,554
AVG FAMILY INCOME
$91,435
AVG HOUSEHOLD INCOME
32.2%
WAGE / INCOME GAP [ % ]
67.8¢/ $1
WAGE / INCOME GAP [ $ ]
0.33
INEQUALITY / GINI INDEX
14,406
TOTAL POPULATION
7,128
MALE POPULATION
7,278
FEMALE POPULATION
97.94
MALES / 100 FEMALES
102.10
FEMALES / 100 MALES
36.4
MEDIAN AGE
3.5
AVG FAMILY SIZE
3.1
AVG HOUSEHOLD SIZE
7,451
LABOR FORCE [ PEOPLE ]
69.9%
PERCENT IN LABOR FORCE
3.5%
UNEMPLOYMENT RATE
Minneola Area Codes
Income in Minneola
Income Overview in Minneola
Per Capita Income in Minneola is $30,556, while median incomes of families and households are $102,554 and $91,435 respectively.
| Characteristic | Number | Measure |
| Per Capita Income | 14,406 | $30,556 |
| Median Family Income | 3,727 | $102,554 |
| Mean Family Income | 3,727 | $100,814 |
| Median Household Income | 4,564 | $91,435 |
| Mean Household Income | 4,564 | $94,701 |
| Income Deficit | 3,727 | $0 |
| Wage / Income Gap (%) | 14,406 | 32.22% |
| Wage / Income Gap ($) | 14,406 | 67.78¢ per $1 |
| Gini / Inequality Index | 14,406 | 0.33 |
Earnings by Sex in Minneola
Average Earnings in Minneola are $41,352, $52,199 for men and $35,379 for women, a difference of 32.2%.
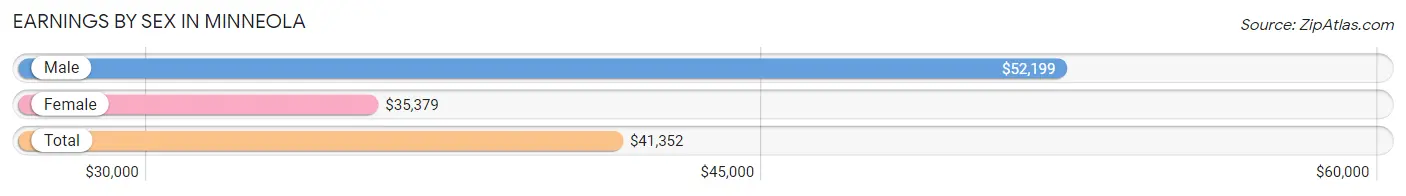
| Sex | Number | Average Earnings |
| Male | 4,003 (52.9%) | $52,199 |
| Female | 3,557 (47.0%) | $35,379 |
| Total | 7,560 (100.0%) | $41,352 |
Earnings by Sex by Income Bracket in Minneola
The most common earnings brackets in Minneola are $100,000+ for men (824 | 20.6%) and $30,000 to $34,999 for women (460 | 12.9%).
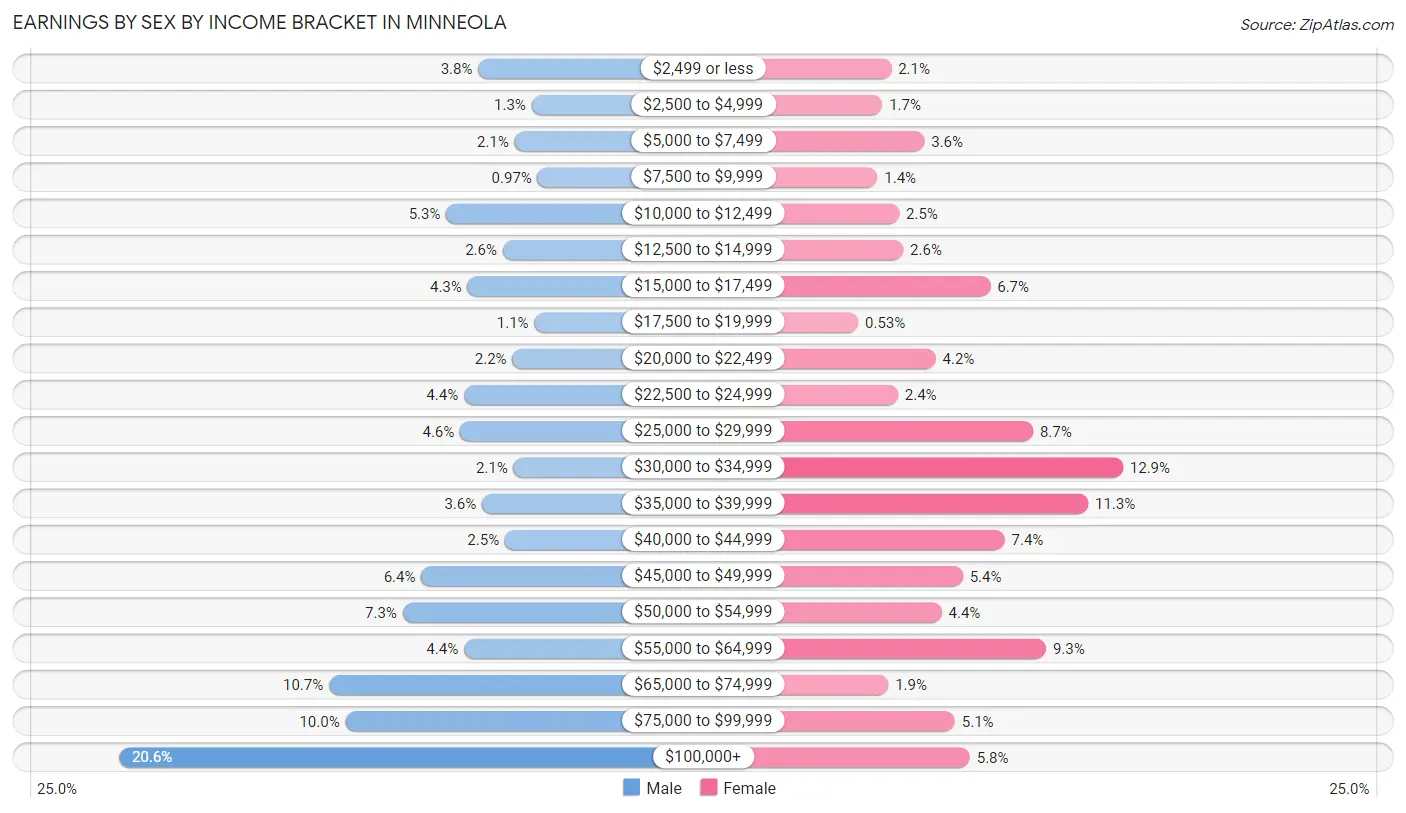
| Income | Male | Female |
| $2,499 or less | 150 (3.7%) | 74 (2.1%) |
| $2,500 to $4,999 | 50 (1.3%) | 59 (1.7%) |
| $5,000 to $7,499 | 82 (2.1%) | 129 (3.6%) |
| $7,500 to $9,999 | 39 (1.0%) | 51 (1.4%) |
| $10,000 to $12,499 | 210 (5.2%) | 87 (2.5%) |
| $12,500 to $14,999 | 104 (2.6%) | 94 (2.6%) |
| $15,000 to $17,499 | 170 (4.3%) | 239 (6.7%) |
| $17,500 to $19,999 | 45 (1.1%) | 19 (0.5%) |
| $20,000 to $22,499 | 86 (2.1%) | 148 (4.2%) |
| $22,500 to $24,999 | 177 (4.4%) | 85 (2.4%) |
| $25,000 to $29,999 | 184 (4.6%) | 310 (8.7%) |
| $30,000 to $34,999 | 84 (2.1%) | 460 (12.9%) |
| $35,000 to $39,999 | 143 (3.6%) | 402 (11.3%) |
| $40,000 to $44,999 | 100 (2.5%) | 263 (7.4%) |
| $45,000 to $49,999 | 257 (6.4%) | 193 (5.4%) |
| $50,000 to $54,999 | 292 (7.3%) | 158 (4.4%) |
| $55,000 to $64,999 | 177 (4.4%) | 332 (9.3%) |
| $65,000 to $74,999 | 430 (10.7%) | 69 (1.9%) |
| $75,000 to $99,999 | 399 (10.0%) | 180 (5.1%) |
| $100,000+ | 824 (20.6%) | 205 (5.8%) |
| Total | 4,003 (100.0%) | 3,557 (100.0%) |
Earnings by Sex by Educational Attainment in Minneola
Average earnings in Minneola are $54,976 for men and $37,561 for women, a difference of 31.7%. Men with an educational attainment of graduate degree enjoy the highest average annual earnings of $103,750, while those with high school diploma education earn the least with $51,391. Women with an educational attainment of graduate degree earn the most with the average annual earnings of $88,024, while those with college or associate's degree education have the smallest earnings of $32,949.
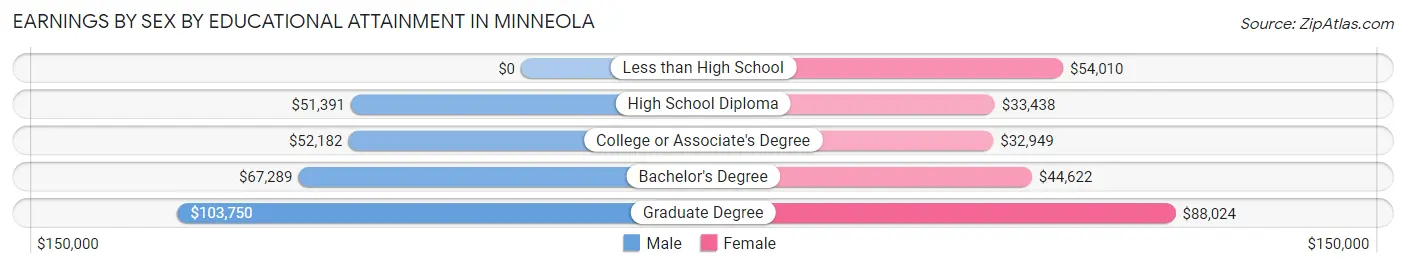
| Educational Attainment | Male Income | Female Income |
| Less than High School | - | - |
| High School Diploma | $51,391 | $33,438 |
| College or Associate's Degree | $52,182 | $32,949 |
| Bachelor's Degree | $67,289 | $44,622 |
| Graduate Degree | $103,750 | $88,024 |
| Total | $54,976 | $37,561 |
Family Income in Minneola
Family Income Brackets in Minneola
According to the Minneola family income data, there are 1,368 families falling into the $100,000 to $149,999 income range, which is the most common income bracket and makes up 36.7% of all families.
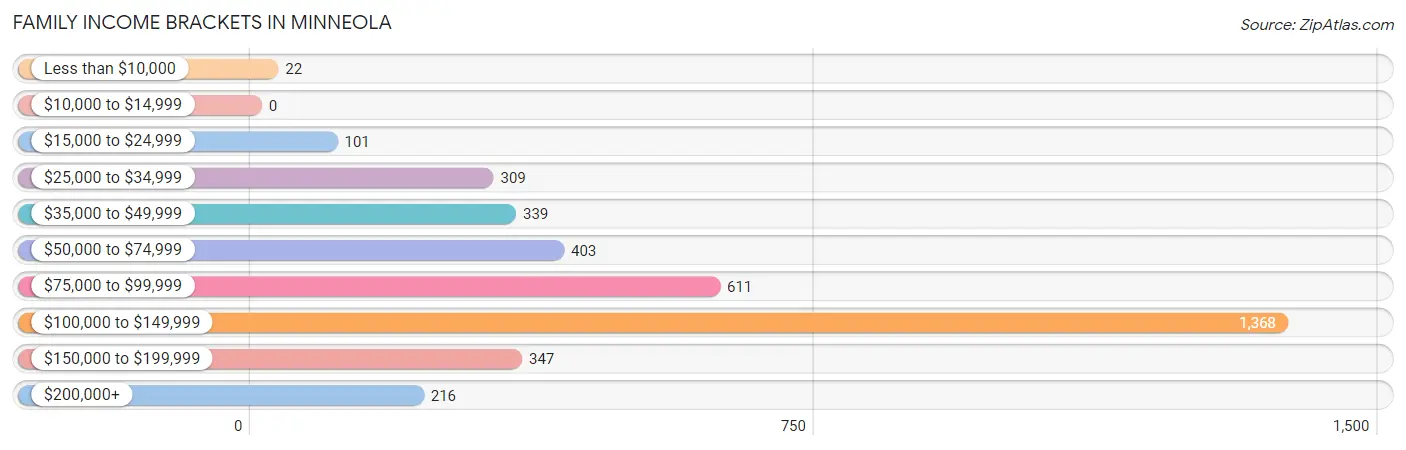
| Income Bracket | # Families | % Families |
| Less than $10,000 | 22 | 0.6% |
| $10,000 to $14,999 | 0 | 0.0% |
| $15,000 to $24,999 | 101 | 2.7% |
| $25,000 to $34,999 | 309 | 8.3% |
| $35,000 to $49,999 | 339 | 9.1% |
| $50,000 to $74,999 | 403 | 10.8% |
| $75,000 to $99,999 | 611 | 16.4% |
| $100,000 to $149,999 | 1,368 | 36.7% |
| $150,000 to $199,999 | 347 | 9.3% |
| $200,000+ | 216 | 5.8% |
Family Income by Famaliy Size in Minneola
4-person families (546 | 14.6%) account for the highest median family income in Minneola with $112,059 per family, while 2-person families (1,479 | 39.7%) have the highest median income of $38,275 per family member.
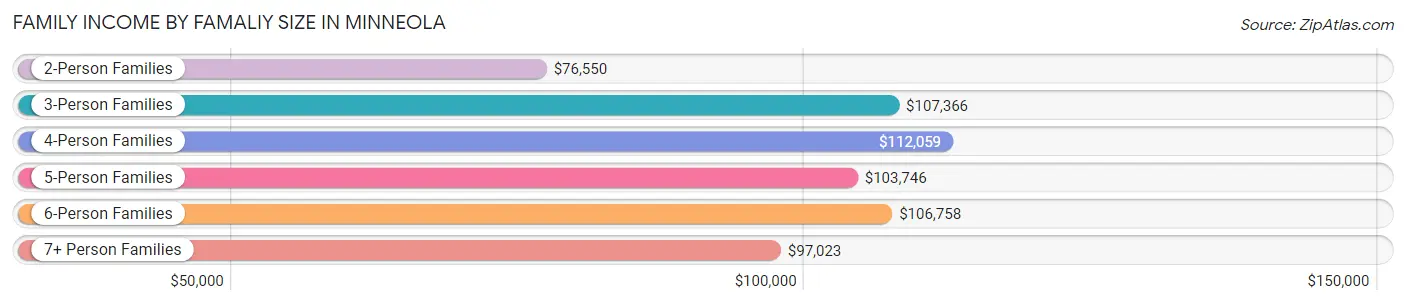
| Income Bracket | # Families | Median Income |
| 2-Person Families | 1,479 (39.7%) | $76,550 |
| 3-Person Families | 932 (25.0%) | $107,366 |
| 4-Person Families | 546 (14.6%) | $112,059 |
| 5-Person Families | 534 (14.3%) | $103,746 |
| 6-Person Families | 83 (2.2%) | $106,758 |
| 7+ Person Families | 153 (4.1%) | $97,023 |
| Total | 3,727 (100.0%) | $102,554 |
Family Income by Number of Earners in Minneola
The median family income in Minneola is $102,554, with families comprising 3+ earners (623) having the highest median family income of $109,688, while families with no earners (460) have the lowest median family income of $40,106, accounting for 16.7% and 12.3% of families, respectively.
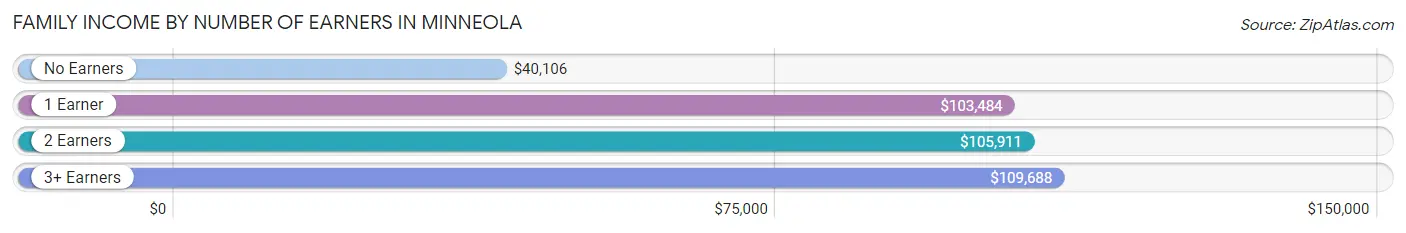
| Number of Earners | # Families | Median Income |
| No Earners | 460 (12.3%) | $40,106 |
| 1 Earner | 1,103 (29.6%) | $103,484 |
| 2 Earners | 1,541 (41.3%) | $105,911 |
| 3+ Earners | 623 (16.7%) | $109,688 |
| Total | 3,727 (100.0%) | $102,554 |
Household Income in Minneola
Household Income Brackets in Minneola
With 1,356 households falling in the category, the $100,000 to $149,999 income range is the most frequent in Minneola, accounting for 29.7% of all households.
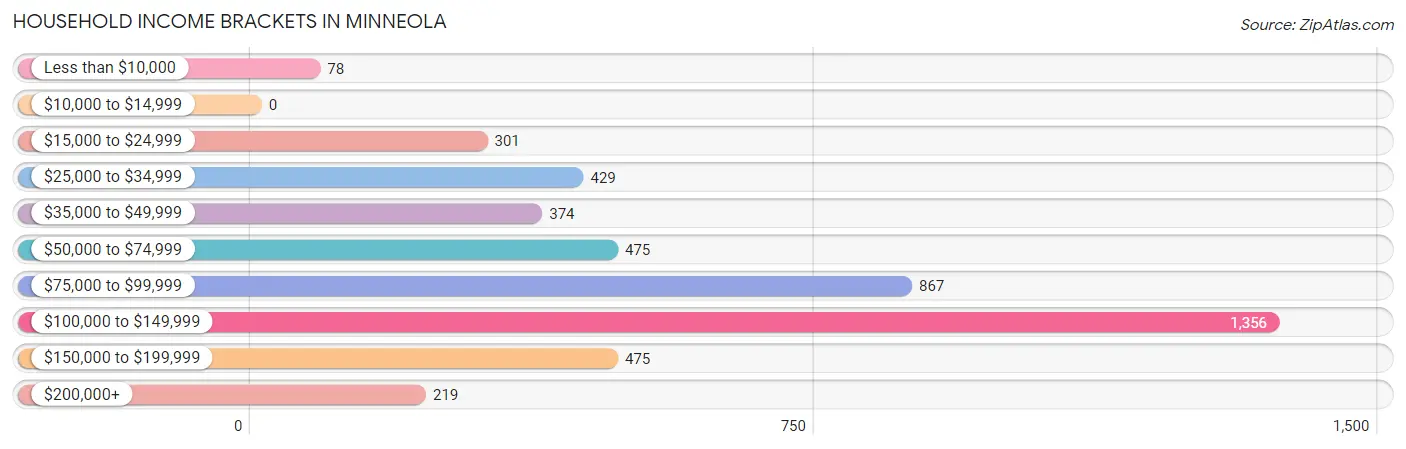
| Income Bracket | # Households | % Households |
| Less than $10,000 | 78 | 1.7% |
| $10,000 to $14,999 | 0 | 0.0% |
| $15,000 to $24,999 | 301 | 6.6% |
| $25,000 to $34,999 | 429 | 9.4% |
| $35,000 to $49,999 | 374 | 8.2% |
| $50,000 to $74,999 | 475 | 10.4% |
| $75,000 to $99,999 | 867 | 19.0% |
| $100,000 to $149,999 | 1,356 | 29.7% |
| $150,000 to $199,999 | 475 | 10.4% |
| $200,000+ | 219 | 4.8% |
Household Income by Householder Age in Minneola
The median household income in Minneola is $91,435, with the highest median household income of $103,359 found in the 25 to 44 years age bracket for the primary householder. A total of 2,032 households (44.5%) fall into this category. Meanwhile, the 15 to 24 years age bracket for the primary householder has the lowest median household income of $0, with 64 households (1.4%) in this group.
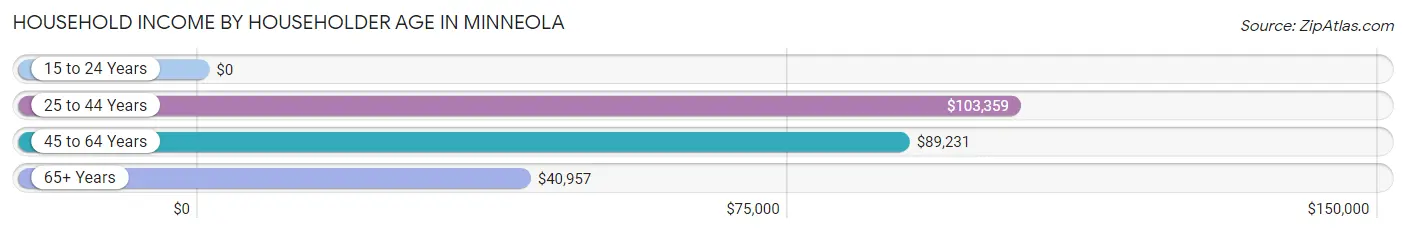
| Income Bracket | # Households | Median Income |
| 15 to 24 Years | 64 (1.4%) | $0 |
| 25 to 44 Years | 2,032 (44.5%) | $103,359 |
| 45 to 64 Years | 1,826 (40.0%) | $89,231 |
| 65+ Years | 642 (14.1%) | $40,957 |
| Total | 4,564 (100.0%) | $91,435 |
Poverty in Minneola
Income Below Poverty by Sex and Age in Minneola
With 4.5% poverty level for males and 4.0% for females among the residents of Minneola, 16 and 17 year old males and 15 year old females are the most vulnerable to poverty, with 40 males (24.7%) and 50 females (24.3%) in their respective age groups living below the poverty level.
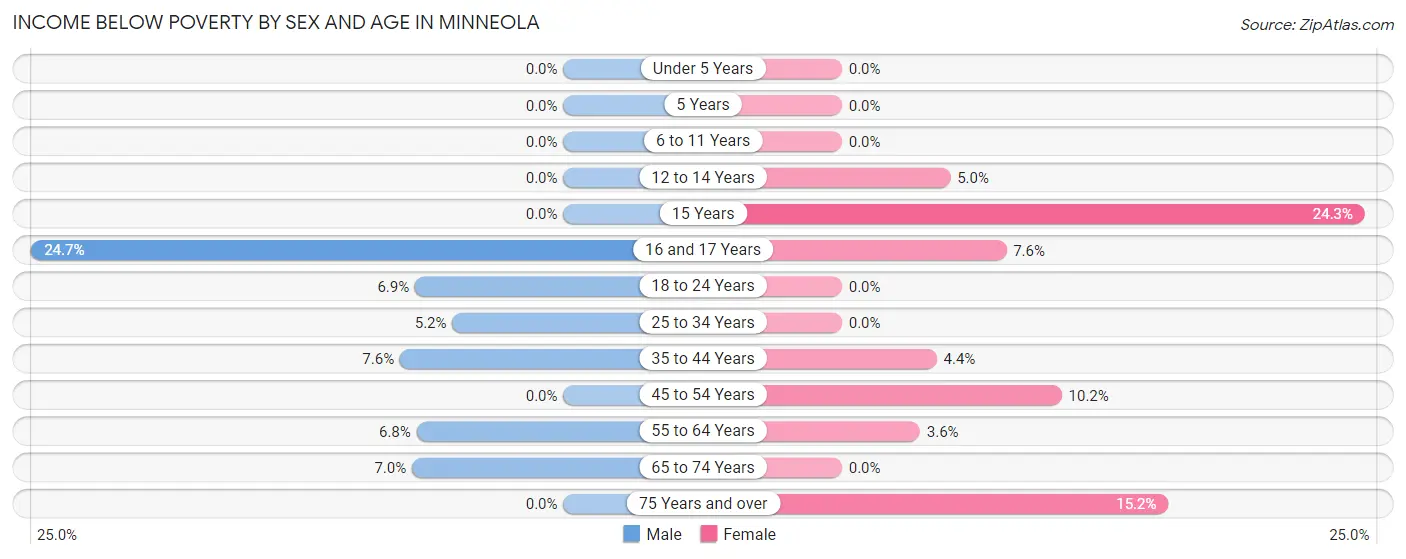
| Age Bracket | Male | Female |
| Under 5 Years | 0 (0.0%) | 0 (0.0%) |
| 5 Years | 0 (0.0%) | 0 (0.0%) |
| 6 to 11 Years | 0 (0.0%) | 0 (0.0%) |
| 12 to 14 Years | 0 (0.0%) | 16 (5.0%) |
| 15 Years | 0 (0.0%) | 50 (24.3%) |
| 16 and 17 Years | 40 (24.7%) | 10 (7.6%) |
| 18 to 24 Years | 39 (6.9%) | 0 (0.0%) |
| 25 to 34 Years | 45 (5.1%) | 0 (0.0%) |
| 35 to 44 Years | 116 (7.6%) | 59 (4.4%) |
| 45 to 54 Years | 0 (0.0%) | 95 (10.2%) |
| 55 to 64 Years | 57 (6.8%) | 32 (3.6%) |
| 65 to 74 Years | 24 (7.0%) | 0 (0.0%) |
| 75 Years and over | 0 (0.0%) | 25 (15.1%) |
| Total | 321 (4.5%) | 287 (4.0%) |
Income Above Poverty by Sex and Age in Minneola
According to the poverty statistics in Minneola, males aged under 5 years and females aged under 5 years are the age groups that are most secure financially, with 100.0% of males and 100.0% of females in these age groups living above the poverty line.
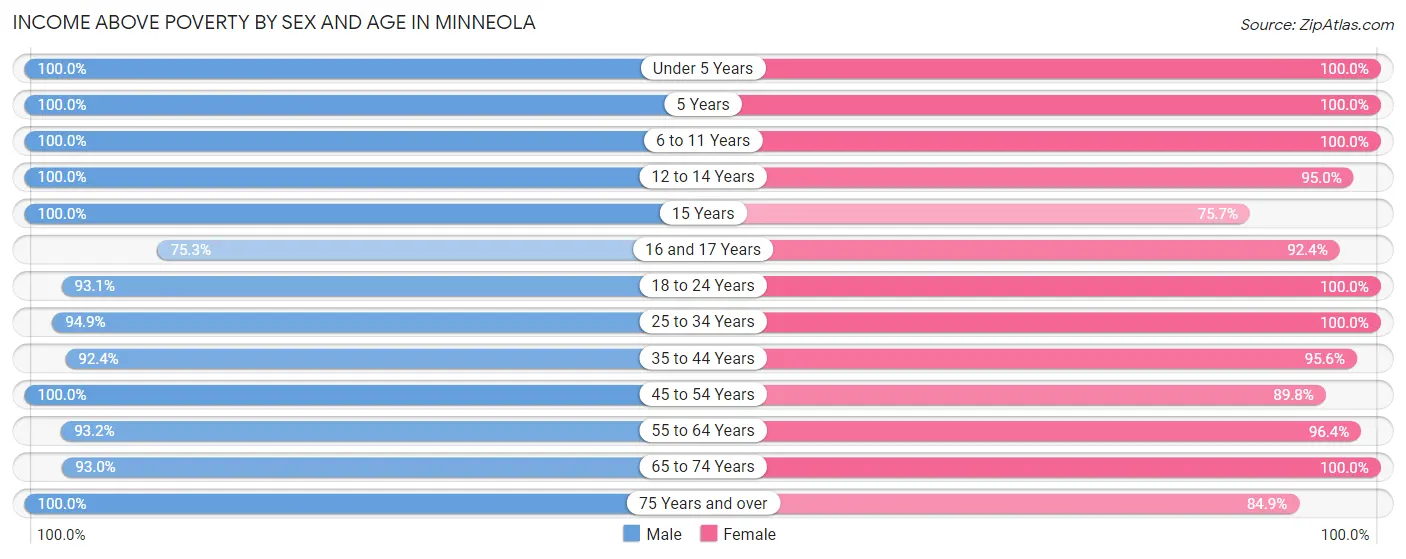
| Age Bracket | Male | Female |
| Under 5 Years | 598 (100.0%) | 485 (100.0%) |
| 5 Years | 143 (100.0%) | 23 (100.0%) |
| 6 to 11 Years | 766 (100.0%) | 837 (100.0%) |
| 12 to 14 Years | 225 (100.0%) | 302 (95.0%) |
| 15 Years | 146 (100.0%) | 156 (75.7%) |
| 16 and 17 Years | 122 (75.3%) | 121 (92.4%) |
| 18 to 24 Years | 528 (93.1%) | 416 (100.0%) |
| 25 to 34 Years | 828 (94.9%) | 957 (100.0%) |
| 35 to 44 Years | 1,415 (92.4%) | 1,282 (95.6%) |
| 45 to 54 Years | 759 (100.0%) | 836 (89.8%) |
| 55 to 64 Years | 780 (93.2%) | 852 (96.4%) |
| 65 to 74 Years | 318 (93.0%) | 577 (100.0%) |
| 75 Years and over | 173 (100.0%) | 140 (84.9%) |
| Total | 6,801 (95.5%) | 6,984 (96.1%) |
Income Below Poverty Among Married-Couple Families in Minneola
The poverty statistics for married-couple families in Minneola show that 0.8% or 24 of the total 2,856 families live below the poverty line. Families with 1 or 2 children have the highest poverty rate of 2.4%, comprising of 24 families. On the other hand, families with no children have the lowest poverty rate of 0.0%, which includes 0 families.
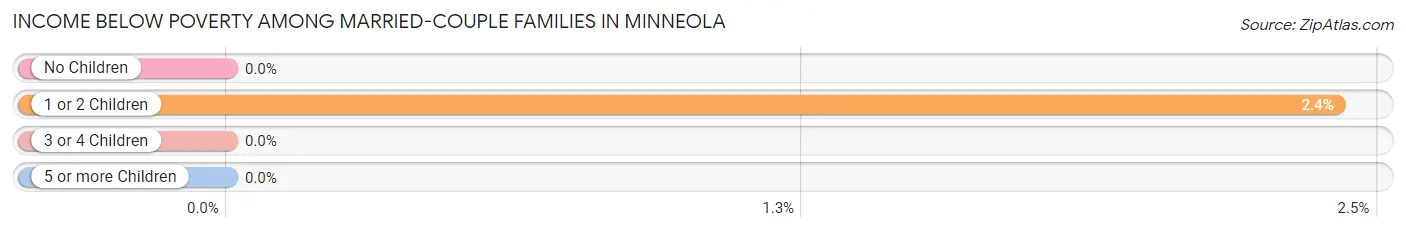
| Children | Above Poverty | Below Poverty |
| No Children | 1,309 (100.0%) | 0 (0.0%) |
| 1 or 2 Children | 973 (97.6%) | 24 (2.4%) |
| 3 or 4 Children | 463 (100.0%) | 0 (0.0%) |
| 5 or more Children | 87 (100.0%) | 0 (0.0%) |
| Total | 2,832 (99.2%) | 24 (0.8%) |
Income Below Poverty Among Single-Parent Households in Minneola
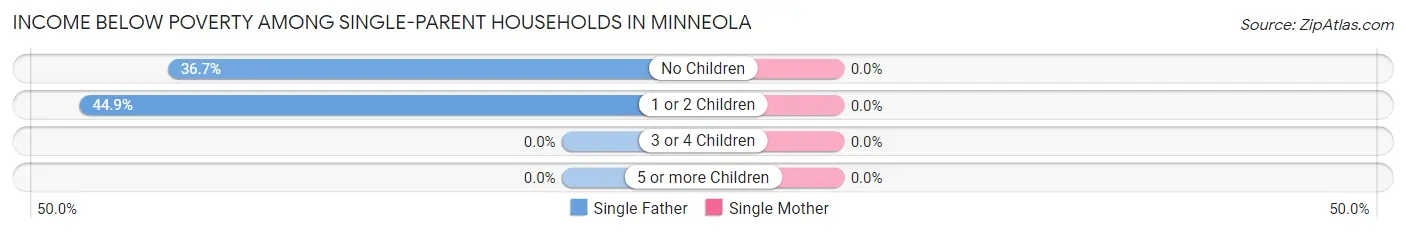
| Children | Single Father | Single Mother |
| No Children | 44 (36.7%) | 0 (0.0%) |
| 1 or 2 Children | 57 (44.9%) | 0 (0.0%) |
| 3 or 4 Children | 0 (0.0%) | 0 (0.0%) |
| 5 or more Children | 0 (0.0%) | 0 (0.0%) |
| Total | 101 (40.9%) | 0 (0.0%) |
Income Below Poverty Among Married-Couple vs Single-Parent Households in Minneola
The poverty data for Minneola shows that 24 of the married-couple family households (0.8%) and 101 of the single-parent households (11.6%) are living below the poverty level. Within the married-couple family households, those with 1 or 2 children have the highest poverty rate, with 24 households (2.4%) falling below the poverty line. Among the single-parent households, those with 1 or 2 children have the highest poverty rate, with 57 household (14.5%) living below poverty.
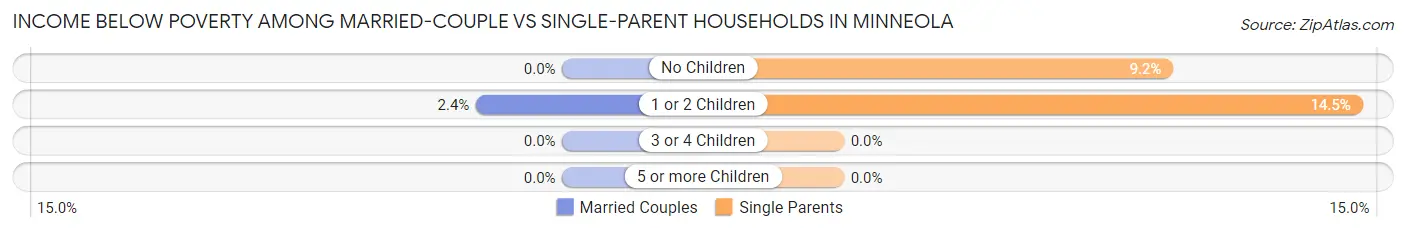
| Children | Married-Couple Families | Single-Parent Households |
| No Children | 0 (0.0%) | 44 (9.2%) |
| 1 or 2 Children | 24 (2.4%) | 57 (14.5%) |
| 3 or 4 Children | 0 (0.0%) | 0 (0.0%) |
| 5 or more Children | 0 (0.0%) | 0 (0.0%) |
| Total | 24 (0.8%) | 101 (11.6%) |
Race in Minneola
The most populous races in Minneola are White / Caucasian (8,939 | 62.1%), Hispanic or Latino (4,434 | 30.8%), and Two or more Races (2,222 | 15.4%).
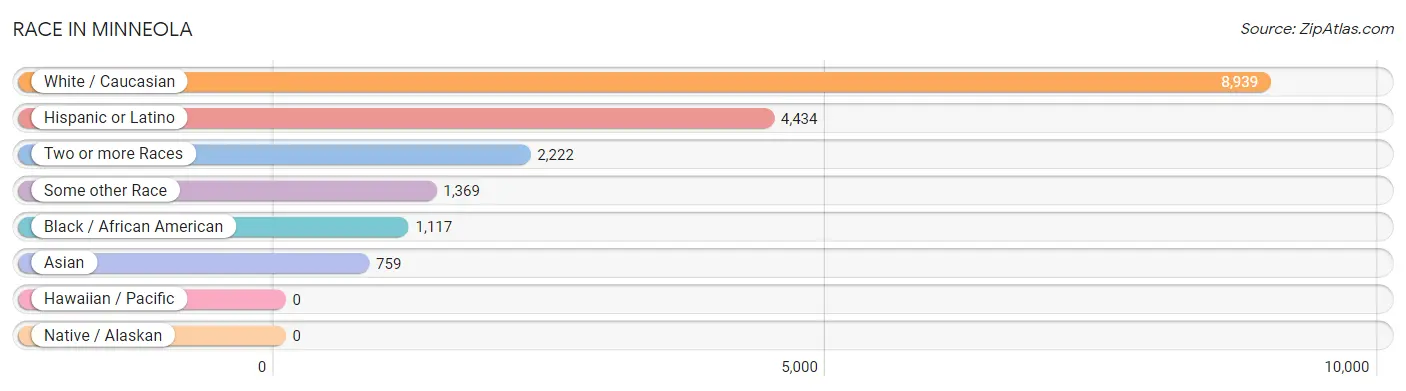
| Race | # Population | % Population |
| Asian | 759 | 5.3% |
| Black / African American | 1,117 | 7.7% |
| Hawaiian / Pacific | 0 | 0.0% |
| Hispanic or Latino | 4,434 | 30.8% |
| Native / Alaskan | 0 | 0.0% |
| White / Caucasian | 8,939 | 62.1% |
| Two or more Races | 2,222 | 15.4% |
| Some other Race | 1,369 | 9.5% |
| Total | 14,406 | 100.0% |
Ancestry in Minneola
The most populous ancestries reported in Minneola are American (3,332 | 23.1%), Puerto Rican (2,776 | 19.3%), German (2,118 | 14.7%), Irish (1,665 | 11.6%), and English (642 | 4.5%), together accounting for 73.1% of all Minneola residents.
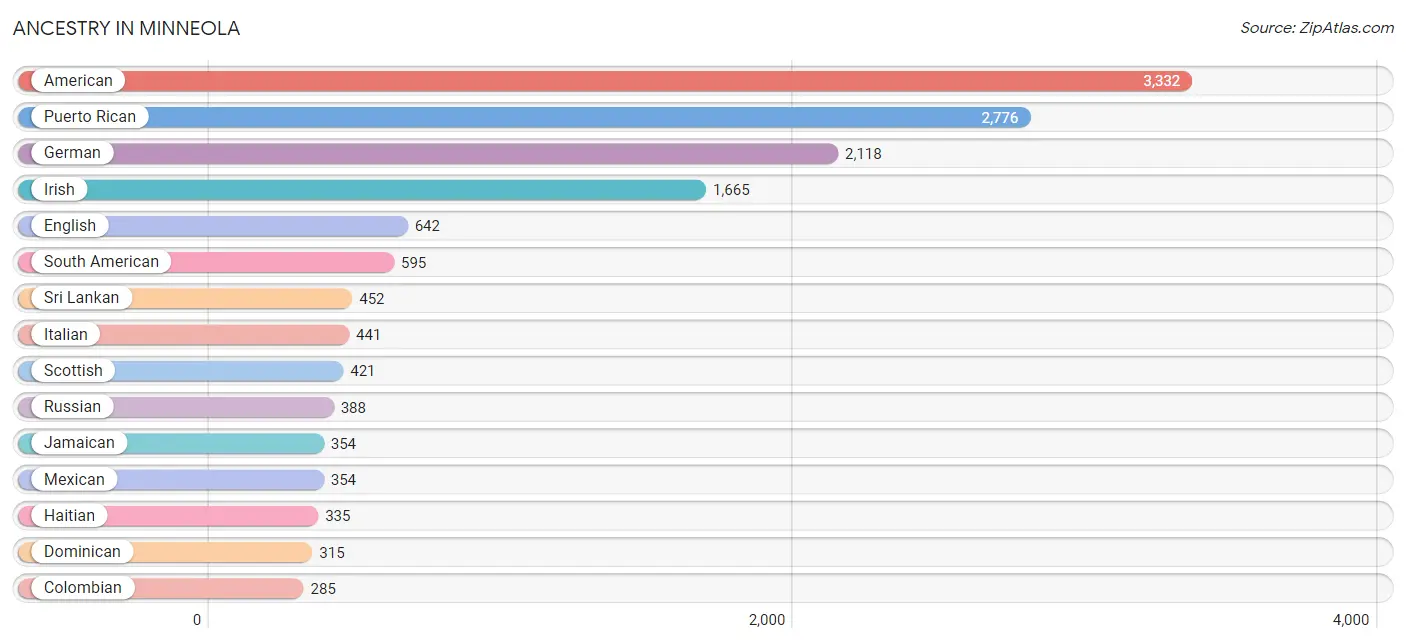
| Ancestry | # Population | % Population |
| American | 3,332 | 23.1% |
| Austrian | 21 | 0.2% |
| British | 52 | 0.4% |
| Burmese | 34 | 0.2% |
| Canadian | 24 | 0.2% |
| Central American | 175 | 1.2% |
| Central American Indian | 160 | 1.1% |
| Cherokee | 7 | 0.1% |
| Colombian | 285 | 2.0% |
| Cuban | 88 | 0.6% |
| Czech | 85 | 0.6% |
| Danish | 33 | 0.2% |
| Dominican | 315 | 2.2% |
| Dutch | 76 | 0.5% |
| Eastern European | 18 | 0.1% |
| Ecuadorian | 82 | 0.6% |
| English | 642 | 4.5% |
| European | 142 | 1.0% |
| French | 67 | 0.5% |
| French Canadian | 114 | 0.8% |
| German | 2,118 | 14.7% |
| Greek | 3 | 0.0% |
| Guyanese | 251 | 1.7% |
| Haitian | 335 | 2.3% |
| Honduran | 38 | 0.3% |
| Irish | 1,665 | 11.6% |
| Italian | 441 | 3.1% |
| Jamaican | 354 | 2.5% |
| Korean | 64 | 0.4% |
| Lithuanian | 16 | 0.1% |
| Mexican | 354 | 2.5% |
| Nicaraguan | 122 | 0.9% |
| Norwegian | 46 | 0.3% |
| Peruvian | 228 | 1.6% |
| Polish | 183 | 1.3% |
| Portuguese | 144 | 1.0% |
| Puerto Rican | 2,776 | 19.3% |
| Russian | 388 | 2.7% |
| Salvadoran | 15 | 0.1% |
| Scotch-Irish | 147 | 1.0% |
| Scottish | 421 | 2.9% |
| South African | 53 | 0.4% |
| South American | 595 | 4.1% |
| Spaniard | 53 | 0.4% |
| Spanish | 47 | 0.3% |
| Sri Lankan | 452 | 3.1% |
| Subsaharan African | 53 | 0.4% |
| Swedish | 94 | 0.6% |
| Thai | 219 | 1.5% |
| Trinidadian and Tobagonian | 27 | 0.2% |
| U.S. Virgin Islander | 73 | 0.5% | View All 51 Rows |
Immigrants in Minneola
The most numerous immigrant groups reported in Minneola came from Latin America (1,316 | 9.1%), Caribbean (705 | 4.9%), South America (501 | 3.5%), Asia (472 | 3.3%), and South Eastern Asia (331 | 2.3%), together accounting for 23.1% of all Minneola residents.
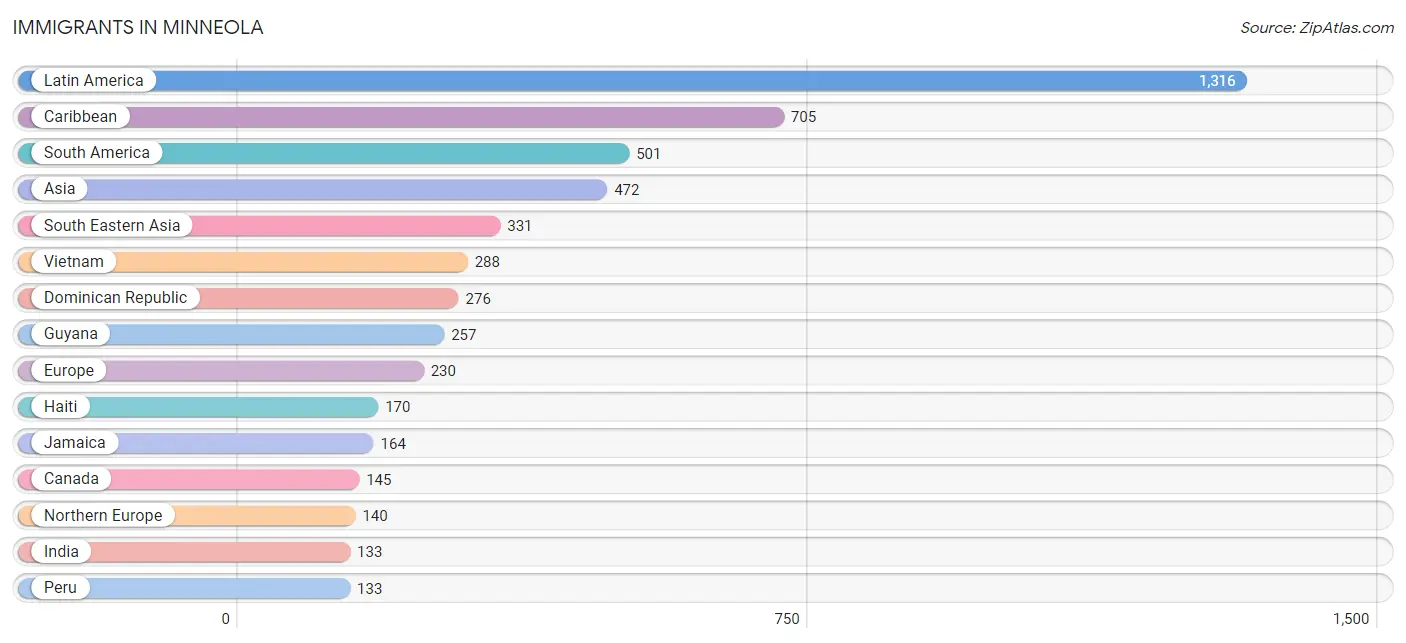
| Immigration Origin | # Population | % Population |
| Africa | 53 | 0.4% |
| Asia | 472 | 3.3% |
| Canada | 145 | 1.0% |
| Caribbean | 705 | 4.9% |
| Central America | 110 | 0.8% |
| Colombia | 111 | 0.8% |
| Cuba | 68 | 0.5% |
| Dominican Republic | 276 | 1.9% |
| Eastern Asia | 8 | 0.1% |
| Eastern Europe | 44 | 0.3% |
| El Salvador | 15 | 0.1% |
| Europe | 230 | 1.6% |
| Germany | 46 | 0.3% |
| Guyana | 257 | 1.8% |
| Haiti | 170 | 1.2% |
| India | 133 | 0.9% |
| Jamaica | 164 | 1.1% |
| Korea | 8 | 0.1% |
| Latin America | 1,316 | 9.1% |
| Mexico | 14 | 0.1% |
| Nicaragua | 81 | 0.6% |
| Northern Europe | 140 | 1.0% |
| Norway | 12 | 0.1% |
| Peru | 133 | 0.9% |
| Philippines | 43 | 0.3% |
| Russia | 44 | 0.3% |
| Scotland | 53 | 0.4% |
| South Africa | 53 | 0.4% |
| South America | 501 | 3.5% |
| South Central Asia | 133 | 0.9% |
| South Eastern Asia | 331 | 2.3% |
| Sweden | 53 | 0.4% |
| Trinidad and Tobago | 27 | 0.2% |
| Vietnam | 288 | 2.0% |
| Western Europe | 46 | 0.3% | View All 35 Rows |
Sex and Age in Minneola
Sex and Age in Minneola
The most populous age groups in Minneola are 35 to 39 Years (841 | 11.8%) for men and 35 to 39 Years (806 | 11.1%) for women.
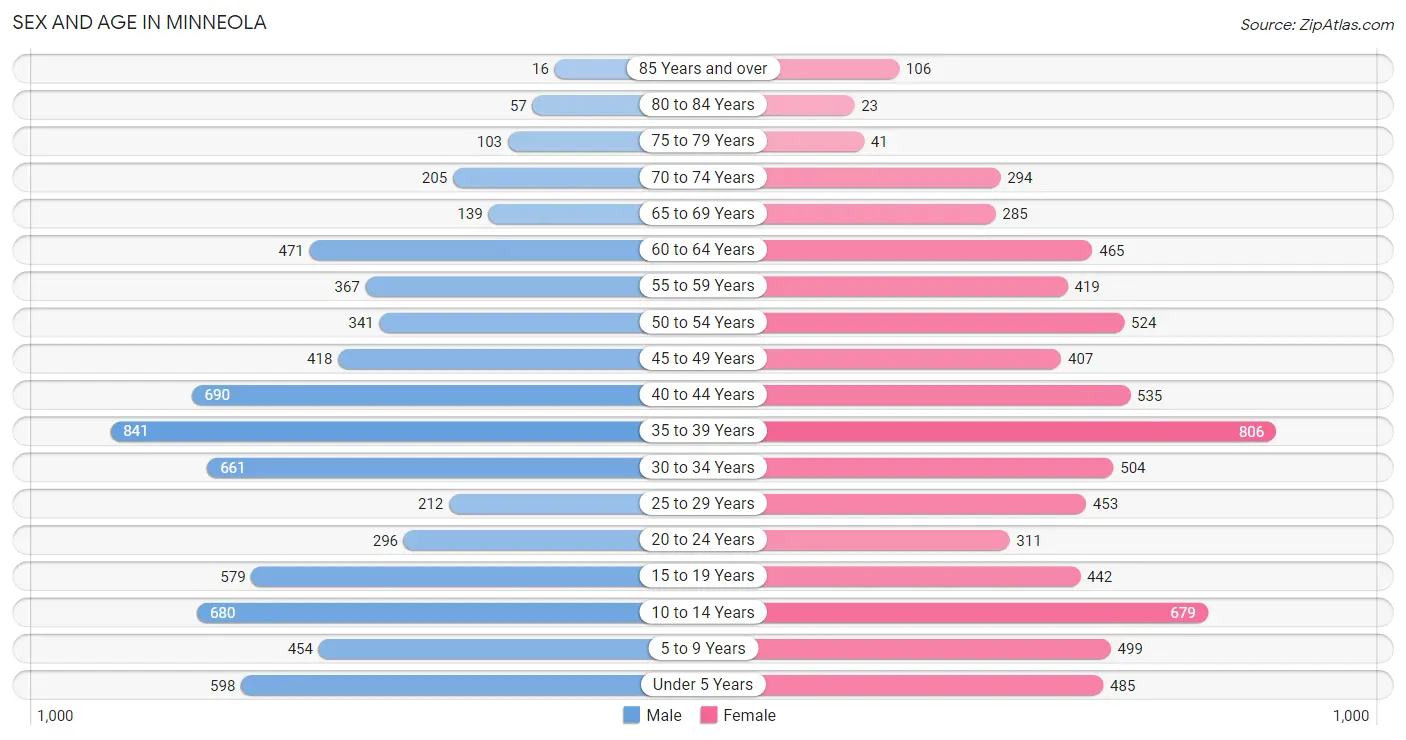
| Age Bracket | Male | Female |
| Under 5 Years | 598 (8.4%) | 485 (6.7%) |
| 5 to 9 Years | 454 (6.4%) | 499 (6.9%) |
| 10 to 14 Years | 680 (9.5%) | 679 (9.3%) |
| 15 to 19 Years | 579 (8.1%) | 442 (6.1%) |
| 20 to 24 Years | 296 (4.2%) | 311 (4.3%) |
| 25 to 29 Years | 212 (3.0%) | 453 (6.2%) |
| 30 to 34 Years | 661 (9.3%) | 504 (6.9%) |
| 35 to 39 Years | 841 (11.8%) | 806 (11.1%) |
| 40 to 44 Years | 690 (9.7%) | 535 (7.3%) |
| 45 to 49 Years | 418 (5.9%) | 407 (5.6%) |
| 50 to 54 Years | 341 (4.8%) | 524 (7.2%) |
| 55 to 59 Years | 367 (5.1%) | 419 (5.8%) |
| 60 to 64 Years | 471 (6.6%) | 465 (6.4%) |
| 65 to 69 Years | 139 (1.9%) | 285 (3.9%) |
| 70 to 74 Years | 205 (2.9%) | 294 (4.0%) |
| 75 to 79 Years | 103 (1.5%) | 41 (0.6%) |
| 80 to 84 Years | 57 (0.8%) | 23 (0.3%) |
| 85 Years and over | 16 (0.2%) | 106 (1.5%) |
| Total | 7,128 (100.0%) | 7,278 (100.0%) |
Families and Households in Minneola
Median Family Size in Minneola
The median family size in Minneola is 3.49 persons per family, with married-couple families (2,856 | 76.6%) accounting for the largest median family size of 3.77 persons per family. On the other hand, single male/father families (247 | 6.6%) represent the smallest median family size with 2.52 persons per family.
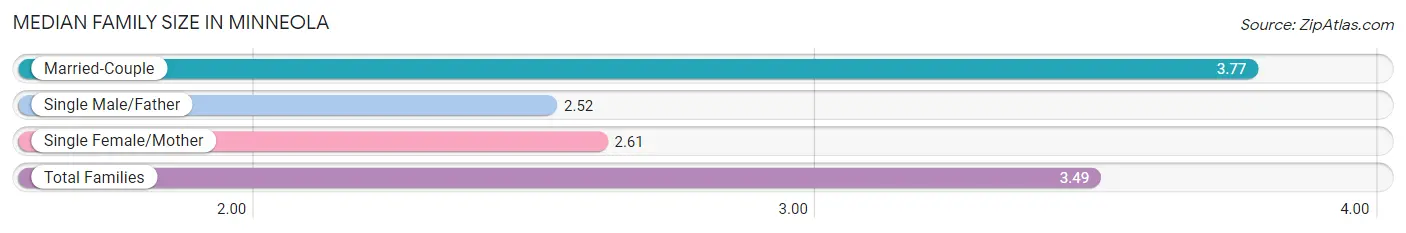
| Family Type | # Families | Family Size |
| Married-Couple | 2,856 (76.6%) | 3.77 |
| Single Male/Father | 247 (6.6%) | 2.52 |
| Single Female/Mother | 624 (16.7%) | 2.61 |
| Total Families | 3,727 (100.0%) | 3.49 |
Median Household Size in Minneola
The median household size in Minneola is 3.15 persons per household, with married-couple households (2,856 | 62.6%) accounting for the largest median household size of 3.78 persons per household. non-family households (837 | 18.3%) represent the smallest median household size with 1.40 persons per household.
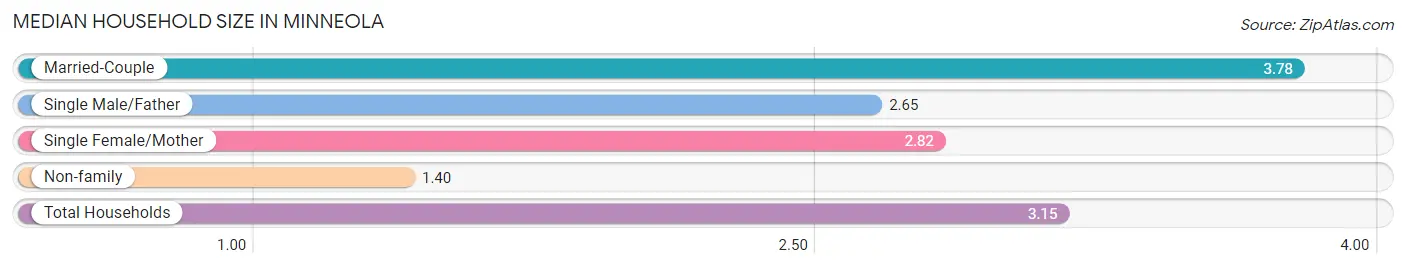
| Household Type | # Households | Household Size |
| Married-Couple | 2,856 (62.6%) | 3.78 |
| Single Male/Father | 247 (5.4%) | 2.65 |
| Single Female/Mother | 624 (13.7%) | 2.82 |
| Non-family | 837 (18.3%) | 1.40 |
| Total Households | 4,564 (100.0%) | 3.15 |
Household Size by Marriage Status in Minneola
Out of a total of 4,564 households in Minneola, 3,727 (81.7%) are family households, while 837 (18.3%) are nonfamily households. The most numerous type of family households are 2-person households, comprising 1,410, and the most common type of nonfamily households are 1-person households, comprising 550.
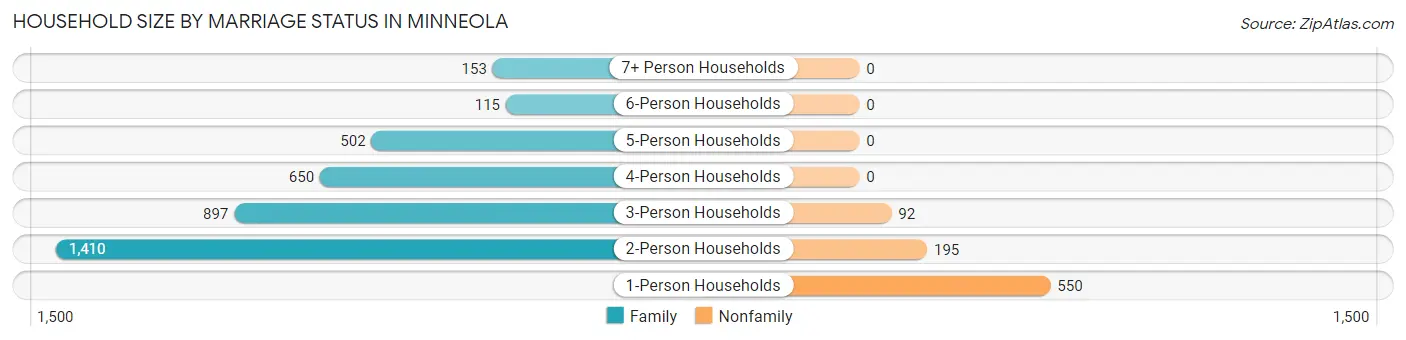
| Household Size | Family Households | Nonfamily Households |
| 1-Person Households | - | 550 (12.0%) |
| 2-Person Households | 1,410 (30.9%) | 195 (4.3%) |
| 3-Person Households | 897 (19.7%) | 92 (2.0%) |
| 4-Person Households | 650 (14.2%) | 0 (0.0%) |
| 5-Person Households | 502 (11.0%) | 0 (0.0%) |
| 6-Person Households | 115 (2.5%) | 0 (0.0%) |
| 7+ Person Households | 153 (3.4%) | 0 (0.0%) |
| Total | 3,727 (81.7%) | 837 (18.3%) |
Female Fertility in Minneola
Fertility by Age in Minneola
Average fertility rate in Minneola is 30.0 births per 1,000 women. Women in the age bracket of 20 to 34 years have the highest fertility rate with 83.0 births per 1,000 women. Women in the age bracket of 20 to 34 years acount for 100.0% of all women with births.
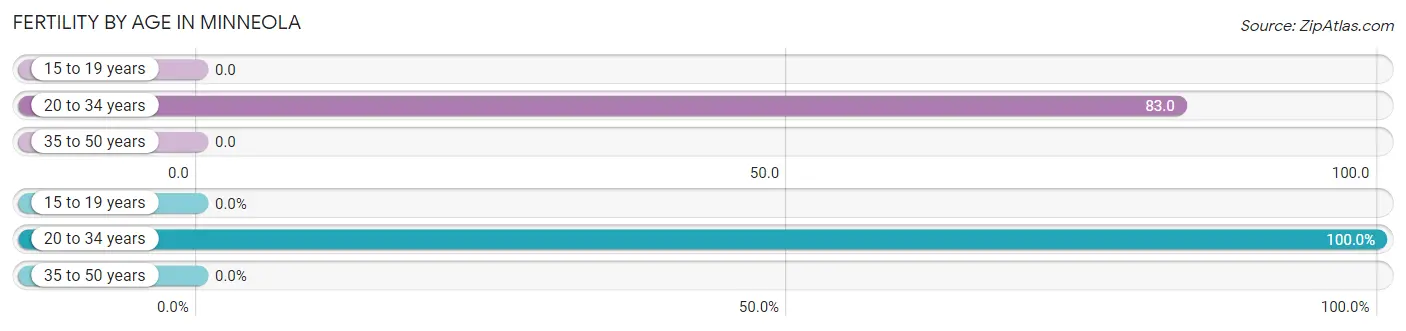
| Age Bracket | Women with Births | Births / 1,000 Women |
| 15 to 19 years | 0 (0.0%) | 0.0 |
| 20 to 34 years | 105 (100.0%) | 83.0 |
| 35 to 50 years | 0 (0.0%) | 0.0 |
| Total | 105 (100.0%) | 30.0 |
Fertility by Age by Marriage Status in Minneola
85.7% of women with births (105) in Minneola are married. The highest percentage of unmarried women with births falls into 20 to 34 years age bracket with 14.3% of them unmarried at the time of birth, while the lowest percentage of unmarried women with births belong to 20 to 34 years age bracket with 14.3% of them unmarried.
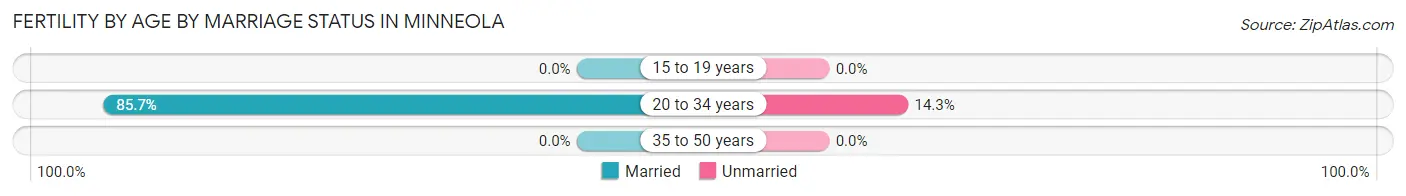
| Age Bracket | Married | Unmarried |
| 15 to 19 years | 0 (0.0%) | 0 (0.0%) |
| 20 to 34 years | 90 (85.7%) | 15 (14.3%) |
| 35 to 50 years | 0 (0.0%) | 0 (0.0%) |
| Total | 90 (85.7%) | 15 (14.3%) |
Fertility by Education in Minneola
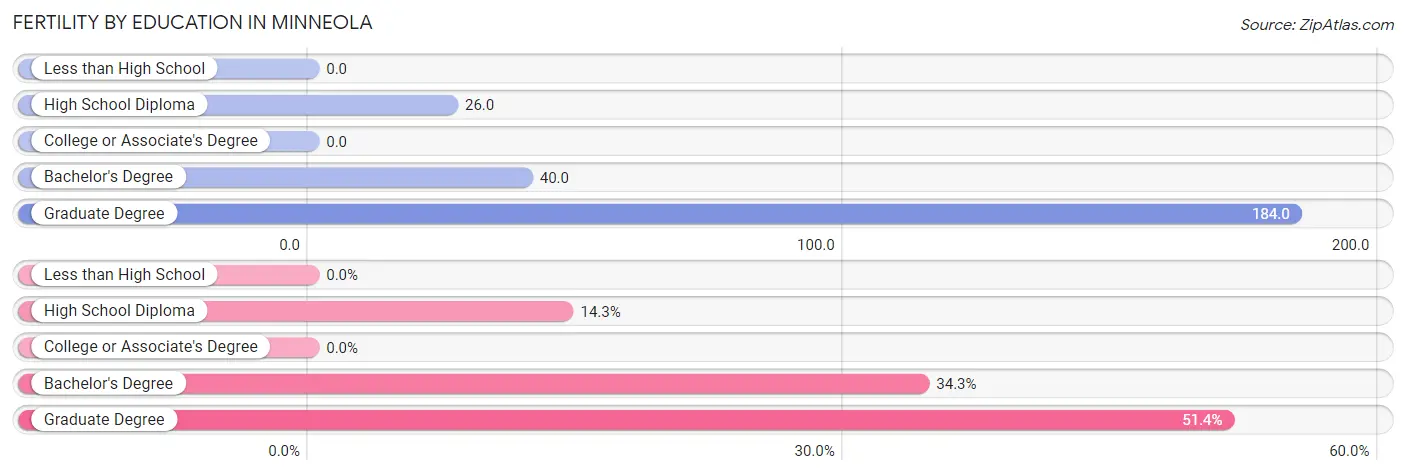
| Educational Attainment | Women with Births | Births / 1,000 Women |
| Less than High School | 0 (0.0%) | 0.0 |
| High School Diploma | 15 (14.3%) | 26.0 |
| College or Associate's Degree | 0 (0.0%) | 0.0 |
| Bachelor's Degree | 36 (34.3%) | 40.0 |
| Graduate Degree | 54 (51.4%) | 184.0 |
| Total | 105 (100.0%) | 30.0 |
Fertility by Education by Marriage Status in Minneola
14.3% of women with births in Minneola are unmarried. Women with the educational attainment of bachelor's degree are most likely to be married with 100.0% of them married at childbirth, while women with the educational attainment of high school diploma are least likely to be married with 100.0% of them unmarried at childbirth.
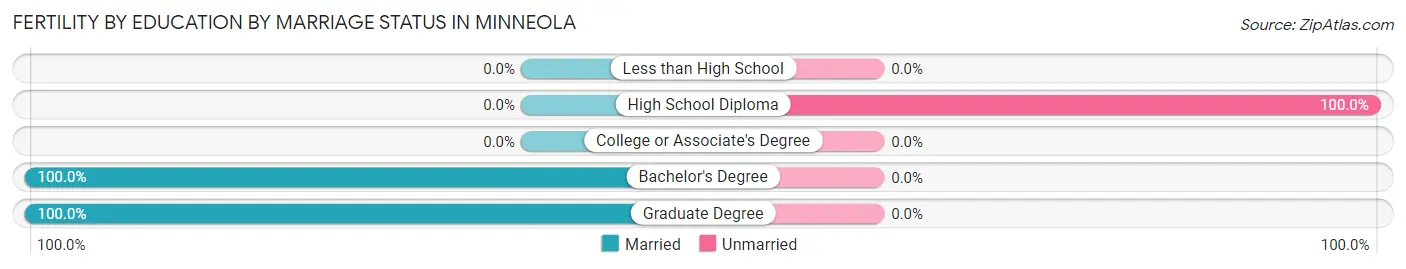
| Educational Attainment | Married | Unmarried |
| Less than High School | 0 (0.0%) | 0 (0.0%) |
| High School Diploma | 0 (0.0%) | 15 (100.0%) |
| College or Associate's Degree | 0 (0.0%) | 0 (0.0%) |
| Bachelor's Degree | 36 (100.0%) | 0 (0.0%) |
| Graduate Degree | 54 (100.0%) | 0 (0.0%) |
| Total | 90 (85.7%) | 15 (14.3%) |
Employment Characteristics in Minneola
Employment by Class of Employer in Minneola
Among the 7,103 employed individuals in Minneola, private company employees (5,318 | 74.9%), local government employees (654 | 9.2%), and self-employed (not incorporated) (321 | 4.5%) make up the most common classes of employment.
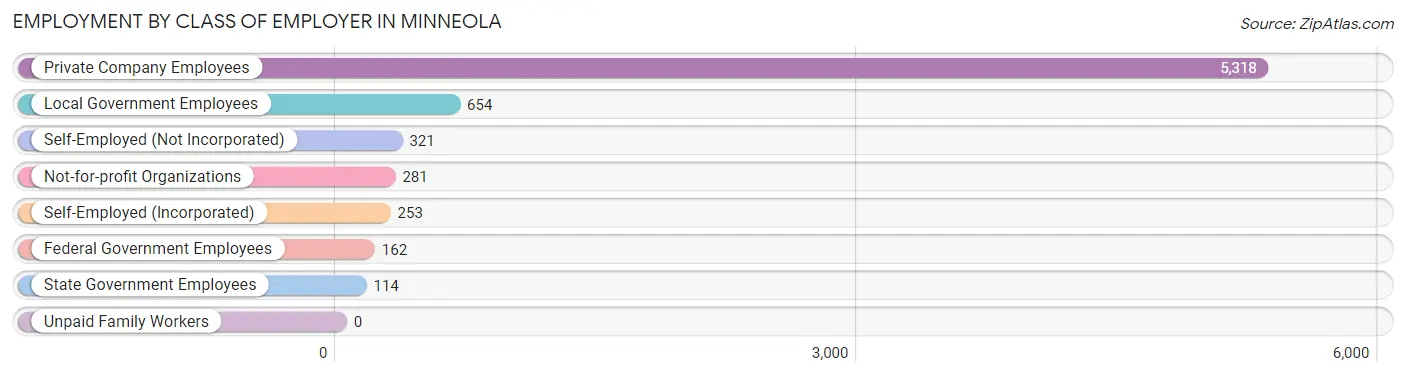
| Employer Class | # Employees | % Employees |
| Private Company Employees | 5,318 | 74.9% |
| Self-Employed (Incorporated) | 253 | 3.6% |
| Self-Employed (Not Incorporated) | 321 | 4.5% |
| Not-for-profit Organizations | 281 | 4.0% |
| Local Government Employees | 654 | 9.2% |
| State Government Employees | 114 | 1.6% |
| Federal Government Employees | 162 | 2.3% |
| Unpaid Family Workers | 0 | 0.0% |
| Total | 7,103 | 100.0% |
Employment Status by Age in Minneola
According to the labor force statistics for Minneola, out of the total population over 16 years of age (10,659), 69.9% or 7,451 individuals are in the labor force, with 3.5% or 261 of them unemployed. The age group with the highest labor force participation rate is 25 to 29 years, with 97.1% or 646 individuals in the labor force. Within the labor force, the 16 to 19 years age range has the highest percentage of unemployed individuals, with 31.7% or 65 of them being unemployed.
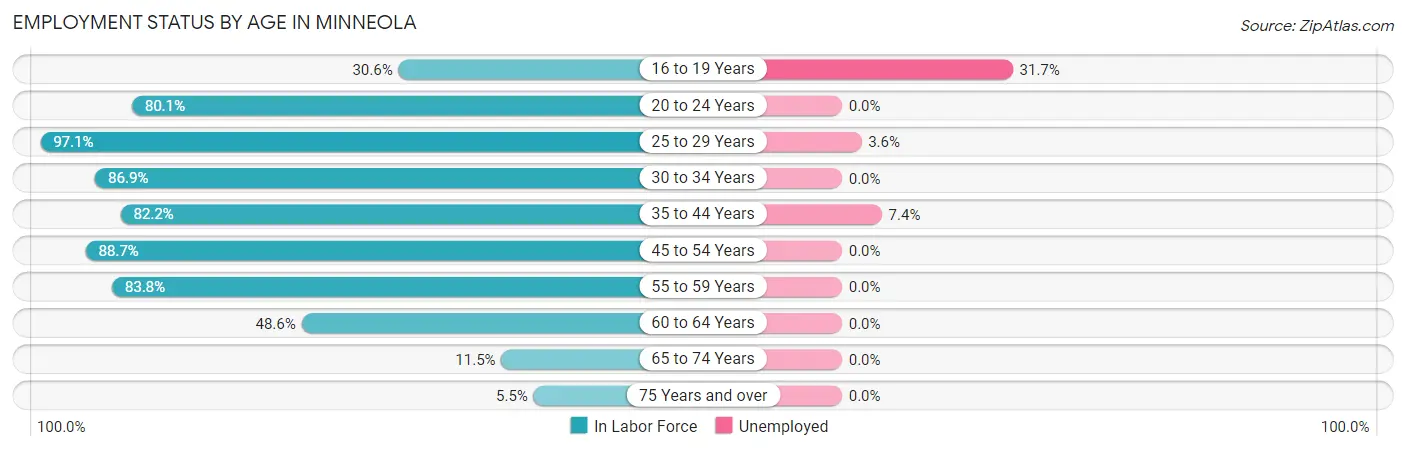
| Age Bracket | In Labor Force | Unemployed |
| 16 to 19 Years | 205 (30.6%) | 65 (31.7%) |
| 20 to 24 Years | 486 (80.1%) | 0 (0.0%) |
| 25 to 29 Years | 646 (97.1%) | 23 (3.6%) |
| 30 to 34 Years | 1,012 (86.9%) | 0 (0.0%) |
| 35 to 44 Years | 2,361 (82.2%) | 175 (7.4%) |
| 45 to 54 Years | 1,499 (88.7%) | 0 (0.0%) |
| 55 to 59 Years | 659 (83.8%) | 0 (0.0%) |
| 60 to 64 Years | 455 (48.6%) | 0 (0.0%) |
| 65 to 74 Years | 106 (11.5%) | 0 (0.0%) |
| 75 Years and over | 19 (5.5%) | 0 (0.0%) |
| Total | 7,451 (69.9%) | 261 (3.5%) |
Employment Status by Educational Attainment in Minneola
According to labor force statistics for Minneola, 81.7% of individuals (6,629) out of the total population between 25 and 64 years of age (8,114) are in the labor force, with 3.0% or 199 of them being unemployed. The group with the highest labor force participation rate are those with the educational attainment of bachelor's degree or higher, with 92.6% or 2,264 individuals in the labor force. Within the labor force, individuals with less than high school education have the highest percentage of unemployment, with 18.7% or 82 of them being unemployed.
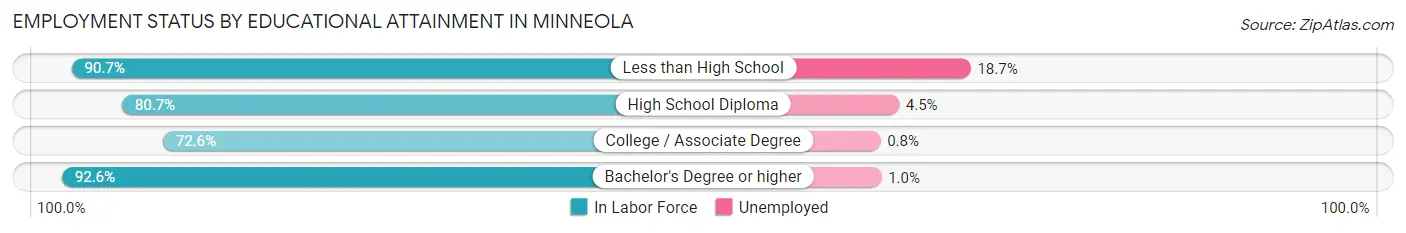
| Educational Attainment | In Labor Force | Unemployed |
| Less than High School | 438 (90.7%) | 90 (18.7%) |
| High School Diploma | 1,609 (80.7%) | 90 (4.5%) |
| College / Associate Degree | 2,317 (72.6%) | 26 (0.8%) |
| Bachelor's Degree or higher | 2,264 (92.6%) | 24 (1.0%) |
| Total | 6,629 (81.7%) | 243 (3.0%) |
Employment Occupations by Sex in Minneola
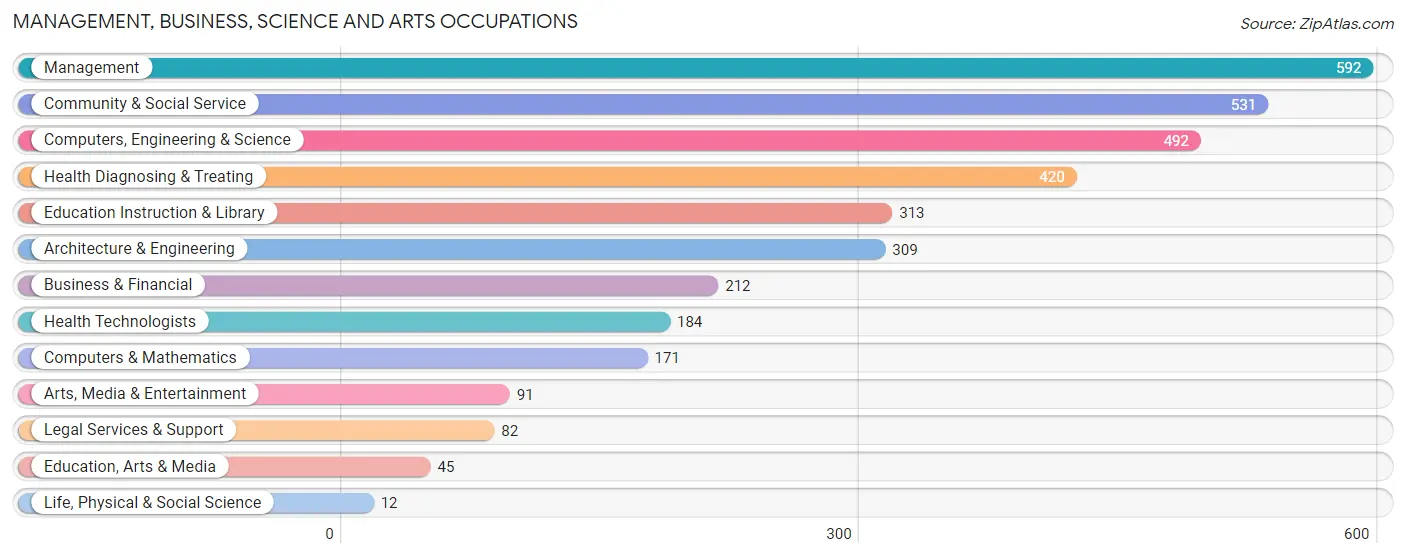
Management, Business, Science and Arts Occupations
The most common Management, Business, Science and Arts occupations in Minneola are Management (592 | 8.2%), Community & Social Service (531 | 7.4%), Computers, Engineering & Science (492 | 6.9%), Health Diagnosing & Treating (420 | 5.9%), and Education Instruction & Library (313 | 4.4%).
Management, Business, Science and Arts Occupations by Sex
Within the Management, Business, Science and Arts occupations in Minneola, the most male-oriented occupations are Architecture & Engineering (100.0%), Computers, Engineering & Science (81.5%), and Management (67.2%), while the most female-oriented occupations are Life, Physical & Social Science (100.0%), Education, Arts & Media (100.0%), and Education Instruction & Library (96.5%).
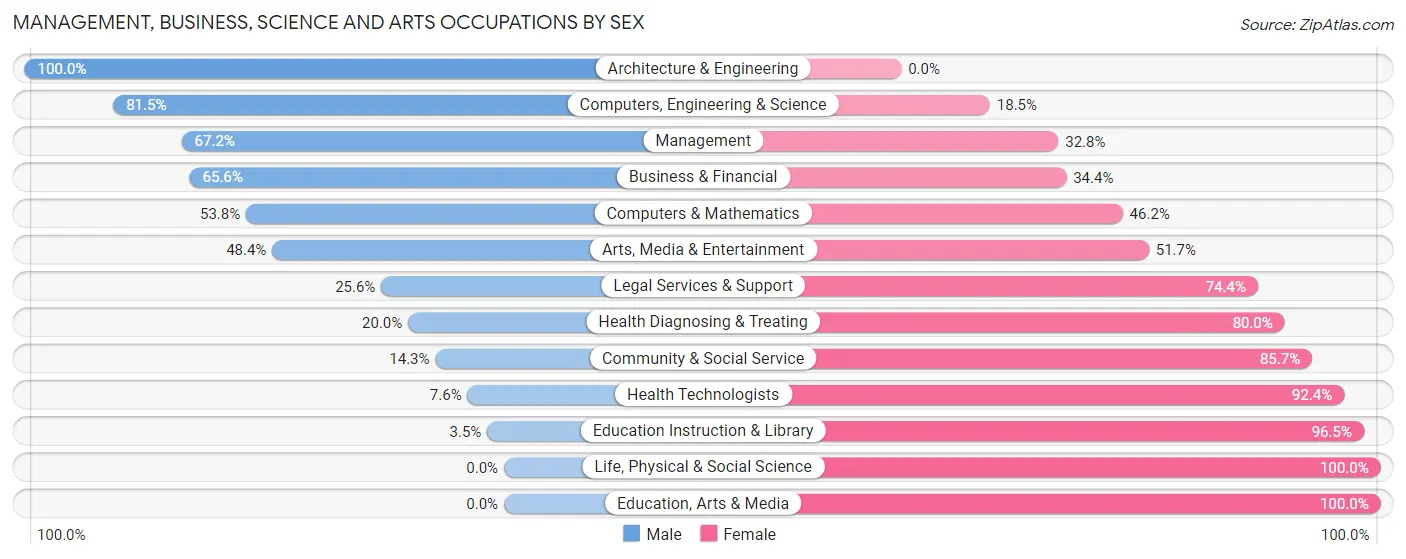
| Occupation | Male | Female |
| Management | 398 (67.2%) | 194 (32.8%) |
| Business & Financial | 139 (65.6%) | 73 (34.4%) |
| Computers, Engineering & Science | 401 (81.5%) | 91 (18.5%) |
| Computers & Mathematics | 92 (53.8%) | 79 (46.2%) |
| Architecture & Engineering | 309 (100.0%) | 0 (0.0%) |
| Life, Physical & Social Science | 0 (0.0%) | 12 (100.0%) |
| Community & Social Service | 76 (14.3%) | 455 (85.7%) |
| Education, Arts & Media | 0 (0.0%) | 45 (100.0%) |
| Legal Services & Support | 21 (25.6%) | 61 (74.4%) |
| Education Instruction & Library | 11 (3.5%) | 302 (96.5%) |
| Arts, Media & Entertainment | 44 (48.3%) | 47 (51.6%) |
| Health Diagnosing & Treating | 84 (20.0%) | 336 (80.0%) |
| Health Technologists | 14 (7.6%) | 170 (92.4%) |
| Total (Category) | 1,098 (48.9%) | 1,149 (51.1%) |
| Total (Overall) | 3,823 (53.2%) | 3,362 (46.8%) |
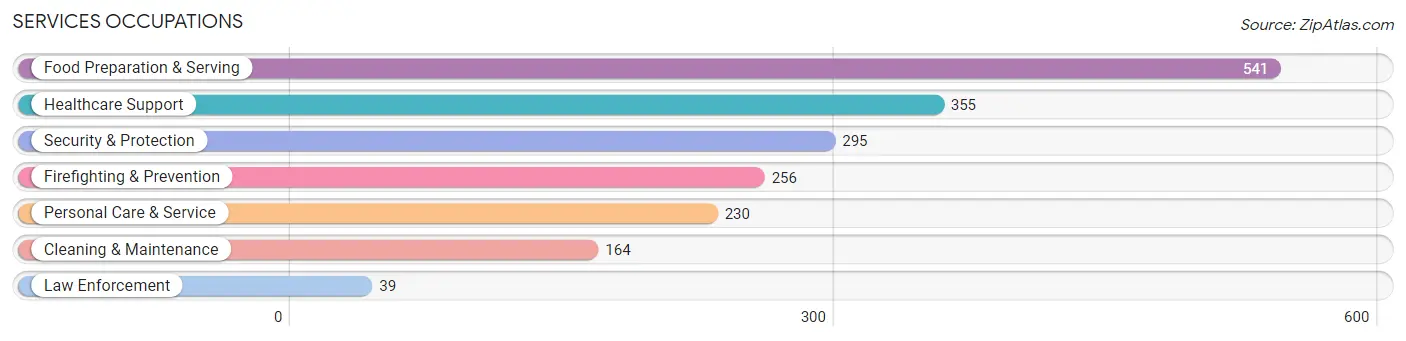
Services Occupations
The most common Services occupations in Minneola are Food Preparation & Serving (541 | 7.5%), Healthcare Support (355 | 4.9%), Security & Protection (295 | 4.1%), Firefighting & Prevention (256 | 3.6%), and Personal Care & Service (230 | 3.2%).
Services Occupations by Sex
Within the Services occupations in Minneola, the most male-oriented occupations are Law Enforcement (100.0%), Cleaning & Maintenance (89.6%), and Personal Care & Service (60.0%), while the most female-oriented occupations are Healthcare Support (89.6%), Firefighting & Prevention (57.4%), and Food Preparation & Serving (55.8%).
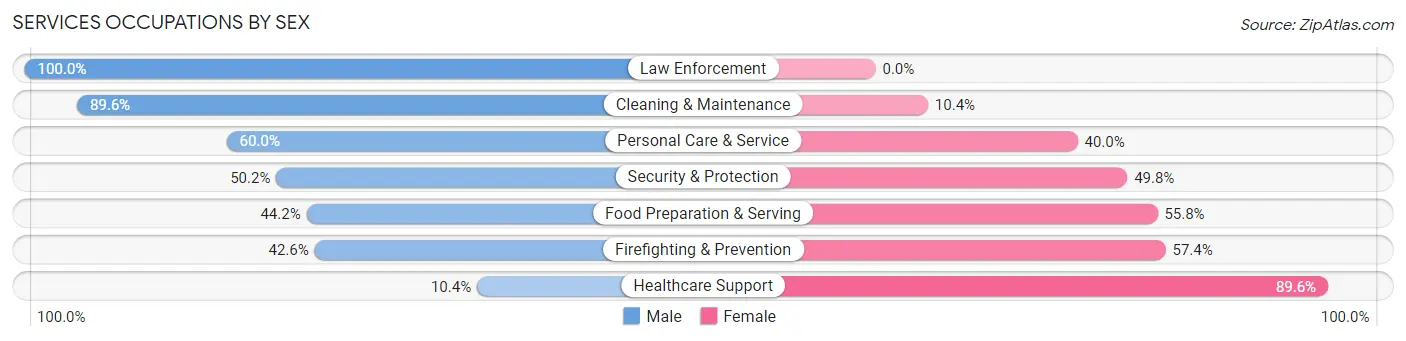
| Occupation | Male | Female |
| Healthcare Support | 37 (10.4%) | 318 (89.6%) |
| Security & Protection | 148 (50.2%) | 147 (49.8%) |
| Firefighting & Prevention | 109 (42.6%) | 147 (57.4%) |
| Law Enforcement | 39 (100.0%) | 0 (0.0%) |
| Food Preparation & Serving | 239 (44.2%) | 302 (55.8%) |
| Cleaning & Maintenance | 147 (89.6%) | 17 (10.4%) |
| Personal Care & Service | 138 (60.0%) | 92 (40.0%) |
| Total (Category) | 709 (44.7%) | 876 (55.3%) |
| Total (Overall) | 3,823 (53.2%) | 3,362 (46.8%) |
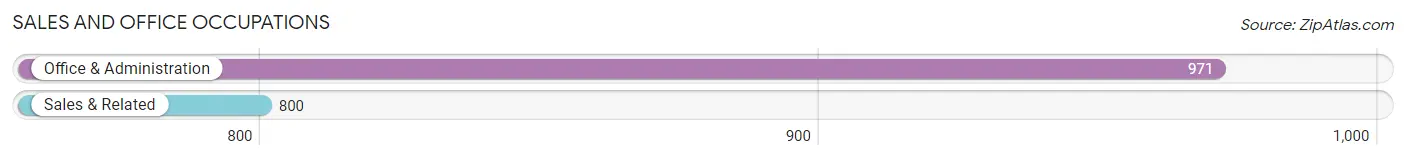
Sales and Office Occupations
The most common Sales and Office occupations in Minneola are Office & Administration (971 | 13.5%), and Sales & Related (800 | 11.1%).
Sales and Office Occupations by Sex
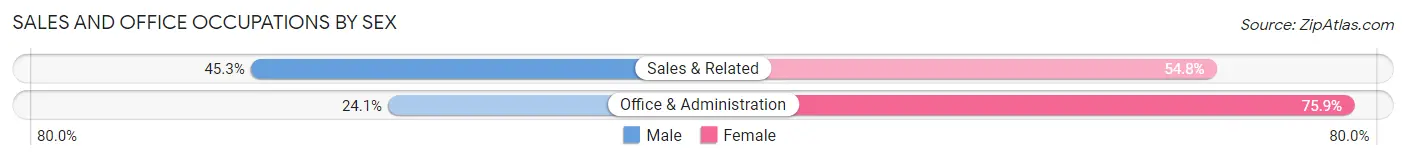
| Occupation | Male | Female |
| Sales & Related | 362 (45.3%) | 438 (54.7%) |
| Office & Administration | 234 (24.1%) | 737 (75.9%) |
| Total (Category) | 596 (33.7%) | 1,175 (66.3%) |
| Total (Overall) | 3,823 (53.2%) | 3,362 (46.8%) |
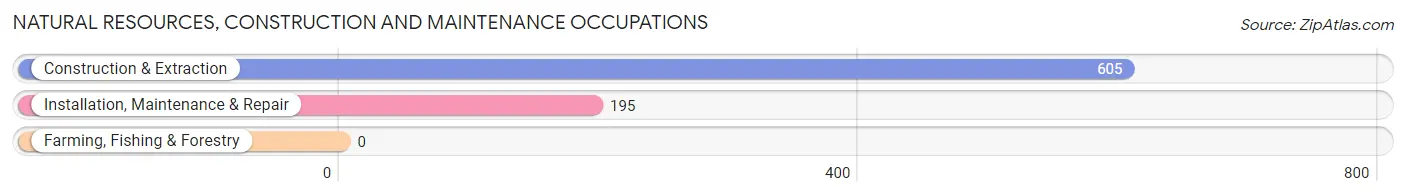
Natural Resources, Construction and Maintenance Occupations
The most common Natural Resources, Construction and Maintenance occupations in Minneola are Construction & Extraction (605 | 8.4%), and Installation, Maintenance & Repair (195 | 2.7%).
Natural Resources, Construction and Maintenance Occupations by Sex
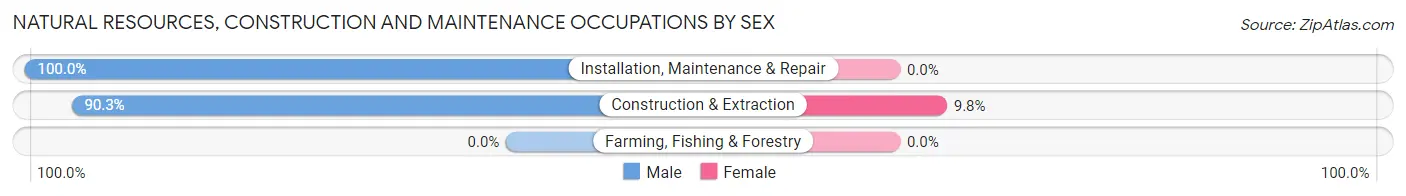
| Occupation | Male | Female |
| Farming, Fishing & Forestry | 0 (0.0%) | 0 (0.0%) |
| Construction & Extraction | 546 (90.2%) | 59 (9.8%) |
| Installation, Maintenance & Repair | 195 (100.0%) | 0 (0.0%) |
| Total (Category) | 741 (92.6%) | 59 (7.4%) |
| Total (Overall) | 3,823 (53.2%) | 3,362 (46.8%) |
Production, Transportation and Moving Occupations
The most common Production, Transportation and Moving occupations in Minneola are Production (331 | 4.6%), Transportation (282 | 3.9%), and Material Moving (169 | 2.4%).
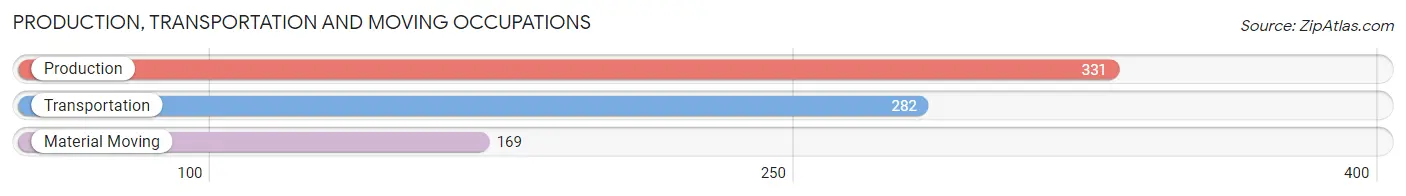
Production, Transportation and Moving Occupations by Sex
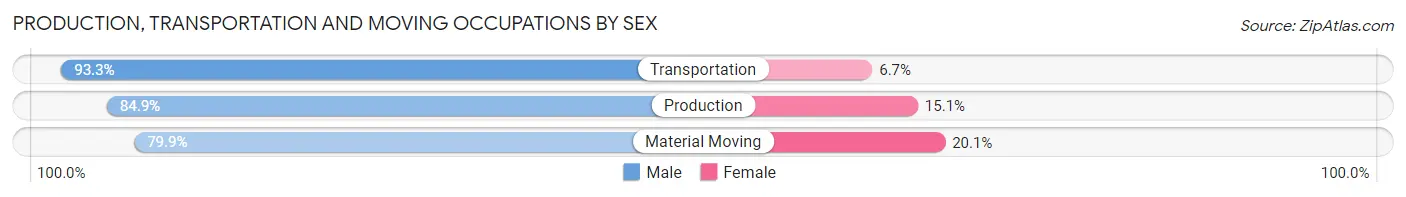
| Occupation | Male | Female |
| Production | 281 (84.9%) | 50 (15.1%) |
| Transportation | 263 (93.3%) | 19 (6.7%) |
| Material Moving | 135 (79.9%) | 34 (20.1%) |
| Total (Category) | 679 (86.8%) | 103 (13.2%) |
| Total (Overall) | 3,823 (53.2%) | 3,362 (46.8%) |
Employment Industries by Sex in Minneola
Employment Industries in Minneola
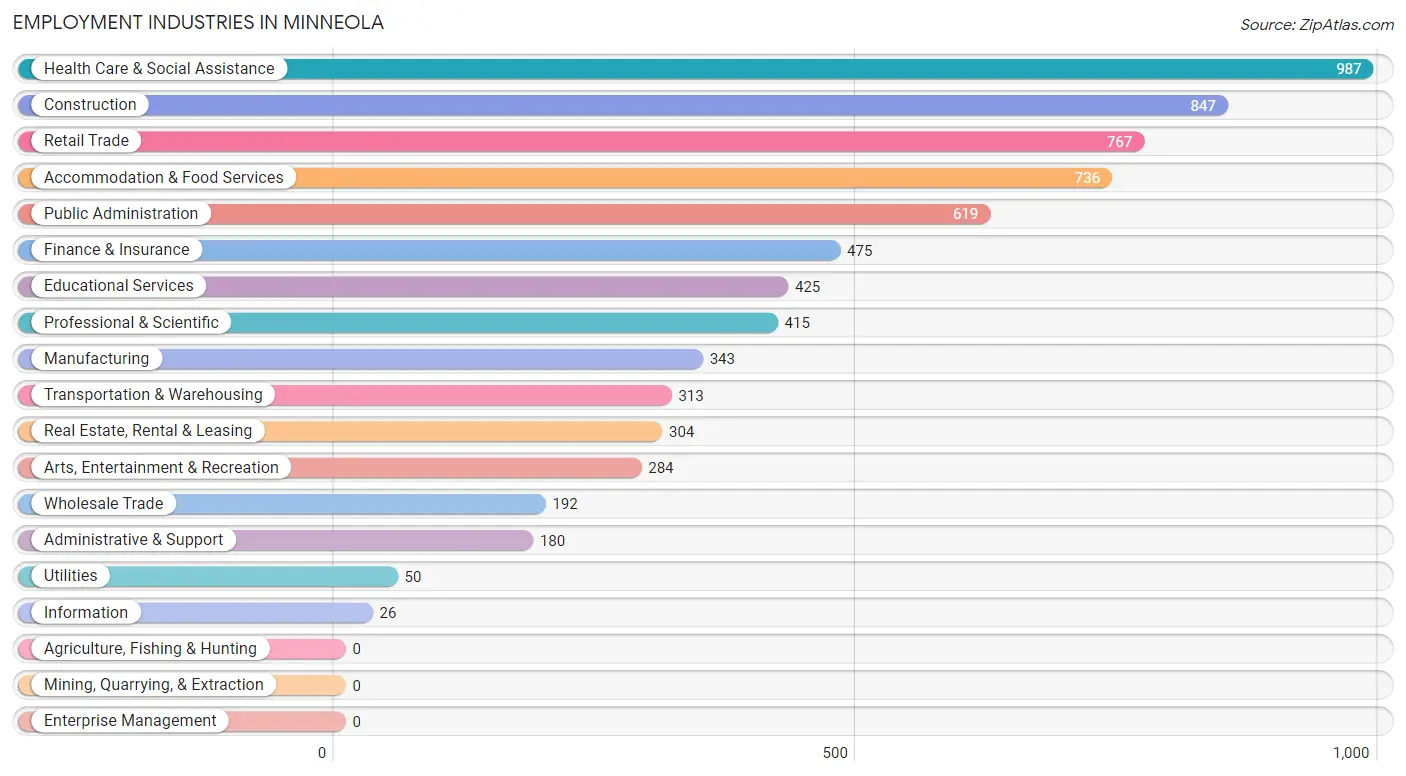
The major employment industries in Minneola include Health Care & Social Assistance (987 | 13.7%), Construction (847 | 11.8%), Retail Trade (767 | 10.7%), Accommodation & Food Services (736 | 10.2%), and Public Administration (619 | 8.6%).
Employment Industries by Sex in Minneola
The Minneola industries that see more men than women are Information (100.0%), Manufacturing (89.8%), and Arts, Entertainment & Recreation (85.2%), whereas the industries that tend to have a higher number of women are Educational Services (88.5%), Health Care & Social Assistance (71.3%), and Real Estate, Rental & Leasing (70.4%).
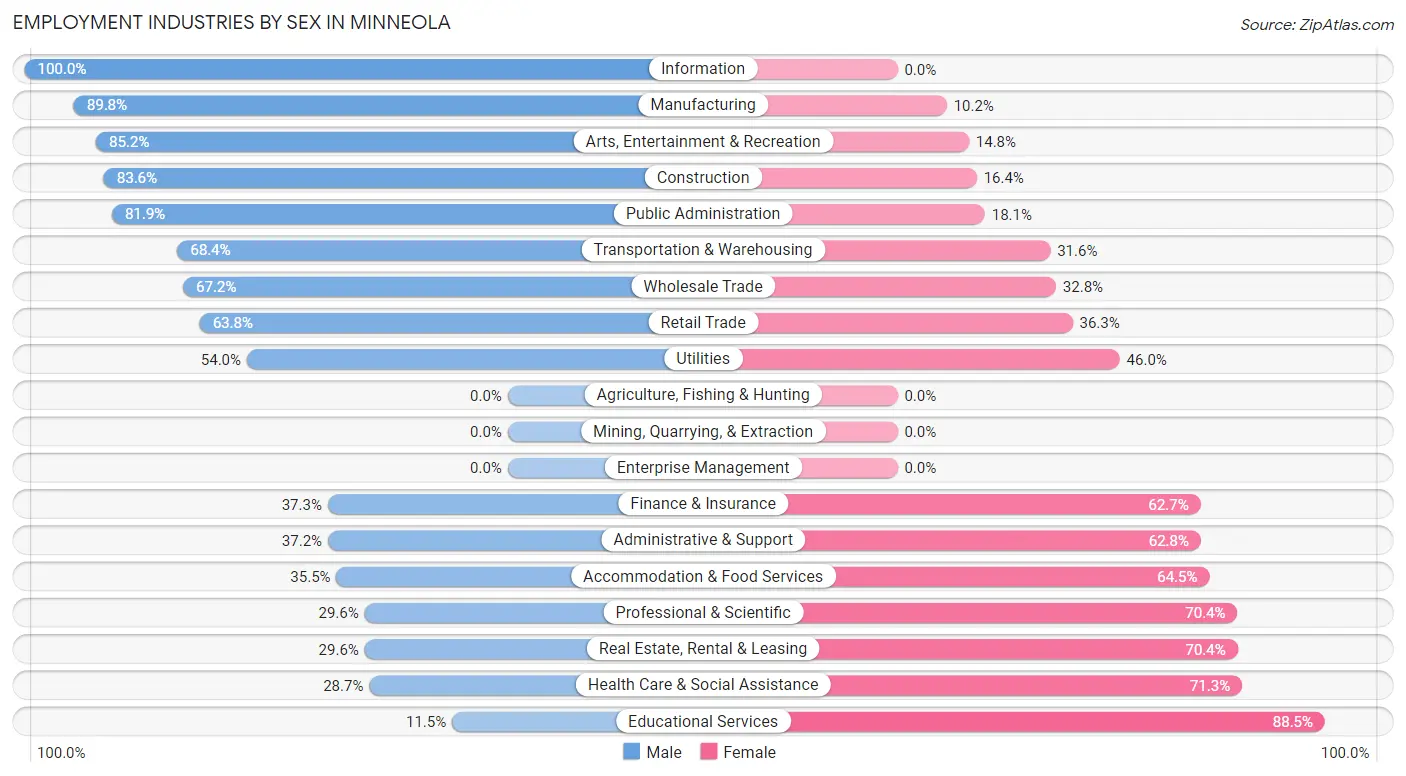
| Industry | Male | Female |
| Agriculture, Fishing & Hunting | 0 (0.0%) | 0 (0.0%) |
| Mining, Quarrying, & Extraction | 0 (0.0%) | 0 (0.0%) |
| Construction | 708 (83.6%) | 139 (16.4%) |
| Manufacturing | 308 (89.8%) | 35 (10.2%) |
| Wholesale Trade | 129 (67.2%) | 63 (32.8%) |
| Retail Trade | 489 (63.7%) | 278 (36.2%) |
| Transportation & Warehousing | 214 (68.4%) | 99 (31.6%) |
| Utilities | 27 (54.0%) | 23 (46.0%) |
| Information | 26 (100.0%) | 0 (0.0%) |
| Finance & Insurance | 177 (37.3%) | 298 (62.7%) |
| Real Estate, Rental & Leasing | 90 (29.6%) | 214 (70.4%) |
| Professional & Scientific | 123 (29.6%) | 292 (70.4%) |
| Enterprise Management | 0 (0.0%) | 0 (0.0%) |
| Administrative & Support | 67 (37.2%) | 113 (62.8%) |
| Educational Services | 49 (11.5%) | 376 (88.5%) |
| Health Care & Social Assistance | 283 (28.7%) | 704 (71.3%) |
| Arts, Entertainment & Recreation | 242 (85.2%) | 42 (14.8%) |
| Accommodation & Food Services | 261 (35.5%) | 475 (64.5%) |
| Public Administration | 507 (81.9%) | 112 (18.1%) |
| Total | 3,823 (53.2%) | 3,362 (46.8%) |
Education in Minneola
School Enrollment in Minneola
The most common levels of schooling among the 4,121 students in Minneola are elementary school (1,024 | 24.8%), middle school (931 | 22.6%), and high school (918 | 22.3%).
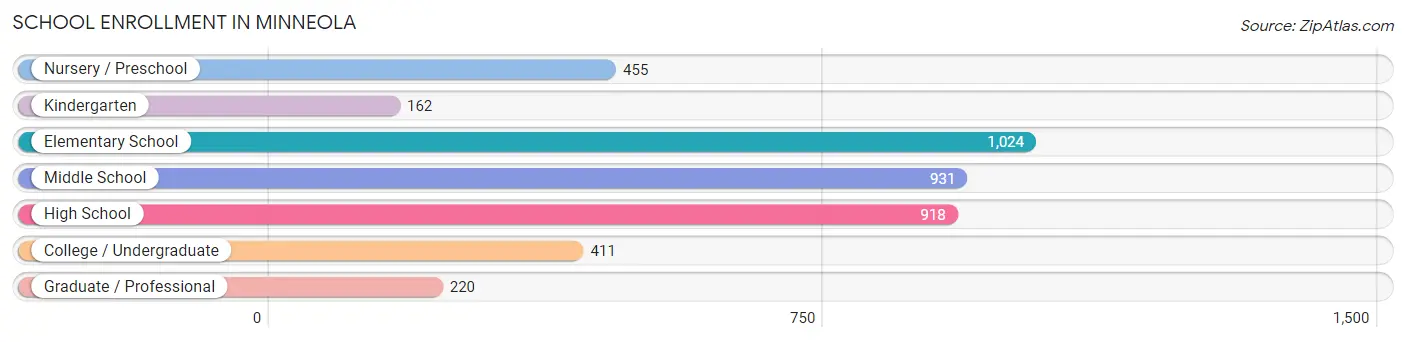
| School Level | # Students | % Students |
| Nursery / Preschool | 455 | 11.0% |
| Kindergarten | 162 | 3.9% |
| Elementary School | 1,024 | 24.8% |
| Middle School | 931 | 22.6% |
| High School | 918 | 22.3% |
| College / Undergraduate | 411 | 10.0% |
| Graduate / Professional | 220 | 5.3% |
| Total | 4,121 | 100.0% |
School Enrollment by Age by Funding Source in Minneola
Out of a total of 4,121 students who are enrolled in schools in Minneola, 874 (21.2%) attend a private institution, while the remaining 3,247 (78.8%) are enrolled in public schools. The age group of 25 to 34 year olds has the highest likelihood of being enrolled in private schools, with 61 (36.7% in the age bracket) enrolled. Conversely, the age group of 18 to 19 year olds has the lowest likelihood of being enrolled in a private school, with 277 (92.0% in the age bracket) attending a public institution.
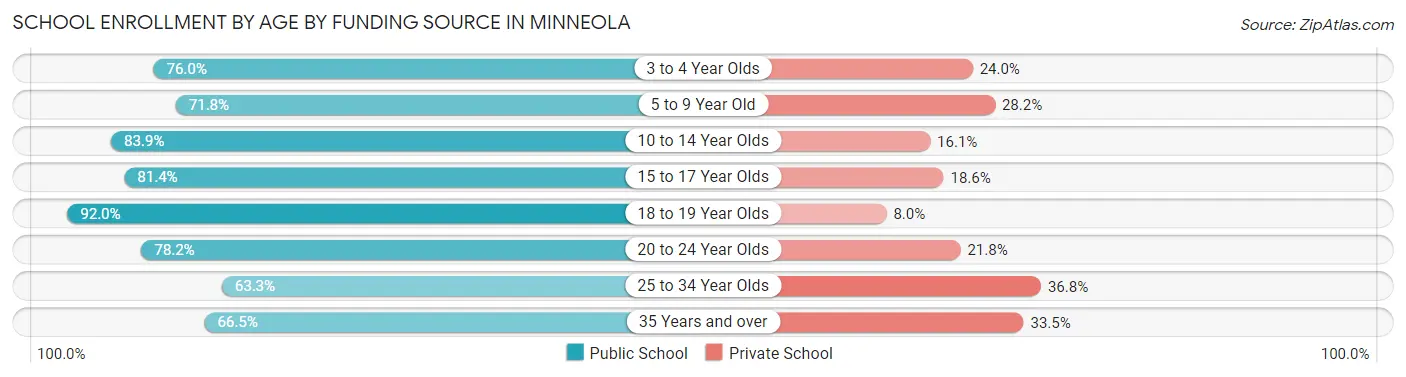
| Age Bracket | Public School | Private School |
| 3 to 4 Year Olds | 294 (76.0%) | 93 (24.0%) |
| 5 to 9 Year Old | 650 (71.8%) | 255 (28.2%) |
| 10 to 14 Year Olds | 1,140 (83.9%) | 219 (16.1%) |
| 15 to 17 Year Olds | 525 (81.4%) | 120 (18.6%) |
| 18 to 19 Year Olds | 277 (92.0%) | 24 (8.0%) |
| 20 to 24 Year Olds | 133 (78.2%) | 37 (21.8%) |
| 25 to 34 Year Olds | 105 (63.2%) | 61 (36.7%) |
| 35 Years and over | 125 (66.5%) | 63 (33.5%) |
| Total | 3,247 (78.8%) | 874 (21.2%) |
Educational Attainment by Field of Study in Minneola
Business (656 | 24.4%), engineering (466 | 17.4%), science & technology (395 | 14.7%), arts & humanities (358 | 13.3%), and education (285 | 10.6%) are the most common fields of study among 2,684 individuals in Minneola who have obtained a bachelor's degree or higher.
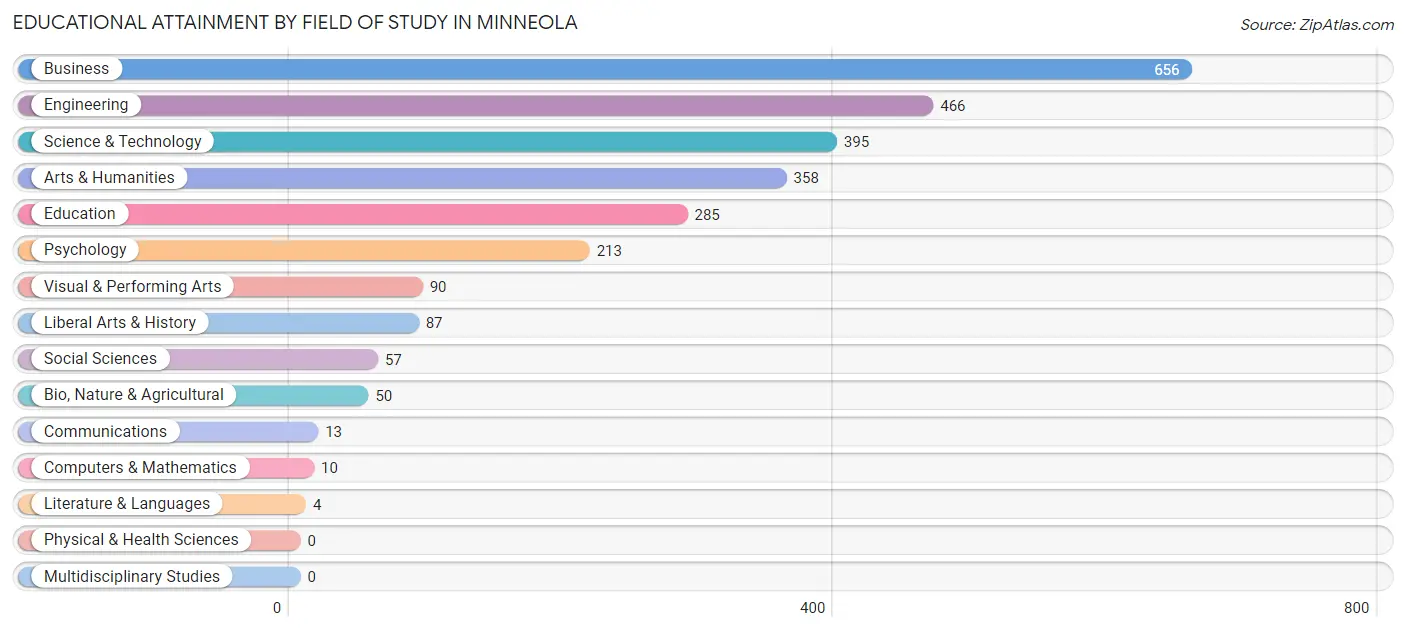
| Field of Study | # Graduates | % Graduates |
| Computers & Mathematics | 10 | 0.4% |
| Bio, Nature & Agricultural | 50 | 1.9% |
| Physical & Health Sciences | 0 | 0.0% |
| Psychology | 213 | 7.9% |
| Social Sciences | 57 | 2.1% |
| Engineering | 466 | 17.4% |
| Multidisciplinary Studies | 0 | 0.0% |
| Science & Technology | 395 | 14.7% |
| Business | 656 | 24.4% |
| Education | 285 | 10.6% |
| Literature & Languages | 4 | 0.2% |
| Liberal Arts & History | 87 | 3.2% |
| Visual & Performing Arts | 90 | 3.4% |
| Communications | 13 | 0.5% |
| Arts & Humanities | 358 | 13.3% |
| Total | 2,684 | 100.0% |
Transportation & Commute in Minneola
Vehicle Availability by Sex in Minneola
The most prevalent vehicle ownership categories in Minneola are males with 2 vehicles (2,039, accounting for 53.6%) and females with 2 vehicles (1,563, making up 61.9%).
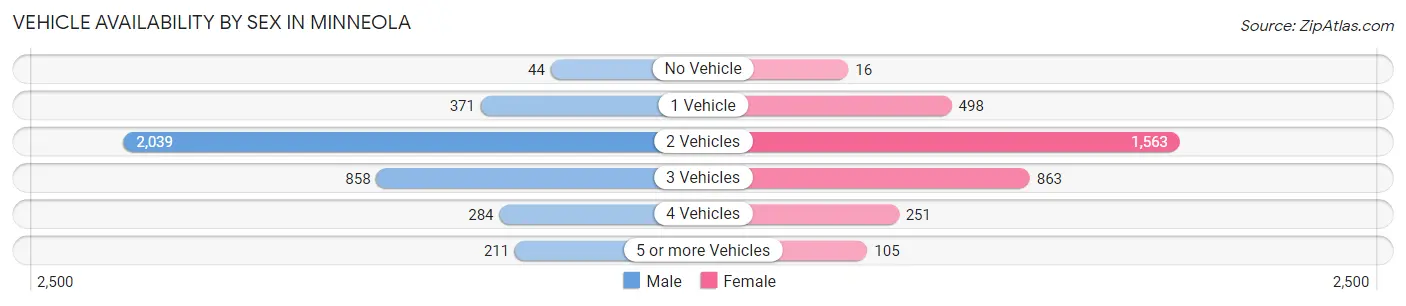
| Vehicles Available | Male | Female |
| No Vehicle | 44 (1.2%) | 16 (0.5%) |
| 1 Vehicle | 371 (9.8%) | 498 (15.1%) |
| 2 Vehicles | 2,039 (53.6%) | 1,563 (47.4%) |
| 3 Vehicles | 858 (22.5%) | 863 (26.2%) |
| 4 Vehicles | 284 (7.5%) | 251 (7.6%) |
| 5 or more Vehicles | 211 (5.5%) | 105 (3.2%) |
| Total | 3,807 (100.0%) | 3,296 (100.0%) |
Commute Time in Minneola
The most frequently occuring commute durations in Minneola are 10 to 14 minutes (1,227 commuters, 20.4%), 45 to 59 minutes (876 commuters, 14.6%), and 5 to 9 minutes (850 commuters, 14.2%).
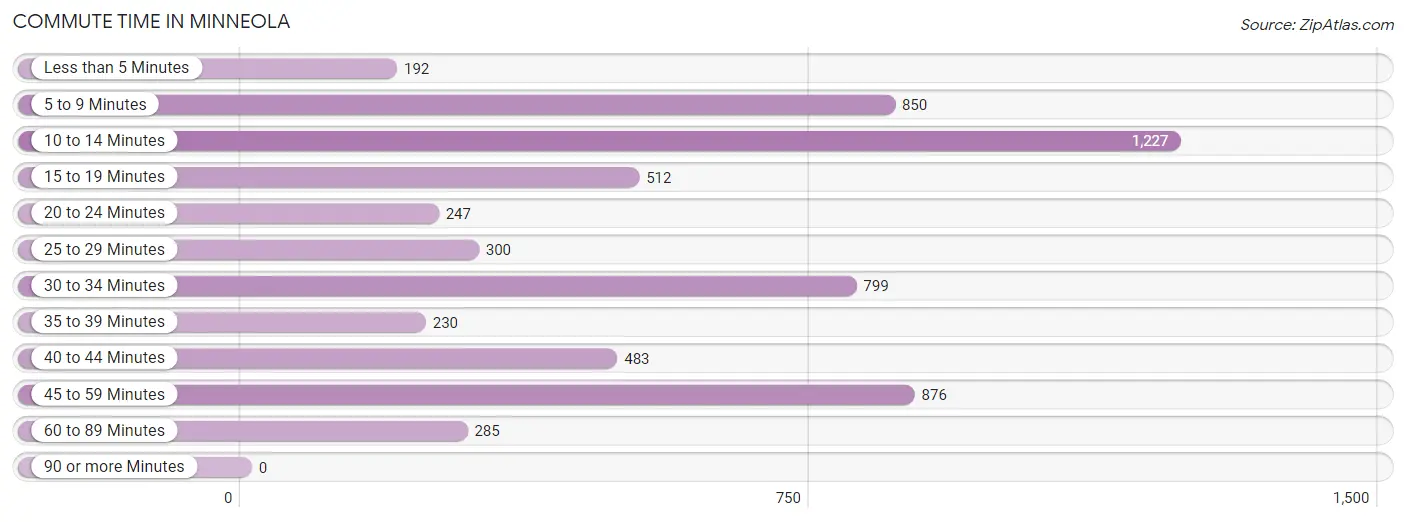
| Commute Time | # Commuters | % Commuters |
| Less than 5 Minutes | 192 | 3.2% |
| 5 to 9 Minutes | 850 | 14.2% |
| 10 to 14 Minutes | 1,227 | 20.4% |
| 15 to 19 Minutes | 512 | 8.5% |
| 20 to 24 Minutes | 247 | 4.1% |
| 25 to 29 Minutes | 300 | 5.0% |
| 30 to 34 Minutes | 799 | 13.3% |
| 35 to 39 Minutes | 230 | 3.8% |
| 40 to 44 Minutes | 483 | 8.1% |
| 45 to 59 Minutes | 876 | 14.6% |
| 60 to 89 Minutes | 285 | 4.8% |
| 90 or more Minutes | 0 | 0.0% |
Commute Time by Sex in Minneola
The most common commute times in Minneola are 10 to 14 minutes (561 commuters, 18.1%) for males and 10 to 14 minutes (666 commuters, 22.9%) for females.
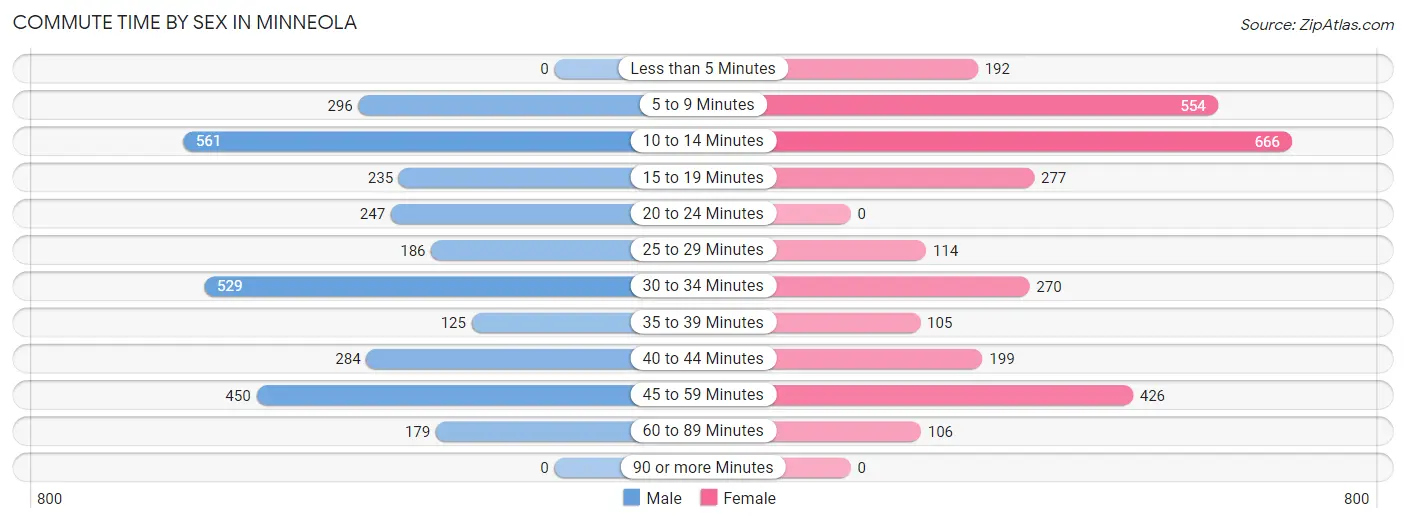
| Commute Time | Male | Female |
| Less than 5 Minutes | 0 (0.0%) | 192 (6.6%) |
| 5 to 9 Minutes | 296 (9.6%) | 554 (19.0%) |
| 10 to 14 Minutes | 561 (18.1%) | 666 (22.9%) |
| 15 to 19 Minutes | 235 (7.6%) | 277 (9.5%) |
| 20 to 24 Minutes | 247 (8.0%) | 0 (0.0%) |
| 25 to 29 Minutes | 186 (6.0%) | 114 (3.9%) |
| 30 to 34 Minutes | 529 (17.1%) | 270 (9.3%) |
| 35 to 39 Minutes | 125 (4.0%) | 105 (3.6%) |
| 40 to 44 Minutes | 284 (9.2%) | 199 (6.8%) |
| 45 to 59 Minutes | 450 (14.5%) | 426 (14.6%) |
| 60 to 89 Minutes | 179 (5.8%) | 106 (3.6%) |
| 90 or more Minutes | 0 (0.0%) | 0 (0.0%) |
Time of Departure to Work by Sex in Minneola
The most frequent times of departure to work in Minneola are 7:00 AM to 7:29 AM (470, 15.2%) for males and 9:00 AM to 9:59 AM (448, 15.4%) for females.
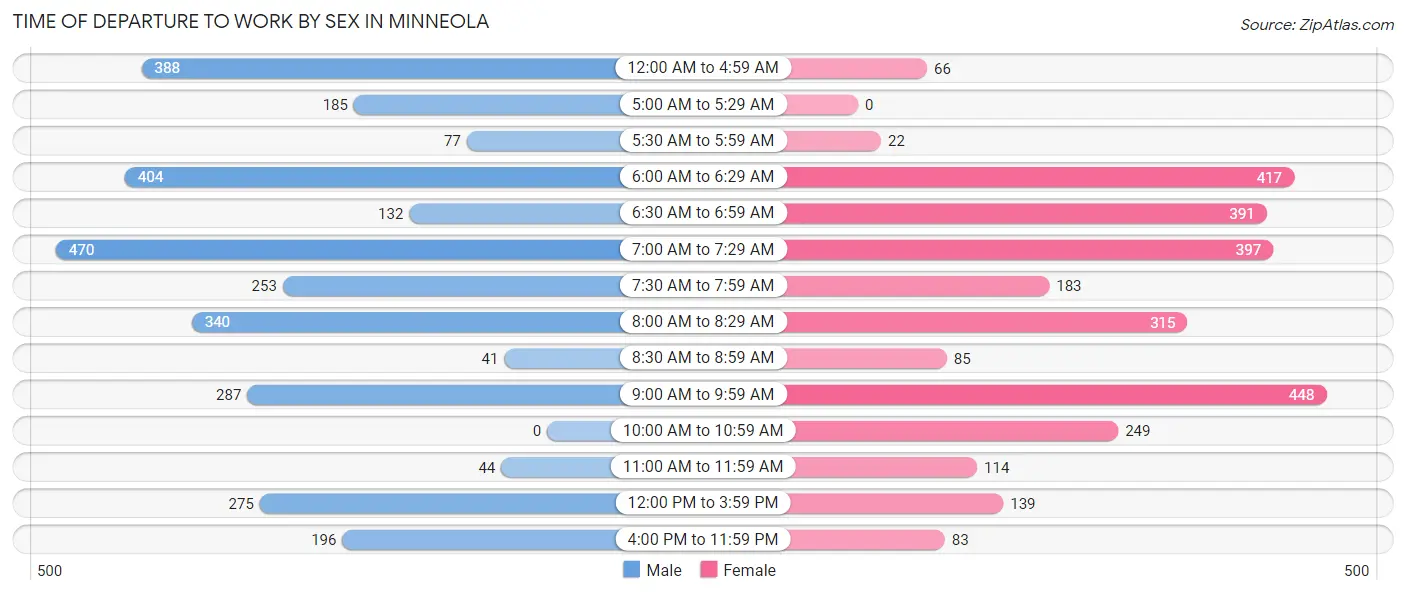
| Time of Departure | Male | Female |
| 12:00 AM to 4:59 AM | 388 (12.6%) | 66 (2.3%) |
| 5:00 AM to 5:29 AM | 185 (6.0%) | 0 (0.0%) |
| 5:30 AM to 5:59 AM | 77 (2.5%) | 22 (0.8%) |
| 6:00 AM to 6:29 AM | 404 (13.1%) | 417 (14.3%) |
| 6:30 AM to 6:59 AM | 132 (4.3%) | 391 (13.4%) |
| 7:00 AM to 7:29 AM | 470 (15.2%) | 397 (13.7%) |
| 7:30 AM to 7:59 AM | 253 (8.2%) | 183 (6.3%) |
| 8:00 AM to 8:29 AM | 340 (11.0%) | 315 (10.8%) |
| 8:30 AM to 8:59 AM | 41 (1.3%) | 85 (2.9%) |
| 9:00 AM to 9:59 AM | 287 (9.3%) | 448 (15.4%) |
| 10:00 AM to 10:59 AM | 0 (0.0%) | 249 (8.6%) |
| 11:00 AM to 11:59 AM | 44 (1.4%) | 114 (3.9%) |
| 12:00 PM to 3:59 PM | 275 (8.9%) | 139 (4.8%) |
| 4:00 PM to 11:59 PM | 196 (6.3%) | 83 (2.9%) |
| Total | 3,092 (100.0%) | 2,909 (100.0%) |
Housing Occupancy in Minneola
Occupancy by Ownership in Minneola
Of the total 4,564 dwellings in Minneola, owner-occupied units account for 3,113 (68.2%), while renter-occupied units make up 1,451 (31.8%).
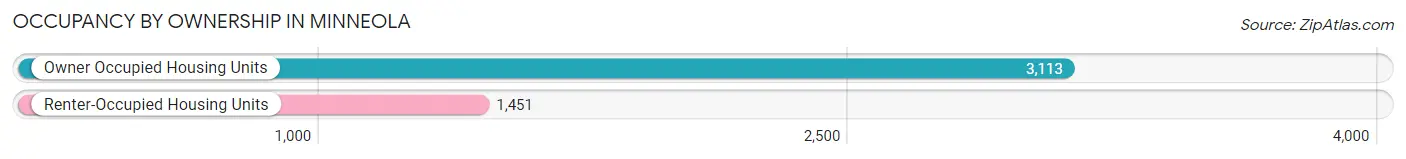
| Occupancy | # Housing Units | % Housing Units |
| Owner Occupied Housing Units | 3,113 | 68.2% |
| Renter-Occupied Housing Units | 1,451 | 31.8% |
| Total Occupied Housing Units | 4,564 | 100.0% |
Occupancy by Household Size in Minneola
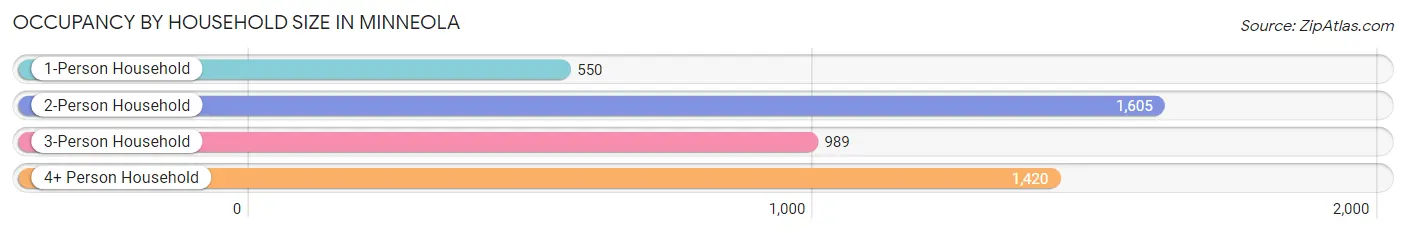
| Household Size | # Housing Units | % Housing Units |
| 1-Person Household | 550 | 12.0% |
| 2-Person Household | 1,605 | 35.2% |
| 3-Person Household | 989 | 21.7% |
| 4+ Person Household | 1,420 | 31.1% |
| Total Housing Units | 4,564 | 100.0% |
Occupancy by Ownership by Household Size in Minneola
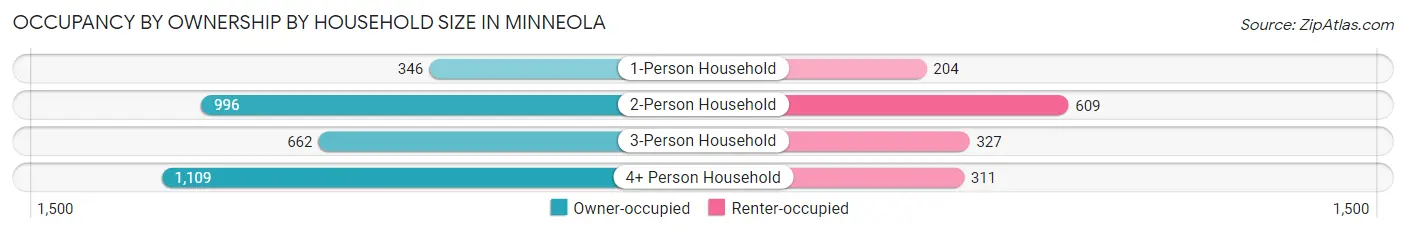
| Household Size | Owner-occupied | Renter-occupied |
| 1-Person Household | 346 (62.9%) | 204 (37.1%) |
| 2-Person Household | 996 (62.1%) | 609 (37.9%) |
| 3-Person Household | 662 (66.9%) | 327 (33.1%) |
| 4+ Person Household | 1,109 (78.1%) | 311 (21.9%) |
| Total Housing Units | 3,113 (68.2%) | 1,451 (31.8%) |
Occupancy by Educational Attainment in Minneola
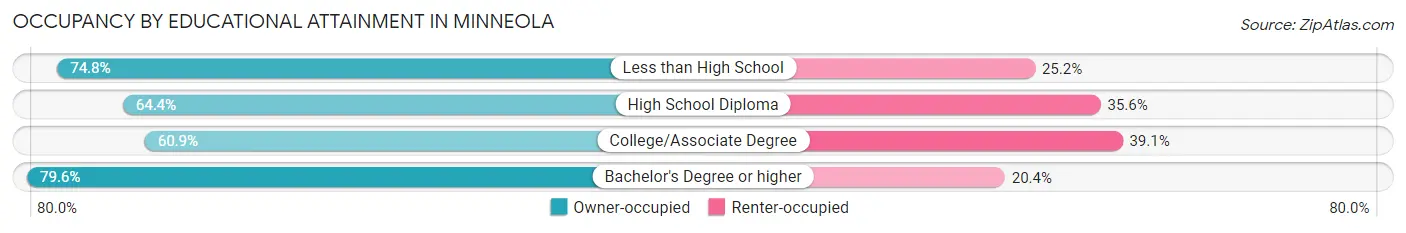
| Household Size | Owner-occupied | Renter-occupied |
| Less than High School | 202 (74.8%) | 68 (25.2%) |
| High School Diploma | 760 (64.4%) | 420 (35.6%) |
| College/Associate Degree | 1,070 (60.9%) | 686 (39.1%) |
| Bachelor's Degree or higher | 1,081 (79.6%) | 277 (20.4%) |
Occupancy by Age of Householder in Minneola
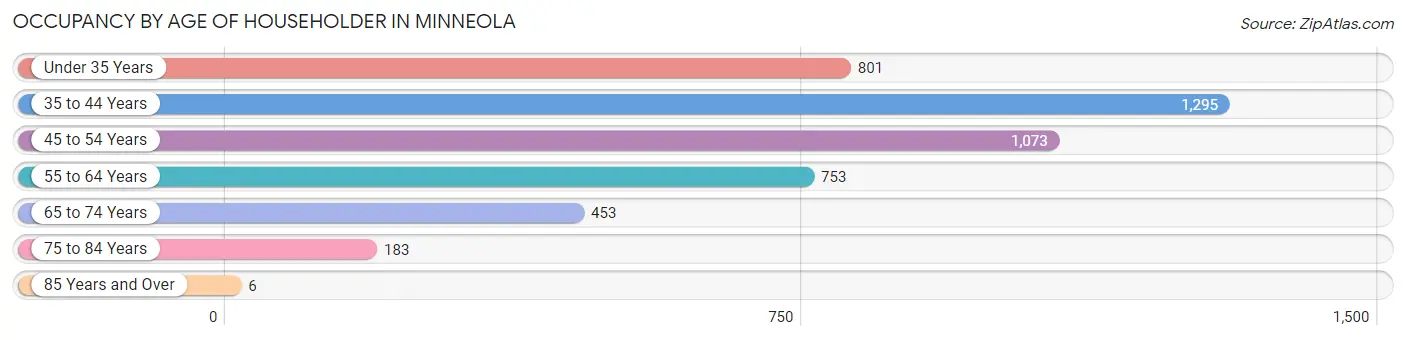
| Age Bracket | # Households | % Households |
| Under 35 Years | 801 | 17.5% |
| 35 to 44 Years | 1,295 | 28.4% |
| 45 to 54 Years | 1,073 | 23.5% |
| 55 to 64 Years | 753 | 16.5% |
| 65 to 74 Years | 453 | 9.9% |
| 75 to 84 Years | 183 | 4.0% |
| 85 Years and Over | 6 | 0.1% |
| Total | 4,564 | 100.0% |
Housing Finances in Minneola
Median Income by Occupancy in Minneola
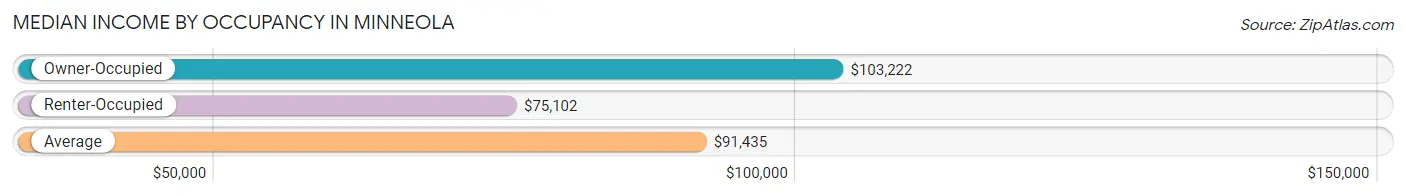
| Occupancy Type | # Households | Median Income |
| Owner-Occupied | 3,113 (68.2%) | $103,222 |
| Renter-Occupied | 1,451 (31.8%) | $75,102 |
| Average | 4,564 (100.0%) | $91,435 |
Occupancy by Householder Income Bracket in Minneola
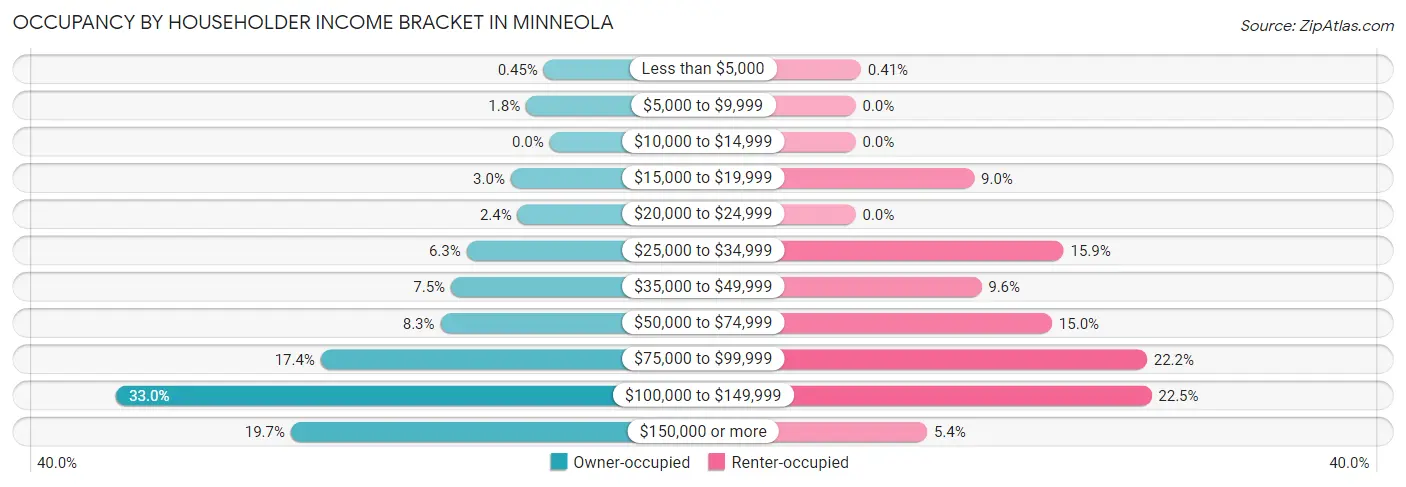
| Income Bracket | Owner-occupied | Renter-occupied |
| Less than $5,000 | 14 (0.4%) | 6 (0.4%) |
| $5,000 to $9,999 | 56 (1.8%) | 0 (0.0%) |
| $10,000 to $14,999 | 0 (0.0%) | 0 (0.0%) |
| $15,000 to $19,999 | 92 (3.0%) | 131 (9.0%) |
| $20,000 to $24,999 | 76 (2.4%) | 0 (0.0%) |
| $25,000 to $34,999 | 197 (6.3%) | 230 (15.9%) |
| $35,000 to $49,999 | 234 (7.5%) | 139 (9.6%) |
| $50,000 to $74,999 | 259 (8.3%) | 217 (15.0%) |
| $75,000 to $99,999 | 543 (17.4%) | 322 (22.2%) |
| $100,000 to $149,999 | 1,028 (33.0%) | 327 (22.5%) |
| $150,000 or more | 614 (19.7%) | 79 (5.4%) |
| Total | 3,113 (100.0%) | 1,451 (100.0%) |
Monthly Housing Cost Tiers in Minneola
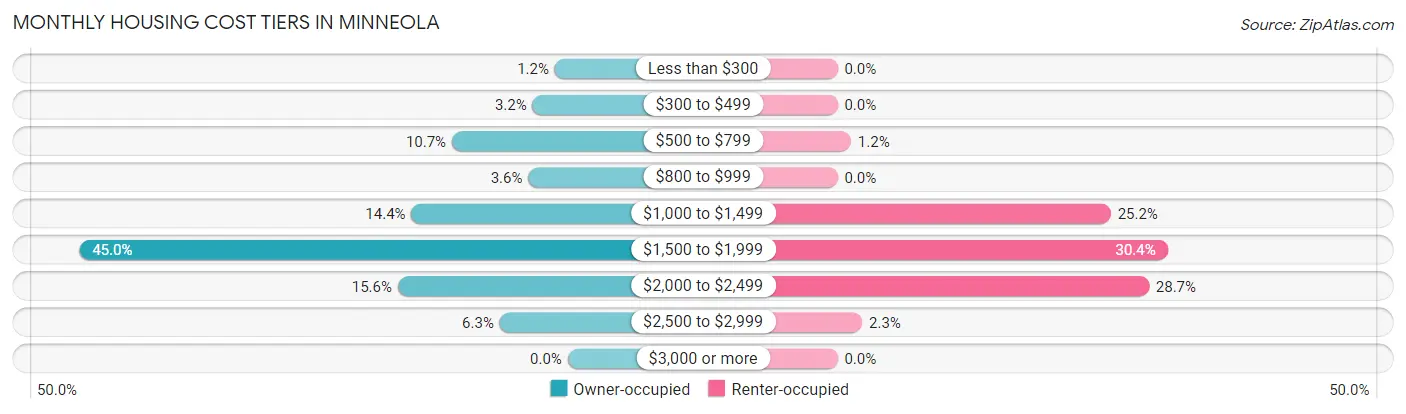
| Monthly Cost | Owner-occupied | Renter-occupied |
| Less than $300 | 37 (1.2%) | 0 (0.0%) |
| $300 to $499 | 101 (3.2%) | 0 (0.0%) |
| $500 to $799 | 332 (10.7%) | 18 (1.2%) |
| $800 to $999 | 113 (3.6%) | 0 (0.0%) |
| $1,000 to $1,499 | 448 (14.4%) | 365 (25.2%) |
| $1,500 to $1,999 | 1,400 (45.0%) | 441 (30.4%) |
| $2,000 to $2,499 | 487 (15.6%) | 416 (28.7%) |
| $2,500 to $2,999 | 195 (6.3%) | 33 (2.3%) |
| $3,000 or more | 0 (0.0%) | 0 (0.0%) |
| Total | 3,113 (100.0%) | 1,451 (100.0%) |
Physical Housing Characteristics in Minneola
Housing Structures in Minneola
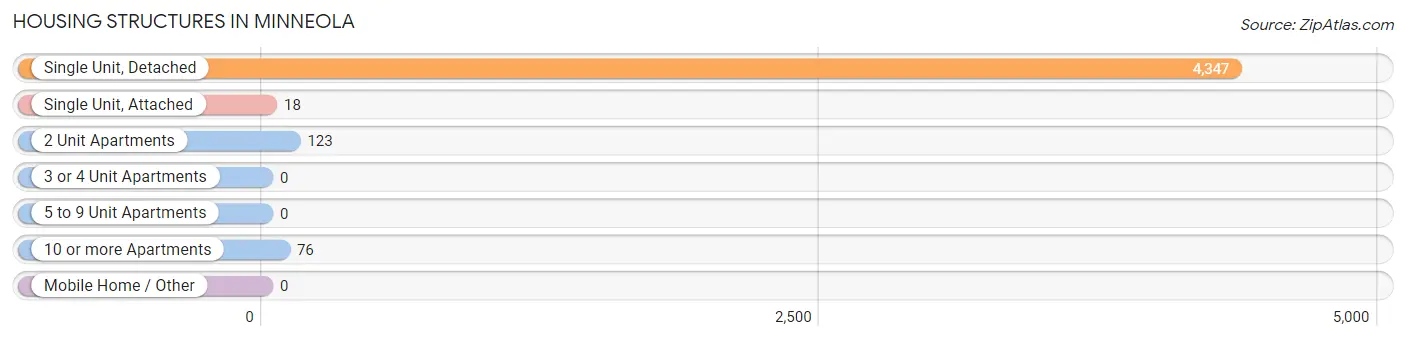
| Structure Type | # Housing Units | % Housing Units |
| Single Unit, Detached | 4,347 | 95.3% |
| Single Unit, Attached | 18 | 0.4% |
| 2 Unit Apartments | 123 | 2.7% |
| 3 or 4 Unit Apartments | 0 | 0.0% |
| 5 to 9 Unit Apartments | 0 | 0.0% |
| 10 or more Apartments | 76 | 1.7% |
| Mobile Home / Other | 0 | 0.0% |
| Total | 4,564 | 100.0% |
Housing Structures by Occupancy in Minneola
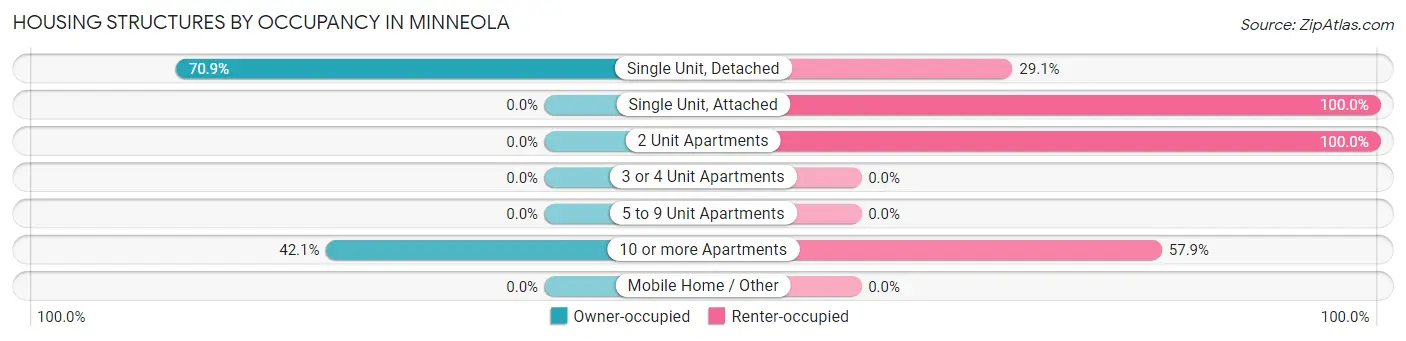
| Structure Type | Owner-occupied | Renter-occupied |
| Single Unit, Detached | 3,081 (70.9%) | 1,266 (29.1%) |
| Single Unit, Attached | 0 (0.0%) | 18 (100.0%) |
| 2 Unit Apartments | 0 (0.0%) | 123 (100.0%) |
| 3 or 4 Unit Apartments | 0 (0.0%) | 0 (0.0%) |
| 5 to 9 Unit Apartments | 0 (0.0%) | 0 (0.0%) |
| 10 or more Apartments | 32 (42.1%) | 44 (57.9%) |
| Mobile Home / Other | 0 (0.0%) | 0 (0.0%) |
| Total | 3,113 (68.2%) | 1,451 (31.8%) |
Housing Structures by Number of Rooms in Minneola
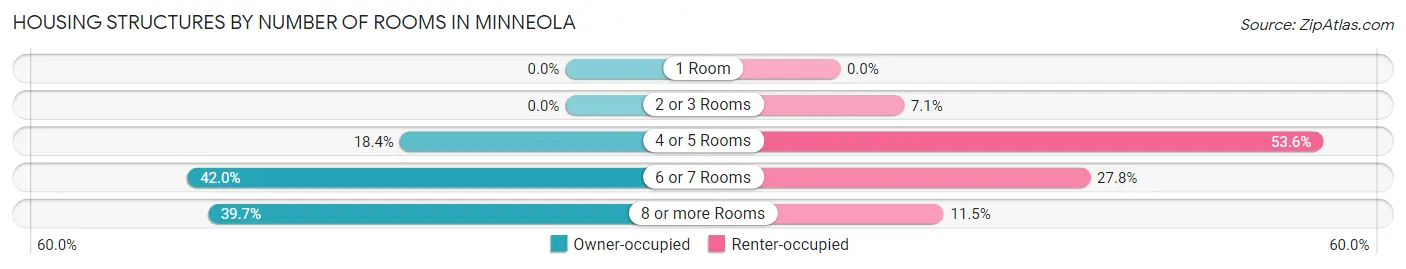
| Number of Rooms | Owner-occupied | Renter-occupied |
| 1 Room | 0 (0.0%) | 0 (0.0%) |
| 2 or 3 Rooms | 0 (0.0%) | 103 (7.1%) |
| 4 or 5 Rooms | 572 (18.4%) | 778 (53.6%) |
| 6 or 7 Rooms | 1,306 (41.9%) | 403 (27.8%) |
| 8 or more Rooms | 1,235 (39.7%) | 167 (11.5%) |
| Total | 3,113 (100.0%) | 1,451 (100.0%) |
Housing Structure by Heating Type in Minneola
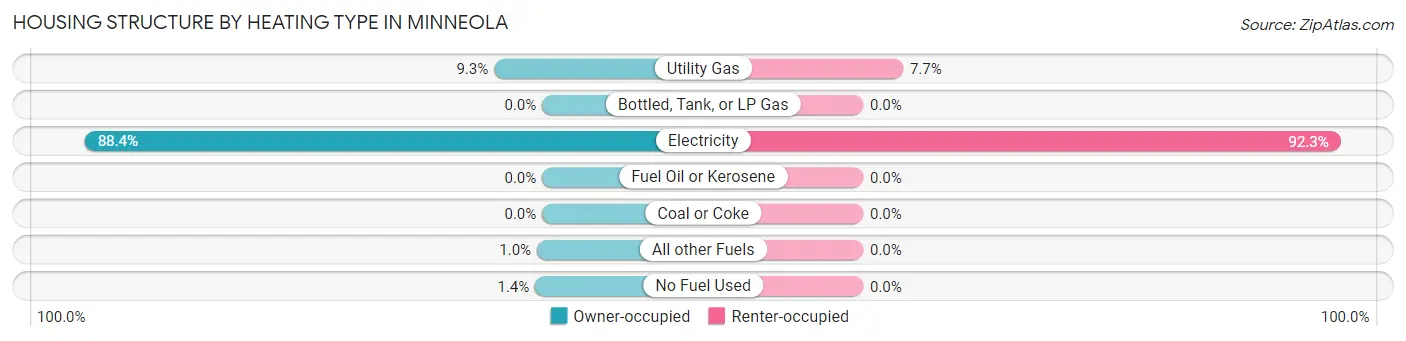
| Heating Type | Owner-occupied | Renter-occupied |
| Utility Gas | 289 (9.3%) | 112 (7.7%) |
| Bottled, Tank, or LP Gas | 0 (0.0%) | 0 (0.0%) |
| Electricity | 2,751 (88.4%) | 1,339 (92.3%) |
| Fuel Oil or Kerosene | 0 (0.0%) | 0 (0.0%) |
| Coal or Coke | 0 (0.0%) | 0 (0.0%) |
| All other Fuels | 31 (1.0%) | 0 (0.0%) |
| No Fuel Used | 42 (1.3%) | 0 (0.0%) |
| Total | 3,113 (100.0%) | 1,451 (100.0%) |
Household Vehicle Usage in Minneola
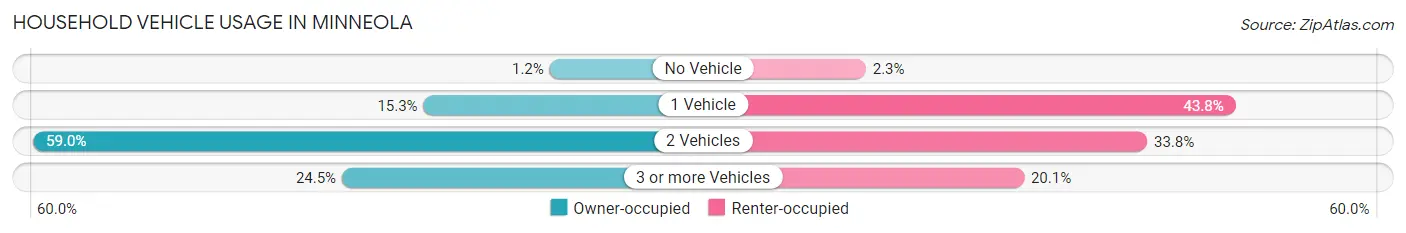
| Vehicles per Household | Owner-occupied | Renter-occupied |
| No Vehicle | 37 (1.2%) | 34 (2.3%) |
| 1 Vehicle | 477 (15.3%) | 635 (43.8%) |
| 2 Vehicles | 1,838 (59.0%) | 491 (33.8%) |
| 3 or more Vehicles | 761 (24.4%) | 291 (20.1%) |
| Total | 3,113 (100.0%) | 1,451 (100.0%) |
Real Estate & Mortgages in Minneola
Real Estate and Mortgage Overview in Minneola
| Characteristic | Without Mortgage | With Mortgage |
| Housing Units | 441 | 2,672 |
| Median Property Value | $322,500 | $353,000 |
| Median Household Income | $82,539 | $515 |
| Monthly Housing Costs | $565 | $0 |
| Real Estate Taxes | $2,995 | $70 |
Property Value by Mortgage Status in Minneola
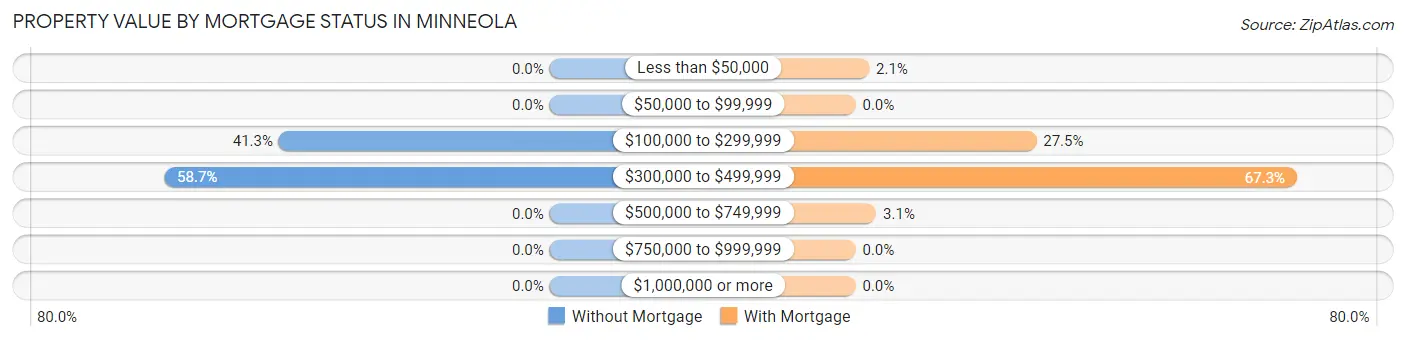
| Property Value | Without Mortgage | With Mortgage |
| Less than $50,000 | 0 (0.0%) | 55 (2.1%) |
| $50,000 to $99,999 | 0 (0.0%) | 0 (0.0%) |
| $100,000 to $299,999 | 182 (41.3%) | 736 (27.5%) |
| $300,000 to $499,999 | 259 (58.7%) | 1,797 (67.2%) |
| $500,000 to $749,999 | 0 (0.0%) | 84 (3.1%) |
| $750,000 to $999,999 | 0 (0.0%) | 0 (0.0%) |
| $1,000,000 or more | 0 (0.0%) | 0 (0.0%) |
| Total | 441 (100.0%) | 2,672 (100.0%) |
Household Income by Mortgage Status in Minneola
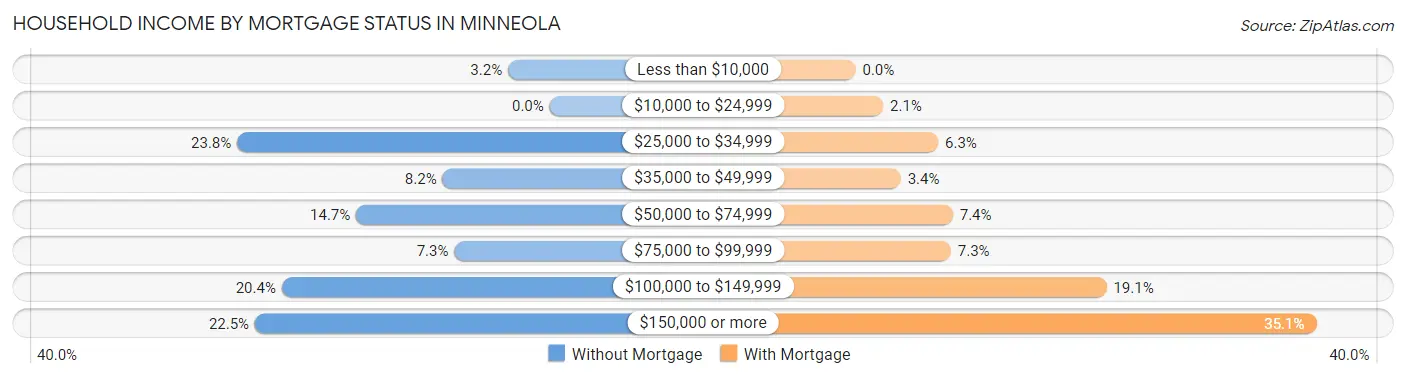
| Household Income | Without Mortgage | With Mortgage |
| Less than $10,000 | 14 (3.2%) | 0 (0.0%) |
| $10,000 to $24,999 | 0 (0.0%) | 56 (2.1%) |
| $25,000 to $34,999 | 105 (23.8%) | 168 (6.3%) |
| $35,000 to $49,999 | 36 (8.2%) | 92 (3.4%) |
| $50,000 to $74,999 | 65 (14.7%) | 198 (7.4%) |
| $75,000 to $99,999 | 32 (7.3%) | 194 (7.3%) |
| $100,000 to $149,999 | 90 (20.4%) | 511 (19.1%) |
| $150,000 or more | 99 (22.5%) | 938 (35.1%) |
| Total | 441 (100.0%) | 2,672 (100.0%) |
Property Value to Household Income Ratio in Minneola
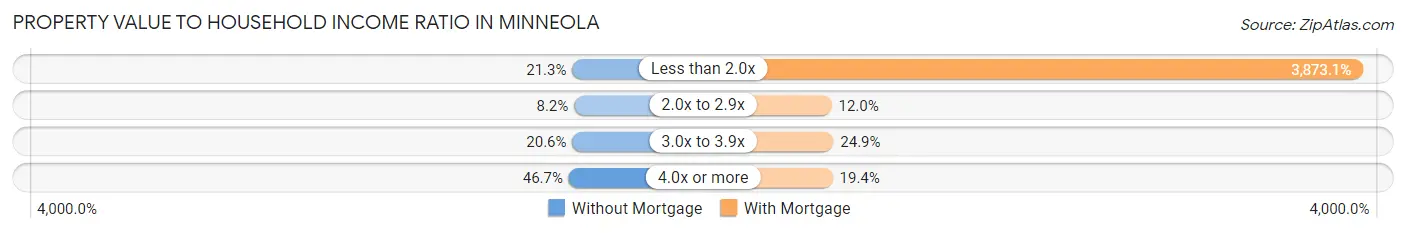
| Value-to-Income Ratio | Without Mortgage | With Mortgage |
| Less than 2.0x | 94 (21.3%) | 103,488 (3,873.0%) |
| 2.0x to 2.9x | 36 (8.2%) | 321 (12.0%) |
| 3.0x to 3.9x | 91 (20.6%) | 664 (24.8%) |
| 4.0x or more | 206 (46.7%) | 518 (19.4%) |
| Total | 441 (100.0%) | 2,672 (100.0%) |
Real Estate Taxes by Mortgage Status in Minneola
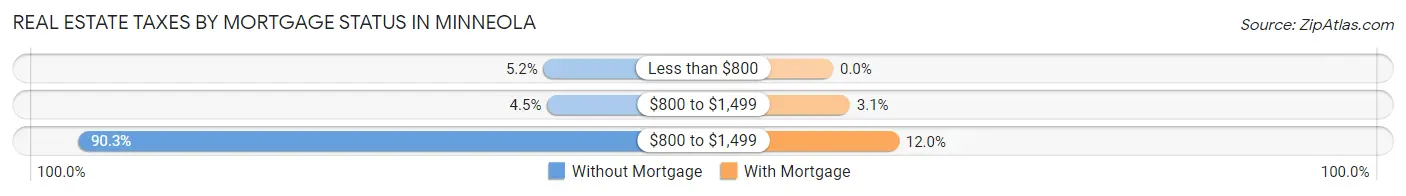
| Property Taxes | Without Mortgage | With Mortgage |
| Less than $800 | 23 (5.2%) | 0 (0.0%) |
| $800 to $1,499 | 20 (4.5%) | 82 (3.1%) |
| $800 to $1,499 | 398 (90.2%) | 321 (12.0%) |
| Total | 441 (100.0%) | 2,672 (100.0%) |
Health & Disability in Minneola
Health Insurance Coverage by Age in Minneola
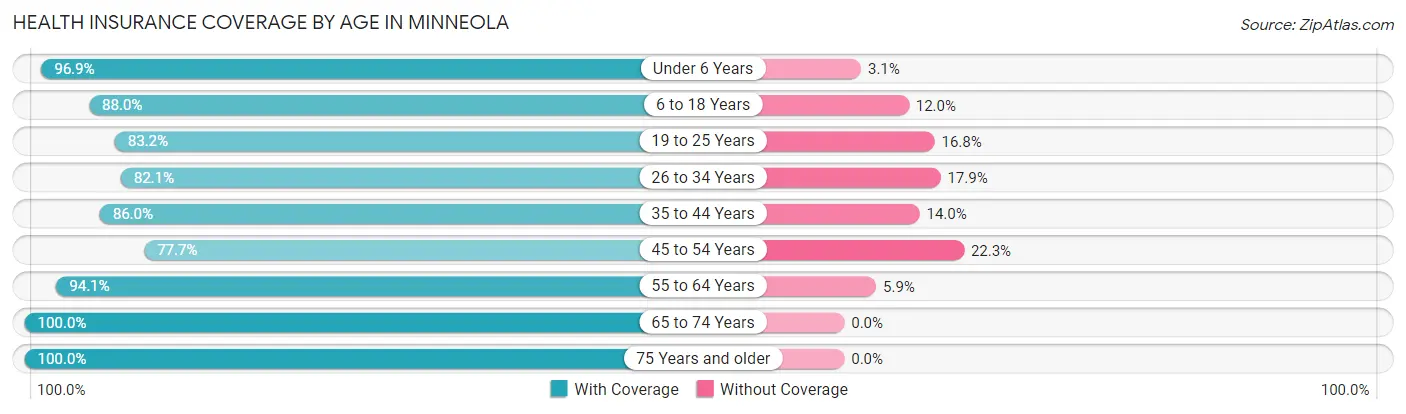
| Age Bracket | With Coverage | Without Coverage |
| Under 6 Years | 1,210 (96.9%) | 39 (3.1%) |
| 6 to 18 Years | 2,743 (88.0%) | 375 (12.0%) |
| 19 to 25 Years | 593 (83.2%) | 120 (16.8%) |
| 26 to 34 Years | 1,455 (82.1%) | 318 (17.9%) |
| 35 to 44 Years | 2,469 (86.0%) | 403 (14.0%) |
| 45 to 54 Years | 1,313 (77.7%) | 377 (22.3%) |
| 55 to 64 Years | 1,619 (94.1%) | 102 (5.9%) |
| 65 to 74 Years | 919 (100.0%) | 0 (0.0%) |
| 75 Years and older | 338 (100.0%) | 0 (0.0%) |
| Total | 12,659 (87.9%) | 1,734 (12.0%) |
Health Insurance Coverage by Citizenship Status in Minneola
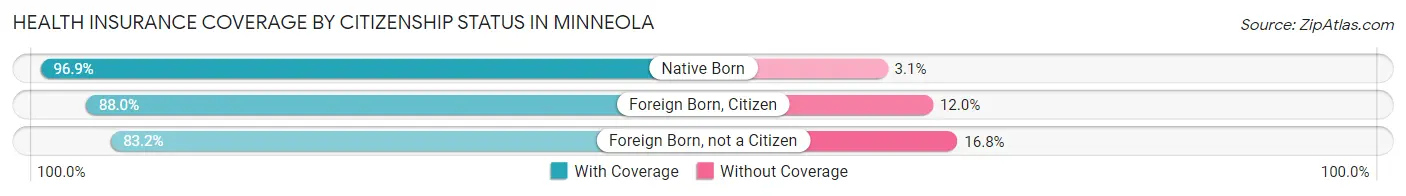
| Citizenship Status | With Coverage | Without Coverage |
| Native Born | 1,210 (96.9%) | 39 (3.1%) |
| Foreign Born, Citizen | 2,743 (88.0%) | 375 (12.0%) |
| Foreign Born, not a Citizen | 593 (83.2%) | 120 (16.8%) |
Health Insurance Coverage by Household Income in Minneola
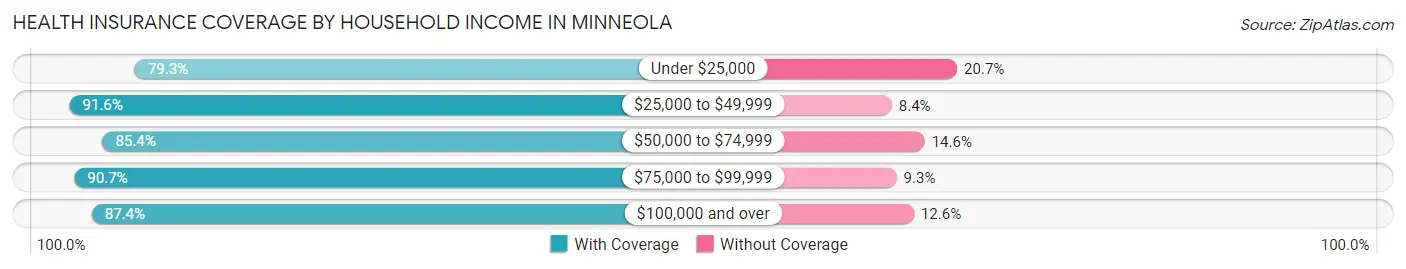
| Household Income | With Coverage | Without Coverage |
| Under $25,000 | 556 (79.3%) | 145 (20.7%) |
| $25,000 to $49,999 | 1,659 (91.6%) | 153 (8.4%) |
| $50,000 to $74,999 | 1,082 (85.4%) | 185 (14.6%) |
| $75,000 to $99,999 | 2,368 (90.7%) | 244 (9.3%) |
| $100,000 and over | 6,994 (87.4%) | 1,007 (12.6%) |
Public vs Private Health Insurance Coverage by Age in Minneola
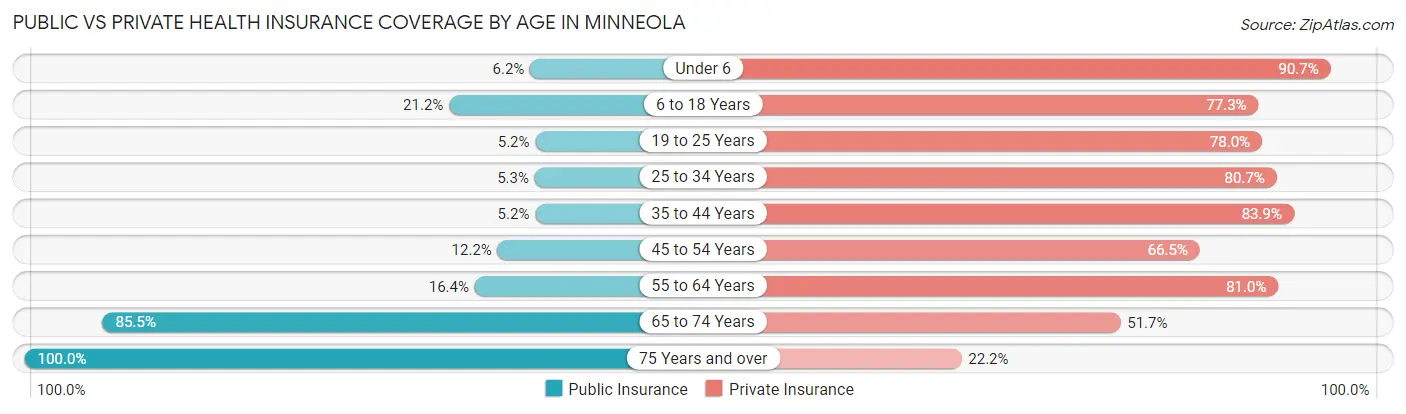
| Age Bracket | Public Insurance | Private Insurance |
| Under 6 | 77 (6.2%) | 1,133 (90.7%) |
| 6 to 18 Years | 661 (21.2%) | 2,411 (77.3%) |
| 19 to 25 Years | 37 (5.2%) | 556 (78.0%) |
| 25 to 34 Years | 94 (5.3%) | 1,431 (80.7%) |
| 35 to 44 Years | 150 (5.2%) | 2,409 (83.9%) |
| 45 to 54 Years | 206 (12.2%) | 1,123 (66.4%) |
| 55 to 64 Years | 283 (16.4%) | 1,394 (81.0%) |
| 65 to 74 Years | 786 (85.5%) | 475 (51.7%) |
| 75 Years and over | 338 (100.0%) | 75 (22.2%) |
| Total | 2,632 (18.3%) | 11,007 (76.5%) |
Disability Status by Sex by Age in Minneola
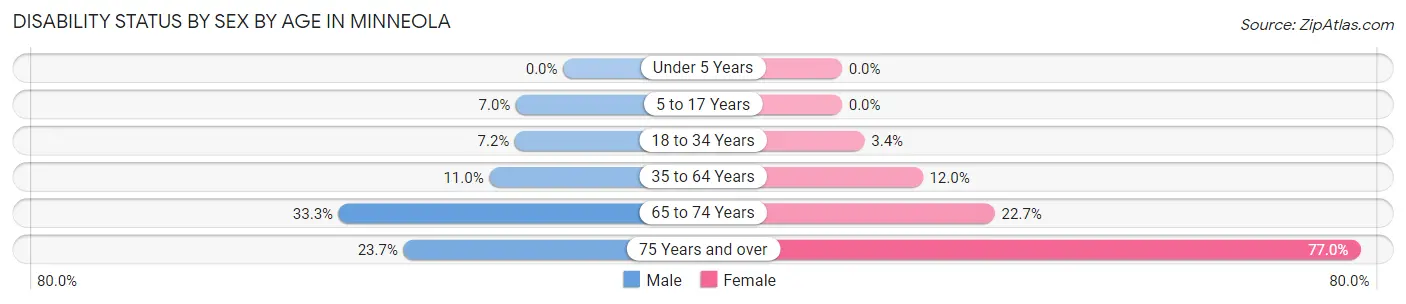
| Age Bracket | Male | Female |
| Under 5 Years | 0 (0.0%) | 0 (0.0%) |
| 5 to 17 Years | 101 (7.0%) | 0 (0.0%) |
| 18 to 34 Years | 103 (7.1%) | 46 (3.4%) |
| 35 to 64 Years | 343 (11.0%) | 378 (12.0%) |
| 65 to 74 Years | 114 (33.3%) | 131 (22.7%) |
| 75 Years and over | 41 (23.7%) | 127 (77.0%) |
Disability Class by Sex by Age in Minneola
Disability Class: Hearing Difficulty
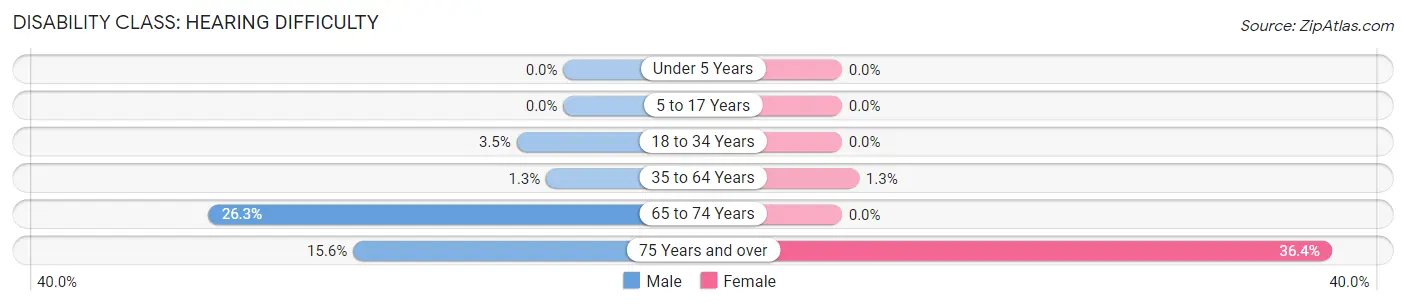
| Age Bracket | Male | Female |
| Under 5 Years | 0 (0.0%) | 0 (0.0%) |
| 5 to 17 Years | 0 (0.0%) | 0 (0.0%) |
| 18 to 34 Years | 50 (3.5%) | 0 (0.0%) |
| 35 to 64 Years | 40 (1.3%) | 40 (1.3%) |
| 65 to 74 Years | 90 (26.3%) | 0 (0.0%) |
| 75 Years and over | 27 (15.6%) | 60 (36.4%) |
Disability Class: Vision Difficulty
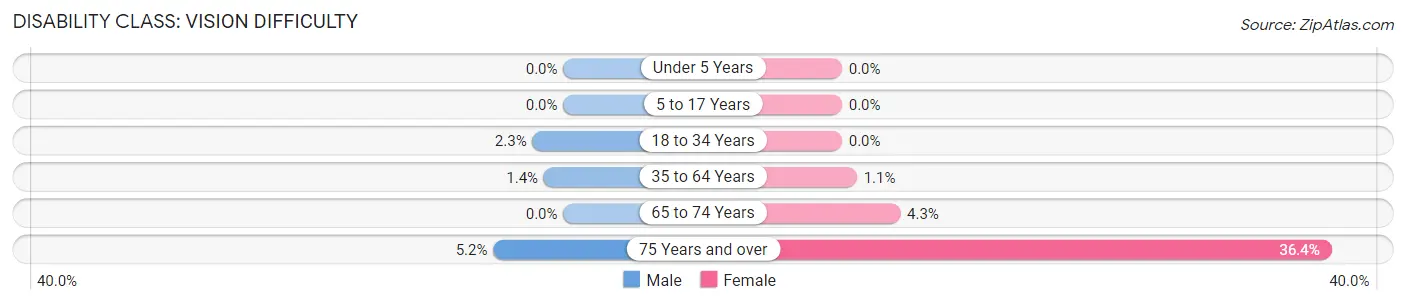
| Age Bracket | Male | Female |
| Under 5 Years | 0 (0.0%) | 0 (0.0%) |
| 5 to 17 Years | 0 (0.0%) | 0 (0.0%) |
| 18 to 34 Years | 33 (2.3%) | 0 (0.0%) |
| 35 to 64 Years | 45 (1.4%) | 35 (1.1%) |
| 65 to 74 Years | 0 (0.0%) | 25 (4.3%) |
| 75 Years and over | 9 (5.2%) | 60 (36.4%) |
Disability Class: Cognitive Difficulty
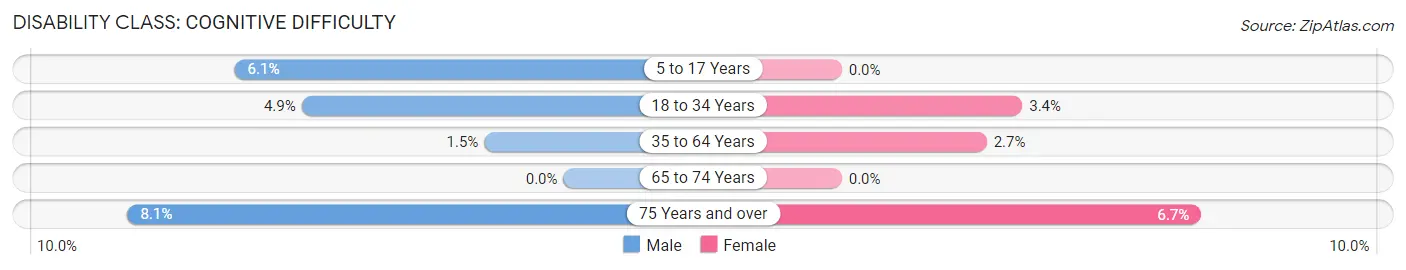
| Age Bracket | Male | Female |
| 5 to 17 Years | 88 (6.1%) | 0 (0.0%) |
| 18 to 34 Years | 70 (4.9%) | 46 (3.4%) |
| 35 to 64 Years | 46 (1.5%) | 85 (2.7%) |
| 65 to 74 Years | 0 (0.0%) | 0 (0.0%) |
| 75 Years and over | 14 (8.1%) | 11 (6.7%) |
Disability Class: Ambulatory Difficulty
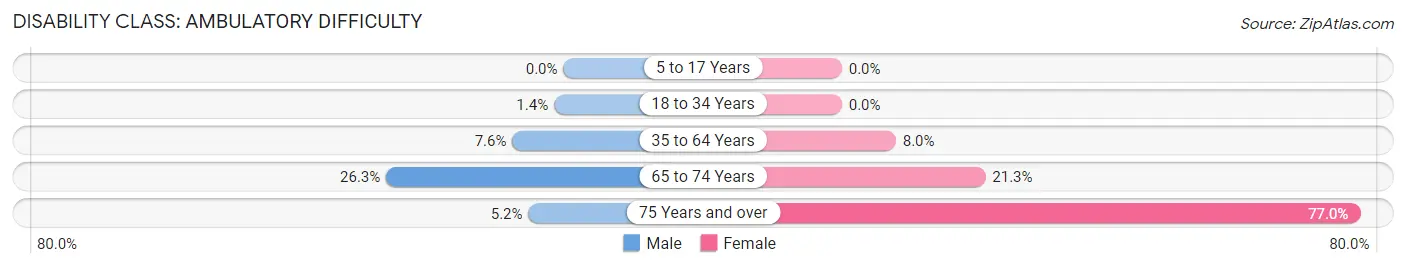
| Age Bracket | Male | Female |
| 5 to 17 Years | 0 (0.0%) | 0 (0.0%) |
| 18 to 34 Years | 20 (1.4%) | 0 (0.0%) |
| 35 to 64 Years | 237 (7.6%) | 253 (8.0%) |
| 65 to 74 Years | 90 (26.3%) | 123 (21.3%) |
| 75 Years and over | 9 (5.2%) | 127 (77.0%) |
Disability Class: Self-Care Difficulty
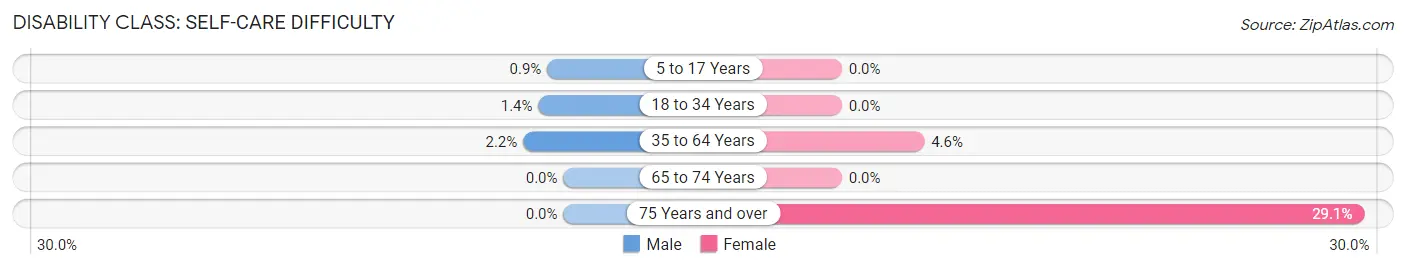
| Age Bracket | Male | Female |
| 5 to 17 Years | 13 (0.9%) | 0 (0.0%) |
| 18 to 34 Years | 20 (1.4%) | 0 (0.0%) |
| 35 to 64 Years | 70 (2.2%) | 145 (4.6%) |
| 65 to 74 Years | 0 (0.0%) | 0 (0.0%) |
| 75 Years and over | 0 (0.0%) | 48 (29.1%) |
Technology Access in Minneola
Computing Device Access in Minneola
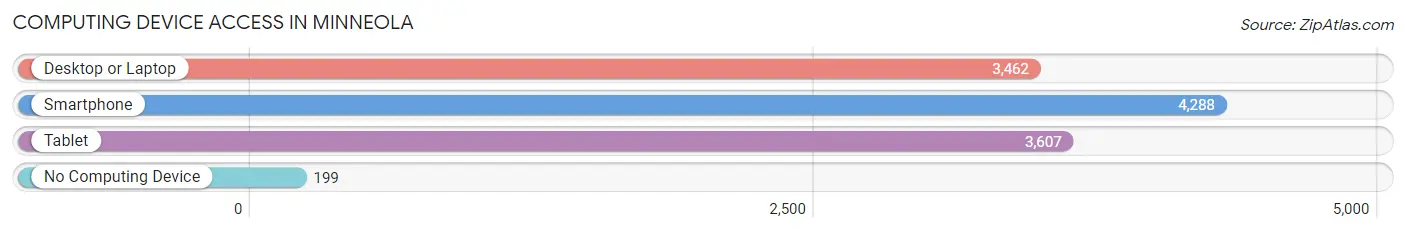
| Device Type | # Households | % Households |
| Desktop or Laptop | 3,462 | 75.8% |
| Smartphone | 4,288 | 94.0% |
| Tablet | 3,607 | 79.0% |
| No Computing Device | 199 | 4.4% |
| Total | 4,564 | 100.0% |
Internet Access in Minneola
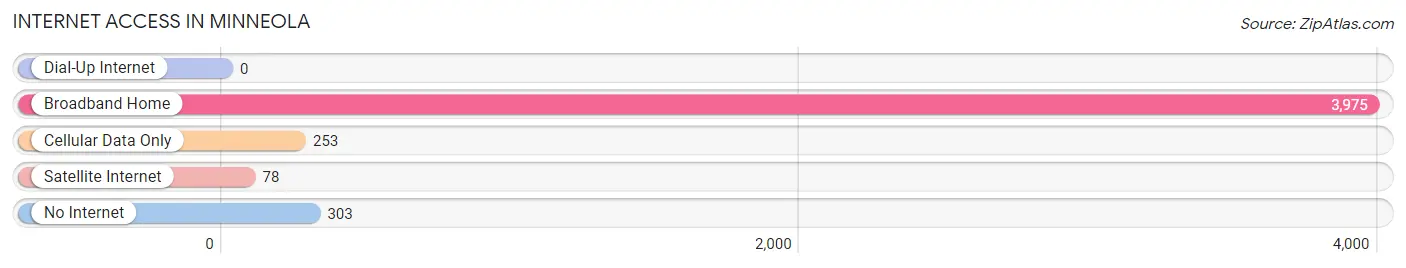
| Internet Type | # Households | % Households |
| Dial-Up Internet | 0 | 0.0% |
| Broadband Home | 3,975 | 87.1% |
| Cellular Data Only | 253 | 5.5% |
| Satellite Internet | 78 | 1.7% |
| No Internet | 303 | 6.6% |
| Total | 4,564 | 100.0% |
Minneola Summary
Minneola, Florida is a small city located in Lake County, Florida. It is situated on the south shore of Lake Minneola, which is part of the Clermont Chain of Lakes. The city is located approximately 25 miles west of Orlando and is part of the Orlando-Kissimmee-Sanford Metropolitan Statistical Area. As of the 2010 census, the population of Minneola was 6,072.
History
The area that is now Minneola was originally inhabited by the Timucua Indians. The first European settlers arrived in the area in the late 1800s. The city was founded in 1887 and was originally known as Clay Bank. The name was changed to Minneola in 1891 in honor of the nearby lake. The city was incorporated in 1920.
Geography
Minneola is located at 28°35'N 81°45'W (28.5833, -81.7500). The city has a total area of 4.2 square miles, of which 4.1 square miles is land and 0.1 square miles is water. The city is located on the south shore of Lake Minneola, which is part of the Clermont Chain of Lakes. The city is located approximately 25 miles west of Orlando.
Economy
The economy of Minneola is largely based on tourism and agriculture. The city is home to several tourist attractions, including the Minneola Scenic Trail, which is a popular hiking and biking trail. The city is also home to several wineries and vineyards, as well as several farms and nurseries. The city is also home to several small businesses, including restaurants, retail stores, and professional services.
Demographics
As of the 2010 census, there were 6,072 people, 2,072 households, and 1,541 families residing in the city. The population density was 1,467.2 people per square mile. The racial makeup of the city was 79.2% White, 11.2% African American, 0.4% Native American, 1.2% Asian, 0.1% Pacific Islander, 5.7% from other races, and 2.2% from two or more races. Hispanic or Latino of any race were 14.2% of the population.
The median income for a household in the city was $45,938, and the median income for a family was $51,944. The per capita income for the city was $20,945. About 11.2% of families and 14.2% of the population were below the poverty line, including 19.2% of those under age 18 and 8.2% of those age 65 or over.
Common Questions
What is Per Capita Income in Minneola?
Per Capita income in Minneola is $30,556.
What is the Median Family Income in Minneola?
Median Family Income in Minneola is $102,554.
What is the Median Household income in Minneola?
Median Household Income in Minneola is $91,435.
What is Income or Wage Gap in Minneola?
Income or Wage Gap in Minneola is 32.2%.
Women in Minneola earn 67.8 cents for every dollar earned by a man.
What is Inequality or Gini Index in Minneola?
Inequality or Gini Index in Minneola is 0.33.
What is the Total Population of Minneola?
Total Population of Minneola is 14,406.
What is the Total Male Population of Minneola?
Total Male Population of Minneola is 7,128.
What is the Total Female Population of Minneola?
Total Female Population of Minneola is 7,278.
What is the Ratio of Males per 100 Females in Minneola?
There are 97.94 Males per 100 Females in Minneola.
What is the Ratio of Females per 100 Males in Minneola?
There are 102.10 Females per 100 Males in Minneola.
What is the Median Population Age in Minneola?
Median Population Age in Minneola is 36.4 Years.
What is the Average Family Size in Minneola
Average Family Size in Minneola is 3.5 People.
What is the Average Household Size in Minneola
Average Household Size in Minneola is 3.1 People.
How Large is the Labor Force in Minneola?
There are 7,451 People in the Labor Forcein in Minneola.
What is the Percentage of People in the Labor Force in Minneola?
69.9% of People are in the Labor Force in Minneola.
What is the Unemployment Rate in Minneola?
Unemployment Rate in Minneola is 3.5%.