Groveland, FL Map & Demographics
Groveland Map
Groveland Overview
$39,878
PER CAPITA INCOME
$98,822
AVG FAMILY INCOME
$84,347
AVG HOUSEHOLD INCOME
27.4%
WAGE / INCOME GAP [ % ]
72.6¢/ $1
WAGE / INCOME GAP [ $ ]
0.41
INEQUALITY / GINI INDEX
19,240
TOTAL POPULATION
8,831
MALE POPULATION
10,409
FEMALE POPULATION
84.84
MALES / 100 FEMALES
117.87
FEMALES / 100 MALES
40.3
MEDIAN AGE
3.3
AVG FAMILY SIZE
2.8
AVG HOUSEHOLD SIZE
9,096
LABOR FORCE [ PEOPLE ]
61.6%
PERCENT IN LABOR FORCE
6.0%
UNEMPLOYMENT RATE
Groveland Zip Codes
Groveland Area Codes
Income in Groveland
Income Overview in Groveland
Per Capita Income in Groveland is $39,878, while median incomes of families and households are $98,822 and $84,347 respectively.
| Characteristic | Number | Measure |
| Per Capita Income | 19,240 | $39,878 |
| Median Family Income | 4,931 | $98,822 |
| Mean Family Income | 4,931 | $122,920 |
| Median Household Income | 6,924 | $84,347 |
| Mean Household Income | 6,924 | $108,061 |
| Income Deficit | 4,931 | $0 |
| Wage / Income Gap (%) | 19,240 | 27.37% |
| Wage / Income Gap ($) | 19,240 | 72.63¢ per $1 |
| Gini / Inequality Index | 19,240 | 0.41 |
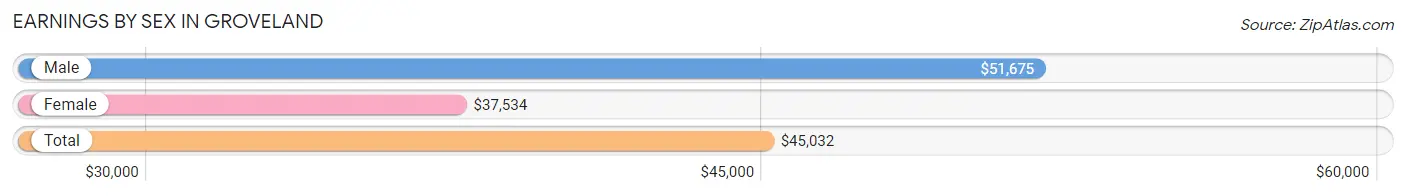
Earnings by Sex in Groveland
Average Earnings in Groveland are $45,032, $51,675 for men and $37,534 for women, a difference of 27.4%.
| Sex | Number | Average Earnings |
| Male | 4,214 (45.8%) | $51,675 |
| Female | 4,984 (54.2%) | $37,534 |
| Total | 9,198 (100.0%) | $45,032 |
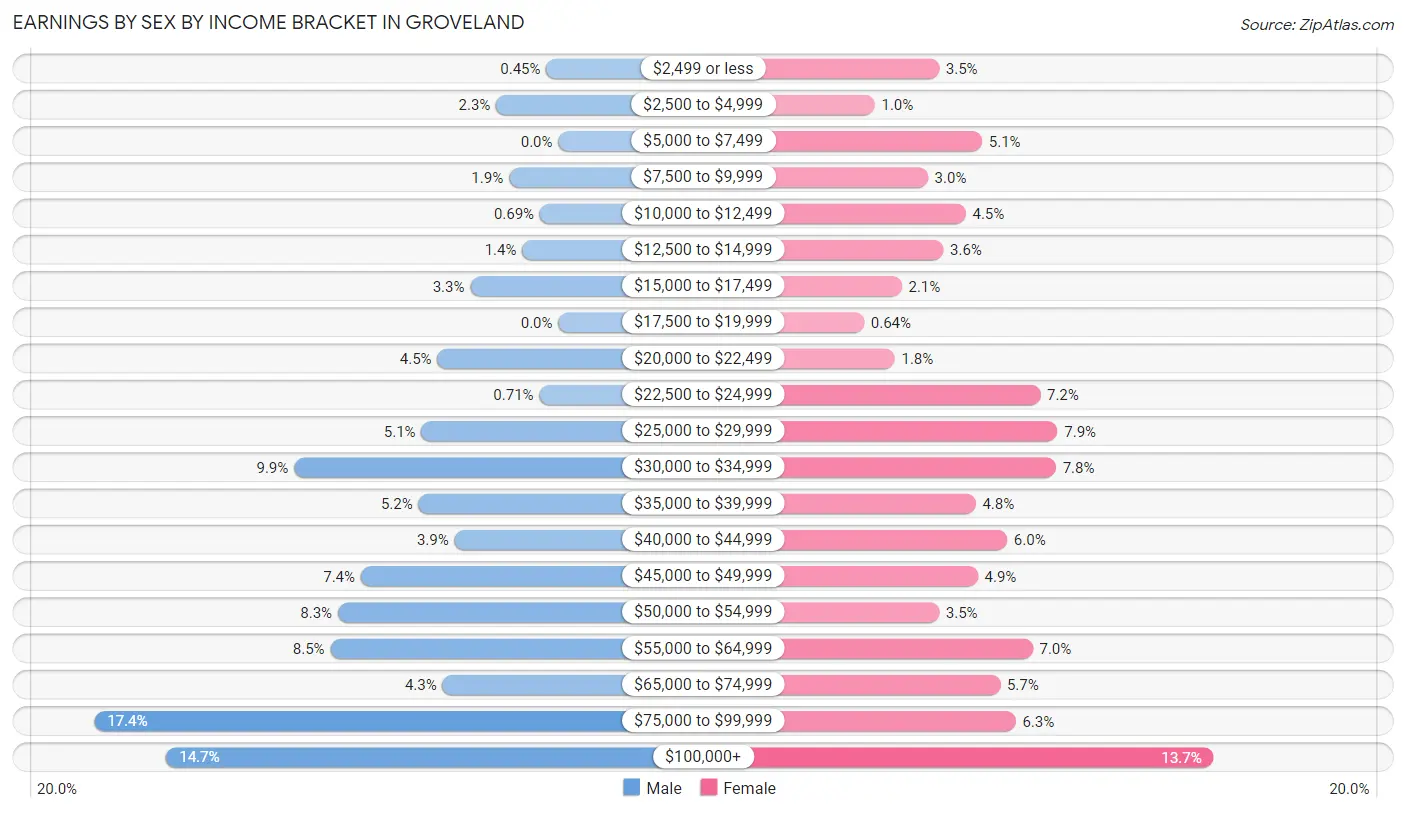
Earnings by Sex by Income Bracket in Groveland
The most common earnings brackets in Groveland are $75,000 to $99,999 for men (733 | 17.4%) and $100,000+ for women (685 | 13.7%).
| Income | Male | Female |
| $2,499 or less | 19 (0.4%) | 172 (3.5%) |
| $2,500 to $4,999 | 98 (2.3%) | 52 (1.0%) |
| $5,000 to $7,499 | 0 (0.0%) | 252 (5.1%) |
| $7,500 to $9,999 | 78 (1.8%) | 151 (3.0%) |
| $10,000 to $12,499 | 29 (0.7%) | 222 (4.4%) |
| $12,500 to $14,999 | 57 (1.3%) | 180 (3.6%) |
| $15,000 to $17,499 | 139 (3.3%) | 102 (2.1%) |
| $17,500 to $19,999 | 0 (0.0%) | 32 (0.6%) |
| $20,000 to $22,499 | 191 (4.5%) | 89 (1.8%) |
| $22,500 to $24,999 | 30 (0.7%) | 361 (7.2%) |
| $25,000 to $29,999 | 216 (5.1%) | 393 (7.9%) |
| $30,000 to $34,999 | 417 (9.9%) | 390 (7.8%) |
| $35,000 to $39,999 | 221 (5.2%) | 240 (4.8%) |
| $40,000 to $44,999 | 164 (3.9%) | 299 (6.0%) |
| $45,000 to $49,999 | 312 (7.4%) | 244 (4.9%) |
| $50,000 to $54,999 | 348 (8.3%) | 172 (3.5%) |
| $55,000 to $64,999 | 360 (8.5%) | 347 (7.0%) |
| $65,000 to $74,999 | 183 (4.3%) | 286 (5.7%) |
| $75,000 to $99,999 | 733 (17.4%) | 315 (6.3%) |
| $100,000+ | 619 (14.7%) | 685 (13.7%) |
| Total | 4,214 (100.0%) | 4,984 (100.0%) |
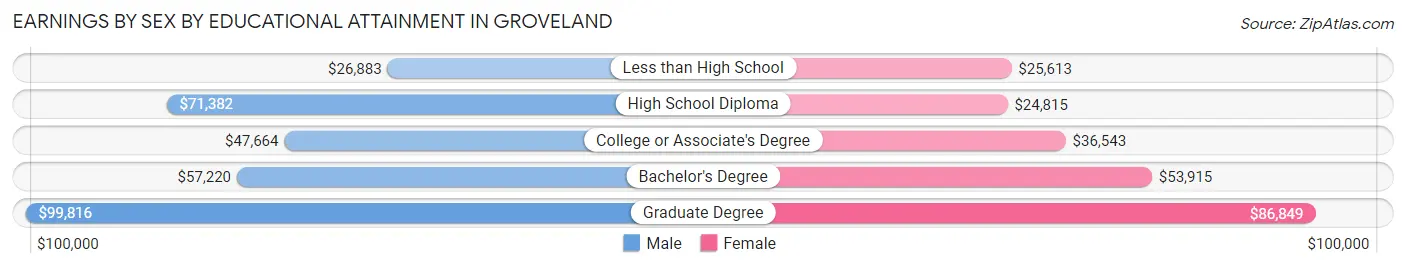
Earnings by Sex by Educational Attainment in Groveland
Average earnings in Groveland are $54,986 for men and $40,951 for women, a difference of 25.5%. Men with an educational attainment of graduate degree enjoy the highest average annual earnings of $99,816, while those with less than high school education earn the least with $26,883. Women with an educational attainment of graduate degree earn the most with the average annual earnings of $86,849, while those with high school diploma education have the smallest earnings of $24,815.
| Educational Attainment | Male Income | Female Income |
| Less than High School | $26,883 | $25,613 |
| High School Diploma | $71,382 | $24,815 |
| College or Associate's Degree | $47,664 | $36,543 |
| Bachelor's Degree | $57,220 | $53,915 |
| Graduate Degree | $99,816 | $86,849 |
| Total | $54,986 | $40,951 |
Family Income in Groveland
Family Income Brackets in Groveland
According to the Groveland family income data, there are 1,366 families falling into the $100,000 to $149,999 income range, which is the most common income bracket and makes up 27.7% of all families.
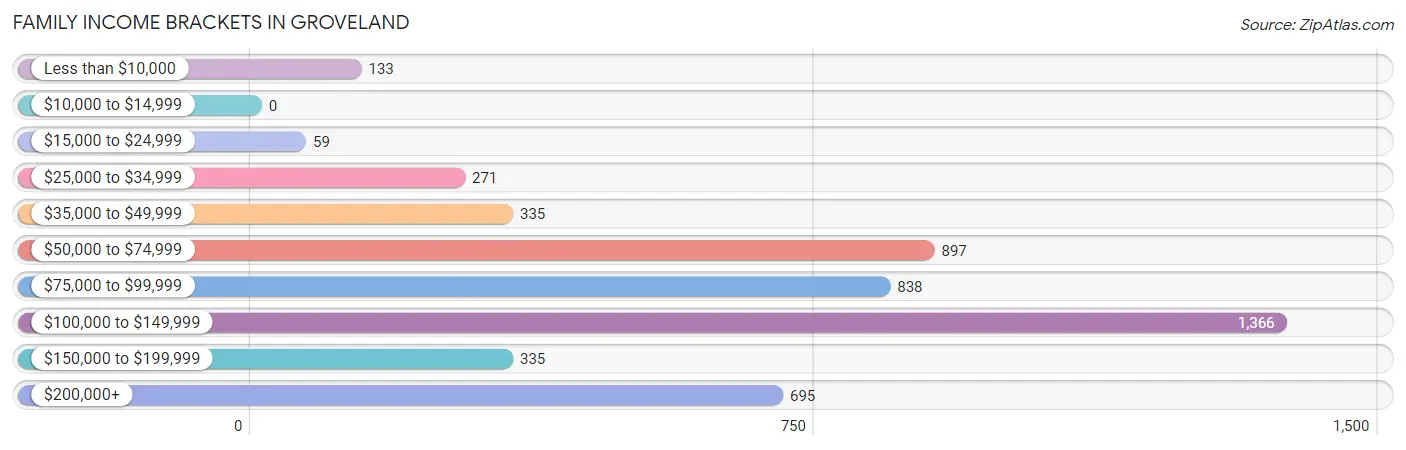
| Income Bracket | # Families | % Families |
| Less than $10,000 | 133 | 2.7% |
| $10,000 to $14,999 | 0 | 0.0% |
| $15,000 to $24,999 | 59 | 1.2% |
| $25,000 to $34,999 | 271 | 5.5% |
| $35,000 to $49,999 | 335 | 6.8% |
| $50,000 to $74,999 | 897 | 18.2% |
| $75,000 to $99,999 | 838 | 17.0% |
| $100,000 to $149,999 | 1,366 | 27.7% |
| $150,000 to $199,999 | 335 | 6.8% |
| $200,000+ | 695 | 14.1% |
Family Income by Famaliy Size in Groveland
5-person families (216 | 4.4%) account for the highest median family income in Groveland with $111,554 per family, while 2-person families (2,331 | 47.3%) have the highest median income of $50,564 per family member.
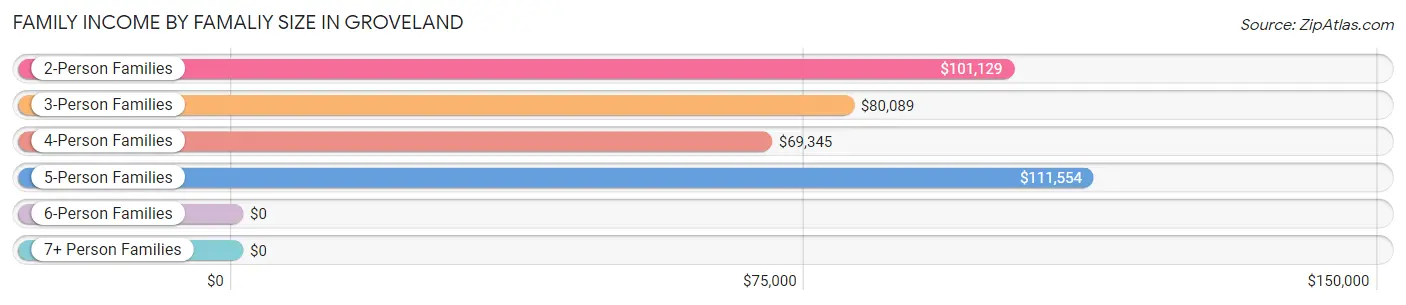
| Income Bracket | # Families | Median Income |
| 2-Person Families | 2,331 (47.3%) | $101,129 |
| 3-Person Families | 1,026 (20.8%) | $80,089 |
| 4-Person Families | 851 (17.3%) | $69,345 |
| 5-Person Families | 216 (4.4%) | $111,554 |
| 6-Person Families | 329 (6.7%) | $0 |
| 7+ Person Families | 178 (3.6%) | $0 |
| Total | 4,931 (100.0%) | $98,822 |
Family Income by Number of Earners in Groveland
The median family income in Groveland is $98,822, with families comprising 3+ earners (470) having the highest median family income of $143,400, while families with no earners (818) have the lowest median family income of $66,051, accounting for 9.5% and 16.6% of families, respectively.
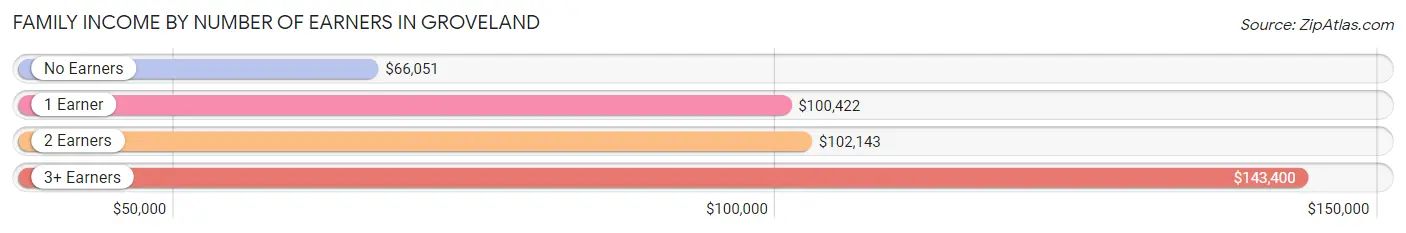
| Number of Earners | # Families | Median Income |
| No Earners | 818 (16.6%) | $66,051 |
| 1 Earner | 1,849 (37.5%) | $100,422 |
| 2 Earners | 1,794 (36.4%) | $102,143 |
| 3+ Earners | 470 (9.5%) | $143,400 |
| Total | 4,931 (100.0%) | $98,822 |
Household Income in Groveland
Household Income Brackets in Groveland
With 1,572 households falling in the category, the $100,000 to $149,999 income range is the most frequent in Groveland, accounting for 22.7% of all households.
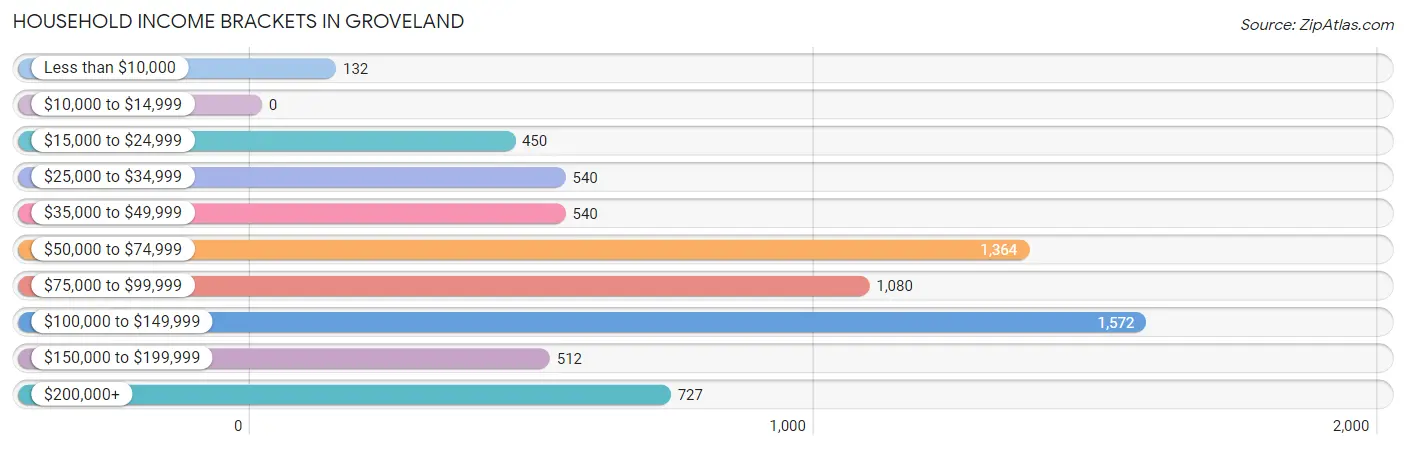
| Income Bracket | # Households | % Households |
| Less than $10,000 | 132 | 1.9% |
| $10,000 to $14,999 | 0 | 0.0% |
| $15,000 to $24,999 | 450 | 6.5% |
| $25,000 to $34,999 | 540 | 7.8% |
| $35,000 to $49,999 | 540 | 7.8% |
| $50,000 to $74,999 | 1,364 | 19.7% |
| $75,000 to $99,999 | 1,080 | 15.6% |
| $100,000 to $149,999 | 1,572 | 22.7% |
| $150,000 to $199,999 | 512 | 7.4% |
| $200,000+ | 727 | 10.5% |
Household Income by Householder Age in Groveland
The median household income in Groveland is $84,347, with the highest median household income of $103,138 found in the 25 to 44 years age bracket for the primary householder. A total of 2,014 households (29.1%) fall into this category. Meanwhile, the 65+ years age bracket for the primary householder has the lowest median household income of $68,750, with 2,222 households (32.1%) in this group.
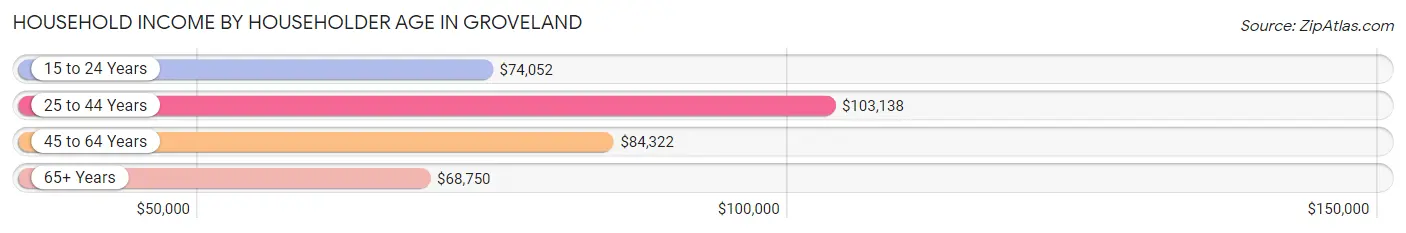
| Income Bracket | # Households | Median Income |
| 15 to 24 Years | 332 (4.8%) | $74,052 |
| 25 to 44 Years | 2,014 (29.1%) | $103,138 |
| 45 to 64 Years | 2,356 (34.0%) | $84,322 |
| 65+ Years | 2,222 (32.1%) | $68,750 |
| Total | 6,924 (100.0%) | $84,347 |
Poverty in Groveland
Income Below Poverty by Sex and Age in Groveland
With 6.8% poverty level for males and 7.7% for females among the residents of Groveland, under 5 year old males and 12 to 14 year old females are the most vulnerable to poverty, with 218 males (39.1%) and 91 females (29.0%) in their respective age groups living below the poverty level.
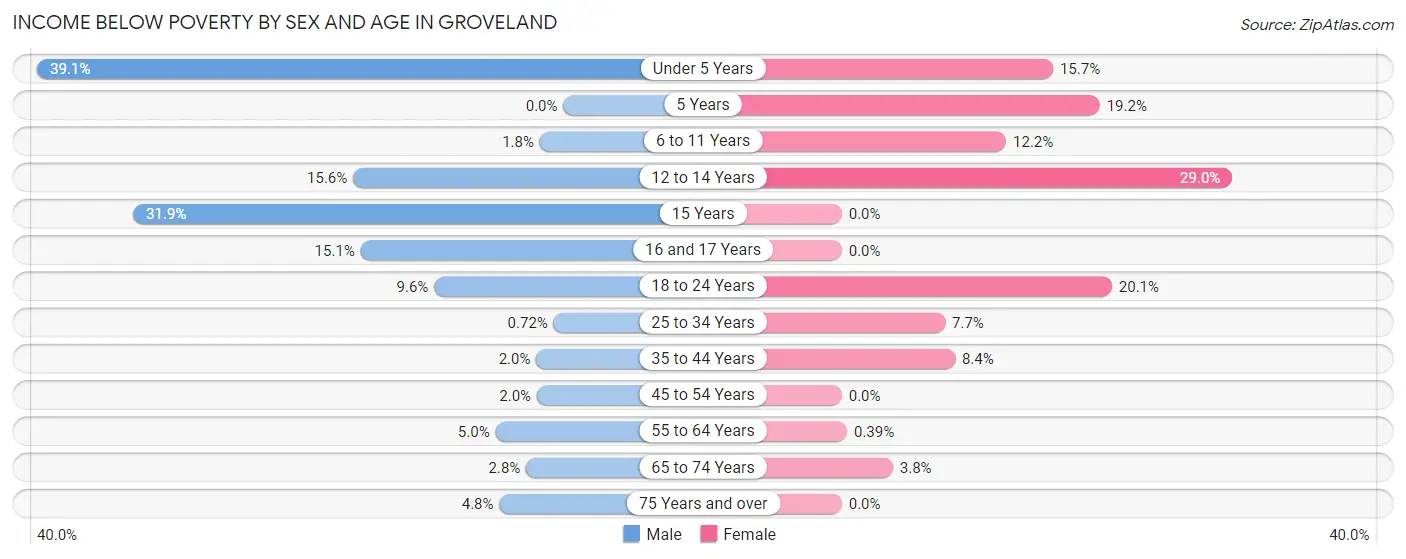
| Age Bracket | Male | Female |
| Under 5 Years | 218 (39.1%) | 164 (15.7%) |
| 5 Years | 0 (0.0%) | 9 (19.2%) |
| 6 to 11 Years | 14 (1.8%) | 90 (12.2%) |
| 12 to 14 Years | 96 (15.6%) | 91 (29.0%) |
| 15 Years | 23 (31.9%) | 0 (0.0%) |
| 16 and 17 Years | 28 (15.0%) | 0 (0.0%) |
| 18 to 24 Years | 71 (9.6%) | 164 (20.1%) |
| 25 to 34 Years | 5 (0.7%) | 83 (7.7%) |
| 35 to 44 Years | 27 (2.0%) | 146 (8.4%) |
| 45 to 54 Years | 24 (2.0%) | 0 (0.0%) |
| 55 to 64 Years | 42 (5.0%) | 4 (0.4%) |
| 65 to 74 Years | 31 (2.8%) | 52 (3.8%) |
| 75 Years and over | 21 (4.8%) | 0 (0.0%) |
| Total | 600 (6.8%) | 803 (7.7%) |
Income Above Poverty by Sex and Age in Groveland
According to the poverty statistics in Groveland, males aged 5 years and females aged 15 years are the age groups that are most secure financially, with 100.0% of males and 100.0% of females in these age groups living above the poverty line.
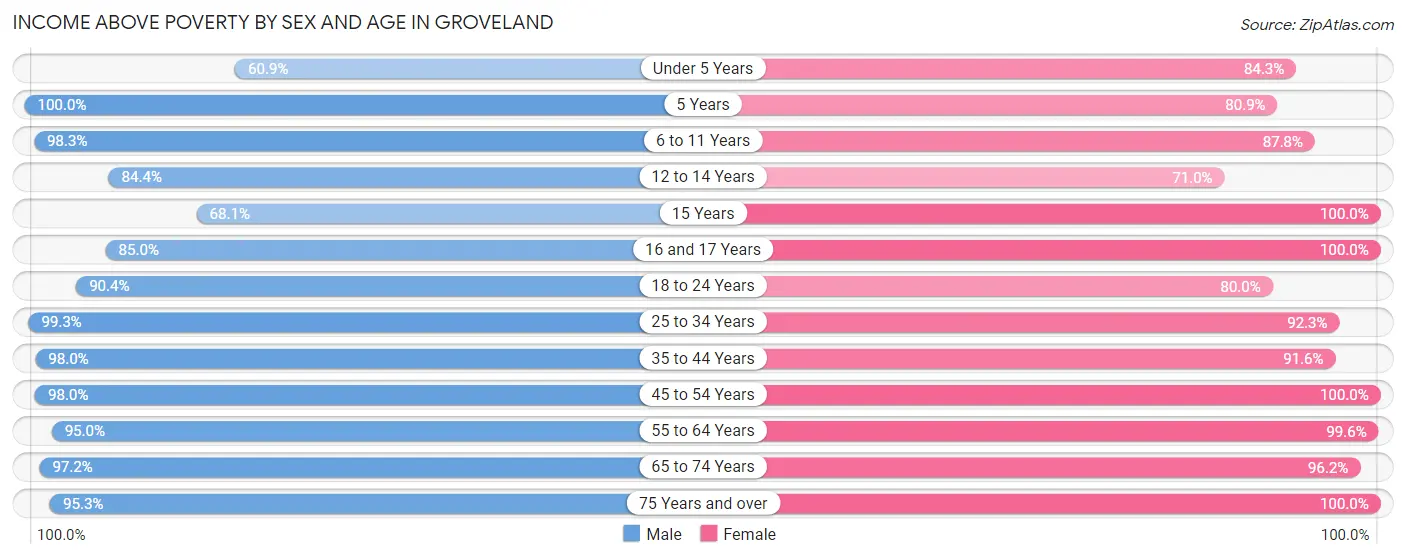
| Age Bracket | Male | Female |
| Under 5 Years | 340 (60.9%) | 882 (84.3%) |
| 5 Years | 138 (100.0%) | 38 (80.8%) |
| 6 to 11 Years | 786 (98.3%) | 648 (87.8%) |
| 12 to 14 Years | 519 (84.4%) | 223 (71.0%) |
| 15 Years | 49 (68.1%) | 67 (100.0%) |
| 16 and 17 Years | 158 (85.0%) | 237 (100.0%) |
| 18 to 24 Years | 669 (90.4%) | 654 (79.9%) |
| 25 to 34 Years | 691 (99.3%) | 999 (92.3%) |
| 35 to 44 Years | 1,318 (98.0%) | 1,592 (91.6%) |
| 45 to 54 Years | 1,199 (98.0%) | 1,185 (100.0%) |
| 55 to 64 Years | 791 (95.0%) | 1,016 (99.6%) |
| 65 to 74 Years | 1,092 (97.2%) | 1,319 (96.2%) |
| 75 Years and over | 421 (95.3%) | 718 (100.0%) |
| Total | 8,171 (93.2%) | 9,578 (92.3%) |
Income Below Poverty Among Married-Couple Families in Groveland
The poverty statistics for married-couple families in Groveland show that 1.1% or 38 of the total 3,376 families live below the poverty line. Families with 3 or 4 children have the highest poverty rate of 1.8%, comprising of 7 families. On the other hand, families with 1 or 2 children have the lowest poverty rate of 0.0%, which includes 0 families.
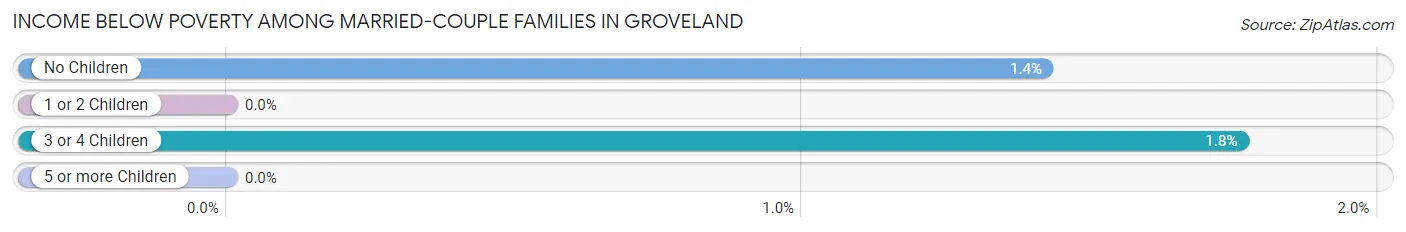
| Children | Above Poverty | Below Poverty |
| No Children | 2,152 (98.6%) | 31 (1.4%) |
| 1 or 2 Children | 795 (100.0%) | 0 (0.0%) |
| 3 or 4 Children | 391 (98.2%) | 7 (1.8%) |
| 5 or more Children | 0 (0.0%) | 0 (0.0%) |
| Total | 3,338 (98.9%) | 38 (1.1%) |
Income Below Poverty Among Single-Parent Households in Groveland
According to the poverty data in Groveland, 3.4% or 16 single-father households and 14.1% or 153 single-mother households are living below the poverty line. Among single-father households, those with 3 or 4 children have the highest poverty rate, with 16 households (15.1%) experiencing poverty. Likewise, among single-mother households, those with 5 or more children have the highest poverty rate, with 89 households (100.0%) falling below the poverty line.
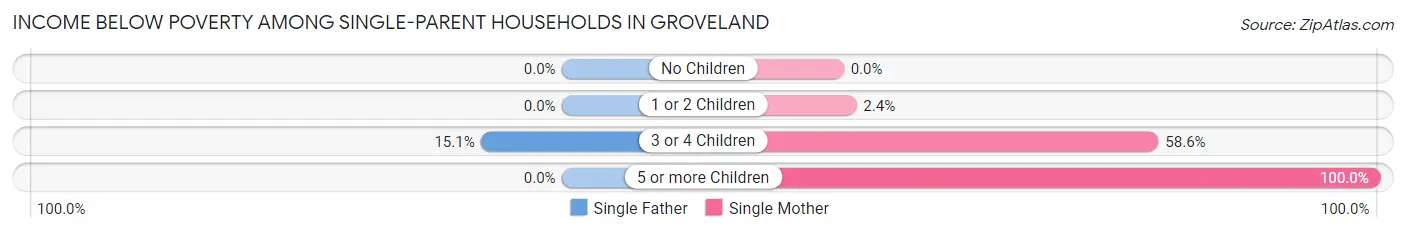
| Children | Single Father | Single Mother |
| No Children | 0 (0.0%) | 0 (0.0%) |
| 1 or 2 Children | 0 (0.0%) | 13 (2.4%) |
| 3 or 4 Children | 16 (15.1%) | 51 (58.6%) |
| 5 or more Children | 0 (0.0%) | 89 (100.0%) |
| Total | 16 (3.4%) | 153 (14.1%) |
Income Below Poverty Among Married-Couple vs Single-Parent Households in Groveland
The poverty data for Groveland shows that 38 of the married-couple family households (1.1%) and 169 of the single-parent households (10.9%) are living below the poverty level. Within the married-couple family households, those with 3 or 4 children have the highest poverty rate, with 7 households (1.8%) falling below the poverty line. Among the single-parent households, those with 5 or more children have the highest poverty rate, with 89 household (100.0%) living below poverty.
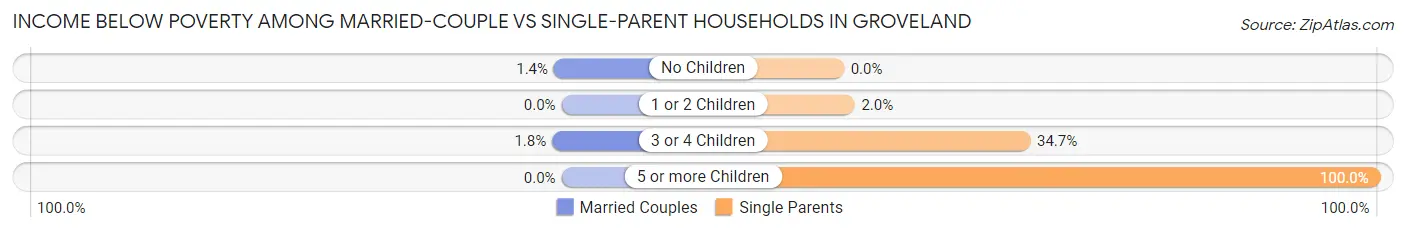
| Children | Married-Couple Families | Single-Parent Households |
| No Children | 31 (1.4%) | 0 (0.0%) |
| 1 or 2 Children | 0 (0.0%) | 13 (2.0%) |
| 3 or 4 Children | 7 (1.8%) | 67 (34.7%) |
| 5 or more Children | 0 (0.0%) | 89 (100.0%) |
| Total | 38 (1.1%) | 169 (10.9%) |
Race in Groveland
The most populous races in Groveland are White / Caucasian (10,302 | 53.5%), Hispanic or Latino (5,930 | 30.8%), and Two or more Races (3,818 | 19.8%).
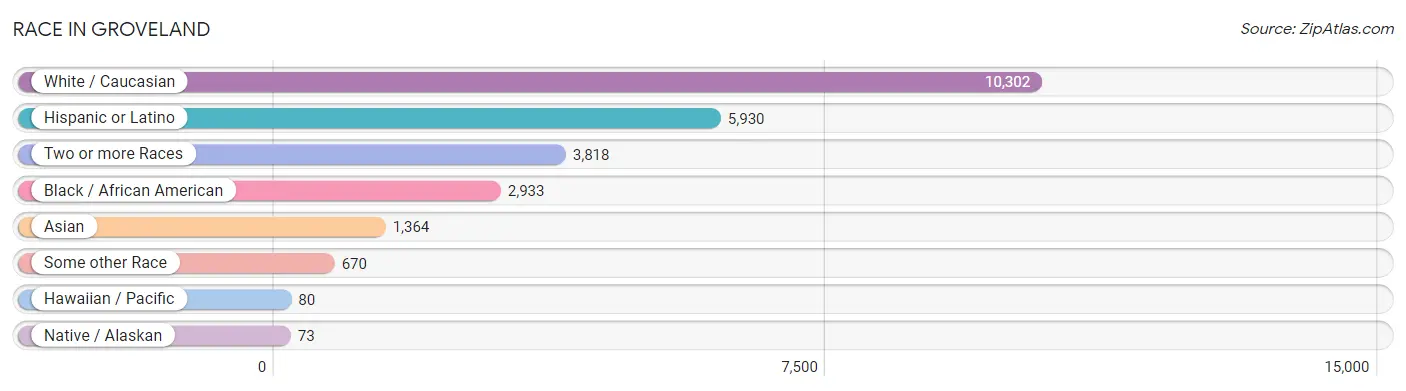
| Race | # Population | % Population |
| Asian | 1,364 | 7.1% |
| Black / African American | 2,933 | 15.2% |
| Hawaiian / Pacific | 80 | 0.4% |
| Hispanic or Latino | 5,930 | 30.8% |
| Native / Alaskan | 73 | 0.4% |
| White / Caucasian | 10,302 | 53.5% |
| Two or more Races | 3,818 | 19.8% |
| Some other Race | 670 | 3.5% |
| Total | 19,240 | 100.0% |
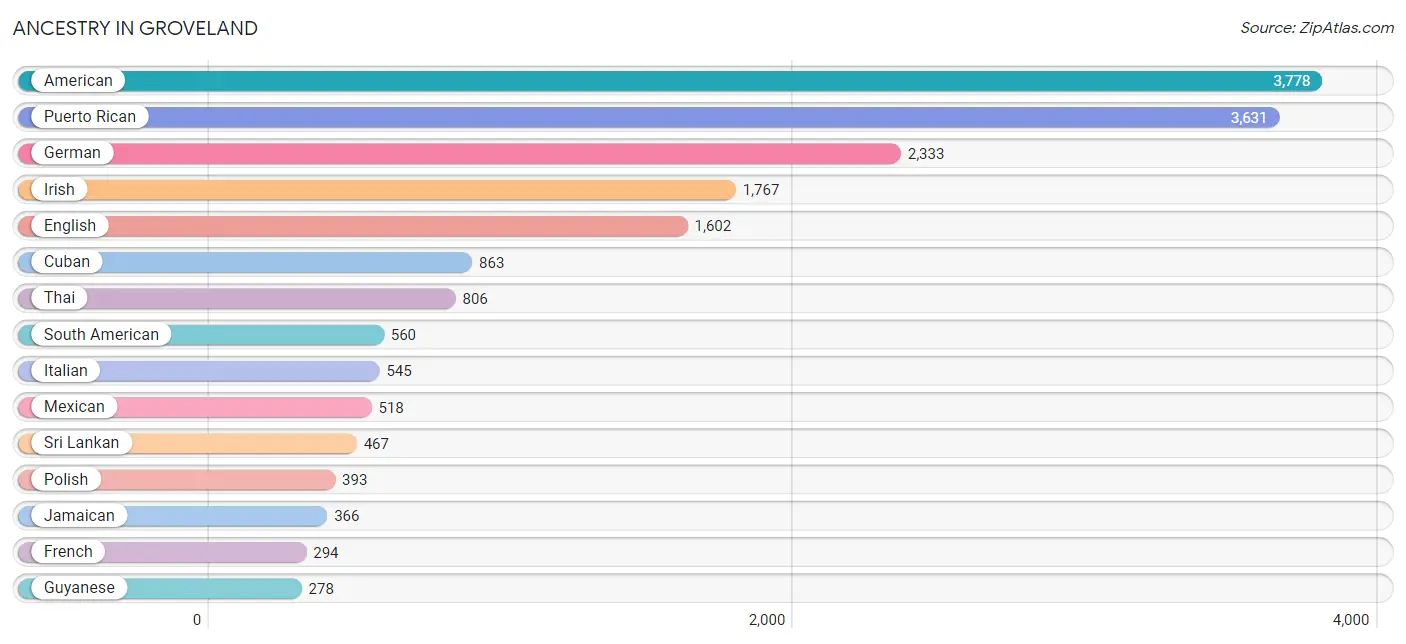
Ancestry in Groveland
The most populous ancestries reported in Groveland are American (3,778 | 19.6%), Puerto Rican (3,631 | 18.9%), German (2,333 | 12.1%), Irish (1,767 | 9.2%), and English (1,602 | 8.3%), together accounting for 68.1% of all Groveland residents.
| Ancestry | # Population | % Population |
| African | 115 | 0.6% |
| American | 3,778 | 19.6% |
| Arab | 9 | 0.1% |
| Austrian | 62 | 0.3% |
| Bhutanese | 81 | 0.4% |
| Brazilian | 49 | 0.3% |
| Burmese | 15 | 0.1% |
| Canadian | 18 | 0.1% |
| Central American | 170 | 0.9% |
| Cherokee | 61 | 0.3% |
| Chilean | 238 | 1.2% |
| Chippewa | 14 | 0.1% |
| Colombian | 49 | 0.3% |
| Costa Rican | 82 | 0.4% |
| Croatian | 12 | 0.1% |
| Cuban | 863 | 4.5% |
| Czech | 19 | 0.1% |
| Danish | 68 | 0.4% |
| Dominican | 73 | 0.4% |
| Dutch | 90 | 0.5% |
| Eastern European | 18 | 0.1% |
| English | 1,602 | 8.3% |
| European | 195 | 1.0% |
| French | 294 | 1.5% |
| French Canadian | 54 | 0.3% |
| German | 2,333 | 12.1% |
| Ghanaian | 26 | 0.1% |
| Greek | 14 | 0.1% |
| Guamanian / Chamorro | 13 | 0.1% |
| Guatemalan | 88 | 0.5% |
| Guyanese | 278 | 1.4% |
| Haitian | 80 | 0.4% |
| Indian (Asian) | 121 | 0.6% |
| Irish | 1,767 | 9.2% |
| Italian | 545 | 2.8% |
| Jamaican | 366 | 1.9% |
| Korean | 61 | 0.3% |
| Lithuanian | 27 | 0.1% |
| Mexican | 518 | 2.7% |
| Mongolian | 36 | 0.2% |
| Moroccan | 9 | 0.1% |
| Norwegian | 72 | 0.4% |
| Pennsylvania German | 43 | 0.2% |
| Peruvian | 15 | 0.1% |
| Polish | 393 | 2.0% |
| Portuguese | 29 | 0.2% |
| Puerto Rican | 3,631 | 18.9% |
| Russian | 131 | 0.7% |
| Scandinavian | 62 | 0.3% |
| Scottish | 62 | 0.3% |
| Slovak | 246 | 1.3% |
| South American | 560 | 2.9% |
| Spanish | 34 | 0.2% |
| Sri Lankan | 467 | 2.4% |
| Subsaharan African | 148 | 0.8% |
| Swedish | 64 | 0.3% |
| Thai | 806 | 4.2% |
| Trinidadian and Tobagonian | 71 | 0.4% |
| Turkish | 14 | 0.1% |
| Ukrainian | 24 | 0.1% |
| Venezuelan | 258 | 1.3% |
| Welsh | 66 | 0.3% |
| West Indian | 41 | 0.2% | View All 63 Rows |
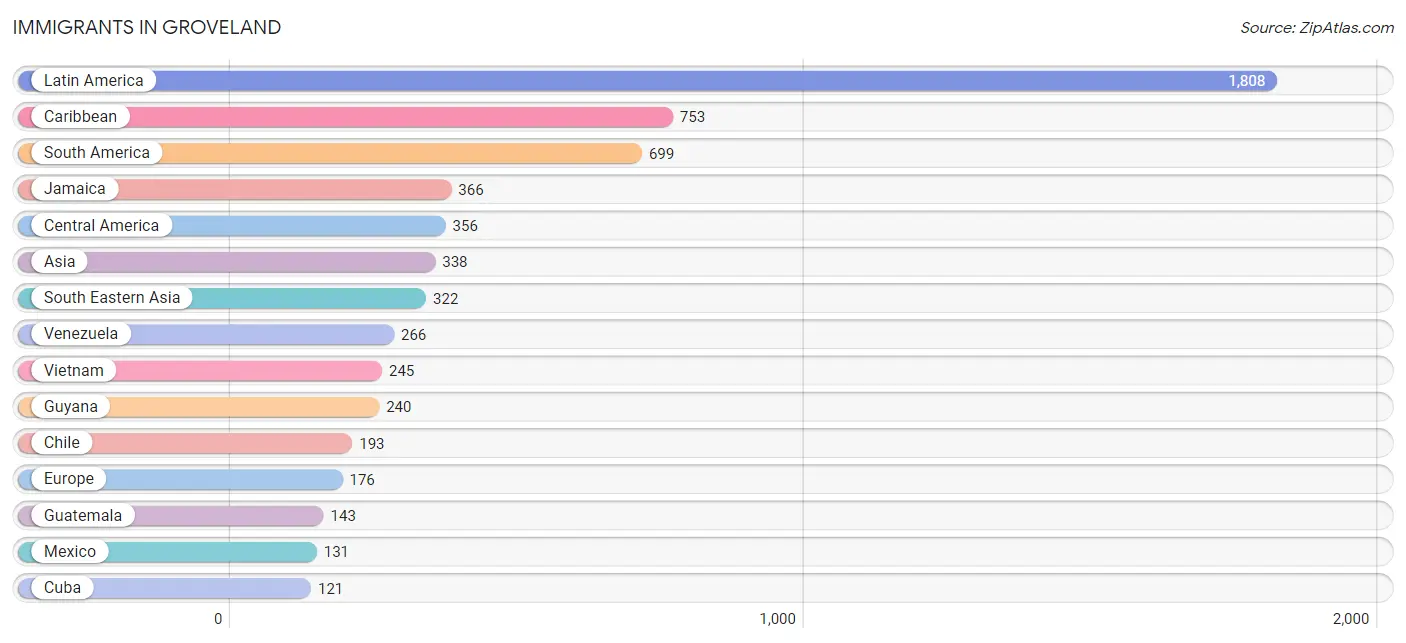
Immigrants in Groveland
The most numerous immigrant groups reported in Groveland came from Latin America (1,808 | 9.4%), Caribbean (753 | 3.9%), South America (699 | 3.6%), Jamaica (366 | 1.9%), and Central America (356 | 1.8%), together accounting for 20.7% of all Groveland residents.
| Immigration Origin | # Population | % Population |
| Africa | 35 | 0.2% |
| Asia | 338 | 1.8% |
| Caribbean | 753 | 3.9% |
| Central America | 356 | 1.8% |
| Chile | 193 | 1.0% |
| China | 16 | 0.1% |
| Costa Rica | 82 | 0.4% |
| Cuba | 121 | 0.6% |
| Eastern Asia | 16 | 0.1% |
| Eastern Europe | 39 | 0.2% |
| England | 42 | 0.2% |
| Europe | 176 | 0.9% |
| Germany | 26 | 0.1% |
| Ghana | 26 | 0.1% |
| Guatemala | 143 | 0.7% |
| Guyana | 240 | 1.3% |
| Haiti | 40 | 0.2% |
| Italy | 7 | 0.0% |
| Jamaica | 366 | 1.9% |
| Latin America | 1,808 | 9.4% |
| Malaysia | 5 | 0.0% |
| Mexico | 131 | 0.7% |
| Morocco | 9 | 0.1% |
| Netherlands | 24 | 0.1% |
| Northern Africa | 9 | 0.1% |
| Northern Europe | 80 | 0.4% |
| Philippines | 61 | 0.3% |
| Poland | 39 | 0.2% |
| South America | 699 | 3.6% |
| South Eastern Asia | 322 | 1.7% |
| Southern Europe | 7 | 0.0% |
| St. Vincent and the Grenadines | 3 | 0.0% |
| Sweden | 13 | 0.1% |
| Trinidad and Tobago | 71 | 0.4% |
| Venezuela | 266 | 1.4% |
| Vietnam | 245 | 1.3% |
| Western Africa | 26 | 0.1% |
| Western Europe | 50 | 0.3% | View All 38 Rows |
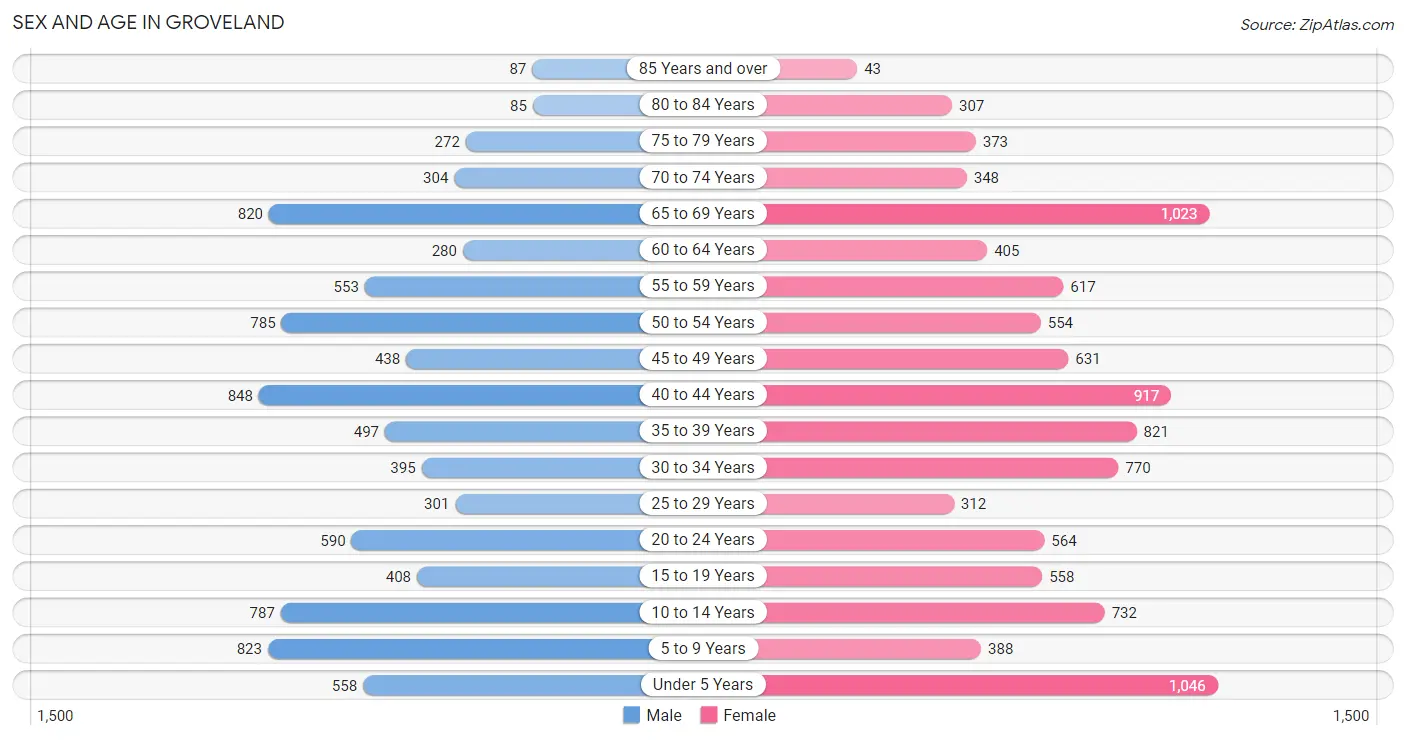
Sex and Age in Groveland
Sex and Age in Groveland
The most populous age groups in Groveland are 40 to 44 Years (848 | 9.6%) for men and Under 5 Years (1,046 | 10.1%) for women.
| Age Bracket | Male | Female |
| Under 5 Years | 558 (6.3%) | 1,046 (10.1%) |
| 5 to 9 Years | 823 (9.3%) | 388 (3.7%) |
| 10 to 14 Years | 787 (8.9%) | 732 (7.0%) |
| 15 to 19 Years | 408 (4.6%) | 558 (5.4%) |
| 20 to 24 Years | 590 (6.7%) | 564 (5.4%) |
| 25 to 29 Years | 301 (3.4%) | 312 (3.0%) |
| 30 to 34 Years | 395 (4.5%) | 770 (7.4%) |
| 35 to 39 Years | 497 (5.6%) | 821 (7.9%) |
| 40 to 44 Years | 848 (9.6%) | 917 (8.8%) |
| 45 to 49 Years | 438 (5.0%) | 631 (6.1%) |
| 50 to 54 Years | 785 (8.9%) | 554 (5.3%) |
| 55 to 59 Years | 553 (6.3%) | 617 (5.9%) |
| 60 to 64 Years | 280 (3.2%) | 405 (3.9%) |
| 65 to 69 Years | 820 (9.3%) | 1,023 (9.8%) |
| 70 to 74 Years | 304 (3.4%) | 348 (3.3%) |
| 75 to 79 Years | 272 (3.1%) | 373 (3.6%) |
| 80 to 84 Years | 85 (1.0%) | 307 (2.9%) |
| 85 Years and over | 87 (1.0%) | 43 (0.4%) |
| Total | 8,831 (100.0%) | 10,409 (100.0%) |
Families and Households in Groveland
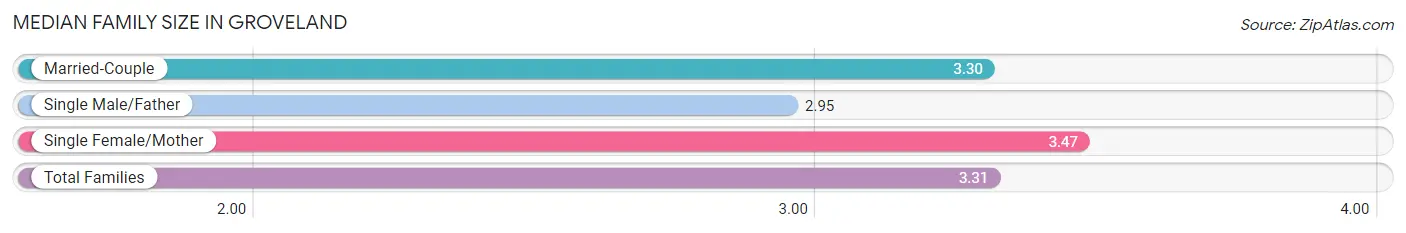
Median Family Size in Groveland
The median family size in Groveland is 3.31 persons per family, with single female/mother families (1,089 | 22.1%) accounting for the largest median family size of 3.47 persons per family. On the other hand, single male/father families (466 | 9.5%) represent the smallest median family size with 2.95 persons per family.
| Family Type | # Families | Family Size |
| Married-Couple | 3,376 (68.5%) | 3.30 |
| Single Male/Father | 466 (9.5%) | 2.95 |
| Single Female/Mother | 1,089 (22.1%) | 3.47 |
| Total Families | 4,931 (100.0%) | 3.31 |
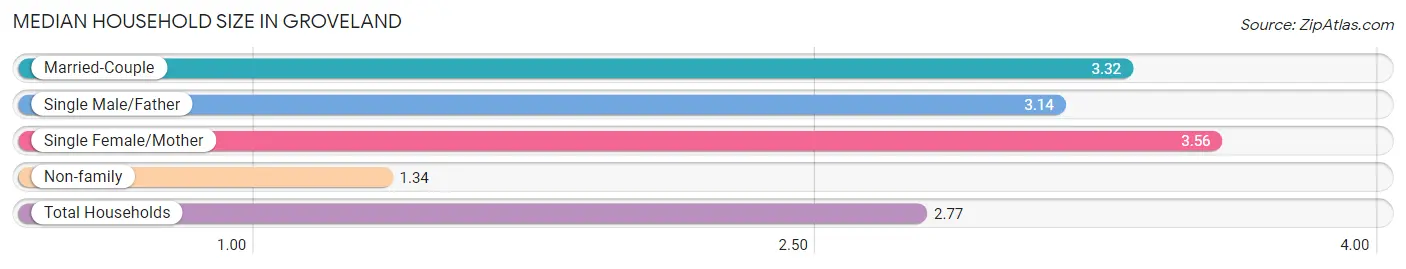
Median Household Size in Groveland
The median household size in Groveland is 2.77 persons per household, with single female/mother households (1,089 | 15.7%) accounting for the largest median household size of 3.56 persons per household. non-family households (1,993 | 28.8%) represent the smallest median household size with 1.34 persons per household.
| Household Type | # Households | Household Size |
| Married-Couple | 3,376 (48.8%) | 3.32 |
| Single Male/Father | 466 (6.7%) | 3.14 |
| Single Female/Mother | 1,089 (15.7%) | 3.56 |
| Non-family | 1,993 (28.8%) | 1.34 |
| Total Households | 6,924 (100.0%) | 2.77 |
Household Size by Marriage Status in Groveland
Out of a total of 6,924 households in Groveland, 4,931 (71.2%) are family households, while 1,993 (28.8%) are nonfamily households. The most numerous type of family households are 2-person households, comprising 2,272, and the most common type of nonfamily households are 1-person households, comprising 1,620.
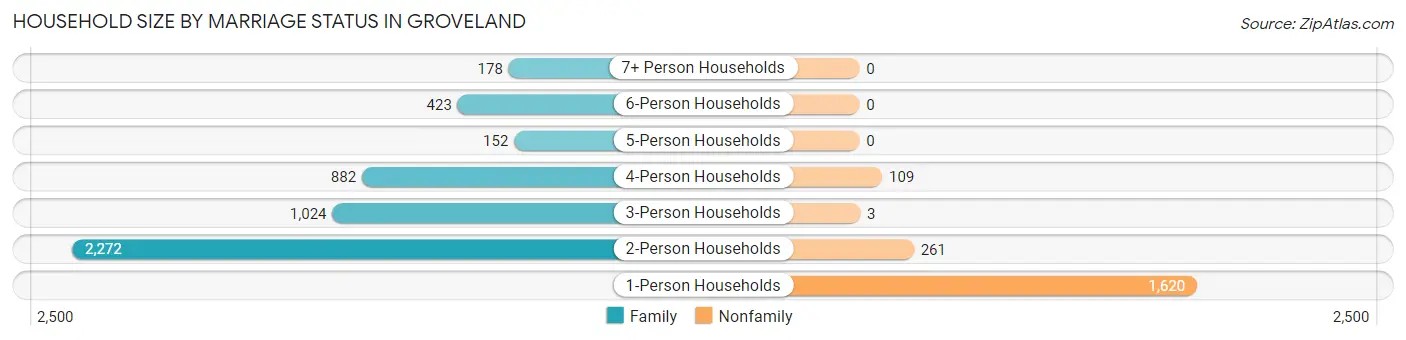
| Household Size | Family Households | Nonfamily Households |
| 1-Person Households | - | 1,620 (23.4%) |
| 2-Person Households | 2,272 (32.8%) | 261 (3.8%) |
| 3-Person Households | 1,024 (14.8%) | 3 (0.0%) |
| 4-Person Households | 882 (12.7%) | 109 (1.6%) |
| 5-Person Households | 152 (2.2%) | 0 (0.0%) |
| 6-Person Households | 423 (6.1%) | 0 (0.0%) |
| 7+ Person Households | 178 (2.6%) | 0 (0.0%) |
| Total | 4,931 (71.2%) | 1,993 (28.8%) |
Female Fertility in Groveland
Fertility by Age in Groveland
Average fertility rate in Groveland is 64.0 births per 1,000 women. Women in the age bracket of 20 to 34 years have the highest fertility rate with 173.0 births per 1,000 women. Women in the age bracket of 20 to 34 years acount for 93.1% of all women with births.
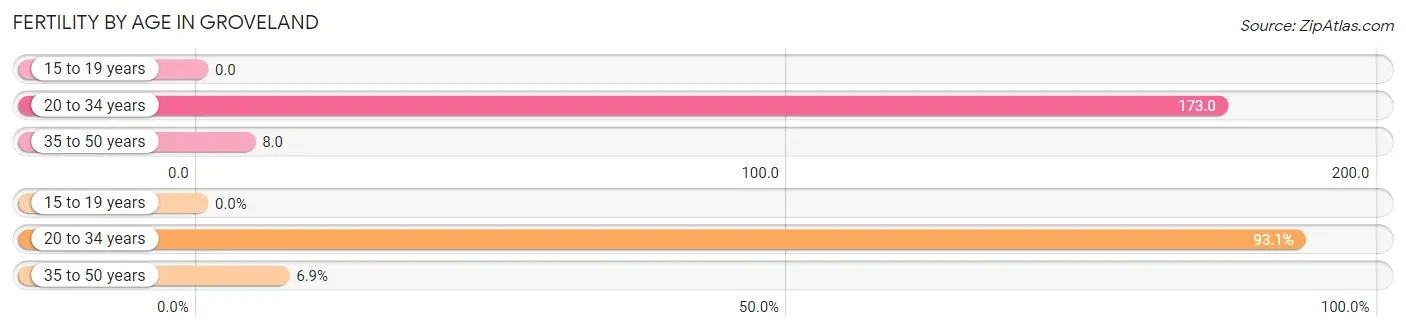
| Age Bracket | Women with Births | Births / 1,000 Women |
| 15 to 19 years | 0 (0.0%) | 0.0 |
| 20 to 34 years | 284 (93.1%) | 173.0 |
| 35 to 50 years | 21 (6.9%) | 8.0 |
| Total | 305 (100.0%) | 64.0 |
Fertility by Age by Marriage Status in Groveland
62.3% of women with births (305) in Groveland are married. The highest percentage of unmarried women with births falls into 20 to 34 years age bracket with 40.5% of them unmarried at the time of birth, while the lowest percentage of unmarried women with births belong to 35 to 50 years age bracket with 0.0% of them unmarried.
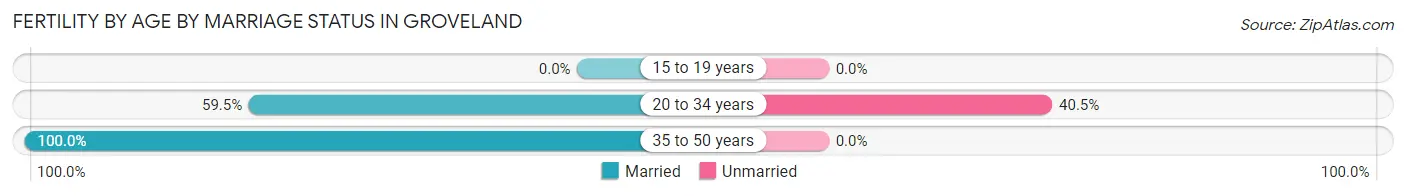
| Age Bracket | Married | Unmarried |
| 15 to 19 years | 0 (0.0%) | 0 (0.0%) |
| 20 to 34 years | 169 (59.5%) | 115 (40.5%) |
| 35 to 50 years | 21 (100.0%) | 0 (0.0%) |
| Total | 190 (62.3%) | 115 (37.7%) |
Fertility by Education in Groveland
Average fertility rate in Groveland is 64.0 births per 1,000 women. Women with the education attainment of less than high school have the highest fertility rate of 140.0 births per 1,000 women, while women with the education attainment of college or associate's degree have the lowest fertility at 20.0 births per 1,000 women. Women with the education attainment of high school diploma represent 32.8% of all women with births.
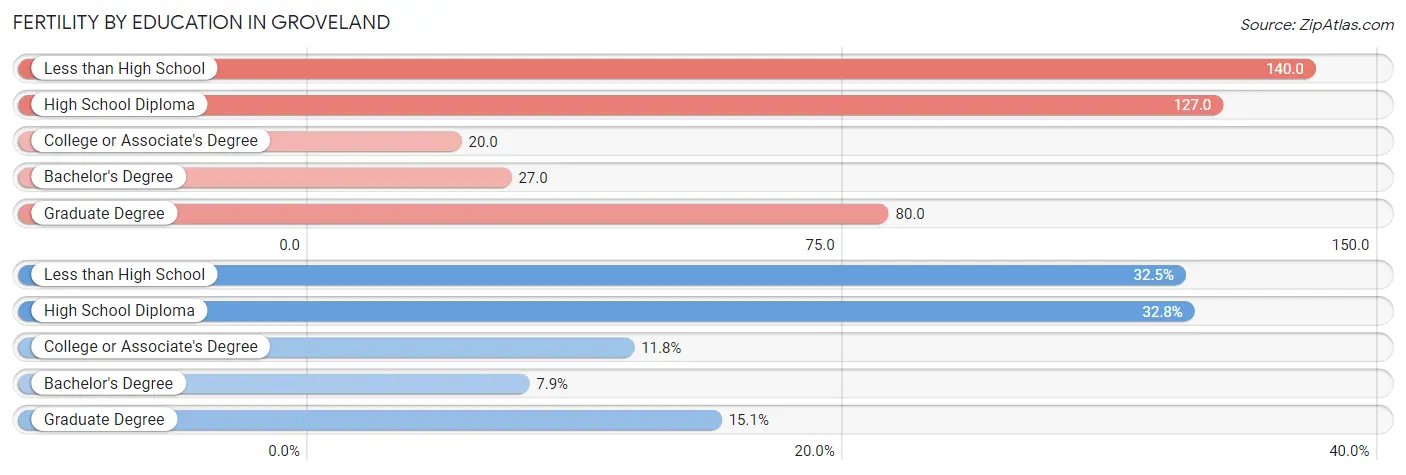
| Educational Attainment | Women with Births | Births / 1,000 Women |
| Less than High School | 99 (32.5%) | 140.0 |
| High School Diploma | 100 (32.8%) | 127.0 |
| College or Associate's Degree | 36 (11.8%) | 20.0 |
| Bachelor's Degree | 24 (7.9%) | 27.0 |
| Graduate Degree | 46 (15.1%) | 80.0 |
| Total | 305 (100.0%) | 64.0 |
Fertility by Education by Marriage Status in Groveland
37.7% of women with births in Groveland are unmarried. Women with the educational attainment of less than high school are most likely to be married with 100.0% of them married at childbirth, while women with the educational attainment of high school diploma are least likely to be married with 100.0% of them unmarried at childbirth.
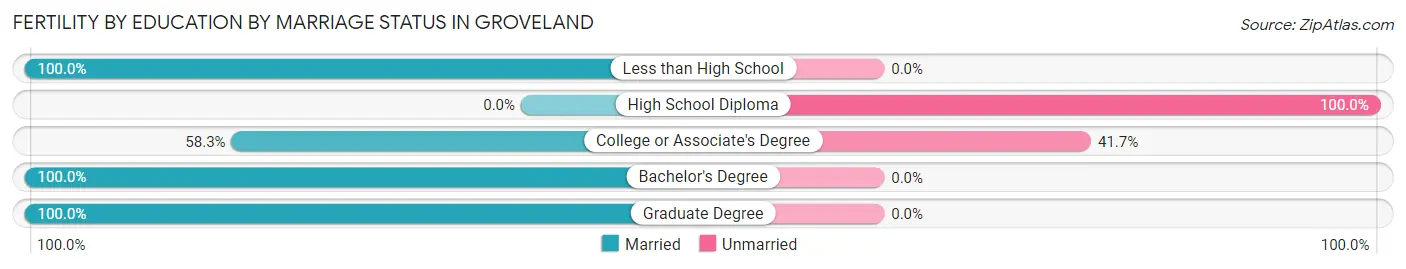
| Educational Attainment | Married | Unmarried |
| Less than High School | 99 (100.0%) | 0 (0.0%) |
| High School Diploma | 0 (0.0%) | 100 (100.0%) |
| College or Associate's Degree | 21 (58.3%) | 15 (41.7%) |
| Bachelor's Degree | 24 (100.0%) | 0 (0.0%) |
| Graduate Degree | 46 (100.0%) | 0 (0.0%) |
| Total | 190 (62.3%) | 115 (37.7%) |
Employment Characteristics in Groveland
Employment by Class of Employer in Groveland
Among the 8,536 employed individuals in Groveland, private company employees (5,868 | 68.7%), local government employees (923 | 10.8%), and not-for-profit organizations (487 | 5.7%) make up the most common classes of employment.
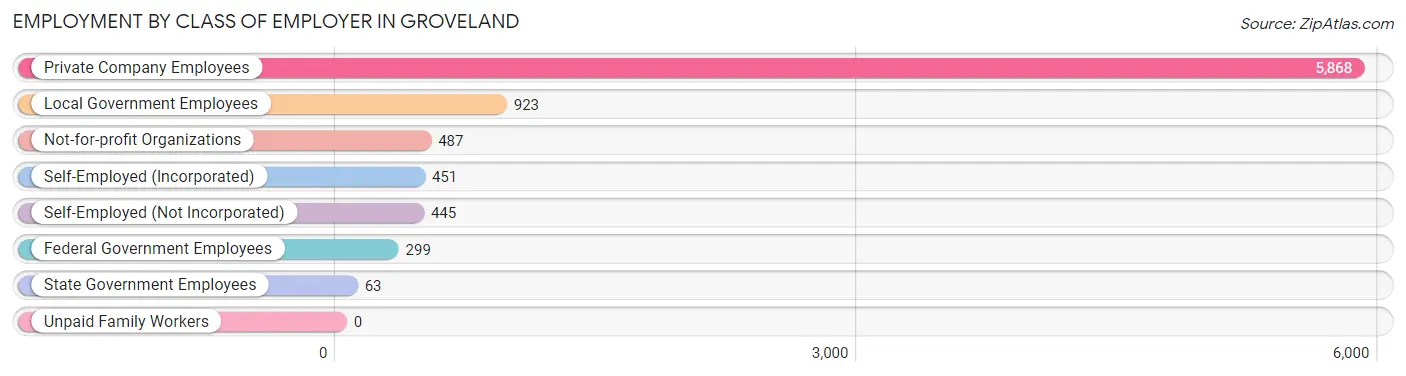
| Employer Class | # Employees | % Employees |
| Private Company Employees | 5,868 | 68.7% |
| Self-Employed (Incorporated) | 451 | 5.3% |
| Self-Employed (Not Incorporated) | 445 | 5.2% |
| Not-for-profit Organizations | 487 | 5.7% |
| Local Government Employees | 923 | 10.8% |
| State Government Employees | 63 | 0.7% |
| Federal Government Employees | 299 | 3.5% |
| Unpaid Family Workers | 0 | 0.0% |
| Total | 8,536 | 100.0% |
Employment Status by Age in Groveland
According to the labor force statistics for Groveland, out of the total population over 16 years of age (14,767), 61.6% or 9,096 individuals are in the labor force, with 6.0% or 546 of them unemployed. The age group with the highest labor force participation rate is 25 to 29 years, with 95.1% or 583 individuals in the labor force. Within the labor force, the 16 to 19 years age range has the highest percentage of unemployed individuals, with 29.7% or 91 of them being unemployed.
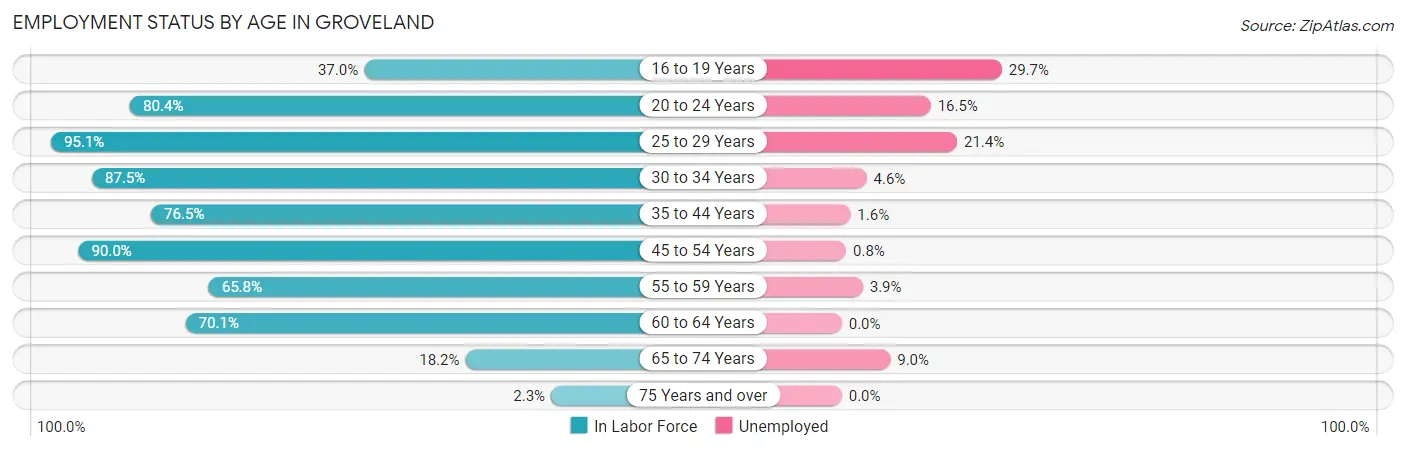
| Age Bracket | In Labor Force | Unemployed |
| 16 to 19 Years | 306 (37.0%) | 91 (29.7%) |
| 20 to 24 Years | 928 (80.4%) | 153 (16.5%) |
| 25 to 29 Years | 583 (95.1%) | 125 (21.4%) |
| 30 to 34 Years | 1,019 (87.5%) | 47 (4.6%) |
| 35 to 44 Years | 2,358 (76.5%) | 38 (1.6%) |
| 45 to 54 Years | 2,167 (90.0%) | 17 (0.8%) |
| 55 to 59 Years | 770 (65.8%) | 30 (3.9%) |
| 60 to 64 Years | 480 (70.1%) | 0 (0.0%) |
| 65 to 74 Years | 454 (18.2%) | 41 (9.0%) |
| 75 Years and over | 27 (2.3%) | 0 (0.0%) |
| Total | 9,096 (61.6%) | 546 (6.0%) |
Employment Status by Educational Attainment in Groveland
According to labor force statistics for Groveland, 80.8% of individuals (7,372) out of the total population between 25 and 64 years of age (9,124) are in the labor force, with 3.5% or 258 of them being unemployed. The group with the highest labor force participation rate are those with the educational attainment of bachelor's degree or higher, with 83.0% or 2,541 individuals in the labor force. Within the labor force, individuals with high school diploma education have the highest percentage of unemployment, with 9.6% or 157 of them being unemployed.
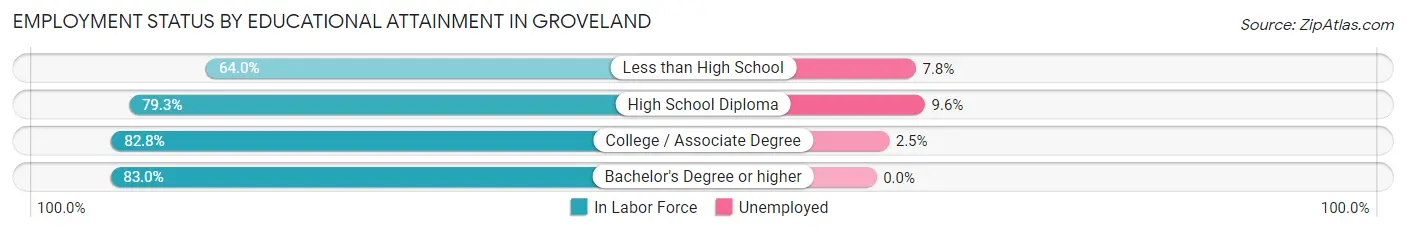
| Educational Attainment | In Labor Force | Unemployed |
| Less than High School | 384 (64.0%) | 47 (7.8%) |
| High School Diploma | 1,634 (79.3%) | 198 (9.6%) |
| College / Associate Degree | 2,817 (82.8%) | 85 (2.5%) |
| Bachelor's Degree or higher | 2,541 (83.0%) | 0 (0.0%) |
| Total | 7,372 (80.8%) | 319 (3.5%) |
Employment Occupations by Sex in Groveland
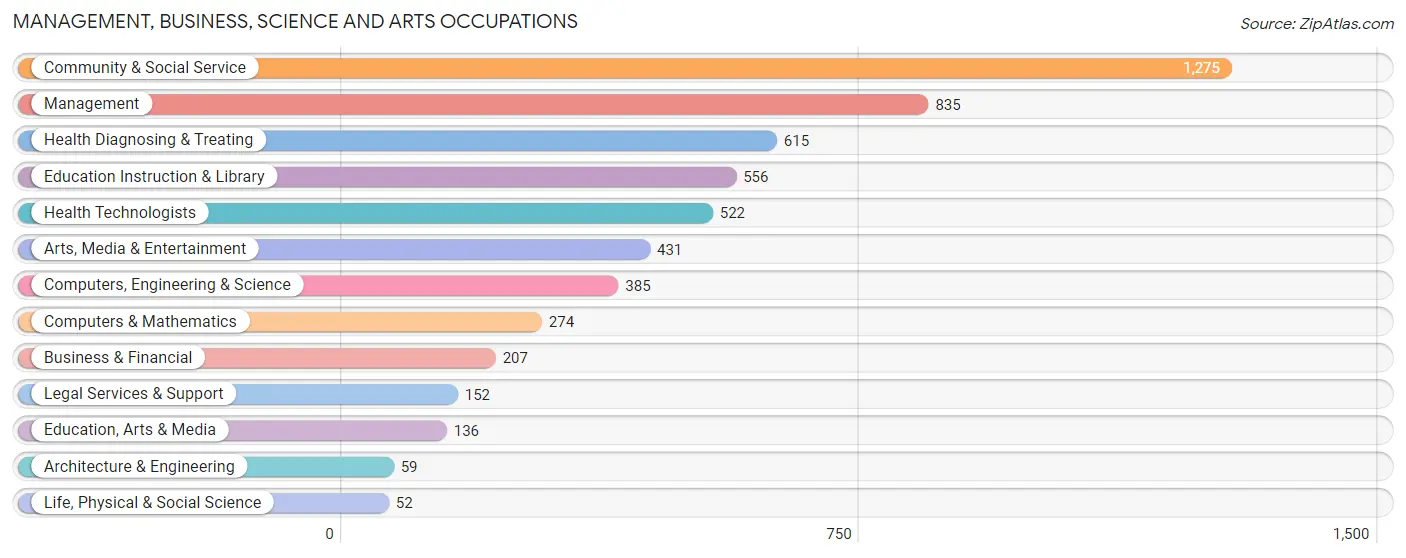
Management, Business, Science and Arts Occupations
The most common Management, Business, Science and Arts occupations in Groveland are Community & Social Service (1,275 | 15.0%), Management (835 | 9.8%), Health Diagnosing & Treating (615 | 7.2%), Education Instruction & Library (556 | 6.6%), and Health Technologists (522 | 6.1%).
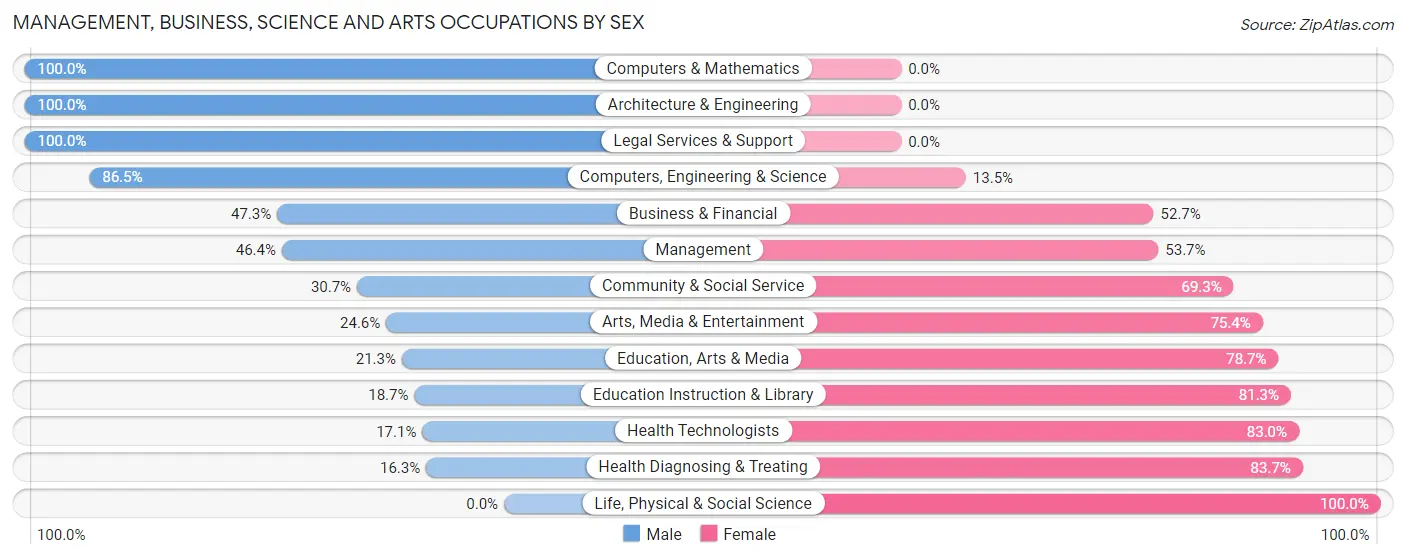
Management, Business, Science and Arts Occupations by Sex
Within the Management, Business, Science and Arts occupations in Groveland, the most male-oriented occupations are Computers & Mathematics (100.0%), Architecture & Engineering (100.0%), and Legal Services & Support (100.0%), while the most female-oriented occupations are Life, Physical & Social Science (100.0%), Health Diagnosing & Treating (83.7%), and Health Technologists (83.0%).
| Occupation | Male | Female |
| Management | 387 (46.4%) | 448 (53.6%) |
| Business & Financial | 98 (47.3%) | 109 (52.7%) |
| Computers, Engineering & Science | 333 (86.5%) | 52 (13.5%) |
| Computers & Mathematics | 274 (100.0%) | 0 (0.0%) |
| Architecture & Engineering | 59 (100.0%) | 0 (0.0%) |
| Life, Physical & Social Science | 0 (0.0%) | 52 (100.0%) |
| Community & Social Service | 391 (30.7%) | 884 (69.3%) |
| Education, Arts & Media | 29 (21.3%) | 107 (78.7%) |
| Legal Services & Support | 152 (100.0%) | 0 (0.0%) |
| Education Instruction & Library | 104 (18.7%) | 452 (81.3%) |
| Arts, Media & Entertainment | 106 (24.6%) | 325 (75.4%) |
| Health Diagnosing & Treating | 100 (16.3%) | 515 (83.7%) |
| Health Technologists | 89 (17.1%) | 433 (83.0%) |
| Total (Category) | 1,309 (39.5%) | 2,008 (60.5%) |
| Total (Overall) | 3,949 (46.5%) | 4,536 (53.5%) |
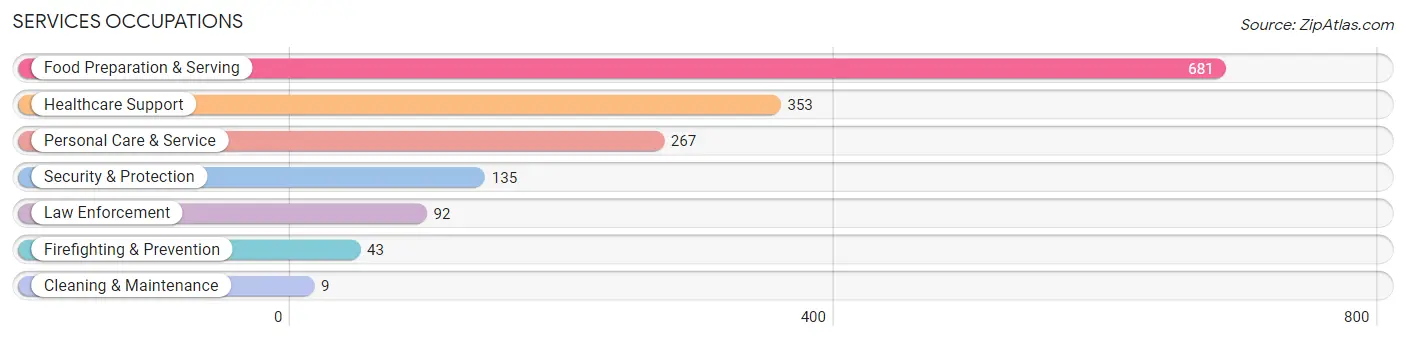
Services Occupations
The most common Services occupations in Groveland are Food Preparation & Serving (681 | 8.0%), Healthcare Support (353 | 4.2%), Personal Care & Service (267 | 3.2%), Security & Protection (135 | 1.6%), and Law Enforcement (92 | 1.1%).
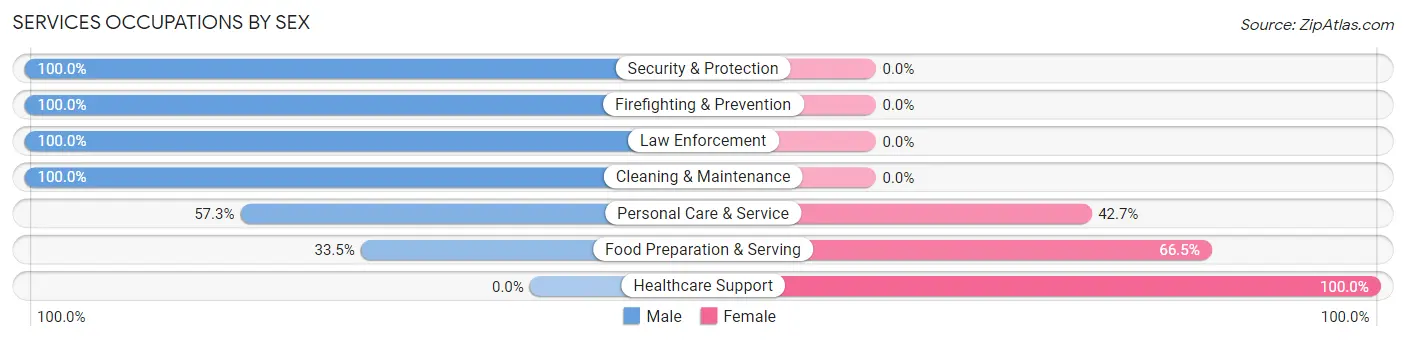
Services Occupations by Sex
Within the Services occupations in Groveland, the most male-oriented occupations are Security & Protection (100.0%), Firefighting & Prevention (100.0%), and Law Enforcement (100.0%), while the most female-oriented occupations are Healthcare Support (100.0%), Food Preparation & Serving (66.5%), and Personal Care & Service (42.7%).
| Occupation | Male | Female |
| Healthcare Support | 0 (0.0%) | 353 (100.0%) |
| Security & Protection | 135 (100.0%) | 0 (0.0%) |
| Firefighting & Prevention | 43 (100.0%) | 0 (0.0%) |
| Law Enforcement | 92 (100.0%) | 0 (0.0%) |
| Food Preparation & Serving | 228 (33.5%) | 453 (66.5%) |
| Cleaning & Maintenance | 9 (100.0%) | 0 (0.0%) |
| Personal Care & Service | 153 (57.3%) | 114 (42.7%) |
| Total (Category) | 525 (36.3%) | 920 (63.7%) |
| Total (Overall) | 3,949 (46.5%) | 4,536 (53.5%) |
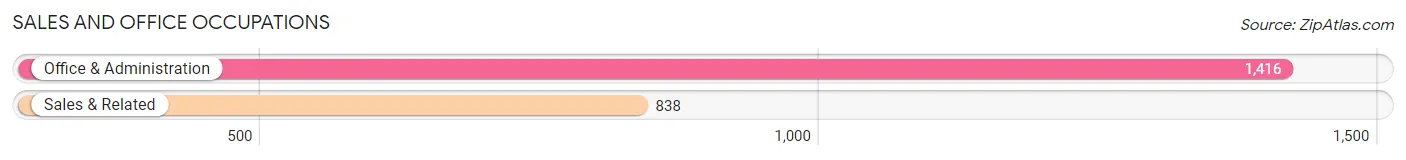
Sales and Office Occupations
The most common Sales and Office occupations in Groveland are Office & Administration (1,416 | 16.7%), and Sales & Related (838 | 9.9%).
Sales and Office Occupations by Sex
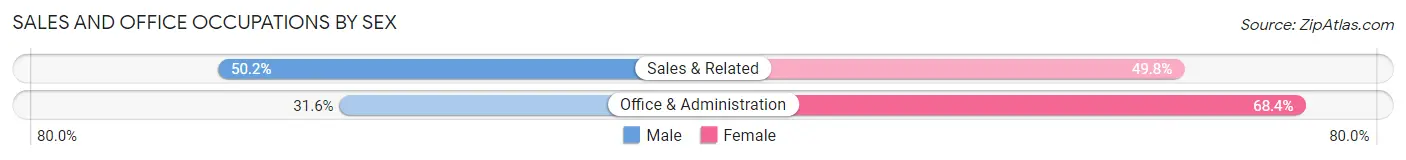
| Occupation | Male | Female |
| Sales & Related | 421 (50.2%) | 417 (49.8%) |
| Office & Administration | 447 (31.6%) | 969 (68.4%) |
| Total (Category) | 868 (38.5%) | 1,386 (61.5%) |
| Total (Overall) | 3,949 (46.5%) | 4,536 (53.5%) |
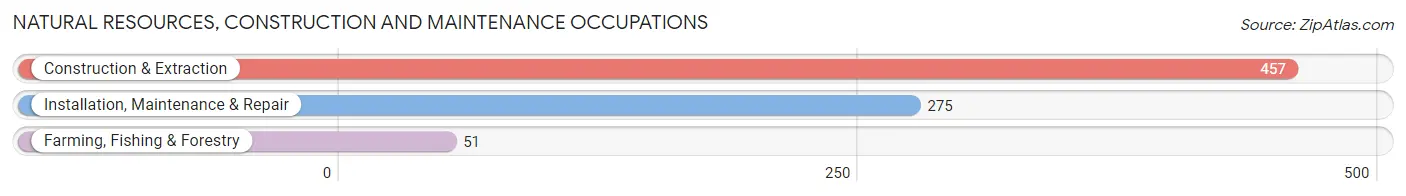
Natural Resources, Construction and Maintenance Occupations
The most common Natural Resources, Construction and Maintenance occupations in Groveland are Construction & Extraction (457 | 5.4%), Installation, Maintenance & Repair (275 | 3.2%), and Farming, Fishing & Forestry (51 | 0.6%).
Natural Resources, Construction and Maintenance Occupations by Sex
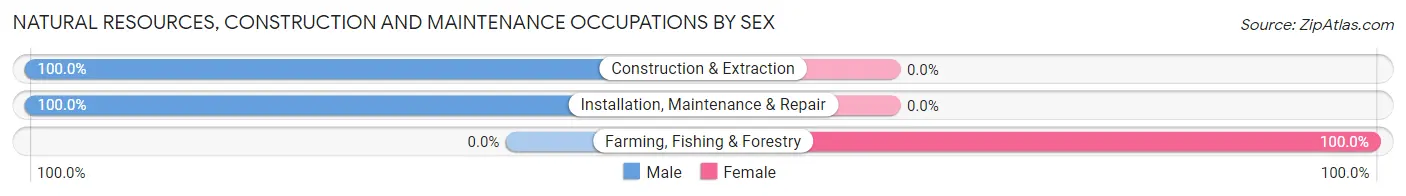
| Occupation | Male | Female |
| Farming, Fishing & Forestry | 0 (0.0%) | 51 (100.0%) |
| Construction & Extraction | 457 (100.0%) | 0 (0.0%) |
| Installation, Maintenance & Repair | 275 (100.0%) | 0 (0.0%) |
| Total (Category) | 732 (93.5%) | 51 (6.5%) |
| Total (Overall) | 3,949 (46.5%) | 4,536 (53.5%) |
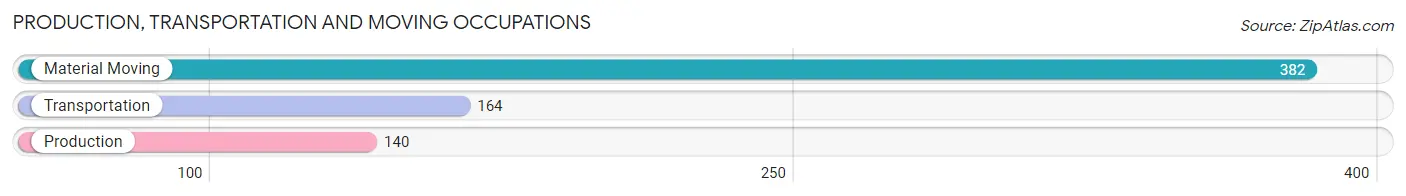
Production, Transportation and Moving Occupations
The most common Production, Transportation and Moving occupations in Groveland are Material Moving (382 | 4.5%), Transportation (164 | 1.9%), and Production (140 | 1.7%).
Production, Transportation and Moving Occupations by Sex
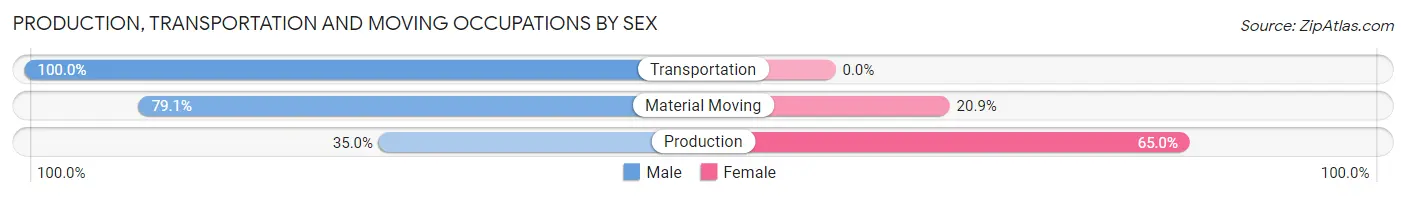
| Occupation | Male | Female |
| Production | 49 (35.0%) | 91 (65.0%) |
| Transportation | 164 (100.0%) | 0 (0.0%) |
| Material Moving | 302 (79.1%) | 80 (20.9%) |
| Total (Category) | 515 (75.1%) | 171 (24.9%) |
| Total (Overall) | 3,949 (46.5%) | 4,536 (53.5%) |
Employment Industries by Sex in Groveland
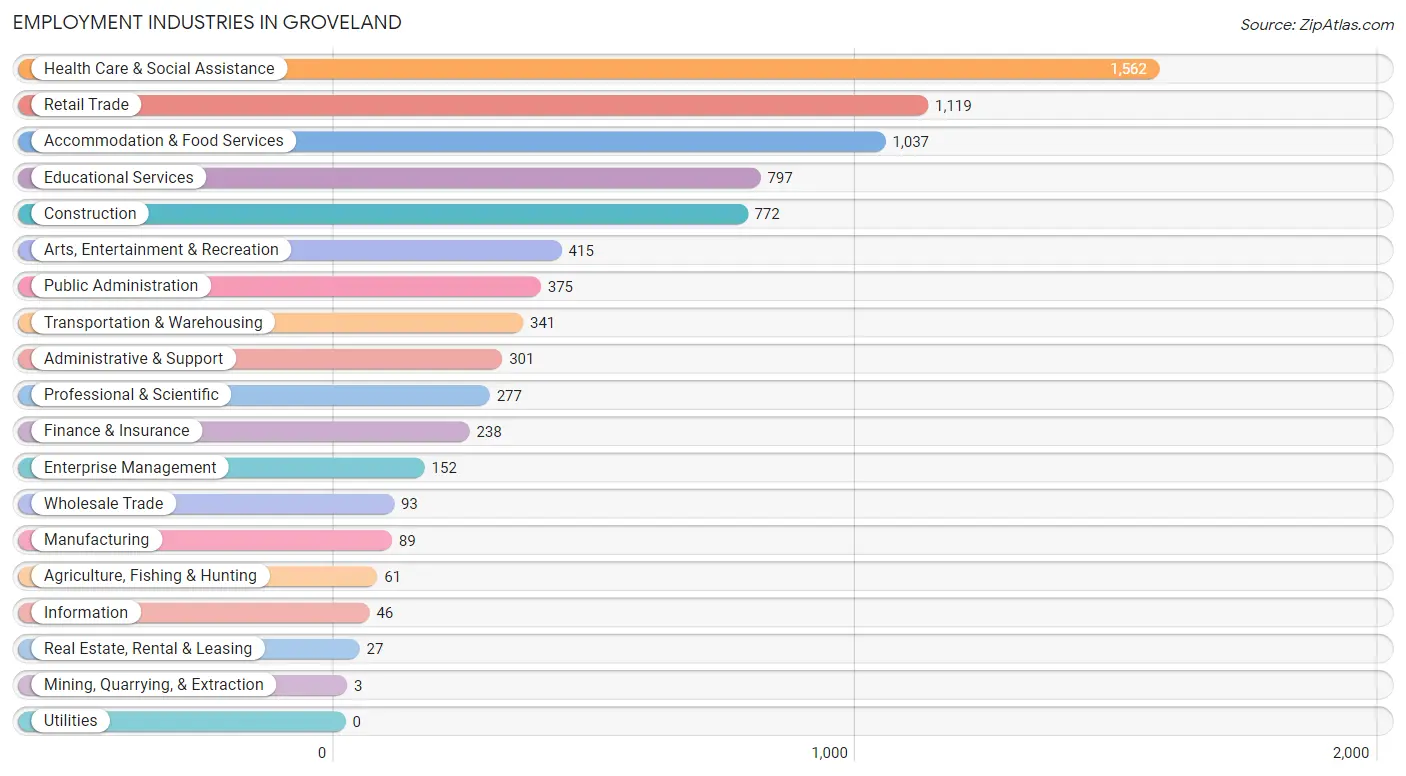
Employment Industries in Groveland
The major employment industries in Groveland include Health Care & Social Assistance (1,562 | 18.4%), Retail Trade (1,119 | 13.2%), Accommodation & Food Services (1,037 | 12.2%), Educational Services (797 | 9.4%), and Construction (772 | 9.1%).
Employment Industries by Sex in Groveland
The Groveland industries that see more men than women are Mining, Quarrying, & Extraction (100.0%), Enterprise Management (100.0%), and Construction (93.4%), whereas the industries that tend to have a higher number of women are Agriculture, Fishing & Hunting (100.0%), Real Estate, Rental & Leasing (100.0%), and Educational Services (83.2%).
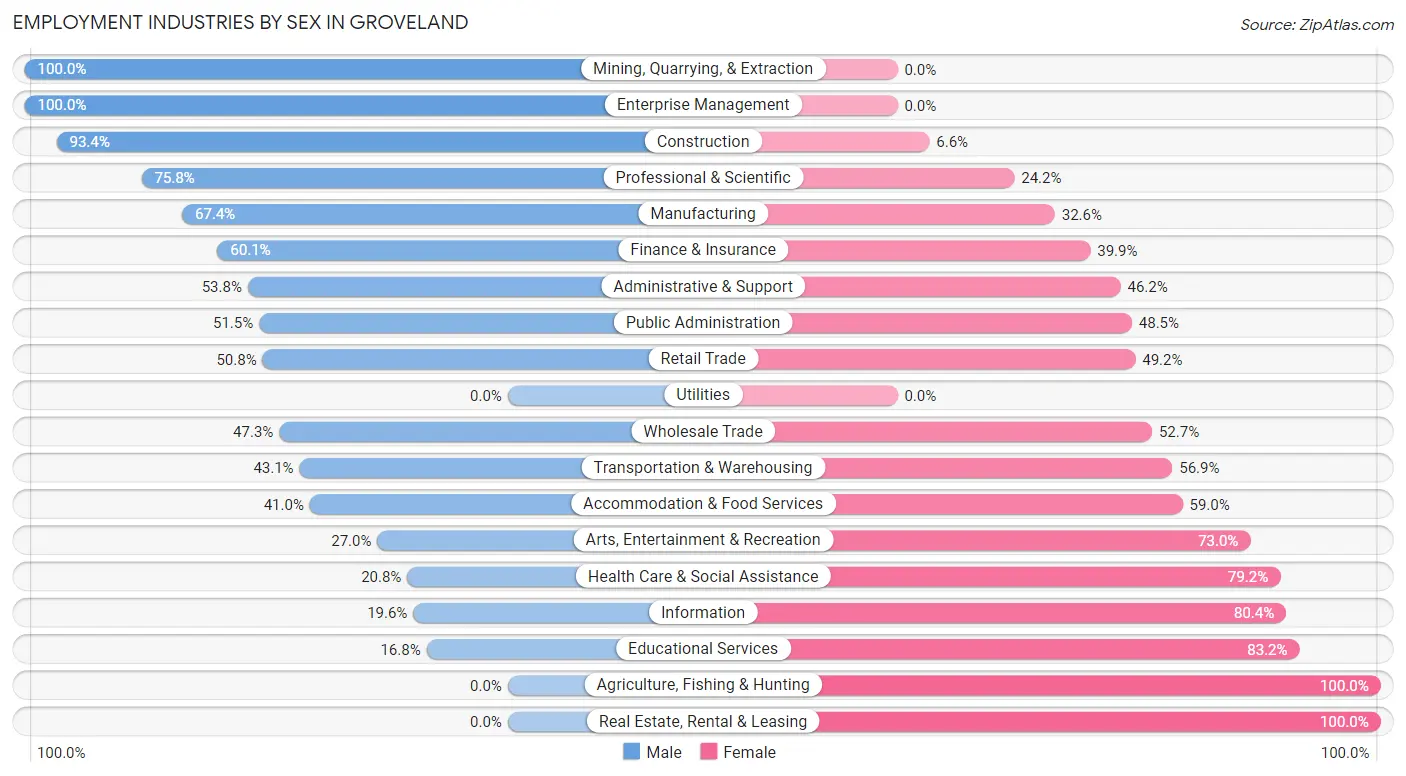
| Industry | Male | Female |
| Agriculture, Fishing & Hunting | 0 (0.0%) | 61 (100.0%) |
| Mining, Quarrying, & Extraction | 3 (100.0%) | 0 (0.0%) |
| Construction | 721 (93.4%) | 51 (6.6%) |
| Manufacturing | 60 (67.4%) | 29 (32.6%) |
| Wholesale Trade | 44 (47.3%) | 49 (52.7%) |
| Retail Trade | 568 (50.8%) | 551 (49.2%) |
| Transportation & Warehousing | 147 (43.1%) | 194 (56.9%) |
| Utilities | 0 (0.0%) | 0 (0.0%) |
| Information | 9 (19.6%) | 37 (80.4%) |
| Finance & Insurance | 143 (60.1%) | 95 (39.9%) |
| Real Estate, Rental & Leasing | 0 (0.0%) | 27 (100.0%) |
| Professional & Scientific | 210 (75.8%) | 67 (24.2%) |
| Enterprise Management | 152 (100.0%) | 0 (0.0%) |
| Administrative & Support | 162 (53.8%) | 139 (46.2%) |
| Educational Services | 134 (16.8%) | 663 (83.2%) |
| Health Care & Social Assistance | 325 (20.8%) | 1,237 (79.2%) |
| Arts, Entertainment & Recreation | 112 (27.0%) | 303 (73.0%) |
| Accommodation & Food Services | 425 (41.0%) | 612 (59.0%) |
| Public Administration | 193 (51.5%) | 182 (48.5%) |
| Total | 3,949 (46.5%) | 4,536 (53.5%) |
Education in Groveland
School Enrollment in Groveland
The most common levels of schooling among the 4,569 students in Groveland are middle school (1,120 | 24.5%), elementary school (1,031 | 22.6%), and high school (768 | 16.8%).
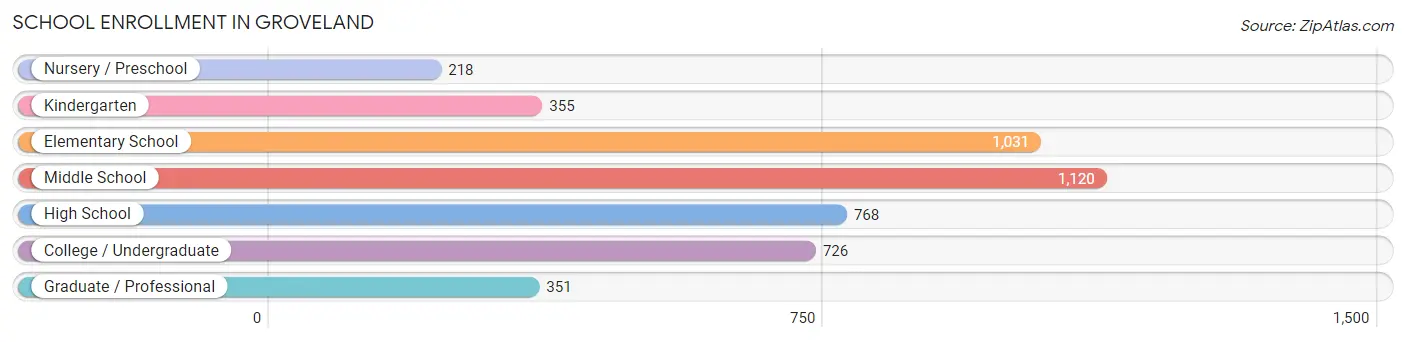
| School Level | # Students | % Students |
| Nursery / Preschool | 218 | 4.8% |
| Kindergarten | 355 | 7.8% |
| Elementary School | 1,031 | 22.6% |
| Middle School | 1,120 | 24.5% |
| High School | 768 | 16.8% |
| College / Undergraduate | 726 | 15.9% |
| Graduate / Professional | 351 | 7.7% |
| Total | 4,569 | 100.0% |
School Enrollment by Age by Funding Source in Groveland
Out of a total of 4,569 students who are enrolled in schools in Groveland, 1,540 (33.7%) attend a private institution, while the remaining 3,029 (66.3%) are enrolled in public schools. The age group of 3 to 4 year olds has the highest likelihood of being enrolled in private schools, with 159 (88.3% in the age bracket) enrolled. Conversely, the age group of 18 to 19 year olds has the lowest likelihood of being enrolled in a private school, with 170 (100.0% in the age bracket) attending a public institution.
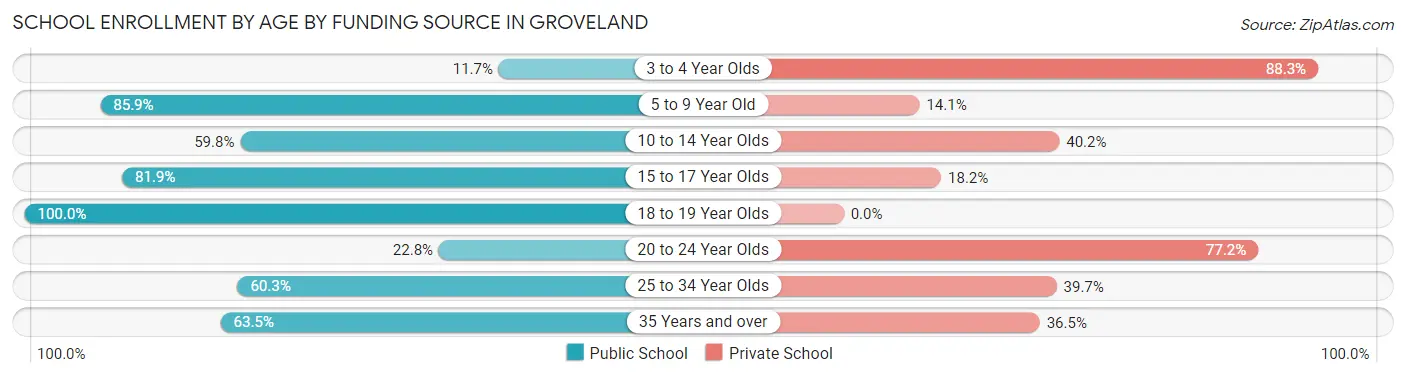
| Age Bracket | Public School | Private School |
| 3 to 4 Year Olds | 21 (11.7%) | 159 (88.3%) |
| 5 to 9 Year Old | 1,040 (85.9%) | 171 (14.1%) |
| 10 to 14 Year Olds | 898 (59.8%) | 603 (40.2%) |
| 15 to 17 Year Olds | 460 (81.9%) | 102 (18.1%) |
| 18 to 19 Year Olds | 170 (100.0%) | 0 (0.0%) |
| 20 to 24 Year Olds | 84 (22.8%) | 284 (77.2%) |
| 25 to 34 Year Olds | 178 (60.3%) | 117 (39.7%) |
| 35 Years and over | 179 (63.5%) | 103 (36.5%) |
| Total | 3,029 (66.3%) | 1,540 (33.7%) |
Educational Attainment by Field of Study in Groveland
Business (1,183 | 24.3%), science & technology (1,113 | 22.8%), education (674 | 13.8%), arts & humanities (345 | 7.1%), and communications (291 | 6.0%) are the most common fields of study among 4,874 individuals in Groveland who have obtained a bachelor's degree or higher.
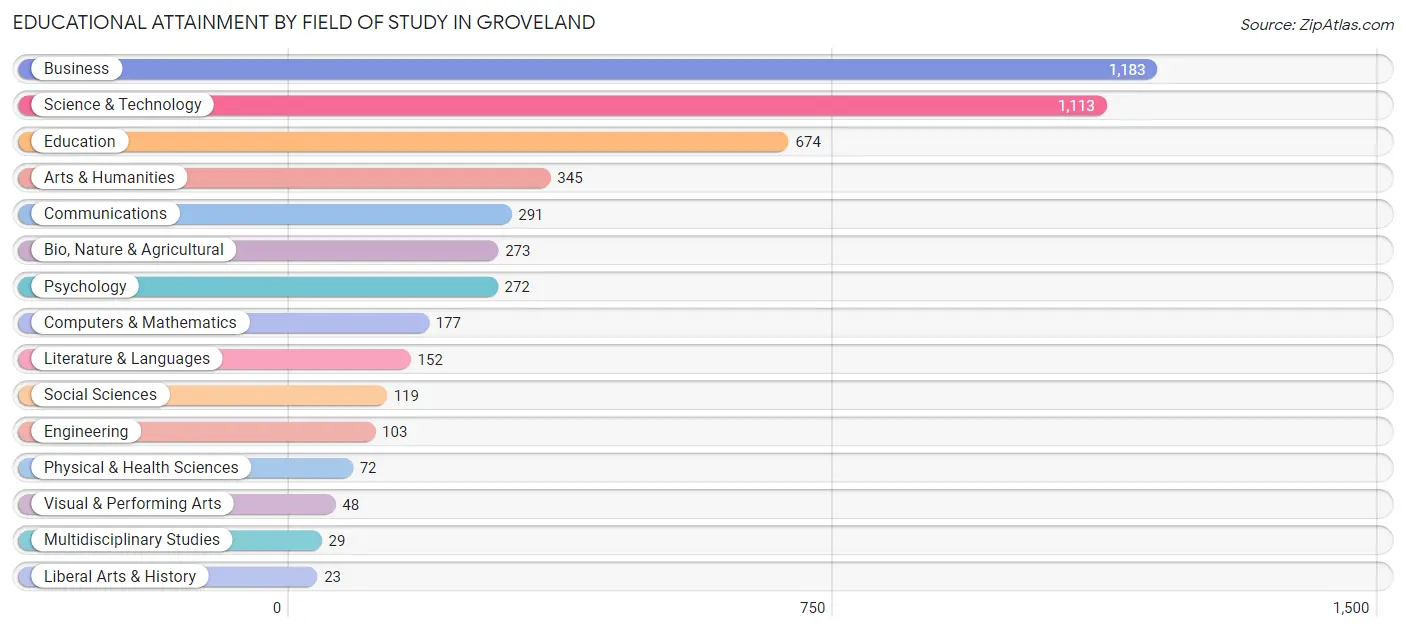
| Field of Study | # Graduates | % Graduates |
| Computers & Mathematics | 177 | 3.6% |
| Bio, Nature & Agricultural | 273 | 5.6% |
| Physical & Health Sciences | 72 | 1.5% |
| Psychology | 272 | 5.6% |
| Social Sciences | 119 | 2.4% |
| Engineering | 103 | 2.1% |
| Multidisciplinary Studies | 29 | 0.6% |
| Science & Technology | 1,113 | 22.8% |
| Business | 1,183 | 24.3% |
| Education | 674 | 13.8% |
| Literature & Languages | 152 | 3.1% |
| Liberal Arts & History | 23 | 0.5% |
| Visual & Performing Arts | 48 | 1.0% |
| Communications | 291 | 6.0% |
| Arts & Humanities | 345 | 7.1% |
| Total | 4,874 | 100.0% |
Transportation & Commute in Groveland
Vehicle Availability by Sex in Groveland
The most prevalent vehicle ownership categories in Groveland are males with 2 vehicles (1,923, accounting for 48.1%) and females with 2 vehicles (2,311, making up 42.5%).
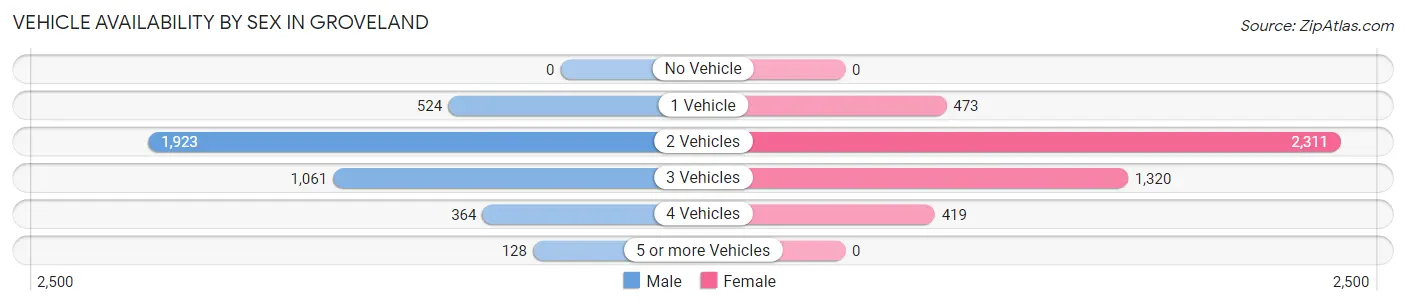
| Vehicles Available | Male | Female |
| No Vehicle | 0 (0.0%) | 0 (0.0%) |
| 1 Vehicle | 524 (13.1%) | 473 (10.5%) |
| 2 Vehicles | 1,923 (48.1%) | 2,311 (51.1%) |
| 3 Vehicles | 1,061 (26.5%) | 1,320 (29.2%) |
| 4 Vehicles | 364 (9.1%) | 419 (9.3%) |
| 5 or more Vehicles | 128 (3.2%) | 0 (0.0%) |
| Total | 4,000 (100.0%) | 4,523 (100.0%) |
Commute Time in Groveland
The most frequently occuring commute durations in Groveland are 45 to 59 minutes (2,031 commuters, 27.2%), 20 to 24 minutes (792 commuters, 10.6%), and 30 to 34 minutes (747 commuters, 10.0%).
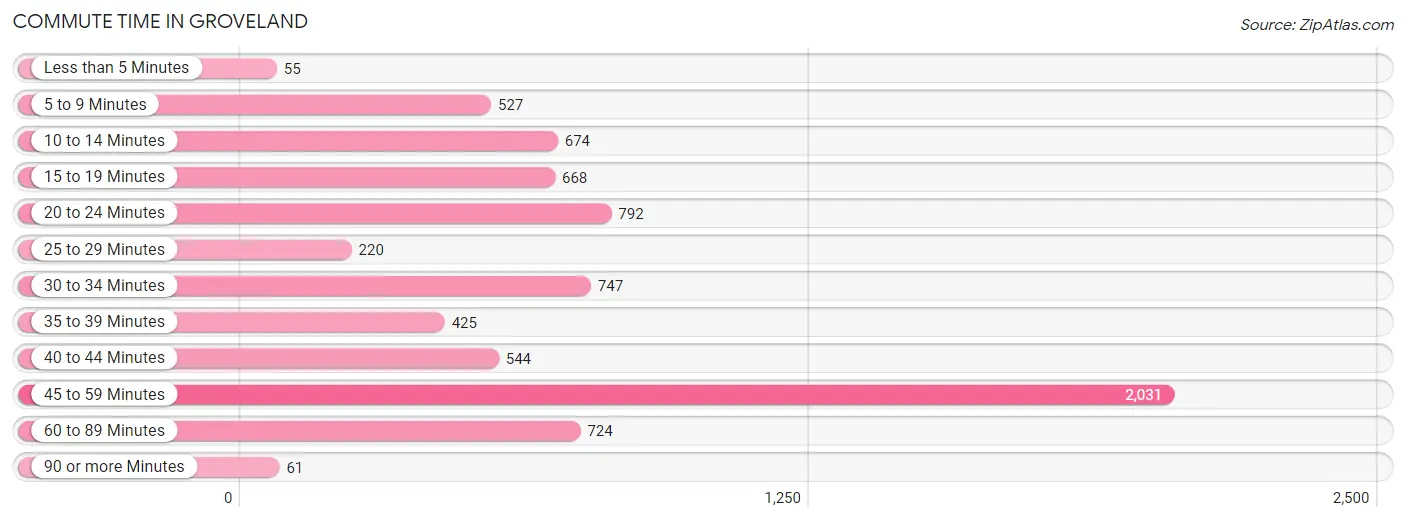
| Commute Time | # Commuters | % Commuters |
| Less than 5 Minutes | 55 | 0.7% |
| 5 to 9 Minutes | 527 | 7.1% |
| 10 to 14 Minutes | 674 | 9.0% |
| 15 to 19 Minutes | 668 | 8.9% |
| 20 to 24 Minutes | 792 | 10.6% |
| 25 to 29 Minutes | 220 | 2.9% |
| 30 to 34 Minutes | 747 | 10.0% |
| 35 to 39 Minutes | 425 | 5.7% |
| 40 to 44 Minutes | 544 | 7.3% |
| 45 to 59 Minutes | 2,031 | 27.2% |
| 60 to 89 Minutes | 724 | 9.7% |
| 90 or more Minutes | 61 | 0.8% |
Commute Time by Sex in Groveland
The most common commute times in Groveland are 45 to 59 minutes (878 commuters, 25.3%) for males and 45 to 59 minutes (1,153 commuters, 28.9%) for females.
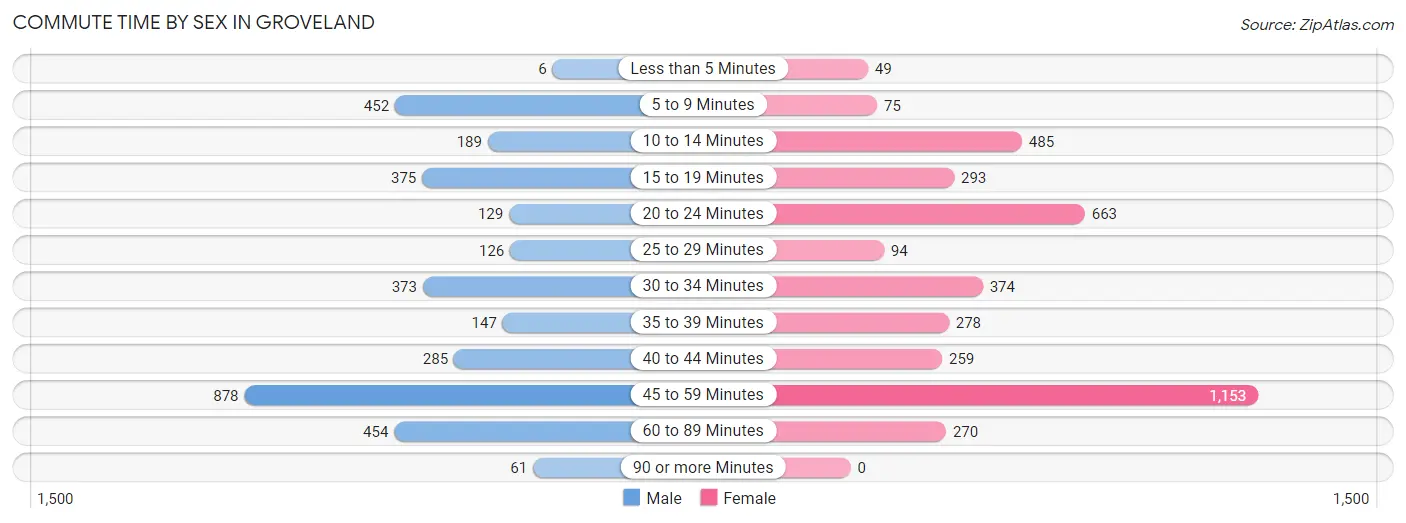
| Commute Time | Male | Female |
| Less than 5 Minutes | 6 (0.2%) | 49 (1.2%) |
| 5 to 9 Minutes | 452 (13.0%) | 75 (1.9%) |
| 10 to 14 Minutes | 189 (5.4%) | 485 (12.1%) |
| 15 to 19 Minutes | 375 (10.8%) | 293 (7.3%) |
| 20 to 24 Minutes | 129 (3.7%) | 663 (16.6%) |
| 25 to 29 Minutes | 126 (3.6%) | 94 (2.4%) |
| 30 to 34 Minutes | 373 (10.7%) | 374 (9.4%) |
| 35 to 39 Minutes | 147 (4.2%) | 278 (7.0%) |
| 40 to 44 Minutes | 285 (8.2%) | 259 (6.5%) |
| 45 to 59 Minutes | 878 (25.3%) | 1,153 (28.9%) |
| 60 to 89 Minutes | 454 (13.1%) | 270 (6.8%) |
| 90 or more Minutes | 61 (1.8%) | 0 (0.0%) |
Time of Departure to Work by Sex in Groveland
The most frequent times of departure to work in Groveland are 6:00 AM to 6:29 AM (619, 17.8%) for males and 6:30 AM to 6:59 AM (745, 18.7%) for females.
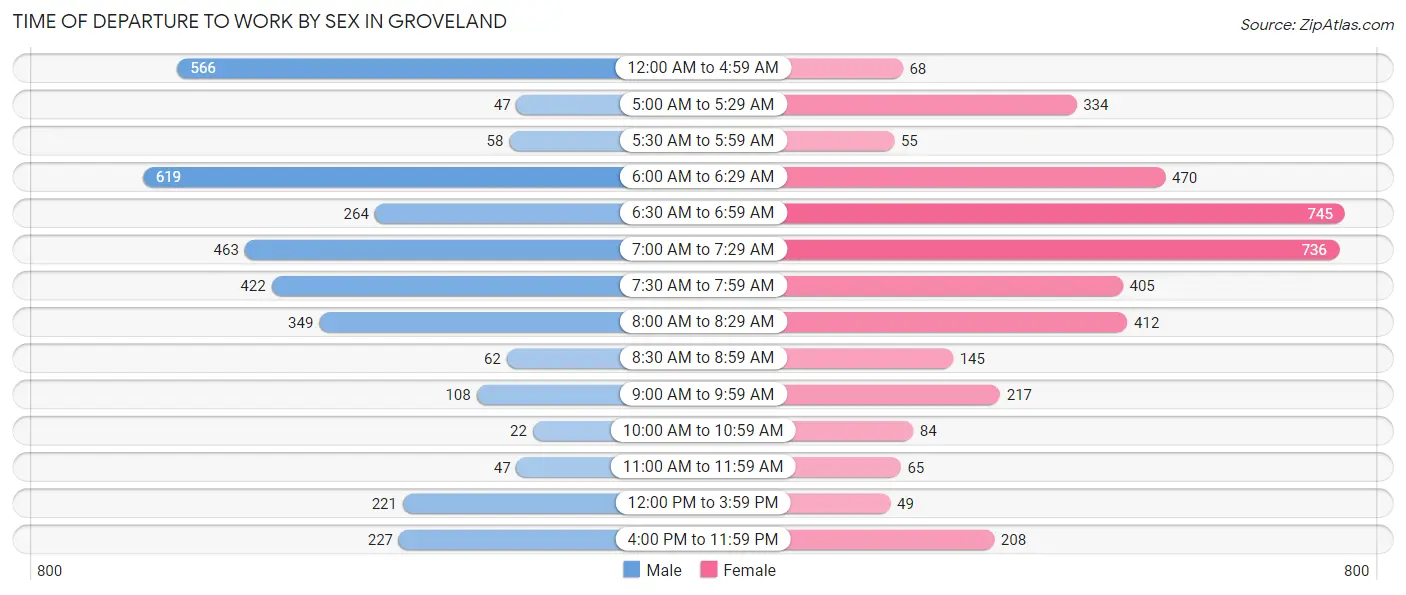
| Time of Departure | Male | Female |
| 12:00 AM to 4:59 AM | 566 (16.3%) | 68 (1.7%) |
| 5:00 AM to 5:29 AM | 47 (1.3%) | 334 (8.4%) |
| 5:30 AM to 5:59 AM | 58 (1.7%) | 55 (1.4%) |
| 6:00 AM to 6:29 AM | 619 (17.8%) | 470 (11.8%) |
| 6:30 AM to 6:59 AM | 264 (7.6%) | 745 (18.7%) |
| 7:00 AM to 7:29 AM | 463 (13.3%) | 736 (18.4%) |
| 7:30 AM to 7:59 AM | 422 (12.1%) | 405 (10.1%) |
| 8:00 AM to 8:29 AM | 349 (10.0%) | 412 (10.3%) |
| 8:30 AM to 8:59 AM | 62 (1.8%) | 145 (3.6%) |
| 9:00 AM to 9:59 AM | 108 (3.1%) | 217 (5.4%) |
| 10:00 AM to 10:59 AM | 22 (0.6%) | 84 (2.1%) |
| 11:00 AM to 11:59 AM | 47 (1.3%) | 65 (1.6%) |
| 12:00 PM to 3:59 PM | 221 (6.4%) | 49 (1.2%) |
| 4:00 PM to 11:59 PM | 227 (6.5%) | 208 (5.2%) |
| Total | 3,475 (100.0%) | 3,993 (100.0%) |
Housing Occupancy in Groveland
Occupancy by Ownership in Groveland
Of the total 6,924 dwellings in Groveland, owner-occupied units account for 6,125 (88.5%), while renter-occupied units make up 799 (11.5%).
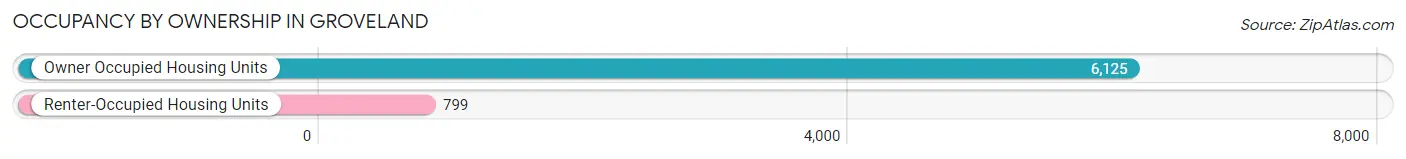
| Occupancy | # Housing Units | % Housing Units |
| Owner Occupied Housing Units | 6,125 | 88.5% |
| Renter-Occupied Housing Units | 799 | 11.5% |
| Total Occupied Housing Units | 6,924 | 100.0% |
Occupancy by Household Size in Groveland
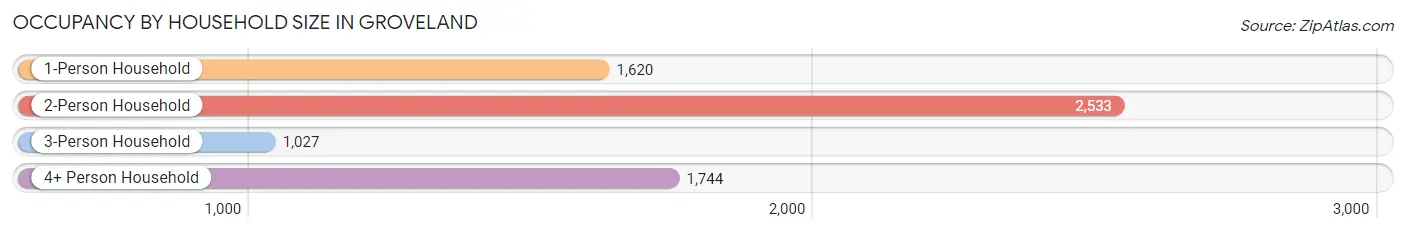
| Household Size | # Housing Units | % Housing Units |
| 1-Person Household | 1,620 | 23.4% |
| 2-Person Household | 2,533 | 36.6% |
| 3-Person Household | 1,027 | 14.8% |
| 4+ Person Household | 1,744 | 25.2% |
| Total Housing Units | 6,924 | 100.0% |
Occupancy by Ownership by Household Size in Groveland
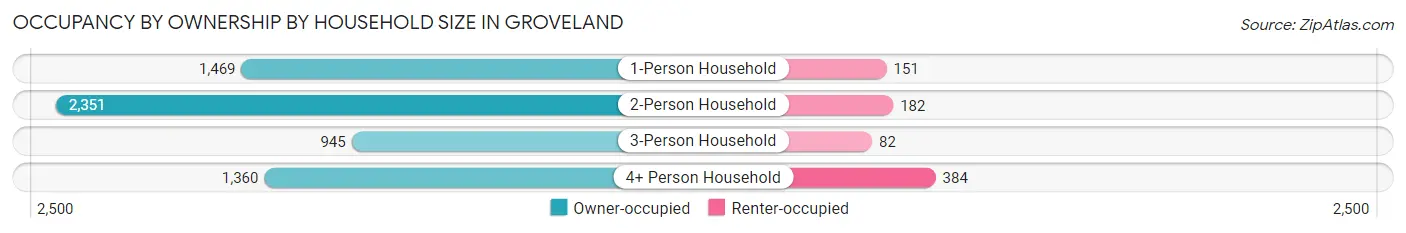
| Household Size | Owner-occupied | Renter-occupied |
| 1-Person Household | 1,469 (90.7%) | 151 (9.3%) |
| 2-Person Household | 2,351 (92.8%) | 182 (7.2%) |
| 3-Person Household | 945 (92.0%) | 82 (8.0%) |
| 4+ Person Household | 1,360 (78.0%) | 384 (22.0%) |
| Total Housing Units | 6,125 (88.5%) | 799 (11.5%) |
Occupancy by Educational Attainment in Groveland
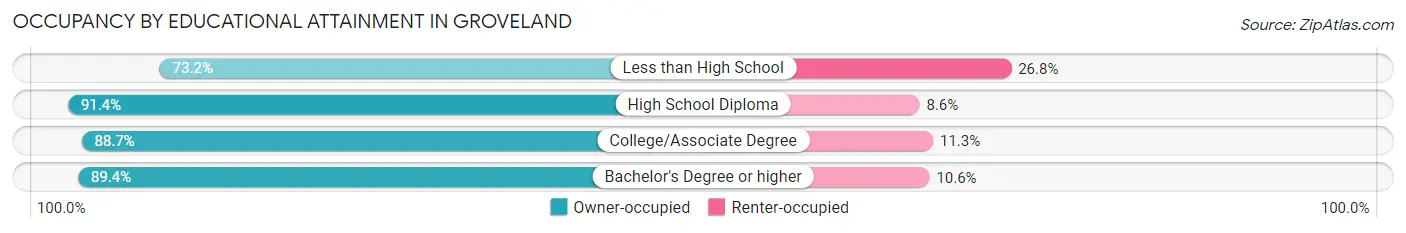
| Household Size | Owner-occupied | Renter-occupied |
| Less than High School | 339 (73.2%) | 124 (26.8%) |
| High School Diploma | 1,108 (91.4%) | 104 (8.6%) |
| College/Associate Degree | 2,061 (88.7%) | 262 (11.3%) |
| Bachelor's Degree or higher | 2,617 (89.4%) | 309 (10.6%) |
Occupancy by Age of Householder in Groveland
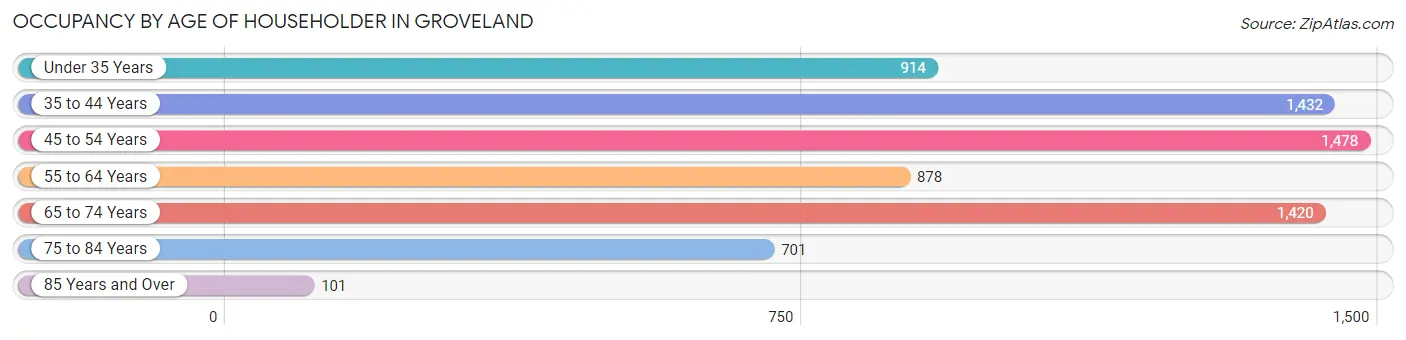
| Age Bracket | # Households | % Households |
| Under 35 Years | 914 | 13.2% |
| 35 to 44 Years | 1,432 | 20.7% |
| 45 to 54 Years | 1,478 | 21.3% |
| 55 to 64 Years | 878 | 12.7% |
| 65 to 74 Years | 1,420 | 20.5% |
| 75 to 84 Years | 701 | 10.1% |
| 85 Years and Over | 101 | 1.5% |
| Total | 6,924 | 100.0% |
Housing Finances in Groveland
Median Income by Occupancy in Groveland
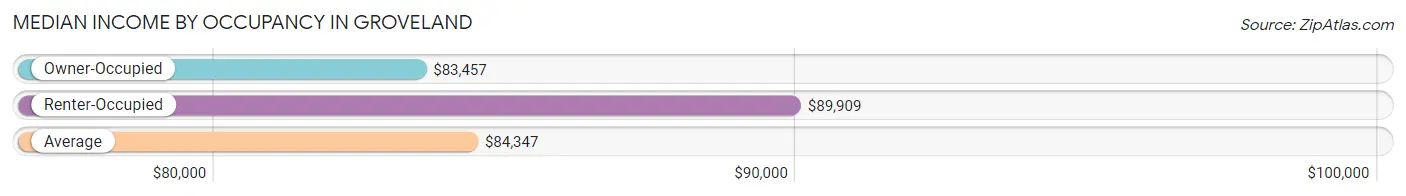
| Occupancy Type | # Households | Median Income |
| Owner-Occupied | 6,125 (88.5%) | $83,457 |
| Renter-Occupied | 799 (11.5%) | $89,909 |
| Average | 6,924 (100.0%) | $84,347 |
Occupancy by Householder Income Bracket in Groveland
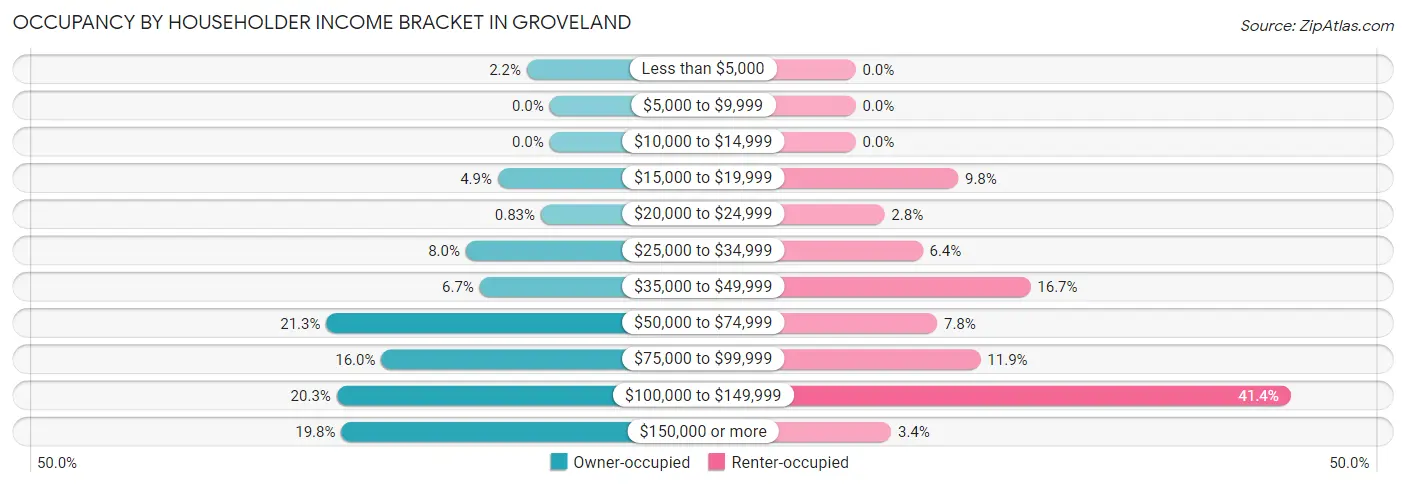
| Income Bracket | Owner-occupied | Renter-occupied |
| Less than $5,000 | 133 (2.2%) | 0 (0.0%) |
| $5,000 to $9,999 | 0 (0.0%) | 0 (0.0%) |
| $10,000 to $14,999 | 0 (0.0%) | 0 (0.0%) |
| $15,000 to $19,999 | 302 (4.9%) | 78 (9.8%) |
| $20,000 to $24,999 | 51 (0.8%) | 22 (2.8%) |
| $25,000 to $34,999 | 489 (8.0%) | 51 (6.4%) |
| $35,000 to $49,999 | 408 (6.7%) | 133 (16.7%) |
| $50,000 to $74,999 | 1,303 (21.3%) | 62 (7.8%) |
| $75,000 to $99,999 | 982 (16.0%) | 95 (11.9%) |
| $100,000 to $149,999 | 1,242 (20.3%) | 331 (41.4%) |
| $150,000 or more | 1,215 (19.8%) | 27 (3.4%) |
| Total | 6,125 (100.0%) | 799 (100.0%) |
Monthly Housing Cost Tiers in Groveland
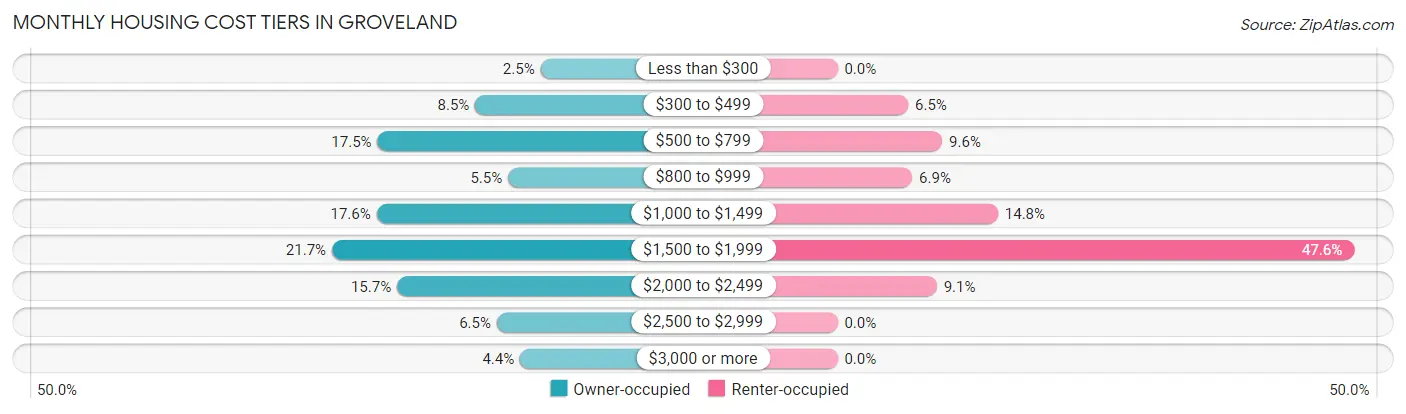
| Monthly Cost | Owner-occupied | Renter-occupied |
| Less than $300 | 154 (2.5%) | 0 (0.0%) |
| $300 to $499 | 522 (8.5%) | 52 (6.5%) |
| $500 to $799 | 1,073 (17.5%) | 77 (9.6%) |
| $800 to $999 | 336 (5.5%) | 55 (6.9%) |
| $1,000 to $1,499 | 1,078 (17.6%) | 118 (14.8%) |
| $1,500 to $1,999 | 1,330 (21.7%) | 380 (47.6%) |
| $2,000 to $2,499 | 963 (15.7%) | 73 (9.1%) |
| $2,500 to $2,999 | 400 (6.5%) | 0 (0.0%) |
| $3,000 or more | 269 (4.4%) | 0 (0.0%) |
| Total | 6,125 (100.0%) | 799 (100.0%) |
Physical Housing Characteristics in Groveland
Housing Structures in Groveland
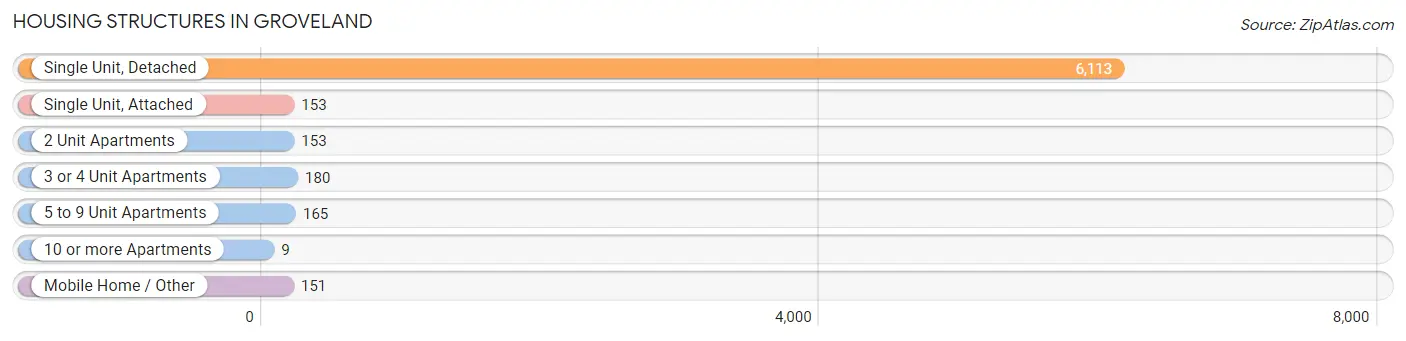
| Structure Type | # Housing Units | % Housing Units |
| Single Unit, Detached | 6,113 | 88.3% |
| Single Unit, Attached | 153 | 2.2% |
| 2 Unit Apartments | 153 | 2.2% |
| 3 or 4 Unit Apartments | 180 | 2.6% |
| 5 to 9 Unit Apartments | 165 | 2.4% |
| 10 or more Apartments | 9 | 0.1% |
| Mobile Home / Other | 151 | 2.2% |
| Total | 6,924 | 100.0% |
Housing Structures by Occupancy in Groveland
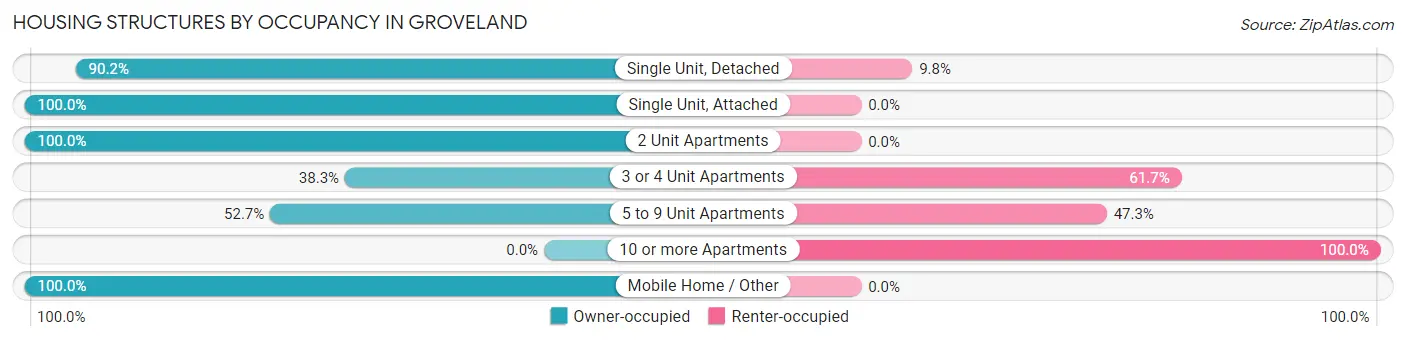
| Structure Type | Owner-occupied | Renter-occupied |
| Single Unit, Detached | 5,512 (90.2%) | 601 (9.8%) |
| Single Unit, Attached | 153 (100.0%) | 0 (0.0%) |
| 2 Unit Apartments | 153 (100.0%) | 0 (0.0%) |
| 3 or 4 Unit Apartments | 69 (38.3%) | 111 (61.7%) |
| 5 to 9 Unit Apartments | 87 (52.7%) | 78 (47.3%) |
| 10 or more Apartments | 0 (0.0%) | 9 (100.0%) |
| Mobile Home / Other | 151 (100.0%) | 0 (0.0%) |
| Total | 6,125 (88.5%) | 799 (11.5%) |
Housing Structures by Number of Rooms in Groveland
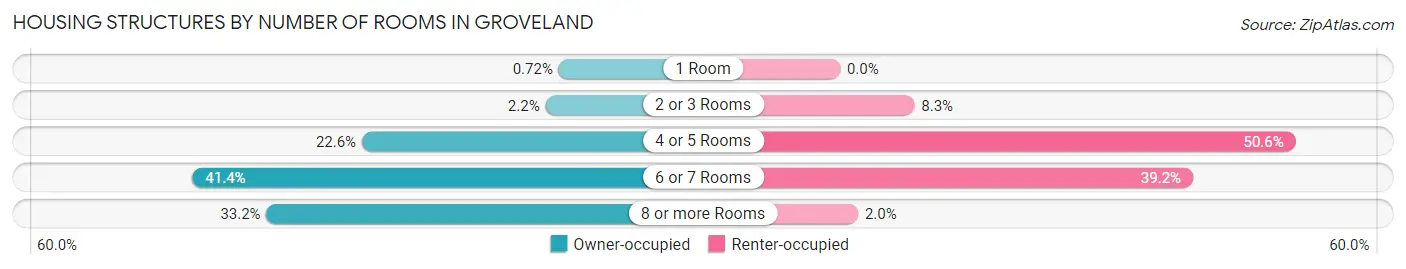
| Number of Rooms | Owner-occupied | Renter-occupied |
| 1 Room | 44 (0.7%) | 0 (0.0%) |
| 2 or 3 Rooms | 134 (2.2%) | 66 (8.3%) |
| 4 or 5 Rooms | 1,382 (22.6%) | 404 (50.6%) |
| 6 or 7 Rooms | 2,534 (41.4%) | 313 (39.2%) |
| 8 or more Rooms | 2,031 (33.2%) | 16 (2.0%) |
| Total | 6,125 (100.0%) | 799 (100.0%) |
Housing Structure by Heating Type in Groveland
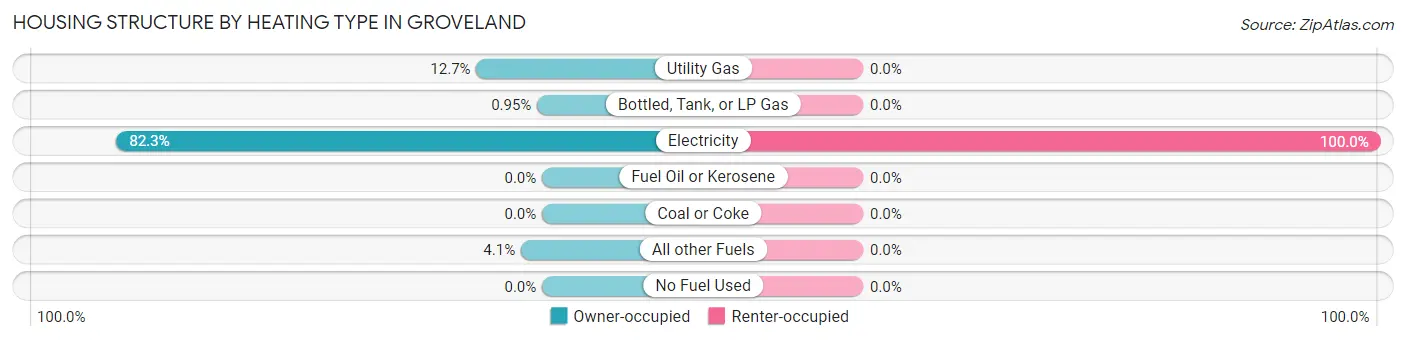
| Heating Type | Owner-occupied | Renter-occupied |
| Utility Gas | 778 (12.7%) | 0 (0.0%) |
| Bottled, Tank, or LP Gas | 58 (0.9%) | 0 (0.0%) |
| Electricity | 5,039 (82.3%) | 799 (100.0%) |
| Fuel Oil or Kerosene | 0 (0.0%) | 0 (0.0%) |
| Coal or Coke | 0 (0.0%) | 0 (0.0%) |
| All other Fuels | 250 (4.1%) | 0 (0.0%) |
| No Fuel Used | 0 (0.0%) | 0 (0.0%) |
| Total | 6,125 (100.0%) | 799 (100.0%) |
Household Vehicle Usage in Groveland
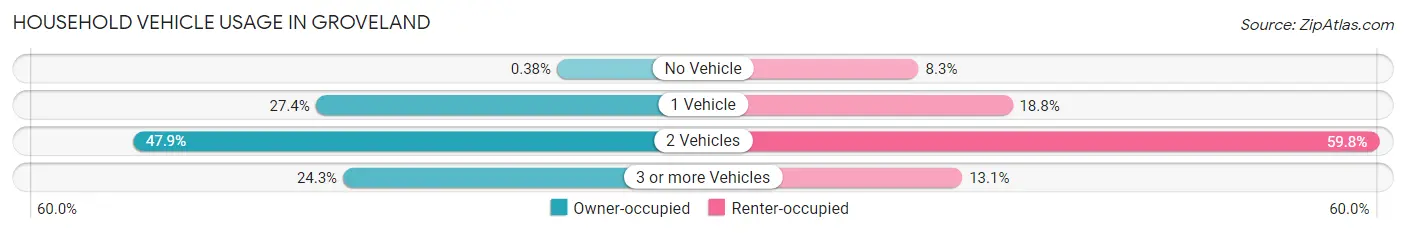
| Vehicles per Household | Owner-occupied | Renter-occupied |
| No Vehicle | 23 (0.4%) | 66 (8.3%) |
| 1 Vehicle | 1,679 (27.4%) | 150 (18.8%) |
| 2 Vehicles | 2,932 (47.9%) | 478 (59.8%) |
| 3 or more Vehicles | 1,491 (24.3%) | 105 (13.1%) |
| Total | 6,125 (100.0%) | 799 (100.0%) |
Real Estate & Mortgages in Groveland
Real Estate and Mortgage Overview in Groveland
| Characteristic | Without Mortgage | With Mortgage |
| Housing Units | 1,800 | 4,325 |
| Median Property Value | $268,100 | $322,600 |
| Median Household Income | $77,941 | $865 |
| Monthly Housing Costs | $583 | $269 |
| Real Estate Taxes | $2,442 | $201 |
Property Value by Mortgage Status in Groveland
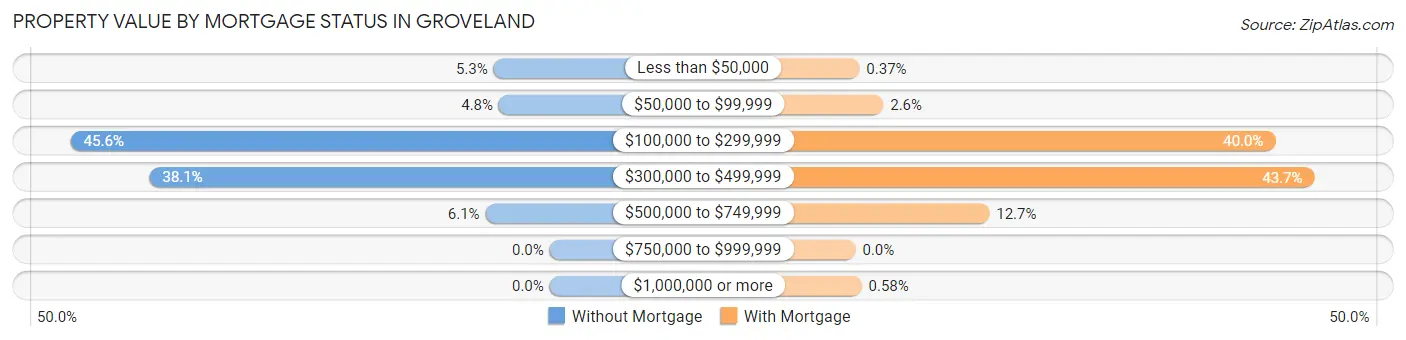
| Property Value | Without Mortgage | With Mortgage |
| Less than $50,000 | 96 (5.3%) | 16 (0.4%) |
| $50,000 to $99,999 | 87 (4.8%) | 114 (2.6%) |
| $100,000 to $299,999 | 821 (45.6%) | 1,729 (40.0%) |
| $300,000 to $499,999 | 686 (38.1%) | 1,890 (43.7%) |
| $500,000 to $749,999 | 110 (6.1%) | 551 (12.7%) |
| $750,000 to $999,999 | 0 (0.0%) | 0 (0.0%) |
| $1,000,000 or more | 0 (0.0%) | 25 (0.6%) |
| Total | 1,800 (100.0%) | 4,325 (100.0%) |
Household Income by Mortgage Status in Groveland
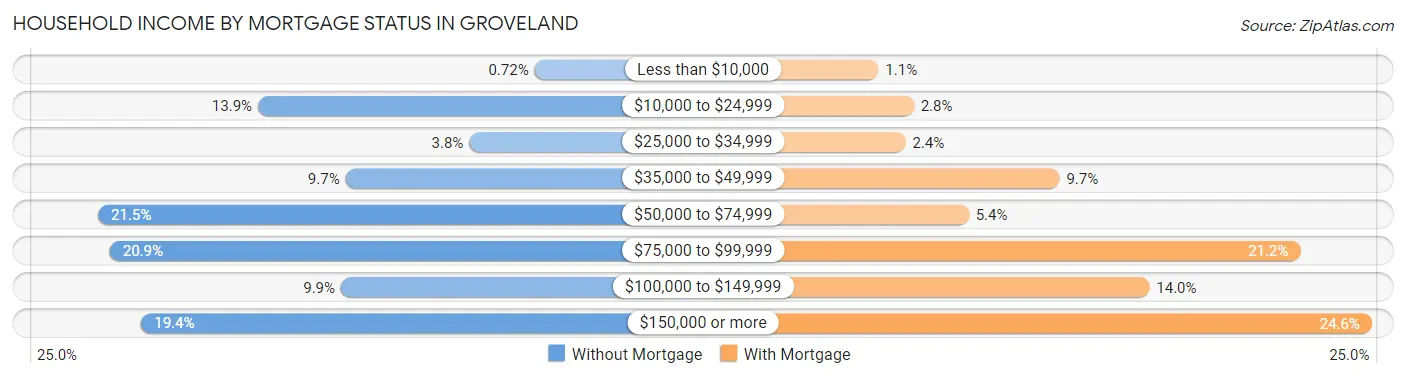
| Household Income | Without Mortgage | With Mortgage |
| Less than $10,000 | 13 (0.7%) | 47 (1.1%) |
| $10,000 to $24,999 | 250 (13.9%) | 120 (2.8%) |
| $25,000 to $34,999 | 69 (3.8%) | 103 (2.4%) |
| $35,000 to $49,999 | 175 (9.7%) | 420 (9.7%) |
| $50,000 to $74,999 | 387 (21.5%) | 233 (5.4%) |
| $75,000 to $99,999 | 377 (20.9%) | 916 (21.2%) |
| $100,000 to $149,999 | 179 (9.9%) | 605 (14.0%) |
| $150,000 or more | 350 (19.4%) | 1,063 (24.6%) |
| Total | 1,800 (100.0%) | 4,325 (100.0%) |
Property Value to Household Income Ratio in Groveland
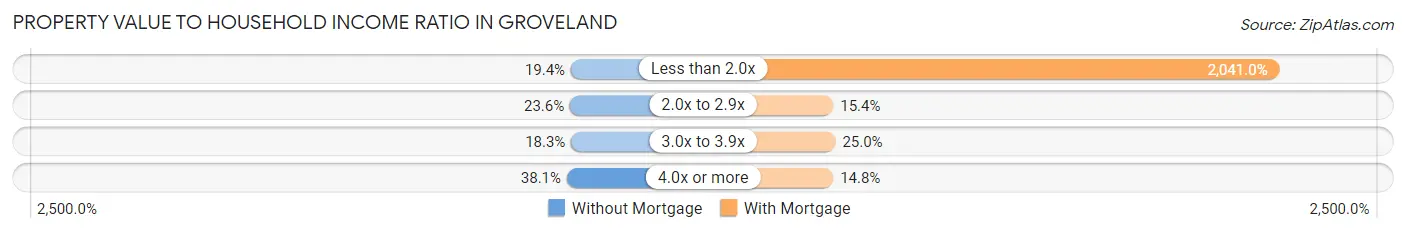
| Value-to-Income Ratio | Without Mortgage | With Mortgage |
| Less than 2.0x | 349 (19.4%) | 88,272 (2,041.0%) |
| 2.0x to 2.9x | 424 (23.6%) | 666 (15.4%) |
| 3.0x to 3.9x | 329 (18.3%) | 1,082 (25.0%) |
| 4.0x or more | 685 (38.1%) | 642 (14.8%) |
| Total | 1,800 (100.0%) | 4,325 (100.0%) |
Real Estate Taxes by Mortgage Status in Groveland
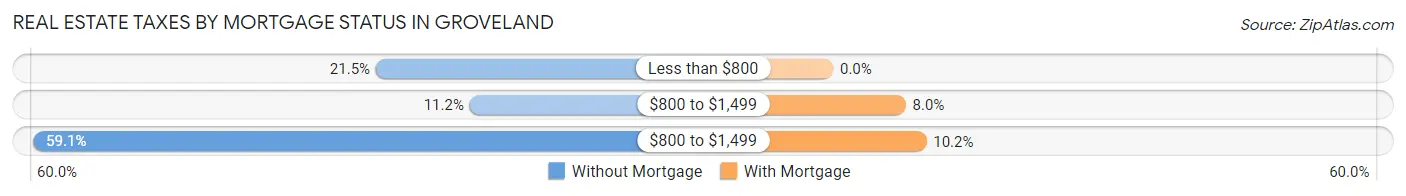
| Property Taxes | Without Mortgage | With Mortgage |
| Less than $800 | 387 (21.5%) | 0 (0.0%) |
| $800 to $1,499 | 202 (11.2%) | 344 (8.0%) |
| $800 to $1,499 | 1,063 (59.1%) | 442 (10.2%) |
| Total | 1,800 (100.0%) | 4,325 (100.0%) |
Health & Disability in Groveland
Health Insurance Coverage by Age in Groveland
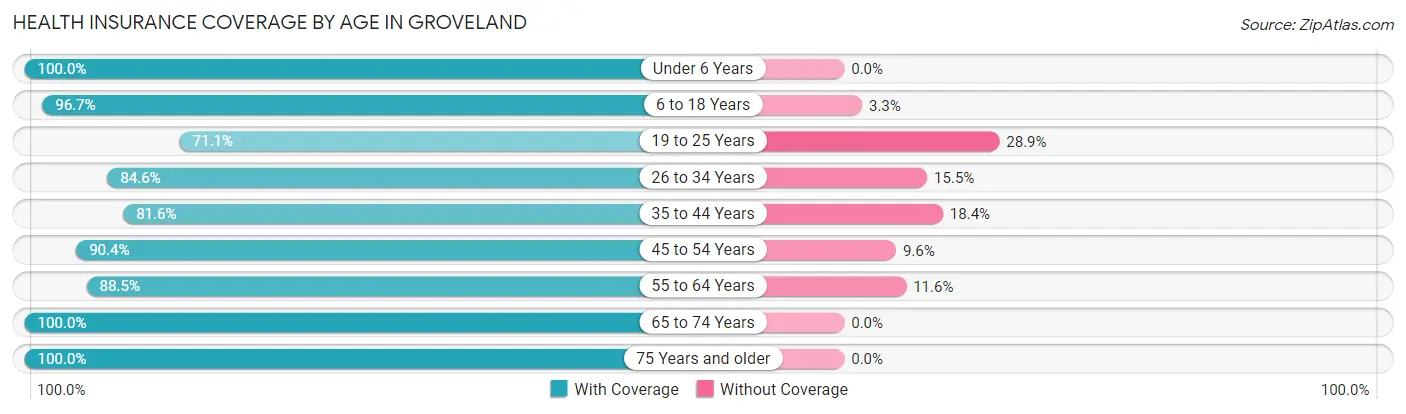
| Age Bracket | With Coverage | Without Coverage |
| Under 6 Years | 1,789 (100.0%) | 0 (0.0%) |
| 6 to 18 Years | 3,069 (96.7%) | 105 (3.3%) |
| 19 to 25 Years | 1,123 (71.1%) | 457 (28.9%) |
| 26 to 34 Years | 1,428 (84.6%) | 261 (15.4%) |
| 35 to 44 Years | 2,516 (81.6%) | 567 (18.4%) |
| 45 to 54 Years | 2,118 (90.4%) | 226 (9.6%) |
| 55 to 64 Years | 1,639 (88.4%) | 214 (11.6%) |
| 65 to 74 Years | 2,494 (100.0%) | 0 (0.0%) |
| 75 Years and older | 1,160 (100.0%) | 0 (0.0%) |
| Total | 17,336 (90.4%) | 1,830 (9.6%) |
Health Insurance Coverage by Citizenship Status in Groveland
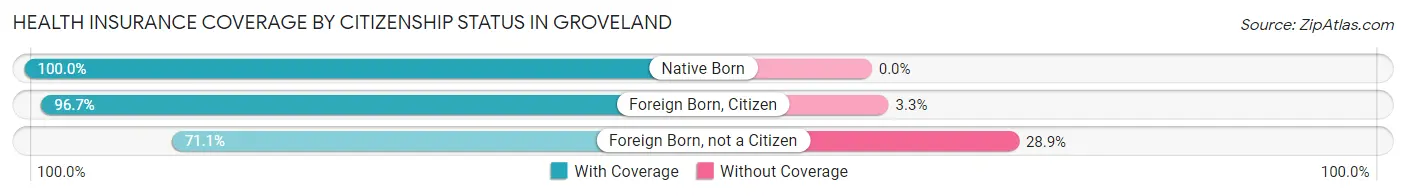
| Citizenship Status | With Coverage | Without Coverage |
| Native Born | 1,789 (100.0%) | 0 (0.0%) |
| Foreign Born, Citizen | 3,069 (96.7%) | 105 (3.3%) |
| Foreign Born, not a Citizen | 1,123 (71.1%) | 457 (28.9%) |
Health Insurance Coverage by Household Income in Groveland
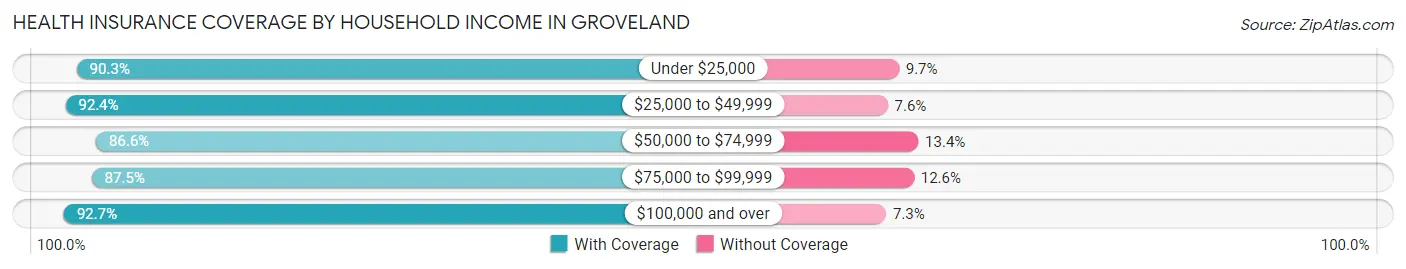
| Household Income | With Coverage | Without Coverage |
| Under $25,000 | 1,242 (90.3%) | 134 (9.7%) |
| $25,000 to $49,999 | 2,260 (92.4%) | 187 (7.6%) |
| $50,000 to $74,999 | 3,046 (86.6%) | 470 (13.4%) |
| $75,000 to $99,999 | 2,682 (87.5%) | 385 (12.6%) |
| $100,000 and over | 8,089 (92.7%) | 641 (7.3%) |
Public vs Private Health Insurance Coverage by Age in Groveland
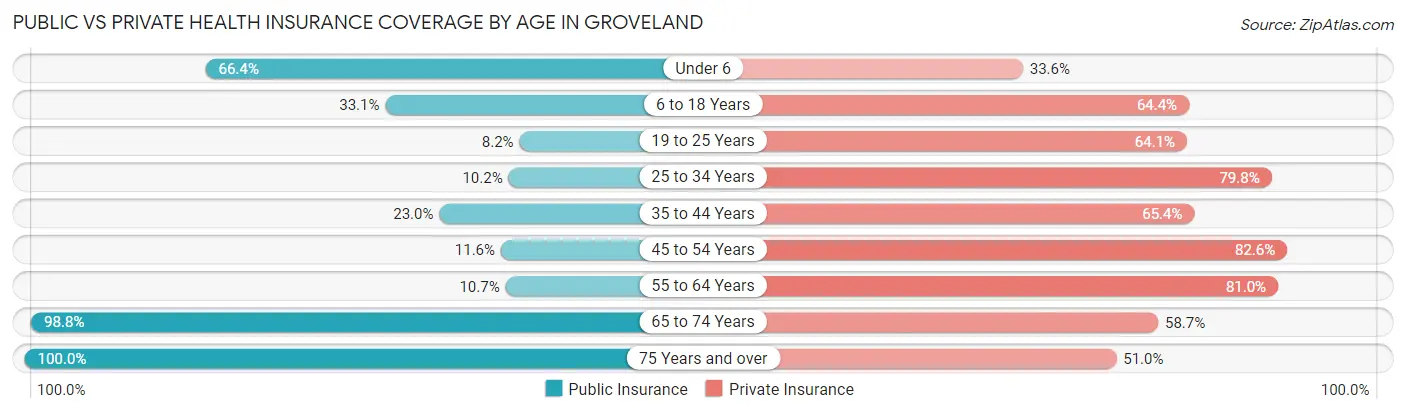
| Age Bracket | Public Insurance | Private Insurance |
| Under 6 | 1,188 (66.4%) | 601 (33.6%) |
| 6 to 18 Years | 1,049 (33.1%) | 2,045 (64.4%) |
| 19 to 25 Years | 129 (8.2%) | 1,012 (64.0%) |
| 25 to 34 Years | 172 (10.2%) | 1,347 (79.7%) |
| 35 to 44 Years | 710 (23.0%) | 2,017 (65.4%) |
| 45 to 54 Years | 272 (11.6%) | 1,937 (82.6%) |
| 55 to 64 Years | 199 (10.7%) | 1,500 (80.9%) |
| 65 to 74 Years | 2,464 (98.8%) | 1,464 (58.7%) |
| 75 Years and over | 1,160 (100.0%) | 591 (50.9%) |
| Total | 7,343 (38.3%) | 12,514 (65.3%) |
Disability Status by Sex by Age in Groveland
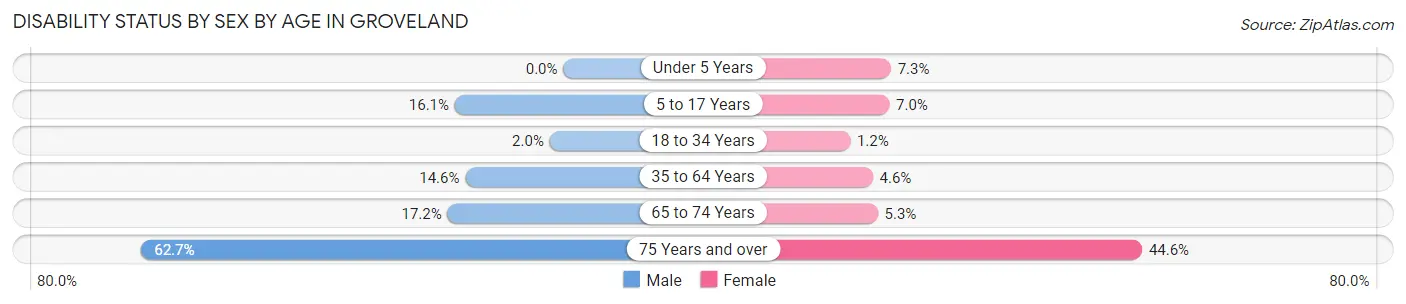
| Age Bracket | Male | Female |
| Under 5 Years | 0 (0.0%) | 76 (7.3%) |
| 5 to 17 Years | 301 (16.1%) | 100 (7.0%) |
| 18 to 34 Years | 29 (2.0%) | 23 (1.2%) |
| 35 to 64 Years | 486 (14.6%) | 180 (4.6%) |
| 65 to 74 Years | 193 (17.2%) | 73 (5.3%) |
| 75 Years and over | 277 (62.7%) | 320 (44.6%) |
Disability Class by Sex by Age in Groveland
Disability Class: Hearing Difficulty
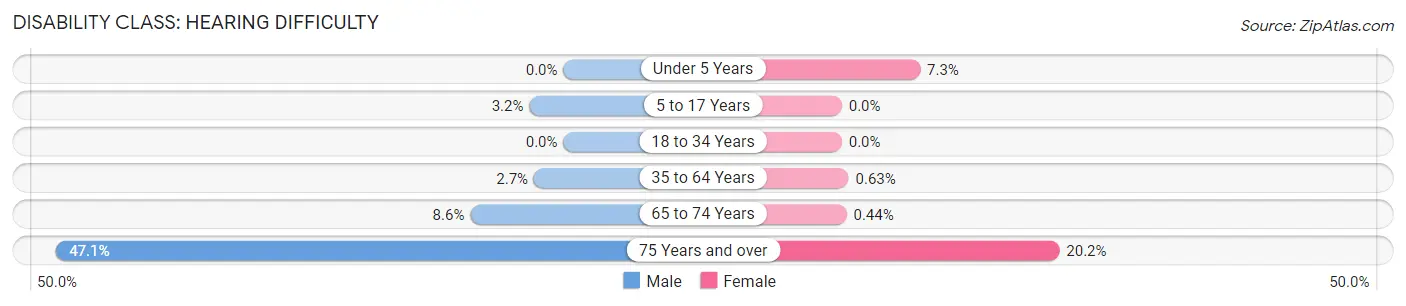
| Age Bracket | Male | Female |
| Under 5 Years | 0 (0.0%) | 76 (7.3%) |
| 5 to 17 Years | 59 (3.2%) | 0 (0.0%) |
| 18 to 34 Years | 0 (0.0%) | 0 (0.0%) |
| 35 to 64 Years | 91 (2.7%) | 25 (0.6%) |
| 65 to 74 Years | 97 (8.6%) | 6 (0.4%) |
| 75 Years and over | 208 (47.1%) | 145 (20.2%) |
Disability Class: Vision Difficulty
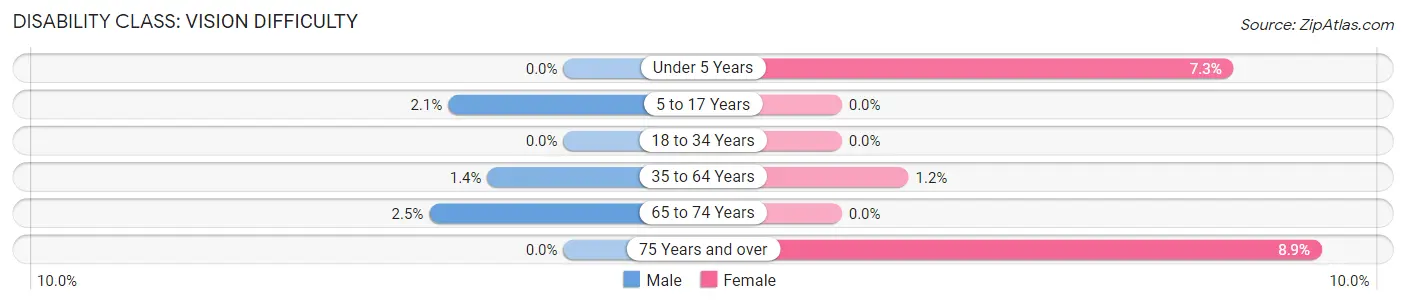
| Age Bracket | Male | Female |
| Under 5 Years | 0 (0.0%) | 76 (7.3%) |
| 5 to 17 Years | 40 (2.1%) | 0 (0.0%) |
| 18 to 34 Years | 0 (0.0%) | 0 (0.0%) |
| 35 to 64 Years | 47 (1.4%) | 49 (1.2%) |
| 65 to 74 Years | 28 (2.5%) | 0 (0.0%) |
| 75 Years and over | 0 (0.0%) | 64 (8.9%) |
Disability Class: Cognitive Difficulty
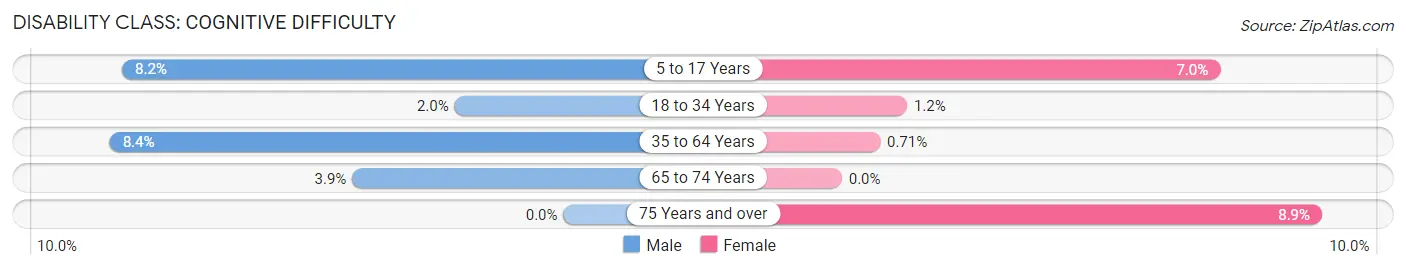
| Age Bracket | Male | Female |
| 5 to 17 Years | 153 (8.2%) | 100 (7.0%) |
| 18 to 34 Years | 29 (2.0%) | 23 (1.2%) |
| 35 to 64 Years | 281 (8.4%) | 28 (0.7%) |
| 65 to 74 Years | 44 (3.9%) | 0 (0.0%) |
| 75 Years and over | 0 (0.0%) | 64 (8.9%) |
Disability Class: Ambulatory Difficulty
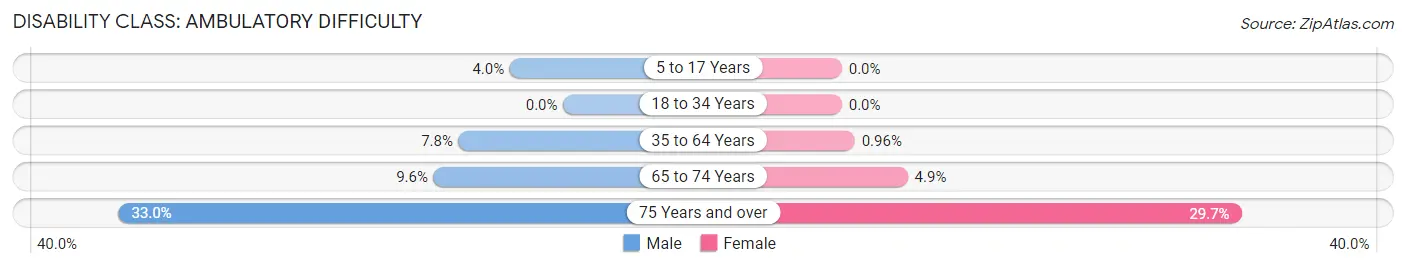
| Age Bracket | Male | Female |
| 5 to 17 Years | 74 (4.0%) | 0 (0.0%) |
| 18 to 34 Years | 0 (0.0%) | 0 (0.0%) |
| 35 to 64 Years | 259 (7.8%) | 38 (1.0%) |
| 65 to 74 Years | 108 (9.6%) | 67 (4.9%) |
| 75 Years and over | 146 (33.0%) | 213 (29.7%) |
Disability Class: Self-Care Difficulty
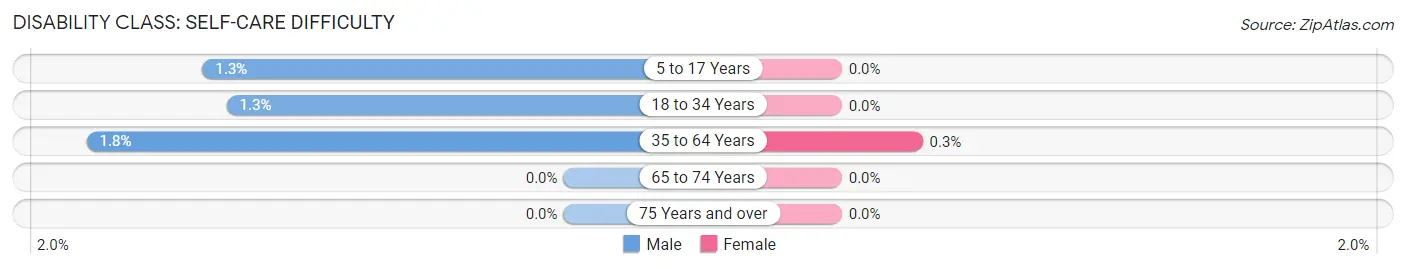
| Age Bracket | Male | Female |
| 5 to 17 Years | 25 (1.3%) | 0 (0.0%) |
| 18 to 34 Years | 18 (1.3%) | 0 (0.0%) |
| 35 to 64 Years | 59 (1.8%) | 12 (0.3%) |
| 65 to 74 Years | 0 (0.0%) | 0 (0.0%) |
| 75 Years and over | 0 (0.0%) | 0 (0.0%) |
Technology Access in Groveland
Computing Device Access in Groveland
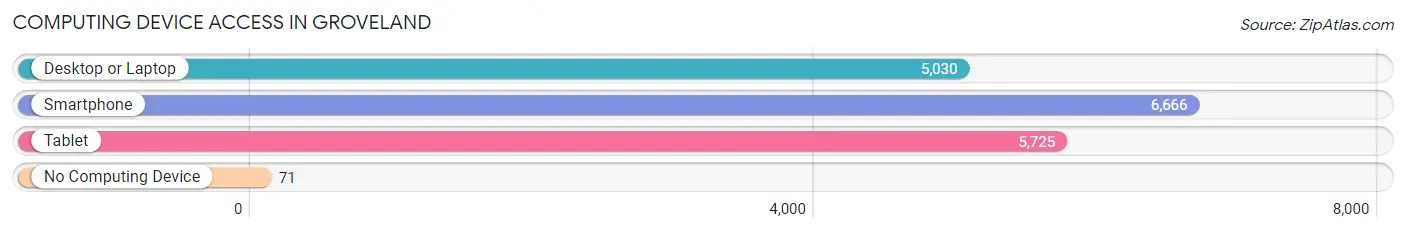
| Device Type | # Households | % Households |
| Desktop or Laptop | 5,030 | 72.7% |
| Smartphone | 6,666 | 96.3% |
| Tablet | 5,725 | 82.7% |
| No Computing Device | 71 | 1.0% |
| Total | 6,924 | 100.0% |
Internet Access in Groveland
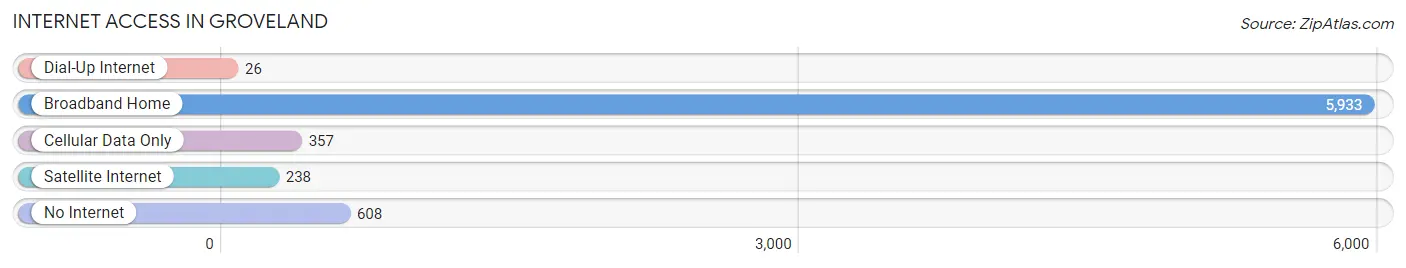
| Internet Type | # Households | % Households |
| Dial-Up Internet | 26 | 0.4% |
| Broadband Home | 5,933 | 85.7% |
| Cellular Data Only | 357 | 5.2% |
| Satellite Internet | 238 | 3.4% |
| No Internet | 608 | 8.8% |
| Total | 6,924 | 100.0% |
Groveland Summary
Geography
Groveland is a city located in Lake County, Florida, United States. It is part of the Orlando–Kissimmee–Sanford Metropolitan Statistical Area. The city is situated in the rolling hills of the Lake Wales Ridge, an upland area of Florida. The city is located approximately 25 miles west of Orlando and 40 miles northeast of Tampa. The city is bordered by Clermont to the east, Mascotte to the south, and Minneola to the west.
History
The area that is now Groveland was originally inhabited by the Seminole Indians. The first settlers arrived in the area in the late 1800s and established a small farming community. The town was originally known as “Garden Grove” and was later renamed “Groveland” in honor of the groves of citrus trees that grew in the area.
In the early 1900s, the town began to grow as the citrus industry flourished. The town was incorporated in 1925 and the population grew to over 1,000 by the 1940s. The city continued to grow throughout the 20th century and by 2000, the population had grown to over 5,000.
Economy
The economy of Groveland is largely based on the citrus industry. The city is home to several citrus groves and packing houses. The city is also home to several manufacturing and distribution companies. The city is also home to several retail stores and restaurants.
Demographics
As of the 2010 census, the population of Groveland was 8,729. The racial makeup of the city was 77.3% White, 15.2% African American, 0.5% Native American, 1.2% Asian, 0.1% Pacific Islander, 3.2% from other races, and 2.7% from two or more races. Hispanic or Latino of any race were 11.2% of the population.
The median household income in Groveland was $45,813 in 2018. The per capita income for the city was $22,845. The median age of the population was 38.7 years.
Conclusion
Groveland is a city located in Lake County, Florida. It is part of the Orlando–Kissimmee–Sanford Metropolitan Statistical Area. The city is situated in the rolling hills of the Lake Wales Ridge and is bordered by Clermont, Mascotte, and Minneola. The city was originally inhabited by the Seminole Indians and was later settled by farmers in the late 1800s. The city was incorporated in 1925 and the population grew to over 5,000 by 2000. The economy of Groveland is largely based on the citrus industry and the city is also home to several manufacturing and distribution companies. As of the 2010 census, the population of Groveland was 8,729. The median household income in Groveland was $45,813 in 2018 and the median age of the population was 38.7 years.
Common Questions
What is Per Capita Income in Groveland?
Per Capita income in Groveland is $39,878.
What is the Median Family Income in Groveland?
Median Family Income in Groveland is $98,822.
What is the Median Household income in Groveland?
Median Household Income in Groveland is $84,347.
What is Income or Wage Gap in Groveland?
Income or Wage Gap in Groveland is 27.4%.
Women in Groveland earn 72.6 cents for every dollar earned by a man.
What is Inequality or Gini Index in Groveland?
Inequality or Gini Index in Groveland is 0.41.
What is the Total Population of Groveland?
Total Population of Groveland is 19,240.
What is the Total Male Population of Groveland?
Total Male Population of Groveland is 8,831.
What is the Total Female Population of Groveland?
Total Female Population of Groveland is 10,409.
What is the Ratio of Males per 100 Females in Groveland?
There are 84.84 Males per 100 Females in Groveland.
What is the Ratio of Females per 100 Males in Groveland?
There are 117.87 Females per 100 Males in Groveland.
What is the Median Population Age in Groveland?
Median Population Age in Groveland is 40.3 Years.
What is the Average Family Size in Groveland
Average Family Size in Groveland is 3.3 People.
What is the Average Household Size in Groveland
Average Household Size in Groveland is 2.8 People.
How Large is the Labor Force in Groveland?
There are 9,096 People in the Labor Forcein in Groveland.
What is the Percentage of People in the Labor Force in Groveland?
61.6% of People are in the Labor Force in Groveland.
What is the Unemployment Rate in Groveland?
Unemployment Rate in Groveland is 6.0%.