Villas, FL Map & Demographics
Villas Map
Villas Overview
$38,134
PER CAPITA INCOME
$74,424
AVG FAMILY INCOME
$55,165
AVG HOUSEHOLD INCOME
11.5%
WAGE / INCOME GAP [ % ]
88.5¢/ $1
WAGE / INCOME GAP [ $ ]
0.45
INEQUALITY / GINI INDEX
13,801
TOTAL POPULATION
6,511
MALE POPULATION
7,290
FEMALE POPULATION
89.31
MALES / 100 FEMALES
111.96
FEMALES / 100 MALES
52.5
MEDIAN AGE
2.8
AVG FAMILY SIZE
2.1
AVG HOUSEHOLD SIZE
7,510
LABOR FORCE [ PEOPLE ]
59.7%
PERCENT IN LABOR FORCE
3.5%
UNEMPLOYMENT RATE
Income in Villas
Income Overview in Villas
Per Capita Income in Villas is $38,134, while median incomes of families and households are $74,424 and $55,165 respectively.
| Characteristic | Number | Measure |
| Per Capita Income | 13,801 | $38,134 |
| Median Family Income | 3,199 | $74,424 |
| Mean Family Income | 3,199 | $99,218 |
| Median Household Income | 6,647 | $55,165 |
| Mean Household Income | 6,647 | $73,354 |
| Income Deficit | 3,199 | $0 |
| Wage / Income Gap (%) | 13,801 | 11.52% |
| Wage / Income Gap ($) | 13,801 | 88.48¢ per $1 |
| Gini / Inequality Index | 13,801 | 0.45 |
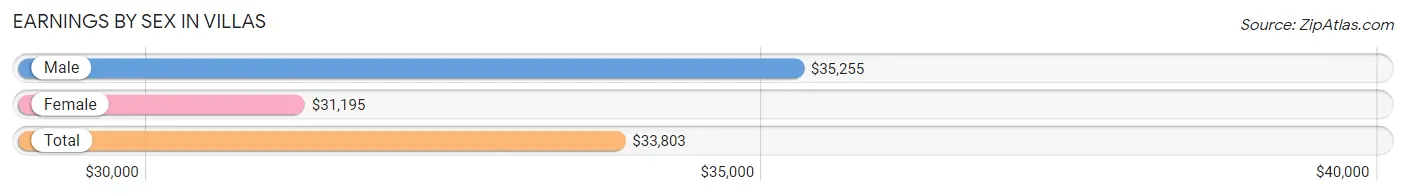
Earnings by Sex in Villas
Average Earnings in Villas are $33,803, $35,255 for men and $31,195 for women, a difference of 11.5%.
| Sex | Number | Average Earnings |
| Male | 4,128 (52.2%) | $35,255 |
| Female | 3,777 (47.8%) | $31,195 |
| Total | 7,905 (100.0%) | $33,803 |
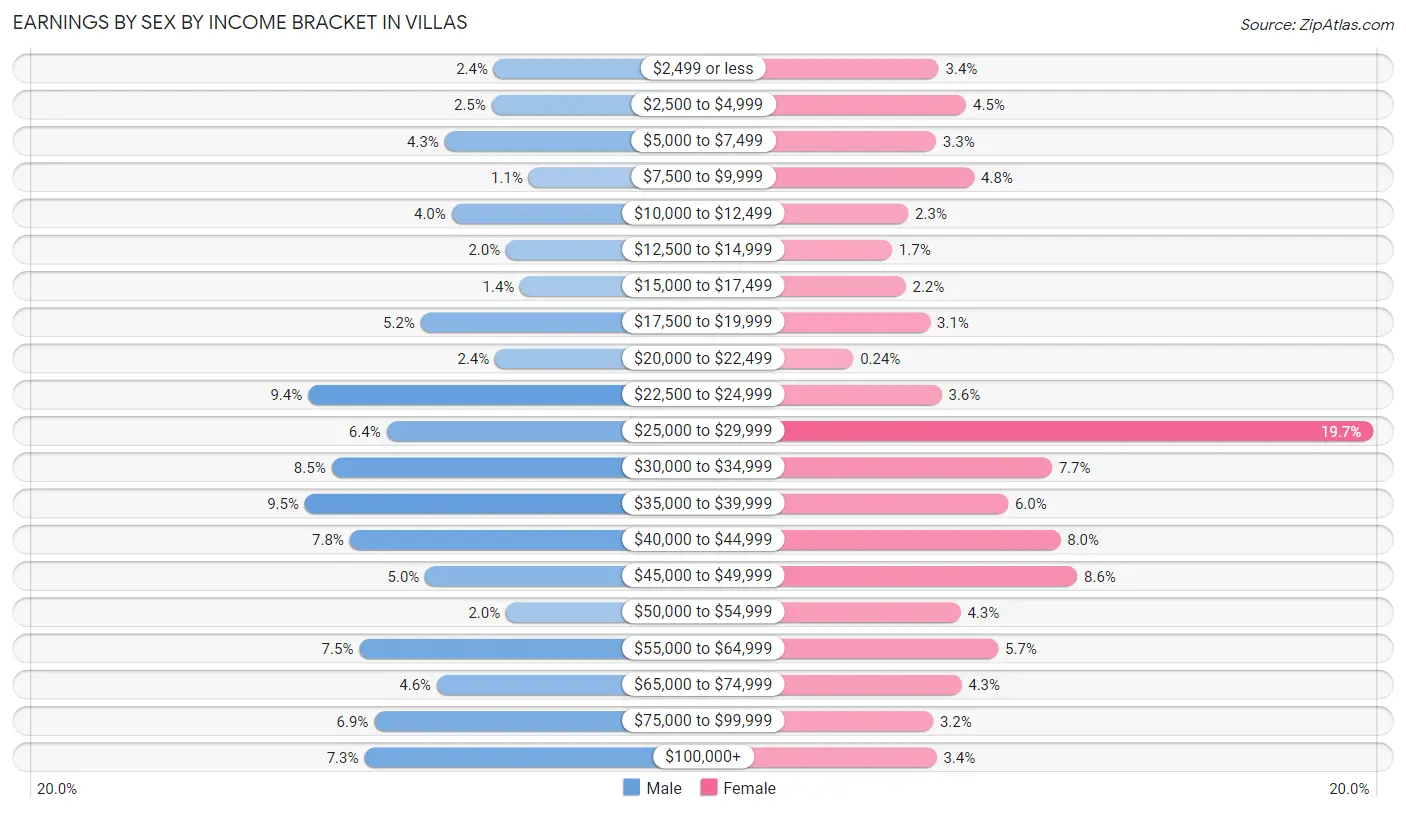
Earnings by Sex by Income Bracket in Villas
The most common earnings brackets in Villas are $35,000 to $39,999 for men (392 | 9.5%) and $25,000 to $29,999 for women (745 | 19.7%).
| Income | Male | Female |
| $2,499 or less | 100 (2.4%) | 130 (3.4%) |
| $2,500 to $4,999 | 103 (2.5%) | 169 (4.5%) |
| $5,000 to $7,499 | 176 (4.3%) | 126 (3.3%) |
| $7,500 to $9,999 | 46 (1.1%) | 180 (4.8%) |
| $10,000 to $12,499 | 165 (4.0%) | 87 (2.3%) |
| $12,500 to $14,999 | 81 (2.0%) | 64 (1.7%) |
| $15,000 to $17,499 | 59 (1.4%) | 83 (2.2%) |
| $17,500 to $19,999 | 213 (5.2%) | 118 (3.1%) |
| $20,000 to $22,499 | 98 (2.4%) | 9 (0.2%) |
| $22,500 to $24,999 | 387 (9.4%) | 134 (3.5%) |
| $25,000 to $29,999 | 266 (6.4%) | 745 (19.7%) |
| $30,000 to $34,999 | 351 (8.5%) | 290 (7.7%) |
| $35,000 to $39,999 | 392 (9.5%) | 228 (6.0%) |
| $40,000 to $44,999 | 323 (7.8%) | 302 (8.0%) |
| $45,000 to $49,999 | 206 (5.0%) | 326 (8.6%) |
| $50,000 to $54,999 | 81 (2.0%) | 161 (4.3%) |
| $55,000 to $64,999 | 308 (7.5%) | 214 (5.7%) |
| $65,000 to $74,999 | 188 (4.5%) | 162 (4.3%) |
| $75,000 to $99,999 | 285 (6.9%) | 122 (3.2%) |
| $100,000+ | 300 (7.3%) | 127 (3.4%) |
| Total | 4,128 (100.0%) | 3,777 (100.0%) |
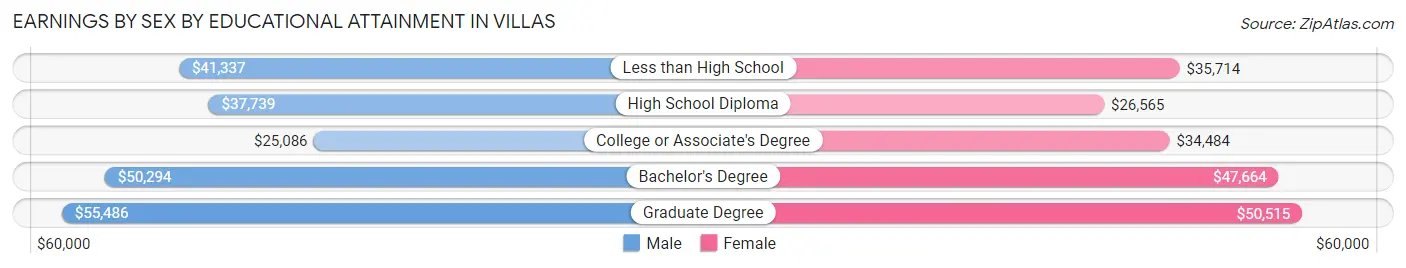
Earnings by Sex by Educational Attainment in Villas
Average earnings in Villas are $38,258 for men and $33,825 for women, a difference of 11.6%. Men with an educational attainment of graduate degree enjoy the highest average annual earnings of $55,486, while those with college or associate's degree education earn the least with $25,086. Women with an educational attainment of graduate degree earn the most with the average annual earnings of $50,515, while those with high school diploma education have the smallest earnings of $26,565.
| Educational Attainment | Male Income | Female Income |
| Less than High School | $41,337 | $35,714 |
| High School Diploma | $37,739 | $26,565 |
| College or Associate's Degree | $25,086 | $34,484 |
| Bachelor's Degree | $50,294 | $47,664 |
| Graduate Degree | $55,486 | $50,515 |
| Total | $38,258 | $33,825 |
Family Income in Villas
Family Income Brackets in Villas
According to the Villas family income data, there are 912 families falling into the $50,000 to $74,999 income range, which is the most common income bracket and makes up 28.5% of all families. Conversely, the $10,000 to $14,999 income bracket is the least frequent group with only 42 families (1.3%) belonging to this category.
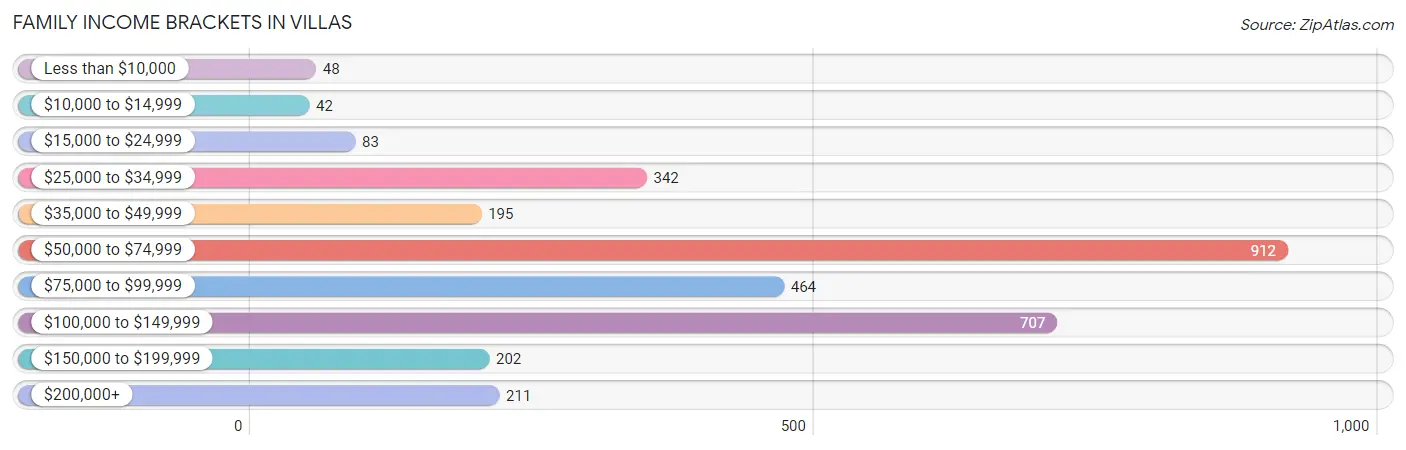
| Income Bracket | # Families | % Families |
| Less than $10,000 | 48 | 1.5% |
| $10,000 to $14,999 | 42 | 1.3% |
| $15,000 to $24,999 | 83 | 2.6% |
| $25,000 to $34,999 | 342 | 10.7% |
| $35,000 to $49,999 | 195 | 6.1% |
| $50,000 to $74,999 | 912 | 28.5% |
| $75,000 to $99,999 | 464 | 14.5% |
| $100,000 to $149,999 | 707 | 22.1% |
| $150,000 to $199,999 | 202 | 6.3% |
| $200,000+ | 211 | 6.6% |
Family Income by Famaliy Size in Villas
4-person families (222 | 6.9%) account for the highest median family income in Villas with $113,636 per family, while 2-person families (2,109 | 65.9%) have the highest median income of $38,310 per family member.
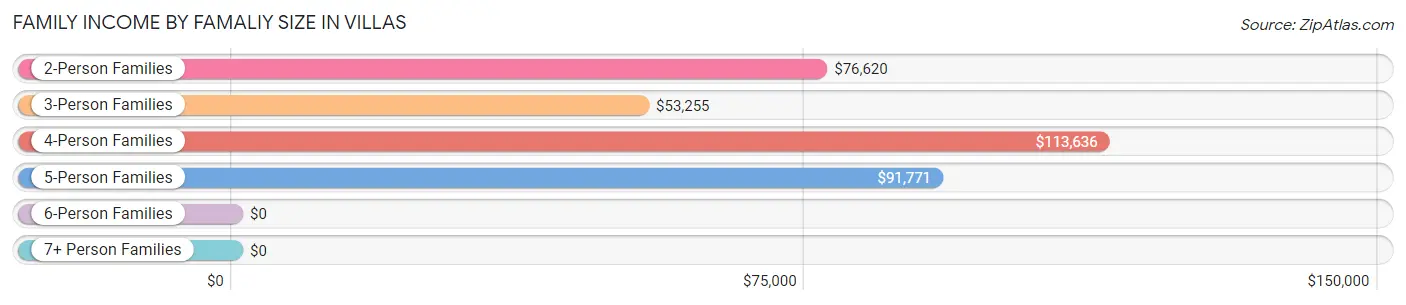
| Income Bracket | # Families | Median Income |
| 2-Person Families | 2,109 (65.9%) | $76,620 |
| 3-Person Families | 748 (23.4%) | $53,255 |
| 4-Person Families | 222 (6.9%) | $113,636 |
| 5-Person Families | 105 (3.3%) | $91,771 |
| 6-Person Families | 15 (0.5%) | $0 |
| 7+ Person Families | 0 (0.0%) | $0 |
| Total | 3,199 (100.0%) | $74,424 |
Family Income by Number of Earners in Villas
The median family income in Villas is $74,424, with families comprising 3+ earners (269) having the highest median family income of $87,969, while families with 1 earner (764) have the lowest median family income of $61,373, accounting for 8.4% and 23.9% of families, respectively.
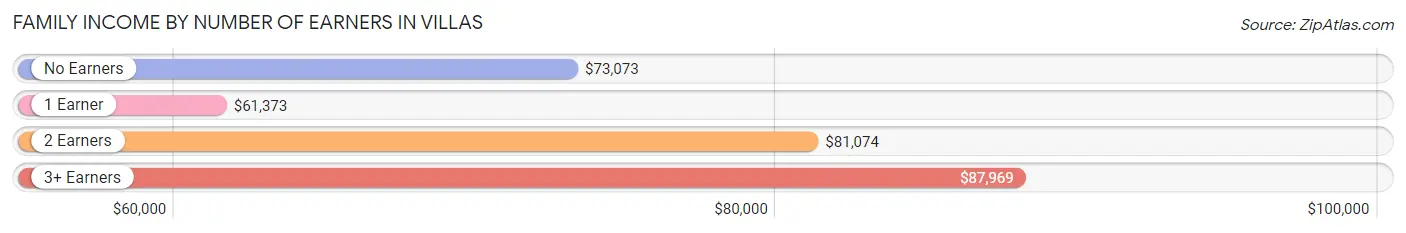
| Number of Earners | # Families | Median Income |
| No Earners | 755 (23.6%) | $73,073 |
| 1 Earner | 764 (23.9%) | $61,373 |
| 2 Earners | 1,411 (44.1%) | $81,074 |
| 3+ Earners | 269 (8.4%) | $87,969 |
| Total | 3,199 (100.0%) | $74,424 |
Household Income in Villas
Household Income Brackets in Villas
With 1,622 households falling in the category, the $50,000 to $74,999 income range is the most frequent in Villas, accounting for 24.4% of all households. In contrast, only 199 households (3.0%) fall into the $10,000 to $14,999 income bracket, making it the least populous group.
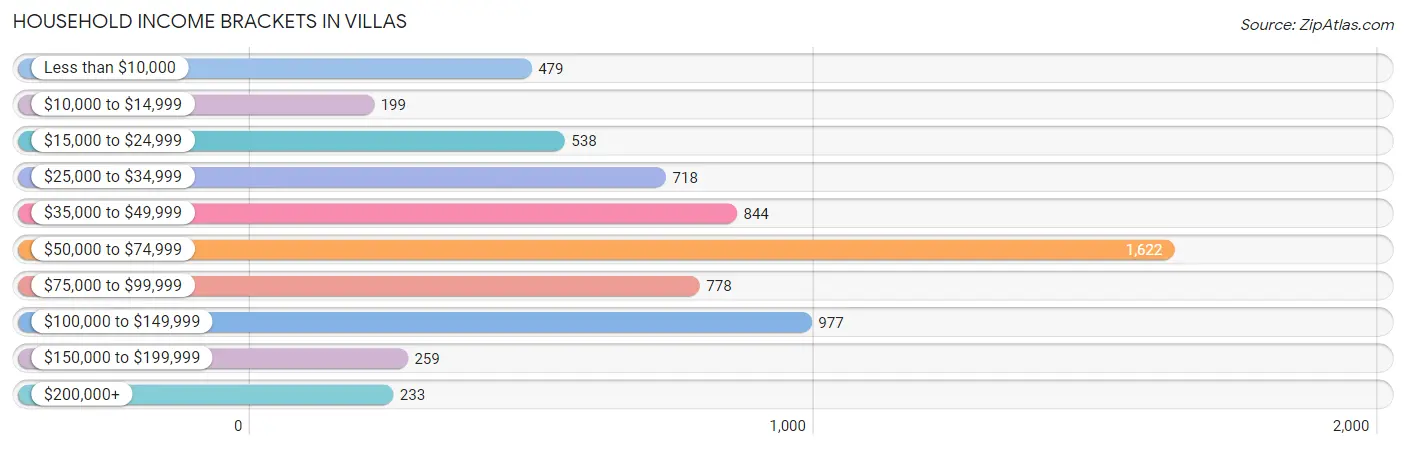
| Income Bracket | # Households | % Households |
| Less than $10,000 | 479 | 7.2% |
| $10,000 to $14,999 | 199 | 3.0% |
| $15,000 to $24,999 | 538 | 8.1% |
| $25,000 to $34,999 | 718 | 10.8% |
| $35,000 to $49,999 | 844 | 12.7% |
| $50,000 to $74,999 | 1,622 | 24.4% |
| $75,000 to $99,999 | 778 | 11.7% |
| $100,000 to $149,999 | 977 | 14.7% |
| $150,000 to $199,999 | 259 | 3.9% |
| $200,000+ | 233 | 3.5% |
Household Income by Householder Age in Villas
The median household income in Villas is $55,165, with the highest median household income of $65,491 found in the 45 to 64 years age bracket for the primary householder. A total of 1,881 households (28.3%) fall into this category. Meanwhile, the 65+ years age bracket for the primary householder has the lowest median household income of $37,883, with 2,757 households (41.5%) in this group.
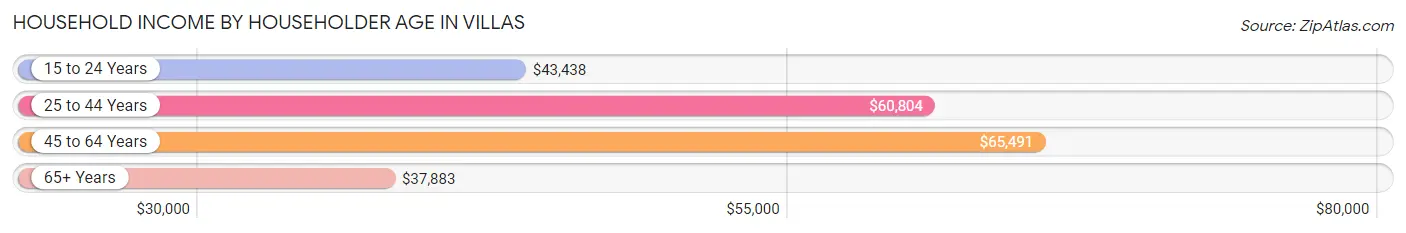
| Income Bracket | # Households | Median Income |
| 15 to 24 Years | 149 (2.2%) | $43,438 |
| 25 to 44 Years | 1,860 (28.0%) | $60,804 |
| 45 to 64 Years | 1,881 (28.3%) | $65,491 |
| 65+ Years | 2,757 (41.5%) | $37,883 |
| Total | 6,647 (100.0%) | $55,165 |
Poverty in Villas
Income Below Poverty by Sex and Age in Villas
With 9.7% poverty level for males and 7.3% for females among the residents of Villas, under 5 year old males and 15 year old females are the most vulnerable to poverty, with 34 males (25.0%) and 11 females (20.0%) in their respective age groups living below the poverty level.
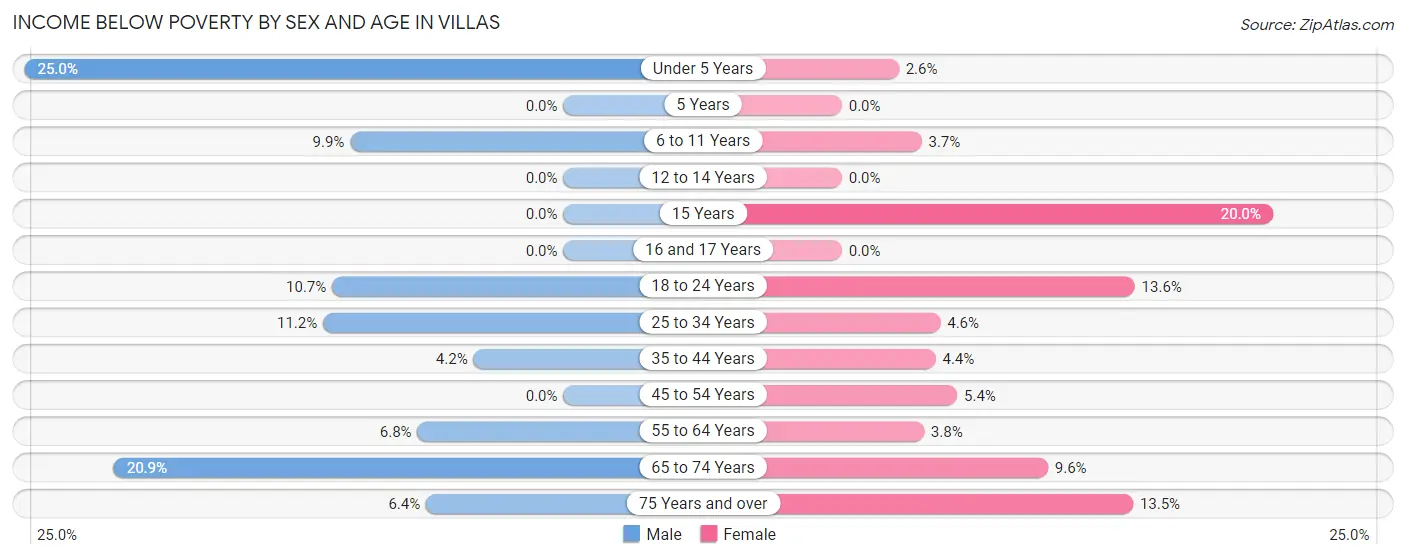
| Age Bracket | Male | Female |
| Under 5 Years | 34 (25.0%) | 7 (2.6%) |
| 5 Years | 0 (0.0%) | 0 (0.0%) |
| 6 to 11 Years | 35 (9.9%) | 6 (3.7%) |
| 12 to 14 Years | 0 (0.0%) | 0 (0.0%) |
| 15 Years | 0 (0.0%) | 11 (20.0%) |
| 16 and 17 Years | 0 (0.0%) | 0 (0.0%) |
| 18 to 24 Years | 53 (10.7%) | 50 (13.6%) |
| 25 to 34 Years | 161 (11.2%) | 42 (4.6%) |
| 35 to 44 Years | 28 (4.2%) | 28 (4.3%) |
| 45 to 54 Years | 0 (0.0%) | 50 (5.3%) |
| 55 to 64 Years | 60 (6.8%) | 44 (3.8%) |
| 65 to 74 Years | 203 (20.9%) | 93 (9.6%) |
| 75 Years and over | 53 (6.4%) | 196 (13.5%) |
| Total | 627 (9.7%) | 527 (7.3%) |
Income Above Poverty by Sex and Age in Villas
According to the poverty statistics in Villas, males aged 5 years and females aged 5 years are the age groups that are most secure financially, with 100.0% of males and 100.0% of females in these age groups living above the poverty line.
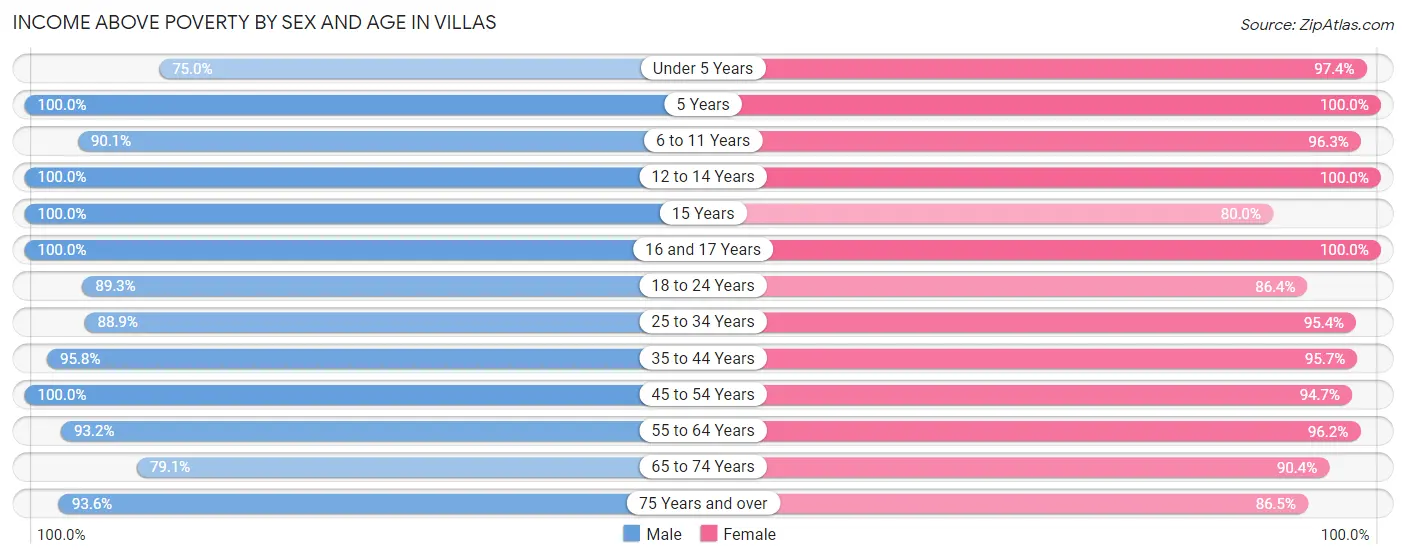
| Age Bracket | Male | Female |
| Under 5 Years | 102 (75.0%) | 258 (97.4%) |
| 5 Years | 14 (100.0%) | 32 (100.0%) |
| 6 to 11 Years | 319 (90.1%) | 156 (96.3%) |
| 12 to 14 Years | 46 (100.0%) | 104 (100.0%) |
| 15 Years | 21 (100.0%) | 44 (80.0%) |
| 16 and 17 Years | 65 (100.0%) | 114 (100.0%) |
| 18 to 24 Years | 441 (89.3%) | 318 (86.4%) |
| 25 to 34 Years | 1,283 (88.8%) | 877 (95.4%) |
| 35 to 44 Years | 644 (95.8%) | 616 (95.7%) |
| 45 to 54 Years | 558 (100.0%) | 884 (94.7%) |
| 55 to 64 Years | 826 (93.2%) | 1,110 (96.2%) |
| 65 to 74 Years | 770 (79.1%) | 880 (90.4%) |
| 75 Years and over | 779 (93.6%) | 1,255 (86.5%) |
| Total | 5,868 (90.3%) | 6,648 (92.7%) |
Income Below Poverty Among Married-Couple Families in Villas
The poverty statistics for married-couple families in Villas show that 2.8% or 59 of the total 2,124 families live below the poverty line. Families with no children have the highest poverty rate of 3.3%, comprising of 59 families. On the other hand, families with 1 or 2 children have the lowest poverty rate of 0.0%, which includes 0 families.
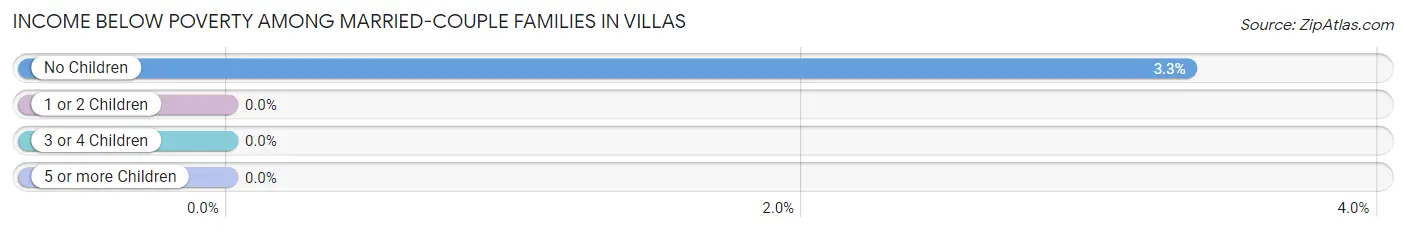
| Children | Above Poverty | Below Poverty |
| No Children | 1,705 (96.7%) | 59 (3.3%) |
| 1 or 2 Children | 304 (100.0%) | 0 (0.0%) |
| 3 or 4 Children | 56 (100.0%) | 0 (0.0%) |
| 5 or more Children | 0 (0.0%) | 0 (0.0%) |
| Total | 2,065 (97.2%) | 59 (2.8%) |
Income Below Poverty Among Single-Parent Households in Villas
According to the poverty data in Villas, 1.8% or 9 single-father households and 12.3% or 72 single-mother households are living below the poverty line. Among single-father households, those with 1 or 2 children have the highest poverty rate, with 9 households (2.9%) experiencing poverty. Likewise, among single-mother households, those with 1 or 2 children have the highest poverty rate, with 72 households (25.0%) falling below the poverty line.
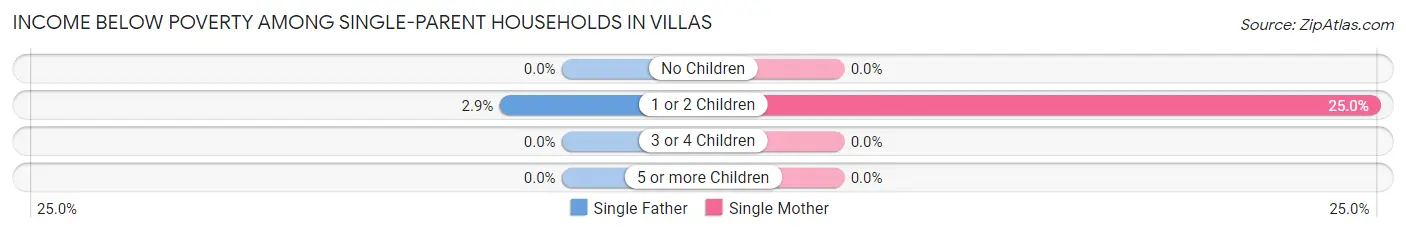
| Children | Single Father | Single Mother |
| No Children | 0 (0.0%) | 0 (0.0%) |
| 1 or 2 Children | 9 (2.9%) | 72 (25.0%) |
| 3 or 4 Children | 0 (0.0%) | 0 (0.0%) |
| 5 or more Children | 0 (0.0%) | 0 (0.0%) |
| Total | 9 (1.8%) | 72 (12.3%) |
Income Below Poverty Among Married-Couple vs Single-Parent Households in Villas
The poverty data for Villas shows that 59 of the married-couple family households (2.8%) and 81 of the single-parent households (7.5%) are living below the poverty level. Within the married-couple family households, those with no children have the highest poverty rate, with 59 households (3.3%) falling below the poverty line. Among the single-parent households, those with 1 or 2 children have the highest poverty rate, with 81 household (13.6%) living below poverty.
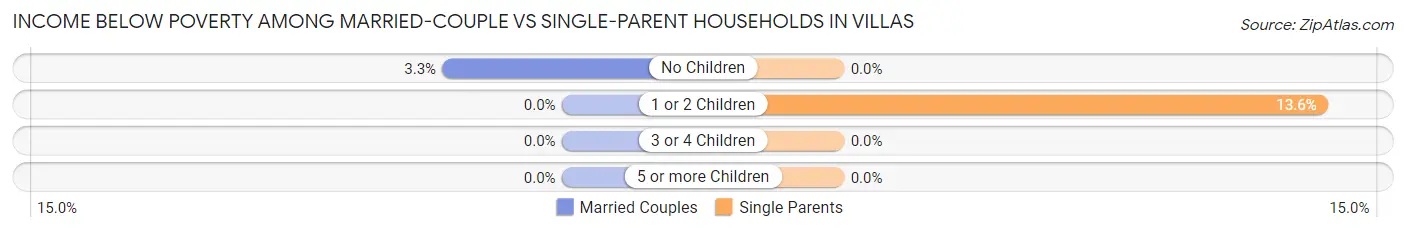
| Children | Married-Couple Families | Single-Parent Households |
| No Children | 59 (3.3%) | 0 (0.0%) |
| 1 or 2 Children | 0 (0.0%) | 81 (13.6%) |
| 3 or 4 Children | 0 (0.0%) | 0 (0.0%) |
| 5 or more Children | 0 (0.0%) | 0 (0.0%) |
| Total | 59 (2.8%) | 81 (7.5%) |
Race in Villas
The most populous races in Villas are White / Caucasian (10,817 | 78.4%), Hispanic or Latino (2,274 | 16.5%), and Two or more Races (1,301 | 9.4%).
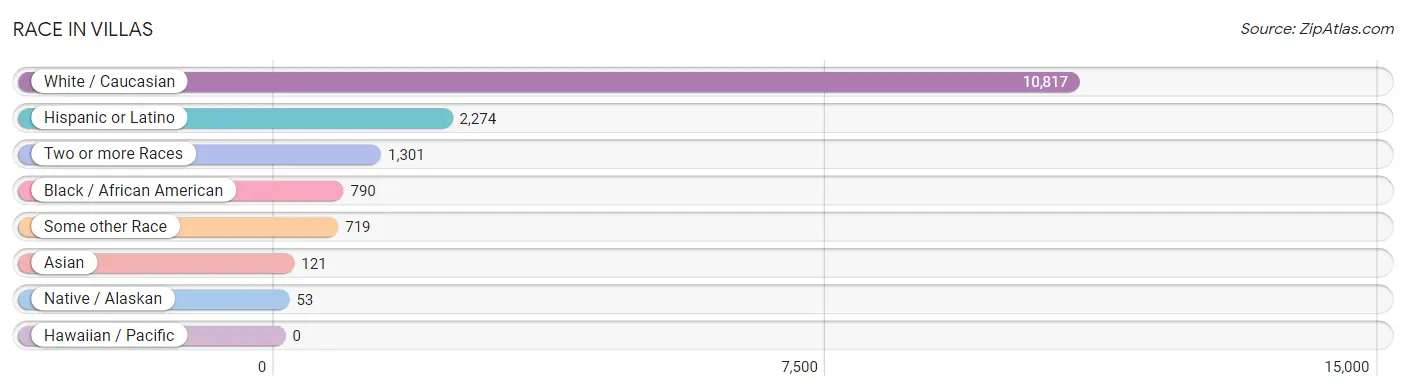
| Race | # Population | % Population |
| Asian | 121 | 0.9% |
| Black / African American | 790 | 5.7% |
| Hawaiian / Pacific | 0 | 0.0% |
| Hispanic or Latino | 2,274 | 16.5% |
| Native / Alaskan | 53 | 0.4% |
| White / Caucasian | 10,817 | 78.4% |
| Two or more Races | 1,301 | 9.4% |
| Some other Race | 719 | 5.2% |
| Total | 13,801 | 100.0% |
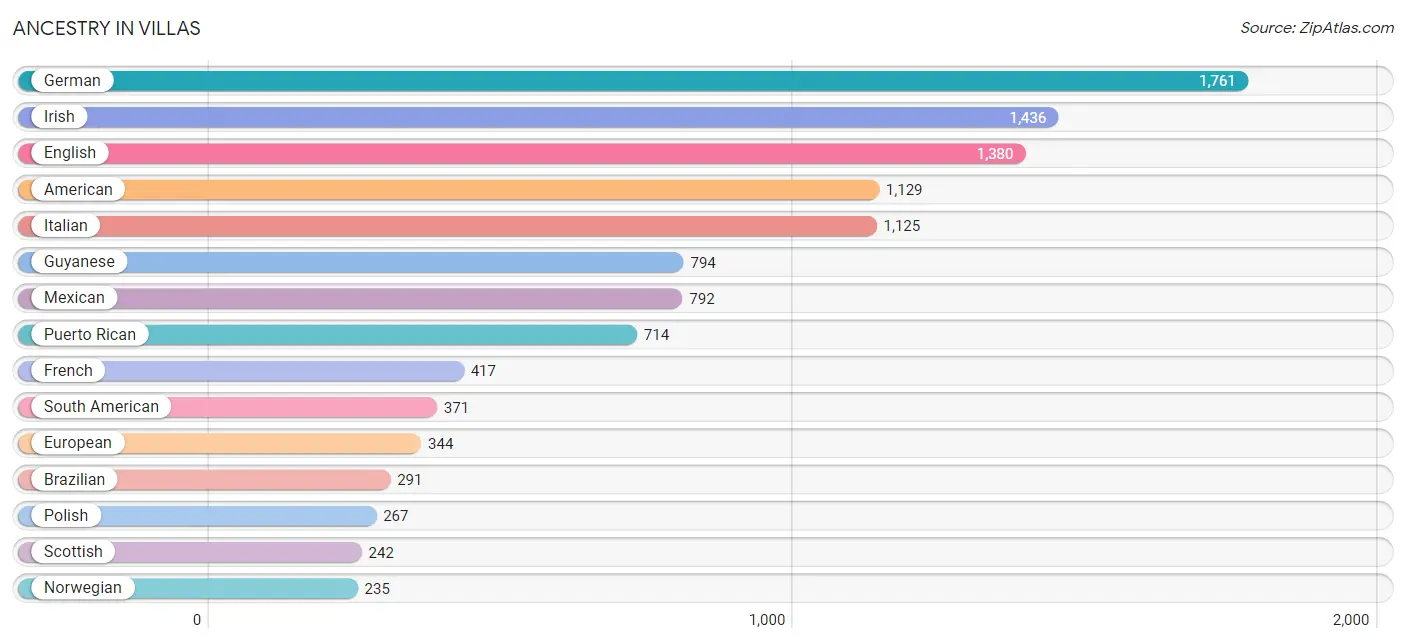
Ancestry in Villas
The most populous ancestries reported in Villas are German (1,761 | 12.8%), Irish (1,436 | 10.4%), English (1,380 | 10.0%), American (1,129 | 8.2%), and Italian (1,125 | 8.2%), together accounting for 49.5% of all Villas residents.
| Ancestry | # Population | % Population |
| African | 17 | 0.1% |
| American | 1,129 | 8.2% |
| Arab | 76 | 0.5% |
| Argentinean | 88 | 0.6% |
| Austrian | 17 | 0.1% |
| Belgian | 24 | 0.2% |
| Bhutanese | 33 | 0.2% |
| Brazilian | 291 | 2.1% |
| British | 18 | 0.1% |
| Canadian | 151 | 1.1% |
| Central American | 47 | 0.3% |
| Cherokee | 29 | 0.2% |
| Chippewa | 22 | 0.2% |
| Choctaw | 14 | 0.1% |
| Colombian | 188 | 1.4% |
| Costa Rican | 25 | 0.2% |
| Croatian | 5 | 0.0% |
| Cuban | 102 | 0.7% |
| Czech | 113 | 0.8% |
| Czechoslovakian | 21 | 0.2% |
| Danish | 34 | 0.3% |
| Dominican | 97 | 0.7% |
| Dutch | 121 | 0.9% |
| Eastern European | 27 | 0.2% |
| Ecuadorian | 36 | 0.3% |
| English | 1,380 | 10.0% |
| European | 344 | 2.5% |
| Filipino | 26 | 0.2% |
| French | 417 | 3.0% |
| French Canadian | 113 | 0.8% |
| German | 1,761 | 12.8% |
| Greek | 187 | 1.3% |
| Guatemalan | 22 | 0.2% |
| Guyanese | 794 | 5.8% |
| Haitian | 24 | 0.2% |
| Hungarian | 58 | 0.4% |
| Indian (Asian) | 102 | 0.7% |
| Irish | 1,436 | 10.4% |
| Italian | 1,125 | 8.2% |
| Jamaican | 46 | 0.3% |
| Korean | 46 | 0.3% |
| Lithuanian | 54 | 0.4% |
| Maltese | 56 | 0.4% |
| Mexican | 792 | 5.7% |
| Mexican American Indian | 12 | 0.1% |
| Northern European | 7 | 0.1% |
| Norwegian | 235 | 1.7% |
| Palestinian | 16 | 0.1% |
| Peruvian | 13 | 0.1% |
| Polish | 267 | 1.9% |
| Portuguese | 71 | 0.5% |
| Puerto Rican | 714 | 5.2% |
| Romanian | 10 | 0.1% |
| Russian | 6 | 0.0% |
| Scandinavian | 73 | 0.5% |
| Scotch-Irish | 121 | 0.9% |
| Scottish | 242 | 1.8% |
| Slovak | 15 | 0.1% |
| Slovene | 10 | 0.1% |
| South American | 371 | 2.7% |
| Spaniard | 36 | 0.3% |
| Spanish | 25 | 0.2% |
| Subsaharan African | 17 | 0.1% |
| Swedish | 191 | 1.4% |
| Swiss | 25 | 0.2% |
| Ukrainian | 55 | 0.4% |
| Venezuelan | 46 | 0.3% |
| Welsh | 18 | 0.1% |
| Yugoslavian | 58 | 0.4% | View All 69 Rows |
Immigrants in Villas
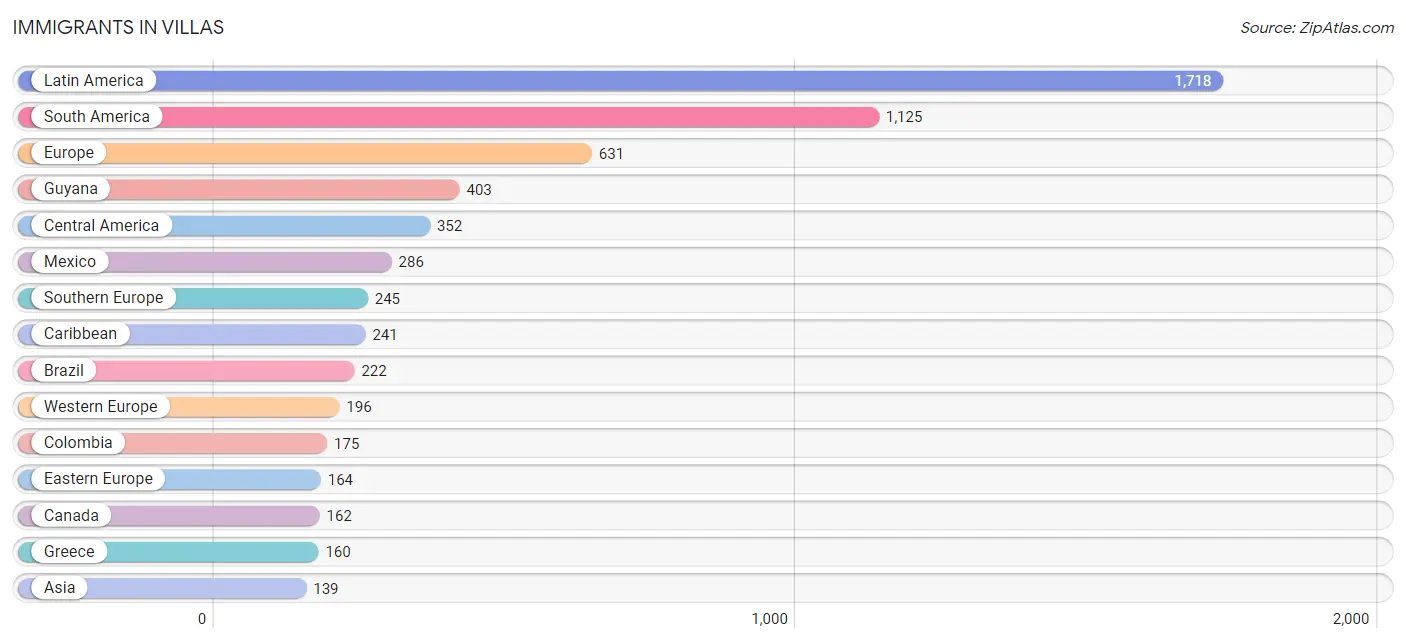
The most numerous immigrant groups reported in Villas came from Latin America (1,718 | 12.4%), South America (1,125 | 8.2%), Europe (631 | 4.6%), Guyana (403 | 2.9%), and Central America (352 | 2.5%), together accounting for 30.6% of all Villas residents.
| Immigration Origin | # Population | % Population |
| Argentina | 115 | 0.8% |
| Asia | 139 | 1.0% |
| Austria | 11 | 0.1% |
| Bosnia and Herzegovina | 31 | 0.2% |
| Brazil | 222 | 1.6% |
| Canada | 162 | 1.2% |
| Caribbean | 241 | 1.8% |
| Central America | 352 | 2.5% |
| China | 93 | 0.7% |
| Colombia | 175 | 1.3% |
| Costa Rica | 25 | 0.2% |
| Cuba | 38 | 0.3% |
| Czechoslovakia | 42 | 0.3% |
| Dominican Republic | 97 | 0.7% |
| Eastern Asia | 101 | 0.7% |
| Eastern Europe | 164 | 1.2% |
| Ecuador | 61 | 0.4% |
| El Salvador | 22 | 0.2% |
| England | 18 | 0.1% |
| Europe | 631 | 4.6% |
| France | 60 | 0.4% |
| Germany | 49 | 0.4% |
| Greece | 160 | 1.2% |
| Guatemala | 19 | 0.1% |
| Guyana | 403 | 2.9% |
| Hong Kong | 10 | 0.1% |
| Hungary | 38 | 0.3% |
| Italy | 29 | 0.2% |
| Jamaica | 106 | 0.8% |
| Japan | 8 | 0.1% |
| Latin America | 1,718 | 12.4% |
| Mexico | 286 | 2.1% |
| Netherlands | 14 | 0.1% |
| Northern Europe | 26 | 0.2% |
| Peru | 13 | 0.1% |
| Philippines | 11 | 0.1% |
| Russia | 12 | 0.1% |
| South America | 1,125 | 8.2% |
| South Eastern Asia | 11 | 0.1% |
| Southern Europe | 245 | 1.8% |
| Taiwan | 42 | 0.3% |
| Turkey | 27 | 0.2% |
| Ukraine | 41 | 0.3% |
| Venezuela | 136 | 1.0% |
| Western Asia | 27 | 0.2% |
| Western Europe | 196 | 1.4% | View All 46 Rows |
Sex and Age in Villas
Sex and Age in Villas
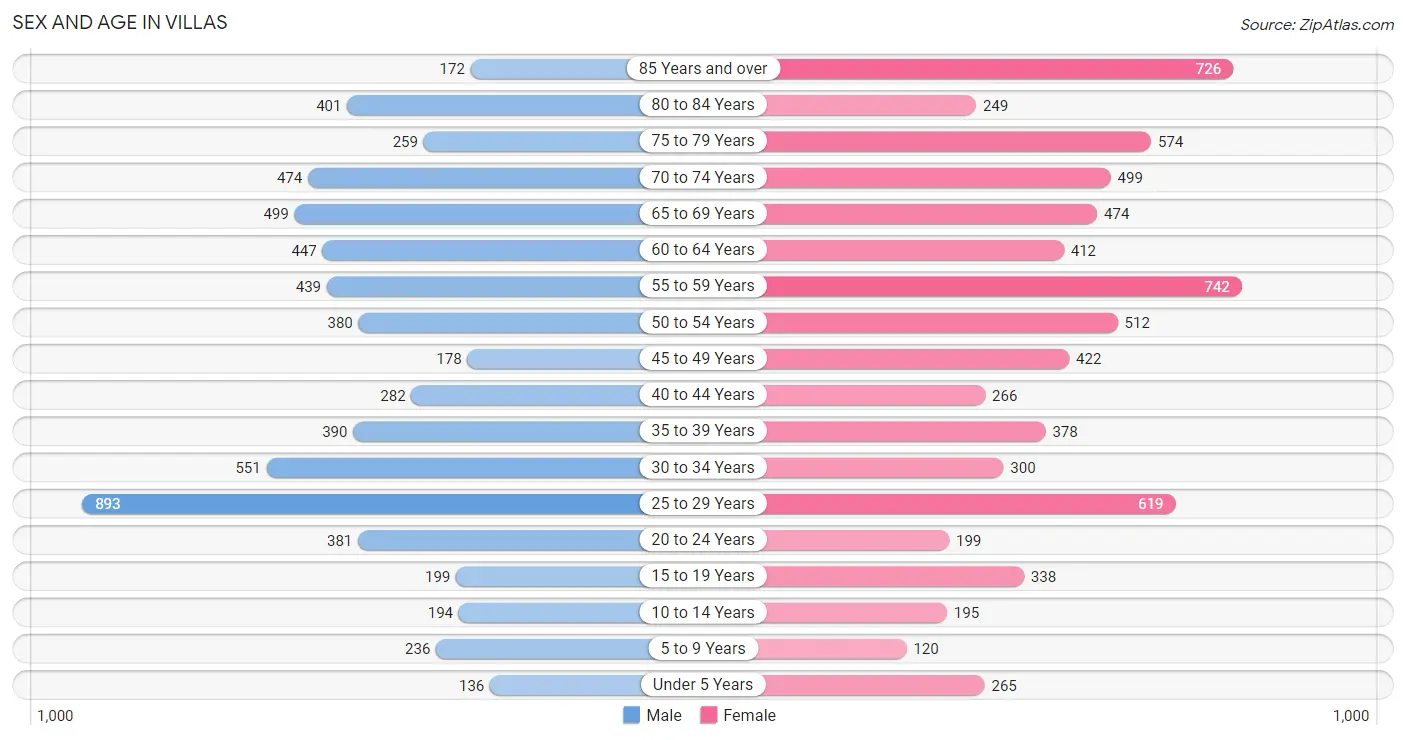
The most populous age groups in Villas are 25 to 29 Years (893 | 13.7%) for men and 55 to 59 Years (742 | 10.2%) for women.
| Age Bracket | Male | Female |
| Under 5 Years | 136 (2.1%) | 265 (3.6%) |
| 5 to 9 Years | 236 (3.6%) | 120 (1.7%) |
| 10 to 14 Years | 194 (3.0%) | 195 (2.7%) |
| 15 to 19 Years | 199 (3.1%) | 338 (4.6%) |
| 20 to 24 Years | 381 (5.9%) | 199 (2.7%) |
| 25 to 29 Years | 893 (13.7%) | 619 (8.5%) |
| 30 to 34 Years | 551 (8.5%) | 300 (4.1%) |
| 35 to 39 Years | 390 (6.0%) | 378 (5.2%) |
| 40 to 44 Years | 282 (4.3%) | 266 (3.6%) |
| 45 to 49 Years | 178 (2.7%) | 422 (5.8%) |
| 50 to 54 Years | 380 (5.8%) | 512 (7.0%) |
| 55 to 59 Years | 439 (6.7%) | 742 (10.2%) |
| 60 to 64 Years | 447 (6.9%) | 412 (5.7%) |
| 65 to 69 Years | 499 (7.7%) | 474 (6.5%) |
| 70 to 74 Years | 474 (7.3%) | 499 (6.8%) |
| 75 to 79 Years | 259 (4.0%) | 574 (7.9%) |
| 80 to 84 Years | 401 (6.2%) | 249 (3.4%) |
| 85 Years and over | 172 (2.6%) | 726 (10.0%) |
| Total | 6,511 (100.0%) | 7,290 (100.0%) |
Families and Households in Villas
Median Family Size in Villas
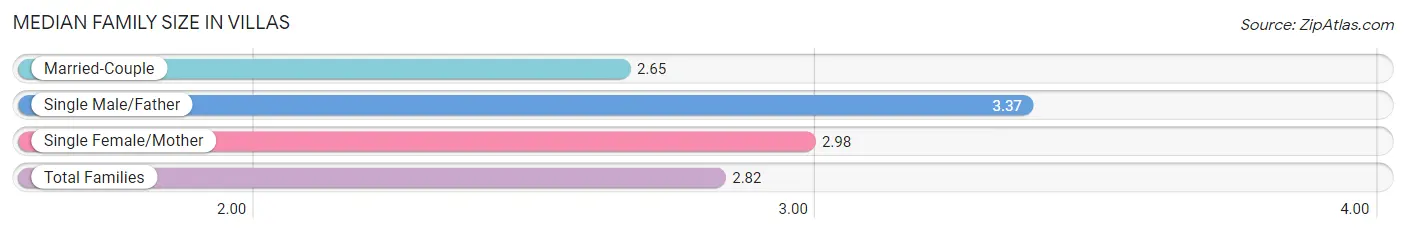
The median family size in Villas is 2.82 persons per family, with single male/father families (489 | 15.3%) accounting for the largest median family size of 3.37 persons per family. On the other hand, married-couple families (2,124 | 66.4%) represent the smallest median family size with 2.65 persons per family.
| Family Type | # Families | Family Size |
| Married-Couple | 2,124 (66.4%) | 2.65 |
| Single Male/Father | 489 (15.3%) | 3.37 |
| Single Female/Mother | 586 (18.3%) | 2.98 |
| Total Families | 3,199 (100.0%) | 2.82 |
Median Household Size in Villas
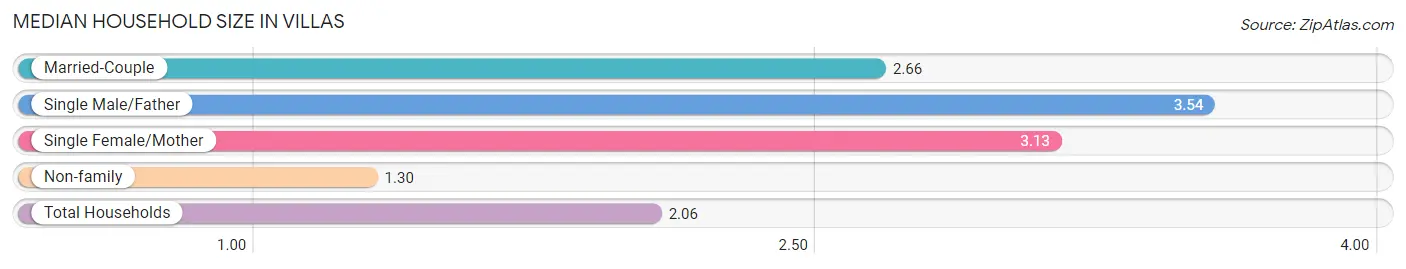
The median household size in Villas is 2.06 persons per household, with single male/father households (489 | 7.4%) accounting for the largest median household size of 3.54 persons per household. non-family households (3,448 | 51.9%) represent the smallest median household size with 1.30 persons per household.
| Household Type | # Households | Household Size |
| Married-Couple | 2,124 (32.0%) | 2.66 |
| Single Male/Father | 489 (7.4%) | 3.54 |
| Single Female/Mother | 586 (8.8%) | 3.13 |
| Non-family | 3,448 (51.9%) | 1.30 |
| Total Households | 6,647 (100.0%) | 2.06 |
Household Size by Marriage Status in Villas
Out of a total of 6,647 households in Villas, 3,199 (48.1%) are family households, while 3,448 (51.9%) are nonfamily households. The most numerous type of family households are 2-person households, comprising 2,046, and the most common type of nonfamily households are 1-person households, comprising 2,757.
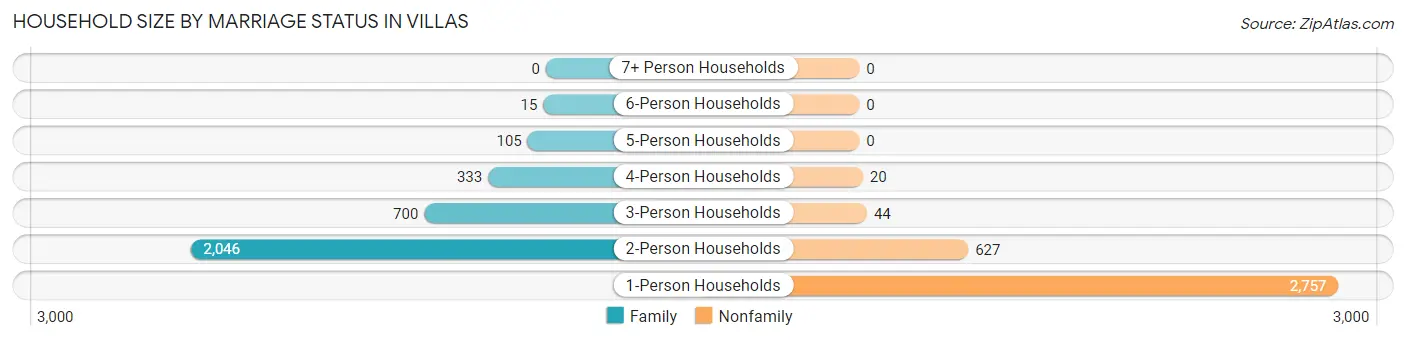
| Household Size | Family Households | Nonfamily Households |
| 1-Person Households | - | 2,757 (41.5%) |
| 2-Person Households | 2,046 (30.8%) | 627 (9.4%) |
| 3-Person Households | 700 (10.5%) | 44 (0.7%) |
| 4-Person Households | 333 (5.0%) | 20 (0.3%) |
| 5-Person Households | 105 (1.6%) | 0 (0.0%) |
| 6-Person Households | 15 (0.2%) | 0 (0.0%) |
| 7+ Person Households | 0 (0.0%) | 0 (0.0%) |
| Total | 3,199 (48.1%) | 3,448 (51.9%) |
Female Fertility in Villas
Fertility by Age in Villas
| Age Bracket | Women with Births | Births / 1,000 Women |
| 15 to 19 years | 0 (0.0%) | 0.0 |
| 20 to 34 years | 0 (0.0%) | 0.0 |
| 35 to 50 years | 0 (0.0%) | 0.0 |
| Total | 0 (0.0%) | 0.0 |
Fertility by Age by Marriage Status in Villas
| Age Bracket | Married | Unmarried |
| 15 to 19 years | 0 (0.0%) | 0 (0.0%) |
| 20 to 34 years | 0 (0.0%) | 0 (0.0%) |
| 35 to 50 years | 0 (0.0%) | 0 (0.0%) |
| Total | 0 (0.0%) | 0 (0.0%) |
Fertility by Education in Villas
| Educational Attainment | Women with Births | Births / 1,000 Women |
| Less than High School | 0 (0.0%) | 0.0 |
| High School Diploma | 0 (0.0%) | 0.0 |
| College or Associate's Degree | 0 (0.0%) | 0.0 |
| Bachelor's Degree | 0 (0.0%) | 0.0 |
| Graduate Degree | 0 (0.0%) | 0.0 |
| Total | 0 (0.0%) | 0.0 |
Fertility by Education by Marriage Status in Villas
| Educational Attainment | Married | Unmarried |
| Less than High School | 0 (0.0%) | 0 (0.0%) |
| High School Diploma | 0 (0.0%) | 0 (0.0%) |
| College or Associate's Degree | 0 (0.0%) | 0 (0.0%) |
| Bachelor's Degree | 0 (0.0%) | 0 (0.0%) |
| Graduate Degree | 0 (0.0%) | 0 (0.0%) |
| Total | 0 (0.0%) | 0 (0.0%) |
Employment Characteristics in Villas
Employment by Class of Employer in Villas
Among the 7,073 employed individuals in Villas, private company employees (5,153 | 72.9%), local government employees (582 | 8.2%), and not-for-profit organizations (478 | 6.8%) make up the most common classes of employment.
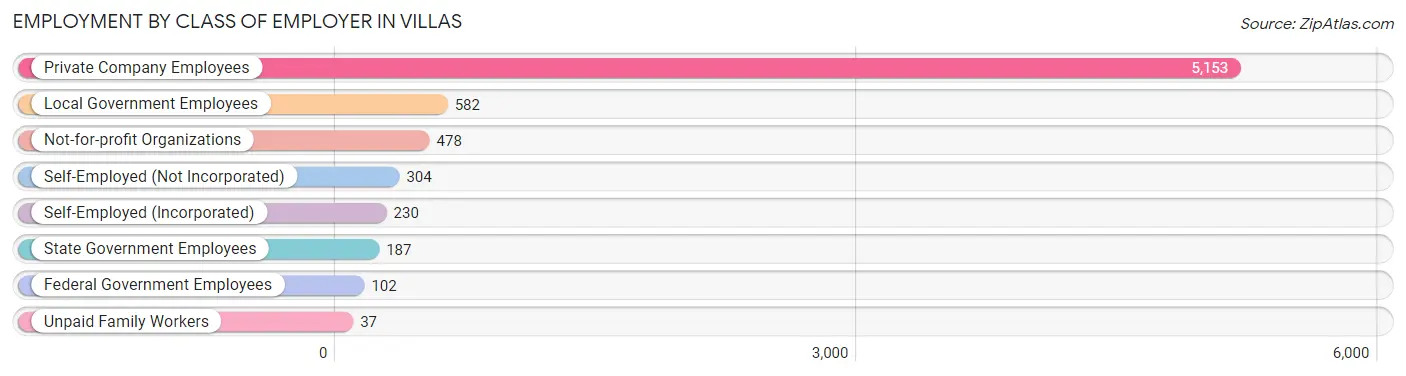
| Employer Class | # Employees | % Employees |
| Private Company Employees | 5,153 | 72.9% |
| Self-Employed (Incorporated) | 230 | 3.3% |
| Self-Employed (Not Incorporated) | 304 | 4.3% |
| Not-for-profit Organizations | 478 | 6.8% |
| Local Government Employees | 582 | 8.2% |
| State Government Employees | 187 | 2.6% |
| Federal Government Employees | 102 | 1.4% |
| Unpaid Family Workers | 37 | 0.5% |
| Total | 7,073 | 100.0% |
Employment Status by Age in Villas
According to the labor force statistics for Villas, out of the total population over 16 years of age (12,579), 59.7% or 7,510 individuals are in the labor force, with 3.5% or 263 of them unemployed. The age group with the highest labor force participation rate is 25 to 29 years, with 98.5% or 1,489 individuals in the labor force. Within the labor force, the 75 years and over age range has the highest percentage of unemployed individuals, with 10.5% or 17 of them being unemployed.
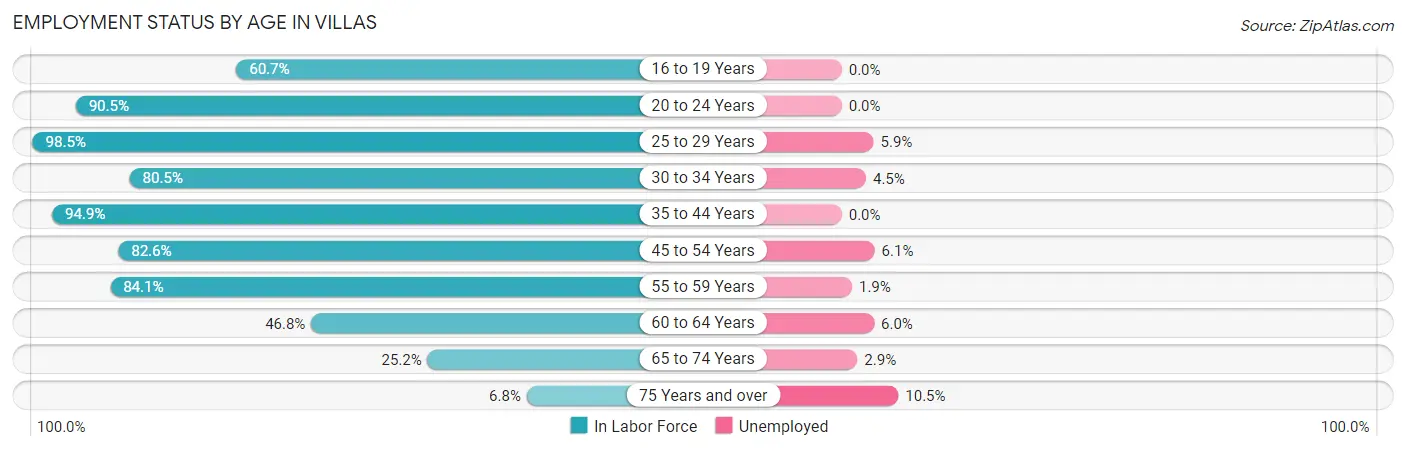
| Age Bracket | In Labor Force | Unemployed |
| 16 to 19 Years | 280 (60.7%) | 0 (0.0%) |
| 20 to 24 Years | 525 (90.5%) | 0 (0.0%) |
| 25 to 29 Years | 1,489 (98.5%) | 88 (5.9%) |
| 30 to 34 Years | 685 (80.5%) | 31 (4.5%) |
| 35 to 44 Years | 1,249 (94.9%) | 0 (0.0%) |
| 45 to 54 Years | 1,232 (82.6%) | 75 (6.1%) |
| 55 to 59 Years | 993 (84.1%) | 19 (1.9%) |
| 60 to 64 Years | 402 (46.8%) | 24 (6.0%) |
| 65 to 74 Years | 490 (25.2%) | 14 (2.9%) |
| 75 Years and over | 162 (6.8%) | 17 (10.5%) |
| Total | 7,510 (59.7%) | 263 (3.5%) |
Employment Status by Educational Attainment in Villas
According to labor force statistics for Villas, 83.9% of individuals (6,050) out of the total population between 25 and 64 years of age (7,211) are in the labor force, with 3.9% or 236 of them being unemployed. The group with the highest labor force participation rate are those with the educational attainment of high school diploma, with 88.0% or 1,979 individuals in the labor force. Within the labor force, individuals with college / associate degree education have the highest percentage of unemployment, with 6.8% or 134 of them being unemployed.
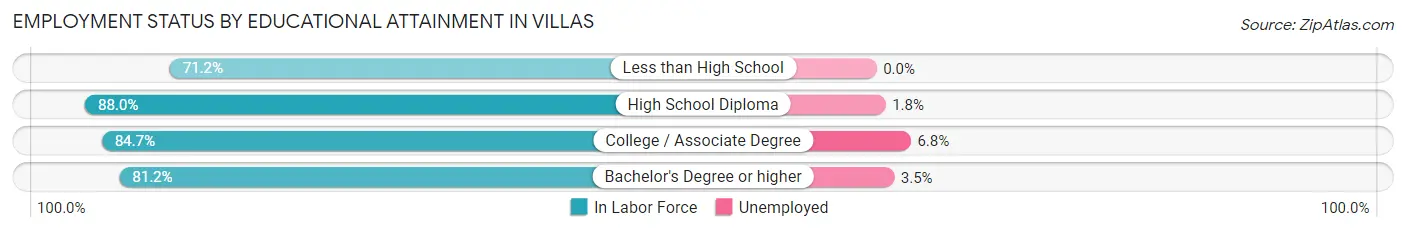
| Educational Attainment | In Labor Force | Unemployed |
| Less than High School | 275 (71.2%) | 0 (0.0%) |
| High School Diploma | 1,979 (88.0%) | 40 (1.8%) |
| College / Associate Degree | 1,964 (84.7%) | 158 (6.8%) |
| Bachelor's Degree or higher | 1,833 (81.2%) | 79 (3.5%) |
| Total | 6,050 (83.9%) | 281 (3.9%) |
Employment Occupations by Sex in Villas
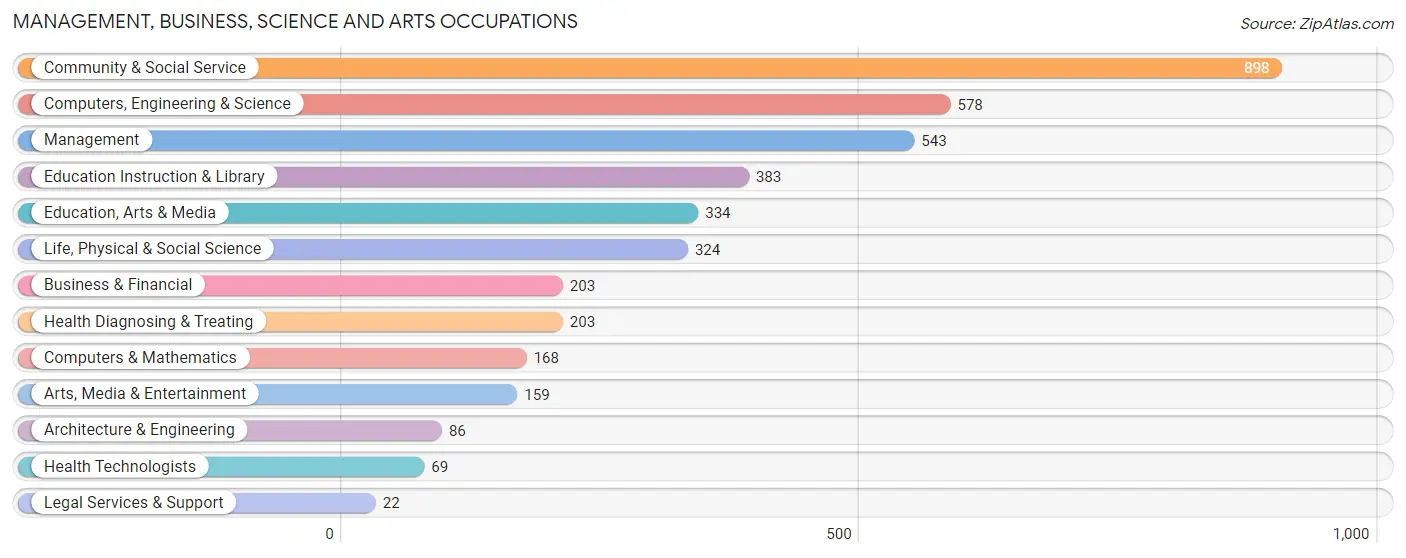
Management, Business, Science and Arts Occupations
The most common Management, Business, Science and Arts occupations in Villas are Community & Social Service (898 | 12.5%), Computers, Engineering & Science (578 | 8.0%), Management (543 | 7.6%), Education Instruction & Library (383 | 5.3%), and Education, Arts & Media (334 | 4.6%).
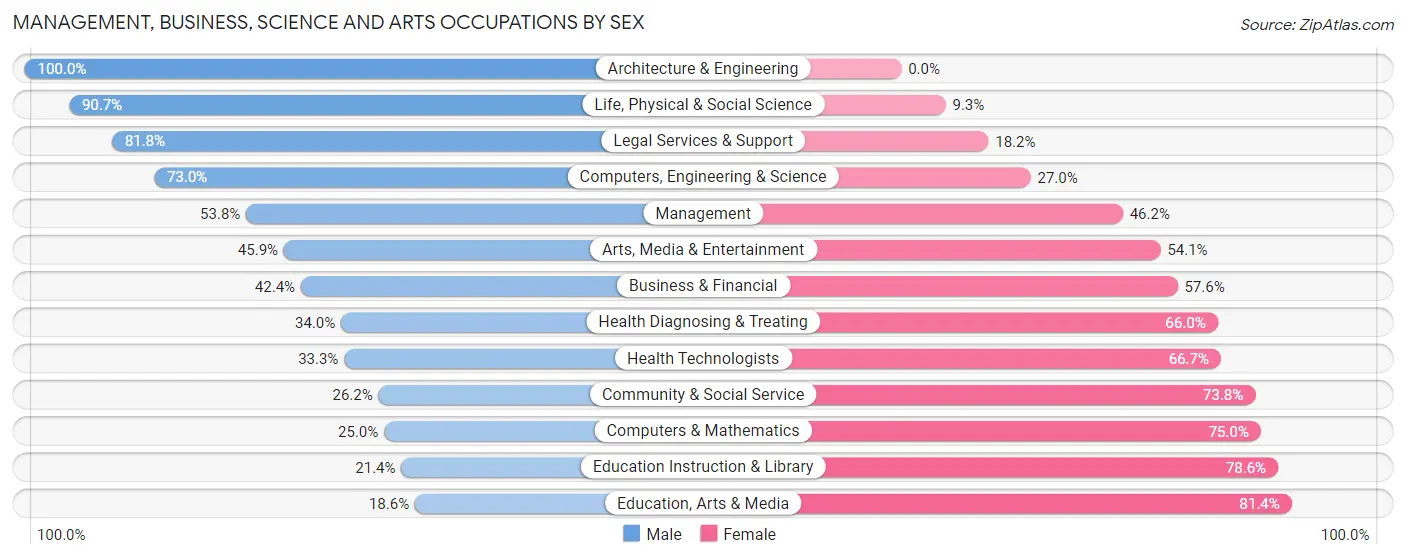
Management, Business, Science and Arts Occupations by Sex
Within the Management, Business, Science and Arts occupations in Villas, the most male-oriented occupations are Architecture & Engineering (100.0%), Life, Physical & Social Science (90.7%), and Legal Services & Support (81.8%), while the most female-oriented occupations are Education, Arts & Media (81.4%), Education Instruction & Library (78.6%), and Computers & Mathematics (75.0%).
| Occupation | Male | Female |
| Management | 292 (53.8%) | 251 (46.2%) |
| Business & Financial | 86 (42.4%) | 117 (57.6%) |
| Computers, Engineering & Science | 422 (73.0%) | 156 (27.0%) |
| Computers & Mathematics | 42 (25.0%) | 126 (75.0%) |
| Architecture & Engineering | 86 (100.0%) | 0 (0.0%) |
| Life, Physical & Social Science | 294 (90.7%) | 30 (9.3%) |
| Community & Social Service | 235 (26.2%) | 663 (73.8%) |
| Education, Arts & Media | 62 (18.6%) | 272 (81.4%) |
| Legal Services & Support | 18 (81.8%) | 4 (18.2%) |
| Education Instruction & Library | 82 (21.4%) | 301 (78.6%) |
| Arts, Media & Entertainment | 73 (45.9%) | 86 (54.1%) |
| Health Diagnosing & Treating | 69 (34.0%) | 134 (66.0%) |
| Health Technologists | 23 (33.3%) | 46 (66.7%) |
| Total (Category) | 1,104 (45.5%) | 1,321 (54.5%) |
| Total (Overall) | 3,749 (52.2%) | 3,436 (47.8%) |
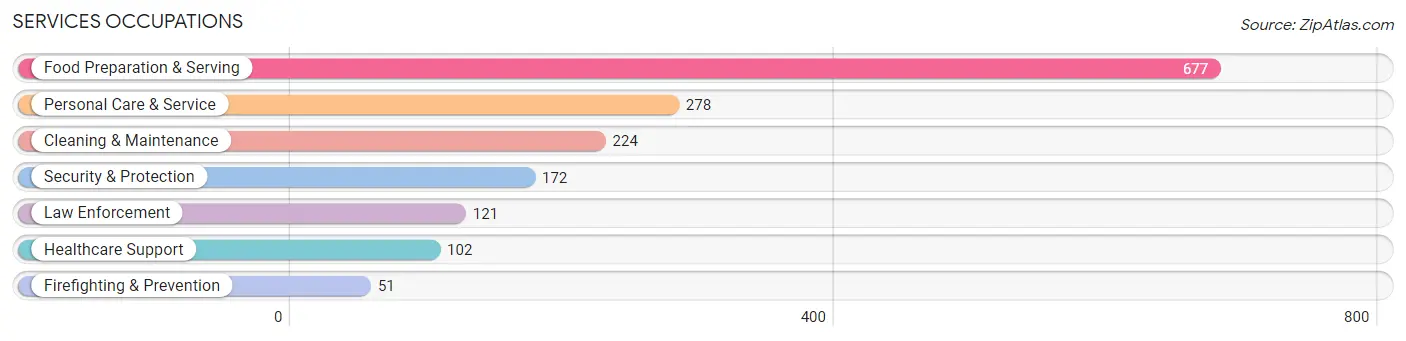
Services Occupations
The most common Services occupations in Villas are Food Preparation & Serving (677 | 9.4%), Personal Care & Service (278 | 3.9%), Cleaning & Maintenance (224 | 3.1%), Security & Protection (172 | 2.4%), and Law Enforcement (121 | 1.7%).
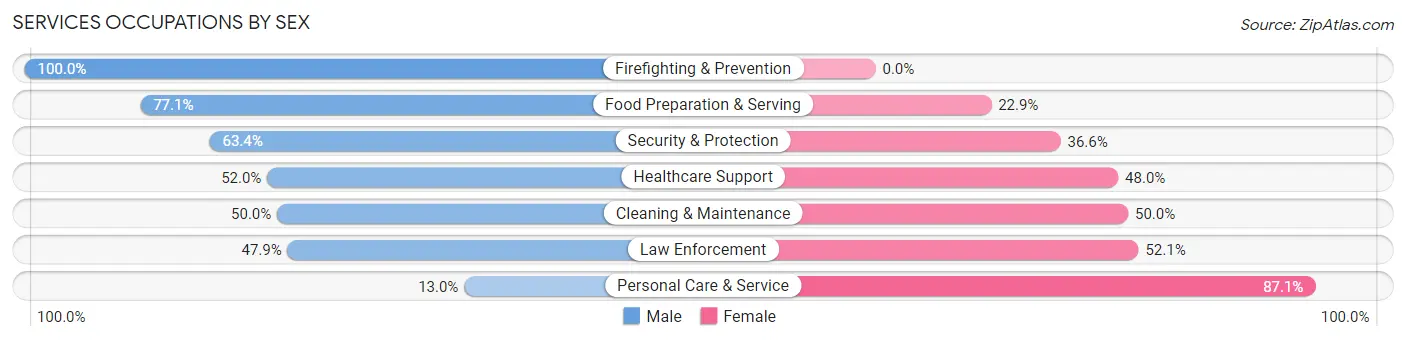
Services Occupations by Sex
Within the Services occupations in Villas, the most male-oriented occupations are Firefighting & Prevention (100.0%), Food Preparation & Serving (77.1%), and Security & Protection (63.4%), while the most female-oriented occupations are Personal Care & Service (87.1%), Law Enforcement (52.1%), and Cleaning & Maintenance (50.0%).
| Occupation | Male | Female |
| Healthcare Support | 53 (52.0%) | 49 (48.0%) |
| Security & Protection | 109 (63.4%) | 63 (36.6%) |
| Firefighting & Prevention | 51 (100.0%) | 0 (0.0%) |
| Law Enforcement | 58 (47.9%) | 63 (52.1%) |
| Food Preparation & Serving | 522 (77.1%) | 155 (22.9%) |
| Cleaning & Maintenance | 112 (50.0%) | 112 (50.0%) |
| Personal Care & Service | 36 (13.0%) | 242 (87.1%) |
| Total (Category) | 832 (57.3%) | 621 (42.7%) |
| Total (Overall) | 3,749 (52.2%) | 3,436 (47.8%) |
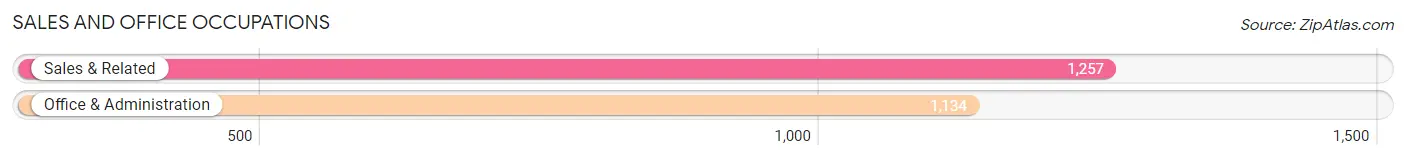
Sales and Office Occupations
The most common Sales and Office occupations in Villas are Sales & Related (1,257 | 17.5%), and Office & Administration (1,134 | 15.8%).
Sales and Office Occupations by Sex
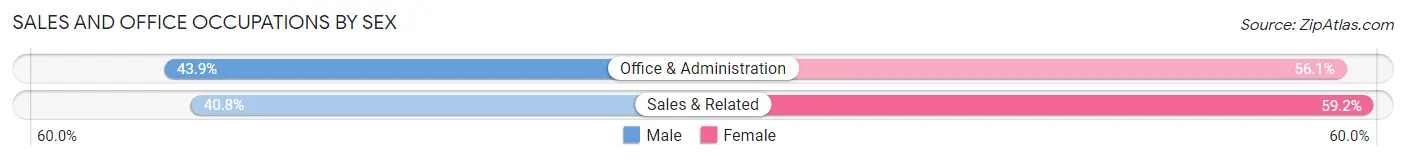
| Occupation | Male | Female |
| Sales & Related | 513 (40.8%) | 744 (59.2%) |
| Office & Administration | 498 (43.9%) | 636 (56.1%) |
| Total (Category) | 1,011 (42.3%) | 1,380 (57.7%) |
| Total (Overall) | 3,749 (52.2%) | 3,436 (47.8%) |
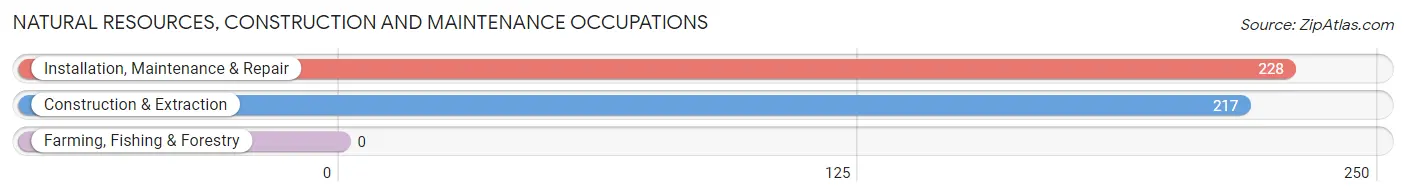
Natural Resources, Construction and Maintenance Occupations
The most common Natural Resources, Construction and Maintenance occupations in Villas are Installation, Maintenance & Repair (228 | 3.2%), and Construction & Extraction (217 | 3.0%).
Natural Resources, Construction and Maintenance Occupations by Sex
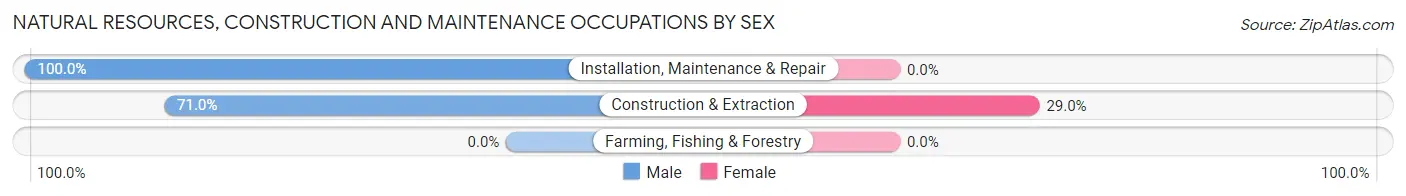
| Occupation | Male | Female |
| Farming, Fishing & Forestry | 0 (0.0%) | 0 (0.0%) |
| Construction & Extraction | 154 (71.0%) | 63 (29.0%) |
| Installation, Maintenance & Repair | 228 (100.0%) | 0 (0.0%) |
| Total (Category) | 382 (85.8%) | 63 (14.2%) |
| Total (Overall) | 3,749 (52.2%) | 3,436 (47.8%) |
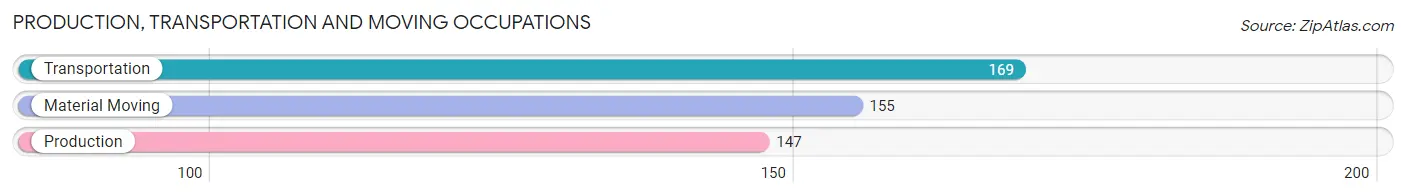
Production, Transportation and Moving Occupations
The most common Production, Transportation and Moving occupations in Villas are Transportation (169 | 2.4%), Material Moving (155 | 2.2%), and Production (147 | 2.1%).
Production, Transportation and Moving Occupations by Sex
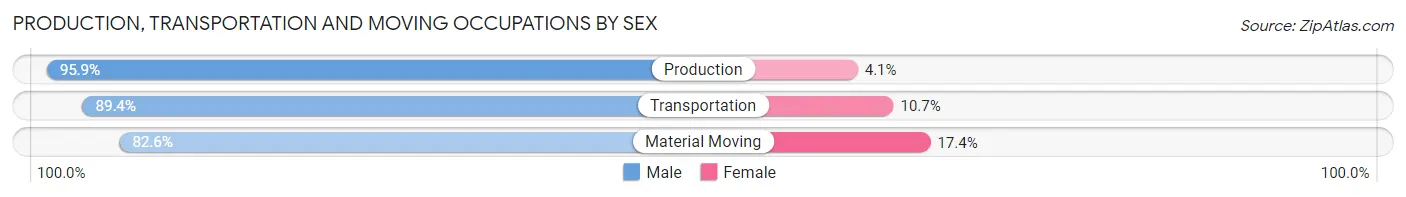
| Occupation | Male | Female |
| Production | 141 (95.9%) | 6 (4.1%) |
| Transportation | 151 (89.3%) | 18 (10.6%) |
| Material Moving | 128 (82.6%) | 27 (17.4%) |
| Total (Category) | 420 (89.2%) | 51 (10.8%) |
| Total (Overall) | 3,749 (52.2%) | 3,436 (47.8%) |
Employment Industries by Sex in Villas
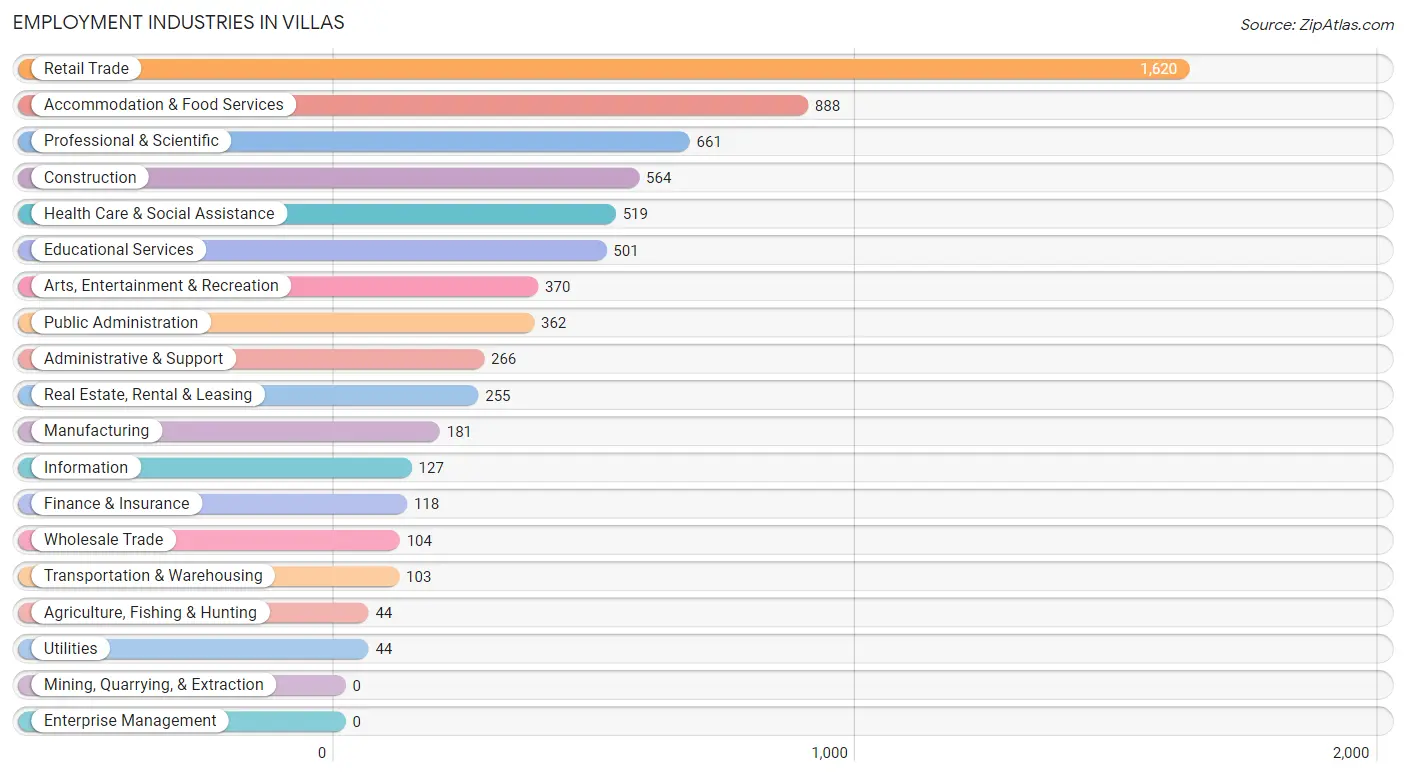
Employment Industries in Villas
The major employment industries in Villas include Retail Trade (1,620 | 22.6%), Accommodation & Food Services (888 | 12.4%), Professional & Scientific (661 | 9.2%), Construction (564 | 7.9%), and Health Care & Social Assistance (519 | 7.2%).
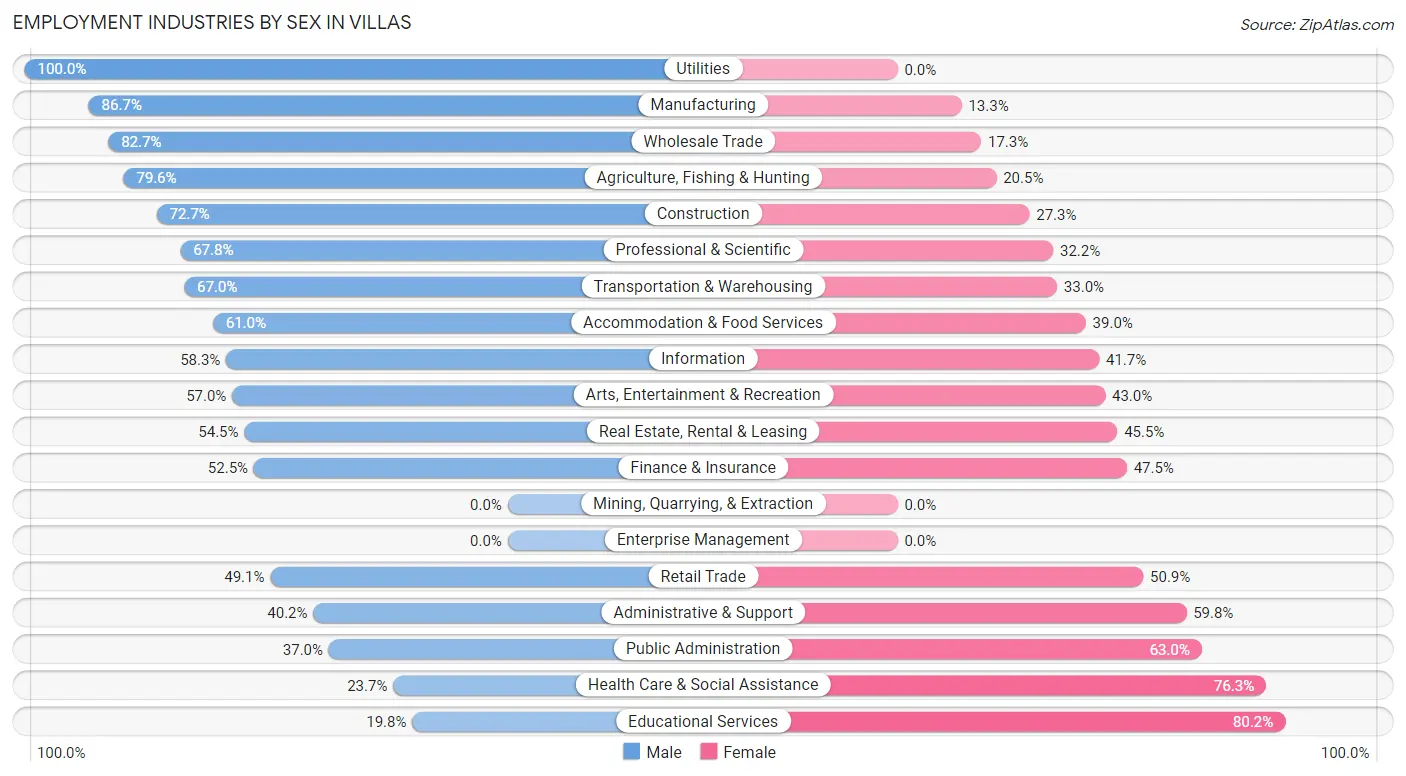
Employment Industries by Sex in Villas
The Villas industries that see more men than women are Utilities (100.0%), Manufacturing (86.7%), and Wholesale Trade (82.7%), whereas the industries that tend to have a higher number of women are Educational Services (80.2%), Health Care & Social Assistance (76.3%), and Public Administration (63.0%).
| Industry | Male | Female |
| Agriculture, Fishing & Hunting | 35 (79.5%) | 9 (20.4%) |
| Mining, Quarrying, & Extraction | 0 (0.0%) | 0 (0.0%) |
| Construction | 410 (72.7%) | 154 (27.3%) |
| Manufacturing | 157 (86.7%) | 24 (13.3%) |
| Wholesale Trade | 86 (82.7%) | 18 (17.3%) |
| Retail Trade | 796 (49.1%) | 824 (50.9%) |
| Transportation & Warehousing | 69 (67.0%) | 34 (33.0%) |
| Utilities | 44 (100.0%) | 0 (0.0%) |
| Information | 74 (58.3%) | 53 (41.7%) |
| Finance & Insurance | 62 (52.5%) | 56 (47.5%) |
| Real Estate, Rental & Leasing | 139 (54.5%) | 116 (45.5%) |
| Professional & Scientific | 448 (67.8%) | 213 (32.2%) |
| Enterprise Management | 0 (0.0%) | 0 (0.0%) |
| Administrative & Support | 107 (40.2%) | 159 (59.8%) |
| Educational Services | 99 (19.8%) | 402 (80.2%) |
| Health Care & Social Assistance | 123 (23.7%) | 396 (76.3%) |
| Arts, Entertainment & Recreation | 211 (57.0%) | 159 (43.0%) |
| Accommodation & Food Services | 542 (61.0%) | 346 (39.0%) |
| Public Administration | 134 (37.0%) | 228 (63.0%) |
| Total | 3,749 (52.2%) | 3,436 (47.8%) |
Education in Villas
School Enrollment in Villas
The most common levels of schooling among the 1,958 students in Villas are high school (528 | 27.0%), college / undergraduate (449 | 22.9%), and elementary school (330 | 16.9%).
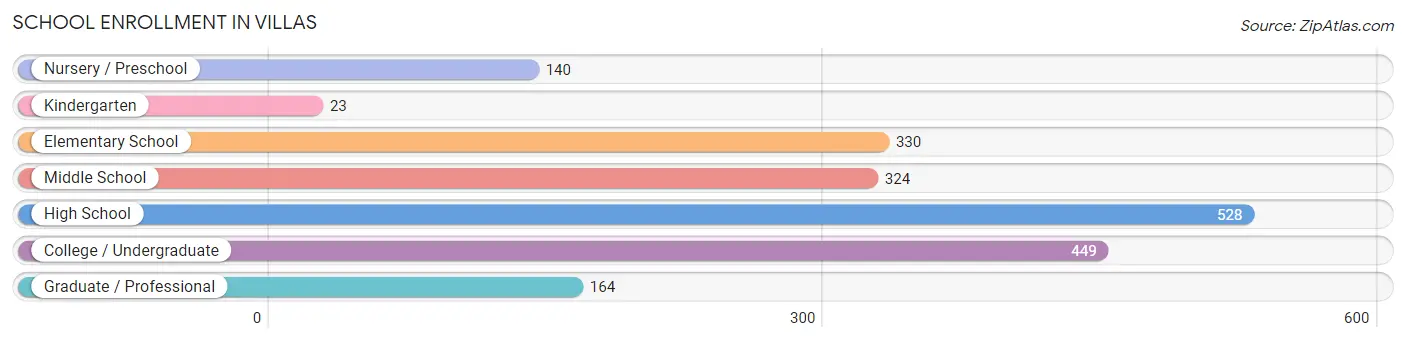
| School Level | # Students | % Students |
| Nursery / Preschool | 140 | 7.1% |
| Kindergarten | 23 | 1.2% |
| Elementary School | 330 | 16.9% |
| Middle School | 324 | 16.6% |
| High School | 528 | 27.0% |
| College / Undergraduate | 449 | 22.9% |
| Graduate / Professional | 164 | 8.4% |
| Total | 1,958 | 100.0% |
School Enrollment by Age by Funding Source in Villas
Out of a total of 1,958 students who are enrolled in schools in Villas, 307 (15.7%) attend a private institution, while the remaining 1,651 (84.3%) are enrolled in public schools. The age group of 20 to 24 year olds has the highest likelihood of being enrolled in private schools, with 125 (47.2% in the age bracket) enrolled. Conversely, the age group of 15 to 17 year olds has the lowest likelihood of being enrolled in a private school, with 255 (100.0% in the age bracket) attending a public institution.
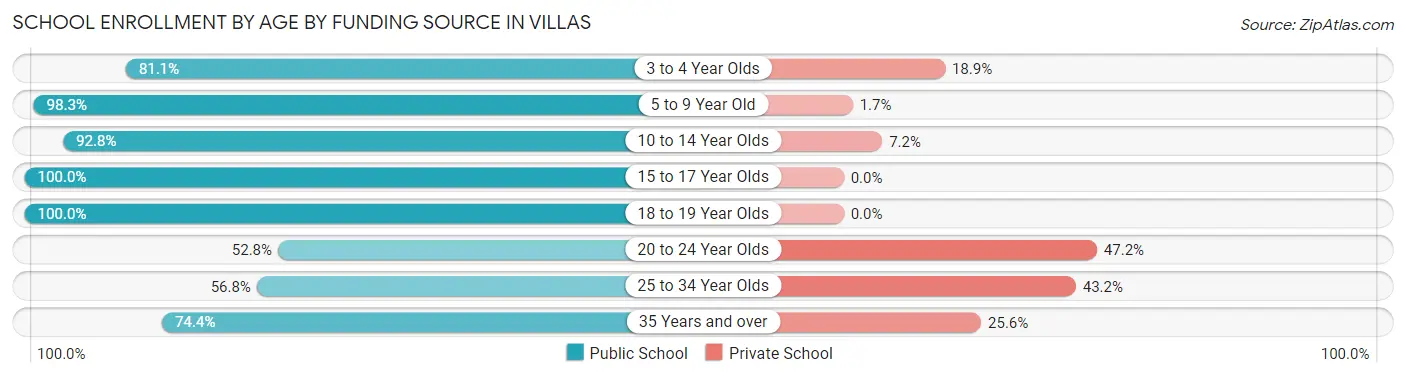
| Age Bracket | Public School | Private School |
| 3 to 4 Year Olds | 86 (81.1%) | 20 (18.9%) |
| 5 to 9 Year Old | 350 (98.3%) | 6 (1.7%) |
| 10 to 14 Year Olds | 336 (92.8%) | 26 (7.2%) |
| 15 to 17 Year Olds | 255 (100.0%) | 0 (0.0%) |
| 18 to 19 Year Olds | 260 (100.0%) | 0 (0.0%) |
| 20 to 24 Year Olds | 140 (52.8%) | 125 (47.2%) |
| 25 to 34 Year Olds | 130 (56.8%) | 99 (43.2%) |
| 35 Years and over | 93 (74.4%) | 32 (25.6%) |
| Total | 1,651 (84.3%) | 307 (15.7%) |
Educational Attainment by Field of Study in Villas
Business (985 | 25.8%), education (624 | 16.4%), science & technology (315 | 8.3%), physical & health sciences (268 | 7.0%), and arts & humanities (251 | 6.6%) are the most common fields of study among 3,814 individuals in Villas who have obtained a bachelor's degree or higher.
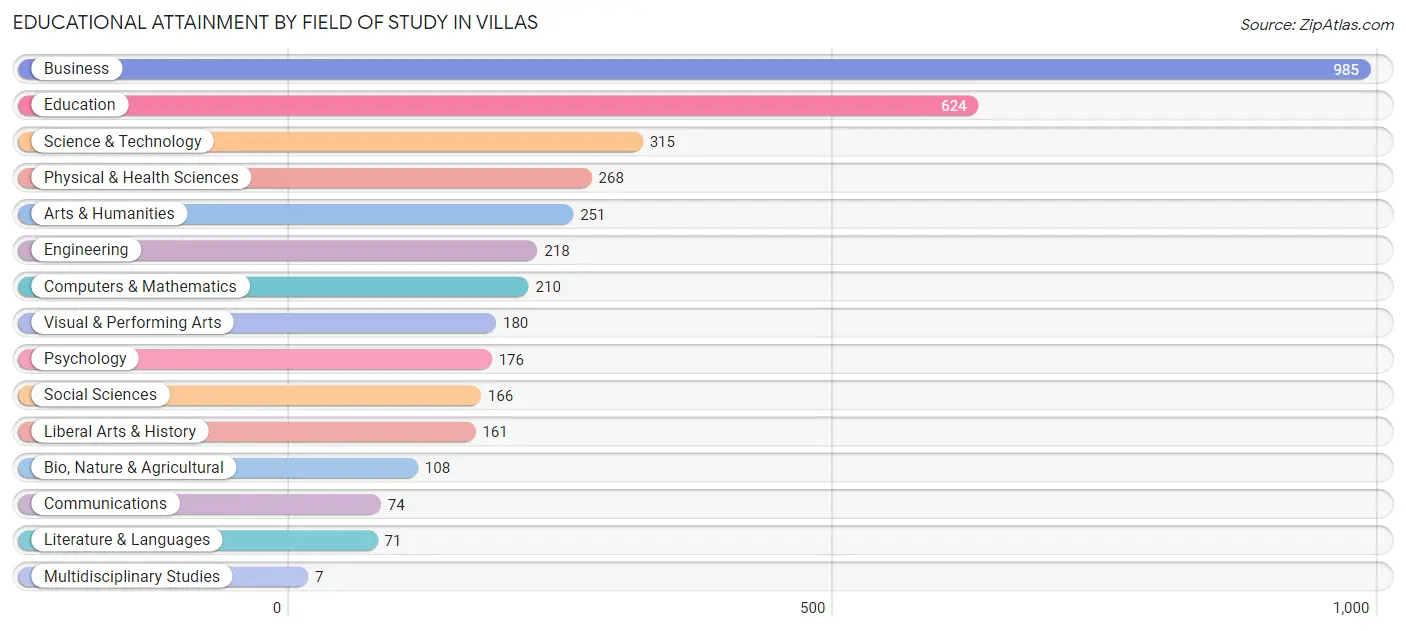
| Field of Study | # Graduates | % Graduates |
| Computers & Mathematics | 210 | 5.5% |
| Bio, Nature & Agricultural | 108 | 2.8% |
| Physical & Health Sciences | 268 | 7.0% |
| Psychology | 176 | 4.6% |
| Social Sciences | 166 | 4.3% |
| Engineering | 218 | 5.7% |
| Multidisciplinary Studies | 7 | 0.2% |
| Science & Technology | 315 | 8.3% |
| Business | 985 | 25.8% |
| Education | 624 | 16.4% |
| Literature & Languages | 71 | 1.9% |
| Liberal Arts & History | 161 | 4.2% |
| Visual & Performing Arts | 180 | 4.7% |
| Communications | 74 | 1.9% |
| Arts & Humanities | 251 | 6.6% |
| Total | 3,814 | 100.0% |
Transportation & Commute in Villas
Vehicle Availability by Sex in Villas
The most prevalent vehicle ownership categories in Villas are males with 2 vehicles (1,950, accounting for 52.6%) and females with 2 vehicles (1,639, making up 57.9%).
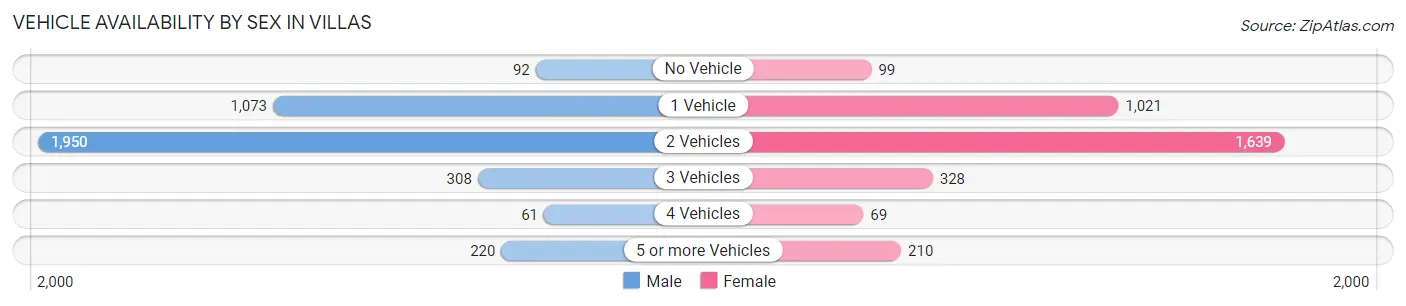
| Vehicles Available | Male | Female |
| No Vehicle | 92 (2.5%) | 99 (2.9%) |
| 1 Vehicle | 1,073 (29.0%) | 1,021 (30.3%) |
| 2 Vehicles | 1,950 (52.6%) | 1,639 (48.7%) |
| 3 Vehicles | 308 (8.3%) | 328 (9.7%) |
| 4 Vehicles | 61 (1.7%) | 69 (2.1%) |
| 5 or more Vehicles | 220 (5.9%) | 210 (6.2%) |
| Total | 3,704 (100.0%) | 3,366 (100.0%) |
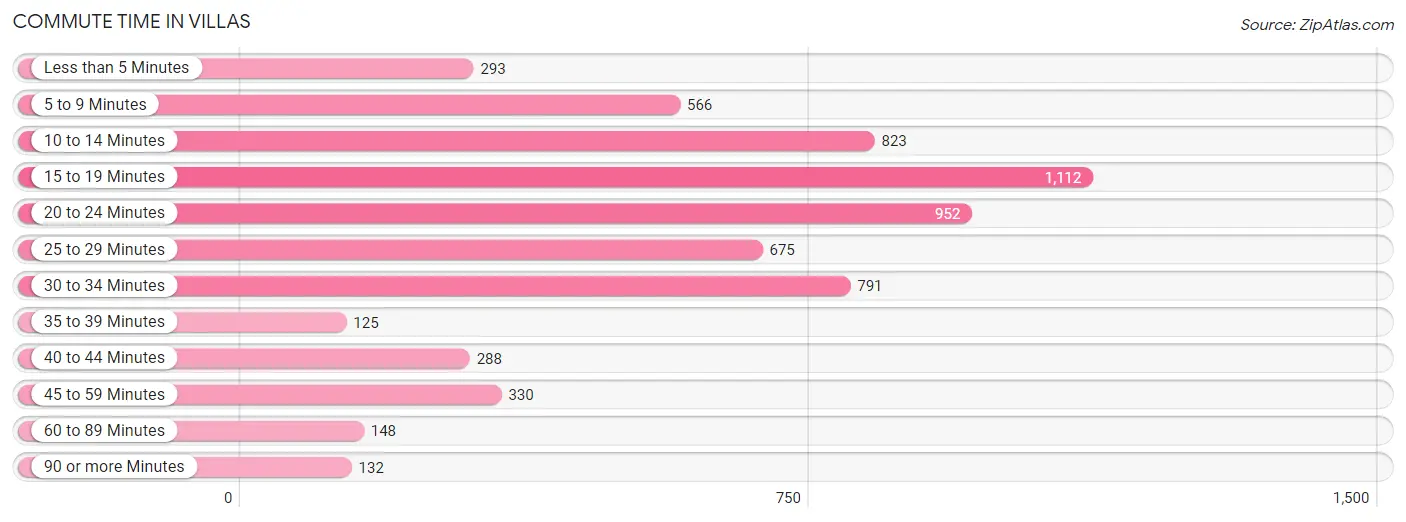
Commute Time in Villas
The most frequently occuring commute durations in Villas are 15 to 19 minutes (1,112 commuters, 17.8%), 20 to 24 minutes (952 commuters, 15.3%), and 10 to 14 minutes (823 commuters, 13.2%).
| Commute Time | # Commuters | % Commuters |
| Less than 5 Minutes | 293 | 4.7% |
| 5 to 9 Minutes | 566 | 9.1% |
| 10 to 14 Minutes | 823 | 13.2% |
| 15 to 19 Minutes | 1,112 | 17.8% |
| 20 to 24 Minutes | 952 | 15.3% |
| 25 to 29 Minutes | 675 | 10.8% |
| 30 to 34 Minutes | 791 | 12.7% |
| 35 to 39 Minutes | 125 | 2.0% |
| 40 to 44 Minutes | 288 | 4.6% |
| 45 to 59 Minutes | 330 | 5.3% |
| 60 to 89 Minutes | 148 | 2.4% |
| 90 or more Minutes | 132 | 2.1% |
Commute Time by Sex in Villas
The most common commute times in Villas are 15 to 19 minutes (640 commuters, 18.0%) for males and 15 to 19 minutes (472 commuters, 17.6%) for females.
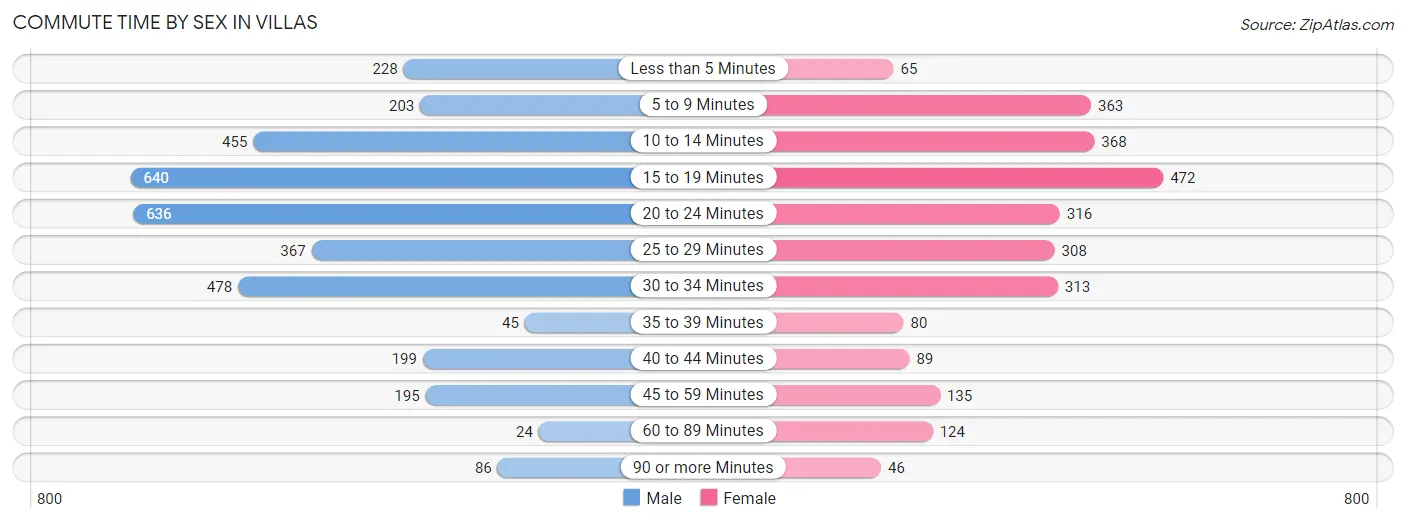
| Commute Time | Male | Female |
| Less than 5 Minutes | 228 (6.4%) | 65 (2.4%) |
| 5 to 9 Minutes | 203 (5.7%) | 363 (13.6%) |
| 10 to 14 Minutes | 455 (12.8%) | 368 (13.7%) |
| 15 to 19 Minutes | 640 (18.0%) | 472 (17.6%) |
| 20 to 24 Minutes | 636 (17.9%) | 316 (11.8%) |
| 25 to 29 Minutes | 367 (10.3%) | 308 (11.5%) |
| 30 to 34 Minutes | 478 (13.4%) | 313 (11.7%) |
| 35 to 39 Minutes | 45 (1.3%) | 80 (3.0%) |
| 40 to 44 Minutes | 199 (5.6%) | 89 (3.3%) |
| 45 to 59 Minutes | 195 (5.5%) | 135 (5.0%) |
| 60 to 89 Minutes | 24 (0.7%) | 124 (4.6%) |
| 90 or more Minutes | 86 (2.4%) | 46 (1.7%) |
Time of Departure to Work by Sex in Villas
The most frequent times of departure to work in Villas are 7:00 AM to 7:29 AM (474, 13.3%) for males and 7:30 AM to 7:59 AM (437, 16.3%) for females.
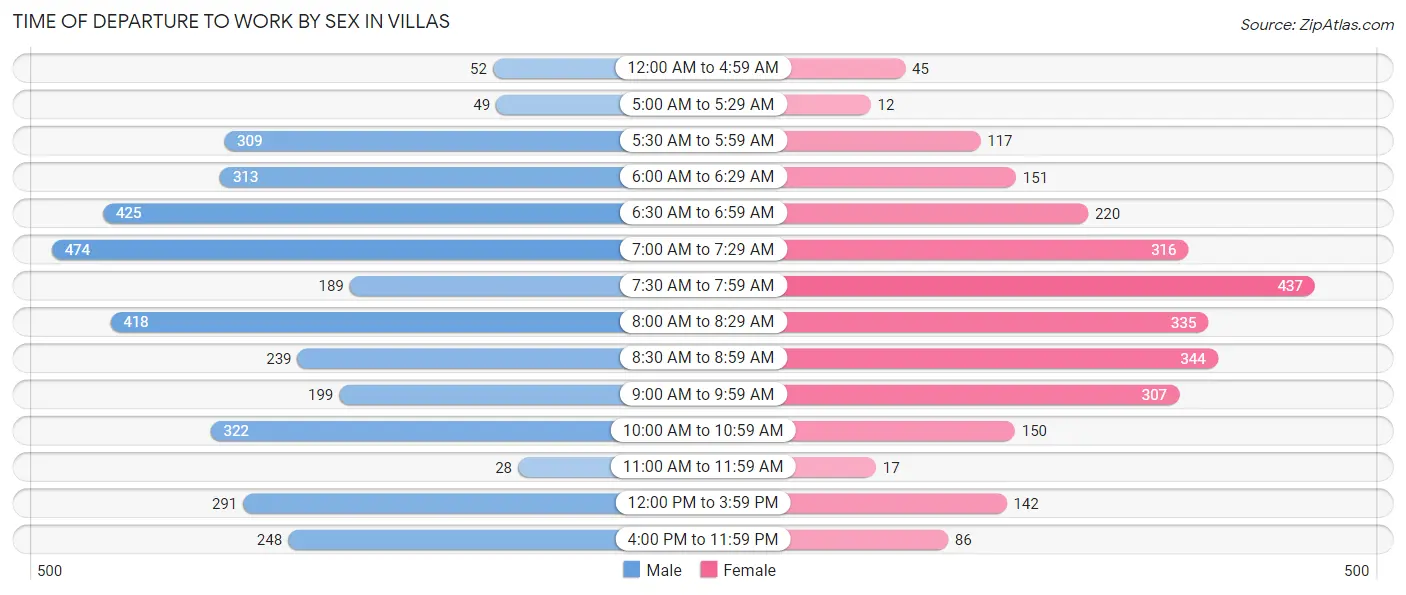
| Time of Departure | Male | Female |
| 12:00 AM to 4:59 AM | 52 (1.5%) | 45 (1.7%) |
| 5:00 AM to 5:29 AM | 49 (1.4%) | 12 (0.4%) |
| 5:30 AM to 5:59 AM | 309 (8.7%) | 117 (4.4%) |
| 6:00 AM to 6:29 AM | 313 (8.8%) | 151 (5.6%) |
| 6:30 AM to 6:59 AM | 425 (11.9%) | 220 (8.2%) |
| 7:00 AM to 7:29 AM | 474 (13.3%) | 316 (11.8%) |
| 7:30 AM to 7:59 AM | 189 (5.3%) | 437 (16.3%) |
| 8:00 AM to 8:29 AM | 418 (11.7%) | 335 (12.5%) |
| 8:30 AM to 8:59 AM | 239 (6.7%) | 344 (12.8%) |
| 9:00 AM to 9:59 AM | 199 (5.6%) | 307 (11.5%) |
| 10:00 AM to 10:59 AM | 322 (9.1%) | 150 (5.6%) |
| 11:00 AM to 11:59 AM | 28 (0.8%) | 17 (0.6%) |
| 12:00 PM to 3:59 PM | 291 (8.2%) | 142 (5.3%) |
| 4:00 PM to 11:59 PM | 248 (7.0%) | 86 (3.2%) |
| Total | 3,556 (100.0%) | 2,679 (100.0%) |
Housing Occupancy in Villas
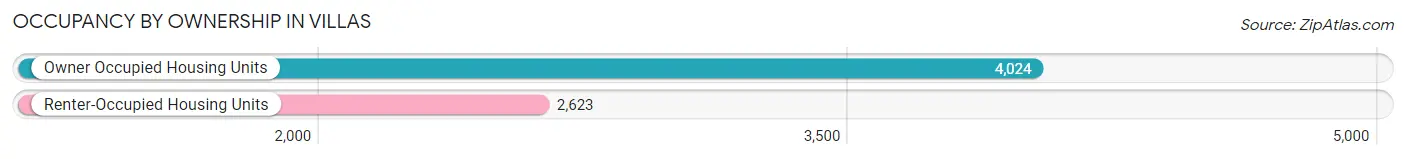
Occupancy by Ownership in Villas
Of the total 6,647 dwellings in Villas, owner-occupied units account for 4,024 (60.5%), while renter-occupied units make up 2,623 (39.5%).
| Occupancy | # Housing Units | % Housing Units |
| Owner Occupied Housing Units | 4,024 | 60.5% |
| Renter-Occupied Housing Units | 2,623 | 39.5% |
| Total Occupied Housing Units | 6,647 | 100.0% |
Occupancy by Household Size in Villas
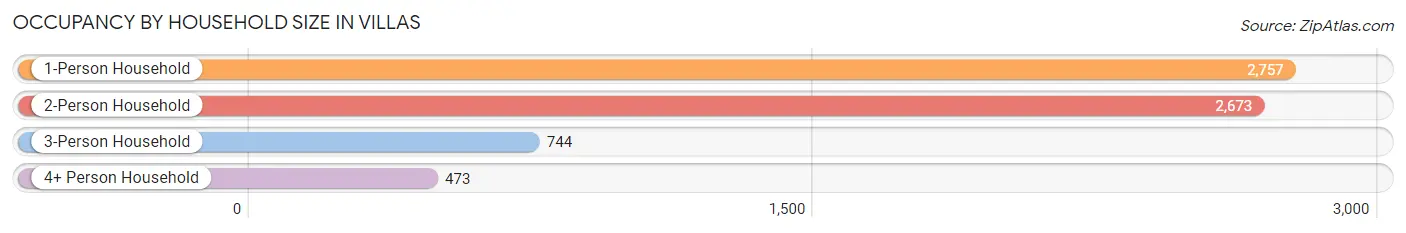
| Household Size | # Housing Units | % Housing Units |
| 1-Person Household | 2,757 | 41.5% |
| 2-Person Household | 2,673 | 40.2% |
| 3-Person Household | 744 | 11.2% |
| 4+ Person Household | 473 | 7.1% |
| Total Housing Units | 6,647 | 100.0% |
Occupancy by Ownership by Household Size in Villas
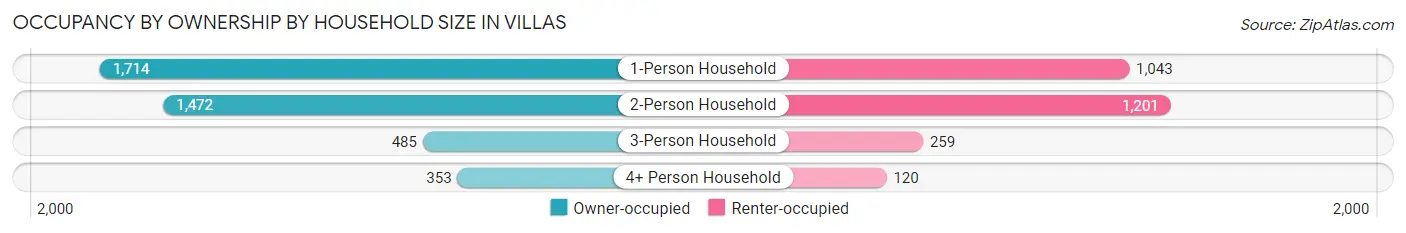
| Household Size | Owner-occupied | Renter-occupied |
| 1-Person Household | 1,714 (62.2%) | 1,043 (37.8%) |
| 2-Person Household | 1,472 (55.1%) | 1,201 (44.9%) |
| 3-Person Household | 485 (65.2%) | 259 (34.8%) |
| 4+ Person Household | 353 (74.6%) | 120 (25.4%) |
| Total Housing Units | 4,024 (60.5%) | 2,623 (39.5%) |
Occupancy by Educational Attainment in Villas
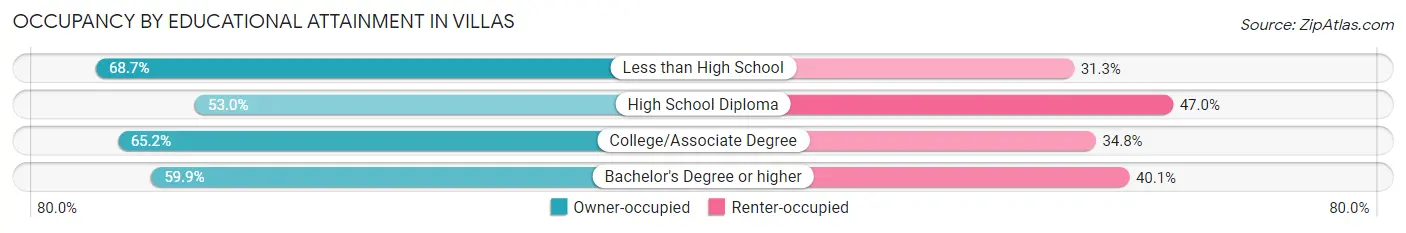
| Household Size | Owner-occupied | Renter-occupied |
| Less than High School | 228 (68.7%) | 104 (31.3%) |
| High School Diploma | 824 (53.0%) | 732 (47.0%) |
| College/Associate Degree | 1,485 (65.2%) | 792 (34.8%) |
| Bachelor's Degree or higher | 1,487 (59.9%) | 995 (40.1%) |
Occupancy by Age of Householder in Villas
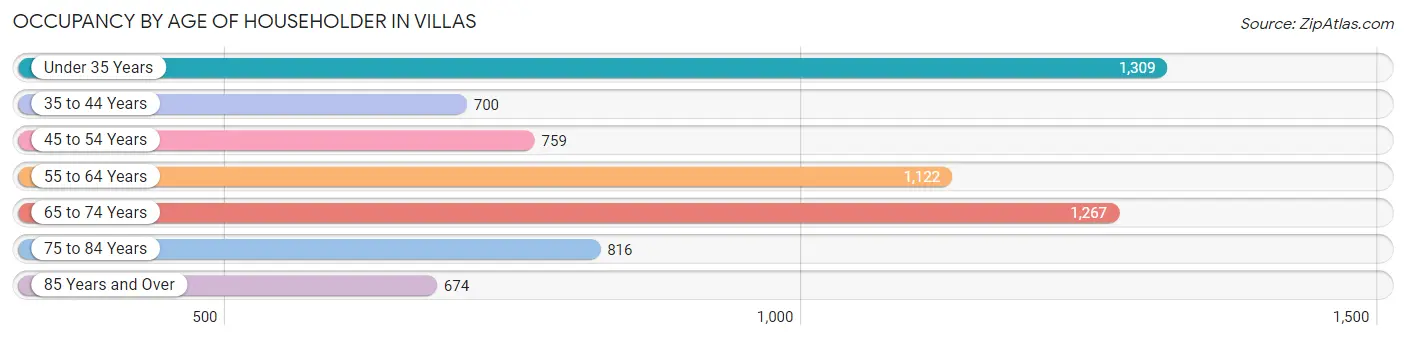
| Age Bracket | # Households | % Households |
| Under 35 Years | 1,309 | 19.7% |
| 35 to 44 Years | 700 | 10.5% |
| 45 to 54 Years | 759 | 11.4% |
| 55 to 64 Years | 1,122 | 16.9% |
| 65 to 74 Years | 1,267 | 19.1% |
| 75 to 84 Years | 816 | 12.3% |
| 85 Years and Over | 674 | 10.1% |
| Total | 6,647 | 100.0% |
Housing Finances in Villas
Median Income by Occupancy in Villas
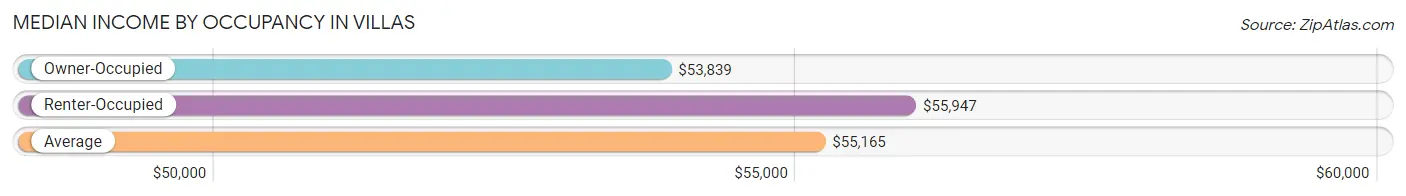
| Occupancy Type | # Households | Median Income |
| Owner-Occupied | 4,024 (60.5%) | $53,839 |
| Renter-Occupied | 2,623 (39.5%) | $55,947 |
| Average | 6,647 (100.0%) | $55,165 |
Occupancy by Householder Income Bracket in Villas
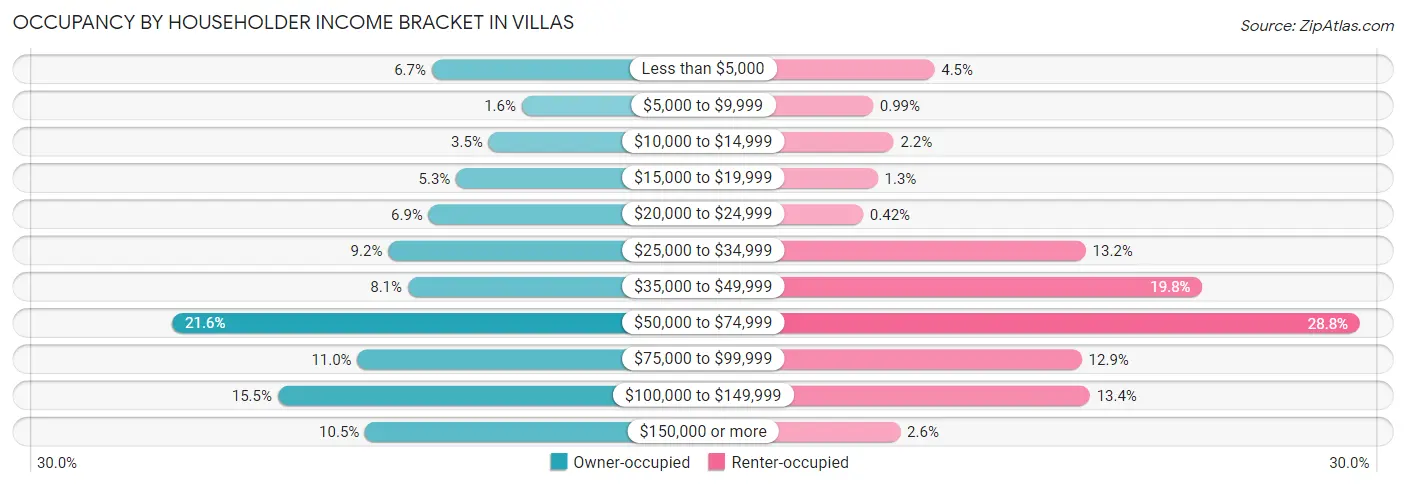
| Income Bracket | Owner-occupied | Renter-occupied |
| Less than $5,000 | 271 (6.7%) | 118 (4.5%) |
| $5,000 to $9,999 | 64 (1.6%) | 26 (1.0%) |
| $10,000 to $14,999 | 140 (3.5%) | 57 (2.2%) |
| $15,000 to $19,999 | 215 (5.3%) | 33 (1.3%) |
| $20,000 to $24,999 | 278 (6.9%) | 11 (0.4%) |
| $25,000 to $34,999 | 371 (9.2%) | 345 (13.2%) |
| $35,000 to $49,999 | 326 (8.1%) | 520 (19.8%) |
| $50,000 to $74,999 | 868 (21.6%) | 756 (28.8%) |
| $75,000 to $99,999 | 442 (11.0%) | 339 (12.9%) |
| $100,000 to $149,999 | 625 (15.5%) | 351 (13.4%) |
| $150,000 or more | 424 (10.5%) | 67 (2.5%) |
| Total | 4,024 (100.0%) | 2,623 (100.0%) |
Monthly Housing Cost Tiers in Villas
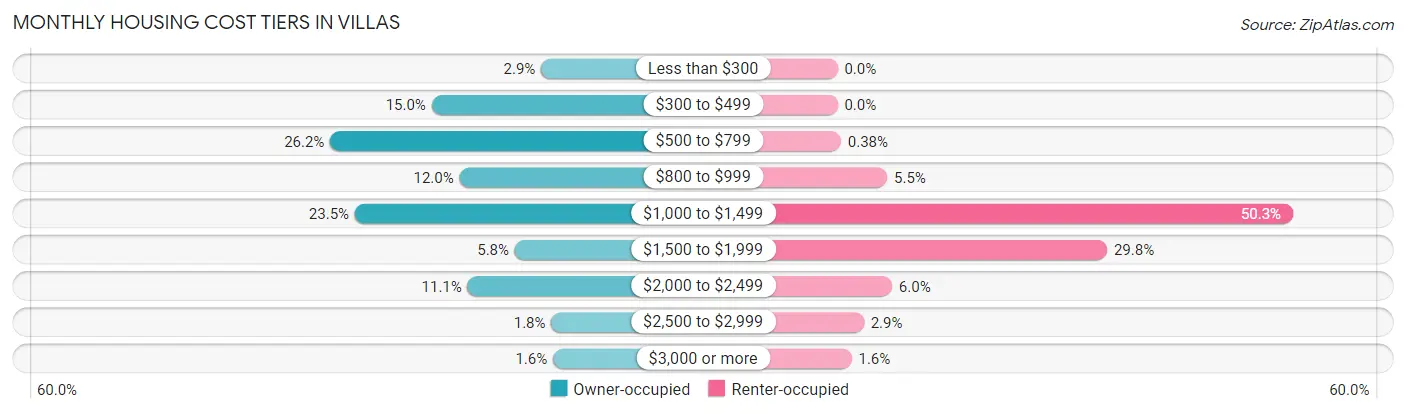
| Monthly Cost | Owner-occupied | Renter-occupied |
| Less than $300 | 118 (2.9%) | 0 (0.0%) |
| $300 to $499 | 605 (15.0%) | 0 (0.0%) |
| $500 to $799 | 1,056 (26.2%) | 10 (0.4%) |
| $800 to $999 | 481 (11.9%) | 144 (5.5%) |
| $1,000 to $1,499 | 946 (23.5%) | 1,320 (50.3%) |
| $1,500 to $1,999 | 235 (5.8%) | 781 (29.8%) |
| $2,000 to $2,499 | 445 (11.1%) | 158 (6.0%) |
| $2,500 to $2,999 | 73 (1.8%) | 76 (2.9%) |
| $3,000 or more | 65 (1.6%) | 41 (1.6%) |
| Total | 4,024 (100.0%) | 2,623 (100.0%) |
Physical Housing Characteristics in Villas
Housing Structures in Villas
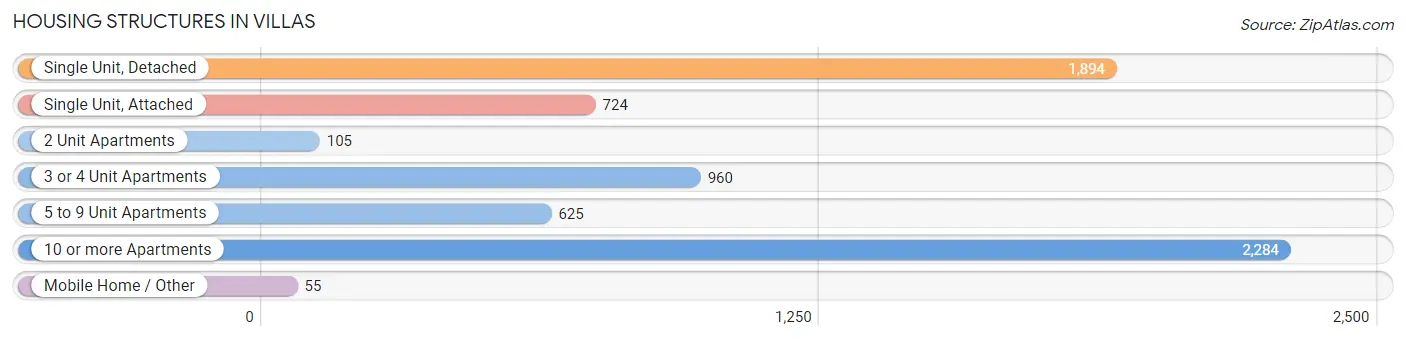
| Structure Type | # Housing Units | % Housing Units |
| Single Unit, Detached | 1,894 | 28.5% |
| Single Unit, Attached | 724 | 10.9% |
| 2 Unit Apartments | 105 | 1.6% |
| 3 or 4 Unit Apartments | 960 | 14.4% |
| 5 to 9 Unit Apartments | 625 | 9.4% |
| 10 or more Apartments | 2,284 | 34.4% |
| Mobile Home / Other | 55 | 0.8% |
| Total | 6,647 | 100.0% |
Housing Structures by Occupancy in Villas
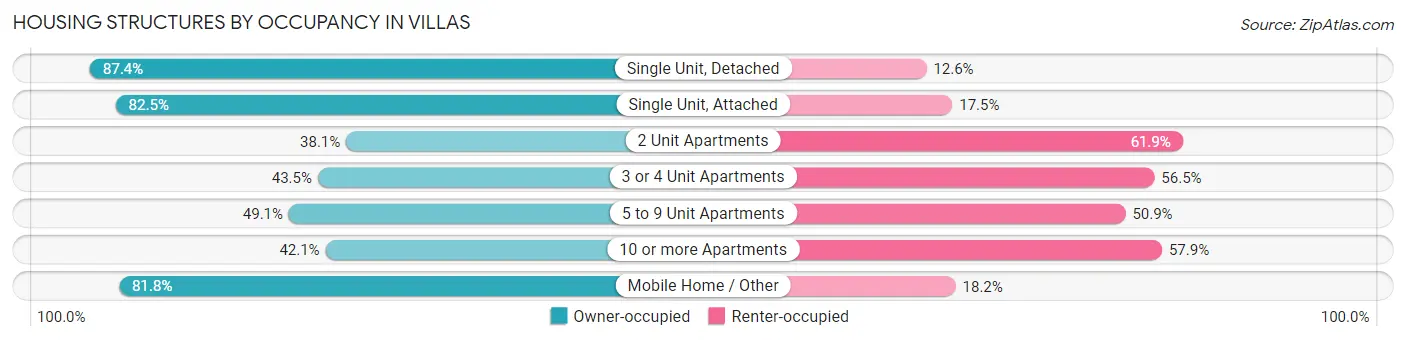
| Structure Type | Owner-occupied | Renter-occupied |
| Single Unit, Detached | 1,656 (87.4%) | 238 (12.6%) |
| Single Unit, Attached | 597 (82.5%) | 127 (17.5%) |
| 2 Unit Apartments | 40 (38.1%) | 65 (61.9%) |
| 3 or 4 Unit Apartments | 418 (43.5%) | 542 (56.5%) |
| 5 to 9 Unit Apartments | 307 (49.1%) | 318 (50.9%) |
| 10 or more Apartments | 961 (42.1%) | 1,323 (57.9%) |
| Mobile Home / Other | 45 (81.8%) | 10 (18.2%) |
| Total | 4,024 (60.5%) | 2,623 (39.5%) |
Housing Structures by Number of Rooms in Villas
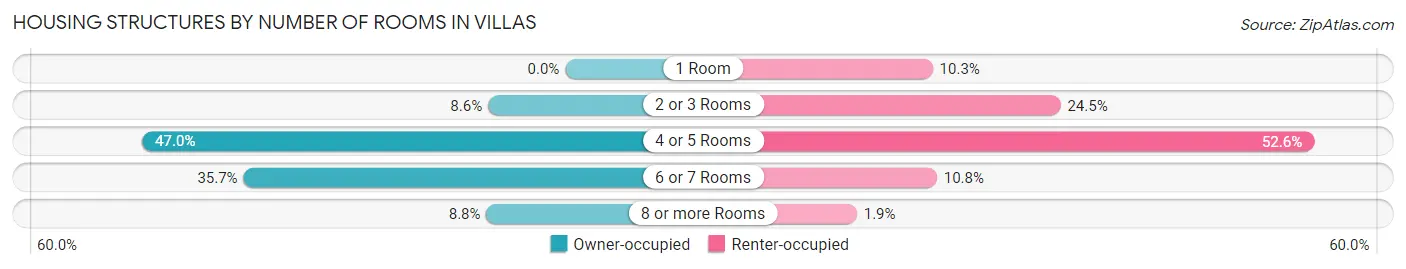
| Number of Rooms | Owner-occupied | Renter-occupied |
| 1 Room | 0 (0.0%) | 270 (10.3%) |
| 2 or 3 Rooms | 345 (8.6%) | 642 (24.5%) |
| 4 or 5 Rooms | 1,890 (47.0%) | 1,380 (52.6%) |
| 6 or 7 Rooms | 1,437 (35.7%) | 282 (10.7%) |
| 8 or more Rooms | 352 (8.7%) | 49 (1.9%) |
| Total | 4,024 (100.0%) | 2,623 (100.0%) |
Housing Structure by Heating Type in Villas
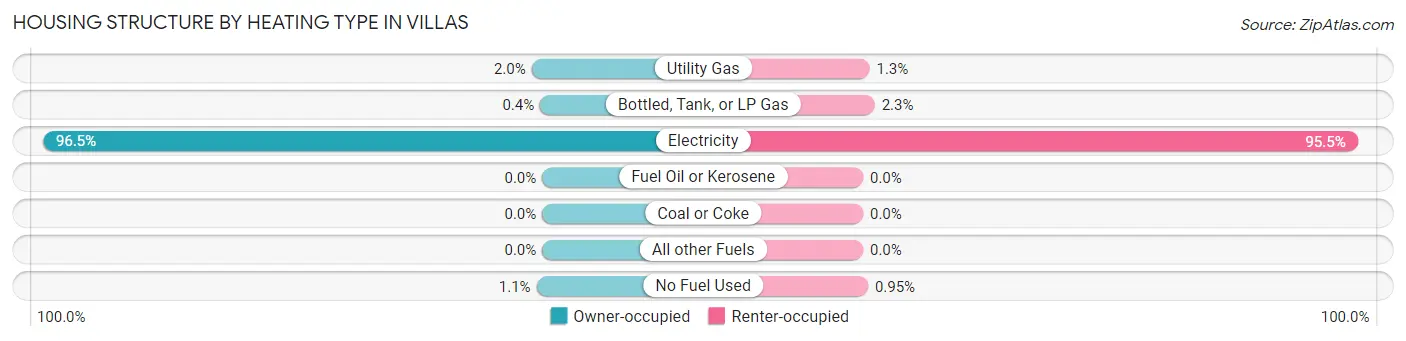
| Heating Type | Owner-occupied | Renter-occupied |
| Utility Gas | 82 (2.0%) | 33 (1.3%) |
| Bottled, Tank, or LP Gas | 16 (0.4%) | 59 (2.2%) |
| Electricity | 3,882 (96.5%) | 2,506 (95.5%) |
| Fuel Oil or Kerosene | 0 (0.0%) | 0 (0.0%) |
| Coal or Coke | 0 (0.0%) | 0 (0.0%) |
| All other Fuels | 0 (0.0%) | 0 (0.0%) |
| No Fuel Used | 44 (1.1%) | 25 (0.9%) |
| Total | 4,024 (100.0%) | 2,623 (100.0%) |
Household Vehicle Usage in Villas
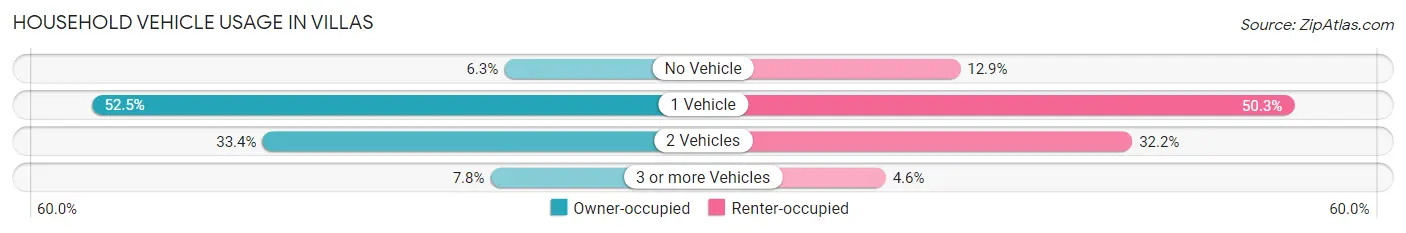
| Vehicles per Household | Owner-occupied | Renter-occupied |
| No Vehicle | 253 (6.3%) | 339 (12.9%) |
| 1 Vehicle | 2,113 (52.5%) | 1,320 (50.3%) |
| 2 Vehicles | 1,343 (33.4%) | 844 (32.2%) |
| 3 or more Vehicles | 315 (7.8%) | 120 (4.6%) |
| Total | 4,024 (100.0%) | 2,623 (100.0%) |
Real Estate & Mortgages in Villas
Real Estate and Mortgage Overview in Villas
| Characteristic | Without Mortgage | With Mortgage |
| Housing Units | 2,237 | 1,787 |
| Median Property Value | $210,300 | $230,700 |
| Median Household Income | $42,390 | $188 |
| Monthly Housing Costs | $657 | $57 |
| Real Estate Taxes | $1,437 | $35 |
Property Value by Mortgage Status in Villas
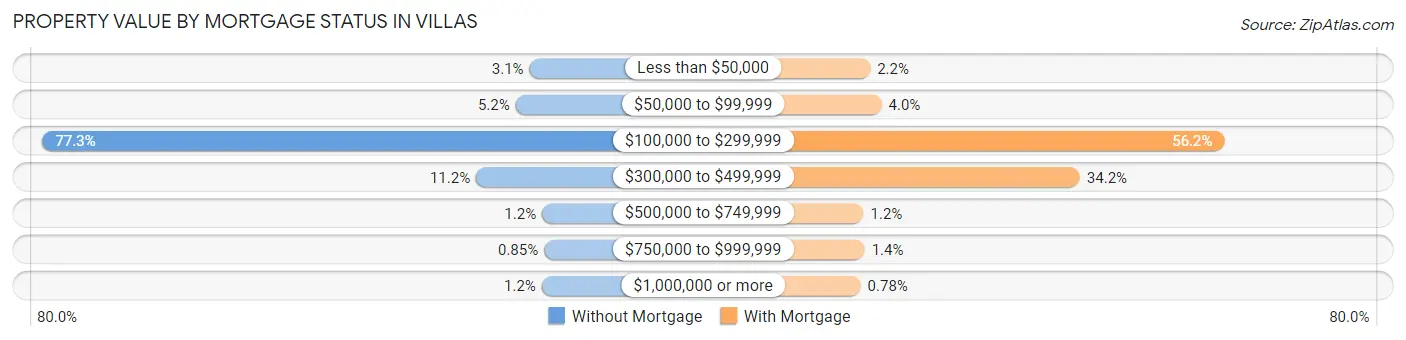
| Property Value | Without Mortgage | With Mortgage |
| Less than $50,000 | 69 (3.1%) | 40 (2.2%) |
| $50,000 to $99,999 | 116 (5.2%) | 71 (4.0%) |
| $100,000 to $299,999 | 1,729 (77.3%) | 1,004 (56.2%) |
| $300,000 to $499,999 | 251 (11.2%) | 611 (34.2%) |
| $500,000 to $749,999 | 26 (1.2%) | 22 (1.2%) |
| $750,000 to $999,999 | 19 (0.9%) | 25 (1.4%) |
| $1,000,000 or more | 27 (1.2%) | 14 (0.8%) |
| Total | 2,237 (100.0%) | 1,787 (100.0%) |
Household Income by Mortgage Status in Villas
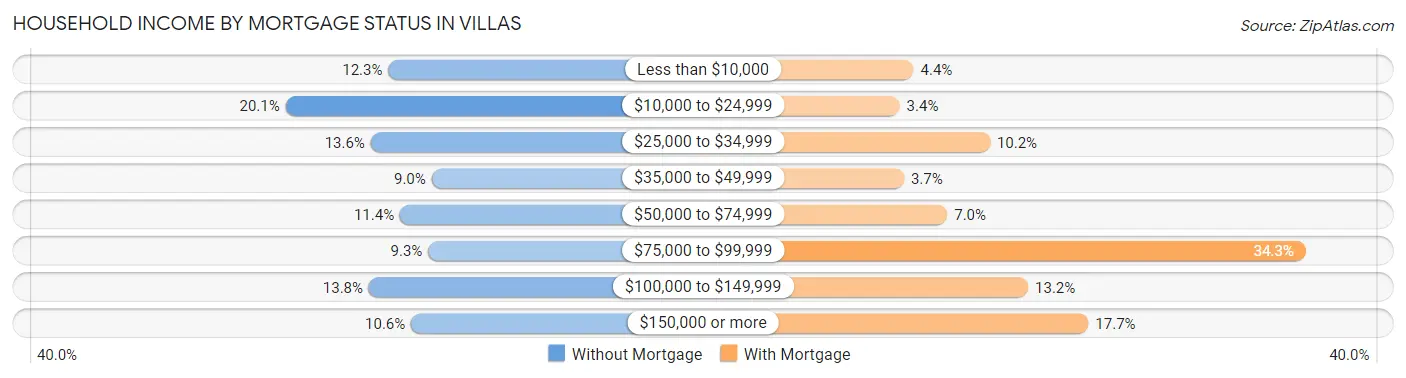
| Household Income | Without Mortgage | With Mortgage |
| Less than $10,000 | 275 (12.3%) | 79 (4.4%) |
| $10,000 to $24,999 | 450 (20.1%) | 60 (3.4%) |
| $25,000 to $34,999 | 305 (13.6%) | 183 (10.2%) |
| $35,000 to $49,999 | 201 (9.0%) | 66 (3.7%) |
| $50,000 to $74,999 | 255 (11.4%) | 125 (7.0%) |
| $75,000 to $99,999 | 207 (9.2%) | 613 (34.3%) |
| $100,000 to $149,999 | 308 (13.8%) | 235 (13.2%) |
| $150,000 or more | 236 (10.5%) | 317 (17.7%) |
| Total | 2,237 (100.0%) | 1,787 (100.0%) |
Property Value to Household Income Ratio in Villas
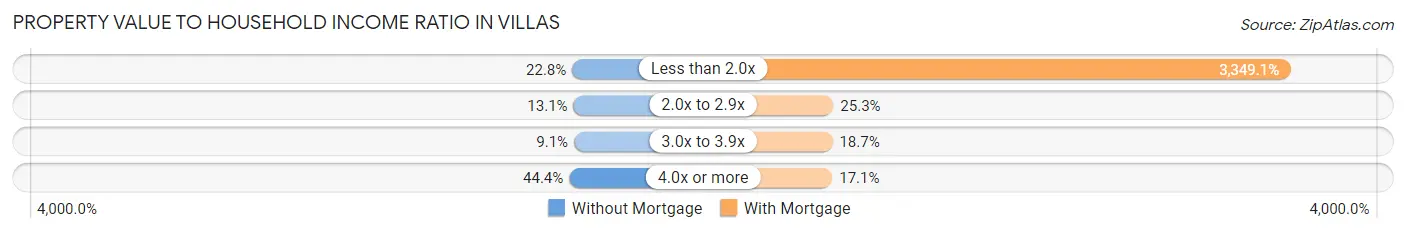
| Value-to-Income Ratio | Without Mortgage | With Mortgage |
| Less than 2.0x | 509 (22.8%) | 59,849 (3,349.1%) |
| 2.0x to 2.9x | 293 (13.1%) | 452 (25.3%) |
| 3.0x to 3.9x | 204 (9.1%) | 334 (18.7%) |
| 4.0x or more | 992 (44.4%) | 305 (17.1%) |
| Total | 2,237 (100.0%) | 1,787 (100.0%) |
Real Estate Taxes by Mortgage Status in Villas
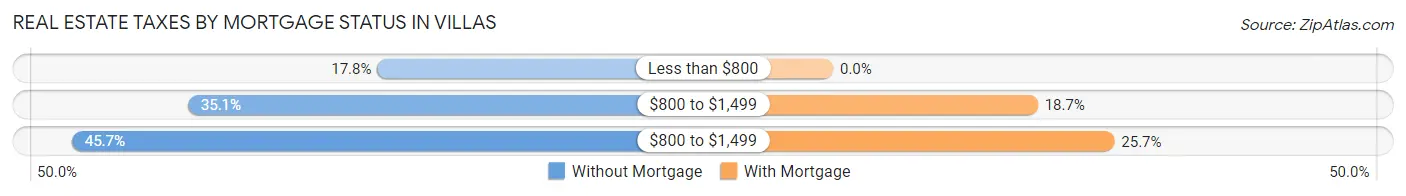
| Property Taxes | Without Mortgage | With Mortgage |
| Less than $800 | 398 (17.8%) | 0 (0.0%) |
| $800 to $1,499 | 785 (35.1%) | 334 (18.7%) |
| $800 to $1,499 | 1,022 (45.7%) | 459 (25.7%) |
| Total | 2,237 (100.0%) | 1,787 (100.0%) |
Health & Disability in Villas
Health Insurance Coverage by Age in Villas
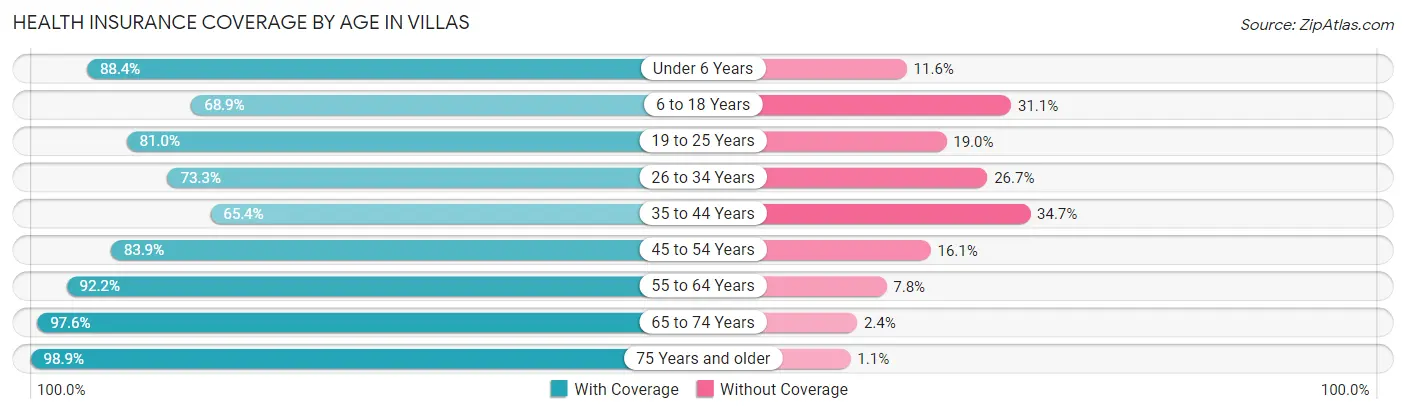
| Age Bracket | With Coverage | Without Coverage |
| Under 6 Years | 395 (88.4%) | 52 (11.6%) |
| 6 to 18 Years | 820 (68.9%) | 370 (31.1%) |
| 19 to 25 Years | 681 (81.0%) | 160 (19.0%) |
| 26 to 34 Years | 1,532 (73.3%) | 557 (26.7%) |
| 35 to 44 Years | 860 (65.3%) | 456 (34.6%) |
| 45 to 54 Years | 1,252 (83.9%) | 240 (16.1%) |
| 55 to 64 Years | 1,880 (92.2%) | 160 (7.8%) |
| 65 to 74 Years | 1,900 (97.6%) | 46 (2.4%) |
| 75 Years and older | 2,257 (98.9%) | 26 (1.1%) |
| Total | 11,577 (84.9%) | 2,067 (15.1%) |
Health Insurance Coverage by Citizenship Status in Villas
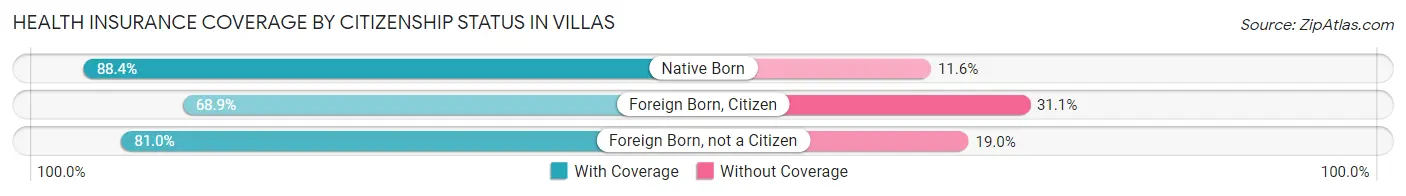
| Citizenship Status | With Coverage | Without Coverage |
| Native Born | 395 (88.4%) | 52 (11.6%) |
| Foreign Born, Citizen | 820 (68.9%) | 370 (31.1%) |
| Foreign Born, not a Citizen | 681 (81.0%) | 160 (19.0%) |
Health Insurance Coverage by Household Income in Villas
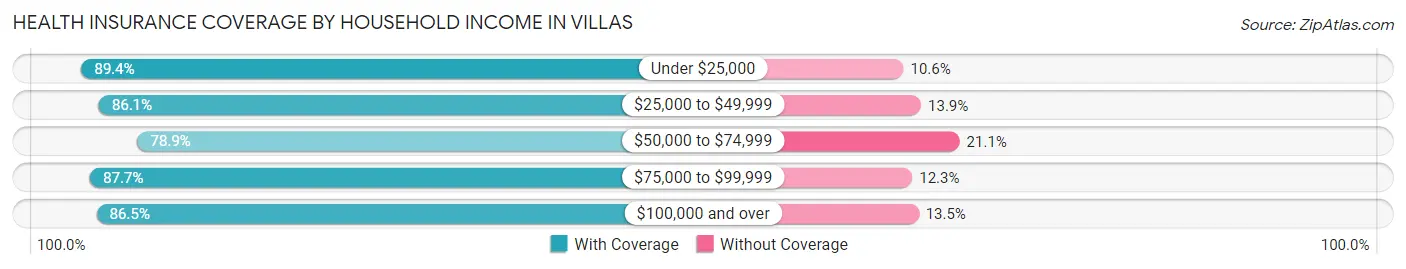
| Household Income | With Coverage | Without Coverage |
| Under $25,000 | 1,236 (89.4%) | 147 (10.6%) |
| $25,000 to $49,999 | 2,331 (86.1%) | 377 (13.9%) |
| $50,000 to $74,999 | 2,873 (78.9%) | 770 (21.1%) |
| $75,000 to $99,999 | 1,722 (87.7%) | 241 (12.3%) |
| $100,000 and over | 3,410 (86.5%) | 531 (13.5%) |
Public vs Private Health Insurance Coverage by Age in Villas
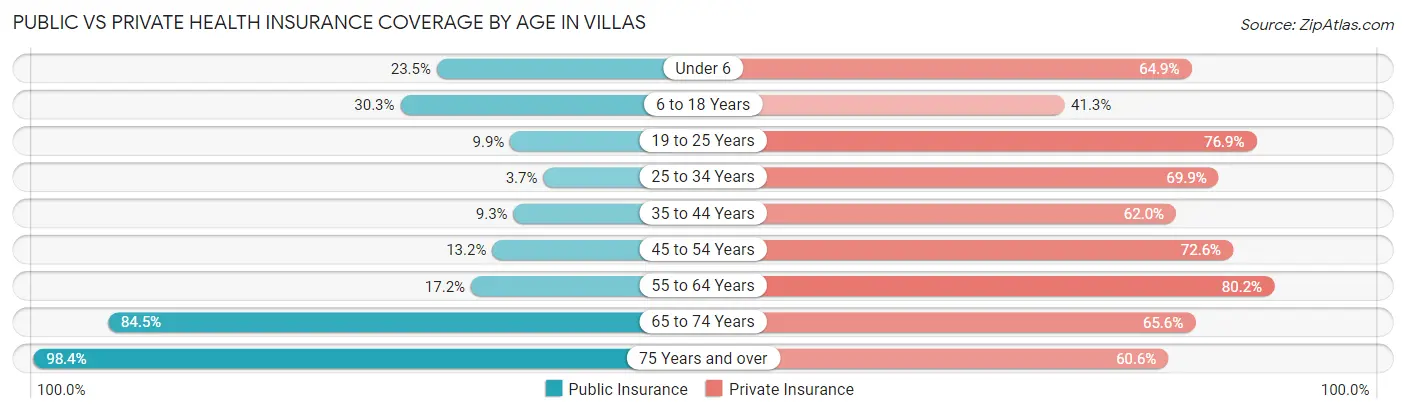
| Age Bracket | Public Insurance | Private Insurance |
| Under 6 | 105 (23.5%) | 290 (64.9%) |
| 6 to 18 Years | 360 (30.2%) | 491 (41.3%) |
| 19 to 25 Years | 83 (9.9%) | 647 (76.9%) |
| 25 to 34 Years | 78 (3.7%) | 1,461 (69.9%) |
| 35 to 44 Years | 122 (9.3%) | 816 (62.0%) |
| 45 to 54 Years | 197 (13.2%) | 1,083 (72.6%) |
| 55 to 64 Years | 350 (17.2%) | 1,636 (80.2%) |
| 65 to 74 Years | 1,645 (84.5%) | 1,276 (65.6%) |
| 75 Years and over | 2,246 (98.4%) | 1,383 (60.6%) |
| Total | 5,186 (38.0%) | 9,083 (66.6%) |
Disability Status by Sex by Age in Villas
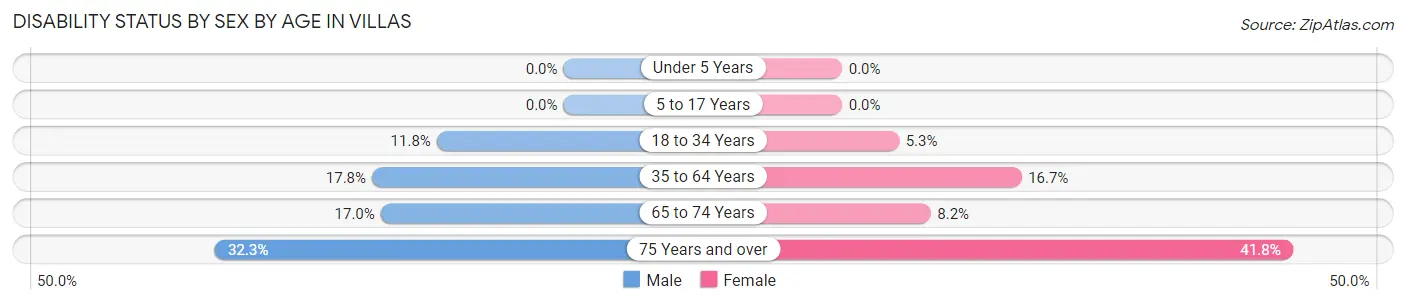
| Age Bracket | Male | Female |
| Under 5 Years | 0 (0.0%) | 0 (0.0%) |
| 5 to 17 Years | 0 (0.0%) | 0 (0.0%) |
| 18 to 34 Years | 221 (11.8%) | 68 (5.3%) |
| 35 to 64 Years | 376 (17.8%) | 455 (16.7%) |
| 65 to 74 Years | 165 (17.0%) | 80 (8.2%) |
| 75 Years and over | 269 (32.3%) | 607 (41.8%) |
Disability Class by Sex by Age in Villas
Disability Class: Hearing Difficulty
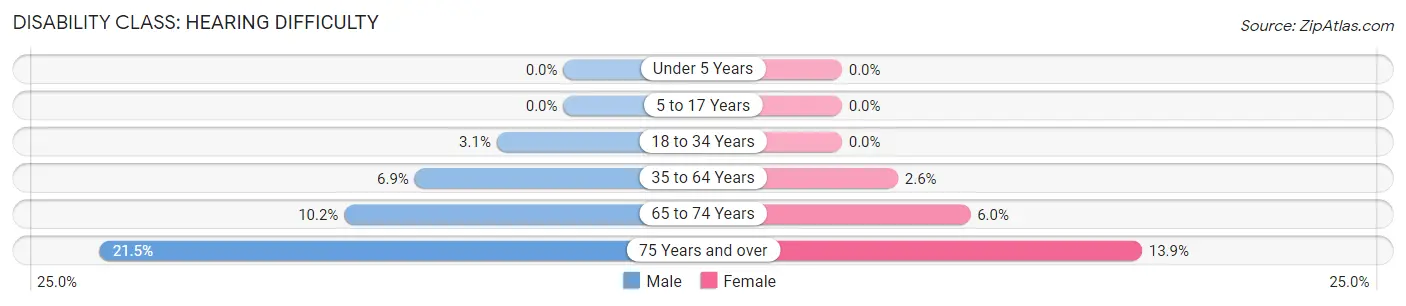
| Age Bracket | Male | Female |
| Under 5 Years | 0 (0.0%) | 0 (0.0%) |
| 5 to 17 Years | 0 (0.0%) | 0 (0.0%) |
| 18 to 34 Years | 58 (3.1%) | 0 (0.0%) |
| 35 to 64 Years | 146 (6.9%) | 71 (2.6%) |
| 65 to 74 Years | 99 (10.2%) | 58 (6.0%) |
| 75 Years and over | 179 (21.5%) | 202 (13.9%) |
Disability Class: Vision Difficulty
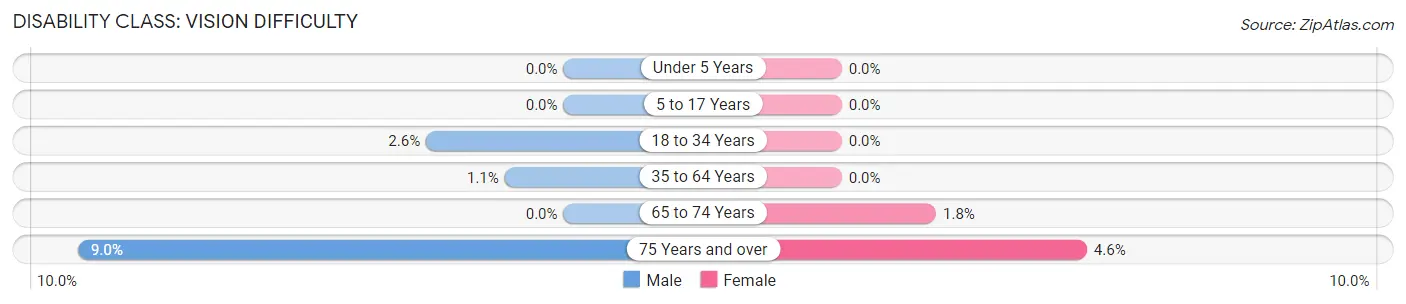
| Age Bracket | Male | Female |
| Under 5 Years | 0 (0.0%) | 0 (0.0%) |
| 5 to 17 Years | 0 (0.0%) | 0 (0.0%) |
| 18 to 34 Years | 48 (2.5%) | 0 (0.0%) |
| 35 to 64 Years | 23 (1.1%) | 0 (0.0%) |
| 65 to 74 Years | 0 (0.0%) | 17 (1.8%) |
| 75 Years and over | 75 (9.0%) | 66 (4.5%) |
Disability Class: Cognitive Difficulty
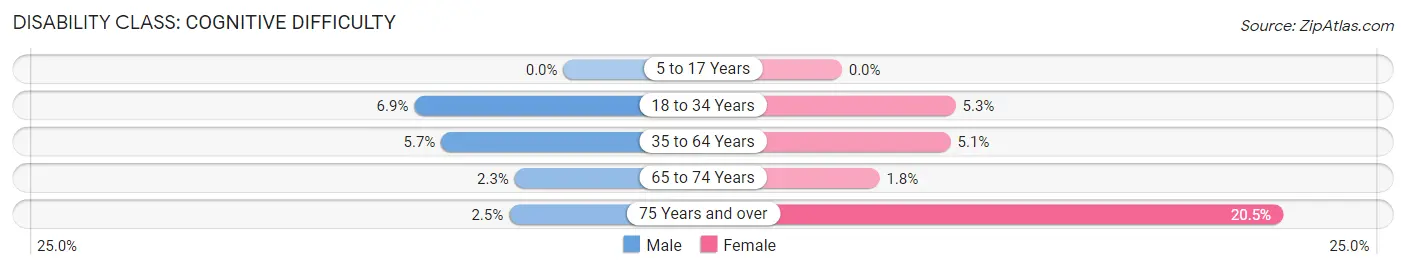
| Age Bracket | Male | Female |
| 5 to 17 Years | 0 (0.0%) | 0 (0.0%) |
| 18 to 34 Years | 130 (6.9%) | 68 (5.3%) |
| 35 to 64 Years | 120 (5.7%) | 138 (5.1%) |
| 65 to 74 Years | 22 (2.3%) | 17 (1.8%) |
| 75 Years and over | 21 (2.5%) | 297 (20.5%) |
Disability Class: Ambulatory Difficulty
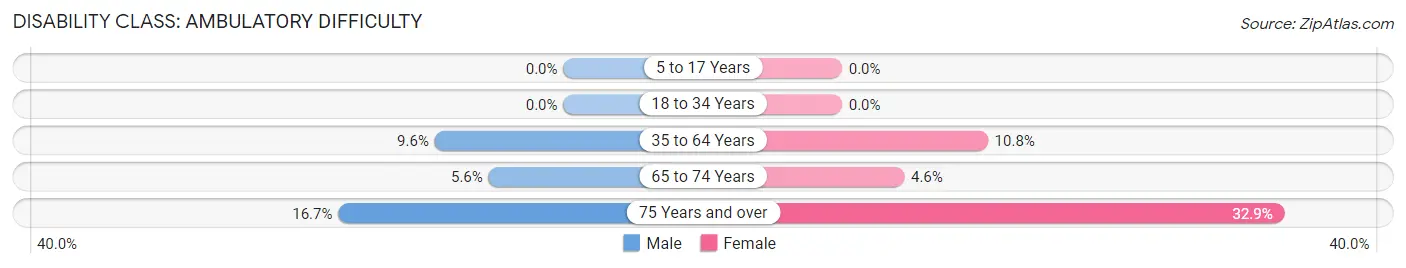
| Age Bracket | Male | Female |
| 5 to 17 Years | 0 (0.0%) | 0 (0.0%) |
| 18 to 34 Years | 0 (0.0%) | 0 (0.0%) |
| 35 to 64 Years | 202 (9.6%) | 296 (10.8%) |
| 65 to 74 Years | 54 (5.6%) | 45 (4.6%) |
| 75 Years and over | 139 (16.7%) | 477 (32.9%) |
Disability Class: Self-Care Difficulty
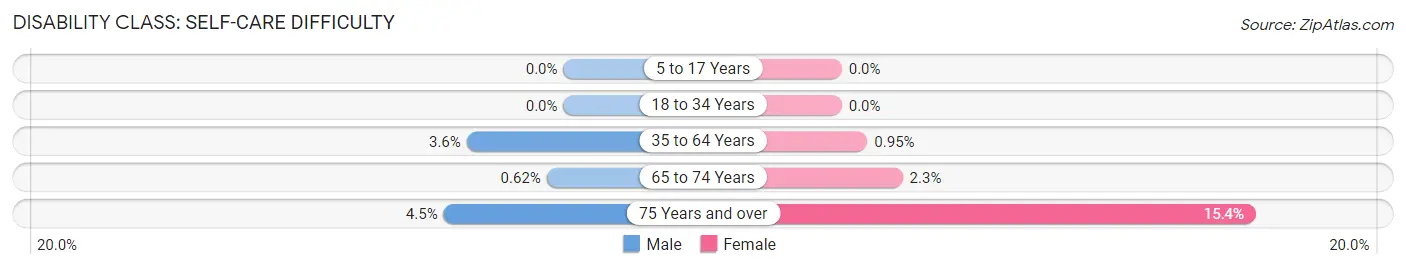
| Age Bracket | Male | Female |
| 5 to 17 Years | 0 (0.0%) | 0 (0.0%) |
| 18 to 34 Years | 0 (0.0%) | 0 (0.0%) |
| 35 to 64 Years | 76 (3.6%) | 26 (0.9%) |
| 65 to 74 Years | 6 (0.6%) | 22 (2.3%) |
| 75 Years and over | 37 (4.4%) | 223 (15.4%) |
Technology Access in Villas
Computing Device Access in Villas
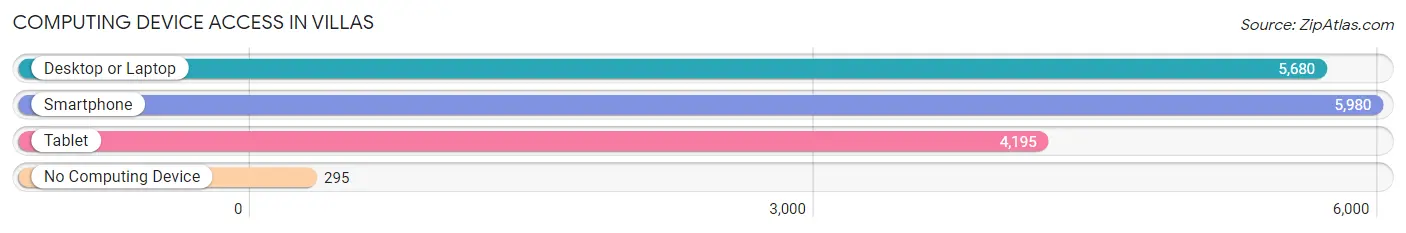
| Device Type | # Households | % Households |
| Desktop or Laptop | 5,680 | 85.5% |
| Smartphone | 5,980 | 90.0% |
| Tablet | 4,195 | 63.1% |
| No Computing Device | 295 | 4.4% |
| Total | 6,647 | 100.0% |
Internet Access in Villas
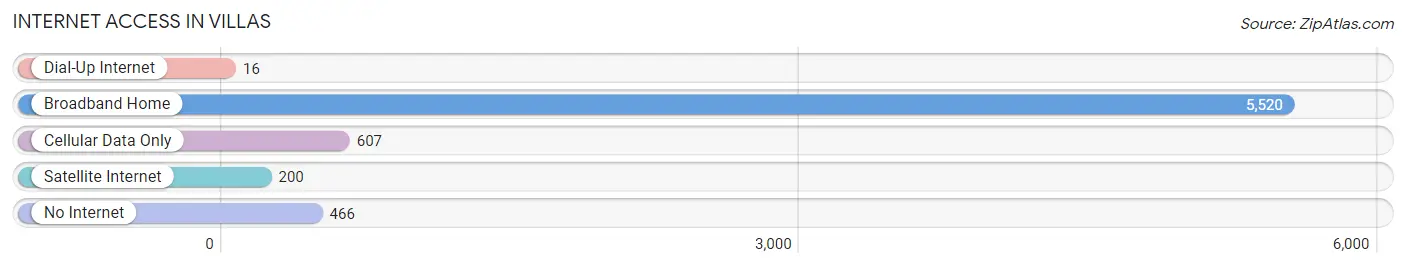
| Internet Type | # Households | % Households |
| Dial-Up Internet | 16 | 0.2% |
| Broadband Home | 5,520 | 83.0% |
| Cellular Data Only | 607 | 9.1% |
| Satellite Internet | 200 | 3.0% |
| No Internet | 466 | 7.0% |
| Total | 6,647 | 100.0% |
Villas Summary
Villas is a small unincorporated community located in Lee County, Florida, United States. It is situated on the northern edge of the Caloosahatchee River, approximately 10 miles east of Fort Myers. The population of Villas was estimated to be 1,845 in 2019.
History
Villas was first settled in the late 19th century by settlers from the Bahamas. The settlement was originally known as “Bahama Village” and was located on the north side of the Caloosahatchee River. The settlement was later renamed “Villas” after the Spanish word for “village”.
In the early 20th century, Villas was a popular destination for tourists from the Midwest and Northeast. The town was known for its fishing, hunting, and boating activities. In the 1950s, the town began to experience a decline in tourism due to the development of nearby Fort Myers.
Geography
Villas is located in Lee County, Florida, approximately 10 miles east of Fort Myers. The town is situated on the northern edge of the Caloosahatchee River. The town is bordered by the Caloosahatchee River to the north, the Gulf of Mexico to the south, and the Sanibel Causeway to the east.
The town has a total area of 1.3 square miles, all of which is land. The terrain is mostly flat and the town is located at an elevation of 10 feet above sea level.
Economy
The economy of Villas is largely based on tourism and fishing. The town is home to several marinas, boat ramps, and fishing charters. The town is also home to several restaurants, bars, and shops.
The town is also home to several small businesses, including a grocery store, a hardware store, and a gas station. The town is also home to a post office and a library.
Demographics
As of the 2019 census, the population of Villas was estimated to be 1,845. The racial makeup of the town was 94.3% White, 2.2% African American, 0.7% Native American, 0.7% Asian, 0.2% Pacific Islander, 0.7% from other races, and 1.2% from two or more races. Hispanic or Latino of any race were 3.2% of the population.
The median household income in Villas was $45,000, and the median family income was $50,000. The per capita income for the town was $20,000. About 11.2% of families and 14.2% of the population were below the poverty line, including 18.2% of those under age 18 and 8.2% of those age 65 or over.
Common Questions
What is Per Capita Income in Villas?
Per Capita income in Villas is $38,134.
What is the Median Family Income in Villas?
Median Family Income in Villas is $74,424.
What is the Median Household income in Villas?
Median Household Income in Villas is $55,165.
What is Income or Wage Gap in Villas?
Income or Wage Gap in Villas is 11.5%.
Women in Villas earn 88.5 cents for every dollar earned by a man.
What is Inequality or Gini Index in Villas?
Inequality or Gini Index in Villas is 0.45.
What is the Total Population of Villas?
Total Population of Villas is 13,801.
What is the Total Male Population of Villas?
Total Male Population of Villas is 6,511.
What is the Total Female Population of Villas?
Total Female Population of Villas is 7,290.
What is the Ratio of Males per 100 Females in Villas?
There are 89.31 Males per 100 Females in Villas.
What is the Ratio of Females per 100 Males in Villas?
There are 111.96 Females per 100 Males in Villas.
What is the Median Population Age in Villas?
Median Population Age in Villas is 52.5 Years.
What is the Average Family Size in Villas
Average Family Size in Villas is 2.8 People.
What is the Average Household Size in Villas
Average Household Size in Villas is 2.1 People.
How Large is the Labor Force in Villas?
There are 7,510 People in the Labor Forcein in Villas.
What is the Percentage of People in the Labor Force in Villas?
59.7% of People are in the Labor Force in Villas.
What is the Unemployment Rate in Villas?
Unemployment Rate in Villas is 3.5%.