West Loch Estate, HI Map & Demographics
West Loch Estate Map
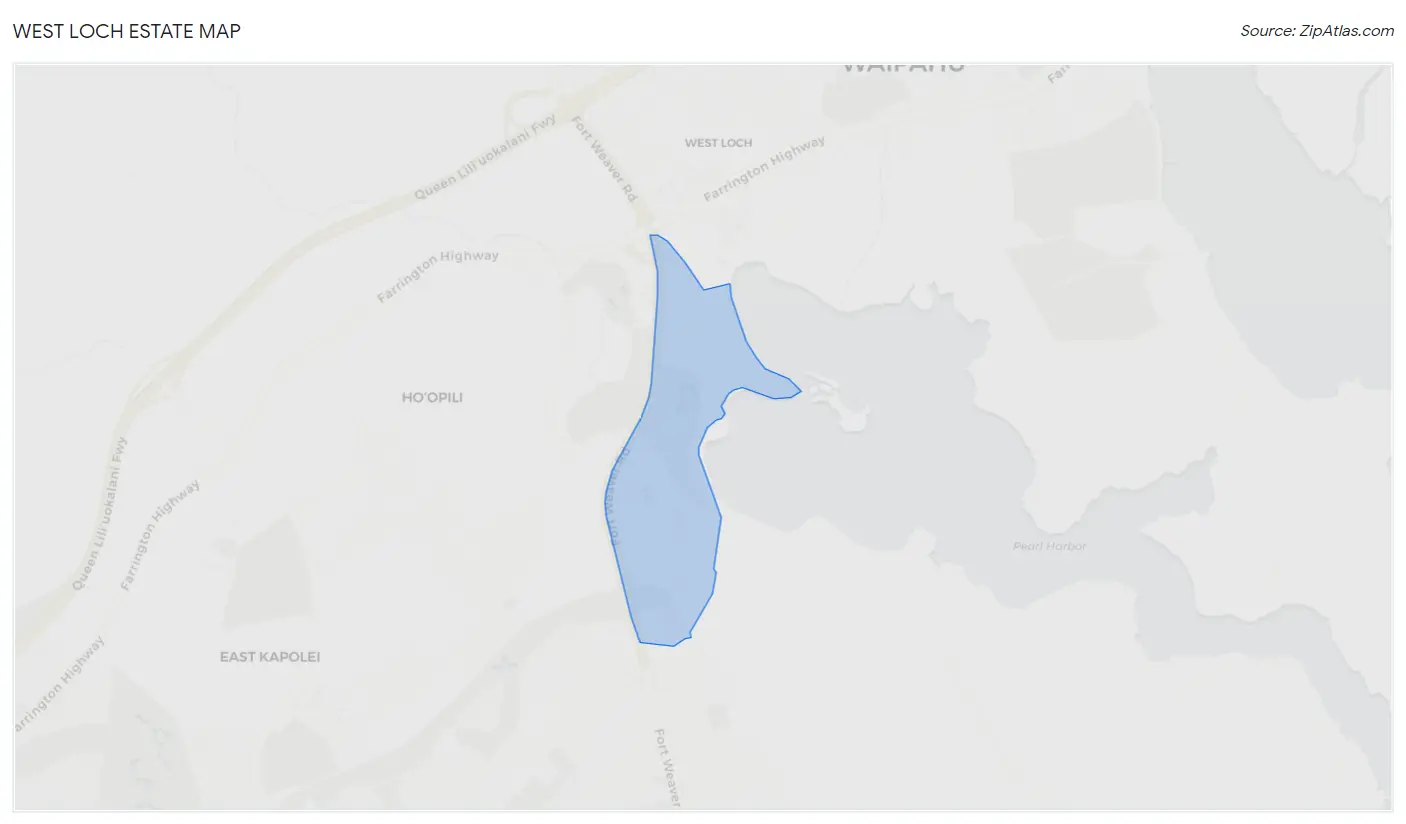
West Loch Estate Overview
$36,905
PER CAPITA INCOME
$146,906
AVG FAMILY INCOME
$119,250
AVG HOUSEHOLD INCOME
33.2%
WAGE / INCOME GAP [ % ]
66.8¢/ $1
WAGE / INCOME GAP [ $ ]
$4,391
FAMILY INCOME DEFICIT
0.39
INEQUALITY / GINI INDEX
6,469
TOTAL POPULATION
3,099
MALE POPULATION
3,370
FEMALE POPULATION
91.96
MALES / 100 FEMALES
108.74
FEMALES / 100 MALES
35.3
MEDIAN AGE
4.3
AVG FAMILY SIZE
3.8
AVG HOUSEHOLD SIZE
3,312
LABOR FORCE [ PEOPLE ]
66.7%
PERCENT IN LABOR FORCE
1.8%
UNEMPLOYMENT RATE
Income in West Loch Estate
Income Overview in West Loch Estate
Per Capita Income in West Loch Estate is $36,905, while median incomes of families and households are $146,906 and $119,250 respectively.
| Characteristic | Number | Measure |
| Per Capita Income | 6,469 | $36,905 |
| Median Family Income | 1,317 | $146,906 |
| Mean Family Income | 1,317 | $156,054 |
| Median Household Income | 1,700 | $119,250 |
| Mean Household Income | 1,700 | $134,423 |
| Income Deficit | 1,317 | $4,391 |
| Wage / Income Gap (%) | 6,469 | 33.16% |
| Wage / Income Gap ($) | 6,469 | 66.84¢ per $1 |
| Gini / Inequality Index | 6,469 | 0.39 |
Earnings by Sex in West Loch Estate
Average Earnings in West Loch Estate are $46,494, $59,235 for men and $39,590 for women, a difference of 33.2%.
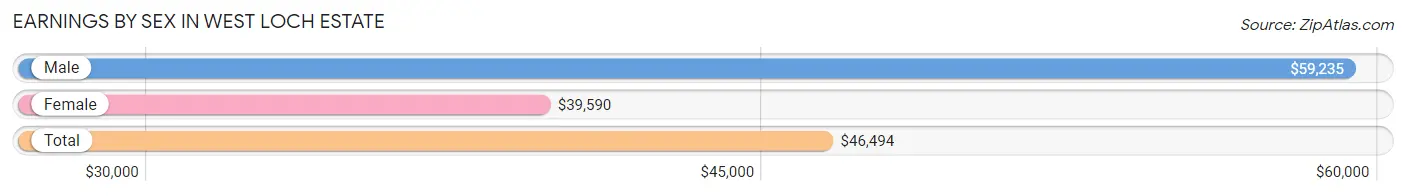
| Sex | Number | Average Earnings |
| Male | 1,736 (50.9%) | $59,235 |
| Female | 1,672 (49.1%) | $39,590 |
| Total | 3,408 (100.0%) | $46,494 |
Earnings by Sex by Income Bracket in West Loch Estate
The most common earnings brackets in West Loch Estate are $100,000+ for men (317 | 18.3%) and $40,000 to $44,999 for women (202 | 12.1%).
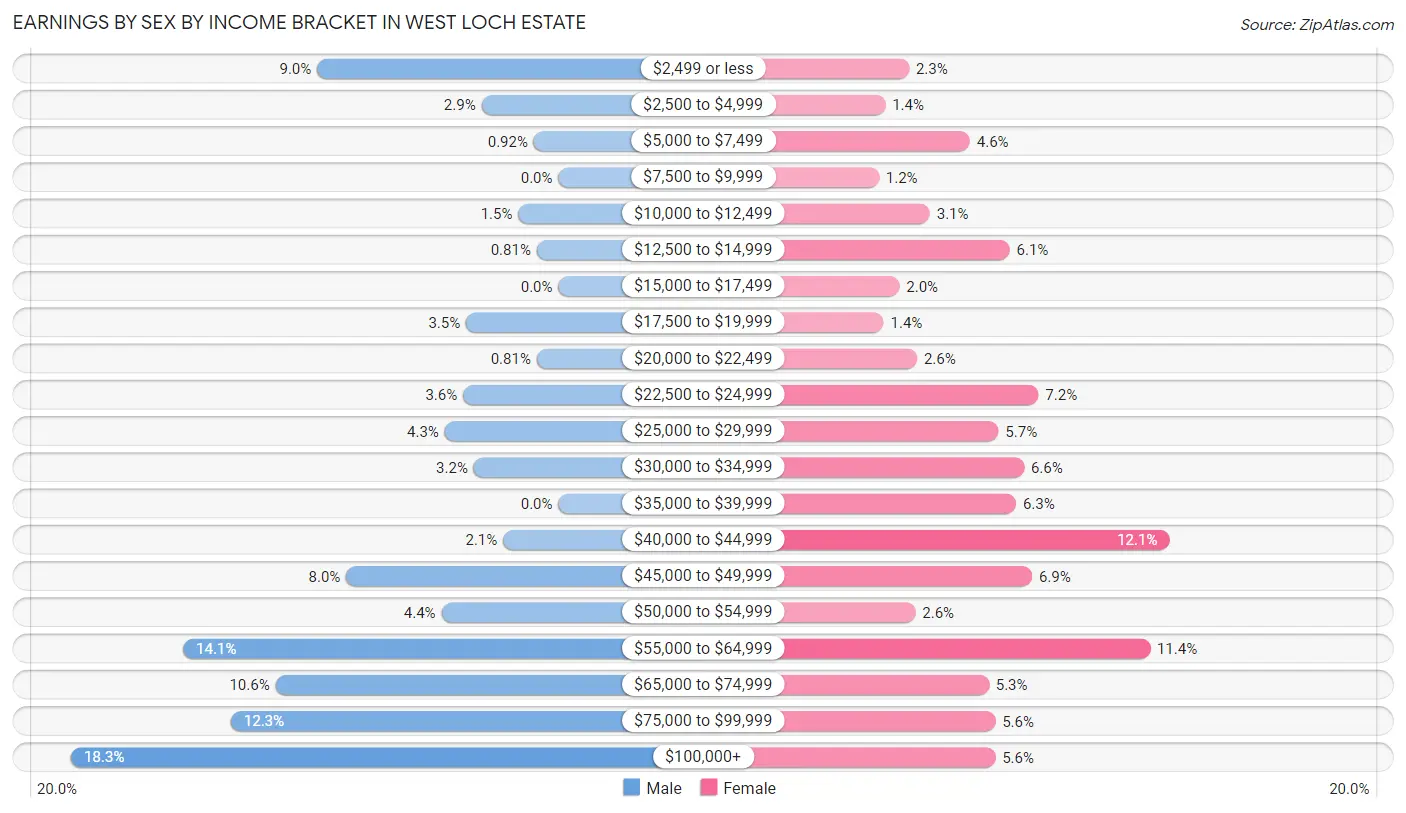
| Income | Male | Female |
| $2,499 or less | 157 (9.0%) | 39 (2.3%) |
| $2,500 to $4,999 | 50 (2.9%) | 24 (1.4%) |
| $5,000 to $7,499 | 16 (0.9%) | 77 (4.6%) |
| $7,500 to $9,999 | 0 (0.0%) | 20 (1.2%) |
| $10,000 to $12,499 | 26 (1.5%) | 52 (3.1%) |
| $12,500 to $14,999 | 14 (0.8%) | 102 (6.1%) |
| $15,000 to $17,499 | 0 (0.0%) | 33 (2.0%) |
| $17,500 to $19,999 | 60 (3.5%) | 23 (1.4%) |
| $20,000 to $22,499 | 14 (0.8%) | 44 (2.6%) |
| $22,500 to $24,999 | 62 (3.6%) | 120 (7.2%) |
| $25,000 to $29,999 | 74 (4.3%) | 95 (5.7%) |
| $30,000 to $34,999 | 55 (3.2%) | 111 (6.6%) |
| $35,000 to $39,999 | 0 (0.0%) | 106 (6.3%) |
| $40,000 to $44,999 | 36 (2.1%) | 202 (12.1%) |
| $45,000 to $49,999 | 138 (8.0%) | 116 (6.9%) |
| $50,000 to $54,999 | 76 (4.4%) | 43 (2.6%) |
| $55,000 to $64,999 | 244 (14.1%) | 190 (11.4%) |
| $65,000 to $74,999 | 184 (10.6%) | 89 (5.3%) |
| $75,000 to $99,999 | 213 (12.3%) | 93 (5.6%) |
| $100,000+ | 317 (18.3%) | 93 (5.6%) |
| Total | 1,736 (100.0%) | 1,672 (100.0%) |
Earnings by Sex by Educational Attainment in West Loch Estate
Average earnings in West Loch Estate are $65,091 for men and $40,839 for women, a difference of 37.3%. Men with an educational attainment of graduate degree enjoy the highest average annual earnings of $74,766, while those with high school diploma education earn the least with $29,293. Women with an educational attainment of graduate degree earn the most with the average annual earnings of $63,846, while those with high school diploma education have the smallest earnings of $33,657.
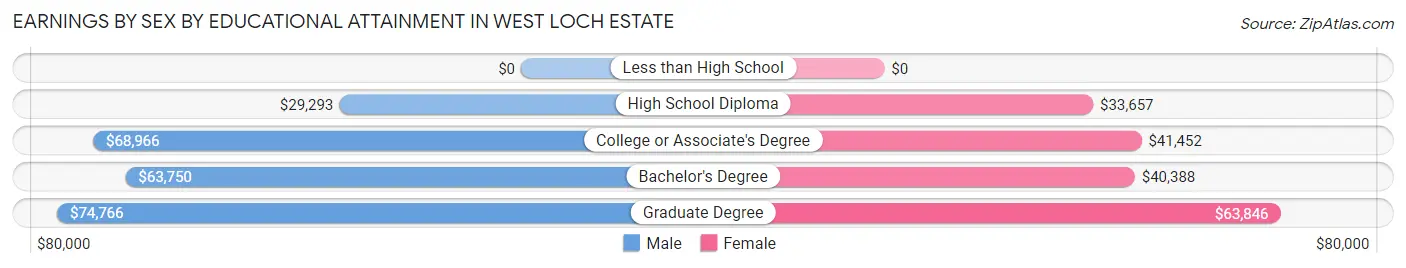
| Educational Attainment | Male Income | Female Income |
| Less than High School | - | - |
| High School Diploma | $29,293 | $33,657 |
| College or Associate's Degree | $68,966 | $41,452 |
| Bachelor's Degree | $63,750 | $40,388 |
| Graduate Degree | $74,766 | $63,846 |
| Total | $65,091 | $40,839 |
Family Income in West Loch Estate
Family Income Brackets in West Loch Estate
According to the West Loch Estate family income data, there are 324 families falling into the $150,000 to $199,999 income range, which is the most common income bracket and makes up 24.6% of all families.
| Income Bracket | # Families | % Families |
| Less than $10,000 | 0 | 0.0% |
| $10,000 to $14,999 | 5 | 0.4% |
| $15,000 to $24,999 | 22 | 1.7% |
| $25,000 to $34,999 | 8 | 0.6% |
| $35,000 to $49,999 | 134 | 10.2% |
| $50,000 to $74,999 | 122 | 9.3% |
| $75,000 to $99,999 | 113 | 8.6% |
| $100,000 to $149,999 | 273 | 20.7% |
| $150,000 to $199,999 | 324 | 24.6% |
| $200,000+ | 315 | 23.9% |
Family Income by Famaliy Size in West Loch Estate
7+ person families (116 | 8.8%) account for the highest median family income in West Loch Estate with $250,001 per family, while 2-person families (367 | 27.9%) have the highest median income of $54,940 per family member.
| Income Bracket | # Families | Median Income |
| 2-Person Families | 367 (27.9%) | $109,879 |
| 3-Person Families | 223 (16.9%) | $147,450 |
| 4-Person Families | 299 (22.7%) | $0 |
| 5-Person Families | 247 (18.8%) | $157,411 |
| 6-Person Families | 65 (4.9%) | $202,917 |
| 7+ Person Families | 116 (8.8%) | $250,001 |
| Total | 1,317 (100.0%) | $146,906 |
Family Income by Number of Earners in West Loch Estate
| Number of Earners | # Families | Median Income |
| No Earners | 107 (8.1%) | $0 |
| 1 Earner | 251 (19.1%) | $110,703 |
| 2 Earners | 495 (37.6%) | $108,508 |
| 3+ Earners | 464 (35.2%) | $192,404 |
| Total | 1,317 (100.0%) | $146,906 |
Household Income in West Loch Estate
Household Income Brackets in West Loch Estate
With 347 households falling in the category, the $200,000+ income range is the most frequent in West Loch Estate, accounting for 20.4% of all households. In contrast, only 20 households (1.2%) fall into the less than $10,000 income bracket, making it the least populous group.
| Income Bracket | # Households | % Households |
| Less than $10,000 | 20 | 1.2% |
| $10,000 to $14,999 | 36 | 2.1% |
| $15,000 to $24,999 | 83 | 4.9% |
| $25,000 to $34,999 | 78 | 4.6% |
| $35,000 to $49,999 | 236 | 13.9% |
| $50,000 to $74,999 | 128 | 7.5% |
| $75,000 to $99,999 | 134 | 7.9% |
| $100,000 to $149,999 | 313 | 18.4% |
| $150,000 to $199,999 | 326 | 19.2% |
| $200,000+ | 347 | 20.4% |
Household Income by Householder Age in West Loch Estate
The median household income in West Loch Estate is $119,250, with the highest median household income of $166,010 found in the 45 to 64 years age bracket for the primary householder. A total of 751 households (44.2%) fall into this category. Meanwhile, the 15 to 24 years age bracket for the primary householder has the lowest median household income of $0, with 71 households (4.2%) in this group.
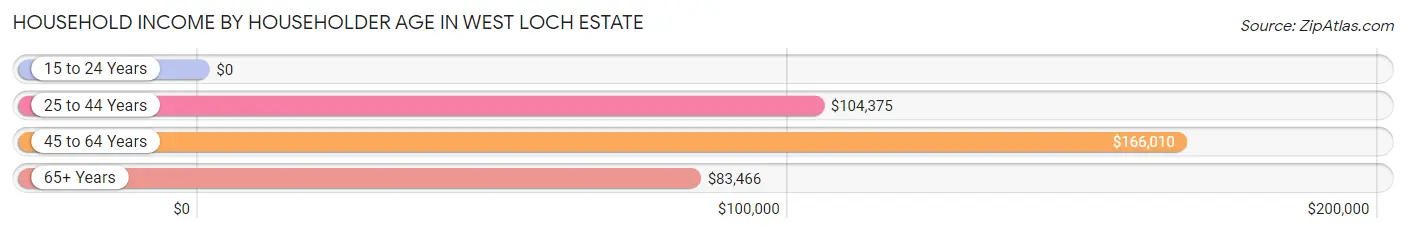
| Income Bracket | # Households | Median Income |
| 15 to 24 Years | 71 (4.2%) | $0 |
| 25 to 44 Years | 337 (19.8%) | $104,375 |
| 45 to 64 Years | 751 (44.2%) | $166,010 |
| 65+ Years | 541 (31.8%) | $83,466 |
| Total | 1,700 (100.0%) | $119,250 |
Poverty in West Loch Estate
Income Below Poverty by Sex and Age in West Loch Estate
With 5.7% poverty level for males and 5.8% for females among the residents of West Loch Estate, 16 and 17 year old males and 65 to 74 year old females are the most vulnerable to poverty, with 13 males (20.6%) and 38 females (13.1%) in their respective age groups living below the poverty level.
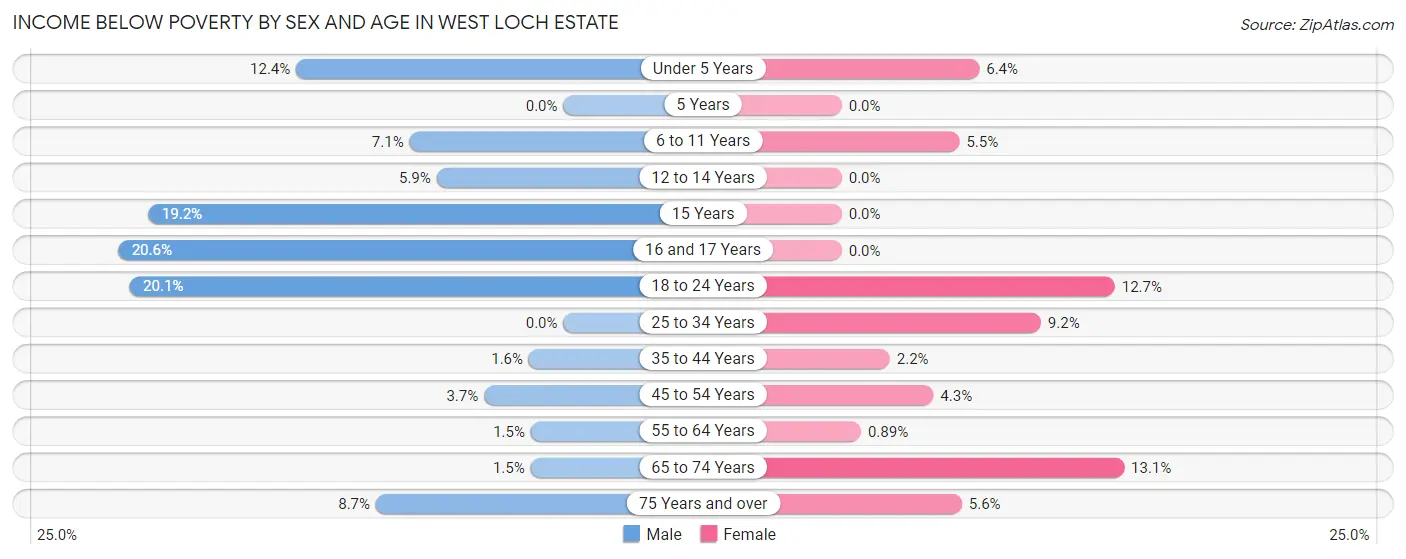
| Age Bracket | Male | Female |
| Under 5 Years | 16 (12.4%) | 15 (6.4%) |
| 5 Years | 0 (0.0%) | 0 (0.0%) |
| 6 to 11 Years | 20 (7.1%) | 13 (5.5%) |
| 12 to 14 Years | 5 (5.9%) | 0 (0.0%) |
| 15 Years | 5 (19.2%) | 0 (0.0%) |
| 16 and 17 Years | 13 (20.6%) | 0 (0.0%) |
| 18 to 24 Years | 78 (20.1%) | 28 (12.7%) |
| 25 to 34 Years | 0 (0.0%) | 51 (9.2%) |
| 35 to 44 Years | 5 (1.6%) | 6 (2.2%) |
| 45 to 54 Years | 13 (3.7%) | 17 (4.3%) |
| 55 to 64 Years | 5 (1.5%) | 4 (0.9%) |
| 65 to 74 Years | 5 (1.5%) | 38 (13.1%) |
| 75 Years and over | 12 (8.7%) | 21 (5.6%) |
| Total | 177 (5.7%) | 193 (5.8%) |
Income Above Poverty by Sex and Age in West Loch Estate
According to the poverty statistics in West Loch Estate, males aged 5 years and females aged 5 years are the age groups that are most secure financially, with 100.0% of males and 100.0% of females in these age groups living above the poverty line.
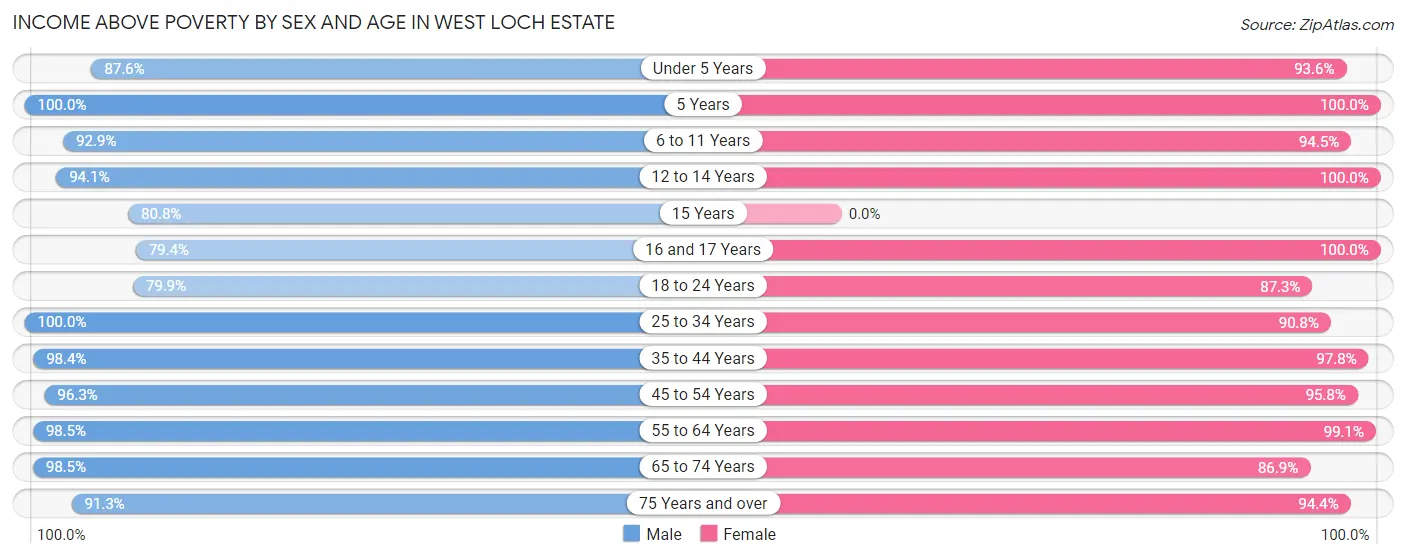
| Age Bracket | Male | Female |
| Under 5 Years | 113 (87.6%) | 220 (93.6%) |
| 5 Years | 225 (100.0%) | 119 (100.0%) |
| 6 to 11 Years | 260 (92.9%) | 225 (94.5%) |
| 12 to 14 Years | 80 (94.1%) | 138 (100.0%) |
| 15 Years | 21 (80.8%) | 0 (0.0%) |
| 16 and 17 Years | 50 (79.4%) | 59 (100.0%) |
| 18 to 24 Years | 310 (79.9%) | 193 (87.3%) |
| 25 to 34 Years | 426 (100.0%) | 501 (90.8%) |
| 35 to 44 Years | 308 (98.4%) | 263 (97.8%) |
| 45 to 54 Years | 340 (96.3%) | 383 (95.8%) |
| 55 to 64 Years | 327 (98.5%) | 447 (99.1%) |
| 65 to 74 Years | 325 (98.5%) | 252 (86.9%) |
| 75 Years and over | 126 (91.3%) | 356 (94.4%) |
| Total | 2,911 (94.3%) | 3,156 (94.2%) |
Income Below Poverty Among Married-Couple Families in West Loch Estate
The poverty statistics for married-couple families in West Loch Estate show that 2.2% or 22 of the total 1,004 families live below the poverty line. Families with 5 or more children have the highest poverty rate of 100.0%, comprising of 13 families. On the other hand, families with 1 or 2 children have the lowest poverty rate of 0.0%, which includes 0 families.
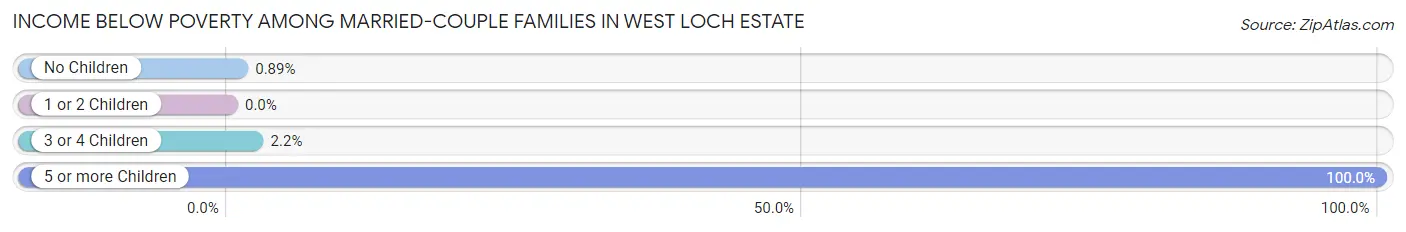
| Children | Above Poverty | Below Poverty |
| No Children | 559 (99.1%) | 5 (0.9%) |
| 1 or 2 Children | 248 (100.0%) | 0 (0.0%) |
| 3 or 4 Children | 175 (97.8%) | 4 (2.2%) |
| 5 or more Children | 0 (0.0%) | 13 (100.0%) |
| Total | 982 (97.8%) | 22 (2.2%) |
Income Below Poverty Among Single-Parent Households in West Loch Estate
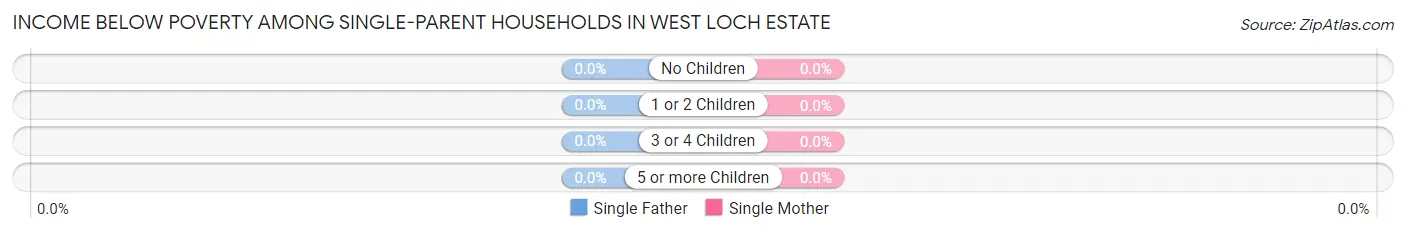
| Children | Single Father | Single Mother |
| No Children | 0 (0.0%) | 0 (0.0%) |
| 1 or 2 Children | 0 (0.0%) | 0 (0.0%) |
| 3 or 4 Children | 0 (0.0%) | 0 (0.0%) |
| 5 or more Children | 0 (0.0%) | 0 (0.0%) |
| Total | 0 (0.0%) | 0 (0.0%) |
Income Below Poverty Among Married-Couple vs Single-Parent Households in West Loch Estate
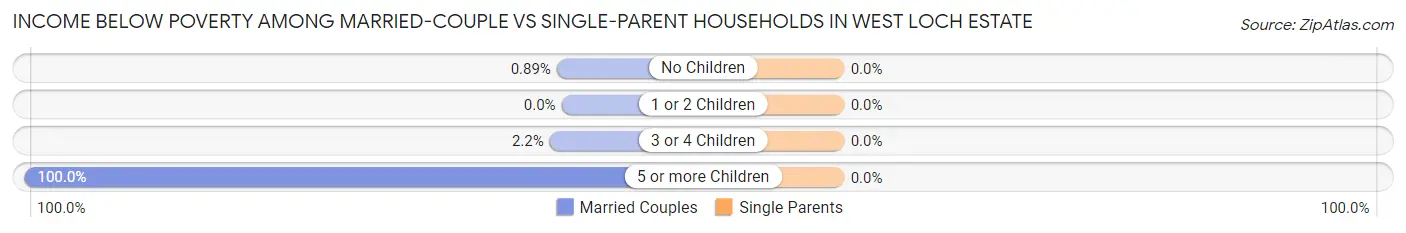
| Children | Married-Couple Families | Single-Parent Households |
| No Children | 5 (0.9%) | 0 (0.0%) |
| 1 or 2 Children | 0 (0.0%) | 0 (0.0%) |
| 3 or 4 Children | 4 (2.2%) | 0 (0.0%) |
| 5 or more Children | 13 (100.0%) | 0 (0.0%) |
| Total | 22 (2.2%) | 0 (0.0%) |
Race in West Loch Estate
The most populous races in West Loch Estate are Asian (3,100 | 47.9%), Two or more Races (2,169 | 33.5%), and Hispanic or Latino (891 | 13.8%).
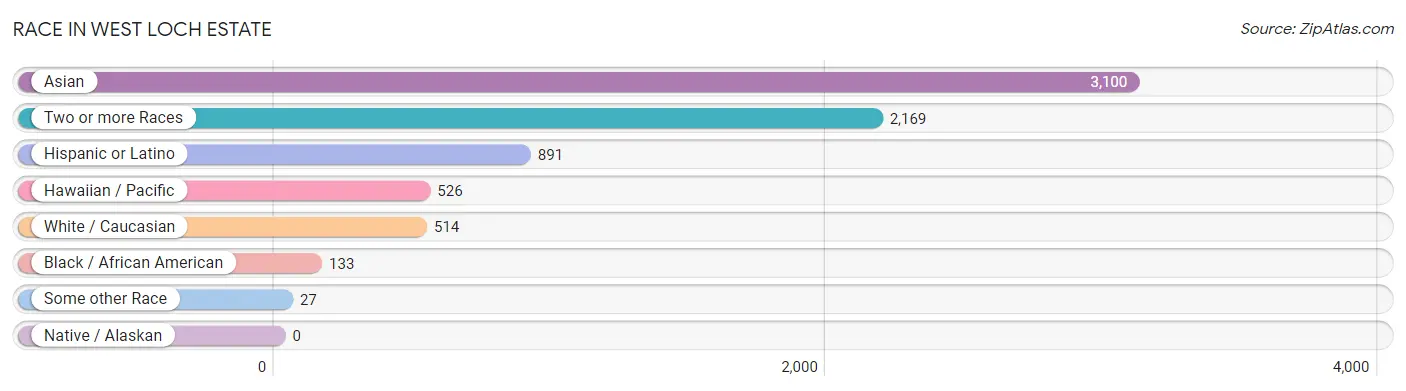
| Race | # Population | % Population |
| Asian | 3,100 | 47.9% |
| Black / African American | 133 | 2.1% |
| Hawaiian / Pacific | 526 | 8.1% |
| Hispanic or Latino | 891 | 13.8% |
| Native / Alaskan | 0 | 0.0% |
| White / Caucasian | 514 | 8.0% |
| Two or more Races | 2,169 | 33.5% |
| Some other Race | 27 | 0.4% |
| Total | 6,469 | 100.0% |
Ancestry in West Loch Estate
The most populous ancestries reported in West Loch Estate are Korean (3,356 | 51.9%), Native Hawaiian (1,857 | 28.7%), Bhutanese (1,523 | 23.5%), Indian (Asian) (1,102 | 17.0%), and Portuguese (590 | 9.1%), together accounting for 130.3% of all West Loch Estate residents.
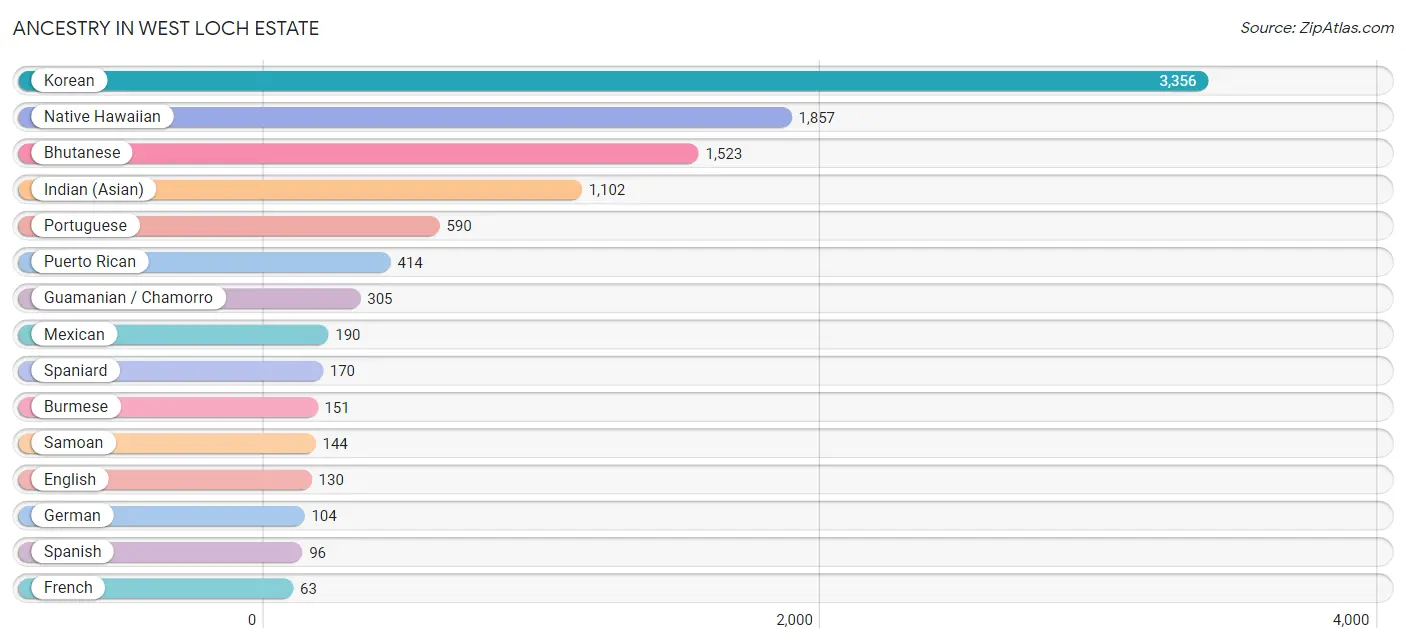
| Ancestry | # Population | % Population |
| African | 18 | 0.3% |
| American | 26 | 0.4% |
| Bhutanese | 1,523 | 23.5% |
| Burmese | 151 | 2.3% |
| Cherokee | 14 | 0.2% |
| Chinese | 41 | 0.6% |
| Creek | 5 | 0.1% |
| Dominican | 5 | 0.1% |
| English | 130 | 2.0% |
| French | 63 | 1.0% |
| German | 104 | 1.6% |
| Guamanian / Chamorro | 305 | 4.7% |
| Hungarian | 15 | 0.2% |
| Indian (Asian) | 1,102 | 17.0% |
| Irish | 48 | 0.7% |
| Italian | 26 | 0.4% |
| Korean | 3,356 | 51.9% |
| Marshallese | 4 | 0.1% |
| Mexican | 190 | 2.9% |
| Native Hawaiian | 1,857 | 28.7% |
| Polish | 4 | 0.1% |
| Portuguese | 590 | 9.1% |
| Puerto Rican | 414 | 6.4% |
| Russian | 8 | 0.1% |
| Samoan | 144 | 2.2% |
| Scandinavian | 15 | 0.2% |
| Scottish | 7 | 0.1% |
| South American | 16 | 0.3% |
| Spaniard | 170 | 2.6% |
| Spanish | 96 | 1.5% |
| Sri Lankan | 29 | 0.4% |
| Subsaharan African | 18 | 0.3% |
| Swedish | 34 | 0.5% |
| Thai | 32 | 0.5% |
| Tongan | 10 | 0.2% |
| Venezuelan | 16 | 0.3% | View All 36 Rows |
Immigrants in West Loch Estate
The most numerous immigrant groups reported in West Loch Estate came from Asia (1,446 | 22.4%), South Eastern Asia (1,374 | 21.2%), Philippines (1,333 | 20.6%), Eastern Asia (72 | 1.1%), and Vietnam (41 | 0.6%), together accounting for 65.9% of all West Loch Estate residents.
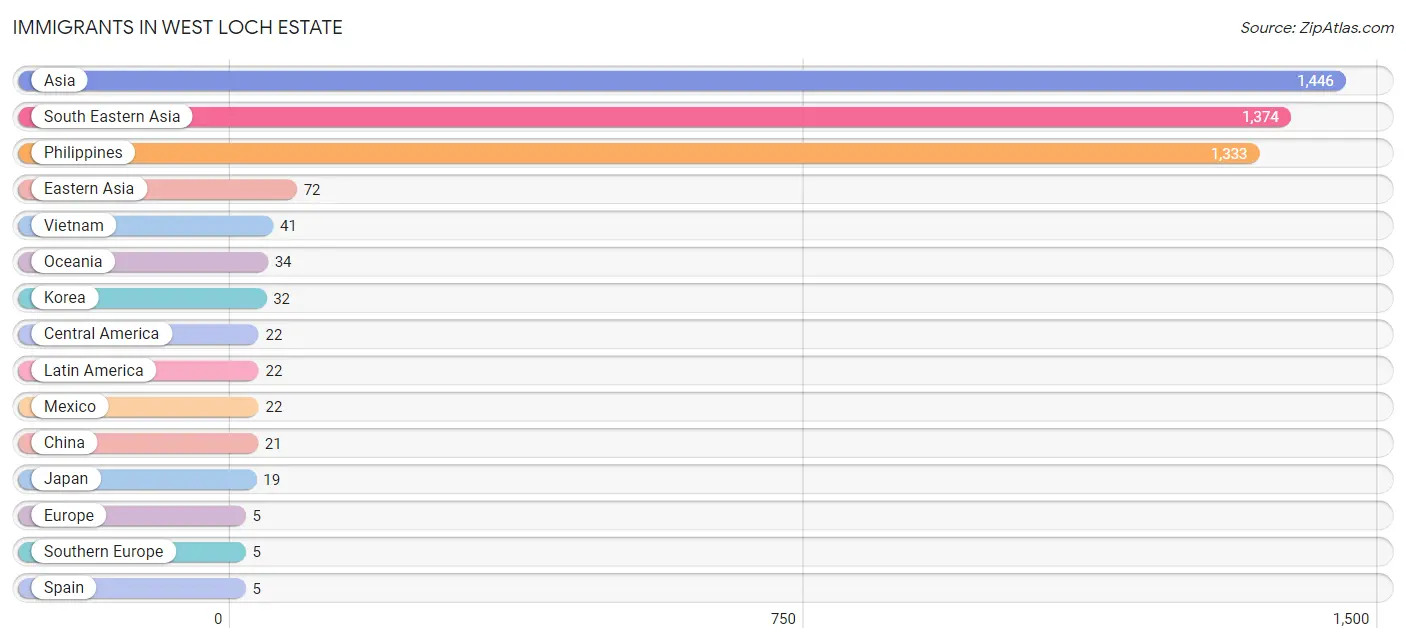
| Immigration Origin | # Population | % Population |
| Asia | 1,446 | 22.4% |
| Central America | 22 | 0.3% |
| China | 21 | 0.3% |
| Eastern Asia | 72 | 1.1% |
| Europe | 5 | 0.1% |
| Japan | 19 | 0.3% |
| Korea | 32 | 0.5% |
| Latin America | 22 | 0.3% |
| Mexico | 22 | 0.3% |
| Micronesia | 4 | 0.1% |
| Oceania | 34 | 0.5% |
| Philippines | 1,333 | 20.6% |
| South Eastern Asia | 1,374 | 21.2% |
| Southern Europe | 5 | 0.1% |
| Spain | 5 | 0.1% |
| Taiwan | 4 | 0.1% |
| Vietnam | 41 | 0.6% | View All 17 Rows |
Sex and Age in West Loch Estate
Sex and Age in West Loch Estate
The most populous age groups in West Loch Estate are 5 to 9 Years (486 | 15.7%) for men and 30 to 34 Years (335 | 9.9%) for women.
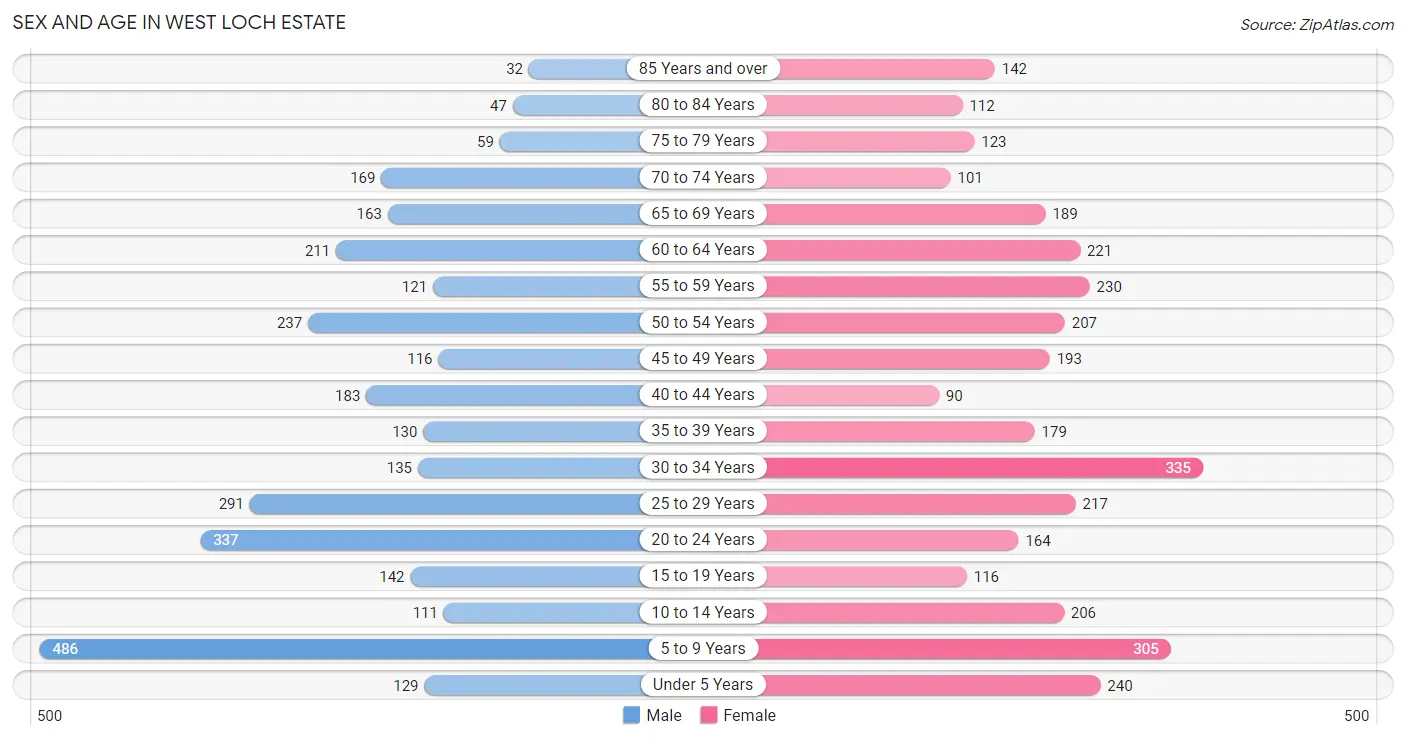
| Age Bracket | Male | Female |
| Under 5 Years | 129 (4.2%) | 240 (7.1%) |
| 5 to 9 Years | 486 (15.7%) | 305 (9.0%) |
| 10 to 14 Years | 111 (3.6%) | 206 (6.1%) |
| 15 to 19 Years | 142 (4.6%) | 116 (3.4%) |
| 20 to 24 Years | 337 (10.9%) | 164 (4.9%) |
| 25 to 29 Years | 291 (9.4%) | 217 (6.4%) |
| 30 to 34 Years | 135 (4.4%) | 335 (9.9%) |
| 35 to 39 Years | 130 (4.2%) | 179 (5.3%) |
| 40 to 44 Years | 183 (5.9%) | 90 (2.7%) |
| 45 to 49 Years | 116 (3.7%) | 193 (5.7%) |
| 50 to 54 Years | 237 (7.6%) | 207 (6.1%) |
| 55 to 59 Years | 121 (3.9%) | 230 (6.8%) |
| 60 to 64 Years | 211 (6.8%) | 221 (6.6%) |
| 65 to 69 Years | 163 (5.3%) | 189 (5.6%) |
| 70 to 74 Years | 169 (5.4%) | 101 (3.0%) |
| 75 to 79 Years | 59 (1.9%) | 123 (3.6%) |
| 80 to 84 Years | 47 (1.5%) | 112 (3.3%) |
| 85 Years and over | 32 (1.0%) | 142 (4.2%) |
| Total | 3,099 (100.0%) | 3,370 (100.0%) |
Families and Households in West Loch Estate
Median Family Size in West Loch Estate
The median family size in West Loch Estate is 4.35 persons per family, with married-couple families (1,004 | 76.2%) accounting for the largest median family size of 4.6 persons per family. On the other hand, single male/father families (111 | 8.4%) represent the smallest median family size with 3.08 persons per family.
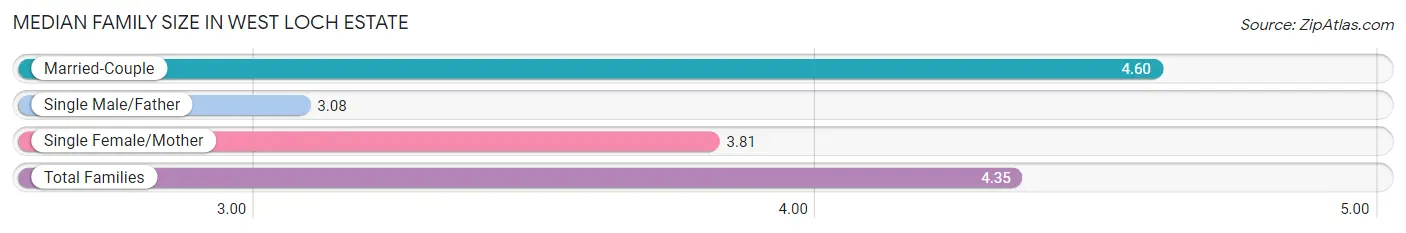
| Family Type | # Families | Family Size |
| Married-Couple | 1,004 (76.2%) | 4.60 |
| Single Male/Father | 111 (8.4%) | 3.08 |
| Single Female/Mother | 202 (15.3%) | 3.81 |
| Total Families | 1,317 (100.0%) | 4.35 |
Median Household Size in West Loch Estate
The median household size in West Loch Estate is 3.78 persons per household, with married-couple households (1,004 | 59.1%) accounting for the largest median household size of 4.68 persons per household. non-family households (383 | 22.5%) represent the smallest median household size with 1.55 persons per household.
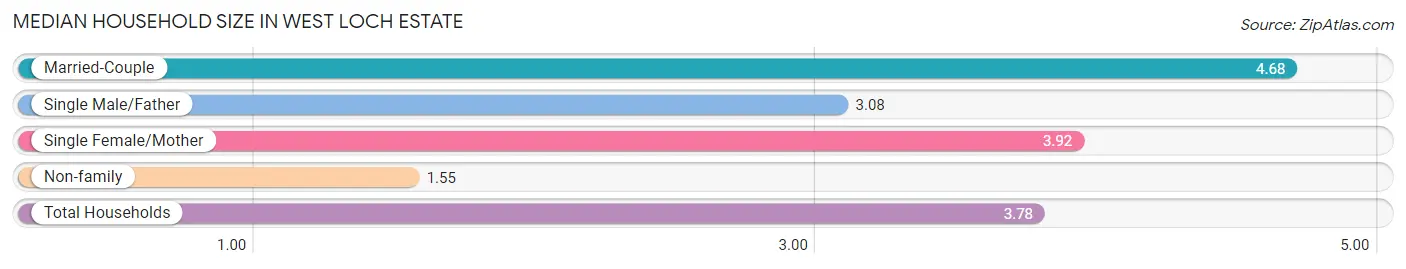
| Household Type | # Households | Household Size |
| Married-Couple | 1,004 (59.1%) | 4.68 |
| Single Male/Father | 111 (6.5%) | 3.08 |
| Single Female/Mother | 202 (11.9%) | 3.92 |
| Non-family | 383 (22.5%) | 1.55 |
| Total Households | 1,700 (100.0%) | 3.78 |
Household Size by Marriage Status in West Loch Estate
Out of a total of 1,700 households in West Loch Estate, 1,317 (77.5%) are family households, while 383 (22.5%) are nonfamily households. The most numerous type of family households are 2-person households, comprising 361, and the most common type of nonfamily households are 1-person households, comprising 241.
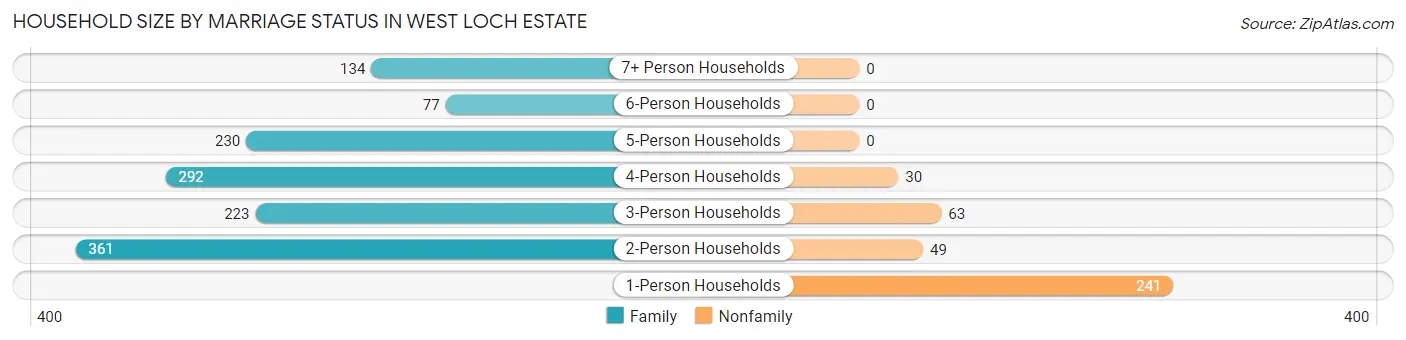
| Household Size | Family Households | Nonfamily Households |
| 1-Person Households | - | 241 (14.2%) |
| 2-Person Households | 361 (21.2%) | 49 (2.9%) |
| 3-Person Households | 223 (13.1%) | 63 (3.7%) |
| 4-Person Households | 292 (17.2%) | 30 (1.8%) |
| 5-Person Households | 230 (13.5%) | 0 (0.0%) |
| 6-Person Households | 77 (4.5%) | 0 (0.0%) |
| 7+ Person Households | 134 (7.9%) | 0 (0.0%) |
| Total | 1,317 (77.5%) | 383 (22.5%) |
Female Fertility in West Loch Estate
Fertility by Age in West Loch Estate
Average fertility rate in West Loch Estate is 68.0 births per 1,000 women. Women in the age bracket of 35 to 50 years have the highest fertility rate with 124.0 births per 1,000 women. Women in the age bracket of 35 to 50 years acount for 66.3% of all women with births.
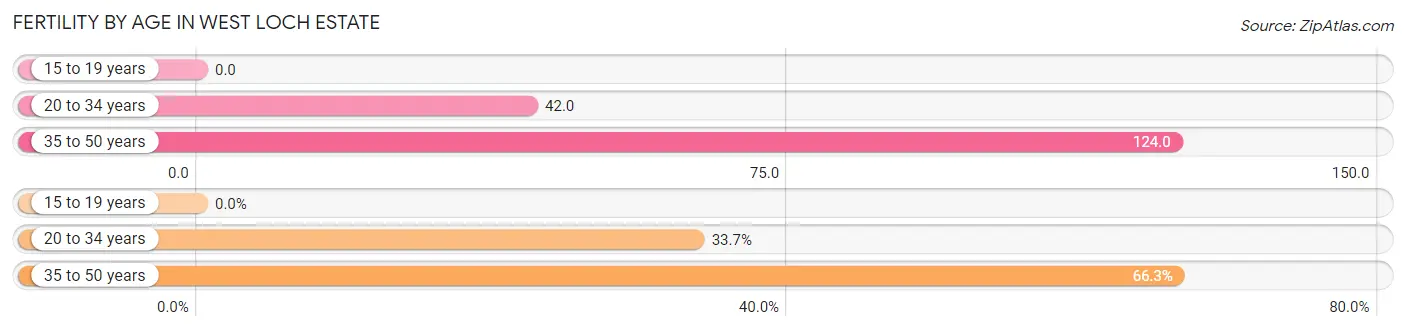
| Age Bracket | Women with Births | Births / 1,000 Women |
| 15 to 19 years | 0 (0.0%) | 0.0 |
| 20 to 34 years | 30 (33.7%) | 42.0 |
| 35 to 50 years | 59 (66.3%) | 124.0 |
| Total | 89 (100.0%) | 68.0 |
Fertility by Age by Marriage Status in West Loch Estate
75.3% of women with births (89) in West Loch Estate are married. The highest percentage of unmarried women with births falls into 20 to 34 years age bracket with 50.0% of them unmarried at the time of birth, while the lowest percentage of unmarried women with births belong to 35 to 50 years age bracket with 11.9% of them unmarried.
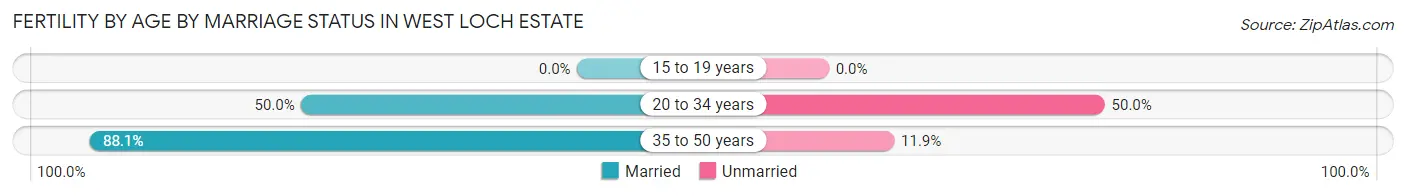
| Age Bracket | Married | Unmarried |
| 15 to 19 years | 0 (0.0%) | 0 (0.0%) |
| 20 to 34 years | 15 (50.0%) | 15 (50.0%) |
| 35 to 50 years | 52 (88.1%) | 7 (11.9%) |
| Total | 67 (75.3%) | 22 (24.7%) |
Fertility by Education in West Loch Estate
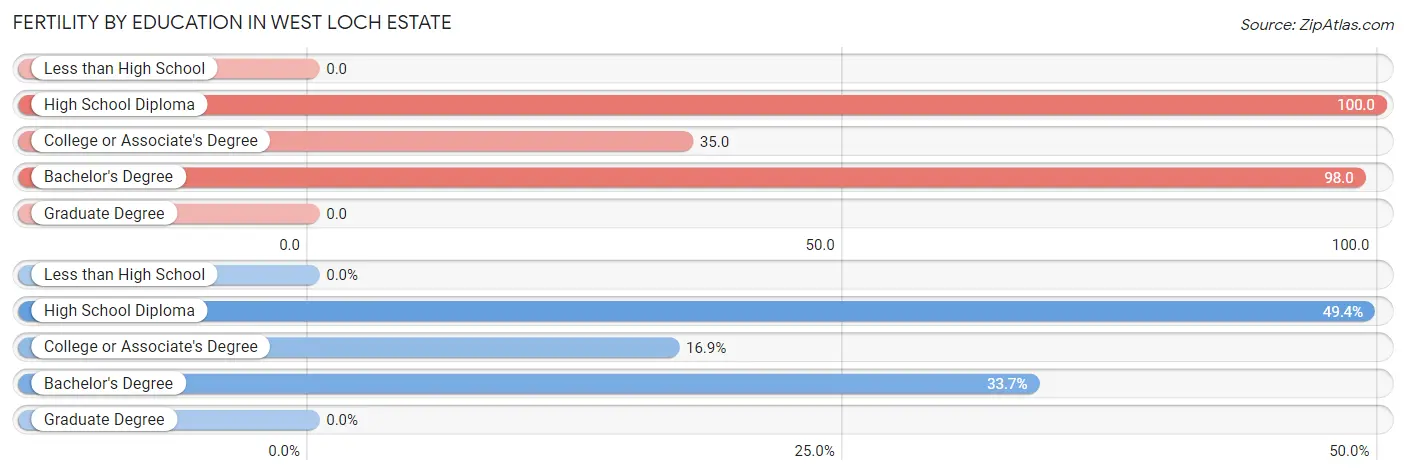
| Educational Attainment | Women with Births | Births / 1,000 Women |
| Less than High School | 0 (0.0%) | 0.0 |
| High School Diploma | 44 (49.4%) | 100.0 |
| College or Associate's Degree | 15 (16.9%) | 35.0 |
| Bachelor's Degree | 30 (33.7%) | 98.0 |
| Graduate Degree | 0 (0.0%) | 0.0 |
| Total | 89 (100.0%) | 68.0 |
Fertility by Education by Marriage Status in West Loch Estate
24.7% of women with births in West Loch Estate are unmarried. Women with the educational attainment of bachelor's degree are most likely to be married with 100.0% of them married at childbirth, while women with the educational attainment of college or associate's degree are least likely to be married with 100.0% of them unmarried at childbirth.
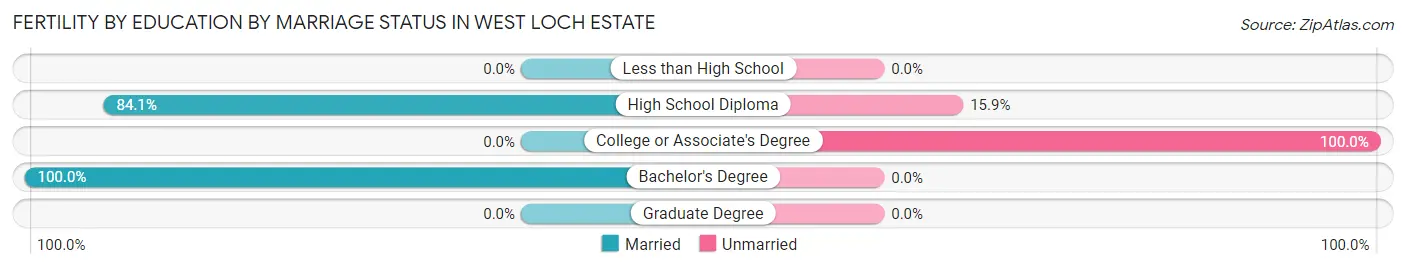
| Educational Attainment | Married | Unmarried |
| Less than High School | 0 (0.0%) | 0 (0.0%) |
| High School Diploma | 37 (84.1%) | 7 (15.9%) |
| College or Associate's Degree | 0 (0.0%) | 15 (100.0%) |
| Bachelor's Degree | 30 (100.0%) | 0 (0.0%) |
| Graduate Degree | 0 (0.0%) | 0 (0.0%) |
| Total | 67 (75.3%) | 22 (24.7%) |
Employment Characteristics in West Loch Estate
Employment by Class of Employer in West Loch Estate
Among the 3,158 employed individuals in West Loch Estate, private company employees (1,828 | 57.9%), federal government employees (416 | 13.2%), and state government employees (276 | 8.7%) make up the most common classes of employment.
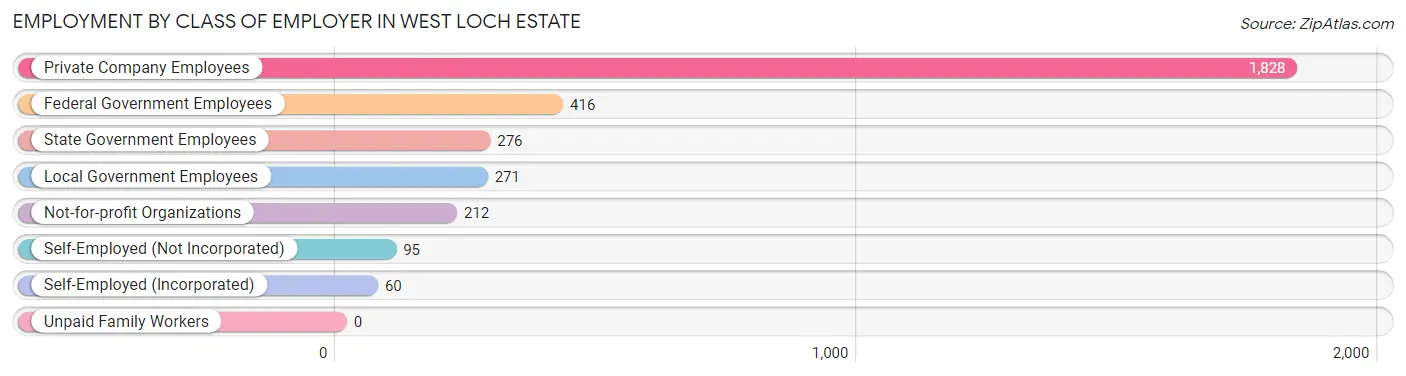
| Employer Class | # Employees | % Employees |
| Private Company Employees | 1,828 | 57.9% |
| Self-Employed (Incorporated) | 60 | 1.9% |
| Self-Employed (Not Incorporated) | 95 | 3.0% |
| Not-for-profit Organizations | 212 | 6.7% |
| Local Government Employees | 271 | 8.6% |
| State Government Employees | 276 | 8.7% |
| Federal Government Employees | 416 | 13.2% |
| Unpaid Family Workers | 0 | 0.0% |
| Total | 3,158 | 100.0% |
Employment Status by Age in West Loch Estate
According to the labor force statistics for West Loch Estate, out of the total population over 16 years of age (4,966), 66.7% or 3,312 individuals are in the labor force, with 1.8% or 60 of them unemployed. The age group with the highest labor force participation rate is 30 to 34 years, with 97.9% or 460 individuals in the labor force. Within the labor force, the 16 to 19 years age range has the highest percentage of unemployed individuals, with 15.4% or 14 of them being unemployed.
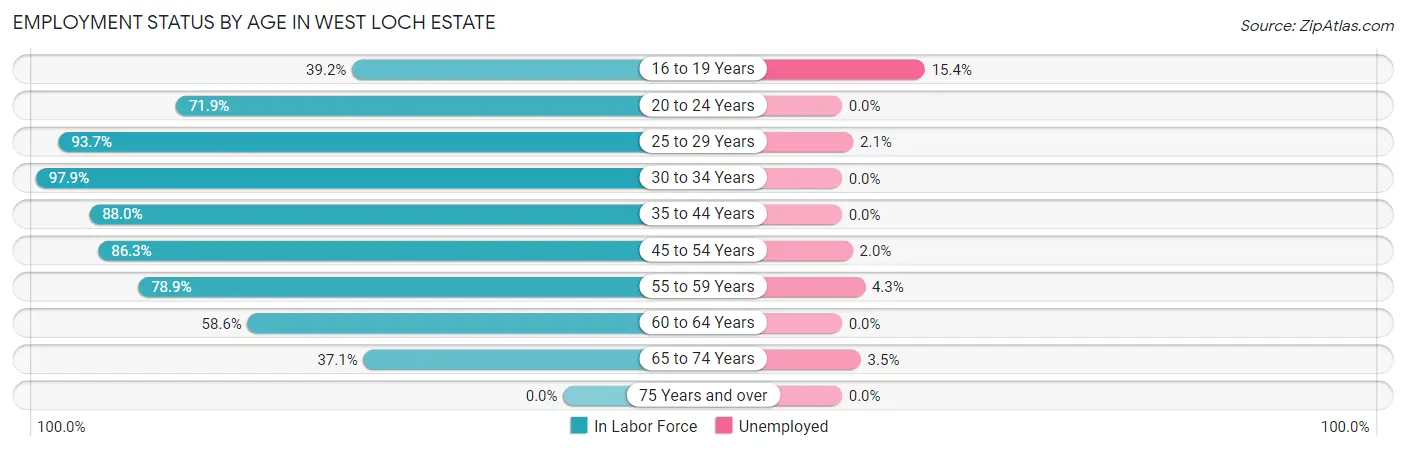
| Age Bracket | In Labor Force | Unemployed |
| 16 to 19 Years | 91 (39.2%) | 14 (15.4%) |
| 20 to 24 Years | 360 (71.9%) | 0 (0.0%) |
| 25 to 29 Years | 476 (93.7%) | 10 (2.1%) |
| 30 to 34 Years | 460 (97.9%) | 0 (0.0%) |
| 35 to 44 Years | 512 (88.0%) | 0 (0.0%) |
| 45 to 54 Years | 650 (86.3%) | 13 (2.0%) |
| 55 to 59 Years | 277 (78.9%) | 12 (4.3%) |
| 60 to 64 Years | 253 (58.6%) | 0 (0.0%) |
| 65 to 74 Years | 231 (37.1%) | 8 (3.5%) |
| 75 Years and over | 0 (0.0%) | 0 (0.0%) |
| Total | 3,312 (66.7%) | 60 (1.8%) |
Employment Status by Educational Attainment in West Loch Estate
According to labor force statistics for West Loch Estate, 84.9% of individuals (2,629) out of the total population between 25 and 64 years of age (3,096) are in the labor force, with 1.4% or 37 of them being unemployed. The group with the highest labor force participation rate are those with the educational attainment of less than high school, with 90.6% or 48 individuals in the labor force. Within the labor force, individuals with less than high school education have the highest percentage of unemployment, with 20.8% or 10 of them being unemployed.
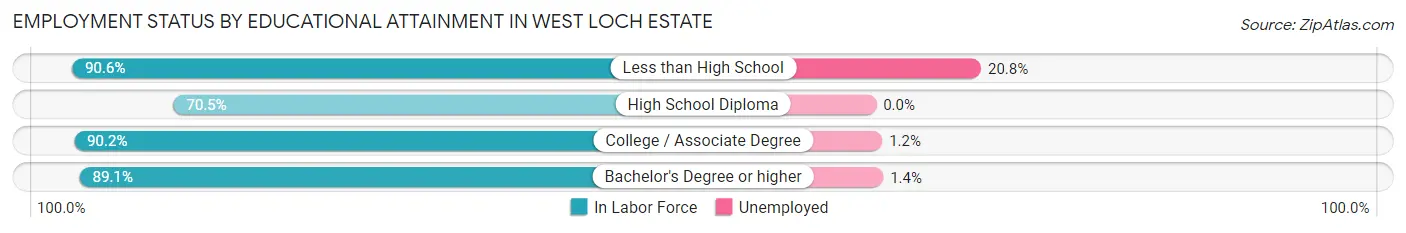
| Educational Attainment | In Labor Force | Unemployed |
| Less than High School | 48 (90.6%) | 11 (20.8%) |
| High School Diploma | 551 (70.5%) | 0 (0.0%) |
| College / Associate Degree | 1,154 (90.2%) | 15 (1.2%) |
| Bachelor's Degree or higher | 875 (89.1%) | 14 (1.4%) |
| Total | 2,629 (84.9%) | 43 (1.4%) |
Employment Occupations by Sex in West Loch Estate
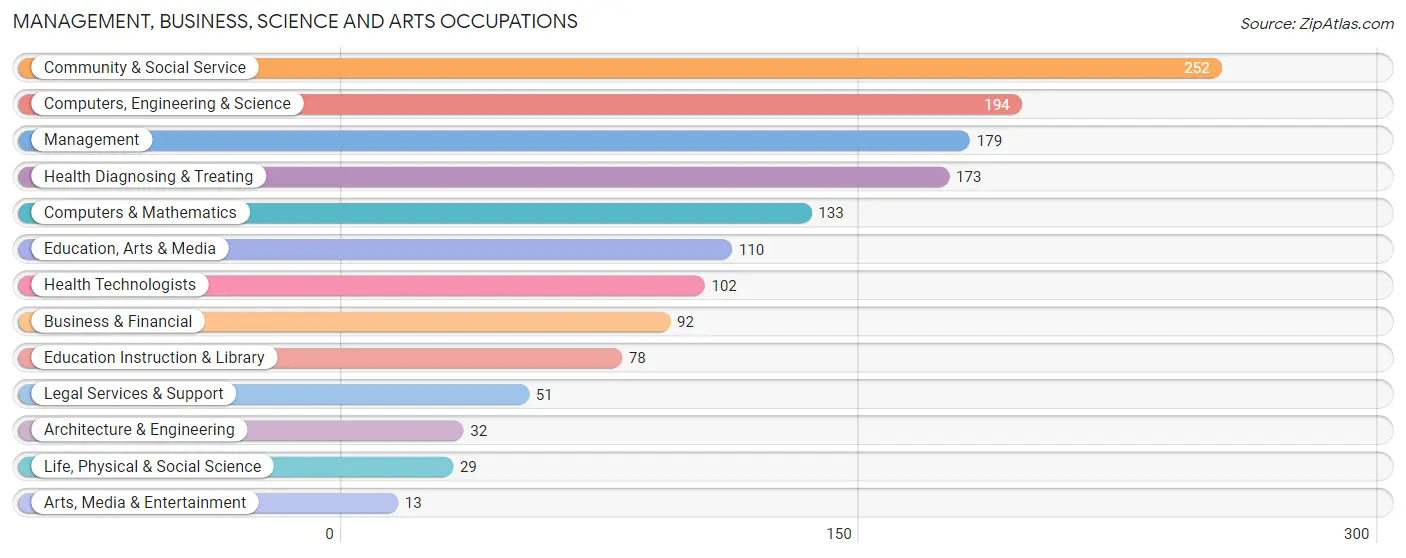
Management, Business, Science and Arts Occupations
The most common Management, Business, Science and Arts occupations in West Loch Estate are Community & Social Service (252 | 8.0%), Computers, Engineering & Science (194 | 6.1%), Management (179 | 5.7%), Health Diagnosing & Treating (173 | 5.5%), and Computers & Mathematics (133 | 4.2%).
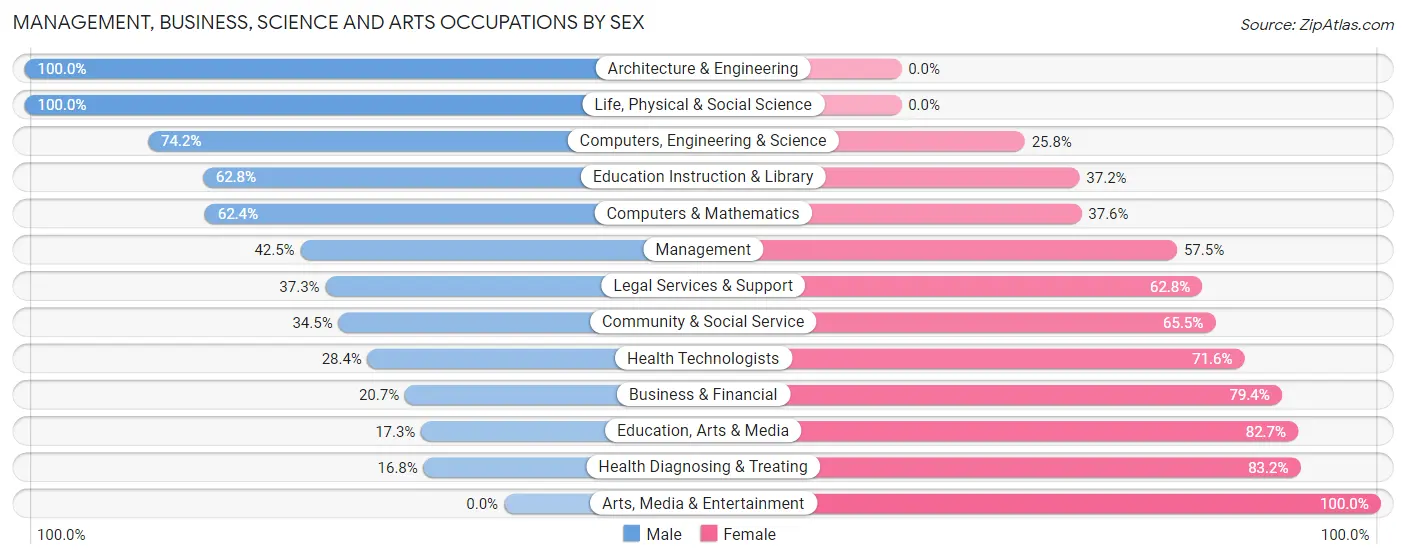
Management, Business, Science and Arts Occupations by Sex
Within the Management, Business, Science and Arts occupations in West Loch Estate, the most male-oriented occupations are Architecture & Engineering (100.0%), Life, Physical & Social Science (100.0%), and Computers, Engineering & Science (74.2%), while the most female-oriented occupations are Arts, Media & Entertainment (100.0%), Health Diagnosing & Treating (83.2%), and Education, Arts & Media (82.7%).
| Occupation | Male | Female |
| Management | 76 (42.5%) | 103 (57.5%) |
| Business & Financial | 19 (20.6%) | 73 (79.3%) |
| Computers, Engineering & Science | 144 (74.2%) | 50 (25.8%) |
| Computers & Mathematics | 83 (62.4%) | 50 (37.6%) |
| Architecture & Engineering | 32 (100.0%) | 0 (0.0%) |
| Life, Physical & Social Science | 29 (100.0%) | 0 (0.0%) |
| Community & Social Service | 87 (34.5%) | 165 (65.5%) |
| Education, Arts & Media | 19 (17.3%) | 91 (82.7%) |
| Legal Services & Support | 19 (37.2%) | 32 (62.7%) |
| Education Instruction & Library | 49 (62.8%) | 29 (37.2%) |
| Arts, Media & Entertainment | 0 (0.0%) | 13 (100.0%) |
| Health Diagnosing & Treating | 29 (16.8%) | 144 (83.2%) |
| Health Technologists | 29 (28.4%) | 73 (71.6%) |
| Total (Category) | 355 (39.9%) | 535 (60.1%) |
| Total (Overall) | 1,575 (49.9%) | 1,582 (50.1%) |
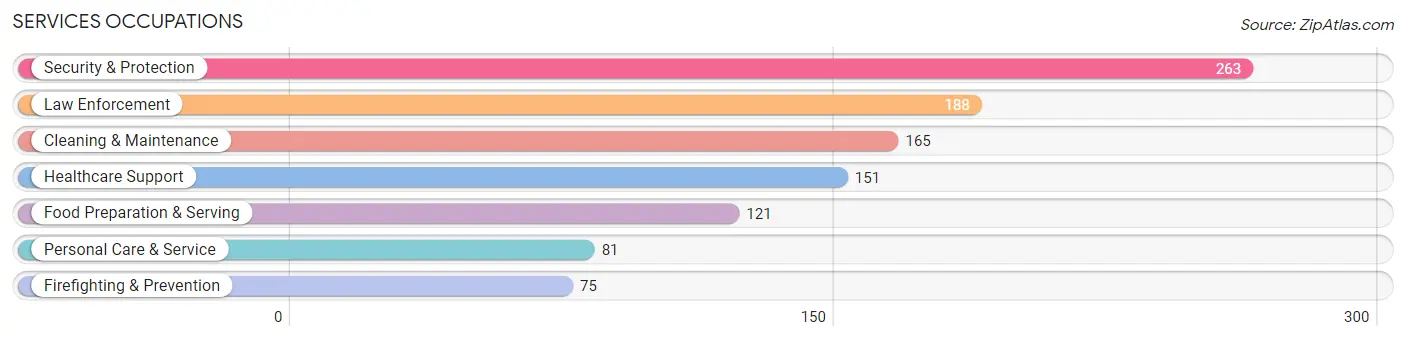
Services Occupations
The most common Services occupations in West Loch Estate are Security & Protection (263 | 8.3%), Law Enforcement (188 | 6.0%), Cleaning & Maintenance (165 | 5.2%), Healthcare Support (151 | 4.8%), and Food Preparation & Serving (121 | 3.8%).
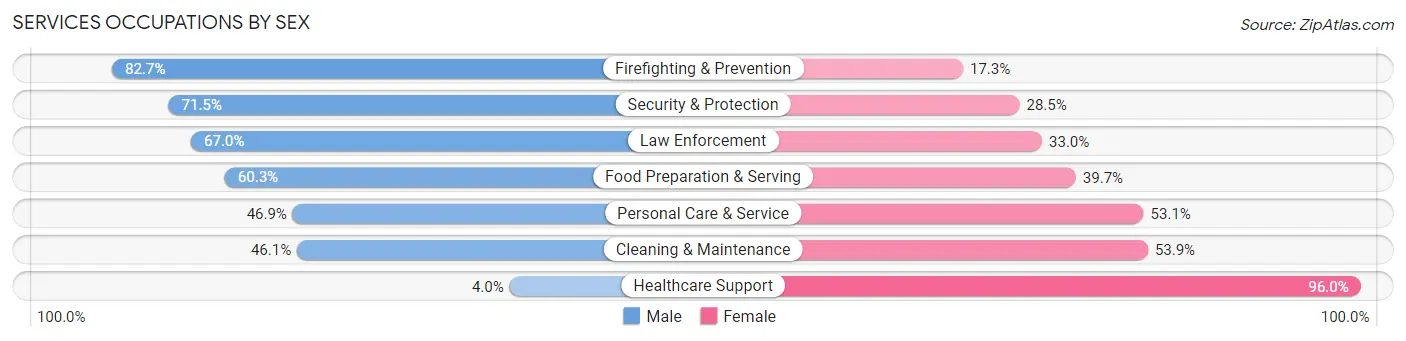
Services Occupations by Sex
Within the Services occupations in West Loch Estate, the most male-oriented occupations are Firefighting & Prevention (82.7%), Security & Protection (71.5%), and Law Enforcement (67.0%), while the most female-oriented occupations are Healthcare Support (96.0%), Cleaning & Maintenance (53.9%), and Personal Care & Service (53.1%).
| Occupation | Male | Female |
| Healthcare Support | 6 (4.0%) | 145 (96.0%) |
| Security & Protection | 188 (71.5%) | 75 (28.5%) |
| Firefighting & Prevention | 62 (82.7%) | 13 (17.3%) |
| Law Enforcement | 126 (67.0%) | 62 (33.0%) |
| Food Preparation & Serving | 73 (60.3%) | 48 (39.7%) |
| Cleaning & Maintenance | 76 (46.1%) | 89 (53.9%) |
| Personal Care & Service | 38 (46.9%) | 43 (53.1%) |
| Total (Category) | 381 (48.8%) | 400 (51.2%) |
| Total (Overall) | 1,575 (49.9%) | 1,582 (50.1%) |
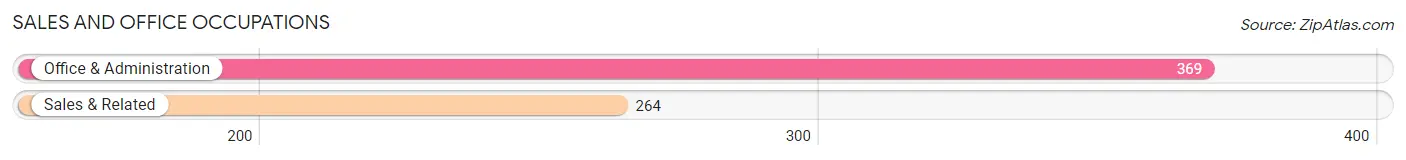
Sales and Office Occupations
The most common Sales and Office occupations in West Loch Estate are Office & Administration (369 | 11.7%), and Sales & Related (264 | 8.4%).
Sales and Office Occupations by Sex
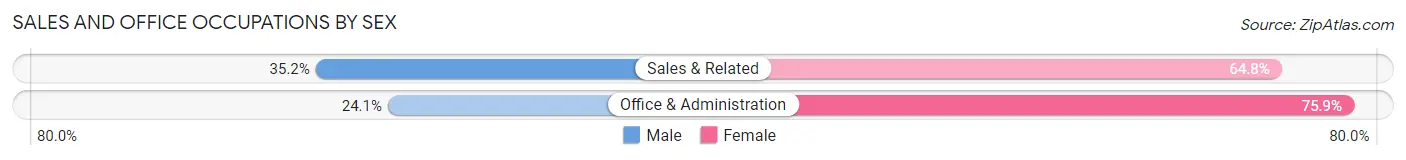
| Occupation | Male | Female |
| Sales & Related | 93 (35.2%) | 171 (64.8%) |
| Office & Administration | 89 (24.1%) | 280 (75.9%) |
| Total (Category) | 182 (28.7%) | 451 (71.3%) |
| Total (Overall) | 1,575 (49.9%) | 1,582 (50.1%) |
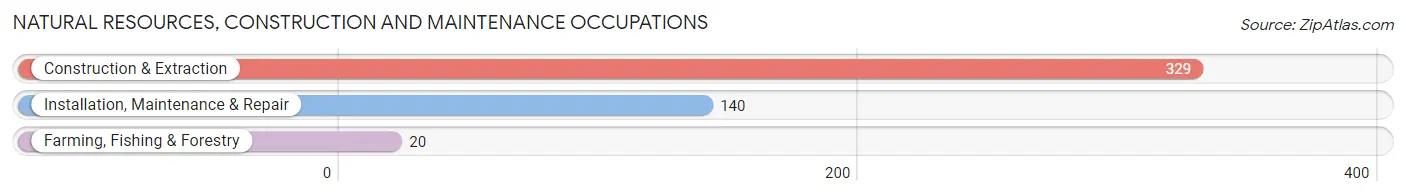
Natural Resources, Construction and Maintenance Occupations
The most common Natural Resources, Construction and Maintenance occupations in West Loch Estate are Construction & Extraction (329 | 10.4%), Installation, Maintenance & Repair (140 | 4.4%), and Farming, Fishing & Forestry (20 | 0.6%).
Natural Resources, Construction and Maintenance Occupations by Sex
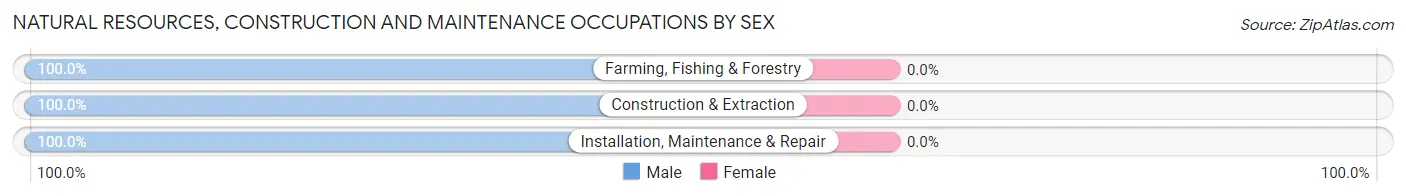
| Occupation | Male | Female |
| Farming, Fishing & Forestry | 20 (100.0%) | 0 (0.0%) |
| Construction & Extraction | 329 (100.0%) | 0 (0.0%) |
| Installation, Maintenance & Repair | 140 (100.0%) | 0 (0.0%) |
| Total (Category) | 489 (100.0%) | 0 (0.0%) |
| Total (Overall) | 1,575 (49.9%) | 1,582 (50.1%) |
Production, Transportation and Moving Occupations
The most common Production, Transportation and Moving occupations in West Loch Estate are Production (203 | 6.4%), Transportation (83 | 2.6%), and Material Moving (78 | 2.5%).
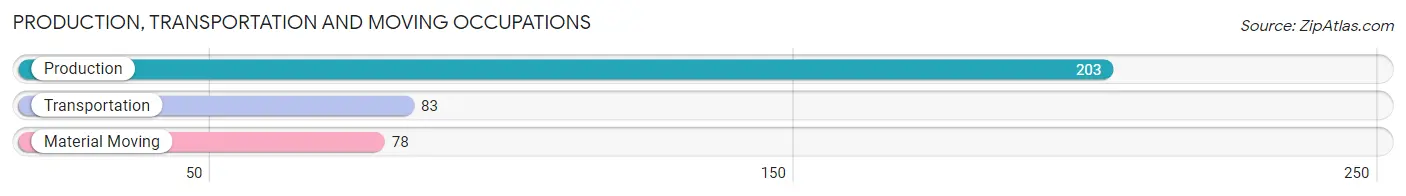
Production, Transportation and Moving Occupations by Sex
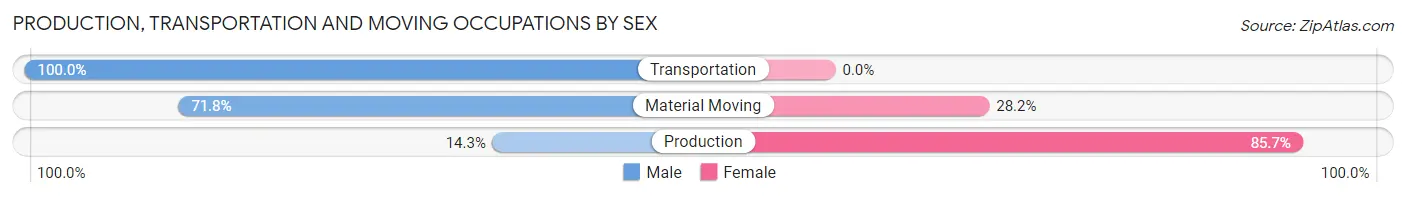
| Occupation | Male | Female |
| Production | 29 (14.3%) | 174 (85.7%) |
| Transportation | 83 (100.0%) | 0 (0.0%) |
| Material Moving | 56 (71.8%) | 22 (28.2%) |
| Total (Category) | 168 (46.2%) | 196 (53.8%) |
| Total (Overall) | 1,575 (49.9%) | 1,582 (50.1%) |
Employment Industries by Sex in West Loch Estate
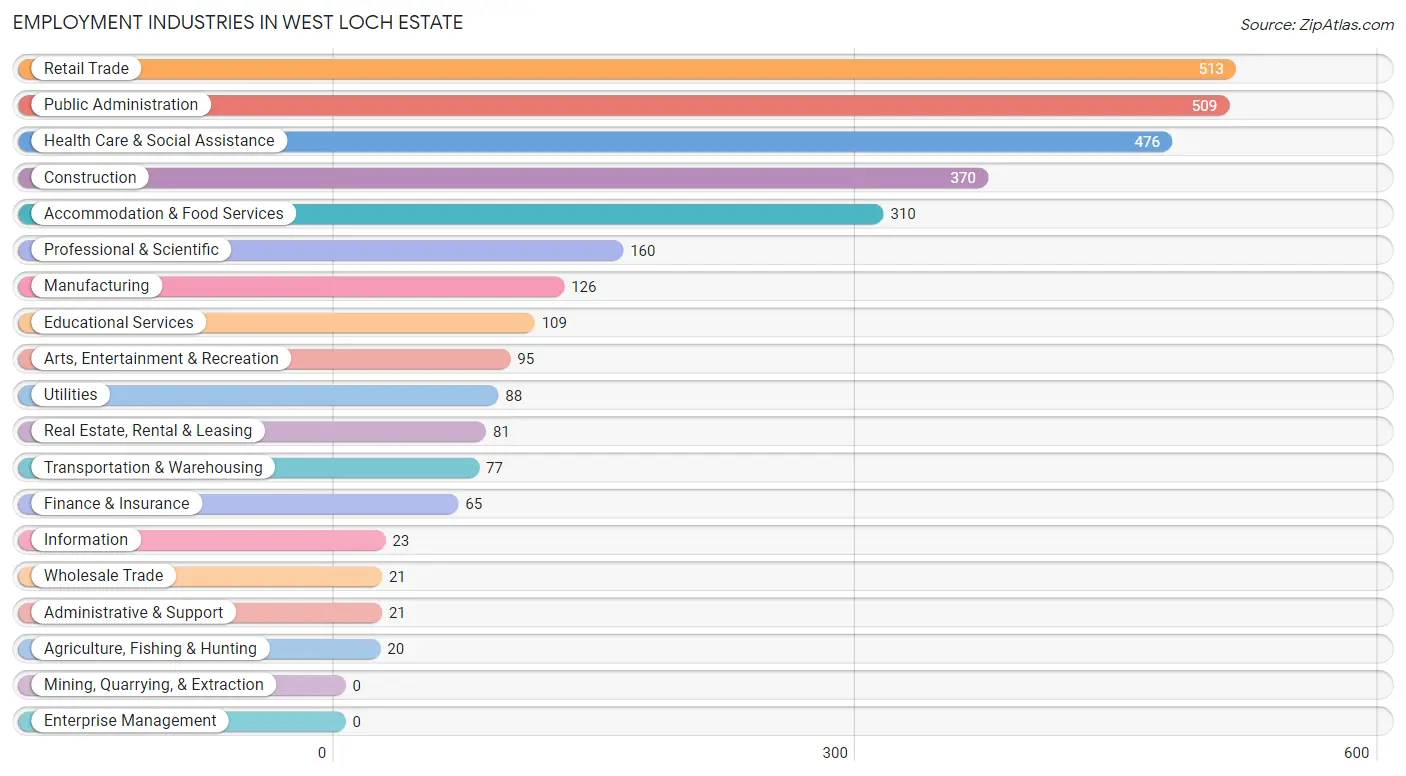
Employment Industries in West Loch Estate
The major employment industries in West Loch Estate include Retail Trade (513 | 16.3%), Public Administration (509 | 16.1%), Health Care & Social Assistance (476 | 15.1%), Construction (370 | 11.7%), and Accommodation & Food Services (310 | 9.8%).
Employment Industries by Sex in West Loch Estate
The West Loch Estate industries that see more men than women are Agriculture, Fishing & Hunting (100.0%), Transportation & Warehousing (100.0%), and Utilities (100.0%), whereas the industries that tend to have a higher number of women are Information (100.0%), Administrative & Support (100.0%), and Finance & Insurance (86.2%).
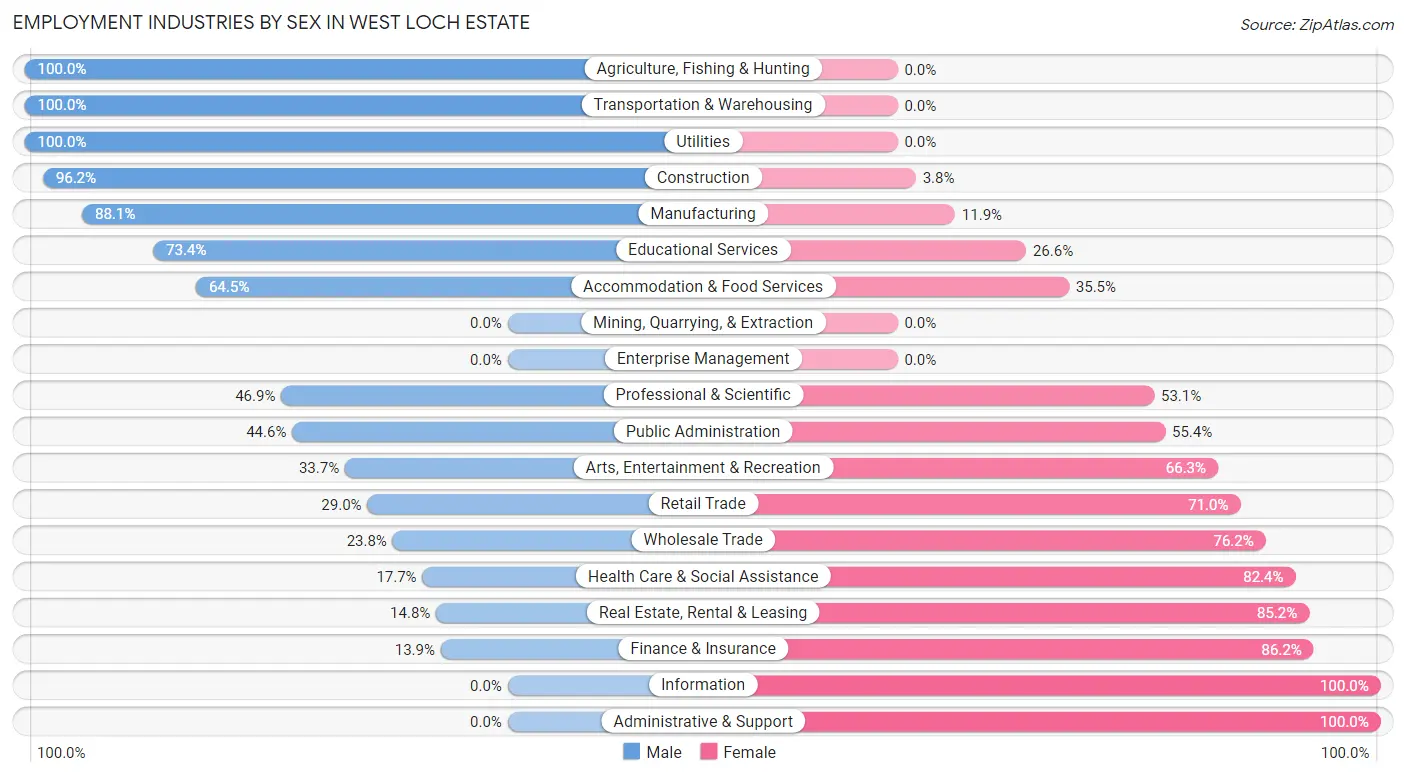
| Industry | Male | Female |
| Agriculture, Fishing & Hunting | 20 (100.0%) | 0 (0.0%) |
| Mining, Quarrying, & Extraction | 0 (0.0%) | 0 (0.0%) |
| Construction | 356 (96.2%) | 14 (3.8%) |
| Manufacturing | 111 (88.1%) | 15 (11.9%) |
| Wholesale Trade | 5 (23.8%) | 16 (76.2%) |
| Retail Trade | 149 (29.0%) | 364 (71.0%) |
| Transportation & Warehousing | 77 (100.0%) | 0 (0.0%) |
| Utilities | 88 (100.0%) | 0 (0.0%) |
| Information | 0 (0.0%) | 23 (100.0%) |
| Finance & Insurance | 9 (13.9%) | 56 (86.2%) |
| Real Estate, Rental & Leasing | 12 (14.8%) | 69 (85.2%) |
| Professional & Scientific | 75 (46.9%) | 85 (53.1%) |
| Enterprise Management | 0 (0.0%) | 0 (0.0%) |
| Administrative & Support | 0 (0.0%) | 21 (100.0%) |
| Educational Services | 80 (73.4%) | 29 (26.6%) |
| Health Care & Social Assistance | 84 (17.6%) | 392 (82.4%) |
| Arts, Entertainment & Recreation | 32 (33.7%) | 63 (66.3%) |
| Accommodation & Food Services | 200 (64.5%) | 110 (35.5%) |
| Public Administration | 227 (44.6%) | 282 (55.4%) |
| Total | 1,575 (49.9%) | 1,582 (50.1%) |
Education in West Loch Estate
School Enrollment in West Loch Estate
The most common levels of schooling among the 1,785 students in West Loch Estate are college / undergraduate (443 | 24.8%), elementary school (388 | 21.7%), and high school (317 | 17.8%).
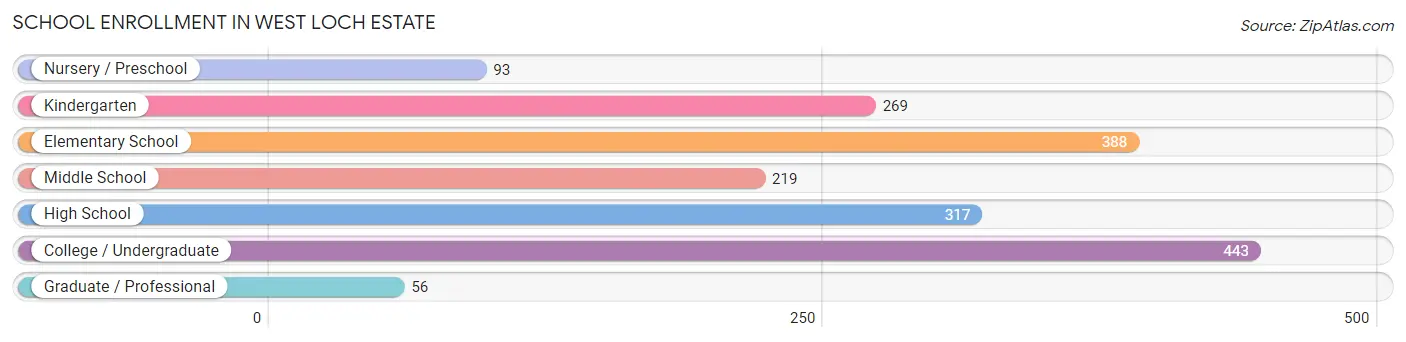
| School Level | # Students | % Students |
| Nursery / Preschool | 93 | 5.2% |
| Kindergarten | 269 | 15.1% |
| Elementary School | 388 | 21.7% |
| Middle School | 219 | 12.3% |
| High School | 317 | 17.8% |
| College / Undergraduate | 443 | 24.8% |
| Graduate / Professional | 56 | 3.1% |
| Total | 1,785 | 100.0% |
School Enrollment by Age by Funding Source in West Loch Estate
Out of a total of 1,785 students who are enrolled in schools in West Loch Estate, 391 (21.9%) attend a private institution, while the remaining 1,394 (78.1%) are enrolled in public schools. The age group of 18 to 19 year olds has the highest likelihood of being enrolled in private schools, with 65 (60.2% in the age bracket) enrolled. Conversely, the age group of 10 to 14 year olds has the lowest likelihood of being enrolled in a private school, with 312 (98.4% in the age bracket) attending a public institution.
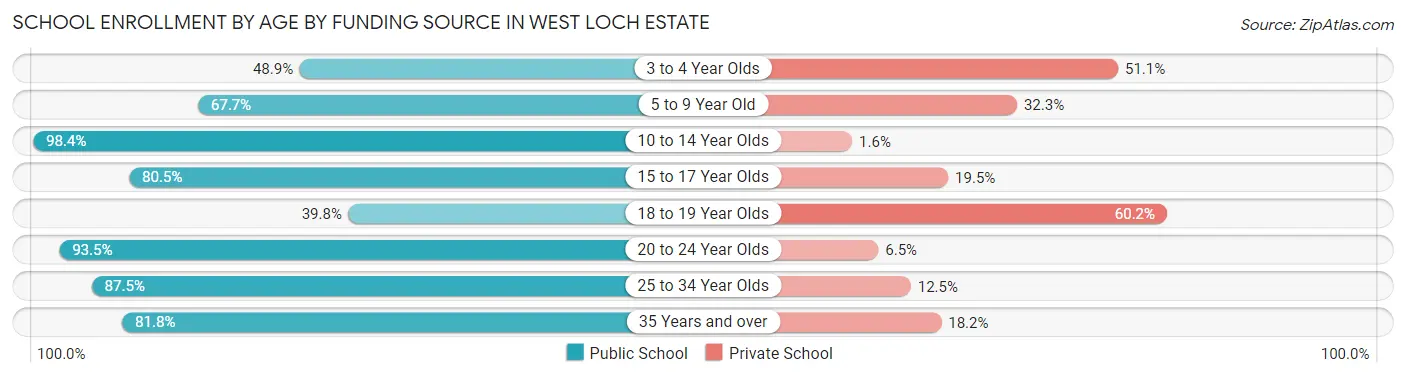
| Age Bracket | Public School | Private School |
| 3 to 4 Year Olds | 22 (48.9%) | 23 (51.1%) |
| 5 to 9 Year Old | 470 (67.7%) | 224 (32.3%) |
| 10 to 14 Year Olds | 312 (98.4%) | 5 (1.6%) |
| 15 to 17 Year Olds | 120 (80.5%) | 29 (19.5%) |
| 18 to 19 Year Olds | 43 (39.8%) | 65 (60.2%) |
| 20 to 24 Year Olds | 246 (93.5%) | 17 (6.5%) |
| 25 to 34 Year Olds | 154 (87.5%) | 22 (12.5%) |
| 35 Years and over | 27 (81.8%) | 6 (18.2%) |
| Total | 1,394 (78.1%) | 391 (21.9%) |
Educational Attainment by Field of Study in West Loch Estate
Arts & humanities (231 | 18.8%), business (194 | 15.8%), science & technology (171 | 13.9%), education (157 | 12.8%), and social sciences (105 | 8.5%) are the most common fields of study among 1,230 individuals in West Loch Estate who have obtained a bachelor's degree or higher.
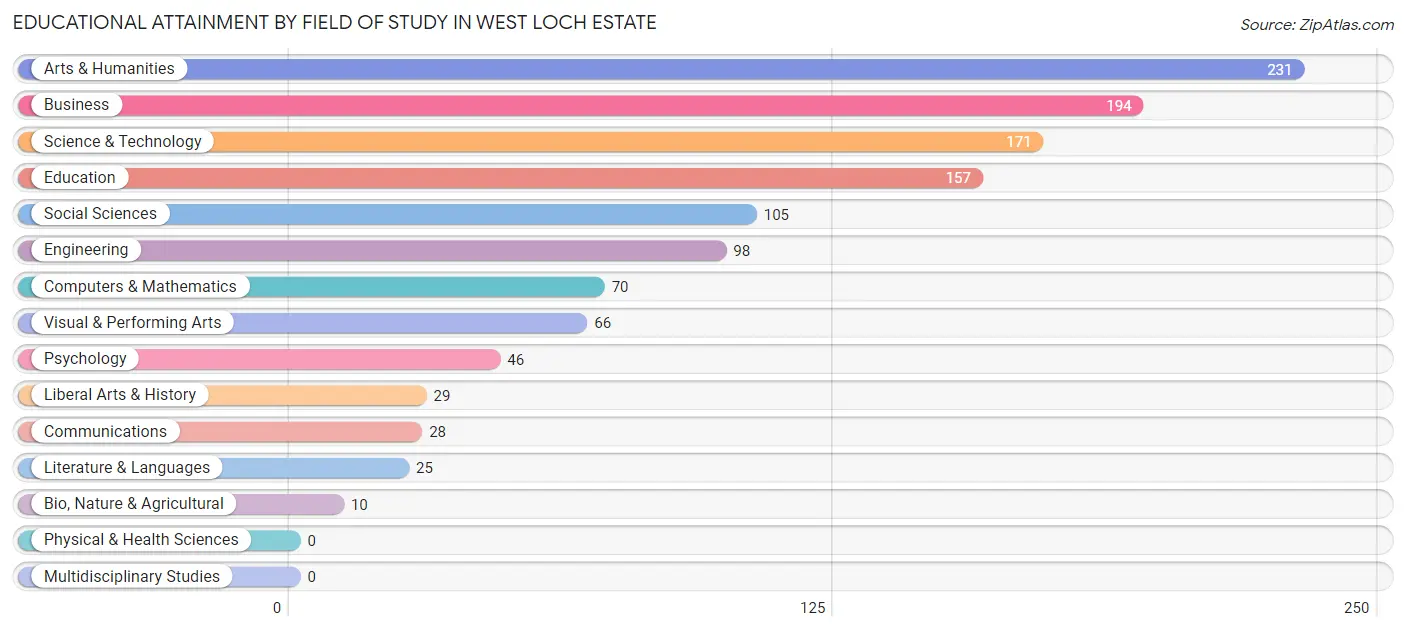
| Field of Study | # Graduates | % Graduates |
| Computers & Mathematics | 70 | 5.7% |
| Bio, Nature & Agricultural | 10 | 0.8% |
| Physical & Health Sciences | 0 | 0.0% |
| Psychology | 46 | 3.7% |
| Social Sciences | 105 | 8.5% |
| Engineering | 98 | 8.0% |
| Multidisciplinary Studies | 0 | 0.0% |
| Science & Technology | 171 | 13.9% |
| Business | 194 | 15.8% |
| Education | 157 | 12.8% |
| Literature & Languages | 25 | 2.0% |
| Liberal Arts & History | 29 | 2.4% |
| Visual & Performing Arts | 66 | 5.4% |
| Communications | 28 | 2.3% |
| Arts & Humanities | 231 | 18.8% |
| Total | 1,230 | 100.0% |
Transportation & Commute in West Loch Estate
Vehicle Availability by Sex in West Loch Estate
The most prevalent vehicle ownership categories in West Loch Estate are males with 3 vehicles (656, accounting for 41.3%) and females with 3 vehicles (487, making up 41.9%).
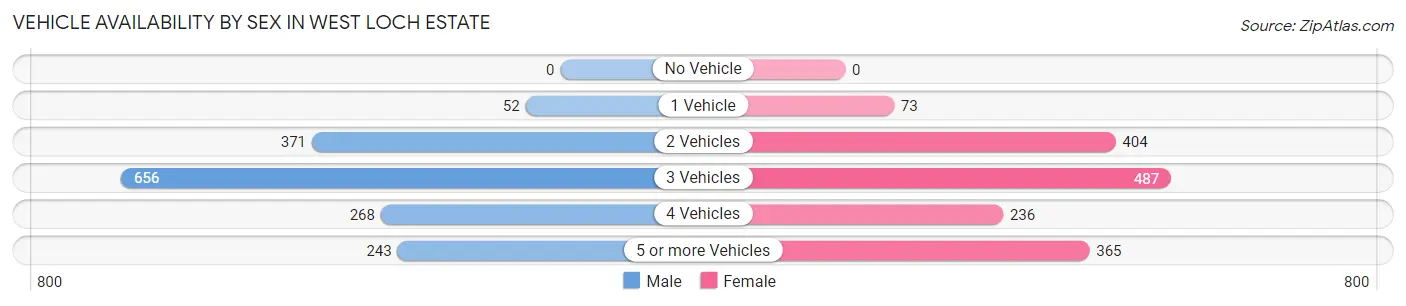
| Vehicles Available | Male | Female |
| No Vehicle | 0 (0.0%) | 0 (0.0%) |
| 1 Vehicle | 52 (3.3%) | 73 (4.7%) |
| 2 Vehicles | 371 (23.3%) | 404 (25.8%) |
| 3 Vehicles | 656 (41.3%) | 487 (31.1%) |
| 4 Vehicles | 268 (16.9%) | 236 (15.1%) |
| 5 or more Vehicles | 243 (15.3%) | 365 (23.3%) |
| Total | 1,590 (100.0%) | 1,565 (100.0%) |
Commute Time in West Loch Estate
The most frequently occuring commute durations in West Loch Estate are 30 to 34 minutes (607 commuters, 19.9%), 20 to 24 minutes (554 commuters, 18.1%), and 45 to 59 minutes (467 commuters, 15.3%).
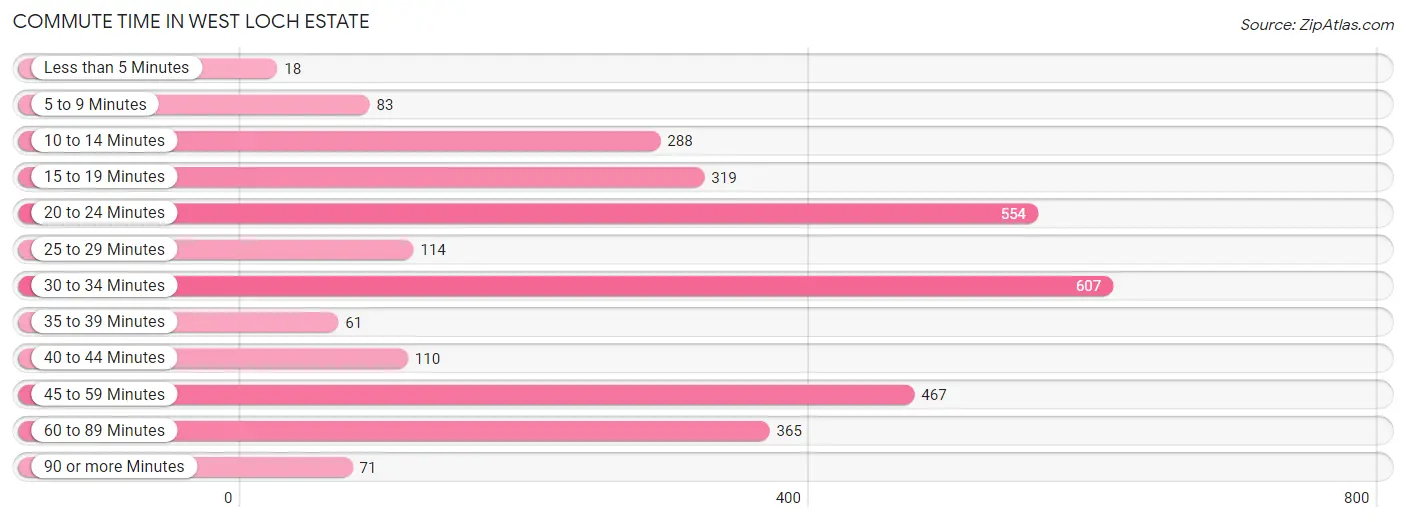
| Commute Time | # Commuters | % Commuters |
| Less than 5 Minutes | 18 | 0.6% |
| 5 to 9 Minutes | 83 | 2.7% |
| 10 to 14 Minutes | 288 | 9.4% |
| 15 to 19 Minutes | 319 | 10.4% |
| 20 to 24 Minutes | 554 | 18.1% |
| 25 to 29 Minutes | 114 | 3.7% |
| 30 to 34 Minutes | 607 | 19.9% |
| 35 to 39 Minutes | 61 | 2.0% |
| 40 to 44 Minutes | 110 | 3.6% |
| 45 to 59 Minutes | 467 | 15.3% |
| 60 to 89 Minutes | 365 | 11.9% |
| 90 or more Minutes | 71 | 2.3% |
Commute Time by Sex in West Loch Estate
The most common commute times in West Loch Estate are 30 to 34 minutes (371 commuters, 23.4%) for males and 20 to 24 minutes (289 commuters, 19.6%) for females.
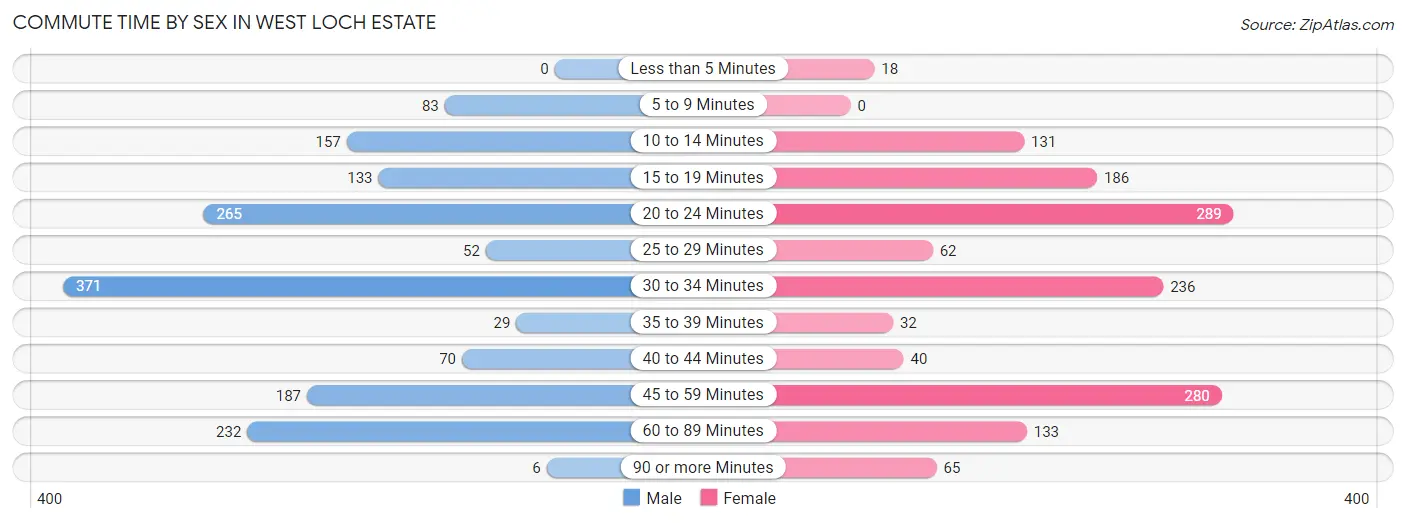
| Commute Time | Male | Female |
| Less than 5 Minutes | 0 (0.0%) | 18 (1.2%) |
| 5 to 9 Minutes | 83 (5.2%) | 0 (0.0%) |
| 10 to 14 Minutes | 157 (9.9%) | 131 (8.9%) |
| 15 to 19 Minutes | 133 (8.4%) | 186 (12.6%) |
| 20 to 24 Minutes | 265 (16.7%) | 289 (19.6%) |
| 25 to 29 Minutes | 52 (3.3%) | 62 (4.2%) |
| 30 to 34 Minutes | 371 (23.4%) | 236 (16.0%) |
| 35 to 39 Minutes | 29 (1.8%) | 32 (2.2%) |
| 40 to 44 Minutes | 70 (4.4%) | 40 (2.7%) |
| 45 to 59 Minutes | 187 (11.8%) | 280 (19.0%) |
| 60 to 89 Minutes | 232 (14.6%) | 133 (9.0%) |
| 90 or more Minutes | 6 (0.4%) | 65 (4.4%) |
Time of Departure to Work by Sex in West Loch Estate
The most frequent times of departure to work in West Loch Estate are 5:00 AM to 5:29 AM (292, 18.4%) for males and 12:00 AM to 4:59 AM (232, 15.8%) for females.
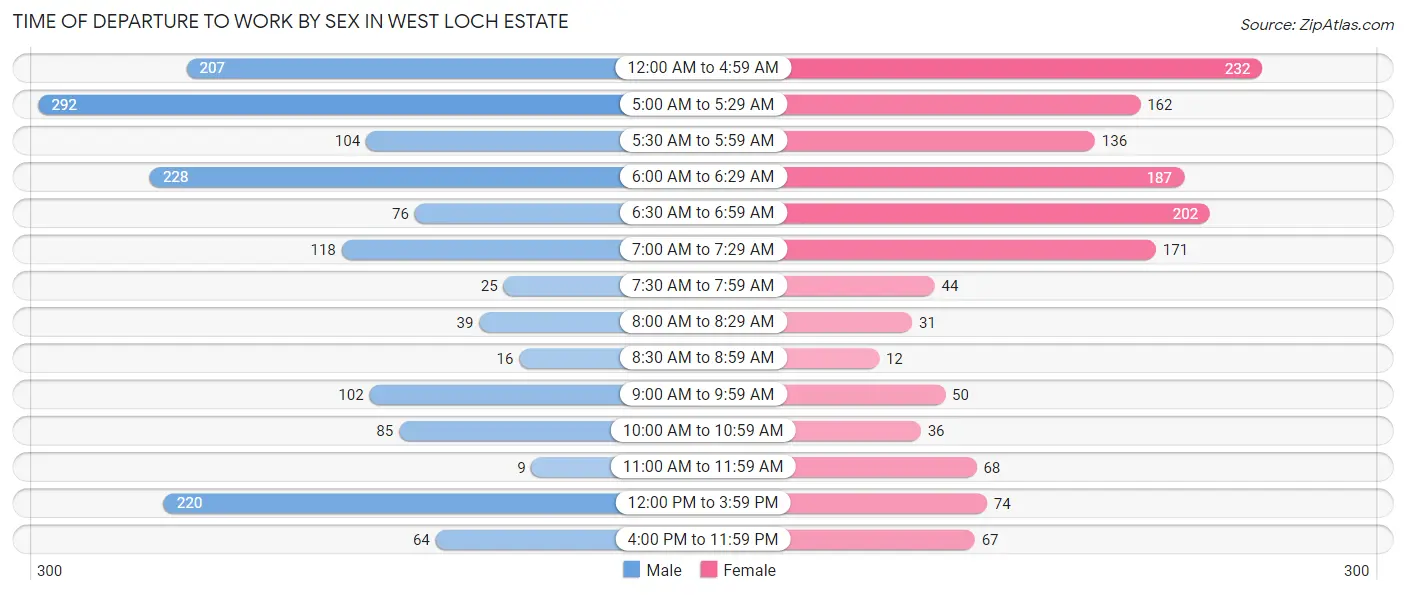
| Time of Departure | Male | Female |
| 12:00 AM to 4:59 AM | 207 (13.1%) | 232 (15.8%) |
| 5:00 AM to 5:29 AM | 292 (18.4%) | 162 (11.0%) |
| 5:30 AM to 5:59 AM | 104 (6.6%) | 136 (9.2%) |
| 6:00 AM to 6:29 AM | 228 (14.4%) | 187 (12.7%) |
| 6:30 AM to 6:59 AM | 76 (4.8%) | 202 (13.7%) |
| 7:00 AM to 7:29 AM | 118 (7.4%) | 171 (11.6%) |
| 7:30 AM to 7:59 AM | 25 (1.6%) | 44 (3.0%) |
| 8:00 AM to 8:29 AM | 39 (2.5%) | 31 (2.1%) |
| 8:30 AM to 8:59 AM | 16 (1.0%) | 12 (0.8%) |
| 9:00 AM to 9:59 AM | 102 (6.4%) | 50 (3.4%) |
| 10:00 AM to 10:59 AM | 85 (5.4%) | 36 (2.5%) |
| 11:00 AM to 11:59 AM | 9 (0.6%) | 68 (4.6%) |
| 12:00 PM to 3:59 PM | 220 (13.9%) | 74 (5.0%) |
| 4:00 PM to 11:59 PM | 64 (4.0%) | 67 (4.5%) |
| Total | 1,585 (100.0%) | 1,472 (100.0%) |
Housing Occupancy in West Loch Estate
Occupancy by Ownership in West Loch Estate
Of the total 1,700 dwellings in West Loch Estate, owner-occupied units account for 1,137 (66.9%), while renter-occupied units make up 563 (33.1%).
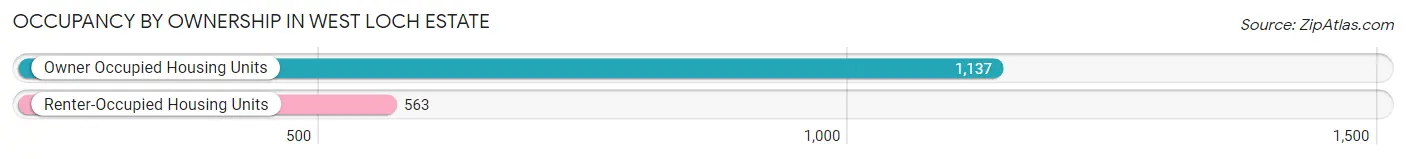
| Occupancy | # Housing Units | % Housing Units |
| Owner Occupied Housing Units | 1,137 | 66.9% |
| Renter-Occupied Housing Units | 563 | 33.1% |
| Total Occupied Housing Units | 1,700 | 100.0% |
Occupancy by Household Size in West Loch Estate
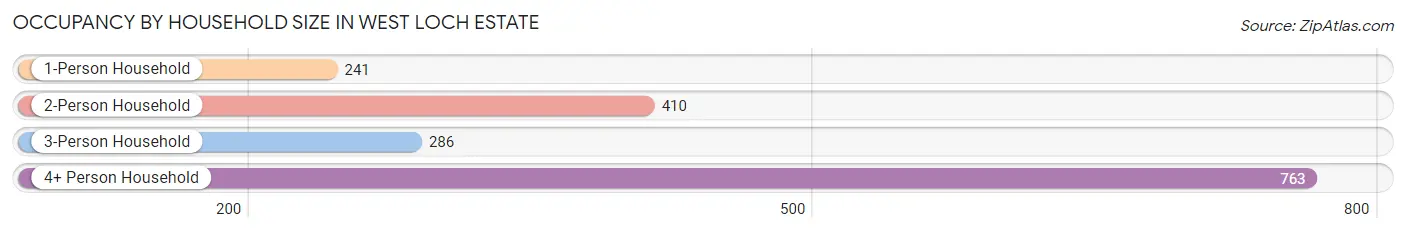
| Household Size | # Housing Units | % Housing Units |
| 1-Person Household | 241 | 14.2% |
| 2-Person Household | 410 | 24.1% |
| 3-Person Household | 286 | 16.8% |
| 4+ Person Household | 763 | 44.9% |
| Total Housing Units | 1,700 | 100.0% |
Occupancy by Ownership by Household Size in West Loch Estate
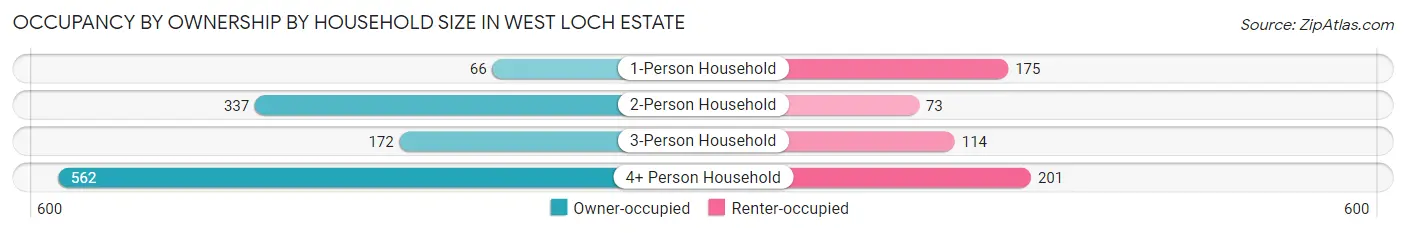
| Household Size | Owner-occupied | Renter-occupied |
| 1-Person Household | 66 (27.4%) | 175 (72.6%) |
| 2-Person Household | 337 (82.2%) | 73 (17.8%) |
| 3-Person Household | 172 (60.1%) | 114 (39.9%) |
| 4+ Person Household | 562 (73.7%) | 201 (26.3%) |
| Total Housing Units | 1,137 (66.9%) | 563 (33.1%) |
Occupancy by Educational Attainment in West Loch Estate
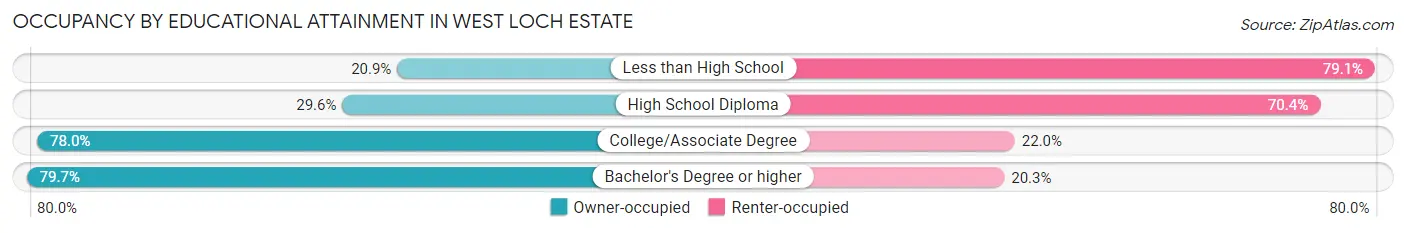
| Household Size | Owner-occupied | Renter-occupied |
| Less than High School | 14 (20.9%) | 53 (79.1%) |
| High School Diploma | 98 (29.6%) | 233 (70.4%) |
| College/Associate Degree | 578 (78.0%) | 163 (22.0%) |
| Bachelor's Degree or higher | 447 (79.7%) | 114 (20.3%) |
Occupancy by Age of Householder in West Loch Estate
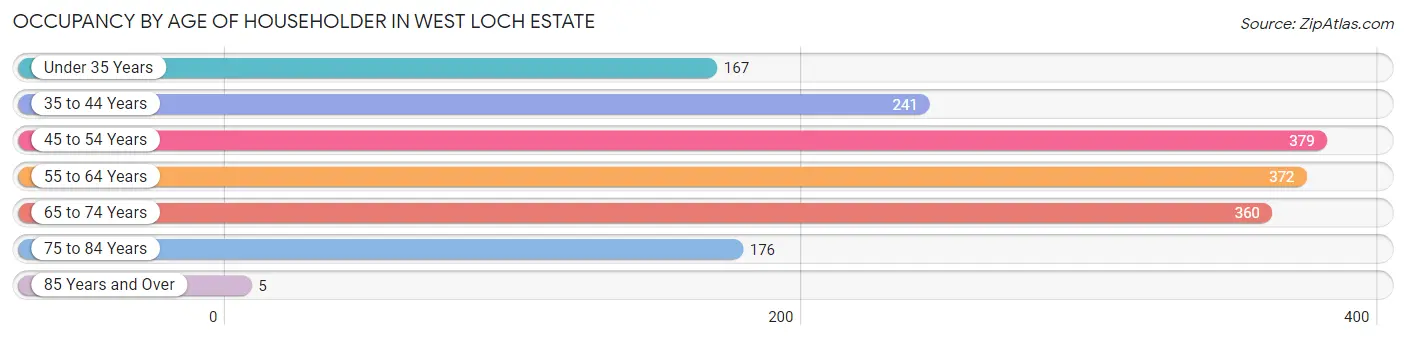
| Age Bracket | # Households | % Households |
| Under 35 Years | 167 | 9.8% |
| 35 to 44 Years | 241 | 14.2% |
| 45 to 54 Years | 379 | 22.3% |
| 55 to 64 Years | 372 | 21.9% |
| 65 to 74 Years | 360 | 21.2% |
| 75 to 84 Years | 176 | 10.3% |
| 85 Years and Over | 5 | 0.3% |
| Total | 1,700 | 100.0% |
Housing Finances in West Loch Estate
Median Income by Occupancy in West Loch Estate
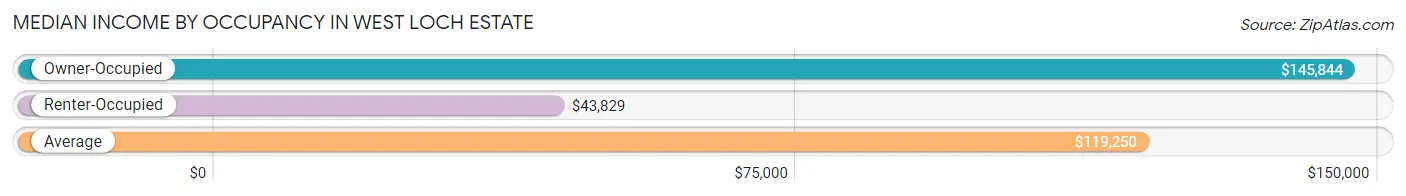
| Occupancy Type | # Households | Median Income |
| Owner-Occupied | 1,137 (66.9%) | $145,844 |
| Renter-Occupied | 563 (33.1%) | $43,829 |
| Average | 1,700 (100.0%) | $119,250 |
Occupancy by Householder Income Bracket in West Loch Estate
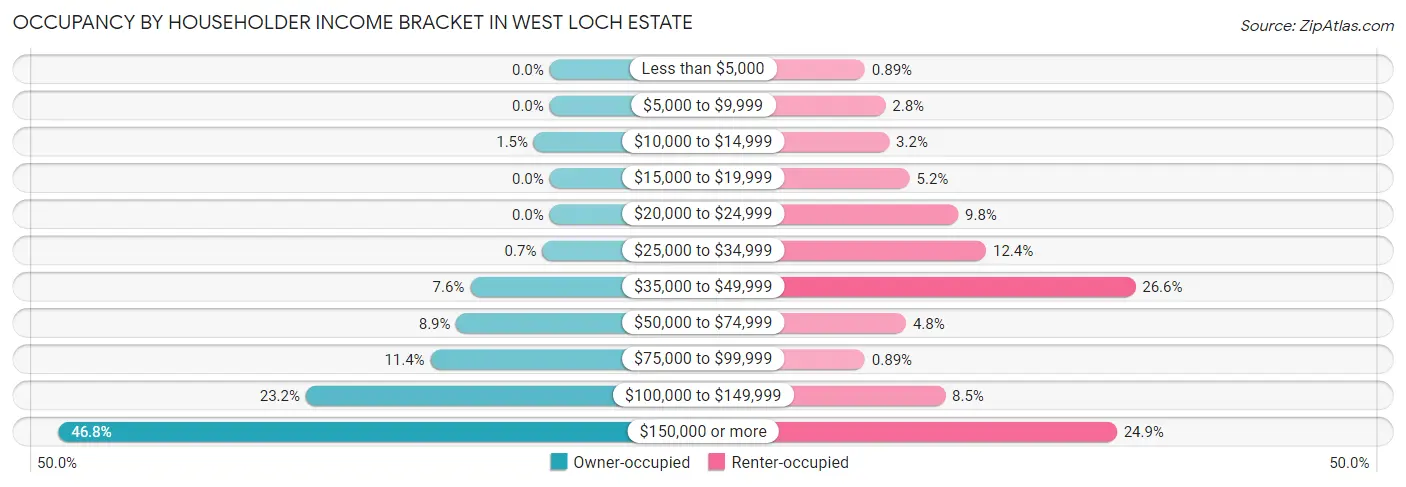
| Income Bracket | Owner-occupied | Renter-occupied |
| Less than $5,000 | 0 (0.0%) | 5 (0.9%) |
| $5,000 to $9,999 | 0 (0.0%) | 16 (2.8%) |
| $10,000 to $14,999 | 17 (1.5%) | 18 (3.2%) |
| $15,000 to $19,999 | 0 (0.0%) | 29 (5.1%) |
| $20,000 to $24,999 | 0 (0.0%) | 55 (9.8%) |
| $25,000 to $34,999 | 8 (0.7%) | 70 (12.4%) |
| $35,000 to $49,999 | 86 (7.6%) | 150 (26.6%) |
| $50,000 to $74,999 | 101 (8.9%) | 27 (4.8%) |
| $75,000 to $99,999 | 129 (11.4%) | 5 (0.9%) |
| $100,000 to $149,999 | 264 (23.2%) | 48 (8.5%) |
| $150,000 or more | 532 (46.8%) | 140 (24.9%) |
| Total | 1,137 (100.0%) | 563 (100.0%) |
Monthly Housing Cost Tiers in West Loch Estate
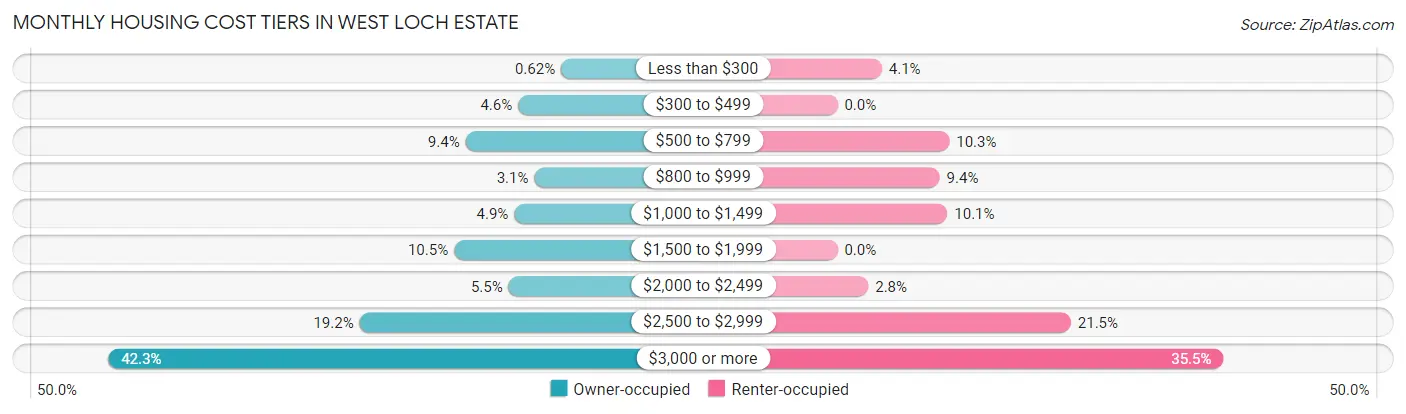
| Monthly Cost | Owner-occupied | Renter-occupied |
| Less than $300 | 7 (0.6%) | 23 (4.1%) |
| $300 to $499 | 52 (4.6%) | 0 (0.0%) |
| $500 to $799 | 107 (9.4%) | 58 (10.3%) |
| $800 to $999 | 35 (3.1%) | 53 (9.4%) |
| $1,000 to $1,499 | 56 (4.9%) | 57 (10.1%) |
| $1,500 to $1,999 | 119 (10.5%) | 0 (0.0%) |
| $2,000 to $2,499 | 62 (5.4%) | 16 (2.8%) |
| $2,500 to $2,999 | 218 (19.2%) | 121 (21.5%) |
| $3,000 or more | 481 (42.3%) | 200 (35.5%) |
| Total | 1,137 (100.0%) | 563 (100.0%) |
Physical Housing Characteristics in West Loch Estate
Housing Structures in West Loch Estate
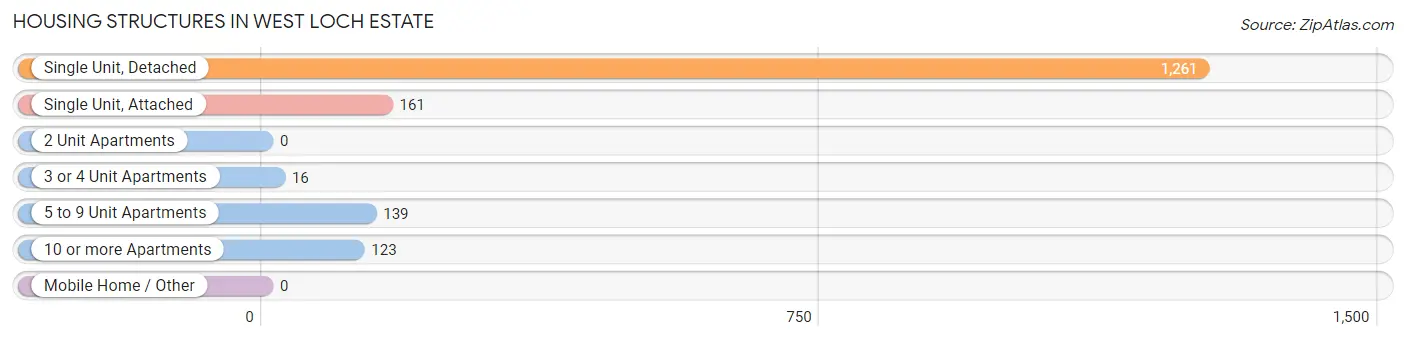
| Structure Type | # Housing Units | % Housing Units |
| Single Unit, Detached | 1,261 | 74.2% |
| Single Unit, Attached | 161 | 9.5% |
| 2 Unit Apartments | 0 | 0.0% |
| 3 or 4 Unit Apartments | 16 | 0.9% |
| 5 to 9 Unit Apartments | 139 | 8.2% |
| 10 or more Apartments | 123 | 7.2% |
| Mobile Home / Other | 0 | 0.0% |
| Total | 1,700 | 100.0% |
Housing Structures by Occupancy in West Loch Estate
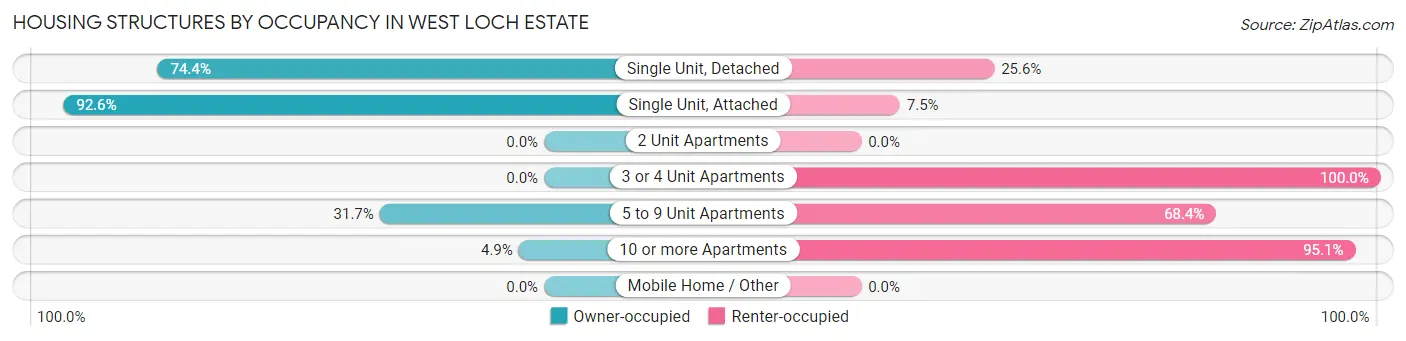
| Structure Type | Owner-occupied | Renter-occupied |
| Single Unit, Detached | 938 (74.4%) | 323 (25.6%) |
| Single Unit, Attached | 149 (92.5%) | 12 (7.4%) |
| 2 Unit Apartments | 0 (0.0%) | 0 (0.0%) |
| 3 or 4 Unit Apartments | 0 (0.0%) | 16 (100.0%) |
| 5 to 9 Unit Apartments | 44 (31.7%) | 95 (68.3%) |
| 10 or more Apartments | 6 (4.9%) | 117 (95.1%) |
| Mobile Home / Other | 0 (0.0%) | 0 (0.0%) |
| Total | 1,137 (66.9%) | 563 (33.1%) |
Housing Structures by Number of Rooms in West Loch Estate
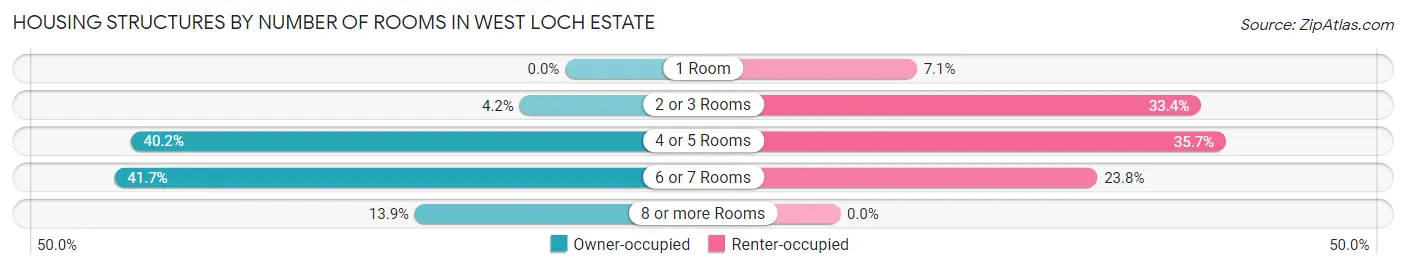
| Number of Rooms | Owner-occupied | Renter-occupied |
| 1 Room | 0 (0.0%) | 40 (7.1%) |
| 2 or 3 Rooms | 48 (4.2%) | 188 (33.4%) |
| 4 or 5 Rooms | 457 (40.2%) | 201 (35.7%) |
| 6 or 7 Rooms | 474 (41.7%) | 134 (23.8%) |
| 8 or more Rooms | 158 (13.9%) | 0 (0.0%) |
| Total | 1,137 (100.0%) | 563 (100.0%) |
Housing Structure by Heating Type in West Loch Estate
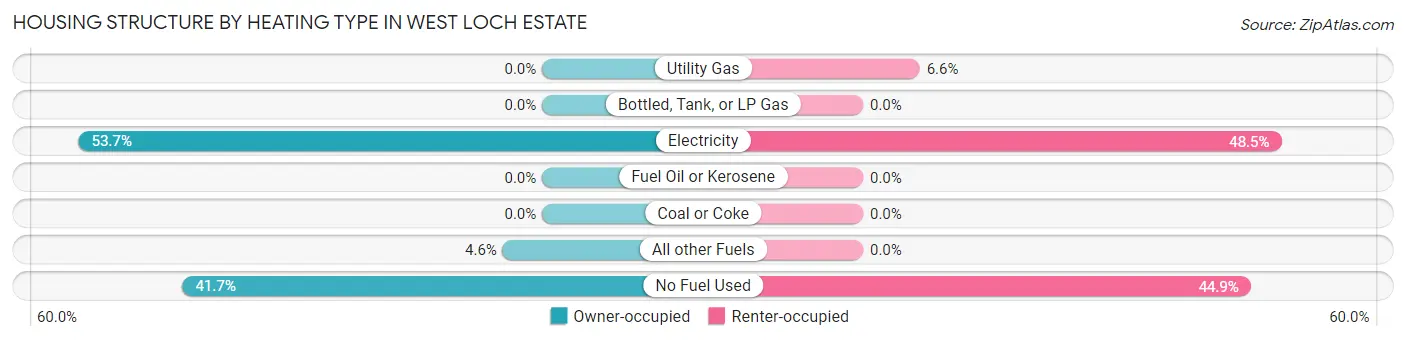
| Heating Type | Owner-occupied | Renter-occupied |
| Utility Gas | 0 (0.0%) | 37 (6.6%) |
| Bottled, Tank, or LP Gas | 0 (0.0%) | 0 (0.0%) |
| Electricity | 611 (53.7%) | 273 (48.5%) |
| Fuel Oil or Kerosene | 0 (0.0%) | 0 (0.0%) |
| Coal or Coke | 0 (0.0%) | 0 (0.0%) |
| All other Fuels | 52 (4.6%) | 0 (0.0%) |
| No Fuel Used | 474 (41.7%) | 253 (44.9%) |
| Total | 1,137 (100.0%) | 563 (100.0%) |
Household Vehicle Usage in West Loch Estate
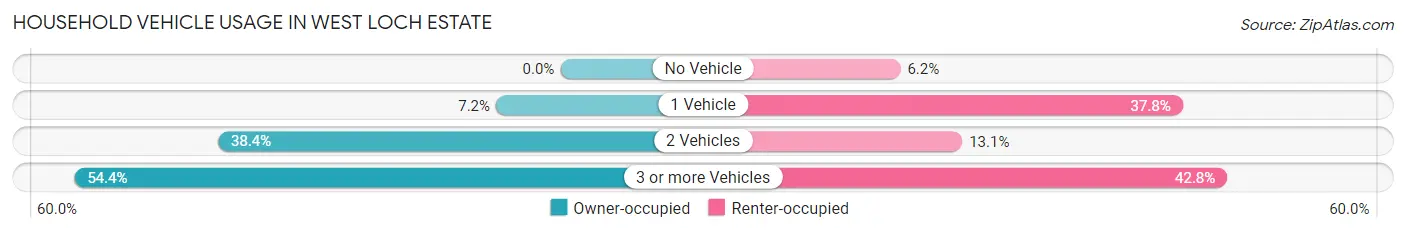
| Vehicles per Household | Owner-occupied | Renter-occupied |
| No Vehicle | 0 (0.0%) | 35 (6.2%) |
| 1 Vehicle | 82 (7.2%) | 213 (37.8%) |
| 2 Vehicles | 436 (38.4%) | 74 (13.1%) |
| 3 or more Vehicles | 619 (54.4%) | 241 (42.8%) |
| Total | 1,137 (100.0%) | 563 (100.0%) |
Real Estate & Mortgages in West Loch Estate
Real Estate and Mortgage Overview in West Loch Estate
| Characteristic | Without Mortgage | With Mortgage |
| Housing Units | 185 | 952 |
| Median Property Value | $873,500 | $796,100 |
| Median Household Income | $164,250 | $436 |
| Monthly Housing Costs | $605 | $481 |
| Real Estate Taxes | $2,435 | $33 |
Property Value by Mortgage Status in West Loch Estate
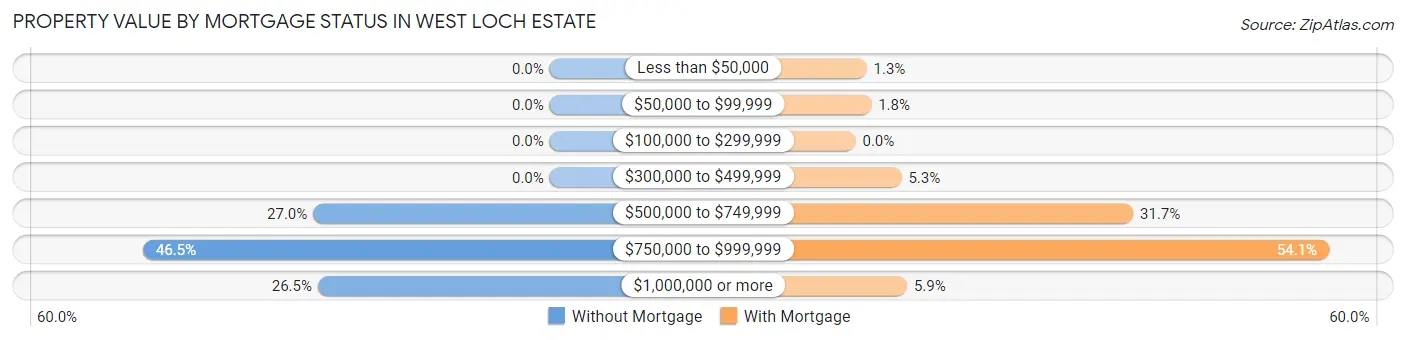
| Property Value | Without Mortgage | With Mortgage |
| Less than $50,000 | 0 (0.0%) | 12 (1.3%) |
| $50,000 to $99,999 | 0 (0.0%) | 17 (1.8%) |
| $100,000 to $299,999 | 0 (0.0%) | 0 (0.0%) |
| $300,000 to $499,999 | 0 (0.0%) | 50 (5.2%) |
| $500,000 to $749,999 | 50 (27.0%) | 302 (31.7%) |
| $750,000 to $999,999 | 86 (46.5%) | 515 (54.1%) |
| $1,000,000 or more | 49 (26.5%) | 56 (5.9%) |
| Total | 185 (100.0%) | 952 (100.0%) |
Household Income by Mortgage Status in West Loch Estate
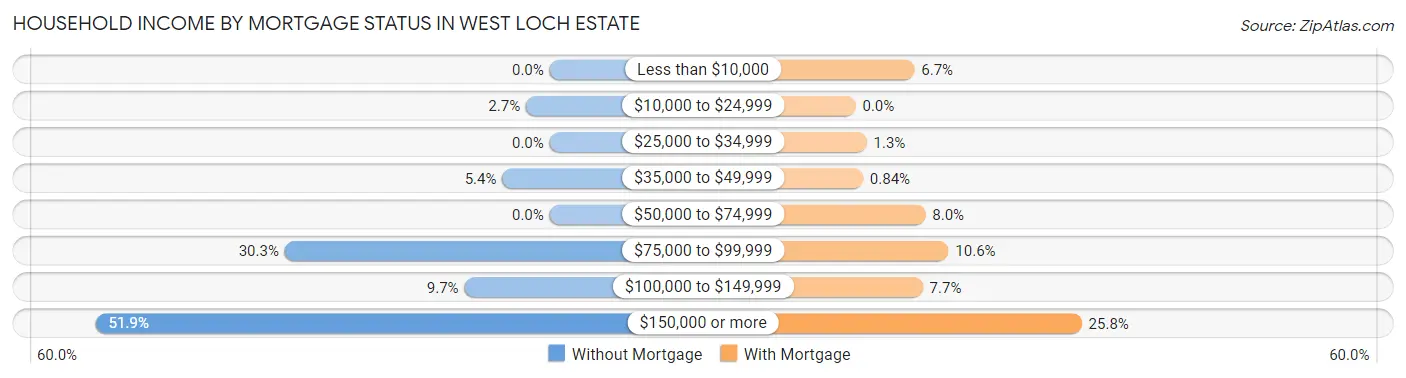
| Household Income | Without Mortgage | With Mortgage |
| Less than $10,000 | 0 (0.0%) | 64 (6.7%) |
| $10,000 to $24,999 | 5 (2.7%) | 0 (0.0%) |
| $25,000 to $34,999 | 0 (0.0%) | 12 (1.3%) |
| $35,000 to $49,999 | 10 (5.4%) | 8 (0.8%) |
| $50,000 to $74,999 | 0 (0.0%) | 76 (8.0%) |
| $75,000 to $99,999 | 56 (30.3%) | 101 (10.6%) |
| $100,000 to $149,999 | 18 (9.7%) | 73 (7.7%) |
| $150,000 or more | 96 (51.9%) | 246 (25.8%) |
| Total | 185 (100.0%) | 952 (100.0%) |
Property Value to Household Income Ratio in West Loch Estate
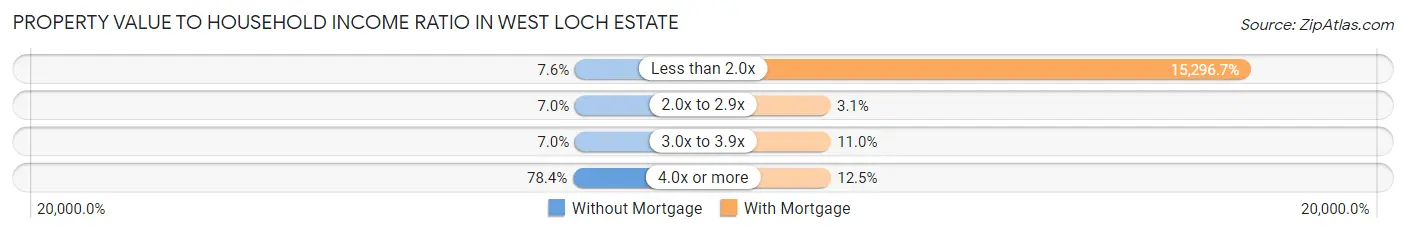
| Value-to-Income Ratio | Without Mortgage | With Mortgage |
| Less than 2.0x | 14 (7.6%) | 145,625 (15,296.7%) |
| 2.0x to 2.9x | 13 (7.0%) | 29 (3.0%) |
| 3.0x to 3.9x | 13 (7.0%) | 105 (11.0%) |
| 4.0x or more | 145 (78.4%) | 119 (12.5%) |
| Total | 185 (100.0%) | 952 (100.0%) |
Real Estate Taxes by Mortgage Status in West Loch Estate
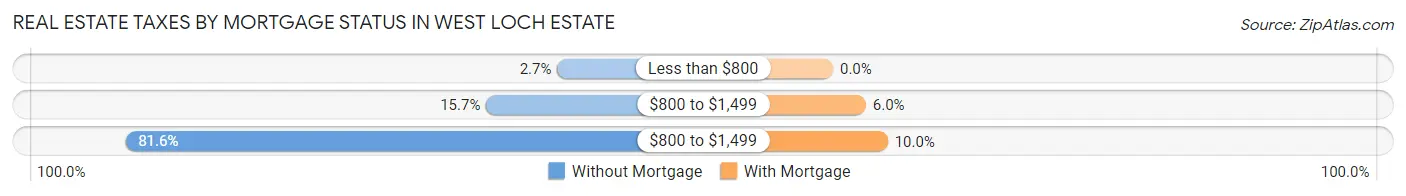
| Property Taxes | Without Mortgage | With Mortgage |
| Less than $800 | 5 (2.7%) | 0 (0.0%) |
| $800 to $1,499 | 29 (15.7%) | 57 (6.0%) |
| $800 to $1,499 | 151 (81.6%) | 95 (10.0%) |
| Total | 185 (100.0%) | 952 (100.0%) |
Health & Disability in West Loch Estate
Health Insurance Coverage by Age in West Loch Estate
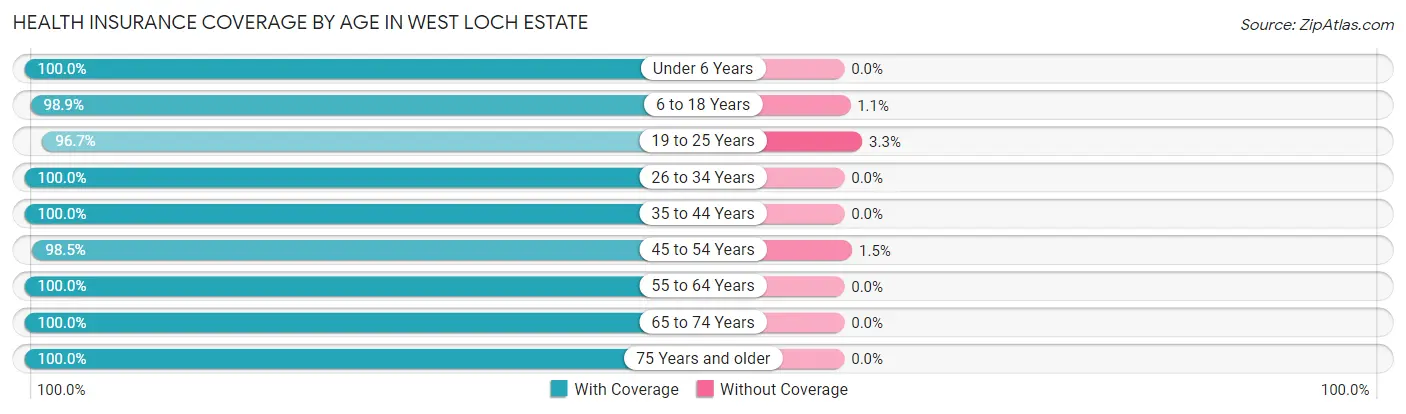
| Age Bracket | With Coverage | Without Coverage |
| Under 6 Years | 713 (100.0%) | 0 (0.0%) |
| 6 to 18 Years | 979 (98.9%) | 11 (1.1%) |
| 19 to 25 Years | 581 (96.7%) | 20 (3.3%) |
| 26 to 34 Years | 885 (100.0%) | 0 (0.0%) |
| 35 to 44 Years | 509 (100.0%) | 0 (0.0%) |
| 45 to 54 Years | 742 (98.5%) | 11 (1.5%) |
| 55 to 64 Years | 783 (100.0%) | 0 (0.0%) |
| 65 to 74 Years | 620 (100.0%) | 0 (0.0%) |
| 75 Years and older | 515 (100.0%) | 0 (0.0%) |
| Total | 6,327 (99.3%) | 42 (0.7%) |
Health Insurance Coverage by Citizenship Status in West Loch Estate
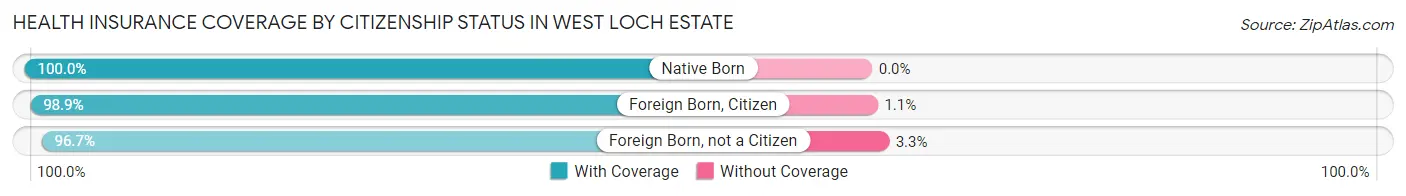
| Citizenship Status | With Coverage | Without Coverage |
| Native Born | 713 (100.0%) | 0 (0.0%) |
| Foreign Born, Citizen | 979 (98.9%) | 11 (1.1%) |
| Foreign Born, not a Citizen | 581 (96.7%) | 20 (3.3%) |
Health Insurance Coverage by Household Income in West Loch Estate
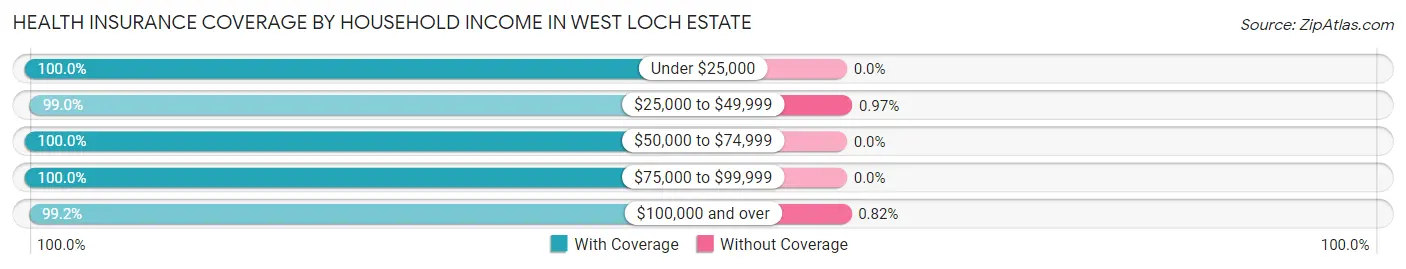
| Household Income | With Coverage | Without Coverage |
| Under $25,000 | 204 (100.0%) | 0 (0.0%) |
| $25,000 to $49,999 | 612 (99.0%) | 6 (1.0%) |
| $50,000 to $74,999 | 604 (100.0%) | 0 (0.0%) |
| $75,000 to $99,999 | 495 (100.0%) | 0 (0.0%) |
| $100,000 and over | 4,374 (99.2%) | 36 (0.8%) |
Public vs Private Health Insurance Coverage by Age in West Loch Estate
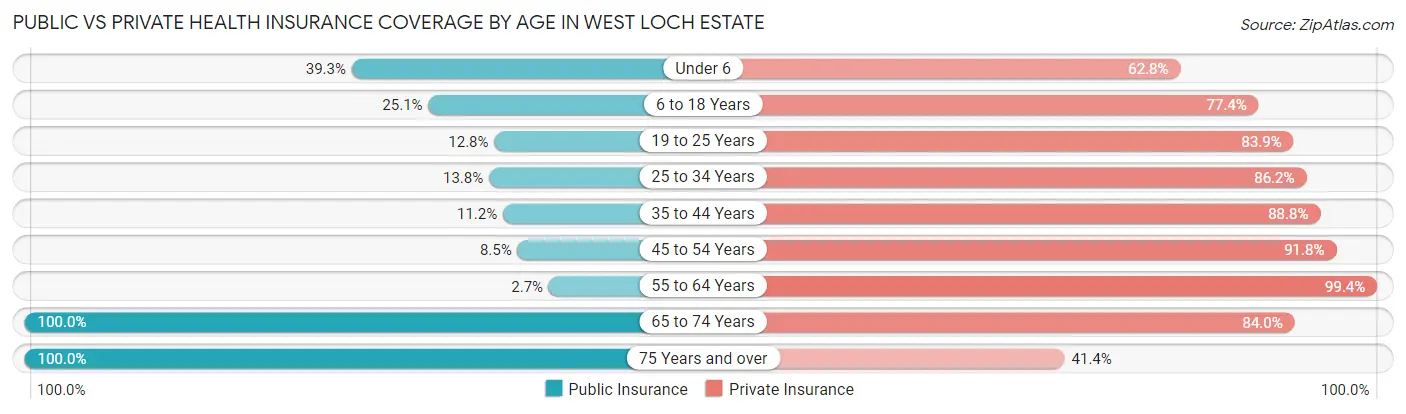
| Age Bracket | Public Insurance | Private Insurance |
| Under 6 | 280 (39.3%) | 448 (62.8%) |
| 6 to 18 Years | 248 (25.1%) | 766 (77.4%) |
| 19 to 25 Years | 77 (12.8%) | 504 (83.9%) |
| 25 to 34 Years | 122 (13.8%) | 763 (86.2%) |
| 35 to 44 Years | 57 (11.2%) | 452 (88.8%) |
| 45 to 54 Years | 64 (8.5%) | 691 (91.8%) |
| 55 to 64 Years | 21 (2.7%) | 778 (99.4%) |
| 65 to 74 Years | 620 (100.0%) | 521 (84.0%) |
| 75 Years and over | 515 (100.0%) | 213 (41.4%) |
| Total | 2,004 (31.5%) | 5,136 (80.6%) |
Disability Status by Sex by Age in West Loch Estate
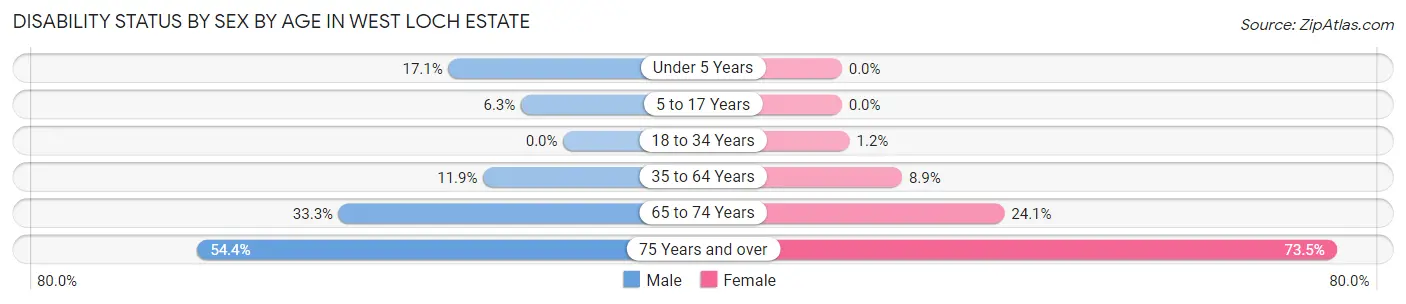
| Age Bracket | Male | Female |
| Under 5 Years | 22 (17.1%) | 0 (0.0%) |
| 5 to 17 Years | 43 (6.3%) | 0 (0.0%) |
| 18 to 34 Years | 0 (0.0%) | 9 (1.2%) |
| 35 to 64 Years | 110 (11.9%) | 100 (8.9%) |
| 65 to 74 Years | 110 (33.3%) | 70 (24.1%) |
| 75 Years and over | 75 (54.3%) | 277 (73.5%) |
Disability Class by Sex by Age in West Loch Estate
Disability Class: Hearing Difficulty
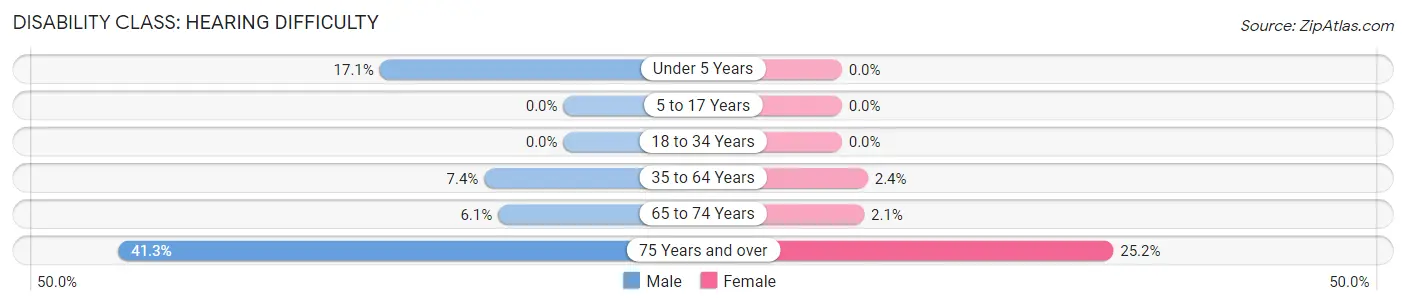
| Age Bracket | Male | Female |
| Under 5 Years | 22 (17.1%) | 0 (0.0%) |
| 5 to 17 Years | 0 (0.0%) | 0 (0.0%) |
| 18 to 34 Years | 0 (0.0%) | 0 (0.0%) |
| 35 to 64 Years | 68 (7.3%) | 27 (2.4%) |
| 65 to 74 Years | 20 (6.1%) | 6 (2.1%) |
| 75 Years and over | 57 (41.3%) | 95 (25.2%) |
Disability Class: Vision Difficulty
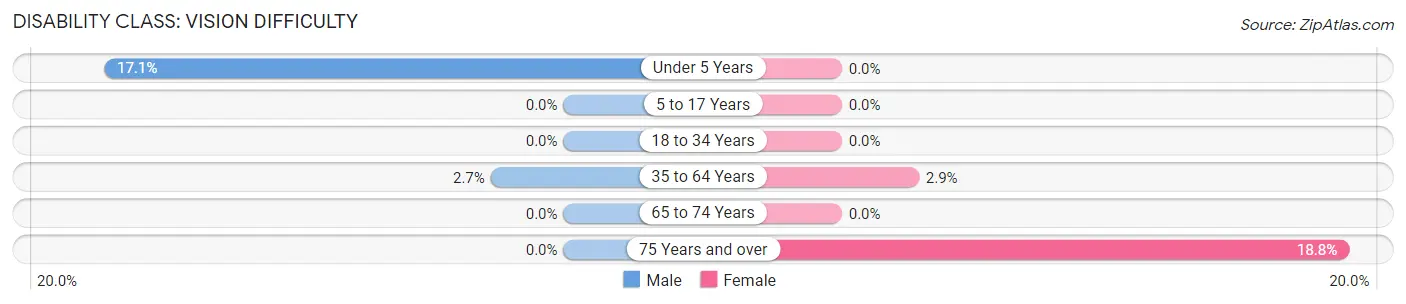
| Age Bracket | Male | Female |
| Under 5 Years | 22 (17.1%) | 0 (0.0%) |
| 5 to 17 Years | 0 (0.0%) | 0 (0.0%) |
| 18 to 34 Years | 0 (0.0%) | 0 (0.0%) |
| 35 to 64 Years | 25 (2.7%) | 32 (2.9%) |
| 65 to 74 Years | 0 (0.0%) | 0 (0.0%) |
| 75 Years and over | 0 (0.0%) | 71 (18.8%) |
Disability Class: Cognitive Difficulty
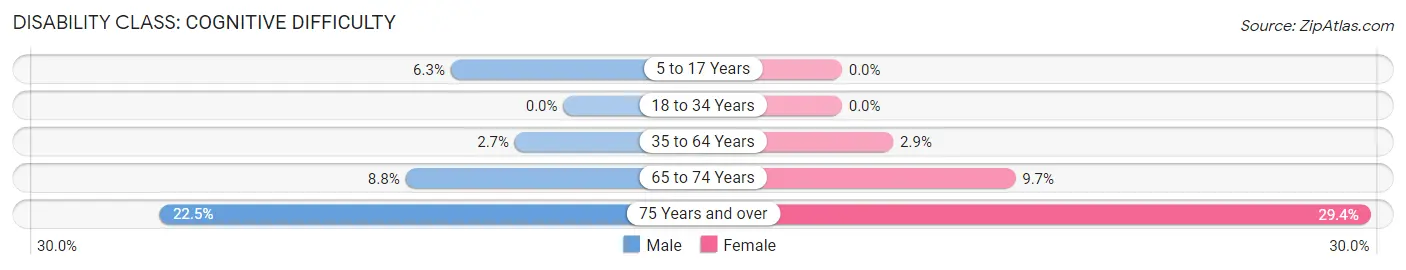
| Age Bracket | Male | Female |
| 5 to 17 Years | 43 (6.3%) | 0 (0.0%) |
| 18 to 34 Years | 0 (0.0%) | 0 (0.0%) |
| 35 to 64 Years | 25 (2.7%) | 32 (2.9%) |
| 65 to 74 Years | 29 (8.8%) | 28 (9.7%) |
| 75 Years and over | 31 (22.5%) | 111 (29.4%) |
Disability Class: Ambulatory Difficulty
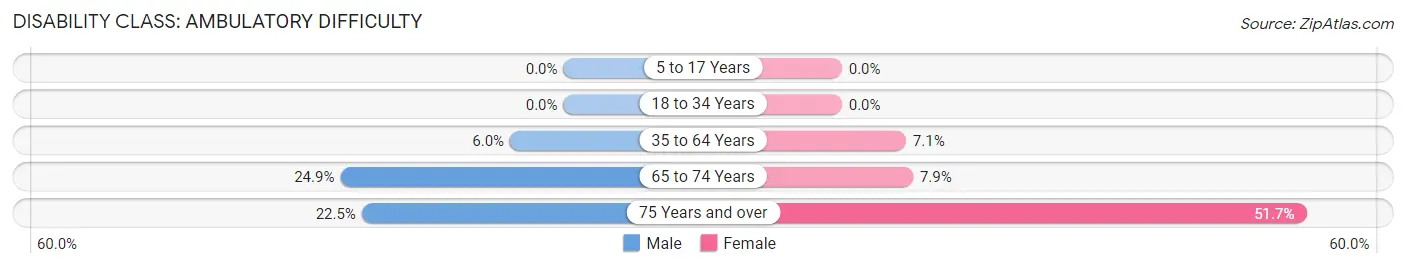
| Age Bracket | Male | Female |
| 5 to 17 Years | 0 (0.0%) | 0 (0.0%) |
| 18 to 34 Years | 0 (0.0%) | 0 (0.0%) |
| 35 to 64 Years | 55 (5.9%) | 80 (7.1%) |
| 65 to 74 Years | 82 (24.8%) | 23 (7.9%) |
| 75 Years and over | 31 (22.5%) | 195 (51.7%) |
Disability Class: Self-Care Difficulty
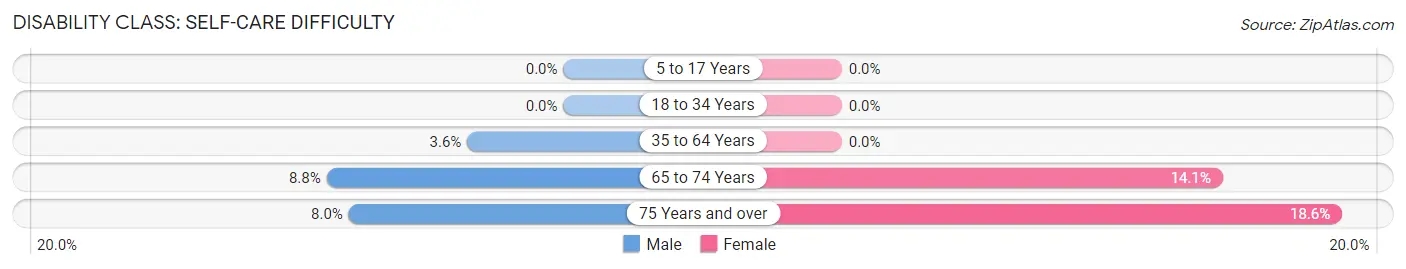
| Age Bracket | Male | Female |
| 5 to 17 Years | 0 (0.0%) | 0 (0.0%) |
| 18 to 34 Years | 0 (0.0%) | 0 (0.0%) |
| 35 to 64 Years | 33 (3.6%) | 0 (0.0%) |
| 65 to 74 Years | 29 (8.8%) | 41 (14.1%) |
| 75 Years and over | 11 (8.0%) | 70 (18.6%) |
Technology Access in West Loch Estate
Computing Device Access in West Loch Estate
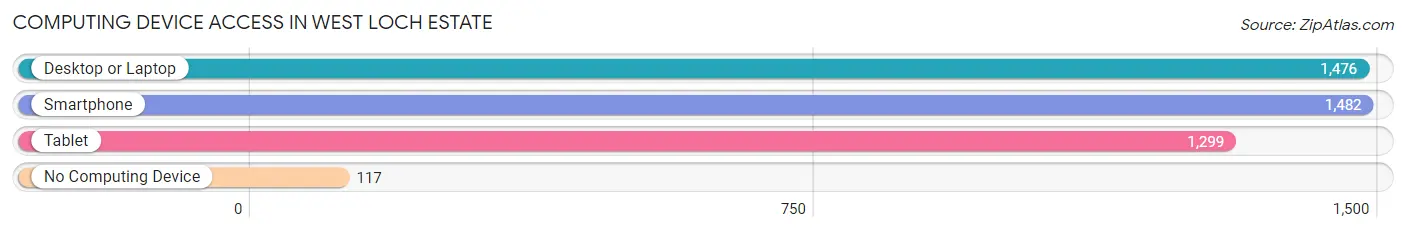
| Device Type | # Households | % Households |
| Desktop or Laptop | 1,476 | 86.8% |
| Smartphone | 1,482 | 87.2% |
| Tablet | 1,299 | 76.4% |
| No Computing Device | 117 | 6.9% |
| Total | 1,700 | 100.0% |
Internet Access in West Loch Estate
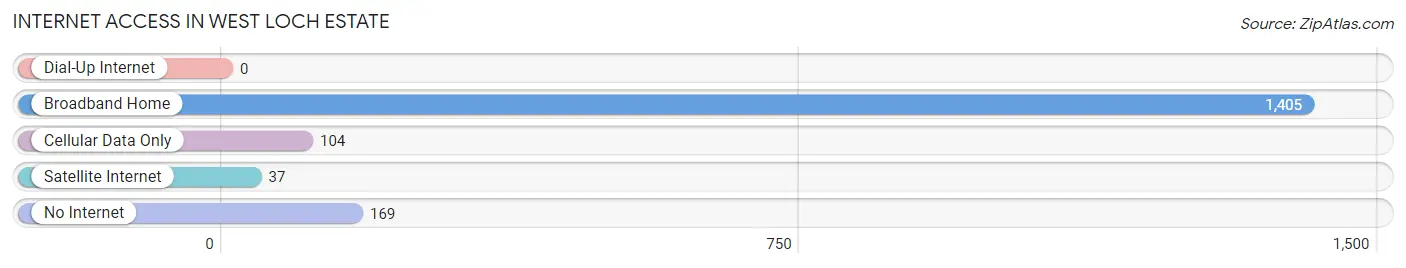
| Internet Type | # Households | % Households |
| Dial-Up Internet | 0 | 0.0% |
| Broadband Home | 1,405 | 82.7% |
| Cellular Data Only | 104 | 6.1% |
| Satellite Internet | 37 | 2.2% |
| No Internet | 169 | 9.9% |
| Total | 1,700 | 100.0% |
West Loch Estate Summary
History
Located on the western side of the island of Oahu, Hawaii, the West Loch Estate is a residential community that has been in existence since the early 1900s. The area was originally part of the Ewa Plantation, which was established in the late 1800s. The plantation was owned by the Castle & Cooke Company, which was a major sugar producer in the Hawaiian Islands. The plantation was divided into several smaller parcels of land, and the West Loch Estate was one of these parcels.
The West Loch Estate was developed in the early 1900s by the West Loch Company, which was owned by the Castle & Cooke Company. The company developed the area into a residential community, and it quickly became a popular place to live. The area was known for its beautiful views of the ocean and its lush tropical vegetation.
The West Loch Estate was home to many prominent families in the early 1900s, including the Dole family, who owned the Dole Pineapple Company. The Dole family built a large estate in the area, which is now known as the Dole Mansion. The area was also home to many other prominent families, including the Kamehameha family, who were the rulers of the Hawaiian Kingdom.
The West Loch Estate was also home to many military personnel during World War II. The area was used as a staging area for the U.S. Navy, and many of the homes in the area were used as barracks for the troops. After the war, the area was returned to its residential status, and it has remained a popular place to live ever since.
Geography
The West Loch Estate is located on the western side of the island of Oahu, Hawaii. The area is bordered by the Ewa Beach to the north, the Pearl Harbor to the east, and the Waianae Mountains to the south. The area is approximately 4.5 square miles in size, and it is located at an elevation of approximately 500 feet above sea level.
The area is known for its beautiful views of the ocean and its lush tropical vegetation. The area is also home to several parks, including the West Loch Park, which is a popular spot for picnics and outdoor activities. The area is also home to several beaches, including the Ewa Beach, which is a popular spot for swimming and surfing.
Economy
The economy of the West Loch Estate is largely based on tourism and real estate. The area is home to several resorts and hotels, which attract tourists from all over the world. The area is also home to several residential communities, which are popular with both locals and visitors.
The area is also home to several businesses, including restaurants, retail stores, and other services. The area is also home to several industrial parks, which are home to several manufacturing and technology companies.
Demographics
As of the 2010 census, the population of the West Loch Estate was approximately 8,000 people. The area is largely populated by people of Asian descent, with the majority of the population being of Japanese, Filipino, and Chinese descent. The area is also home to a large number of Native Hawaiians, as well as a small number of other ethnicities.
The median household income in the area is approximately $60,000, which is slightly higher than the national average. The area is also home to a large number of college-educated individuals, with approximately 40% of the population having a college degree or higher. The area is also home to a large number of military personnel, as the area is located near several military bases.
Common Questions
What is Per Capita Income in West Loch Estate?
Per Capita income in West Loch Estate is $36,905.
What is the Median Family Income in West Loch Estate?
Median Family Income in West Loch Estate is $146,906.
What is the Median Household income in West Loch Estate?
Median Household Income in West Loch Estate is $119,250.
What is Income or Wage Gap in West Loch Estate?
Income or Wage Gap in West Loch Estate is 33.2%.
Women in West Loch Estate earn 66.8 cents for every dollar earned by a man.
What is Family Income Deficit in West Loch Estate?
Family Income Deficit in West Loch Estate is $4,391.
Families that are below poverty line in West Loch Estate earn $4,391 less on average than the poverty threshold level.
What is Inequality or Gini Index in West Loch Estate?
Inequality or Gini Index in West Loch Estate is 0.39.
What is the Total Population of West Loch Estate?
Total Population of West Loch Estate is 6,469.
What is the Total Male Population of West Loch Estate?
Total Male Population of West Loch Estate is 3,099.
What is the Total Female Population of West Loch Estate?
Total Female Population of West Loch Estate is 3,370.
What is the Ratio of Males per 100 Females in West Loch Estate?
There are 91.96 Males per 100 Females in West Loch Estate.
What is the Ratio of Females per 100 Males in West Loch Estate?
There are 108.74 Females per 100 Males in West Loch Estate.
What is the Median Population Age in West Loch Estate?
Median Population Age in West Loch Estate is 35.3 Years.
What is the Average Family Size in West Loch Estate
Average Family Size in West Loch Estate is 4.3 People.
What is the Average Household Size in West Loch Estate
Average Household Size in West Loch Estate is 3.8 People.
How Large is the Labor Force in West Loch Estate?
There are 3,312 People in the Labor Forcein in West Loch Estate.
What is the Percentage of People in the Labor Force in West Loch Estate?
66.7% of People are in the Labor Force in West Loch Estate.
What is the Unemployment Rate in West Loch Estate?
Unemployment Rate in West Loch Estate is 1.8%.