Piney Green, NC Map & Demographics
Piney Green Map
Piney Green Overview
$27,147
PER CAPITA INCOME
$69,206
AVG FAMILY INCOME
$65,336
AVG HOUSEHOLD INCOME
43.3%
WAGE / INCOME GAP [ % ]
56.7¢/ $1
WAGE / INCOME GAP [ $ ]
$9,926
FAMILY INCOME DEFICIT
0.41
INEQUALITY / GINI INDEX
14,767
TOTAL POPULATION
7,701
MALE POPULATION
7,066
FEMALE POPULATION
108.99
MALES / 100 FEMALES
91.75
FEMALES / 100 MALES
29.5
MEDIAN AGE
3.2
AVG FAMILY SIZE
2.8
AVG HOUSEHOLD SIZE
7,968
LABOR FORCE [ PEOPLE ]
71.3%
PERCENT IN LABOR FORCE
7.2%
UNEMPLOYMENT RATE
Income in Piney Green
Income Overview in Piney Green
Per Capita Income in Piney Green is $27,147, while median incomes of families and households are $69,206 and $65,336 respectively.
| Characteristic | Number | Measure |
| Per Capita Income | 14,767 | $27,147 |
| Median Family Income | 3,879 | $69,206 |
| Mean Family Income | 3,879 | $83,699 |
| Median Household Income | 5,345 | $65,336 |
| Mean Household Income | 5,345 | $77,034 |
| Income Deficit | 3,879 | $9,926 |
| Wage / Income Gap (%) | 14,767 | 43.27% |
| Wage / Income Gap ($) | 14,767 | 56.73¢ per $1 |
| Gini / Inequality Index | 14,767 | 0.41 |
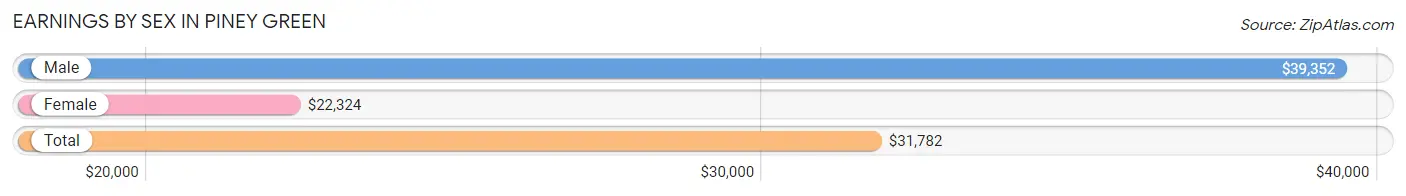
Earnings by Sex in Piney Green
Average Earnings in Piney Green are $31,782, $39,352 for men and $22,324 for women, a difference of 43.3%.
| Sex | Number | Average Earnings |
| Male | 4,608 (58.2%) | $39,352 |
| Female | 3,312 (41.8%) | $22,324 |
| Total | 7,920 (100.0%) | $31,782 |
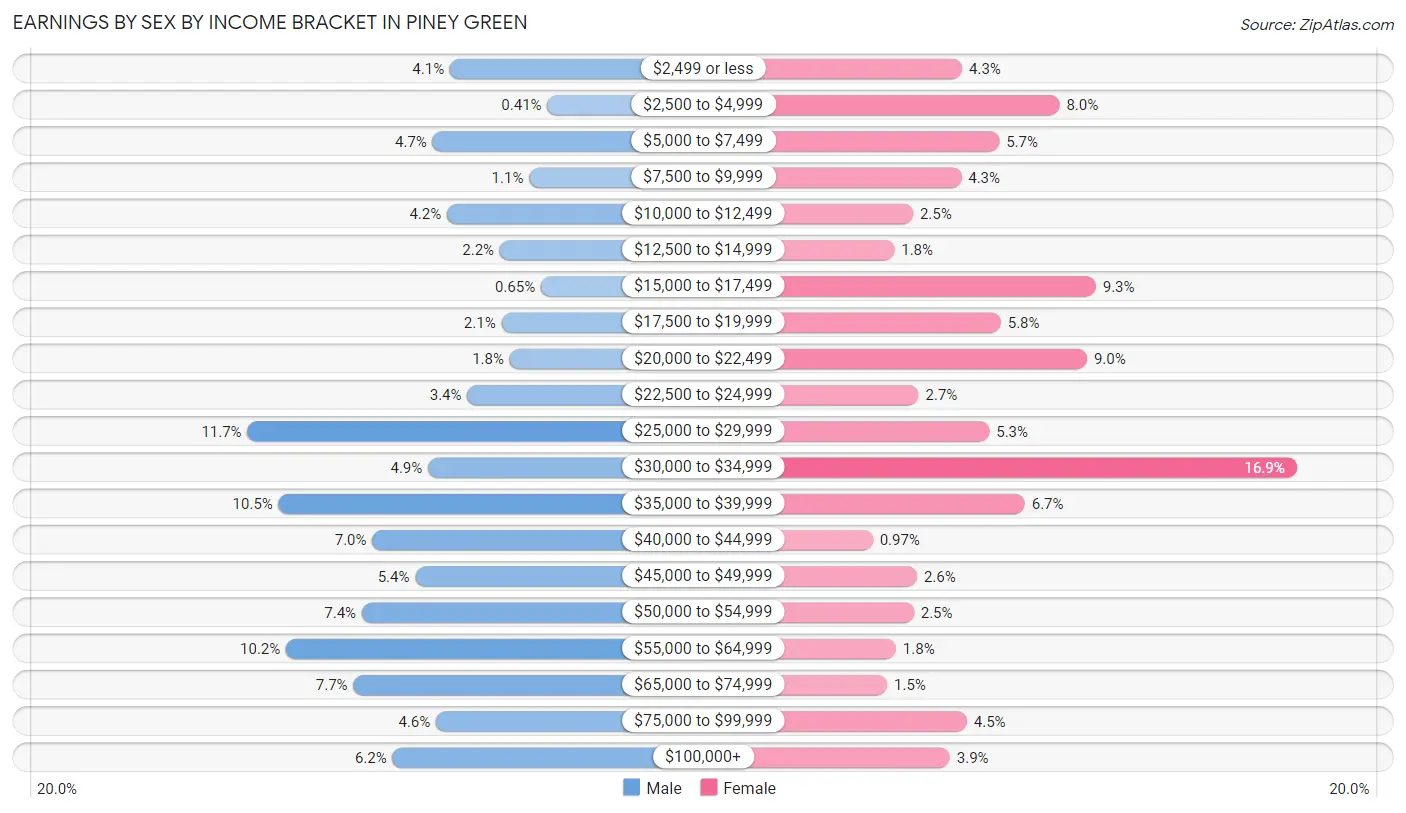
Earnings by Sex by Income Bracket in Piney Green
The most common earnings brackets in Piney Green are $25,000 to $29,999 for men (537 | 11.7%) and $30,000 to $34,999 for women (558 | 16.9%).
| Income | Male | Female |
| $2,499 or less | 187 (4.1%) | 143 (4.3%) |
| $2,500 to $4,999 | 19 (0.4%) | 264 (8.0%) |
| $5,000 to $7,499 | 217 (4.7%) | 189 (5.7%) |
| $7,500 to $9,999 | 50 (1.1%) | 142 (4.3%) |
| $10,000 to $12,499 | 192 (4.2%) | 82 (2.5%) |
| $12,500 to $14,999 | 101 (2.2%) | 59 (1.8%) |
| $15,000 to $17,499 | 30 (0.6%) | 309 (9.3%) |
| $17,500 to $19,999 | 98 (2.1%) | 191 (5.8%) |
| $20,000 to $22,499 | 84 (1.8%) | 298 (9.0%) |
| $22,500 to $24,999 | 157 (3.4%) | 89 (2.7%) |
| $25,000 to $29,999 | 537 (11.7%) | 177 (5.3%) |
| $30,000 to $34,999 | 225 (4.9%) | 558 (16.9%) |
| $35,000 to $39,999 | 483 (10.5%) | 221 (6.7%) |
| $40,000 to $44,999 | 321 (7.0%) | 32 (1.0%) |
| $45,000 to $49,999 | 247 (5.4%) | 87 (2.6%) |
| $50,000 to $54,999 | 339 (7.4%) | 83 (2.5%) |
| $55,000 to $64,999 | 470 (10.2%) | 61 (1.8%) |
| $65,000 to $74,999 | 354 (7.7%) | 50 (1.5%) |
| $75,000 to $99,999 | 211 (4.6%) | 149 (4.5%) |
| $100,000+ | 286 (6.2%) | 128 (3.9%) |
| Total | 4,608 (100.0%) | 3,312 (100.0%) |
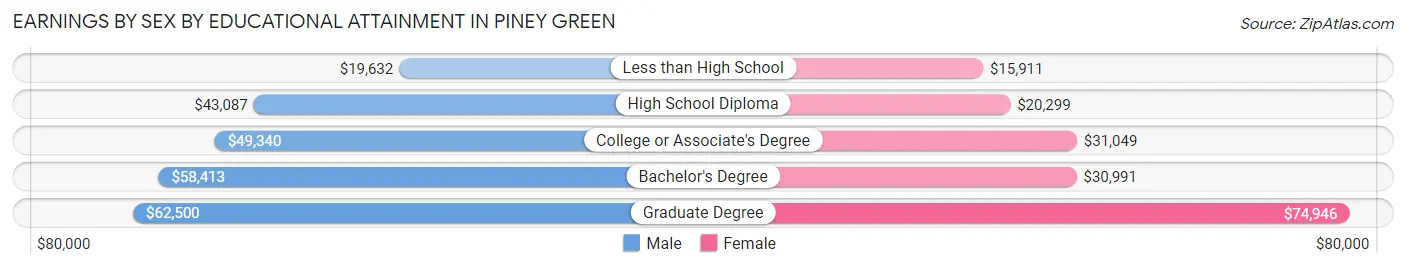
Earnings by Sex by Educational Attainment in Piney Green
Average earnings in Piney Green are $47,828 for men and $29,120 for women, a difference of 39.1%. Men with an educational attainment of graduate degree enjoy the highest average annual earnings of $62,500, while those with less than high school education earn the least with $19,632. Women with an educational attainment of graduate degree earn the most with the average annual earnings of $74,946, while those with less than high school education have the smallest earnings of $15,911.
| Educational Attainment | Male Income | Female Income |
| Less than High School | $19,632 | $15,911 |
| High School Diploma | $43,087 | $20,299 |
| College or Associate's Degree | $49,340 | $31,049 |
| Bachelor's Degree | $58,413 | $30,991 |
| Graduate Degree | $62,500 | $74,946 |
| Total | $47,828 | $29,120 |
Family Income in Piney Green
Family Income Brackets in Piney Green
According to the Piney Green family income data, there are 1,051 families falling into the $50,000 to $74,999 income range, which is the most common income bracket and makes up 27.1% of all families. Conversely, the $10,000 to $14,999 income bracket is the least frequent group with only 12 families (0.3%) belonging to this category.
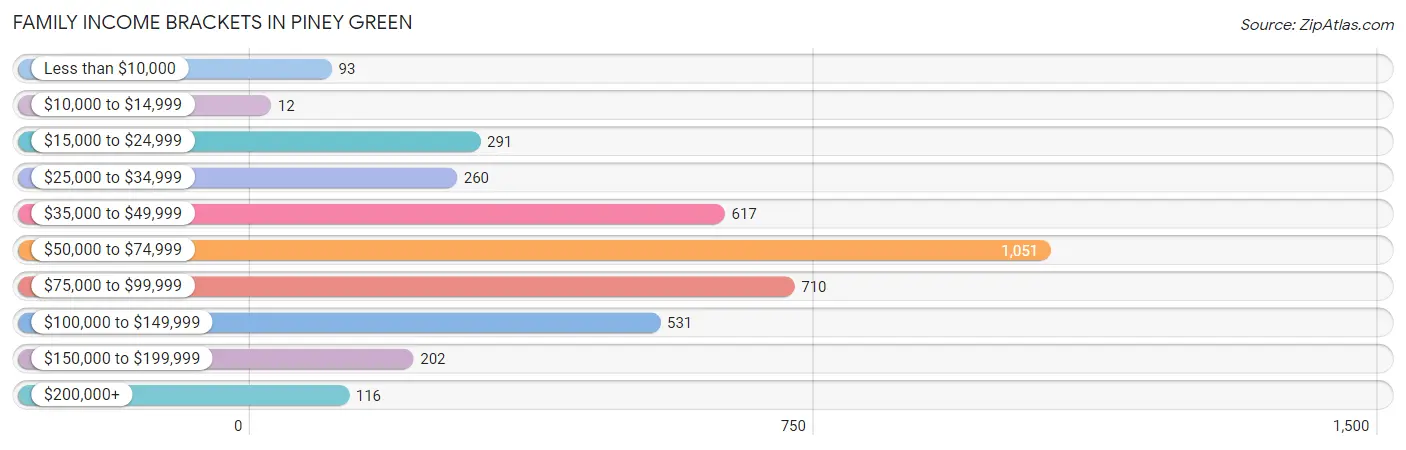
| Income Bracket | # Families | % Families |
| Less than $10,000 | 93 | 2.4% |
| $10,000 to $14,999 | 12 | 0.3% |
| $15,000 to $24,999 | 291 | 7.5% |
| $25,000 to $34,999 | 260 | 6.7% |
| $35,000 to $49,999 | 617 | 15.9% |
| $50,000 to $74,999 | 1,051 | 27.1% |
| $75,000 to $99,999 | 710 | 18.3% |
| $100,000 to $149,999 | 531 | 13.7% |
| $150,000 to $199,999 | 202 | 5.2% |
| $200,000+ | 116 | 3.0% |
Family Income by Famaliy Size in Piney Green
3-person families (1,176 | 30.3%) account for the highest median family income in Piney Green with $73,000 per family, while 2-person families (1,473 | 38.0%) have the highest median income of $26,390 per family member.
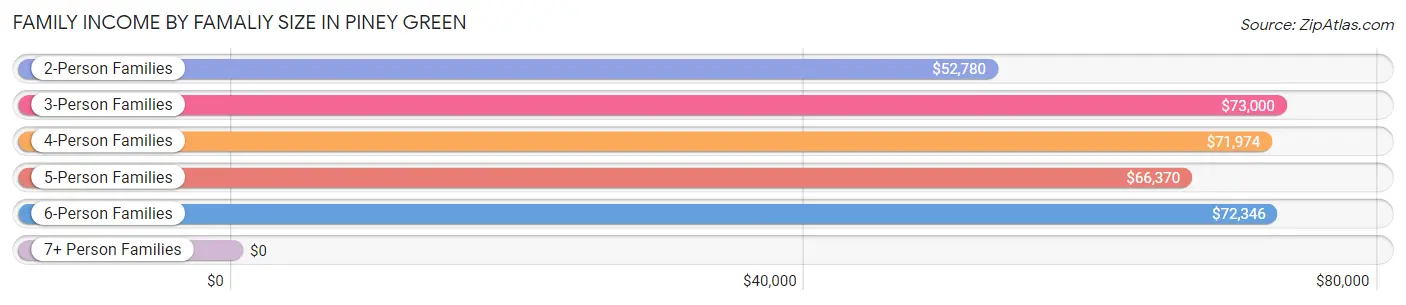
| Income Bracket | # Families | Median Income |
| 2-Person Families | 1,473 (38.0%) | $52,780 |
| 3-Person Families | 1,176 (30.3%) | $73,000 |
| 4-Person Families | 640 (16.5%) | $71,974 |
| 5-Person Families | 403 (10.4%) | $66,370 |
| 6-Person Families | 137 (3.5%) | $72,346 |
| 7+ Person Families | 50 (1.3%) | $0 |
| Total | 3,879 (100.0%) | $69,206 |
Family Income by Number of Earners in Piney Green
The median family income in Piney Green is $69,206, with families comprising 3+ earners (352) having the highest median family income of $113,922, while families with no earners (381) have the lowest median family income of $39,712, accounting for 9.1% and 9.8% of families, respectively.
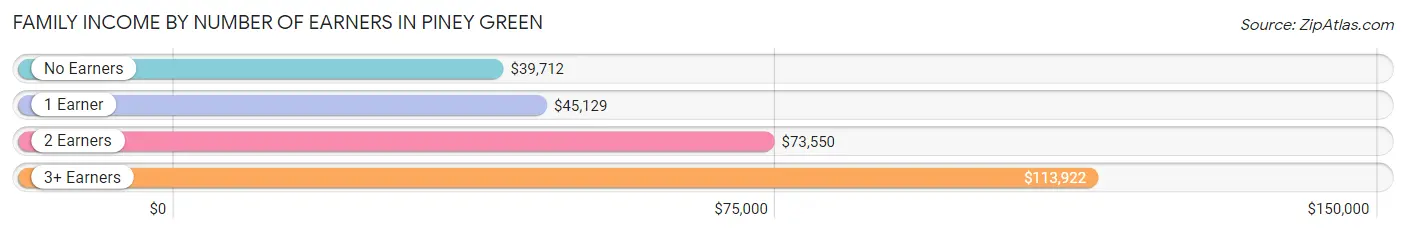
| Number of Earners | # Families | Median Income |
| No Earners | 381 (9.8%) | $39,712 |
| 1 Earner | 1,257 (32.4%) | $45,129 |
| 2 Earners | 1,889 (48.7%) | $73,550 |
| 3+ Earners | 352 (9.1%) | $113,922 |
| Total | 3,879 (100.0%) | $69,206 |
Household Income in Piney Green
Household Income Brackets in Piney Green
With 1,342 households falling in the category, the $50,000 to $74,999 income range is the most frequent in Piney Green, accounting for 25.1% of all households. In contrast, only 144 households (2.7%) fall into the $10,000 to $14,999 income bracket, making it the least populous group.
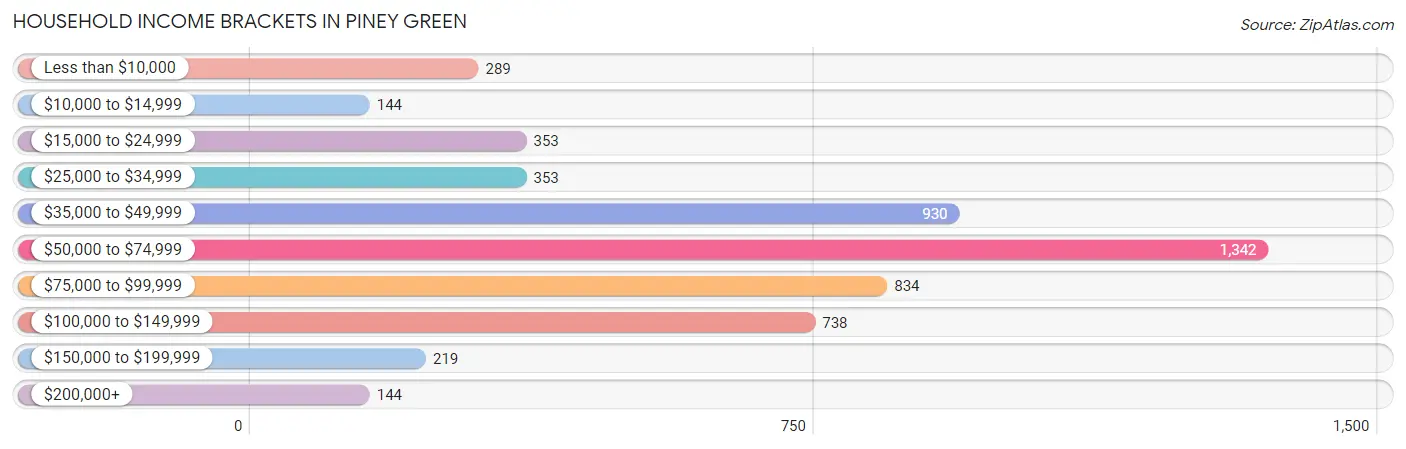
| Income Bracket | # Households | % Households |
| Less than $10,000 | 289 | 5.4% |
| $10,000 to $14,999 | 144 | 2.7% |
| $15,000 to $24,999 | 353 | 6.6% |
| $25,000 to $34,999 | 353 | 6.6% |
| $35,000 to $49,999 | 930 | 17.4% |
| $50,000 to $74,999 | 1,342 | 25.1% |
| $75,000 to $99,999 | 834 | 15.6% |
| $100,000 to $149,999 | 738 | 13.8% |
| $150,000 to $199,999 | 219 | 4.1% |
| $200,000+ | 144 | 2.7% |
Household Income by Householder Age in Piney Green
The median household income in Piney Green is $65,336, with the highest median household income of $85,817 found in the 45 to 64 years age bracket for the primary householder. A total of 1,417 households (26.5%) fall into this category. Meanwhile, the 65+ years age bracket for the primary householder has the lowest median household income of $41,083, with 862 households (16.1%) in this group.
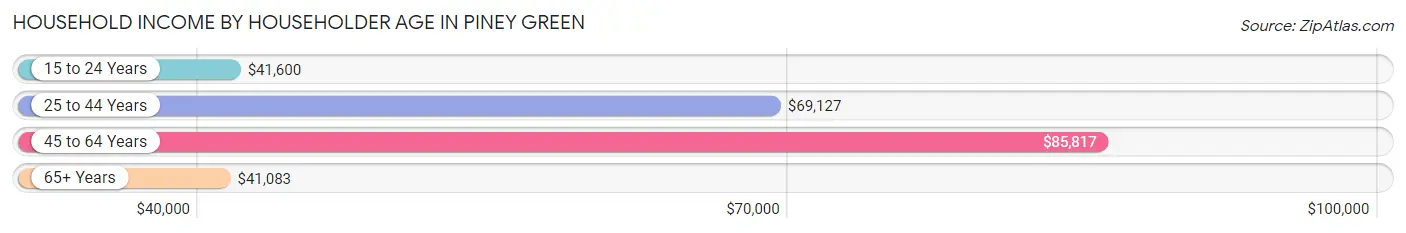
| Income Bracket | # Households | Median Income |
| 15 to 24 Years | 744 (13.9%) | $41,600 |
| 25 to 44 Years | 2,322 (43.4%) | $69,127 |
| 45 to 64 Years | 1,417 (26.5%) | $85,817 |
| 65+ Years | 862 (16.1%) | $41,083 |
| Total | 5,345 (100.0%) | $65,336 |
Poverty in Piney Green
Income Below Poverty by Sex and Age in Piney Green
With 8.8% poverty level for males and 15.2% for females among the residents of Piney Green, 5 year old males and 15 year old females are the most vulnerable to poverty, with 98 males (35.5%) and 49 females (35.2%) in their respective age groups living below the poverty level.
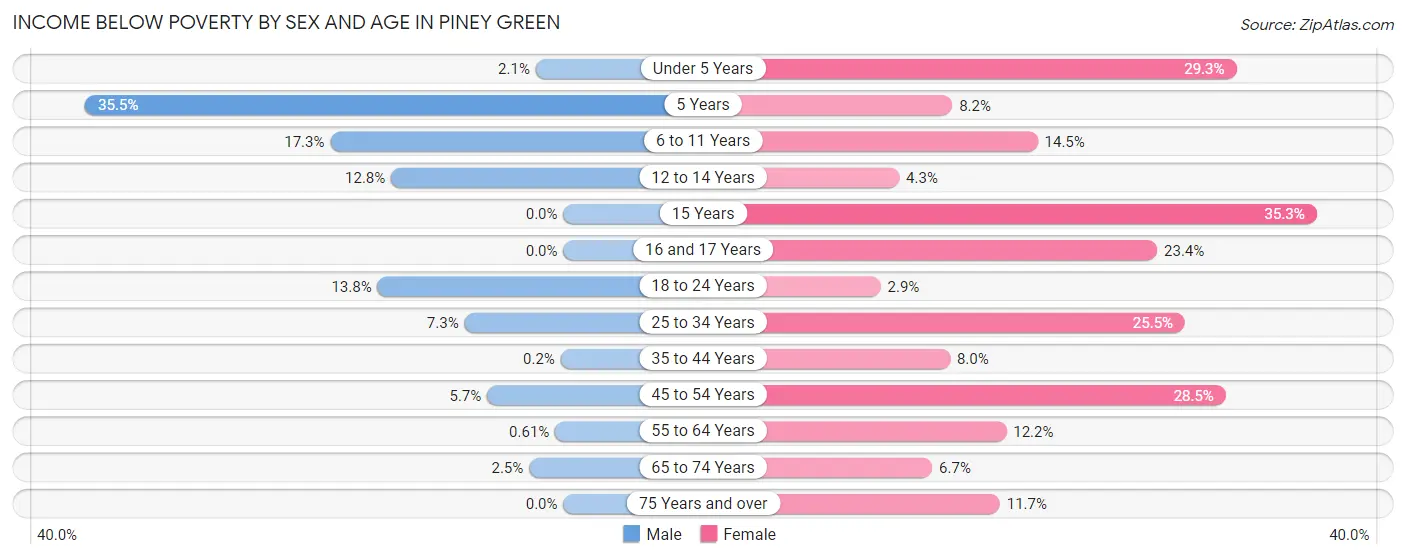
| Age Bracket | Male | Female |
| Under 5 Years | 6 (2.1%) | 82 (29.3%) |
| 5 Years | 98 (35.5%) | 5 (8.2%) |
| 6 to 11 Years | 181 (17.3%) | 83 (14.5%) |
| 12 to 14 Years | 38 (12.8%) | 22 (4.3%) |
| 15 Years | 0 (0.0%) | 49 (35.2%) |
| 16 and 17 Years | 0 (0.0%) | 48 (23.4%) |
| 18 to 24 Years | 214 (13.8%) | 23 (2.9%) |
| 25 to 34 Years | 94 (7.3%) | 270 (25.5%) |
| 35 to 44 Years | 2 (0.2%) | 90 (8.0%) |
| 45 to 54 Years | 30 (5.7%) | 242 (28.5%) |
| 55 to 64 Years | 3 (0.6%) | 91 (12.2%) |
| 65 to 74 Years | 10 (2.5%) | 21 (6.7%) |
| 75 Years and over | 0 (0.0%) | 46 (11.7%) |
| Total | 676 (8.8%) | 1,072 (15.2%) |
Income Above Poverty by Sex and Age in Piney Green
According to the poverty statistics in Piney Green, males aged 15 years and females aged 18 to 24 years are the age groups that are most secure financially, with 100.0% of males and 97.1% of females in these age groups living above the poverty line.

| Age Bracket | Male | Female |
| Under 5 Years | 286 (98.0%) | 198 (70.7%) |
| 5 Years | 178 (64.5%) | 56 (91.8%) |
| 6 to 11 Years | 865 (82.7%) | 488 (85.5%) |
| 12 to 14 Years | 259 (87.2%) | 494 (95.7%) |
| 15 Years | 98 (100.0%) | 90 (64.7%) |
| 16 and 17 Years | 147 (100.0%) | 157 (76.6%) |
| 18 to 24 Years | 1,337 (86.2%) | 775 (97.1%) |
| 25 to 34 Years | 1,187 (92.7%) | 790 (74.5%) |
| 35 to 44 Years | 1,008 (99.8%) | 1,031 (92.0%) |
| 45 to 54 Years | 500 (94.3%) | 607 (71.5%) |
| 55 to 64 Years | 485 (99.4%) | 654 (87.8%) |
| 65 to 74 Years | 383 (97.5%) | 292 (93.3%) |
| 75 Years and over | 287 (100.0%) | 346 (88.3%) |
| Total | 7,020 (91.2%) | 5,978 (84.8%) |
Income Below Poverty Among Married-Couple Families in Piney Green
The poverty statistics for married-couple families in Piney Green show that 3.4% or 98 of the total 2,846 families live below the poverty line. Families with no children have the highest poverty rate of 4.2%, comprising of 56 families. On the other hand, families with 3 or 4 children have the lowest poverty rate of 0.0%, which includes 0 families.
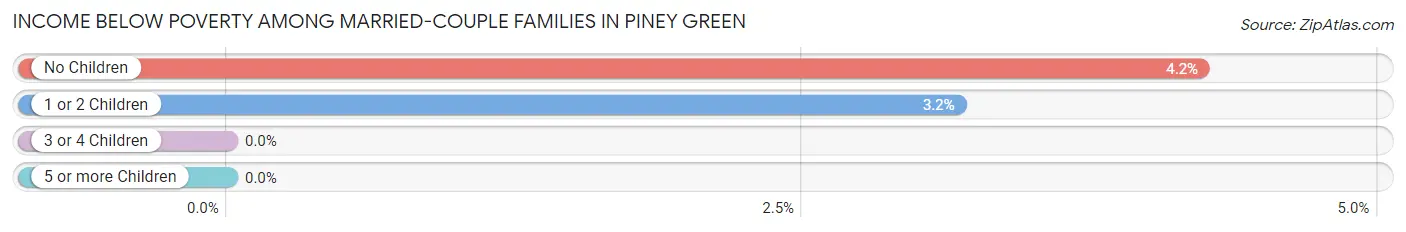
| Children | Above Poverty | Below Poverty |
| No Children | 1,267 (95.8%) | 56 (4.2%) |
| 1 or 2 Children | 1,285 (96.8%) | 42 (3.2%) |
| 3 or 4 Children | 167 (100.0%) | 0 (0.0%) |
| 5 or more Children | 29 (100.0%) | 0 (0.0%) |
| Total | 2,748 (96.6%) | 98 (3.4%) |
Income Below Poverty Among Single-Parent Households in Piney Green
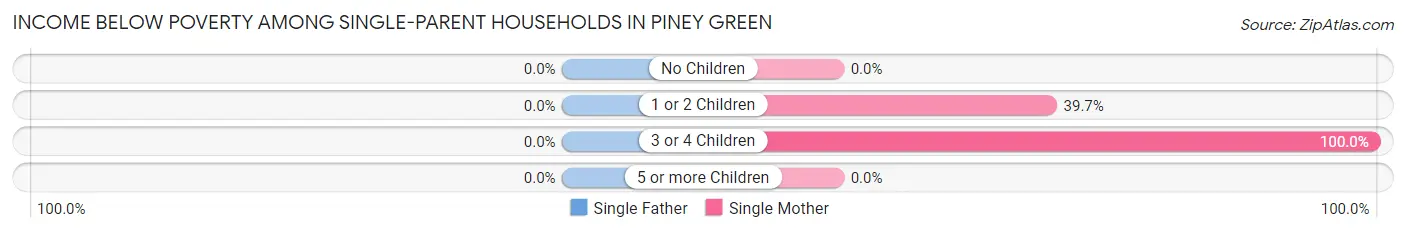
| Children | Single Father | Single Mother |
| No Children | 0 (0.0%) | 0 (0.0%) |
| 1 or 2 Children | 0 (0.0%) | 188 (39.7%) |
| 3 or 4 Children | 0 (0.0%) | 38 (100.0%) |
| 5 or more Children | 0 (0.0%) | 0 (0.0%) |
| Total | 0 (0.0%) | 226 (31.0%) |
Income Below Poverty Among Married-Couple vs Single-Parent Households in Piney Green
The poverty data for Piney Green shows that 98 of the married-couple family households (3.4%) and 226 of the single-parent households (21.9%) are living below the poverty level. Within the married-couple family households, those with no children have the highest poverty rate, with 56 households (4.2%) falling below the poverty line. Among the single-parent households, those with 3 or 4 children have the highest poverty rate, with 38 household (100.0%) living below poverty.
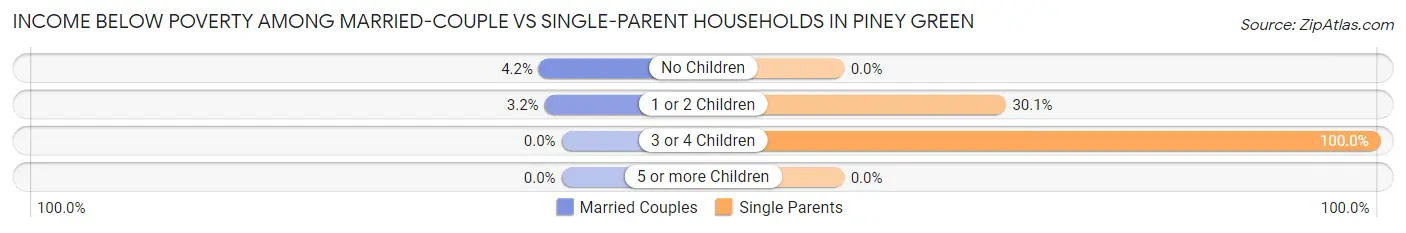
| Children | Married-Couple Families | Single-Parent Households |
| No Children | 56 (4.2%) | 0 (0.0%) |
| 1 or 2 Children | 42 (3.2%) | 188 (30.1%) |
| 3 or 4 Children | 0 (0.0%) | 38 (100.0%) |
| 5 or more Children | 0 (0.0%) | 0 (0.0%) |
| Total | 98 (3.4%) | 226 (21.9%) |
Race in Piney Green
The most populous races in Piney Green are White / Caucasian (8,528 | 57.8%), Black / African American (3,018 | 20.4%), and Two or more Races (2,264 | 15.3%).
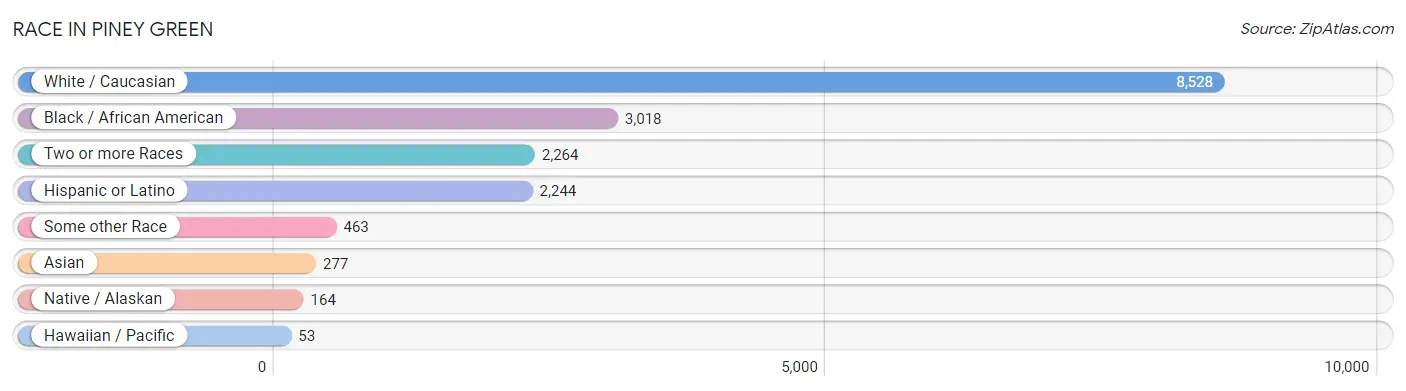
| Race | # Population | % Population |
| Asian | 277 | 1.9% |
| Black / African American | 3,018 | 20.4% |
| Hawaiian / Pacific | 53 | 0.4% |
| Hispanic or Latino | 2,244 | 15.2% |
| Native / Alaskan | 164 | 1.1% |
| White / Caucasian | 8,528 | 57.8% |
| Two or more Races | 2,264 | 15.3% |
| Some other Race | 463 | 3.1% |
| Total | 14,767 | 100.0% |
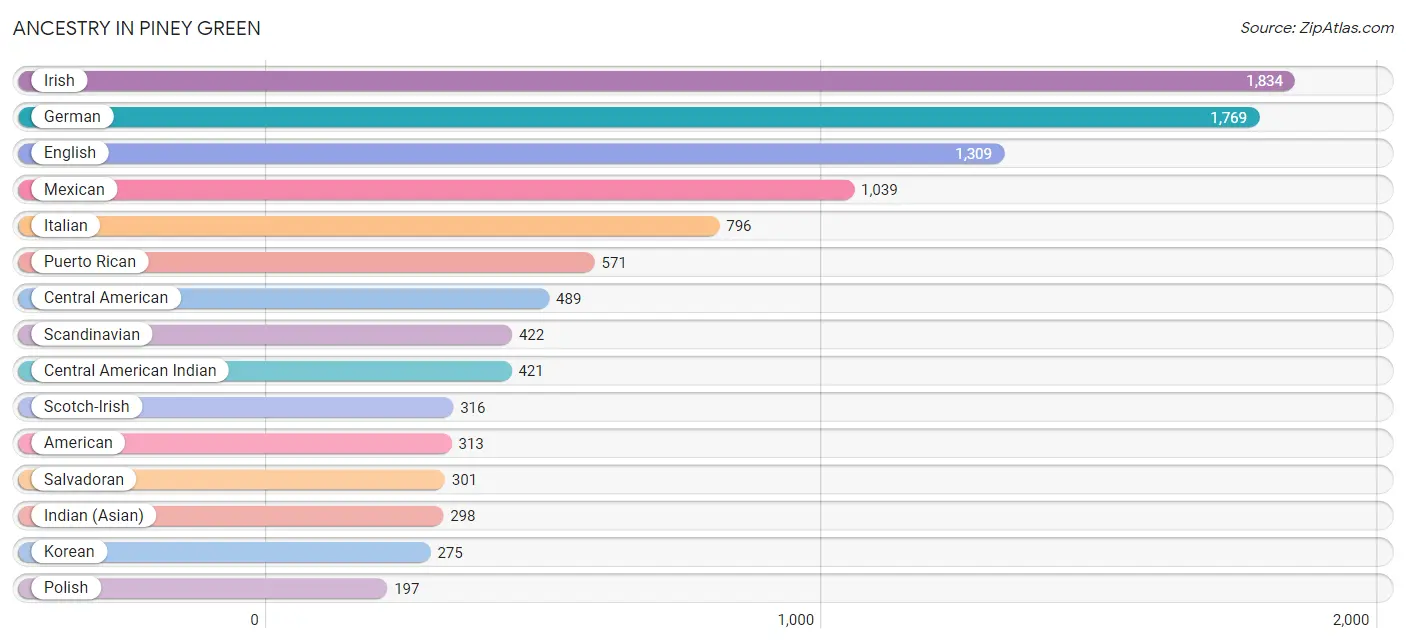
Ancestry in Piney Green
The most populous ancestries reported in Piney Green are Irish (1,834 | 12.4%), German (1,769 | 12.0%), English (1,309 | 8.9%), Mexican (1,039 | 7.0%), and Italian (796 | 5.4%), together accounting for 45.7% of all Piney Green residents.
| Ancestry | # Population | % Population |
| African | 4 | 0.0% |
| Alaska Native | 35 | 0.2% |
| American | 313 | 2.1% |
| Arab | 53 | 0.4% |
| Austrian | 20 | 0.1% |
| Basque | 17 | 0.1% |
| Belgian | 16 | 0.1% |
| Bhutanese | 132 | 0.9% |
| Blackfeet | 7 | 0.1% |
| British | 65 | 0.4% |
| British West Indian | 49 | 0.3% |
| Burmese | 55 | 0.4% |
| Central American | 489 | 3.3% |
| Central American Indian | 421 | 2.9% |
| Cherokee | 1 | 0.0% |
| Chinese | 38 | 0.3% |
| Chippewa | 1 | 0.0% |
| Colombian | 107 | 0.7% |
| Cuban | 22 | 0.2% |
| Czech | 187 | 1.3% |
| Czechoslovakian | 19 | 0.1% |
| Danish | 30 | 0.2% |
| Dutch | 59 | 0.4% |
| English | 1,309 | 8.9% |
| European | 77 | 0.5% |
| French | 130 | 0.9% |
| French Canadian | 52 | 0.4% |
| German | 1,769 | 12.0% |
| Greek | 4 | 0.0% |
| Guamanian / Chamorro | 10 | 0.1% |
| Honduran | 175 | 1.2% |
| Hungarian | 23 | 0.2% |
| Indian (Asian) | 298 | 2.0% |
| Irish | 1,834 | 12.4% |
| Italian | 796 | 5.4% |
| Jamaican | 40 | 0.3% |
| Korean | 275 | 1.9% |
| Lebanese | 53 | 0.4% |
| Liberian | 25 | 0.2% |
| Lumbee | 10 | 0.1% |
| Mexican | 1,039 | 7.0% |
| Nigerian | 145 | 1.0% |
| Northern European | 58 | 0.4% |
| Norwegian | 35 | 0.2% |
| Panamanian | 13 | 0.1% |
| Polish | 197 | 1.3% |
| Portuguese | 47 | 0.3% |
| Puerto Rican | 571 | 3.9% |
| Salvadoran | 301 | 2.0% |
| Samoan | 119 | 0.8% |
| Scandinavian | 422 | 2.9% |
| Scotch-Irish | 316 | 2.1% |
| Scottish | 88 | 0.6% |
| Sioux | 4 | 0.0% |
| South American | 107 | 0.7% |
| Subsaharan African | 174 | 1.2% |
| Swiss | 108 | 0.7% |
| Ukrainian | 16 | 0.1% |
| Welsh | 88 | 0.6% |
| West Indian | 108 | 0.7% | View All 60 Rows |
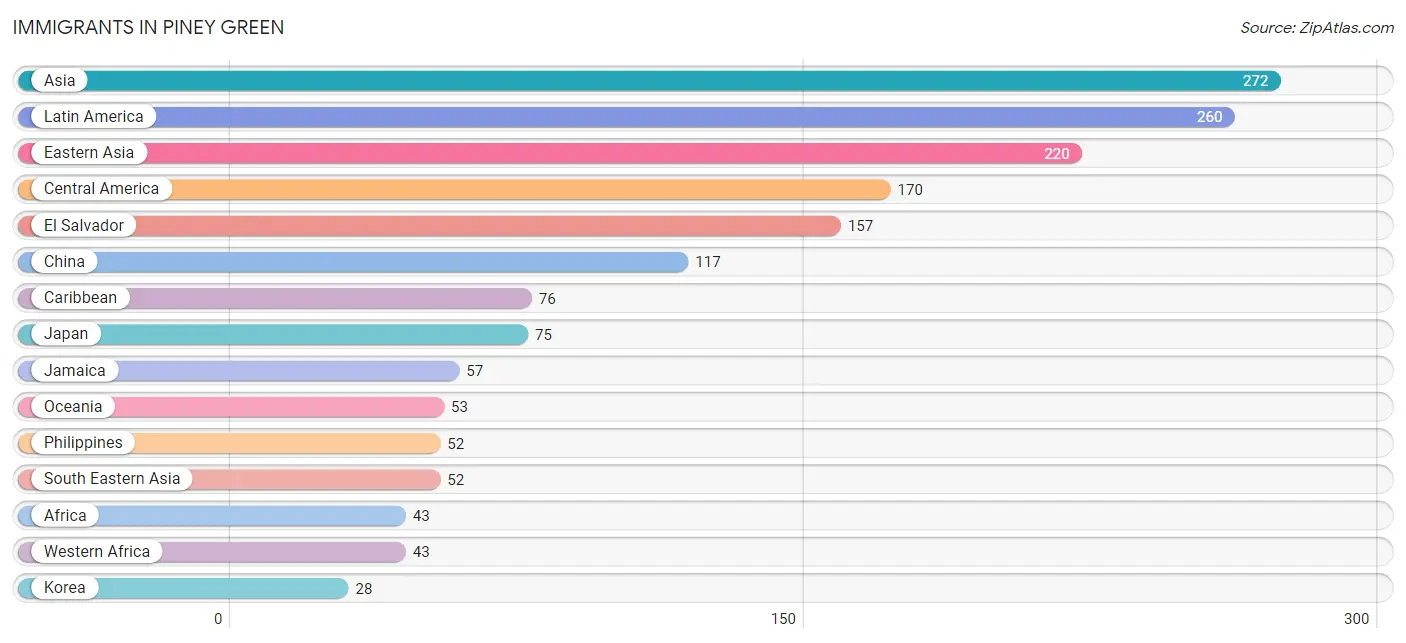
Immigrants in Piney Green
The most numerous immigrant groups reported in Piney Green came from Asia (272 | 1.8%), Latin America (260 | 1.8%), Eastern Asia (220 | 1.5%), Central America (170 | 1.1%), and El Salvador (157 | 1.1%), together accounting for 7.3% of all Piney Green residents.
| Immigration Origin | # Population | % Population |
| Africa | 43 | 0.3% |
| Asia | 272 | 1.8% |
| Austria | 12 | 0.1% |
| Caribbean | 76 | 0.5% |
| Central America | 170 | 1.1% |
| China | 117 | 0.8% |
| Colombia | 14 | 0.1% |
| Eastern Asia | 220 | 1.5% |
| El Salvador | 157 | 1.1% |
| Europe | 12 | 0.1% |
| Grenada | 19 | 0.1% |
| Jamaica | 57 | 0.4% |
| Japan | 75 | 0.5% |
| Korea | 28 | 0.2% |
| Latin America | 260 | 1.8% |
| Liberia | 25 | 0.2% |
| Nigeria | 18 | 0.1% |
| Oceania | 53 | 0.4% |
| Panama | 13 | 0.1% |
| Philippines | 52 | 0.4% |
| South America | 14 | 0.1% |
| South Eastern Asia | 52 | 0.4% |
| Western Africa | 43 | 0.3% |
| Western Europe | 12 | 0.1% | View All 24 Rows |
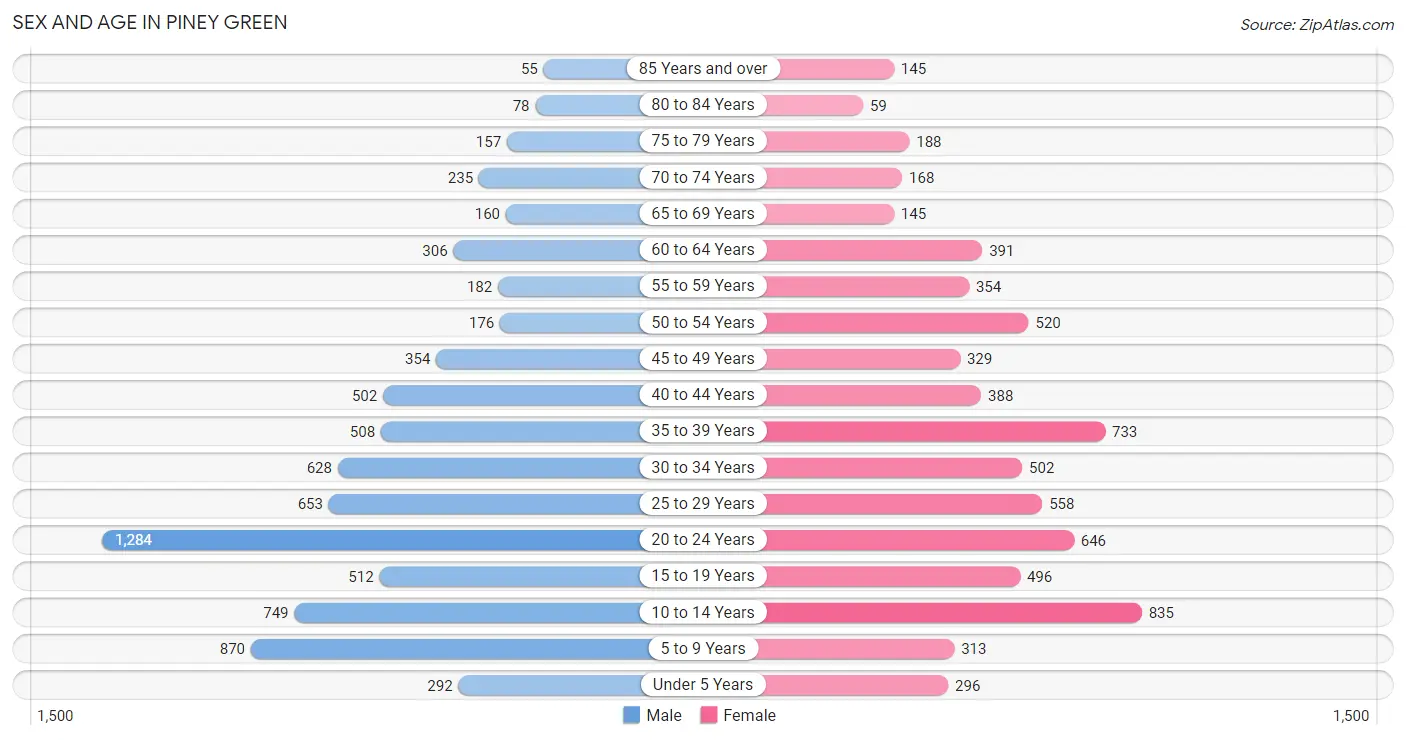
Sex and Age in Piney Green
Sex and Age in Piney Green
The most populous age groups in Piney Green are 20 to 24 Years (1,284 | 16.7%) for men and 10 to 14 Years (835 | 11.8%) for women.
| Age Bracket | Male | Female |
| Under 5 Years | 292 (3.8%) | 296 (4.2%) |
| 5 to 9 Years | 870 (11.3%) | 313 (4.4%) |
| 10 to 14 Years | 749 (9.7%) | 835 (11.8%) |
| 15 to 19 Years | 512 (6.7%) | 496 (7.0%) |
| 20 to 24 Years | 1,284 (16.7%) | 646 (9.1%) |
| 25 to 29 Years | 653 (8.5%) | 558 (7.9%) |
| 30 to 34 Years | 628 (8.2%) | 502 (7.1%) |
| 35 to 39 Years | 508 (6.6%) | 733 (10.4%) |
| 40 to 44 Years | 502 (6.5%) | 388 (5.5%) |
| 45 to 49 Years | 354 (4.6%) | 329 (4.7%) |
| 50 to 54 Years | 176 (2.3%) | 520 (7.4%) |
| 55 to 59 Years | 182 (2.4%) | 354 (5.0%) |
| 60 to 64 Years | 306 (4.0%) | 391 (5.5%) |
| 65 to 69 Years | 160 (2.1%) | 145 (2.1%) |
| 70 to 74 Years | 235 (3.0%) | 168 (2.4%) |
| 75 to 79 Years | 157 (2.0%) | 188 (2.7%) |
| 80 to 84 Years | 78 (1.0%) | 59 (0.8%) |
| 85 Years and over | 55 (0.7%) | 145 (2.1%) |
| Total | 7,701 (100.0%) | 7,066 (100.0%) |
Families and Households in Piney Green
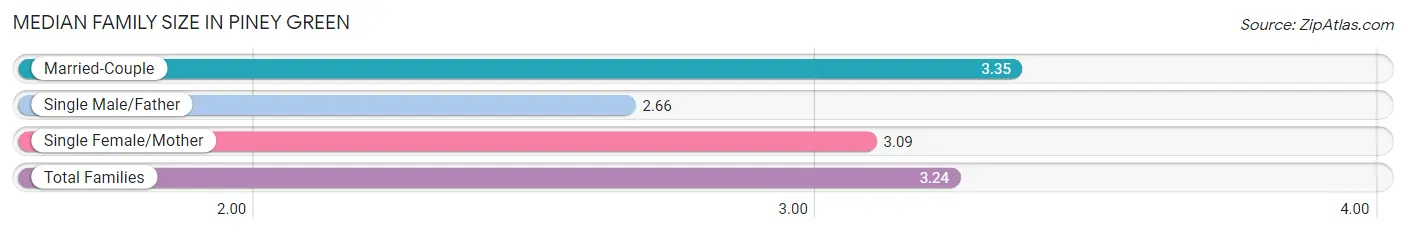
Median Family Size in Piney Green
The median family size in Piney Green is 3.24 persons per family, with married-couple families (2,846 | 73.4%) accounting for the largest median family size of 3.35 persons per family. On the other hand, single male/father families (305 | 7.9%) represent the smallest median family size with 2.66 persons per family.
| Family Type | # Families | Family Size |
| Married-Couple | 2,846 (73.4%) | 3.35 |
| Single Male/Father | 305 (7.9%) | 2.66 |
| Single Female/Mother | 728 (18.8%) | 3.09 |
| Total Families | 3,879 (100.0%) | 3.24 |
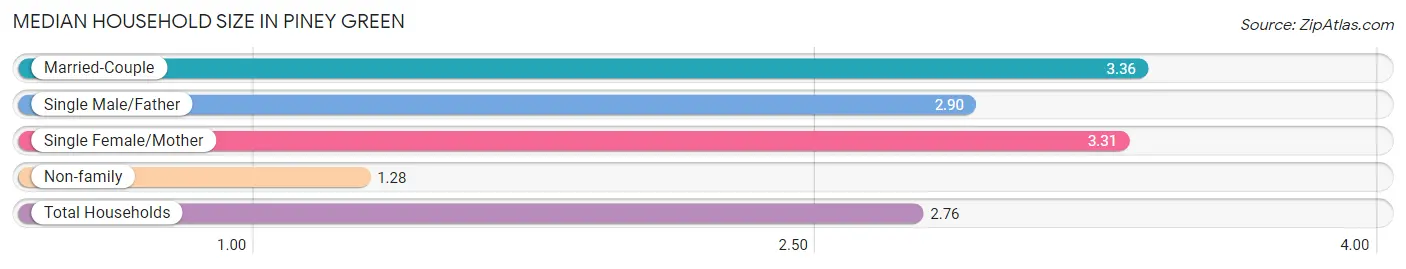
Median Household Size in Piney Green
The median household size in Piney Green is 2.76 persons per household, with married-couple households (2,846 | 53.2%) accounting for the largest median household size of 3.36 persons per household. non-family households (1,466 | 27.4%) represent the smallest median household size with 1.28 persons per household.
| Household Type | # Households | Household Size |
| Married-Couple | 2,846 (53.2%) | 3.36 |
| Single Male/Father | 305 (5.7%) | 2.90 |
| Single Female/Mother | 728 (13.6%) | 3.31 |
| Non-family | 1,466 (27.4%) | 1.28 |
| Total Households | 5,345 (100.0%) | 2.76 |
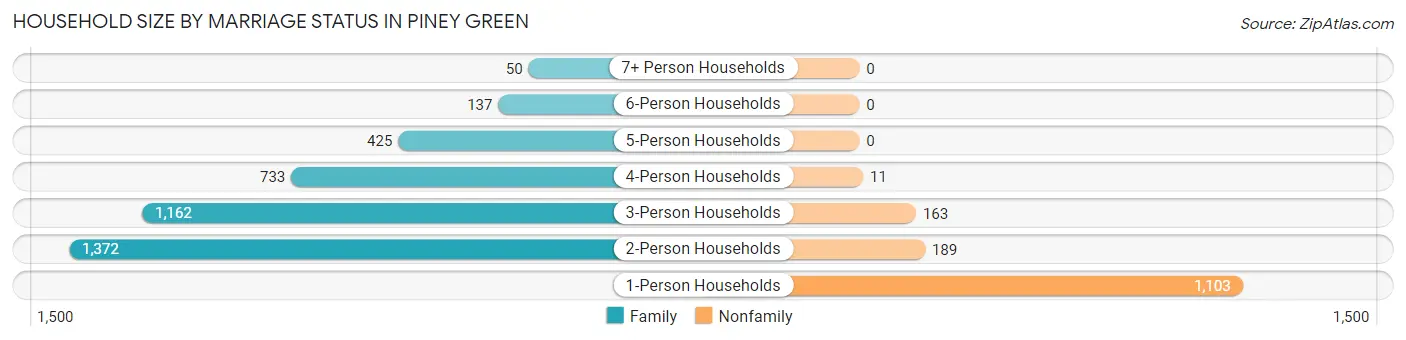
Household Size by Marriage Status in Piney Green
Out of a total of 5,345 households in Piney Green, 3,879 (72.6%) are family households, while 1,466 (27.4%) are nonfamily households. The most numerous type of family households are 2-person households, comprising 1,372, and the most common type of nonfamily households are 1-person households, comprising 1,103.
| Household Size | Family Households | Nonfamily Households |
| 1-Person Households | - | 1,103 (20.6%) |
| 2-Person Households | 1,372 (25.7%) | 189 (3.5%) |
| 3-Person Households | 1,162 (21.7%) | 163 (3.0%) |
| 4-Person Households | 733 (13.7%) | 11 (0.2%) |
| 5-Person Households | 425 (8.0%) | 0 (0.0%) |
| 6-Person Households | 137 (2.6%) | 0 (0.0%) |
| 7+ Person Households | 50 (0.9%) | 0 (0.0%) |
| Total | 3,879 (72.6%) | 1,466 (27.4%) |
Female Fertility in Piney Green
Fertility by Age in Piney Green
Average fertility rate in Piney Green is 51.0 births per 1,000 women. Women in the age bracket of 20 to 34 years have the highest fertility rate with 101.0 births per 1,000 women. Women in the age bracket of 20 to 34 years acount for 87.8% of all women with births.
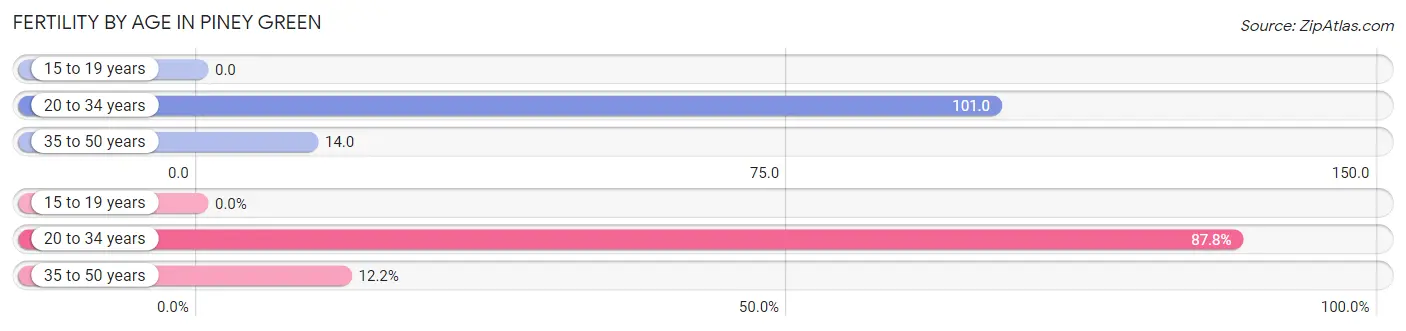
| Age Bracket | Women with Births | Births / 1,000 Women |
| 15 to 19 years | 0 (0.0%) | 0.0 |
| 20 to 34 years | 173 (87.8%) | 101.0 |
| 35 to 50 years | 24 (12.2%) | 14.0 |
| Total | 197 (100.0%) | 51.0 |
Fertility by Age by Marriage Status in Piney Green
88.8% of women with births (197) in Piney Green are married. The highest percentage of unmarried women with births falls into 35 to 50 years age bracket with 45.8% of them unmarried at the time of birth, while the lowest percentage of unmarried women with births belong to 20 to 34 years age bracket with 6.4% of them unmarried.
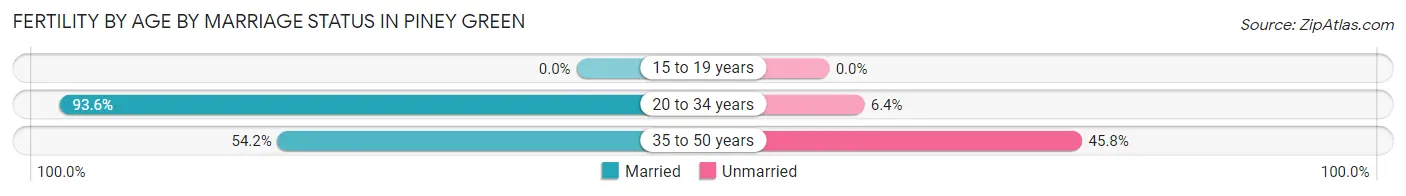
| Age Bracket | Married | Unmarried |
| 15 to 19 years | 0 (0.0%) | 0 (0.0%) |
| 20 to 34 years | 162 (93.6%) | 11 (6.4%) |
| 35 to 50 years | 13 (54.2%) | 11 (45.8%) |
| Total | 175 (88.8%) | 22 (11.2%) |
Fertility by Education in Piney Green
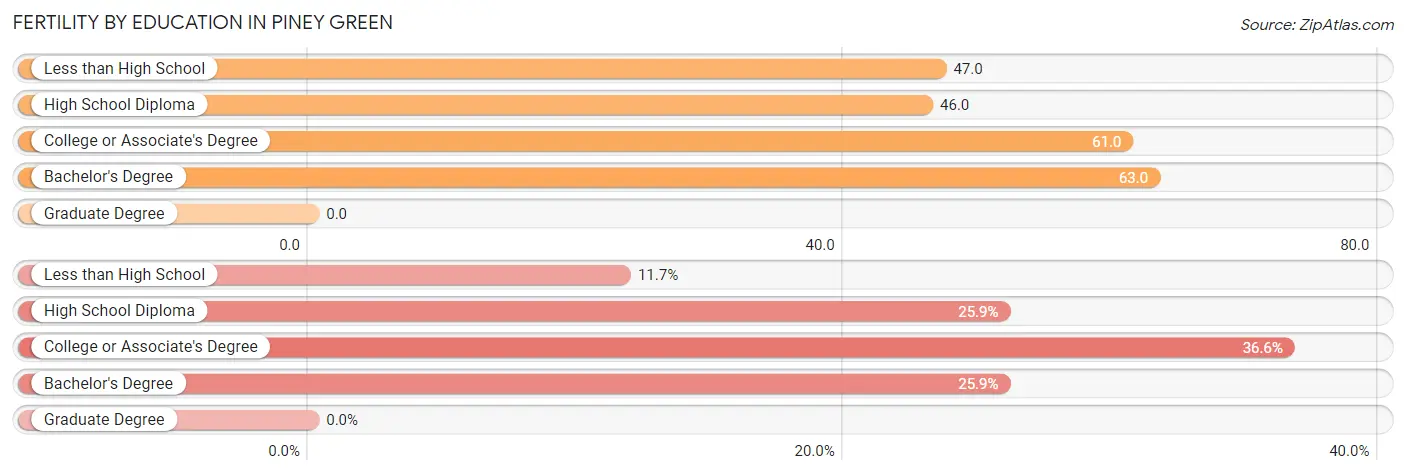
| Educational Attainment | Women with Births | Births / 1,000 Women |
| Less than High School | 23 (11.7%) | 47.0 |
| High School Diploma | 51 (25.9%) | 46.0 |
| College or Associate's Degree | 72 (36.5%) | 61.0 |
| Bachelor's Degree | 51 (25.9%) | 63.0 |
| Graduate Degree | 0 (0.0%) | 0.0 |
| Total | 197 (100.0%) | 51.0 |
Fertility by Education by Marriage Status in Piney Green
11.2% of women with births in Piney Green are unmarried. Women with the educational attainment of less than high school are most likely to be married with 100.0% of them married at childbirth, while women with the educational attainment of college or associate's degree are least likely to be married with 15.3% of them unmarried at childbirth.
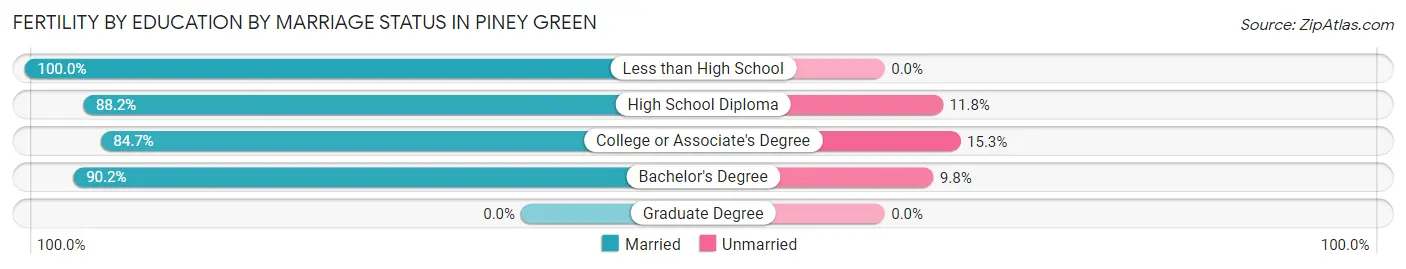
| Educational Attainment | Married | Unmarried |
| Less than High School | 23 (100.0%) | 0 (0.0%) |
| High School Diploma | 45 (88.2%) | 6 (11.8%) |
| College or Associate's Degree | 61 (84.7%) | 11 (15.3%) |
| Bachelor's Degree | 46 (90.2%) | 5 (9.8%) |
| Graduate Degree | 0 (0.0%) | 0 (0.0%) |
| Total | 175 (88.8%) | 22 (11.2%) |
Employment Characteristics in Piney Green
Employment by Class of Employer in Piney Green
Among the 7,239 employed individuals in Piney Green, private company employees (4,136 | 57.1%), federal government employees (2,117 | 29.2%), and local government employees (312 | 4.3%) make up the most common classes of employment.
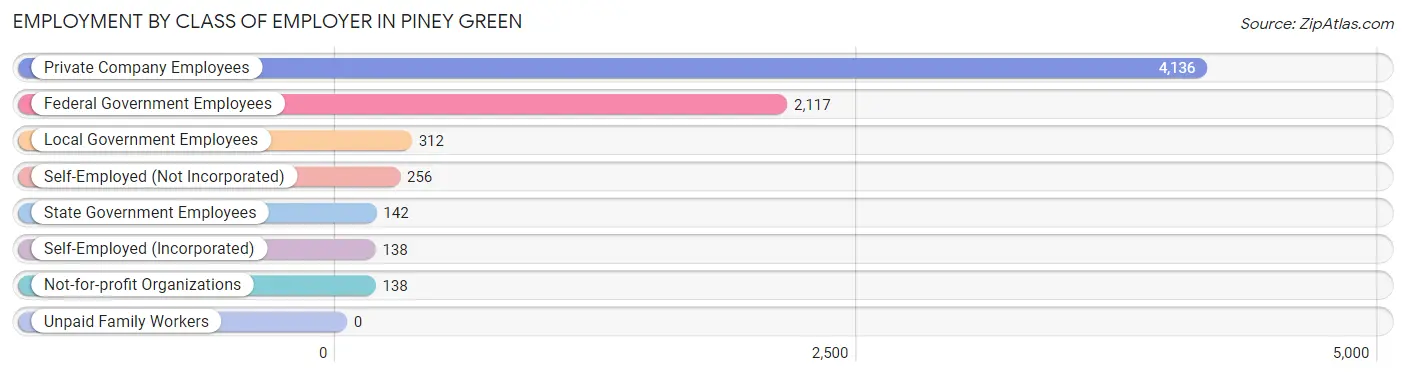
| Employer Class | # Employees | % Employees |
| Private Company Employees | 4,136 | 57.1% |
| Self-Employed (Incorporated) | 138 | 1.9% |
| Self-Employed (Not Incorporated) | 256 | 3.5% |
| Not-for-profit Organizations | 138 | 1.9% |
| Local Government Employees | 312 | 4.3% |
| State Government Employees | 142 | 2.0% |
| Federal Government Employees | 2,117 | 29.2% |
| Unpaid Family Workers | 0 | 0.0% |
| Total | 7,239 | 100.0% |
Employment Status by Age in Piney Green
According to the labor force statistics for Piney Green, out of the total population over 16 years of age (11,175), 71.3% or 7,968 individuals are in the labor force, with 7.2% or 574 of them unemployed. The age group with the highest labor force participation rate is 25 to 29 years, with 91.1% or 1,103 individuals in the labor force. Within the labor force, the 16 to 19 years age range has the highest percentage of unemployed individuals, with 31.8% or 159 of them being unemployed.
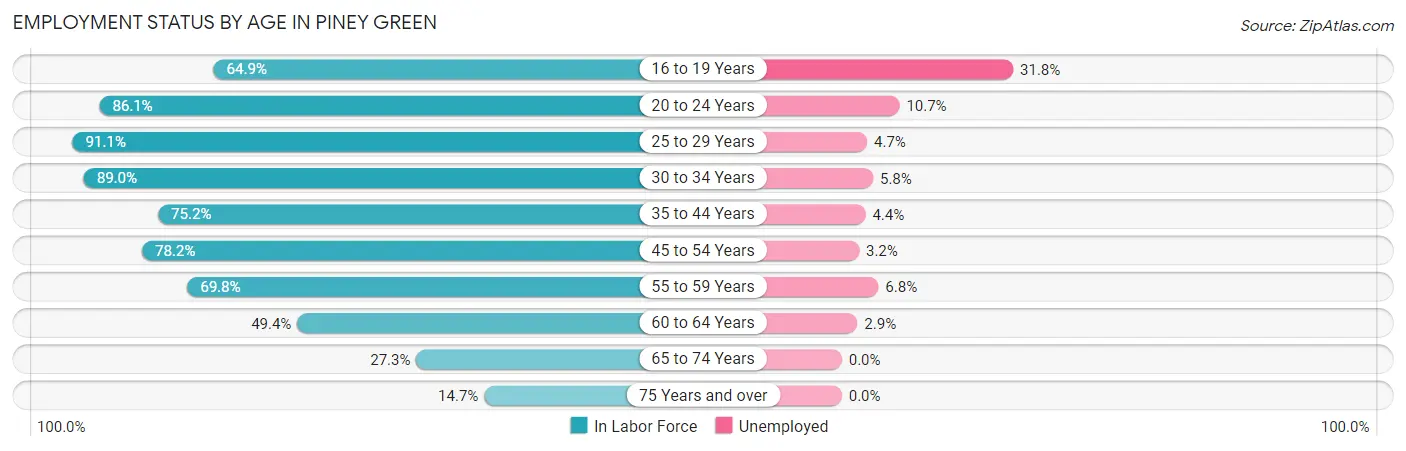
| Age Bracket | In Labor Force | Unemployed |
| 16 to 19 Years | 500 (64.9%) | 159 (31.8%) |
| 20 to 24 Years | 1,662 (86.1%) | 178 (10.7%) |
| 25 to 29 Years | 1,103 (91.1%) | 52 (4.7%) |
| 30 to 34 Years | 1,006 (89.0%) | 58 (5.8%) |
| 35 to 44 Years | 1,603 (75.2%) | 71 (4.4%) |
| 45 to 54 Years | 1,078 (78.2%) | 34 (3.2%) |
| 55 to 59 Years | 374 (69.8%) | 25 (6.8%) |
| 60 to 64 Years | 344 (49.4%) | 10 (2.9%) |
| 65 to 74 Years | 193 (27.3%) | 0 (0.0%) |
| 75 Years and over | 100 (14.7%) | 0 (0.0%) |
| Total | 7,968 (71.3%) | 574 (7.2%) |
Employment Status by Educational Attainment in Piney Green
According to labor force statistics for Piney Green, 77.8% of individuals (5,511) out of the total population between 25 and 64 years of age (7,084) are in the labor force, with 4.5% or 248 of them being unemployed. The group with the highest labor force participation rate are those with the educational attainment of bachelor's degree or higher, with 84.9% or 1,594 individuals in the labor force. Within the labor force, individuals with less than high school education have the highest percentage of unemployment, with 10.6% or 28 of them being unemployed.
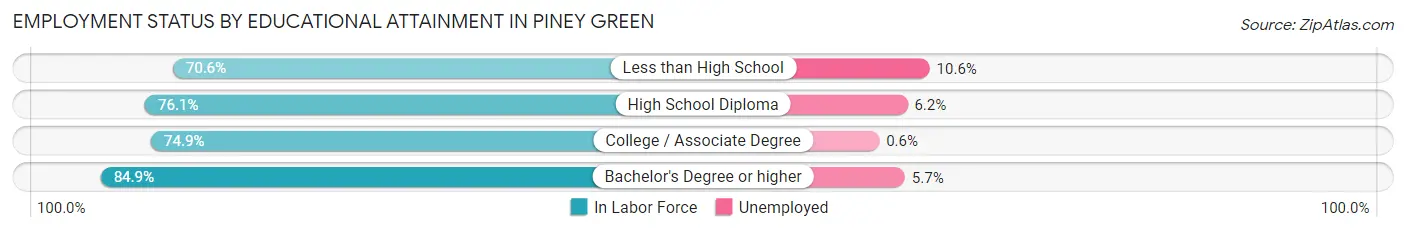
| Educational Attainment | In Labor Force | Unemployed |
| Less than High School | 264 (70.6%) | 40 (10.6%) |
| High School Diploma | 1,895 (76.1%) | 154 (6.2%) |
| College / Associate Degree | 1,755 (74.9%) | 14 (0.6%) |
| Bachelor's Degree or higher | 1,594 (84.9%) | 107 (5.7%) |
| Total | 5,511 (77.8%) | 319 (4.5%) |
Employment Occupations by Sex in Piney Green
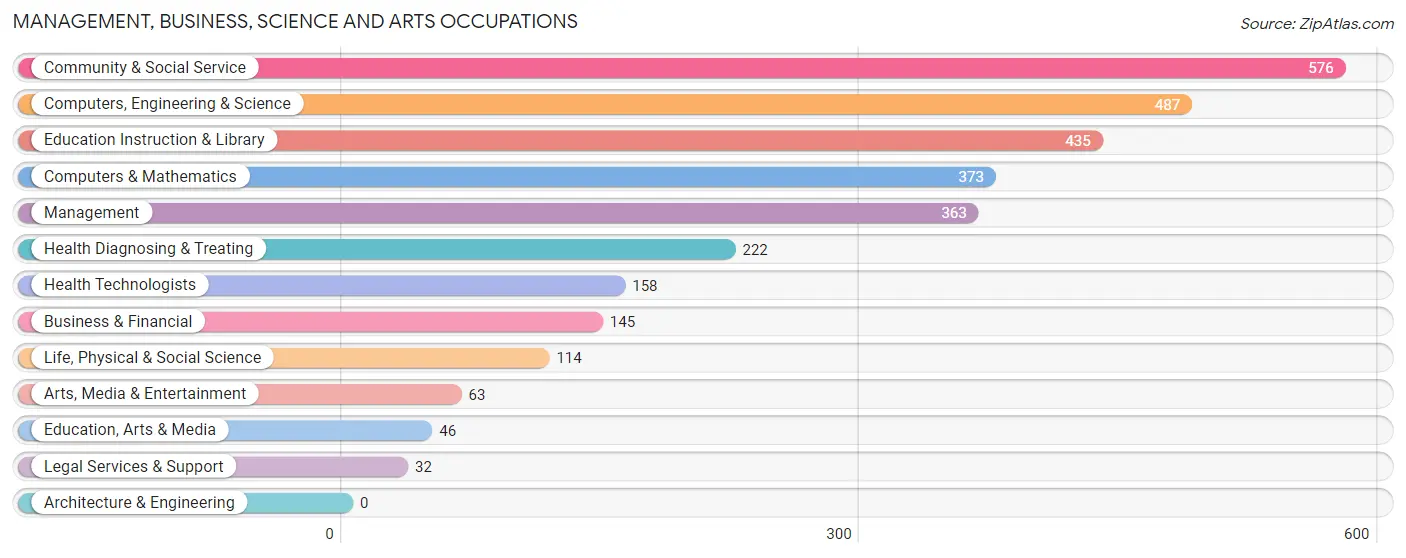
Management, Business, Science and Arts Occupations
The most common Management, Business, Science and Arts occupations in Piney Green are Community & Social Service (576 | 9.1%), Computers, Engineering & Science (487 | 7.7%), Education Instruction & Library (435 | 6.9%), Computers & Mathematics (373 | 5.9%), and Management (363 | 5.7%).
Management, Business, Science and Arts Occupations by Sex
Within the Management, Business, Science and Arts occupations in Piney Green, the most male-oriented occupations are Computers & Mathematics (100.0%), Computers, Engineering & Science (82.3%), and Education, Arts & Media (78.3%), while the most female-oriented occupations are Legal Services & Support (100.0%), Health Technologists (100.0%), and Health Diagnosing & Treating (92.3%).
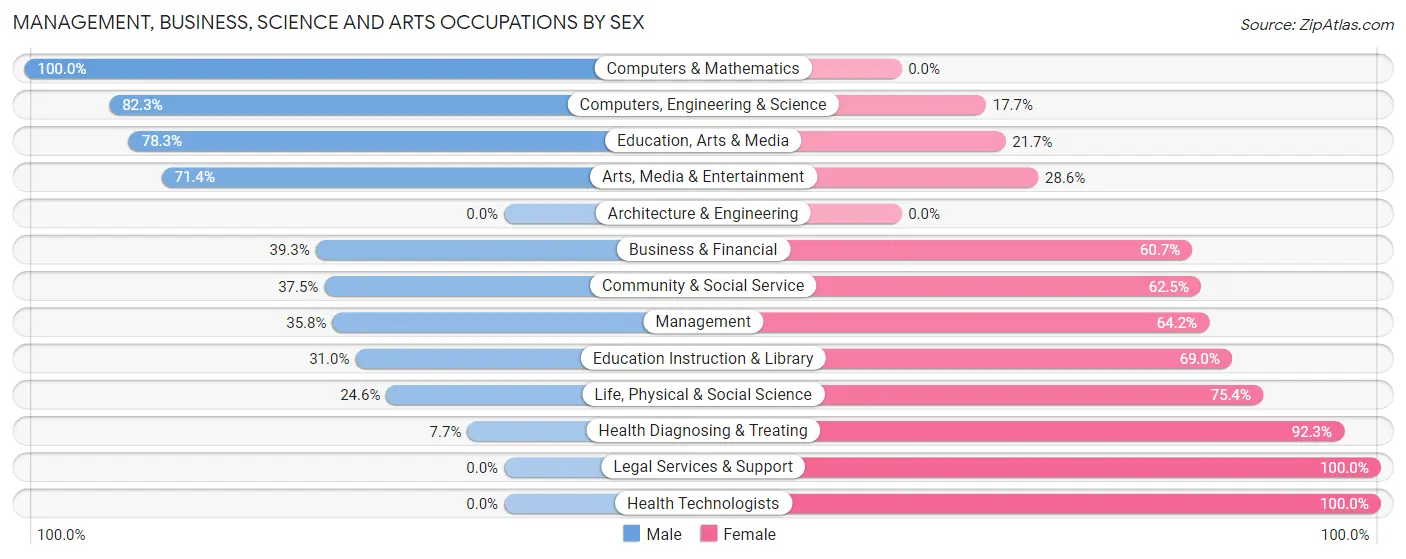
| Occupation | Male | Female |
| Management | 130 (35.8%) | 233 (64.2%) |
| Business & Financial | 57 (39.3%) | 88 (60.7%) |
| Computers, Engineering & Science | 401 (82.3%) | 86 (17.7%) |
| Computers & Mathematics | 373 (100.0%) | 0 (0.0%) |
| Architecture & Engineering | 0 (0.0%) | 0 (0.0%) |
| Life, Physical & Social Science | 28 (24.6%) | 86 (75.4%) |
| Community & Social Service | 216 (37.5%) | 360 (62.5%) |
| Education, Arts & Media | 36 (78.3%) | 10 (21.7%) |
| Legal Services & Support | 0 (0.0%) | 32 (100.0%) |
| Education Instruction & Library | 135 (31.0%) | 300 (69.0%) |
| Arts, Media & Entertainment | 45 (71.4%) | 18 (28.6%) |
| Health Diagnosing & Treating | 17 (7.7%) | 205 (92.3%) |
| Health Technologists | 0 (0.0%) | 158 (100.0%) |
| Total (Category) | 821 (45.8%) | 972 (54.2%) |
| Total (Overall) | 3,360 (53.0%) | 2,978 (47.0%) |
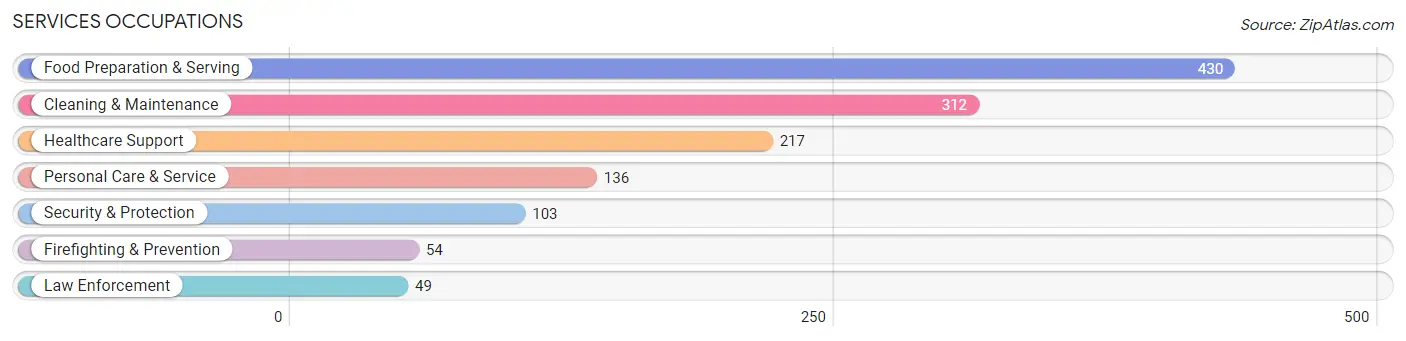
Services Occupations
The most common Services occupations in Piney Green are Food Preparation & Serving (430 | 6.8%), Cleaning & Maintenance (312 | 4.9%), Healthcare Support (217 | 3.4%), Personal Care & Service (136 | 2.1%), and Security & Protection (103 | 1.6%).
Services Occupations by Sex
Within the Services occupations in Piney Green, the most male-oriented occupations are Security & Protection (100.0%), Firefighting & Prevention (100.0%), and Law Enforcement (100.0%), while the most female-oriented occupations are Healthcare Support (100.0%), Food Preparation & Serving (75.1%), and Cleaning & Maintenance (53.5%).
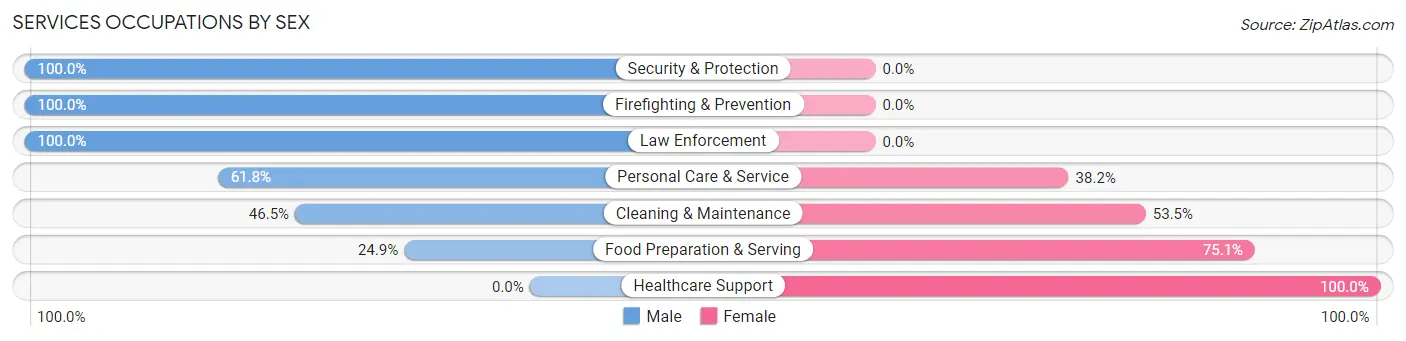
| Occupation | Male | Female |
| Healthcare Support | 0 (0.0%) | 217 (100.0%) |
| Security & Protection | 103 (100.0%) | 0 (0.0%) |
| Firefighting & Prevention | 54 (100.0%) | 0 (0.0%) |
| Law Enforcement | 49 (100.0%) | 0 (0.0%) |
| Food Preparation & Serving | 107 (24.9%) | 323 (75.1%) |
| Cleaning & Maintenance | 145 (46.5%) | 167 (53.5%) |
| Personal Care & Service | 84 (61.8%) | 52 (38.2%) |
| Total (Category) | 439 (36.6%) | 759 (63.4%) |
| Total (Overall) | 3,360 (53.0%) | 2,978 (47.0%) |
Sales and Office Occupations
The most common Sales and Office occupations in Piney Green are Sales & Related (949 | 15.0%), and Office & Administration (577 | 9.1%).

Sales and Office Occupations by Sex
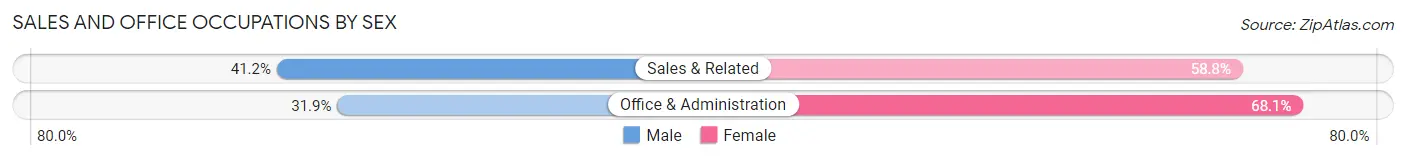
| Occupation | Male | Female |
| Sales & Related | 391 (41.2%) | 558 (58.8%) |
| Office & Administration | 184 (31.9%) | 393 (68.1%) |
| Total (Category) | 575 (37.7%) | 951 (62.3%) |
| Total (Overall) | 3,360 (53.0%) | 2,978 (47.0%) |
Natural Resources, Construction and Maintenance Occupations
The most common Natural Resources, Construction and Maintenance occupations in Piney Green are Construction & Extraction (512 | 8.1%), and Installation, Maintenance & Repair (184 | 2.9%).
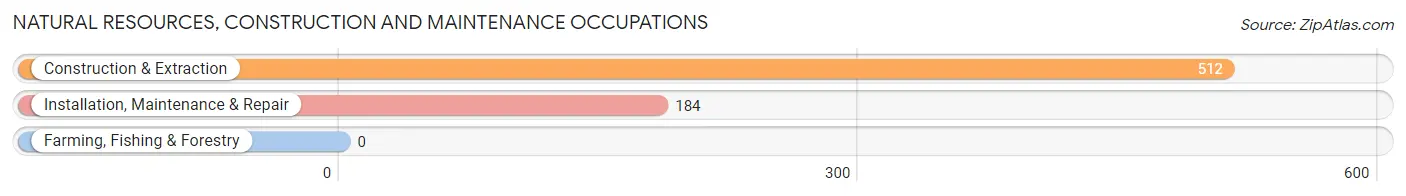
Natural Resources, Construction and Maintenance Occupations by Sex
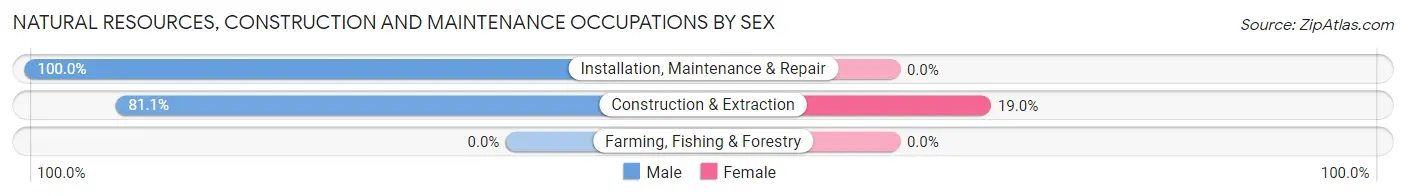
| Occupation | Male | Female |
| Farming, Fishing & Forestry | 0 (0.0%) | 0 (0.0%) |
| Construction & Extraction | 415 (81.0%) | 97 (19.0%) |
| Installation, Maintenance & Repair | 184 (100.0%) | 0 (0.0%) |
| Total (Category) | 599 (86.1%) | 97 (13.9%) |
| Total (Overall) | 3,360 (53.0%) | 2,978 (47.0%) |
Production, Transportation and Moving Occupations
The most common Production, Transportation and Moving occupations in Piney Green are Transportation (464 | 7.3%), Production (373 | 5.9%), and Material Moving (288 | 4.5%).
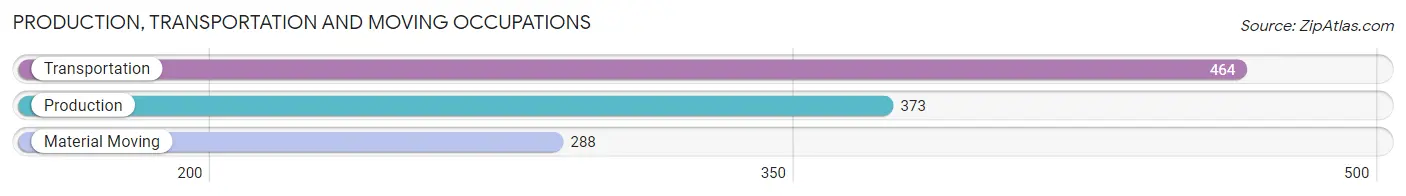
Production, Transportation and Moving Occupations by Sex
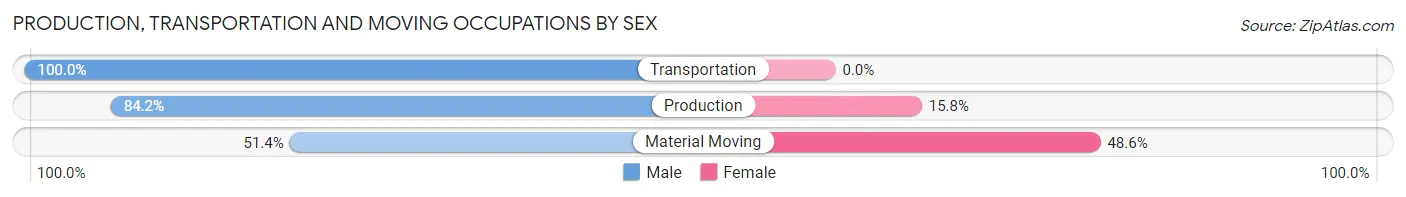
| Occupation | Male | Female |
| Production | 314 (84.2%) | 59 (15.8%) |
| Transportation | 464 (100.0%) | 0 (0.0%) |
| Material Moving | 148 (51.4%) | 140 (48.6%) |
| Total (Category) | 926 (82.3%) | 199 (17.7%) |
| Total (Overall) | 3,360 (53.0%) | 2,978 (47.0%) |
Employment Industries by Sex in Piney Green
Employment Industries in Piney Green
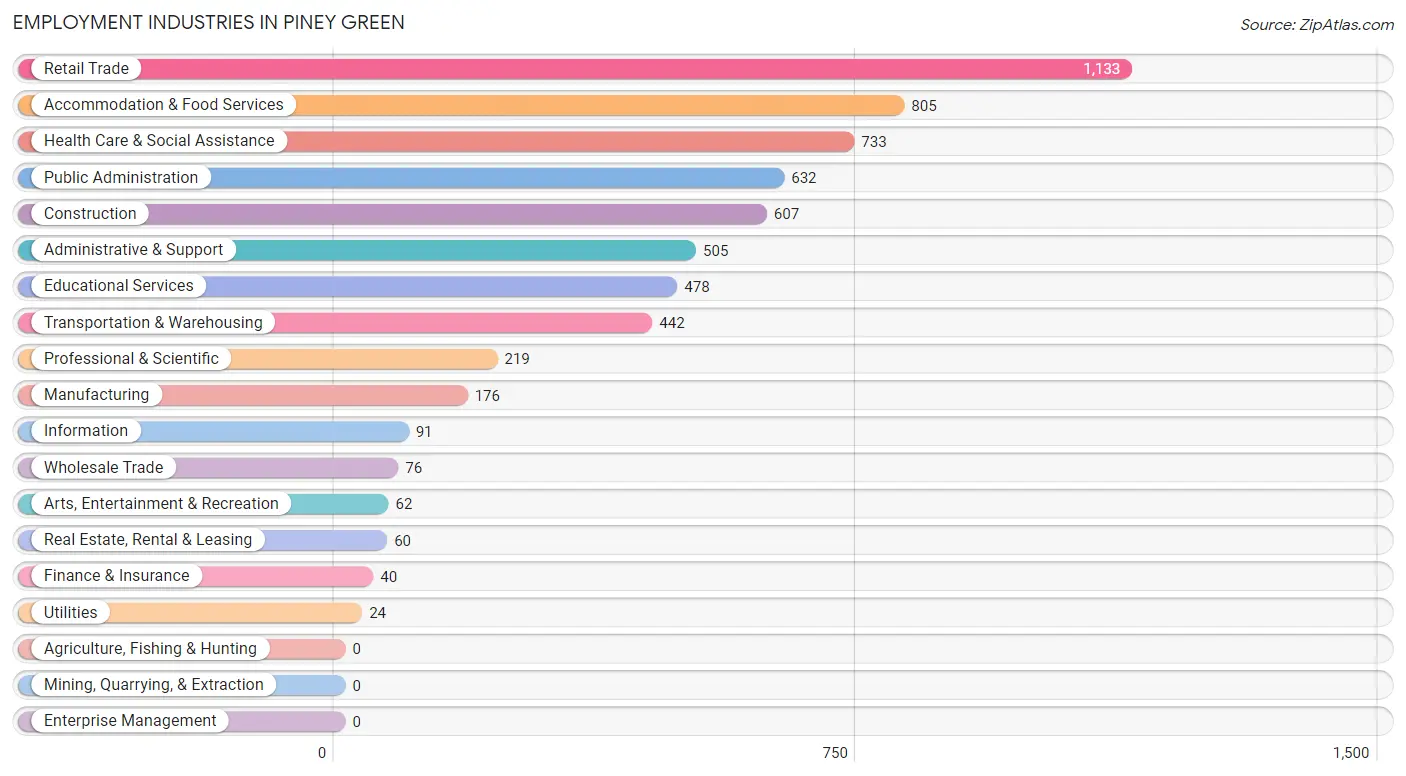
The major employment industries in Piney Green include Retail Trade (1,133 | 17.9%), Accommodation & Food Services (805 | 12.7%), Health Care & Social Assistance (733 | 11.6%), Public Administration (632 | 10.0%), and Construction (607 | 9.6%).
Employment Industries by Sex in Piney Green
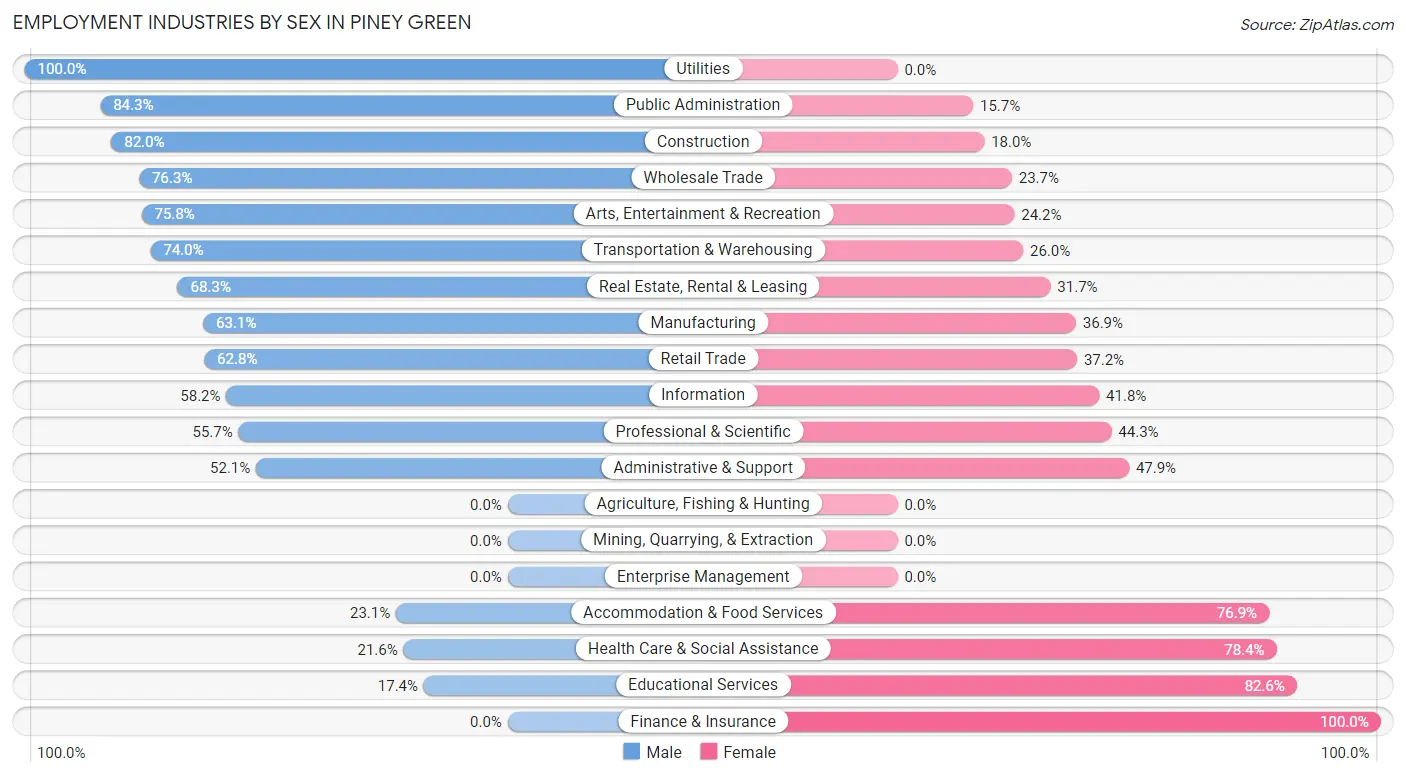
The Piney Green industries that see more men than women are Utilities (100.0%), Public Administration (84.3%), and Construction (82.0%), whereas the industries that tend to have a higher number of women are Finance & Insurance (100.0%), Educational Services (82.6%), and Health Care & Social Assistance (78.4%).
| Industry | Male | Female |
| Agriculture, Fishing & Hunting | 0 (0.0%) | 0 (0.0%) |
| Mining, Quarrying, & Extraction | 0 (0.0%) | 0 (0.0%) |
| Construction | 498 (82.0%) | 109 (18.0%) |
| Manufacturing | 111 (63.1%) | 65 (36.9%) |
| Wholesale Trade | 58 (76.3%) | 18 (23.7%) |
| Retail Trade | 712 (62.8%) | 421 (37.2%) |
| Transportation & Warehousing | 327 (74.0%) | 115 (26.0%) |
| Utilities | 24 (100.0%) | 0 (0.0%) |
| Information | 53 (58.2%) | 38 (41.8%) |
| Finance & Insurance | 0 (0.0%) | 40 (100.0%) |
| Real Estate, Rental & Leasing | 41 (68.3%) | 19 (31.7%) |
| Professional & Scientific | 122 (55.7%) | 97 (44.3%) |
| Enterprise Management | 0 (0.0%) | 0 (0.0%) |
| Administrative & Support | 263 (52.1%) | 242 (47.9%) |
| Educational Services | 83 (17.4%) | 395 (82.6%) |
| Health Care & Social Assistance | 158 (21.6%) | 575 (78.4%) |
| Arts, Entertainment & Recreation | 47 (75.8%) | 15 (24.2%) |
| Accommodation & Food Services | 186 (23.1%) | 619 (76.9%) |
| Public Administration | 533 (84.3%) | 99 (15.7%) |
| Total | 3,360 (53.0%) | 2,978 (47.0%) |
Education in Piney Green
School Enrollment in Piney Green
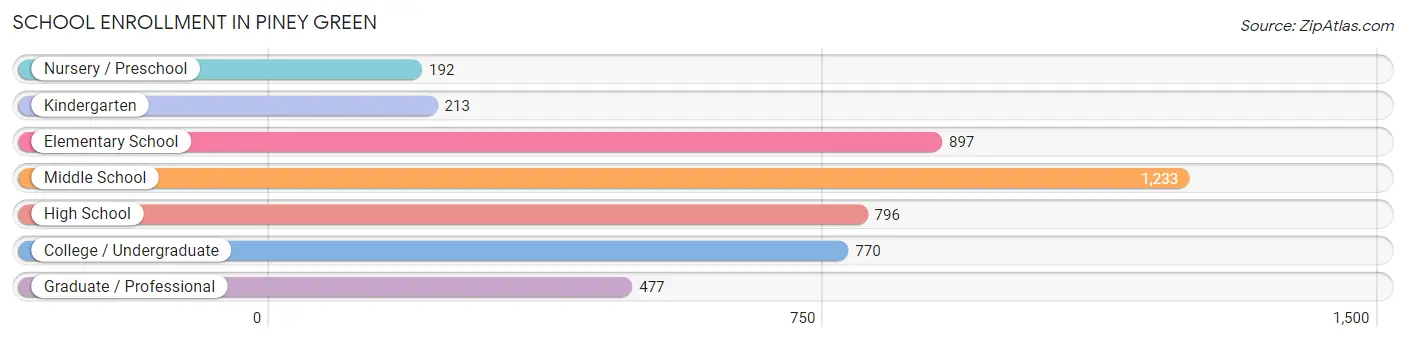
The most common levels of schooling among the 4,578 students in Piney Green are middle school (1,233 | 26.9%), elementary school (897 | 19.6%), and high school (796 | 17.4%).
| School Level | # Students | % Students |
| Nursery / Preschool | 192 | 4.2% |
| Kindergarten | 213 | 4.6% |
| Elementary School | 897 | 19.6% |
| Middle School | 1,233 | 26.9% |
| High School | 796 | 17.4% |
| College / Undergraduate | 770 | 16.8% |
| Graduate / Professional | 477 | 10.4% |
| Total | 4,578 | 100.0% |
School Enrollment by Age by Funding Source in Piney Green
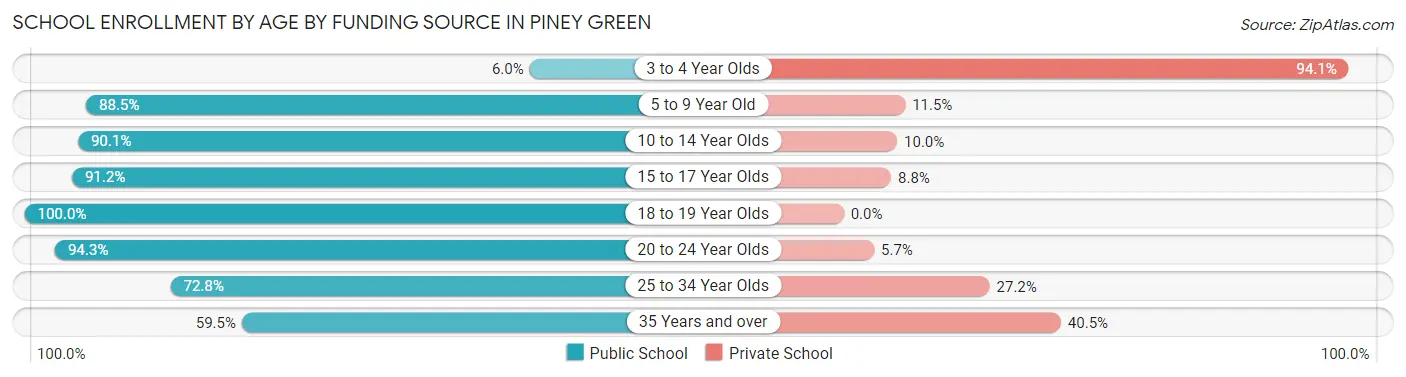
Out of a total of 4,578 students who are enrolled in schools in Piney Green, 710 (15.5%) attend a private institution, while the remaining 3,868 (84.5%) are enrolled in public schools. The age group of 3 to 4 year olds has the highest likelihood of being enrolled in private schools, with 79 (94.1% in the age bracket) enrolled. Conversely, the age group of 18 to 19 year olds has the lowest likelihood of being enrolled in a private school, with 126 (100.0% in the age bracket) attending a public institution.
| Age Bracket | Public School | Private School |
| 3 to 4 Year Olds | 5 (5.9%) | 79 (94.1%) |
| 5 to 9 Year Old | 927 (88.5%) | 120 (11.5%) |
| 10 to 14 Year Olds | 1,358 (90.0%) | 150 (10.0%) |
| 15 to 17 Year Olds | 537 (91.2%) | 52 (8.8%) |
| 18 to 19 Year Olds | 126 (100.0%) | 0 (0.0%) |
| 20 to 24 Year Olds | 366 (94.3%) | 22 (5.7%) |
| 25 to 34 Year Olds | 292 (72.8%) | 109 (27.2%) |
| 35 Years and over | 259 (59.5%) | 176 (40.5%) |
| Total | 3,868 (84.5%) | 710 (15.5%) |
Educational Attainment by Field of Study in Piney Green
Science & technology (453 | 21.5%), arts & humanities (370 | 17.5%), business (328 | 15.6%), social sciences (179 | 8.5%), and computers & mathematics (173 | 8.2%) are the most common fields of study among 2,108 individuals in Piney Green who have obtained a bachelor's degree or higher.
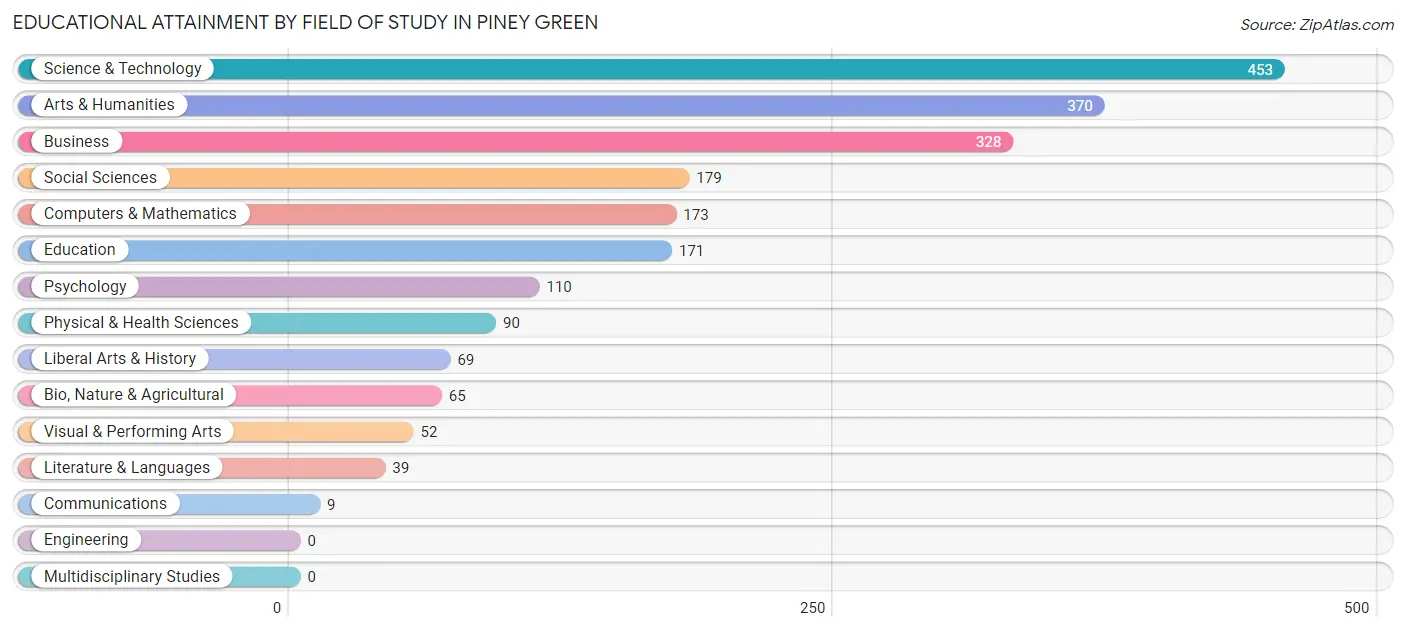
| Field of Study | # Graduates | % Graduates |
| Computers & Mathematics | 173 | 8.2% |
| Bio, Nature & Agricultural | 65 | 3.1% |
| Physical & Health Sciences | 90 | 4.3% |
| Psychology | 110 | 5.2% |
| Social Sciences | 179 | 8.5% |
| Engineering | 0 | 0.0% |
| Multidisciplinary Studies | 0 | 0.0% |
| Science & Technology | 453 | 21.5% |
| Business | 328 | 15.6% |
| Education | 171 | 8.1% |
| Literature & Languages | 39 | 1.8% |
| Liberal Arts & History | 69 | 3.3% |
| Visual & Performing Arts | 52 | 2.5% |
| Communications | 9 | 0.4% |
| Arts & Humanities | 370 | 17.5% |
| Total | 2,108 | 100.0% |
Transportation & Commute in Piney Green
Vehicle Availability by Sex in Piney Green
The most prevalent vehicle ownership categories in Piney Green are males with 2 vehicles (2,110, accounting for 49.7%) and females with 2 vehicles (1,307, making up 70.6%).
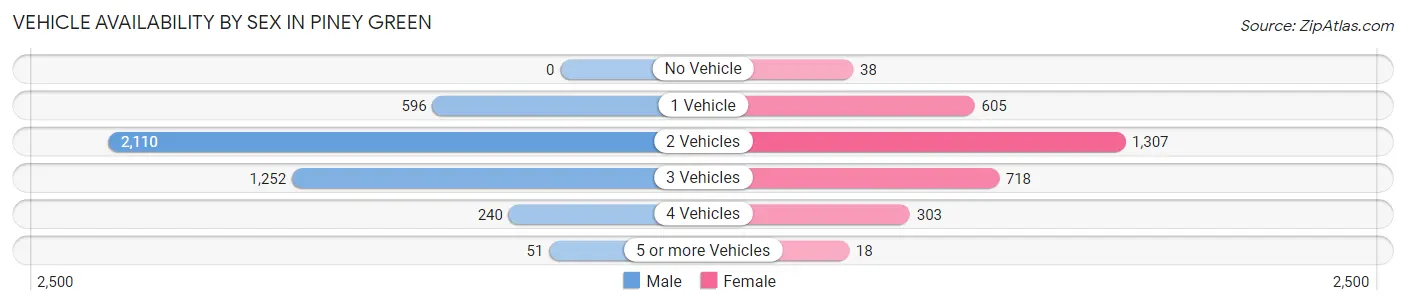
| Vehicles Available | Male | Female |
| No Vehicle | 0 (0.0%) | 38 (1.3%) |
| 1 Vehicle | 596 (14.0%) | 605 (20.2%) |
| 2 Vehicles | 2,110 (49.7%) | 1,307 (43.7%) |
| 3 Vehicles | 1,252 (29.5%) | 718 (24.0%) |
| 4 Vehicles | 240 (5.7%) | 303 (10.1%) |
| 5 or more Vehicles | 51 (1.2%) | 18 (0.6%) |
| Total | 4,249 (100.0%) | 2,989 (100.0%) |
Commute Time in Piney Green
The most frequently occuring commute durations in Piney Green are 20 to 24 minutes (1,862 commuters, 27.9%), 15 to 19 minutes (1,377 commuters, 20.6%), and 10 to 14 minutes (916 commuters, 13.7%).
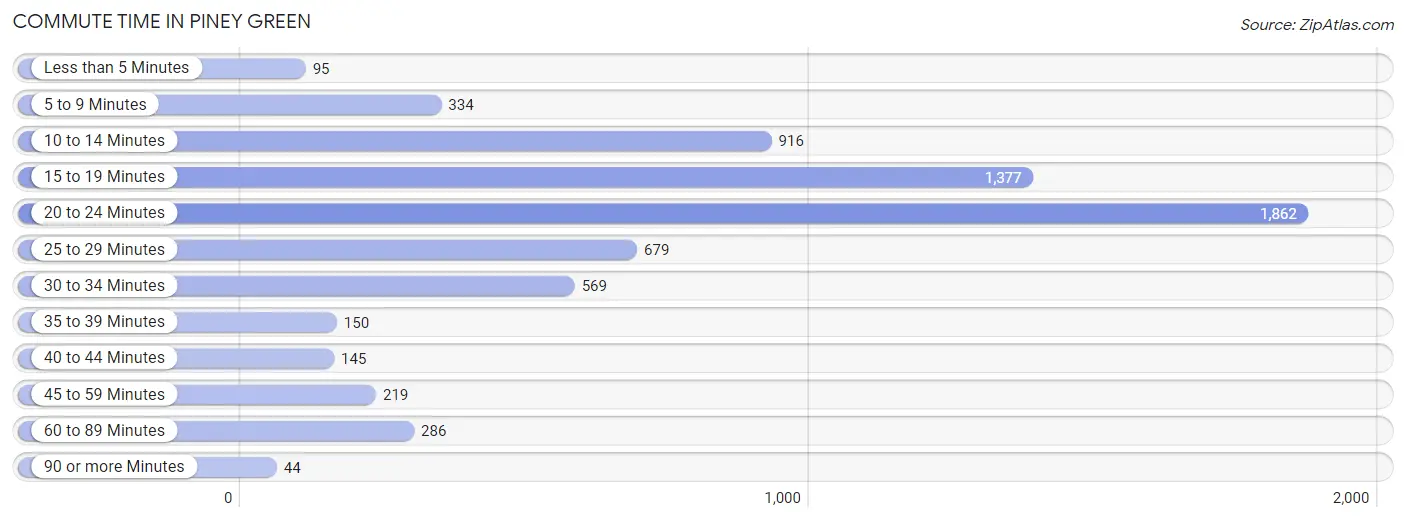
| Commute Time | # Commuters | % Commuters |
| Less than 5 Minutes | 95 | 1.4% |
| 5 to 9 Minutes | 334 | 5.0% |
| 10 to 14 Minutes | 916 | 13.7% |
| 15 to 19 Minutes | 1,377 | 20.6% |
| 20 to 24 Minutes | 1,862 | 27.9% |
| 25 to 29 Minutes | 679 | 10.2% |
| 30 to 34 Minutes | 569 | 8.5% |
| 35 to 39 Minutes | 150 | 2.2% |
| 40 to 44 Minutes | 145 | 2.2% |
| 45 to 59 Minutes | 219 | 3.3% |
| 60 to 89 Minutes | 286 | 4.3% |
| 90 or more Minutes | 44 | 0.7% |
Commute Time by Sex in Piney Green
The most common commute times in Piney Green are 20 to 24 minutes (1,202 commuters, 29.7%) for males and 15 to 19 minutes (761 commuters, 28.9%) for females.
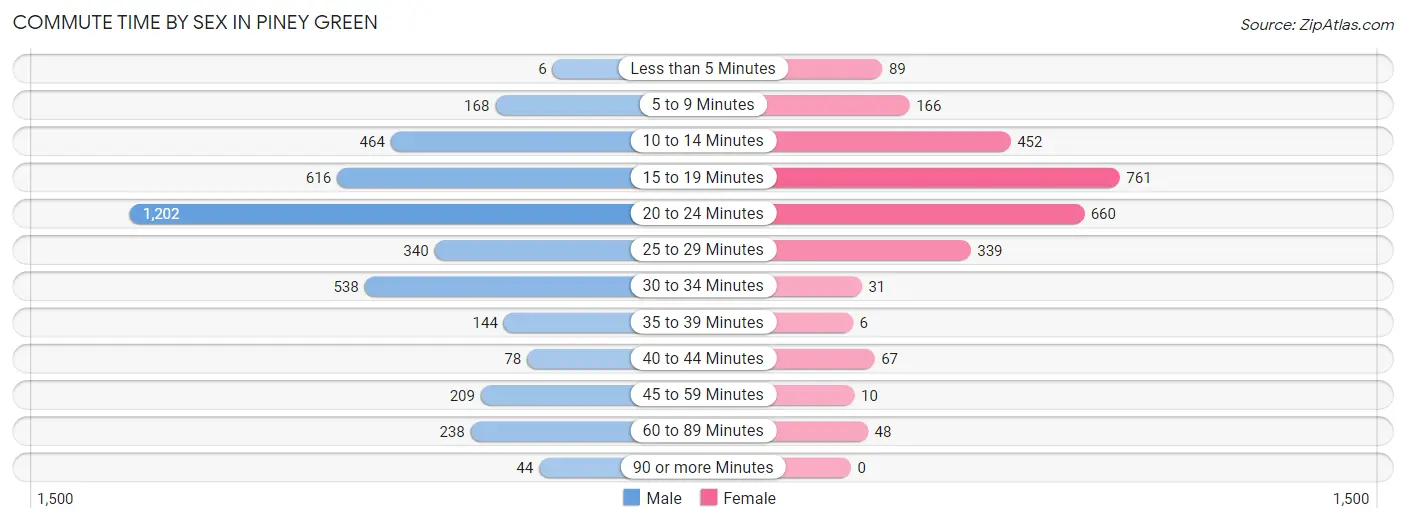
| Commute Time | Male | Female |
| Less than 5 Minutes | 6 (0.2%) | 89 (3.4%) |
| 5 to 9 Minutes | 168 (4.2%) | 166 (6.3%) |
| 10 to 14 Minutes | 464 (11.5%) | 452 (17.2%) |
| 15 to 19 Minutes | 616 (15.2%) | 761 (28.9%) |
| 20 to 24 Minutes | 1,202 (29.7%) | 660 (25.1%) |
| 25 to 29 Minutes | 340 (8.4%) | 339 (12.9%) |
| 30 to 34 Minutes | 538 (13.3%) | 31 (1.2%) |
| 35 to 39 Minutes | 144 (3.6%) | 6 (0.2%) |
| 40 to 44 Minutes | 78 (1.9%) | 67 (2.5%) |
| 45 to 59 Minutes | 209 (5.2%) | 10 (0.4%) |
| 60 to 89 Minutes | 238 (5.9%) | 48 (1.8%) |
| 90 or more Minutes | 44 (1.1%) | 0 (0.0%) |
Time of Departure to Work by Sex in Piney Green
The most frequent times of departure to work in Piney Green are 6:00 AM to 6:29 AM (860, 21.2%) for males and 6:30 AM to 6:59 AM (557, 21.2%) for females.
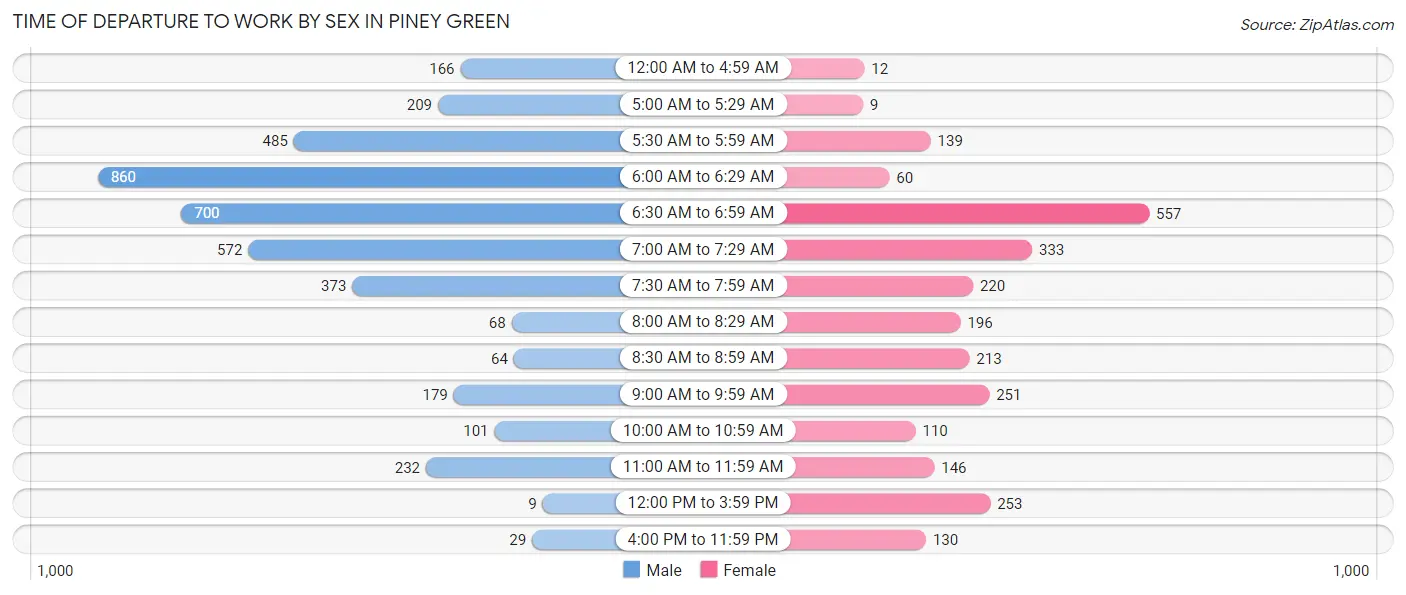
| Time of Departure | Male | Female |
| 12:00 AM to 4:59 AM | 166 (4.1%) | 12 (0.5%) |
| 5:00 AM to 5:29 AM | 209 (5.2%) | 9 (0.3%) |
| 5:30 AM to 5:59 AM | 485 (12.0%) | 139 (5.3%) |
| 6:00 AM to 6:29 AM | 860 (21.2%) | 60 (2.3%) |
| 6:30 AM to 6:59 AM | 700 (17.3%) | 557 (21.2%) |
| 7:00 AM to 7:29 AM | 572 (14.1%) | 333 (12.7%) |
| 7:30 AM to 7:59 AM | 373 (9.2%) | 220 (8.4%) |
| 8:00 AM to 8:29 AM | 68 (1.7%) | 196 (7.5%) |
| 8:30 AM to 8:59 AM | 64 (1.6%) | 213 (8.1%) |
| 9:00 AM to 9:59 AM | 179 (4.4%) | 251 (9.6%) |
| 10:00 AM to 10:59 AM | 101 (2.5%) | 110 (4.2%) |
| 11:00 AM to 11:59 AM | 232 (5.7%) | 146 (5.6%) |
| 12:00 PM to 3:59 PM | 9 (0.2%) | 253 (9.6%) |
| 4:00 PM to 11:59 PM | 29 (0.7%) | 130 (4.9%) |
| Total | 4,047 (100.0%) | 2,629 (100.0%) |
Housing Occupancy in Piney Green
Occupancy by Ownership in Piney Green
Of the total 5,345 dwellings in Piney Green, owner-occupied units account for 3,074 (57.5%), while renter-occupied units make up 2,271 (42.5%).
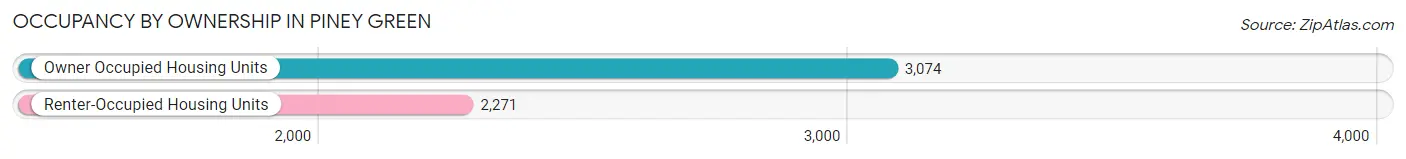
| Occupancy | # Housing Units | % Housing Units |
| Owner Occupied Housing Units | 3,074 | 57.5% |
| Renter-Occupied Housing Units | 2,271 | 42.5% |
| Total Occupied Housing Units | 5,345 | 100.0% |
Occupancy by Household Size in Piney Green
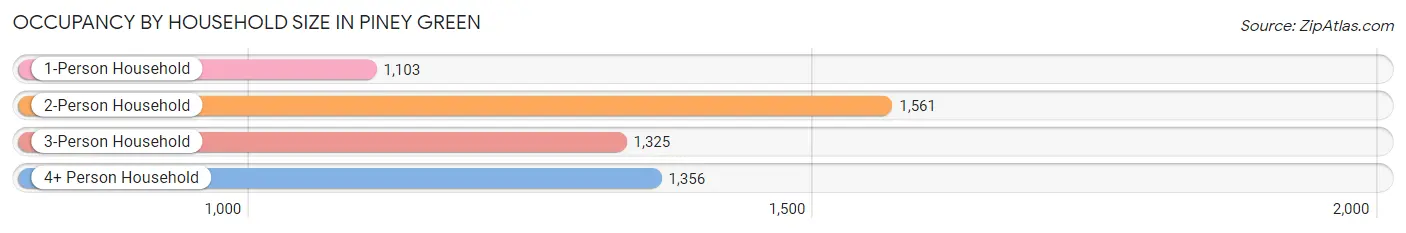
| Household Size | # Housing Units | % Housing Units |
| 1-Person Household | 1,103 | 20.6% |
| 2-Person Household | 1,561 | 29.2% |
| 3-Person Household | 1,325 | 24.8% |
| 4+ Person Household | 1,356 | 25.4% |
| Total Housing Units | 5,345 | 100.0% |
Occupancy by Ownership by Household Size in Piney Green
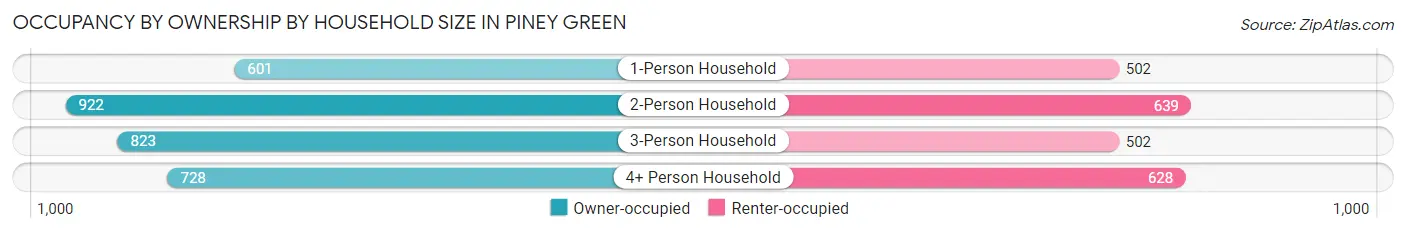
| Household Size | Owner-occupied | Renter-occupied |
| 1-Person Household | 601 (54.5%) | 502 (45.5%) |
| 2-Person Household | 922 (59.1%) | 639 (40.9%) |
| 3-Person Household | 823 (62.1%) | 502 (37.9%) |
| 4+ Person Household | 728 (53.7%) | 628 (46.3%) |
| Total Housing Units | 3,074 (57.5%) | 2,271 (42.5%) |
Occupancy by Educational Attainment in Piney Green
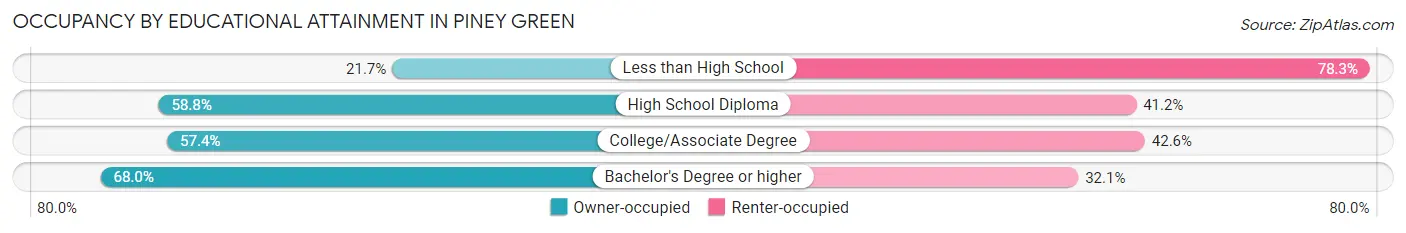
| Household Size | Owner-occupied | Renter-occupied |
| Less than High School | 76 (21.7%) | 274 (78.3%) |
| High School Diploma | 1,174 (58.8%) | 824 (41.2%) |
| College/Associate Degree | 1,154 (57.4%) | 857 (42.6%) |
| Bachelor's Degree or higher | 670 (67.9%) | 316 (32.1%) |
Occupancy by Age of Householder in Piney Green
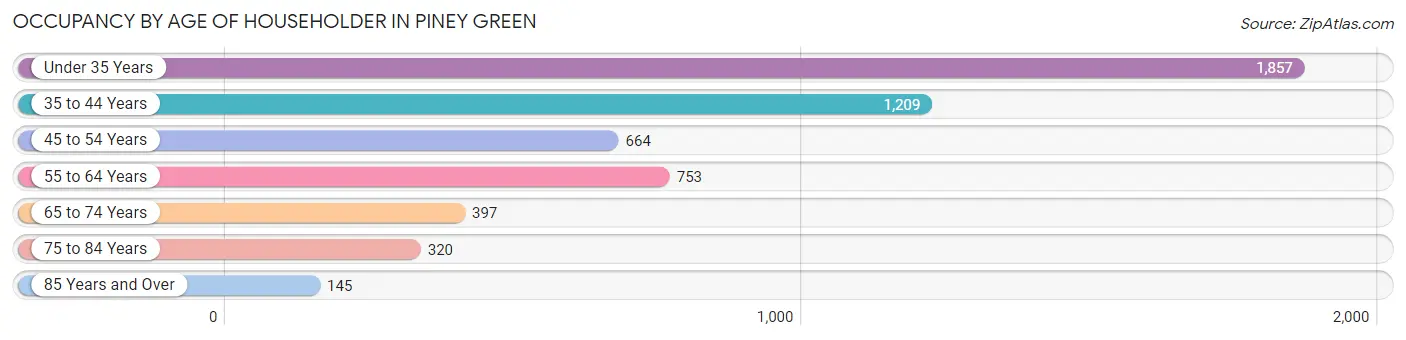
| Age Bracket | # Households | % Households |
| Under 35 Years | 1,857 | 34.7% |
| 35 to 44 Years | 1,209 | 22.6% |
| 45 to 54 Years | 664 | 12.4% |
| 55 to 64 Years | 753 | 14.1% |
| 65 to 74 Years | 397 | 7.4% |
| 75 to 84 Years | 320 | 6.0% |
| 85 Years and Over | 145 | 2.7% |
| Total | 5,345 | 100.0% |
Housing Finances in Piney Green
Median Income by Occupancy in Piney Green
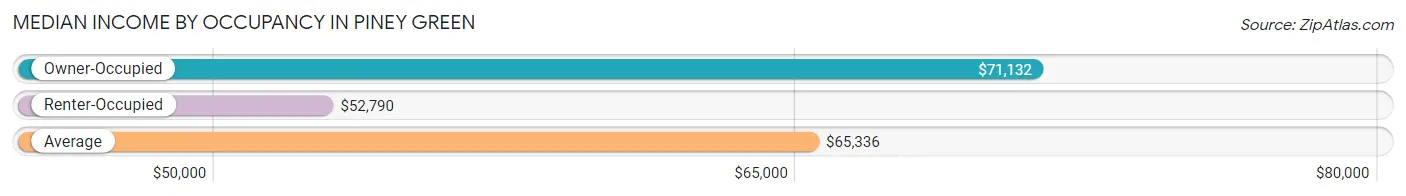
| Occupancy Type | # Households | Median Income |
| Owner-Occupied | 3,074 (57.5%) | $71,132 |
| Renter-Occupied | 2,271 (42.5%) | $52,790 |
| Average | 5,345 (100.0%) | $65,336 |
Occupancy by Householder Income Bracket in Piney Green
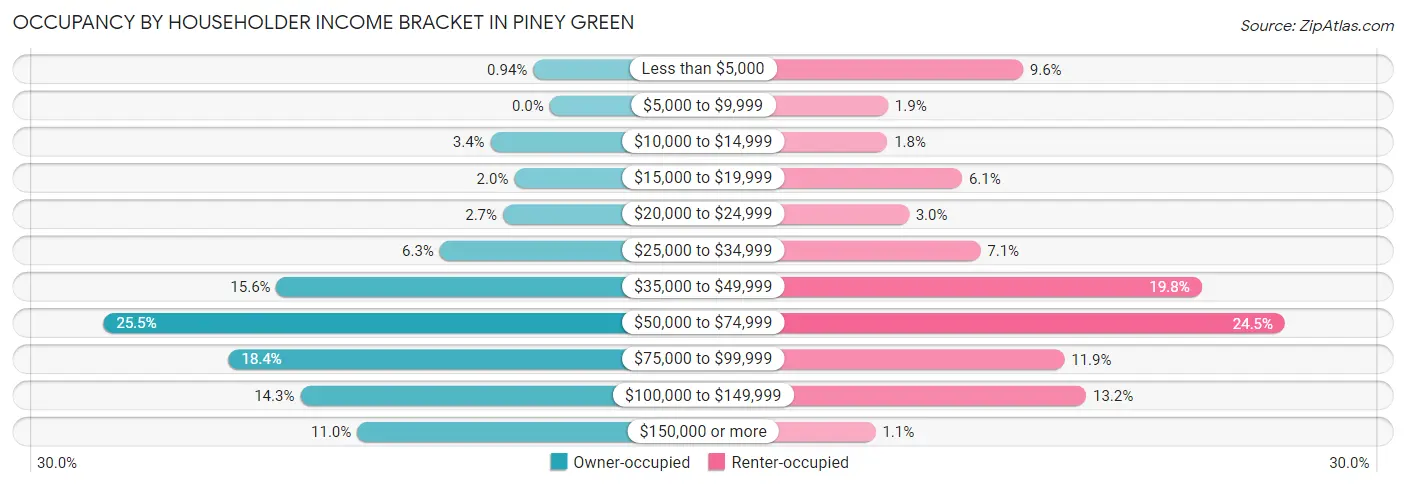
| Income Bracket | Owner-occupied | Renter-occupied |
| Less than $5,000 | 29 (0.9%) | 217 (9.6%) |
| $5,000 to $9,999 | 0 (0.0%) | 42 (1.8%) |
| $10,000 to $14,999 | 104 (3.4%) | 41 (1.8%) |
| $15,000 to $19,999 | 62 (2.0%) | 138 (6.1%) |
| $20,000 to $24,999 | 82 (2.7%) | 69 (3.0%) |
| $25,000 to $34,999 | 193 (6.3%) | 162 (7.1%) |
| $35,000 to $49,999 | 480 (15.6%) | 449 (19.8%) |
| $50,000 to $74,999 | 784 (25.5%) | 557 (24.5%) |
| $75,000 to $99,999 | 564 (18.3%) | 271 (11.9%) |
| $100,000 to $149,999 | 438 (14.2%) | 299 (13.2%) |
| $150,000 or more | 338 (11.0%) | 26 (1.1%) |
| Total | 3,074 (100.0%) | 2,271 (100.0%) |
Monthly Housing Cost Tiers in Piney Green
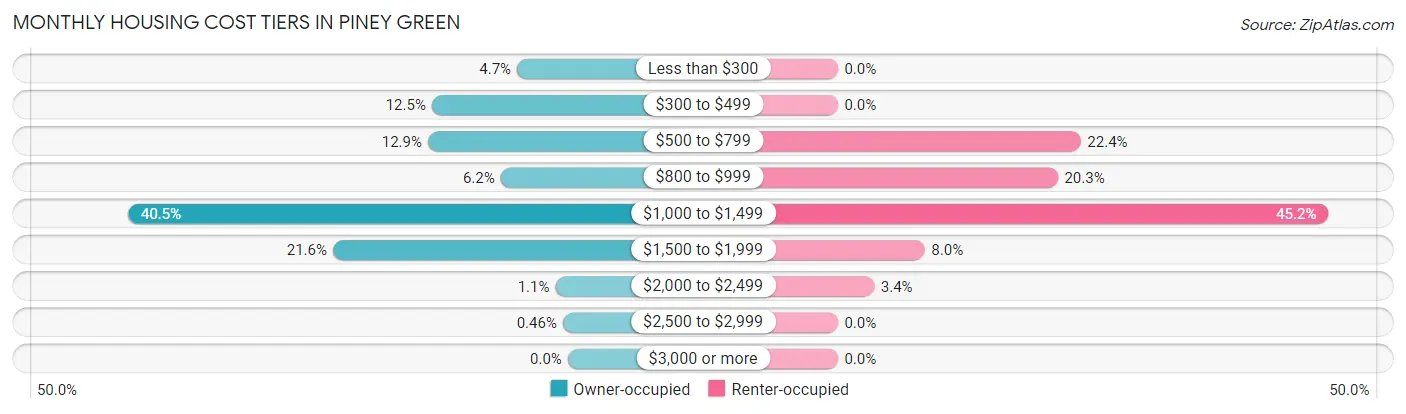
| Monthly Cost | Owner-occupied | Renter-occupied |
| Less than $300 | 144 (4.7%) | 0 (0.0%) |
| $300 to $499 | 385 (12.5%) | 0 (0.0%) |
| $500 to $799 | 396 (12.9%) | 508 (22.4%) |
| $800 to $999 | 190 (6.2%) | 460 (20.3%) |
| $1,000 to $1,499 | 1,245 (40.5%) | 1,026 (45.2%) |
| $1,500 to $1,999 | 665 (21.6%) | 182 (8.0%) |
| $2,000 to $2,499 | 35 (1.1%) | 76 (3.4%) |
| $2,500 to $2,999 | 14 (0.5%) | 0 (0.0%) |
| $3,000 or more | 0 (0.0%) | 0 (0.0%) |
| Total | 3,074 (100.0%) | 2,271 (100.0%) |
Physical Housing Characteristics in Piney Green
Housing Structures in Piney Green
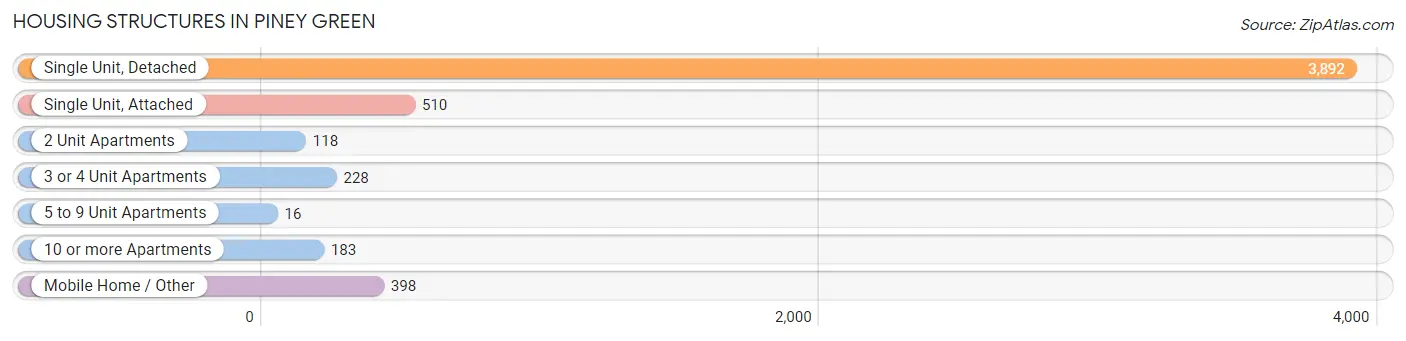
| Structure Type | # Housing Units | % Housing Units |
| Single Unit, Detached | 3,892 | 72.8% |
| Single Unit, Attached | 510 | 9.5% |
| 2 Unit Apartments | 118 | 2.2% |
| 3 or 4 Unit Apartments | 228 | 4.3% |
| 5 to 9 Unit Apartments | 16 | 0.3% |
| 10 or more Apartments | 183 | 3.4% |
| Mobile Home / Other | 398 | 7.4% |
| Total | 5,345 | 100.0% |
Housing Structures by Occupancy in Piney Green
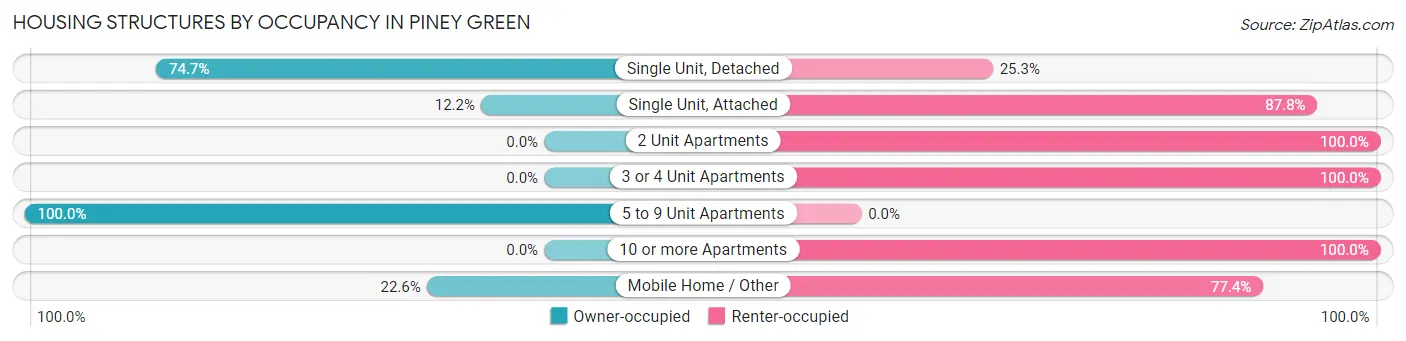
| Structure Type | Owner-occupied | Renter-occupied |
| Single Unit, Detached | 2,906 (74.7%) | 986 (25.3%) |
| Single Unit, Attached | 62 (12.2%) | 448 (87.8%) |
| 2 Unit Apartments | 0 (0.0%) | 118 (100.0%) |
| 3 or 4 Unit Apartments | 0 (0.0%) | 228 (100.0%) |
| 5 to 9 Unit Apartments | 16 (100.0%) | 0 (0.0%) |
| 10 or more Apartments | 0 (0.0%) | 183 (100.0%) |
| Mobile Home / Other | 90 (22.6%) | 308 (77.4%) |
| Total | 3,074 (57.5%) | 2,271 (42.5%) |
Housing Structures by Number of Rooms in Piney Green
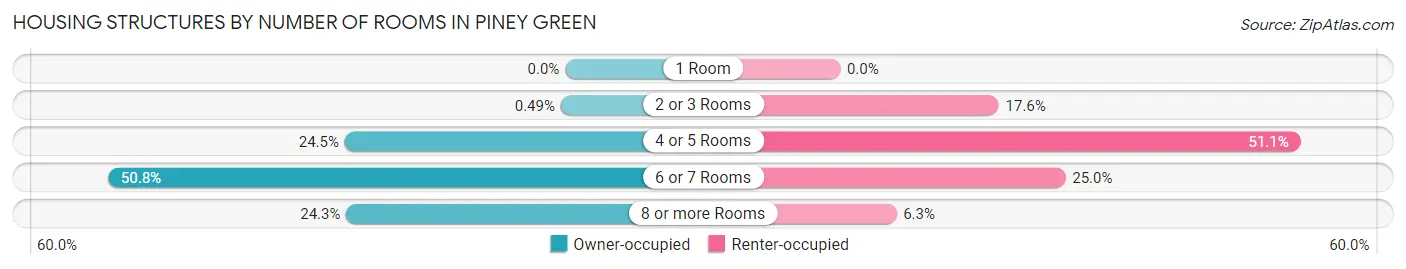
| Number of Rooms | Owner-occupied | Renter-occupied |
| 1 Room | 0 (0.0%) | 0 (0.0%) |
| 2 or 3 Rooms | 15 (0.5%) | 400 (17.6%) |
| 4 or 5 Rooms | 752 (24.5%) | 1,161 (51.1%) |
| 6 or 7 Rooms | 1,560 (50.7%) | 568 (25.0%) |
| 8 or more Rooms | 747 (24.3%) | 142 (6.2%) |
| Total | 3,074 (100.0%) | 2,271 (100.0%) |
Housing Structure by Heating Type in Piney Green
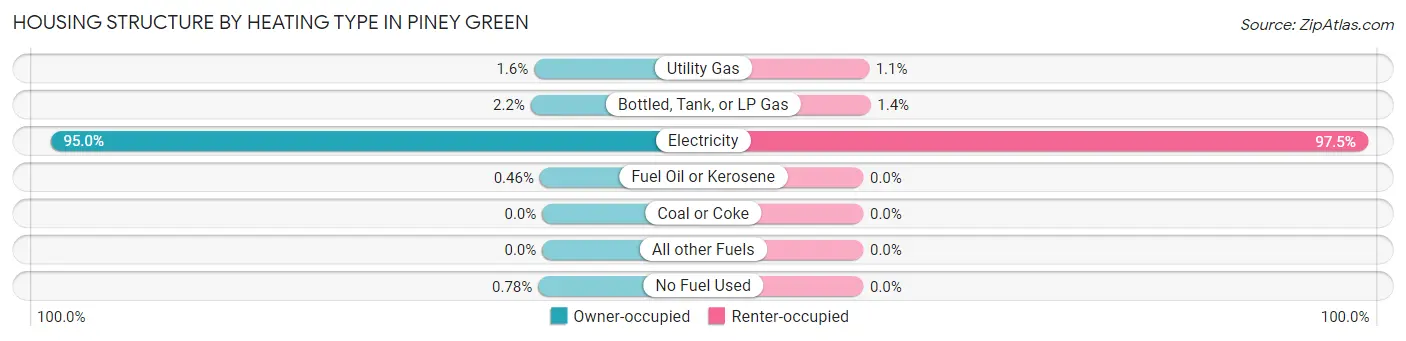
| Heating Type | Owner-occupied | Renter-occupied |
| Utility Gas | 48 (1.6%) | 25 (1.1%) |
| Bottled, Tank, or LP Gas | 68 (2.2%) | 32 (1.4%) |
| Electricity | 2,920 (95.0%) | 2,214 (97.5%) |
| Fuel Oil or Kerosene | 14 (0.5%) | 0 (0.0%) |
| Coal or Coke | 0 (0.0%) | 0 (0.0%) |
| All other Fuels | 0 (0.0%) | 0 (0.0%) |
| No Fuel Used | 24 (0.8%) | 0 (0.0%) |
| Total | 3,074 (100.0%) | 2,271 (100.0%) |
Household Vehicle Usage in Piney Green
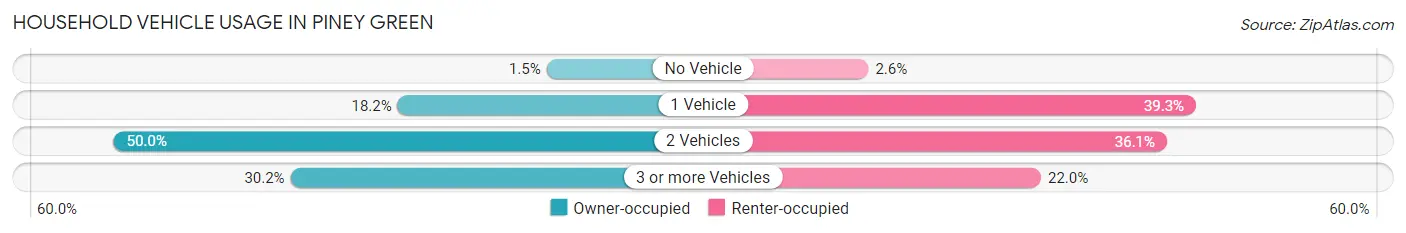
| Vehicles per Household | Owner-occupied | Renter-occupied |
| No Vehicle | 47 (1.5%) | 60 (2.6%) |
| 1 Vehicle | 560 (18.2%) | 893 (39.3%) |
| 2 Vehicles | 1,538 (50.0%) | 819 (36.1%) |
| 3 or more Vehicles | 929 (30.2%) | 499 (22.0%) |
| Total | 3,074 (100.0%) | 2,271 (100.0%) |
Real Estate & Mortgages in Piney Green
Real Estate and Mortgage Overview in Piney Green
| Characteristic | Without Mortgage | With Mortgage |
| Housing Units | 762 | 2,312 |
| Median Property Value | $164,800 | $193,100 |
| Median Household Income | $43,304 | $327 |
| Monthly Housing Costs | $432 | $0 |
| Real Estate Taxes | $918 | $145 |
Property Value by Mortgage Status in Piney Green
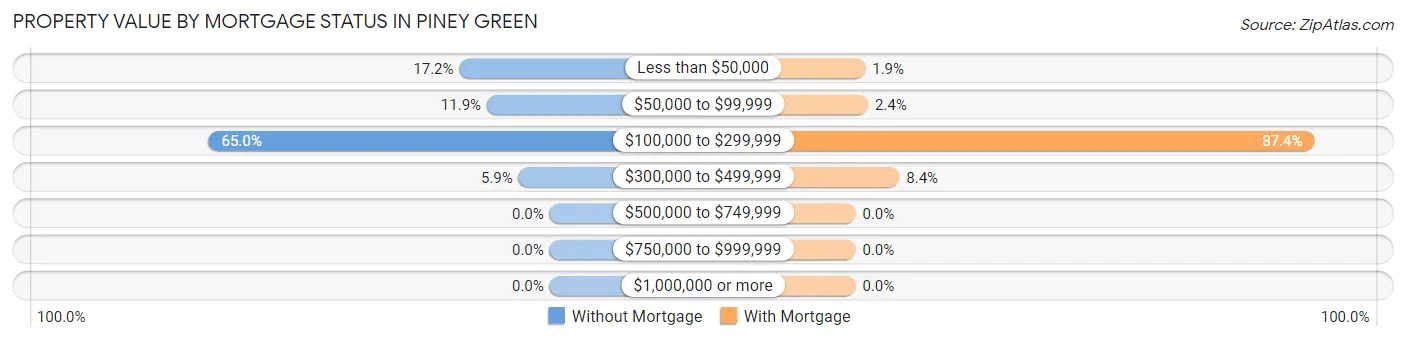
| Property Value | Without Mortgage | With Mortgage |
| Less than $50,000 | 131 (17.2%) | 43 (1.9%) |
| $50,000 to $99,999 | 91 (11.9%) | 55 (2.4%) |
| $100,000 to $299,999 | 495 (65.0%) | 2,021 (87.4%) |
| $300,000 to $499,999 | 45 (5.9%) | 193 (8.4%) |
| $500,000 to $749,999 | 0 (0.0%) | 0 (0.0%) |
| $750,000 to $999,999 | 0 (0.0%) | 0 (0.0%) |
| $1,000,000 or more | 0 (0.0%) | 0 (0.0%) |
| Total | 762 (100.0%) | 2,312 (100.0%) |
Household Income by Mortgage Status in Piney Green
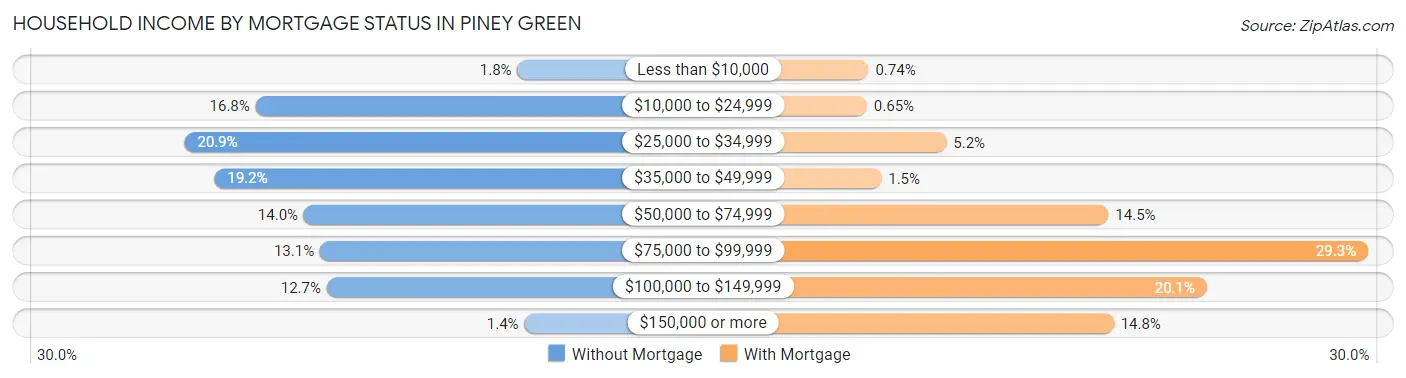
| Household Income | Without Mortgage | With Mortgage |
| Less than $10,000 | 14 (1.8%) | 17 (0.7%) |
| $10,000 to $24,999 | 128 (16.8%) | 15 (0.6%) |
| $25,000 to $34,999 | 159 (20.9%) | 120 (5.2%) |
| $35,000 to $49,999 | 146 (19.2%) | 34 (1.5%) |
| $50,000 to $74,999 | 107 (14.0%) | 334 (14.4%) |
| $75,000 to $99,999 | 100 (13.1%) | 677 (29.3%) |
| $100,000 to $149,999 | 97 (12.7%) | 464 (20.1%) |
| $150,000 or more | 11 (1.4%) | 341 (14.7%) |
| Total | 762 (100.0%) | 2,312 (100.0%) |
Property Value to Household Income Ratio in Piney Green
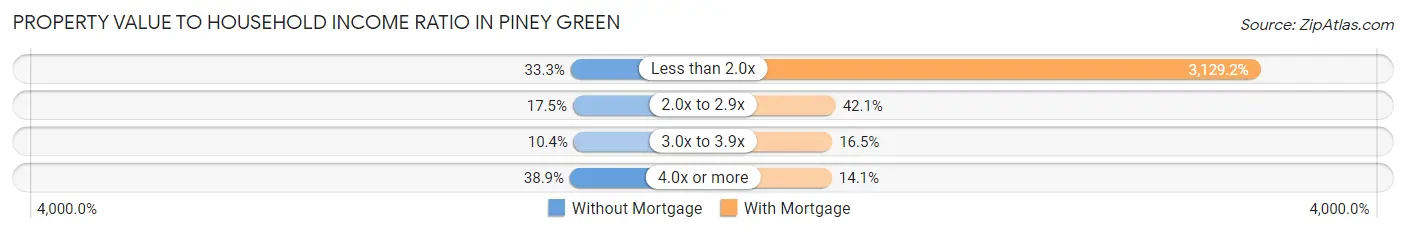
| Value-to-Income Ratio | Without Mortgage | With Mortgage |
| Less than 2.0x | 254 (33.3%) | 72,348 (3,129.2%) |
| 2.0x to 2.9x | 133 (17.4%) | 973 (42.1%) |
| 3.0x to 3.9x | 79 (10.4%) | 381 (16.5%) |
| 4.0x or more | 296 (38.9%) | 327 (14.1%) |
| Total | 762 (100.0%) | 2,312 (100.0%) |
Real Estate Taxes by Mortgage Status in Piney Green
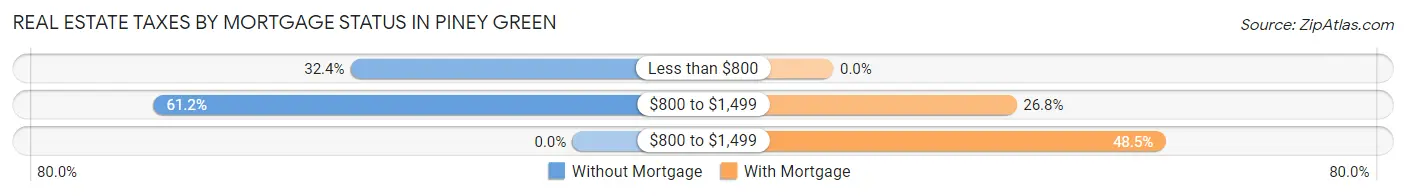
| Property Taxes | Without Mortgage | With Mortgage |
| Less than $800 | 247 (32.4%) | 0 (0.0%) |
| $800 to $1,499 | 466 (61.2%) | 619 (26.8%) |
| $800 to $1,499 | 0 (0.0%) | 1,122 (48.5%) |
| Total | 762 (100.0%) | 2,312 (100.0%) |
Health & Disability in Piney Green
Health Insurance Coverage by Age in Piney Green
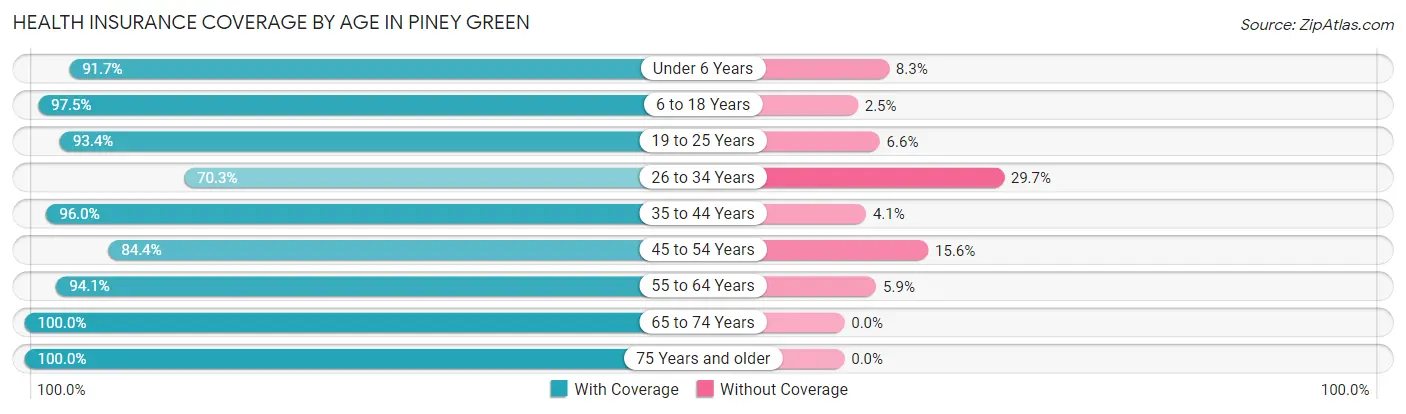
| Age Bracket | With Coverage | Without Coverage |
| Under 6 Years | 848 (91.7%) | 77 (8.3%) |
| 6 to 18 Years | 3,067 (97.5%) | 79 (2.5%) |
| 19 to 25 Years | 1,884 (93.4%) | 133 (6.6%) |
| 26 to 34 Years | 1,167 (70.3%) | 494 (29.7%) |
| 35 to 44 Years | 1,849 (96.0%) | 78 (4.1%) |
| 45 to 54 Years | 1,144 (84.4%) | 212 (15.6%) |
| 55 to 64 Years | 1,141 (94.1%) | 72 (5.9%) |
| 65 to 74 Years | 706 (100.0%) | 0 (0.0%) |
| 75 Years and older | 679 (100.0%) | 0 (0.0%) |
| Total | 12,485 (91.6%) | 1,145 (8.4%) |
Health Insurance Coverage by Citizenship Status in Piney Green
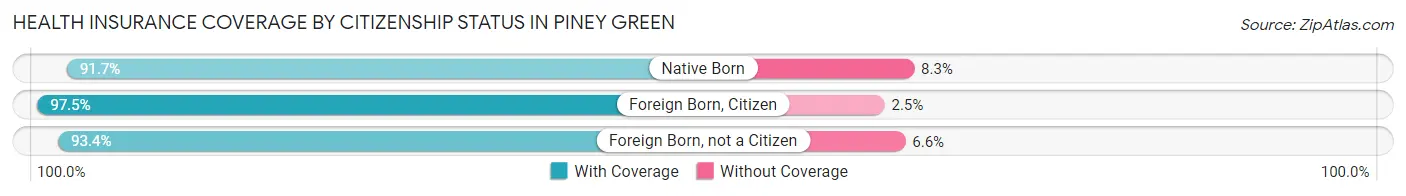
| Citizenship Status | With Coverage | Without Coverage |
| Native Born | 848 (91.7%) | 77 (8.3%) |
| Foreign Born, Citizen | 3,067 (97.5%) | 79 (2.5%) |
| Foreign Born, not a Citizen | 1,884 (93.4%) | 133 (6.6%) |
Health Insurance Coverage by Household Income in Piney Green

| Household Income | With Coverage | Without Coverage |
| Under $25,000 | 1,251 (79.6%) | 321 (20.4%) |
| $25,000 to $49,999 | 2,357 (92.6%) | 187 (7.3%) |
| $50,000 to $74,999 | 2,934 (89.5%) | 344 (10.5%) |
| $75,000 to $99,999 | 2,791 (91.7%) | 251 (8.3%) |
| $100,000 and over | 3,135 (98.7%) | 41 (1.3%) |
Public vs Private Health Insurance Coverage by Age in Piney Green
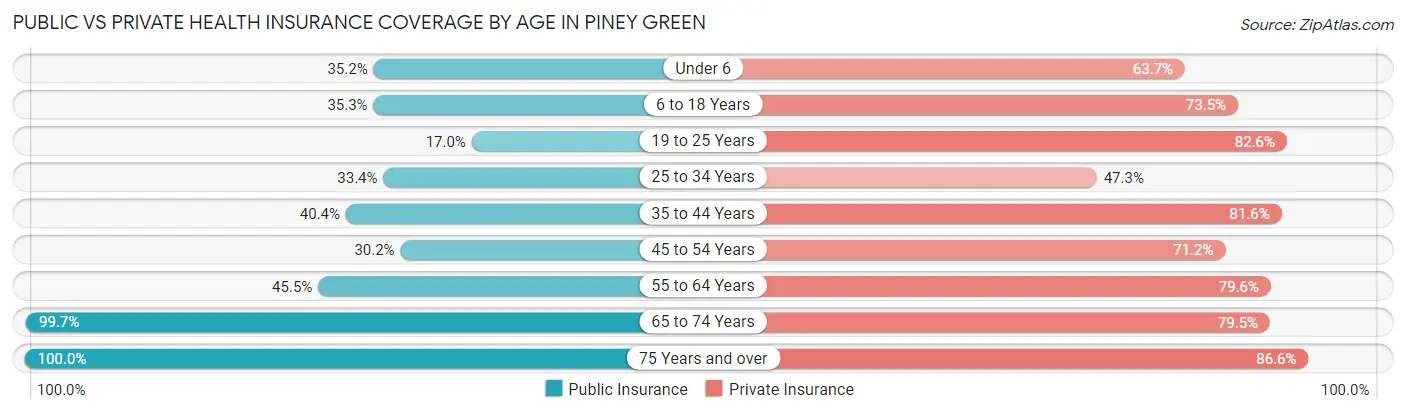
| Age Bracket | Public Insurance | Private Insurance |
| Under 6 | 326 (35.2%) | 589 (63.7%) |
| 6 to 18 Years | 1,109 (35.2%) | 2,313 (73.5%) |
| 19 to 25 Years | 343 (17.0%) | 1,666 (82.6%) |
| 25 to 34 Years | 555 (33.4%) | 786 (47.3%) |
| 35 to 44 Years | 778 (40.4%) | 1,573 (81.6%) |
| 45 to 54 Years | 410 (30.2%) | 965 (71.2%) |
| 55 to 64 Years | 552 (45.5%) | 966 (79.6%) |
| 65 to 74 Years | 704 (99.7%) | 561 (79.5%) |
| 75 Years and over | 679 (100.0%) | 588 (86.6%) |
| Total | 5,456 (40.0%) | 10,007 (73.4%) |
Disability Status by Sex by Age in Piney Green
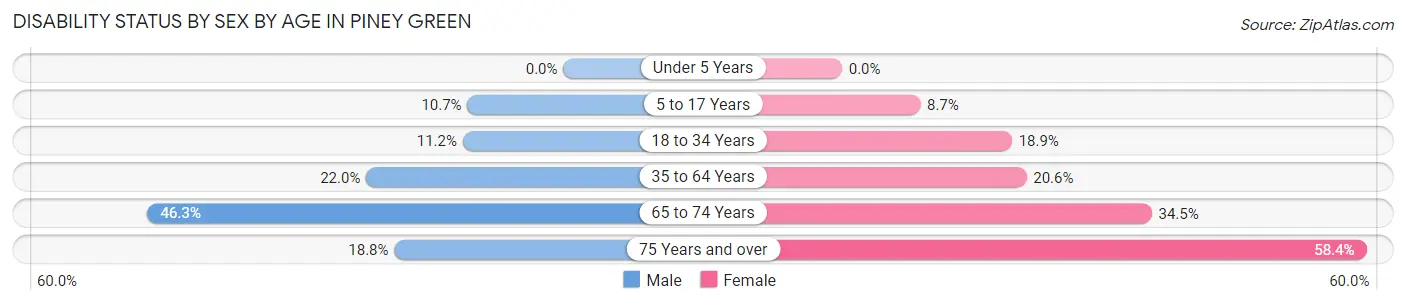
| Age Bracket | Male | Female |
| Under 5 Years | 0 (0.0%) | 0 (0.0%) |
| 5 to 17 Years | 199 (10.7%) | 130 (8.7%) |
| 18 to 34 Years | 232 (11.2%) | 328 (18.9%) |
| 35 to 64 Years | 391 (22.0%) | 558 (20.5%) |
| 65 to 74 Years | 182 (46.3%) | 108 (34.5%) |
| 75 Years and over | 54 (18.8%) | 229 (58.4%) |
Disability Class by Sex by Age in Piney Green
Disability Class: Hearing Difficulty
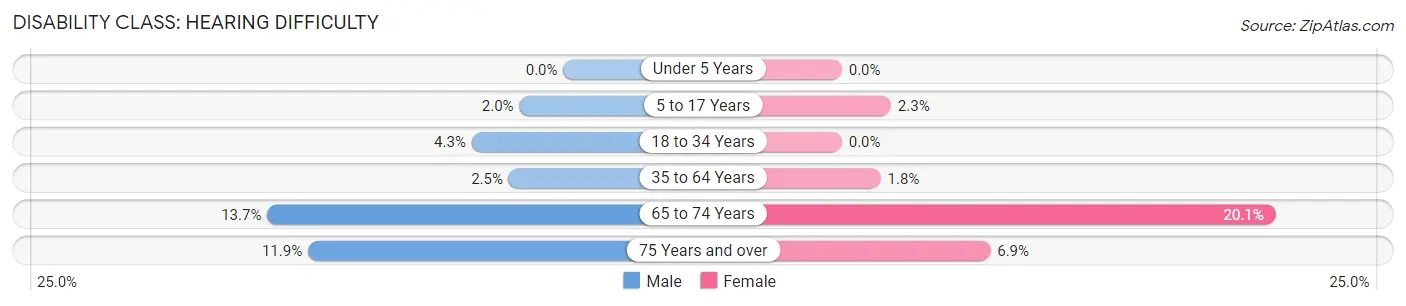
| Age Bracket | Male | Female |
| Under 5 Years | 0 (0.0%) | 0 (0.0%) |
| 5 to 17 Years | 38 (2.0%) | 34 (2.3%) |
| 18 to 34 Years | 88 (4.3%) | 0 (0.0%) |
| 35 to 64 Years | 45 (2.5%) | 49 (1.8%) |
| 65 to 74 Years | 54 (13.7%) | 63 (20.1%) |
| 75 Years and over | 34 (11.8%) | 27 (6.9%) |
Disability Class: Vision Difficulty
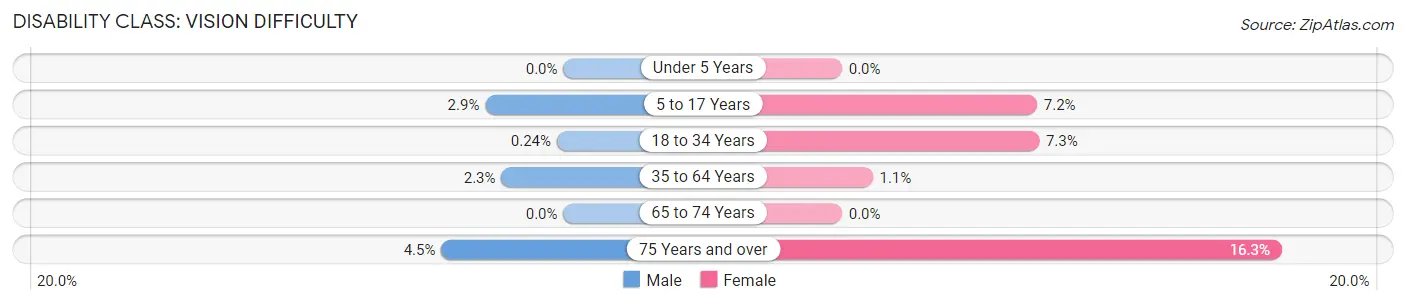
| Age Bracket | Male | Female |
| Under 5 Years | 0 (0.0%) | 0 (0.0%) |
| 5 to 17 Years | 54 (2.9%) | 108 (7.2%) |
| 18 to 34 Years | 5 (0.2%) | 127 (7.3%) |
| 35 to 64 Years | 41 (2.3%) | 31 (1.1%) |
| 65 to 74 Years | 0 (0.0%) | 0 (0.0%) |
| 75 Years and over | 13 (4.5%) | 64 (16.3%) |
Disability Class: Cognitive Difficulty
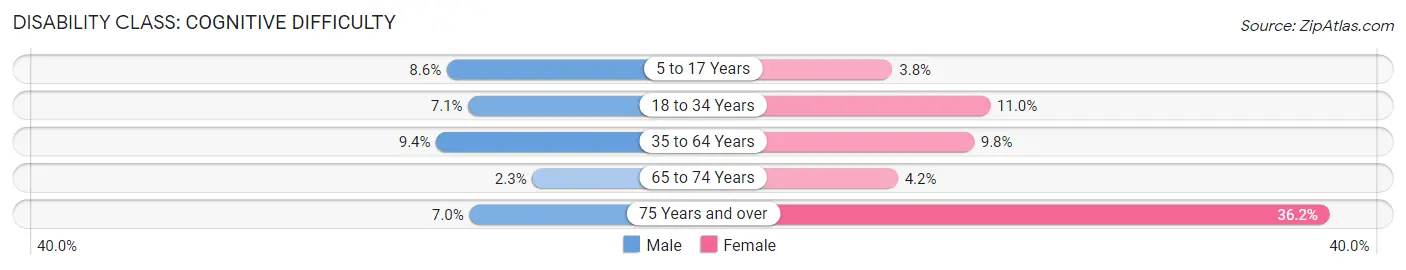
| Age Bracket | Male | Female |
| 5 to 17 Years | 161 (8.6%) | 56 (3.7%) |
| 18 to 34 Years | 146 (7.0%) | 191 (11.0%) |
| 35 to 64 Years | 168 (9.4%) | 266 (9.8%) |
| 65 to 74 Years | 9 (2.3%) | 13 (4.2%) |
| 75 Years and over | 20 (7.0%) | 142 (36.2%) |
Disability Class: Ambulatory Difficulty
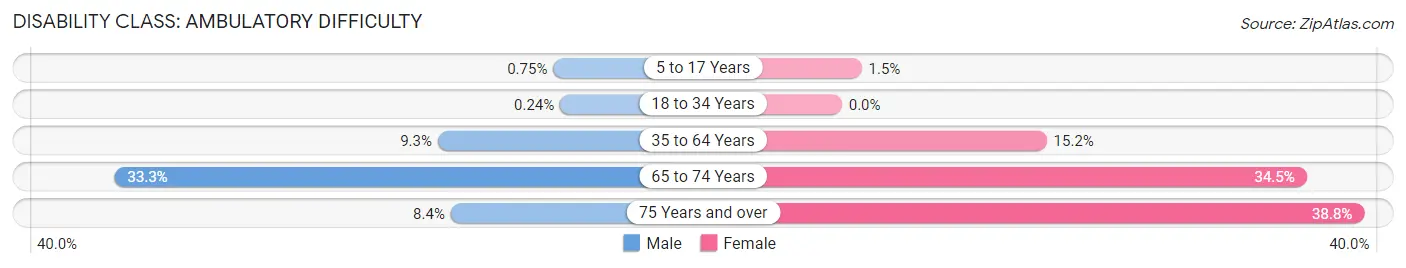
| Age Bracket | Male | Female |
| 5 to 17 Years | 14 (0.7%) | 22 (1.5%) |
| 18 to 34 Years | 5 (0.2%) | 0 (0.0%) |
| 35 to 64 Years | 166 (9.3%) | 413 (15.2%) |
| 65 to 74 Years | 131 (33.3%) | 108 (34.5%) |
| 75 Years and over | 24 (8.4%) | 152 (38.8%) |
Disability Class: Self-Care Difficulty
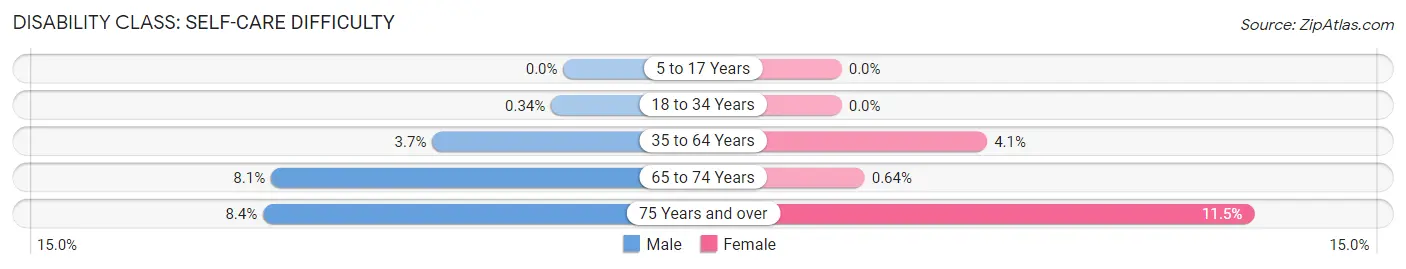
| Age Bracket | Male | Female |
| 5 to 17 Years | 0 (0.0%) | 0 (0.0%) |
| 18 to 34 Years | 7 (0.3%) | 0 (0.0%) |
| 35 to 64 Years | 65 (3.6%) | 110 (4.1%) |
| 65 to 74 Years | 32 (8.1%) | 2 (0.6%) |
| 75 Years and over | 24 (8.4%) | 45 (11.5%) |
Technology Access in Piney Green
Computing Device Access in Piney Green
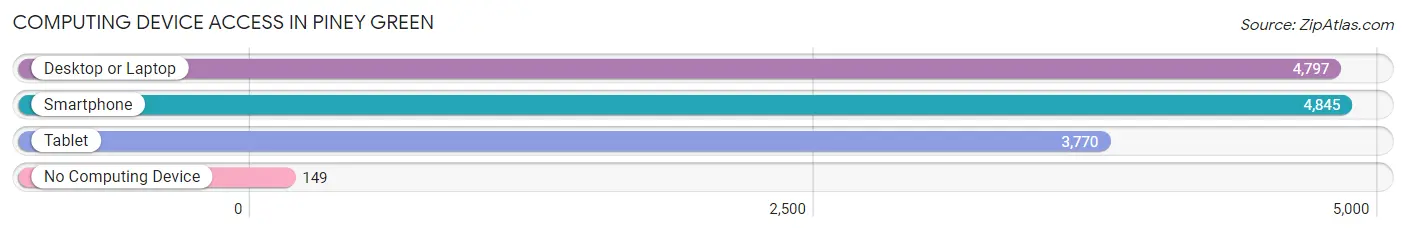
| Device Type | # Households | % Households |
| Desktop or Laptop | 4,797 | 89.7% |
| Smartphone | 4,845 | 90.6% |
| Tablet | 3,770 | 70.5% |
| No Computing Device | 149 | 2.8% |
| Total | 5,345 | 100.0% |
Internet Access in Piney Green
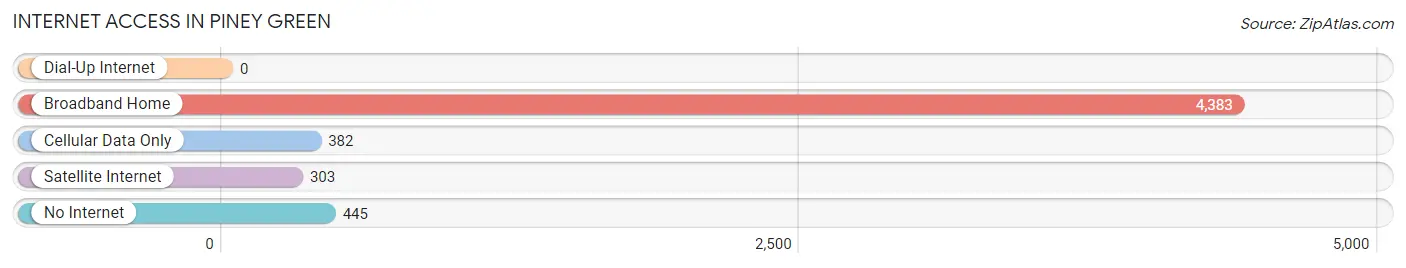
| Internet Type | # Households | % Households |
| Dial-Up Internet | 0 | 0.0% |
| Broadband Home | 4,383 | 82.0% |
| Cellular Data Only | 382 | 7.1% |
| Satellite Internet | 303 | 5.7% |
| No Internet | 445 | 8.3% |
| Total | 5,345 | 100.0% |
Piney Green Summary
Piney Green is an unincorporated community located in Onslow County, North Carolina. It is situated along the banks of the New River, approximately 15 miles north of Jacksonville. The community is home to a variety of businesses, including a post office, a convenience store, a gas station, and a few restaurants.
Geography
Piney Green is located in Onslow County, North Carolina, approximately 15 miles north of Jacksonville. The community is situated along the banks of the New River, which is a tributary of the White Oak River. The area is mostly flat, with some rolling hills and small valleys. The soil is sandy and loamy, and the climate is humid subtropical.
Economy
Piney Green is primarily a residential community, but it does have a few businesses. These include a post office, a convenience store, a gas station, and a few restaurants. The community is also home to a number of small farms, which produce a variety of crops, including corn, soybeans, and tobacco.
Demographics
As of the 2010 census, the population of Piney Green was 1,845. The racial makeup of the community was 79.3% White, 15.2% African American, 0.7% Native American, 0.7% Asian, and 3.9% from other races. The median household income was $37,917, and the median family income was $45,917.
History
Piney Green was first settled in the early 1800s by a group of settlers from Scotland. The community was named after the abundance of pine trees in the area. In the late 1800s, the community was home to a number of small farms, which produced a variety of crops, including corn, soybeans, and tobacco.
In the early 1900s, the community began to grow and develop. The first post office was established in 1906, and the first school was built in 1910. The community continued to grow throughout the 20th century, and today it is a thriving residential community.
Conclusion
Piney Green is an unincorporated community located in Onslow County, North Carolina. It is situated along the banks of the New River, approximately 15 miles north of Jacksonville. The community is home to a variety of businesses, including a post office, a convenience store, a gas station, and a few restaurants. The population of Piney Green was 1,845 as of the 2010 census, and the median household income was $37,917. The community was first settled in the early 1800s by a group of settlers from Scotland, and it has continued to grow and develop throughout the 20th century.
Common Questions
What is Per Capita Income in Piney Green?
Per Capita income in Piney Green is $27,147.
What is the Median Family Income in Piney Green?
Median Family Income in Piney Green is $69,206.
What is the Median Household income in Piney Green?
Median Household Income in Piney Green is $65,336.
What is Income or Wage Gap in Piney Green?
Income or Wage Gap in Piney Green is 43.3%.
Women in Piney Green earn 56.7 cents for every dollar earned by a man.
What is Family Income Deficit in Piney Green?
Family Income Deficit in Piney Green is $9,926.
Families that are below poverty line in Piney Green earn $9,926 less on average than the poverty threshold level.
What is Inequality or Gini Index in Piney Green?
Inequality or Gini Index in Piney Green is 0.41.
What is the Total Population of Piney Green?
Total Population of Piney Green is 14,767.
What is the Total Male Population of Piney Green?
Total Male Population of Piney Green is 7,701.
What is the Total Female Population of Piney Green?
Total Female Population of Piney Green is 7,066.
What is the Ratio of Males per 100 Females in Piney Green?
There are 108.99 Males per 100 Females in Piney Green.
What is the Ratio of Females per 100 Males in Piney Green?
There are 91.75 Females per 100 Males in Piney Green.
What is the Median Population Age in Piney Green?
Median Population Age in Piney Green is 29.5 Years.
What is the Average Family Size in Piney Green
Average Family Size in Piney Green is 3.2 People.
What is the Average Household Size in Piney Green
Average Household Size in Piney Green is 2.8 People.
How Large is the Labor Force in Piney Green?
There are 7,968 People in the Labor Forcein in Piney Green.
What is the Percentage of People in the Labor Force in Piney Green?
71.3% of People are in the Labor Force in Piney Green.
What is the Unemployment Rate in Piney Green?
Unemployment Rate in Piney Green is 7.2%.