Ewa Villages, HI Map & Demographics
Ewa Villages Map
Ewa Villages Overview
$26,392
PER CAPITA INCOME
$95,078
AVG FAMILY INCOME
$82,903
AVG HOUSEHOLD INCOME
18.7%
WAGE / INCOME GAP [ % ]
81.3¢/ $1
WAGE / INCOME GAP [ $ ]
0.43
INEQUALITY / GINI INDEX
6,550
TOTAL POPULATION
3,344
MALE POPULATION
3,206
FEMALE POPULATION
104.30
MALES / 100 FEMALES
95.87
FEMALES / 100 MALES
37.8
MEDIAN AGE
4.5
AVG FAMILY SIZE
3.7
AVG HOUSEHOLD SIZE
3,117
LABOR FORCE [ PEOPLE ]
63.9%
PERCENT IN LABOR FORCE
1.3%
UNEMPLOYMENT RATE
Income in Ewa Villages
Income Overview in Ewa Villages
Per Capita Income in Ewa Villages is $26,392, while median incomes of families and households are $95,078 and $82,903 respectively.
| Characteristic | Number | Measure |
| Per Capita Income | 6,550 | $26,392 |
| Median Family Income | 1,303 | $95,078 |
| Mean Family Income | 1,303 | $104,766 |
| Median Household Income | 1,756 | $82,903 |
| Mean Household Income | 1,756 | $92,069 |
| Income Deficit | 1,303 | $0 |
| Wage / Income Gap (%) | 6,550 | 18.74% |
| Wage / Income Gap ($) | 6,550 | 81.26¢ per $1 |
| Gini / Inequality Index | 6,550 | 0.43 |
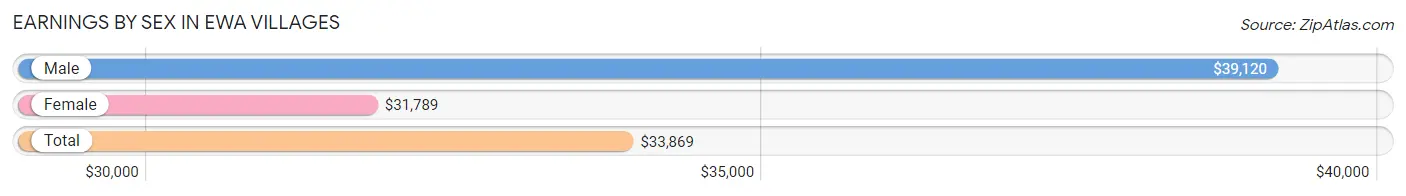
Earnings by Sex in Ewa Villages
Average Earnings in Ewa Villages are $33,869, $39,120 for men and $31,789 for women, a difference of 18.7%.
| Sex | Number | Average Earnings |
| Male | 1,536 (47.7%) | $39,120 |
| Female | 1,683 (52.3%) | $31,789 |
| Total | 3,219 (100.0%) | $33,869 |
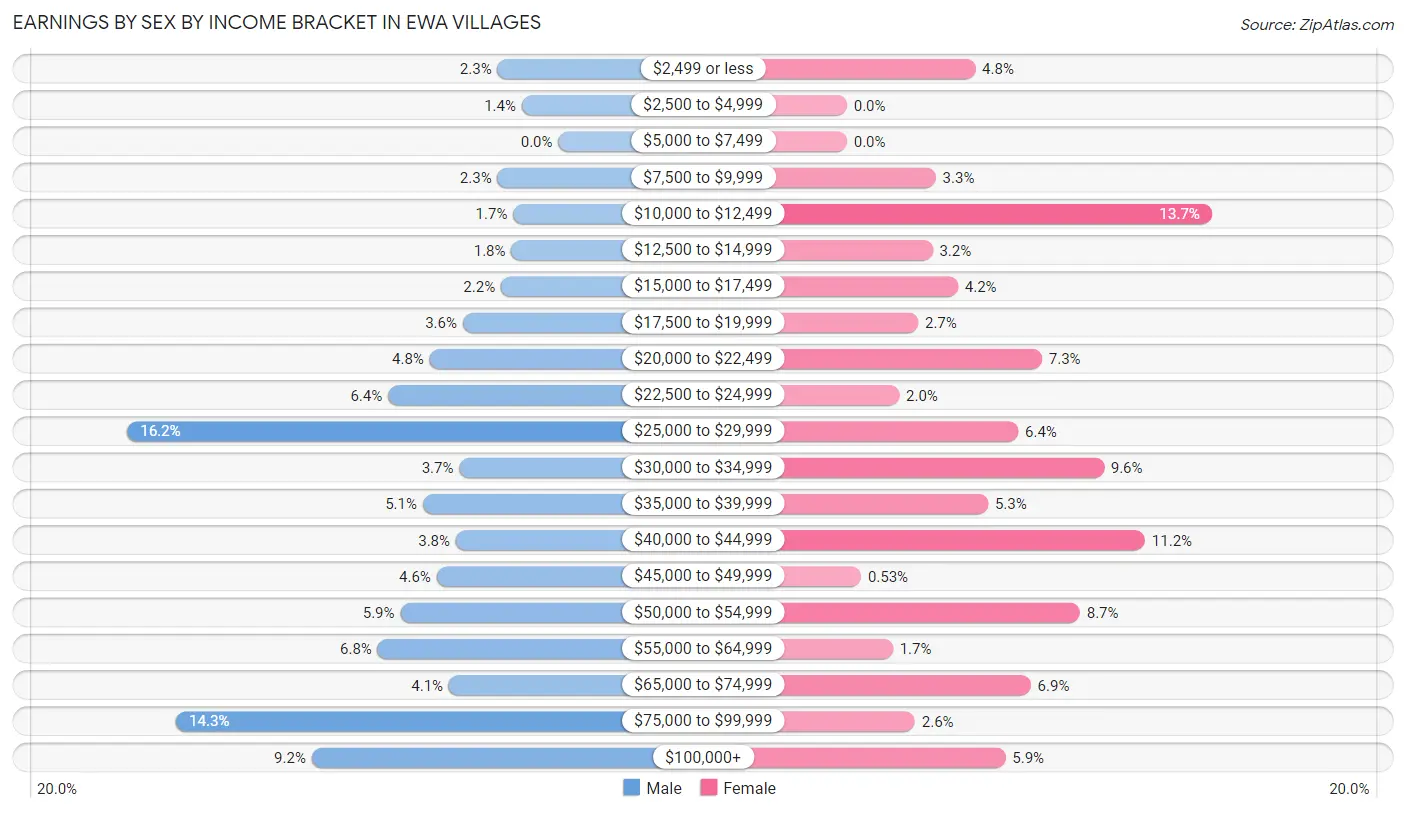
Earnings by Sex by Income Bracket in Ewa Villages
The most common earnings brackets in Ewa Villages are $25,000 to $29,999 for men (248 | 16.2%) and $10,000 to $12,499 for women (230 | 13.7%).
| Income | Male | Female |
| $2,499 or less | 35 (2.3%) | 81 (4.8%) |
| $2,500 to $4,999 | 21 (1.4%) | 0 (0.0%) |
| $5,000 to $7,499 | 0 (0.0%) | 0 (0.0%) |
| $7,500 to $9,999 | 35 (2.3%) | 56 (3.3%) |
| $10,000 to $12,499 | 26 (1.7%) | 230 (13.7%) |
| $12,500 to $14,999 | 27 (1.8%) | 54 (3.2%) |
| $15,000 to $17,499 | 33 (2.1%) | 70 (4.2%) |
| $17,500 to $19,999 | 55 (3.6%) | 45 (2.7%) |
| $20,000 to $22,499 | 74 (4.8%) | 123 (7.3%) |
| $22,500 to $24,999 | 98 (6.4%) | 33 (2.0%) |
| $25,000 to $29,999 | 248 (16.2%) | 108 (6.4%) |
| $30,000 to $34,999 | 57 (3.7%) | 162 (9.6%) |
| $35,000 to $39,999 | 78 (5.1%) | 89 (5.3%) |
| $40,000 to $44,999 | 59 (3.8%) | 188 (11.2%) |
| $45,000 to $49,999 | 70 (4.6%) | 9 (0.5%) |
| $50,000 to $54,999 | 91 (5.9%) | 147 (8.7%) |
| $55,000 to $64,999 | 104 (6.8%) | 29 (1.7%) |
| $65,000 to $74,999 | 63 (4.1%) | 116 (6.9%) |
| $75,000 to $99,999 | 220 (14.3%) | 43 (2.5%) |
| $100,000+ | 142 (9.2%) | 100 (5.9%) |
| Total | 1,536 (100.0%) | 1,683 (100.0%) |
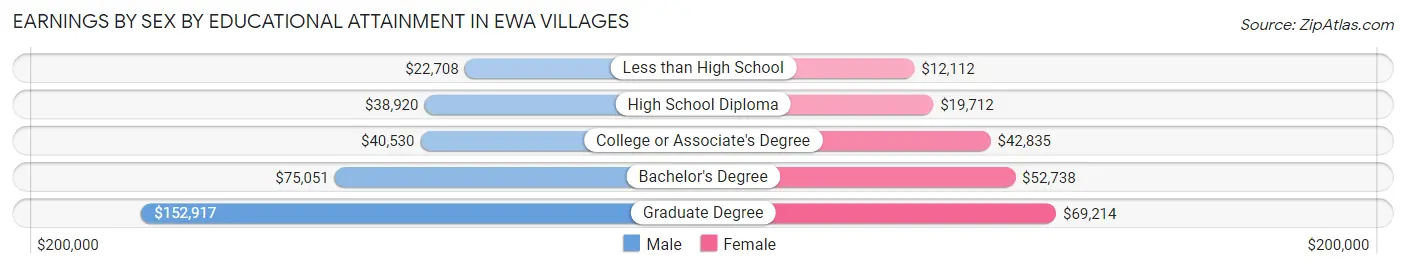
Earnings by Sex by Educational Attainment in Ewa Villages
Average earnings in Ewa Villages are $47,174 for men and $35,093 for women, a difference of 25.6%. Men with an educational attainment of graduate degree enjoy the highest average annual earnings of $152,917, while those with less than high school education earn the least with $22,708. Women with an educational attainment of graduate degree earn the most with the average annual earnings of $69,214, while those with less than high school education have the smallest earnings of $12,112.
| Educational Attainment | Male Income | Female Income |
| Less than High School | $22,708 | $12,112 |
| High School Diploma | $38,920 | $19,712 |
| College or Associate's Degree | $40,530 | $42,835 |
| Bachelor's Degree | $75,051 | $52,738 |
| Graduate Degree | $152,917 | $69,214 |
| Total | $47,174 | $35,093 |
Family Income in Ewa Villages
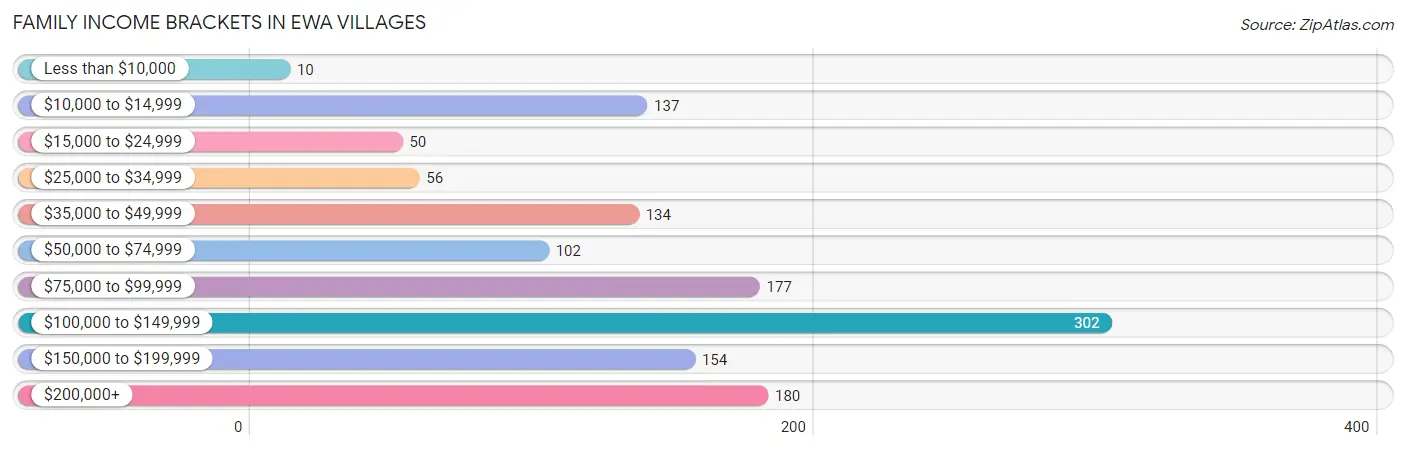
Family Income Brackets in Ewa Villages
According to the Ewa Villages family income data, there are 302 families falling into the $100,000 to $149,999 income range, which is the most common income bracket and makes up 23.2% of all families. Conversely, the less than $10,000 income bracket is the least frequent group with only 10 families (0.8%) belonging to this category.
| Income Bracket | # Families | % Families |
| Less than $10,000 | 10 | 0.8% |
| $10,000 to $14,999 | 137 | 10.5% |
| $15,000 to $24,999 | 50 | 3.8% |
| $25,000 to $34,999 | 56 | 4.3% |
| $35,000 to $49,999 | 134 | 10.3% |
| $50,000 to $74,999 | 102 | 7.8% |
| $75,000 to $99,999 | 177 | 13.6% |
| $100,000 to $149,999 | 302 | 23.2% |
| $150,000 to $199,999 | 154 | 11.8% |
| $200,000+ | 180 | 13.8% |
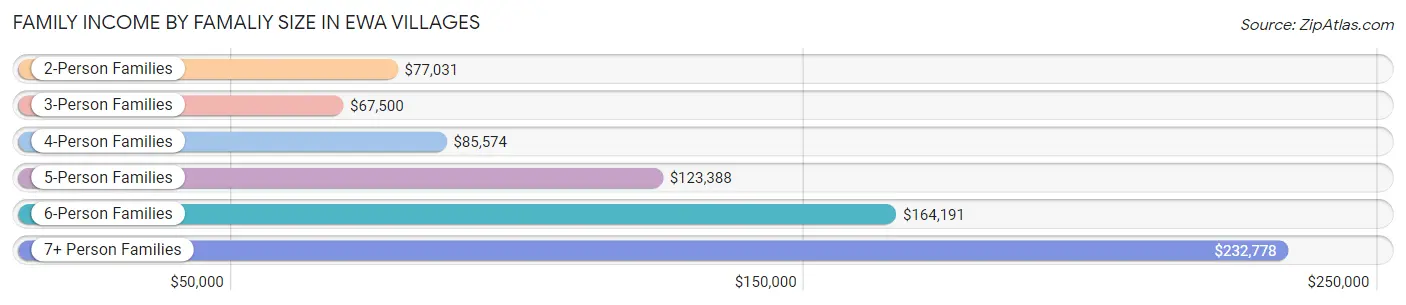
Family Income by Famaliy Size in Ewa Villages
7+ person families (76 | 5.8%) account for the highest median family income in Ewa Villages with $232,778 per family, while 2-person families (295 | 22.6%) have the highest median income of $38,516 per family member.
| Income Bracket | # Families | Median Income |
| 2-Person Families | 295 (22.6%) | $77,031 |
| 3-Person Families | 166 (12.7%) | $67,500 |
| 4-Person Families | 465 (35.7%) | $85,574 |
| 5-Person Families | 121 (9.3%) | $123,388 |
| 6-Person Families | 180 (13.8%) | $164,191 |
| 7+ Person Families | 76 (5.8%) | $232,778 |
| Total | 1,303 (100.0%) | $95,078 |
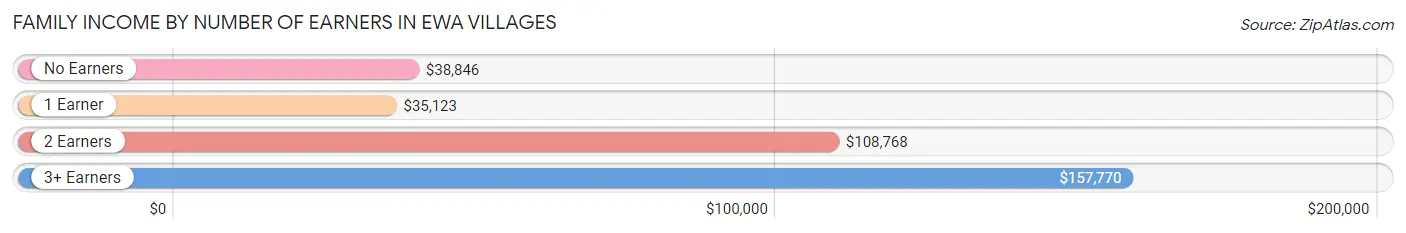
Family Income by Number of Earners in Ewa Villages
The median family income in Ewa Villages is $95,078, with families comprising 3+ earners (330) having the highest median family income of $157,770, while families with 1 earner (347) have the lowest median family income of $35,123, accounting for 25.3% and 26.6% of families, respectively.
| Number of Earners | # Families | Median Income |
| No Earners | 98 (7.5%) | $38,846 |
| 1 Earner | 347 (26.6%) | $35,123 |
| 2 Earners | 528 (40.5%) | $108,768 |
| 3+ Earners | 330 (25.3%) | $157,770 |
| Total | 1,303 (100.0%) | $95,078 |
Household Income in Ewa Villages
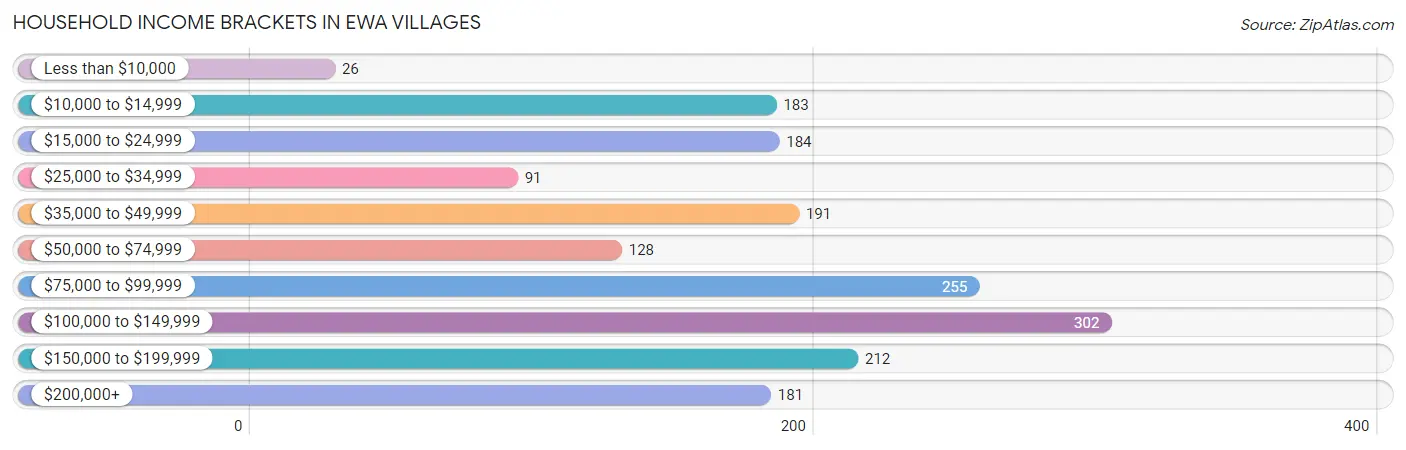
Household Income Brackets in Ewa Villages
With 302 households falling in the category, the $100,000 to $149,999 income range is the most frequent in Ewa Villages, accounting for 17.2% of all households. In contrast, only 26 households (1.5%) fall into the less than $10,000 income bracket, making it the least populous group.
| Income Bracket | # Households | % Households |
| Less than $10,000 | 26 | 1.5% |
| $10,000 to $14,999 | 183 | 10.4% |
| $15,000 to $24,999 | 184 | 10.5% |
| $25,000 to $34,999 | 91 | 5.2% |
| $35,000 to $49,999 | 191 | 10.9% |
| $50,000 to $74,999 | 128 | 7.3% |
| $75,000 to $99,999 | 255 | 14.5% |
| $100,000 to $149,999 | 302 | 17.2% |
| $150,000 to $199,999 | 212 | 12.1% |
| $200,000+ | 181 | 10.3% |
Household Income by Householder Age in Ewa Villages
The median household income in Ewa Villages is $82,903, with the highest median household income of $92,763 found in the 45 to 64 years age bracket for the primary householder. A total of 558 households (31.8%) fall into this category.
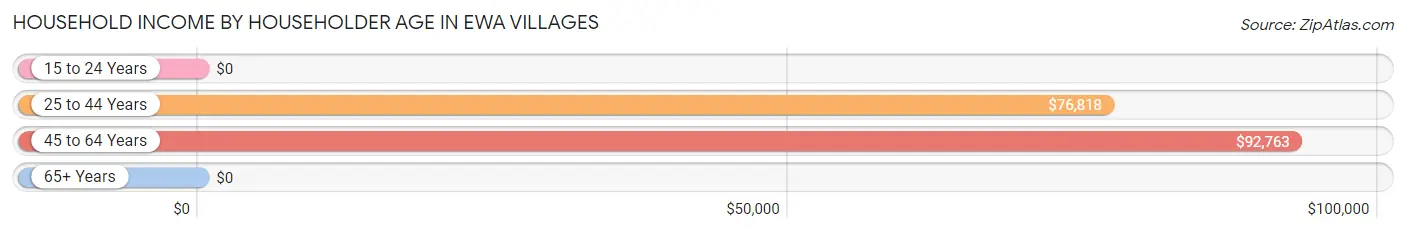
| Income Bracket | # Households | Median Income |
| 15 to 24 Years | 0 (0.0%) | $0 |
| 25 to 44 Years | 686 (39.1%) | $76,818 |
| 45 to 64 Years | 558 (31.8%) | $92,763 |
| 65+ Years | 512 (29.2%) | $0 |
| Total | 1,756 (100.0%) | $82,903 |
Poverty in Ewa Villages
Income Below Poverty by Sex and Age in Ewa Villages
With 16.6% poverty level for males and 16.1% for females among the residents of Ewa Villages, 5 year old males and 6 to 11 year old females are the most vulnerable to poverty, with 43 males (82.7%) and 111 females (53.1%) in their respective age groups living below the poverty level.
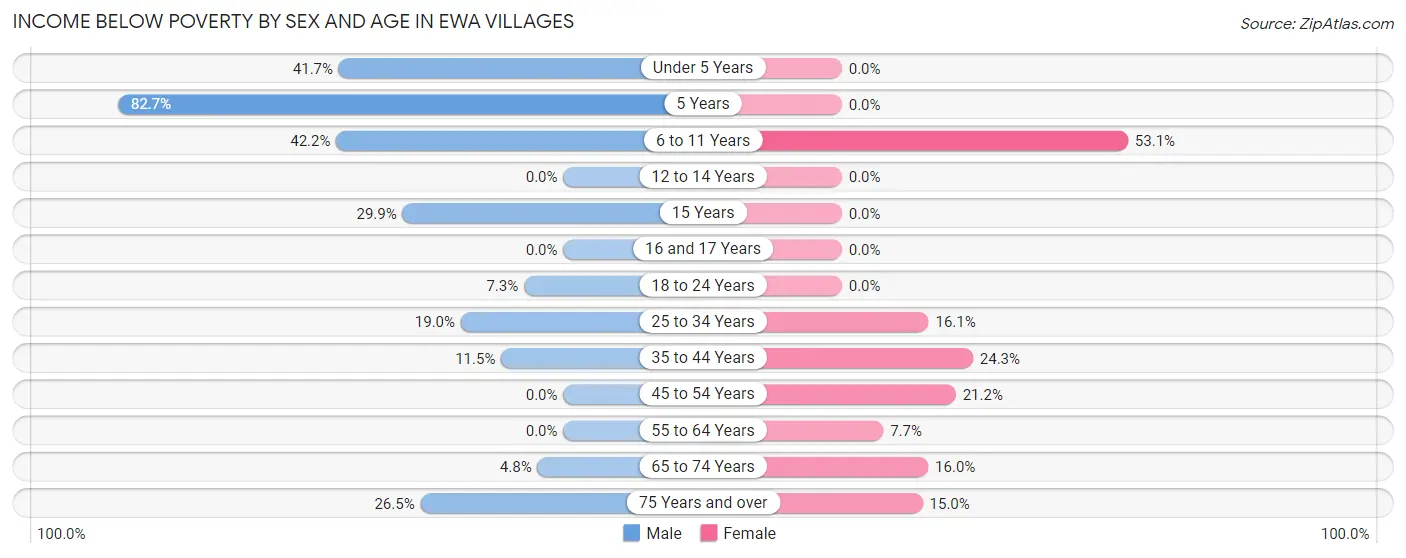
| Age Bracket | Male | Female |
| Under 5 Years | 155 (41.7%) | 0 (0.0%) |
| 5 Years | 43 (82.7%) | 0 (0.0%) |
| 6 to 11 Years | 137 (42.1%) | 111 (53.1%) |
| 12 to 14 Years | 0 (0.0%) | 0 (0.0%) |
| 15 Years | 20 (29.8%) | 0 (0.0%) |
| 16 and 17 Years | 0 (0.0%) | 0 (0.0%) |
| 18 to 24 Years | 26 (7.3%) | 0 (0.0%) |
| 25 to 34 Years | 62 (19.0%) | 47 (16.1%) |
| 35 to 44 Years | 49 (11.5%) | 137 (24.3%) |
| 45 to 54 Years | 0 (0.0%) | 96 (21.1%) |
| 55 to 64 Years | 0 (0.0%) | 24 (7.7%) |
| 65 to 74 Years | 11 (4.8%) | 50 (16.0%) |
| 75 Years and over | 48 (26.5%) | 51 (15.0%) |
| Total | 551 (16.6%) | 516 (16.1%) |
Income Above Poverty by Sex and Age in Ewa Villages
According to the poverty statistics in Ewa Villages, males aged 12 to 14 years and females aged under 5 years are the age groups that are most secure financially, with 100.0% of males and 100.0% of females in these age groups living above the poverty line.
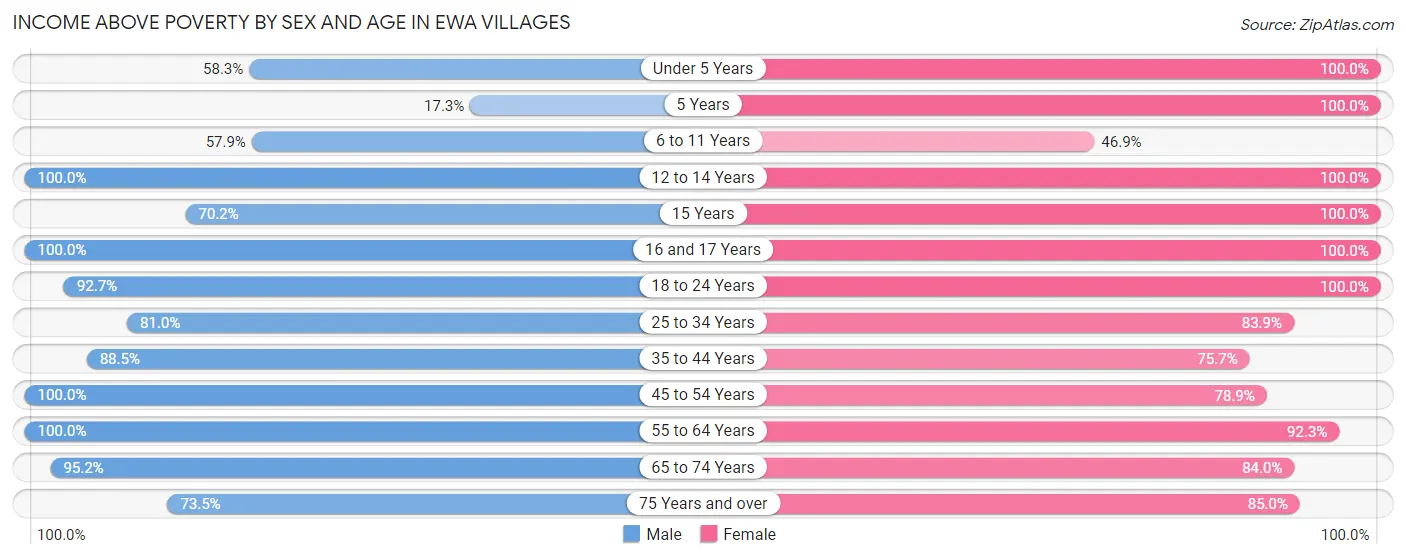
| Age Bracket | Male | Female |
| Under 5 Years | 217 (58.3%) | 166 (100.0%) |
| 5 Years | 9 (17.3%) | 12 (100.0%) |
| 6 to 11 Years | 188 (57.9%) | 98 (46.9%) |
| 12 to 14 Years | 243 (100.0%) | 155 (100.0%) |
| 15 Years | 47 (70.2%) | 61 (100.0%) |
| 16 and 17 Years | 94 (100.0%) | 61 (100.0%) |
| 18 to 24 Years | 330 (92.7%) | 264 (100.0%) |
| 25 to 34 Years | 264 (81.0%) | 245 (83.9%) |
| 35 to 44 Years | 376 (88.5%) | 426 (75.7%) |
| 45 to 54 Years | 276 (100.0%) | 358 (78.8%) |
| 55 to 64 Years | 384 (100.0%) | 288 (92.3%) |
| 65 to 74 Years | 218 (95.2%) | 262 (84.0%) |
| 75 Years and over | 133 (73.5%) | 289 (85.0%) |
| Total | 2,779 (83.5%) | 2,685 (83.9%) |
Income Below Poverty Among Married-Couple Families in Ewa Villages
The poverty statistics for married-couple families in Ewa Villages show that 6.4% or 50 of the total 776 families live below the poverty line. Families with 1 or 2 children have the highest poverty rate of 8.2%, comprising of 39 families. On the other hand, families with 3 or 4 children have the lowest poverty rate of 0.0%, which includes 0 families.
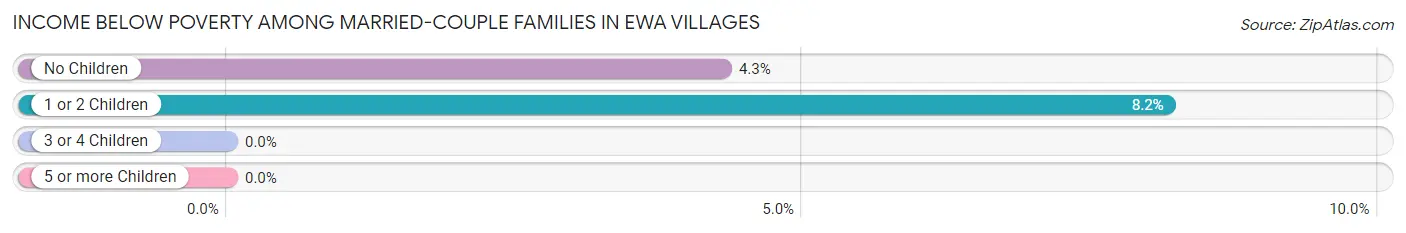
| Children | Above Poverty | Below Poverty |
| No Children | 245 (95.7%) | 11 (4.3%) |
| 1 or 2 Children | 439 (91.8%) | 39 (8.2%) |
| 3 or 4 Children | 24 (100.0%) | 0 (0.0%) |
| 5 or more Children | 18 (100.0%) | 0 (0.0%) |
| Total | 726 (93.6%) | 50 (6.4%) |
Income Below Poverty Among Single-Parent Households in Ewa Villages
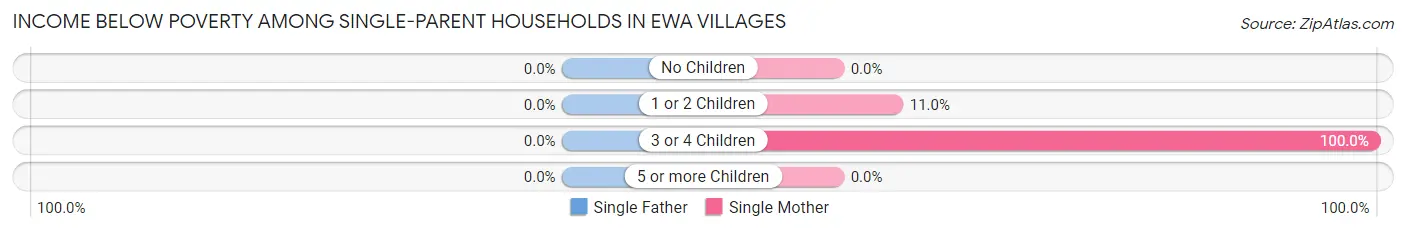
| Children | Single Father | Single Mother |
| No Children | 0 (0.0%) | 0 (0.0%) |
| 1 or 2 Children | 0 (0.0%) | 24 (11.0%) |
| 3 or 4 Children | 0 (0.0%) | 137 (100.0%) |
| 5 or more Children | 0 (0.0%) | 0 (0.0%) |
| Total | 0 (0.0%) | 161 (33.1%) |
Income Below Poverty Among Married-Couple vs Single-Parent Households in Ewa Villages
The poverty data for Ewa Villages shows that 50 of the married-couple family households (6.4%) and 161 of the single-parent households (30.5%) are living below the poverty level. Within the married-couple family households, those with 1 or 2 children have the highest poverty rate, with 39 households (8.2%) falling below the poverty line. Among the single-parent households, those with 3 or 4 children have the highest poverty rate, with 137 household (91.3%) living below poverty.
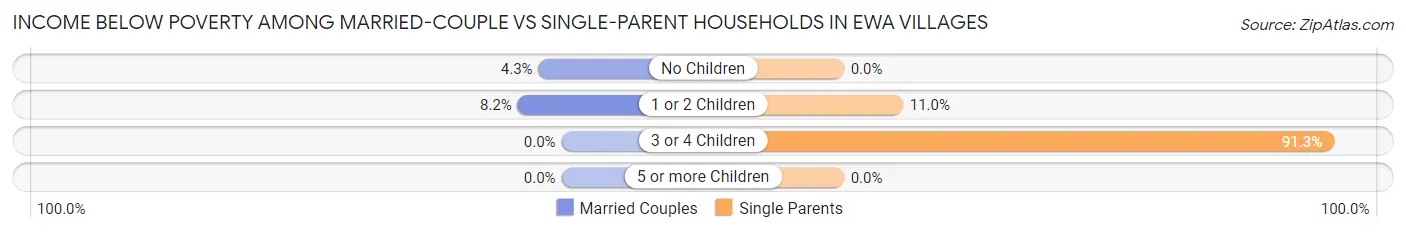
| Children | Married-Couple Families | Single-Parent Households |
| No Children | 11 (4.3%) | 0 (0.0%) |
| 1 or 2 Children | 39 (8.2%) | 24 (11.0%) |
| 3 or 4 Children | 0 (0.0%) | 137 (91.3%) |
| 5 or more Children | 0 (0.0%) | 0 (0.0%) |
| Total | 50 (6.4%) | 161 (30.5%) |
Race in Ewa Villages
The most populous races in Ewa Villages are Asian (4,596 | 70.2%), Two or more Races (1,321 | 20.2%), and Hispanic or Latino (467 | 7.1%).
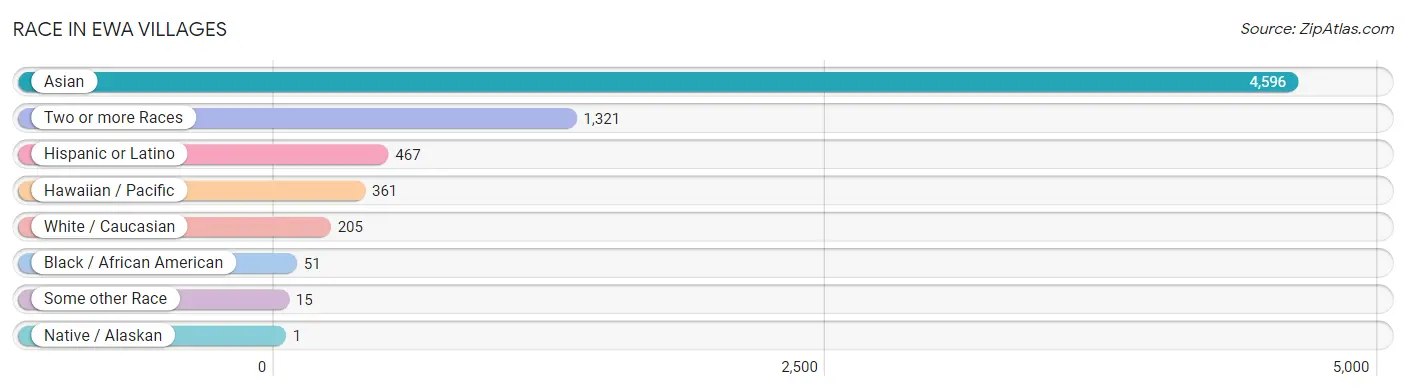
| Race | # Population | % Population |
| Asian | 4,596 | 70.2% |
| Black / African American | 51 | 0.8% |
| Hawaiian / Pacific | 361 | 5.5% |
| Hispanic or Latino | 467 | 7.1% |
| Native / Alaskan | 1 | 0.0% |
| White / Caucasian | 205 | 3.1% |
| Two or more Races | 1,321 | 20.2% |
| Some other Race | 15 | 0.2% |
| Total | 6,550 | 100.0% |
Ancestry in Ewa Villages
The most populous ancestries reported in Ewa Villages are Korean (4,708 | 71.9%), Native Hawaiian (884 | 13.5%), Bhutanese (764 | 11.7%), Indian (Asian) (372 | 5.7%), and Burmese (254 | 3.9%), together accounting for 106.6% of all Ewa Villages residents.
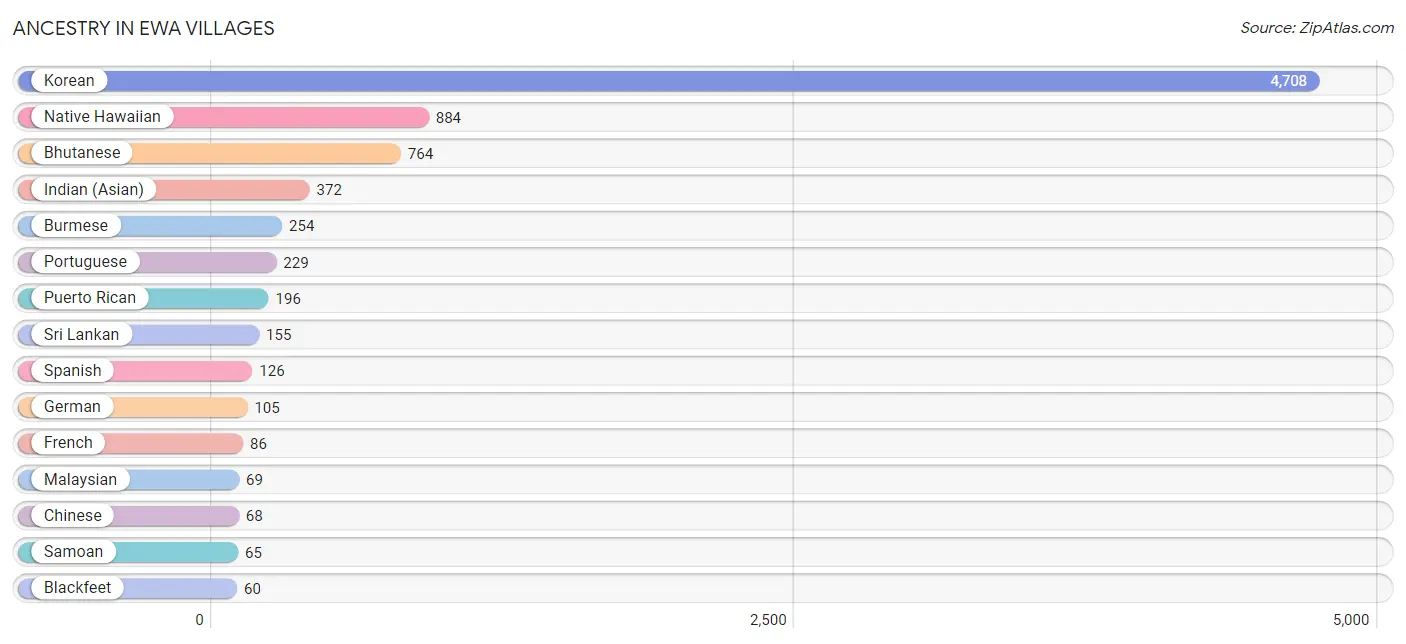
| Ancestry | # Population | % Population |
| American | 10 | 0.2% |
| Bhutanese | 764 | 11.7% |
| Blackfeet | 60 | 0.9% |
| Burmese | 254 | 3.9% |
| Cherokee | 18 | 0.3% |
| Chinese | 68 | 1.0% |
| English | 49 | 0.7% |
| French | 86 | 1.3% |
| German | 105 | 1.6% |
| Hungarian | 8 | 0.1% |
| Indian (Asian) | 372 | 5.7% |
| Irish | 58 | 0.9% |
| Korean | 4,708 | 71.9% |
| Malaysian | 69 | 1.1% |
| Mexican | 47 | 0.7% |
| Native Hawaiian | 884 | 13.5% |
| Norwegian | 12 | 0.2% |
| Peruvian | 7 | 0.1% |
| Polish | 11 | 0.2% |
| Portuguese | 229 | 3.5% |
| Puerto Rican | 196 | 3.0% |
| Samoan | 65 | 1.0% |
| South American | 7 | 0.1% |
| Spanish | 126 | 1.9% |
| Sri Lankan | 155 | 2.4% |
| Tongan | 1 | 0.0% | View All 26 Rows |
Immigrants in Ewa Villages
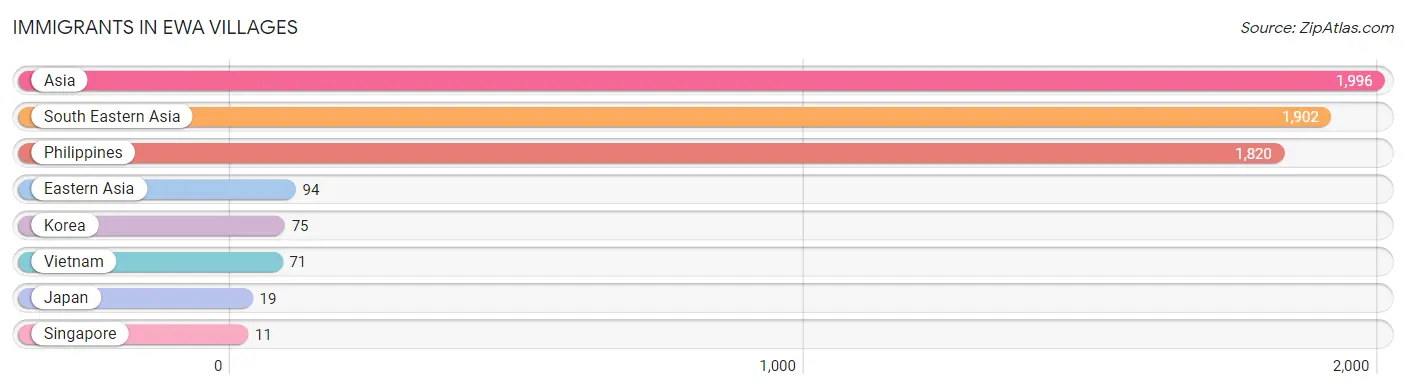
The most numerous immigrant groups reported in Ewa Villages came from Asia (1,996 | 30.5%), South Eastern Asia (1,902 | 29.0%), Philippines (1,820 | 27.8%), Eastern Asia (94 | 1.4%), and Korea (75 | 1.1%), together accounting for 89.9% of all Ewa Villages residents.
| Immigration Origin | # Population | % Population |
| Asia | 1,996 | 30.5% |
| Eastern Asia | 94 | 1.4% |
| Japan | 19 | 0.3% |
| Korea | 75 | 1.1% |
| Philippines | 1,820 | 27.8% |
| Singapore | 11 | 0.2% |
| South Eastern Asia | 1,902 | 29.0% |
| Vietnam | 71 | 1.1% | View All 8 Rows |
Sex and Age in Ewa Villages
Sex and Age in Ewa Villages
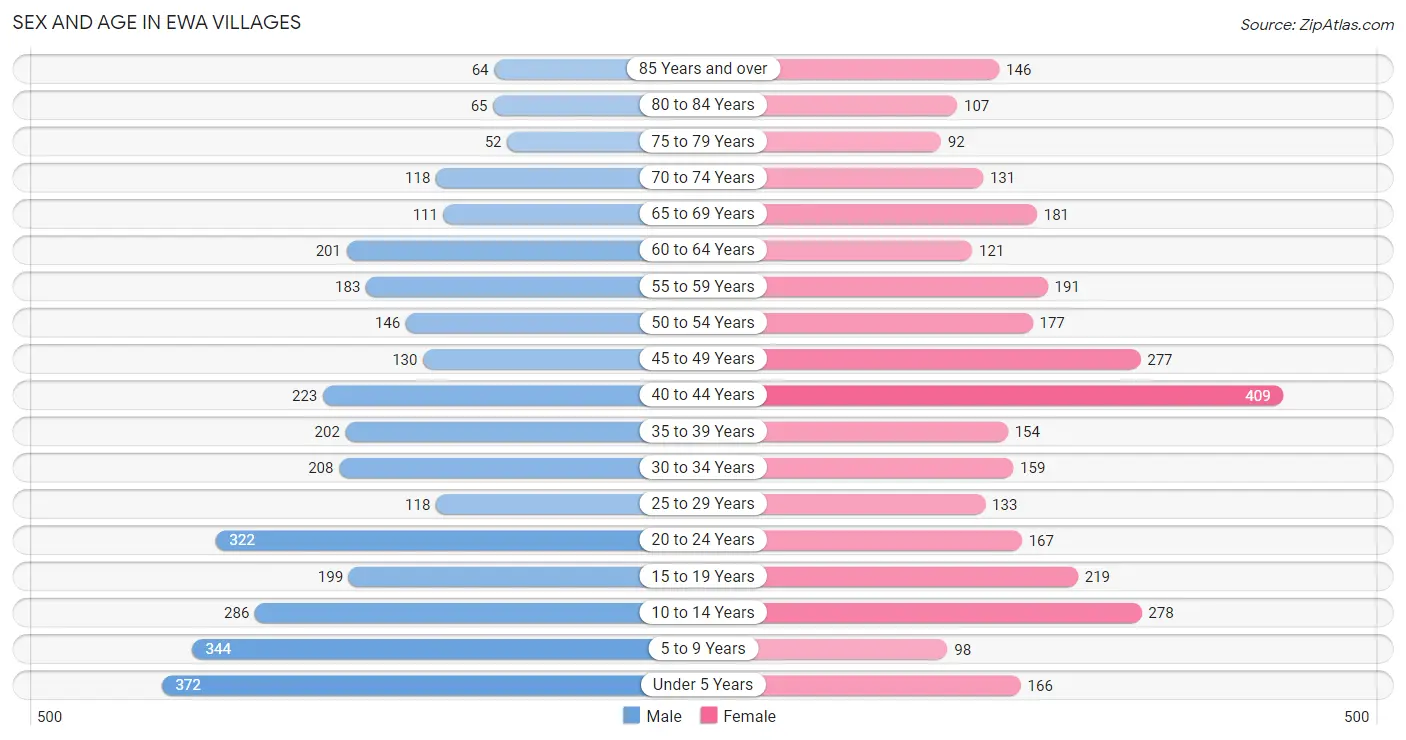
The most populous age groups in Ewa Villages are Under 5 Years (372 | 11.1%) for men and 40 to 44 Years (409 | 12.8%) for women.
| Age Bracket | Male | Female |
| Under 5 Years | 372 (11.1%) | 166 (5.2%) |
| 5 to 9 Years | 344 (10.3%) | 98 (3.1%) |
| 10 to 14 Years | 286 (8.6%) | 278 (8.7%) |
| 15 to 19 Years | 199 (5.9%) | 219 (6.8%) |
| 20 to 24 Years | 322 (9.6%) | 167 (5.2%) |
| 25 to 29 Years | 118 (3.5%) | 133 (4.2%) |
| 30 to 34 Years | 208 (6.2%) | 159 (5.0%) |
| 35 to 39 Years | 202 (6.0%) | 154 (4.8%) |
| 40 to 44 Years | 223 (6.7%) | 409 (12.8%) |
| 45 to 49 Years | 130 (3.9%) | 277 (8.6%) |
| 50 to 54 Years | 146 (4.4%) | 177 (5.5%) |
| 55 to 59 Years | 183 (5.5%) | 191 (6.0%) |
| 60 to 64 Years | 201 (6.0%) | 121 (3.8%) |
| 65 to 69 Years | 111 (3.3%) | 181 (5.7%) |
| 70 to 74 Years | 118 (3.5%) | 131 (4.1%) |
| 75 to 79 Years | 52 (1.6%) | 92 (2.9%) |
| 80 to 84 Years | 65 (1.9%) | 107 (3.3%) |
| 85 Years and over | 64 (1.9%) | 146 (4.5%) |
| Total | 3,344 (100.0%) | 3,206 (100.0%) |
Families and Households in Ewa Villages
Median Family Size in Ewa Villages
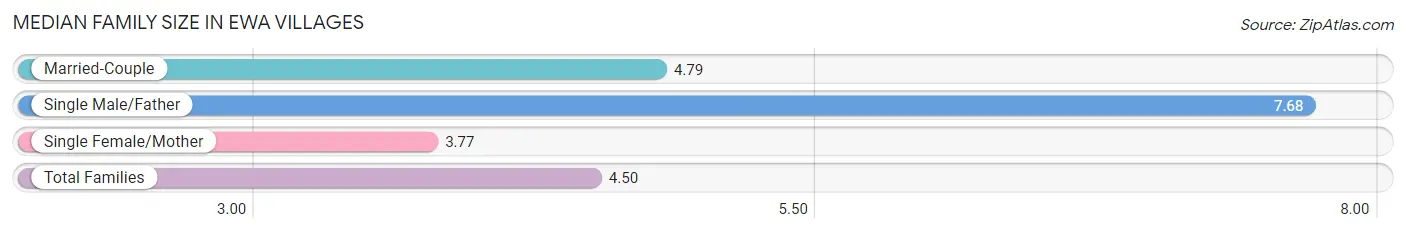
The median family size in Ewa Villages is 4.50 persons per family, with single male/father families (41 | 3.2%) accounting for the largest median family size of 7.68 persons per family. On the other hand, single female/mother families (486 | 37.3%) represent the smallest median family size with 3.77 persons per family.
| Family Type | # Families | Family Size |
| Married-Couple | 776 (59.6%) | 4.79 |
| Single Male/Father | 41 (3.2%) | 7.68 |
| Single Female/Mother | 486 (37.3%) | 3.77 |
| Total Families | 1,303 (100.0%) | 4.50 |
Median Household Size in Ewa Villages
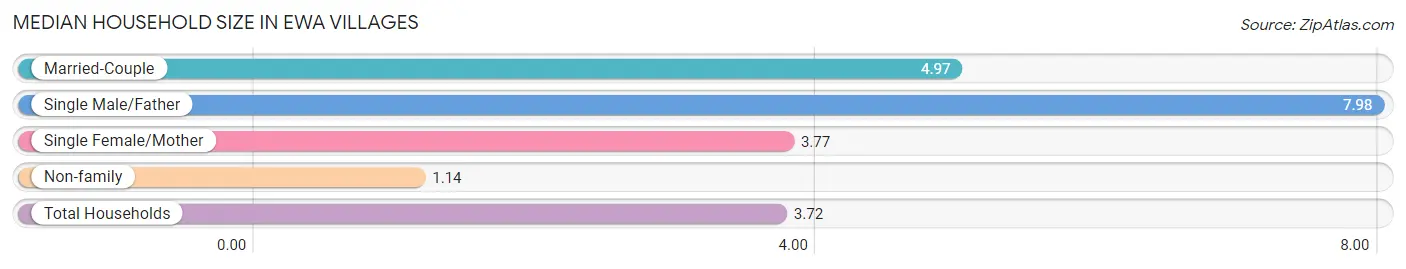
The median household size in Ewa Villages is 3.72 persons per household, with single male/father households (41 | 2.3%) accounting for the largest median household size of 7.98 persons per household. non-family households (453 | 25.8%) represent the smallest median household size with 1.14 persons per household.
| Household Type | # Households | Household Size |
| Married-Couple | 776 (44.2%) | 4.97 |
| Single Male/Father | 41 (2.3%) | 7.98 |
| Single Female/Mother | 486 (27.7%) | 3.77 |
| Non-family | 453 (25.8%) | 1.14 |
| Total Households | 1,756 (100.0%) | 3.72 |
Household Size by Marriage Status in Ewa Villages
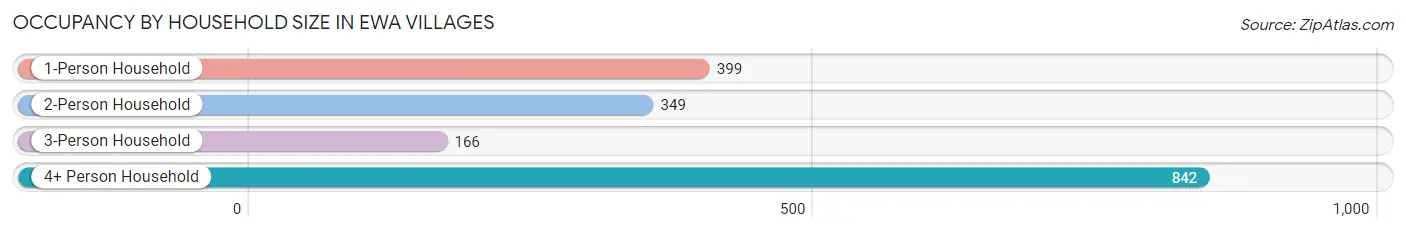
Out of a total of 1,756 households in Ewa Villages, 1,303 (74.2%) are family households, while 453 (25.8%) are nonfamily households. The most numerous type of family households are 4-person households, comprising 432, and the most common type of nonfamily households are 1-person households, comprising 399.
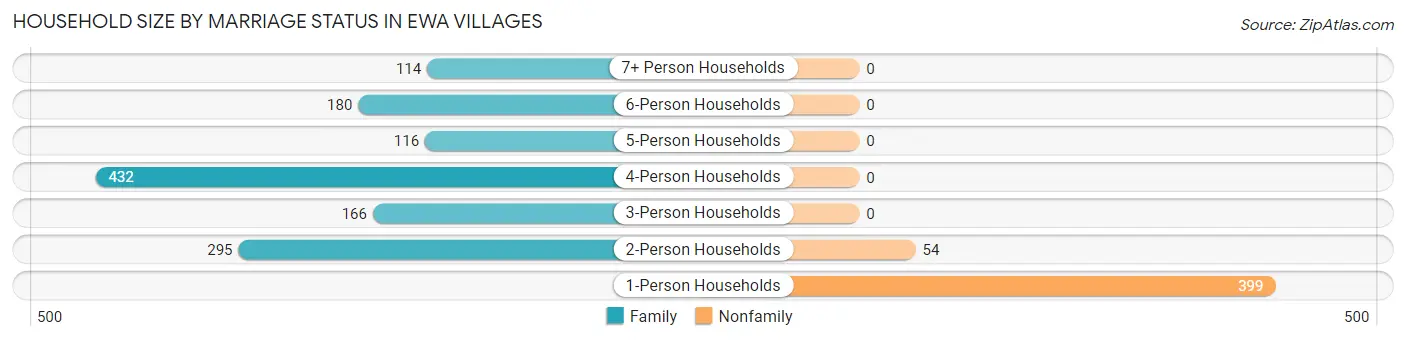
| Household Size | Family Households | Nonfamily Households |
| 1-Person Households | - | 399 (22.7%) |
| 2-Person Households | 295 (16.8%) | 54 (3.1%) |
| 3-Person Households | 166 (9.5%) | 0 (0.0%) |
| 4-Person Households | 432 (24.6%) | 0 (0.0%) |
| 5-Person Households | 116 (6.6%) | 0 (0.0%) |
| 6-Person Households | 180 (10.2%) | 0 (0.0%) |
| 7+ Person Households | 114 (6.5%) | 0 (0.0%) |
| Total | 1,303 (74.2%) | 453 (25.8%) |
Female Fertility in Ewa Villages
Fertility by Age in Ewa Villages
Average fertility rate in Ewa Villages is 44.0 births per 1,000 women. Women in the age bracket of 20 to 34 years have the highest fertility rate with 85.0 births per 1,000 women. Women in the age bracket of 20 to 34 years acount for 56.5% of all women with births.
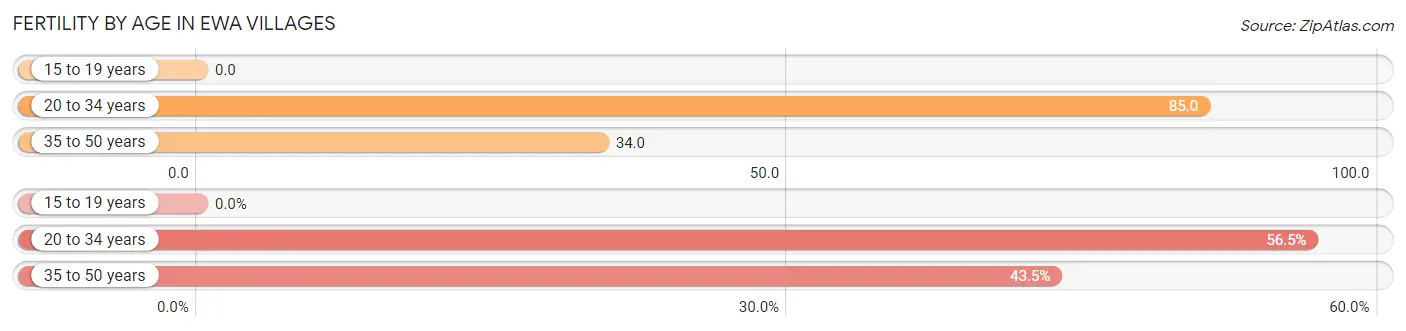
| Age Bracket | Women with Births | Births / 1,000 Women |
| 15 to 19 years | 0 (0.0%) | 0.0 |
| 20 to 34 years | 39 (56.5%) | 85.0 |
| 35 to 50 years | 30 (43.5%) | 34.0 |
| Total | 69 (100.0%) | 44.0 |
Fertility by Age by Marriage Status in Ewa Villages
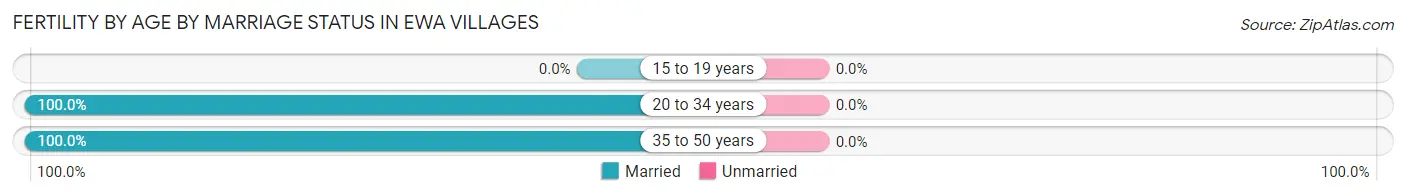
| Age Bracket | Married | Unmarried |
| 15 to 19 years | 0 (0.0%) | 0 (0.0%) |
| 20 to 34 years | 39 (100.0%) | 0 (0.0%) |
| 35 to 50 years | 30 (100.0%) | 0 (0.0%) |
| Total | 69 (100.0%) | 0 (0.0%) |
Fertility by Education in Ewa Villages
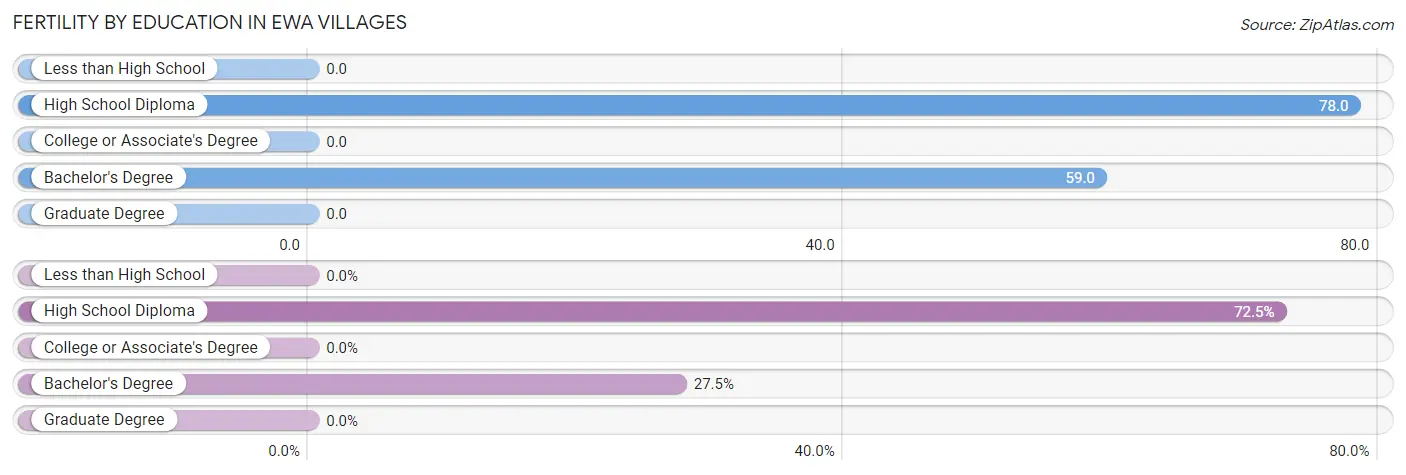
| Educational Attainment | Women with Births | Births / 1,000 Women |
| Less than High School | 0 (0.0%) | 0.0 |
| High School Diploma | 50 (72.5%) | 78.0 |
| College or Associate's Degree | 0 (0.0%) | 0.0 |
| Bachelor's Degree | 19 (27.5%) | 59.0 |
| Graduate Degree | 0 (0.0%) | 0.0 |
| Total | 69 (100.0%) | 44.0 |
Fertility by Education by Marriage Status in Ewa Villages
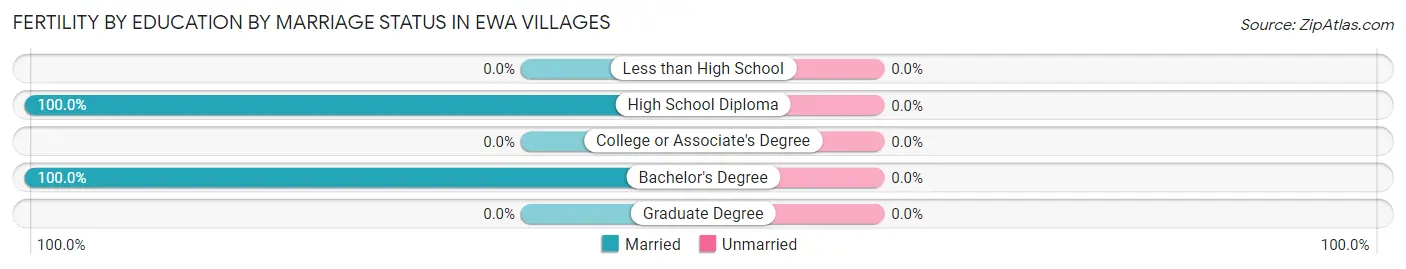
| Educational Attainment | Married | Unmarried |
| Less than High School | 0 (0.0%) | 0 (0.0%) |
| High School Diploma | 50 (100.0%) | 0 (0.0%) |
| College or Associate's Degree | 0 (0.0%) | 0 (0.0%) |
| Bachelor's Degree | 19 (100.0%) | 0 (0.0%) |
| Graduate Degree | 0 (0.0%) | 0 (0.0%) |
| Total | 69 (100.0%) | 0 (0.0%) |
Employment Characteristics in Ewa Villages
Employment by Class of Employer in Ewa Villages
Among the 3,025 employed individuals in Ewa Villages, private company employees (2,083 | 68.9%), federal government employees (341 | 11.3%), and state government employees (237 | 7.8%) make up the most common classes of employment.
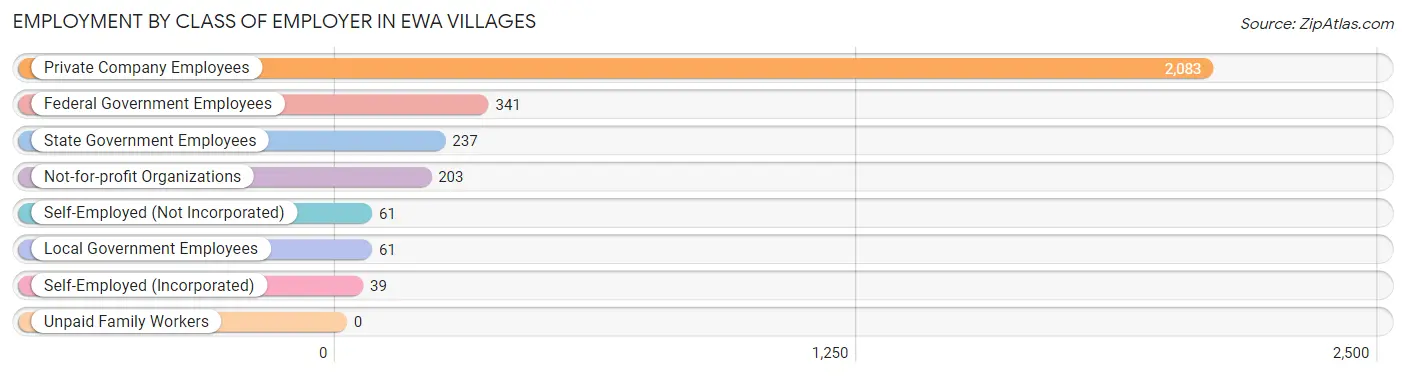
| Employer Class | # Employees | % Employees |
| Private Company Employees | 2,083 | 68.9% |
| Self-Employed (Incorporated) | 39 | 1.3% |
| Self-Employed (Not Incorporated) | 61 | 2.0% |
| Not-for-profit Organizations | 203 | 6.7% |
| Local Government Employees | 61 | 2.0% |
| State Government Employees | 237 | 7.8% |
| Federal Government Employees | 341 | 11.3% |
| Unpaid Family Workers | 0 | 0.0% |
| Total | 3,025 | 100.0% |
Employment Status by Age in Ewa Villages
According to the labor force statistics for Ewa Villages, out of the total population over 16 years of age (4,878), 63.9% or 3,117 individuals are in the labor force, with 1.3% or 41 of them unemployed. The age group with the highest labor force participation rate is 55 to 59 years, with 85.8% or 321 individuals in the labor force. Within the labor force, the 30 to 34 years age range has the highest percentage of unemployed individuals, with 9.1% or 26 of them being unemployed.
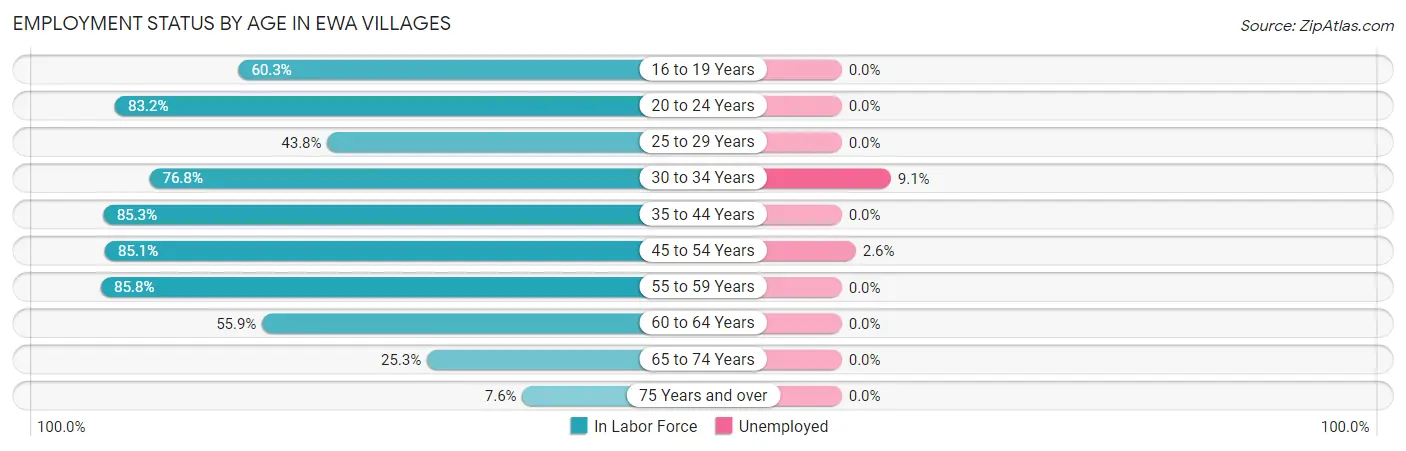
| Age Bracket | In Labor Force | Unemployed |
| 16 to 19 Years | 175 (60.3%) | 0 (0.0%) |
| 20 to 24 Years | 407 (83.2%) | 0 (0.0%) |
| 25 to 29 Years | 110 (43.8%) | 0 (0.0%) |
| 30 to 34 Years | 282 (76.8%) | 26 (9.1%) |
| 35 to 44 Years | 843 (85.3%) | 0 (0.0%) |
| 45 to 54 Years | 621 (85.1%) | 16 (2.6%) |
| 55 to 59 Years | 321 (85.8%) | 0 (0.0%) |
| 60 to 64 Years | 180 (55.9%) | 0 (0.0%) |
| 65 to 74 Years | 137 (25.3%) | 0 (0.0%) |
| 75 Years and over | 40 (7.6%) | 0 (0.0%) |
| Total | 3,117 (63.9%) | 41 (1.3%) |
Employment Status by Educational Attainment in Ewa Villages
According to labor force statistics for Ewa Villages, 77.7% of individuals (2,356) out of the total population between 25 and 64 years of age (3,032) are in the labor force, with 1.7% or 40 of them being unemployed. The group with the highest labor force participation rate are those with the educational attainment of bachelor's degree or higher, with 98.4% or 724 individuals in the labor force. Within the labor force, individuals with high school diploma education have the highest percentage of unemployment, with 4.2% or 39 of them being unemployed.
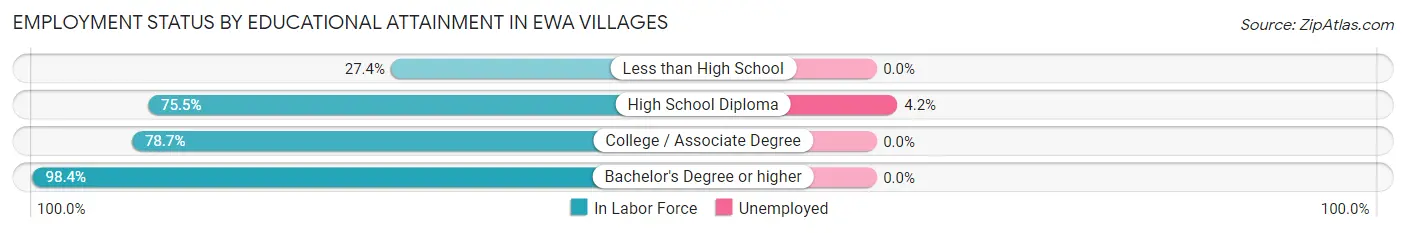
| Educational Attainment | In Labor Force | Unemployed |
| Less than High School | 72 (27.4%) | 0 (0.0%) |
| High School Diploma | 922 (75.5%) | 51 (4.2%) |
| College / Associate Degree | 639 (78.7%) | 0 (0.0%) |
| Bachelor's Degree or higher | 724 (98.4%) | 0 (0.0%) |
| Total | 2,356 (77.7%) | 52 (1.7%) |
Employment Occupations by Sex in Ewa Villages
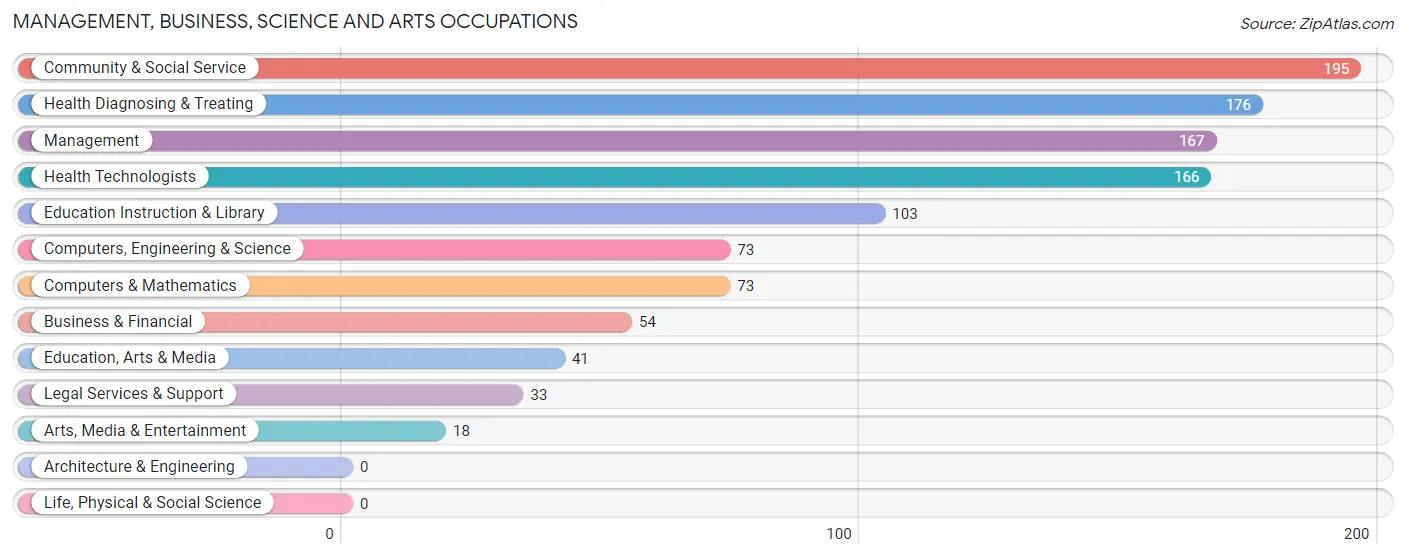
Management, Business, Science and Arts Occupations
The most common Management, Business, Science and Arts occupations in Ewa Villages are Community & Social Service (195 | 6.5%), Health Diagnosing & Treating (176 | 5.8%), Management (167 | 5.5%), Health Technologists (166 | 5.5%), and Education Instruction & Library (103 | 3.4%).
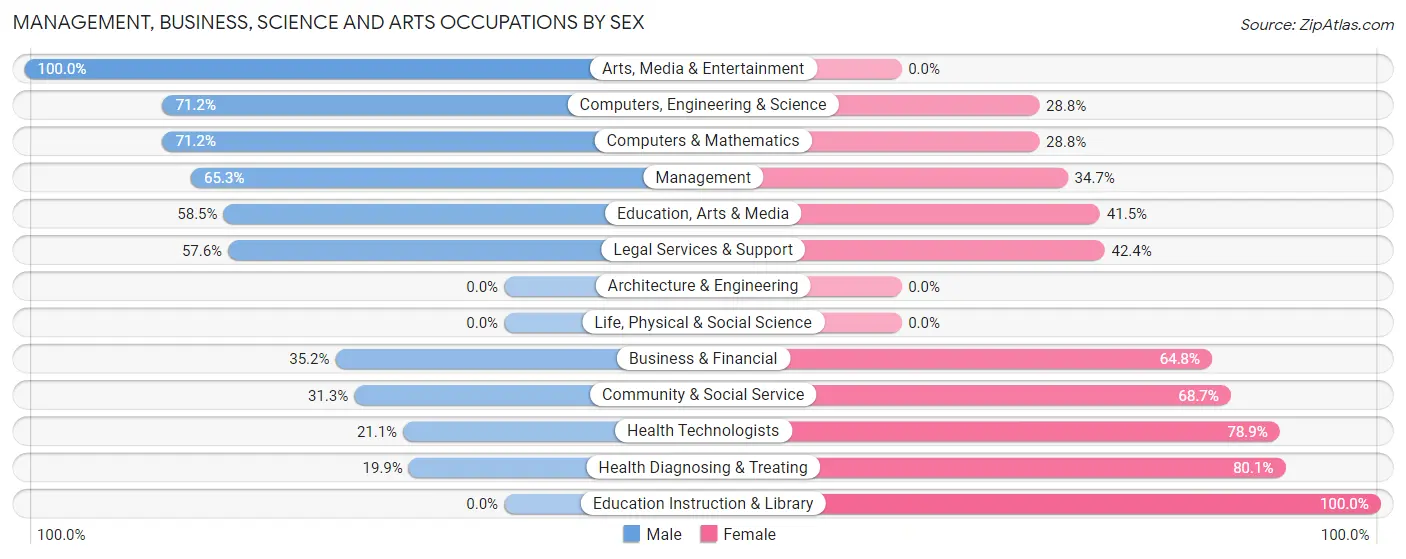
Management, Business, Science and Arts Occupations by Sex
Within the Management, Business, Science and Arts occupations in Ewa Villages, the most male-oriented occupations are Arts, Media & Entertainment (100.0%), Computers, Engineering & Science (71.2%), and Computers & Mathematics (71.2%), while the most female-oriented occupations are Education Instruction & Library (100.0%), Health Diagnosing & Treating (80.1%), and Health Technologists (78.9%).
| Occupation | Male | Female |
| Management | 109 (65.3%) | 58 (34.7%) |
| Business & Financial | 19 (35.2%) | 35 (64.8%) |
| Computers, Engineering & Science | 52 (71.2%) | 21 (28.8%) |
| Computers & Mathematics | 52 (71.2%) | 21 (28.8%) |
| Architecture & Engineering | 0 (0.0%) | 0 (0.0%) |
| Life, Physical & Social Science | 0 (0.0%) | 0 (0.0%) |
| Community & Social Service | 61 (31.3%) | 134 (68.7%) |
| Education, Arts & Media | 24 (58.5%) | 17 (41.5%) |
| Legal Services & Support | 19 (57.6%) | 14 (42.4%) |
| Education Instruction & Library | 0 (0.0%) | 103 (100.0%) |
| Arts, Media & Entertainment | 18 (100.0%) | 0 (0.0%) |
| Health Diagnosing & Treating | 35 (19.9%) | 141 (80.1%) |
| Health Technologists | 35 (21.1%) | 131 (78.9%) |
| Total (Category) | 276 (41.5%) | 389 (58.5%) |
| Total (Overall) | 1,422 (47.2%) | 1,591 (52.8%) |
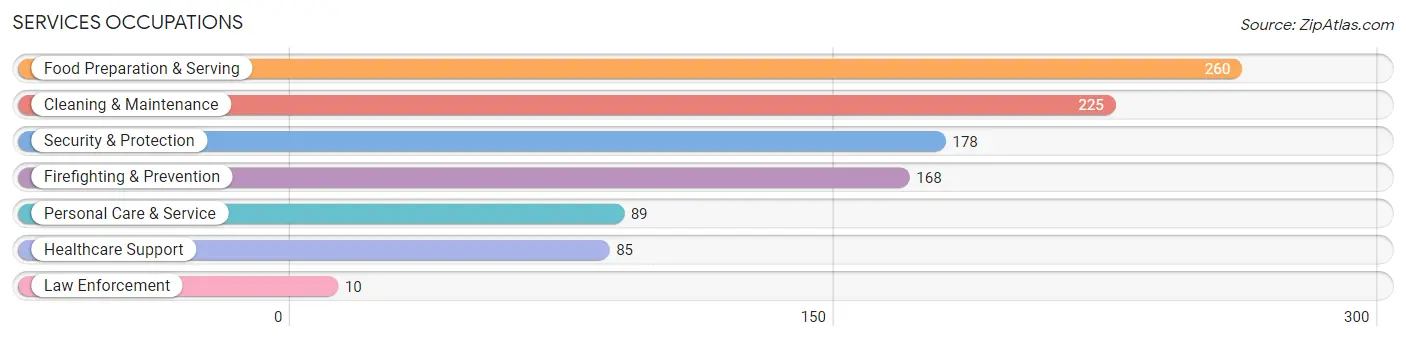
Services Occupations
The most common Services occupations in Ewa Villages are Food Preparation & Serving (260 | 8.6%), Cleaning & Maintenance (225 | 7.5%), Security & Protection (178 | 5.9%), Firefighting & Prevention (168 | 5.6%), and Personal Care & Service (89 | 2.9%).
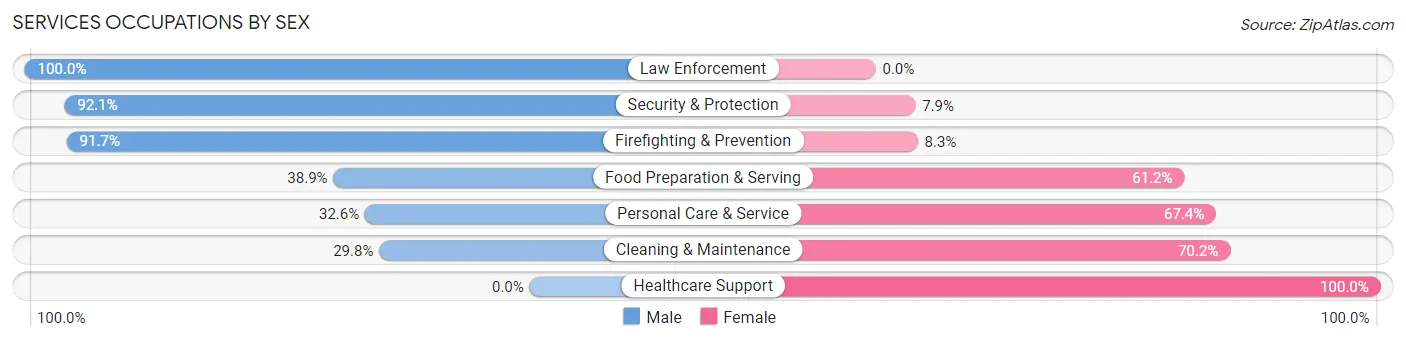
Services Occupations by Sex
Within the Services occupations in Ewa Villages, the most male-oriented occupations are Law Enforcement (100.0%), Security & Protection (92.1%), and Firefighting & Prevention (91.7%), while the most female-oriented occupations are Healthcare Support (100.0%), Cleaning & Maintenance (70.2%), and Personal Care & Service (67.4%).
| Occupation | Male | Female |
| Healthcare Support | 0 (0.0%) | 85 (100.0%) |
| Security & Protection | 164 (92.1%) | 14 (7.9%) |
| Firefighting & Prevention | 154 (91.7%) | 14 (8.3%) |
| Law Enforcement | 10 (100.0%) | 0 (0.0%) |
| Food Preparation & Serving | 101 (38.9%) | 159 (61.2%) |
| Cleaning & Maintenance | 67 (29.8%) | 158 (70.2%) |
| Personal Care & Service | 29 (32.6%) | 60 (67.4%) |
| Total (Category) | 361 (43.1%) | 476 (56.9%) |
| Total (Overall) | 1,422 (47.2%) | 1,591 (52.8%) |
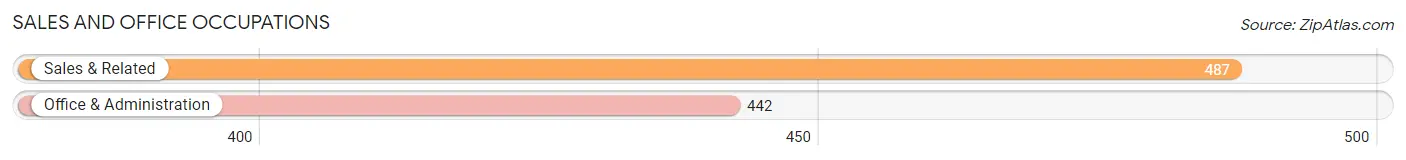
Sales and Office Occupations
The most common Sales and Office occupations in Ewa Villages are Sales & Related (487 | 16.2%), and Office & Administration (442 | 14.7%).
Sales and Office Occupations by Sex
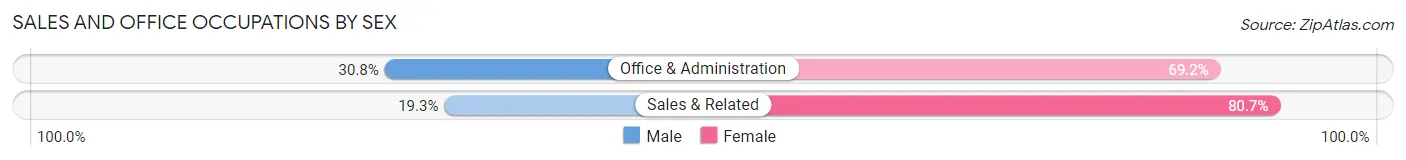
| Occupation | Male | Female |
| Sales & Related | 94 (19.3%) | 393 (80.7%) |
| Office & Administration | 136 (30.8%) | 306 (69.2%) |
| Total (Category) | 230 (24.8%) | 699 (75.2%) |
| Total (Overall) | 1,422 (47.2%) | 1,591 (52.8%) |
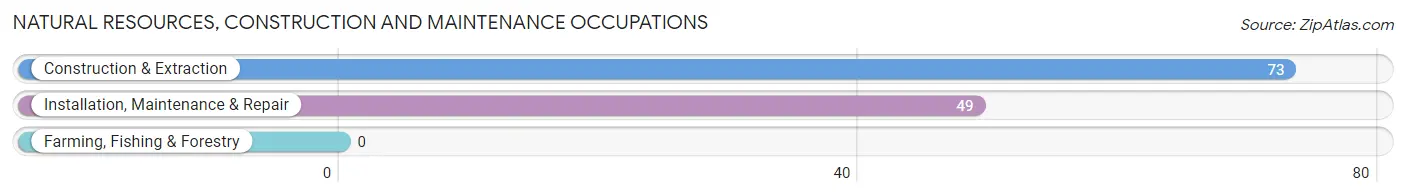
Natural Resources, Construction and Maintenance Occupations
The most common Natural Resources, Construction and Maintenance occupations in Ewa Villages are Construction & Extraction (73 | 2.4%), and Installation, Maintenance & Repair (49 | 1.6%).
Natural Resources, Construction and Maintenance Occupations by Sex
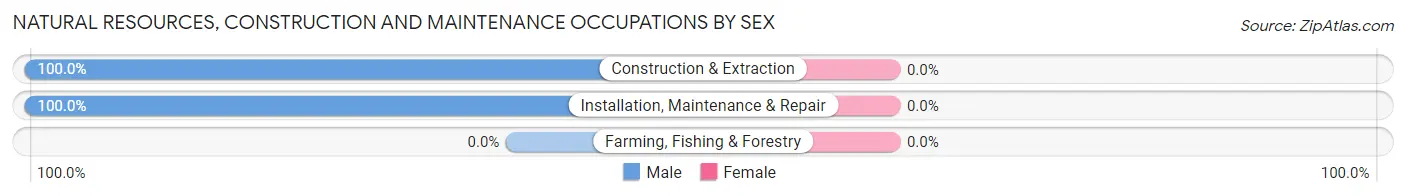
| Occupation | Male | Female |
| Farming, Fishing & Forestry | 0 (0.0%) | 0 (0.0%) |
| Construction & Extraction | 73 (100.0%) | 0 (0.0%) |
| Installation, Maintenance & Repair | 49 (100.0%) | 0 (0.0%) |
| Total (Category) | 122 (100.0%) | 0 (0.0%) |
| Total (Overall) | 1,422 (47.2%) | 1,591 (52.8%) |
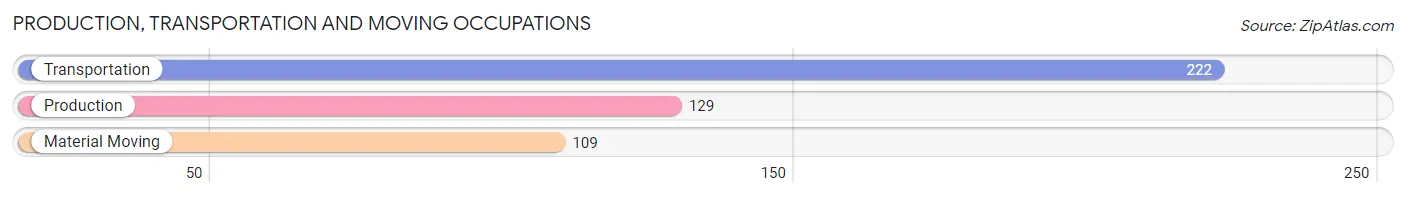
Production, Transportation and Moving Occupations
The most common Production, Transportation and Moving occupations in Ewa Villages are Transportation (222 | 7.4%), Production (129 | 4.3%), and Material Moving (109 | 3.6%).
Production, Transportation and Moving Occupations by Sex
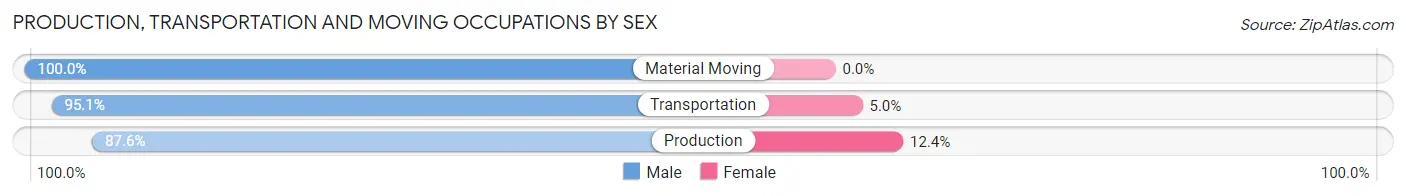
| Occupation | Male | Female |
| Production | 113 (87.6%) | 16 (12.4%) |
| Transportation | 211 (95.1%) | 11 (5.0%) |
| Material Moving | 109 (100.0%) | 0 (0.0%) |
| Total (Category) | 433 (94.1%) | 27 (5.9%) |
| Total (Overall) | 1,422 (47.2%) | 1,591 (52.8%) |
Employment Industries by Sex in Ewa Villages
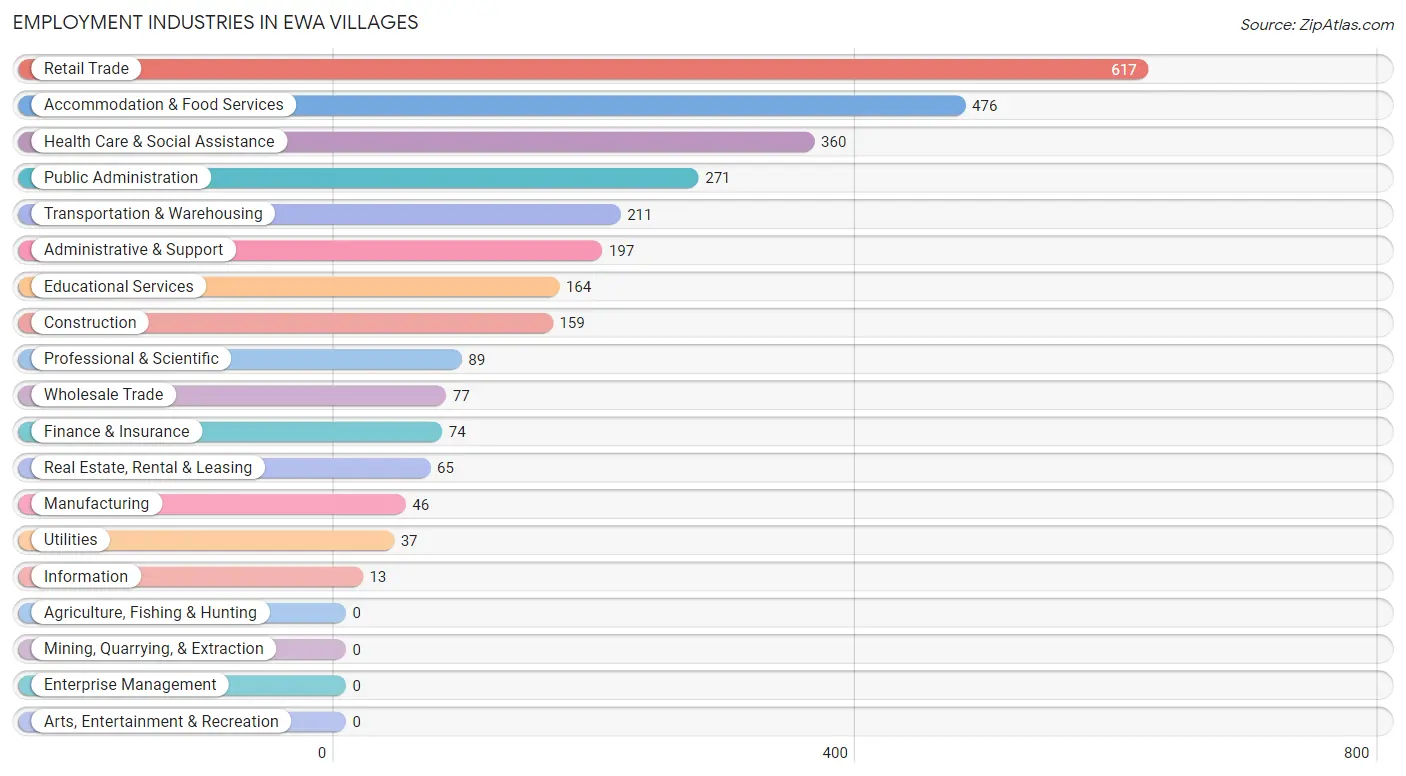
Employment Industries in Ewa Villages
The major employment industries in Ewa Villages include Retail Trade (617 | 20.5%), Accommodation & Food Services (476 | 15.8%), Health Care & Social Assistance (360 | 11.9%), Public Administration (271 | 9.0%), and Transportation & Warehousing (211 | 7.0%).
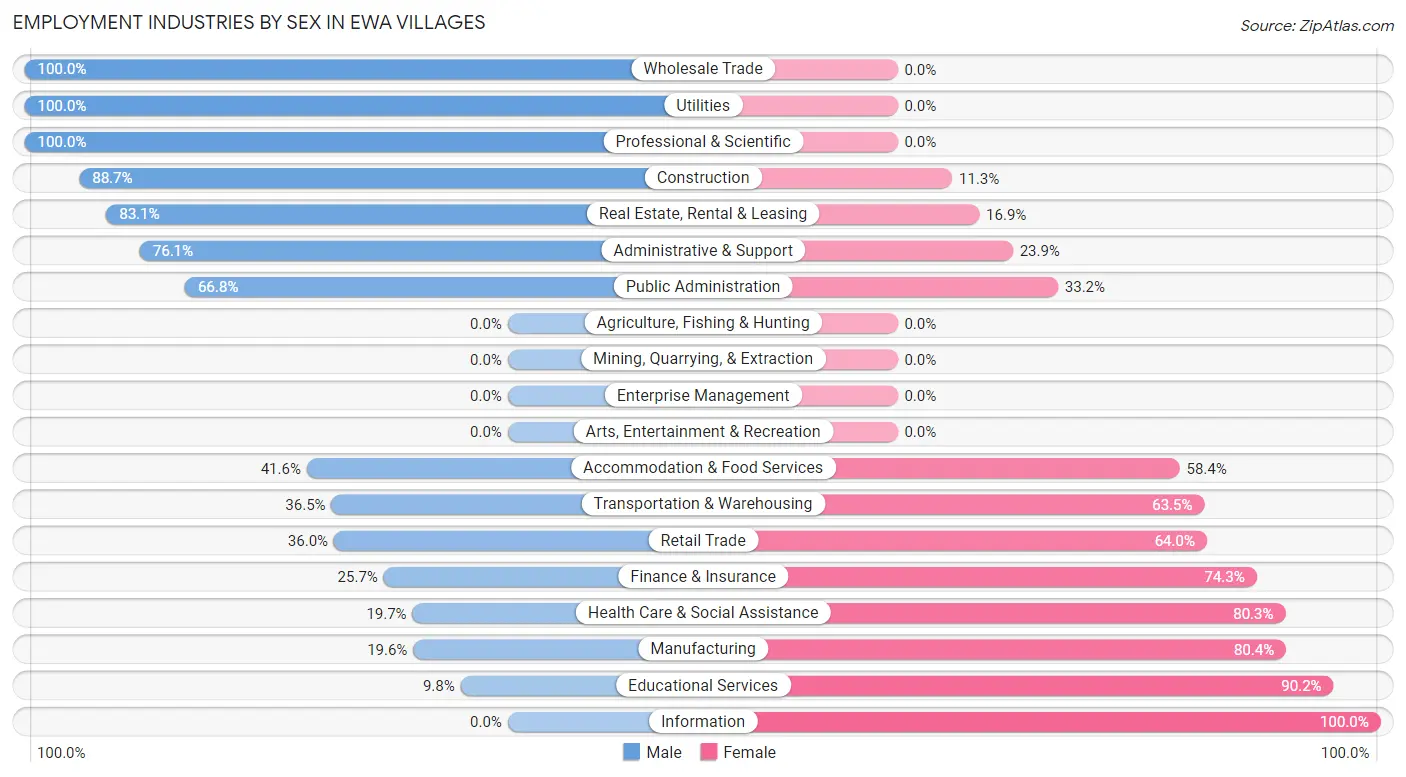
Employment Industries by Sex in Ewa Villages
The Ewa Villages industries that see more men than women are Wholesale Trade (100.0%), Utilities (100.0%), and Professional & Scientific (100.0%), whereas the industries that tend to have a higher number of women are Information (100.0%), Educational Services (90.2%), and Manufacturing (80.4%).
| Industry | Male | Female |
| Agriculture, Fishing & Hunting | 0 (0.0%) | 0 (0.0%) |
| Mining, Quarrying, & Extraction | 0 (0.0%) | 0 (0.0%) |
| Construction | 141 (88.7%) | 18 (11.3%) |
| Manufacturing | 9 (19.6%) | 37 (80.4%) |
| Wholesale Trade | 77 (100.0%) | 0 (0.0%) |
| Retail Trade | 222 (36.0%) | 395 (64.0%) |
| Transportation & Warehousing | 77 (36.5%) | 134 (63.5%) |
| Utilities | 37 (100.0%) | 0 (0.0%) |
| Information | 0 (0.0%) | 13 (100.0%) |
| Finance & Insurance | 19 (25.7%) | 55 (74.3%) |
| Real Estate, Rental & Leasing | 54 (83.1%) | 11 (16.9%) |
| Professional & Scientific | 89 (100.0%) | 0 (0.0%) |
| Enterprise Management | 0 (0.0%) | 0 (0.0%) |
| Administrative & Support | 150 (76.1%) | 47 (23.9%) |
| Educational Services | 16 (9.8%) | 148 (90.2%) |
| Health Care & Social Assistance | 71 (19.7%) | 289 (80.3%) |
| Arts, Entertainment & Recreation | 0 (0.0%) | 0 (0.0%) |
| Accommodation & Food Services | 198 (41.6%) | 278 (58.4%) |
| Public Administration | 181 (66.8%) | 90 (33.2%) |
| Total | 1,422 (47.2%) | 1,591 (52.8%) |
Education in Ewa Villages
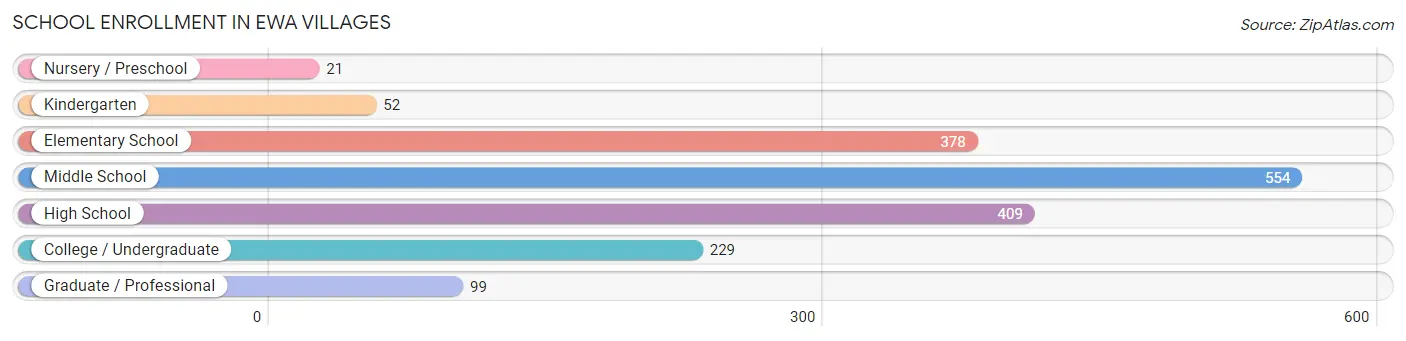
School Enrollment in Ewa Villages
The most common levels of schooling among the 1,742 students in Ewa Villages are middle school (554 | 31.8%), high school (409 | 23.5%), and elementary school (378 | 21.7%).
| School Level | # Students | % Students |
| Nursery / Preschool | 21 | 1.2% |
| Kindergarten | 52 | 3.0% |
| Elementary School | 378 | 21.7% |
| Middle School | 554 | 31.8% |
| High School | 409 | 23.5% |
| College / Undergraduate | 229 | 13.2% |
| Graduate / Professional | 99 | 5.7% |
| Total | 1,742 | 100.0% |
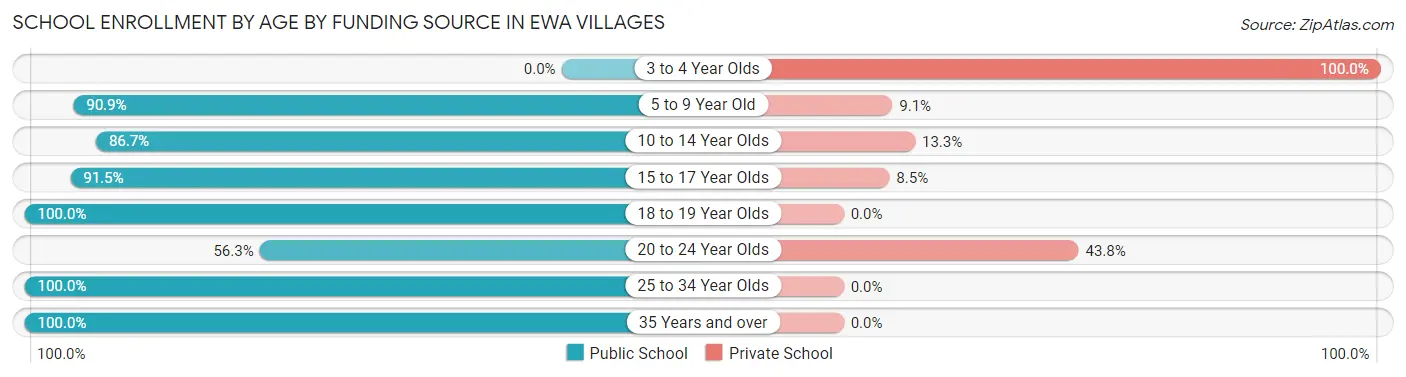
School Enrollment by Age by Funding Source in Ewa Villages
Out of a total of 1,742 students who are enrolled in schools in Ewa Villages, 235 (13.5%) attend a private institution, while the remaining 1,507 (86.5%) are enrolled in public schools. The age group of 3 to 4 year olds has the highest likelihood of being enrolled in private schools, with 21 (100.0% in the age bracket) enrolled. Conversely, the age group of 18 to 19 year olds has the lowest likelihood of being enrolled in a private school, with 115 (100.0% in the age bracket) attending a public institution.
| Age Bracket | Public School | Private School |
| 3 to 4 Year Olds | 0 (0.0%) | 21 (100.0%) |
| 5 to 9 Year Old | 391 (90.9%) | 39 (9.1%) |
| 10 to 14 Year Olds | 489 (86.7%) | 75 (13.3%) |
| 15 to 17 Year Olds | 247 (91.5%) | 23 (8.5%) |
| 18 to 19 Year Olds | 115 (100.0%) | 0 (0.0%) |
| 20 to 24 Year Olds | 99 (56.2%) | 77 (43.8%) |
| 25 to 34 Year Olds | 54 (100.0%) | 0 (0.0%) |
| 35 Years and over | 112 (100.0%) | 0 (0.0%) |
| Total | 1,507 (86.5%) | 235 (13.5%) |
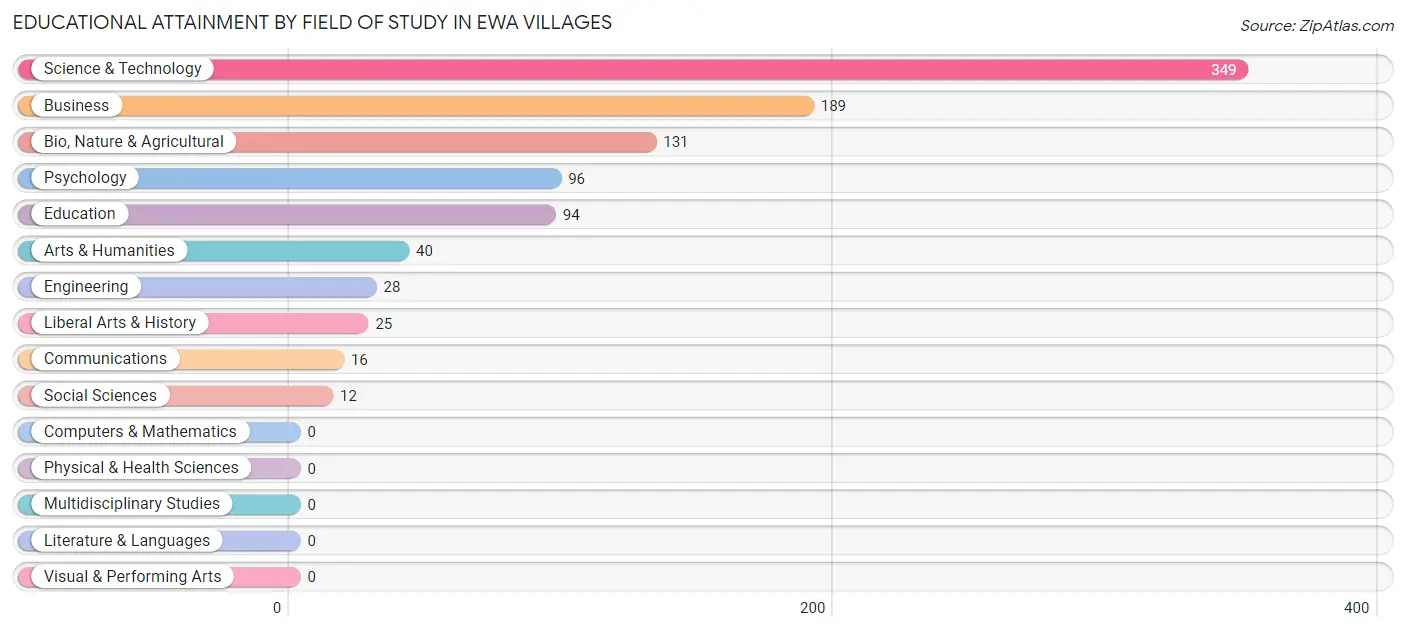
Educational Attainment by Field of Study in Ewa Villages
Science & technology (349 | 35.6%), business (189 | 19.3%), bio, nature & agricultural (131 | 13.4%), psychology (96 | 9.8%), and education (94 | 9.6%) are the most common fields of study among 980 individuals in Ewa Villages who have obtained a bachelor's degree or higher.
| Field of Study | # Graduates | % Graduates |
| Computers & Mathematics | 0 | 0.0% |
| Bio, Nature & Agricultural | 131 | 13.4% |
| Physical & Health Sciences | 0 | 0.0% |
| Psychology | 96 | 9.8% |
| Social Sciences | 12 | 1.2% |
| Engineering | 28 | 2.9% |
| Multidisciplinary Studies | 0 | 0.0% |
| Science & Technology | 349 | 35.6% |
| Business | 189 | 19.3% |
| Education | 94 | 9.6% |
| Literature & Languages | 0 | 0.0% |
| Liberal Arts & History | 25 | 2.5% |
| Visual & Performing Arts | 0 | 0.0% |
| Communications | 16 | 1.6% |
| Arts & Humanities | 40 | 4.1% |
| Total | 980 | 100.0% |
Transportation & Commute in Ewa Villages
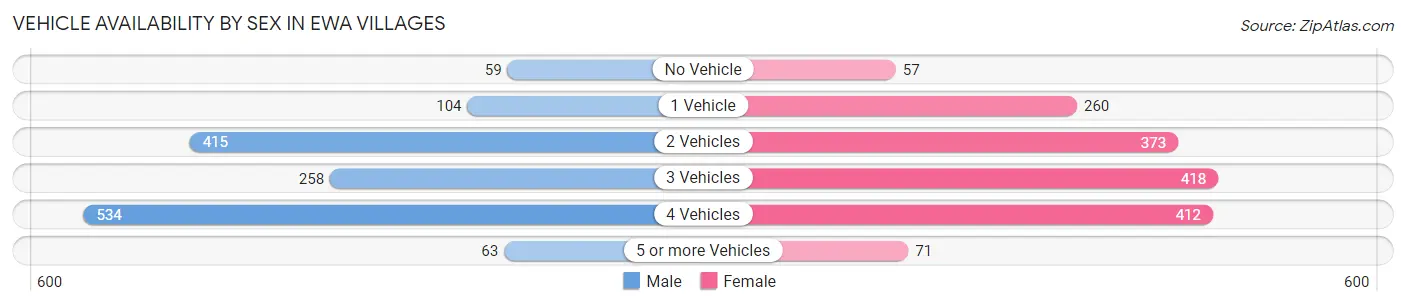
Vehicle Availability by Sex in Ewa Villages
The most prevalent vehicle ownership categories in Ewa Villages are males with 4 vehicles (534, accounting for 37.3%) and females with 4 vehicles (412, making up 33.6%).
| Vehicles Available | Male | Female |
| No Vehicle | 59 (4.1%) | 57 (3.6%) |
| 1 Vehicle | 104 (7.3%) | 260 (16.3%) |
| 2 Vehicles | 415 (29.0%) | 373 (23.4%) |
| 3 Vehicles | 258 (18.0%) | 418 (26.3%) |
| 4 Vehicles | 534 (37.3%) | 412 (25.9%) |
| 5 or more Vehicles | 63 (4.4%) | 71 (4.5%) |
| Total | 1,433 (100.0%) | 1,591 (100.0%) |
Commute Time in Ewa Villages
The most frequently occuring commute durations in Ewa Villages are 30 to 34 minutes (604 commuters, 20.7%), 45 to 59 minutes (407 commuters, 14.0%), and 25 to 29 minutes (352 commuters, 12.1%).
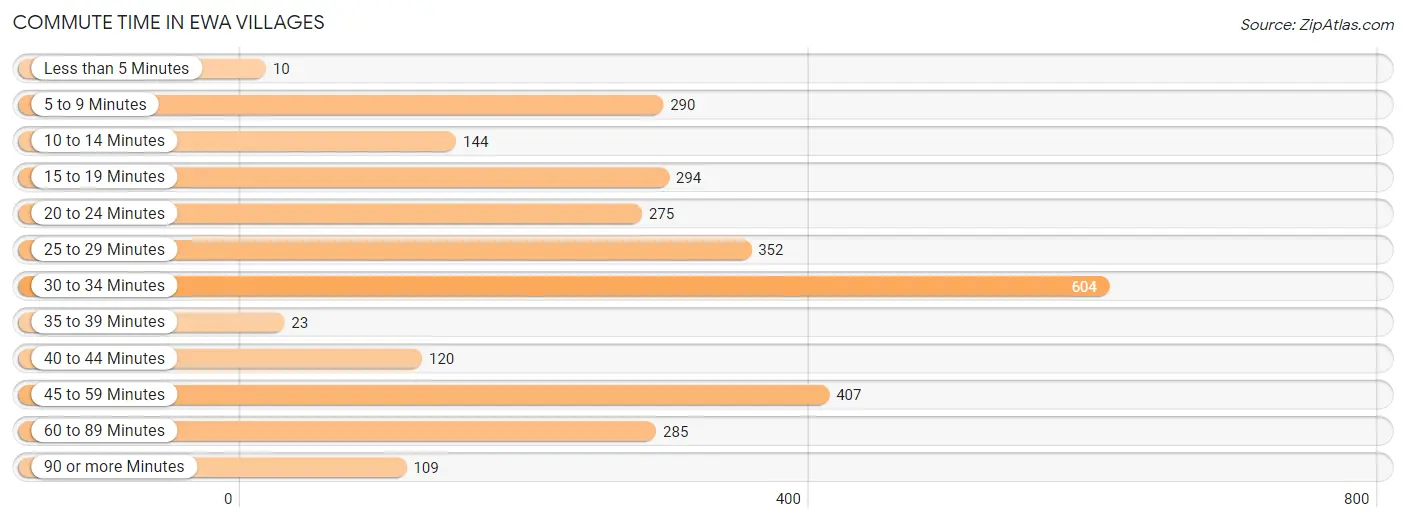
| Commute Time | # Commuters | % Commuters |
| Less than 5 Minutes | 10 | 0.3% |
| 5 to 9 Minutes | 290 | 10.0% |
| 10 to 14 Minutes | 144 | 4.9% |
| 15 to 19 Minutes | 294 | 10.1% |
| 20 to 24 Minutes | 275 | 9.4% |
| 25 to 29 Minutes | 352 | 12.1% |
| 30 to 34 Minutes | 604 | 20.7% |
| 35 to 39 Minutes | 23 | 0.8% |
| 40 to 44 Minutes | 120 | 4.1% |
| 45 to 59 Minutes | 407 | 14.0% |
| 60 to 89 Minutes | 285 | 9.8% |
| 90 or more Minutes | 109 | 3.7% |
Commute Time by Sex in Ewa Villages
The most common commute times in Ewa Villages are 30 to 34 minutes (398 commuters, 29.0%) for males and 25 to 29 minutes (253 commuters, 16.4%) for females.
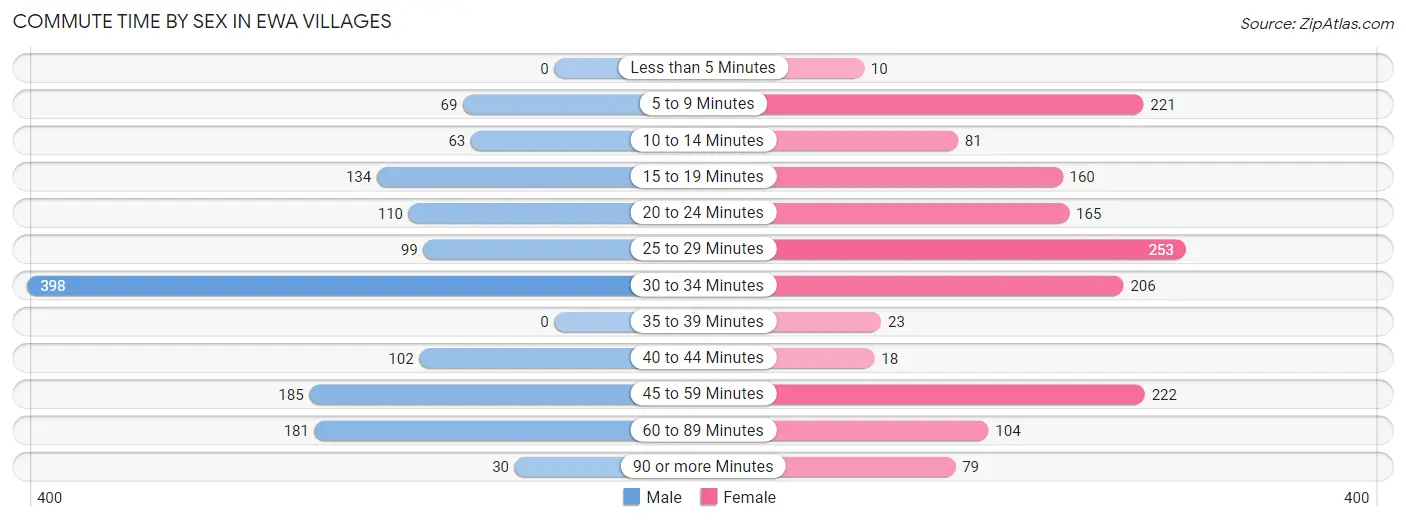
| Commute Time | Male | Female |
| Less than 5 Minutes | 0 (0.0%) | 10 (0.6%) |
| 5 to 9 Minutes | 69 (5.0%) | 221 (14.3%) |
| 10 to 14 Minutes | 63 (4.6%) | 81 (5.2%) |
| 15 to 19 Minutes | 134 (9.8%) | 160 (10.4%) |
| 20 to 24 Minutes | 110 (8.0%) | 165 (10.7%) |
| 25 to 29 Minutes | 99 (7.2%) | 253 (16.4%) |
| 30 to 34 Minutes | 398 (29.0%) | 206 (13.4%) |
| 35 to 39 Minutes | 0 (0.0%) | 23 (1.5%) |
| 40 to 44 Minutes | 102 (7.4%) | 18 (1.2%) |
| 45 to 59 Minutes | 185 (13.5%) | 222 (14.4%) |
| 60 to 89 Minutes | 181 (13.2%) | 104 (6.7%) |
| 90 or more Minutes | 30 (2.2%) | 79 (5.1%) |
Time of Departure to Work by Sex in Ewa Villages
The most frequent times of departure to work in Ewa Villages are 6:00 AM to 6:29 AM (254, 18.5%) for males and 6:00 AM to 6:29 AM (300, 19.5%) for females.
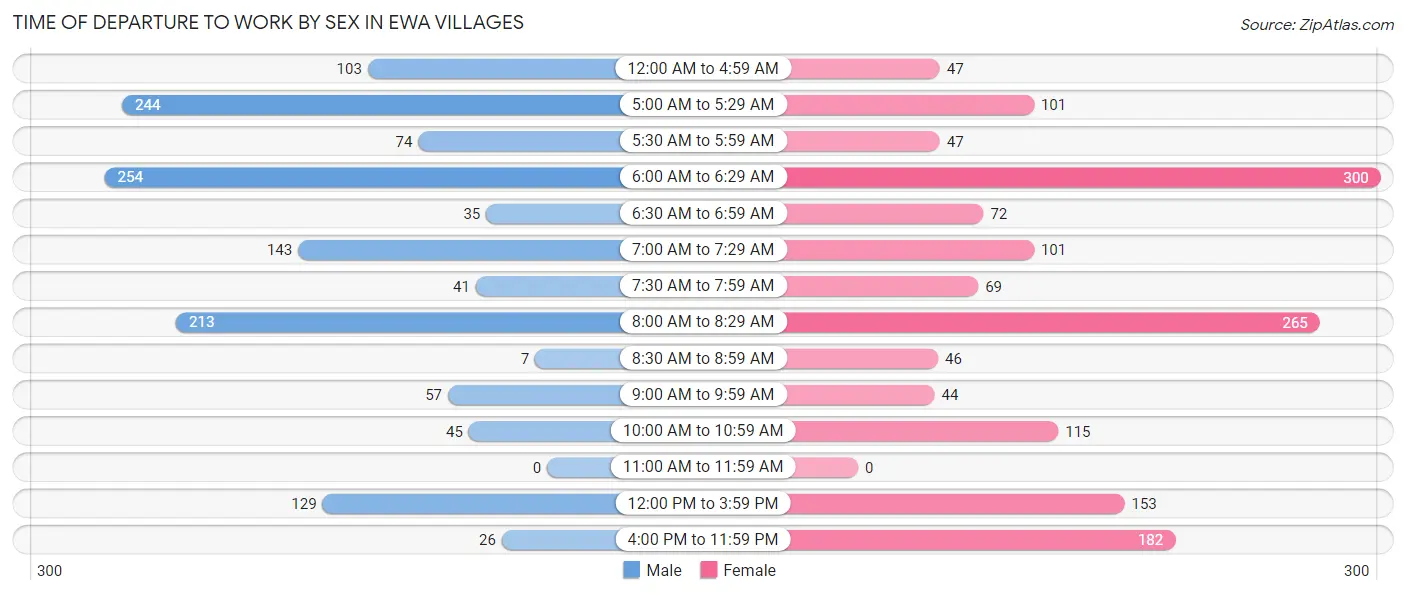
| Time of Departure | Male | Female |
| 12:00 AM to 4:59 AM | 103 (7.5%) | 47 (3.0%) |
| 5:00 AM to 5:29 AM | 244 (17.8%) | 101 (6.6%) |
| 5:30 AM to 5:59 AM | 74 (5.4%) | 47 (3.0%) |
| 6:00 AM to 6:29 AM | 254 (18.5%) | 300 (19.5%) |
| 6:30 AM to 6:59 AM | 35 (2.5%) | 72 (4.7%) |
| 7:00 AM to 7:29 AM | 143 (10.4%) | 101 (6.6%) |
| 7:30 AM to 7:59 AM | 41 (3.0%) | 69 (4.5%) |
| 8:00 AM to 8:29 AM | 213 (15.5%) | 265 (17.2%) |
| 8:30 AM to 8:59 AM | 7 (0.5%) | 46 (3.0%) |
| 9:00 AM to 9:59 AM | 57 (4.2%) | 44 (2.9%) |
| 10:00 AM to 10:59 AM | 45 (3.3%) | 115 (7.5%) |
| 11:00 AM to 11:59 AM | 0 (0.0%) | 0 (0.0%) |
| 12:00 PM to 3:59 PM | 129 (9.4%) | 153 (9.9%) |
| 4:00 PM to 11:59 PM | 26 (1.9%) | 182 (11.8%) |
| Total | 1,371 (100.0%) | 1,542 (100.0%) |
Housing Occupancy in Ewa Villages
Occupancy by Ownership in Ewa Villages
Of the total 1,756 dwellings in Ewa Villages, owner-occupied units account for 1,148 (65.4%), while renter-occupied units make up 608 (34.6%).
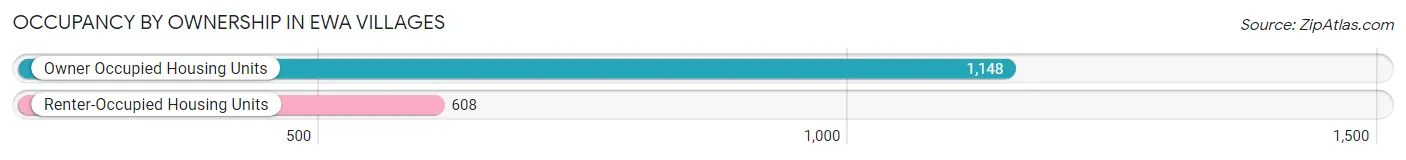
| Occupancy | # Housing Units | % Housing Units |
| Owner Occupied Housing Units | 1,148 | 65.4% |
| Renter-Occupied Housing Units | 608 | 34.6% |
| Total Occupied Housing Units | 1,756 | 100.0% |
Occupancy by Household Size in Ewa Villages
| Household Size | # Housing Units | % Housing Units |
| 1-Person Household | 399 | 22.7% |
| 2-Person Household | 349 | 19.9% |
| 3-Person Household | 166 | 9.5% |
| 4+ Person Household | 842 | 47.9% |
| Total Housing Units | 1,756 | 100.0% |
Occupancy by Ownership by Household Size in Ewa Villages
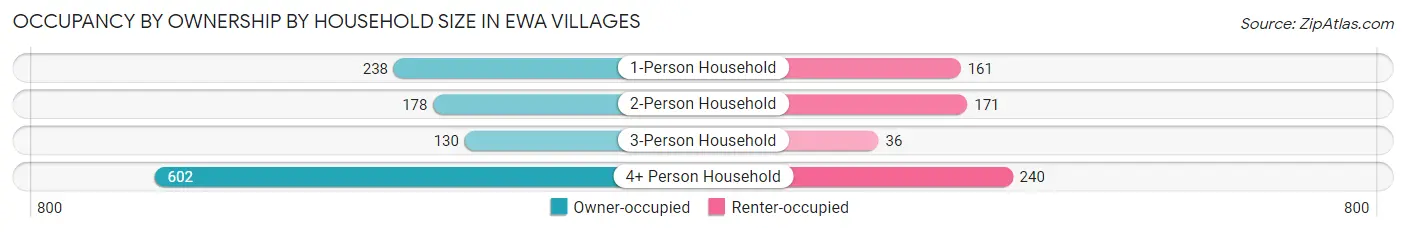
| Household Size | Owner-occupied | Renter-occupied |
| 1-Person Household | 238 (59.7%) | 161 (40.4%) |
| 2-Person Household | 178 (51.0%) | 171 (49.0%) |
| 3-Person Household | 130 (78.3%) | 36 (21.7%) |
| 4+ Person Household | 602 (71.5%) | 240 (28.5%) |
| Total Housing Units | 1,148 (65.4%) | 608 (34.6%) |
Occupancy by Educational Attainment in Ewa Villages
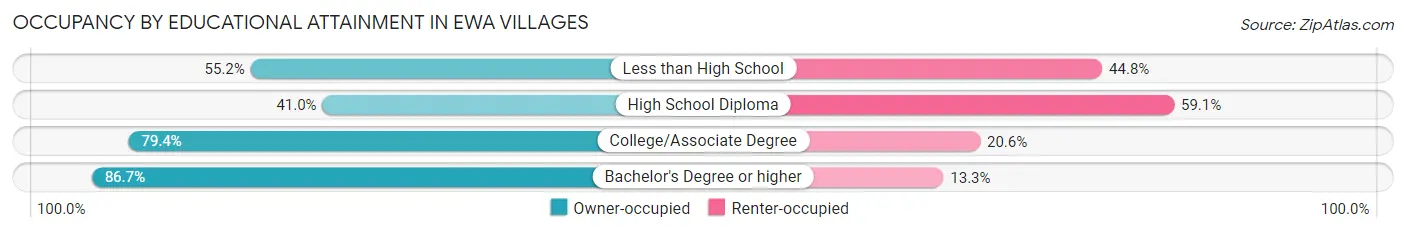
| Household Size | Owner-occupied | Renter-occupied |
| Less than High School | 117 (55.2%) | 95 (44.8%) |
| High School Diploma | 242 (40.9%) | 349 (59.1%) |
| College/Associate Degree | 405 (79.4%) | 105 (20.6%) |
| Bachelor's Degree or higher | 384 (86.7%) | 59 (13.3%) |
Occupancy by Age of Householder in Ewa Villages
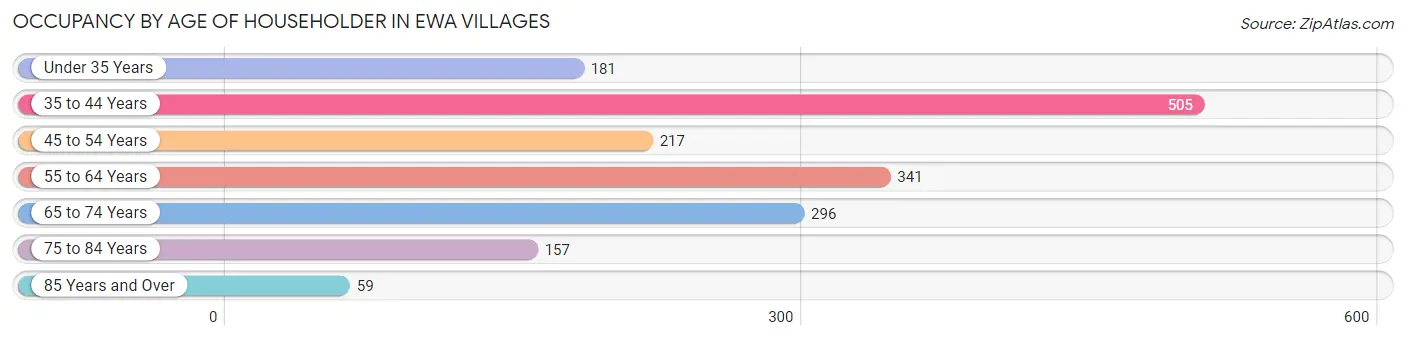
| Age Bracket | # Households | % Households |
| Under 35 Years | 181 | 10.3% |
| 35 to 44 Years | 505 | 28.8% |
| 45 to 54 Years | 217 | 12.4% |
| 55 to 64 Years | 341 | 19.4% |
| 65 to 74 Years | 296 | 16.9% |
| 75 to 84 Years | 157 | 8.9% |
| 85 Years and Over | 59 | 3.4% |
| Total | 1,756 | 100.0% |
Housing Finances in Ewa Villages
Median Income by Occupancy in Ewa Villages
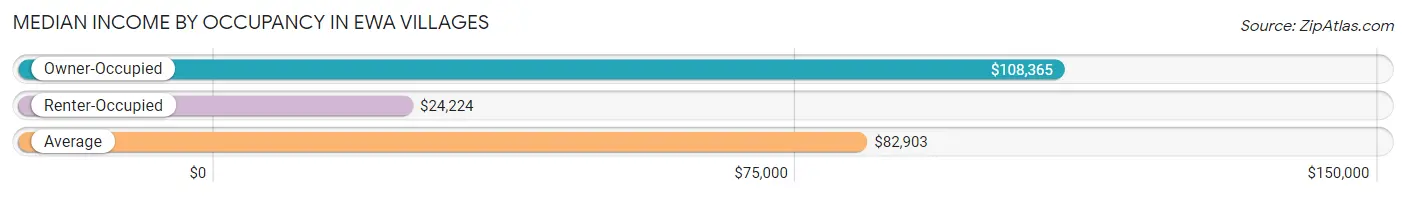
| Occupancy Type | # Households | Median Income |
| Owner-Occupied | 1,148 (65.4%) | $108,365 |
| Renter-Occupied | 608 (34.6%) | $24,224 |
| Average | 1,756 (100.0%) | $82,903 |
Occupancy by Householder Income Bracket in Ewa Villages
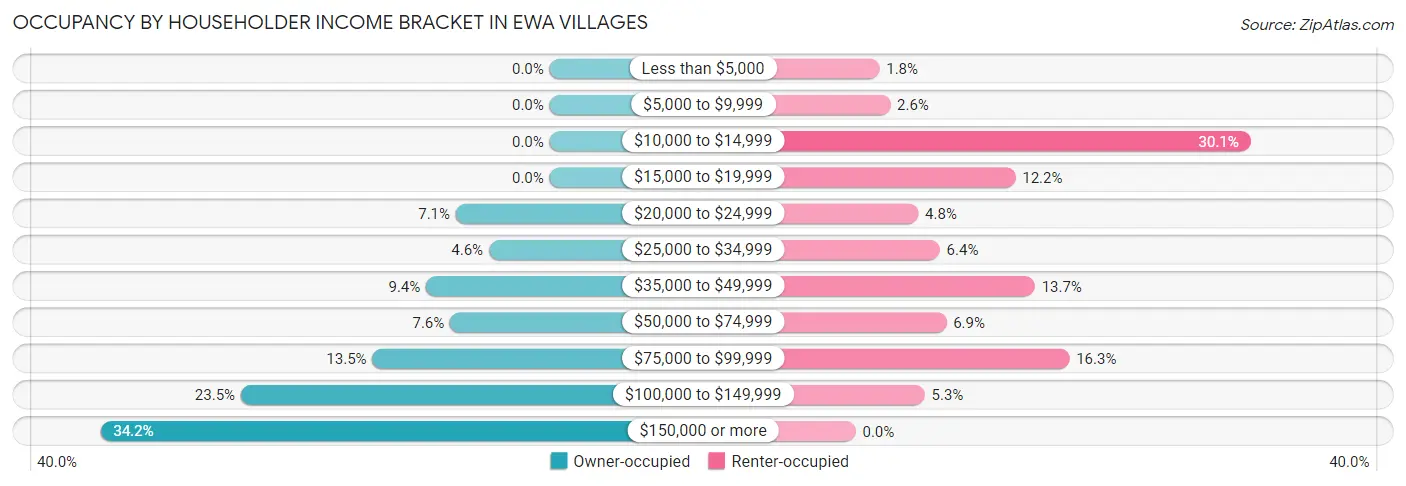
| Income Bracket | Owner-occupied | Renter-occupied |
| Less than $5,000 | 0 (0.0%) | 11 (1.8%) |
| $5,000 to $9,999 | 0 (0.0%) | 16 (2.6%) |
| $10,000 to $14,999 | 0 (0.0%) | 183 (30.1%) |
| $15,000 to $19,999 | 0 (0.0%) | 74 (12.2%) |
| $20,000 to $24,999 | 82 (7.1%) | 29 (4.8%) |
| $25,000 to $34,999 | 53 (4.6%) | 39 (6.4%) |
| $35,000 to $49,999 | 108 (9.4%) | 83 (13.7%) |
| $50,000 to $74,999 | 87 (7.6%) | 42 (6.9%) |
| $75,000 to $99,999 | 155 (13.5%) | 99 (16.3%) |
| $100,000 to $149,999 | 270 (23.5%) | 32 (5.3%) |
| $150,000 or more | 393 (34.2%) | 0 (0.0%) |
| Total | 1,148 (100.0%) | 608 (100.0%) |
Monthly Housing Cost Tiers in Ewa Villages
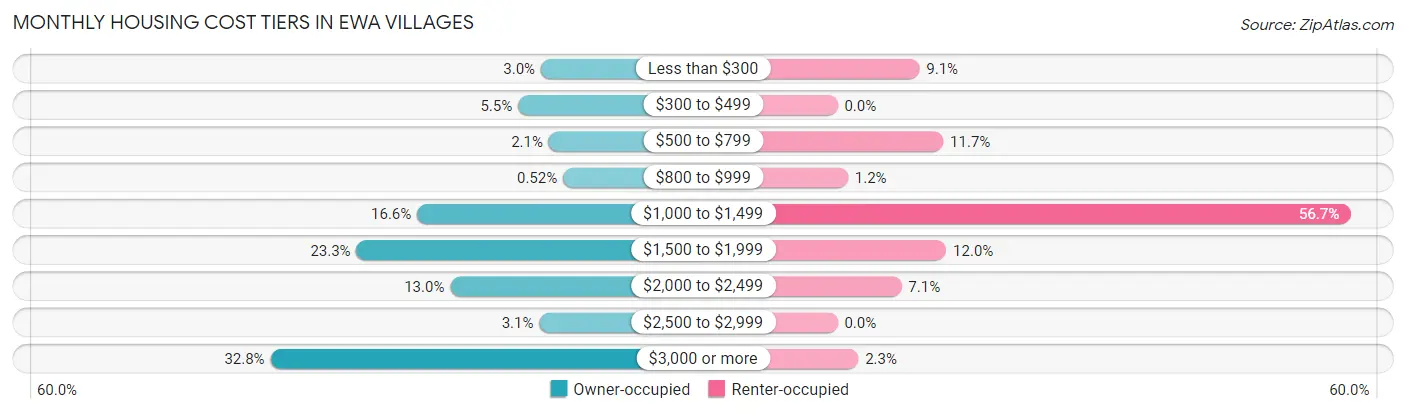
| Monthly Cost | Owner-occupied | Renter-occupied |
| Less than $300 | 34 (3.0%) | 55 (9.0%) |
| $300 to $499 | 63 (5.5%) | 0 (0.0%) |
| $500 to $799 | 24 (2.1%) | 71 (11.7%) |
| $800 to $999 | 6 (0.5%) | 7 (1.1%) |
| $1,000 to $1,499 | 191 (16.6%) | 345 (56.7%) |
| $1,500 to $1,999 | 268 (23.3%) | 73 (12.0%) |
| $2,000 to $2,499 | 149 (13.0%) | 43 (7.1%) |
| $2,500 to $2,999 | 36 (3.1%) | 0 (0.0%) |
| $3,000 or more | 377 (32.8%) | 14 (2.3%) |
| Total | 1,148 (100.0%) | 608 (100.0%) |
Physical Housing Characteristics in Ewa Villages
Housing Structures in Ewa Villages
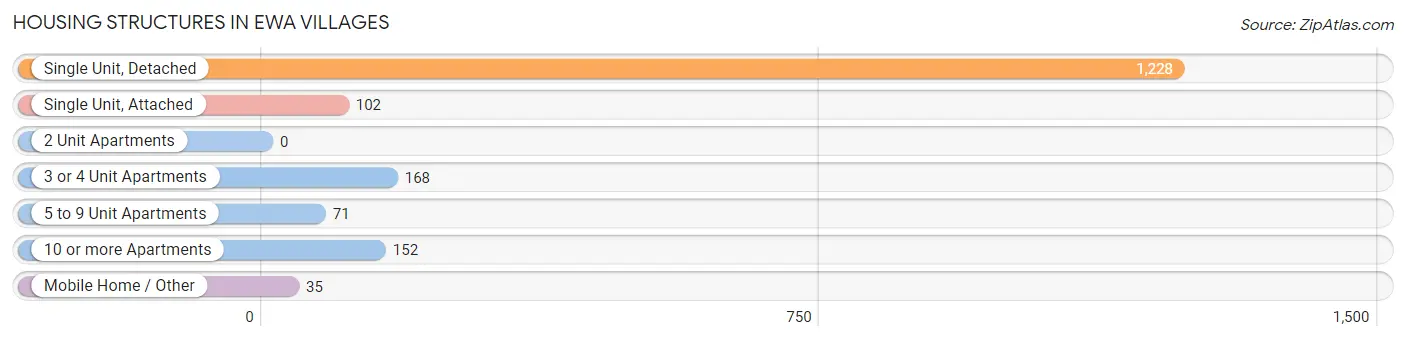
| Structure Type | # Housing Units | % Housing Units |
| Single Unit, Detached | 1,228 | 69.9% |
| Single Unit, Attached | 102 | 5.8% |
| 2 Unit Apartments | 0 | 0.0% |
| 3 or 4 Unit Apartments | 168 | 9.6% |
| 5 to 9 Unit Apartments | 71 | 4.0% |
| 10 or more Apartments | 152 | 8.7% |
| Mobile Home / Other | 35 | 2.0% |
| Total | 1,756 | 100.0% |
Housing Structures by Occupancy in Ewa Villages
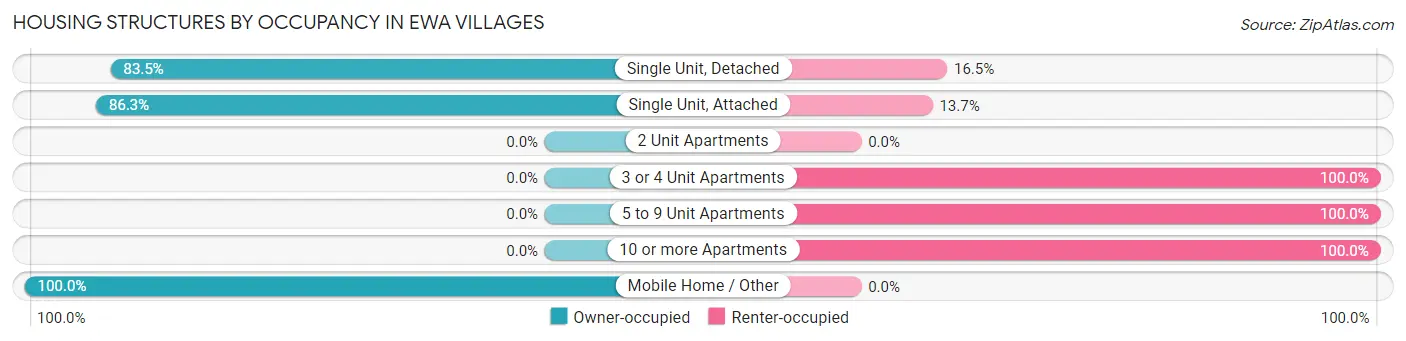
| Structure Type | Owner-occupied | Renter-occupied |
| Single Unit, Detached | 1,025 (83.5%) | 203 (16.5%) |
| Single Unit, Attached | 88 (86.3%) | 14 (13.7%) |
| 2 Unit Apartments | 0 (0.0%) | 0 (0.0%) |
| 3 or 4 Unit Apartments | 0 (0.0%) | 168 (100.0%) |
| 5 to 9 Unit Apartments | 0 (0.0%) | 71 (100.0%) |
| 10 or more Apartments | 0 (0.0%) | 152 (100.0%) |
| Mobile Home / Other | 35 (100.0%) | 0 (0.0%) |
| Total | 1,148 (65.4%) | 608 (34.6%) |
Housing Structures by Number of Rooms in Ewa Villages
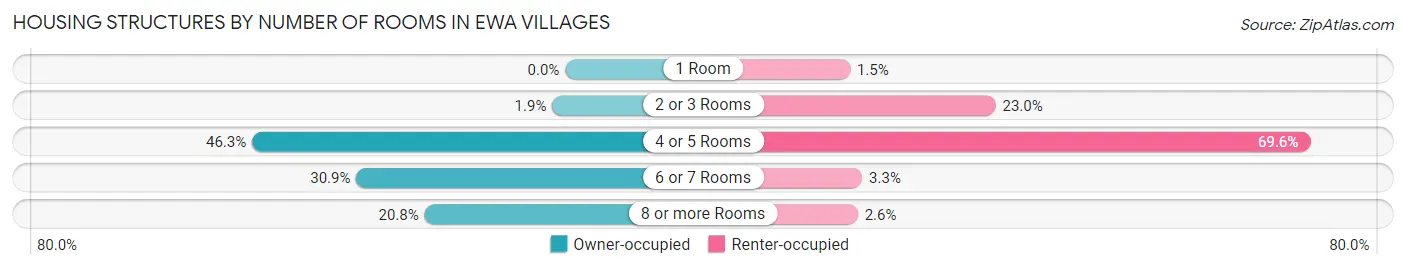
| Number of Rooms | Owner-occupied | Renter-occupied |
| 1 Room | 0 (0.0%) | 9 (1.5%) |
| 2 or 3 Rooms | 22 (1.9%) | 140 (23.0%) |
| 4 or 5 Rooms | 532 (46.3%) | 423 (69.6%) |
| 6 or 7 Rooms | 355 (30.9%) | 20 (3.3%) |
| 8 or more Rooms | 239 (20.8%) | 16 (2.6%) |
| Total | 1,148 (100.0%) | 608 (100.0%) |
Housing Structure by Heating Type in Ewa Villages
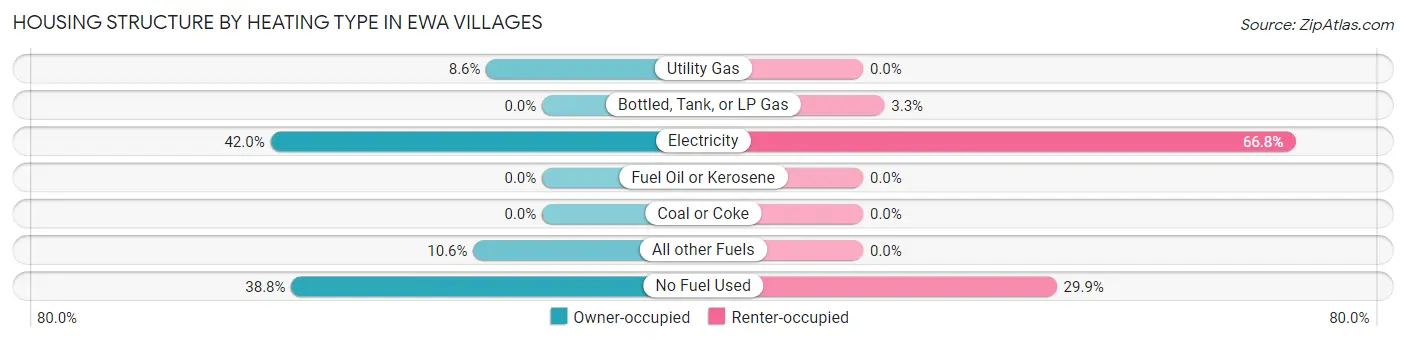
| Heating Type | Owner-occupied | Renter-occupied |
| Utility Gas | 99 (8.6%) | 0 (0.0%) |
| Bottled, Tank, or LP Gas | 0 (0.0%) | 20 (3.3%) |
| Electricity | 482 (42.0%) | 406 (66.8%) |
| Fuel Oil or Kerosene | 0 (0.0%) | 0 (0.0%) |
| Coal or Coke | 0 (0.0%) | 0 (0.0%) |
| All other Fuels | 122 (10.6%) | 0 (0.0%) |
| No Fuel Used | 445 (38.8%) | 182 (29.9%) |
| Total | 1,148 (100.0%) | 608 (100.0%) |
Household Vehicle Usage in Ewa Villages
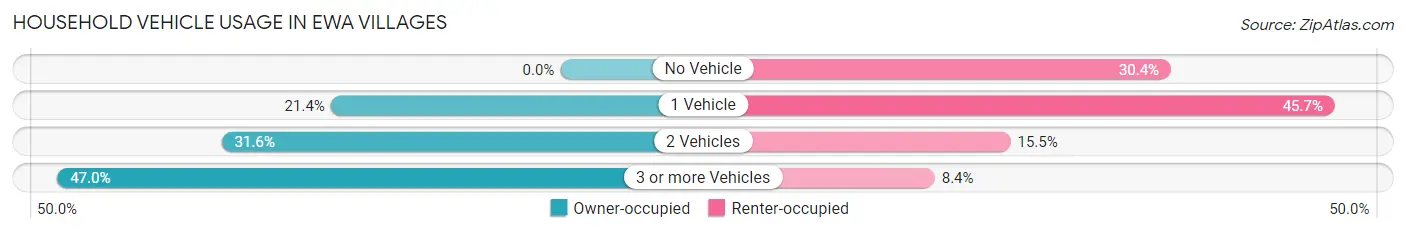
| Vehicles per Household | Owner-occupied | Renter-occupied |
| No Vehicle | 0 (0.0%) | 185 (30.4%) |
| 1 Vehicle | 246 (21.4%) | 278 (45.7%) |
| 2 Vehicles | 363 (31.6%) | 94 (15.5%) |
| 3 or more Vehicles | 539 (46.9%) | 51 (8.4%) |
| Total | 1,148 (100.0%) | 608 (100.0%) |
Real Estate & Mortgages in Ewa Villages
Real Estate and Mortgage Overview in Ewa Villages
| Characteristic | Without Mortgage | With Mortgage |
| Housing Units | 277 | 871 |
| Median Property Value | $747,400 | $762,800 |
| Median Household Income | $87,331 | $378 |
| Monthly Housing Costs | $1,031 | $377 |
| Real Estate Taxes | $1,968 | $124 |
Property Value by Mortgage Status in Ewa Villages
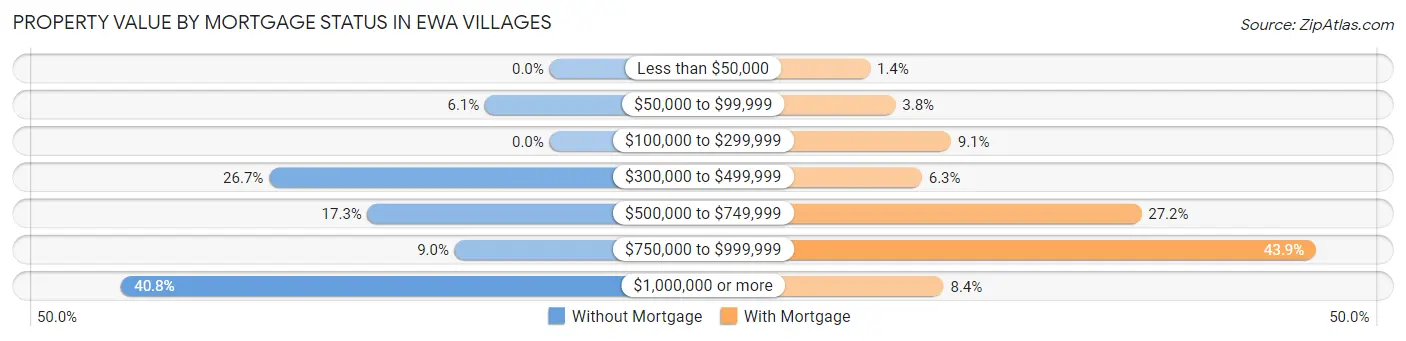
| Property Value | Without Mortgage | With Mortgage |
| Less than $50,000 | 0 (0.0%) | 12 (1.4%) |
| $50,000 to $99,999 | 17 (6.1%) | 33 (3.8%) |
| $100,000 to $299,999 | 0 (0.0%) | 79 (9.1%) |
| $300,000 to $499,999 | 74 (26.7%) | 55 (6.3%) |
| $500,000 to $749,999 | 48 (17.3%) | 237 (27.2%) |
| $750,000 to $999,999 | 25 (9.0%) | 382 (43.9%) |
| $1,000,000 or more | 113 (40.8%) | 73 (8.4%) |
| Total | 277 (100.0%) | 871 (100.0%) |
Household Income by Mortgage Status in Ewa Villages
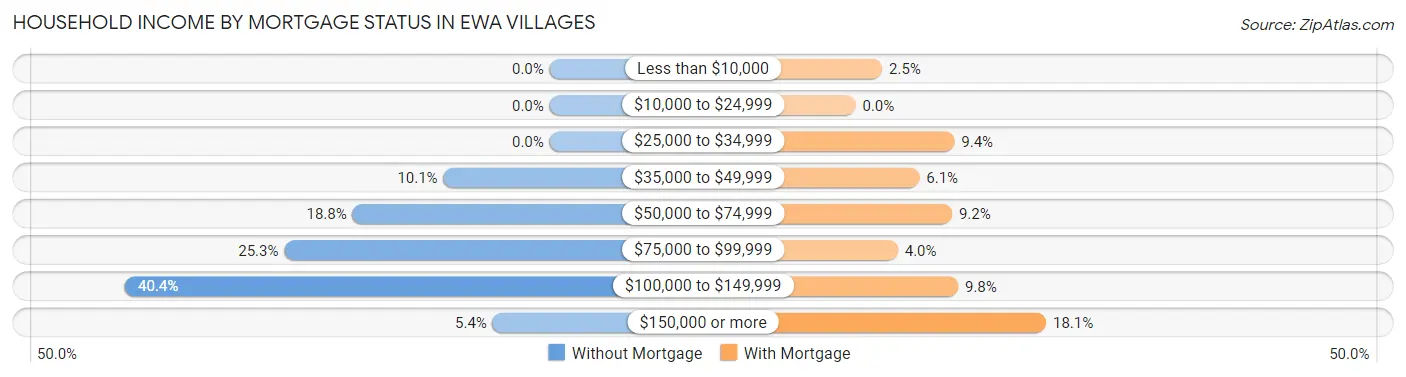
| Household Income | Without Mortgage | With Mortgage |
| Less than $10,000 | 0 (0.0%) | 22 (2.5%) |
| $10,000 to $24,999 | 0 (0.0%) | 0 (0.0%) |
| $25,000 to $34,999 | 0 (0.0%) | 82 (9.4%) |
| $35,000 to $49,999 | 28 (10.1%) | 53 (6.1%) |
| $50,000 to $74,999 | 52 (18.8%) | 80 (9.2%) |
| $75,000 to $99,999 | 70 (25.3%) | 35 (4.0%) |
| $100,000 to $149,999 | 112 (40.4%) | 85 (9.8%) |
| $150,000 or more | 15 (5.4%) | 158 (18.1%) |
| Total | 277 (100.0%) | 871 (100.0%) |
Property Value to Household Income Ratio in Ewa Villages
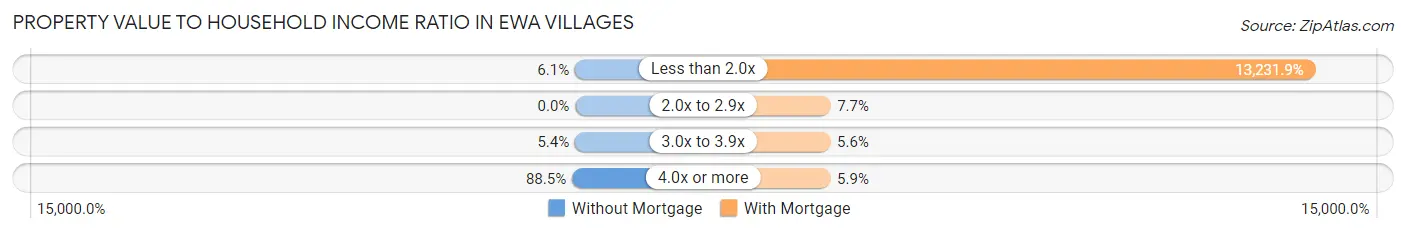
| Value-to-Income Ratio | Without Mortgage | With Mortgage |
| Less than 2.0x | 17 (6.1%) | 115,250 (13,231.9%) |
| 2.0x to 2.9x | 0 (0.0%) | 67 (7.7%) |
| 3.0x to 3.9x | 15 (5.4%) | 49 (5.6%) |
| 4.0x or more | 245 (88.4%) | 51 (5.9%) |
| Total | 277 (100.0%) | 871 (100.0%) |
Real Estate Taxes by Mortgage Status in Ewa Villages
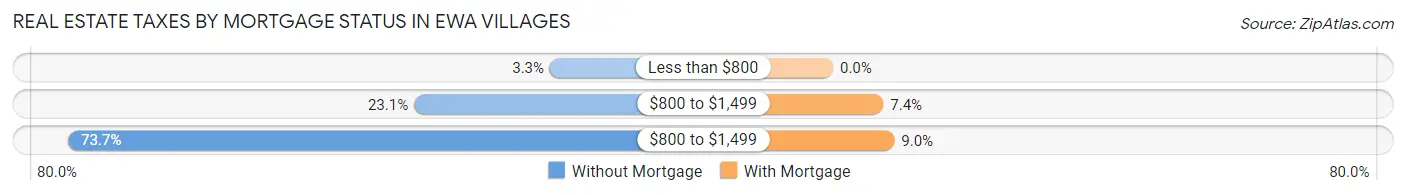
| Property Taxes | Without Mortgage | With Mortgage |
| Less than $800 | 9 (3.3%) | 0 (0.0%) |
| $800 to $1,499 | 64 (23.1%) | 64 (7.3%) |
| $800 to $1,499 | 204 (73.7%) | 78 (9.0%) |
| Total | 277 (100.0%) | 871 (100.0%) |
Health & Disability in Ewa Villages
Health Insurance Coverage by Age in Ewa Villages
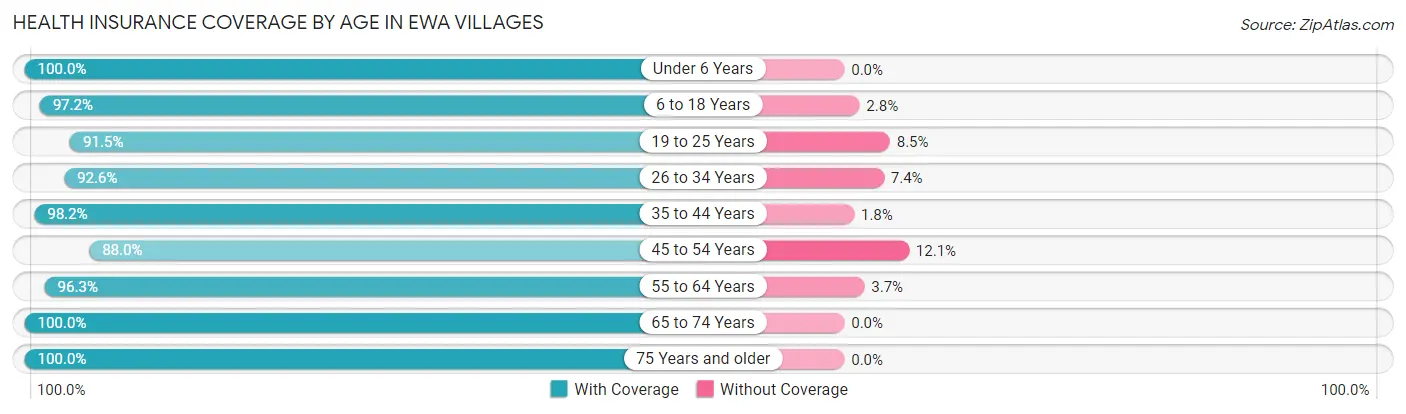
| Age Bracket | With Coverage | Without Coverage |
| Under 6 Years | 602 (100.0%) | 0 (0.0%) |
| 6 to 18 Years | 1,239 (97.2%) | 36 (2.8%) |
| 19 to 25 Years | 507 (91.5%) | 47 (8.5%) |
| 26 to 34 Years | 528 (92.6%) | 42 (7.4%) |
| 35 to 44 Years | 970 (98.2%) | 18 (1.8%) |
| 45 to 54 Years | 642 (87.9%) | 88 (12.0%) |
| 55 to 64 Years | 670 (96.3%) | 26 (3.7%) |
| 65 to 74 Years | 541 (100.0%) | 0 (0.0%) |
| 75 Years and older | 521 (100.0%) | 0 (0.0%) |
| Total | 6,220 (96.0%) | 257 (4.0%) |
Health Insurance Coverage by Citizenship Status in Ewa Villages
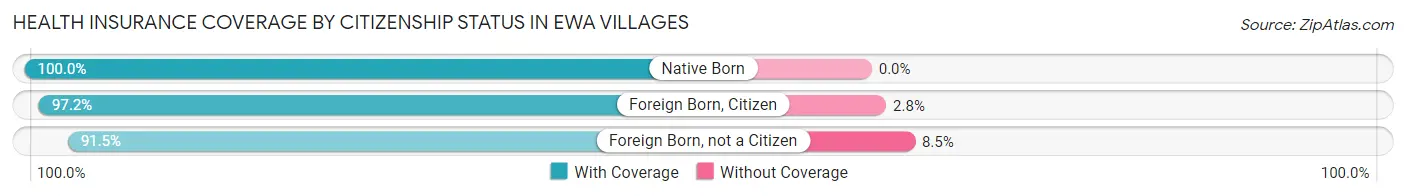
| Citizenship Status | With Coverage | Without Coverage |
| Native Born | 602 (100.0%) | 0 (0.0%) |
| Foreign Born, Citizen | 1,239 (97.2%) | 36 (2.8%) |
| Foreign Born, not a Citizen | 507 (91.5%) | 47 (8.5%) |
Health Insurance Coverage by Household Income in Ewa Villages
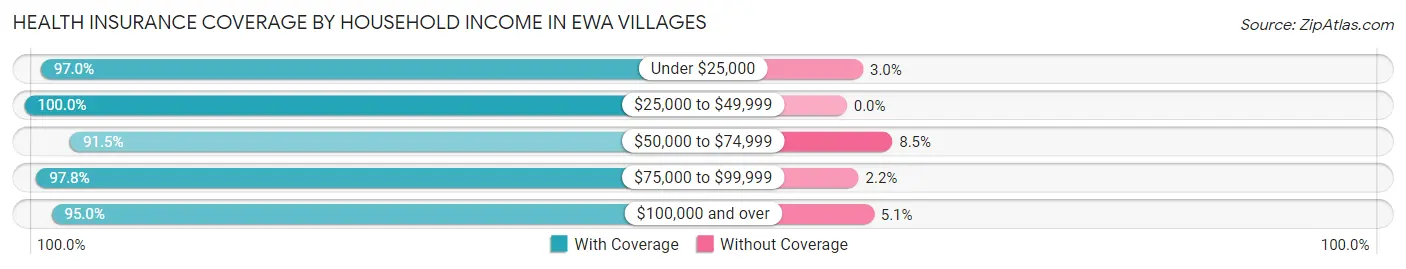
| Household Income | With Coverage | Without Coverage |
| Under $25,000 | 828 (97.0%) | 26 (3.0%) |
| $25,000 to $49,999 | 876 (100.0%) | 0 (0.0%) |
| $50,000 to $74,999 | 322 (91.5%) | 30 (8.5%) |
| $75,000 to $99,999 | 709 (97.8%) | 16 (2.2%) |
| $100,000 and over | 3,476 (95.0%) | 185 (5.1%) |
Public vs Private Health Insurance Coverage by Age in Ewa Villages
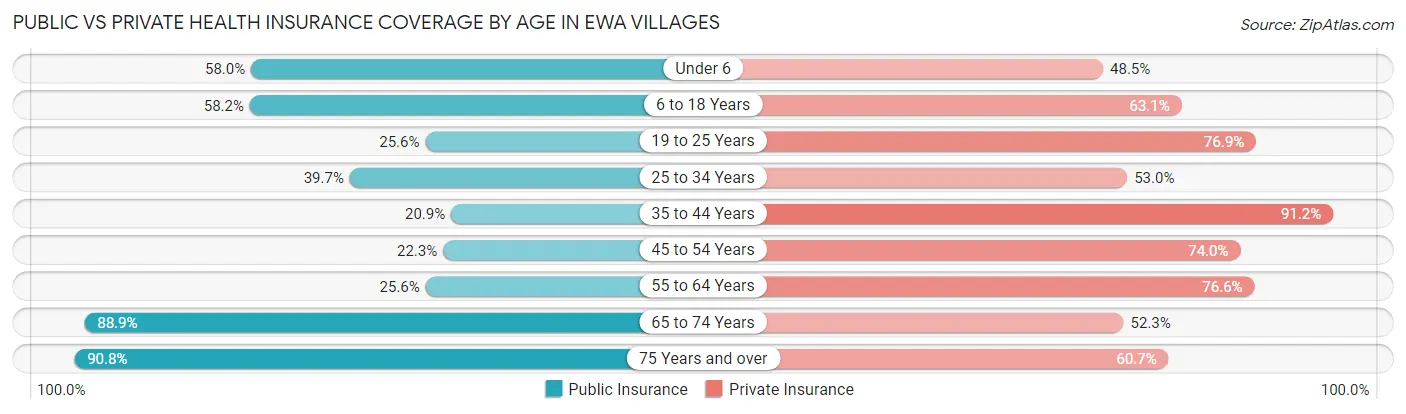
| Age Bracket | Public Insurance | Private Insurance |
| Under 6 | 349 (58.0%) | 292 (48.5%) |
| 6 to 18 Years | 742 (58.2%) | 804 (63.1%) |
| 19 to 25 Years | 142 (25.6%) | 426 (76.9%) |
| 25 to 34 Years | 226 (39.7%) | 302 (53.0%) |
| 35 to 44 Years | 206 (20.8%) | 901 (91.2%) |
| 45 to 54 Years | 163 (22.3%) | 540 (74.0%) |
| 55 to 64 Years | 178 (25.6%) | 533 (76.6%) |
| 65 to 74 Years | 481 (88.9%) | 283 (52.3%) |
| 75 Years and over | 473 (90.8%) | 316 (60.7%) |
| Total | 2,960 (45.7%) | 4,397 (67.9%) |
Disability Status by Sex by Age in Ewa Villages
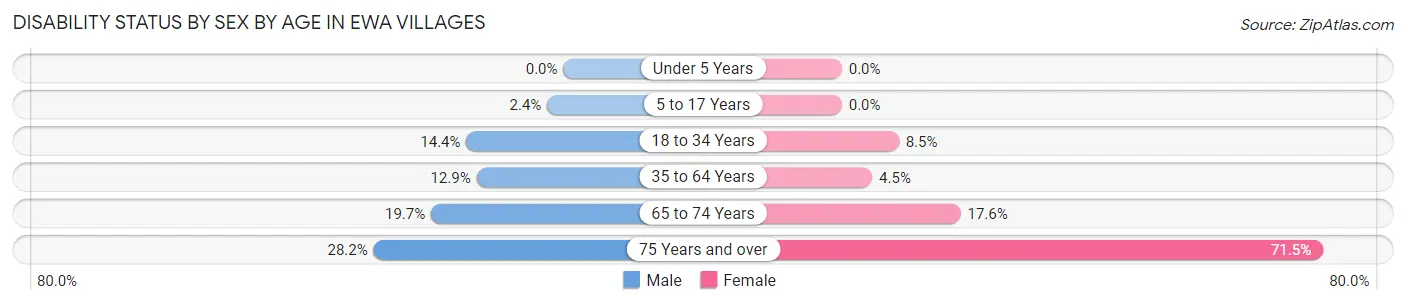
| Age Bracket | Male | Female |
| Under 5 Years | 0 (0.0%) | 0 (0.0%) |
| 5 to 17 Years | 19 (2.4%) | 0 (0.0%) |
| 18 to 34 Years | 89 (14.4%) | 47 (8.5%) |
| 35 to 64 Years | 140 (12.9%) | 60 (4.5%) |
| 65 to 74 Years | 45 (19.7%) | 55 (17.6%) |
| 75 Years and over | 51 (28.2%) | 243 (71.5%) |
Disability Class by Sex by Age in Ewa Villages
Disability Class: Hearing Difficulty
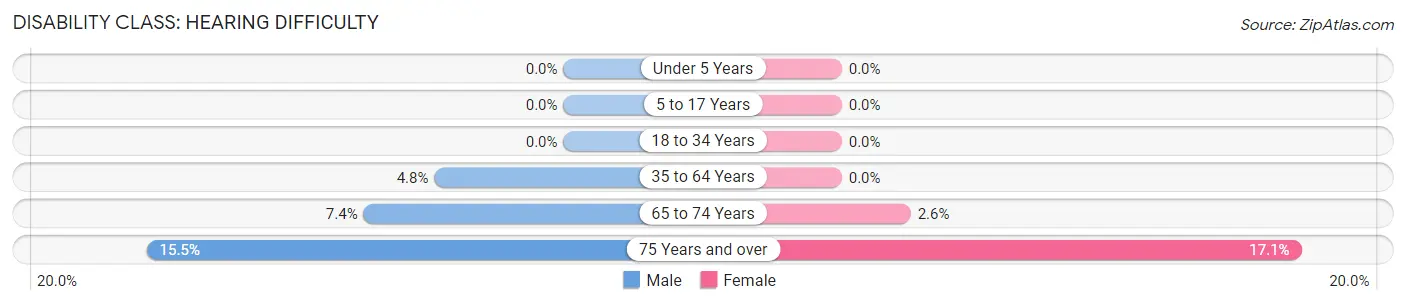
| Age Bracket | Male | Female |
| Under 5 Years | 0 (0.0%) | 0 (0.0%) |
| 5 to 17 Years | 0 (0.0%) | 0 (0.0%) |
| 18 to 34 Years | 0 (0.0%) | 0 (0.0%) |
| 35 to 64 Years | 52 (4.8%) | 0 (0.0%) |
| 65 to 74 Years | 17 (7.4%) | 8 (2.6%) |
| 75 Years and over | 28 (15.5%) | 58 (17.1%) |
Disability Class: Vision Difficulty
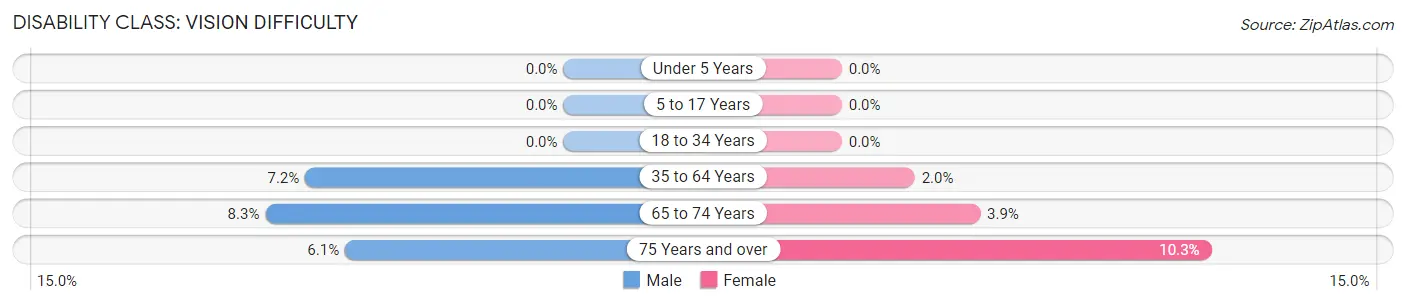
| Age Bracket | Male | Female |
| Under 5 Years | 0 (0.0%) | 0 (0.0%) |
| 5 to 17 Years | 0 (0.0%) | 0 (0.0%) |
| 18 to 34 Years | 0 (0.0%) | 0 (0.0%) |
| 35 to 64 Years | 78 (7.2%) | 27 (2.0%) |
| 65 to 74 Years | 19 (8.3%) | 12 (3.8%) |
| 75 Years and over | 11 (6.1%) | 35 (10.3%) |
Disability Class: Cognitive Difficulty
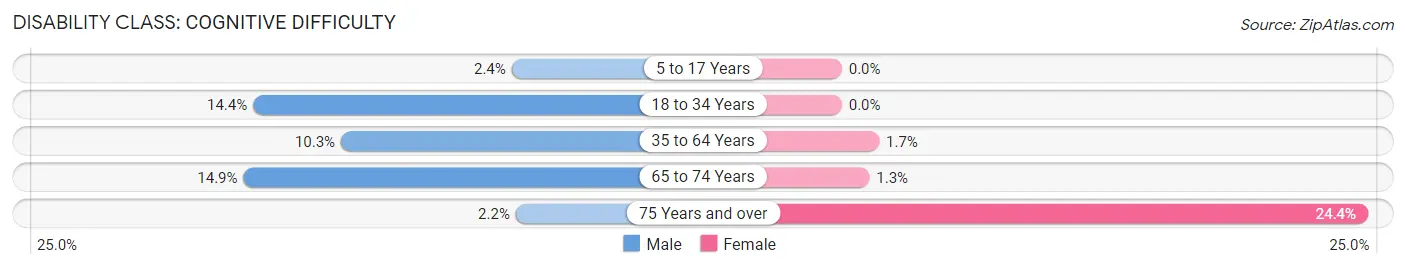
| Age Bracket | Male | Female |
| 5 to 17 Years | 19 (2.4%) | 0 (0.0%) |
| 18 to 34 Years | 89 (14.4%) | 0 (0.0%) |
| 35 to 64 Years | 112 (10.3%) | 23 (1.7%) |
| 65 to 74 Years | 34 (14.8%) | 4 (1.3%) |
| 75 Years and over | 4 (2.2%) | 83 (24.4%) |
Disability Class: Ambulatory Difficulty
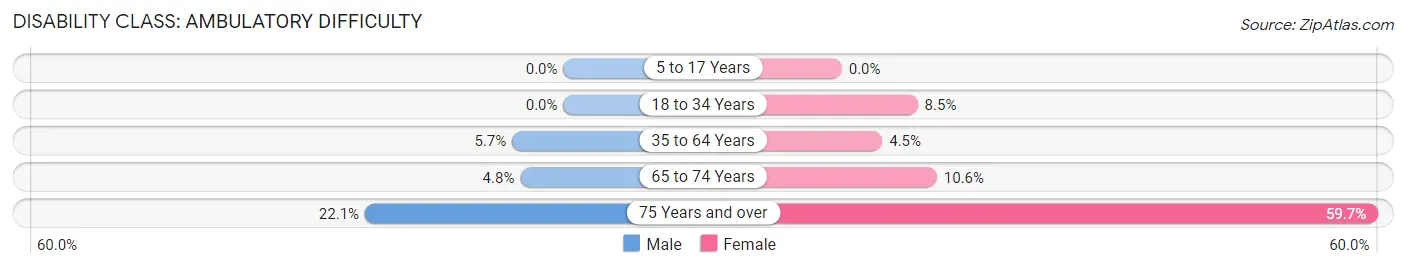
| Age Bracket | Male | Female |
| 5 to 17 Years | 0 (0.0%) | 0 (0.0%) |
| 18 to 34 Years | 0 (0.0%) | 47 (8.5%) |
| 35 to 64 Years | 62 (5.7%) | 60 (4.5%) |
| 65 to 74 Years | 11 (4.8%) | 33 (10.6%) |
| 75 Years and over | 40 (22.1%) | 203 (59.7%) |
Disability Class: Self-Care Difficulty
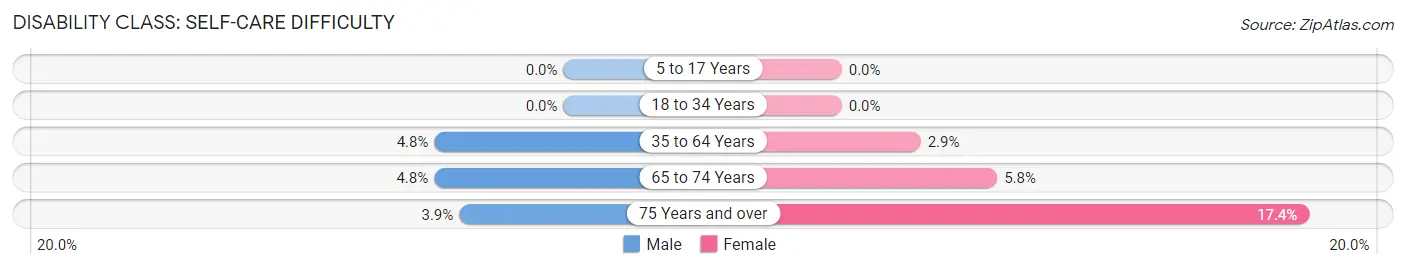
| Age Bracket | Male | Female |
| 5 to 17 Years | 0 (0.0%) | 0 (0.0%) |
| 18 to 34 Years | 0 (0.0%) | 0 (0.0%) |
| 35 to 64 Years | 52 (4.8%) | 39 (2.9%) |
| 65 to 74 Years | 11 (4.8%) | 18 (5.8%) |
| 75 Years and over | 7 (3.9%) | 59 (17.3%) |
Technology Access in Ewa Villages
Computing Device Access in Ewa Villages
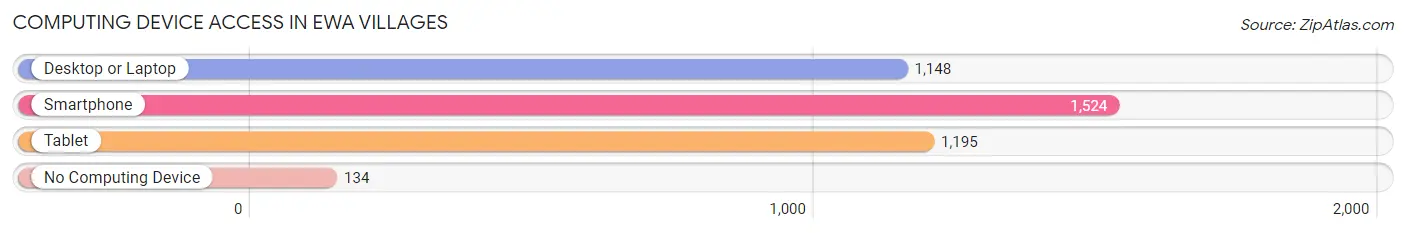
| Device Type | # Households | % Households |
| Desktop or Laptop | 1,148 | 65.4% |
| Smartphone | 1,524 | 86.8% |
| Tablet | 1,195 | 68.0% |
| No Computing Device | 134 | 7.6% |
| Total | 1,756 | 100.0% |
Internet Access in Ewa Villages
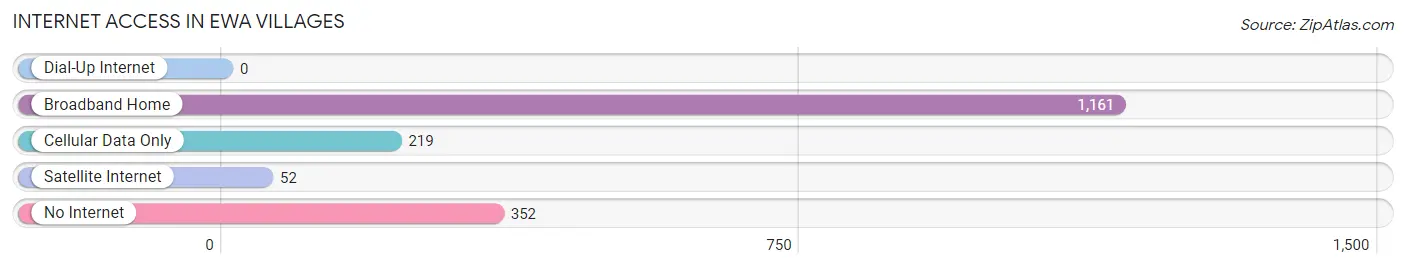
| Internet Type | # Households | % Households |
| Dial-Up Internet | 0 | 0.0% |
| Broadband Home | 1,161 | 66.1% |
| Cellular Data Only | 219 | 12.5% |
| Satellite Internet | 52 | 3.0% |
| No Internet | 352 | 20.1% |
| Total | 1,756 | 100.0% |
Ewa Villages Summary
Ewa Villages is a census-designated place (CDP) located in the City and County of Honolulu, Hawaii, United States. The population was 14,955 at the 2010 census.
Geography
Ewa Villages is located at 21°20′25″N 158°2′2″W (21.340278, -158.033889). It is bordered to the north by Ewa Beach, to the east by Iroquois Point, to the south by Ocean Pointe, and to the west by Kapolei.
According to the United States Census Bureau, the CDP has a total area of 2.3 square miles (6.0 km2), all of it land.
History
Ewa Villages was originally a sugar plantation village, established in the late 19th century. The plantation was owned by the Ewa Plantation Company, which was founded in 1876. The company was owned by the Castle & Cooke corporation, which also owned the nearby Ewa Plantation. The village was home to many of the plantation workers, and was known as Ewa Mill Village.
In the early 20th century, the village was renamed Ewa Villages. The village was annexed by the City and County of Honolulu in 1959.
Economy
Ewa Villages is home to several businesses, including a shopping center, a golf course, and a movie theater. The shopping center includes a grocery store, a drug store, a bank, and several restaurants.
The Ewa Villages Golf Course is a public golf course located in the center of the CDP. The course was designed by golf course architect Robert Trent Jones, Jr. and opened in 1992.
Demographics
As of the census of 2000, there were 14,955 people, 4,945 households, and 3,845 families residing in the CDP. The population density was 6,521.3 people per square mile (2,517.2/km2). There were 5,093 housing units at an average density of 2,213.3 per square mile (854.3/km2). The racial makeup of the CDP was 24.2% White, 0.7% African American, 0.3% Native American, 37.3% Asian, 8.2% Pacific Islander, 0.7% from other races, and 28.7% from two or more races. Hispanic or Latino of any race were 8.2% of the population.
There were 4,945 households, out of which 39.2% had children under the age of 18 living with them, 57.2% were married couples living together, 13.7% had a female householder with no husband present, and 22.2% were non-families. 16.2% of all households were made up of individuals, and 4.2% had someone living alone who was 65 years of age or older. The average household size was 3.02 and the average family size was 3.41.
In the CDP the population was spread out, with 28.2% under the age of 18, 8.7% from 18 to 24, 30.2% from 25 to 44, 24.2% from 45 to 64, and 8.7% who were 65 years of age or older. The median age was 35 years. For every 100 females, there were 99.2 males. For every 100 females age 18 and over, there were 97.2 males.
The median income for a household in the CDP was $60,945, and the median income for a family was $64,917. Males had a median income of $41,945 versus $31,917 for females. The per capita income for the CDP was $21,945. About 4.2% of families and 5.2% of the population were below the poverty line, including 6.2% of those under age 18 and 4.2% of those age 65 or over.
Common Questions
What is Per Capita Income in Ewa Villages?
Per Capita income in Ewa Villages is $26,392.
What is the Median Family Income in Ewa Villages?
Median Family Income in Ewa Villages is $95,078.
What is the Median Household income in Ewa Villages?
Median Household Income in Ewa Villages is $82,903.
What is Income or Wage Gap in Ewa Villages?
Income or Wage Gap in Ewa Villages is 18.7%.
Women in Ewa Villages earn 81.3 cents for every dollar earned by a man.
What is Inequality or Gini Index in Ewa Villages?
Inequality or Gini Index in Ewa Villages is 0.43.
What is the Total Population of Ewa Villages?
Total Population of Ewa Villages is 6,550.
What is the Total Male Population of Ewa Villages?
Total Male Population of Ewa Villages is 3,344.
What is the Total Female Population of Ewa Villages?
Total Female Population of Ewa Villages is 3,206.
What is the Ratio of Males per 100 Females in Ewa Villages?
There are 104.30 Males per 100 Females in Ewa Villages.
What is the Ratio of Females per 100 Males in Ewa Villages?
There are 95.87 Females per 100 Males in Ewa Villages.
What is the Median Population Age in Ewa Villages?
Median Population Age in Ewa Villages is 37.8 Years.
What is the Average Family Size in Ewa Villages
Average Family Size in Ewa Villages is 4.5 People.
What is the Average Household Size in Ewa Villages
Average Household Size in Ewa Villages is 3.7 People.
How Large is the Labor Force in Ewa Villages?
There are 3,117 People in the Labor Forcein in Ewa Villages.
What is the Percentage of People in the Labor Force in Ewa Villages?
63.9% of People are in the Labor Force in Ewa Villages.
What is the Unemployment Rate in Ewa Villages?
Unemployment Rate in Ewa Villages is 1.3%.