Kahaluu, HI Map & Demographics
Kahaluu Map
Kahaluu Overview
$44,558
PER CAPITA INCOME
$133,458
AVG FAMILY INCOME
$123,365
AVG HOUSEHOLD INCOME
22.7%
WAGE / INCOME GAP [ % ]
77.3¢/ $1
WAGE / INCOME GAP [ $ ]
0.35
INEQUALITY / GINI INDEX
5,065
TOTAL POPULATION
2,456
MALE POPULATION
2,609
FEMALE POPULATION
94.14
MALES / 100 FEMALES
106.23
FEMALES / 100 MALES
45.0
MEDIAN AGE
3.8
AVG FAMILY SIZE
3.6
AVG HOUSEHOLD SIZE
2,670
LABOR FORCE [ PEOPLE ]
66.1%
PERCENT IN LABOR FORCE
5.6%
UNEMPLOYMENT RATE
Income in Kahaluu
Income Overview in Kahaluu
Per Capita Income in Kahaluu is $44,558, while median incomes of families and households are $133,458 and $123,365 respectively.
| Characteristic | Number | Measure |
| Per Capita Income | 5,065 | $44,558 |
| Median Family Income | 1,163 | $133,458 |
| Mean Family Income | 1,163 | $153,378 |
| Median Household Income | 1,415 | $123,365 |
| Mean Household Income | 1,415 | $148,122 |
| Income Deficit | 1,163 | $0 |
| Wage / Income Gap (%) | 5,065 | 22.65% |
| Wage / Income Gap ($) | 5,065 | 77.35¢ per $1 |
| Gini / Inequality Index | 5,065 | 0.35 |
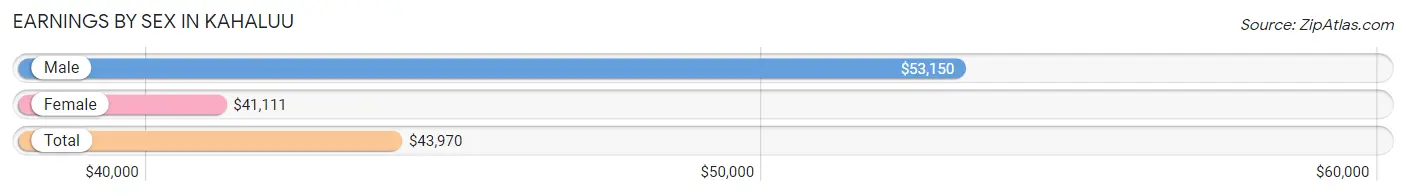
Earnings by Sex in Kahaluu
Average Earnings in Kahaluu are $43,970, $53,150 for men and $41,111 for women, a difference of 22.7%.
| Sex | Number | Average Earnings |
| Male | 1,191 (44.4%) | $53,150 |
| Female | 1,494 (55.6%) | $41,111 |
| Total | 2,685 (100.0%) | $43,970 |
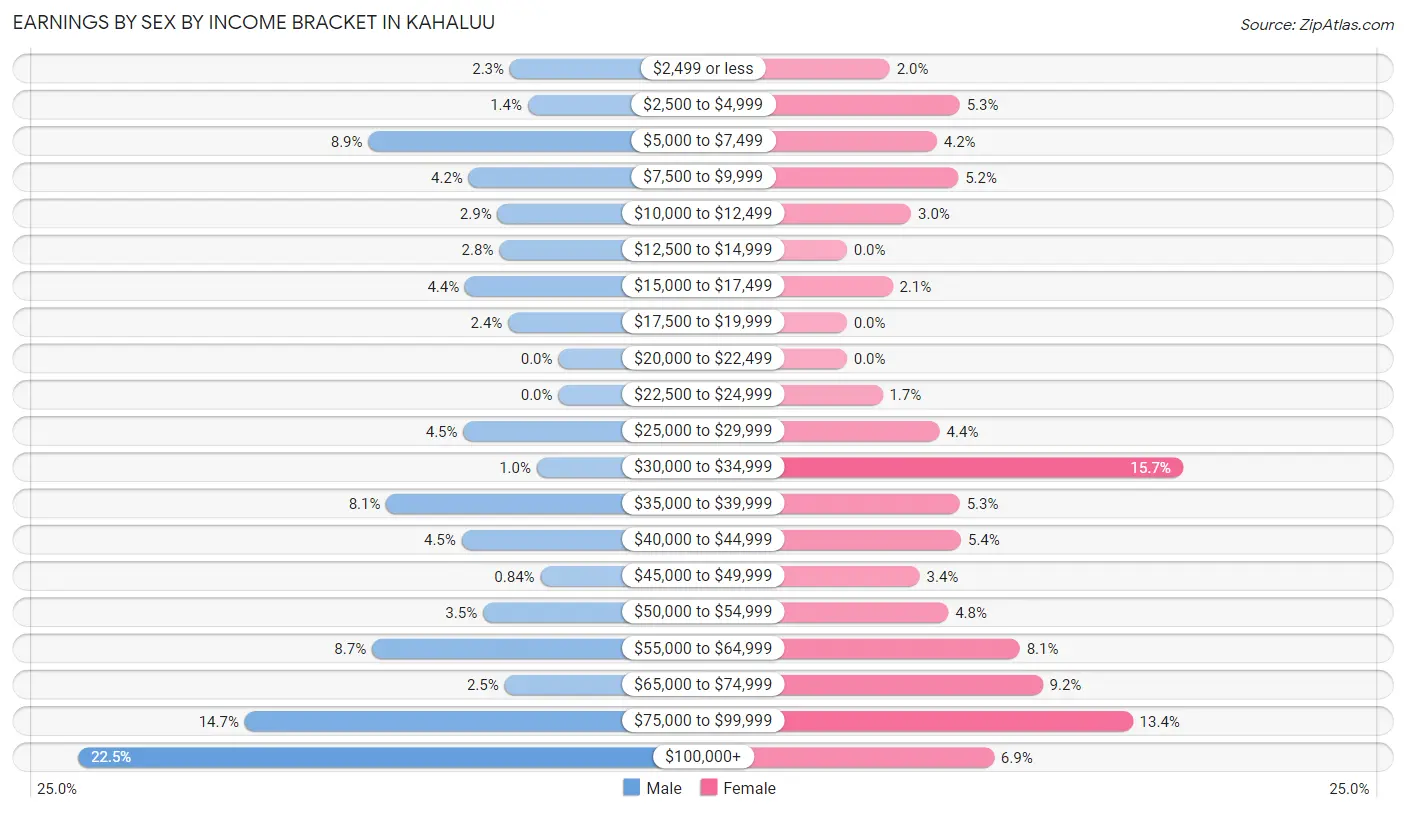
Earnings by Sex by Income Bracket in Kahaluu
The most common earnings brackets in Kahaluu are $100,000+ for men (268 | 22.5%) and $30,000 to $34,999 for women (235 | 15.7%).
| Income | Male | Female |
| $2,499 or less | 27 (2.3%) | 30 (2.0%) |
| $2,500 to $4,999 | 17 (1.4%) | 79 (5.3%) |
| $5,000 to $7,499 | 106 (8.9%) | 63 (4.2%) |
| $7,500 to $9,999 | 50 (4.2%) | 78 (5.2%) |
| $10,000 to $12,499 | 34 (2.9%) | 45 (3.0%) |
| $12,500 to $14,999 | 33 (2.8%) | 0 (0.0%) |
| $15,000 to $17,499 | 52 (4.4%) | 32 (2.1%) |
| $17,500 to $19,999 | 28 (2.4%) | 0 (0.0%) |
| $20,000 to $22,499 | 0 (0.0%) | 0 (0.0%) |
| $22,500 to $24,999 | 0 (0.0%) | 25 (1.7%) |
| $25,000 to $29,999 | 53 (4.4%) | 65 (4.3%) |
| $30,000 to $34,999 | 12 (1.0%) | 235 (15.7%) |
| $35,000 to $39,999 | 96 (8.1%) | 79 (5.3%) |
| $40,000 to $44,999 | 54 (4.5%) | 80 (5.3%) |
| $45,000 to $49,999 | 10 (0.8%) | 51 (3.4%) |
| $50,000 to $54,999 | 42 (3.5%) | 71 (4.8%) |
| $55,000 to $64,999 | 104 (8.7%) | 121 (8.1%) |
| $65,000 to $74,999 | 30 (2.5%) | 137 (9.2%) |
| $75,000 to $99,999 | 175 (14.7%) | 200 (13.4%) |
| $100,000+ | 268 (22.5%) | 103 (6.9%) |
| Total | 1,191 (100.0%) | 1,494 (100.0%) |
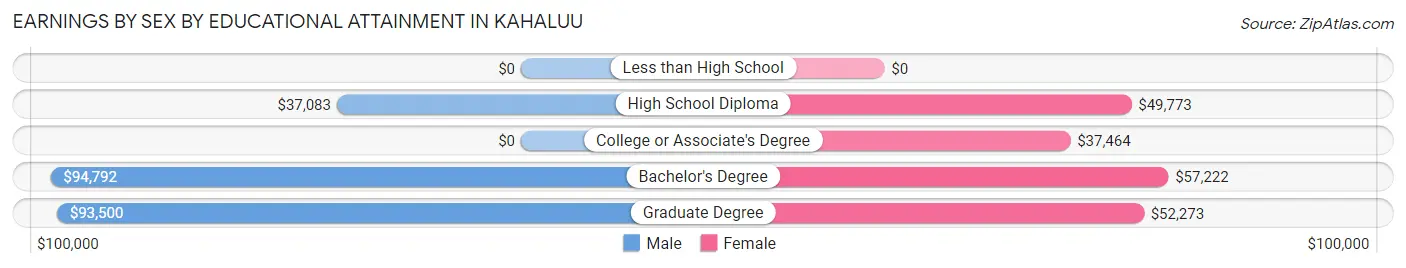
Earnings by Sex by Educational Attainment in Kahaluu
Average earnings in Kahaluu are $56,454 for men and $47,438 for women, a difference of 16.0%. Men with an educational attainment of bachelor's degree enjoy the highest average annual earnings of $94,792, while those with high school diploma education earn the least with $37,083. Women with an educational attainment of bachelor's degree earn the most with the average annual earnings of $57,222, while those with college or associate's degree education have the smallest earnings of $37,464.
| Educational Attainment | Male Income | Female Income |
| Less than High School | - | - |
| High School Diploma | $37,083 | $49,773 |
| College or Associate's Degree | - | - |
| Bachelor's Degree | $94,792 | $57,222 |
| Graduate Degree | $93,500 | $52,273 |
| Total | $56,454 | $47,438 |
Family Income in Kahaluu
Family Income Brackets in Kahaluu
According to the Kahaluu family income data, there are 305 families falling into the $100,000 to $149,999 income range, which is the most common income bracket and makes up 26.2% of all families.
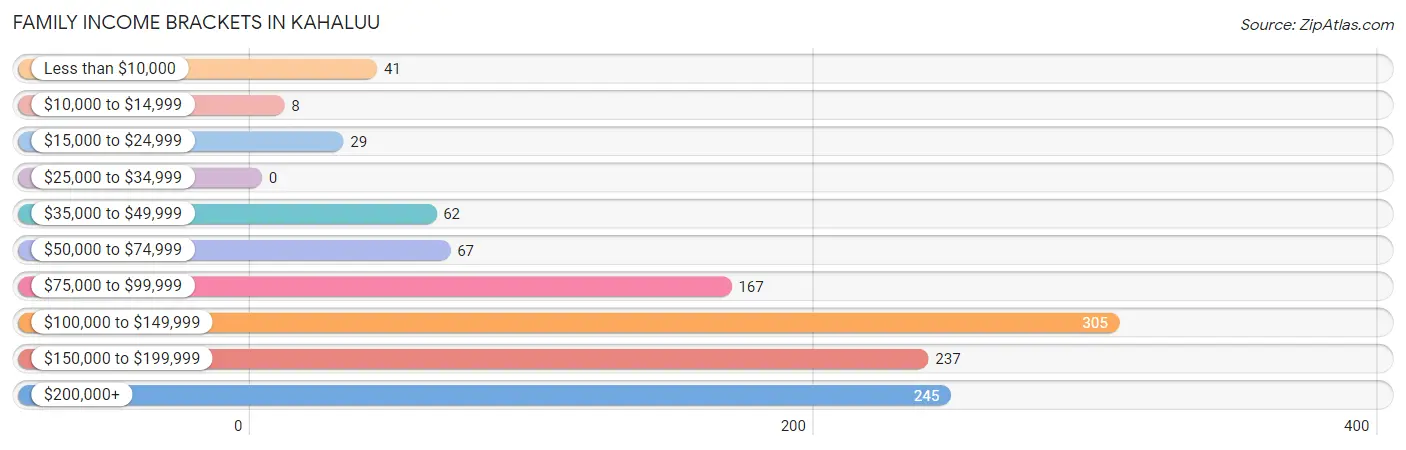
| Income Bracket | # Families | % Families |
| Less than $10,000 | 41 | 3.5% |
| $10,000 to $14,999 | 8 | 0.7% |
| $15,000 to $24,999 | 29 | 2.5% |
| $25,000 to $34,999 | 0 | 0.0% |
| $35,000 to $49,999 | 62 | 5.3% |
| $50,000 to $74,999 | 67 | 5.8% |
| $75,000 to $99,999 | 167 | 14.4% |
| $100,000 to $149,999 | 305 | 26.2% |
| $150,000 to $199,999 | 237 | 20.4% |
| $200,000+ | 245 | 21.1% |
Family Income by Famaliy Size in Kahaluu
7+ person families (112 | 9.6%) account for the highest median family income in Kahaluu with $201,346 per family, while 2-person families (549 | 47.2%) have the highest median income of $61,051 per family member.
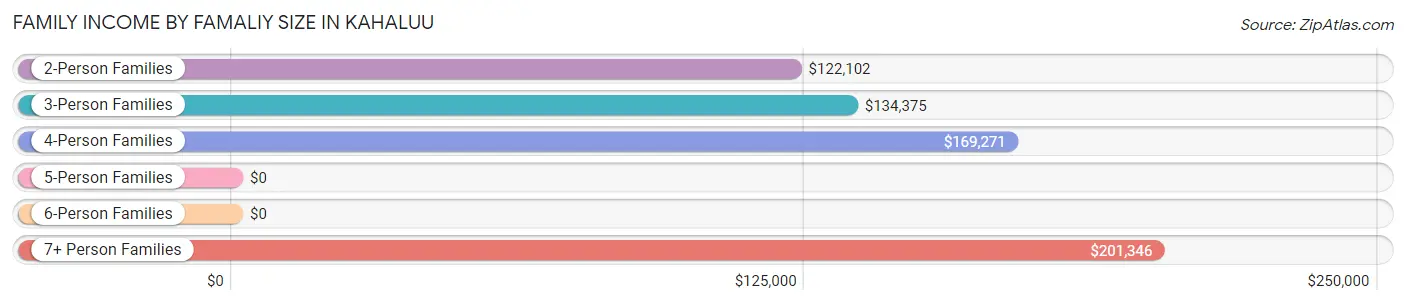
| Income Bracket | # Families | Median Income |
| 2-Person Families | 549 (47.2%) | $122,102 |
| 3-Person Families | 223 (19.2%) | $134,375 |
| 4-Person Families | 133 (11.4%) | $169,271 |
| 5-Person Families | 104 (8.9%) | $0 |
| 6-Person Families | 42 (3.6%) | $0 |
| 7+ Person Families | 112 (9.6%) | $201,346 |
| Total | 1,163 (100.0%) | $133,458 |
Family Income by Number of Earners in Kahaluu
The median family income in Kahaluu is $133,458, with families comprising 3+ earners (202) having the highest median family income of $162,067, while families with no earners (187) have the lowest median family income of $110,054, accounting for 17.4% and 16.1% of families, respectively.
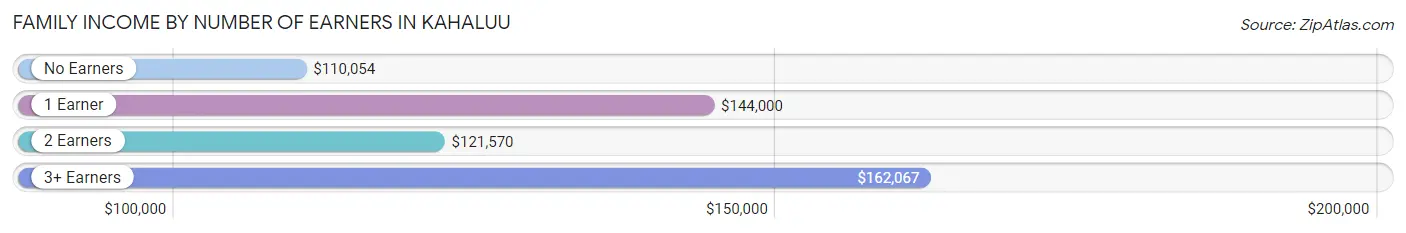
| Number of Earners | # Families | Median Income |
| No Earners | 187 (16.1%) | $110,054 |
| 1 Earner | 302 (26.0%) | $144,000 |
| 2 Earners | 472 (40.6%) | $121,570 |
| 3+ Earners | 202 (17.4%) | $162,067 |
| Total | 1,163 (100.0%) | $133,458 |
Household Income in Kahaluu
Household Income Brackets in Kahaluu
With 369 households falling in the category, the $100,000 to $149,999 income range is the most frequent in Kahaluu, accounting for 26.1% of all households.
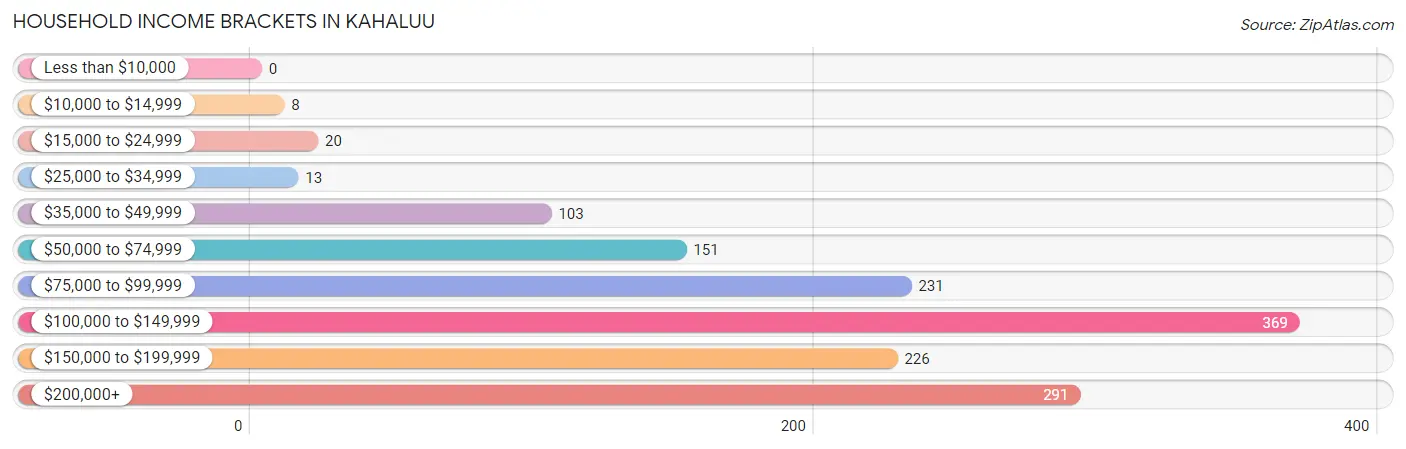
| Income Bracket | # Households | % Households |
| Less than $10,000 | 0 | 0.0% |
| $10,000 to $14,999 | 8 | 0.6% |
| $15,000 to $24,999 | 20 | 1.4% |
| $25,000 to $34,999 | 13 | 0.9% |
| $35,000 to $49,999 | 103 | 7.3% |
| $50,000 to $74,999 | 151 | 10.7% |
| $75,000 to $99,999 | 231 | 16.3% |
| $100,000 to $149,999 | 369 | 26.1% |
| $150,000 to $199,999 | 226 | 16.0% |
| $200,000+ | 291 | 20.6% |
Household Income by Householder Age in Kahaluu
The median household income in Kahaluu is $123,365, with the highest median household income of $152,512 found in the 45 to 64 years age bracket for the primary householder. A total of 623 households (44.0%) fall into this category. Meanwhile, the 15 to 24 years age bracket for the primary householder has the lowest median household income of $0, with 12 households (0.9%) in this group.
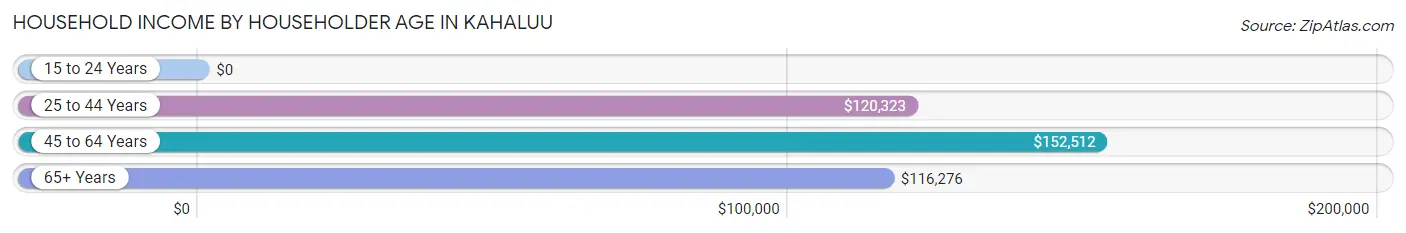
| Income Bracket | # Households | Median Income |
| 15 to 24 Years | 12 (0.9%) | $0 |
| 25 to 44 Years | 274 (19.4%) | $120,323 |
| 45 to 64 Years | 623 (44.0%) | $152,512 |
| 65+ Years | 506 (35.8%) | $116,276 |
| Total | 1,415 (100.0%) | $123,365 |
Poverty in Kahaluu
Income Below Poverty by Sex and Age in Kahaluu
With 9.6% poverty level for males and 4.4% for females among the residents of Kahaluu, under 5 year old males and 18 to 24 year old females are the most vulnerable to poverty, with 40 males (38.8%) and 42 females (17.9%) in their respective age groups living below the poverty level.
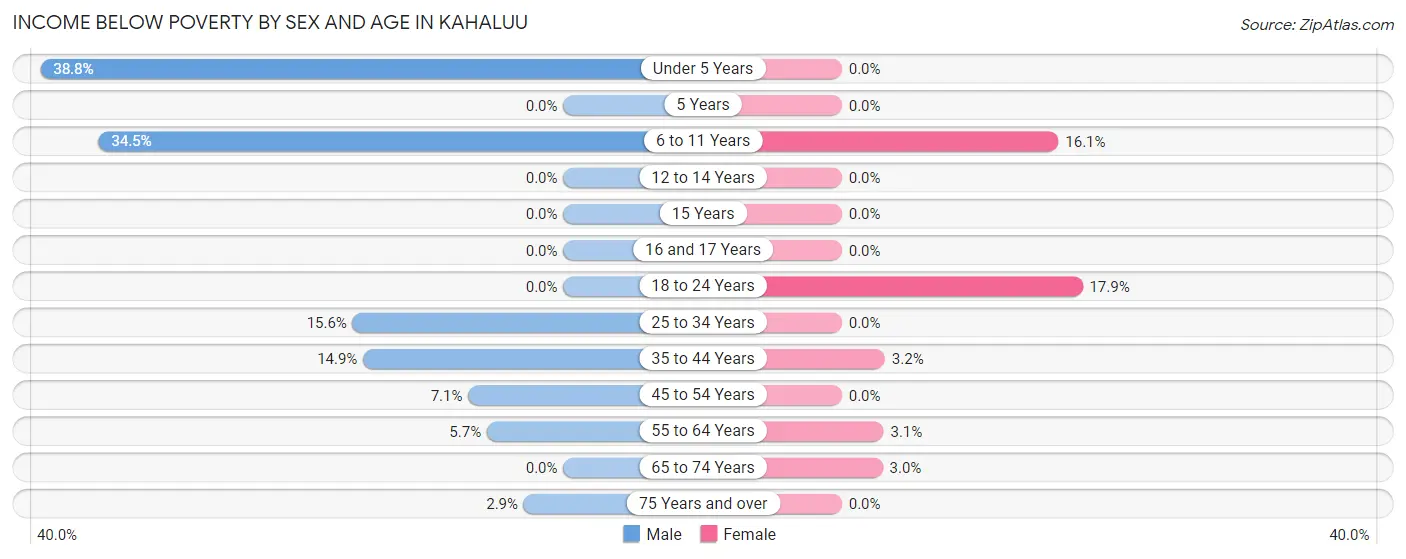
| Age Bracket | Male | Female |
| Under 5 Years | 40 (38.8%) | 0 (0.0%) |
| 5 Years | 0 (0.0%) | 0 (0.0%) |
| 6 to 11 Years | 68 (34.5%) | 41 (16.1%) |
| 12 to 14 Years | 0 (0.0%) | 0 (0.0%) |
| 15 Years | 0 (0.0%) | 0 (0.0%) |
| 16 and 17 Years | 0 (0.0%) | 0 (0.0%) |
| 18 to 24 Years | 0 (0.0%) | 42 (17.9%) |
| 25 to 34 Years | 28 (15.6%) | 0 (0.0%) |
| 35 to 44 Years | 41 (14.9%) | 13 (3.2%) |
| 45 to 54 Years | 29 (7.1%) | 0 (0.0%) |
| 55 to 64 Years | 19 (5.7%) | 11 (3.1%) |
| 65 to 74 Years | 0 (0.0%) | 8 (3.0%) |
| 75 Years and over | 9 (2.9%) | 0 (0.0%) |
| Total | 234 (9.6%) | 115 (4.4%) |
Income Above Poverty by Sex and Age in Kahaluu
According to the poverty statistics in Kahaluu, males aged 12 to 14 years and females aged under 5 years are the age groups that are most secure financially, with 100.0% of males and 100.0% of females in these age groups living above the poverty line.
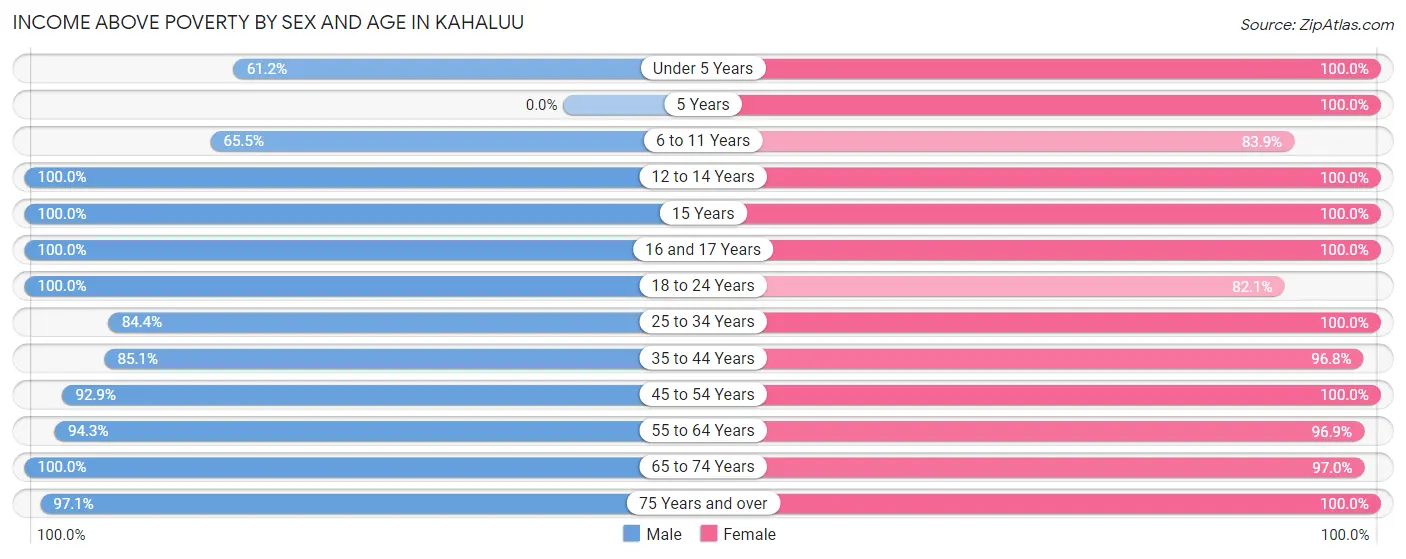
| Age Bracket | Male | Female |
| Under 5 Years | 63 (61.2%) | 130 (100.0%) |
| 5 Years | 0 (0.0%) | 23 (100.0%) |
| 6 to 11 Years | 129 (65.5%) | 214 (83.9%) |
| 12 to 14 Years | 142 (100.0%) | 95 (100.0%) |
| 15 Years | 13 (100.0%) | 36 (100.0%) |
| 16 and 17 Years | 74 (100.0%) | 64 (100.0%) |
| 18 to 24 Years | 127 (100.0%) | 193 (82.1%) |
| 25 to 34 Years | 151 (84.4%) | 141 (100.0%) |
| 35 to 44 Years | 235 (85.1%) | 393 (96.8%) |
| 45 to 54 Years | 382 (92.9%) | 404 (100.0%) |
| 55 to 64 Years | 316 (94.3%) | 344 (96.9%) |
| 65 to 74 Years | 274 (100.0%) | 256 (97.0%) |
| 75 Years and over | 298 (97.1%) | 184 (100.0%) |
| Total | 2,204 (90.4%) | 2,477 (95.6%) |
Income Below Poverty Among Married-Couple Families in Kahaluu
The poverty statistics for married-couple families in Kahaluu show that 0.9% or 8 of the total 876 families live below the poverty line. Families with no children have the highest poverty rate of 1.4%, comprising of 8 families. On the other hand, families with 1 or 2 children have the lowest poverty rate of 0.0%, which includes 0 families.
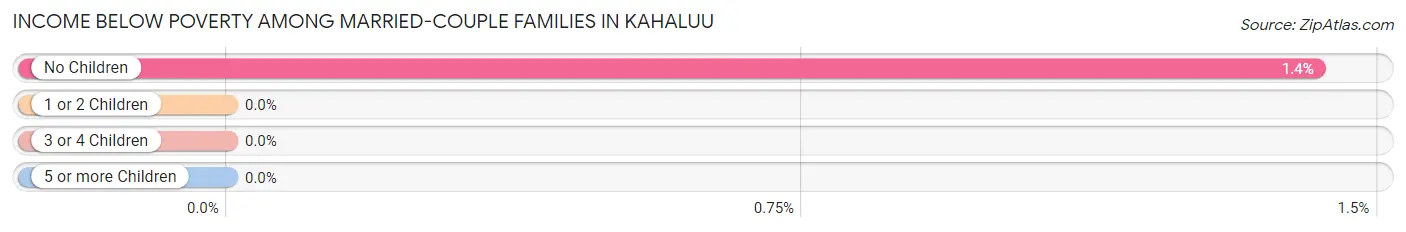
| Children | Above Poverty | Below Poverty |
| No Children | 555 (98.6%) | 8 (1.4%) |
| 1 or 2 Children | 198 (100.0%) | 0 (0.0%) |
| 3 or 4 Children | 115 (100.0%) | 0 (0.0%) |
| 5 or more Children | 0 (0.0%) | 0 (0.0%) |
| Total | 868 (99.1%) | 8 (0.9%) |
Income Below Poverty Among Single-Parent Households in Kahaluu
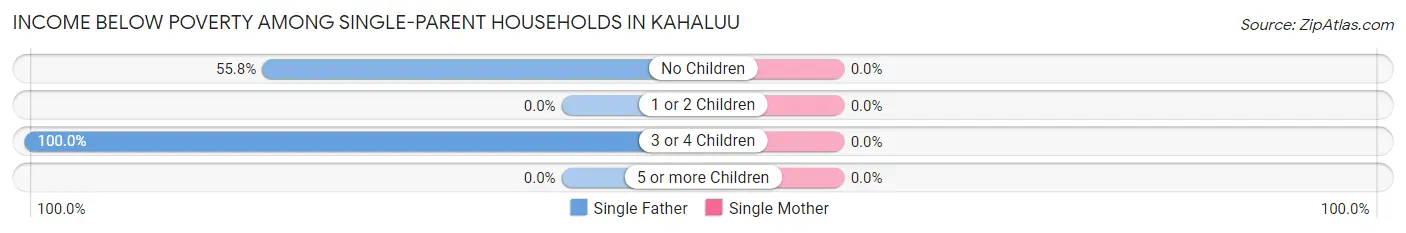
| Children | Single Father | Single Mother |
| No Children | 29 (55.8%) | 0 (0.0%) |
| 1 or 2 Children | 0 (0.0%) | 0 (0.0%) |
| 3 or 4 Children | 41 (100.0%) | 0 (0.0%) |
| 5 or more Children | 0 (0.0%) | 0 (0.0%) |
| Total | 70 (57.9%) | 0 (0.0%) |
Income Below Poverty Among Married-Couple vs Single-Parent Households in Kahaluu
The poverty data for Kahaluu shows that 8 of the married-couple family households (0.9%) and 70 of the single-parent households (24.4%) are living below the poverty level. Within the married-couple family households, those with no children have the highest poverty rate, with 8 households (1.4%) falling below the poverty line. Among the single-parent households, those with 3 or 4 children have the highest poverty rate, with 41 household (68.3%) living below poverty.
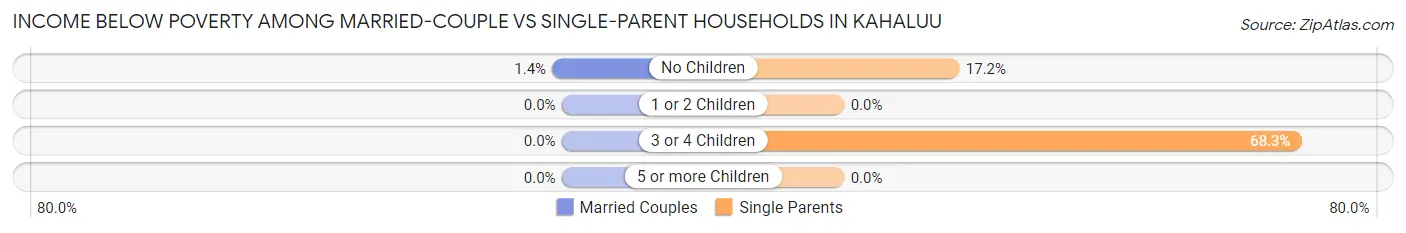
| Children | Married-Couple Families | Single-Parent Households |
| No Children | 8 (1.4%) | 29 (17.2%) |
| 1 or 2 Children | 0 (0.0%) | 0 (0.0%) |
| 3 or 4 Children | 0 (0.0%) | 41 (68.3%) |
| 5 or more Children | 0 (0.0%) | 0 (0.0%) |
| Total | 8 (0.9%) | 70 (24.4%) |
Race in Kahaluu
The most populous races in Kahaluu are Two or more Races (2,472 | 48.8%), White / Caucasian (1,183 | 23.4%), and Asian (919 | 18.1%).
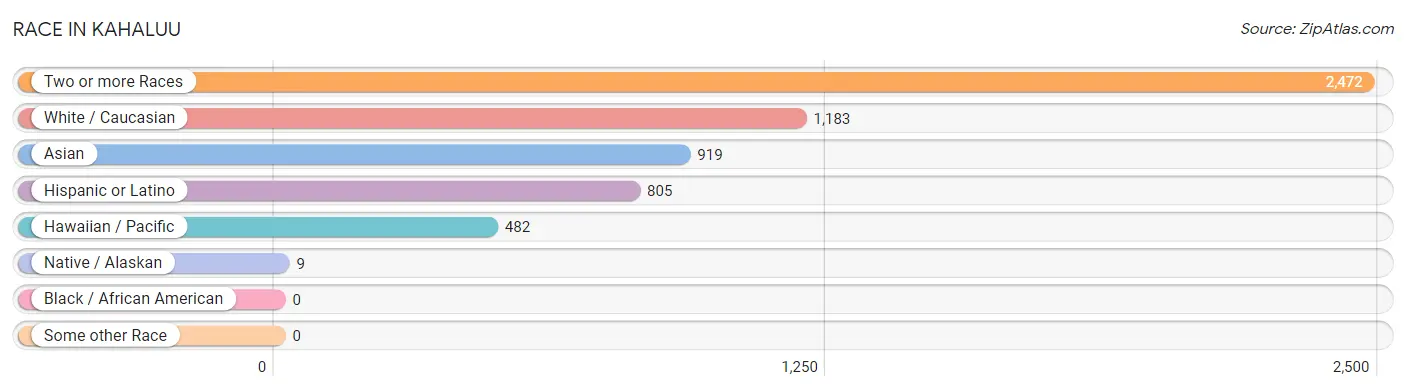
| Race | # Population | % Population |
| Asian | 919 | 18.1% |
| Black / African American | 0 | 0.0% |
| Hawaiian / Pacific | 482 | 9.5% |
| Hispanic or Latino | 805 | 15.9% |
| Native / Alaskan | 9 | 0.2% |
| White / Caucasian | 1,183 | 23.4% |
| Two or more Races | 2,472 | 48.8% |
| Some other Race | 0 | 0.0% |
| Total | 5,065 | 100.0% |
Ancestry in Kahaluu
The most populous ancestries reported in Kahaluu are Native Hawaiian (1,821 | 35.9%), Bhutanese (1,159 | 22.9%), Indian (Asian) (860 | 17.0%), Korean (671 | 13.3%), and German (445 | 8.8%), together accounting for 97.9% of all Kahaluu residents.
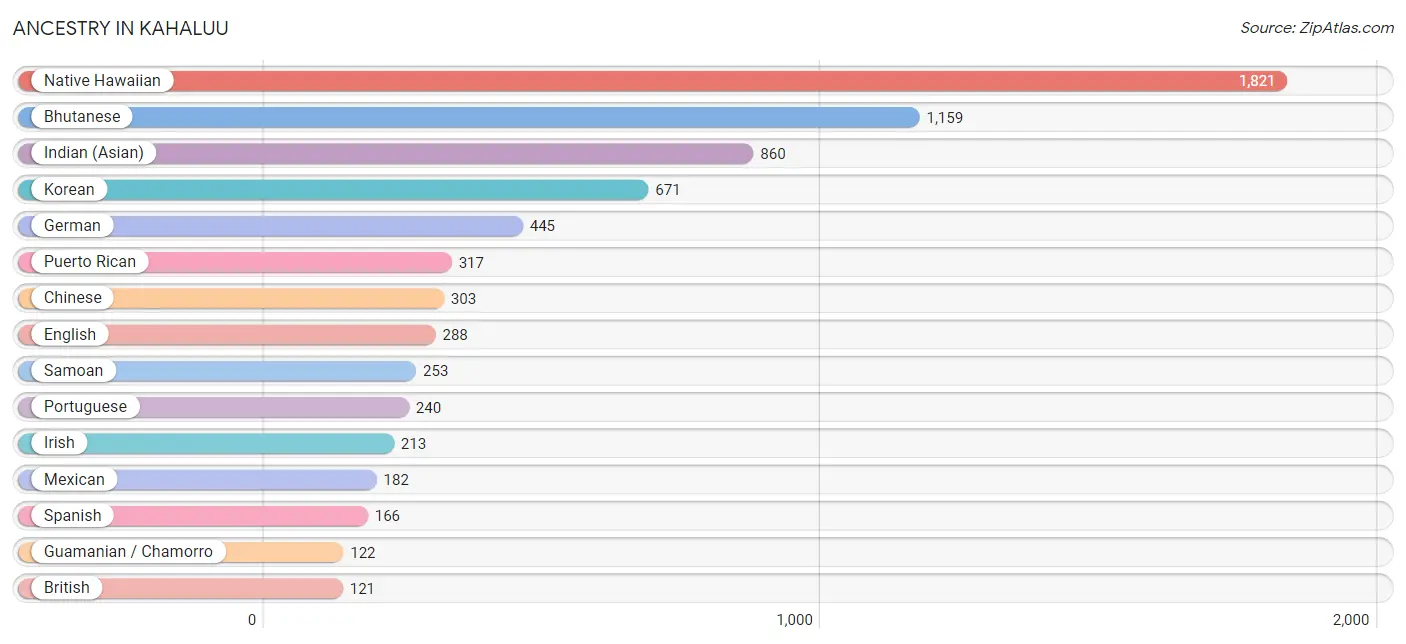
| Ancestry | # Population | % Population |
| American | 102 | 2.0% |
| Apache | 9 | 0.2% |
| Austrian | 9 | 0.2% |
| Belgian | 18 | 0.4% |
| Bhutanese | 1,159 | 22.9% |
| Blackfeet | 36 | 0.7% |
| British | 121 | 2.4% |
| Burmese | 60 | 1.2% |
| Cherokee | 50 | 1.0% |
| Chinese | 303 | 6.0% |
| Croatian | 10 | 0.2% |
| Cuban | 30 | 0.6% |
| Czech | 99 | 1.9% |
| Danish | 38 | 0.7% |
| Dutch | 109 | 2.1% |
| Eastern European | 27 | 0.5% |
| English | 288 | 5.7% |
| European | 33 | 0.6% |
| Filipino | 21 | 0.4% |
| Finnish | 40 | 0.8% |
| French | 8 | 0.2% |
| German | 445 | 8.8% |
| Greek | 31 | 0.6% |
| Guamanian / Chamorro | 122 | 2.4% |
| Hungarian | 9 | 0.2% |
| Indian (Asian) | 860 | 17.0% |
| Irish | 213 | 4.2% |
| Italian | 109 | 2.1% |
| Korean | 671 | 13.3% |
| Mexican | 182 | 3.6% |
| Native Hawaiian | 1,821 | 35.9% |
| Norwegian | 119 | 2.4% |
| Pakistani | 26 | 0.5% |
| Polish | 43 | 0.9% |
| Portuguese | 240 | 4.7% |
| Puerto Rican | 317 | 6.3% |
| Russian | 36 | 0.7% |
| Samoan | 253 | 5.0% |
| Scandinavian | 34 | 0.7% |
| Scotch-Irish | 2 | 0.0% |
| Scottish | 27 | 0.5% |
| Serbian | 10 | 0.2% |
| Slovak | 28 | 0.5% |
| Spaniard | 110 | 2.2% |
| Spanish | 166 | 3.3% |
| Sri Lankan | 33 | 0.6% |
| Swedish | 49 | 1.0% |
| Welsh | 10 | 0.2% | View All 48 Rows |
Immigrants in Kahaluu
The most numerous immigrant groups reported in Kahaluu came from Asia (209 | 4.1%), Europe (195 | 3.8%), Eastern Asia (163 | 3.2%), Eastern Europe (145 | 2.9%), and Japan (86 | 1.7%), together accounting for 15.8% of all Kahaluu residents.
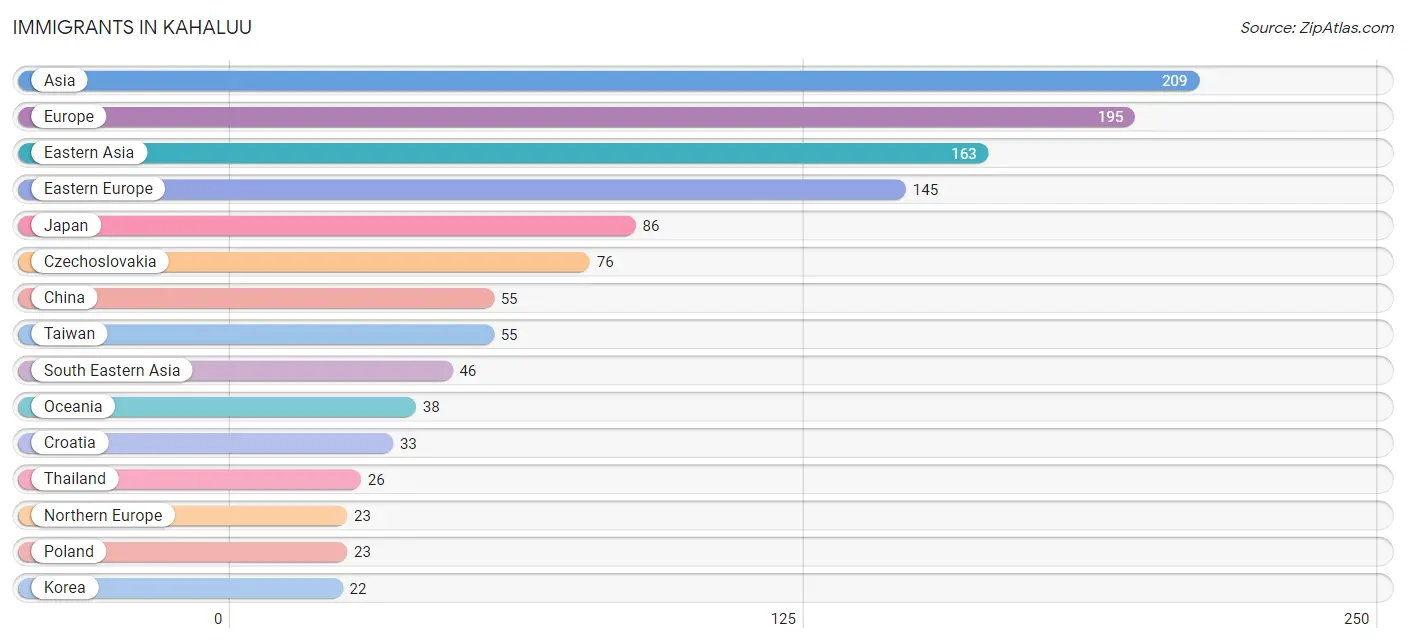
| Immigration Origin | # Population | % Population |
| Africa | 9 | 0.2% |
| Asia | 209 | 4.1% |
| Belgium | 18 | 0.4% |
| Canada | 21 | 0.4% |
| China | 55 | 1.1% |
| Croatia | 33 | 0.6% |
| Czechoslovakia | 76 | 1.5% |
| Eastern Asia | 163 | 3.2% |
| Eastern Europe | 145 | 2.9% |
| Europe | 195 | 3.8% |
| Greece | 9 | 0.2% |
| Japan | 86 | 1.7% |
| Korea | 22 | 0.4% |
| Micronesia | 13 | 0.3% |
| Northern Europe | 23 | 0.4% |
| Oceania | 38 | 0.7% |
| Philippines | 10 | 0.2% |
| Poland | 23 | 0.4% |
| Russia | 13 | 0.3% |
| South Africa | 9 | 0.2% |
| South Eastern Asia | 46 | 0.9% |
| Southern Europe | 9 | 0.2% |
| Taiwan | 55 | 1.1% |
| Thailand | 26 | 0.5% |
| Vietnam | 10 | 0.2% |
| Western Europe | 18 | 0.4% | View All 26 Rows |
Sex and Age in Kahaluu
Sex and Age in Kahaluu
The most populous age groups in Kahaluu are 60 to 64 Years (228 | 9.3%) for men and 40 to 44 Years (243 | 9.3%) for women.
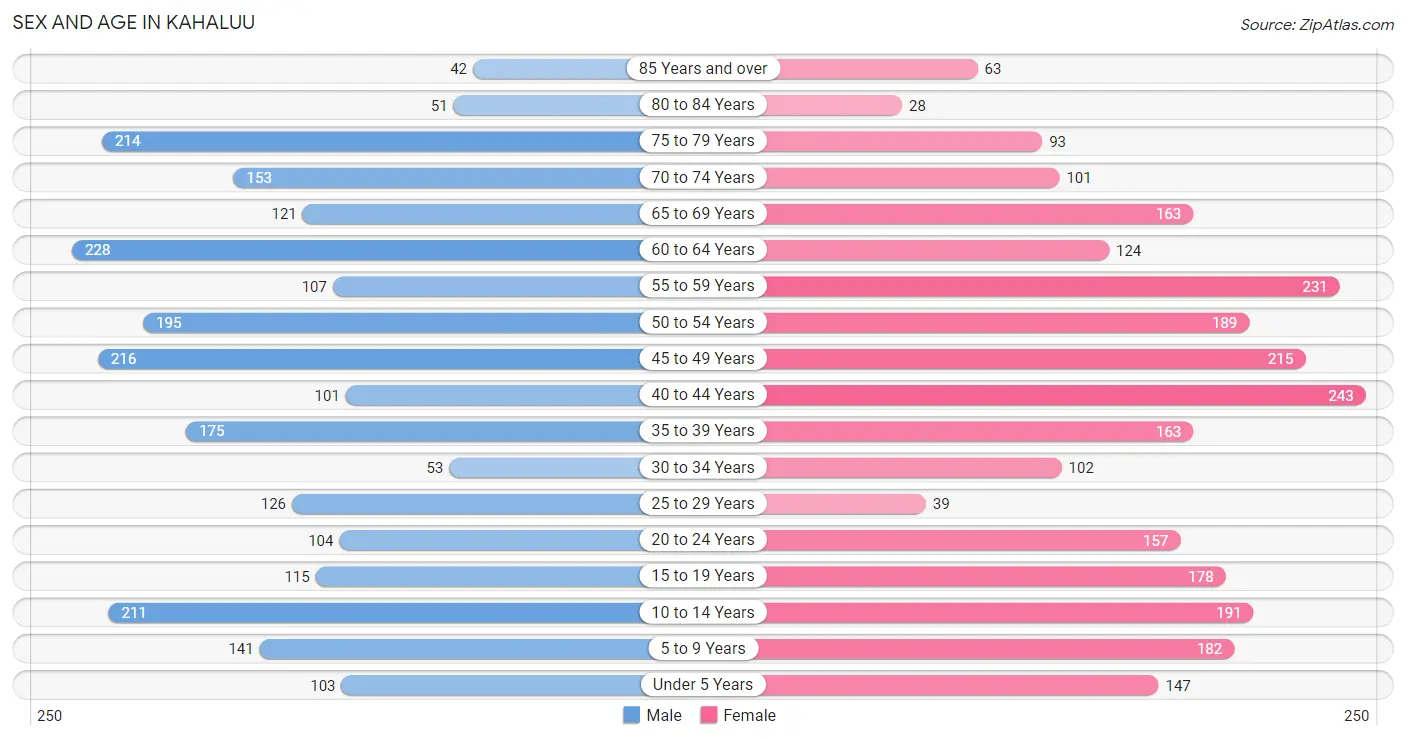
| Age Bracket | Male | Female |
| Under 5 Years | 103 (4.2%) | 147 (5.6%) |
| 5 to 9 Years | 141 (5.7%) | 182 (7.0%) |
| 10 to 14 Years | 211 (8.6%) | 191 (7.3%) |
| 15 to 19 Years | 115 (4.7%) | 178 (6.8%) |
| 20 to 24 Years | 104 (4.2%) | 157 (6.0%) |
| 25 to 29 Years | 126 (5.1%) | 39 (1.5%) |
| 30 to 34 Years | 53 (2.2%) | 102 (3.9%) |
| 35 to 39 Years | 175 (7.1%) | 163 (6.2%) |
| 40 to 44 Years | 101 (4.1%) | 243 (9.3%) |
| 45 to 49 Years | 216 (8.8%) | 215 (8.2%) |
| 50 to 54 Years | 195 (7.9%) | 189 (7.2%) |
| 55 to 59 Years | 107 (4.4%) | 231 (8.8%) |
| 60 to 64 Years | 228 (9.3%) | 124 (4.8%) |
| 65 to 69 Years | 121 (4.9%) | 163 (6.2%) |
| 70 to 74 Years | 153 (6.2%) | 101 (3.9%) |
| 75 to 79 Years | 214 (8.7%) | 93 (3.6%) |
| 80 to 84 Years | 51 (2.1%) | 28 (1.1%) |
| 85 Years and over | 42 (1.7%) | 63 (2.4%) |
| Total | 2,456 (100.0%) | 2,609 (100.0%) |
Families and Households in Kahaluu
Median Family Size in Kahaluu
The median family size in Kahaluu is 3.80 persons per family, with single female/mother families (166 | 14.3%) accounting for the largest median family size of 4.25 persons per family. On the other hand, single male/father families (121 | 10.4%) represent the smallest median family size with 3.60 persons per family.
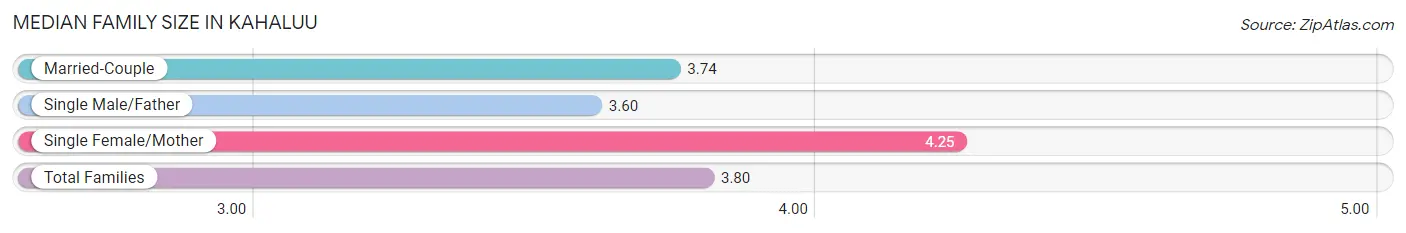
| Family Type | # Families | Family Size |
| Married-Couple | 876 (75.3%) | 3.74 |
| Single Male/Father | 121 (10.4%) | 3.60 |
| Single Female/Mother | 166 (14.3%) | 4.25 |
| Total Families | 1,163 (100.0%) | 3.80 |
Median Household Size in Kahaluu
The median household size in Kahaluu is 3.56 persons per household, with single female/mother households (166 | 11.7%) accounting for the largest median household size of 4.31 persons per household. non-family households (252 | 17.8%) represent the smallest median household size with 1.25 persons per household.
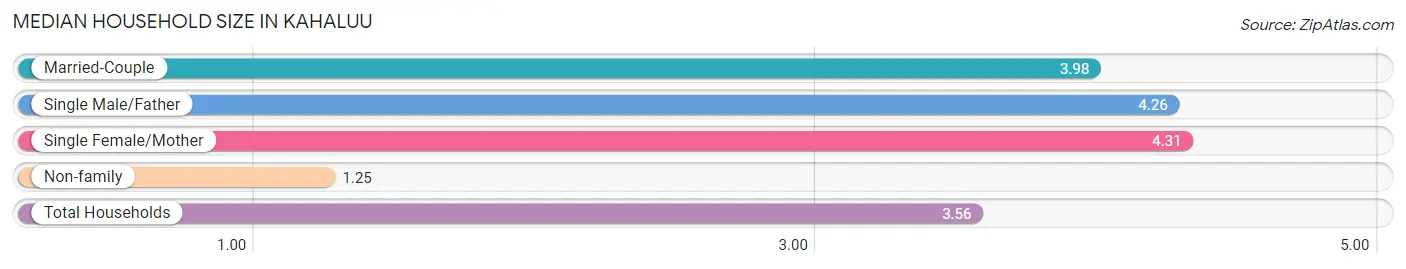
| Household Type | # Households | Household Size |
| Married-Couple | 876 (61.9%) | 3.98 |
| Single Male/Father | 121 (8.6%) | 4.26 |
| Single Female/Mother | 166 (11.7%) | 4.31 |
| Non-family | 252 (17.8%) | 1.25 |
| Total Households | 1,415 (100.0%) | 3.56 |
Household Size by Marriage Status in Kahaluu
Out of a total of 1,415 households in Kahaluu, 1,163 (82.2%) are family households, while 252 (17.8%) are nonfamily households. The most numerous type of family households are 2-person households, comprising 501, and the most common type of nonfamily households are 1-person households, comprising 207.
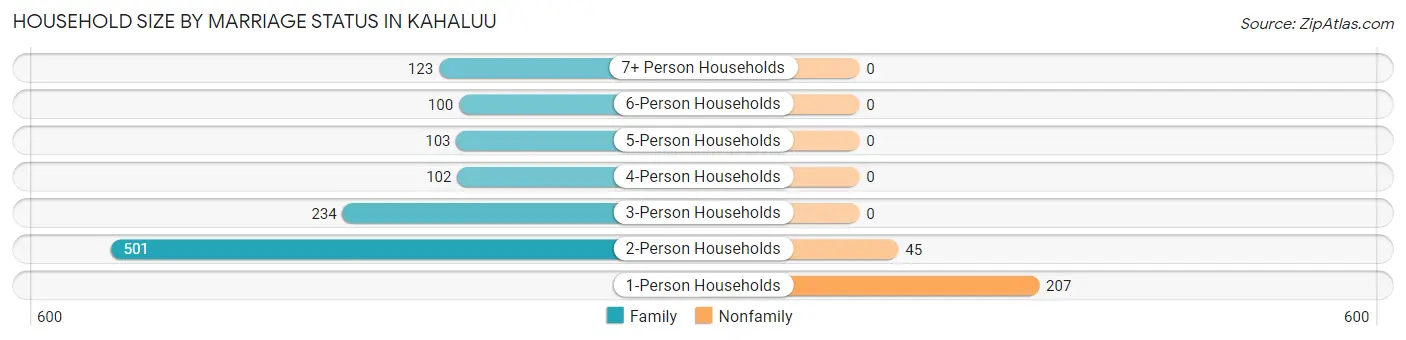
| Household Size | Family Households | Nonfamily Households |
| 1-Person Households | - | 207 (14.6%) |
| 2-Person Households | 501 (35.4%) | 45 (3.2%) |
| 3-Person Households | 234 (16.5%) | 0 (0.0%) |
| 4-Person Households | 102 (7.2%) | 0 (0.0%) |
| 5-Person Households | 103 (7.3%) | 0 (0.0%) |
| 6-Person Households | 100 (7.1%) | 0 (0.0%) |
| 7+ Person Households | 123 (8.7%) | 0 (0.0%) |
| Total | 1,163 (82.2%) | 252 (17.8%) |
Female Fertility in Kahaluu
Fertility by Age in Kahaluu
Average fertility rate in Kahaluu is 29.0 births per 1,000 women. Women in the age bracket of 20 to 34 years have the highest fertility rate with 44.0 births per 1,000 women. Women in the age bracket of 35 to 50 years acount for 61.8% of all women with births.
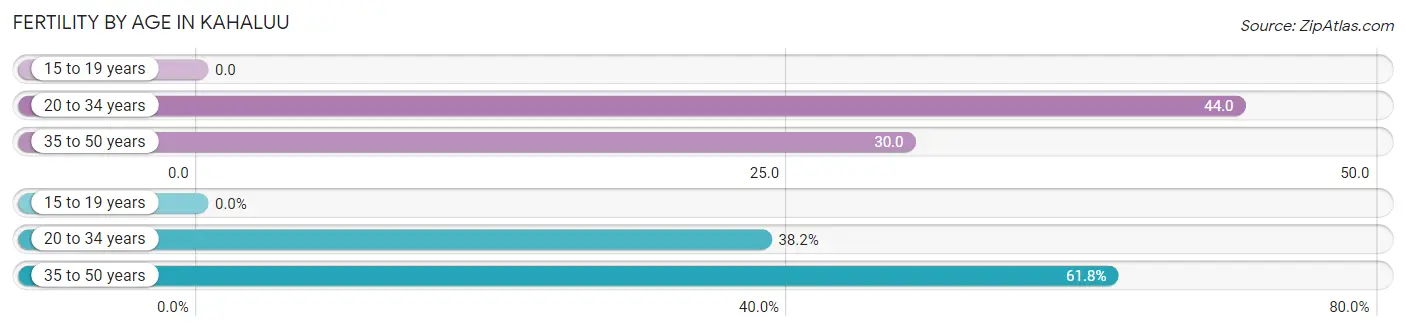
| Age Bracket | Women with Births | Births / 1,000 Women |
| 15 to 19 years | 0 (0.0%) | 0.0 |
| 20 to 34 years | 13 (38.2%) | 44.0 |
| 35 to 50 years | 21 (61.8%) | 30.0 |
| Total | 34 (100.0%) | 29.0 |
Fertility by Age by Marriage Status in Kahaluu
61.8% of women with births (34) in Kahaluu are married. The highest percentage of unmarried women with births falls into 20 to 34 years age bracket with 100.0% of them unmarried at the time of birth, while the lowest percentage of unmarried women with births belong to 35 to 50 years age bracket with 0.0% of them unmarried.
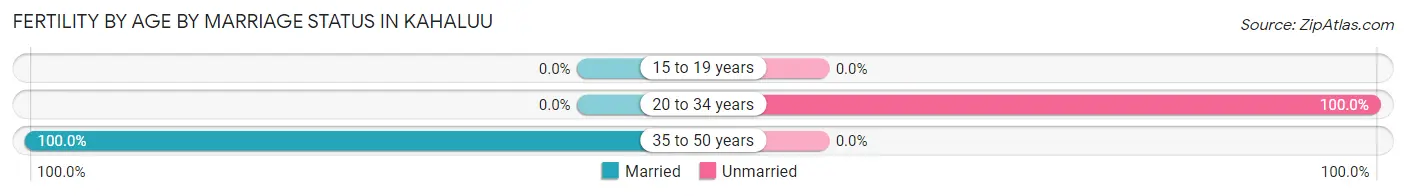
| Age Bracket | Married | Unmarried |
| 15 to 19 years | 0 (0.0%) | 0 (0.0%) |
| 20 to 34 years | 0 (0.0%) | 13 (100.0%) |
| 35 to 50 years | 21 (100.0%) | 0 (0.0%) |
| Total | 21 (61.8%) | 13 (38.2%) |
Fertility by Education in Kahaluu
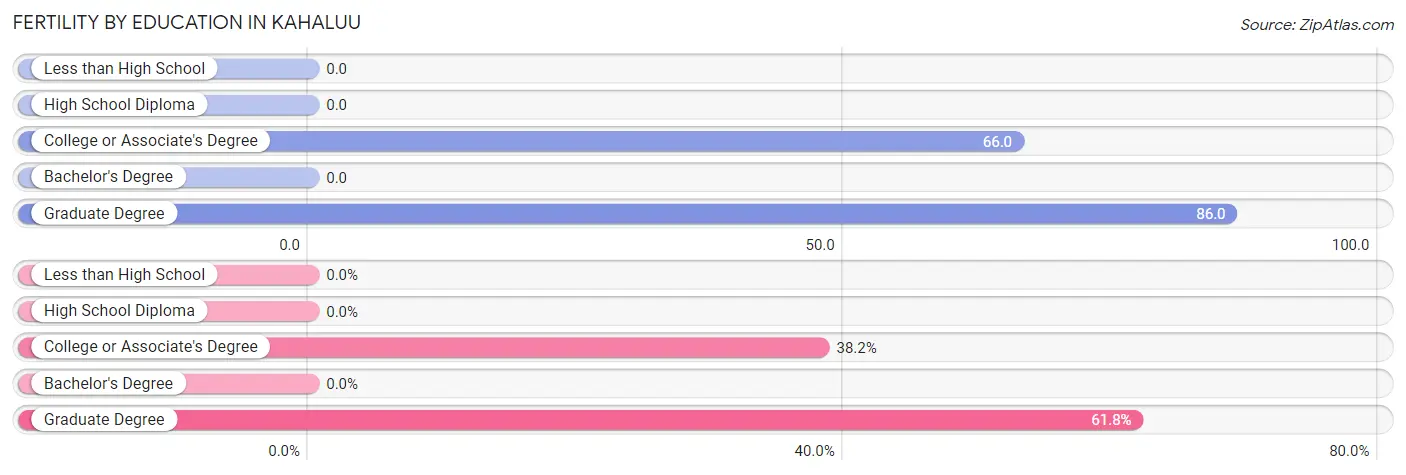
| Educational Attainment | Women with Births | Births / 1,000 Women |
| Less than High School | 0 (0.0%) | 0.0 |
| High School Diploma | 0 (0.0%) | 0.0 |
| College or Associate's Degree | 13 (38.2%) | 66.0 |
| Bachelor's Degree | 0 (0.0%) | 0.0 |
| Graduate Degree | 21 (61.8%) | 86.0 |
| Total | 34 (100.0%) | 29.0 |
Fertility by Education by Marriage Status in Kahaluu
38.2% of women with births in Kahaluu are unmarried. Women with the educational attainment of graduate degree are most likely to be married with 100.0% of them married at childbirth, while women with the educational attainment of college or associate's degree are least likely to be married with 100.0% of them unmarried at childbirth.
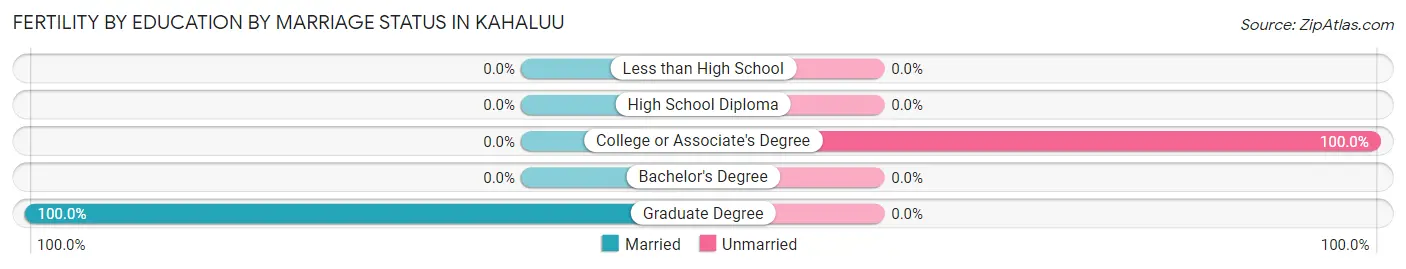
| Educational Attainment | Married | Unmarried |
| Less than High School | 0 (0.0%) | 0 (0.0%) |
| High School Diploma | 0 (0.0%) | 0 (0.0%) |
| College or Associate's Degree | 0 (0.0%) | 13 (100.0%) |
| Bachelor's Degree | 0 (0.0%) | 0 (0.0%) |
| Graduate Degree | 21 (100.0%) | 0 (0.0%) |
| Total | 21 (61.8%) | 13 (38.2%) |
Employment Characteristics in Kahaluu
Employment by Class of Employer in Kahaluu
Among the 2,439 employed individuals in Kahaluu, private company employees (1,094 | 44.9%), federal government employees (349 | 14.3%), and not-for-profit organizations (306 | 12.6%) make up the most common classes of employment.
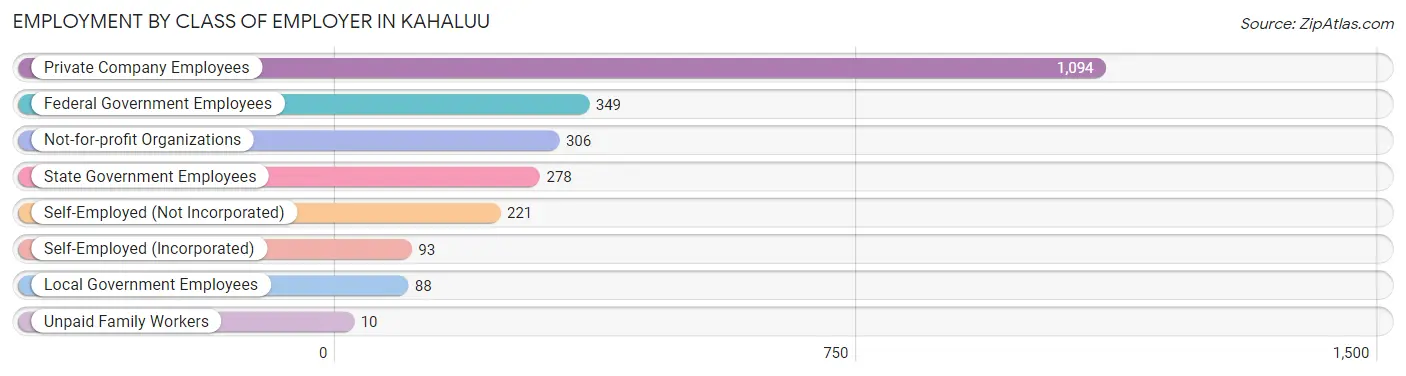
| Employer Class | # Employees | % Employees |
| Private Company Employees | 1,094 | 44.9% |
| Self-Employed (Incorporated) | 93 | 3.8% |
| Self-Employed (Not Incorporated) | 221 | 9.1% |
| Not-for-profit Organizations | 306 | 12.6% |
| Local Government Employees | 88 | 3.6% |
| State Government Employees | 278 | 11.4% |
| Federal Government Employees | 349 | 14.3% |
| Unpaid Family Workers | 10 | 0.4% |
| Total | 2,439 | 100.0% |
Employment Status by Age in Kahaluu
According to the labor force statistics for Kahaluu, out of the total population over 16 years of age (4,039), 66.1% or 2,670 individuals are in the labor force, with 5.6% or 150 of them unemployed. The age group with the highest labor force participation rate is 25 to 29 years, with 100.0% or 165 individuals in the labor force. Within the labor force, the 45 to 54 years age range has the highest percentage of unemployed individuals, with 10.8% or 87 of them being unemployed.
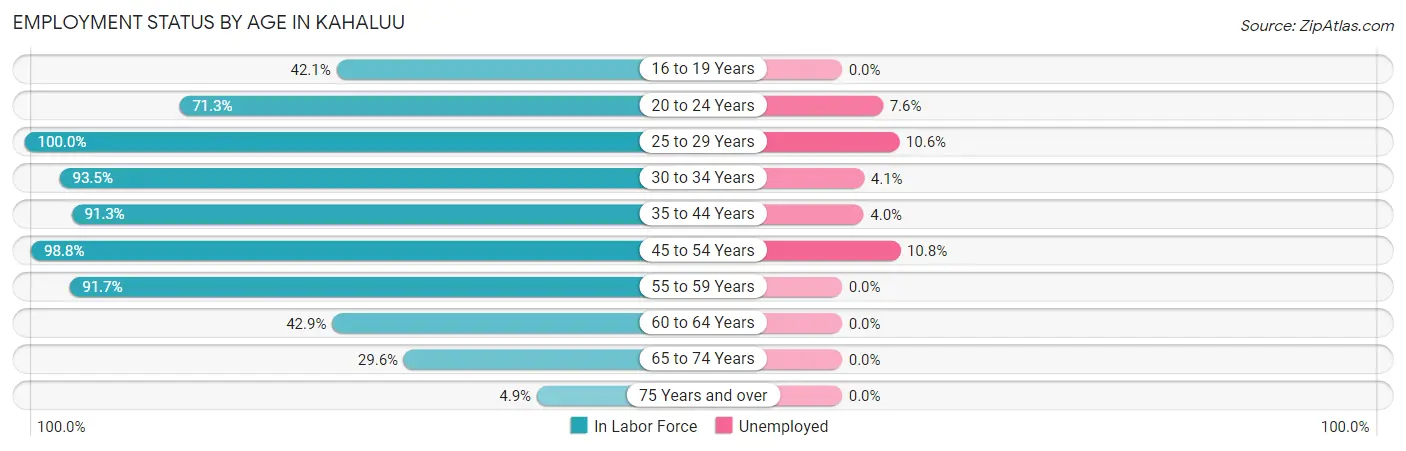
| Age Bracket | In Labor Force | Unemployed |
| 16 to 19 Years | 102 (42.1%) | 0 (0.0%) |
| 20 to 24 Years | 186 (71.3%) | 14 (7.6%) |
| 25 to 29 Years | 165 (100.0%) | 17 (10.6%) |
| 30 to 34 Years | 145 (93.5%) | 6 (4.1%) |
| 35 to 44 Years | 623 (91.3%) | 25 (4.0%) |
| 45 to 54 Years | 805 (98.8%) | 87 (10.8%) |
| 55 to 59 Years | 310 (91.7%) | 0 (0.0%) |
| 60 to 64 Years | 151 (42.9%) | 0 (0.0%) |
| 65 to 74 Years | 159 (29.6%) | 0 (0.0%) |
| 75 Years and over | 24 (4.9%) | 0 (0.0%) |
| Total | 2,670 (66.1%) | 150 (5.6%) |
Employment Status by Educational Attainment in Kahaluu
According to labor force statistics for Kahaluu, 87.7% of individuals (2,199) out of the total population between 25 and 64 years of age (2,507) are in the labor force, with 6.1% or 134 of them being unemployed. The group with the highest labor force participation rate are those with the educational attainment of college / associate degree, with 96.3% or 546 individuals in the labor force. Within the labor force, individuals with high school diploma education have the highest percentage of unemployment, with 15.6% or 99 of them being unemployed.
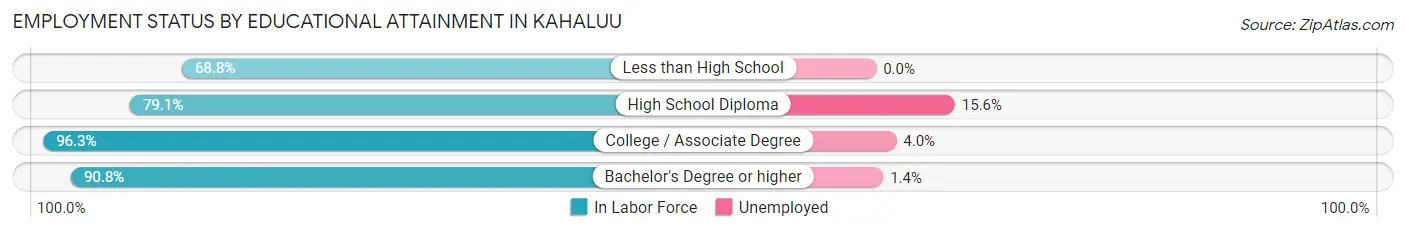
| Educational Attainment | In Labor Force | Unemployed |
| Less than High School | 44 (68.8%) | 0 (0.0%) |
| High School Diploma | 636 (79.1%) | 125 (15.6%) |
| College / Associate Degree | 546 (96.3%) | 23 (4.0%) |
| Bachelor's Degree or higher | 973 (90.8%) | 15 (1.4%) |
| Total | 2,199 (87.7%) | 153 (6.1%) |
Employment Occupations by Sex in Kahaluu
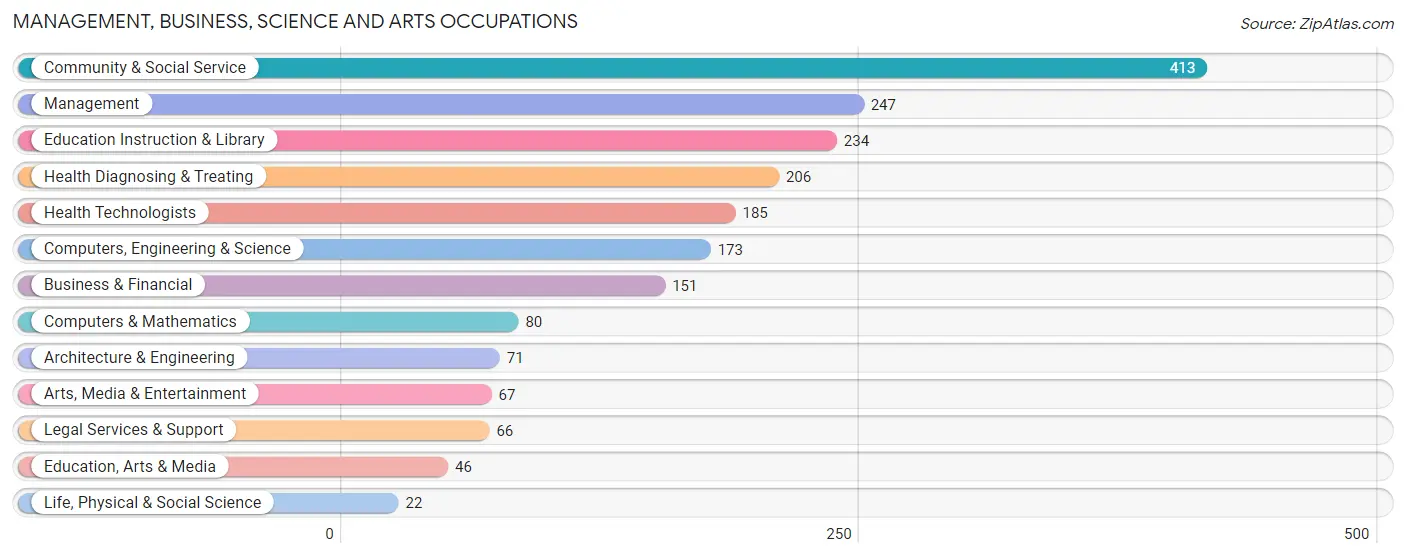
Management, Business, Science and Arts Occupations
The most common Management, Business, Science and Arts occupations in Kahaluu are Community & Social Service (413 | 16.6%), Management (247 | 9.9%), Education Instruction & Library (234 | 9.4%), Health Diagnosing & Treating (206 | 8.3%), and Health Technologists (185 | 7.4%).
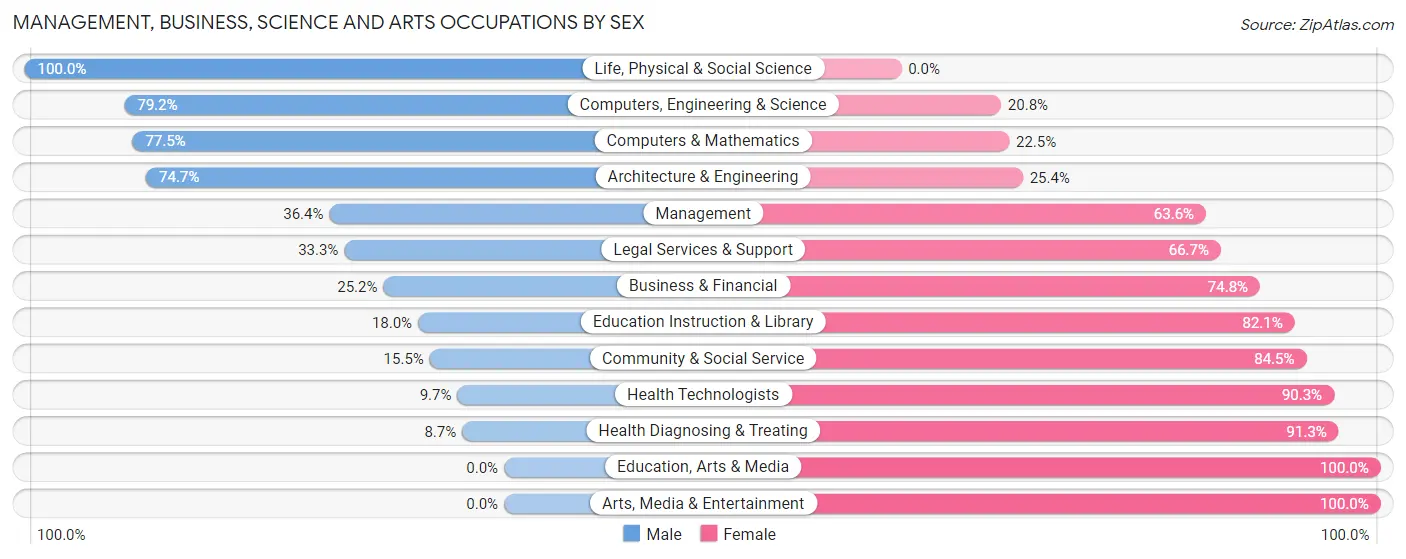
Management, Business, Science and Arts Occupations by Sex
Within the Management, Business, Science and Arts occupations in Kahaluu, the most male-oriented occupations are Life, Physical & Social Science (100.0%), Computers, Engineering & Science (79.2%), and Computers & Mathematics (77.5%), while the most female-oriented occupations are Education, Arts & Media (100.0%), Arts, Media & Entertainment (100.0%), and Health Diagnosing & Treating (91.3%).
| Occupation | Male | Female |
| Management | 90 (36.4%) | 157 (63.6%) |
| Business & Financial | 38 (25.2%) | 113 (74.8%) |
| Computers, Engineering & Science | 137 (79.2%) | 36 (20.8%) |
| Computers & Mathematics | 62 (77.5%) | 18 (22.5%) |
| Architecture & Engineering | 53 (74.7%) | 18 (25.4%) |
| Life, Physical & Social Science | 22 (100.0%) | 0 (0.0%) |
| Community & Social Service | 64 (15.5%) | 349 (84.5%) |
| Education, Arts & Media | 0 (0.0%) | 46 (100.0%) |
| Legal Services & Support | 22 (33.3%) | 44 (66.7%) |
| Education Instruction & Library | 42 (17.9%) | 192 (82.1%) |
| Arts, Media & Entertainment | 0 (0.0%) | 67 (100.0%) |
| Health Diagnosing & Treating | 18 (8.7%) | 188 (91.3%) |
| Health Technologists | 18 (9.7%) | 167 (90.3%) |
| Total (Category) | 347 (29.2%) | 843 (70.8%) |
| Total (Overall) | 1,084 (43.5%) | 1,410 (56.5%) |
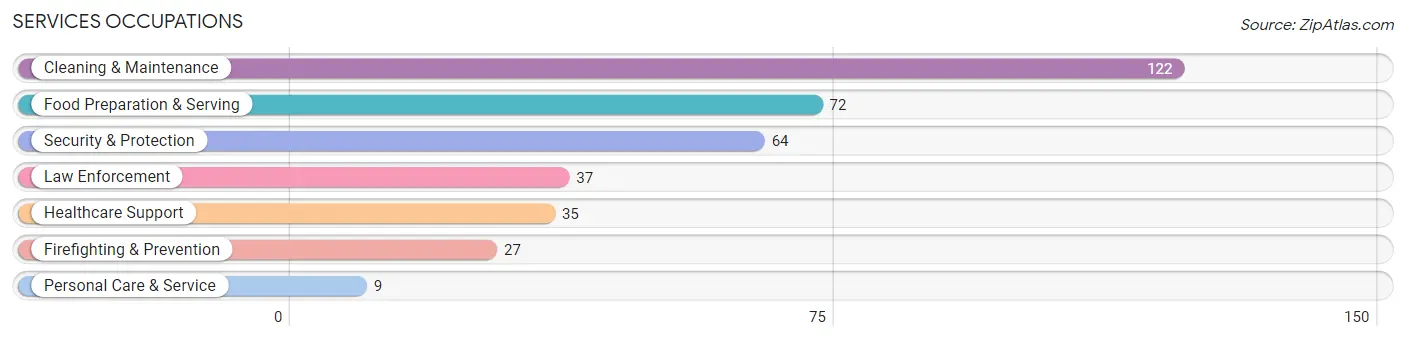
Services Occupations
The most common Services occupations in Kahaluu are Cleaning & Maintenance (122 | 4.9%), Food Preparation & Serving (72 | 2.9%), Security & Protection (64 | 2.6%), Law Enforcement (37 | 1.5%), and Healthcare Support (35 | 1.4%).
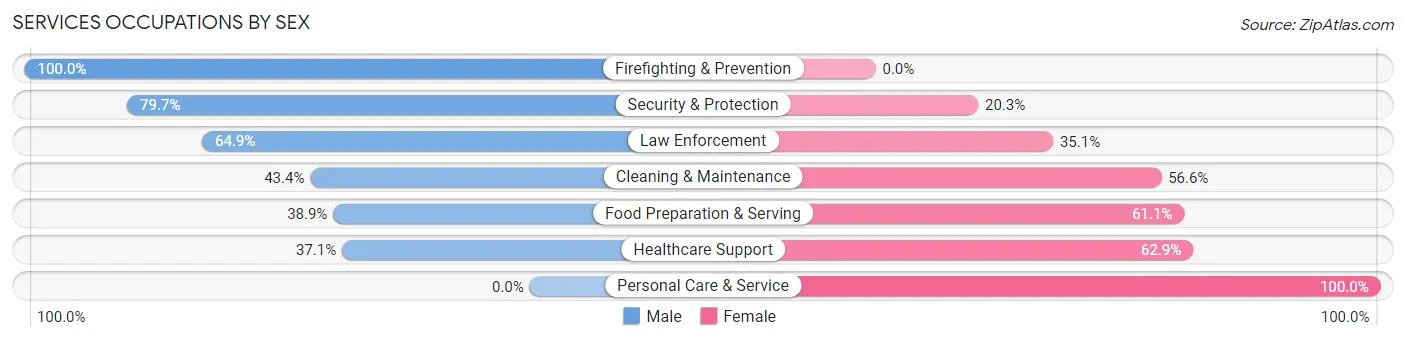
Services Occupations by Sex
Within the Services occupations in Kahaluu, the most male-oriented occupations are Firefighting & Prevention (100.0%), Security & Protection (79.7%), and Law Enforcement (64.9%), while the most female-oriented occupations are Personal Care & Service (100.0%), Healthcare Support (62.9%), and Food Preparation & Serving (61.1%).
| Occupation | Male | Female |
| Healthcare Support | 13 (37.1%) | 22 (62.9%) |
| Security & Protection | 51 (79.7%) | 13 (20.3%) |
| Firefighting & Prevention | 27 (100.0%) | 0 (0.0%) |
| Law Enforcement | 24 (64.9%) | 13 (35.1%) |
| Food Preparation & Serving | 28 (38.9%) | 44 (61.1%) |
| Cleaning & Maintenance | 53 (43.4%) | 69 (56.6%) |
| Personal Care & Service | 0 (0.0%) | 9 (100.0%) |
| Total (Category) | 145 (48.0%) | 157 (52.0%) |
| Total (Overall) | 1,084 (43.5%) | 1,410 (56.5%) |
Sales and Office Occupations
The most common Sales and Office occupations in Kahaluu are Office & Administration (316 | 12.7%), and Sales & Related (100 | 4.0%).
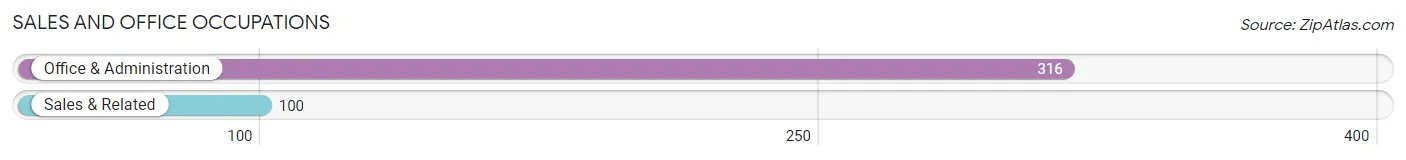
Sales and Office Occupations by Sex
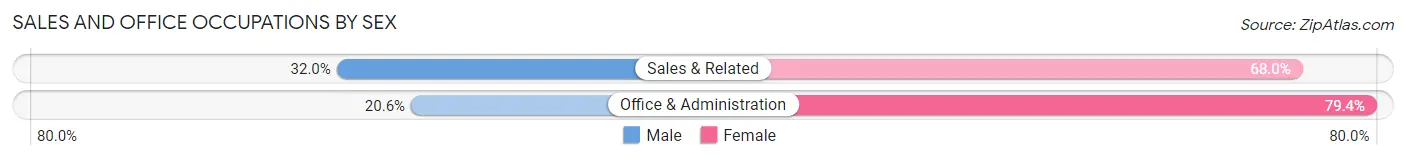
| Occupation | Male | Female |
| Sales & Related | 32 (32.0%) | 68 (68.0%) |
| Office & Administration | 65 (20.6%) | 251 (79.4%) |
| Total (Category) | 97 (23.3%) | 319 (76.7%) |
| Total (Overall) | 1,084 (43.5%) | 1,410 (56.5%) |
Natural Resources, Construction and Maintenance Occupations
The most common Natural Resources, Construction and Maintenance occupations in Kahaluu are Construction & Extraction (129 | 5.2%), and Installation, Maintenance & Repair (93 | 3.7%).
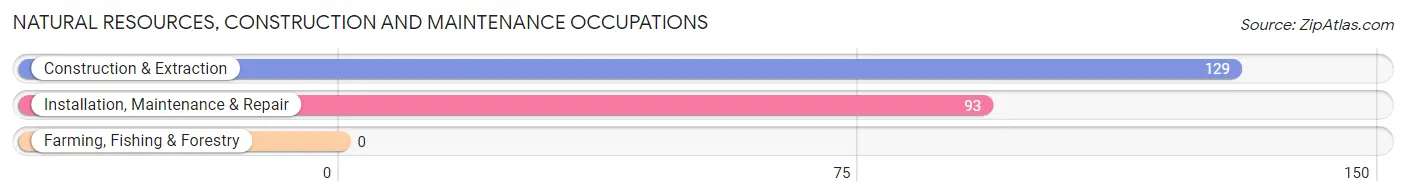
Natural Resources, Construction and Maintenance Occupations by Sex
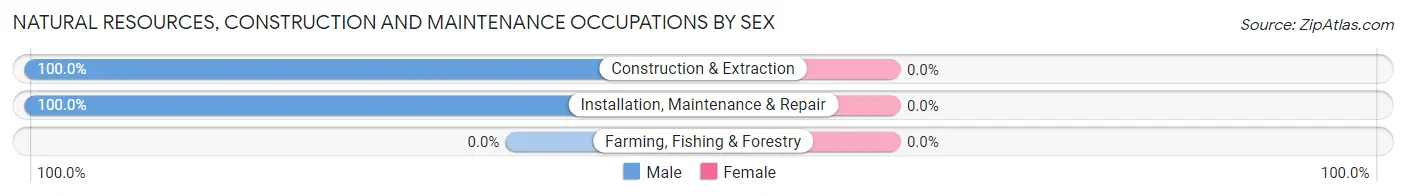
| Occupation | Male | Female |
| Farming, Fishing & Forestry | 0 (0.0%) | 0 (0.0%) |
| Construction & Extraction | 129 (100.0%) | 0 (0.0%) |
| Installation, Maintenance & Repair | 93 (100.0%) | 0 (0.0%) |
| Total (Category) | 222 (100.0%) | 0 (0.0%) |
| Total (Overall) | 1,084 (43.5%) | 1,410 (56.5%) |
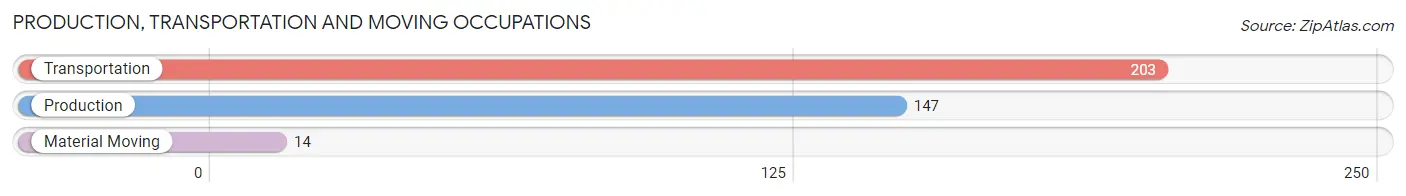
Production, Transportation and Moving Occupations
The most common Production, Transportation and Moving occupations in Kahaluu are Transportation (203 | 8.1%), Production (147 | 5.9%), and Material Moving (14 | 0.6%).
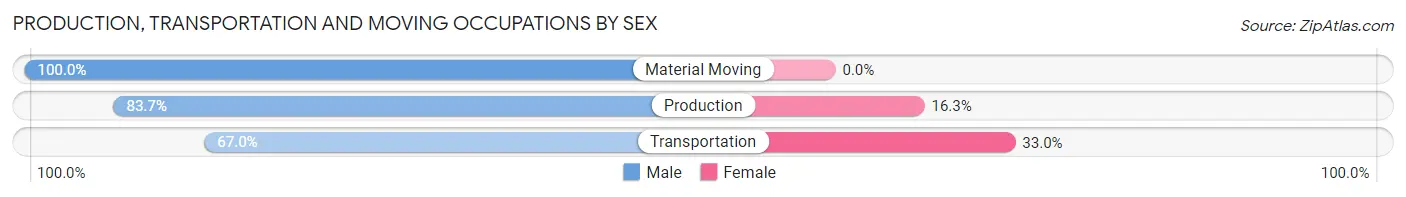
Production, Transportation and Moving Occupations by Sex
| Occupation | Male | Female |
| Production | 123 (83.7%) | 24 (16.3%) |
| Transportation | 136 (67.0%) | 67 (33.0%) |
| Material Moving | 14 (100.0%) | 0 (0.0%) |
| Total (Category) | 273 (75.0%) | 91 (25.0%) |
| Total (Overall) | 1,084 (43.5%) | 1,410 (56.5%) |
Employment Industries by Sex in Kahaluu
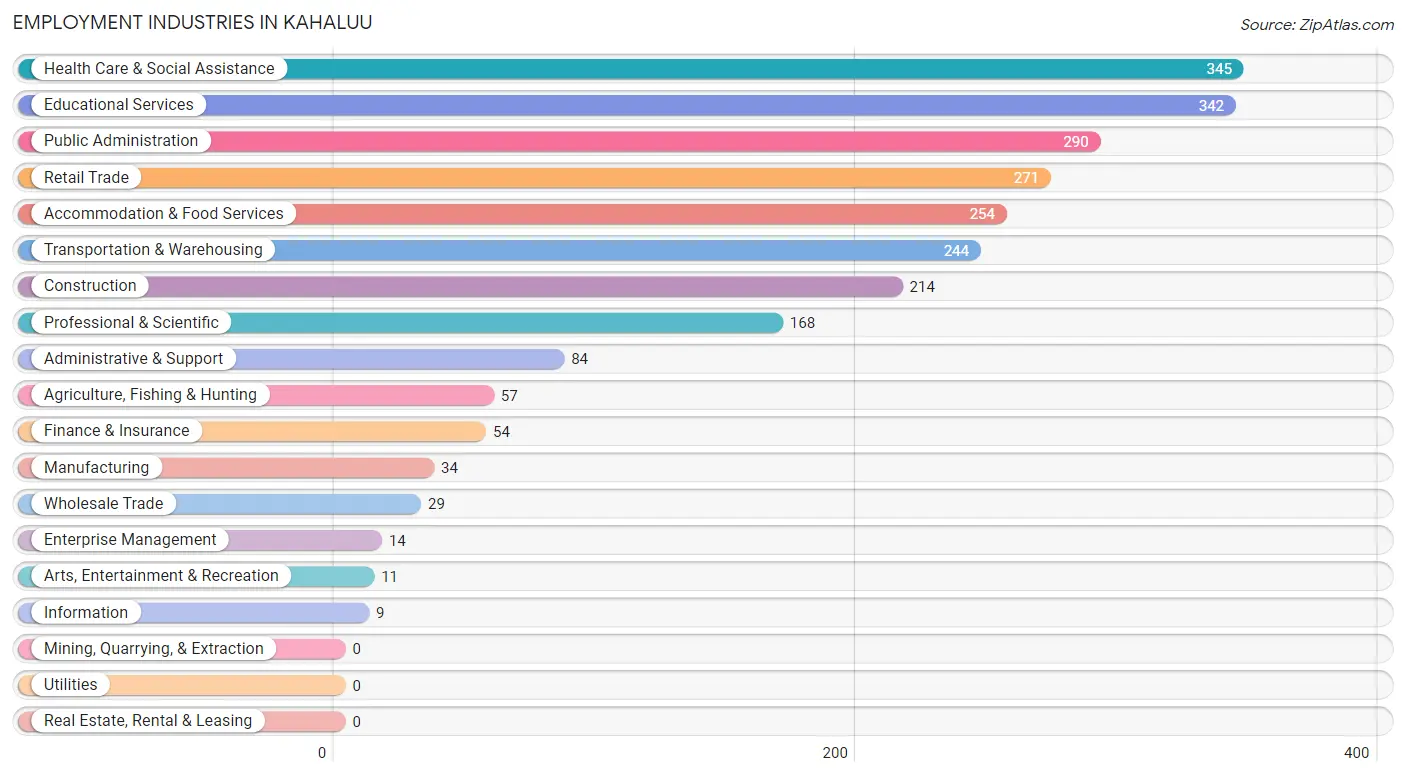
Employment Industries in Kahaluu
The major employment industries in Kahaluu include Health Care & Social Assistance (345 | 13.8%), Educational Services (342 | 13.7%), Public Administration (290 | 11.6%), Retail Trade (271 | 10.9%), and Accommodation & Food Services (254 | 10.2%).
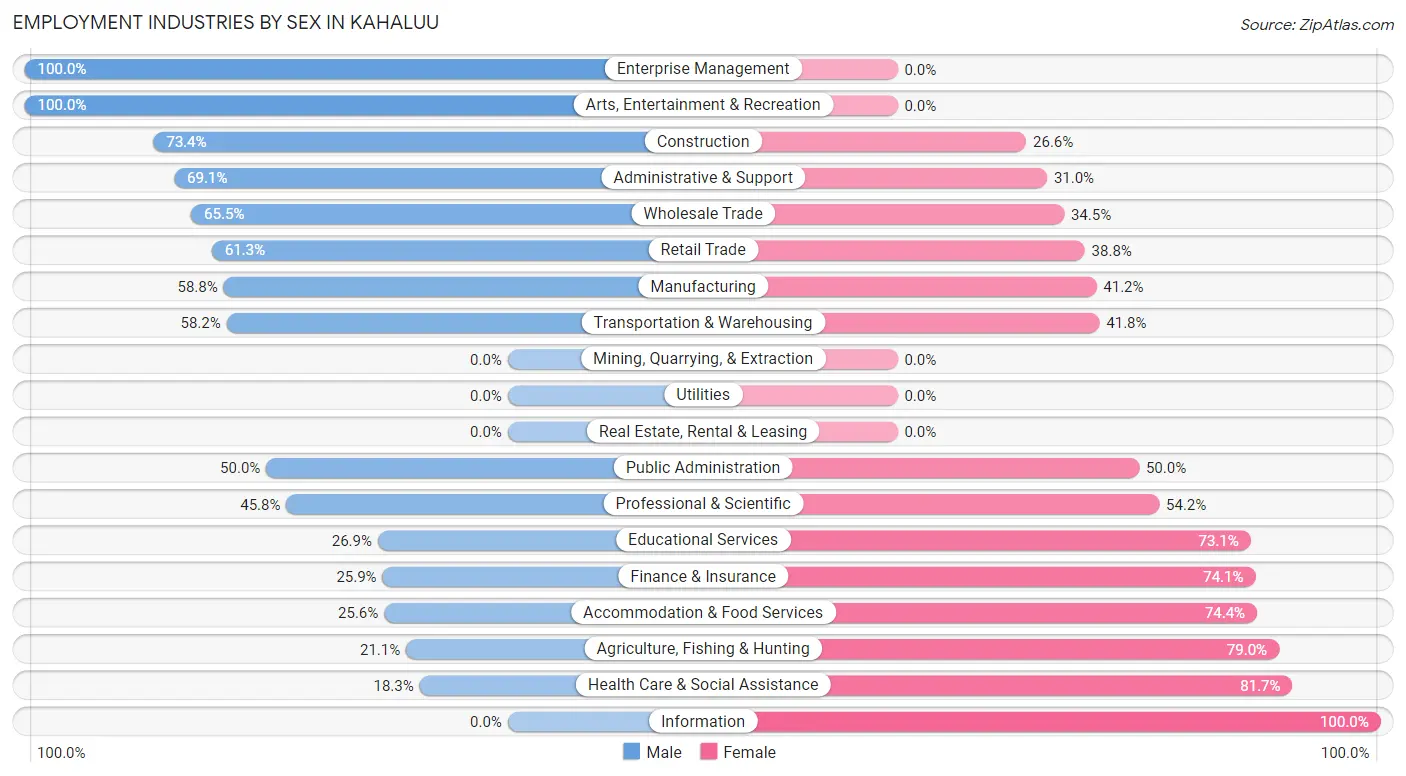
Employment Industries by Sex in Kahaluu
The Kahaluu industries that see more men than women are Enterprise Management (100.0%), Arts, Entertainment & Recreation (100.0%), and Construction (73.4%), whereas the industries that tend to have a higher number of women are Information (100.0%), Health Care & Social Assistance (81.7%), and Agriculture, Fishing & Hunting (78.9%).
| Industry | Male | Female |
| Agriculture, Fishing & Hunting | 12 (21.0%) | 45 (78.9%) |
| Mining, Quarrying, & Extraction | 0 (0.0%) | 0 (0.0%) |
| Construction | 157 (73.4%) | 57 (26.6%) |
| Manufacturing | 20 (58.8%) | 14 (41.2%) |
| Wholesale Trade | 19 (65.5%) | 10 (34.5%) |
| Retail Trade | 166 (61.3%) | 105 (38.8%) |
| Transportation & Warehousing | 142 (58.2%) | 102 (41.8%) |
| Utilities | 0 (0.0%) | 0 (0.0%) |
| Information | 0 (0.0%) | 9 (100.0%) |
| Finance & Insurance | 14 (25.9%) | 40 (74.1%) |
| Real Estate, Rental & Leasing | 0 (0.0%) | 0 (0.0%) |
| Professional & Scientific | 77 (45.8%) | 91 (54.2%) |
| Enterprise Management | 14 (100.0%) | 0 (0.0%) |
| Administrative & Support | 58 (69.1%) | 26 (30.9%) |
| Educational Services | 92 (26.9%) | 250 (73.1%) |
| Health Care & Social Assistance | 63 (18.3%) | 282 (81.7%) |
| Arts, Entertainment & Recreation | 11 (100.0%) | 0 (0.0%) |
| Accommodation & Food Services | 65 (25.6%) | 189 (74.4%) |
| Public Administration | 145 (50.0%) | 145 (50.0%) |
| Total | 1,084 (43.5%) | 1,410 (56.5%) |
Education in Kahaluu
School Enrollment in Kahaluu
The most common levels of schooling among the 1,222 students in Kahaluu are middle school (320 | 26.2%), elementary school (318 | 26.0%), and high school (241 | 19.7%).
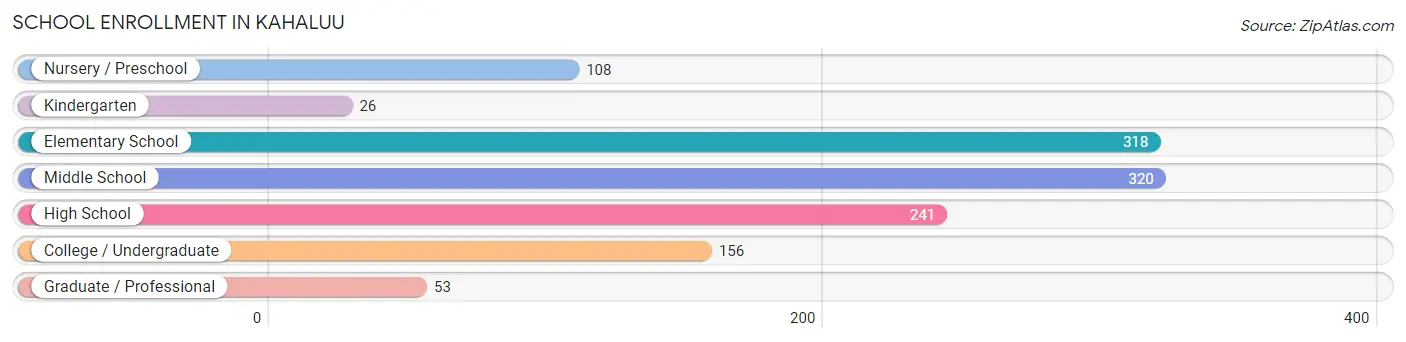
| School Level | # Students | % Students |
| Nursery / Preschool | 108 | 8.8% |
| Kindergarten | 26 | 2.1% |
| Elementary School | 318 | 26.0% |
| Middle School | 320 | 26.2% |
| High School | 241 | 19.7% |
| College / Undergraduate | 156 | 12.8% |
| Graduate / Professional | 53 | 4.3% |
| Total | 1,222 | 100.0% |
School Enrollment by Age by Funding Source in Kahaluu
Out of a total of 1,222 students who are enrolled in schools in Kahaluu, 433 (35.4%) attend a private institution, while the remaining 789 (64.6%) are enrolled in public schools. The age group of 35 years and over has the highest likelihood of being enrolled in private schools, with 66 (66.7% in the age bracket) enrolled. Conversely, the age group of 25 to 34 year olds has the lowest likelihood of being enrolled in a private school, with 10 (100.0% in the age bracket) attending a public institution.
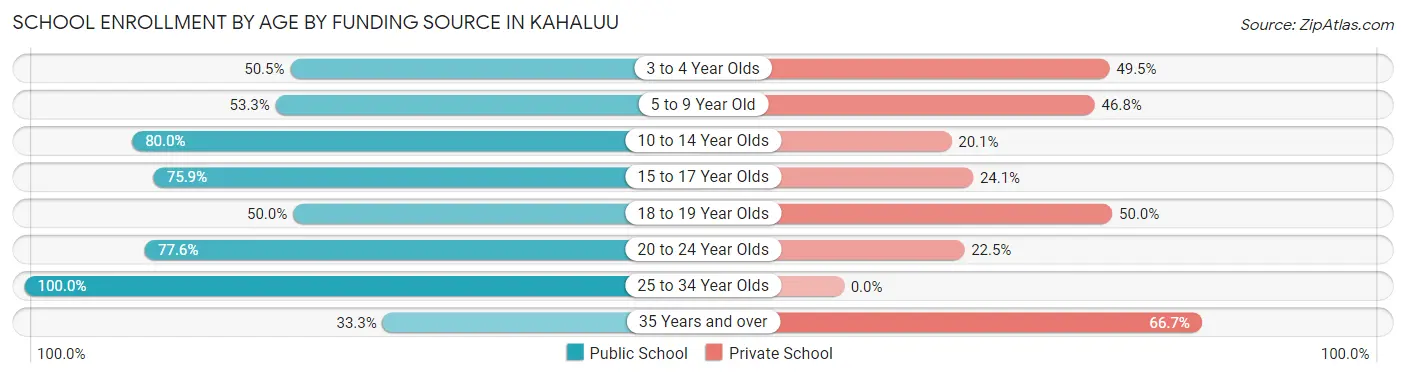
| Age Bracket | Public School | Private School |
| 3 to 4 Year Olds | 50 (50.5%) | 49 (49.5%) |
| 5 to 9 Year Old | 172 (53.2%) | 151 (46.8%) |
| 10 to 14 Year Olds | 311 (79.9%) | 78 (20.1%) |
| 15 to 17 Year Olds | 145 (75.9%) | 46 (24.1%) |
| 18 to 19 Year Olds | 31 (50.0%) | 31 (50.0%) |
| 20 to 24 Year Olds | 38 (77.5%) | 11 (22.5%) |
| 25 to 34 Year Olds | 10 (100.0%) | 0 (0.0%) |
| 35 Years and over | 33 (33.3%) | 66 (66.7%) |
| Total | 789 (64.6%) | 433 (35.4%) |
Educational Attainment by Field of Study in Kahaluu
Science & technology (262 | 17.1%), business (175 | 11.4%), social sciences (164 | 10.7%), education (157 | 10.2%), and bio, nature & agricultural (123 | 8.0%) are the most common fields of study among 1,535 individuals in Kahaluu who have obtained a bachelor's degree or higher.
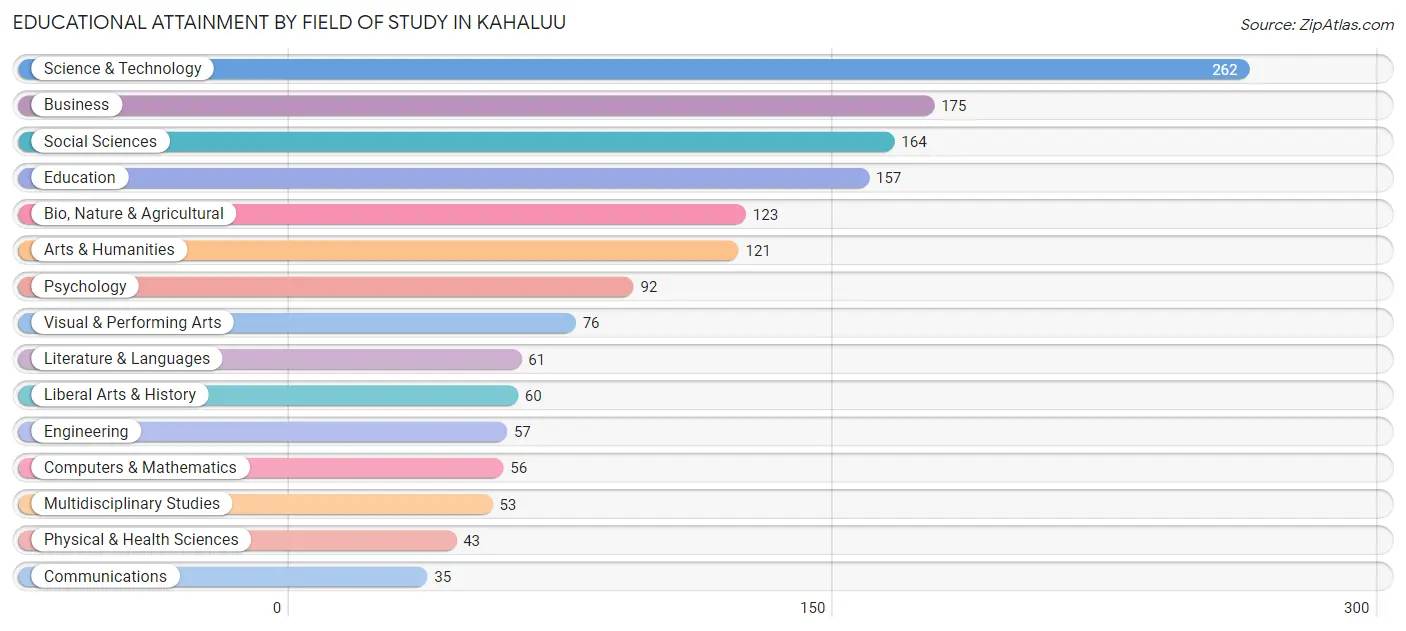
| Field of Study | # Graduates | % Graduates |
| Computers & Mathematics | 56 | 3.6% |
| Bio, Nature & Agricultural | 123 | 8.0% |
| Physical & Health Sciences | 43 | 2.8% |
| Psychology | 92 | 6.0% |
| Social Sciences | 164 | 10.7% |
| Engineering | 57 | 3.7% |
| Multidisciplinary Studies | 53 | 3.5% |
| Science & Technology | 262 | 17.1% |
| Business | 175 | 11.4% |
| Education | 157 | 10.2% |
| Literature & Languages | 61 | 4.0% |
| Liberal Arts & History | 60 | 3.9% |
| Visual & Performing Arts | 76 | 5.0% |
| Communications | 35 | 2.3% |
| Arts & Humanities | 121 | 7.9% |
| Total | 1,535 | 100.0% |
Transportation & Commute in Kahaluu
Vehicle Availability by Sex in Kahaluu
The most prevalent vehicle ownership categories in Kahaluu are males with 2 vehicles (329, accounting for 30.5%) and females with 2 vehicles (393, making up 24.2%).
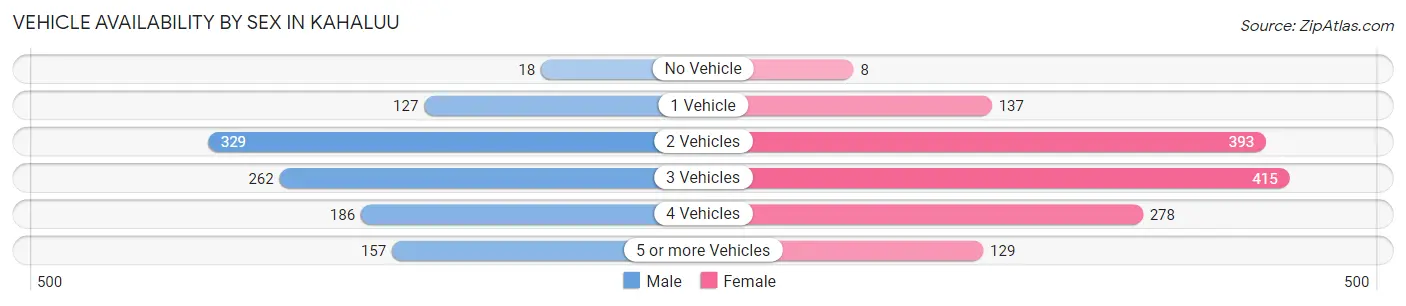
| Vehicles Available | Male | Female |
| No Vehicle | 18 (1.7%) | 8 (0.6%) |
| 1 Vehicle | 127 (11.8%) | 137 (10.1%) |
| 2 Vehicles | 329 (30.5%) | 393 (28.9%) |
| 3 Vehicles | 262 (24.3%) | 415 (30.5%) |
| 4 Vehicles | 186 (17.2%) | 278 (20.4%) |
| 5 or more Vehicles | 157 (14.5%) | 129 (9.5%) |
| Total | 1,079 (100.0%) | 1,360 (100.0%) |
Commute Time in Kahaluu
The most frequently occuring commute durations in Kahaluu are 30 to 34 minutes (526 commuters, 25.8%), 45 to 59 minutes (260 commuters, 12.8%), and 25 to 29 minutes (236 commuters, 11.6%).
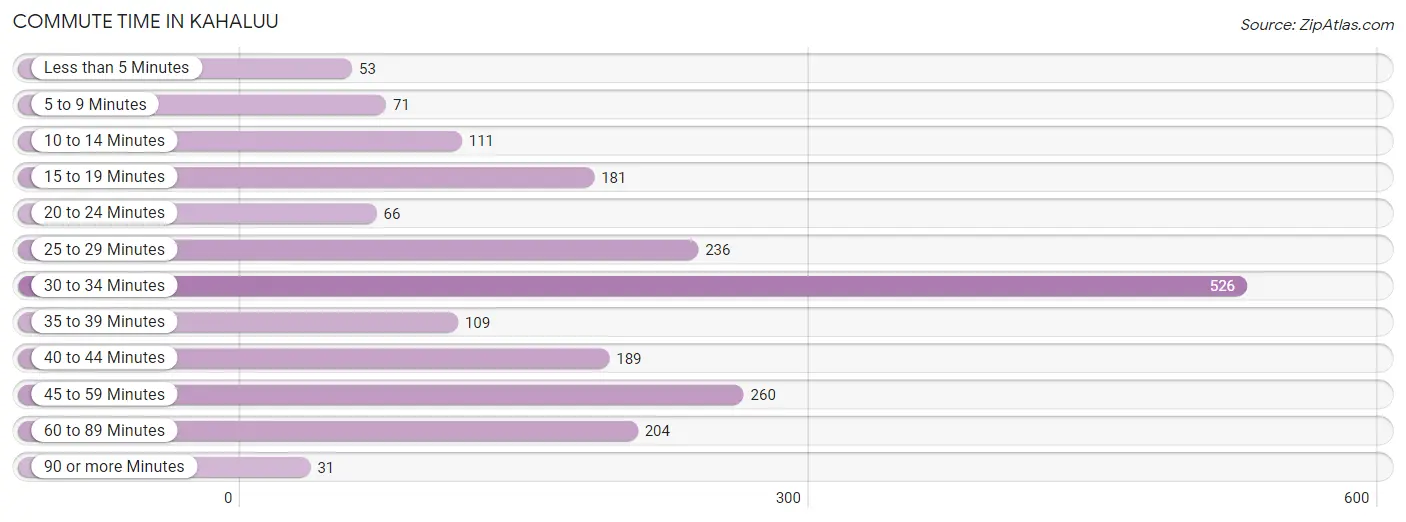
| Commute Time | # Commuters | % Commuters |
| Less than 5 Minutes | 53 | 2.6% |
| 5 to 9 Minutes | 71 | 3.5% |
| 10 to 14 Minutes | 111 | 5.4% |
| 15 to 19 Minutes | 181 | 8.9% |
| 20 to 24 Minutes | 66 | 3.2% |
| 25 to 29 Minutes | 236 | 11.6% |
| 30 to 34 Minutes | 526 | 25.8% |
| 35 to 39 Minutes | 109 | 5.3% |
| 40 to 44 Minutes | 189 | 9.3% |
| 45 to 59 Minutes | 260 | 12.8% |
| 60 to 89 Minutes | 204 | 10.0% |
| 90 or more Minutes | 31 | 1.5% |
Commute Time by Sex in Kahaluu
The most common commute times in Kahaluu are 30 to 34 minutes (265 commuters, 28.9%) for males and 30 to 34 minutes (261 commuters, 23.3%) for females.
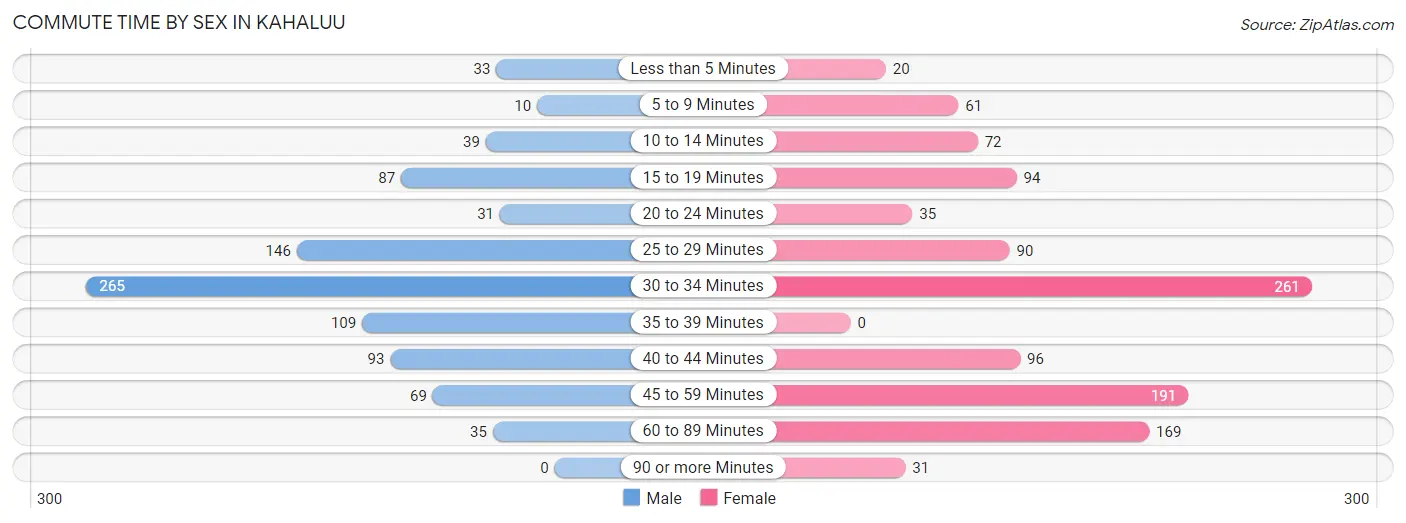
| Commute Time | Male | Female |
| Less than 5 Minutes | 33 (3.6%) | 20 (1.8%) |
| 5 to 9 Minutes | 10 (1.1%) | 61 (5.4%) |
| 10 to 14 Minutes | 39 (4.3%) | 72 (6.4%) |
| 15 to 19 Minutes | 87 (9.5%) | 94 (8.4%) |
| 20 to 24 Minutes | 31 (3.4%) | 35 (3.1%) |
| 25 to 29 Minutes | 146 (15.9%) | 90 (8.0%) |
| 30 to 34 Minutes | 265 (28.9%) | 261 (23.3%) |
| 35 to 39 Minutes | 109 (11.9%) | 0 (0.0%) |
| 40 to 44 Minutes | 93 (10.1%) | 96 (8.6%) |
| 45 to 59 Minutes | 69 (7.5%) | 191 (17.1%) |
| 60 to 89 Minutes | 35 (3.8%) | 169 (15.1%) |
| 90 or more Minutes | 0 (0.0%) | 31 (2.8%) |
Time of Departure to Work by Sex in Kahaluu
The most frequent times of departure to work in Kahaluu are 6:00 AM to 6:29 AM (231, 25.2%) for males and 6:00 AM to 6:29 AM (195, 17.4%) for females.
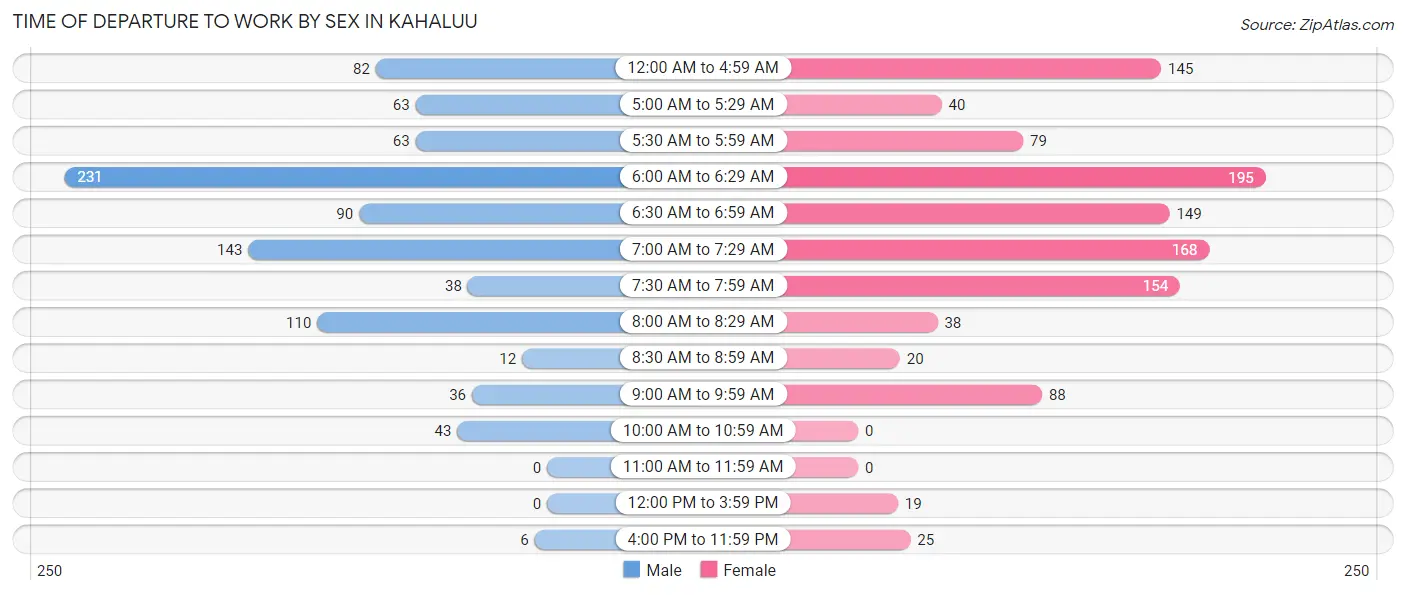
| Time of Departure | Male | Female |
| 12:00 AM to 4:59 AM | 82 (8.9%) | 145 (13.0%) |
| 5:00 AM to 5:29 AM | 63 (6.9%) | 40 (3.6%) |
| 5:30 AM to 5:59 AM | 63 (6.9%) | 79 (7.0%) |
| 6:00 AM to 6:29 AM | 231 (25.2%) | 195 (17.4%) |
| 6:30 AM to 6:59 AM | 90 (9.8%) | 149 (13.3%) |
| 7:00 AM to 7:29 AM | 143 (15.6%) | 168 (15.0%) |
| 7:30 AM to 7:59 AM | 38 (4.1%) | 154 (13.8%) |
| 8:00 AM to 8:29 AM | 110 (12.0%) | 38 (3.4%) |
| 8:30 AM to 8:59 AM | 12 (1.3%) | 20 (1.8%) |
| 9:00 AM to 9:59 AM | 36 (3.9%) | 88 (7.9%) |
| 10:00 AM to 10:59 AM | 43 (4.7%) | 0 (0.0%) |
| 11:00 AM to 11:59 AM | 0 (0.0%) | 0 (0.0%) |
| 12:00 PM to 3:59 PM | 0 (0.0%) | 19 (1.7%) |
| 4:00 PM to 11:59 PM | 6 (0.6%) | 25 (2.2%) |
| Total | 917 (100.0%) | 1,120 (100.0%) |
Housing Occupancy in Kahaluu
Occupancy by Ownership in Kahaluu
Of the total 1,415 dwellings in Kahaluu, owner-occupied units account for 928 (65.6%), while renter-occupied units make up 487 (34.4%).
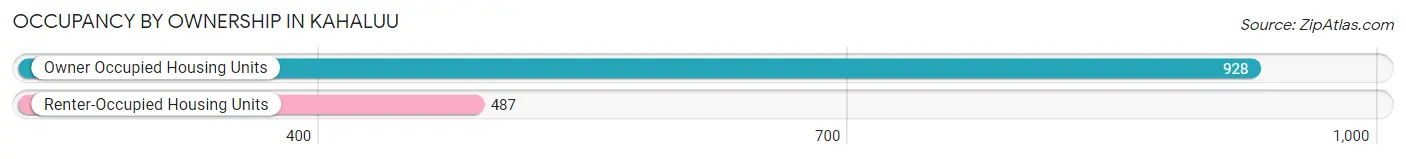
| Occupancy | # Housing Units | % Housing Units |
| Owner Occupied Housing Units | 928 | 65.6% |
| Renter-Occupied Housing Units | 487 | 34.4% |
| Total Occupied Housing Units | 1,415 | 100.0% |
Occupancy by Household Size in Kahaluu
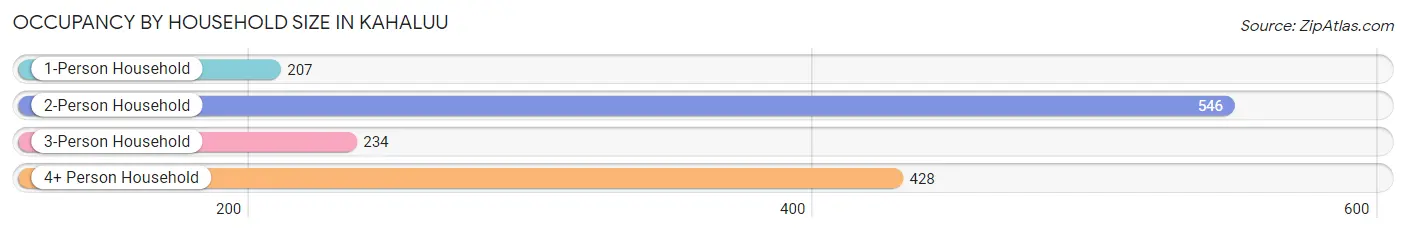
| Household Size | # Housing Units | % Housing Units |
| 1-Person Household | 207 | 14.6% |
| 2-Person Household | 546 | 38.6% |
| 3-Person Household | 234 | 16.5% |
| 4+ Person Household | 428 | 30.2% |
| Total Housing Units | 1,415 | 100.0% |
Occupancy by Ownership by Household Size in Kahaluu
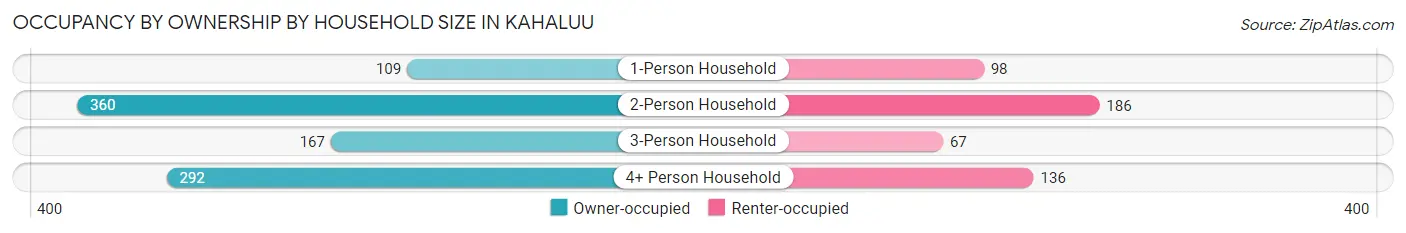
| Household Size | Owner-occupied | Renter-occupied |
| 1-Person Household | 109 (52.7%) | 98 (47.3%) |
| 2-Person Household | 360 (65.9%) | 186 (34.1%) |
| 3-Person Household | 167 (71.4%) | 67 (28.6%) |
| 4+ Person Household | 292 (68.2%) | 136 (31.8%) |
| Total Housing Units | 928 (65.6%) | 487 (34.4%) |
Occupancy by Educational Attainment in Kahaluu
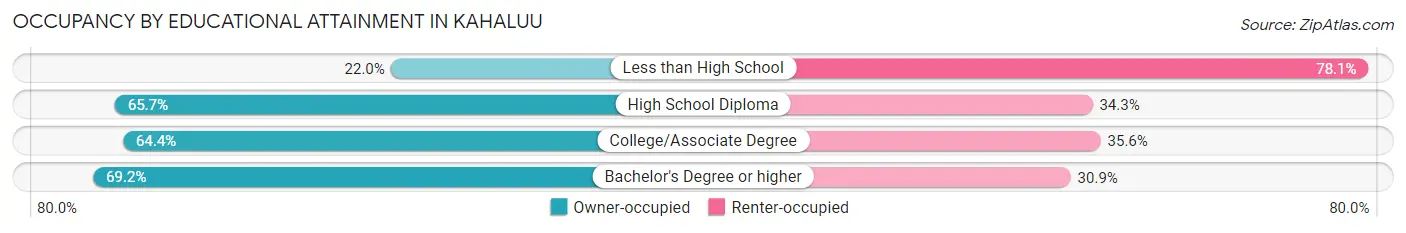
| Household Size | Owner-occupied | Renter-occupied |
| Less than High School | 9 (22.0%) | 32 (78.0%) |
| High School Diploma | 180 (65.7%) | 94 (34.3%) |
| College/Associate Degree | 293 (64.4%) | 162 (35.6%) |
| Bachelor's Degree or higher | 446 (69.2%) | 199 (30.8%) |
Occupancy by Age of Householder in Kahaluu
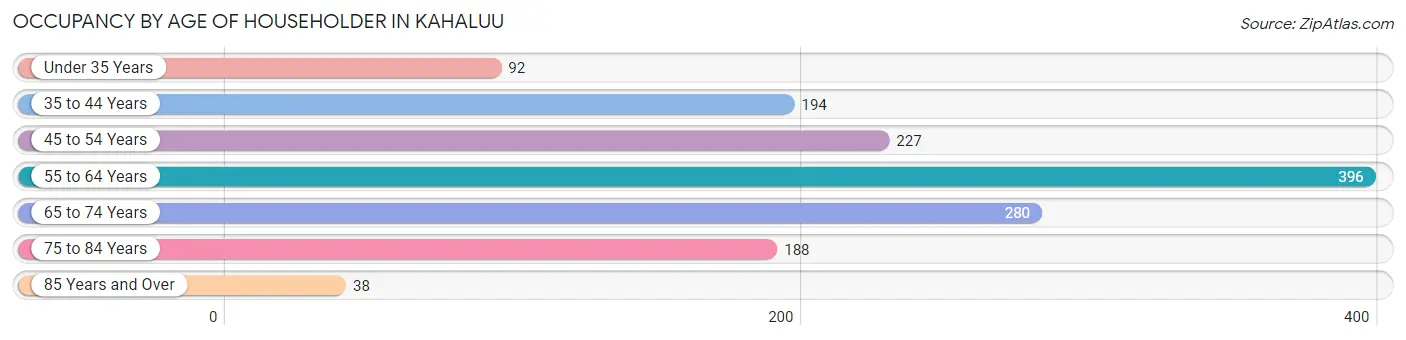
| Age Bracket | # Households | % Households |
| Under 35 Years | 92 | 6.5% |
| 35 to 44 Years | 194 | 13.7% |
| 45 to 54 Years | 227 | 16.0% |
| 55 to 64 Years | 396 | 28.0% |
| 65 to 74 Years | 280 | 19.8% |
| 75 to 84 Years | 188 | 13.3% |
| 85 Years and Over | 38 | 2.7% |
| Total | 1,415 | 100.0% |
Housing Finances in Kahaluu
Median Income by Occupancy in Kahaluu
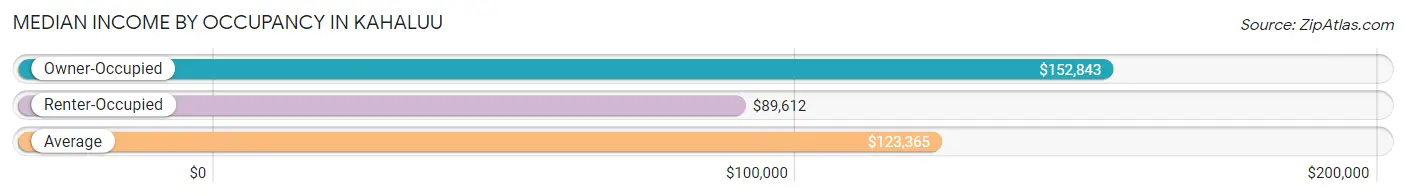
| Occupancy Type | # Households | Median Income |
| Owner-Occupied | 928 (65.6%) | $152,843 |
| Renter-Occupied | 487 (34.4%) | $89,612 |
| Average | 1,415 (100.0%) | $123,365 |
Occupancy by Householder Income Bracket in Kahaluu
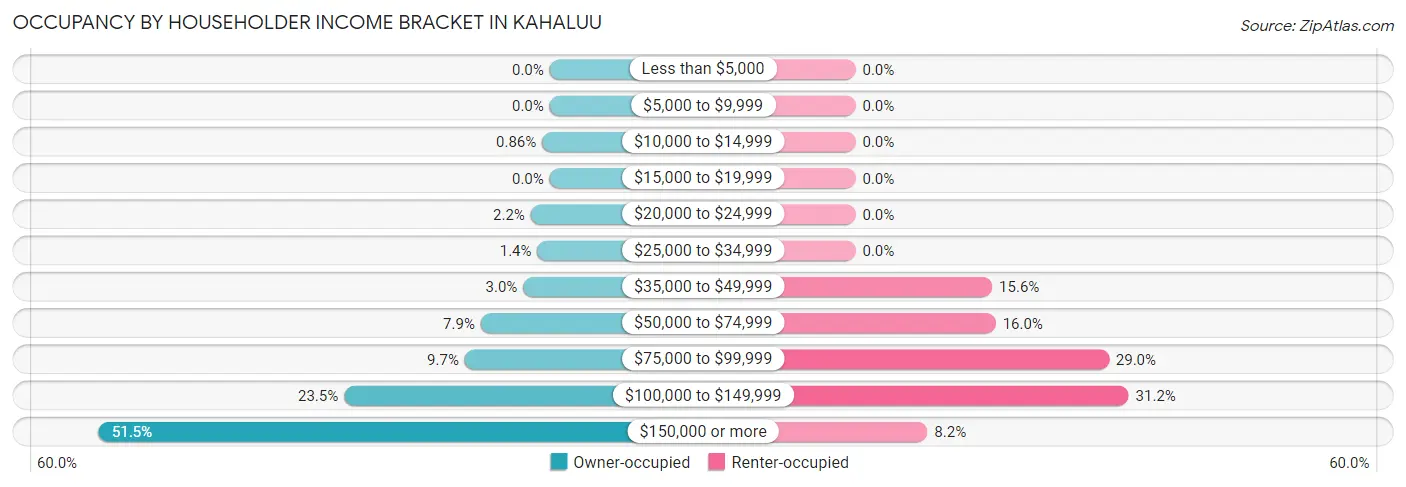
| Income Bracket | Owner-occupied | Renter-occupied |
| Less than $5,000 | 0 (0.0%) | 0 (0.0%) |
| $5,000 to $9,999 | 0 (0.0%) | 0 (0.0%) |
| $10,000 to $14,999 | 8 (0.9%) | 0 (0.0%) |
| $15,000 to $19,999 | 0 (0.0%) | 0 (0.0%) |
| $20,000 to $24,999 | 20 (2.2%) | 0 (0.0%) |
| $25,000 to $34,999 | 13 (1.4%) | 0 (0.0%) |
| $35,000 to $49,999 | 28 (3.0%) | 76 (15.6%) |
| $50,000 to $74,999 | 73 (7.9%) | 78 (16.0%) |
| $75,000 to $99,999 | 90 (9.7%) | 141 (28.9%) |
| $100,000 to $149,999 | 218 (23.5%) | 152 (31.2%) |
| $150,000 or more | 478 (51.5%) | 40 (8.2%) |
| Total | 928 (100.0%) | 487 (100.0%) |
Monthly Housing Cost Tiers in Kahaluu
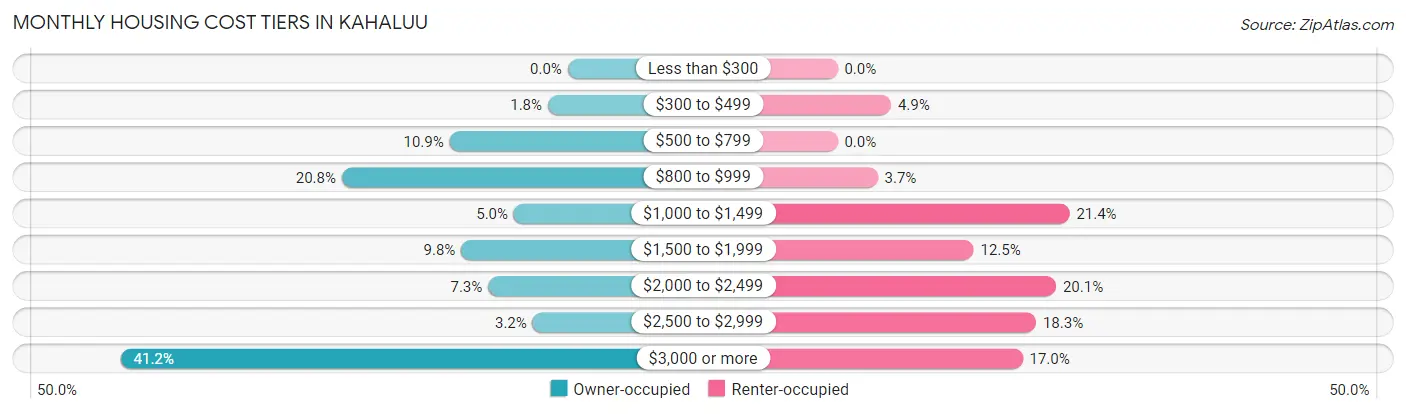
| Monthly Cost | Owner-occupied | Renter-occupied |
| Less than $300 | 0 (0.0%) | 0 (0.0%) |
| $300 to $499 | 17 (1.8%) | 24 (4.9%) |
| $500 to $799 | 101 (10.9%) | 0 (0.0%) |
| $800 to $999 | 193 (20.8%) | 18 (3.7%) |
| $1,000 to $1,499 | 46 (5.0%) | 104 (21.4%) |
| $1,500 to $1,999 | 91 (9.8%) | 61 (12.5%) |
| $2,000 to $2,499 | 68 (7.3%) | 98 (20.1%) |
| $2,500 to $2,999 | 30 (3.2%) | 89 (18.3%) |
| $3,000 or more | 382 (41.2%) | 83 (17.0%) |
| Total | 928 (100.0%) | 487 (100.0%) |
Physical Housing Characteristics in Kahaluu
Housing Structures in Kahaluu
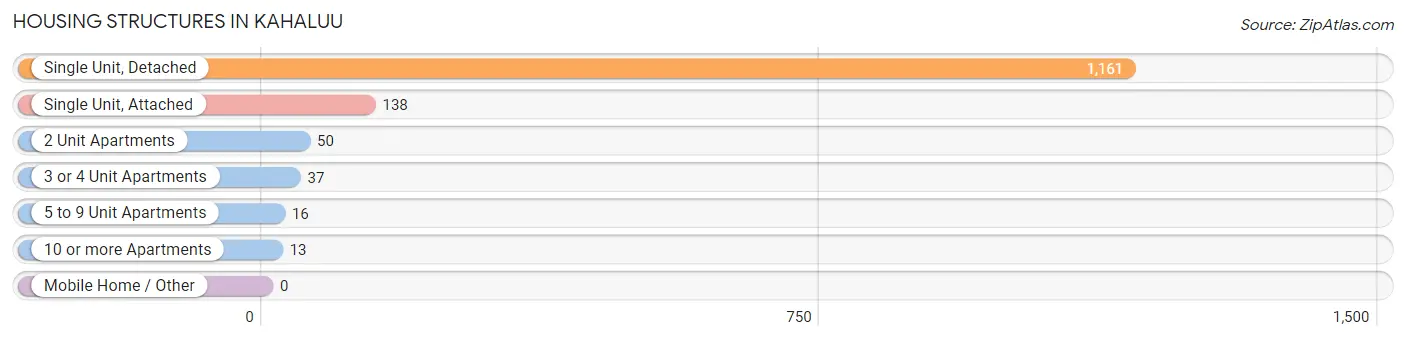
| Structure Type | # Housing Units | % Housing Units |
| Single Unit, Detached | 1,161 | 82.1% |
| Single Unit, Attached | 138 | 9.8% |
| 2 Unit Apartments | 50 | 3.5% |
| 3 or 4 Unit Apartments | 37 | 2.6% |
| 5 to 9 Unit Apartments | 16 | 1.1% |
| 10 or more Apartments | 13 | 0.9% |
| Mobile Home / Other | 0 | 0.0% |
| Total | 1,415 | 100.0% |
Housing Structures by Occupancy in Kahaluu
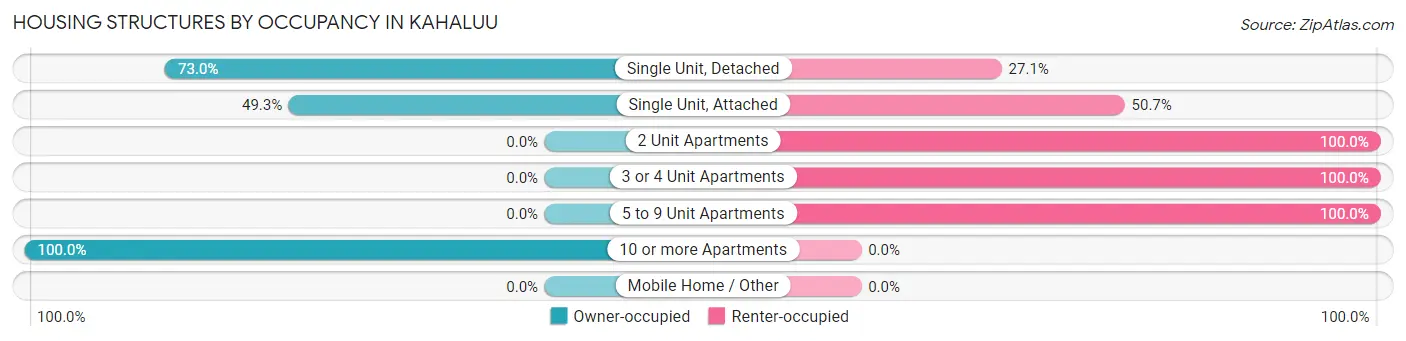
| Structure Type | Owner-occupied | Renter-occupied |
| Single Unit, Detached | 847 (73.0%) | 314 (27.1%) |
| Single Unit, Attached | 68 (49.3%) | 70 (50.7%) |
| 2 Unit Apartments | 0 (0.0%) | 50 (100.0%) |
| 3 or 4 Unit Apartments | 0 (0.0%) | 37 (100.0%) |
| 5 to 9 Unit Apartments | 0 (0.0%) | 16 (100.0%) |
| 10 or more Apartments | 13 (100.0%) | 0 (0.0%) |
| Mobile Home / Other | 0 (0.0%) | 0 (0.0%) |
| Total | 928 (65.6%) | 487 (34.4%) |
Housing Structures by Number of Rooms in Kahaluu
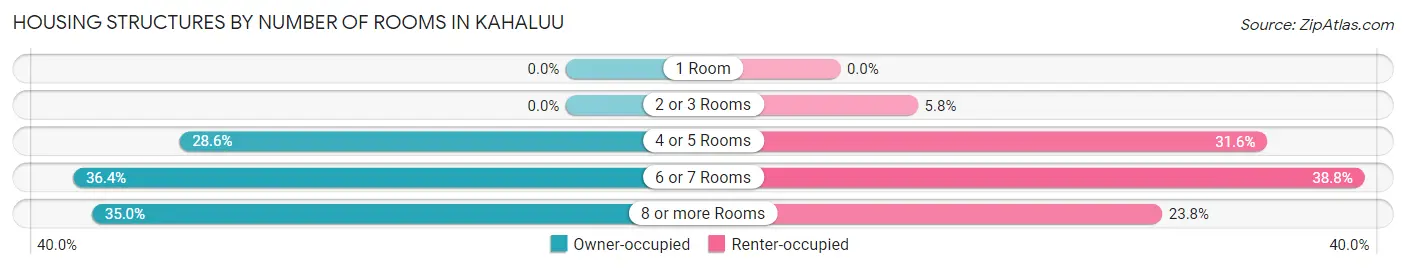
| Number of Rooms | Owner-occupied | Renter-occupied |
| 1 Room | 0 (0.0%) | 0 (0.0%) |
| 2 or 3 Rooms | 0 (0.0%) | 28 (5.8%) |
| 4 or 5 Rooms | 265 (28.6%) | 154 (31.6%) |
| 6 or 7 Rooms | 338 (36.4%) | 189 (38.8%) |
| 8 or more Rooms | 325 (35.0%) | 116 (23.8%) |
| Total | 928 (100.0%) | 487 (100.0%) |
Housing Structure by Heating Type in Kahaluu
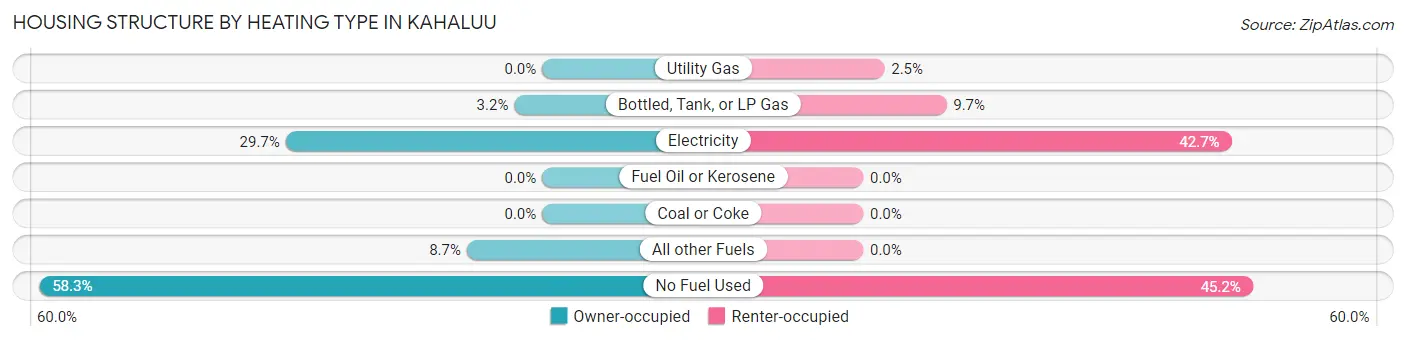
| Heating Type | Owner-occupied | Renter-occupied |
| Utility Gas | 0 (0.0%) | 12 (2.5%) |
| Bottled, Tank, or LP Gas | 30 (3.2%) | 47 (9.7%) |
| Electricity | 276 (29.7%) | 208 (42.7%) |
| Fuel Oil or Kerosene | 0 (0.0%) | 0 (0.0%) |
| Coal or Coke | 0 (0.0%) | 0 (0.0%) |
| All other Fuels | 81 (8.7%) | 0 (0.0%) |
| No Fuel Used | 541 (58.3%) | 220 (45.2%) |
| Total | 928 (100.0%) | 487 (100.0%) |
Household Vehicle Usage in Kahaluu
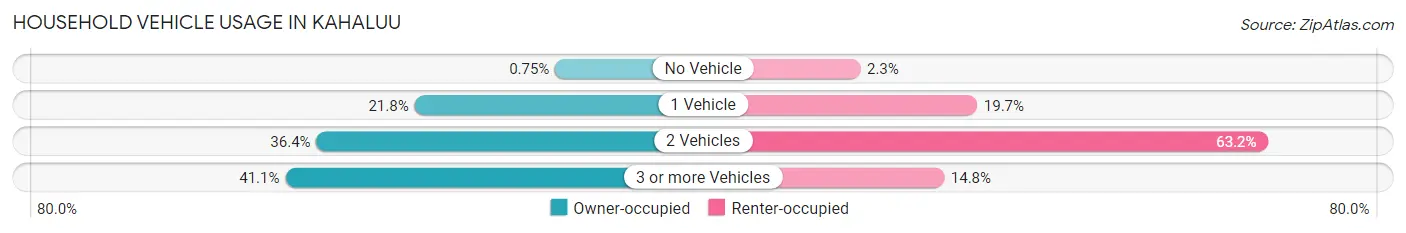
| Vehicles per Household | Owner-occupied | Renter-occupied |
| No Vehicle | 7 (0.7%) | 11 (2.3%) |
| 1 Vehicle | 202 (21.8%) | 96 (19.7%) |
| 2 Vehicles | 338 (36.4%) | 308 (63.2%) |
| 3 or more Vehicles | 381 (41.1%) | 72 (14.8%) |
| Total | 928 (100.0%) | 487 (100.0%) |
Real Estate & Mortgages in Kahaluu
Real Estate and Mortgage Overview in Kahaluu
| Characteristic | Without Mortgage | With Mortgage |
| Housing Units | 336 | 592 |
| Median Property Value | $1,777,800 | $1,047,800 |
| Median Household Income | $152,549 | $308 |
| Monthly Housing Costs | $848 | $382 |
| Real Estate Taxes | $4,877 | $19 |
Property Value by Mortgage Status in Kahaluu
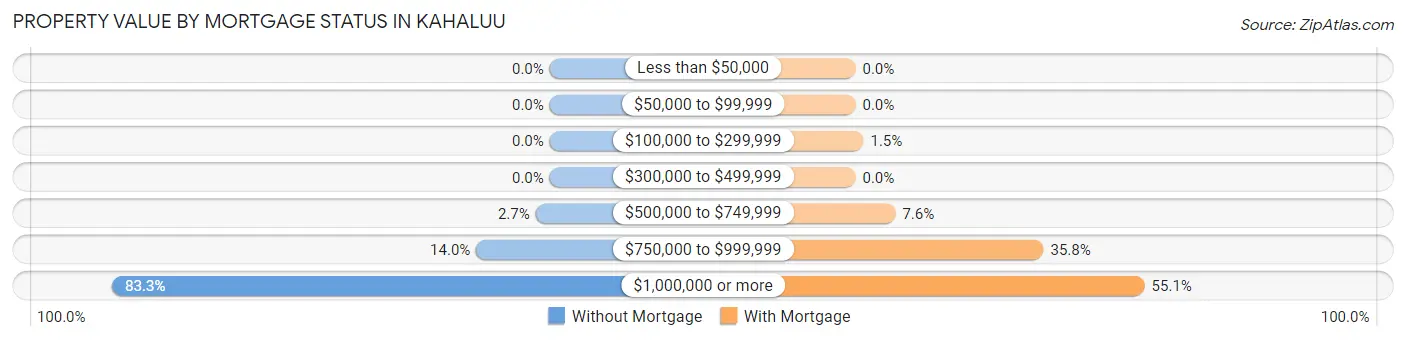
| Property Value | Without Mortgage | With Mortgage |
| Less than $50,000 | 0 (0.0%) | 0 (0.0%) |
| $50,000 to $99,999 | 0 (0.0%) | 0 (0.0%) |
| $100,000 to $299,999 | 0 (0.0%) | 9 (1.5%) |
| $300,000 to $499,999 | 0 (0.0%) | 0 (0.0%) |
| $500,000 to $749,999 | 9 (2.7%) | 45 (7.6%) |
| $750,000 to $999,999 | 47 (14.0%) | 212 (35.8%) |
| $1,000,000 or more | 280 (83.3%) | 326 (55.1%) |
| Total | 336 (100.0%) | 592 (100.0%) |
Household Income by Mortgage Status in Kahaluu
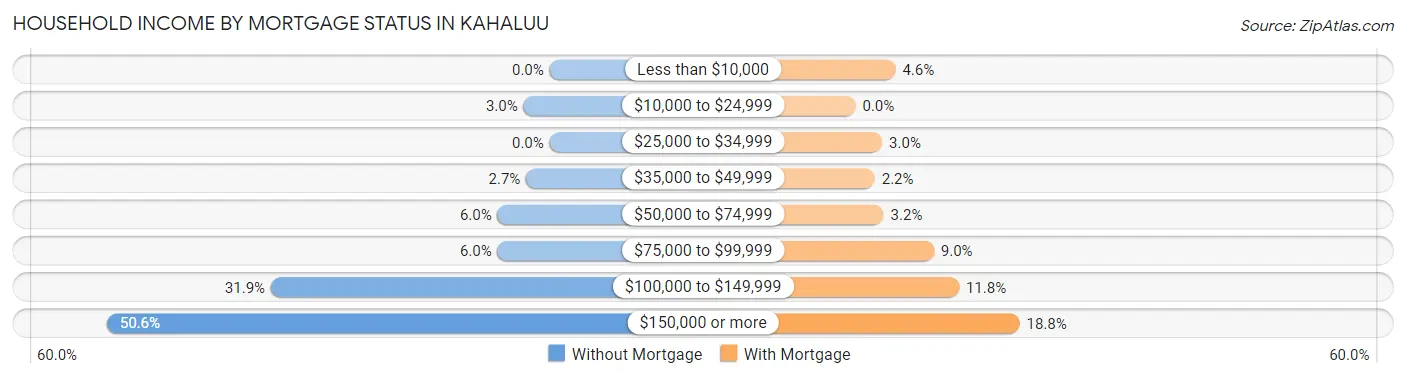
| Household Income | Without Mortgage | With Mortgage |
| Less than $10,000 | 0 (0.0%) | 27 (4.6%) |
| $10,000 to $24,999 | 10 (3.0%) | 0 (0.0%) |
| $25,000 to $34,999 | 0 (0.0%) | 18 (3.0%) |
| $35,000 to $49,999 | 9 (2.7%) | 13 (2.2%) |
| $50,000 to $74,999 | 20 (5.9%) | 19 (3.2%) |
| $75,000 to $99,999 | 20 (5.9%) | 53 (8.9%) |
| $100,000 to $149,999 | 107 (31.9%) | 70 (11.8%) |
| $150,000 or more | 170 (50.6%) | 111 (18.8%) |
| Total | 336 (100.0%) | 592 (100.0%) |
Property Value to Household Income Ratio in Kahaluu
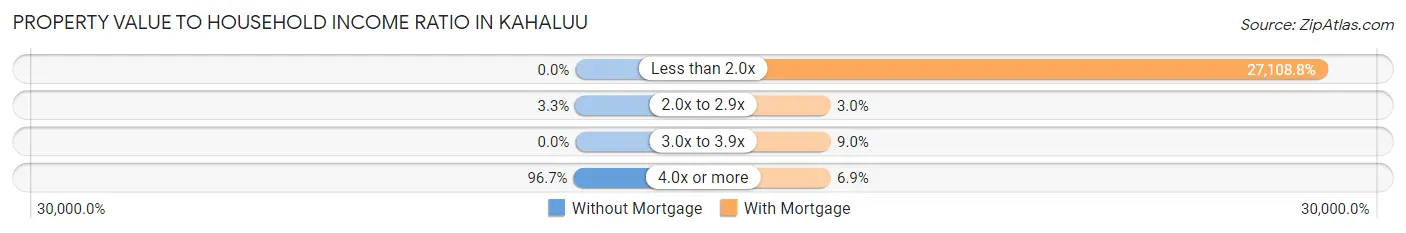
| Value-to-Income Ratio | Without Mortgage | With Mortgage |
| Less than 2.0x | 0 (0.0%) | 160,484 (27,108.8%) |
| 2.0x to 2.9x | 11 (3.3%) | 18 (3.0%) |
| 3.0x to 3.9x | 0 (0.0%) | 53 (8.9%) |
| 4.0x or more | 325 (96.7%) | 41 (6.9%) |
| Total | 336 (100.0%) | 592 (100.0%) |
Real Estate Taxes by Mortgage Status in Kahaluu
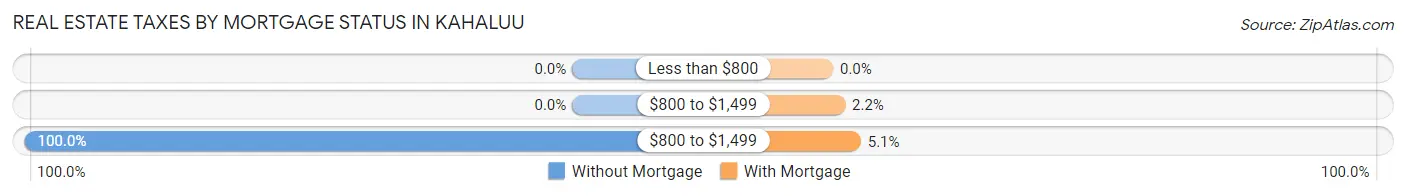
| Property Taxes | Without Mortgage | With Mortgage |
| Less than $800 | 0 (0.0%) | 0 (0.0%) |
| $800 to $1,499 | 0 (0.0%) | 13 (2.2%) |
| $800 to $1,499 | 336 (100.0%) | 30 (5.1%) |
| Total | 336 (100.0%) | 592 (100.0%) |
Health & Disability in Kahaluu
Health Insurance Coverage by Age in Kahaluu
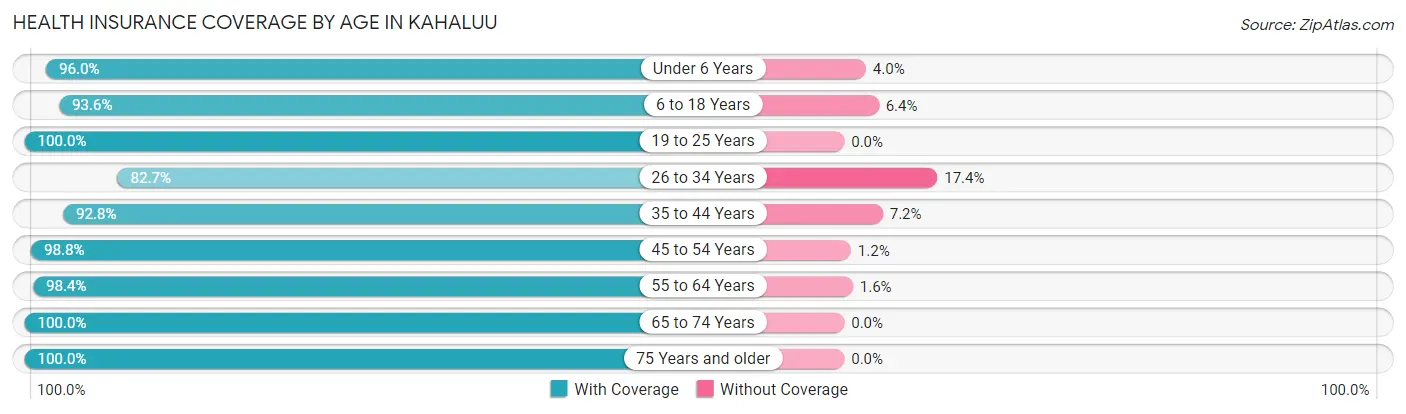
| Age Bracket | With Coverage | Without Coverage |
| Under 6 Years | 262 (96.0%) | 11 (4.0%) |
| 6 to 18 Years | 889 (93.6%) | 61 (6.4%) |
| 19 to 25 Years | 298 (100.0%) | 0 (0.0%) |
| 26 to 34 Years | 243 (82.7%) | 51 (17.3%) |
| 35 to 44 Years | 633 (92.8%) | 49 (7.2%) |
| 45 to 54 Years | 805 (98.8%) | 10 (1.2%) |
| 55 to 64 Years | 679 (98.4%) | 11 (1.6%) |
| 65 to 74 Years | 538 (100.0%) | 0 (0.0%) |
| 75 Years and older | 491 (100.0%) | 0 (0.0%) |
| Total | 4,838 (96.2%) | 193 (3.8%) |
Health Insurance Coverage by Citizenship Status in Kahaluu
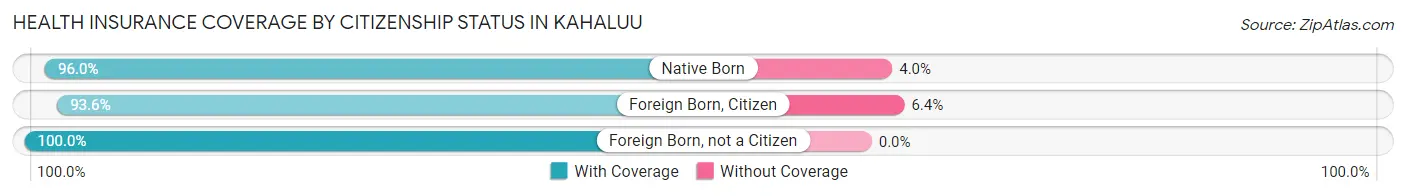
| Citizenship Status | With Coverage | Without Coverage |
| Native Born | 262 (96.0%) | 11 (4.0%) |
| Foreign Born, Citizen | 889 (93.6%) | 61 (6.4%) |
| Foreign Born, not a Citizen | 298 (100.0%) | 0 (0.0%) |
Health Insurance Coverage by Household Income in Kahaluu
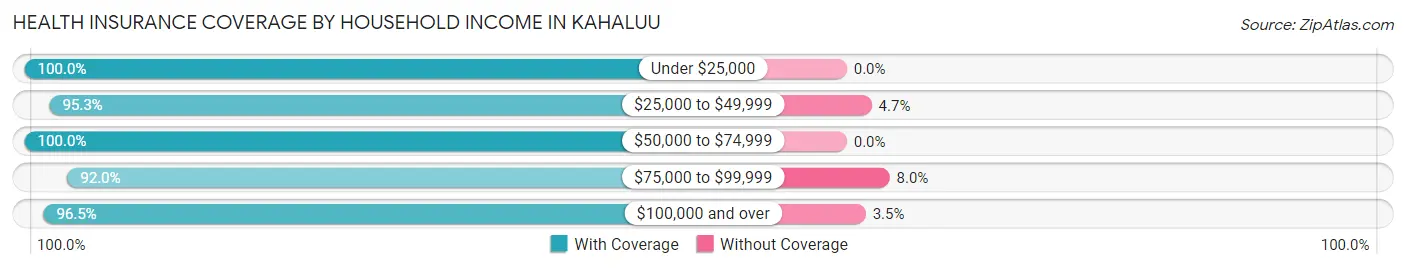
| Household Income | With Coverage | Without Coverage |
| Under $25,000 | 37 (100.0%) | 0 (0.0%) |
| $25,000 to $49,999 | 225 (95.3%) | 11 (4.7%) |
| $50,000 to $74,999 | 523 (100.0%) | 0 (0.0%) |
| $75,000 to $99,999 | 677 (92.0%) | 59 (8.0%) |
| $100,000 and over | 3,349 (96.5%) | 123 (3.5%) |
Public vs Private Health Insurance Coverage by Age in Kahaluu
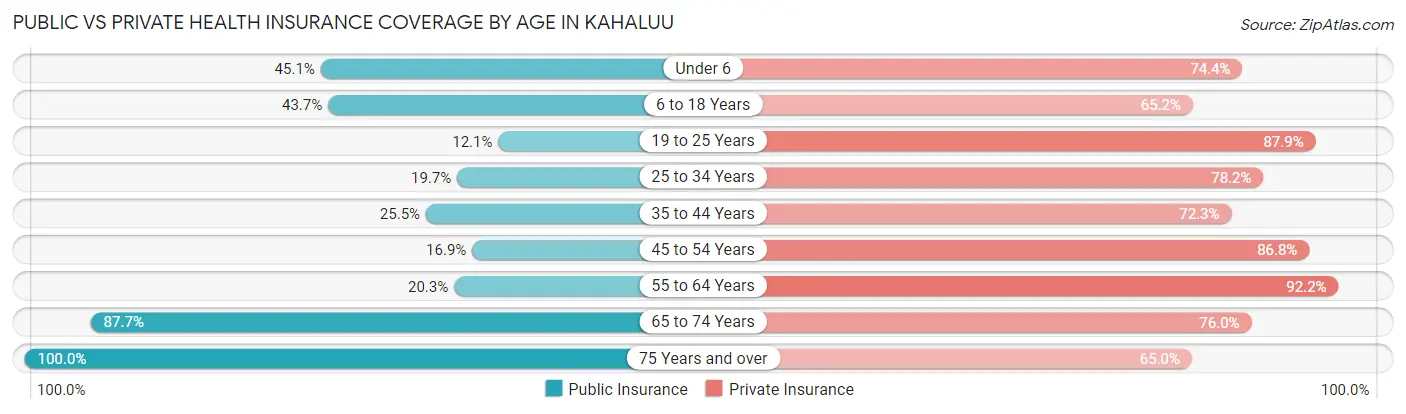
| Age Bracket | Public Insurance | Private Insurance |
| Under 6 | 123 (45.1%) | 203 (74.4%) |
| 6 to 18 Years | 415 (43.7%) | 619 (65.2%) |
| 19 to 25 Years | 36 (12.1%) | 262 (87.9%) |
| 25 to 34 Years | 58 (19.7%) | 230 (78.2%) |
| 35 to 44 Years | 174 (25.5%) | 493 (72.3%) |
| 45 to 54 Years | 138 (16.9%) | 707 (86.8%) |
| 55 to 64 Years | 140 (20.3%) | 636 (92.2%) |
| 65 to 74 Years | 472 (87.7%) | 409 (76.0%) |
| 75 Years and over | 491 (100.0%) | 319 (65.0%) |
| Total | 2,047 (40.7%) | 3,878 (77.1%) |
Disability Status by Sex by Age in Kahaluu
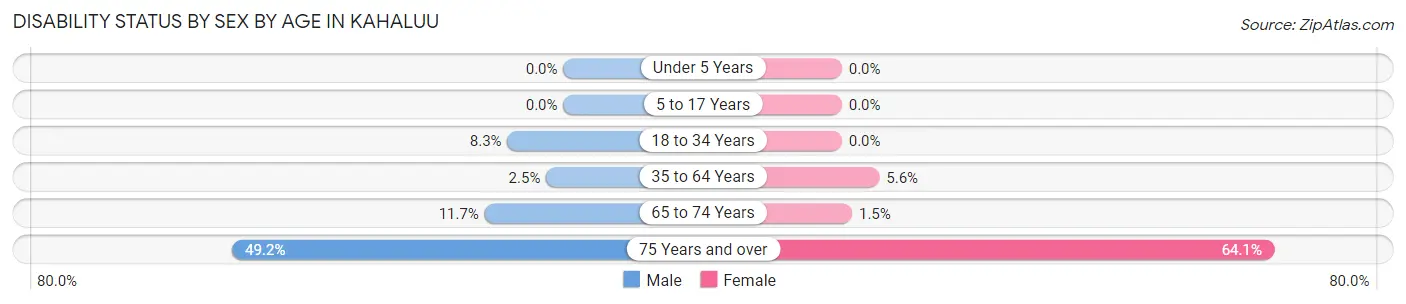
| Age Bracket | Male | Female |
| Under 5 Years | 0 (0.0%) | 0 (0.0%) |
| 5 to 17 Years | 0 (0.0%) | 0 (0.0%) |
| 18 to 34 Years | 23 (8.3%) | 0 (0.0%) |
| 35 to 64 Years | 26 (2.5%) | 65 (5.6%) |
| 65 to 74 Years | 32 (11.7%) | 4 (1.5%) |
| 75 Years and over | 151 (49.2%) | 118 (64.1%) |
Disability Class by Sex by Age in Kahaluu
Disability Class: Hearing Difficulty
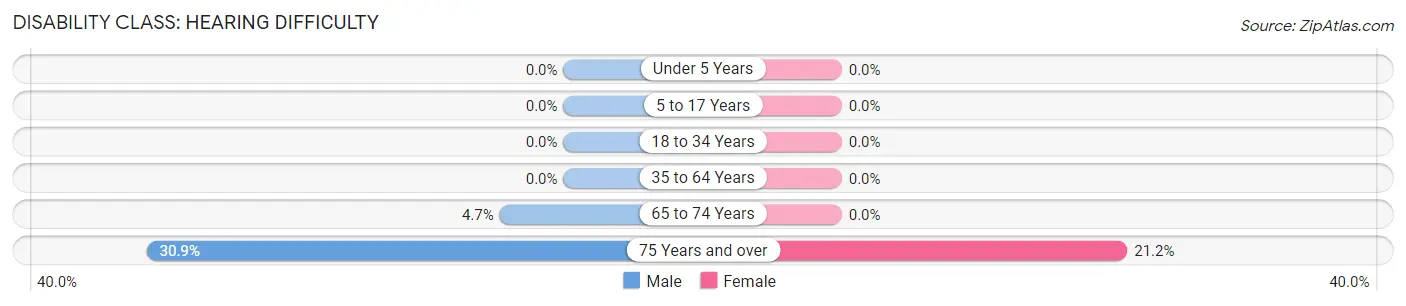
| Age Bracket | Male | Female |
| Under 5 Years | 0 (0.0%) | 0 (0.0%) |
| 5 to 17 Years | 0 (0.0%) | 0 (0.0%) |
| 18 to 34 Years | 0 (0.0%) | 0 (0.0%) |
| 35 to 64 Years | 0 (0.0%) | 0 (0.0%) |
| 65 to 74 Years | 13 (4.7%) | 0 (0.0%) |
| 75 Years and over | 95 (30.9%) | 39 (21.2%) |
Disability Class: Vision Difficulty
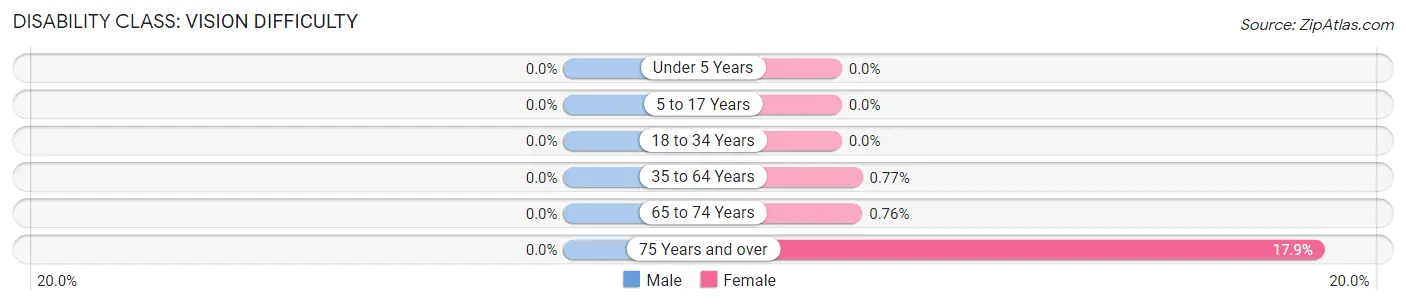
| Age Bracket | Male | Female |
| Under 5 Years | 0 (0.0%) | 0 (0.0%) |
| 5 to 17 Years | 0 (0.0%) | 0 (0.0%) |
| 18 to 34 Years | 0 (0.0%) | 0 (0.0%) |
| 35 to 64 Years | 0 (0.0%) | 9 (0.8%) |
| 65 to 74 Years | 0 (0.0%) | 2 (0.8%) |
| 75 Years and over | 0 (0.0%) | 33 (17.9%) |
Disability Class: Cognitive Difficulty
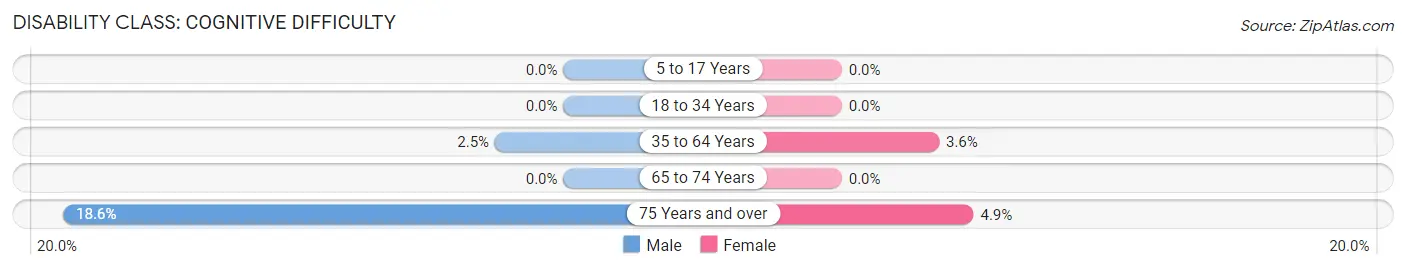
| Age Bracket | Male | Female |
| 5 to 17 Years | 0 (0.0%) | 0 (0.0%) |
| 18 to 34 Years | 0 (0.0%) | 0 (0.0%) |
| 35 to 64 Years | 26 (2.5%) | 42 (3.6%) |
| 65 to 74 Years | 0 (0.0%) | 0 (0.0%) |
| 75 Years and over | 57 (18.6%) | 9 (4.9%) |
Disability Class: Ambulatory Difficulty
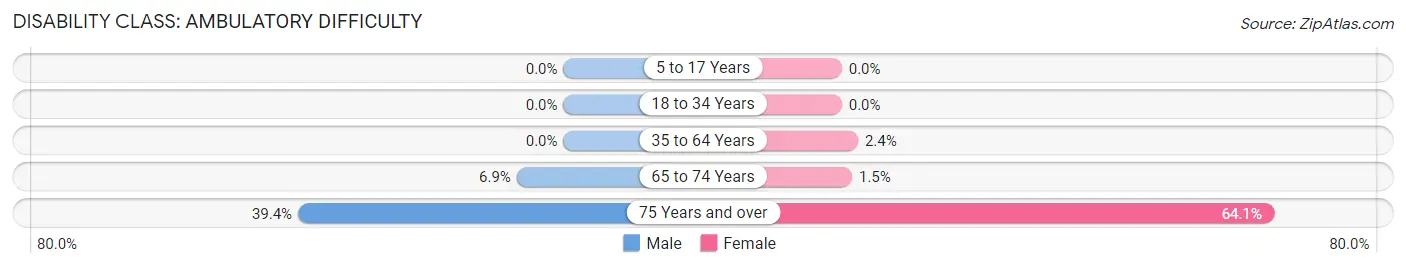
| Age Bracket | Male | Female |
| 5 to 17 Years | 0 (0.0%) | 0 (0.0%) |
| 18 to 34 Years | 0 (0.0%) | 0 (0.0%) |
| 35 to 64 Years | 0 (0.0%) | 28 (2.4%) |
| 65 to 74 Years | 19 (6.9%) | 4 (1.5%) |
| 75 Years and over | 121 (39.4%) | 118 (64.1%) |
Disability Class: Self-Care Difficulty
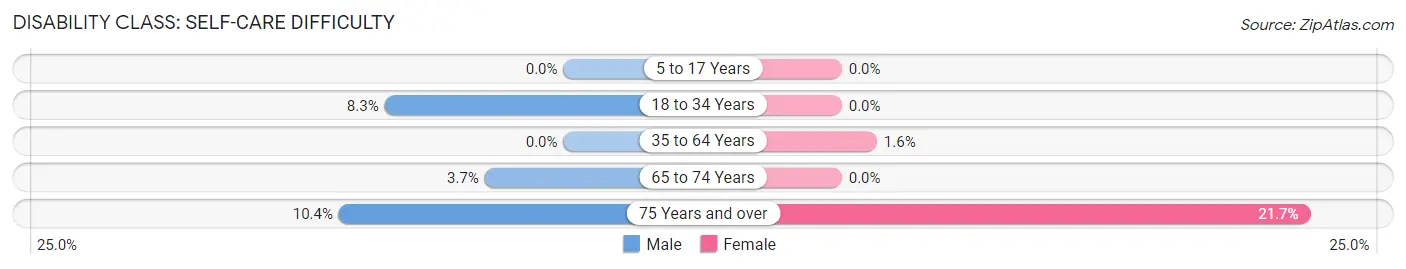
| Age Bracket | Male | Female |
| 5 to 17 Years | 0 (0.0%) | 0 (0.0%) |
| 18 to 34 Years | 23 (8.3%) | 0 (0.0%) |
| 35 to 64 Years | 0 (0.0%) | 19 (1.6%) |
| 65 to 74 Years | 10 (3.6%) | 0 (0.0%) |
| 75 Years and over | 32 (10.4%) | 40 (21.7%) |
Technology Access in Kahaluu
Computing Device Access in Kahaluu
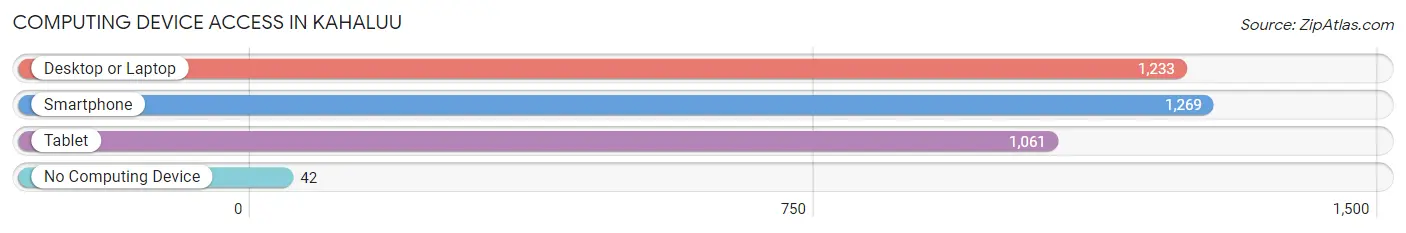
| Device Type | # Households | % Households |
| Desktop or Laptop | 1,233 | 87.1% |
| Smartphone | 1,269 | 89.7% |
| Tablet | 1,061 | 75.0% |
| No Computing Device | 42 | 3.0% |
| Total | 1,415 | 100.0% |
Internet Access in Kahaluu
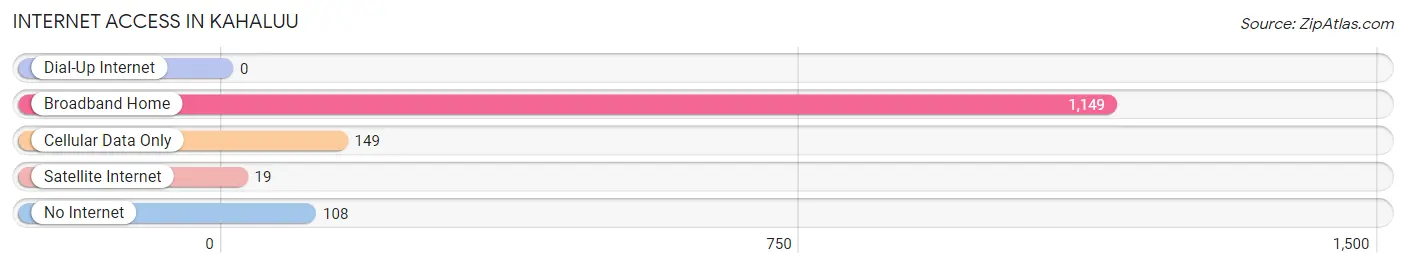
| Internet Type | # Households | % Households |
| Dial-Up Internet | 0 | 0.0% |
| Broadband Home | 1,149 | 81.2% |
| Cellular Data Only | 149 | 10.5% |
| Satellite Internet | 19 | 1.3% |
| No Internet | 108 | 7.6% |
| Total | 1,415 | 100.0% |
Kahaluu Summary
Kahaluu is a small unincorporated community located on the island of Oahu in the state of Hawaii. It is located in the Koolaupoko District of the island and is part of the City and County of Honolulu. The population of Kahaluu was 2,845 at the 2010 census.
History
Kahaluu has a long and rich history. It was first settled by Polynesian voyagers in the late 1700s. The area was used for fishing and farming, and the first permanent settlement was established in 1845. The area was then known as Koolaupoko, and it was part of the ahupuaa of Kahaluu.
In the late 1800s, the area was developed by the sugar industry. The Kahaluu Sugar Mill was built in 1883 and operated until the early 1900s. The mill was the first of its kind in the Hawaiian Islands and was the first to use steam power.
In the early 1900s, the area was developed further by the pineapple industry. The Kahaluu Cannery was built in 1906 and operated until the early 1950s. The cannery was the first of its kind in the Hawaiian Islands and was the first to use electricity.
In the late 1950s, the area was developed further by the tourism industry. The Kahaluu Beach Park was built in 1959 and is now a popular destination for tourists and locals alike.
Geography
Kahaluu is located on the eastern side of the island of Oahu, in the Koolaupoko District. It is bordered by the towns of Kaneohe to the north, Kailua to the south, and Waimanalo to the east. The area is mostly flat and is surrounded by lush tropical vegetation.
The climate in Kahaluu is tropical and humid, with temperatures ranging from an average low of 65°F in the winter to an average high of 85°F in the summer. The area receives an average of about 20 inches of rain per year.
Economy
Kahaluu’s economy is largely based on tourism and agriculture. The area is home to several resorts and hotels, as well as a variety of restaurants and shops. The area is also home to several farms, which produce a variety of fruits and vegetables.
Demographics
As of the 2010 census, the population of Kahaluu was 2,845. The racial makeup of the area was 57.3% Asian, 24.2% White, 8.2% Native Hawaiian and Other Pacific Islander, 6.2% from two or more races, and 4.1% from other races.
The median household income in Kahaluu was $63,917 in 2010, and the median family income was $71,917. The per capita income was $30,917. The unemployment rate was 4.2%.
Conclusion
Kahaluu is a small unincorporated community located on the island of Oahu in the state of Hawaii. It has a long and rich history, and its economy is largely based on tourism and agriculture. The population of Kahaluu was 2,845 at the 2010 census, and the median household income was $63,917 in 2010. The area is home to several resorts and hotels, as well as a variety of restaurants and shops.
Common Questions
What is Per Capita Income in Kahaluu?
Per Capita income in Kahaluu is $44,558.
What is the Median Family Income in Kahaluu?
Median Family Income in Kahaluu is $133,458.
What is the Median Household income in Kahaluu?
Median Household Income in Kahaluu is $123,365.
What is Income or Wage Gap in Kahaluu?
Income or Wage Gap in Kahaluu is 22.7%.
Women in Kahaluu earn 77.3 cents for every dollar earned by a man.
What is Inequality or Gini Index in Kahaluu?
Inequality or Gini Index in Kahaluu is 0.35.
What is the Total Population of Kahaluu?
Total Population of Kahaluu is 5,065.
What is the Total Male Population of Kahaluu?
Total Male Population of Kahaluu is 2,456.
What is the Total Female Population of Kahaluu?
Total Female Population of Kahaluu is 2,609.
What is the Ratio of Males per 100 Females in Kahaluu?
There are 94.14 Males per 100 Females in Kahaluu.
What is the Ratio of Females per 100 Males in Kahaluu?
There are 106.23 Females per 100 Males in Kahaluu.
What is the Median Population Age in Kahaluu?
Median Population Age in Kahaluu is 45.0 Years.
What is the Average Family Size in Kahaluu
Average Family Size in Kahaluu is 3.8 People.
What is the Average Household Size in Kahaluu
Average Household Size in Kahaluu is 3.6 People.
How Large is the Labor Force in Kahaluu?
There are 2,670 People in the Labor Forcein in Kahaluu.
What is the Percentage of People in the Labor Force in Kahaluu?
66.1% of People are in the Labor Force in Kahaluu.
What is the Unemployment Rate in Kahaluu?
Unemployment Rate in Kahaluu is 5.6%.