Makawao, HI Map & Demographics
Makawao Map
Makawao Overview
$41,018
PER CAPITA INCOME
$118,333
AVG FAMILY INCOME
$109,385
AVG HOUSEHOLD INCOME
41.3%
WAGE / INCOME GAP [ % ]
58.7¢/ $1
WAGE / INCOME GAP [ $ ]
$9,786
FAMILY INCOME DEFICIT
0.39
INEQUALITY / GINI INDEX
7,704
TOTAL POPULATION
3,787
MALE POPULATION
3,917
FEMALE POPULATION
96.68
MALES / 100 FEMALES
103.43
FEMALES / 100 MALES
43.8
MEDIAN AGE
3.2
AVG FAMILY SIZE
2.9
AVG HOUSEHOLD SIZE
3,758
LABOR FORCE [ PEOPLE ]
60.5%
PERCENT IN LABOR FORCE
3.0%
UNEMPLOYMENT RATE
Makawao Zip Codes
Makawao Area Codes
Income in Makawao
Income Overview in Makawao
Per Capita Income in Makawao is $41,018, while median incomes of families and households are $118,333 and $109,385 respectively.
| Characteristic | Number | Measure |
| Per Capita Income | 7,704 | $41,018 |
| Median Family Income | 2,032 | $118,333 |
| Mean Family Income | 2,032 | $132,003 |
| Median Household Income | 2,668 | $109,385 |
| Mean Household Income | 2,668 | $120,208 |
| Income Deficit | 2,032 | $9,786 |
| Wage / Income Gap (%) | 7,704 | 41.33% |
| Wage / Income Gap ($) | 7,704 | 58.67¢ per $1 |
| Gini / Inequality Index | 7,704 | 0.39 |
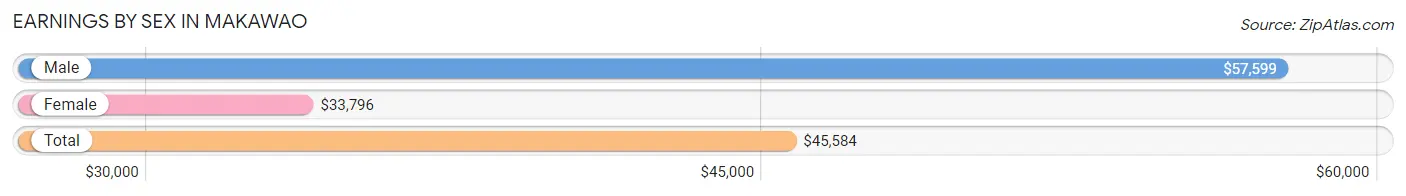
Earnings by Sex in Makawao
Average Earnings in Makawao are $45,584, $57,599 for men and $33,796 for women, a difference of 41.3%.
| Sex | Number | Average Earnings |
| Male | 1,992 (49.0%) | $57,599 |
| Female | 2,069 (50.9%) | $33,796 |
| Total | 4,061 (100.0%) | $45,584 |
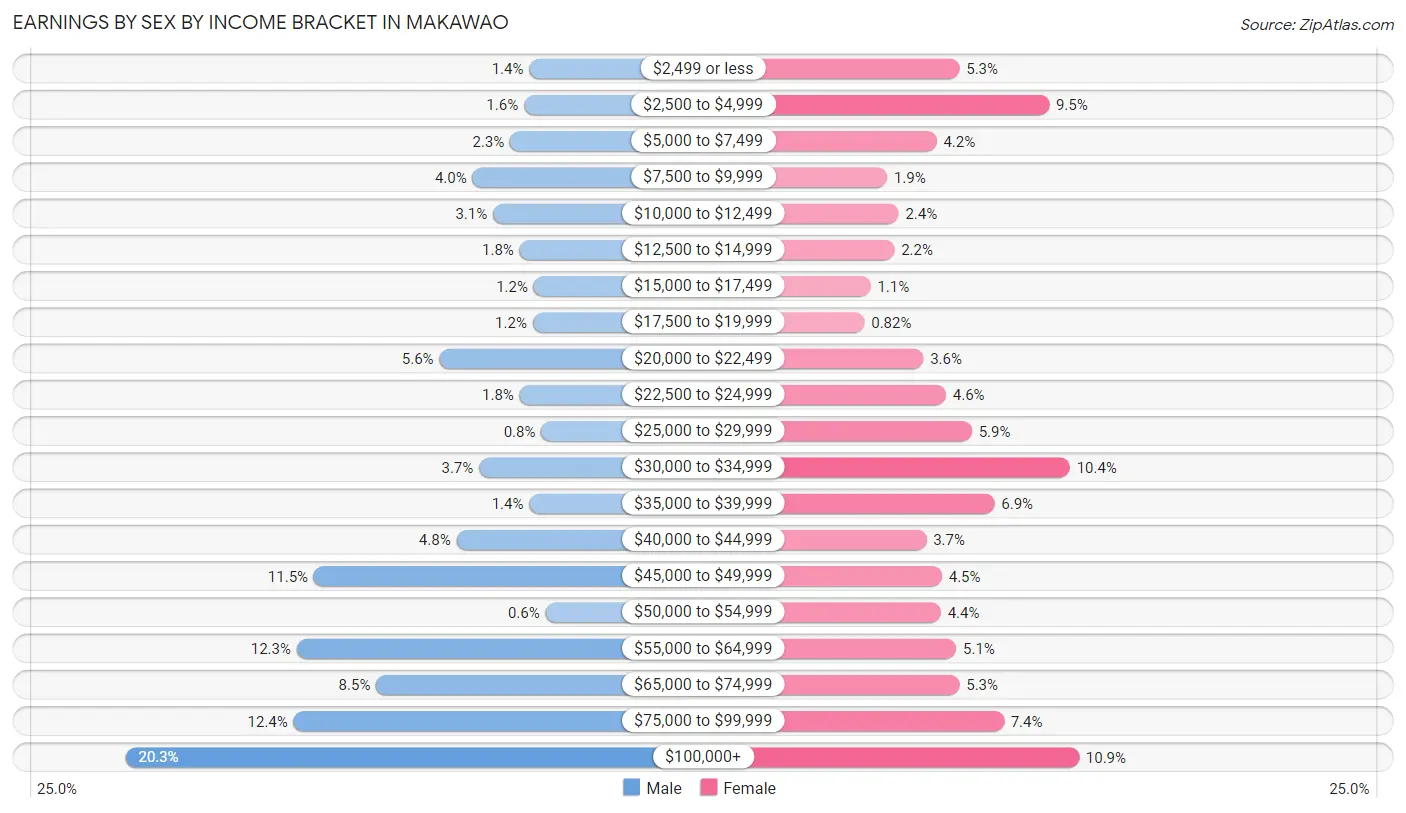
Earnings by Sex by Income Bracket in Makawao
The most common earnings brackets in Makawao are $100,000+ for men (404 | 20.3%) and $100,000+ for women (225 | 10.9%).
| Income | Male | Female |
| $2,499 or less | 27 (1.4%) | 109 (5.3%) |
| $2,500 to $4,999 | 32 (1.6%) | 196 (9.5%) |
| $5,000 to $7,499 | 45 (2.3%) | 87 (4.2%) |
| $7,500 to $9,999 | 80 (4.0%) | 39 (1.9%) |
| $10,000 to $12,499 | 61 (3.1%) | 50 (2.4%) |
| $12,500 to $14,999 | 36 (1.8%) | 46 (2.2%) |
| $15,000 to $17,499 | 23 (1.1%) | 23 (1.1%) |
| $17,500 to $19,999 | 24 (1.2%) | 17 (0.8%) |
| $20,000 to $22,499 | 111 (5.6%) | 74 (3.6%) |
| $22,500 to $24,999 | 36 (1.8%) | 96 (4.6%) |
| $25,000 to $29,999 | 16 (0.8%) | 121 (5.9%) |
| $30,000 to $34,999 | 74 (3.7%) | 216 (10.4%) |
| $35,000 to $39,999 | 27 (1.4%) | 143 (6.9%) |
| $40,000 to $44,999 | 95 (4.8%) | 77 (3.7%) |
| $45,000 to $49,999 | 228 (11.5%) | 92 (4.4%) |
| $50,000 to $54,999 | 12 (0.6%) | 91 (4.4%) |
| $55,000 to $64,999 | 244 (12.2%) | 106 (5.1%) |
| $65,000 to $74,999 | 170 (8.5%) | 109 (5.3%) |
| $75,000 to $99,999 | 247 (12.4%) | 152 (7.3%) |
| $100,000+ | 404 (20.3%) | 225 (10.9%) |
| Total | 1,992 (100.0%) | 2,069 (100.0%) |
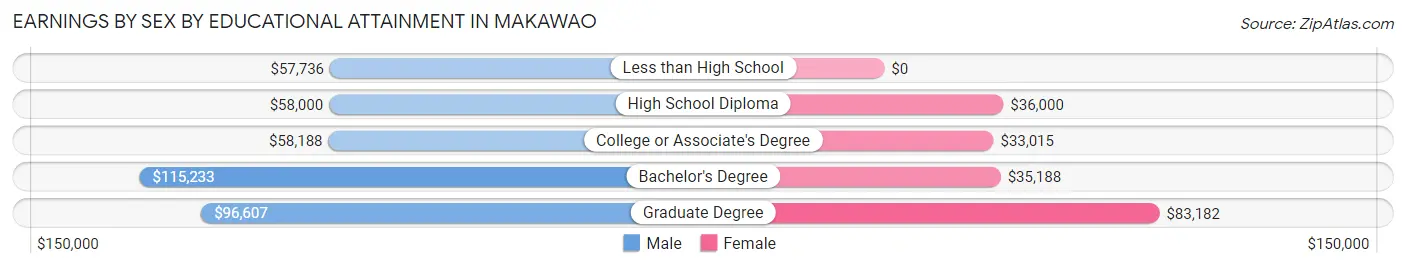
Earnings by Sex by Educational Attainment in Makawao
Average earnings in Makawao are $61,641 for men and $37,750 for women, a difference of 38.8%. Men with an educational attainment of bachelor's degree enjoy the highest average annual earnings of $115,233, while those with less than high school education earn the least with $57,736. Women with an educational attainment of graduate degree earn the most with the average annual earnings of $83,182, while those with college or associate's degree education have the smallest earnings of $33,015.
| Educational Attainment | Male Income | Female Income |
| Less than High School | $57,736 | $0 |
| High School Diploma | $58,000 | $36,000 |
| College or Associate's Degree | $58,188 | $33,015 |
| Bachelor's Degree | $115,233 | $35,188 |
| Graduate Degree | $96,607 | $83,182 |
| Total | $61,641 | $37,750 |
Family Income in Makawao
Family Income Brackets in Makawao
According to the Makawao family income data, there are 750 families falling into the $100,000 to $149,999 income range, which is the most common income bracket and makes up 36.9% of all families. Conversely, the $10,000 to $14,999 income bracket is the least frequent group with only 18 families (0.9%) belonging to this category.
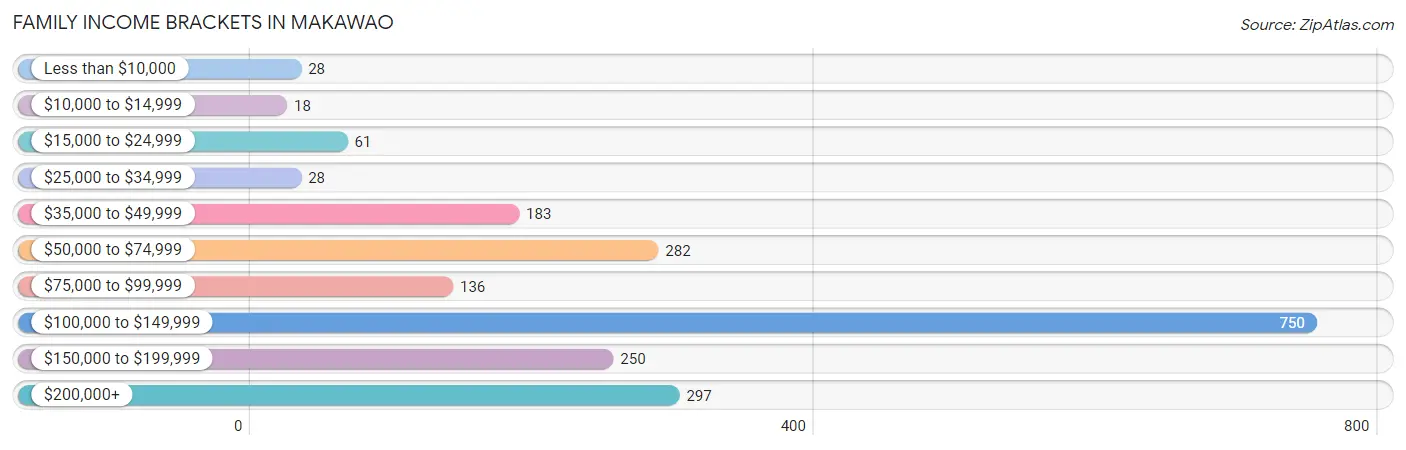
| Income Bracket | # Families | % Families |
| Less than $10,000 | 28 | 1.4% |
| $10,000 to $14,999 | 18 | 0.9% |
| $15,000 to $24,999 | 61 | 3.0% |
| $25,000 to $34,999 | 28 | 1.4% |
| $35,000 to $49,999 | 183 | 9.0% |
| $50,000 to $74,999 | 282 | 13.9% |
| $75,000 to $99,999 | 136 | 6.7% |
| $100,000 to $149,999 | 750 | 36.9% |
| $150,000 to $199,999 | 250 | 12.3% |
| $200,000+ | 297 | 14.6% |
Family Income by Famaliy Size in Makawao
5-person families (87 | 4.3%) account for the highest median family income in Makawao with $141,343 per family, while 2-person families (836 | 41.1%) have the highest median income of $44,532 per family member.
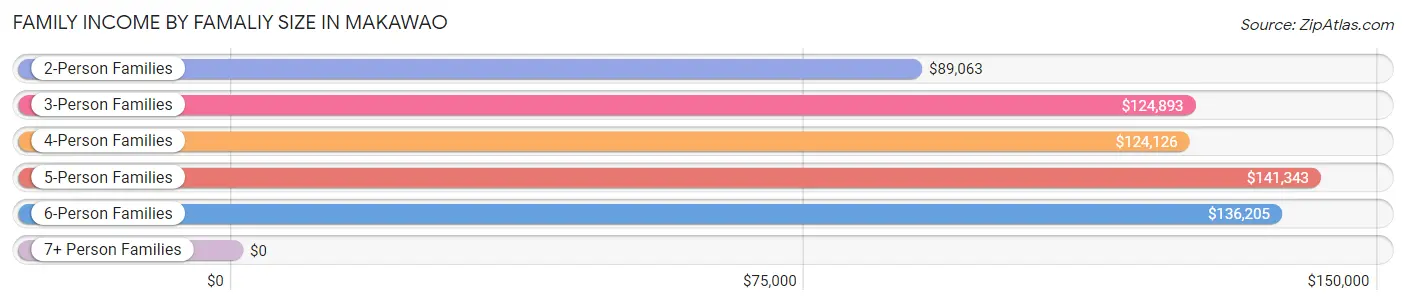
| Income Bracket | # Families | Median Income |
| 2-Person Families | 836 (41.1%) | $89,063 |
| 3-Person Families | 576 (28.3%) | $124,893 |
| 4-Person Families | 359 (17.7%) | $124,126 |
| 5-Person Families | 87 (4.3%) | $141,343 |
| 6-Person Families | 97 (4.8%) | $136,205 |
| 7+ Person Families | 77 (3.8%) | $0 |
| Total | 2,032 (100.0%) | $118,333 |
Family Income by Number of Earners in Makawao
The median family income in Makawao is $118,333, with families comprising 3+ earners (279) having the highest median family income of $146,025, while families with no earners (318) have the lowest median family income of $56,146, accounting for 13.7% and 15.7% of families, respectively.
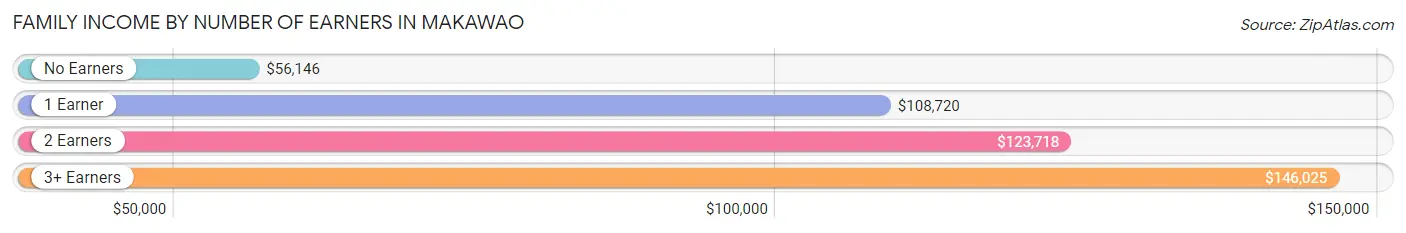
| Number of Earners | # Families | Median Income |
| No Earners | 318 (15.7%) | $56,146 |
| 1 Earner | 538 (26.5%) | $108,720 |
| 2 Earners | 897 (44.1%) | $123,718 |
| 3+ Earners | 279 (13.7%) | $146,025 |
| Total | 2,032 (100.0%) | $118,333 |
Household Income in Makawao
Household Income Brackets in Makawao
With 859 households falling in the category, the $100,000 to $149,999 income range is the most frequent in Makawao, accounting for 32.2% of all households. In contrast, only 51 households (1.9%) fall into the less than $10,000 income bracket, making it the least populous group.
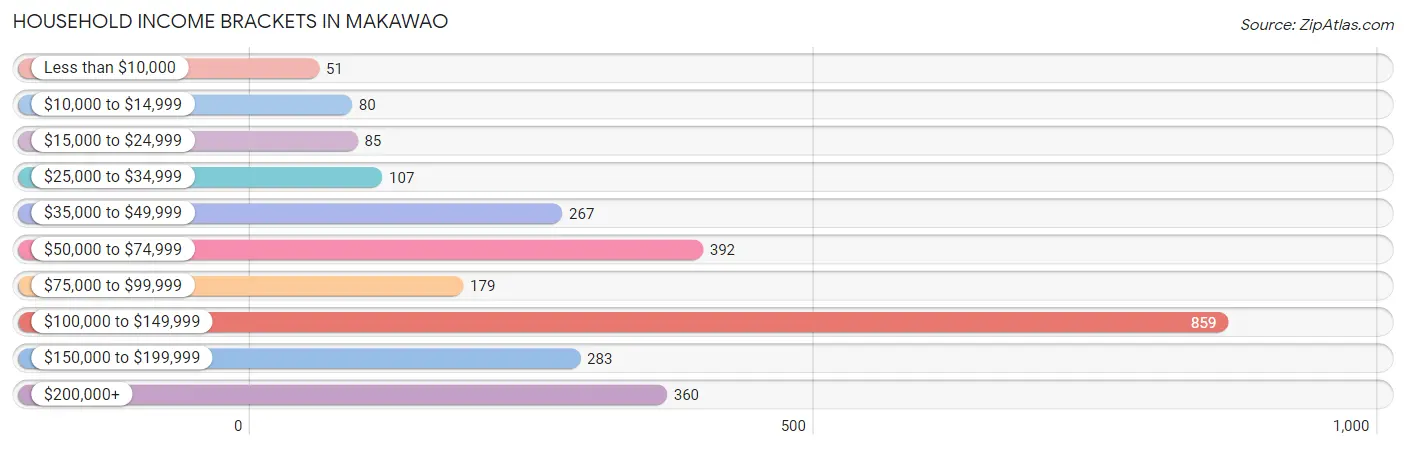
| Income Bracket | # Households | % Households |
| Less than $10,000 | 51 | 1.9% |
| $10,000 to $14,999 | 80 | 3.0% |
| $15,000 to $24,999 | 85 | 3.2% |
| $25,000 to $34,999 | 107 | 4.0% |
| $35,000 to $49,999 | 267 | 10.0% |
| $50,000 to $74,999 | 392 | 14.7% |
| $75,000 to $99,999 | 179 | 6.7% |
| $100,000 to $149,999 | 859 | 32.2% |
| $150,000 to $199,999 | 283 | 10.6% |
| $200,000+ | 360 | 13.5% |
Household Income by Householder Age in Makawao
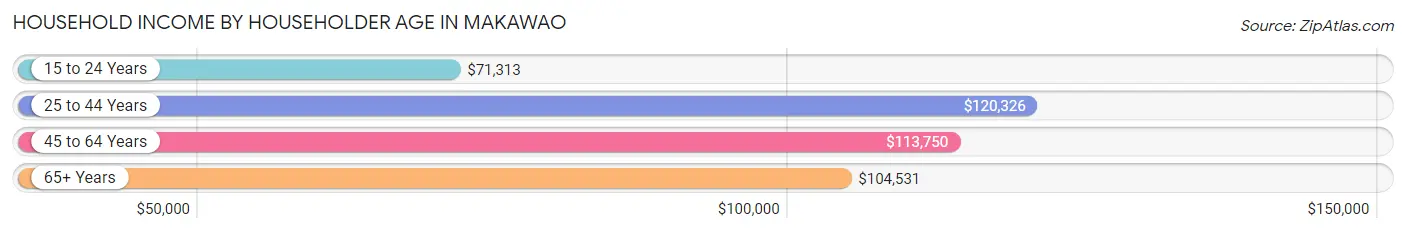
The median household income in Makawao is $109,385, with the highest median household income of $120,326 found in the 25 to 44 years age bracket for the primary householder. A total of 662 households (24.8%) fall into this category. Meanwhile, the 15 to 24 years age bracket for the primary householder has the lowest median household income of $71,313, with 60 households (2.2%) in this group.
| Income Bracket | # Households | Median Income |
| 15 to 24 Years | 60 (2.2%) | $71,313 |
| 25 to 44 Years | 662 (24.8%) | $120,326 |
| 45 to 64 Years | 1,004 (37.6%) | $113,750 |
| 65+ Years | 942 (35.3%) | $104,531 |
| Total | 2,668 (100.0%) | $109,385 |
Poverty in Makawao
Income Below Poverty by Sex and Age in Makawao
With 9.5% poverty level for males and 7.7% for females among the residents of Makawao, 16 and 17 year old males and 16 and 17 year old females are the most vulnerable to poverty, with 18 males (37.5%) and 16 females (18.6%) in their respective age groups living below the poverty level.
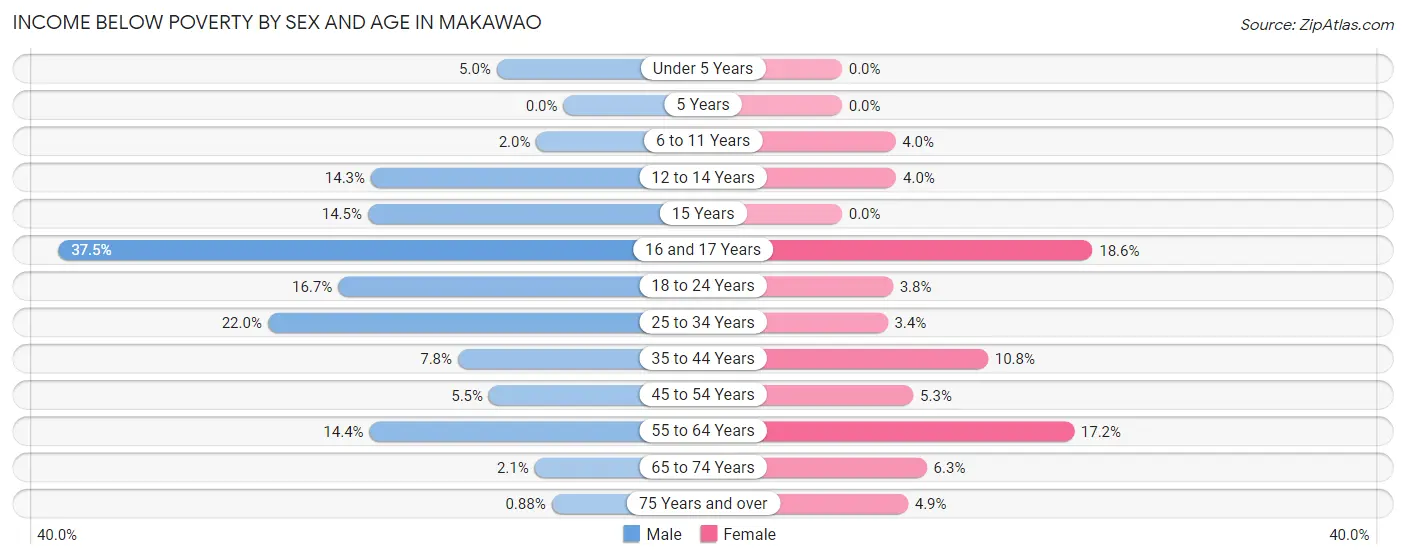
| Age Bracket | Male | Female |
| Under 5 Years | 16 (5.0%) | 0 (0.0%) |
| 5 Years | 0 (0.0%) | 0 (0.0%) |
| 6 to 11 Years | 5 (2.0%) | 10 (4.0%) |
| 12 to 14 Years | 34 (14.3%) | 5 (4.0%) |
| 15 Years | 9 (14.5%) | 0 (0.0%) |
| 16 and 17 Years | 18 (37.5%) | 16 (18.6%) |
| 18 to 24 Years | 45 (16.7%) | 11 (3.8%) |
| 25 to 34 Years | 63 (22.0%) | 12 (3.4%) |
| 35 to 44 Years | 48 (7.8%) | 58 (10.8%) |
| 45 to 54 Years | 21 (5.5%) | 30 (5.3%) |
| 55 to 64 Years | 91 (14.4%) | 113 (17.2%) |
| 65 to 74 Years | 7 (2.1%) | 29 (6.3%) |
| 75 Years and over | 3 (0.9%) | 18 (4.9%) |
| Total | 360 (9.5%) | 302 (7.7%) |
Income Above Poverty by Sex and Age in Makawao
According to the poverty statistics in Makawao, males aged 5 years and females aged under 5 years are the age groups that are most secure financially, with 100.0% of males and 100.0% of females in these age groups living above the poverty line.
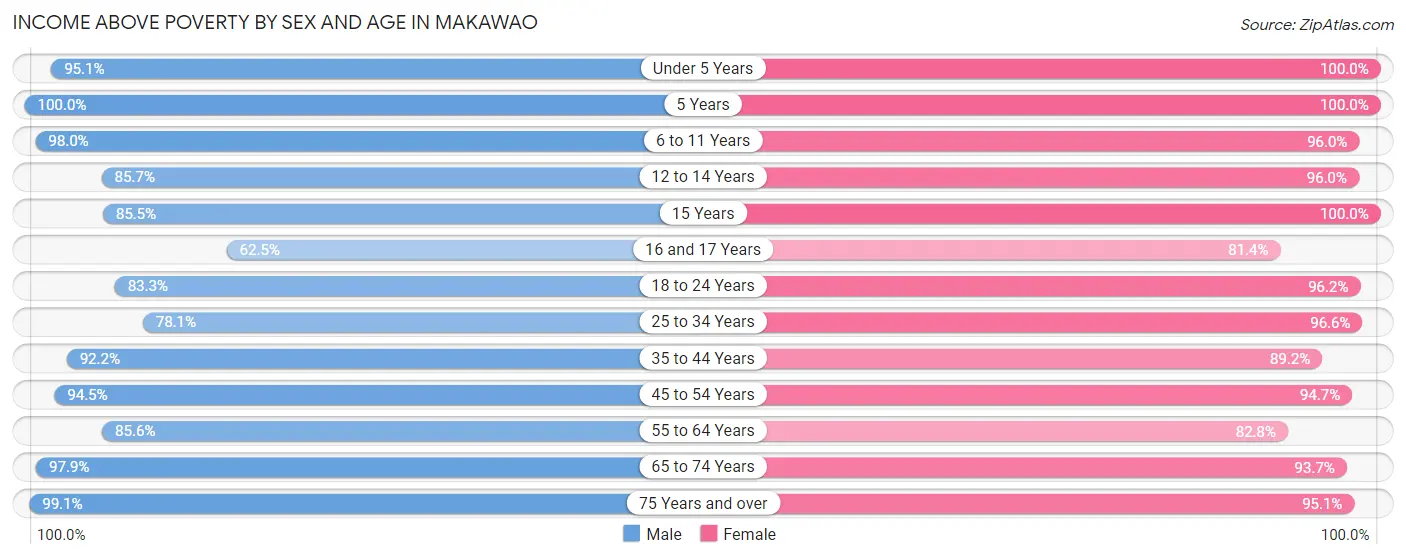
| Age Bracket | Male | Female |
| Under 5 Years | 307 (95.1%) | 124 (100.0%) |
| 5 Years | 18 (100.0%) | 52 (100.0%) |
| 6 to 11 Years | 244 (98.0%) | 242 (96.0%) |
| 12 to 14 Years | 204 (85.7%) | 119 (96.0%) |
| 15 Years | 53 (85.5%) | 50 (100.0%) |
| 16 and 17 Years | 30 (62.5%) | 70 (81.4%) |
| 18 to 24 Years | 224 (83.3%) | 280 (96.2%) |
| 25 to 34 Years | 224 (78.0%) | 342 (96.6%) |
| 35 to 44 Years | 565 (92.2%) | 477 (89.2%) |
| 45 to 54 Years | 359 (94.5%) | 536 (94.7%) |
| 55 to 64 Years | 541 (85.6%) | 543 (82.8%) |
| 65 to 74 Years | 320 (97.9%) | 431 (93.7%) |
| 75 Years and over | 338 (99.1%) | 349 (95.1%) |
| Total | 3,427 (90.5%) | 3,615 (92.3%) |
Income Below Poverty Among Married-Couple Families in Makawao
The poverty statistics for married-couple families in Makawao show that 2.4% or 33 of the total 1,369 families live below the poverty line. Families with no children have the highest poverty rate of 3.2%, comprising of 28 families. On the other hand, families with 3 or 4 children have the lowest poverty rate of 0.0%, which includes 0 families.
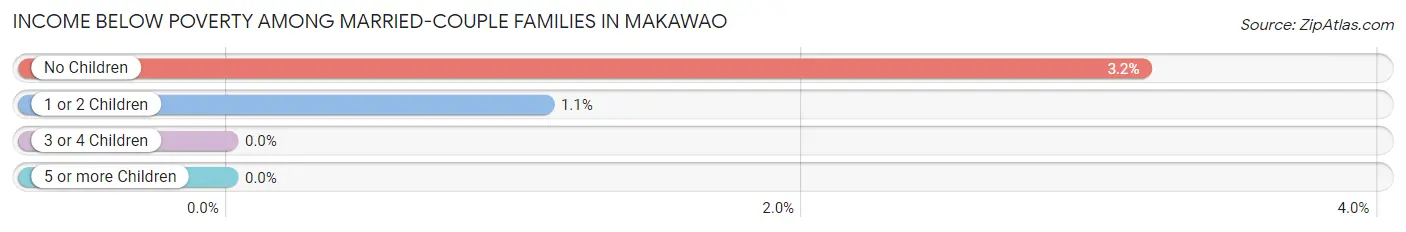
| Children | Above Poverty | Below Poverty |
| No Children | 852 (96.8%) | 28 (3.2%) |
| 1 or 2 Children | 448 (98.9%) | 5 (1.1%) |
| 3 or 4 Children | 5 (100.0%) | 0 (0.0%) |
| 5 or more Children | 31 (100.0%) | 0 (0.0%) |
| Total | 1,336 (97.6%) | 33 (2.4%) |
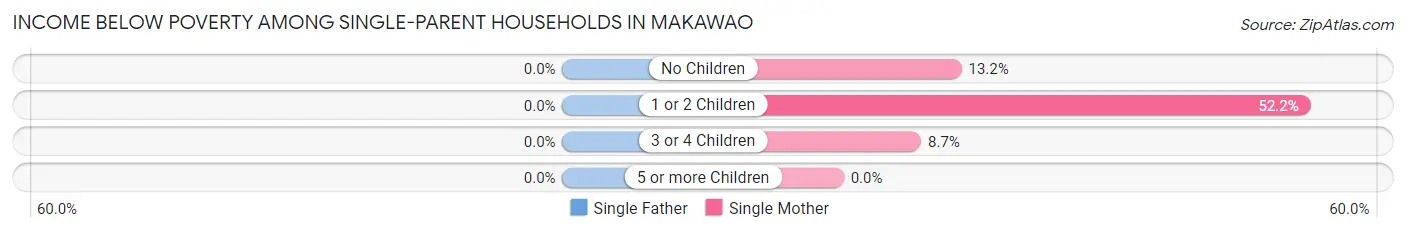
Income Below Poverty Among Single-Parent Households in Makawao
| Children | Single Father | Single Mother |
| No Children | 0 (0.0%) | 27 (13.2%) |
| 1 or 2 Children | 0 (0.0%) | 24 (52.2%) |
| 3 or 4 Children | 0 (0.0%) | 9 (8.6%) |
| 5 or more Children | 0 (0.0%) | 0 (0.0%) |
| Total | 0 (0.0%) | 60 (16.9%) |
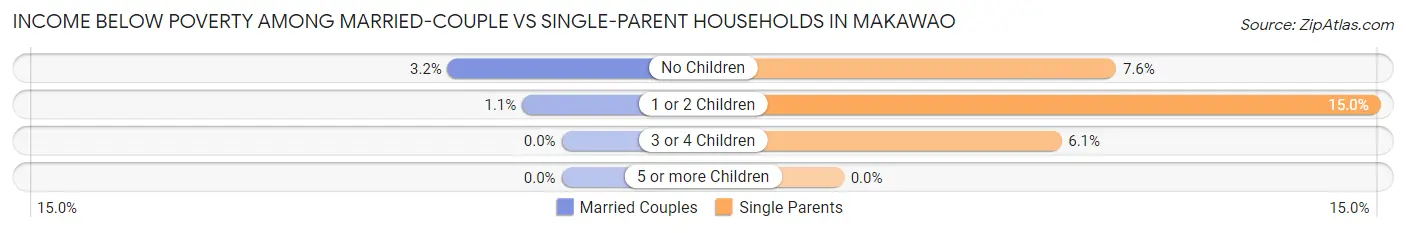
Income Below Poverty Among Married-Couple vs Single-Parent Households in Makawao
The poverty data for Makawao shows that 33 of the married-couple family households (2.4%) and 60 of the single-parent households (9.0%) are living below the poverty level. Within the married-couple family households, those with no children have the highest poverty rate, with 28 households (3.2%) falling below the poverty line. Among the single-parent households, those with 1 or 2 children have the highest poverty rate, with 24 household (15.0%) living below poverty.
| Children | Married-Couple Families | Single-Parent Households |
| No Children | 28 (3.2%) | 27 (7.6%) |
| 1 or 2 Children | 5 (1.1%) | 24 (15.0%) |
| 3 or 4 Children | 0 (0.0%) | 9 (6.1%) |
| 5 or more Children | 0 (0.0%) | 0 (0.0%) |
| Total | 33 (2.4%) | 60 (9.0%) |
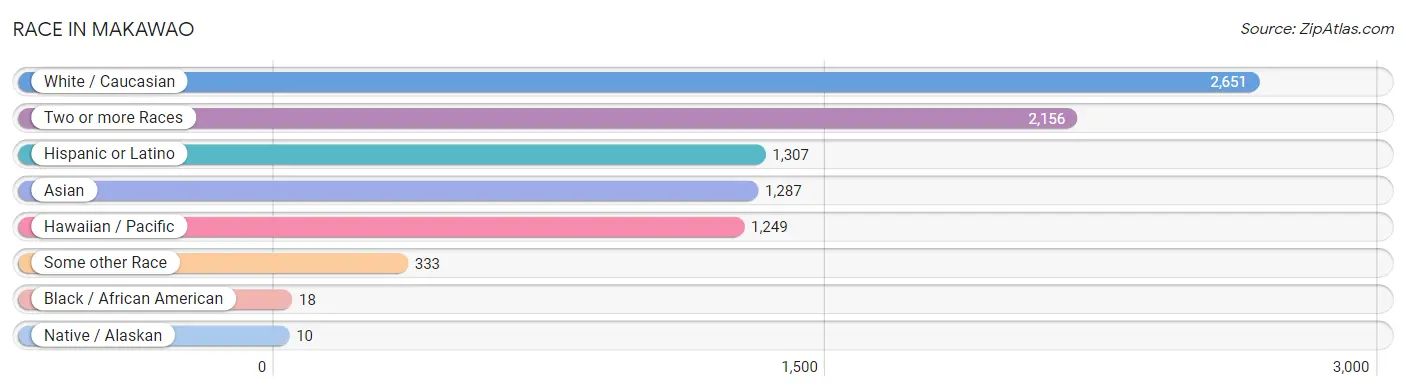
Race in Makawao
The most populous races in Makawao are White / Caucasian (2,651 | 34.4%), Two or more Races (2,156 | 28.0%), and Hispanic or Latino (1,307 | 17.0%).
| Race | # Population | % Population |
| Asian | 1,287 | 16.7% |
| Black / African American | 18 | 0.2% |
| Hawaiian / Pacific | 1,249 | 16.2% |
| Hispanic or Latino | 1,307 | 17.0% |
| Native / Alaskan | 10 | 0.1% |
| White / Caucasian | 2,651 | 34.4% |
| Two or more Races | 2,156 | 28.0% |
| Some other Race | 333 | 4.3% |
| Total | 7,704 | 100.0% |
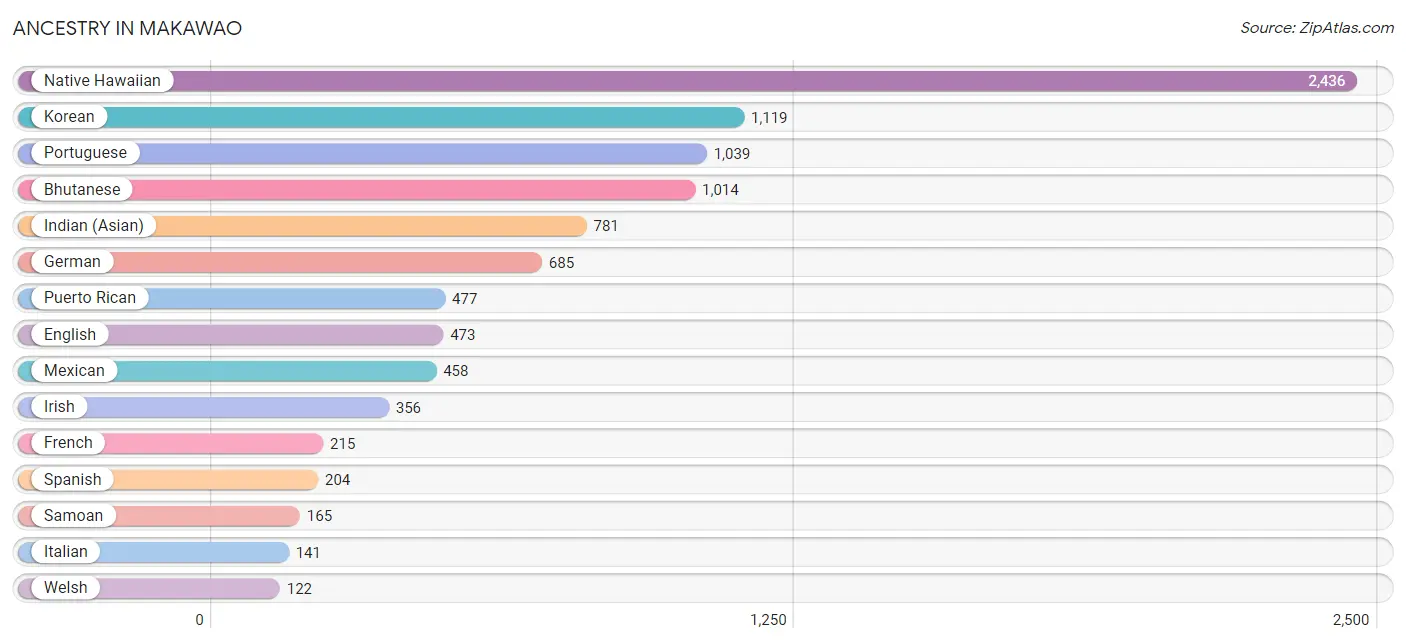
Ancestry in Makawao
The most populous ancestries reported in Makawao are Native Hawaiian (2,436 | 31.6%), Korean (1,119 | 14.5%), Portuguese (1,039 | 13.5%), Bhutanese (1,014 | 13.2%), and Indian (Asian) (781 | 10.1%), together accounting for 82.9% of all Makawao residents.
| Ancestry | # Population | % Population |
| American | 39 | 0.5% |
| Argentinean | 10 | 0.1% |
| Australian | 38 | 0.5% |
| Austrian | 19 | 0.3% |
| Bhutanese | 1,014 | 13.2% |
| Blackfeet | 10 | 0.1% |
| British | 62 | 0.8% |
| Burmese | 88 | 1.1% |
| Canadian | 34 | 0.4% |
| Central American | 70 | 0.9% |
| Cherokee | 29 | 0.4% |
| Chinese | 65 | 0.8% |
| Choctaw | 19 | 0.3% |
| Croatian | 7 | 0.1% |
| Dutch | 102 | 1.3% |
| Eastern European | 28 | 0.4% |
| English | 473 | 6.1% |
| European | 81 | 1.1% |
| Fijian | 1 | 0.0% |
| French | 215 | 2.8% |
| French Canadian | 14 | 0.2% |
| German | 685 | 8.9% |
| Greek | 31 | 0.4% |
| Guamanian / Chamorro | 112 | 1.5% |
| Hungarian | 15 | 0.2% |
| Icelander | 5 | 0.1% |
| Indian (Asian) | 781 | 10.1% |
| Iranian | 8 | 0.1% |
| Irish | 356 | 4.6% |
| Italian | 141 | 1.8% |
| Korean | 1,119 | 14.5% |
| Lithuanian | 9 | 0.1% |
| Mexican | 458 | 5.9% |
| Native Hawaiian | 2,436 | 31.6% |
| New Zealander | 8 | 0.1% |
| Northern European | 20 | 0.3% |
| Norwegian | 5 | 0.1% |
| Panamanian | 33 | 0.4% |
| Polish | 66 | 0.9% |
| Portuguese | 1,039 | 13.5% |
| Puerto Rican | 477 | 6.2% |
| Russian | 22 | 0.3% |
| Salvadoran | 37 | 0.5% |
| Samoan | 165 | 2.1% |
| Scotch-Irish | 88 | 1.1% |
| Scottish | 115 | 1.5% |
| South American | 10 | 0.1% |
| Spaniard | 76 | 1.0% |
| Spanish | 204 | 2.6% |
| Swedish | 15 | 0.2% |
| Swiss | 12 | 0.2% |
| Ukrainian | 38 | 0.5% |
| Welsh | 122 | 1.6% | View All 53 Rows |
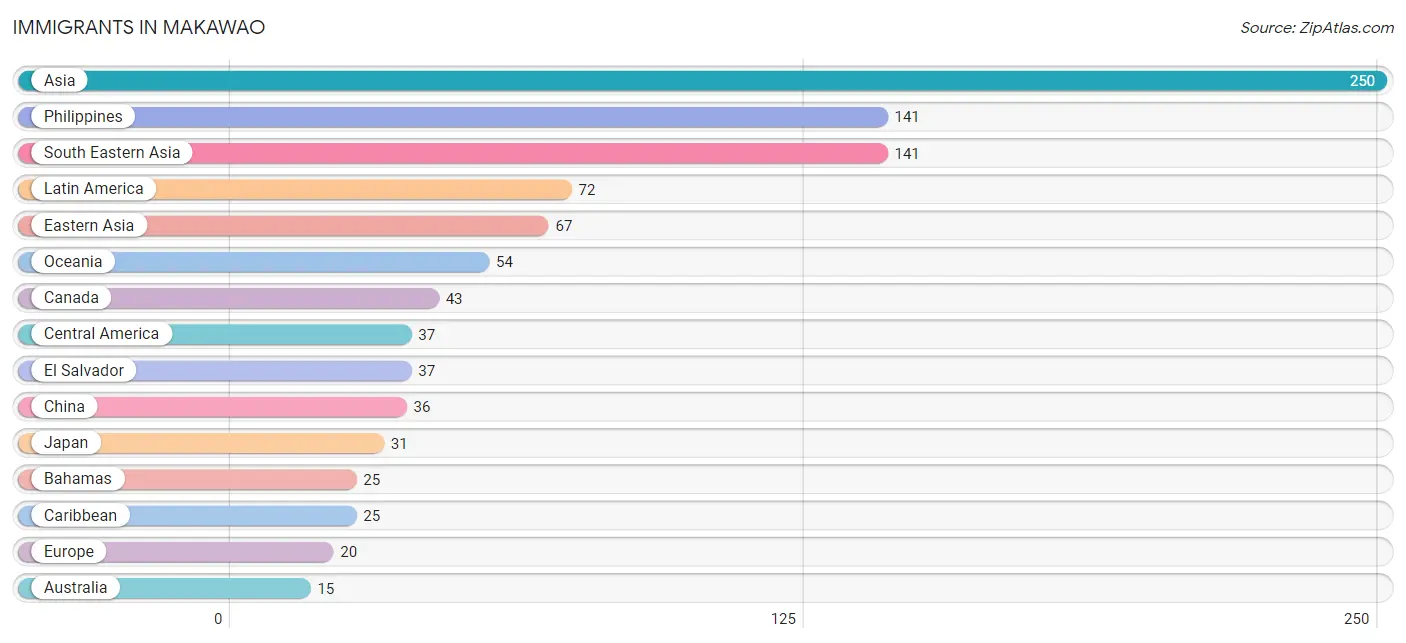
Immigrants in Makawao
The most numerous immigrant groups reported in Makawao came from Asia (250 | 3.3%), Philippines (141 | 1.8%), South Eastern Asia (141 | 1.8%), Latin America (72 | 0.9%), and Eastern Asia (67 | 0.9%), together accounting for 8.7% of all Makawao residents.
| Immigration Origin | # Population | % Population |
| Africa | 11 | 0.1% |
| Argentina | 10 | 0.1% |
| Asia | 250 | 3.3% |
| Australia | 15 | 0.2% |
| Azores | 4 | 0.1% |
| Bahamas | 25 | 0.3% |
| Canada | 43 | 0.6% |
| Caribbean | 25 | 0.3% |
| Central America | 37 | 0.5% |
| China | 36 | 0.5% |
| Eastern Africa | 11 | 0.1% |
| Eastern Asia | 67 | 0.9% |
| Eastern Europe | 7 | 0.1% |
| El Salvador | 37 | 0.5% |
| England | 9 | 0.1% |
| Europe | 20 | 0.3% |
| Hong Kong | 12 | 0.2% |
| Hungary | 7 | 0.1% |
| Iran | 8 | 0.1% |
| Japan | 31 | 0.4% |
| Latin America | 72 | 0.9% |
| Northern Europe | 9 | 0.1% |
| Oceania | 54 | 0.7% |
| Philippines | 141 | 1.8% |
| Portugal | 4 | 0.1% |
| South America | 10 | 0.1% |
| South Central Asia | 8 | 0.1% |
| South Eastern Asia | 141 | 1.8% |
| Southern Europe | 4 | 0.1% |
| Zimbabwe | 11 | 0.1% | View All 30 Rows |
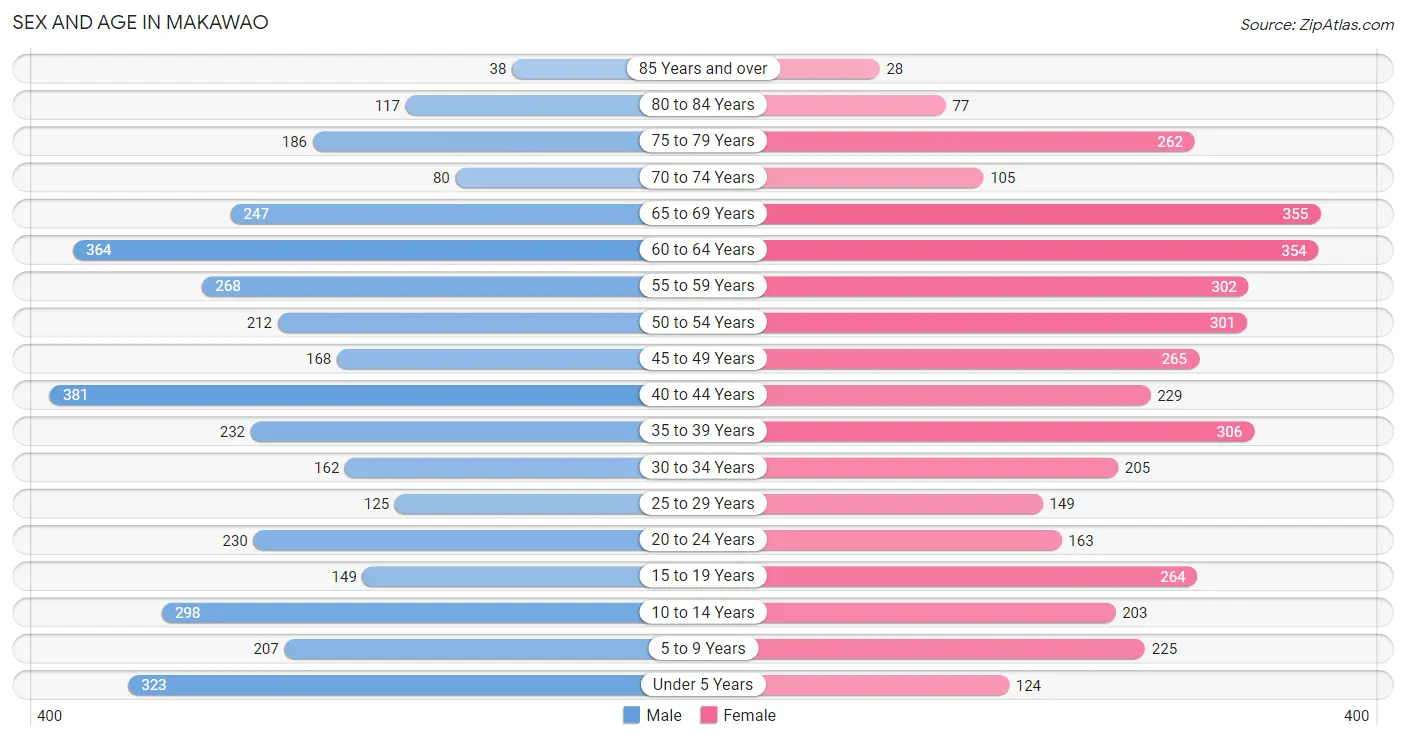
Sex and Age in Makawao
Sex and Age in Makawao
The most populous age groups in Makawao are 40 to 44 Years (381 | 10.1%) for men and 65 to 69 Years (355 | 9.1%) for women.
| Age Bracket | Male | Female |
| Under 5 Years | 323 (8.5%) | 124 (3.2%) |
| 5 to 9 Years | 207 (5.5%) | 225 (5.7%) |
| 10 to 14 Years | 298 (7.9%) | 203 (5.2%) |
| 15 to 19 Years | 149 (3.9%) | 264 (6.7%) |
| 20 to 24 Years | 230 (6.1%) | 163 (4.2%) |
| 25 to 29 Years | 125 (3.3%) | 149 (3.8%) |
| 30 to 34 Years | 162 (4.3%) | 205 (5.2%) |
| 35 to 39 Years | 232 (6.1%) | 306 (7.8%) |
| 40 to 44 Years | 381 (10.1%) | 229 (5.9%) |
| 45 to 49 Years | 168 (4.4%) | 265 (6.8%) |
| 50 to 54 Years | 212 (5.6%) | 301 (7.7%) |
| 55 to 59 Years | 268 (7.1%) | 302 (7.7%) |
| 60 to 64 Years | 364 (9.6%) | 354 (9.0%) |
| 65 to 69 Years | 247 (6.5%) | 355 (9.1%) |
| 70 to 74 Years | 80 (2.1%) | 105 (2.7%) |
| 75 to 79 Years | 186 (4.9%) | 262 (6.7%) |
| 80 to 84 Years | 117 (3.1%) | 77 (2.0%) |
| 85 Years and over | 38 (1.0%) | 28 (0.7%) |
| Total | 3,787 (100.0%) | 3,917 (100.0%) |
Families and Households in Makawao
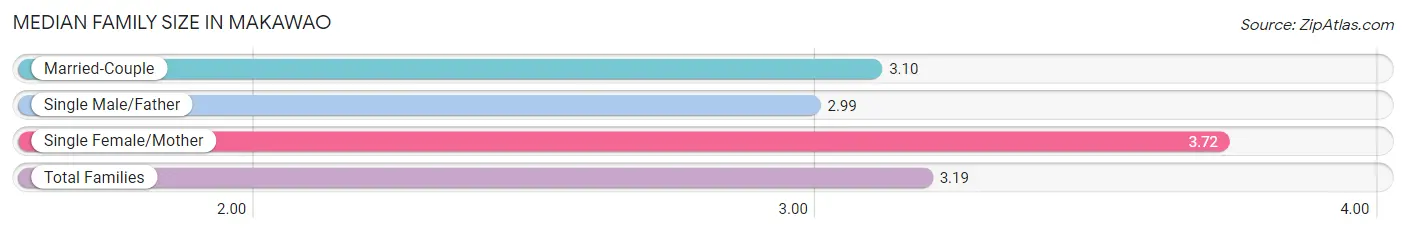
Median Family Size in Makawao
The median family size in Makawao is 3.19 persons per family, with single female/mother families (355 | 17.5%) accounting for the largest median family size of 3.72 persons per family. On the other hand, single male/father families (308 | 15.2%) represent the smallest median family size with 2.99 persons per family.
| Family Type | # Families | Family Size |
| Married-Couple | 1,369 (67.4%) | 3.10 |
| Single Male/Father | 308 (15.2%) | 2.99 |
| Single Female/Mother | 355 (17.5%) | 3.72 |
| Total Families | 2,032 (100.0%) | 3.19 |
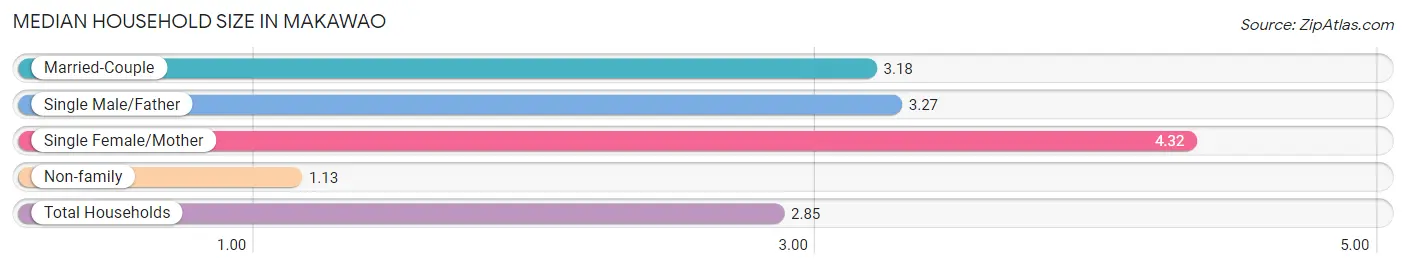
Median Household Size in Makawao
The median household size in Makawao is 2.85 persons per household, with single female/mother households (355 | 13.3%) accounting for the largest median household size of 4.32 persons per household. non-family households (636 | 23.8%) represent the smallest median household size with 1.13 persons per household.
| Household Type | # Households | Household Size |
| Married-Couple | 1,369 (51.3%) | 3.18 |
| Single Male/Father | 308 (11.5%) | 3.27 |
| Single Female/Mother | 355 (13.3%) | 4.32 |
| Non-family | 636 (23.8%) | 1.13 |
| Total Households | 2,668 (100.0%) | 2.85 |
Household Size by Marriage Status in Makawao
Out of a total of 2,668 households in Makawao, 2,032 (76.2%) are family households, while 636 (23.8%) are nonfamily households. The most numerous type of family households are 2-person households, comprising 731, and the most common type of nonfamily households are 1-person households, comprising 561.
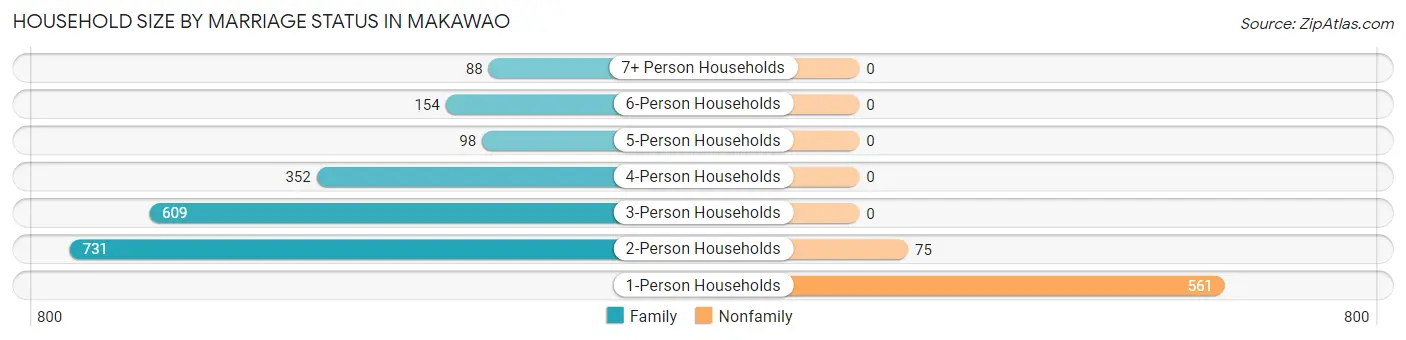
| Household Size | Family Households | Nonfamily Households |
| 1-Person Households | - | 561 (21.0%) |
| 2-Person Households | 731 (27.4%) | 75 (2.8%) |
| 3-Person Households | 609 (22.8%) | 0 (0.0%) |
| 4-Person Households | 352 (13.2%) | 0 (0.0%) |
| 5-Person Households | 98 (3.7%) | 0 (0.0%) |
| 6-Person Households | 154 (5.8%) | 0 (0.0%) |
| 7+ Person Households | 88 (3.3%) | 0 (0.0%) |
| Total | 2,032 (76.2%) | 636 (23.8%) |
Female Fertility in Makawao
Fertility by Age in Makawao
Average fertility rate in Makawao is 26.0 births per 1,000 women. Women in the age bracket of 20 to 34 years have the highest fertility rate with 37.0 births per 1,000 women. Women in the age bracket of 35 to 50 years acount for 55.8% of all women with births.
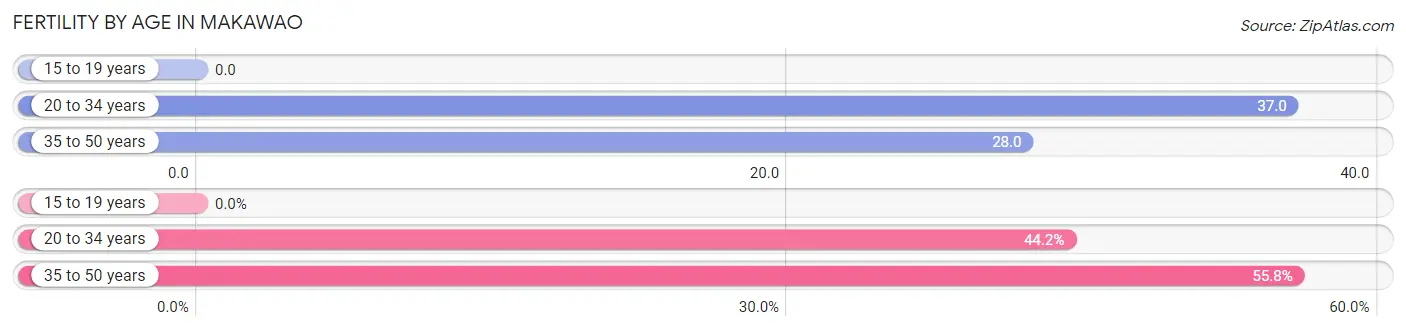
| Age Bracket | Women with Births | Births / 1,000 Women |
| 15 to 19 years | 0 (0.0%) | 0.0 |
| 20 to 34 years | 19 (44.2%) | 37.0 |
| 35 to 50 years | 24 (55.8%) | 28.0 |
| Total | 43 (100.0%) | 26.0 |
Fertility by Age by Marriage Status in Makawao
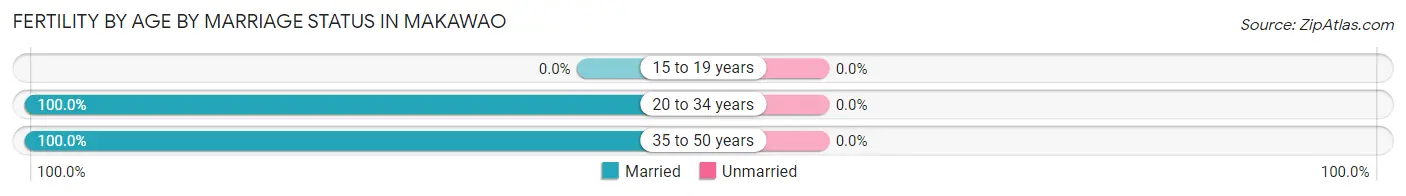
| Age Bracket | Married | Unmarried |
| 15 to 19 years | 0 (0.0%) | 0 (0.0%) |
| 20 to 34 years | 19 (100.0%) | 0 (0.0%) |
| 35 to 50 years | 24 (100.0%) | 0 (0.0%) |
| Total | 43 (100.0%) | 0 (0.0%) |
Fertility by Education in Makawao
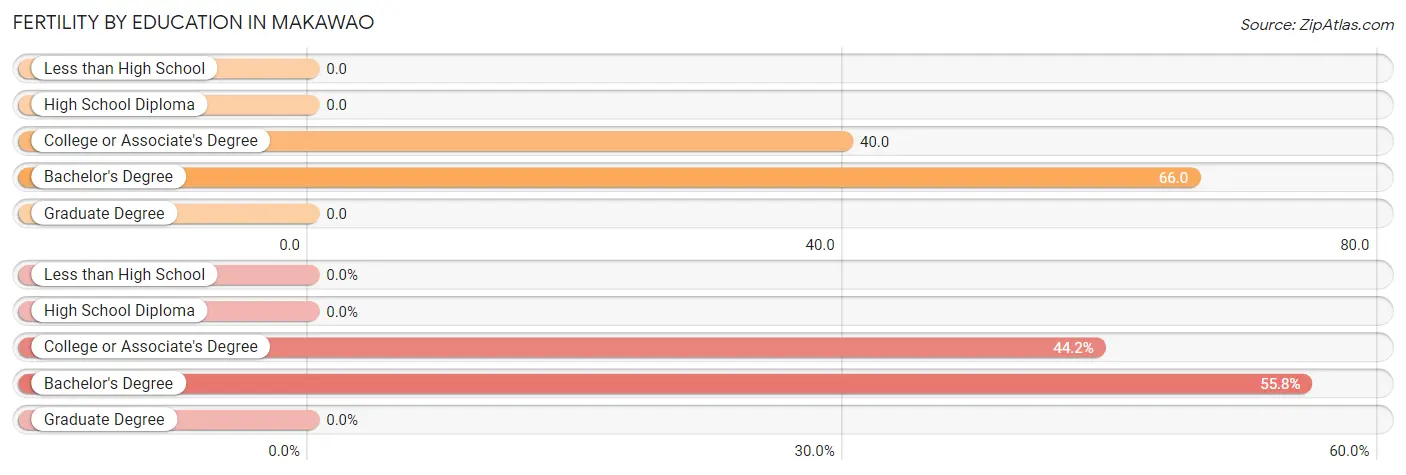
| Educational Attainment | Women with Births | Births / 1,000 Women |
| Less than High School | 0 (0.0%) | 0.0 |
| High School Diploma | 0 (0.0%) | 0.0 |
| College or Associate's Degree | 19 (44.2%) | 40.0 |
| Bachelor's Degree | 24 (55.8%) | 66.0 |
| Graduate Degree | 0 (0.0%) | 0.0 |
| Total | 43 (100.0%) | 26.0 |
Fertility by Education by Marriage Status in Makawao
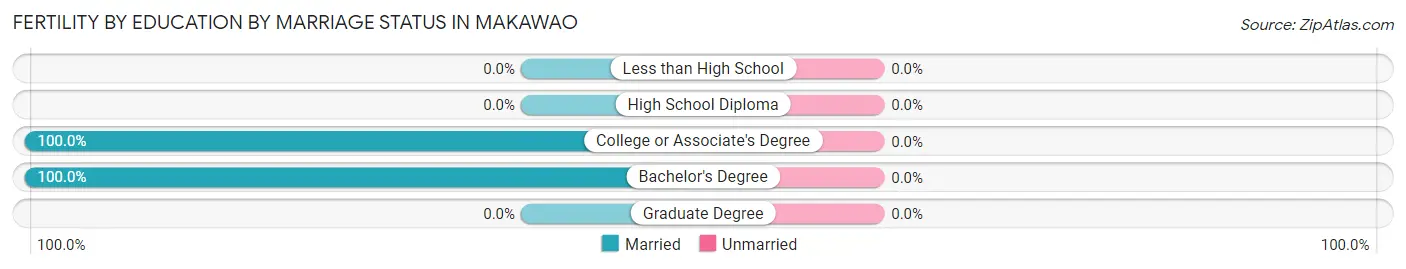
| Educational Attainment | Married | Unmarried |
| Less than High School | 0 (0.0%) | 0 (0.0%) |
| High School Diploma | 0 (0.0%) | 0 (0.0%) |
| College or Associate's Degree | 19 (100.0%) | 0 (0.0%) |
| Bachelor's Degree | 24 (100.0%) | 0 (0.0%) |
| Graduate Degree | 0 (0.0%) | 0 (0.0%) |
| Total | 43 (100.0%) | 0 (0.0%) |
Employment Characteristics in Makawao
Employment by Class of Employer in Makawao
Among the 3,537 employed individuals in Makawao, private company employees (2,122 | 60.0%), state government employees (455 | 12.9%), and self-employed (incorporated) (292 | 8.3%) make up the most common classes of employment.
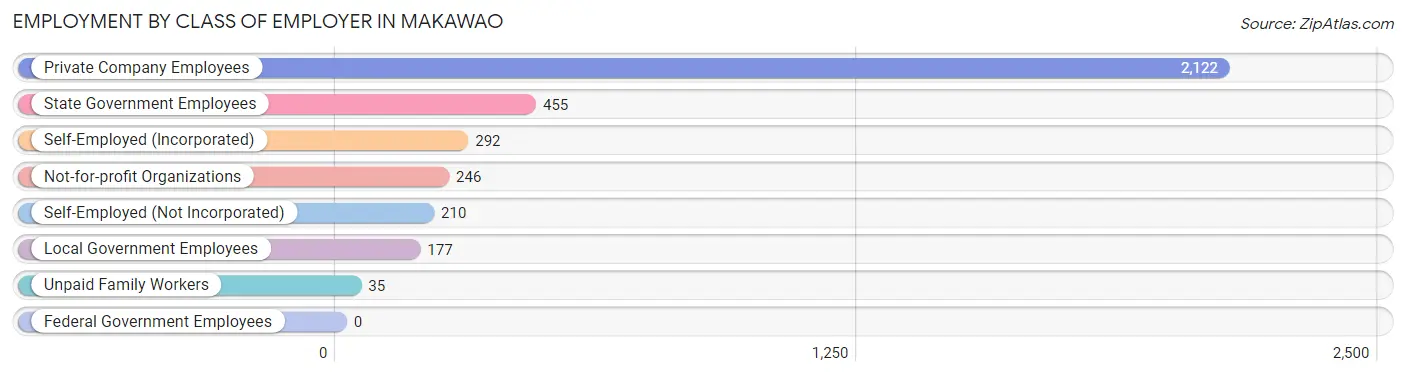
| Employer Class | # Employees | % Employees |
| Private Company Employees | 2,122 | 60.0% |
| Self-Employed (Incorporated) | 292 | 8.3% |
| Self-Employed (Not Incorporated) | 210 | 5.9% |
| Not-for-profit Organizations | 246 | 7.0% |
| Local Government Employees | 177 | 5.0% |
| State Government Employees | 455 | 12.9% |
| Federal Government Employees | 0 | 0.0% |
| Unpaid Family Workers | 35 | 1.0% |
| Total | 3,537 | 100.0% |
Employment Status by Age in Makawao
According to the labor force statistics for Makawao, out of the total population over 16 years of age (6,212), 60.5% or 3,758 individuals are in the labor force, with 3.0% or 113 of them unemployed. The age group with the highest labor force participation rate is 25 to 29 years, with 89.8% or 246 individuals in the labor force. Within the labor force, the 75 years and over age range has the highest percentage of unemployed individuals, with 13.6% or 6 of them being unemployed.
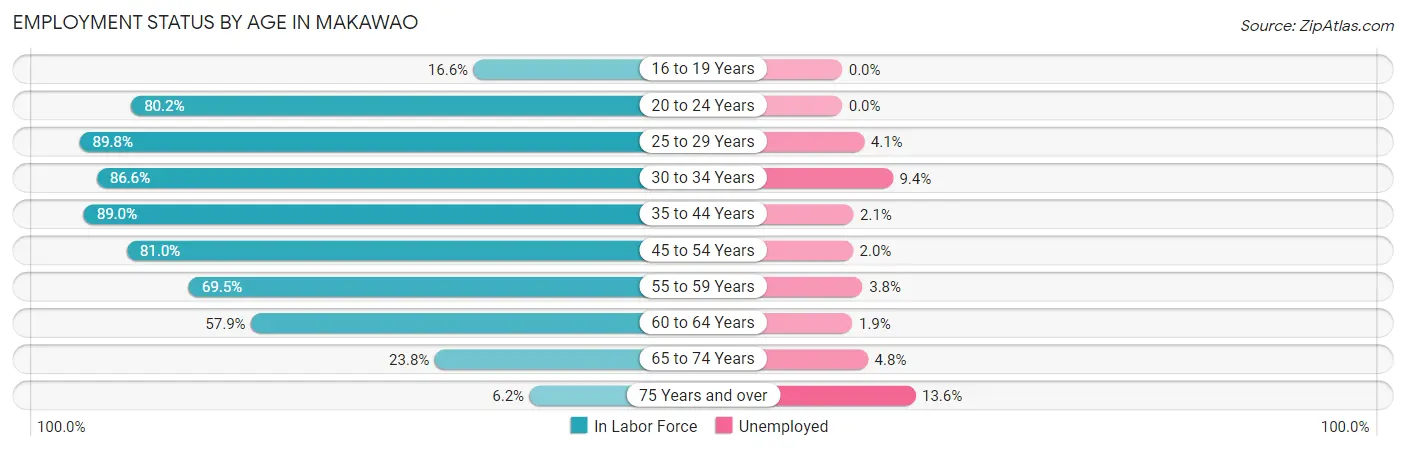
| Age Bracket | In Labor Force | Unemployed |
| 16 to 19 Years | 50 (16.6%) | 0 (0.0%) |
| 20 to 24 Years | 315 (80.2%) | 0 (0.0%) |
| 25 to 29 Years | 246 (89.8%) | 10 (4.1%) |
| 30 to 34 Years | 318 (86.6%) | 30 (9.4%) |
| 35 to 44 Years | 1,022 (89.0%) | 21 (2.1%) |
| 45 to 54 Years | 766 (81.0%) | 15 (2.0%) |
| 55 to 59 Years | 396 (69.5%) | 15 (3.8%) |
| 60 to 64 Years | 416 (57.9%) | 8 (1.9%) |
| 65 to 74 Years | 187 (23.8%) | 9 (4.8%) |
| 75 Years and over | 44 (6.2%) | 6 (13.6%) |
| Total | 3,758 (60.5%) | 113 (3.0%) |
Employment Status by Educational Attainment in Makawao
According to labor force statistics for Makawao, 78.6% of individuals (3,162) out of the total population between 25 and 64 years of age (4,023) are in the labor force, with 3.1% or 98 of them being unemployed. The group with the highest labor force participation rate are those with the educational attainment of bachelor's degree or higher, with 88.4% or 1,239 individuals in the labor force. Within the labor force, individuals with high school diploma education have the highest percentage of unemployment, with 4.1% or 33 of them being unemployed.
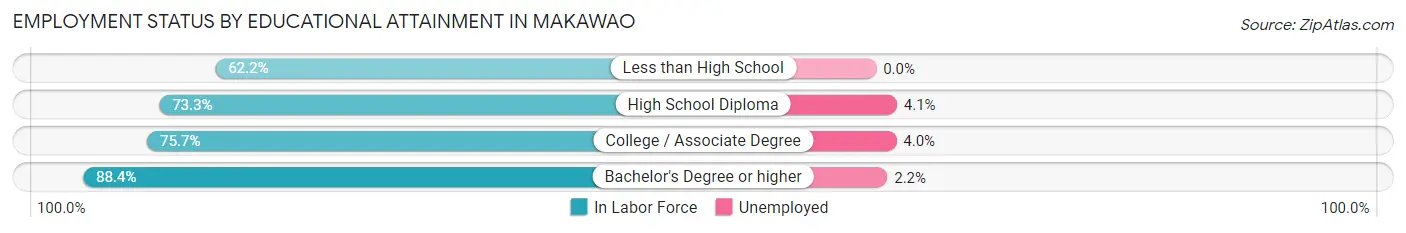
| Educational Attainment | In Labor Force | Unemployed |
| Less than High School | 150 (62.2%) | 0 (0.0%) |
| High School Diploma | 803 (73.3%) | 45 (4.1%) |
| College / Associate Degree | 972 (75.7%) | 51 (4.0%) |
| Bachelor's Degree or higher | 1,239 (88.4%) | 31 (2.2%) |
| Total | 3,162 (78.6%) | 125 (3.1%) |
Employment Occupations by Sex in Makawao
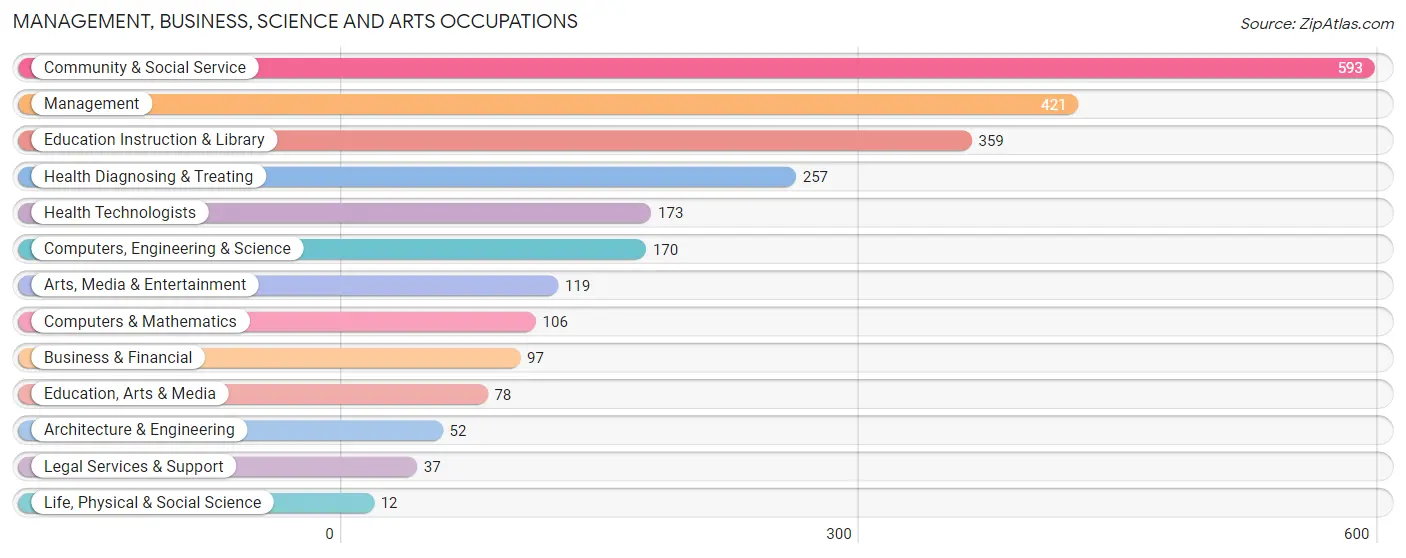
Management, Business, Science and Arts Occupations
The most common Management, Business, Science and Arts occupations in Makawao are Community & Social Service (593 | 16.3%), Management (421 | 11.6%), Education Instruction & Library (359 | 9.9%), Health Diagnosing & Treating (257 | 7.0%), and Health Technologists (173 | 4.7%).
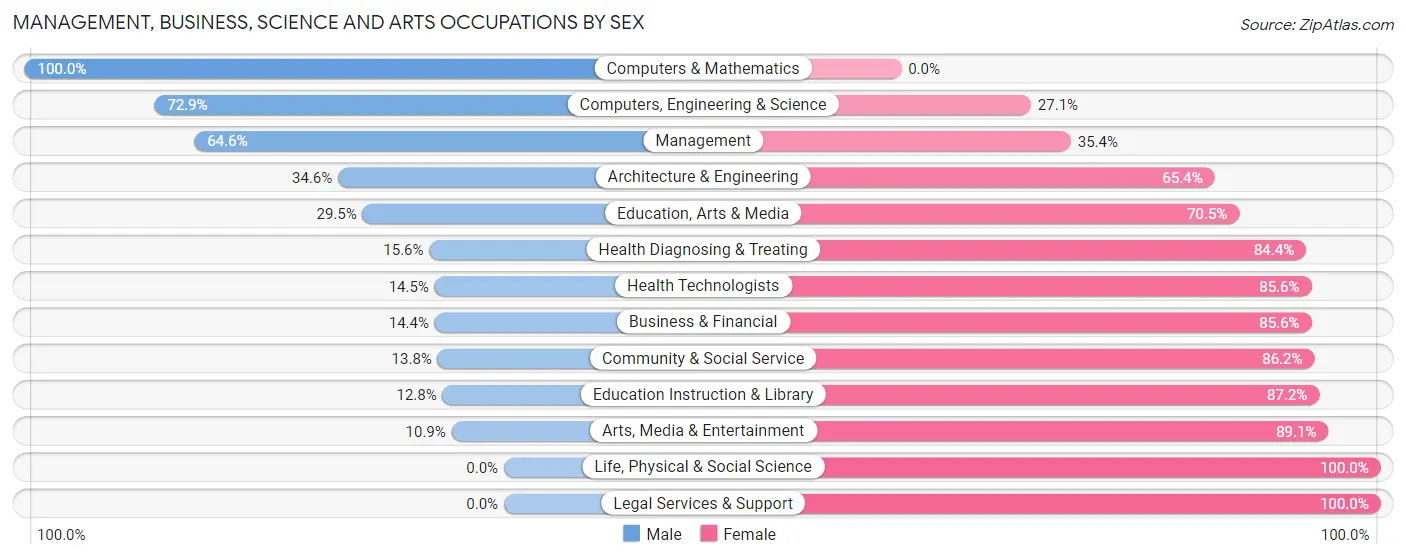
Management, Business, Science and Arts Occupations by Sex
Within the Management, Business, Science and Arts occupations in Makawao, the most male-oriented occupations are Computers & Mathematics (100.0%), Computers, Engineering & Science (72.9%), and Management (64.6%), while the most female-oriented occupations are Life, Physical & Social Science (100.0%), Legal Services & Support (100.0%), and Arts, Media & Entertainment (89.1%).
| Occupation | Male | Female |
| Management | 272 (64.6%) | 149 (35.4%) |
| Business & Financial | 14 (14.4%) | 83 (85.6%) |
| Computers, Engineering & Science | 124 (72.9%) | 46 (27.1%) |
| Computers & Mathematics | 106 (100.0%) | 0 (0.0%) |
| Architecture & Engineering | 18 (34.6%) | 34 (65.4%) |
| Life, Physical & Social Science | 0 (0.0%) | 12 (100.0%) |
| Community & Social Service | 82 (13.8%) | 511 (86.2%) |
| Education, Arts & Media | 23 (29.5%) | 55 (70.5%) |
| Legal Services & Support | 0 (0.0%) | 37 (100.0%) |
| Education Instruction & Library | 46 (12.8%) | 313 (87.2%) |
| Arts, Media & Entertainment | 13 (10.9%) | 106 (89.1%) |
| Health Diagnosing & Treating | 40 (15.6%) | 217 (84.4%) |
| Health Technologists | 25 (14.4%) | 148 (85.6%) |
| Total (Category) | 532 (34.6%) | 1,006 (65.4%) |
| Total (Overall) | 1,753 (48.1%) | 1,893 (51.9%) |
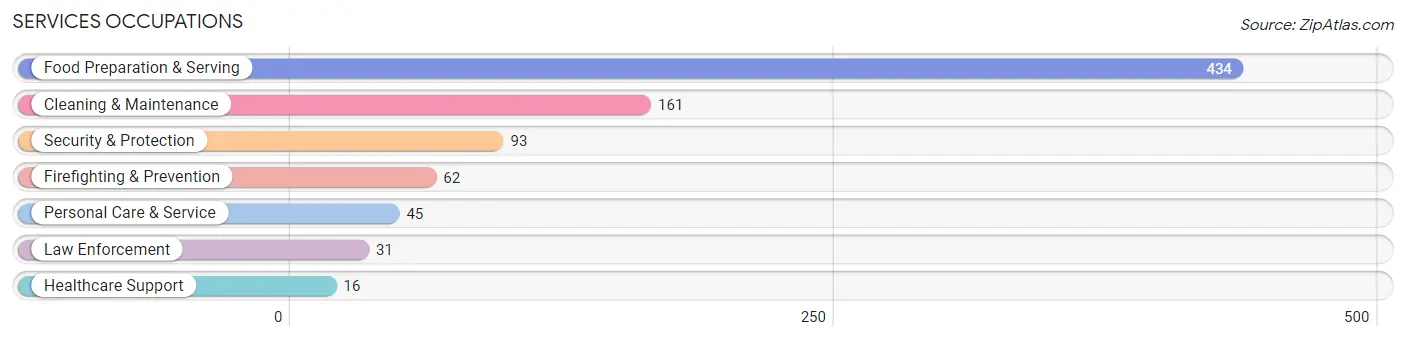
Services Occupations
The most common Services occupations in Makawao are Food Preparation & Serving (434 | 11.9%), Cleaning & Maintenance (161 | 4.4%), Security & Protection (93 | 2.5%), Firefighting & Prevention (62 | 1.7%), and Personal Care & Service (45 | 1.2%).
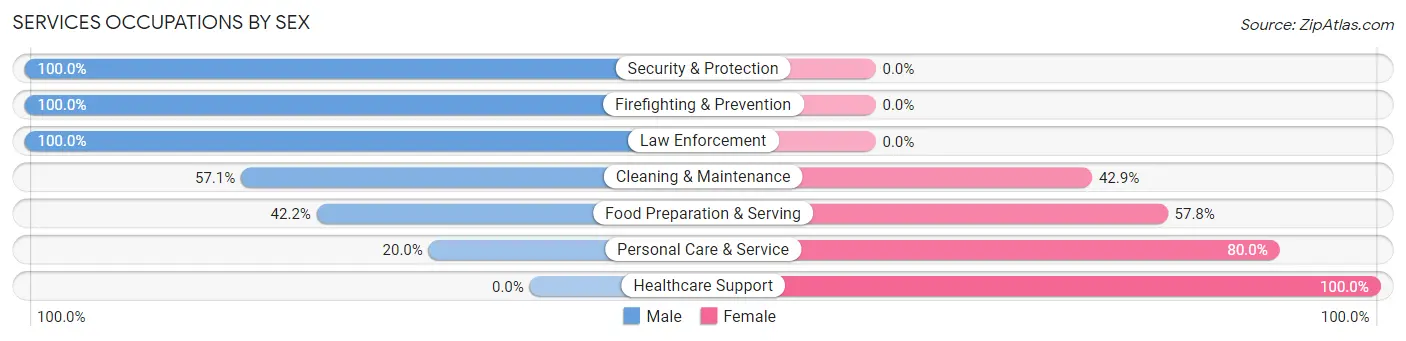
Services Occupations by Sex
Within the Services occupations in Makawao, the most male-oriented occupations are Security & Protection (100.0%), Firefighting & Prevention (100.0%), and Law Enforcement (100.0%), while the most female-oriented occupations are Healthcare Support (100.0%), Personal Care & Service (80.0%), and Food Preparation & Serving (57.8%).
| Occupation | Male | Female |
| Healthcare Support | 0 (0.0%) | 16 (100.0%) |
| Security & Protection | 93 (100.0%) | 0 (0.0%) |
| Firefighting & Prevention | 62 (100.0%) | 0 (0.0%) |
| Law Enforcement | 31 (100.0%) | 0 (0.0%) |
| Food Preparation & Serving | 183 (42.2%) | 251 (57.8%) |
| Cleaning & Maintenance | 92 (57.1%) | 69 (42.9%) |
| Personal Care & Service | 9 (20.0%) | 36 (80.0%) |
| Total (Category) | 377 (50.3%) | 372 (49.7%) |
| Total (Overall) | 1,753 (48.1%) | 1,893 (51.9%) |
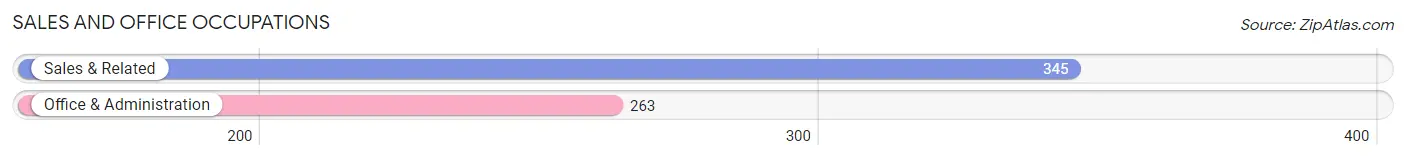
Sales and Office Occupations
The most common Sales and Office occupations in Makawao are Sales & Related (345 | 9.5%), and Office & Administration (263 | 7.2%).
Sales and Office Occupations by Sex
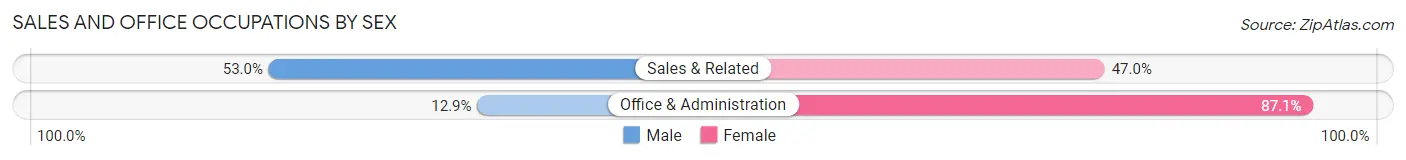
| Occupation | Male | Female |
| Sales & Related | 183 (53.0%) | 162 (47.0%) |
| Office & Administration | 34 (12.9%) | 229 (87.1%) |
| Total (Category) | 217 (35.7%) | 391 (64.3%) |
| Total (Overall) | 1,753 (48.1%) | 1,893 (51.9%) |
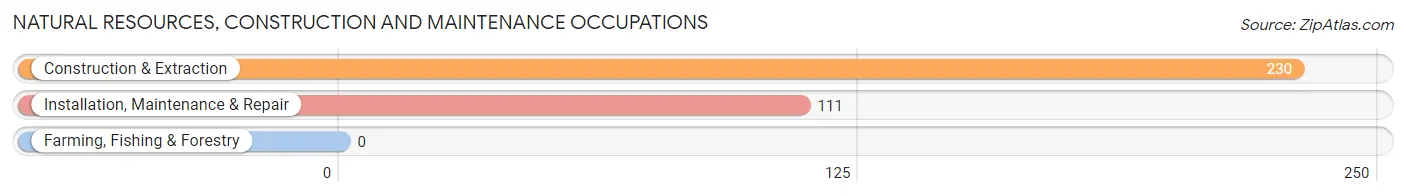
Natural Resources, Construction and Maintenance Occupations
The most common Natural Resources, Construction and Maintenance occupations in Makawao are Construction & Extraction (230 | 6.3%), and Installation, Maintenance & Repair (111 | 3.0%).
Natural Resources, Construction and Maintenance Occupations by Sex
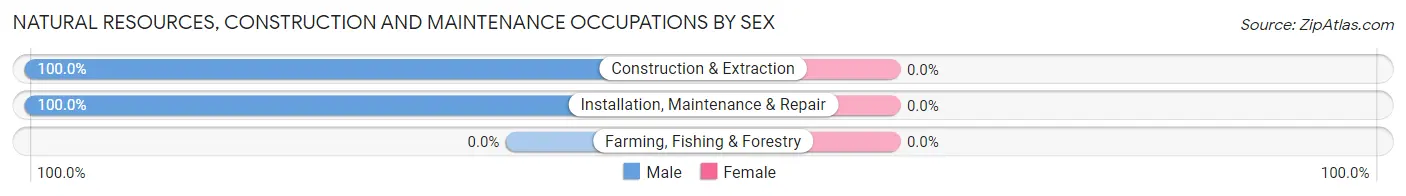
| Occupation | Male | Female |
| Farming, Fishing & Forestry | 0 (0.0%) | 0 (0.0%) |
| Construction & Extraction | 230 (100.0%) | 0 (0.0%) |
| Installation, Maintenance & Repair | 111 (100.0%) | 0 (0.0%) |
| Total (Category) | 341 (100.0%) | 0 (0.0%) |
| Total (Overall) | 1,753 (48.1%) | 1,893 (51.9%) |
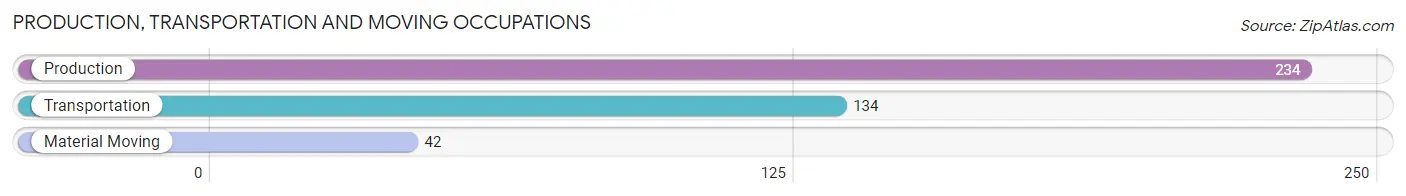
Production, Transportation and Moving Occupations
The most common Production, Transportation and Moving occupations in Makawao are Production (234 | 6.4%), Transportation (134 | 3.7%), and Material Moving (42 | 1.1%).
Production, Transportation and Moving Occupations by Sex
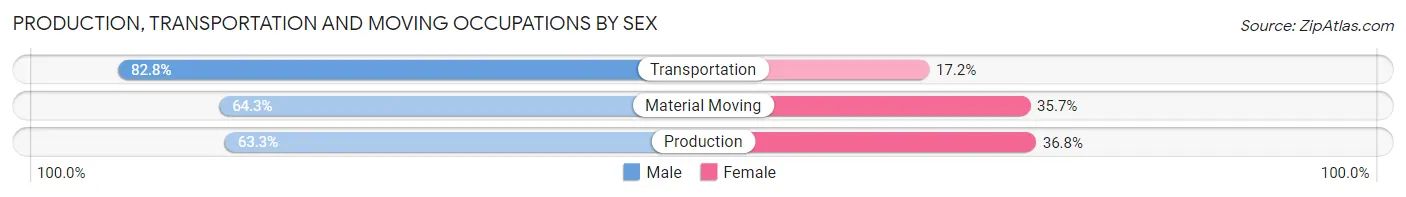
| Occupation | Male | Female |
| Production | 148 (63.2%) | 86 (36.7%) |
| Transportation | 111 (82.8%) | 23 (17.2%) |
| Material Moving | 27 (64.3%) | 15 (35.7%) |
| Total (Category) | 286 (69.8%) | 124 (30.2%) |
| Total (Overall) | 1,753 (48.1%) | 1,893 (51.9%) |
Employment Industries by Sex in Makawao
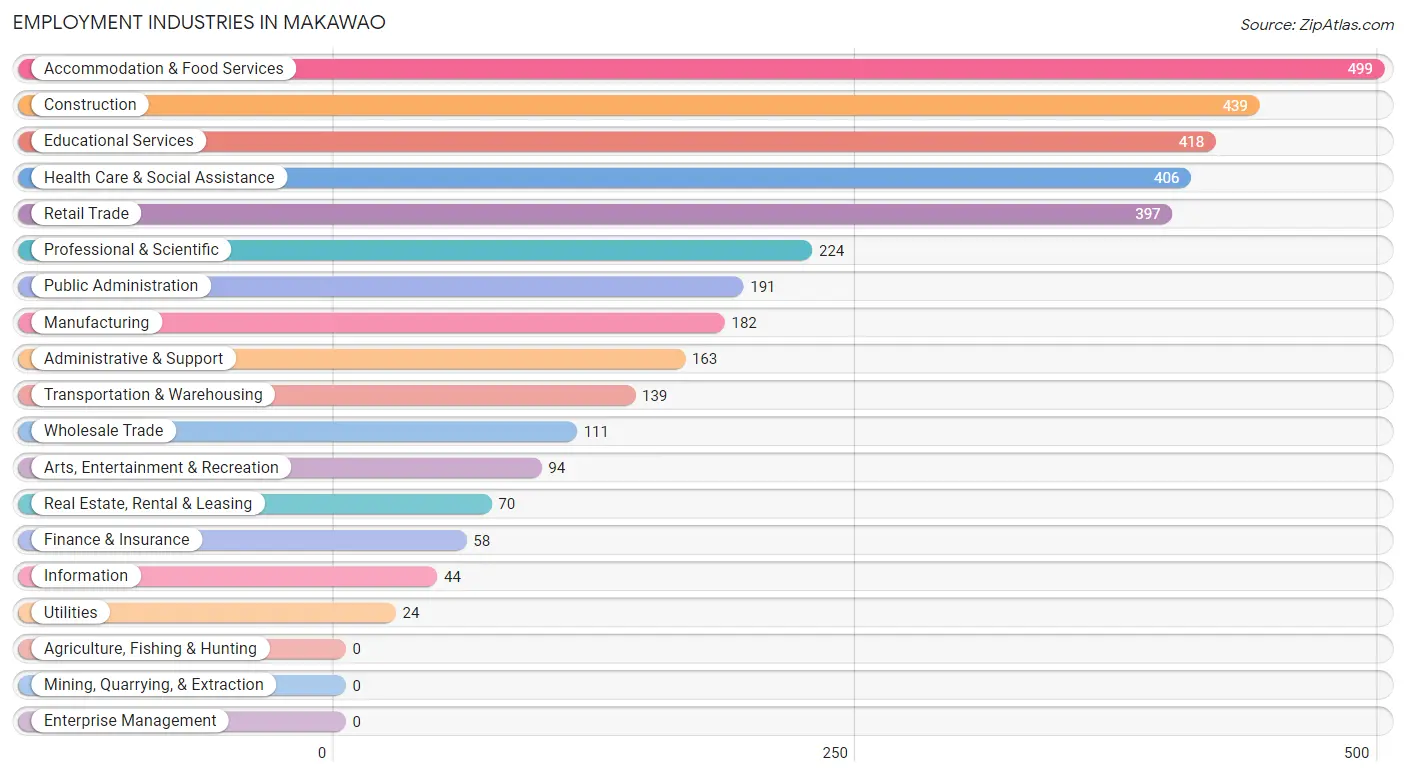
Employment Industries in Makawao
The major employment industries in Makawao include Accommodation & Food Services (499 | 13.7%), Construction (439 | 12.0%), Educational Services (418 | 11.5%), Health Care & Social Assistance (406 | 11.1%), and Retail Trade (397 | 10.9%).
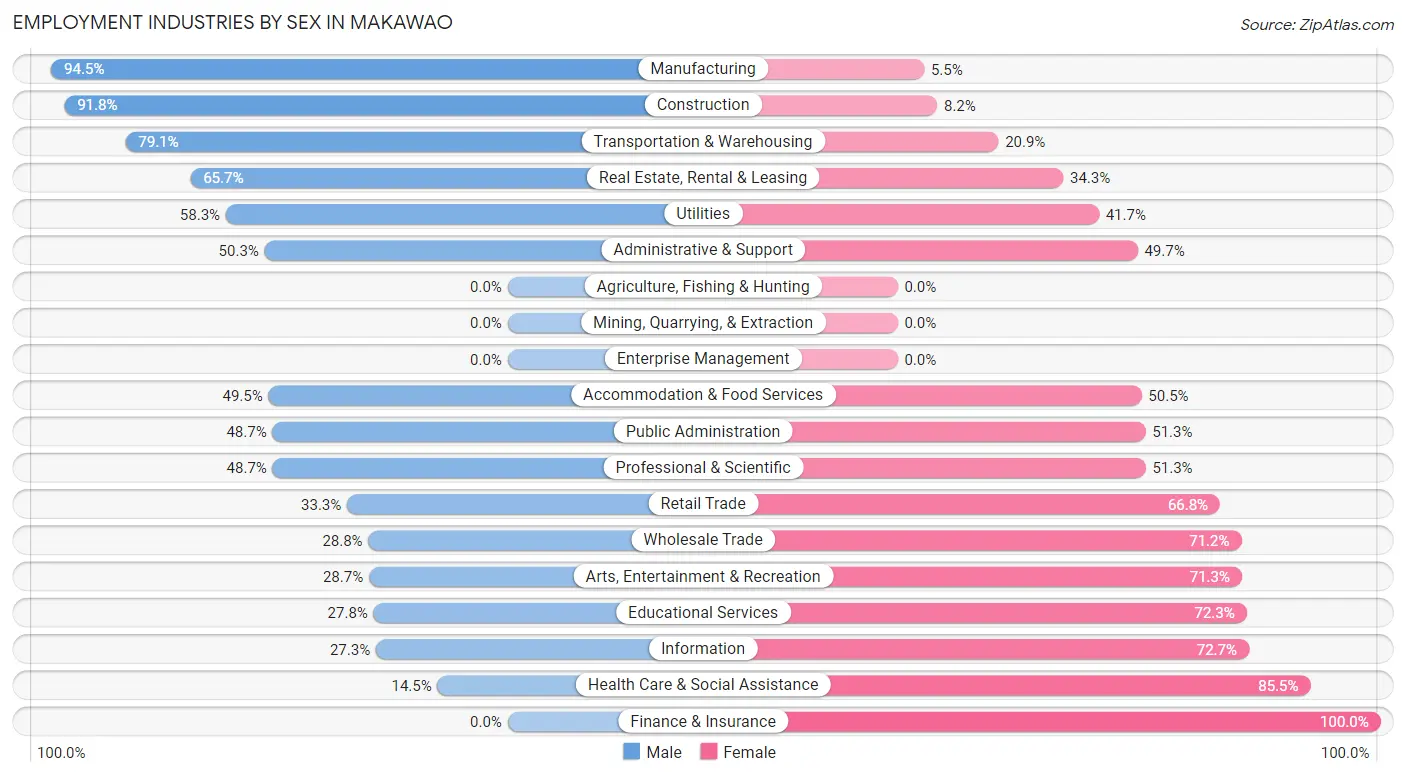
Employment Industries by Sex in Makawao
The Makawao industries that see more men than women are Manufacturing (94.5%), Construction (91.8%), and Transportation & Warehousing (79.1%), whereas the industries that tend to have a higher number of women are Finance & Insurance (100.0%), Health Care & Social Assistance (85.5%), and Information (72.7%).
| Industry | Male | Female |
| Agriculture, Fishing & Hunting | 0 (0.0%) | 0 (0.0%) |
| Mining, Quarrying, & Extraction | 0 (0.0%) | 0 (0.0%) |
| Construction | 403 (91.8%) | 36 (8.2%) |
| Manufacturing | 172 (94.5%) | 10 (5.5%) |
| Wholesale Trade | 32 (28.8%) | 79 (71.2%) |
| Retail Trade | 132 (33.3%) | 265 (66.7%) |
| Transportation & Warehousing | 110 (79.1%) | 29 (20.9%) |
| Utilities | 14 (58.3%) | 10 (41.7%) |
| Information | 12 (27.3%) | 32 (72.7%) |
| Finance & Insurance | 0 (0.0%) | 58 (100.0%) |
| Real Estate, Rental & Leasing | 46 (65.7%) | 24 (34.3%) |
| Professional & Scientific | 109 (48.7%) | 115 (51.3%) |
| Enterprise Management | 0 (0.0%) | 0 (0.0%) |
| Administrative & Support | 82 (50.3%) | 81 (49.7%) |
| Educational Services | 116 (27.8%) | 302 (72.3%) |
| Health Care & Social Assistance | 59 (14.5%) | 347 (85.5%) |
| Arts, Entertainment & Recreation | 27 (28.7%) | 67 (71.3%) |
| Accommodation & Food Services | 247 (49.5%) | 252 (50.5%) |
| Public Administration | 93 (48.7%) | 98 (51.3%) |
| Total | 1,753 (48.1%) | 1,893 (51.9%) |
Education in Makawao
School Enrollment in Makawao
The most common levels of schooling among the 1,456 students in Makawao are middle school (369 | 25.3%), elementary school (324 | 22.3%), and high school (307 | 21.1%).
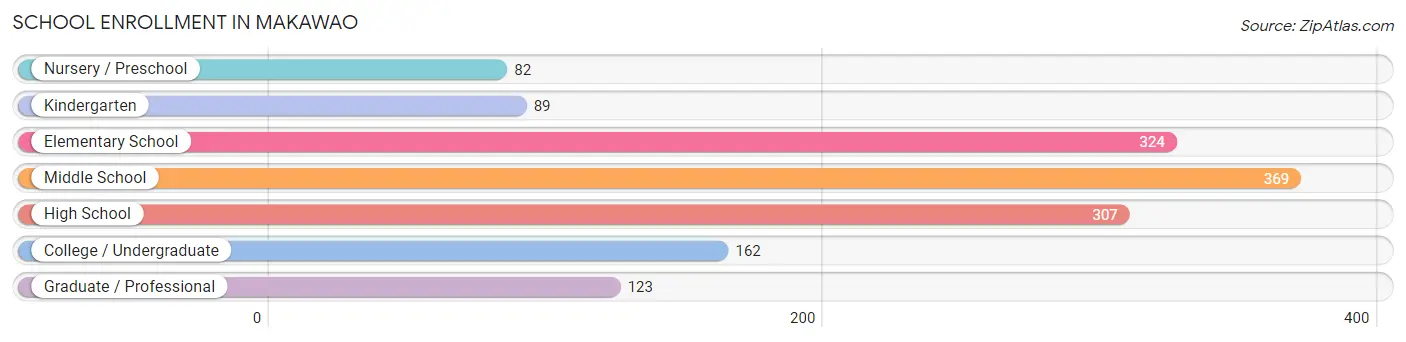
| School Level | # Students | % Students |
| Nursery / Preschool | 82 | 5.6% |
| Kindergarten | 89 | 6.1% |
| Elementary School | 324 | 22.3% |
| Middle School | 369 | 25.3% |
| High School | 307 | 21.1% |
| College / Undergraduate | 162 | 11.1% |
| Graduate / Professional | 123 | 8.5% |
| Total | 1,456 | 100.0% |
School Enrollment by Age by Funding Source in Makawao
Out of a total of 1,456 students who are enrolled in schools in Makawao, 376 (25.8%) attend a private institution, while the remaining 1,080 (74.2%) are enrolled in public schools. The age group of 35 years and over has the highest likelihood of being enrolled in private schools, with 84 (44.4% in the age bracket) enrolled. Conversely, the age group of 18 to 19 year olds has the lowest likelihood of being enrolled in a private school, with 10 (100.0% in the age bracket) attending a public institution.
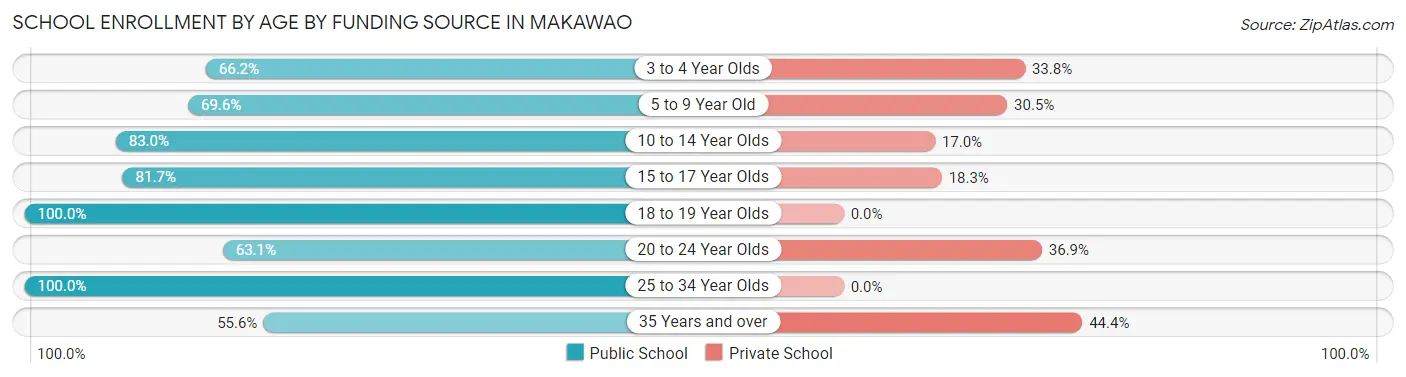
| Age Bracket | Public School | Private School |
| 3 to 4 Year Olds | 51 (66.2%) | 26 (33.8%) |
| 5 to 9 Year Old | 281 (69.6%) | 123 (30.4%) |
| 10 to 14 Year Olds | 376 (83.0%) | 77 (17.0%) |
| 15 to 17 Year Olds | 188 (81.7%) | 42 (18.3%) |
| 18 to 19 Year Olds | 10 (100.0%) | 0 (0.0%) |
| 20 to 24 Year Olds | 41 (63.1%) | 24 (36.9%) |
| 25 to 34 Year Olds | 28 (100.0%) | 0 (0.0%) |
| 35 Years and over | 105 (55.6%) | 84 (44.4%) |
| Total | 1,080 (74.2%) | 376 (25.8%) |
Educational Attainment by Field of Study in Makawao
Business (370 | 20.6%), education (230 | 12.8%), visual & performing arts (197 | 11.0%), bio, nature & agricultural (164 | 9.1%), and science & technology (160 | 8.9%) are the most common fields of study among 1,797 individuals in Makawao who have obtained a bachelor's degree or higher.
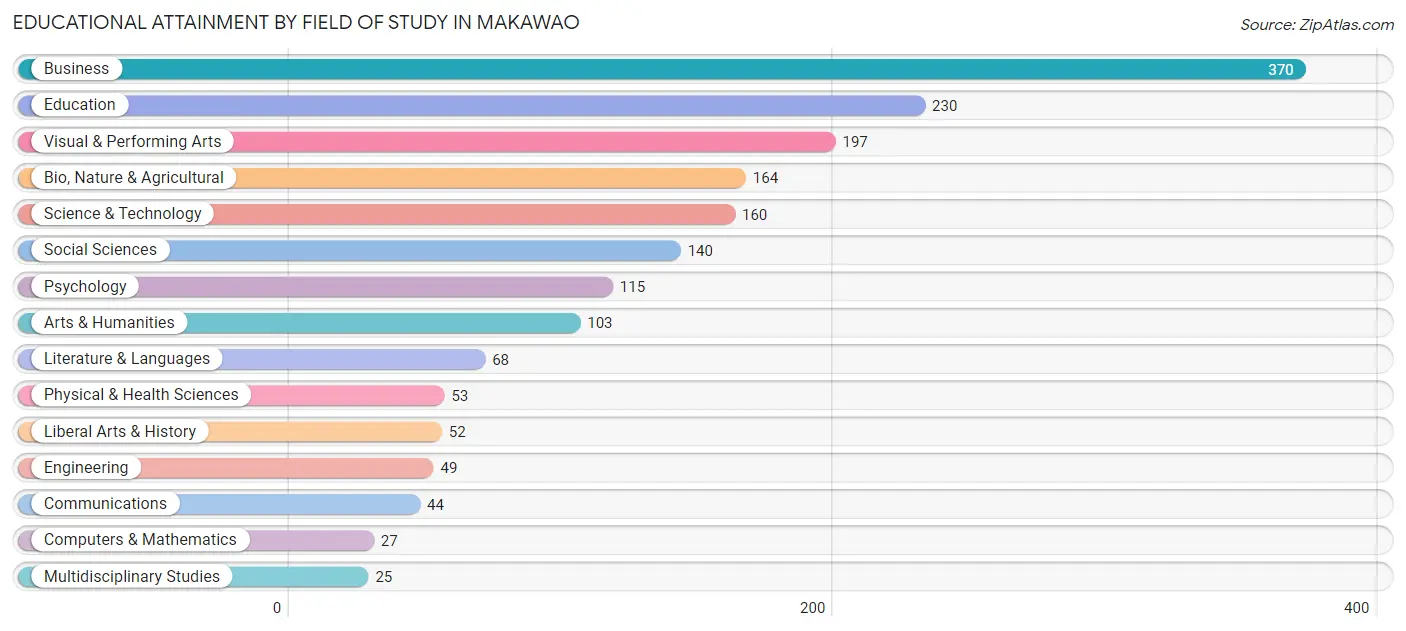
| Field of Study | # Graduates | % Graduates |
| Computers & Mathematics | 27 | 1.5% |
| Bio, Nature & Agricultural | 164 | 9.1% |
| Physical & Health Sciences | 53 | 2.9% |
| Psychology | 115 | 6.4% |
| Social Sciences | 140 | 7.8% |
| Engineering | 49 | 2.7% |
| Multidisciplinary Studies | 25 | 1.4% |
| Science & Technology | 160 | 8.9% |
| Business | 370 | 20.6% |
| Education | 230 | 12.8% |
| Literature & Languages | 68 | 3.8% |
| Liberal Arts & History | 52 | 2.9% |
| Visual & Performing Arts | 197 | 11.0% |
| Communications | 44 | 2.5% |
| Arts & Humanities | 103 | 5.7% |
| Total | 1,797 | 100.0% |
Transportation & Commute in Makawao
Vehicle Availability by Sex in Makawao
The most prevalent vehicle ownership categories in Makawao are males with 2 vehicles (581, accounting for 34.1%) and females with 2 vehicles (499, making up 32.3%).
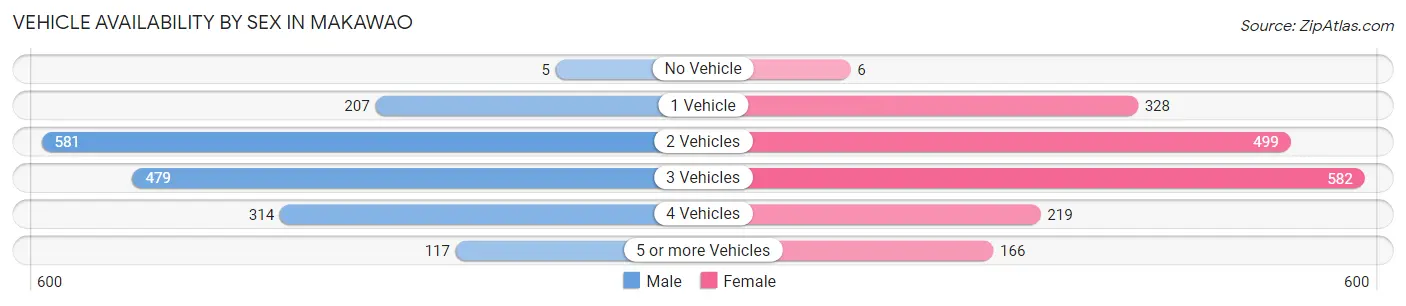
| Vehicles Available | Male | Female |
| No Vehicle | 5 (0.3%) | 6 (0.3%) |
| 1 Vehicle | 207 (12.2%) | 328 (18.2%) |
| 2 Vehicles | 581 (34.1%) | 499 (27.7%) |
| 3 Vehicles | 479 (28.1%) | 582 (32.3%) |
| 4 Vehicles | 314 (18.4%) | 219 (12.2%) |
| 5 or more Vehicles | 117 (6.9%) | 166 (9.2%) |
| Total | 1,703 (100.0%) | 1,800 (100.0%) |
Commute Time in Makawao
The most frequently occuring commute durations in Makawao are 30 to 34 minutes (907 commuters, 29.1%), 20 to 24 minutes (341 commuters, 11.0%), and 10 to 14 minutes (282 commuters, 9.1%).
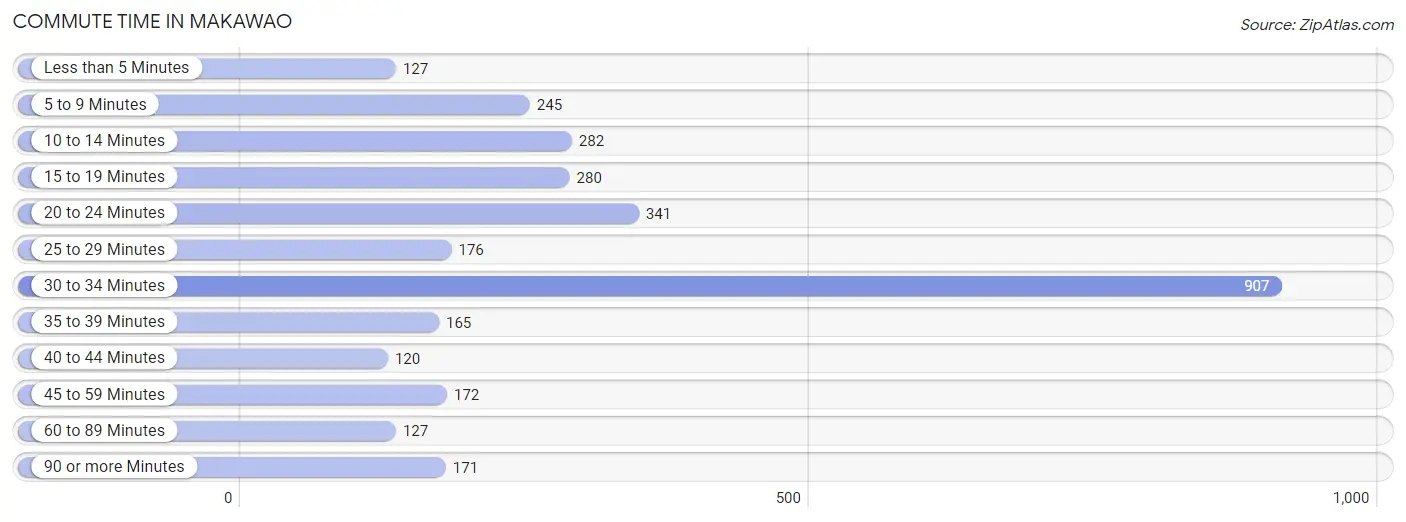
| Commute Time | # Commuters | % Commuters |
| Less than 5 Minutes | 127 | 4.1% |
| 5 to 9 Minutes | 245 | 7.9% |
| 10 to 14 Minutes | 282 | 9.1% |
| 15 to 19 Minutes | 280 | 9.0% |
| 20 to 24 Minutes | 341 | 11.0% |
| 25 to 29 Minutes | 176 | 5.7% |
| 30 to 34 Minutes | 907 | 29.1% |
| 35 to 39 Minutes | 165 | 5.3% |
| 40 to 44 Minutes | 120 | 3.8% |
| 45 to 59 Minutes | 172 | 5.5% |
| 60 to 89 Minutes | 127 | 4.1% |
| 90 or more Minutes | 171 | 5.5% |
Commute Time by Sex in Makawao
The most common commute times in Makawao are 30 to 34 minutes (458 commuters, 29.8%) for males and 30 to 34 minutes (449 commuters, 28.4%) for females.
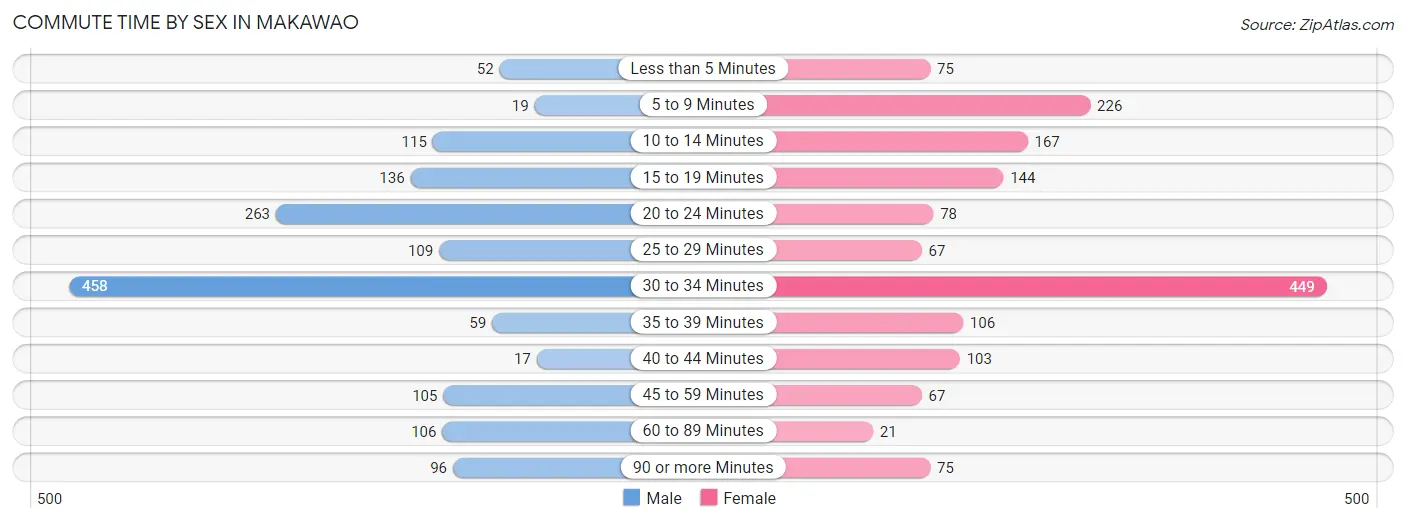
| Commute Time | Male | Female |
| Less than 5 Minutes | 52 (3.4%) | 75 (4.8%) |
| 5 to 9 Minutes | 19 (1.2%) | 226 (14.3%) |
| 10 to 14 Minutes | 115 (7.5%) | 167 (10.6%) |
| 15 to 19 Minutes | 136 (8.9%) | 144 (9.1%) |
| 20 to 24 Minutes | 263 (17.1%) | 78 (4.9%) |
| 25 to 29 Minutes | 109 (7.1%) | 67 (4.3%) |
| 30 to 34 Minutes | 458 (29.8%) | 449 (28.4%) |
| 35 to 39 Minutes | 59 (3.8%) | 106 (6.7%) |
| 40 to 44 Minutes | 17 (1.1%) | 103 (6.5%) |
| 45 to 59 Minutes | 105 (6.8%) | 67 (4.3%) |
| 60 to 89 Minutes | 106 (6.9%) | 21 (1.3%) |
| 90 or more Minutes | 96 (6.2%) | 75 (4.8%) |
Time of Departure to Work by Sex in Makawao
The most frequent times of departure to work in Makawao are 7:00 AM to 7:29 AM (280, 18.2%) for males and 7:00 AM to 7:29 AM (290, 18.4%) for females.
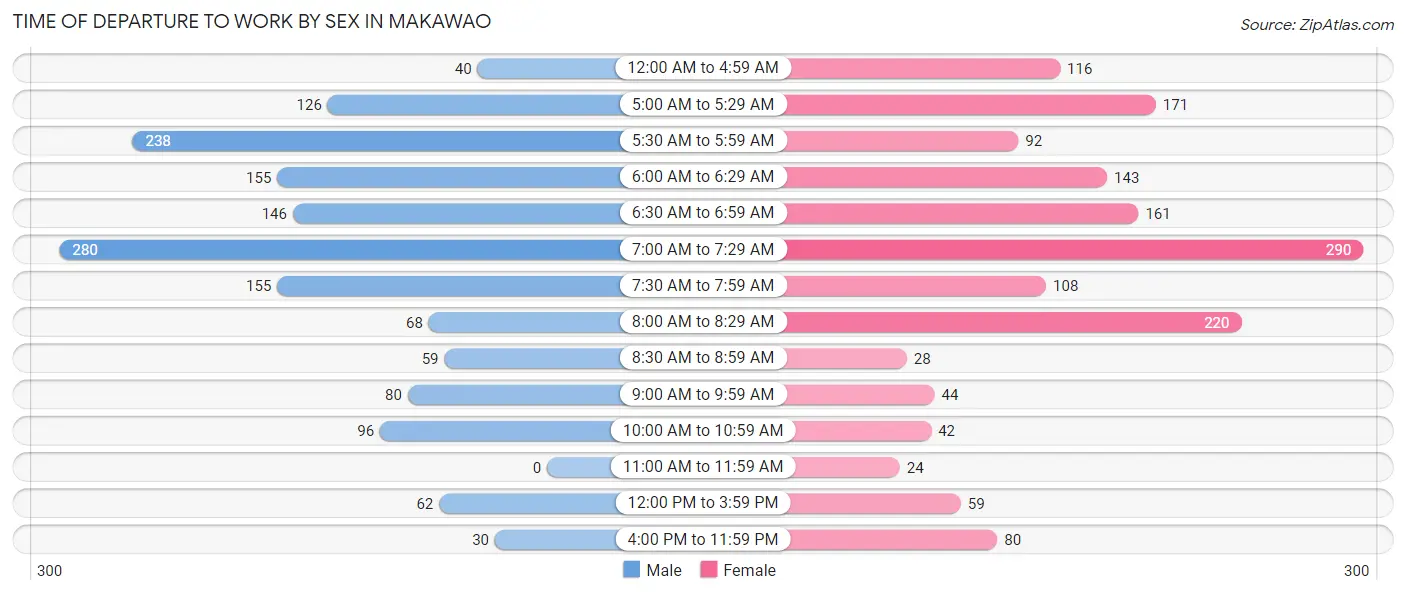
| Time of Departure | Male | Female |
| 12:00 AM to 4:59 AM | 40 (2.6%) | 116 (7.3%) |
| 5:00 AM to 5:29 AM | 126 (8.2%) | 171 (10.8%) |
| 5:30 AM to 5:59 AM | 238 (15.5%) | 92 (5.8%) |
| 6:00 AM to 6:29 AM | 155 (10.1%) | 143 (9.1%) |
| 6:30 AM to 6:59 AM | 146 (9.5%) | 161 (10.2%) |
| 7:00 AM to 7:29 AM | 280 (18.2%) | 290 (18.4%) |
| 7:30 AM to 7:59 AM | 155 (10.1%) | 108 (6.8%) |
| 8:00 AM to 8:29 AM | 68 (4.4%) | 220 (13.9%) |
| 8:30 AM to 8:59 AM | 59 (3.8%) | 28 (1.8%) |
| 9:00 AM to 9:59 AM | 80 (5.2%) | 44 (2.8%) |
| 10:00 AM to 10:59 AM | 96 (6.2%) | 42 (2.7%) |
| 11:00 AM to 11:59 AM | 0 (0.0%) | 24 (1.5%) |
| 12:00 PM to 3:59 PM | 62 (4.0%) | 59 (3.7%) |
| 4:00 PM to 11:59 PM | 30 (1.9%) | 80 (5.1%) |
| Total | 1,535 (100.0%) | 1,578 (100.0%) |
Housing Occupancy in Makawao
Occupancy by Ownership in Makawao
Of the total 2,668 dwellings in Makawao, owner-occupied units account for 1,878 (70.4%), while renter-occupied units make up 790 (29.6%).
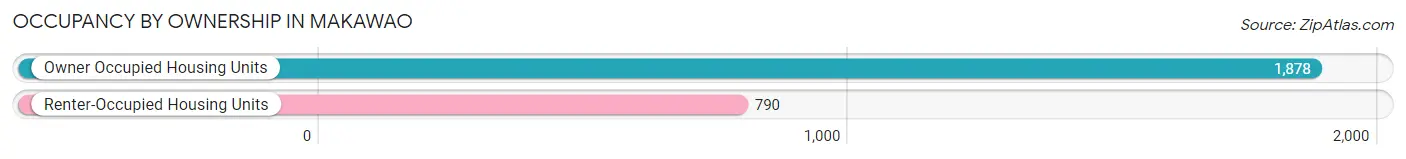
| Occupancy | # Housing Units | % Housing Units |
| Owner Occupied Housing Units | 1,878 | 70.4% |
| Renter-Occupied Housing Units | 790 | 29.6% |
| Total Occupied Housing Units | 2,668 | 100.0% |
Occupancy by Household Size in Makawao
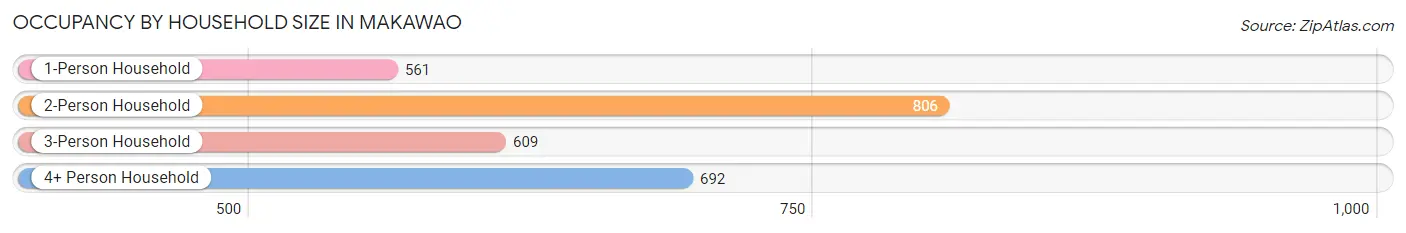
| Household Size | # Housing Units | % Housing Units |
| 1-Person Household | 561 | 21.0% |
| 2-Person Household | 806 | 30.2% |
| 3-Person Household | 609 | 22.8% |
| 4+ Person Household | 692 | 25.9% |
| Total Housing Units | 2,668 | 100.0% |
Occupancy by Ownership by Household Size in Makawao
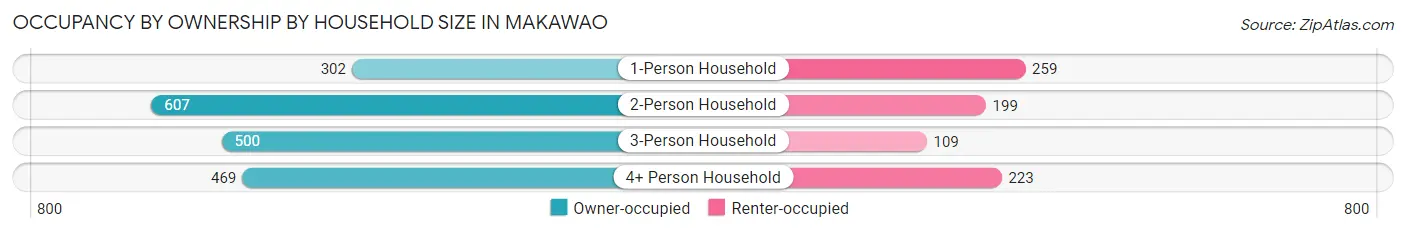
| Household Size | Owner-occupied | Renter-occupied |
| 1-Person Household | 302 (53.8%) | 259 (46.2%) |
| 2-Person Household | 607 (75.3%) | 199 (24.7%) |
| 3-Person Household | 500 (82.1%) | 109 (17.9%) |
| 4+ Person Household | 469 (67.8%) | 223 (32.2%) |
| Total Housing Units | 1,878 (70.4%) | 790 (29.6%) |
Occupancy by Educational Attainment in Makawao
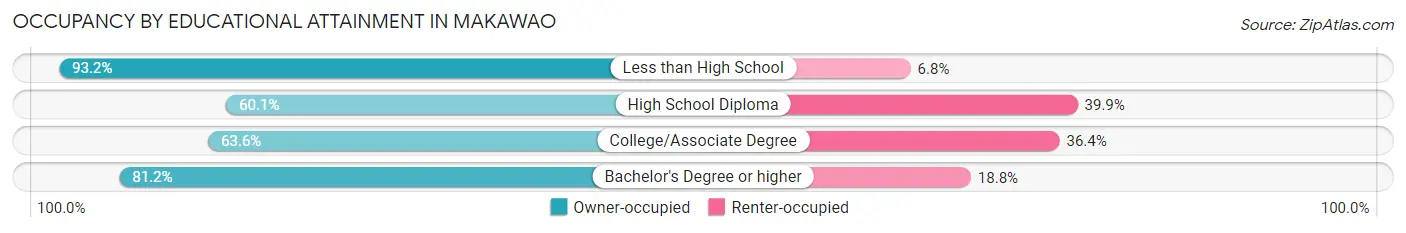
| Household Size | Owner-occupied | Renter-occupied |
| Less than High School | 109 (93.2%) | 8 (6.8%) |
| High School Diploma | 415 (60.1%) | 276 (39.9%) |
| College/Associate Degree | 567 (63.6%) | 324 (36.4%) |
| Bachelor's Degree or higher | 787 (81.2%) | 182 (18.8%) |
Occupancy by Age of Householder in Makawao
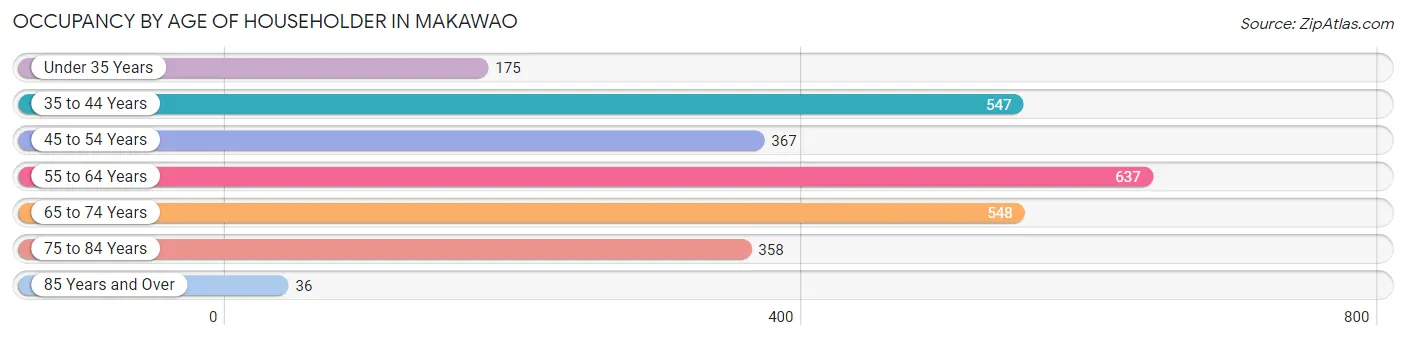
| Age Bracket | # Households | % Households |
| Under 35 Years | 175 | 6.6% |
| 35 to 44 Years | 547 | 20.5% |
| 45 to 54 Years | 367 | 13.8% |
| 55 to 64 Years | 637 | 23.9% |
| 65 to 74 Years | 548 | 20.5% |
| 75 to 84 Years | 358 | 13.4% |
| 85 Years and Over | 36 | 1.3% |
| Total | 2,668 | 100.0% |
Housing Finances in Makawao
Median Income by Occupancy in Makawao
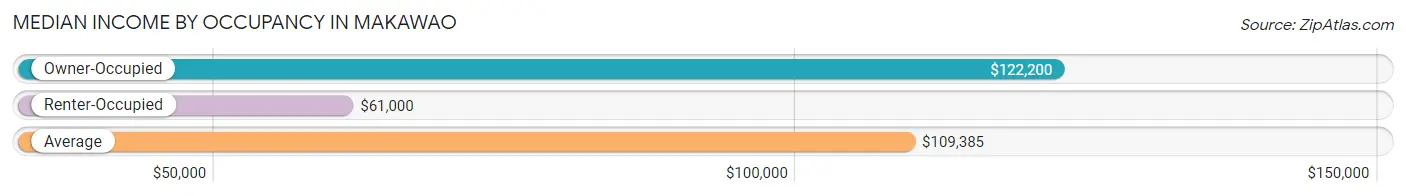
| Occupancy Type | # Households | Median Income |
| Owner-Occupied | 1,878 (70.4%) | $122,200 |
| Renter-Occupied | 790 (29.6%) | $61,000 |
| Average | 2,668 (100.0%) | $109,385 |
Occupancy by Householder Income Bracket in Makawao
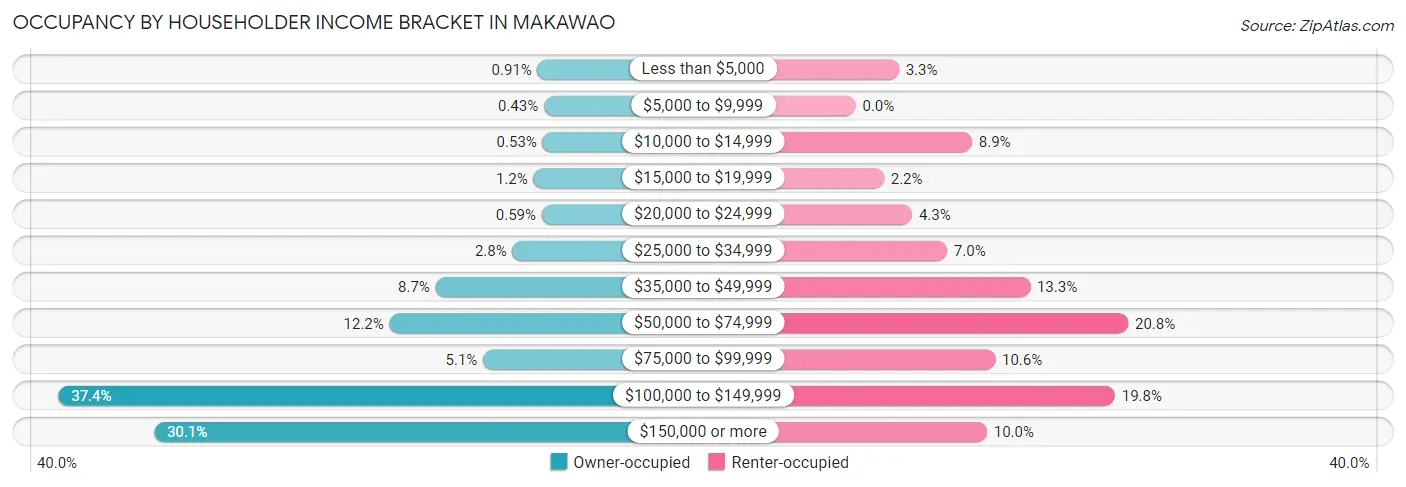
| Income Bracket | Owner-occupied | Renter-occupied |
| Less than $5,000 | 17 (0.9%) | 26 (3.3%) |
| $5,000 to $9,999 | 8 (0.4%) | 0 (0.0%) |
| $10,000 to $14,999 | 10 (0.5%) | 70 (8.9%) |
| $15,000 to $19,999 | 23 (1.2%) | 17 (2.1%) |
| $20,000 to $24,999 | 11 (0.6%) | 34 (4.3%) |
| $25,000 to $34,999 | 53 (2.8%) | 55 (7.0%) |
| $35,000 to $49,999 | 163 (8.7%) | 105 (13.3%) |
| $50,000 to $74,999 | 229 (12.2%) | 164 (20.8%) |
| $75,000 to $99,999 | 95 (5.1%) | 84 (10.6%) |
| $100,000 to $149,999 | 703 (37.4%) | 156 (19.8%) |
| $150,000 or more | 566 (30.1%) | 79 (10.0%) |
| Total | 1,878 (100.0%) | 790 (100.0%) |
Monthly Housing Cost Tiers in Makawao
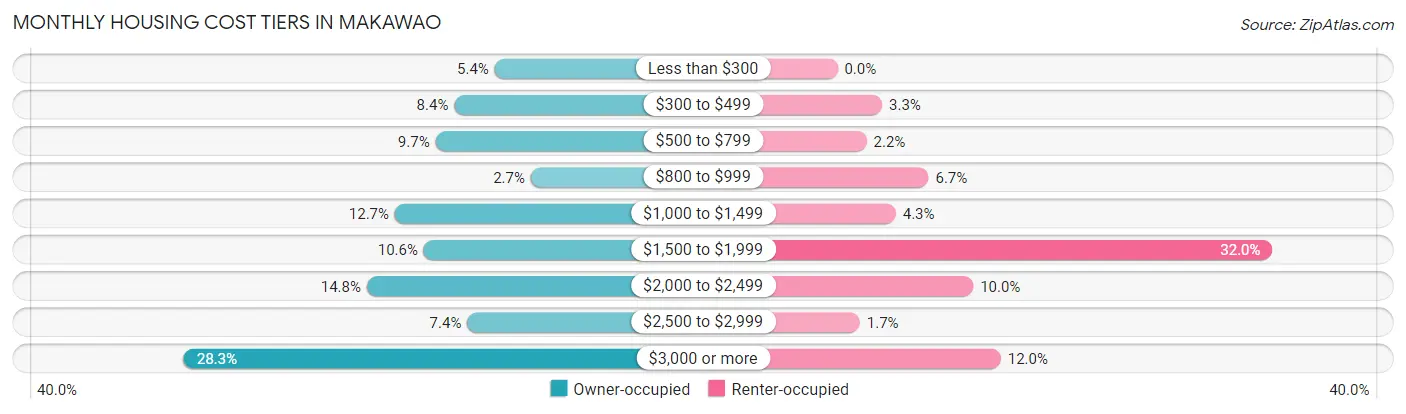
| Monthly Cost | Owner-occupied | Renter-occupied |
| Less than $300 | 101 (5.4%) | 0 (0.0%) |
| $300 to $499 | 157 (8.4%) | 26 (3.3%) |
| $500 to $799 | 183 (9.7%) | 17 (2.1%) |
| $800 to $999 | 51 (2.7%) | 53 (6.7%) |
| $1,000 to $1,499 | 239 (12.7%) | 34 (4.3%) |
| $1,500 to $1,999 | 199 (10.6%) | 253 (32.0%) |
| $2,000 to $2,499 | 278 (14.8%) | 79 (10.0%) |
| $2,500 to $2,999 | 139 (7.4%) | 13 (1.7%) |
| $3,000 or more | 531 (28.3%) | 95 (12.0%) |
| Total | 1,878 (100.0%) | 790 (100.0%) |
Physical Housing Characteristics in Makawao
Housing Structures in Makawao
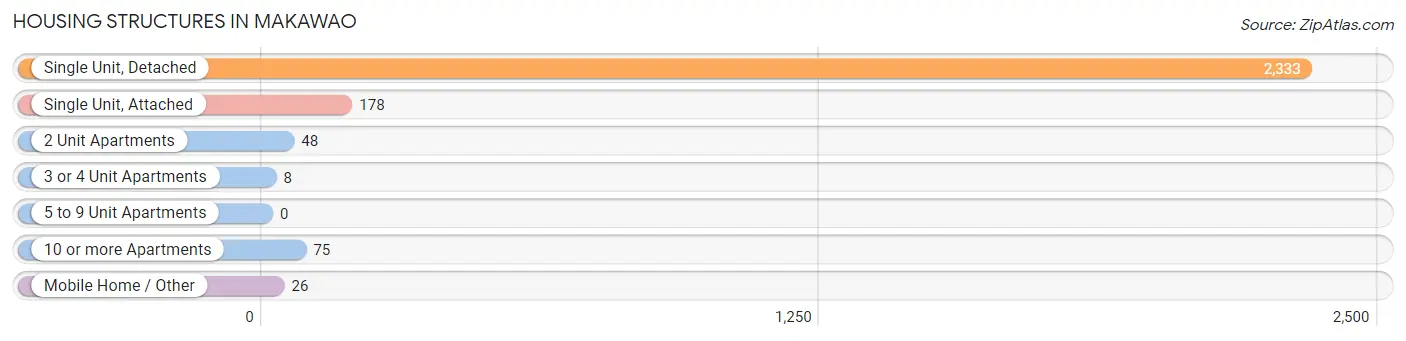
| Structure Type | # Housing Units | % Housing Units |
| Single Unit, Detached | 2,333 | 87.4% |
| Single Unit, Attached | 178 | 6.7% |
| 2 Unit Apartments | 48 | 1.8% |
| 3 or 4 Unit Apartments | 8 | 0.3% |
| 5 to 9 Unit Apartments | 0 | 0.0% |
| 10 or more Apartments | 75 | 2.8% |
| Mobile Home / Other | 26 | 1.0% |
| Total | 2,668 | 100.0% |
Housing Structures by Occupancy in Makawao
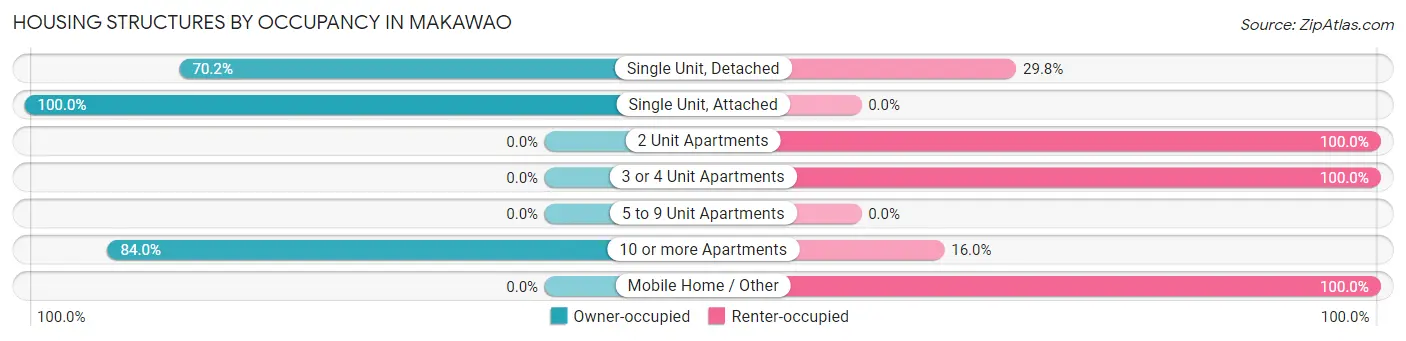
| Structure Type | Owner-occupied | Renter-occupied |
| Single Unit, Detached | 1,637 (70.2%) | 696 (29.8%) |
| Single Unit, Attached | 178 (100.0%) | 0 (0.0%) |
| 2 Unit Apartments | 0 (0.0%) | 48 (100.0%) |
| 3 or 4 Unit Apartments | 0 (0.0%) | 8 (100.0%) |
| 5 to 9 Unit Apartments | 0 (0.0%) | 0 (0.0%) |
| 10 or more Apartments | 63 (84.0%) | 12 (16.0%) |
| Mobile Home / Other | 0 (0.0%) | 26 (100.0%) |
| Total | 1,878 (70.4%) | 790 (29.6%) |
Housing Structures by Number of Rooms in Makawao
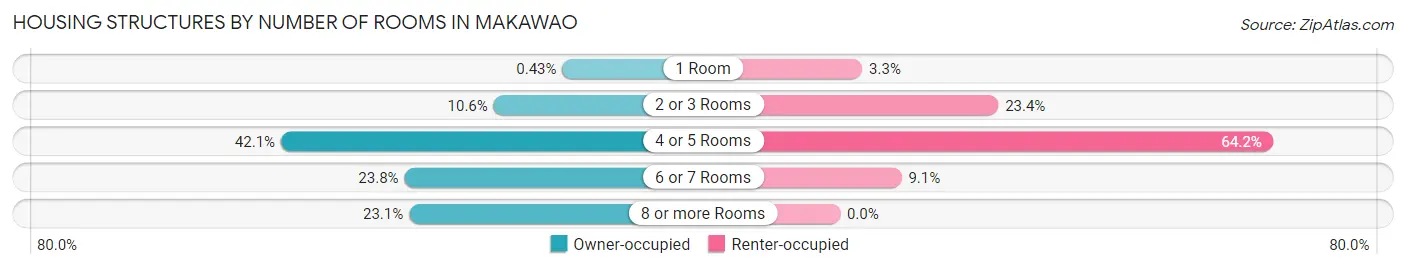
| Number of Rooms | Owner-occupied | Renter-occupied |
| 1 Room | 8 (0.4%) | 26 (3.3%) |
| 2 or 3 Rooms | 199 (10.6%) | 185 (23.4%) |
| 4 or 5 Rooms | 790 (42.1%) | 507 (64.2%) |
| 6 or 7 Rooms | 447 (23.8%) | 72 (9.1%) |
| 8 or more Rooms | 434 (23.1%) | 0 (0.0%) |
| Total | 1,878 (100.0%) | 790 (100.0%) |
Housing Structure by Heating Type in Makawao
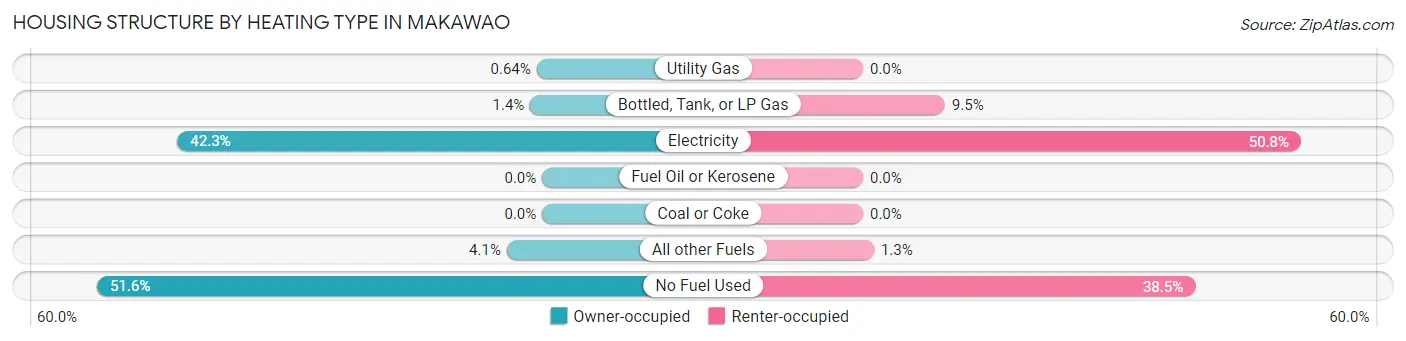
| Heating Type | Owner-occupied | Renter-occupied |
| Utility Gas | 12 (0.6%) | 0 (0.0%) |
| Bottled, Tank, or LP Gas | 26 (1.4%) | 75 (9.5%) |
| Electricity | 794 (42.3%) | 401 (50.8%) |
| Fuel Oil or Kerosene | 0 (0.0%) | 0 (0.0%) |
| Coal or Coke | 0 (0.0%) | 0 (0.0%) |
| All other Fuels | 77 (4.1%) | 10 (1.3%) |
| No Fuel Used | 969 (51.6%) | 304 (38.5%) |
| Total | 1,878 (100.0%) | 790 (100.0%) |
Household Vehicle Usage in Makawao
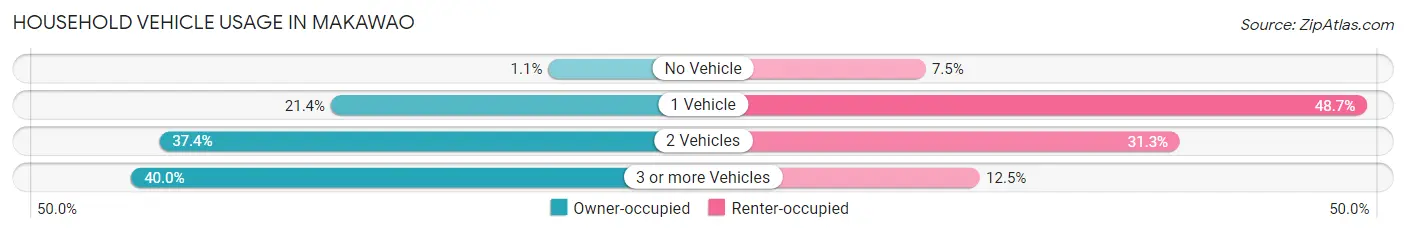
| Vehicles per Household | Owner-occupied | Renter-occupied |
| No Vehicle | 21 (1.1%) | 59 (7.5%) |
| 1 Vehicle | 402 (21.4%) | 385 (48.7%) |
| 2 Vehicles | 703 (37.4%) | 247 (31.3%) |
| 3 or more Vehicles | 752 (40.0%) | 99 (12.5%) |
| Total | 1,878 (100.0%) | 790 (100.0%) |
Real Estate & Mortgages in Makawao
Real Estate and Mortgage Overview in Makawao
| Characteristic | Without Mortgage | With Mortgage |
| Housing Units | 458 | 1,420 |
| Median Property Value | $692,300 | $783,600 |
| Median Household Income | $97,292 | $457 |
| Monthly Housing Costs | $459 | $531 |
| Real Estate Taxes | $1,301 | $11 |
Property Value by Mortgage Status in Makawao
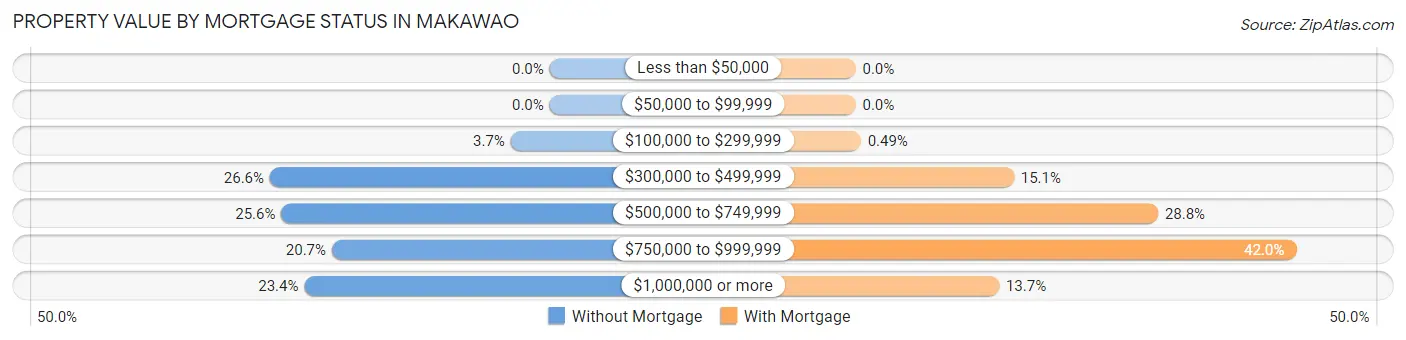
| Property Value | Without Mortgage | With Mortgage |
| Less than $50,000 | 0 (0.0%) | 0 (0.0%) |
| $50,000 to $99,999 | 0 (0.0%) | 0 (0.0%) |
| $100,000 to $299,999 | 17 (3.7%) | 7 (0.5%) |
| $300,000 to $499,999 | 122 (26.6%) | 214 (15.1%) |
| $500,000 to $749,999 | 117 (25.6%) | 409 (28.8%) |
| $750,000 to $999,999 | 95 (20.7%) | 596 (42.0%) |
| $1,000,000 or more | 107 (23.4%) | 194 (13.7%) |
| Total | 458 (100.0%) | 1,420 (100.0%) |
Household Income by Mortgage Status in Makawao
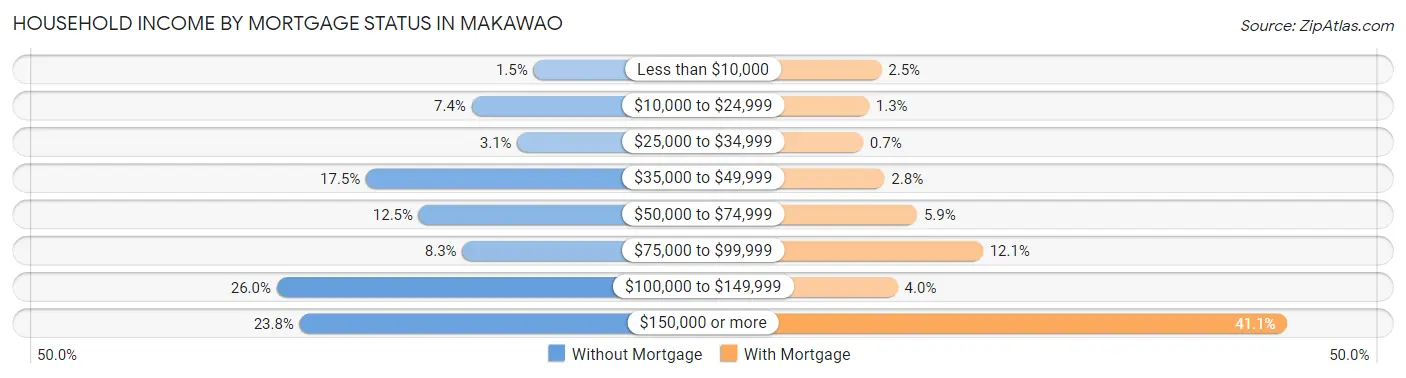
| Household Income | Without Mortgage | With Mortgage |
| Less than $10,000 | 7 (1.5%) | 35 (2.5%) |
| $10,000 to $24,999 | 34 (7.4%) | 18 (1.3%) |
| $25,000 to $34,999 | 14 (3.1%) | 10 (0.7%) |
| $35,000 to $49,999 | 80 (17.5%) | 39 (2.8%) |
| $50,000 to $74,999 | 57 (12.4%) | 83 (5.9%) |
| $75,000 to $99,999 | 38 (8.3%) | 172 (12.1%) |
| $100,000 to $149,999 | 119 (26.0%) | 57 (4.0%) |
| $150,000 or more | 109 (23.8%) | 584 (41.1%) |
| Total | 458 (100.0%) | 1,420 (100.0%) |
Property Value to Household Income Ratio in Makawao
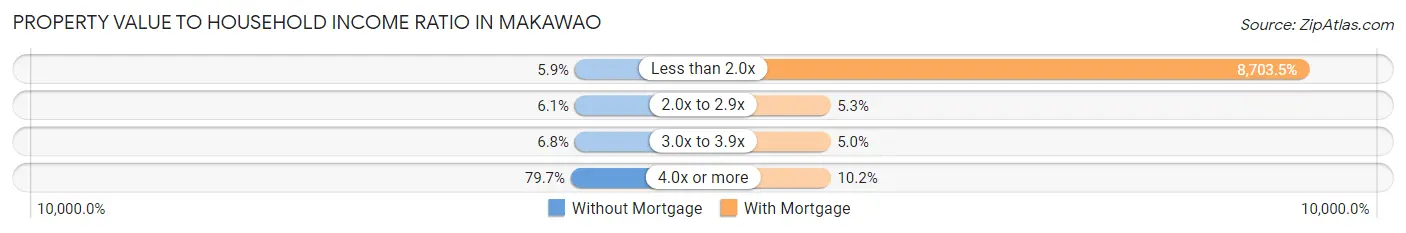
| Value-to-Income Ratio | Without Mortgage | With Mortgage |
| Less than 2.0x | 27 (5.9%) | 123,589 (8,703.4%) |
| 2.0x to 2.9x | 28 (6.1%) | 75 (5.3%) |
| 3.0x to 3.9x | 31 (6.8%) | 71 (5.0%) |
| 4.0x or more | 365 (79.7%) | 145 (10.2%) |
| Total | 458 (100.0%) | 1,420 (100.0%) |
Real Estate Taxes by Mortgage Status in Makawao
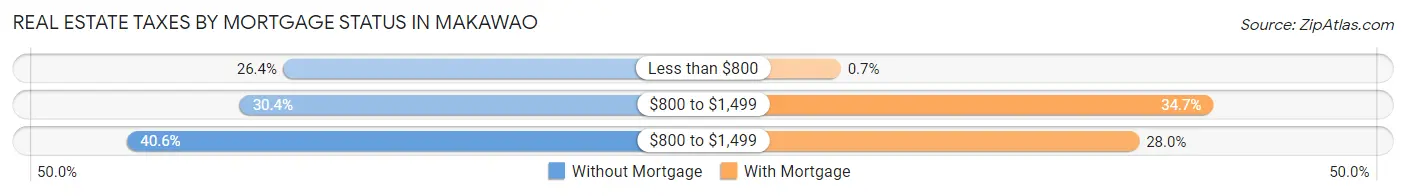
| Property Taxes | Without Mortgage | With Mortgage |
| Less than $800 | 121 (26.4%) | 10 (0.7%) |
| $800 to $1,499 | 139 (30.3%) | 493 (34.7%) |
| $800 to $1,499 | 186 (40.6%) | 397 (28.0%) |
| Total | 458 (100.0%) | 1,420 (100.0%) |
Health & Disability in Makawao
Health Insurance Coverage by Age in Makawao
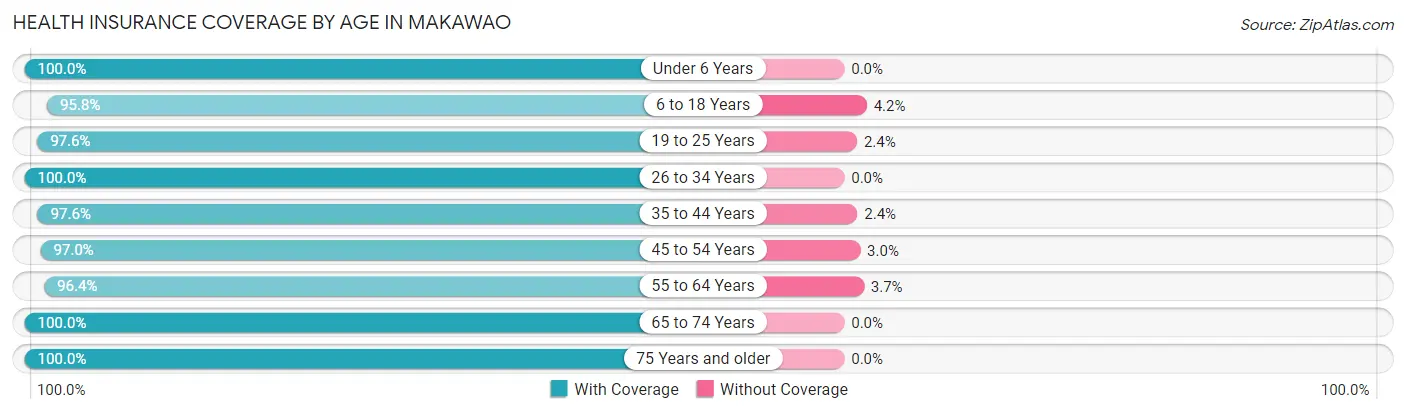
| Age Bracket | With Coverage | Without Coverage |
| Under 6 Years | 517 (100.0%) | 0 (0.0%) |
| 6 to 18 Years | 1,147 (95.8%) | 50 (4.2%) |
| 19 to 25 Years | 496 (97.6%) | 12 (2.4%) |
| 26 to 34 Years | 605 (100.0%) | 0 (0.0%) |
| 35 to 44 Years | 1,120 (97.6%) | 28 (2.4%) |
| 45 to 54 Years | 918 (97.0%) | 28 (3.0%) |
| 55 to 64 Years | 1,241 (96.4%) | 47 (3.6%) |
| 65 to 74 Years | 787 (100.0%) | 0 (0.0%) |
| 75 Years and older | 708 (100.0%) | 0 (0.0%) |
| Total | 7,539 (97.9%) | 165 (2.1%) |
Health Insurance Coverage by Citizenship Status in Makawao
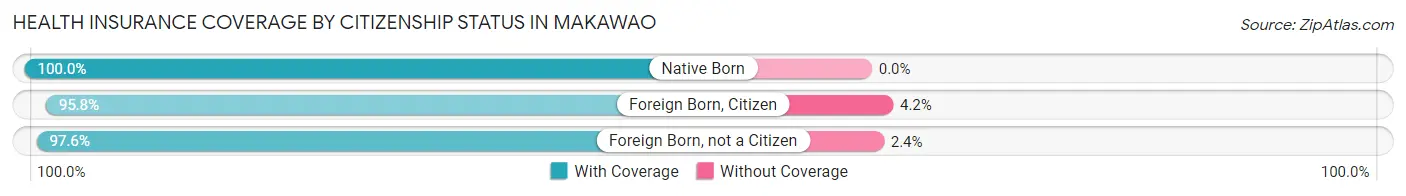
| Citizenship Status | With Coverage | Without Coverage |
| Native Born | 517 (100.0%) | 0 (0.0%) |
| Foreign Born, Citizen | 1,147 (95.8%) | 50 (4.2%) |
| Foreign Born, not a Citizen | 496 (97.6%) | 12 (2.4%) |
Health Insurance Coverage by Household Income in Makawao
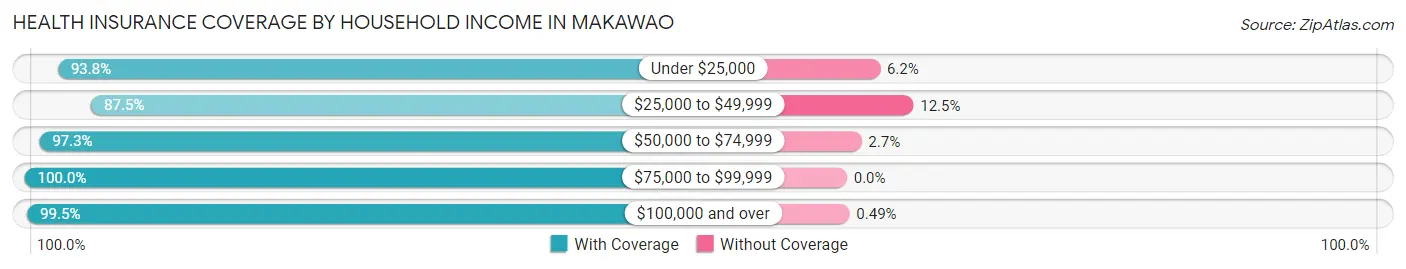
| Household Income | With Coverage | Without Coverage |
| Under $25,000 | 393 (93.8%) | 26 (6.2%) |
| $25,000 to $49,999 | 597 (87.5%) | 85 (12.5%) |
| $50,000 to $74,999 | 1,030 (97.3%) | 29 (2.7%) |
| $75,000 to $99,999 | 396 (100.0%) | 0 (0.0%) |
| $100,000 and over | 5,035 (99.5%) | 25 (0.5%) |
Public vs Private Health Insurance Coverage by Age in Makawao
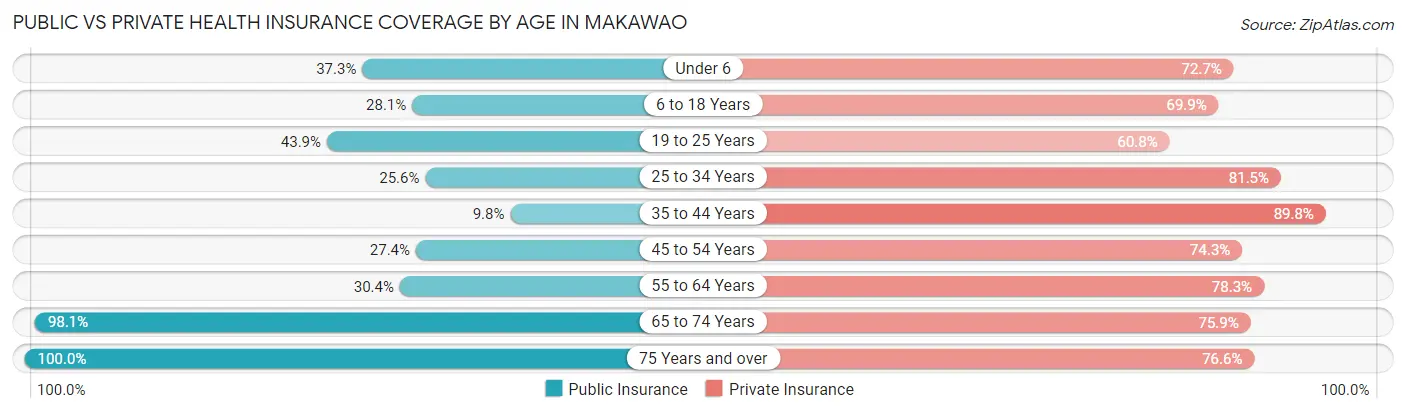
| Age Bracket | Public Insurance | Private Insurance |
| Under 6 | 193 (37.3%) | 376 (72.7%) |
| 6 to 18 Years | 336 (28.1%) | 837 (69.9%) |
| 19 to 25 Years | 223 (43.9%) | 309 (60.8%) |
| 25 to 34 Years | 155 (25.6%) | 493 (81.5%) |
| 35 to 44 Years | 113 (9.8%) | 1,031 (89.8%) |
| 45 to 54 Years | 259 (27.4%) | 703 (74.3%) |
| 55 to 64 Years | 391 (30.4%) | 1,009 (78.3%) |
| 65 to 74 Years | 772 (98.1%) | 597 (75.9%) |
| 75 Years and over | 708 (100.0%) | 542 (76.5%) |
| Total | 3,150 (40.9%) | 5,897 (76.5%) |
Disability Status by Sex by Age in Makawao
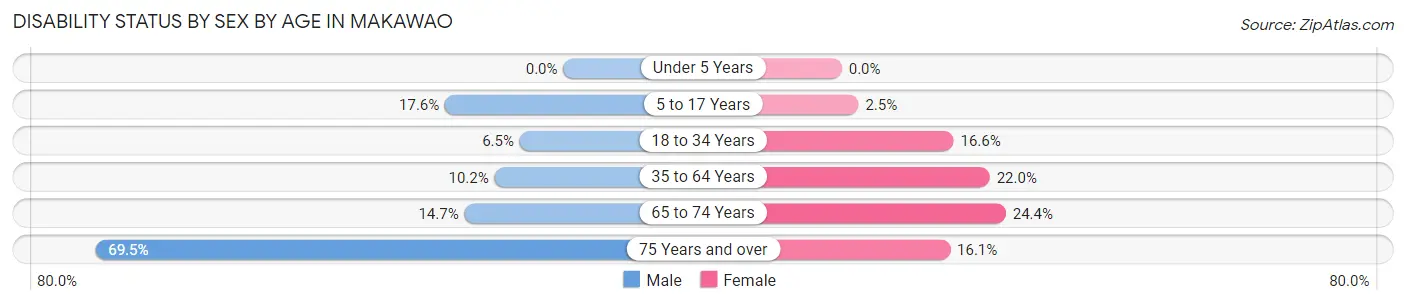
| Age Bracket | Male | Female |
| Under 5 Years | 0 (0.0%) | 0 (0.0%) |
| 5 to 17 Years | 108 (17.6%) | 14 (2.5%) |
| 18 to 34 Years | 36 (6.5%) | 107 (16.6%) |
| 35 to 64 Years | 166 (10.2%) | 386 (22.0%) |
| 65 to 74 Years | 48 (14.7%) | 112 (24.3%) |
| 75 Years and over | 237 (69.5%) | 59 (16.1%) |
Disability Class by Sex by Age in Makawao
Disability Class: Hearing Difficulty
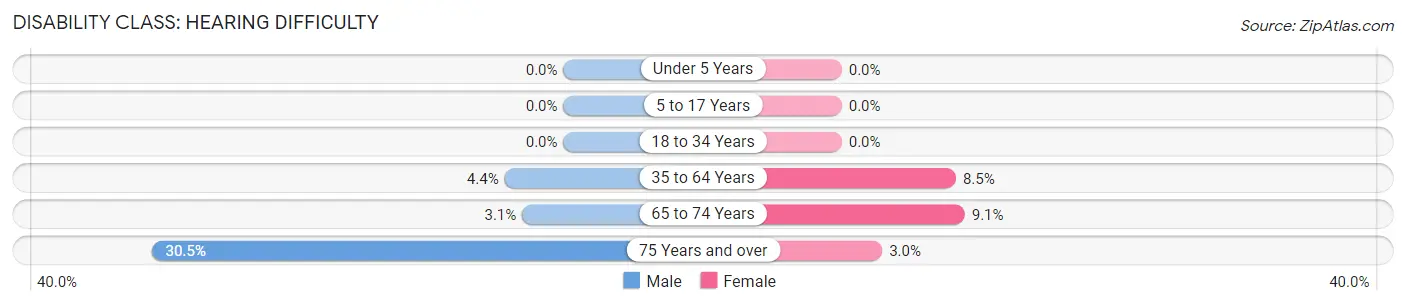
| Age Bracket | Male | Female |
| Under 5 Years | 0 (0.0%) | 0 (0.0%) |
| 5 to 17 Years | 0 (0.0%) | 0 (0.0%) |
| 18 to 34 Years | 0 (0.0%) | 0 (0.0%) |
| 35 to 64 Years | 71 (4.4%) | 149 (8.5%) |
| 65 to 74 Years | 10 (3.1%) | 42 (9.1%) |
| 75 Years and over | 104 (30.5%) | 11 (3.0%) |
Disability Class: Vision Difficulty
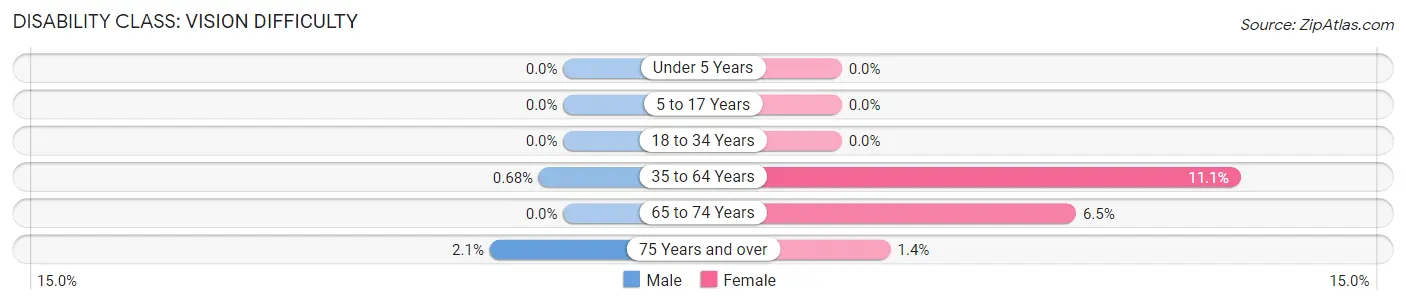
| Age Bracket | Male | Female |
| Under 5 Years | 0 (0.0%) | 0 (0.0%) |
| 5 to 17 Years | 0 (0.0%) | 0 (0.0%) |
| 18 to 34 Years | 0 (0.0%) | 0 (0.0%) |
| 35 to 64 Years | 11 (0.7%) | 195 (11.1%) |
| 65 to 74 Years | 0 (0.0%) | 30 (6.5%) |
| 75 Years and over | 7 (2.1%) | 5 (1.4%) |
Disability Class: Cognitive Difficulty
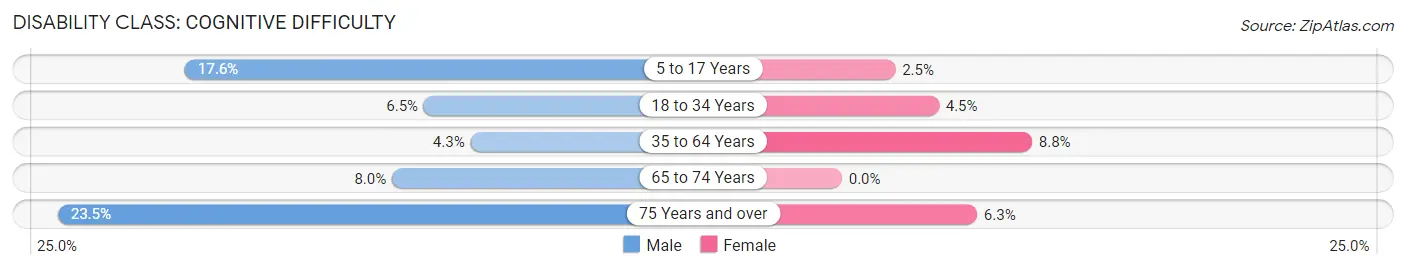
| Age Bracket | Male | Female |
| 5 to 17 Years | 108 (17.6%) | 14 (2.5%) |
| 18 to 34 Years | 36 (6.5%) | 29 (4.5%) |
| 35 to 64 Years | 70 (4.3%) | 155 (8.8%) |
| 65 to 74 Years | 26 (8.0%) | 0 (0.0%) |
| 75 Years and over | 80 (23.5%) | 23 (6.3%) |
Disability Class: Ambulatory Difficulty
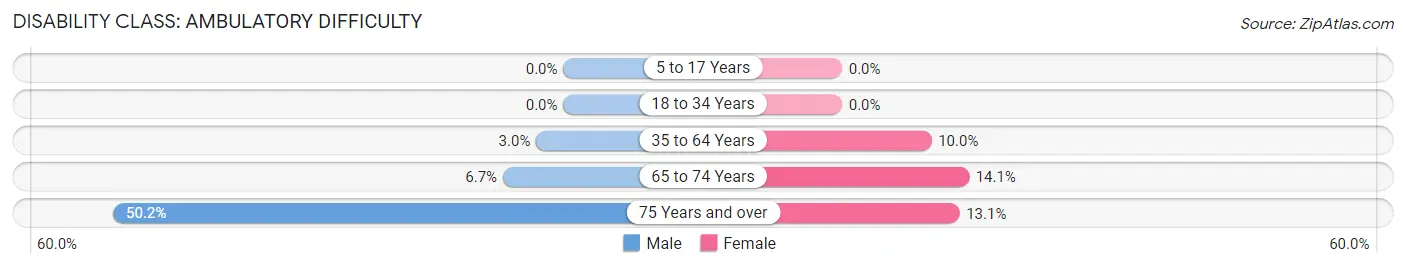
| Age Bracket | Male | Female |
| 5 to 17 Years | 0 (0.0%) | 0 (0.0%) |
| 18 to 34 Years | 0 (0.0%) | 0 (0.0%) |
| 35 to 64 Years | 49 (3.0%) | 175 (10.0%) |
| 65 to 74 Years | 22 (6.7%) | 65 (14.1%) |
| 75 Years and over | 171 (50.1%) | 48 (13.1%) |
Disability Class: Self-Care Difficulty
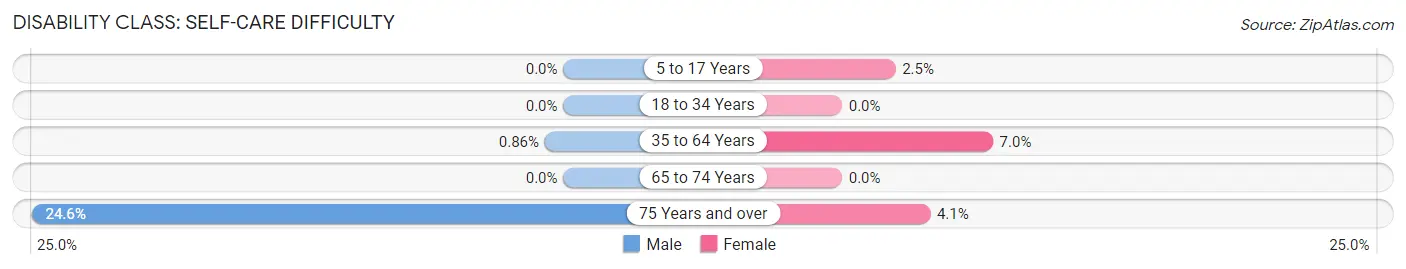
| Age Bracket | Male | Female |
| 5 to 17 Years | 0 (0.0%) | 14 (2.5%) |
| 18 to 34 Years | 0 (0.0%) | 0 (0.0%) |
| 35 to 64 Years | 14 (0.9%) | 123 (7.0%) |
| 65 to 74 Years | 0 (0.0%) | 0 (0.0%) |
| 75 Years and over | 84 (24.6%) | 15 (4.1%) |
Technology Access in Makawao
Computing Device Access in Makawao
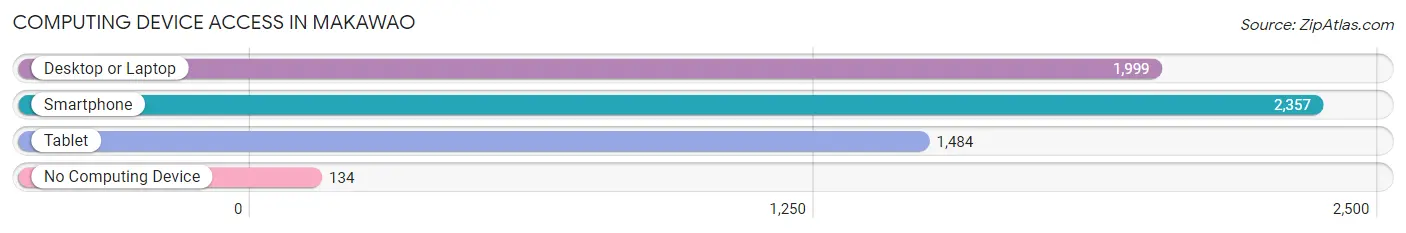
| Device Type | # Households | % Households |
| Desktop or Laptop | 1,999 | 74.9% |
| Smartphone | 2,357 | 88.3% |
| Tablet | 1,484 | 55.6% |
| No Computing Device | 134 | 5.0% |
| Total | 2,668 | 100.0% |
Internet Access in Makawao
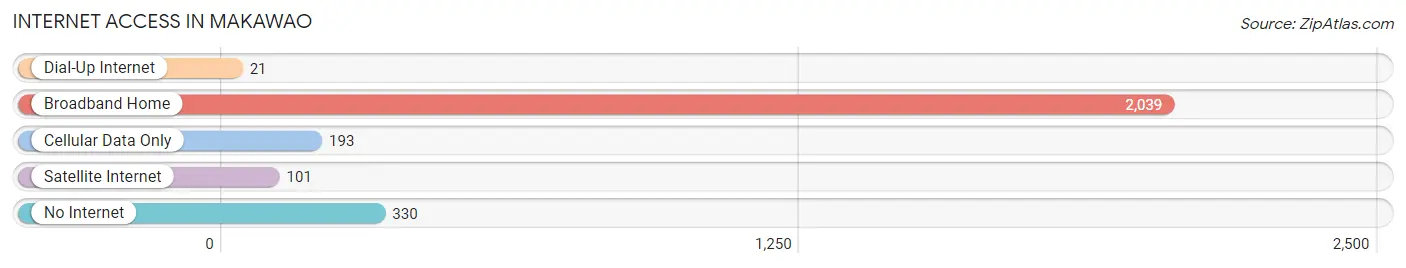
| Internet Type | # Households | % Households |
| Dial-Up Internet | 21 | 0.8% |
| Broadband Home | 2,039 | 76.4% |
| Cellular Data Only | 193 | 7.2% |
| Satellite Internet | 101 | 3.8% |
| No Internet | 330 | 12.4% |
| Total | 2,668 | 100.0% |
Makawao Summary
Makawao is a small town located in the Upcountry region of Maui, Hawaii. It is situated at the base of the majestic Haleakala volcano and is known for its paniolo (Hawaiian cowboy) culture and its vibrant art scene. The town has a population of approximately 7,000 people and is located in the Makawao/Olinda/Haliimaile census-designated place (CDP).
Geography
Makawao is located in the Upcountry region of Maui, Hawaii, at an elevation of 1,000 feet (305 m). It is situated at the base of the majestic Haleakala volcano and is surrounded by lush green hills and valleys. The town is located on the slopes of the West Maui Mountains and is bordered by the towns of Pukalani to the east and Kula to the west. The climate in Makawao is mild and temperate, with temperatures ranging from the mid-60s to the mid-80s Fahrenheit (18-30 Celsius).
Economy
Makawao is a small town with a vibrant economy. The town is home to a variety of businesses, including restaurants, retail stores, art galleries, and professional services. The town is also home to several small farms and ranches, which produce a variety of fruits and vegetables, as well as beef and dairy products. Tourism is also an important part of the local economy, with many visitors coming to the town to experience its unique culture and scenery.
Demographics
As of the 2010 census, the population of Makawao was 7,184. The racial makeup of the town was 57.2% White, 0.7% African American, 0.3% Native American, 11.2% Asian, 0.2% Pacific Islander, 0.7% from other races, and 2.9% from two or more races. Hispanic or Latino of any race were 8.3% of the population.
The median income for a household in Makawao was $50,917, and the median income for a family was $60,917. The per capita income for the town was $25,917. About 8.3% of families and 11.2% of the population were below the poverty line, including 15.2% of those under age 18 and 4.3% of those age 65 or over.
History
Makawao was founded in the late 1800s by a group of paniolo (Hawaiian cowboys) who were looking for a place to settle and raise their cattle. The town quickly grew and became a center for the paniolo culture, with rodeos, horse shows, and other events being held in the town. In the early 1900s, the town was home to a thriving sugar cane industry, and the town was known for its sugar plantations.
In the mid-1900s, the town began to transition away from its agricultural roots and towards a more tourist-oriented economy. The town is now home to a variety of restaurants, retail stores, art galleries, and professional services. The town is also home to several small farms and ranches, which produce a variety of fruits and vegetables, as well as beef and dairy products.
Conclusion
Makawao is a small town located in the Upcountry region of Maui, Hawaii. It is situated at the base of the majestic Haleakala volcano and is known for its paniolo (Hawaiian cowboy) culture and its vibrant art scene. The town has a population of approximately 7,000 people and is located in the Makawao/Olinda/Haliimaile census-designated place (CDP). The town is home to a variety of businesses, including restaurants, retail stores, art galleries, and professional services. Tourism is also an important part of the local economy, with many visitors coming to the town to experience its unique culture and scenery. Makawao has a rich history, with its roots in the paniolo culture and its transition to a more tourist-oriented economy. The town is a great place to visit and experience the unique culture and scenery of Maui.
Common Questions
What is Per Capita Income in Makawao?
Per Capita income in Makawao is $41,018.
What is the Median Family Income in Makawao?
Median Family Income in Makawao is $118,333.
What is the Median Household income in Makawao?
Median Household Income in Makawao is $109,385.
What is Income or Wage Gap in Makawao?
Income or Wage Gap in Makawao is 41.3%.
Women in Makawao earn 58.7 cents for every dollar earned by a man.
What is Family Income Deficit in Makawao?
Family Income Deficit in Makawao is $9,786.
Families that are below poverty line in Makawao earn $9,786 less on average than the poverty threshold level.
What is Inequality or Gini Index in Makawao?
Inequality or Gini Index in Makawao is 0.39.
What is the Total Population of Makawao?
Total Population of Makawao is 7,704.
What is the Total Male Population of Makawao?
Total Male Population of Makawao is 3,787.
What is the Total Female Population of Makawao?
Total Female Population of Makawao is 3,917.
What is the Ratio of Males per 100 Females in Makawao?
There are 96.68 Males per 100 Females in Makawao.
What is the Ratio of Females per 100 Males in Makawao?
There are 103.43 Females per 100 Males in Makawao.
What is the Median Population Age in Makawao?
Median Population Age in Makawao is 43.8 Years.
What is the Average Family Size in Makawao
Average Family Size in Makawao is 3.2 People.
What is the Average Household Size in Makawao
Average Household Size in Makawao is 2.9 People.
How Large is the Labor Force in Makawao?
There are 3,758 People in the Labor Forcein in Makawao.
What is the Percentage of People in the Labor Force in Makawao?
60.5% of People are in the Labor Force in Makawao.
What is the Unemployment Rate in Makawao?
Unemployment Rate in Makawao is 3.0%.