Waianae, HI Map & Demographics
Waianae Map
Waianae Overview
$26,528
PER CAPITA INCOME
$91,530
AVG FAMILY INCOME
$77,435
AVG HOUSEHOLD INCOME
36.2%
WAGE / INCOME GAP [ % ]
63.8¢/ $1
WAGE / INCOME GAP [ $ ]
$16,079
FAMILY INCOME DEFICIT
0.43
INEQUALITY / GINI INDEX
13,749
TOTAL POPULATION
6,887
MALE POPULATION
6,862
FEMALE POPULATION
100.36
MALES / 100 FEMALES
99.64
FEMALES / 100 MALES
34.8
MEDIAN AGE
4.3
AVG FAMILY SIZE
3.8
AVG HOUSEHOLD SIZE
6,034
LABOR FORCE [ PEOPLE ]
60.7%
PERCENT IN LABOR FORCE
9.7%
UNEMPLOYMENT RATE
Waianae Zip Codes
Waianae Area Codes
Income in Waianae
Income Overview in Waianae
Per Capita Income in Waianae is $26,528, while median incomes of families and households are $91,530 and $77,435 respectively.
| Characteristic | Number | Measure |
| Per Capita Income | 13,749 | $26,528 |
| Median Family Income | 2,841 | $91,530 |
| Mean Family Income | 2,841 | $106,414 |
| Median Household Income | 3,510 | $77,435 |
| Mean Household Income | 3,510 | $99,231 |
| Income Deficit | 2,841 | $16,079 |
| Wage / Income Gap (%) | 13,749 | 36.23% |
| Wage / Income Gap ($) | 13,749 | 63.77¢ per $1 |
| Gini / Inequality Index | 13,749 | 0.43 |
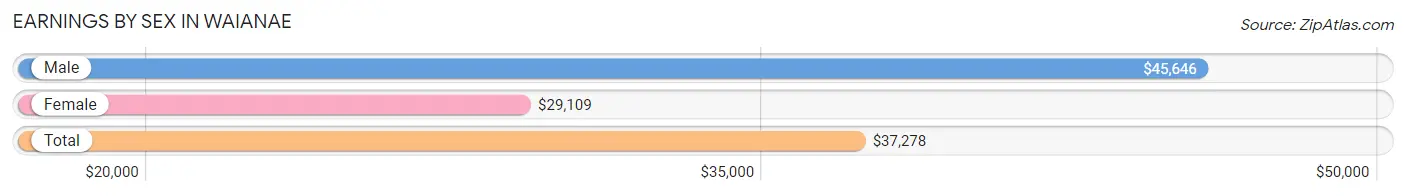
Earnings by Sex in Waianae
Average Earnings in Waianae are $37,278, $45,646 for men and $29,109 for women, a difference of 36.2%.
| Sex | Number | Average Earnings |
| Male | 3,011 (50.8%) | $45,646 |
| Female | 2,920 (49.2%) | $29,109 |
| Total | 5,931 (100.0%) | $37,278 |
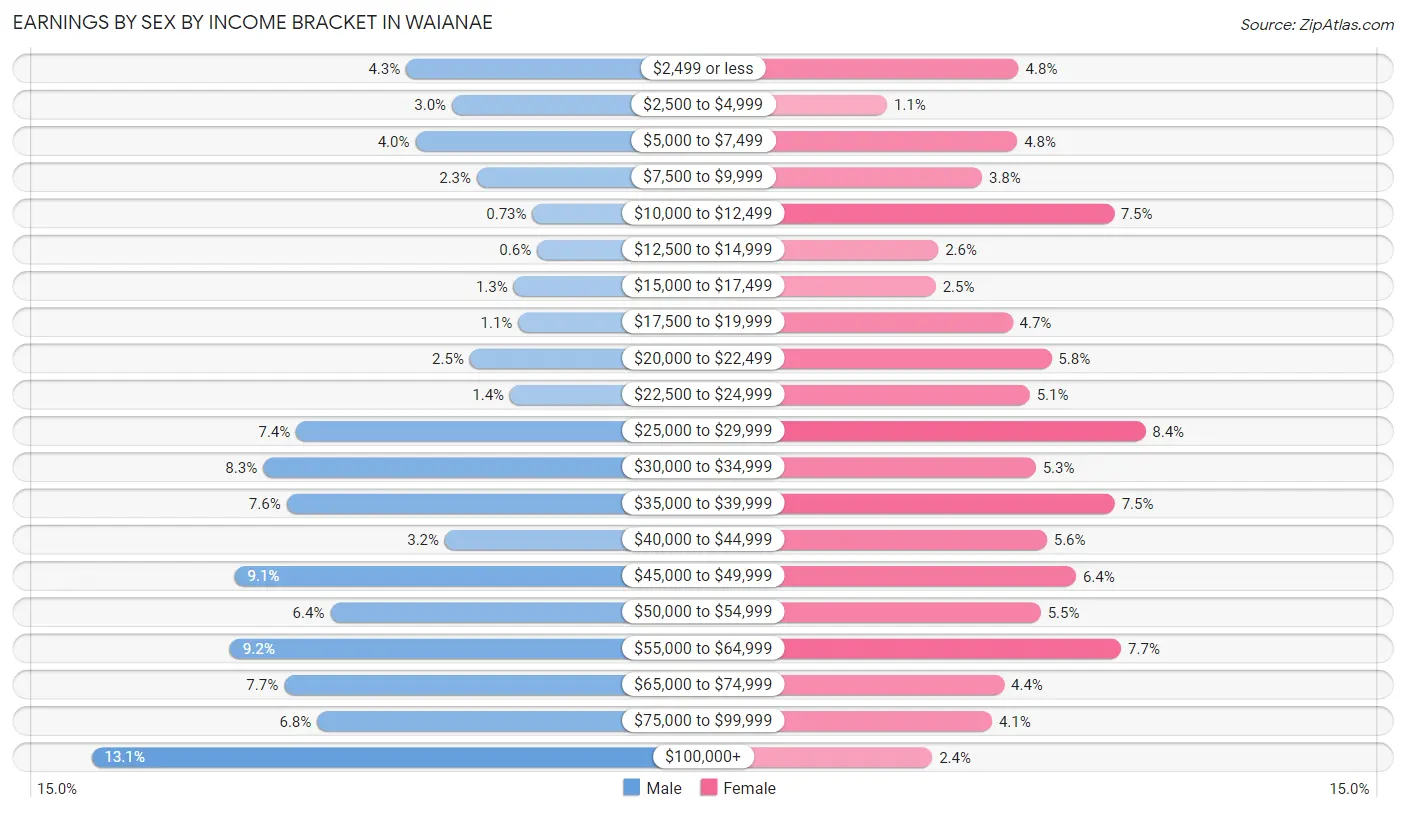
Earnings by Sex by Income Bracket in Waianae
The most common earnings brackets in Waianae are $100,000+ for men (395 | 13.1%) and $25,000 to $29,999 for women (245 | 8.4%).
| Income | Male | Female |
| $2,499 or less | 129 (4.3%) | 141 (4.8%) |
| $2,500 to $4,999 | 90 (3.0%) | 33 (1.1%) |
| $5,000 to $7,499 | 121 (4.0%) | 140 (4.8%) |
| $7,500 to $9,999 | 69 (2.3%) | 111 (3.8%) |
| $10,000 to $12,499 | 22 (0.7%) | 219 (7.5%) |
| $12,500 to $14,999 | 18 (0.6%) | 75 (2.6%) |
| $15,000 to $17,499 | 38 (1.3%) | 73 (2.5%) |
| $17,500 to $19,999 | 34 (1.1%) | 136 (4.7%) |
| $20,000 to $22,499 | 75 (2.5%) | 168 (5.8%) |
| $22,500 to $24,999 | 41 (1.4%) | 150 (5.1%) |
| $25,000 to $29,999 | 222 (7.4%) | 245 (8.4%) |
| $30,000 to $34,999 | 250 (8.3%) | 155 (5.3%) |
| $35,000 to $39,999 | 230 (7.6%) | 220 (7.5%) |
| $40,000 to $44,999 | 96 (3.2%) | 164 (5.6%) |
| $45,000 to $49,999 | 274 (9.1%) | 188 (6.4%) |
| $50,000 to $54,999 | 193 (6.4%) | 159 (5.4%) |
| $55,000 to $64,999 | 278 (9.2%) | 225 (7.7%) |
| $65,000 to $74,999 | 232 (7.7%) | 129 (4.4%) |
| $75,000 to $99,999 | 204 (6.8%) | 119 (4.1%) |
| $100,000+ | 395 (13.1%) | 70 (2.4%) |
| Total | 3,011 (100.0%) | 2,920 (100.0%) |
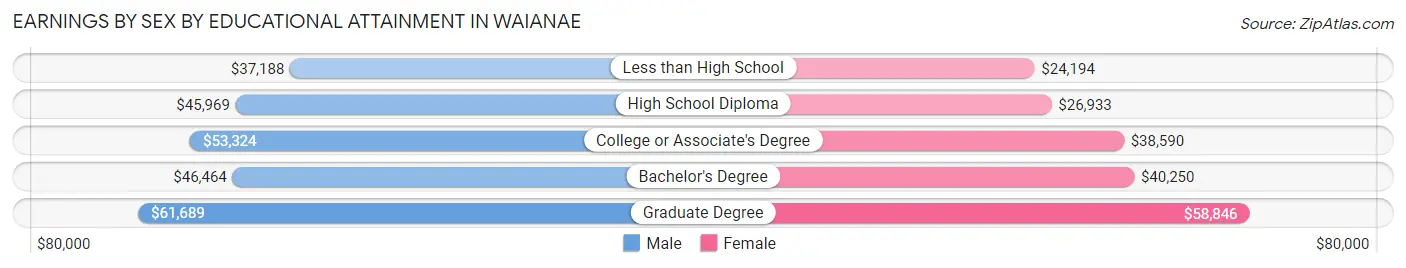
Earnings by Sex by Educational Attainment in Waianae
Average earnings in Waianae are $46,832 for men and $33,408 for women, a difference of 28.7%. Men with an educational attainment of graduate degree enjoy the highest average annual earnings of $61,689, while those with less than high school education earn the least with $37,188. Women with an educational attainment of graduate degree earn the most with the average annual earnings of $58,846, while those with less than high school education have the smallest earnings of $24,194.
| Educational Attainment | Male Income | Female Income |
| Less than High School | $37,188 | $24,194 |
| High School Diploma | $45,969 | $26,933 |
| College or Associate's Degree | $53,324 | $38,590 |
| Bachelor's Degree | $46,464 | $40,250 |
| Graduate Degree | $61,689 | $58,846 |
| Total | $46,832 | $33,408 |
Family Income in Waianae
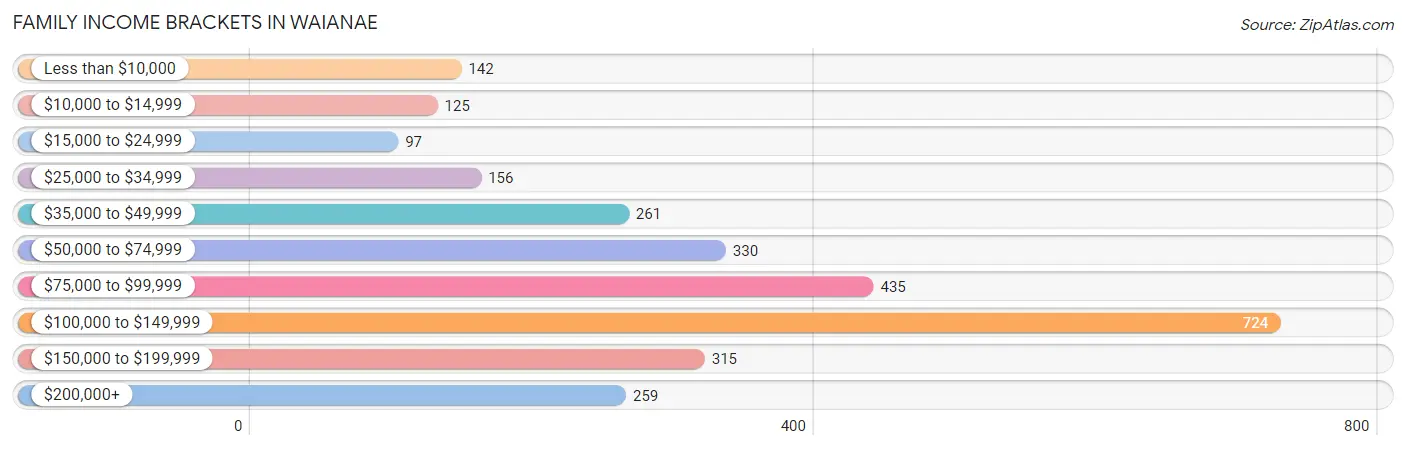
Family Income Brackets in Waianae
According to the Waianae family income data, there are 724 families falling into the $100,000 to $149,999 income range, which is the most common income bracket and makes up 25.5% of all families. Conversely, the $15,000 to $24,999 income bracket is the least frequent group with only 97 families (3.4%) belonging to this category.
| Income Bracket | # Families | % Families |
| Less than $10,000 | 142 | 5.0% |
| $10,000 to $14,999 | 125 | 4.4% |
| $15,000 to $24,999 | 97 | 3.4% |
| $25,000 to $34,999 | 156 | 5.5% |
| $35,000 to $49,999 | 261 | 9.2% |
| $50,000 to $74,999 | 330 | 11.6% |
| $75,000 to $99,999 | 435 | 15.3% |
| $100,000 to $149,999 | 724 | 25.5% |
| $150,000 to $199,999 | 315 | 11.1% |
| $200,000+ | 259 | 9.1% |
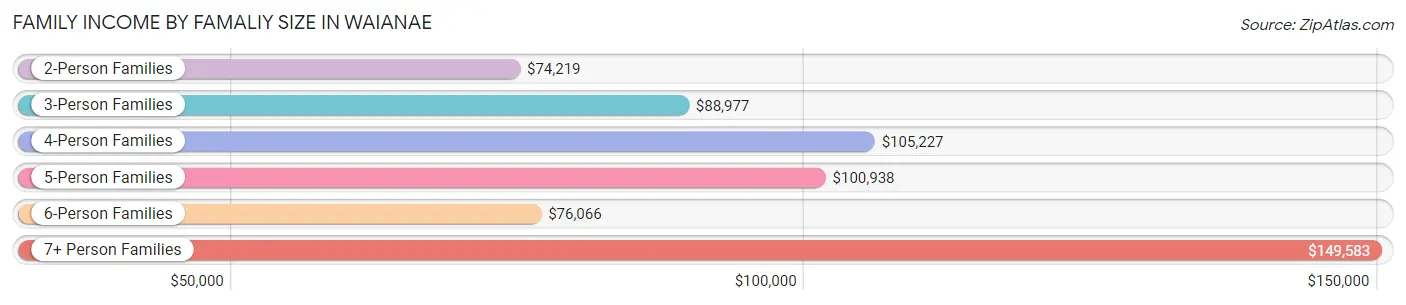
Family Income by Famaliy Size in Waianae
7+ person families (263 | 9.3%) account for the highest median family income in Waianae with $149,583 per family, while 2-person families (866 | 30.5%) have the highest median income of $37,110 per family member.
| Income Bracket | # Families | Median Income |
| 2-Person Families | 866 (30.5%) | $74,219 |
| 3-Person Families | 595 (20.9%) | $88,977 |
| 4-Person Families | 372 (13.1%) | $105,227 |
| 5-Person Families | 516 (18.2%) | $100,938 |
| 6-Person Families | 229 (8.1%) | $76,066 |
| 7+ Person Families | 263 (9.3%) | $149,583 |
| Total | 2,841 (100.0%) | $91,530 |
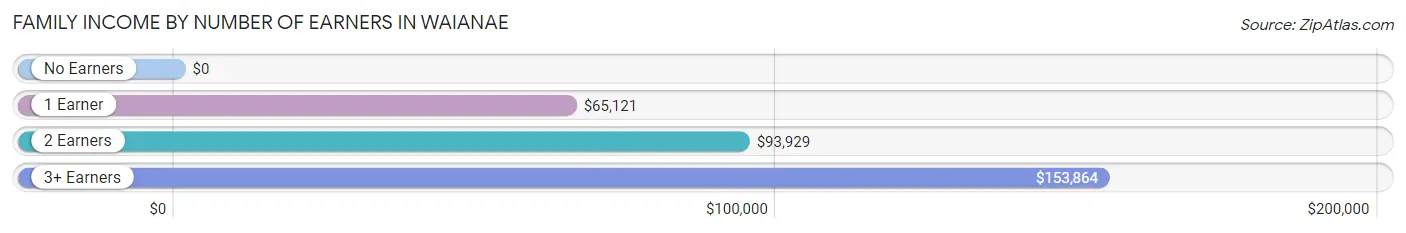
Family Income by Number of Earners in Waianae
| Number of Earners | # Families | Median Income |
| No Earners | 498 (17.5%) | $0 |
| 1 Earner | 837 (29.5%) | $65,121 |
| 2 Earners | 886 (31.2%) | $93,929 |
| 3+ Earners | 620 (21.8%) | $153,864 |
| Total | 2,841 (100.0%) | $91,530 |
Household Income in Waianae
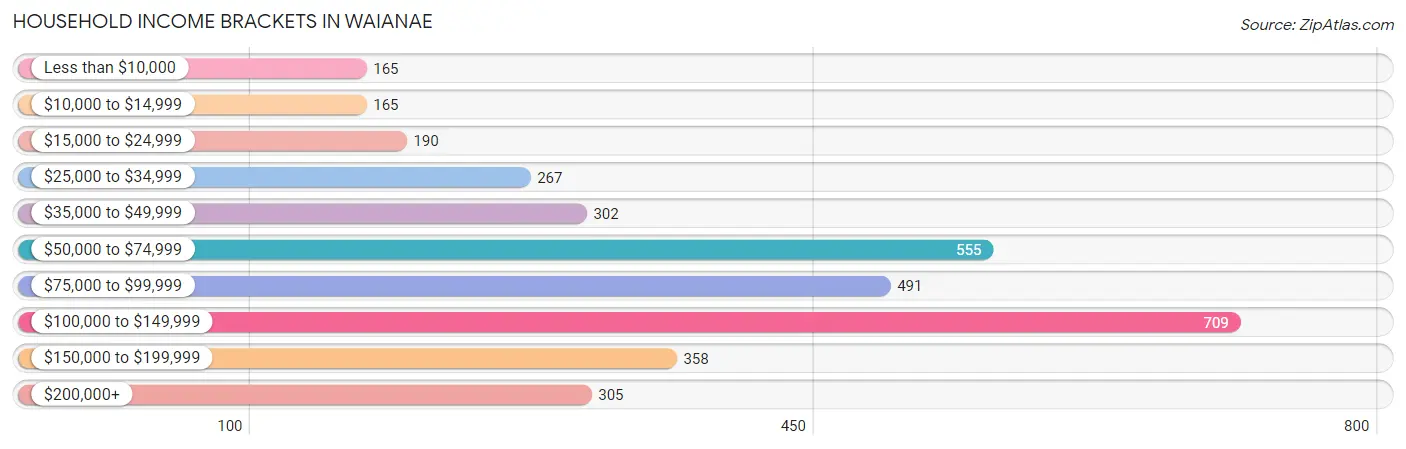
Household Income Brackets in Waianae
With 709 households falling in the category, the $100,000 to $149,999 income range is the most frequent in Waianae, accounting for 20.2% of all households. In contrast, only 165 households (4.7%) fall into the less than $10,000 income bracket, making it the least populous group.
| Income Bracket | # Households | % Households |
| Less than $10,000 | 165 | 4.7% |
| $10,000 to $14,999 | 165 | 4.7% |
| $15,000 to $24,999 | 190 | 5.4% |
| $25,000 to $34,999 | 267 | 7.6% |
| $35,000 to $49,999 | 302 | 8.6% |
| $50,000 to $74,999 | 555 | 15.8% |
| $75,000 to $99,999 | 491 | 14.0% |
| $100,000 to $149,999 | 709 | 20.2% |
| $150,000 to $199,999 | 358 | 10.2% |
| $200,000+ | 305 | 8.7% |
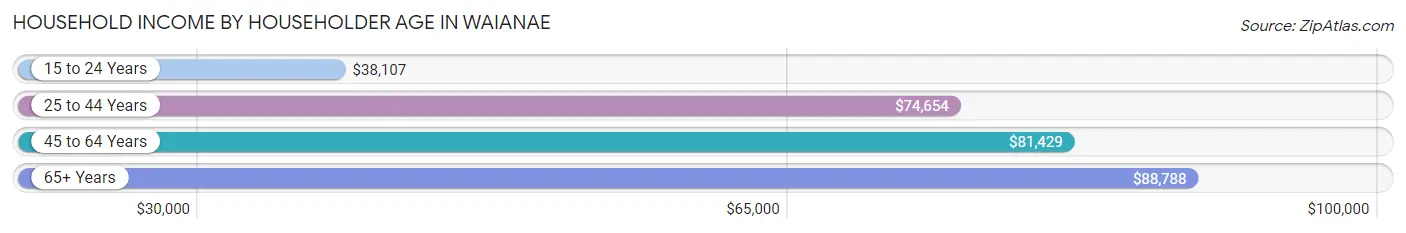
Household Income by Householder Age in Waianae
The median household income in Waianae is $77,435, with the highest median household income of $88,788 found in the 65+ years age bracket for the primary householder. A total of 958 households (27.3%) fall into this category. Meanwhile, the 15 to 24 years age bracket for the primary householder has the lowest median household income of $38,107, with 71 households (2.0%) in this group.
| Income Bracket | # Households | Median Income |
| 15 to 24 Years | 71 (2.0%) | $38,107 |
| 25 to 44 Years | 933 (26.6%) | $74,654 |
| 45 to 64 Years | 1,548 (44.1%) | $81,429 |
| 65+ Years | 958 (27.3%) | $88,788 |
| Total | 3,510 (100.0%) | $77,435 |
Poverty in Waianae
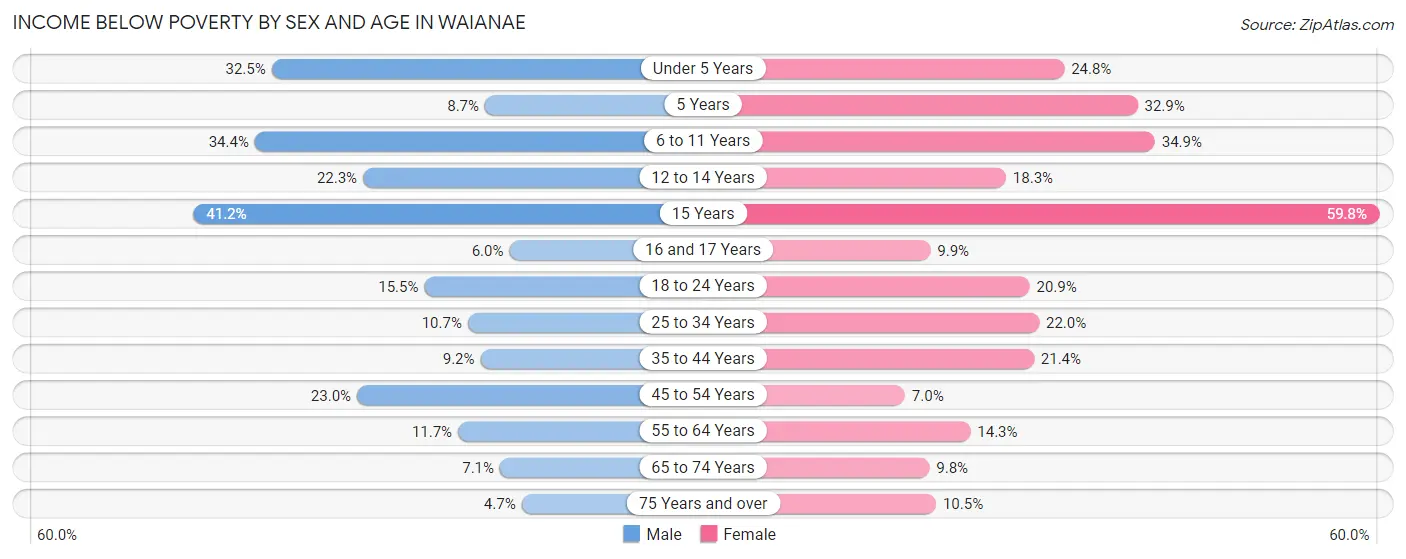
Income Below Poverty by Sex and Age in Waianae
With 17.3% poverty level for males and 19.5% for females among the residents of Waianae, 15 year old males and 15 year old females are the most vulnerable to poverty, with 89 males (41.2%) and 61 females (59.8%) in their respective age groups living below the poverty level.
| Age Bracket | Male | Female |
| Under 5 Years | 169 (32.5%) | 134 (24.8%) |
| 5 Years | 9 (8.7%) | 28 (32.9%) |
| 6 to 11 Years | 233 (34.4%) | 251 (34.9%) |
| 12 to 14 Years | 98 (22.3%) | 70 (18.3%) |
| 15 Years | 89 (41.2%) | 61 (59.8%) |
| 16 and 17 Years | 13 (6.0%) | 14 (9.9%) |
| 18 to 24 Years | 66 (15.5%) | 106 (20.9%) |
| 25 to 34 Years | 95 (10.6%) | 201 (22.0%) |
| 35 to 44 Years | 89 (9.2%) | 197 (21.4%) |
| 45 to 54 Years | 194 (23.0%) | 44 (7.0%) |
| 55 to 64 Years | 83 (11.7%) | 131 (14.3%) |
| 65 to 74 Years | 42 (7.1%) | 65 (9.8%) |
| 75 Years and over | 13 (4.7%) | 34 (10.5%) |
| Total | 1,193 (17.3%) | 1,336 (19.5%) |
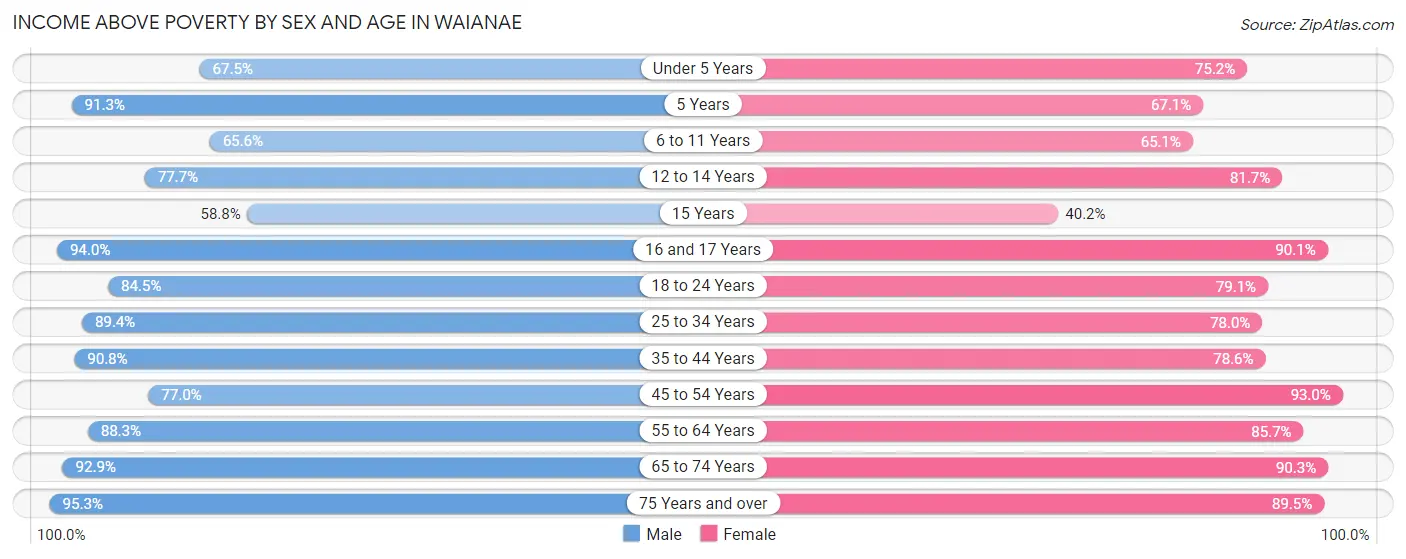
Income Above Poverty by Sex and Age in Waianae
According to the poverty statistics in Waianae, males aged 75 years and over and females aged 45 to 54 years are the age groups that are most secure financially, with 95.3% of males and 93.0% of females in these age groups living above the poverty line.
| Age Bracket | Male | Female |
| Under 5 Years | 351 (67.5%) | 407 (75.2%) |
| 5 Years | 94 (91.3%) | 57 (67.1%) |
| 6 to 11 Years | 445 (65.6%) | 469 (65.1%) |
| 12 to 14 Years | 341 (77.7%) | 313 (81.7%) |
| 15 Years | 127 (58.8%) | 41 (40.2%) |
| 16 and 17 Years | 203 (94.0%) | 128 (90.1%) |
| 18 to 24 Years | 360 (84.5%) | 401 (79.1%) |
| 25 to 34 Years | 797 (89.3%) | 714 (78.0%) |
| 35 to 44 Years | 874 (90.8%) | 724 (78.6%) |
| 45 to 54 Years | 650 (77.0%) | 582 (93.0%) |
| 55 to 64 Years | 624 (88.3%) | 784 (85.7%) |
| 65 to 74 Years | 552 (92.9%) | 602 (90.2%) |
| 75 Years and over | 266 (95.3%) | 290 (89.5%) |
| Total | 5,684 (82.7%) | 5,512 (80.5%) |
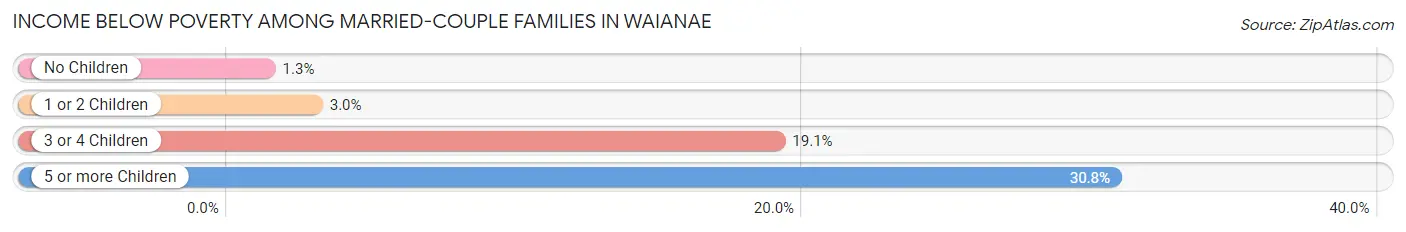
Income Below Poverty Among Married-Couple Families in Waianae
The poverty statistics for married-couple families in Waianae show that 5.6% or 109 of the total 1,947 families live below the poverty line. Families with 5 or more children have the highest poverty rate of 30.8%, comprising of 12 families. On the other hand, families with no children have the lowest poverty rate of 1.3%, which includes 14 families.
| Children | Above Poverty | Below Poverty |
| No Children | 1,057 (98.7%) | 14 (1.3%) |
| 1 or 2 Children | 461 (97.1%) | 14 (2.9%) |
| 3 or 4 Children | 293 (80.9%) | 69 (19.1%) |
| 5 or more Children | 27 (69.2%) | 12 (30.8%) |
| Total | 1,838 (94.4%) | 109 (5.6%) |
Income Below Poverty Among Single-Parent Households in Waianae
According to the poverty data in Waianae, 27.4% or 64 single-father households and 31.2% or 206 single-mother households are living below the poverty line. Among single-father households, those with 3 or 4 children have the highest poverty rate, with 55 households (52.4%) experiencing poverty. Likewise, among single-mother households, those with 3 or 4 children have the highest poverty rate, with 93 households (72.7%) falling below the poverty line.
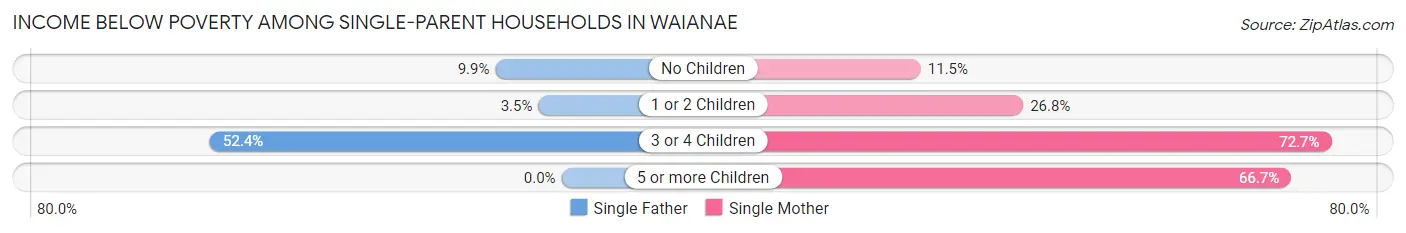
| Children | Single Father | Single Mother |
| No Children | 7 (9.9%) | 23 (11.5%) |
| 1 or 2 Children | 2 (3.5%) | 88 (26.8%) |
| 3 or 4 Children | 55 (52.4%) | 93 (72.7%) |
| 5 or more Children | 0 (0.0%) | 2 (66.7%) |
| Total | 64 (27.4%) | 206 (31.2%) |
Income Below Poverty Among Married-Couple vs Single-Parent Households in Waianae
The poverty data for Waianae shows that 109 of the married-couple family households (5.6%) and 270 of the single-parent households (30.2%) are living below the poverty level. Within the married-couple family households, those with 5 or more children have the highest poverty rate, with 12 households (30.8%) falling below the poverty line. Among the single-parent households, those with 5 or more children have the highest poverty rate, with 2 household (66.7%) living below poverty.
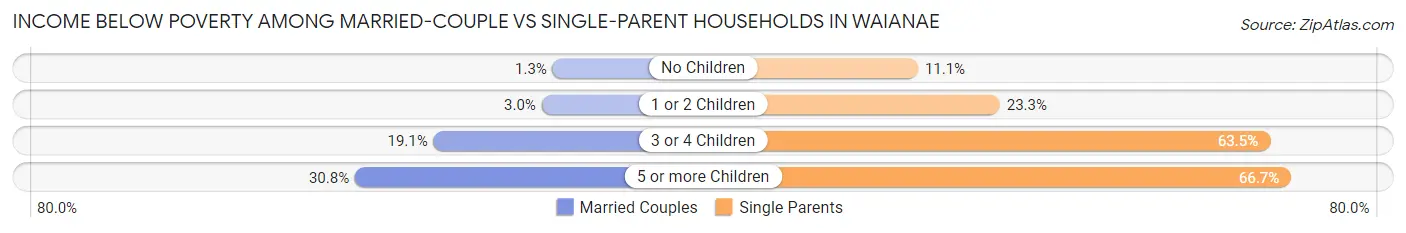
| Children | Married-Couple Families | Single-Parent Households |
| No Children | 14 (1.3%) | 30 (11.1%) |
| 1 or 2 Children | 14 (2.9%) | 90 (23.3%) |
| 3 or 4 Children | 69 (19.1%) | 148 (63.5%) |
| 5 or more Children | 12 (30.8%) | 2 (66.7%) |
| Total | 109 (5.6%) | 270 (30.2%) |
Race in Waianae
The most populous races in Waianae are Hawaiian / Pacific (6,178 | 44.9%), Two or more Races (4,792 | 34.8%), and Hispanic or Latino (2,554 | 18.6%).
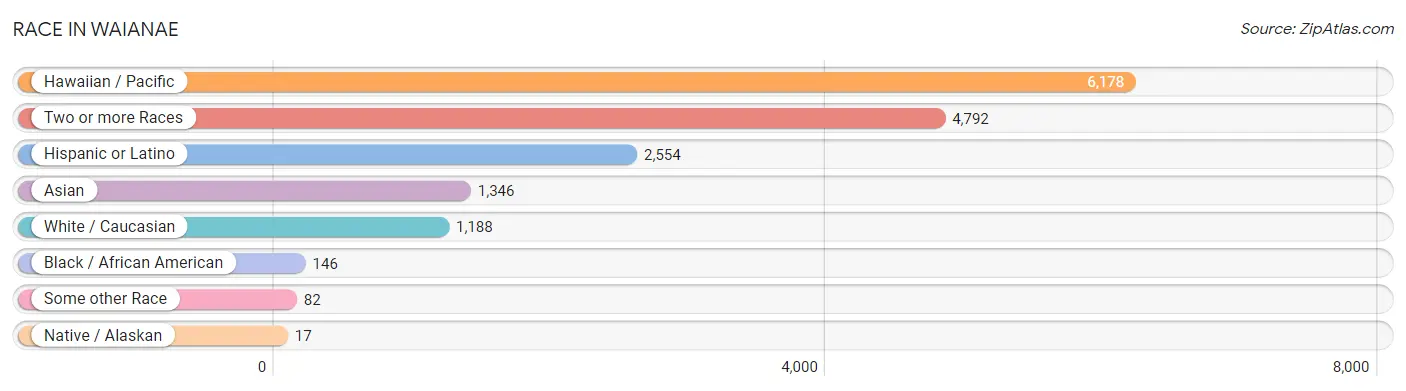
| Race | # Population | % Population |
| Asian | 1,346 | 9.8% |
| Black / African American | 146 | 1.1% |
| Hawaiian / Pacific | 6,178 | 44.9% |
| Hispanic or Latino | 2,554 | 18.6% |
| Native / Alaskan | 17 | 0.1% |
| White / Caucasian | 1,188 | 8.6% |
| Two or more Races | 4,792 | 34.8% |
| Some other Race | 82 | 0.6% |
| Total | 13,749 | 100.0% |
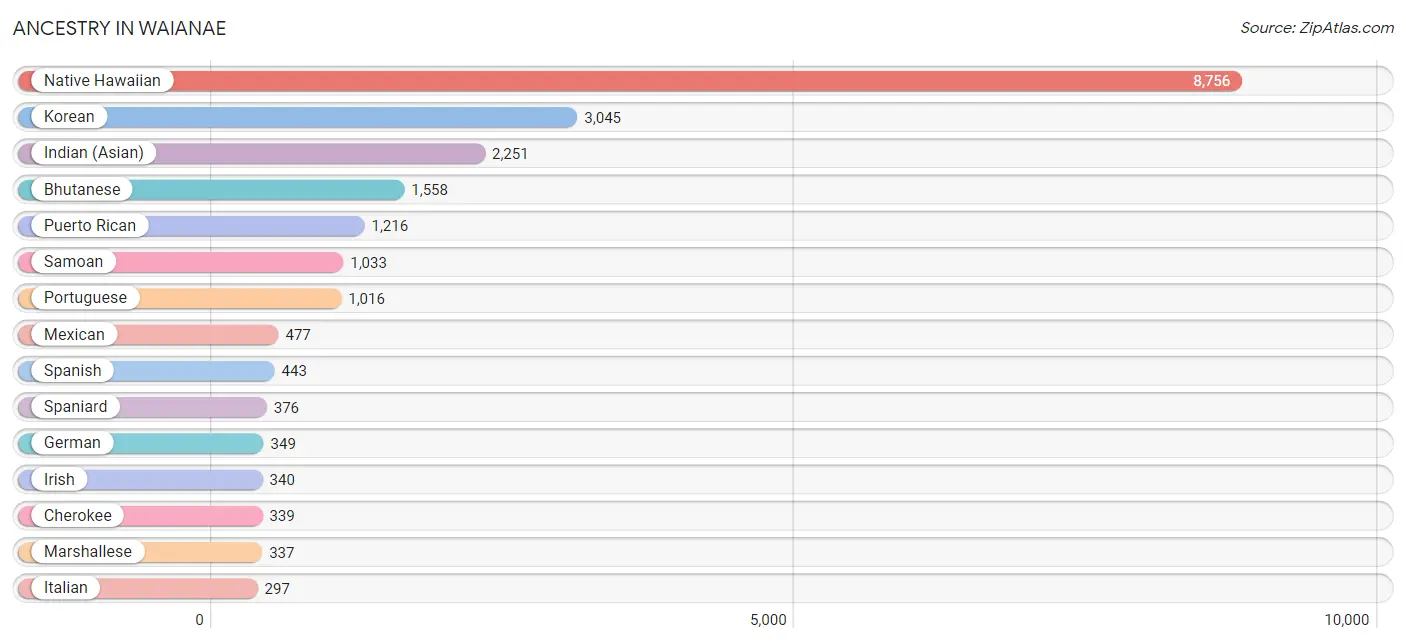
Ancestry in Waianae
The most populous ancestries reported in Waianae are Native Hawaiian (8,756 | 63.7%), Korean (3,045 | 22.2%), Indian (Asian) (2,251 | 16.4%), Bhutanese (1,558 | 11.3%), and Puerto Rican (1,216 | 8.8%), together accounting for 122.4% of all Waianae residents.
| Ancestry | # Population | % Population |
| American | 63 | 0.5% |
| Arab | 15 | 0.1% |
| Australian | 5 | 0.0% |
| Basque | 25 | 0.2% |
| Belgian | 2 | 0.0% |
| Bhutanese | 1,558 | 11.3% |
| Blackfeet | 4 | 0.0% |
| Burmese | 228 | 1.7% |
| Canadian | 7 | 0.1% |
| Central American Indian | 4 | 0.0% |
| Cherokee | 339 | 2.5% |
| Chickasaw | 5 | 0.0% |
| Chinese | 48 | 0.4% |
| Chippewa | 2 | 0.0% |
| Cuban | 20 | 0.2% |
| Dutch | 23 | 0.2% |
| English | 206 | 1.5% |
| European | 4 | 0.0% |
| Fijian | 196 | 1.4% |
| French | 86 | 0.6% |
| French Canadian | 16 | 0.1% |
| German | 349 | 2.5% |
| Guamanian / Chamorro | 78 | 0.6% |
| Haitian | 3 | 0.0% |
| Indian (Asian) | 2,251 | 16.4% |
| Irish | 340 | 2.5% |
| Italian | 297 | 2.2% |
| Korean | 3,045 | 22.2% |
| Laotian | 5 | 0.0% |
| Lebanese | 10 | 0.1% |
| Malaysian | 4 | 0.0% |
| Marshallese | 337 | 2.5% |
| Mexican | 477 | 3.5% |
| Mexican American Indian | 4 | 0.0% |
| Native Hawaiian | 8,756 | 63.7% |
| Navajo | 3 | 0.0% |
| Norwegian | 34 | 0.3% |
| Pakistani | 30 | 0.2% |
| Polish | 8 | 0.1% |
| Portuguese | 1,016 | 7.4% |
| Puerto Rican | 1,216 | 8.8% |
| Russian | 14 | 0.1% |
| Samoan | 1,033 | 7.5% |
| Scotch-Irish | 8 | 0.1% |
| Scottish | 17 | 0.1% |
| Sioux | 14 | 0.1% |
| Slovak | 8 | 0.1% |
| Spaniard | 376 | 2.7% |
| Spanish | 443 | 3.2% |
| Spanish American | 14 | 0.1% |
| Sri Lankan | 26 | 0.2% |
| Swedish | 15 | 0.1% |
| Thai | 59 | 0.4% |
| Tongan | 140 | 1.0% |
| Ukrainian | 8 | 0.1% | View All 55 Rows |
Immigrants in Waianae
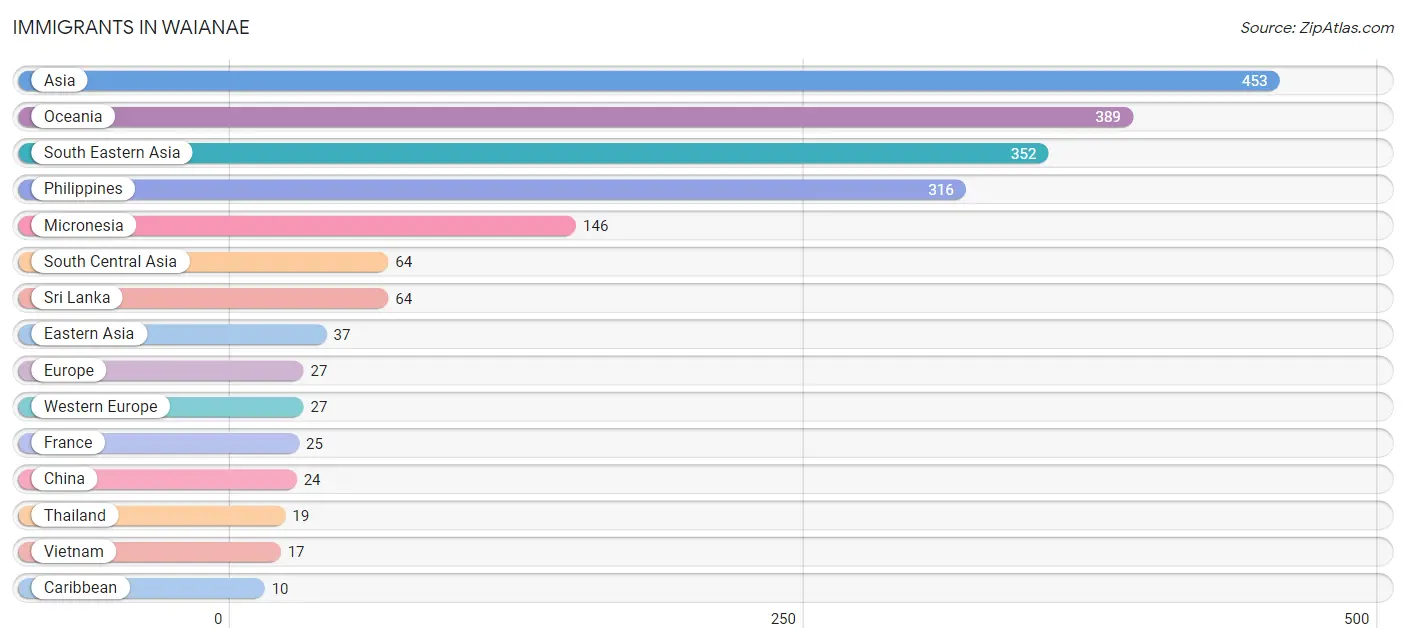
The most numerous immigrant groups reported in Waianae came from Asia (453 | 3.3%), Oceania (389 | 2.8%), South Eastern Asia (352 | 2.6%), Philippines (316 | 2.3%), and Micronesia (146 | 1.1%), together accounting for 12.0% of all Waianae residents.
| Immigration Origin | # Population | % Population |
| Asia | 453 | 3.3% |
| Australia | 4 | 0.0% |
| Caribbean | 10 | 0.1% |
| China | 24 | 0.2% |
| Eastern Asia | 37 | 0.3% |
| Europe | 27 | 0.2% |
| France | 25 | 0.2% |
| Germany | 2 | 0.0% |
| Japan | 8 | 0.1% |
| Korea | 5 | 0.0% |
| Latin America | 10 | 0.1% |
| Micronesia | 146 | 1.1% |
| Oceania | 389 | 2.8% |
| Philippines | 316 | 2.3% |
| South Central Asia | 64 | 0.5% |
| South Eastern Asia | 352 | 2.6% |
| Sri Lanka | 64 | 0.5% |
| Thailand | 19 | 0.1% |
| Trinidad and Tobago | 10 | 0.1% |
| Vietnam | 17 | 0.1% |
| Western Europe | 27 | 0.2% | View All 21 Rows |
Sex and Age in Waianae
Sex and Age in Waianae
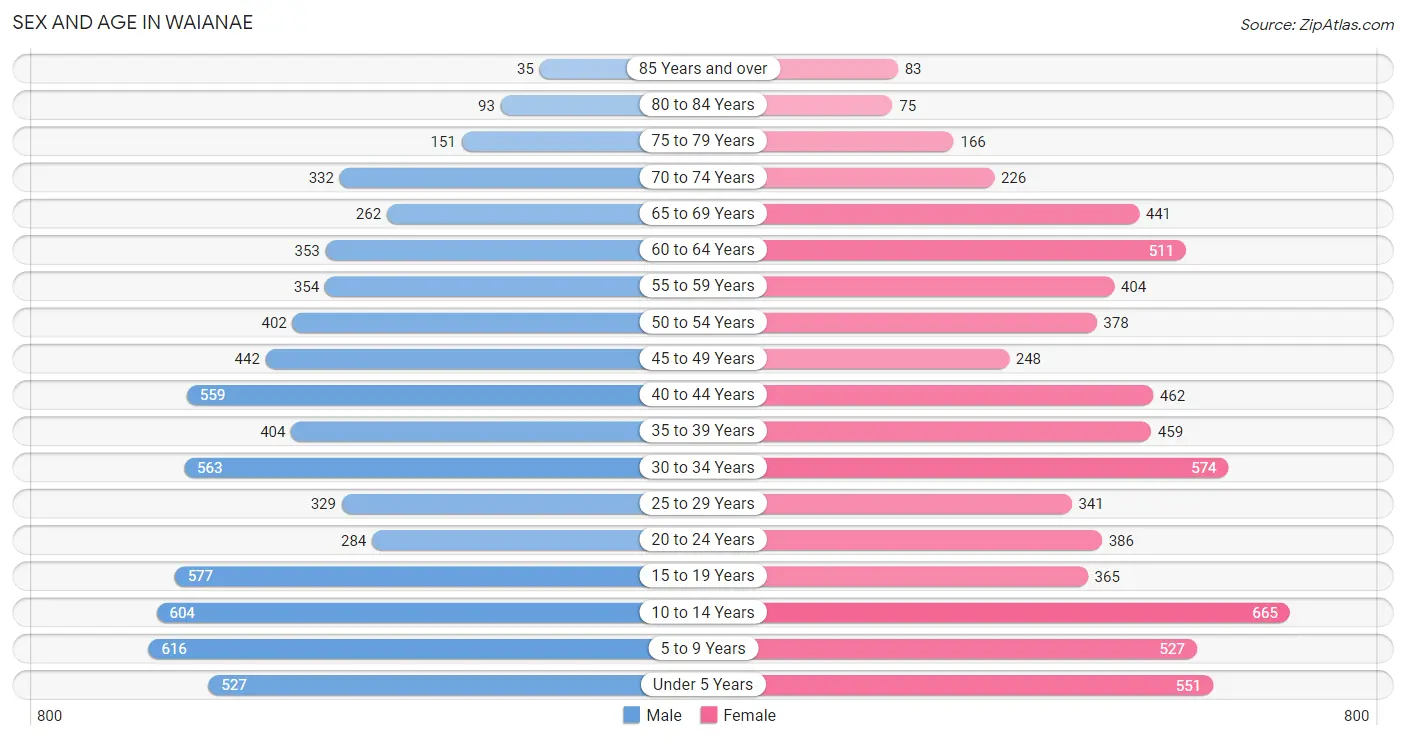
The most populous age groups in Waianae are 5 to 9 Years (616 | 8.9%) for men and 10 to 14 Years (665 | 9.7%) for women.
| Age Bracket | Male | Female |
| Under 5 Years | 527 (7.6%) | 551 (8.0%) |
| 5 to 9 Years | 616 (8.9%) | 527 (7.7%) |
| 10 to 14 Years | 604 (8.8%) | 665 (9.7%) |
| 15 to 19 Years | 577 (8.4%) | 365 (5.3%) |
| 20 to 24 Years | 284 (4.1%) | 386 (5.6%) |
| 25 to 29 Years | 329 (4.8%) | 341 (5.0%) |
| 30 to 34 Years | 563 (8.2%) | 574 (8.4%) |
| 35 to 39 Years | 404 (5.9%) | 459 (6.7%) |
| 40 to 44 Years | 559 (8.1%) | 462 (6.7%) |
| 45 to 49 Years | 442 (6.4%) | 248 (3.6%) |
| 50 to 54 Years | 402 (5.8%) | 378 (5.5%) |
| 55 to 59 Years | 354 (5.1%) | 404 (5.9%) |
| 60 to 64 Years | 353 (5.1%) | 511 (7.4%) |
| 65 to 69 Years | 262 (3.8%) | 441 (6.4%) |
| 70 to 74 Years | 332 (4.8%) | 226 (3.3%) |
| 75 to 79 Years | 151 (2.2%) | 166 (2.4%) |
| 80 to 84 Years | 93 (1.3%) | 75 (1.1%) |
| 85 Years and over | 35 (0.5%) | 83 (1.2%) |
| Total | 6,887 (100.0%) | 6,862 (100.0%) |
Families and Households in Waianae
Median Family Size in Waianae
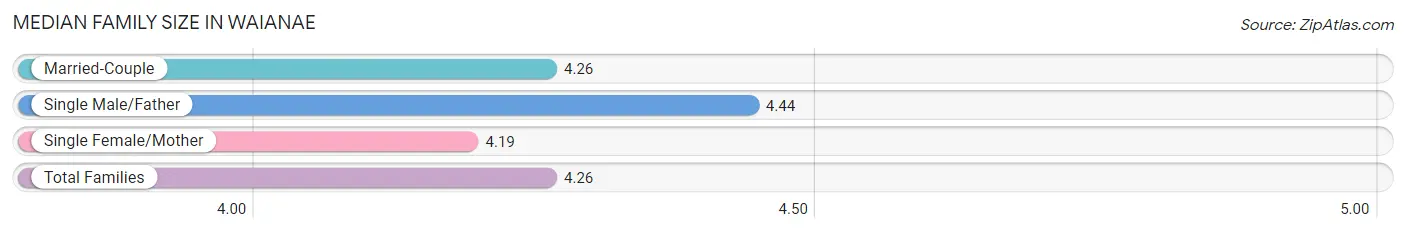
The median family size in Waianae is 4.26 persons per family, with single male/father families (234 | 8.2%) accounting for the largest median family size of 4.44 persons per family. On the other hand, single female/mother families (660 | 23.2%) represent the smallest median family size with 4.19 persons per family.
| Family Type | # Families | Family Size |
| Married-Couple | 1,947 (68.5%) | 4.26 |
| Single Male/Father | 234 (8.2%) | 4.44 |
| Single Female/Mother | 660 (23.2%) | 4.19 |
| Total Families | 2,841 (100.0%) | 4.26 |
Median Household Size in Waianae
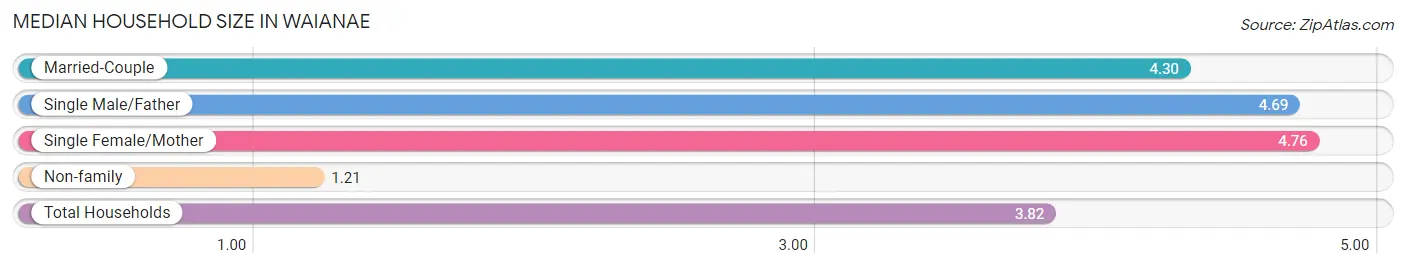
The median household size in Waianae is 3.82 persons per household, with single female/mother households (660 | 18.8%) accounting for the largest median household size of 4.76 persons per household. non-family households (669 | 19.1%) represent the smallest median household size with 1.21 persons per household.
| Household Type | # Households | Household Size |
| Married-Couple | 1,947 (55.5%) | 4.30 |
| Single Male/Father | 234 (6.7%) | 4.69 |
| Single Female/Mother | 660 (18.8%) | 4.76 |
| Non-family | 669 (19.1%) | 1.21 |
| Total Households | 3,510 (100.0%) | 3.82 |
Household Size by Marriage Status in Waianae
Out of a total of 3,510 households in Waianae, 2,841 (80.9%) are family households, while 669 (19.1%) are nonfamily households. The most numerous type of family households are 2-person households, comprising 795, and the most common type of nonfamily households are 1-person households, comprising 542.
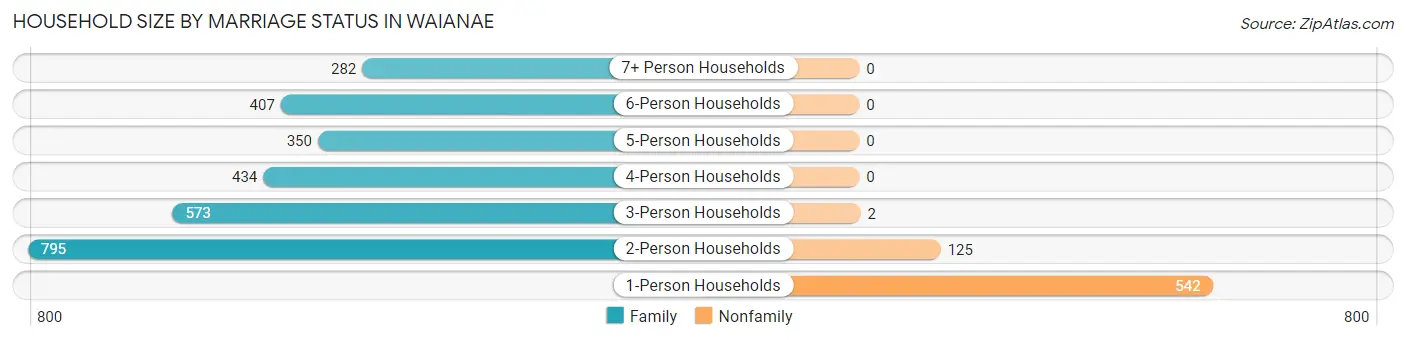
| Household Size | Family Households | Nonfamily Households |
| 1-Person Households | - | 542 (15.4%) |
| 2-Person Households | 795 (22.7%) | 125 (3.6%) |
| 3-Person Households | 573 (16.3%) | 2 (0.1%) |
| 4-Person Households | 434 (12.4%) | 0 (0.0%) |
| 5-Person Households | 350 (10.0%) | 0 (0.0%) |
| 6-Person Households | 407 (11.6%) | 0 (0.0%) |
| 7+ Person Households | 282 (8.0%) | 0 (0.0%) |
| Total | 2,841 (80.9%) | 669 (19.1%) |
Female Fertility in Waianae
Fertility by Age in Waianae
Average fertility rate in Waianae is 63.0 births per 1,000 women. Women in the age bracket of 20 to 34 years have the highest fertility rate with 78.0 births per 1,000 women. Women in the age bracket of 20 to 34 years acount for 54.6% of all women with births.
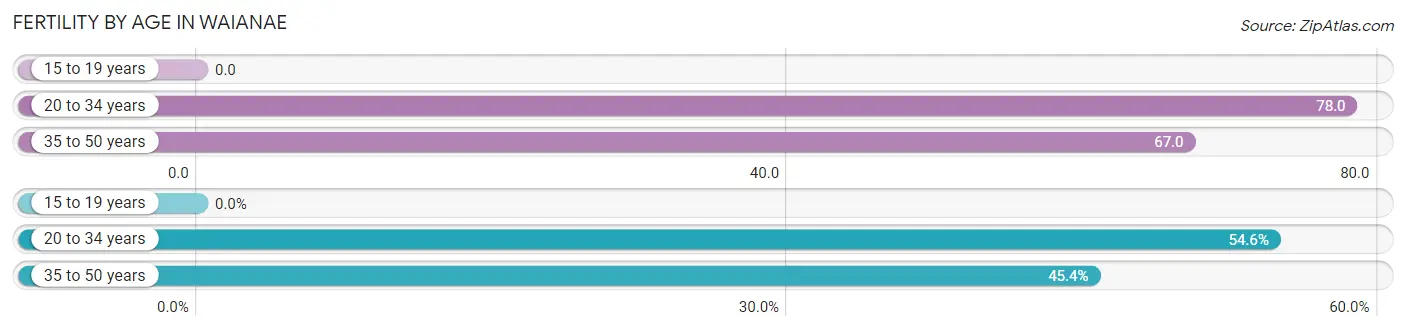
| Age Bracket | Women with Births | Births / 1,000 Women |
| 15 to 19 years | 0 (0.0%) | 0.0 |
| 20 to 34 years | 101 (54.6%) | 78.0 |
| 35 to 50 years | 84 (45.4%) | 67.0 |
| Total | 185 (100.0%) | 63.0 |
Fertility by Age by Marriage Status in Waianae
58.9% of women with births (185) in Waianae are married. The highest percentage of unmarried women with births falls into 35 to 50 years age bracket with 59.5% of them unmarried at the time of birth, while the lowest percentage of unmarried women with births belong to 20 to 34 years age bracket with 25.7% of them unmarried.
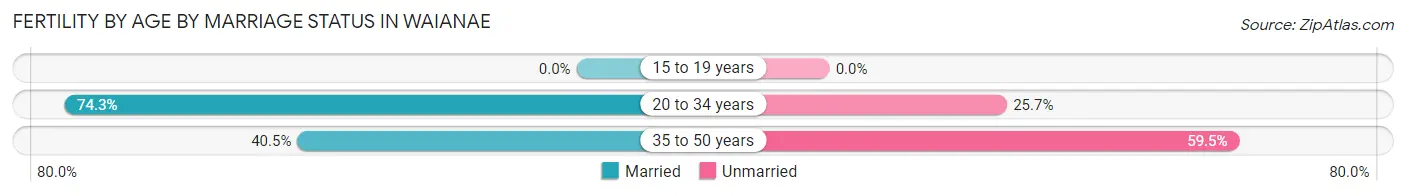
| Age Bracket | Married | Unmarried |
| 15 to 19 years | 0 (0.0%) | 0 (0.0%) |
| 20 to 34 years | 75 (74.3%) | 26 (25.7%) |
| 35 to 50 years | 34 (40.5%) | 50 (59.5%) |
| Total | 109 (58.9%) | 76 (41.1%) |
Fertility by Education in Waianae
Average fertility rate in Waianae is 63.0 births per 1,000 women. Women with the education attainment of graduate degree have the highest fertility rate of 103.0 births per 1,000 women, while women with the education attainment of less than high school have the lowest fertility at 6.0 births per 1,000 women. Women with the education attainment of high school diploma represent 56.2% of all women with births.
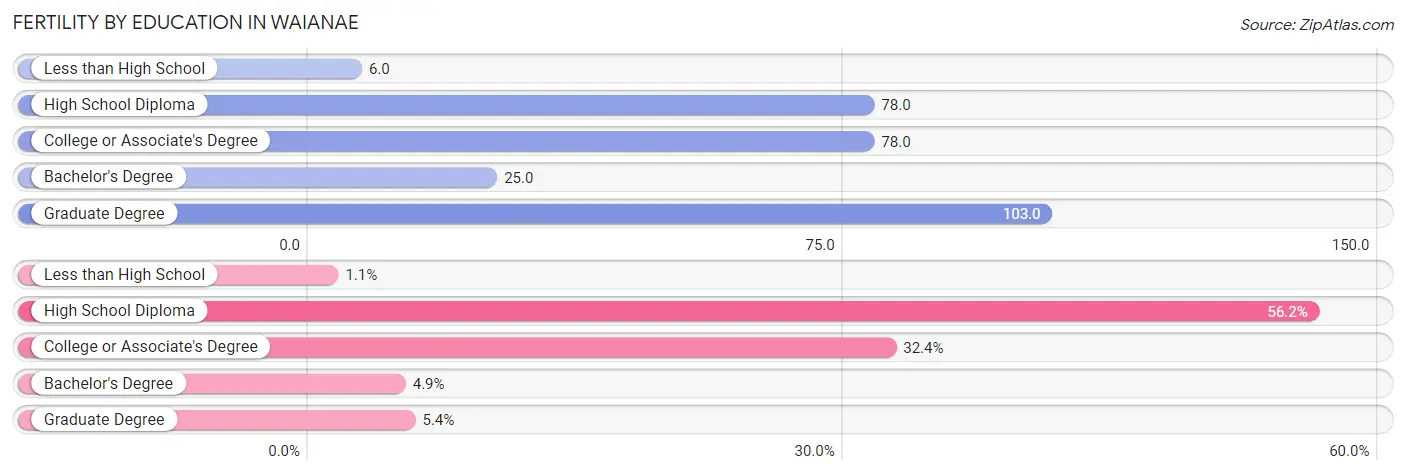
| Educational Attainment | Women with Births | Births / 1,000 Women |
| Less than High School | 2 (1.1%) | 6.0 |
| High School Diploma | 104 (56.2%) | 78.0 |
| College or Associate's Degree | 60 (32.4%) | 78.0 |
| Bachelor's Degree | 9 (4.9%) | 25.0 |
| Graduate Degree | 10 (5.4%) | 103.0 |
| Total | 185 (100.0%) | 63.0 |
Fertility by Education by Marriage Status in Waianae
41.1% of women with births in Waianae are unmarried. Women with the educational attainment of bachelor's degree are most likely to be married with 100.0% of them married at childbirth, while women with the educational attainment of less than high school are least likely to be married with 100.0% of them unmarried at childbirth.
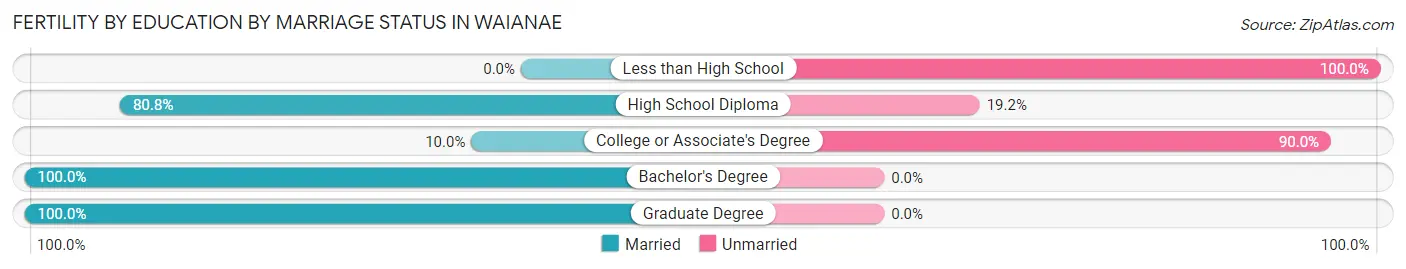
| Educational Attainment | Married | Unmarried |
| Less than High School | 0 (0.0%) | 2 (100.0%) |
| High School Diploma | 84 (80.8%) | 20 (19.2%) |
| College or Associate's Degree | 6 (10.0%) | 54 (90.0%) |
| Bachelor's Degree | 9 (100.0%) | 0 (0.0%) |
| Graduate Degree | 10 (100.0%) | 0 (0.0%) |
| Total | 109 (58.9%) | 76 (41.1%) |
Employment Characteristics in Waianae
Employment by Class of Employer in Waianae
Among the 5,222 employed individuals in Waianae, private company employees (3,036 | 58.1%), state government employees (566 | 10.8%), and not-for-profit organizations (545 | 10.4%) make up the most common classes of employment.
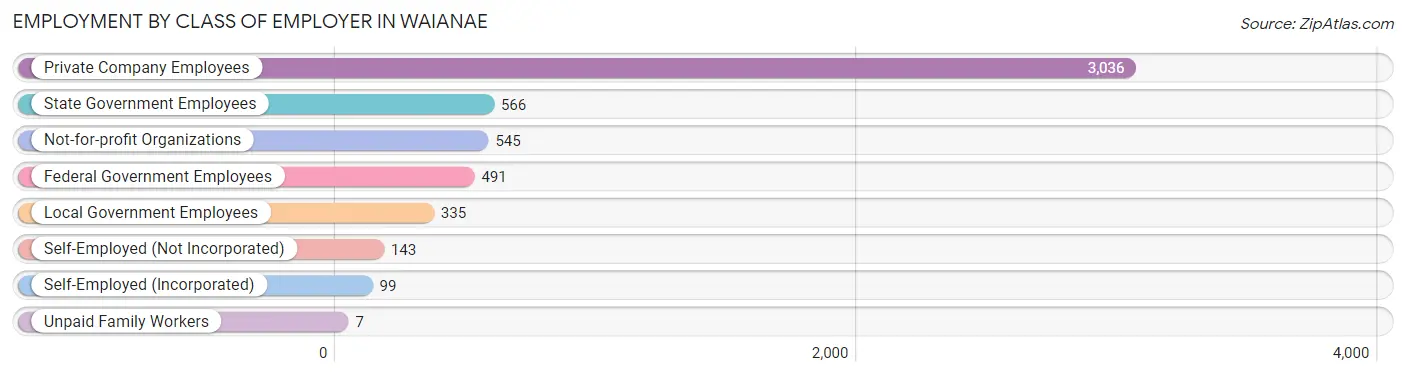
| Employer Class | # Employees | % Employees |
| Private Company Employees | 3,036 | 58.1% |
| Self-Employed (Incorporated) | 99 | 1.9% |
| Self-Employed (Not Incorporated) | 143 | 2.7% |
| Not-for-profit Organizations | 545 | 10.4% |
| Local Government Employees | 335 | 6.4% |
| State Government Employees | 566 | 10.8% |
| Federal Government Employees | 491 | 9.4% |
| Unpaid Family Workers | 7 | 0.1% |
| Total | 5,222 | 100.0% |
Employment Status by Age in Waianae
According to the labor force statistics for Waianae, out of the total population over 16 years of age (9,941), 60.7% or 6,034 individuals are in the labor force, with 9.7% or 585 of them unemployed. The age group with the highest labor force participation rate is 35 to 44 years, with 82.9% or 1,562 individuals in the labor force. Within the labor force, the 16 to 19 years age range has the highest percentage of unemployed individuals, with 32.3% or 54 of them being unemployed.
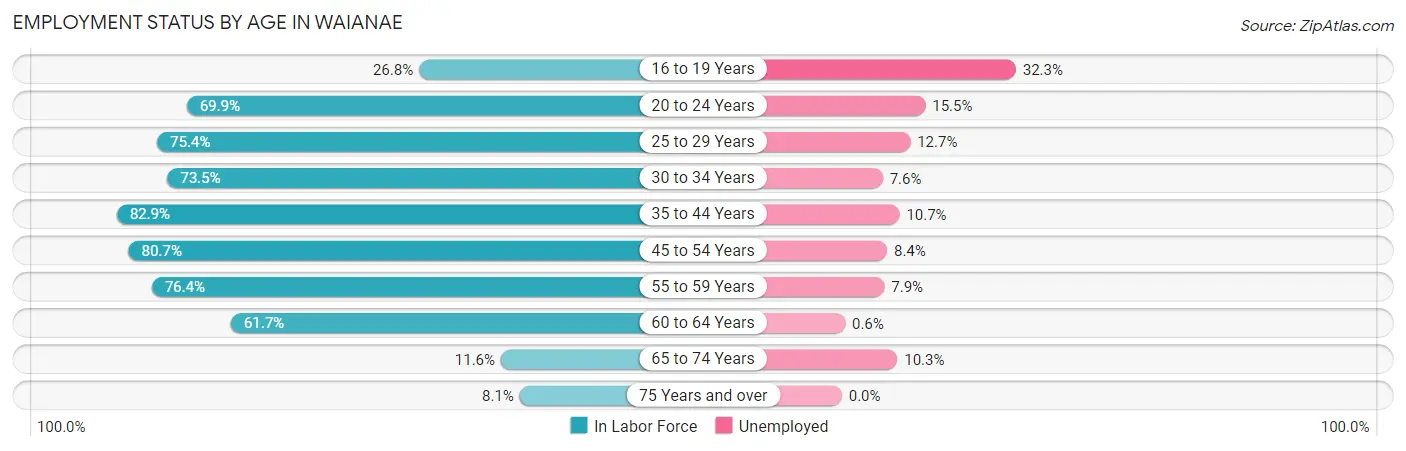
| Age Bracket | In Labor Force | Unemployed |
| 16 to 19 Years | 167 (26.8%) | 54 (32.3%) |
| 20 to 24 Years | 468 (69.9%) | 73 (15.5%) |
| 25 to 29 Years | 505 (75.4%) | 64 (12.7%) |
| 30 to 34 Years | 836 (73.5%) | 64 (7.6%) |
| 35 to 44 Years | 1,562 (82.9%) | 167 (10.7%) |
| 45 to 54 Years | 1,186 (80.7%) | 100 (8.4%) |
| 55 to 59 Years | 579 (76.4%) | 46 (7.9%) |
| 60 to 64 Years | 533 (61.7%) | 3 (0.6%) |
| 65 to 74 Years | 146 (11.6%) | 15 (10.3%) |
| 75 Years and over | 49 (8.1%) | 0 (0.0%) |
| Total | 6,034 (60.7%) | 585 (9.7%) |
Employment Status by Educational Attainment in Waianae
According to labor force statistics for Waianae, 76.7% of individuals (5,203) out of the total population between 25 and 64 years of age (6,783) are in the labor force, with 8.5% or 442 of them being unemployed. The group with the highest labor force participation rate are those with the educational attainment of bachelor's degree or higher, with 93.0% or 1,031 individuals in the labor force. Within the labor force, individuals with less than high school education have the highest percentage of unemployment, with 12.8% or 31 of them being unemployed.
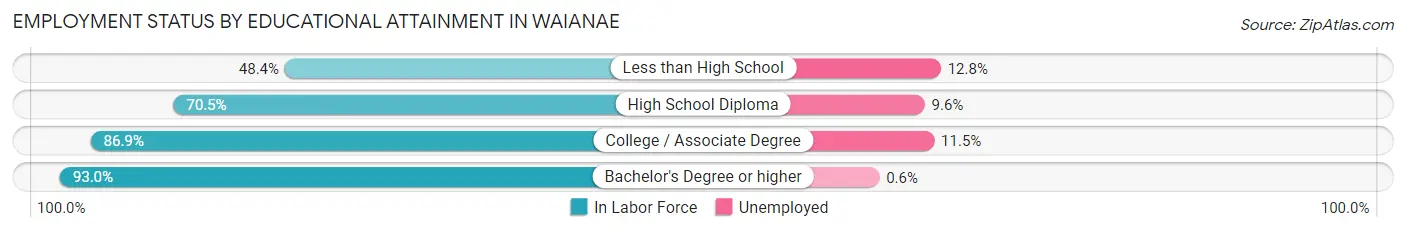
| Educational Attainment | In Labor Force | Unemployed |
| Less than High School | 243 (48.4%) | 64 (12.8%) |
| High School Diploma | 2,448 (70.5%) | 333 (9.6%) |
| College / Associate Degree | 1,477 (86.9%) | 196 (11.5%) |
| Bachelor's Degree or higher | 1,031 (93.0%) | 7 (0.6%) |
| Total | 5,203 (76.7%) | 577 (8.5%) |
Employment Occupations by Sex in Waianae
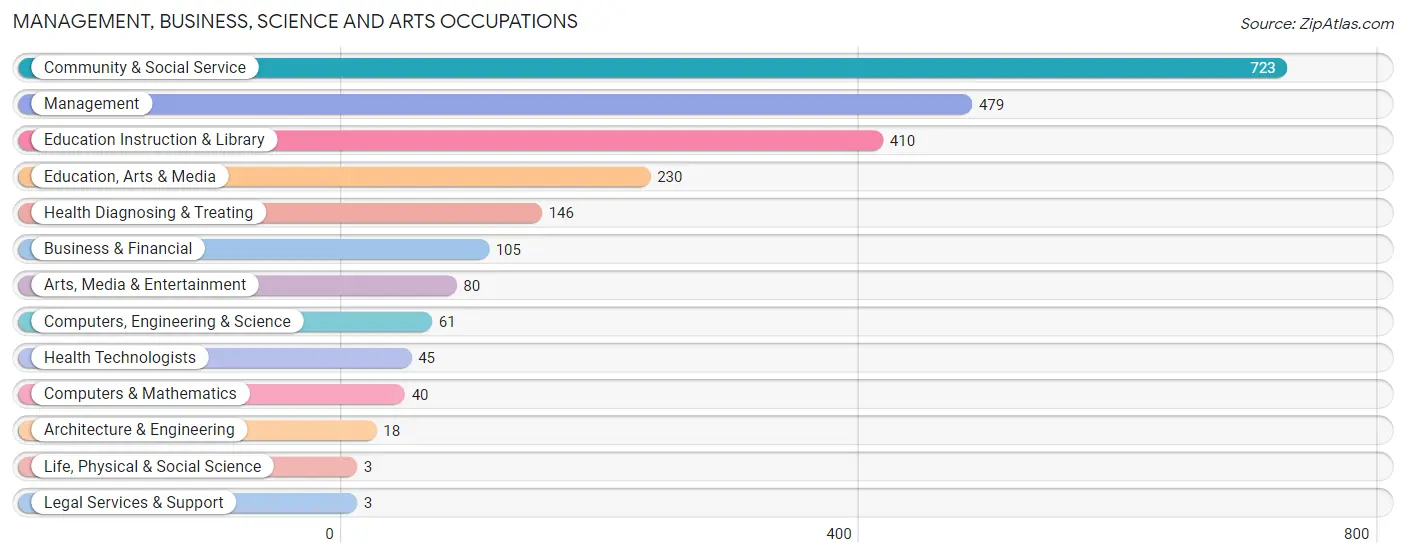
Management, Business, Science and Arts Occupations
The most common Management, Business, Science and Arts occupations in Waianae are Community & Social Service (723 | 13.5%), Management (479 | 8.9%), Education Instruction & Library (410 | 7.6%), Education, Arts & Media (230 | 4.3%), and Health Diagnosing & Treating (146 | 2.7%).
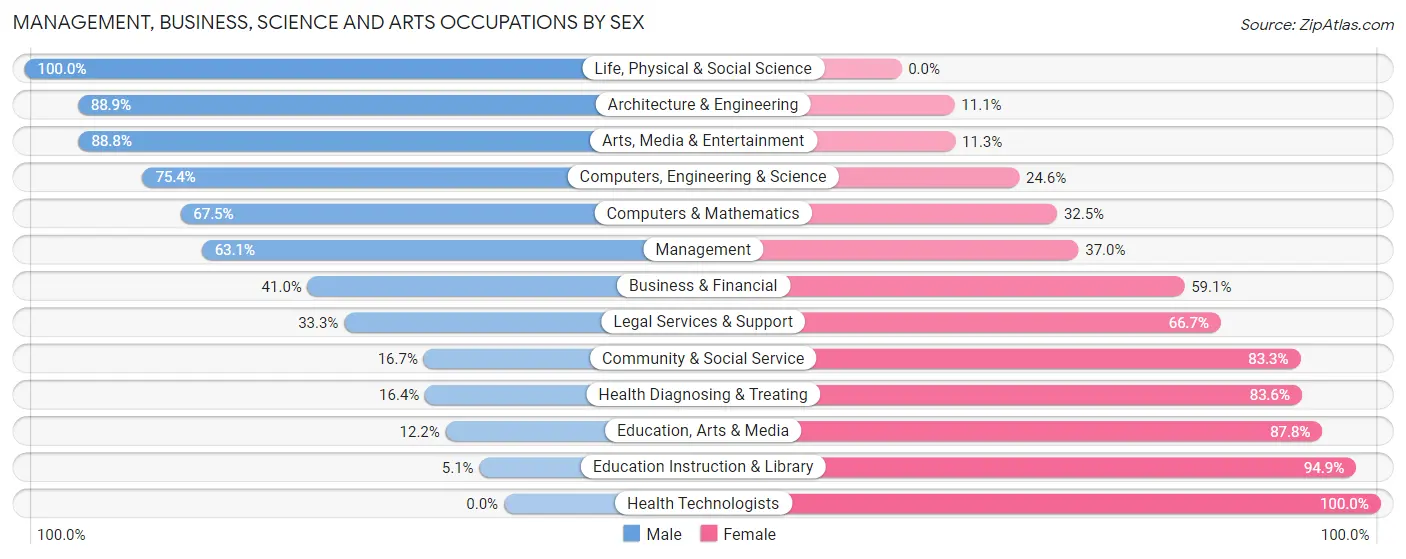
Management, Business, Science and Arts Occupations by Sex
Within the Management, Business, Science and Arts occupations in Waianae, the most male-oriented occupations are Life, Physical & Social Science (100.0%), Architecture & Engineering (88.9%), and Arts, Media & Entertainment (88.7%), while the most female-oriented occupations are Health Technologists (100.0%), Education Instruction & Library (94.9%), and Education, Arts & Media (87.8%).
| Occupation | Male | Female |
| Management | 302 (63.0%) | 177 (36.9%) |
| Business & Financial | 43 (40.9%) | 62 (59.1%) |
| Computers, Engineering & Science | 46 (75.4%) | 15 (24.6%) |
| Computers & Mathematics | 27 (67.5%) | 13 (32.5%) |
| Architecture & Engineering | 16 (88.9%) | 2 (11.1%) |
| Life, Physical & Social Science | 3 (100.0%) | 0 (0.0%) |
| Community & Social Service | 121 (16.7%) | 602 (83.3%) |
| Education, Arts & Media | 28 (12.2%) | 202 (87.8%) |
| Legal Services & Support | 1 (33.3%) | 2 (66.7%) |
| Education Instruction & Library | 21 (5.1%) | 389 (94.9%) |
| Arts, Media & Entertainment | 71 (88.7%) | 9 (11.3%) |
| Health Diagnosing & Treating | 24 (16.4%) | 122 (83.6%) |
| Health Technologists | 0 (0.0%) | 45 (100.0%) |
| Total (Category) | 536 (35.4%) | 978 (64.6%) |
| Total (Overall) | 2,697 (50.2%) | 2,671 (49.8%) |
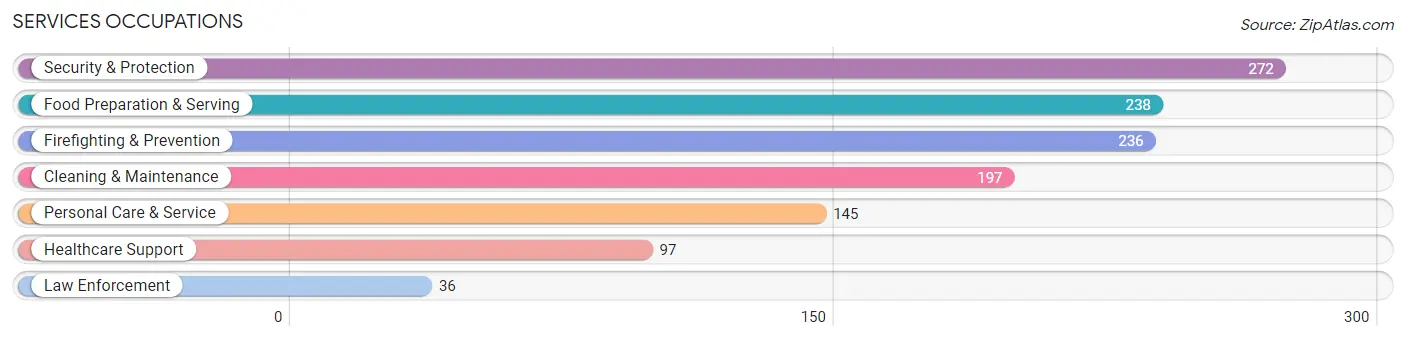
Services Occupations
The most common Services occupations in Waianae are Security & Protection (272 | 5.1%), Food Preparation & Serving (238 | 4.4%), Firefighting & Prevention (236 | 4.4%), Cleaning & Maintenance (197 | 3.7%), and Personal Care & Service (145 | 2.7%).
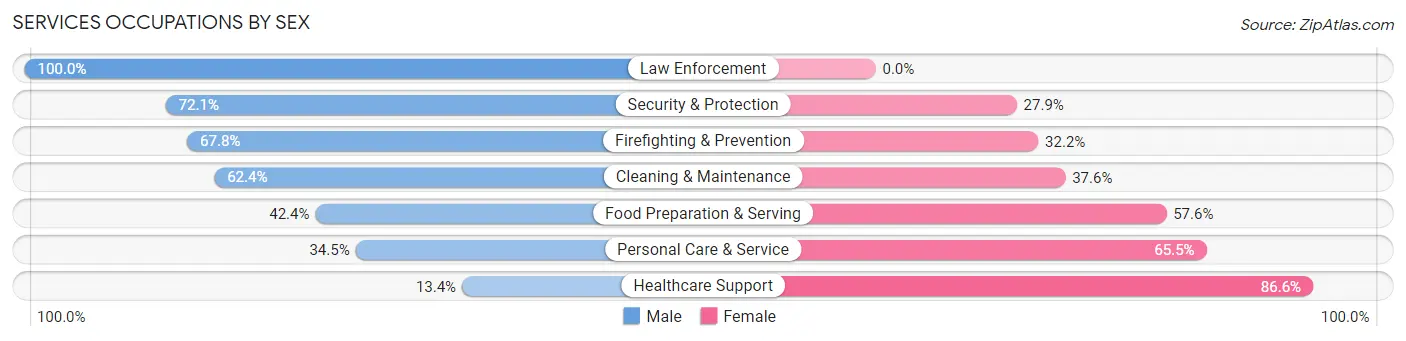
Services Occupations by Sex
Within the Services occupations in Waianae, the most male-oriented occupations are Law Enforcement (100.0%), Security & Protection (72.1%), and Firefighting & Prevention (67.8%), while the most female-oriented occupations are Healthcare Support (86.6%), Personal Care & Service (65.5%), and Food Preparation & Serving (57.6%).
| Occupation | Male | Female |
| Healthcare Support | 13 (13.4%) | 84 (86.6%) |
| Security & Protection | 196 (72.1%) | 76 (27.9%) |
| Firefighting & Prevention | 160 (67.8%) | 76 (32.2%) |
| Law Enforcement | 36 (100.0%) | 0 (0.0%) |
| Food Preparation & Serving | 101 (42.4%) | 137 (57.6%) |
| Cleaning & Maintenance | 123 (62.4%) | 74 (37.6%) |
| Personal Care & Service | 50 (34.5%) | 95 (65.5%) |
| Total (Category) | 483 (50.9%) | 466 (49.1%) |
| Total (Overall) | 2,697 (50.2%) | 2,671 (49.8%) |
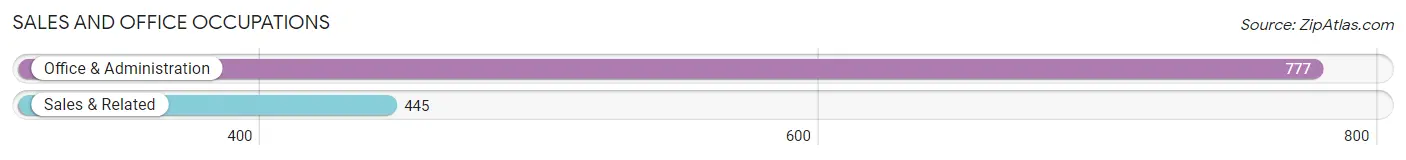
Sales and Office Occupations
The most common Sales and Office occupations in Waianae are Office & Administration (777 | 14.5%), and Sales & Related (445 | 8.3%).
Sales and Office Occupations by Sex
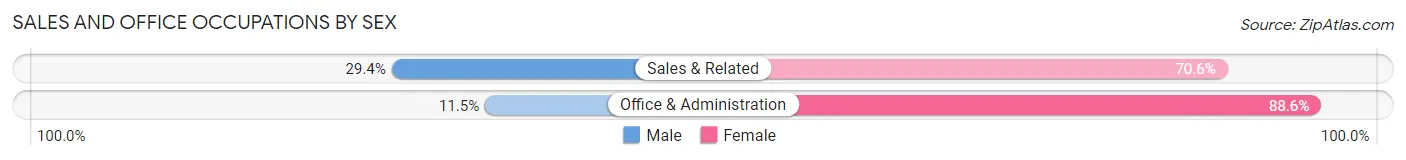
| Occupation | Male | Female |
| Sales & Related | 131 (29.4%) | 314 (70.6%) |
| Office & Administration | 89 (11.5%) | 688 (88.5%) |
| Total (Category) | 220 (18.0%) | 1,002 (82.0%) |
| Total (Overall) | 2,697 (50.2%) | 2,671 (49.8%) |
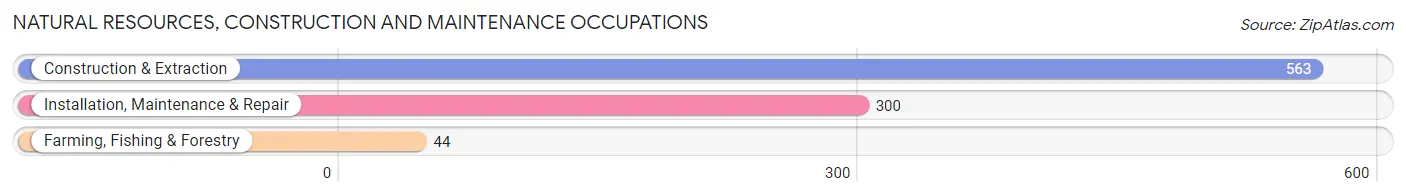
Natural Resources, Construction and Maintenance Occupations
The most common Natural Resources, Construction and Maintenance occupations in Waianae are Construction & Extraction (563 | 10.5%), Installation, Maintenance & Repair (300 | 5.6%), and Farming, Fishing & Forestry (44 | 0.8%).
Natural Resources, Construction and Maintenance Occupations by Sex

| Occupation | Male | Female |
| Farming, Fishing & Forestry | 44 (100.0%) | 0 (0.0%) |
| Construction & Extraction | 563 (100.0%) | 0 (0.0%) |
| Installation, Maintenance & Repair | 257 (85.7%) | 43 (14.3%) |
| Total (Category) | 864 (95.3%) | 43 (4.7%) |
| Total (Overall) | 2,697 (50.2%) | 2,671 (49.8%) |
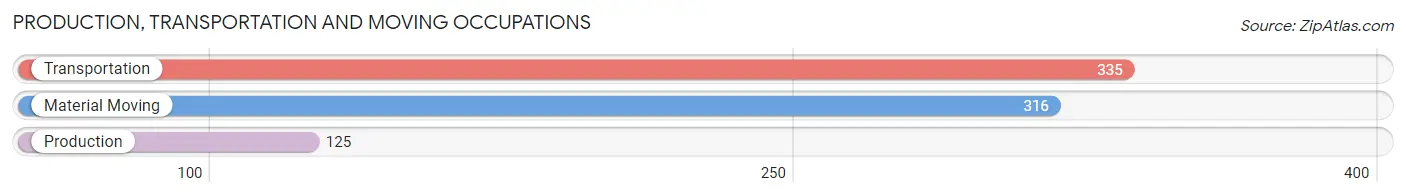
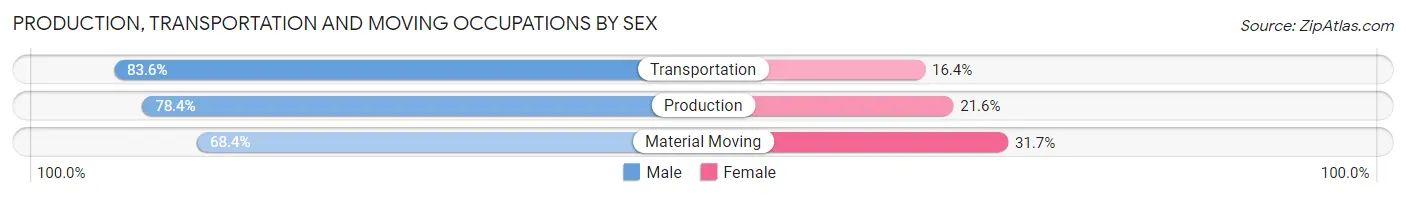
Production, Transportation and Moving Occupations
The most common Production, Transportation and Moving occupations in Waianae are Transportation (335 | 6.2%), Material Moving (316 | 5.9%), and Production (125 | 2.3%).
Production, Transportation and Moving Occupations by Sex
| Occupation | Male | Female |
| Production | 98 (78.4%) | 27 (21.6%) |
| Transportation | 280 (83.6%) | 55 (16.4%) |
| Material Moving | 216 (68.3%) | 100 (31.7%) |
| Total (Category) | 594 (76.5%) | 182 (23.4%) |
| Total (Overall) | 2,697 (50.2%) | 2,671 (49.8%) |
Employment Industries by Sex in Waianae
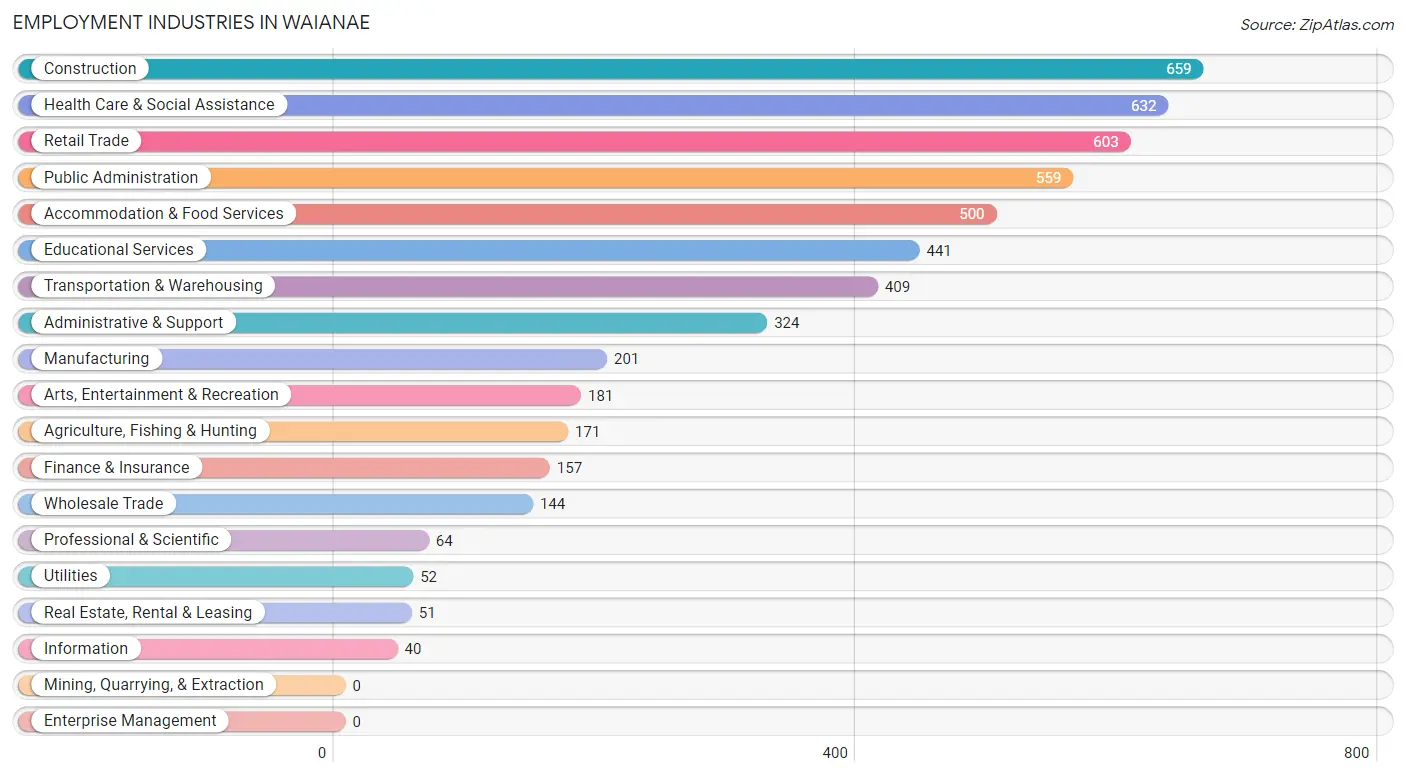
Employment Industries in Waianae
The major employment industries in Waianae include Construction (659 | 12.3%), Health Care & Social Assistance (632 | 11.8%), Retail Trade (603 | 11.2%), Public Administration (559 | 10.4%), and Accommodation & Food Services (500 | 9.3%).
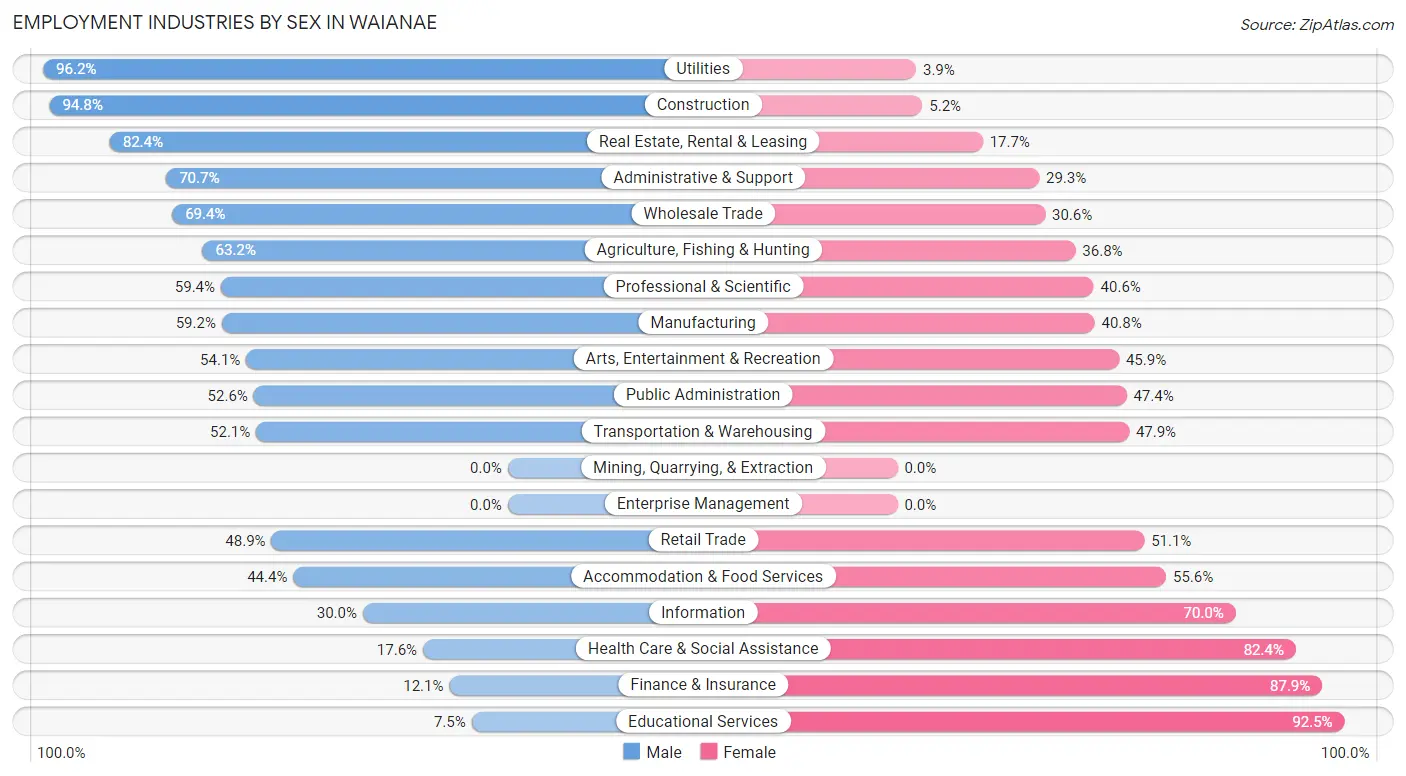
Employment Industries by Sex in Waianae
The Waianae industries that see more men than women are Utilities (96.2%), Construction (94.8%), and Real Estate, Rental & Leasing (82.4%), whereas the industries that tend to have a higher number of women are Educational Services (92.5%), Finance & Insurance (87.9%), and Health Care & Social Assistance (82.4%).
| Industry | Male | Female |
| Agriculture, Fishing & Hunting | 108 (63.2%) | 63 (36.8%) |
| Mining, Quarrying, & Extraction | 0 (0.0%) | 0 (0.0%) |
| Construction | 625 (94.8%) | 34 (5.2%) |
| Manufacturing | 119 (59.2%) | 82 (40.8%) |
| Wholesale Trade | 100 (69.4%) | 44 (30.6%) |
| Retail Trade | 295 (48.9%) | 308 (51.1%) |
| Transportation & Warehousing | 213 (52.1%) | 196 (47.9%) |
| Utilities | 50 (96.2%) | 2 (3.8%) |
| Information | 12 (30.0%) | 28 (70.0%) |
| Finance & Insurance | 19 (12.1%) | 138 (87.9%) |
| Real Estate, Rental & Leasing | 42 (82.4%) | 9 (17.6%) |
| Professional & Scientific | 38 (59.4%) | 26 (40.6%) |
| Enterprise Management | 0 (0.0%) | 0 (0.0%) |
| Administrative & Support | 229 (70.7%) | 95 (29.3%) |
| Educational Services | 33 (7.5%) | 408 (92.5%) |
| Health Care & Social Assistance | 111 (17.6%) | 521 (82.4%) |
| Arts, Entertainment & Recreation | 98 (54.1%) | 83 (45.9%) |
| Accommodation & Food Services | 222 (44.4%) | 278 (55.6%) |
| Public Administration | 294 (52.6%) | 265 (47.4%) |
| Total | 2,697 (50.2%) | 2,671 (49.8%) |
Education in Waianae
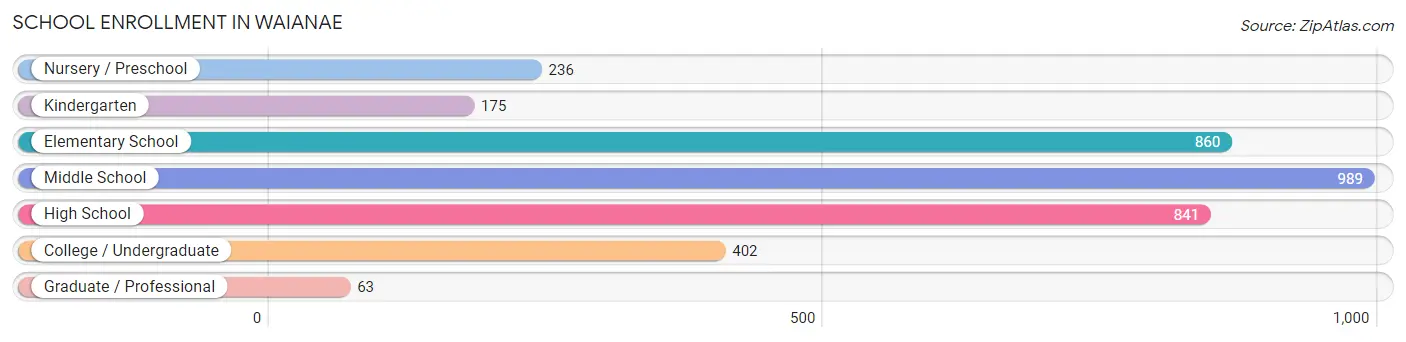
School Enrollment in Waianae
The most common levels of schooling among the 3,566 students in Waianae are middle school (989 | 27.7%), elementary school (860 | 24.1%), and high school (841 | 23.6%).
| School Level | # Students | % Students |
| Nursery / Preschool | 236 | 6.6% |
| Kindergarten | 175 | 4.9% |
| Elementary School | 860 | 24.1% |
| Middle School | 989 | 27.7% |
| High School | 841 | 23.6% |
| College / Undergraduate | 402 | 11.3% |
| Graduate / Professional | 63 | 1.8% |
| Total | 3,566 | 100.0% |
School Enrollment by Age by Funding Source in Waianae
Out of a total of 3,566 students who are enrolled in schools in Waianae, 678 (19.0%) attend a private institution, while the remaining 2,888 (81.0%) are enrolled in public schools. The age group of 3 to 4 year olds has the highest likelihood of being enrolled in private schools, with 110 (58.5% in the age bracket) enrolled. Conversely, the age group of 20 to 24 year olds has the lowest likelihood of being enrolled in a private school, with 142 (88.7% in the age bracket) attending a public institution.
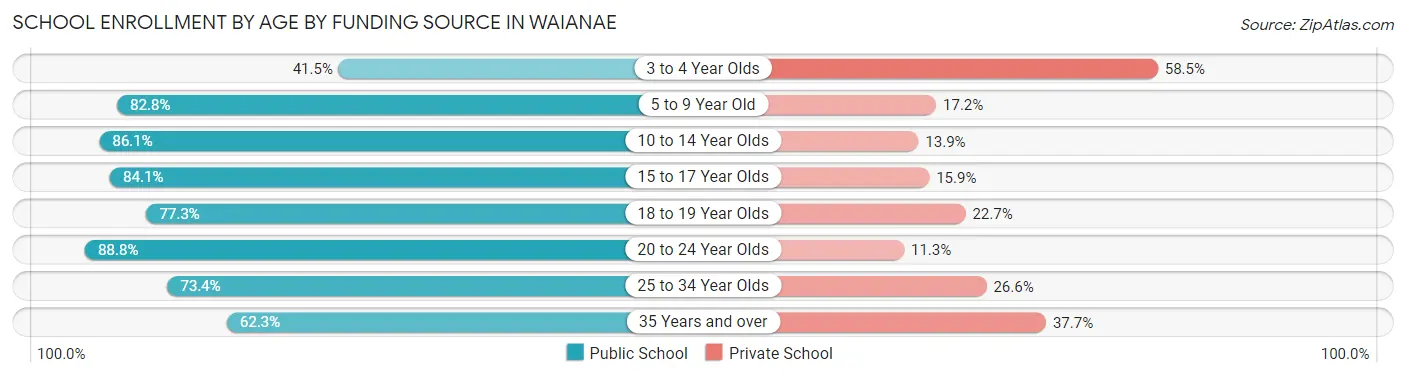
| Age Bracket | Public School | Private School |
| 3 to 4 Year Olds | 78 (41.5%) | 110 (58.5%) |
| 5 to 9 Year Old | 803 (82.8%) | 167 (17.2%) |
| 10 to 14 Year Olds | 1,082 (86.1%) | 175 (13.9%) |
| 15 to 17 Year Olds | 538 (84.1%) | 102 (15.9%) |
| 18 to 19 Year Olds | 92 (77.3%) | 27 (22.7%) |
| 20 to 24 Year Olds | 142 (88.7%) | 18 (11.3%) |
| 25 to 34 Year Olds | 69 (73.4%) | 25 (26.6%) |
| 35 Years and over | 86 (62.3%) | 52 (37.7%) |
| Total | 2,888 (81.0%) | 678 (19.0%) |
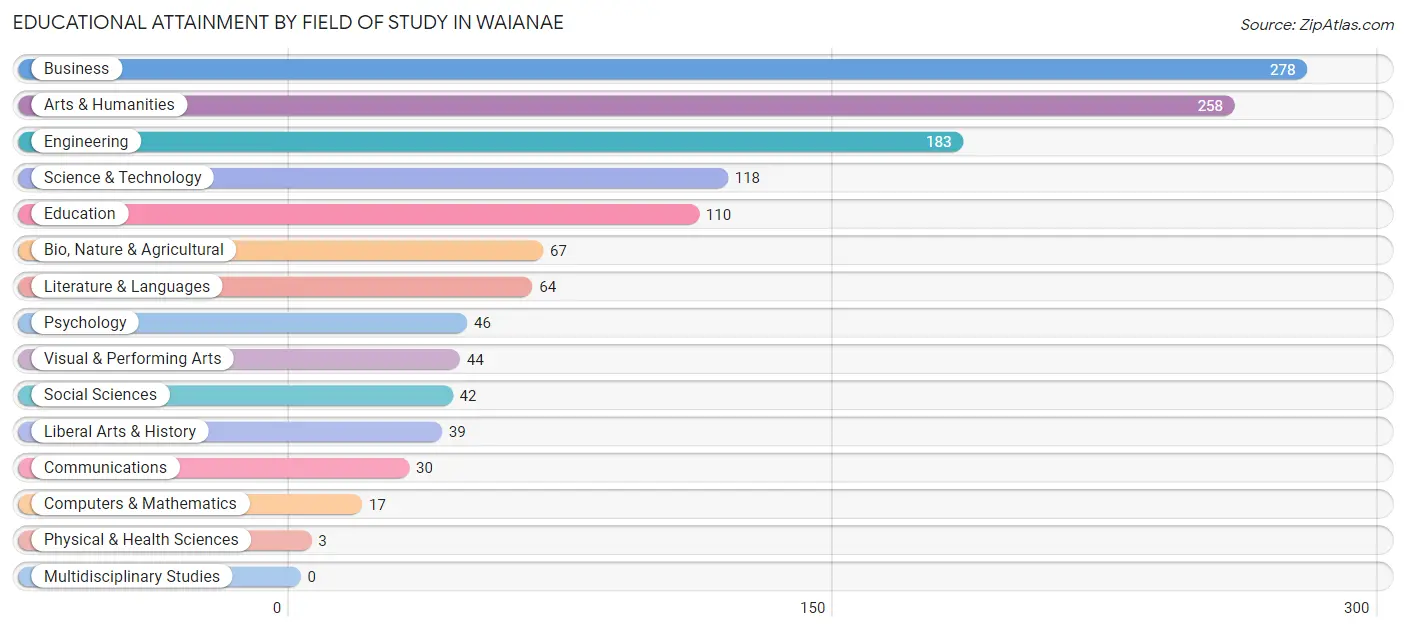
Educational Attainment by Field of Study in Waianae
Business (278 | 21.4%), arts & humanities (258 | 19.9%), engineering (183 | 14.1%), science & technology (118 | 9.1%), and education (110 | 8.5%) are the most common fields of study among 1,299 individuals in Waianae who have obtained a bachelor's degree or higher.
| Field of Study | # Graduates | % Graduates |
| Computers & Mathematics | 17 | 1.3% |
| Bio, Nature & Agricultural | 67 | 5.2% |
| Physical & Health Sciences | 3 | 0.2% |
| Psychology | 46 | 3.5% |
| Social Sciences | 42 | 3.2% |
| Engineering | 183 | 14.1% |
| Multidisciplinary Studies | 0 | 0.0% |
| Science & Technology | 118 | 9.1% |
| Business | 278 | 21.4% |
| Education | 110 | 8.5% |
| Literature & Languages | 64 | 4.9% |
| Liberal Arts & History | 39 | 3.0% |
| Visual & Performing Arts | 44 | 3.4% |
| Communications | 30 | 2.3% |
| Arts & Humanities | 258 | 19.9% |
| Total | 1,299 | 100.0% |
Transportation & Commute in Waianae
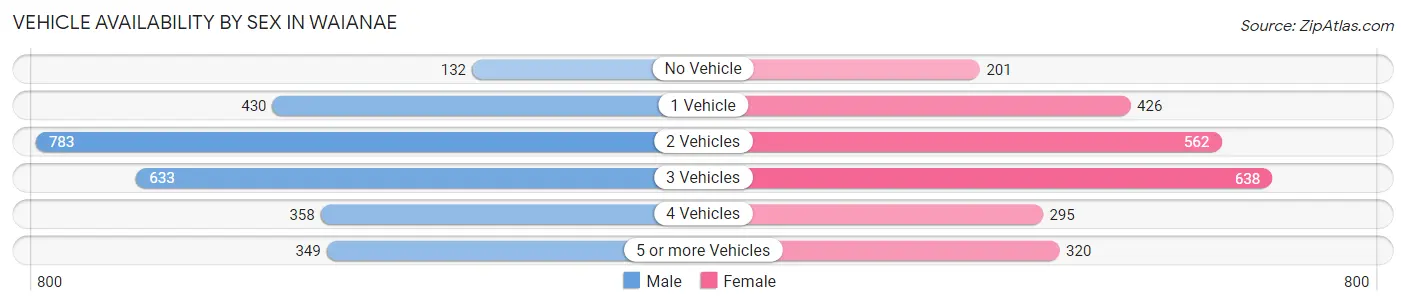
Vehicle Availability by Sex in Waianae
The most prevalent vehicle ownership categories in Waianae are males with 2 vehicles (783, accounting for 29.2%) and females with 2 vehicles (562, making up 32.1%).
| Vehicles Available | Male | Female |
| No Vehicle | 132 (4.9%) | 201 (8.2%) |
| 1 Vehicle | 430 (16.0%) | 426 (17.4%) |
| 2 Vehicles | 783 (29.2%) | 562 (23.0%) |
| 3 Vehicles | 633 (23.6%) | 638 (26.1%) |
| 4 Vehicles | 358 (13.3%) | 295 (12.1%) |
| 5 or more Vehicles | 349 (13.0%) | 320 (13.1%) |
| Total | 2,685 (100.0%) | 2,442 (100.0%) |
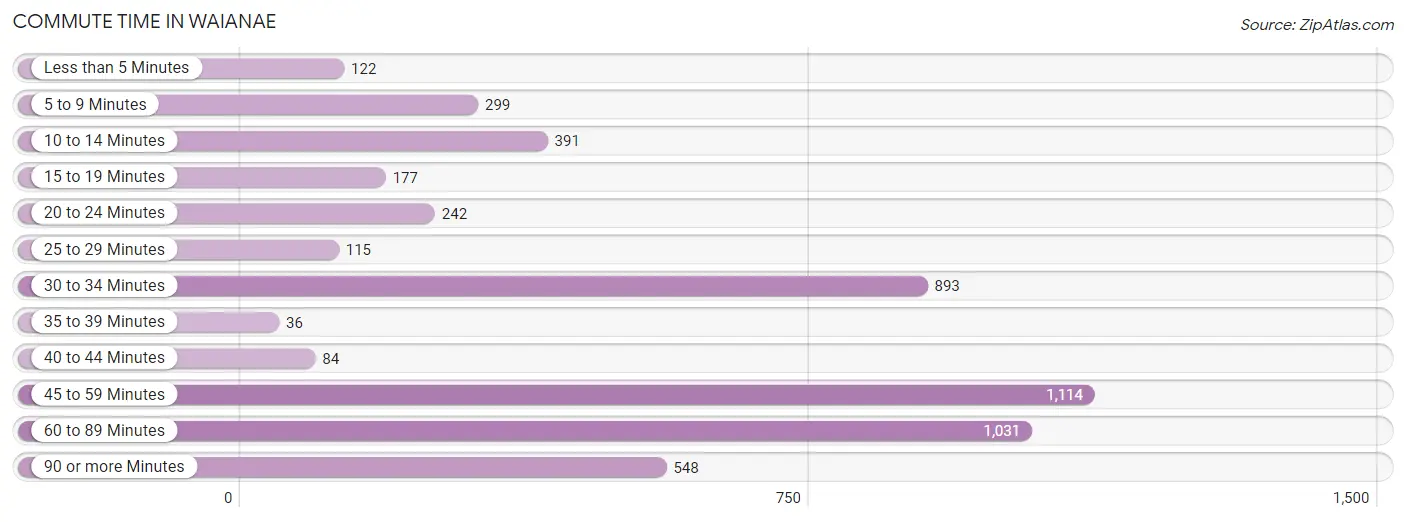
Commute Time in Waianae
The most frequently occuring commute durations in Waianae are 45 to 59 minutes (1,114 commuters, 22.1%), 60 to 89 minutes (1,031 commuters, 20.4%), and 30 to 34 minutes (893 commuters, 17.7%).
| Commute Time | # Commuters | % Commuters |
| Less than 5 Minutes | 122 | 2.4% |
| 5 to 9 Minutes | 299 | 5.9% |
| 10 to 14 Minutes | 391 | 7.7% |
| 15 to 19 Minutes | 177 | 3.5% |
| 20 to 24 Minutes | 242 | 4.8% |
| 25 to 29 Minutes | 115 | 2.3% |
| 30 to 34 Minutes | 893 | 17.7% |
| 35 to 39 Minutes | 36 | 0.7% |
| 40 to 44 Minutes | 84 | 1.7% |
| 45 to 59 Minutes | 1,114 | 22.1% |
| 60 to 89 Minutes | 1,031 | 20.4% |
| 90 or more Minutes | 548 | 10.8% |
Commute Time by Sex in Waianae
The most common commute times in Waianae are 45 to 59 minutes (671 commuters, 25.3%) for males and 45 to 59 minutes (443 commuters, 18.5%) for females.
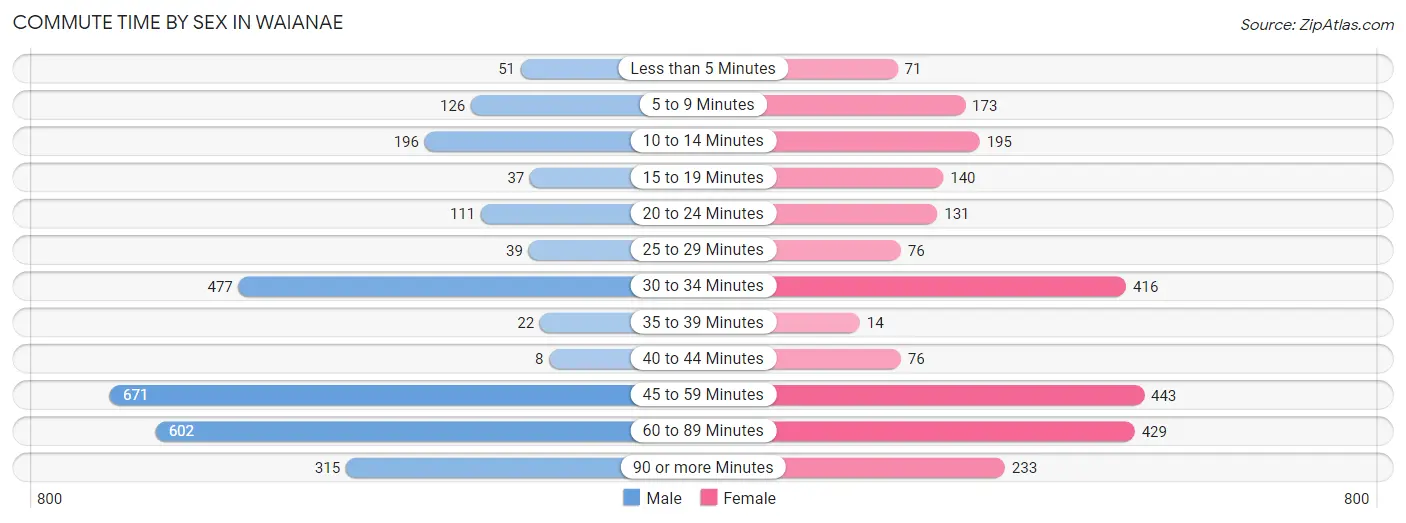
| Commute Time | Male | Female |
| Less than 5 Minutes | 51 (1.9%) | 71 (3.0%) |
| 5 to 9 Minutes | 126 (4.8%) | 173 (7.2%) |
| 10 to 14 Minutes | 196 (7.4%) | 195 (8.1%) |
| 15 to 19 Minutes | 37 (1.4%) | 140 (5.8%) |
| 20 to 24 Minutes | 111 (4.2%) | 131 (5.5%) |
| 25 to 29 Minutes | 39 (1.5%) | 76 (3.2%) |
| 30 to 34 Minutes | 477 (18.0%) | 416 (17.4%) |
| 35 to 39 Minutes | 22 (0.8%) | 14 (0.6%) |
| 40 to 44 Minutes | 8 (0.3%) | 76 (3.2%) |
| 45 to 59 Minutes | 671 (25.3%) | 443 (18.5%) |
| 60 to 89 Minutes | 602 (22.7%) | 429 (17.9%) |
| 90 or more Minutes | 315 (11.9%) | 233 (9.7%) |
Time of Departure to Work by Sex in Waianae
The most frequent times of departure to work in Waianae are 12:00 AM to 4:59 AM (712, 26.8%) for males and 12:00 AM to 4:59 AM (382, 15.9%) for females.
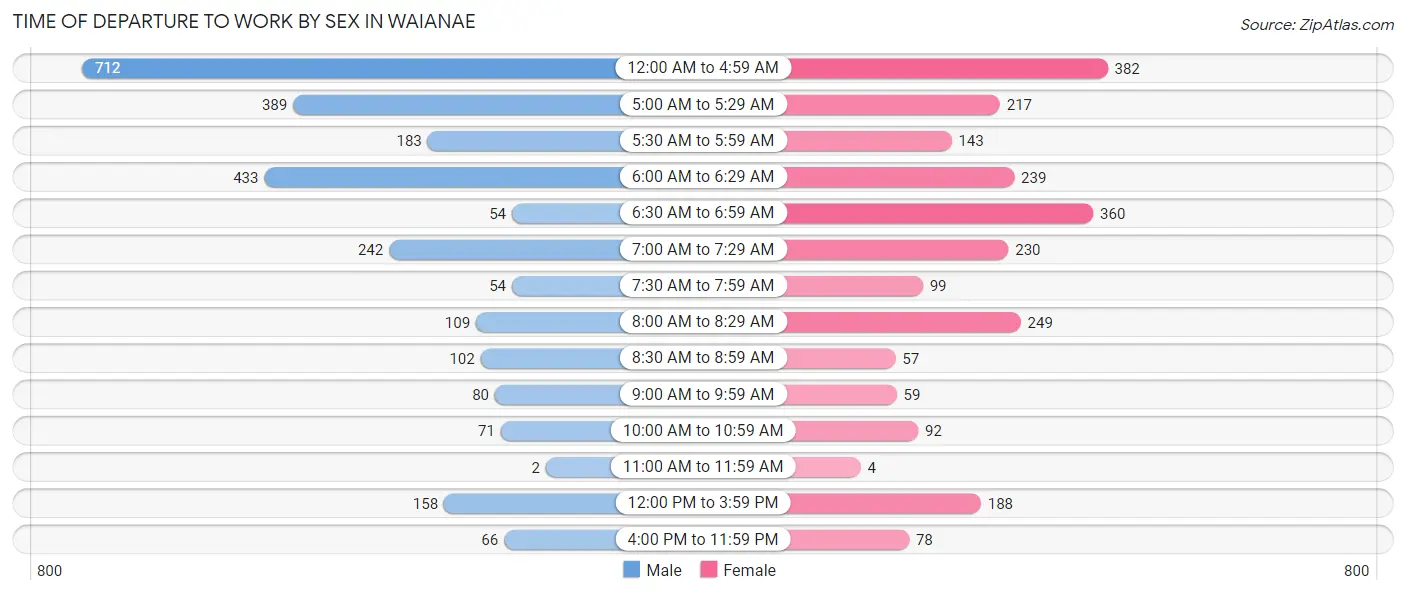
| Time of Departure | Male | Female |
| 12:00 AM to 4:59 AM | 712 (26.8%) | 382 (15.9%) |
| 5:00 AM to 5:29 AM | 389 (14.6%) | 217 (9.0%) |
| 5:30 AM to 5:59 AM | 183 (6.9%) | 143 (6.0%) |
| 6:00 AM to 6:29 AM | 433 (16.3%) | 239 (10.0%) |
| 6:30 AM to 6:59 AM | 54 (2.0%) | 360 (15.0%) |
| 7:00 AM to 7:29 AM | 242 (9.1%) | 230 (9.6%) |
| 7:30 AM to 7:59 AM | 54 (2.0%) | 99 (4.1%) |
| 8:00 AM to 8:29 AM | 109 (4.1%) | 249 (10.4%) |
| 8:30 AM to 8:59 AM | 102 (3.8%) | 57 (2.4%) |
| 9:00 AM to 9:59 AM | 80 (3.0%) | 59 (2.5%) |
| 10:00 AM to 10:59 AM | 71 (2.7%) | 92 (3.8%) |
| 11:00 AM to 11:59 AM | 2 (0.1%) | 4 (0.2%) |
| 12:00 PM to 3:59 PM | 158 (5.9%) | 188 (7.8%) |
| 4:00 PM to 11:59 PM | 66 (2.5%) | 78 (3.3%) |
| Total | 2,655 (100.0%) | 2,397 (100.0%) |
Housing Occupancy in Waianae
Occupancy by Ownership in Waianae
Of the total 3,510 dwellings in Waianae, owner-occupied units account for 2,260 (64.4%), while renter-occupied units make up 1,250 (35.6%).
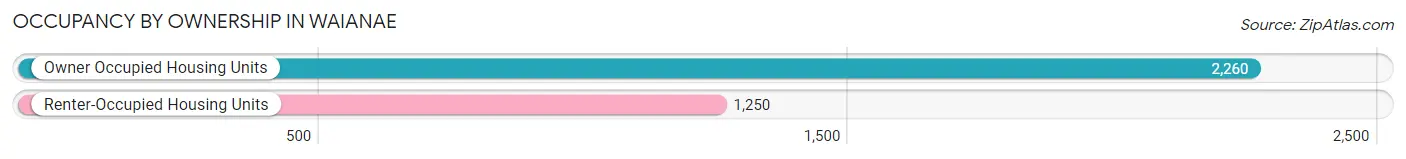
| Occupancy | # Housing Units | % Housing Units |
| Owner Occupied Housing Units | 2,260 | 64.4% |
| Renter-Occupied Housing Units | 1,250 | 35.6% |
| Total Occupied Housing Units | 3,510 | 100.0% |
Occupancy by Household Size in Waianae
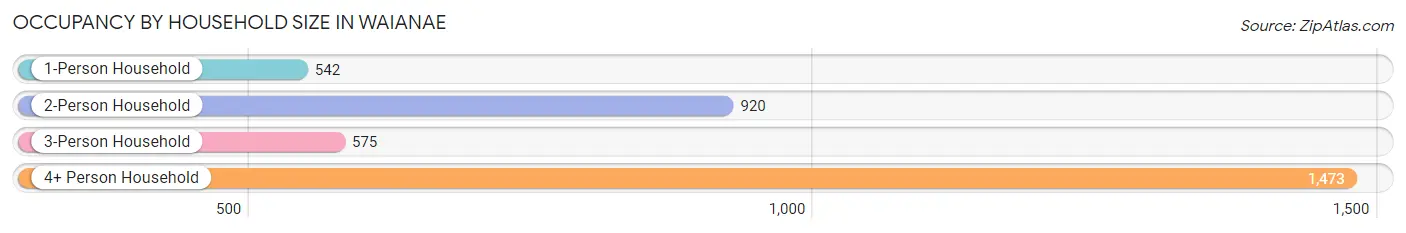
| Household Size | # Housing Units | % Housing Units |
| 1-Person Household | 542 | 15.4% |
| 2-Person Household | 920 | 26.2% |
| 3-Person Household | 575 | 16.4% |
| 4+ Person Household | 1,473 | 42.0% |
| Total Housing Units | 3,510 | 100.0% |
Occupancy by Ownership by Household Size in Waianae
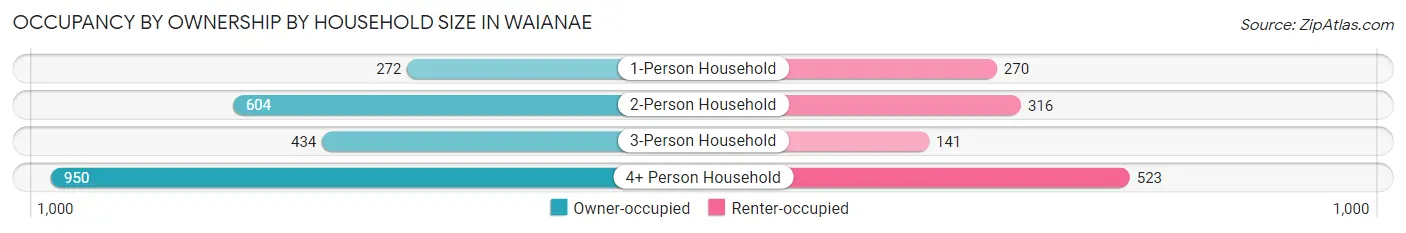
| Household Size | Owner-occupied | Renter-occupied |
| 1-Person Household | 272 (50.2%) | 270 (49.8%) |
| 2-Person Household | 604 (65.6%) | 316 (34.4%) |
| 3-Person Household | 434 (75.5%) | 141 (24.5%) |
| 4+ Person Household | 950 (64.5%) | 523 (35.5%) |
| Total Housing Units | 2,260 (64.4%) | 1,250 (35.6%) |
Occupancy by Educational Attainment in Waianae
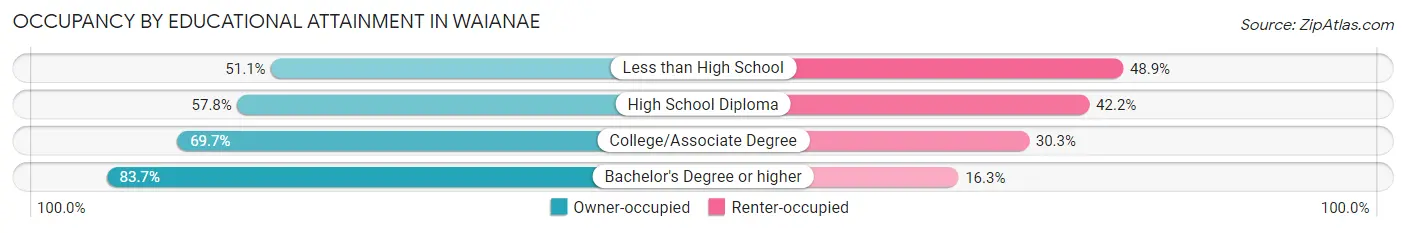
| Household Size | Owner-occupied | Renter-occupied |
| Less than High School | 191 (51.1%) | 183 (48.9%) |
| High School Diploma | 885 (57.8%) | 647 (42.2%) |
| College/Associate Degree | 793 (69.7%) | 344 (30.3%) |
| Bachelor's Degree or higher | 391 (83.7%) | 76 (16.3%) |
Occupancy by Age of Householder in Waianae
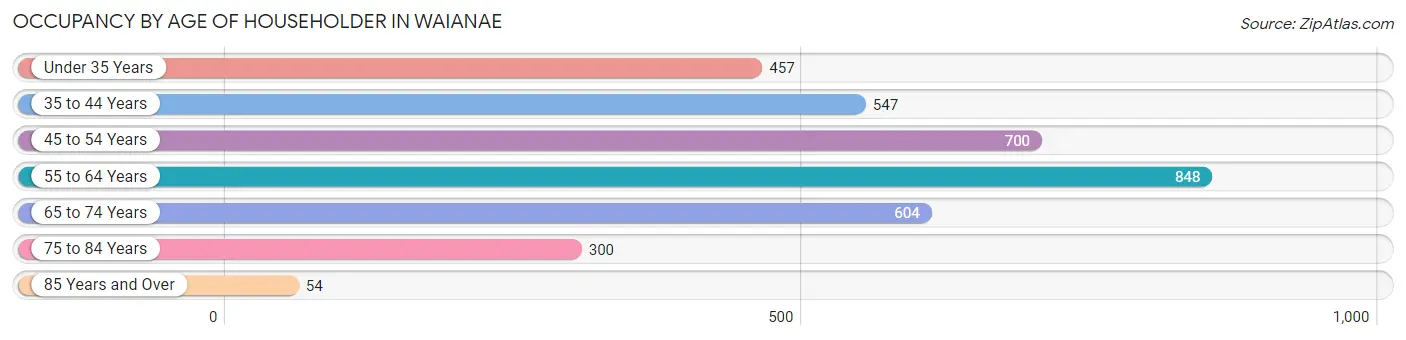
| Age Bracket | # Households | % Households |
| Under 35 Years | 457 | 13.0% |
| 35 to 44 Years | 547 | 15.6% |
| 45 to 54 Years | 700 | 19.9% |
| 55 to 64 Years | 848 | 24.2% |
| 65 to 74 Years | 604 | 17.2% |
| 75 to 84 Years | 300 | 8.6% |
| 85 Years and Over | 54 | 1.5% |
| Total | 3,510 | 100.0% |
Housing Finances in Waianae
Median Income by Occupancy in Waianae
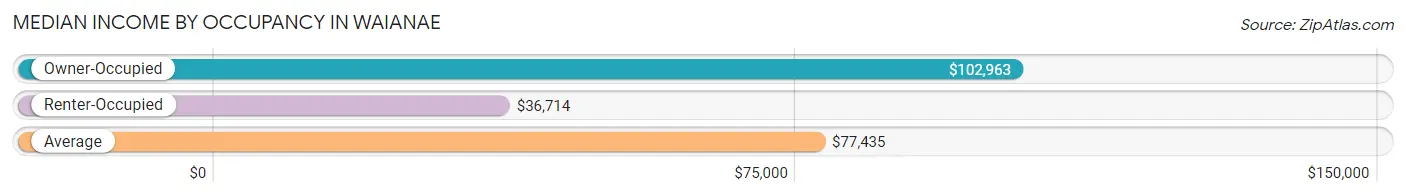
| Occupancy Type | # Households | Median Income |
| Owner-Occupied | 2,260 (64.4%) | $102,963 |
| Renter-Occupied | 1,250 (35.6%) | $36,714 |
| Average | 3,510 (100.0%) | $77,435 |
Occupancy by Householder Income Bracket in Waianae
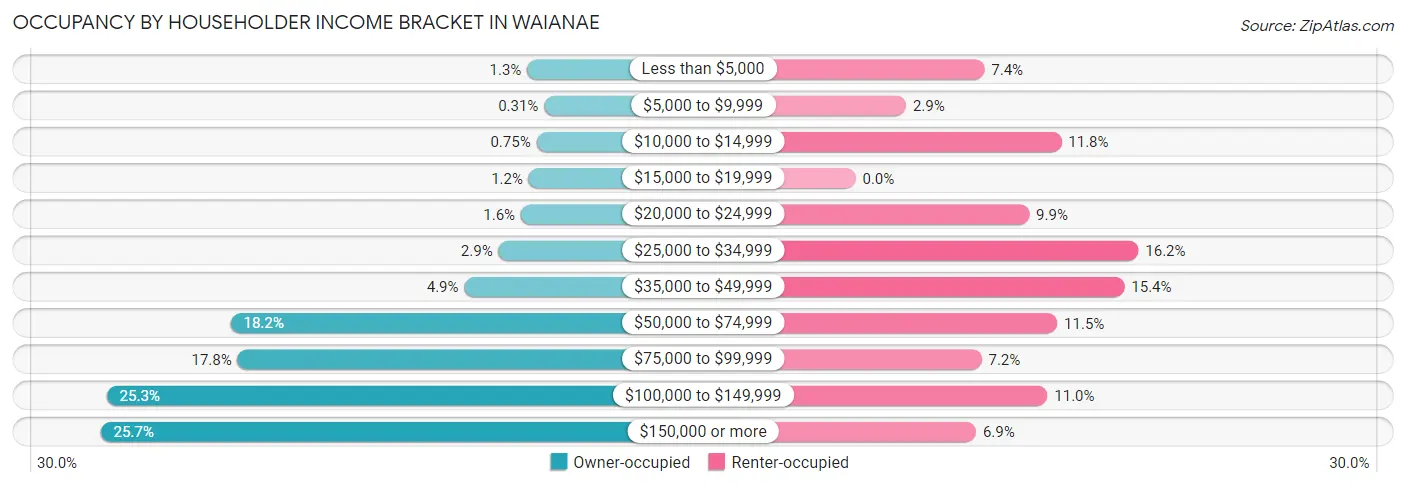
| Income Bracket | Owner-occupied | Renter-occupied |
| Less than $5,000 | 29 (1.3%) | 92 (7.4%) |
| $5,000 to $9,999 | 7 (0.3%) | 36 (2.9%) |
| $10,000 to $14,999 | 17 (0.7%) | 147 (11.8%) |
| $15,000 to $19,999 | 27 (1.2%) | 0 (0.0%) |
| $20,000 to $24,999 | 37 (1.6%) | 124 (9.9%) |
| $25,000 to $34,999 | 66 (2.9%) | 202 (16.2%) |
| $35,000 to $49,999 | 110 (4.9%) | 192 (15.4%) |
| $50,000 to $74,999 | 412 (18.2%) | 144 (11.5%) |
| $75,000 to $99,999 | 403 (17.8%) | 90 (7.2%) |
| $100,000 to $149,999 | 572 (25.3%) | 137 (11.0%) |
| $150,000 or more | 580 (25.7%) | 86 (6.9%) |
| Total | 2,260 (100.0%) | 1,250 (100.0%) |
Monthly Housing Cost Tiers in Waianae
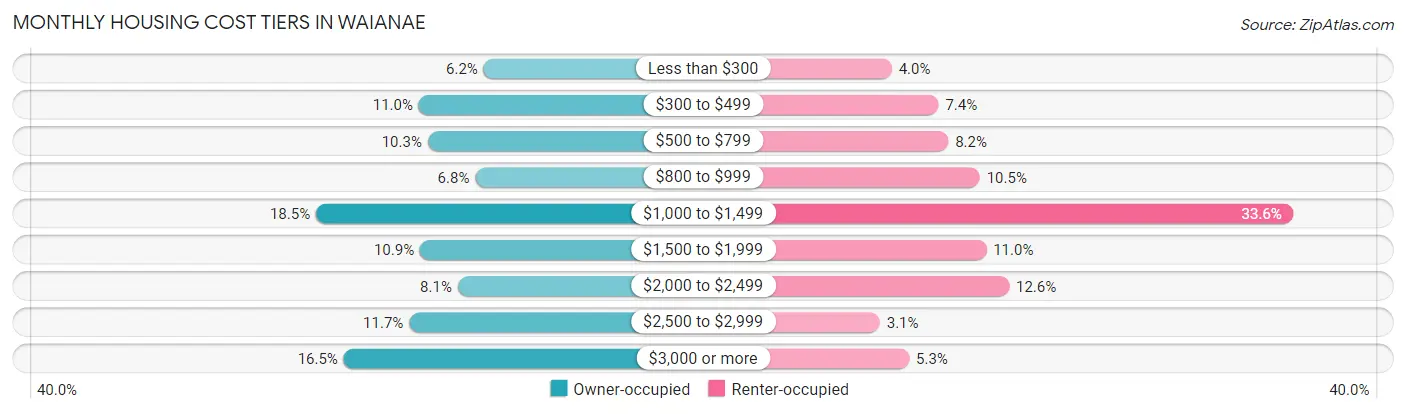
| Monthly Cost | Owner-occupied | Renter-occupied |
| Less than $300 | 140 (6.2%) | 50 (4.0%) |
| $300 to $499 | 248 (11.0%) | 93 (7.4%) |
| $500 to $799 | 233 (10.3%) | 102 (8.2%) |
| $800 to $999 | 154 (6.8%) | 131 (10.5%) |
| $1,000 to $1,499 | 419 (18.5%) | 420 (33.6%) |
| $1,500 to $1,999 | 246 (10.9%) | 137 (11.0%) |
| $2,000 to $2,499 | 183 (8.1%) | 158 (12.6%) |
| $2,500 to $2,999 | 264 (11.7%) | 39 (3.1%) |
| $3,000 or more | 373 (16.5%) | 66 (5.3%) |
| Total | 2,260 (100.0%) | 1,250 (100.0%) |
Physical Housing Characteristics in Waianae
Housing Structures in Waianae
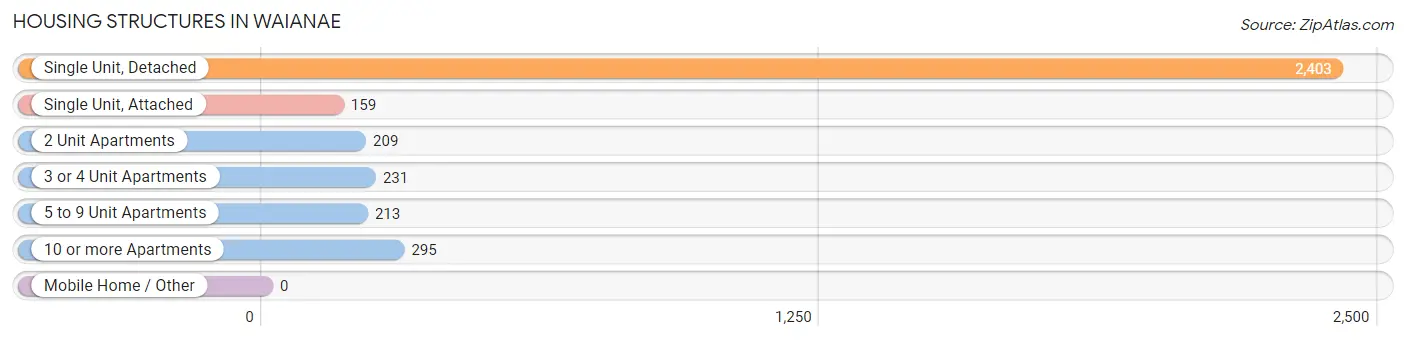
| Structure Type | # Housing Units | % Housing Units |
| Single Unit, Detached | 2,403 | 68.5% |
| Single Unit, Attached | 159 | 4.5% |
| 2 Unit Apartments | 209 | 5.9% |
| 3 or 4 Unit Apartments | 231 | 6.6% |
| 5 to 9 Unit Apartments | 213 | 6.1% |
| 10 or more Apartments | 295 | 8.4% |
| Mobile Home / Other | 0 | 0.0% |
| Total | 3,510 | 100.0% |
Housing Structures by Occupancy in Waianae
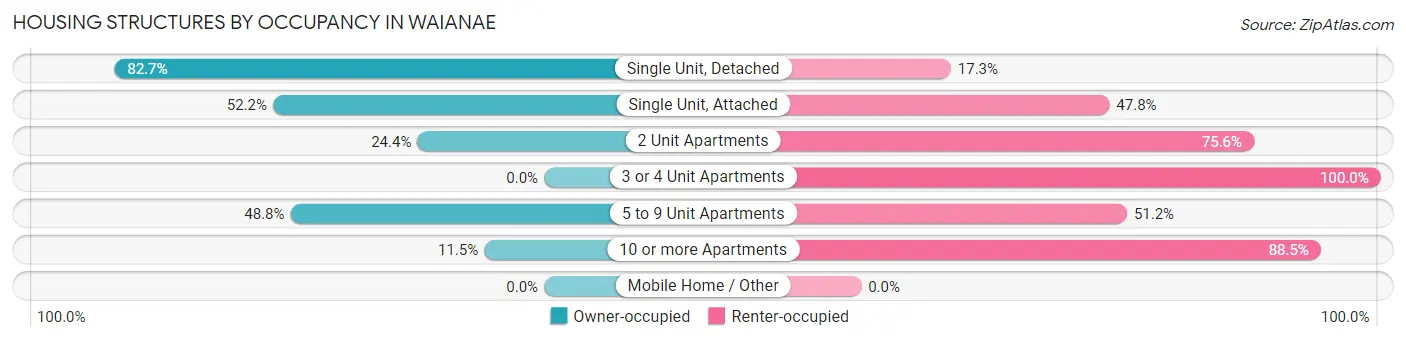
| Structure Type | Owner-occupied | Renter-occupied |
| Single Unit, Detached | 1,988 (82.7%) | 415 (17.3%) |
| Single Unit, Attached | 83 (52.2%) | 76 (47.8%) |
| 2 Unit Apartments | 51 (24.4%) | 158 (75.6%) |
| 3 or 4 Unit Apartments | 0 (0.0%) | 231 (100.0%) |
| 5 to 9 Unit Apartments | 104 (48.8%) | 109 (51.2%) |
| 10 or more Apartments | 34 (11.5%) | 261 (88.5%) |
| Mobile Home / Other | 0 (0.0%) | 0 (0.0%) |
| Total | 2,260 (64.4%) | 1,250 (35.6%) |
Housing Structures by Number of Rooms in Waianae
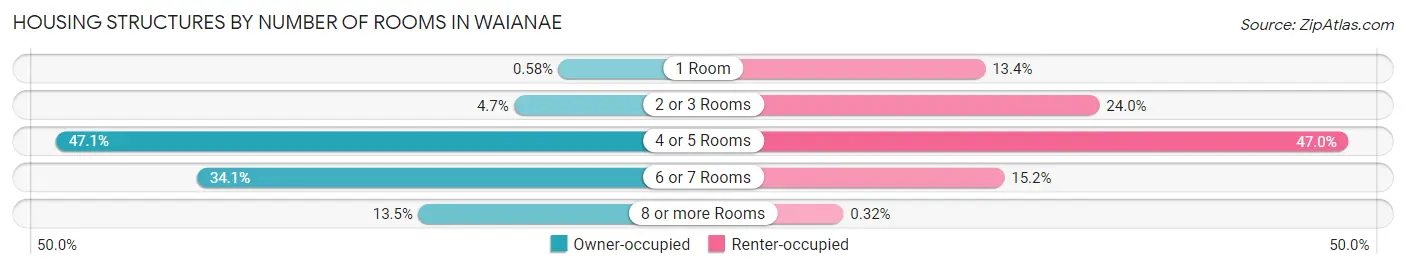
| Number of Rooms | Owner-occupied | Renter-occupied |
| 1 Room | 13 (0.6%) | 168 (13.4%) |
| 2 or 3 Rooms | 106 (4.7%) | 300 (24.0%) |
| 4 or 5 Rooms | 1,065 (47.1%) | 588 (47.0%) |
| 6 or 7 Rooms | 770 (34.1%) | 190 (15.2%) |
| 8 or more Rooms | 306 (13.5%) | 4 (0.3%) |
| Total | 2,260 (100.0%) | 1,250 (100.0%) |
Housing Structure by Heating Type in Waianae
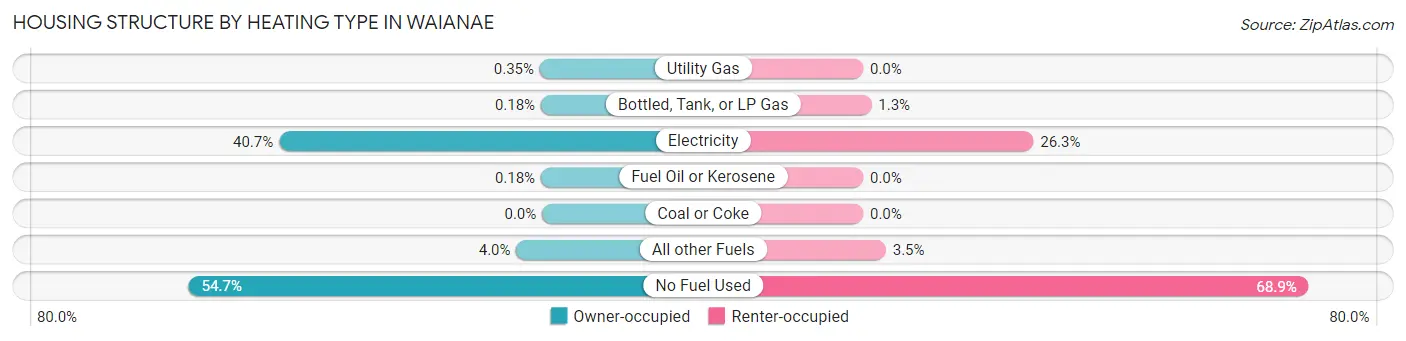
| Heating Type | Owner-occupied | Renter-occupied |
| Utility Gas | 8 (0.4%) | 0 (0.0%) |
| Bottled, Tank, or LP Gas | 4 (0.2%) | 16 (1.3%) |
| Electricity | 919 (40.7%) | 329 (26.3%) |
| Fuel Oil or Kerosene | 4 (0.2%) | 0 (0.0%) |
| Coal or Coke | 0 (0.0%) | 0 (0.0%) |
| All other Fuels | 90 (4.0%) | 44 (3.5%) |
| No Fuel Used | 1,235 (54.6%) | 861 (68.9%) |
| Total | 2,260 (100.0%) | 1,250 (100.0%) |
Household Vehicle Usage in Waianae
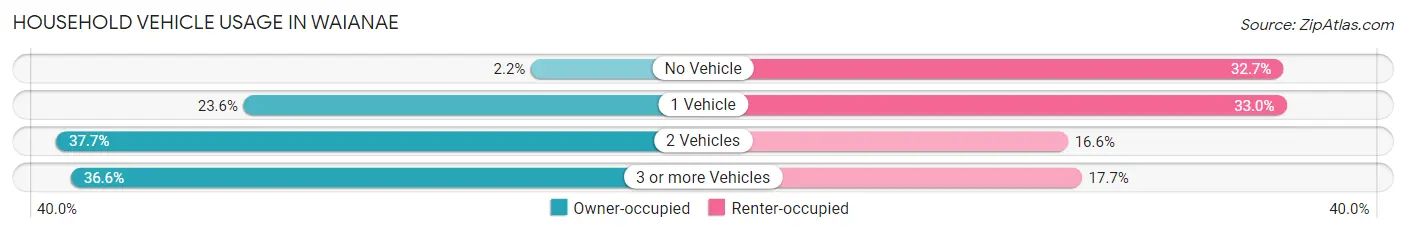
| Vehicles per Household | Owner-occupied | Renter-occupied |
| No Vehicle | 49 (2.2%) | 409 (32.7%) |
| 1 Vehicle | 534 (23.6%) | 412 (33.0%) |
| 2 Vehicles | 851 (37.7%) | 208 (16.6%) |
| 3 or more Vehicles | 826 (36.5%) | 221 (17.7%) |
| Total | 2,260 (100.0%) | 1,250 (100.0%) |
Real Estate & Mortgages in Waianae
Real Estate and Mortgage Overview in Waianae
| Characteristic | Without Mortgage | With Mortgage |
| Housing Units | 677 | 1,583 |
| Median Property Value | $447,500 | $500,600 |
| Median Household Income | $88,287 | $514 |
| Monthly Housing Costs | $474 | $373 |
| Real Estate Taxes | $813 | $123 |
Property Value by Mortgage Status in Waianae
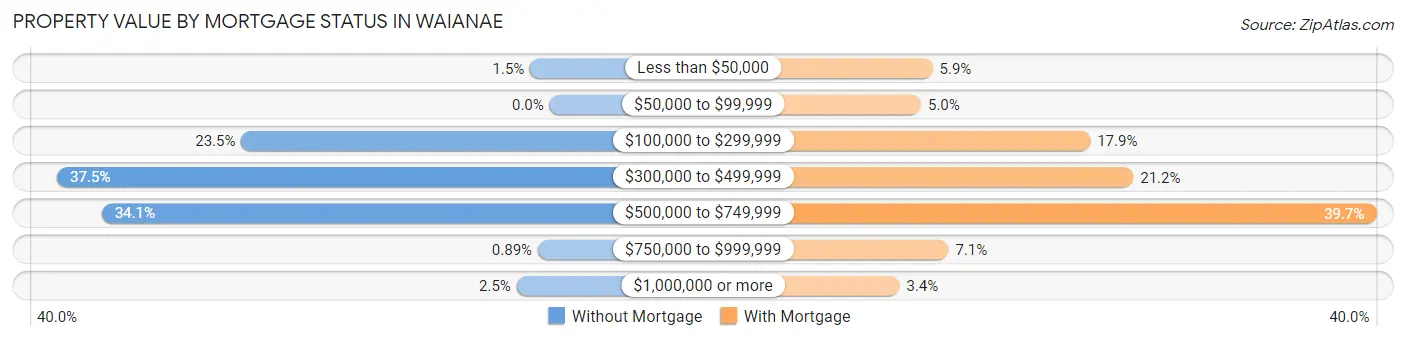
| Property Value | Without Mortgage | With Mortgage |
| Less than $50,000 | 10 (1.5%) | 93 (5.9%) |
| $50,000 to $99,999 | 0 (0.0%) | 79 (5.0%) |
| $100,000 to $299,999 | 159 (23.5%) | 283 (17.9%) |
| $300,000 to $499,999 | 254 (37.5%) | 335 (21.2%) |
| $500,000 to $749,999 | 231 (34.1%) | 628 (39.7%) |
| $750,000 to $999,999 | 6 (0.9%) | 112 (7.1%) |
| $1,000,000 or more | 17 (2.5%) | 53 (3.4%) |
| Total | 677 (100.0%) | 1,583 (100.0%) |
Household Income by Mortgage Status in Waianae
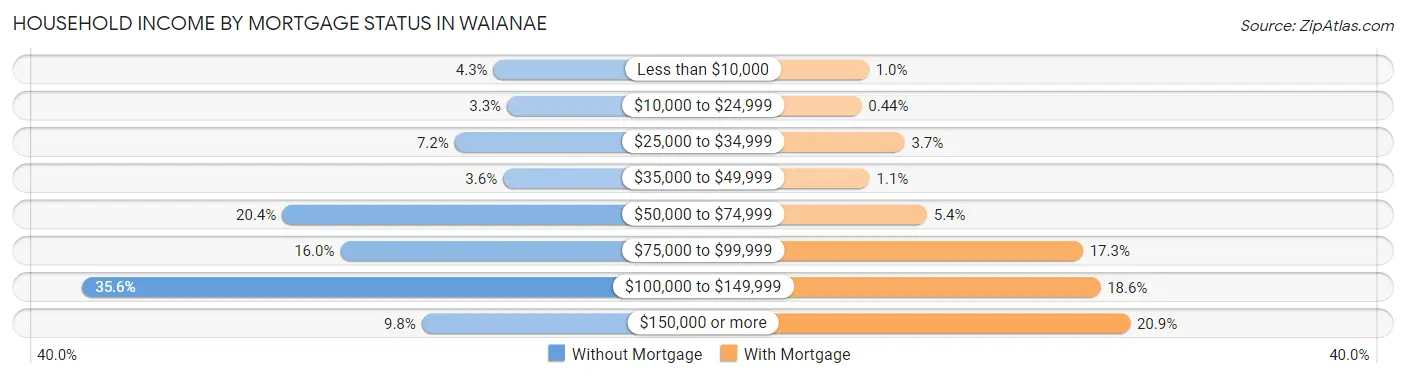
| Household Income | Without Mortgage | With Mortgage |
| Less than $10,000 | 29 (4.3%) | 16 (1.0%) |
| $10,000 to $24,999 | 22 (3.3%) | 7 (0.4%) |
| $25,000 to $34,999 | 49 (7.2%) | 59 (3.7%) |
| $35,000 to $49,999 | 24 (3.5%) | 17 (1.1%) |
| $50,000 to $74,999 | 138 (20.4%) | 86 (5.4%) |
| $75,000 to $99,999 | 108 (16.0%) | 274 (17.3%) |
| $100,000 to $149,999 | 241 (35.6%) | 295 (18.6%) |
| $150,000 or more | 66 (9.8%) | 331 (20.9%) |
| Total | 677 (100.0%) | 1,583 (100.0%) |
Property Value to Household Income Ratio in Waianae
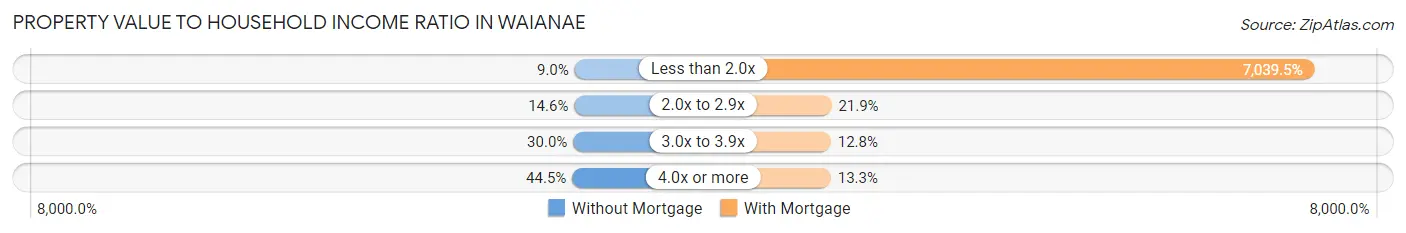
| Value-to-Income Ratio | Without Mortgage | With Mortgage |
| Less than 2.0x | 61 (9.0%) | 111,435 (7,039.5%) |
| 2.0x to 2.9x | 99 (14.6%) | 346 (21.9%) |
| 3.0x to 3.9x | 203 (30.0%) | 202 (12.8%) |
| 4.0x or more | 301 (44.5%) | 211 (13.3%) |
| Total | 677 (100.0%) | 1,583 (100.0%) |
Real Estate Taxes by Mortgage Status in Waianae
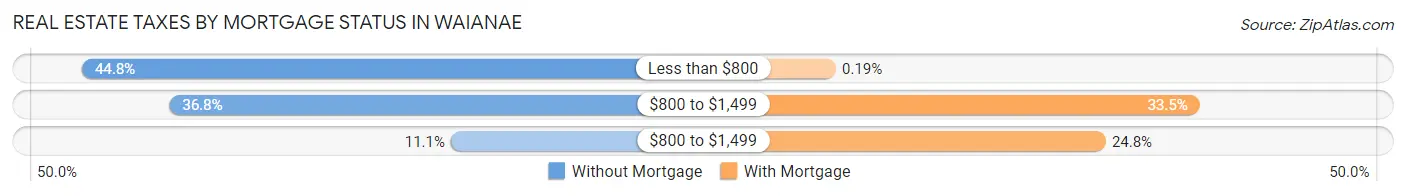
| Property Taxes | Without Mortgage | With Mortgage |
| Less than $800 | 303 (44.8%) | 3 (0.2%) |
| $800 to $1,499 | 249 (36.8%) | 530 (33.5%) |
| $800 to $1,499 | 75 (11.1%) | 393 (24.8%) |
| Total | 677 (100.0%) | 1,583 (100.0%) |
Health & Disability in Waianae
Health Insurance Coverage by Age in Waianae
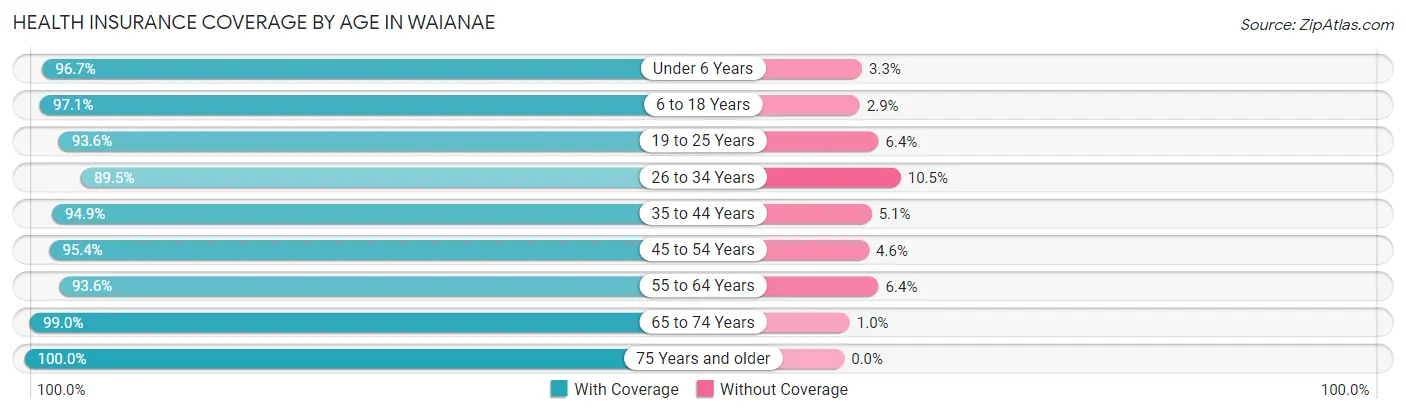
| Age Bracket | With Coverage | Without Coverage |
| Under 6 Years | 1,224 (96.7%) | 42 (3.3%) |
| 6 to 18 Years | 2,985 (97.1%) | 89 (2.9%) |
| 19 to 25 Years | 835 (93.6%) | 57 (6.4%) |
| 26 to 34 Years | 1,453 (89.5%) | 171 (10.5%) |
| 35 to 44 Years | 1,779 (94.9%) | 96 (5.1%) |
| 45 to 54 Years | 1,376 (95.4%) | 67 (4.6%) |
| 55 to 64 Years | 1,518 (93.6%) | 104 (6.4%) |
| 65 to 74 Years | 1,248 (99.0%) | 13 (1.0%) |
| 75 Years and older | 603 (100.0%) | 0 (0.0%) |
| Total | 13,021 (95.3%) | 639 (4.7%) |
Health Insurance Coverage by Citizenship Status in Waianae
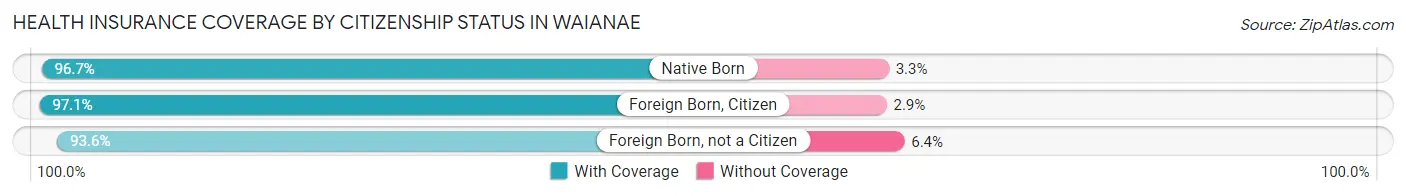
| Citizenship Status | With Coverage | Without Coverage |
| Native Born | 1,224 (96.7%) | 42 (3.3%) |
| Foreign Born, Citizen | 2,985 (97.1%) | 89 (2.9%) |
| Foreign Born, not a Citizen | 835 (93.6%) | 57 (6.4%) |
Health Insurance Coverage by Household Income in Waianae
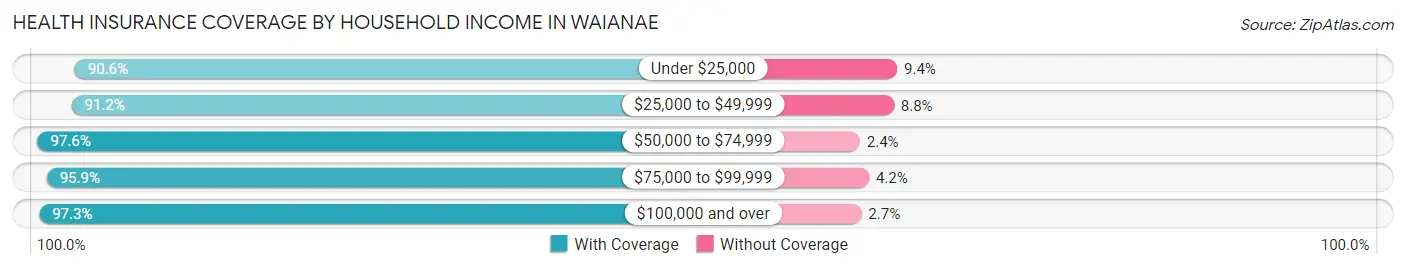
| Household Income | With Coverage | Without Coverage |
| Under $25,000 | 1,221 (90.6%) | 127 (9.4%) |
| $25,000 to $49,999 | 1,450 (91.2%) | 140 (8.8%) |
| $50,000 to $74,999 | 1,721 (97.6%) | 43 (2.4%) |
| $75,000 to $99,999 | 1,780 (95.9%) | 77 (4.2%) |
| $100,000 and over | 6,591 (97.3%) | 186 (2.7%) |
Public vs Private Health Insurance Coverage by Age in Waianae
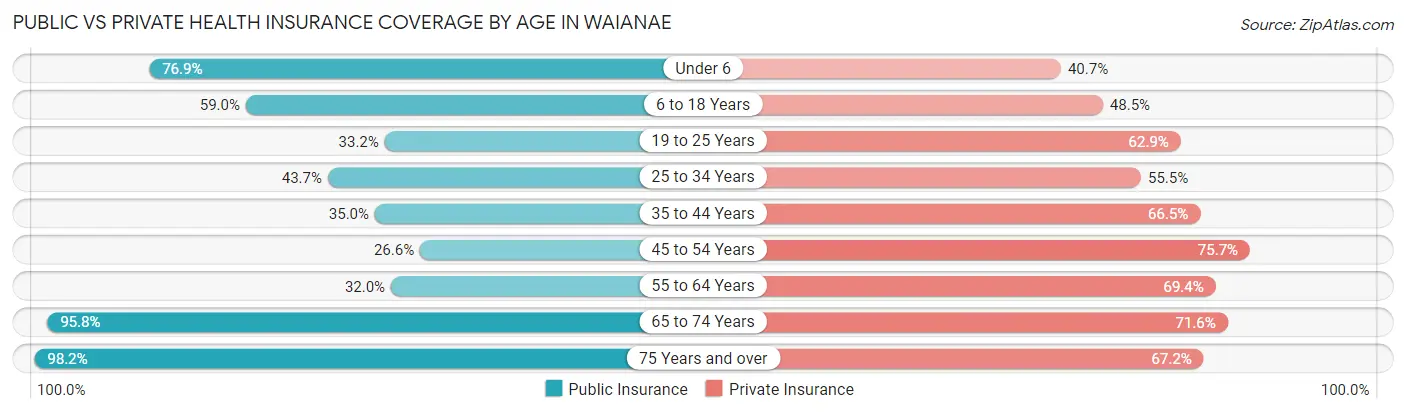
| Age Bracket | Public Insurance | Private Insurance |
| Under 6 | 973 (76.9%) | 515 (40.7%) |
| 6 to 18 Years | 1,812 (59.0%) | 1,490 (48.5%) |
| 19 to 25 Years | 296 (33.2%) | 561 (62.9%) |
| 25 to 34 Years | 710 (43.7%) | 902 (55.5%) |
| 35 to 44 Years | 656 (35.0%) | 1,247 (66.5%) |
| 45 to 54 Years | 384 (26.6%) | 1,093 (75.7%) |
| 55 to 64 Years | 519 (32.0%) | 1,125 (69.4%) |
| 65 to 74 Years | 1,208 (95.8%) | 903 (71.6%) |
| 75 Years and over | 592 (98.2%) | 405 (67.2%) |
| Total | 7,150 (52.3%) | 8,241 (60.3%) |
Disability Status by Sex by Age in Waianae
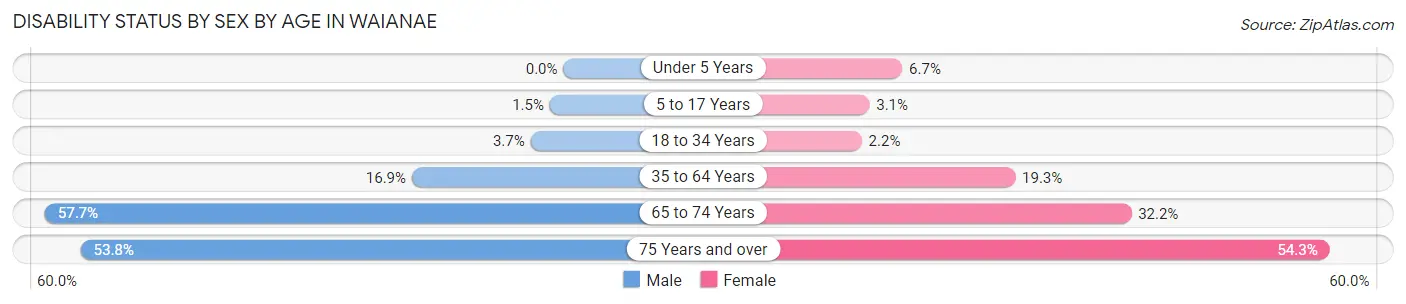
| Age Bracket | Male | Female |
| Under 5 Years | 0 (0.0%) | 37 (6.7%) |
| 5 to 17 Years | 25 (1.5%) | 44 (3.1%) |
| 18 to 34 Years | 47 (3.6%) | 31 (2.2%) |
| 35 to 64 Years | 419 (16.9%) | 474 (19.3%) |
| 65 to 74 Years | 343 (57.7%) | 215 (32.2%) |
| 75 Years and over | 150 (53.8%) | 176 (54.3%) |
Disability Class by Sex by Age in Waianae
Disability Class: Hearing Difficulty
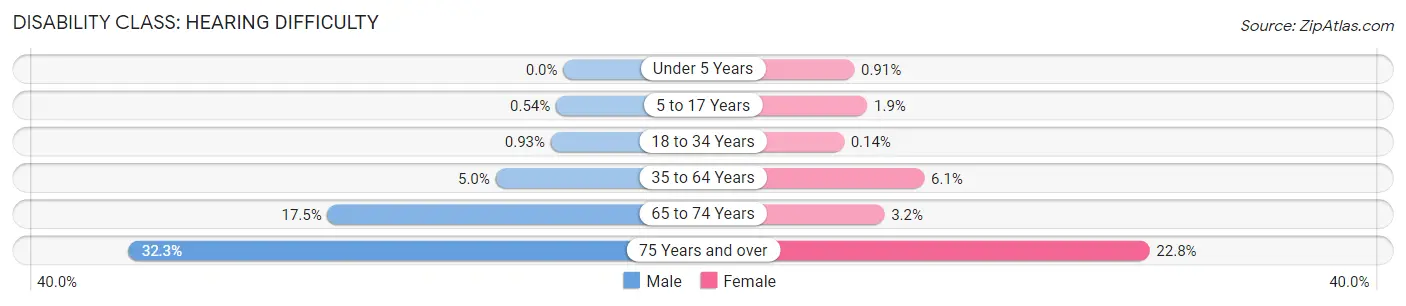
| Age Bracket | Male | Female |
| Under 5 Years | 0 (0.0%) | 5 (0.9%) |
| 5 to 17 Years | 9 (0.5%) | 27 (1.9%) |
| 18 to 34 Years | 12 (0.9%) | 2 (0.1%) |
| 35 to 64 Years | 125 (5.0%) | 150 (6.1%) |
| 65 to 74 Years | 104 (17.5%) | 21 (3.2%) |
| 75 Years and over | 90 (32.3%) | 74 (22.8%) |
Disability Class: Vision Difficulty
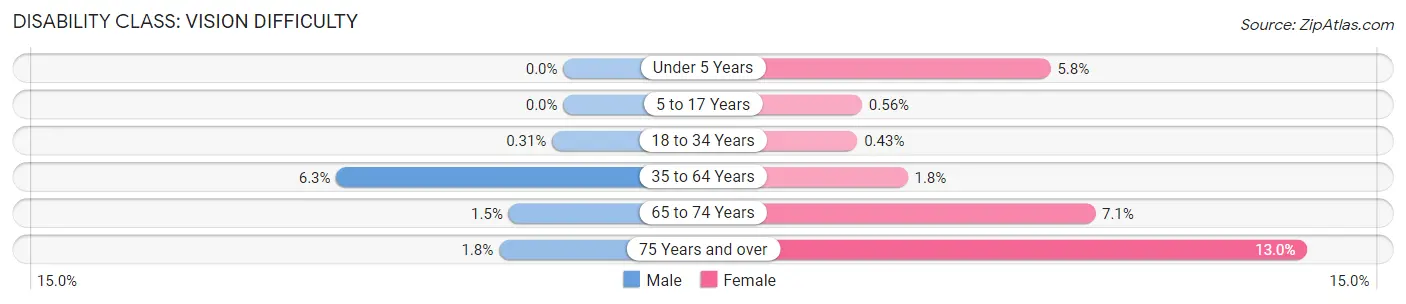
| Age Bracket | Male | Female |
| Under 5 Years | 0 (0.0%) | 32 (5.8%) |
| 5 to 17 Years | 0 (0.0%) | 8 (0.6%) |
| 18 to 34 Years | 4 (0.3%) | 6 (0.4%) |
| 35 to 64 Years | 157 (6.3%) | 45 (1.8%) |
| 65 to 74 Years | 9 (1.5%) | 47 (7.0%) |
| 75 Years and over | 5 (1.8%) | 42 (13.0%) |
Disability Class: Cognitive Difficulty
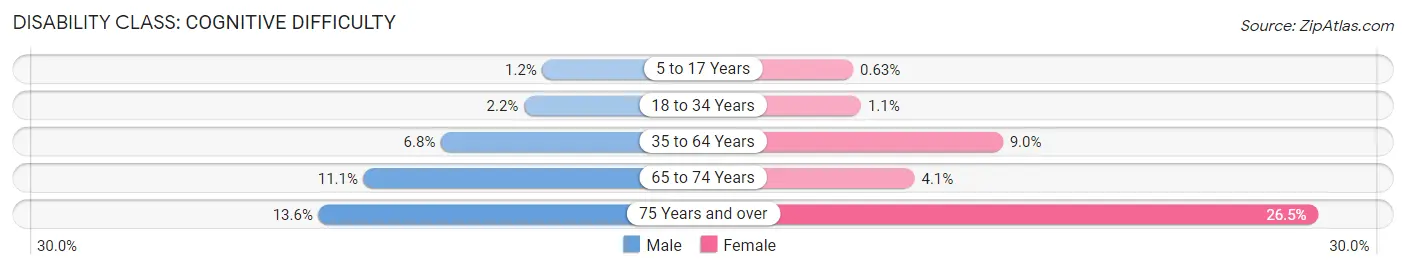
| Age Bracket | Male | Female |
| 5 to 17 Years | 19 (1.1%) | 9 (0.6%) |
| 18 to 34 Years | 28 (2.2%) | 15 (1.1%) |
| 35 to 64 Years | 169 (6.8%) | 220 (9.0%) |
| 65 to 74 Years | 66 (11.1%) | 27 (4.1%) |
| 75 Years and over | 38 (13.6%) | 86 (26.5%) |
Disability Class: Ambulatory Difficulty
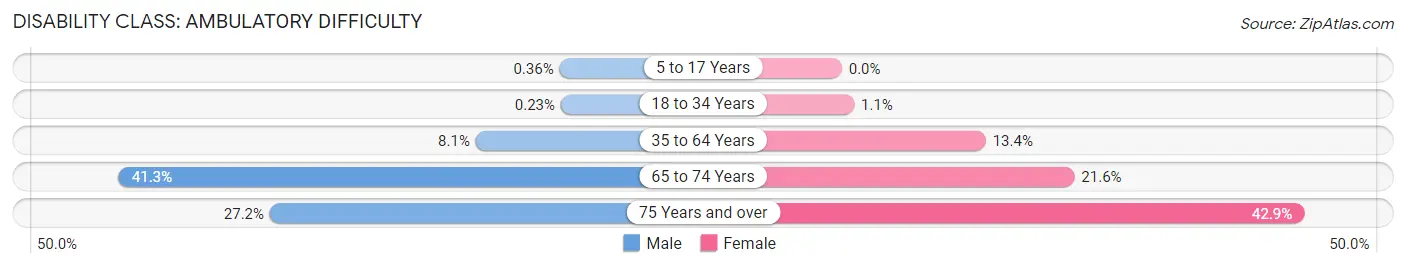
| Age Bracket | Male | Female |
| 5 to 17 Years | 6 (0.4%) | 0 (0.0%) |
| 18 to 34 Years | 3 (0.2%) | 16 (1.1%) |
| 35 to 64 Years | 202 (8.1%) | 328 (13.4%) |
| 65 to 74 Years | 245 (41.2%) | 144 (21.6%) |
| 75 Years and over | 76 (27.2%) | 139 (42.9%) |
Disability Class: Self-Care Difficulty
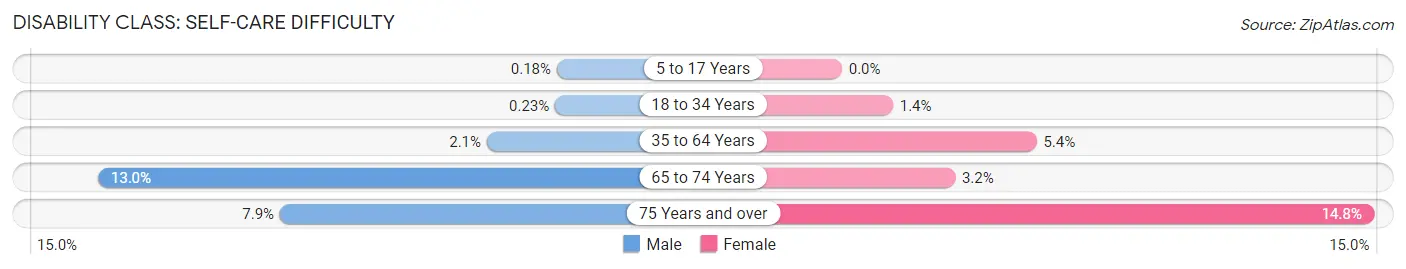
| Age Bracket | Male | Female |
| 5 to 17 Years | 3 (0.2%) | 0 (0.0%) |
| 18 to 34 Years | 3 (0.2%) | 20 (1.4%) |
| 35 to 64 Years | 53 (2.1%) | 133 (5.4%) |
| 65 to 74 Years | 77 (13.0%) | 21 (3.2%) |
| 75 Years and over | 22 (7.9%) | 48 (14.8%) |
Technology Access in Waianae
Computing Device Access in Waianae
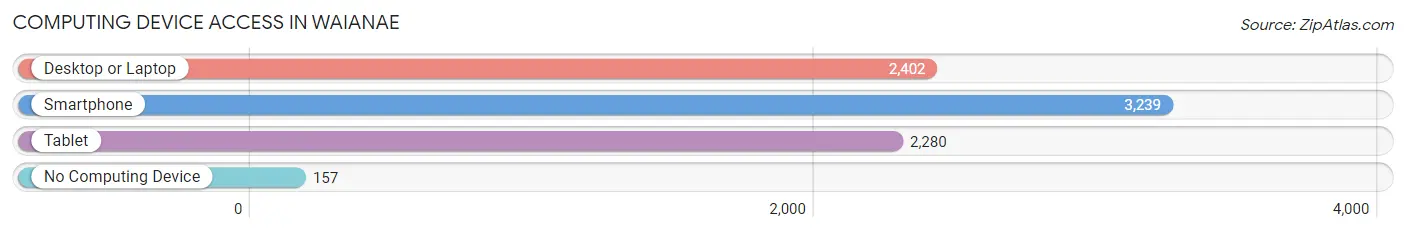
| Device Type | # Households | % Households |
| Desktop or Laptop | 2,402 | 68.4% |
| Smartphone | 3,239 | 92.3% |
| Tablet | 2,280 | 65.0% |
| No Computing Device | 157 | 4.5% |
| Total | 3,510 | 100.0% |
Internet Access in Waianae
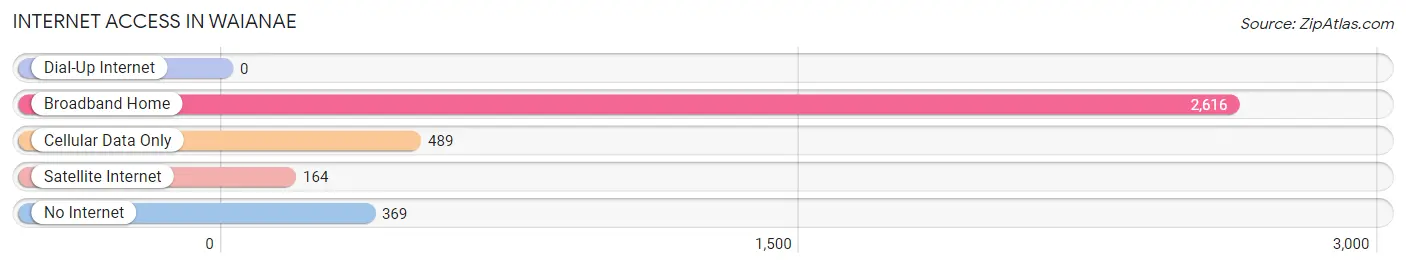
| Internet Type | # Households | % Households |
| Dial-Up Internet | 0 | 0.0% |
| Broadband Home | 2,616 | 74.5% |
| Cellular Data Only | 489 | 13.9% |
| Satellite Internet | 164 | 4.7% |
| No Internet | 369 | 10.5% |
| Total | 3,510 | 100.0% |
Waianae Summary
Waianae is a census-designated place (CDP) located on the western coast of the island of Oahu in the state of Hawaii. It is located about 25 miles (40 km) west of Honolulu and is part of the City and County of Honolulu. As of the 2010 census, the CDP had a population of 13,177.
History
The area now known as Waianae was originally inhabited by the Menehune, a legendary race of small people who were said to have built many of the fishponds and other structures in the area. The first Europeans to visit the area were the crew of the HMS Resolution, which arrived in 1779. The area was later settled by Native Hawaiians, who established fishing villages and agricultural communities.
In the late 19th century, the area was developed by the Waianae Sugar Company, which built a sugar mill and a railroad line to transport the sugar cane to Honolulu. The company also built a hotel and a pier, which became a popular destination for tourists.
Geography
Waianae is located on the western coast of Oahu, about 25 miles (40 km) west of Honolulu. It is bordered to the north by Makaha, to the east by Makua, and to the south by Kahe Point. The Waianae Mountain Range lies to the east of the CDP.
The area has a tropical climate, with temperatures ranging from an average low of 68°F (20°C) in the winter to an average high of 86°F (30°C) in the summer. The average annual rainfall is about 20 inches (51 cm).
Economy
The economy of Waianae is largely based on tourism and agriculture. The area is home to several resorts and hotels, as well as a number of small businesses. Agriculture is also important to the local economy, with sugar cane, taro, and other crops being grown in the area.
Demographics
As of the 2010 census, there were 13,177 people living in Waianae. The population was spread out, with 37.2% under the age of 18, 11.2% from 18 to 24, 28.2% from 25 to 44, 16.2% from 45 to 64, and 7.2% who were 65 years of age or older. The median age was 28.5 years.
The racial makeup of the CDP was 28.2% White, 0.7% African American, 0.3% Native American, 28.2% Asian, 0.2% Pacific Islander, 0.7% from other races, and 41.3% from two or more races. Hispanic or Latino of any race were 8.2% of the population.
The median income for a household in the CDP was $41,945, and the median income for a family was $45,938. Males had a median income of $30,917 versus $25,938 for females. The per capita income for the CDP was $15,945. About 11.2% of families and 14.2% of the population were below the poverty line, including 17.2% of those under age 18 and 8.2% of those age 65 or over.
Common Questions
What is Per Capita Income in Waianae?
Per Capita income in Waianae is $26,528.
What is the Median Family Income in Waianae?
Median Family Income in Waianae is $91,530.
What is the Median Household income in Waianae?
Median Household Income in Waianae is $77,435.
What is Income or Wage Gap in Waianae?
Income or Wage Gap in Waianae is 36.2%.
Women in Waianae earn 63.8 cents for every dollar earned by a man.
What is Family Income Deficit in Waianae?
Family Income Deficit in Waianae is $16,079.
Families that are below poverty line in Waianae earn $16,079 less on average than the poverty threshold level.
What is Inequality or Gini Index in Waianae?
Inequality or Gini Index in Waianae is 0.43.
What is the Total Population of Waianae?
Total Population of Waianae is 13,749.
What is the Total Male Population of Waianae?
Total Male Population of Waianae is 6,887.
What is the Total Female Population of Waianae?
Total Female Population of Waianae is 6,862.
What is the Ratio of Males per 100 Females in Waianae?
There are 100.36 Males per 100 Females in Waianae.
What is the Ratio of Females per 100 Males in Waianae?
There are 99.64 Females per 100 Males in Waianae.
What is the Median Population Age in Waianae?
Median Population Age in Waianae is 34.8 Years.
What is the Average Family Size in Waianae
Average Family Size in Waianae is 4.3 People.
What is the Average Household Size in Waianae
Average Household Size in Waianae is 3.8 People.
How Large is the Labor Force in Waianae?
There are 6,034 People in the Labor Forcein in Waianae.
What is the Percentage of People in the Labor Force in Waianae?
60.7% of People are in the Labor Force in Waianae.
What is the Unemployment Rate in Waianae?
Unemployment Rate in Waianae is 9.7%.