Savannah, TX Map & Demographics
Savannah Map
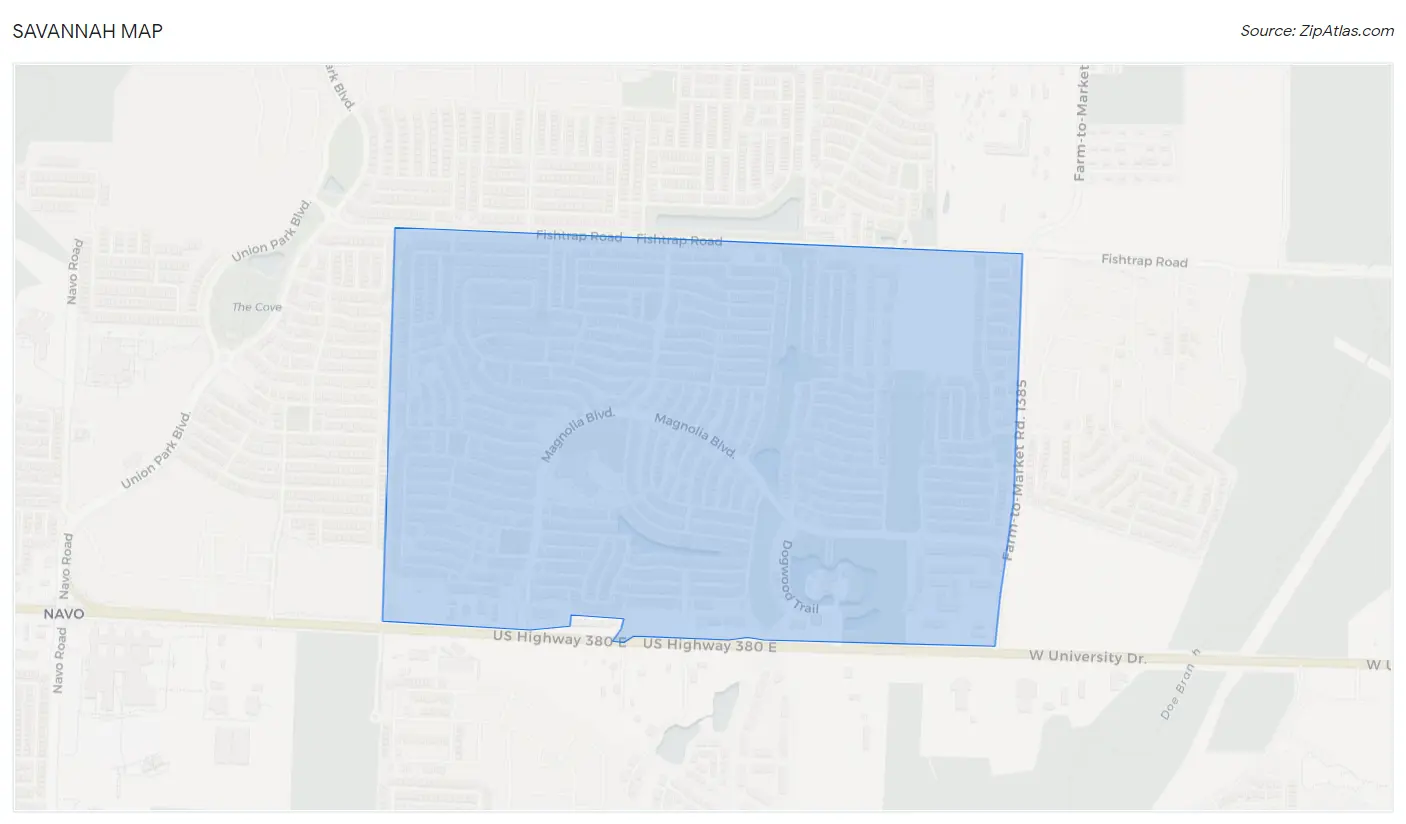
Savannah Overview
$47,968
PER CAPITA INCOME
$117,389
AVG FAMILY INCOME
$119,000
AVG HOUSEHOLD INCOME
48.1%
WAGE / INCOME GAP [ % ]
51.9¢/ $1
WAGE / INCOME GAP [ $ ]
0.35
INEQUALITY / GINI INDEX
6,718
TOTAL POPULATION
3,149
MALE POPULATION
3,569
FEMALE POPULATION
88.23
MALES / 100 FEMALES
113.34
FEMALES / 100 MALES
35.7
MEDIAN AGE
3.3
AVG FAMILY SIZE
3.0
AVG HOUSEHOLD SIZE
3,646
LABOR FORCE [ PEOPLE ]
77.0%
PERCENT IN LABOR FORCE
6.3%
UNEMPLOYMENT RATE
Savannah Area Codes
Income in Savannah
Income Overview in Savannah
Per Capita Income in Savannah is $47,968, while median incomes of families and households are $117,389 and $119,000 respectively.
| Characteristic | Number | Measure |
| Per Capita Income | 6,718 | $47,968 |
| Median Family Income | 1,902 | $117,389 |
| Mean Family Income | 1,902 | $140,245 |
| Median Household Income | 2,208 | $119,000 |
| Mean Household Income | 2,208 | $146,335 |
| Income Deficit | 1,902 | $0 |
| Wage / Income Gap (%) | 6,718 | 48.13% |
| Wage / Income Gap ($) | 6,718 | 51.87¢ per $1 |
| Gini / Inequality Index | 6,718 | 0.35 |
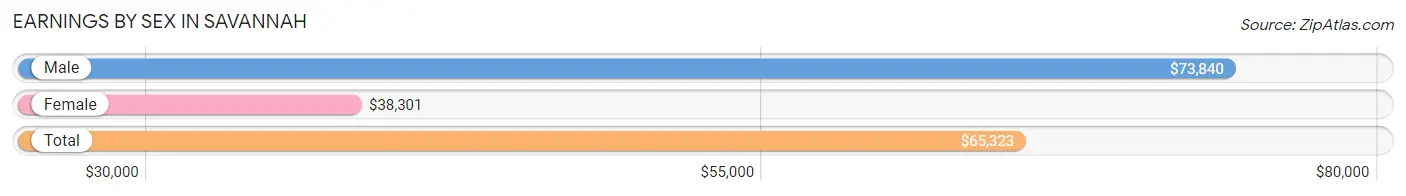
Earnings by Sex in Savannah
Average Earnings in Savannah are $65,323, $73,840 for men and $38,301 for women, a difference of 48.1%.
| Sex | Number | Average Earnings |
| Male | 1,825 (51.1%) | $73,840 |
| Female | 1,745 (48.9%) | $38,301 |
| Total | 3,570 (100.0%) | $65,323 |
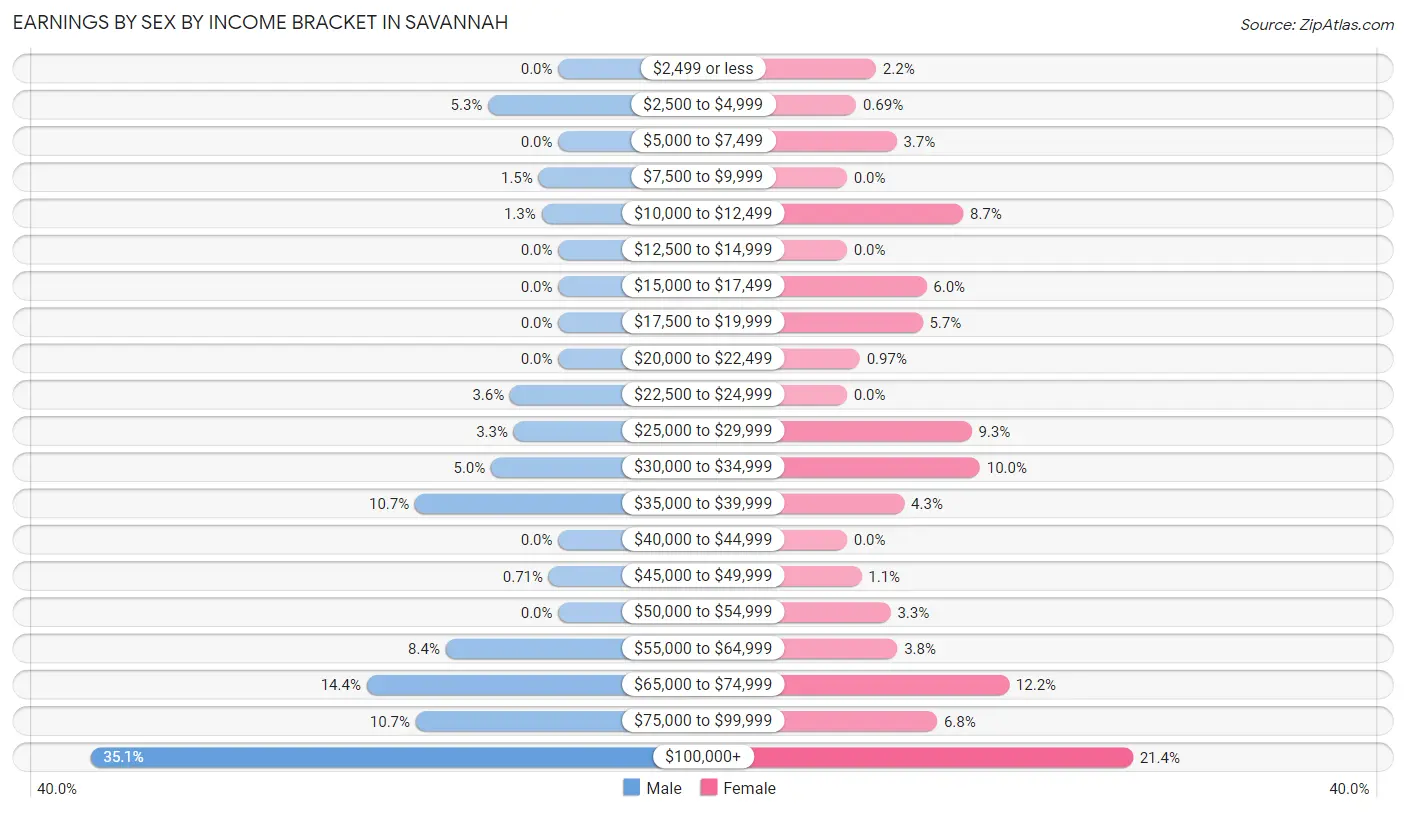
Earnings by Sex by Income Bracket in Savannah
The most common earnings brackets in Savannah are $100,000+ for men (640 | 35.1%) and $100,000+ for women (374 | 21.4%).
| Income | Male | Female |
| $2,499 or less | 0 (0.0%) | 38 (2.2%) |
| $2,500 to $4,999 | 96 (5.3%) | 12 (0.7%) |
| $5,000 to $7,499 | 0 (0.0%) | 65 (3.7%) |
| $7,500 to $9,999 | 27 (1.5%) | 0 (0.0%) |
| $10,000 to $12,499 | 23 (1.3%) | 152 (8.7%) |
| $12,500 to $14,999 | 0 (0.0%) | 0 (0.0%) |
| $15,000 to $17,499 | 0 (0.0%) | 104 (6.0%) |
| $17,500 to $19,999 | 0 (0.0%) | 99 (5.7%) |
| $20,000 to $22,499 | 0 (0.0%) | 17 (1.0%) |
| $22,500 to $24,999 | 66 (3.6%) | 0 (0.0%) |
| $25,000 to $29,999 | 61 (3.3%) | 163 (9.3%) |
| $30,000 to $34,999 | 92 (5.0%) | 174 (10.0%) |
| $35,000 to $39,999 | 196 (10.7%) | 75 (4.3%) |
| $40,000 to $44,999 | 0 (0.0%) | 0 (0.0%) |
| $45,000 to $49,999 | 13 (0.7%) | 19 (1.1%) |
| $50,000 to $54,999 | 0 (0.0%) | 57 (3.3%) |
| $55,000 to $64,999 | 154 (8.4%) | 66 (3.8%) |
| $65,000 to $74,999 | 262 (14.4%) | 212 (12.1%) |
| $75,000 to $99,999 | 195 (10.7%) | 118 (6.8%) |
| $100,000+ | 640 (35.1%) | 374 (21.4%) |
| Total | 1,825 (100.0%) | 1,745 (100.0%) |
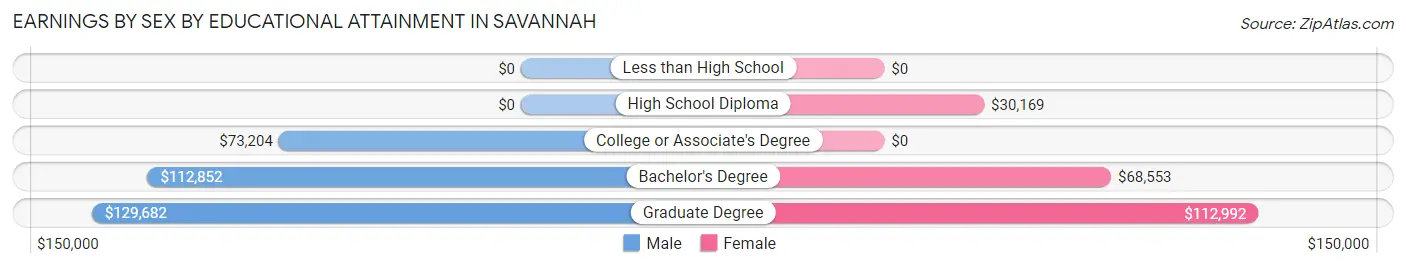
Earnings by Sex by Educational Attainment in Savannah
Average earnings in Savannah are $74,746 for men and $51,042 for women, a difference of 31.7%. Men with an educational attainment of graduate degree enjoy the highest average annual earnings of $129,682, while those with college or associate's degree education earn the least with $73,204. Women with an educational attainment of graduate degree earn the most with the average annual earnings of $112,992, while those with high school diploma education have the smallest earnings of $30,169.
| Educational Attainment | Male Income | Female Income |
| Less than High School | - | - |
| High School Diploma | - | - |
| College or Associate's Degree | $73,204 | $0 |
| Bachelor's Degree | $112,852 | $68,553 |
| Graduate Degree | $129,682 | $112,992 |
| Total | $74,746 | $51,042 |
Family Income in Savannah
Family Income Brackets in Savannah
According to the Savannah family income data, there are 512 families falling into the $100,000 to $149,999 income range, which is the most common income bracket and makes up 26.9% of all families.
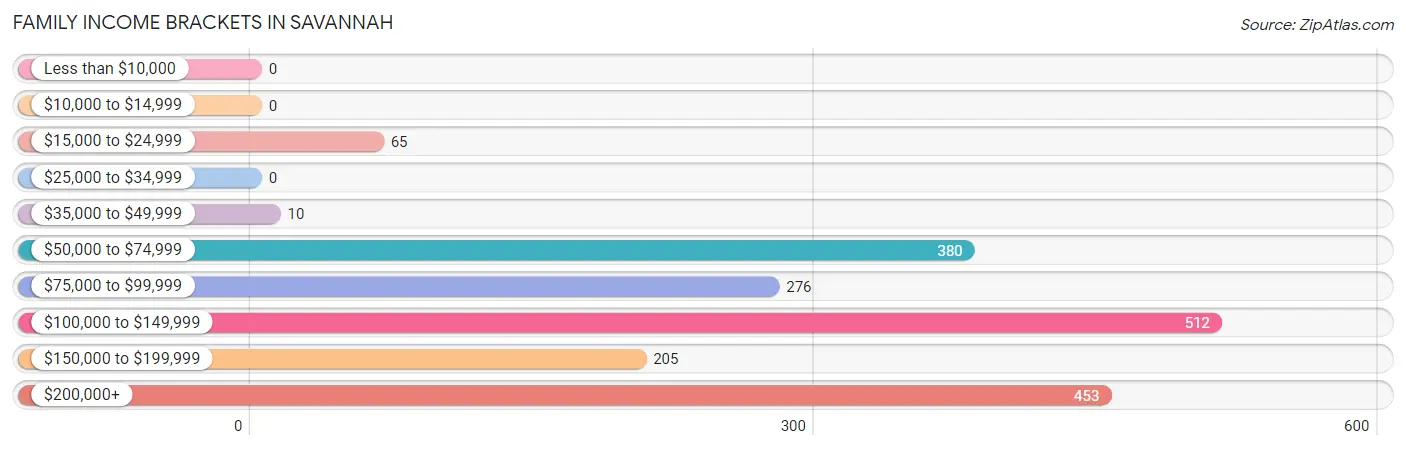
| Income Bracket | # Families | % Families |
| Less than $10,000 | 0 | 0.0% |
| $10,000 to $14,999 | 0 | 0.0% |
| $15,000 to $24,999 | 65 | 3.4% |
| $25,000 to $34,999 | 0 | 0.0% |
| $35,000 to $49,999 | 10 | 0.5% |
| $50,000 to $74,999 | 380 | 20.0% |
| $75,000 to $99,999 | 276 | 14.5% |
| $100,000 to $149,999 | 512 | 26.9% |
| $150,000 to $199,999 | 205 | 10.8% |
| $200,000+ | 453 | 23.8% |
Family Income by Famaliy Size in Savannah
4-person families (386 | 20.3%) account for the highest median family income in Savannah with $227,557 per family, while 3-person families (274 | 14.4%) have the highest median income of $65,201 per family member.
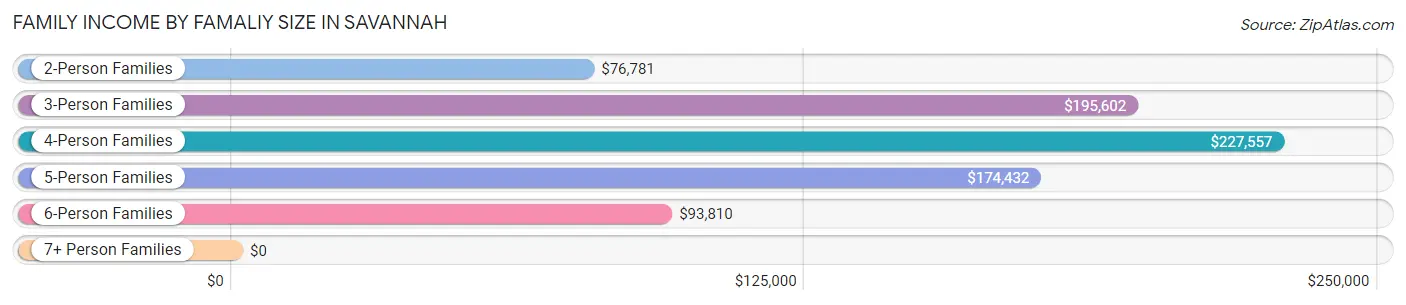
| Income Bracket | # Families | Median Income |
| 2-Person Families | 856 (45.0%) | $76,781 |
| 3-Person Families | 274 (14.4%) | $195,602 |
| 4-Person Families | 386 (20.3%) | $227,557 |
| 5-Person Families | 245 (12.9%) | $174,432 |
| 6-Person Families | 119 (6.3%) | $93,810 |
| 7+ Person Families | 22 (1.2%) | $0 |
| Total | 1,902 (100.0%) | $117,389 |
Family Income by Number of Earners in Savannah
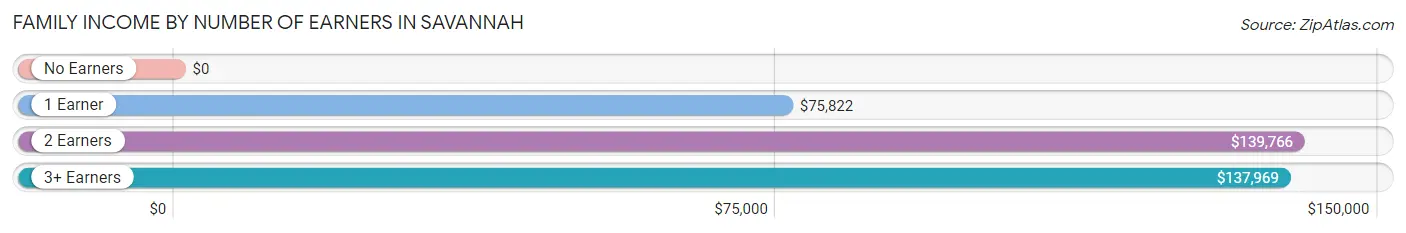
| Number of Earners | # Families | Median Income |
| No Earners | 74 (3.9%) | $0 |
| 1 Earner | 494 (26.0%) | $75,822 |
| 2 Earners | 1,193 (62.7%) | $139,766 |
| 3+ Earners | 141 (7.4%) | $137,969 |
| Total | 1,902 (100.0%) | $117,389 |
Household Income in Savannah
Household Income Brackets in Savannah
With 565 households falling in the category, the $100,000 to $149,999 income range is the most frequent in Savannah, accounting for 25.6% of all households.
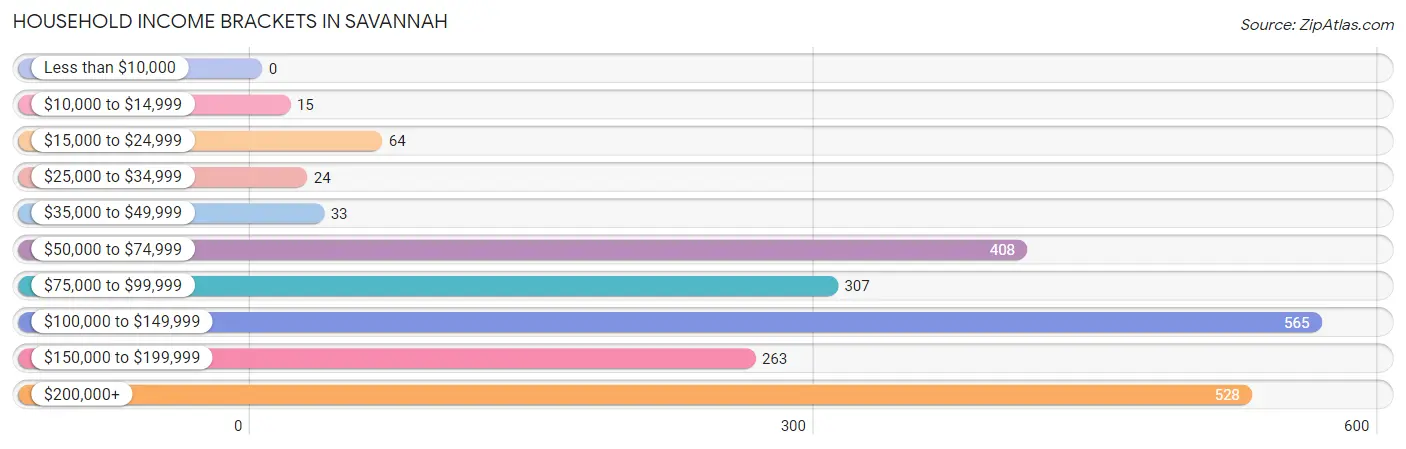
| Income Bracket | # Households | % Households |
| Less than $10,000 | 0 | 0.0% |
| $10,000 to $14,999 | 15 | 0.7% |
| $15,000 to $24,999 | 64 | 2.9% |
| $25,000 to $34,999 | 24 | 1.1% |
| $35,000 to $49,999 | 33 | 1.5% |
| $50,000 to $74,999 | 408 | 18.5% |
| $75,000 to $99,999 | 307 | 13.9% |
| $100,000 to $149,999 | 565 | 25.6% |
| $150,000 to $199,999 | 263 | 11.9% |
| $200,000+ | 528 | 23.9% |
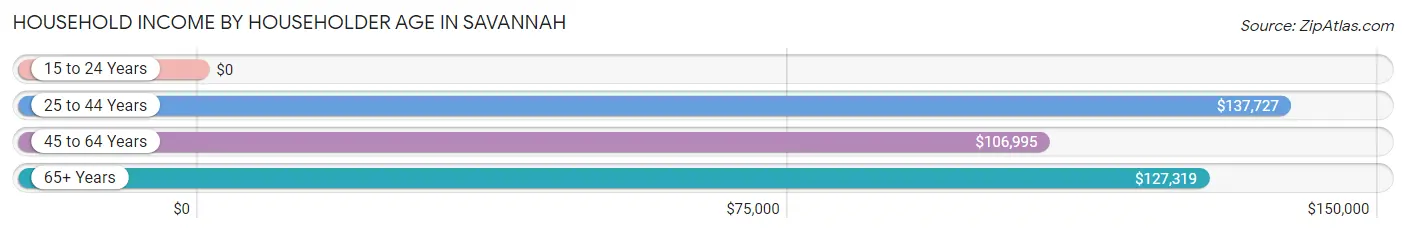
Household Income by Householder Age in Savannah
The median household income in Savannah is $119,000, with the highest median household income of $137,727 found in the 25 to 44 years age bracket for the primary householder. A total of 1,034 households (46.8%) fall into this category. Meanwhile, the 15 to 24 years age bracket for the primary householder has the lowest median household income of $0, with 165 households (7.5%) in this group.
| Income Bracket | # Households | Median Income |
| 15 to 24 Years | 165 (7.5%) | $0 |
| 25 to 44 Years | 1,034 (46.8%) | $137,727 |
| 45 to 64 Years | 603 (27.3%) | $106,995 |
| 65+ Years | 406 (18.4%) | $127,319 |
| Total | 2,208 (100.0%) | $119,000 |
Poverty in Savannah
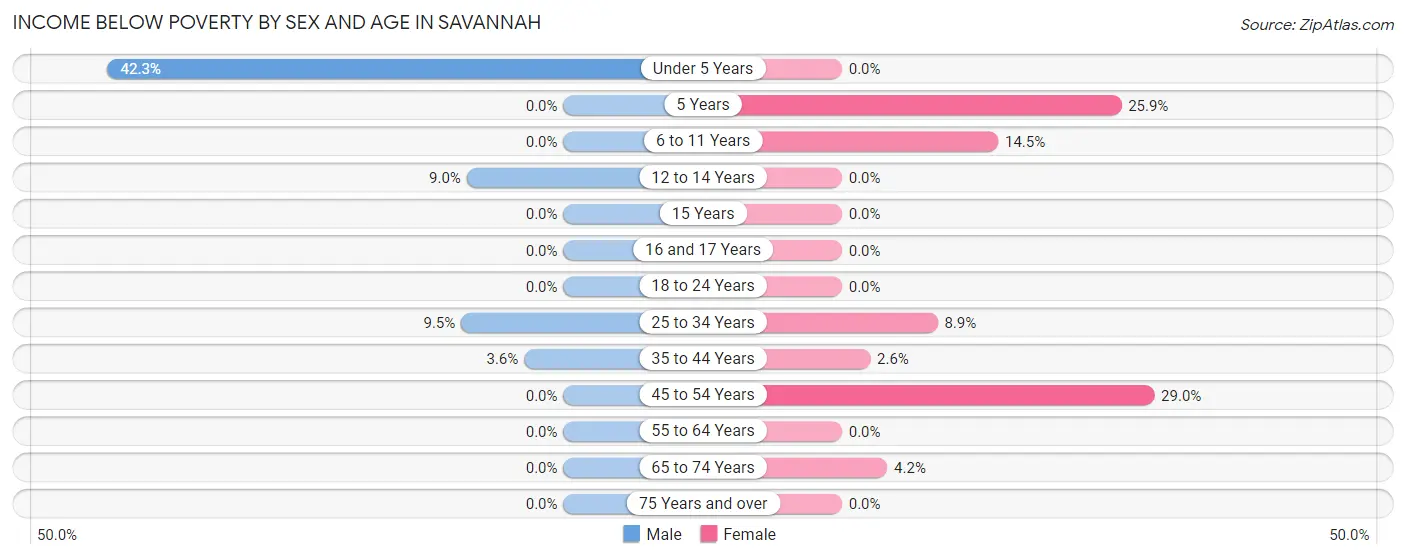
Income Below Poverty by Sex and Age in Savannah
With 5.4% poverty level for males and 8.9% for females among the residents of Savannah, under 5 year old males and 45 to 54 year old females are the most vulnerable to poverty, with 85 males (42.3%) and 149 females (29.0%) in their respective age groups living below the poverty level.
| Age Bracket | Male | Female |
| Under 5 Years | 85 (42.3%) | 0 (0.0%) |
| 5 Years | 0 (0.0%) | 21 (25.9%) |
| 6 to 11 Years | 0 (0.0%) | 79 (14.5%) |
| 12 to 14 Years | 20 (9.0%) | 0 (0.0%) |
| 15 Years | 0 (0.0%) | 0 (0.0%) |
| 16 and 17 Years | 0 (0.0%) | 0 (0.0%) |
| 18 to 24 Years | 0 (0.0%) | 0 (0.0%) |
| 25 to 34 Years | 39 (9.5%) | 38 (8.9%) |
| 35 to 44 Years | 27 (3.6%) | 17 (2.6%) |
| 45 to 54 Years | 0 (0.0%) | 149 (29.0%) |
| 55 to 64 Years | 0 (0.0%) | 0 (0.0%) |
| 65 to 74 Years | 0 (0.0%) | 15 (4.2%) |
| 75 Years and over | 0 (0.0%) | 0 (0.0%) |
| Total | 171 (5.4%) | 319 (8.9%) |
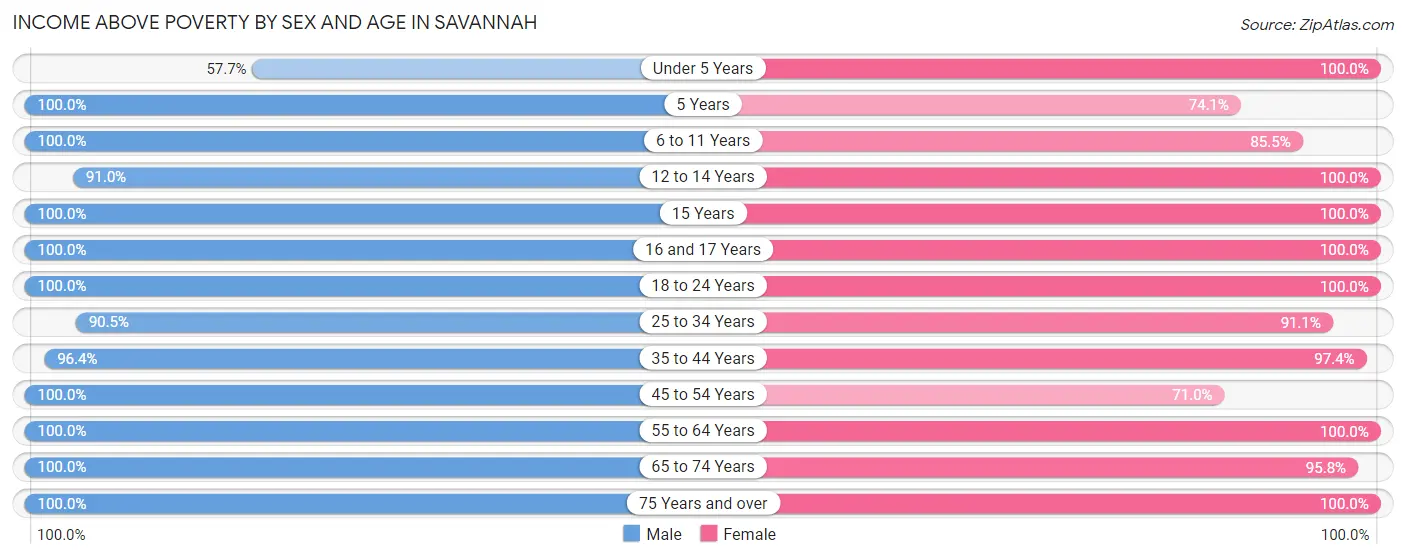
Income Above Poverty by Sex and Age in Savannah
According to the poverty statistics in Savannah, males aged 5 years and females aged under 5 years are the age groups that are most secure financially, with 100.0% of males and 100.0% of females in these age groups living above the poverty line.
| Age Bracket | Male | Female |
| Under 5 Years | 116 (57.7%) | 205 (100.0%) |
| 5 Years | 120 (100.0%) | 60 (74.1%) |
| 6 to 11 Years | 317 (100.0%) | 466 (85.5%) |
| 12 to 14 Years | 203 (91.0%) | 147 (100.0%) |
| 15 Years | 73 (100.0%) | 71 (100.0%) |
| 16 and 17 Years | 110 (100.0%) | 12 (100.0%) |
| 18 to 24 Years | 147 (100.0%) | 149 (100.0%) |
| 25 to 34 Years | 372 (90.5%) | 390 (91.1%) |
| 35 to 44 Years | 714 (96.4%) | 629 (97.4%) |
| 45 to 54 Years | 336 (100.0%) | 365 (71.0%) |
| 55 to 64 Years | 229 (100.0%) | 342 (100.0%) |
| 65 to 74 Years | 142 (100.0%) | 341 (95.8%) |
| 75 Years and over | 99 (100.0%) | 73 (100.0%) |
| Total | 2,978 (94.6%) | 3,250 (91.1%) |
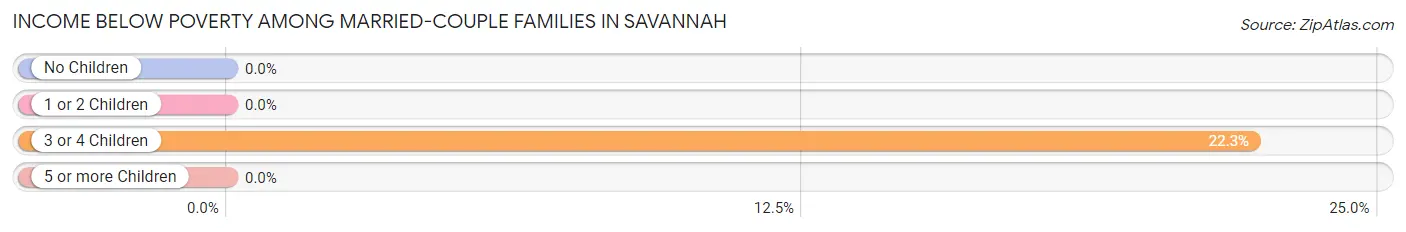
Income Below Poverty Among Married-Couple Families in Savannah
The poverty statistics for married-couple families in Savannah show that 5.0% or 65 of the total 1,314 families live below the poverty line. Families with 3 or 4 children have the highest poverty rate of 22.3%, comprising of 65 families. On the other hand, families with no children have the lowest poverty rate of 0.0%, which includes 0 families.
| Children | Above Poverty | Below Poverty |
| No Children | 445 (100.0%) | 0 (0.0%) |
| 1 or 2 Children | 555 (100.0%) | 0 (0.0%) |
| 3 or 4 Children | 227 (77.7%) | 65 (22.3%) |
| 5 or more Children | 22 (100.0%) | 0 (0.0%) |
| Total | 1,249 (95.1%) | 65 (5.0%) |
Income Below Poverty Among Single-Parent Households in Savannah
| Children | Single Father | Single Mother |
| No Children | 0 (0.0%) | 0 (0.0%) |
| 1 or 2 Children | 0 (0.0%) | 0 (0.0%) |
| 3 or 4 Children | 0 (0.0%) | 0 (0.0%) |
| 5 or more Children | 0 (0.0%) | 0 (0.0%) |
| Total | 0 (0.0%) | 0 (0.0%) |
Income Below Poverty Among Married-Couple vs Single-Parent Households in Savannah
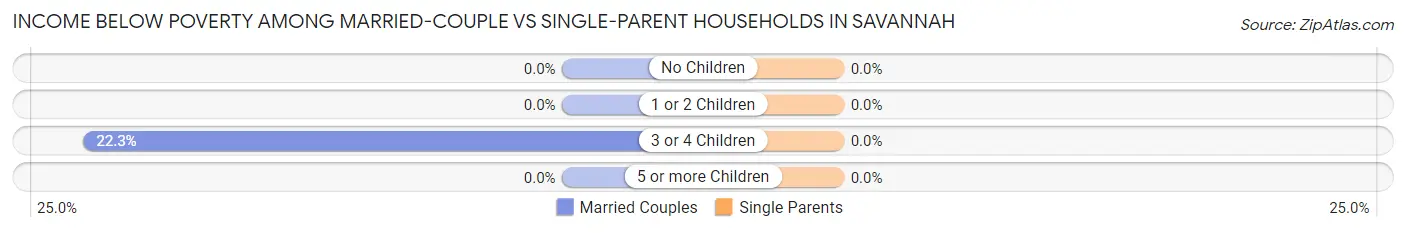
| Children | Married-Couple Families | Single-Parent Households |
| No Children | 0 (0.0%) | 0 (0.0%) |
| 1 or 2 Children | 0 (0.0%) | 0 (0.0%) |
| 3 or 4 Children | 65 (22.3%) | 0 (0.0%) |
| 5 or more Children | 0 (0.0%) | 0 (0.0%) |
| Total | 65 (5.0%) | 0 (0.0%) |
Race in Savannah
The most populous races in Savannah are White / Caucasian (4,495 | 66.9%), Black / African American (1,398 | 20.8%), and Hispanic or Latino (930 | 13.8%).
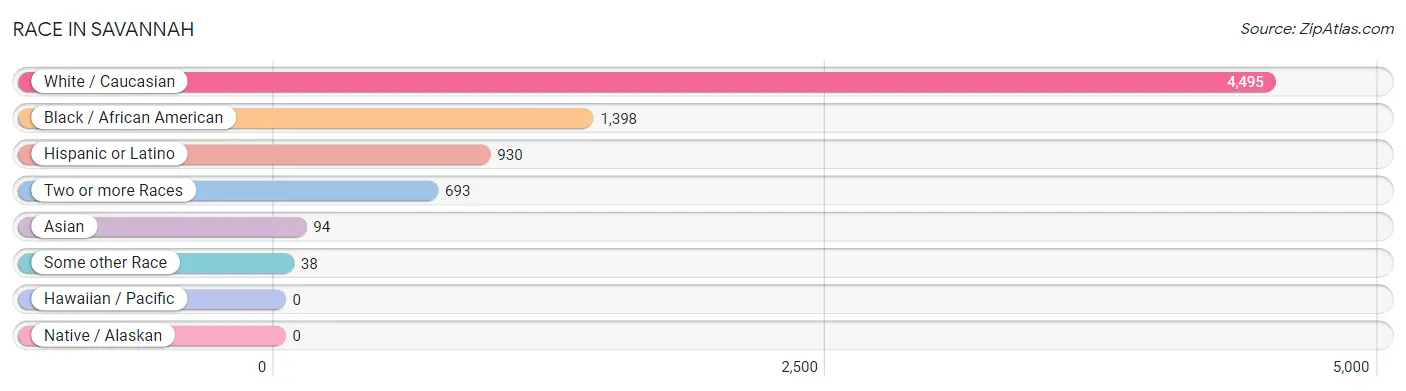
| Race | # Population | % Population |
| Asian | 94 | 1.4% |
| Black / African American | 1,398 | 20.8% |
| Hawaiian / Pacific | 0 | 0.0% |
| Hispanic or Latino | 930 | 13.8% |
| Native / Alaskan | 0 | 0.0% |
| White / Caucasian | 4,495 | 66.9% |
| Two or more Races | 693 | 10.3% |
| Some other Race | 38 | 0.6% |
| Total | 6,718 | 100.0% |
Ancestry in Savannah
The most populous ancestries reported in Savannah are Irish (1,153 | 17.2%), German (692 | 10.3%), Mexican (643 | 9.6%), English (566 | 8.4%), and French (459 | 6.8%), together accounting for 52.3% of all Savannah residents.
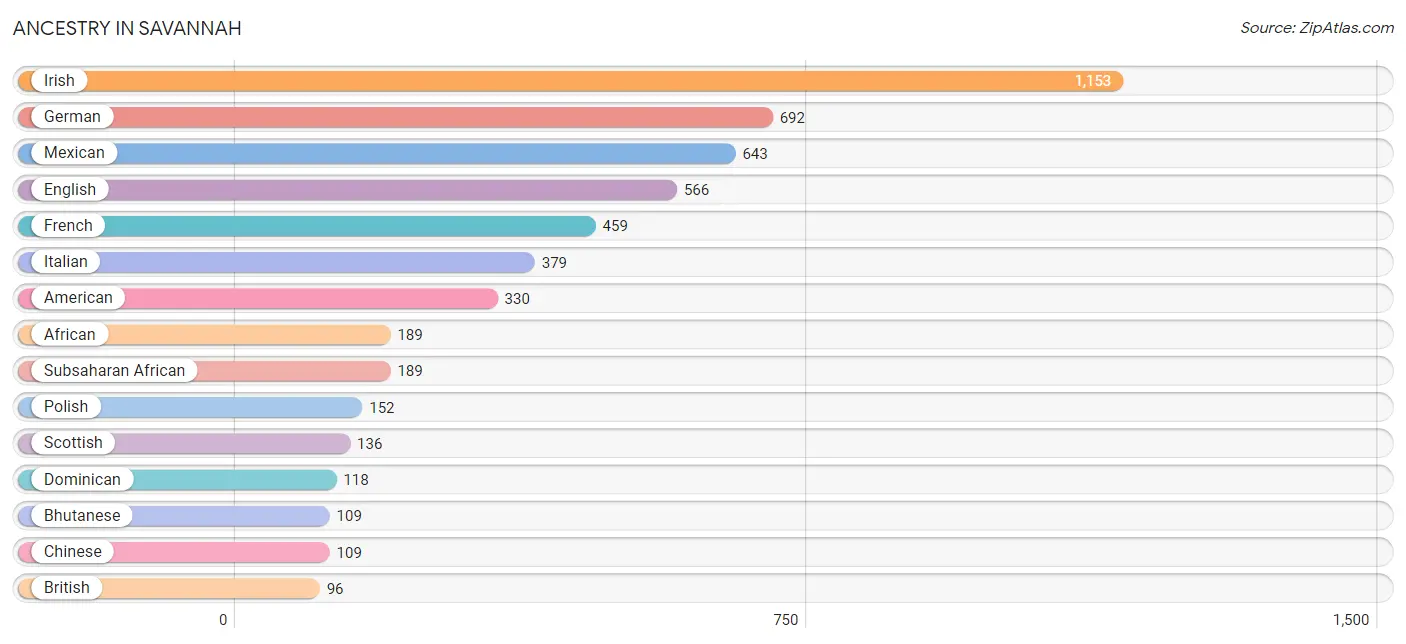
| Ancestry | # Population | % Population |
| African | 189 | 2.8% |
| American | 330 | 4.9% |
| Austrian | 13 | 0.2% |
| Bhutanese | 109 | 1.6% |
| British | 96 | 1.4% |
| Central American | 86 | 1.3% |
| Chinese | 109 | 1.6% |
| Colombian | 54 | 0.8% |
| Czech | 84 | 1.3% |
| Dominican | 118 | 1.8% |
| Dutch | 82 | 1.2% |
| English | 566 | 8.4% |
| European | 46 | 0.7% |
| French | 459 | 6.8% |
| French Canadian | 34 | 0.5% |
| German | 692 | 10.3% |
| Irish | 1,153 | 17.2% |
| Italian | 379 | 5.6% |
| Korean | 6 | 0.1% |
| Mexican | 643 | 9.6% |
| Nicaraguan | 43 | 0.6% |
| Norwegian | 83 | 1.2% |
| Polish | 152 | 2.3% |
| Puerto Rican | 29 | 0.4% |
| Salvadoran | 43 | 0.6% |
| Scandinavian | 54 | 0.8% |
| Scotch-Irish | 86 | 1.3% |
| Scottish | 136 | 2.0% |
| South American | 54 | 0.8% |
| Sri Lankan | 39 | 0.6% |
| Subsaharan African | 189 | 2.8% |
| Swedish | 18 | 0.3% |
| Swiss | 4 | 0.1% |
| Thai | 49 | 0.7% |
| Welsh | 17 | 0.3% | View All 35 Rows |
Immigrants in Savannah
The most numerous immigrant groups reported in Savannah came from Latin America (585 | 8.7%), Central America (531 | 7.9%), Mexico (450 | 6.7%), Asia (94 | 1.4%), and Europe (55 | 0.8%), together accounting for 25.5% of all Savannah residents.
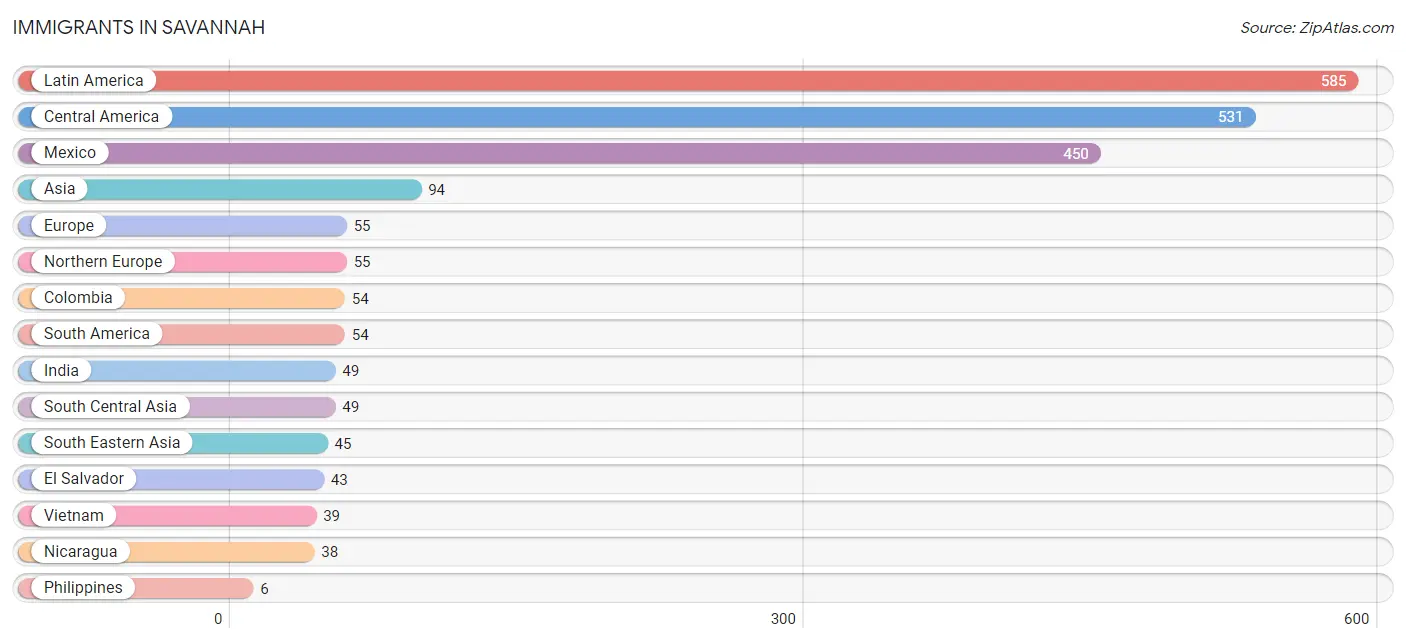
| Immigration Origin | # Population | % Population |
| Asia | 94 | 1.4% |
| Central America | 531 | 7.9% |
| Colombia | 54 | 0.8% |
| El Salvador | 43 | 0.6% |
| Europe | 55 | 0.8% |
| India | 49 | 0.7% |
| Latin America | 585 | 8.7% |
| Mexico | 450 | 6.7% |
| Nicaragua | 38 | 0.6% |
| Northern Europe | 55 | 0.8% |
| Philippines | 6 | 0.1% |
| South America | 54 | 0.8% |
| South Central Asia | 49 | 0.7% |
| South Eastern Asia | 45 | 0.7% |
| Vietnam | 39 | 0.6% | View All 15 Rows |
Sex and Age in Savannah
Sex and Age in Savannah
The most populous age groups in Savannah are 35 to 39 Years (575 | 18.3%) for men and 10 to 14 Years (426 | 11.9%) for women.
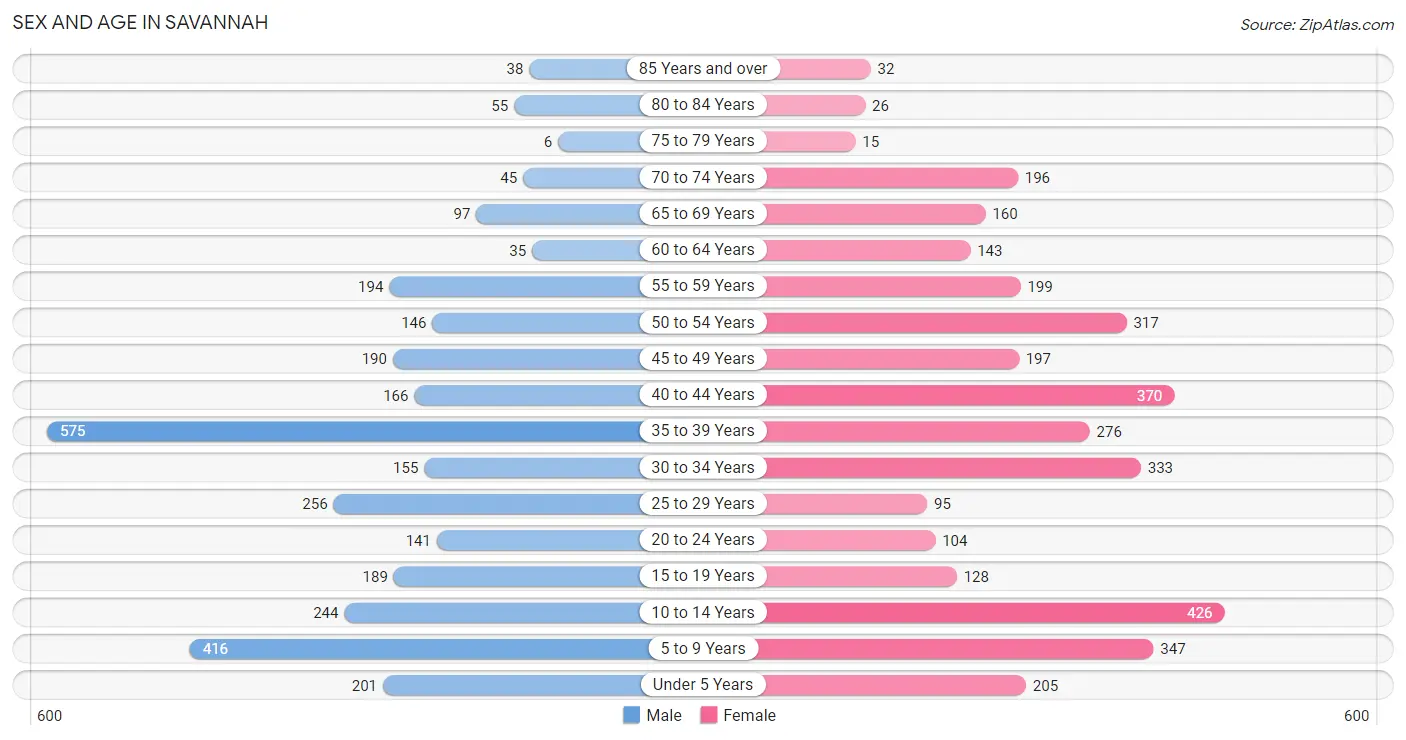
| Age Bracket | Male | Female |
| Under 5 Years | 201 (6.4%) | 205 (5.7%) |
| 5 to 9 Years | 416 (13.2%) | 347 (9.7%) |
| 10 to 14 Years | 244 (7.7%) | 426 (11.9%) |
| 15 to 19 Years | 189 (6.0%) | 128 (3.6%) |
| 20 to 24 Years | 141 (4.5%) | 104 (2.9%) |
| 25 to 29 Years | 256 (8.1%) | 95 (2.7%) |
| 30 to 34 Years | 155 (4.9%) | 333 (9.3%) |
| 35 to 39 Years | 575 (18.3%) | 276 (7.7%) |
| 40 to 44 Years | 166 (5.3%) | 370 (10.4%) |
| 45 to 49 Years | 190 (6.0%) | 197 (5.5%) |
| 50 to 54 Years | 146 (4.6%) | 317 (8.9%) |
| 55 to 59 Years | 194 (6.2%) | 199 (5.6%) |
| 60 to 64 Years | 35 (1.1%) | 143 (4.0%) |
| 65 to 69 Years | 97 (3.1%) | 160 (4.5%) |
| 70 to 74 Years | 45 (1.4%) | 196 (5.5%) |
| 75 to 79 Years | 6 (0.2%) | 15 (0.4%) |
| 80 to 84 Years | 55 (1.8%) | 26 (0.7%) |
| 85 Years and over | 38 (1.2%) | 32 (0.9%) |
| Total | 3,149 (100.0%) | 3,569 (100.0%) |
Families and Households in Savannah
Median Family Size in Savannah
The median family size in Savannah is 3.29 persons per family, with married-couple families (1,314 | 69.1%) accounting for the largest median family size of 3.7 persons per family. On the other hand, single male/father families (245 | 12.9%) represent the smallest median family size with 2.13 persons per family.
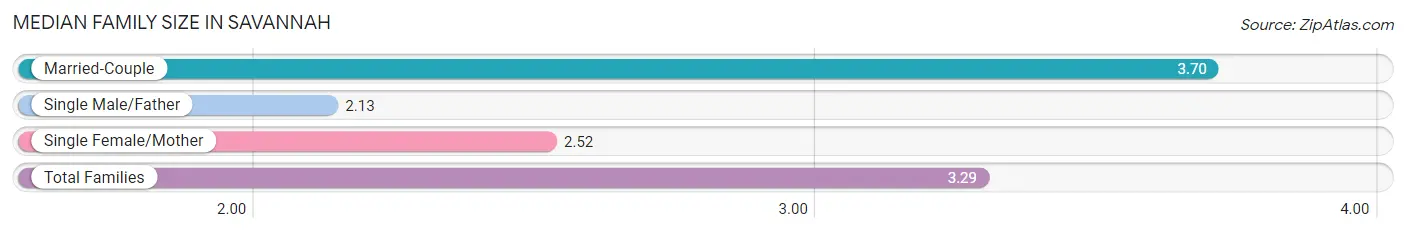
| Family Type | # Families | Family Size |
| Married-Couple | 1,314 (69.1%) | 3.70 |
| Single Male/Father | 245 (12.9%) | 2.13 |
| Single Female/Mother | 343 (18.0%) | 2.52 |
| Total Families | 1,902 (100.0%) | 3.29 |
Median Household Size in Savannah
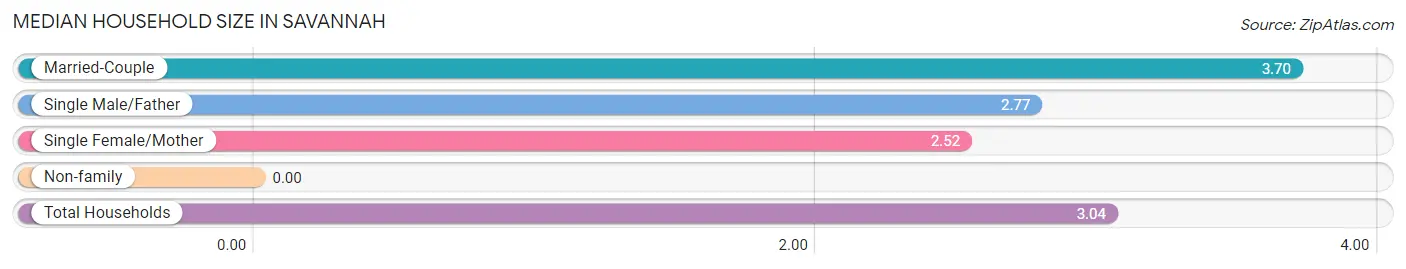
| Household Type | # Households | Household Size |
| Married-Couple | 1,314 (59.5%) | 3.70 |
| Single Male/Father | 245 (11.1%) | 2.77 |
| Single Female/Mother | 343 (15.5%) | 2.52 |
| Non-family | 306 (13.9%) | - |
| Total Households | 2,208 (100.0%) | 3.04 |
Household Size by Marriage Status in Savannah
Out of a total of 2,208 households in Savannah, 1,902 (86.1%) are family households, while 306 (13.9%) are nonfamily households. The most numerous type of family households are 2-person households, comprising 710, and the most common type of nonfamily households are 1-person households, comprising 306.
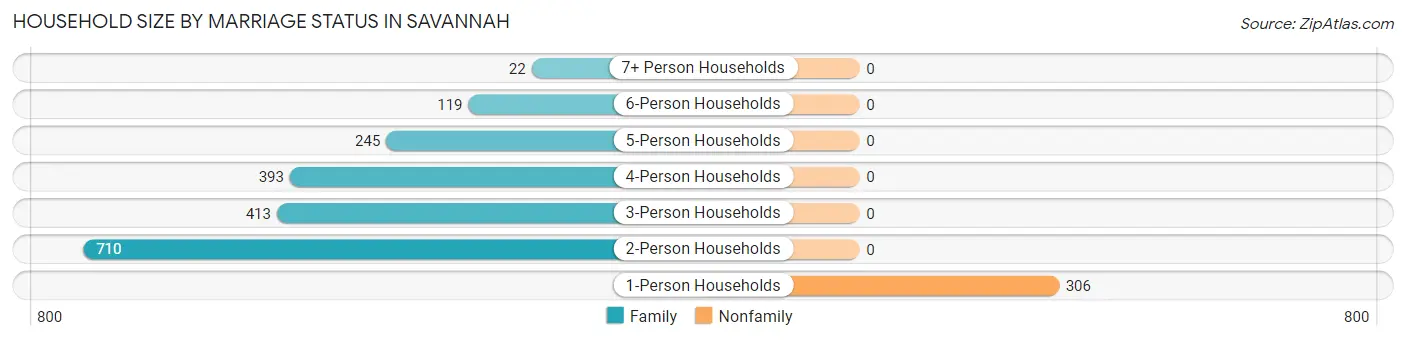
| Household Size | Family Households | Nonfamily Households |
| 1-Person Households | - | 306 (13.9%) |
| 2-Person Households | 710 (32.2%) | 0 (0.0%) |
| 3-Person Households | 413 (18.7%) | 0 (0.0%) |
| 4-Person Households | 393 (17.8%) | 0 (0.0%) |
| 5-Person Households | 245 (11.1%) | 0 (0.0%) |
| 6-Person Households | 119 (5.4%) | 0 (0.0%) |
| 7+ Person Households | 22 (1.0%) | 0 (0.0%) |
| Total | 1,902 (86.1%) | 306 (13.9%) |
Female Fertility in Savannah
Fertility by Age in Savannah
Average fertility rate in Savannah is 76.0 births per 1,000 women. Women in the age bracket of 20 to 34 years have the highest fertility rate with 182.0 births per 1,000 women. Women in the age bracket of 20 to 34 years acount for 77.0% of all women with births.
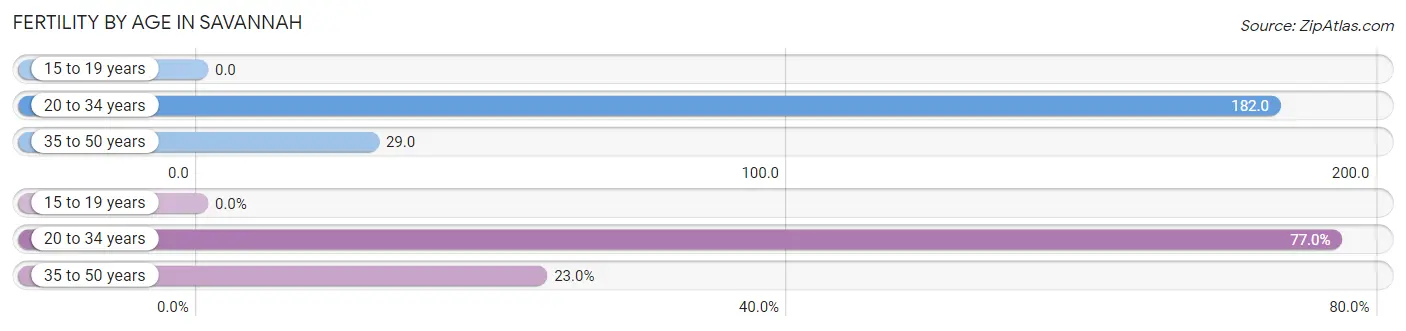
| Age Bracket | Women with Births | Births / 1,000 Women |
| 15 to 19 years | 0 (0.0%) | 0.0 |
| 20 to 34 years | 97 (77.0%) | 182.0 |
| 35 to 50 years | 29 (23.0%) | 29.0 |
| Total | 126 (100.0%) | 76.0 |
Fertility by Age by Marriage Status in Savannah
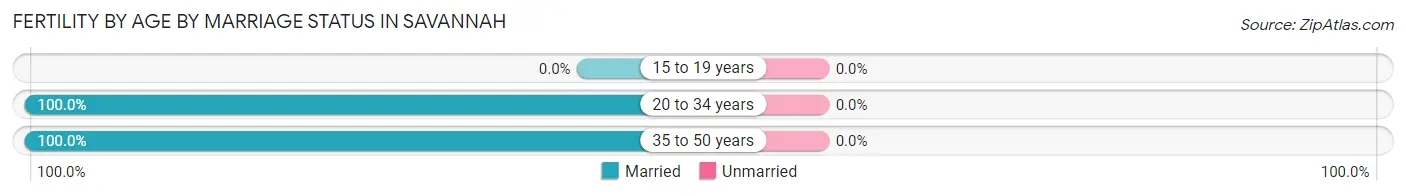
| Age Bracket | Married | Unmarried |
| 15 to 19 years | 0 (0.0%) | 0 (0.0%) |
| 20 to 34 years | 97 (100.0%) | 0 (0.0%) |
| 35 to 50 years | 29 (100.0%) | 0 (0.0%) |
| Total | 126 (100.0%) | 0 (0.0%) |
Fertility by Education in Savannah
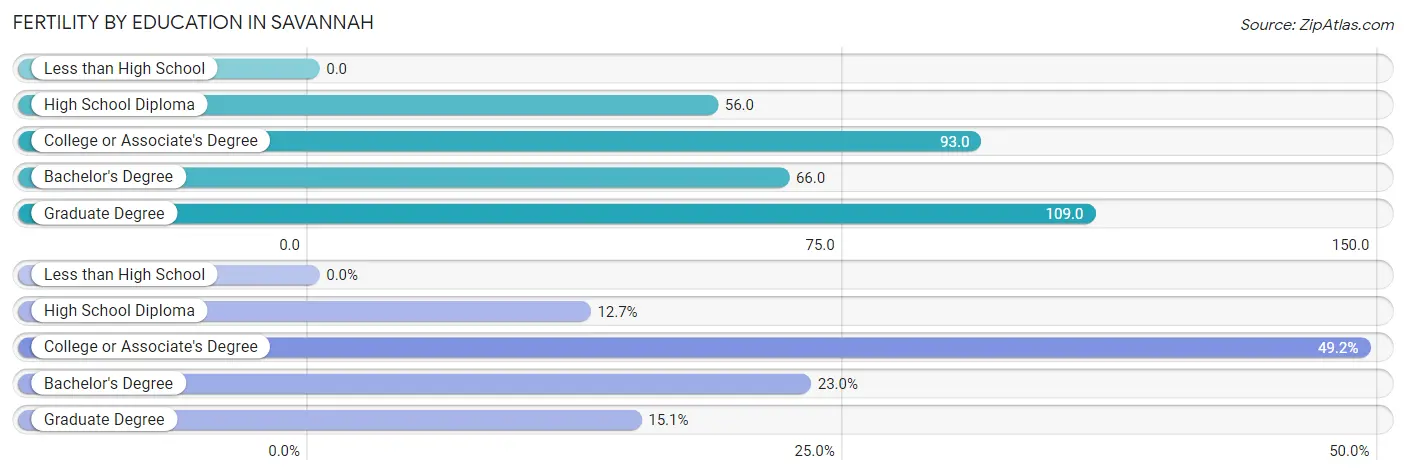
| Educational Attainment | Women with Births | Births / 1,000 Women |
| Less than High School | 0 (0.0%) | 0.0 |
| High School Diploma | 16 (12.7%) | 56.0 |
| College or Associate's Degree | 62 (49.2%) | 93.0 |
| Bachelor's Degree | 29 (23.0%) | 66.0 |
| Graduate Degree | 19 (15.1%) | 109.0 |
| Total | 126 (100.0%) | 76.0 |
Fertility by Education by Marriage Status in Savannah
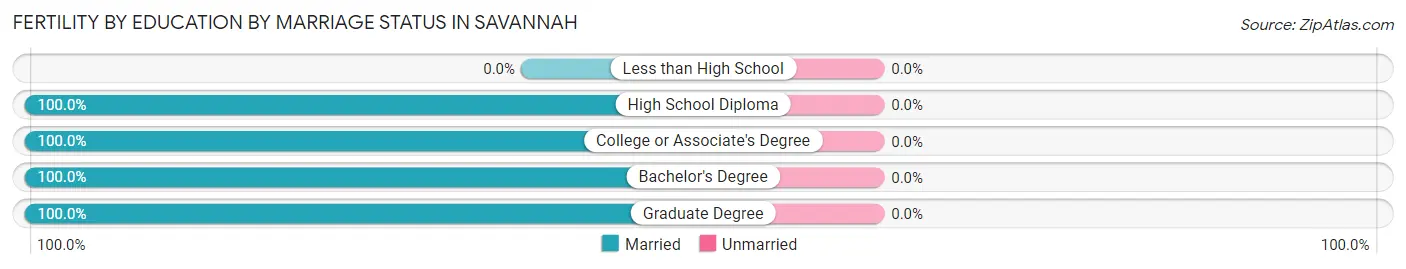
| Educational Attainment | Married | Unmarried |
| Less than High School | 0 (0.0%) | 0 (0.0%) |
| High School Diploma | 16 (100.0%) | 0 (0.0%) |
| College or Associate's Degree | 62 (100.0%) | 0 (0.0%) |
| Bachelor's Degree | 29 (100.0%) | 0 (0.0%) |
| Graduate Degree | 19 (100.0%) | 0 (0.0%) |
| Total | 126 (100.0%) | 0 (0.0%) |
Employment Characteristics in Savannah
Employment by Class of Employer in Savannah
Among the 3,255 employed individuals in Savannah, private company employees (2,746 | 84.4%), not-for-profit organizations (142 | 4.4%), and local government employees (138 | 4.2%) make up the most common classes of employment.
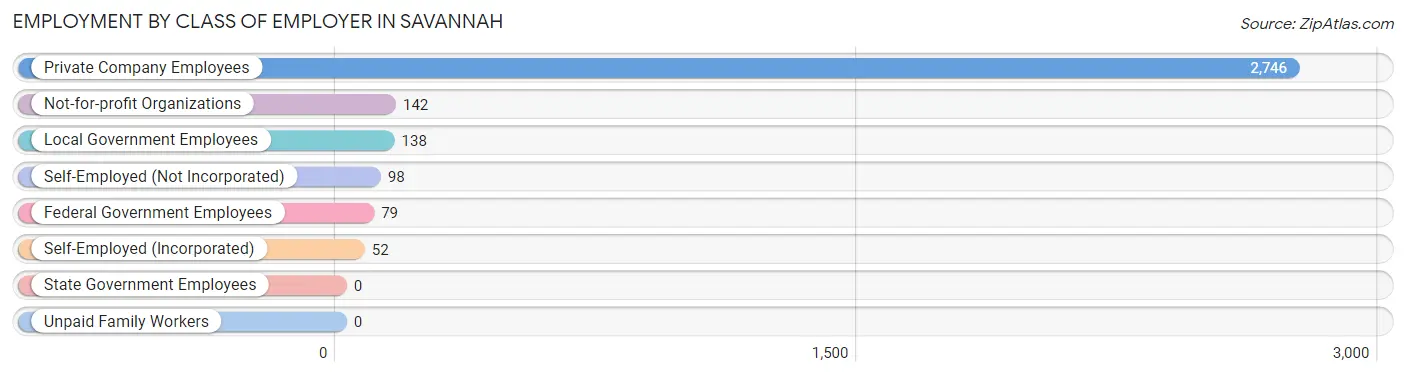
| Employer Class | # Employees | % Employees |
| Private Company Employees | 2,746 | 84.4% |
| Self-Employed (Incorporated) | 52 | 1.6% |
| Self-Employed (Not Incorporated) | 98 | 3.0% |
| Not-for-profit Organizations | 142 | 4.4% |
| Local Government Employees | 138 | 4.2% |
| State Government Employees | 0 | 0.0% |
| Federal Government Employees | 79 | 2.4% |
| Unpaid Family Workers | 0 | 0.0% |
| Total | 3,255 | 100.0% |
Employment Status by Age in Savannah
According to the labor force statistics for Savannah, out of the total population over 16 years of age (4,735), 77.0% or 3,646 individuals are in the labor force, with 6.3% or 230 of them unemployed. The age group with the highest labor force participation rate is 35 to 44 years, with 97.9% or 1,358 individuals in the labor force. Within the labor force, the 45 to 54 years age range has the highest percentage of unemployed individuals, with 18.2% or 149 of them being unemployed.
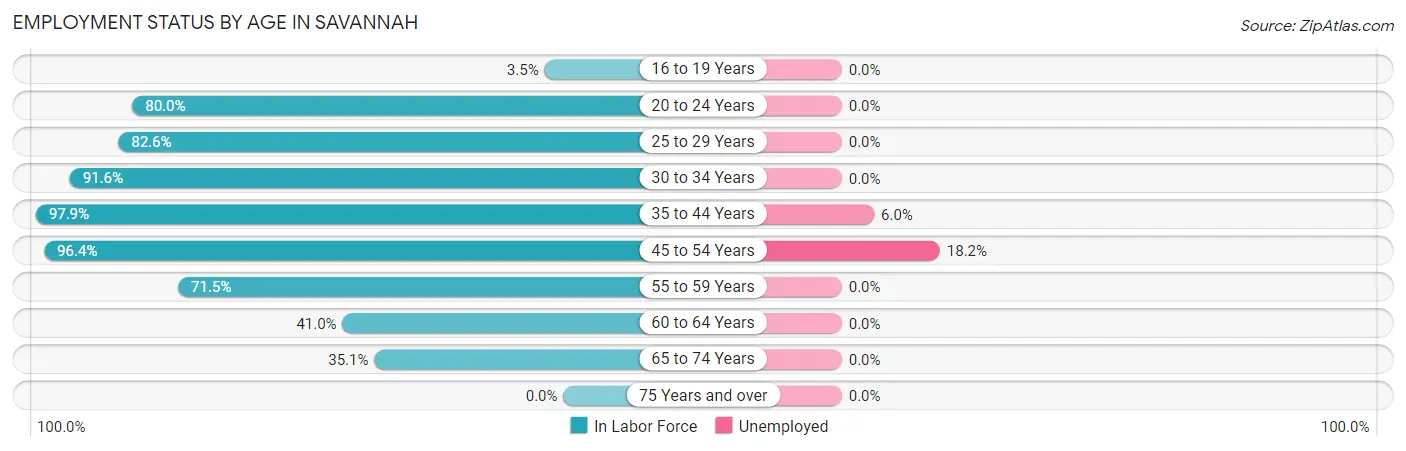
| Age Bracket | In Labor Force | Unemployed |
| 16 to 19 Years | 6 (3.5%) | 0 (0.0%) |
| 20 to 24 Years | 196 (80.0%) | 0 (0.0%) |
| 25 to 29 Years | 290 (82.6%) | 0 (0.0%) |
| 30 to 34 Years | 447 (91.6%) | 0 (0.0%) |
| 35 to 44 Years | 1,358 (97.9%) | 81 (6.0%) |
| 45 to 54 Years | 819 (96.4%) | 149 (18.2%) |
| 55 to 59 Years | 281 (71.5%) | 0 (0.0%) |
| 60 to 64 Years | 73 (41.0%) | 0 (0.0%) |
| 65 to 74 Years | 175 (35.1%) | 0 (0.0%) |
| 75 Years and over | 0 (0.0%) | 0 (0.0%) |
| Total | 3,646 (77.0%) | 230 (6.3%) |
Employment Status by Educational Attainment in Savannah
According to labor force statistics for Savannah, 89.6% of individuals (3,268) out of the total population between 25 and 64 years of age (3,647) are in the labor force, with 7.1% or 232 of them being unemployed. The group with the highest labor force participation rate are those with the educational attainment of less than high school, with 100.0% or 44 individuals in the labor force. Within the labor force, individuals with high school diploma education have the highest percentage of unemployment, with 20.4% or 149 of them being unemployed.
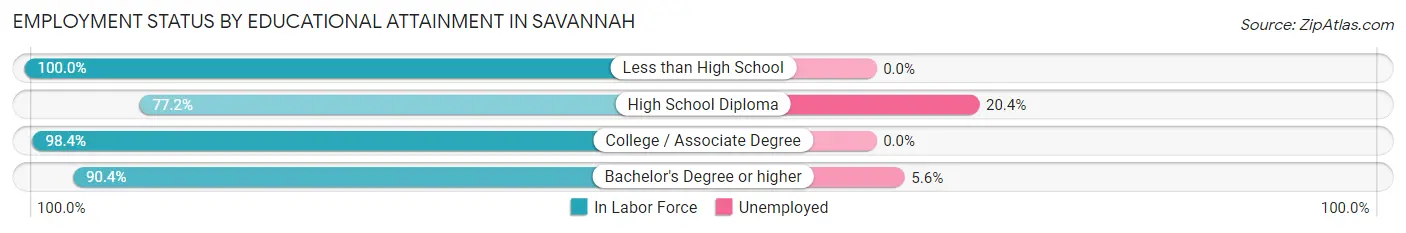
| Educational Attainment | In Labor Force | Unemployed |
| Less than High School | 44 (100.0%) | 0 (0.0%) |
| High School Diploma | 729 (77.2%) | 193 (20.4%) |
| College / Associate Degree | 1,121 (98.4%) | 0 (0.0%) |
| Bachelor's Degree or higher | 1,374 (90.4%) | 85 (5.6%) |
| Total | 3,268 (89.6%) | 259 (7.1%) |
Employment Occupations by Sex in Savannah
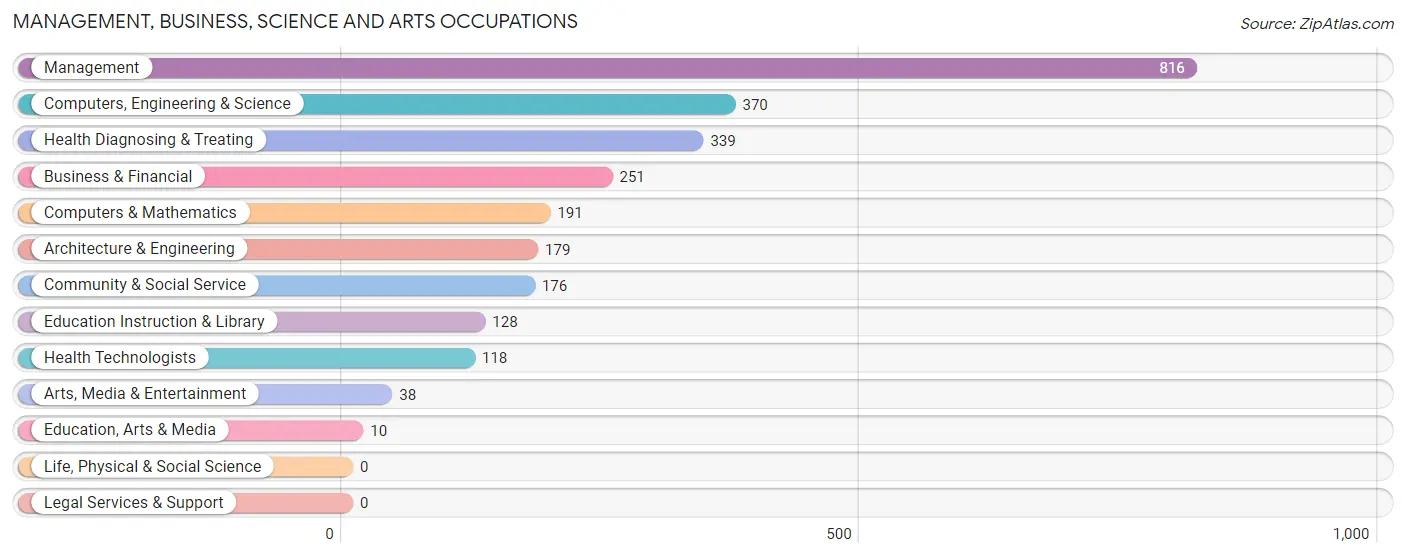
Management, Business, Science and Arts Occupations
The most common Management, Business, Science and Arts occupations in Savannah are Management (816 | 24.4%), Computers, Engineering & Science (370 | 11.1%), Health Diagnosing & Treating (339 | 10.2%), Business & Financial (251 | 7.5%), and Computers & Mathematics (191 | 5.7%).
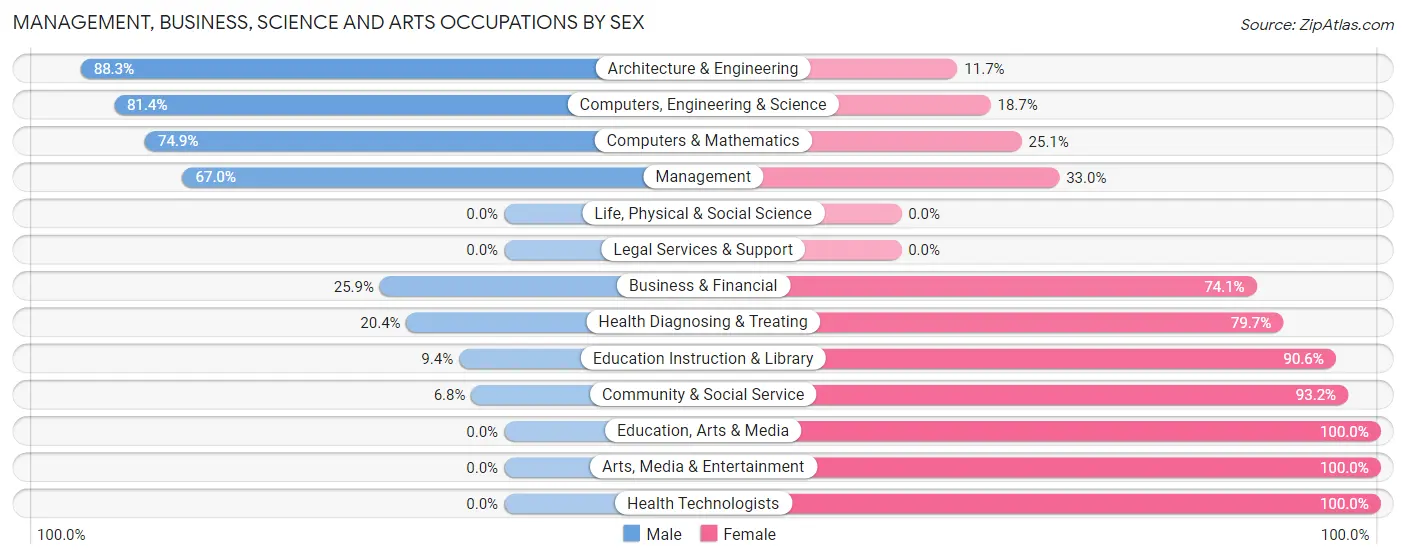
Management, Business, Science and Arts Occupations by Sex
Within the Management, Business, Science and Arts occupations in Savannah, the most male-oriented occupations are Architecture & Engineering (88.3%), Computers, Engineering & Science (81.4%), and Computers & Mathematics (74.9%), while the most female-oriented occupations are Education, Arts & Media (100.0%), Arts, Media & Entertainment (100.0%), and Health Technologists (100.0%).
| Occupation | Male | Female |
| Management | 547 (67.0%) | 269 (33.0%) |
| Business & Financial | 65 (25.9%) | 186 (74.1%) |
| Computers, Engineering & Science | 301 (81.4%) | 69 (18.6%) |
| Computers & Mathematics | 143 (74.9%) | 48 (25.1%) |
| Architecture & Engineering | 158 (88.3%) | 21 (11.7%) |
| Life, Physical & Social Science | 0 (0.0%) | 0 (0.0%) |
| Community & Social Service | 12 (6.8%) | 164 (93.2%) |
| Education, Arts & Media | 0 (0.0%) | 10 (100.0%) |
| Legal Services & Support | 0 (0.0%) | 0 (0.0%) |
| Education Instruction & Library | 12 (9.4%) | 116 (90.6%) |
| Arts, Media & Entertainment | 0 (0.0%) | 38 (100.0%) |
| Health Diagnosing & Treating | 69 (20.3%) | 270 (79.6%) |
| Health Technologists | 0 (0.0%) | 118 (100.0%) |
| Total (Category) | 994 (50.9%) | 958 (49.1%) |
| Total (Overall) | 1,648 (49.3%) | 1,692 (50.7%) |
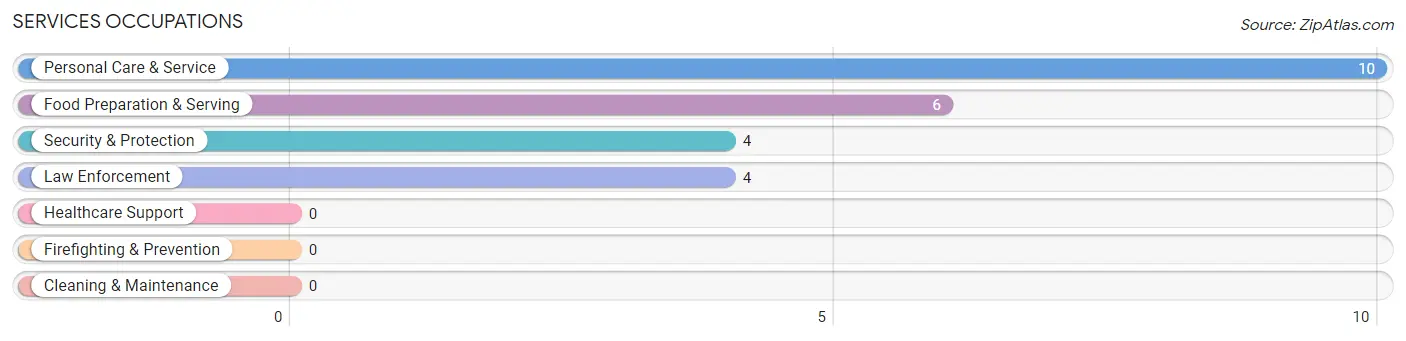
Services Occupations
The most common Services occupations in Savannah are Personal Care & Service (10 | 0.3%), Food Preparation & Serving (6 | 0.2%), Security & Protection (4 | 0.1%), and Law Enforcement (4 | 0.1%).
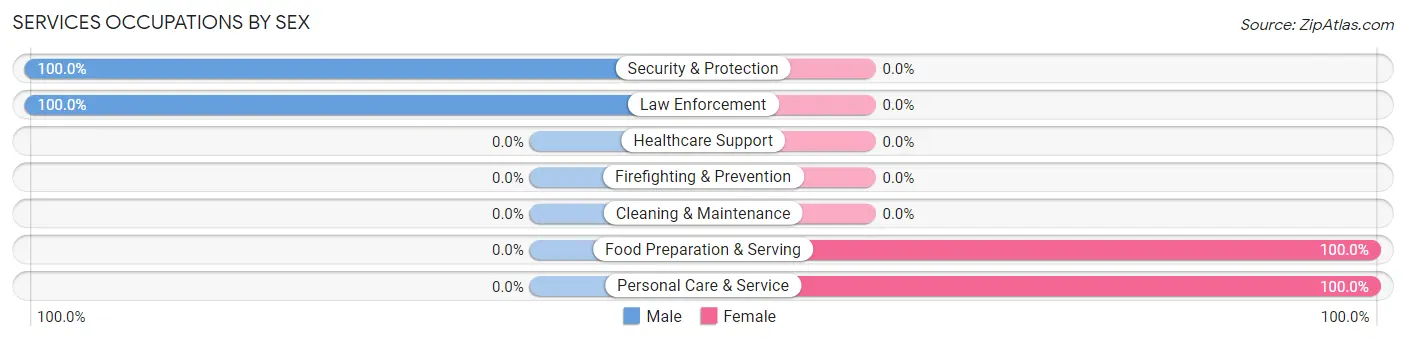
Services Occupations by Sex
Within the Services occupations in Savannah, the most male-oriented occupations are Security & Protection (100.0%), and Law Enforcement (100.0%), while the most female-oriented occupations are Food Preparation & Serving (100.0%), and Personal Care & Service (100.0%).
| Occupation | Male | Female |
| Healthcare Support | 0 (0.0%) | 0 (0.0%) |
| Security & Protection | 4 (100.0%) | 0 (0.0%) |
| Firefighting & Prevention | 0 (0.0%) | 0 (0.0%) |
| Law Enforcement | 4 (100.0%) | 0 (0.0%) |
| Food Preparation & Serving | 0 (0.0%) | 6 (100.0%) |
| Cleaning & Maintenance | 0 (0.0%) | 0 (0.0%) |
| Personal Care & Service | 0 (0.0%) | 10 (100.0%) |
| Total (Category) | 4 (20.0%) | 16 (80.0%) |
| Total (Overall) | 1,648 (49.3%) | 1,692 (50.7%) |
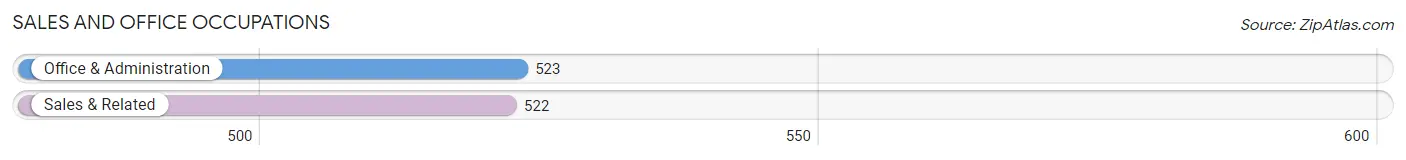
Sales and Office Occupations
The most common Sales and Office occupations in Savannah are Office & Administration (523 | 15.7%), and Sales & Related (522 | 15.6%).
Sales and Office Occupations by Sex
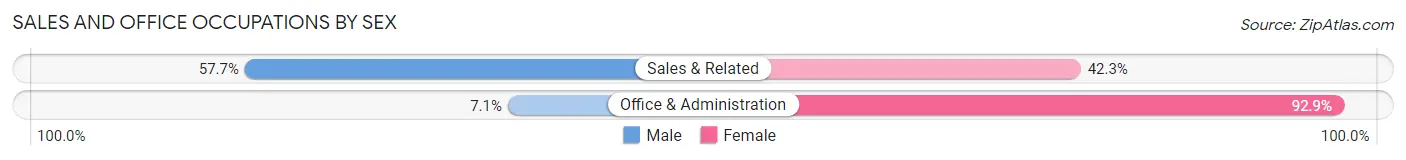
| Occupation | Male | Female |
| Sales & Related | 301 (57.7%) | 221 (42.3%) |
| Office & Administration | 37 (7.1%) | 486 (92.9%) |
| Total (Category) | 338 (32.3%) | 707 (67.7%) |
| Total (Overall) | 1,648 (49.3%) | 1,692 (50.7%) |
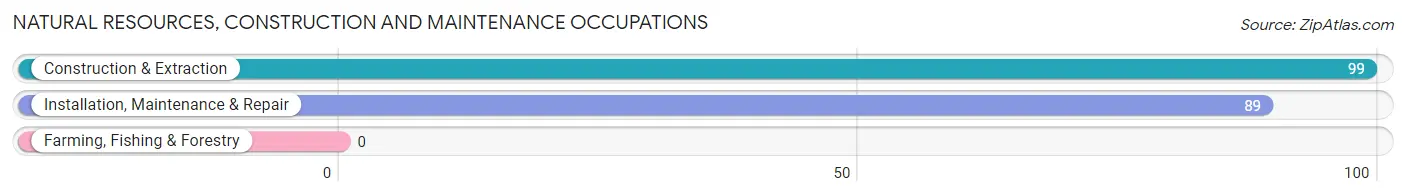
Natural Resources, Construction and Maintenance Occupations
The most common Natural Resources, Construction and Maintenance occupations in Savannah are Construction & Extraction (99 | 3.0%), and Installation, Maintenance & Repair (89 | 2.7%).
Natural Resources, Construction and Maintenance Occupations by Sex
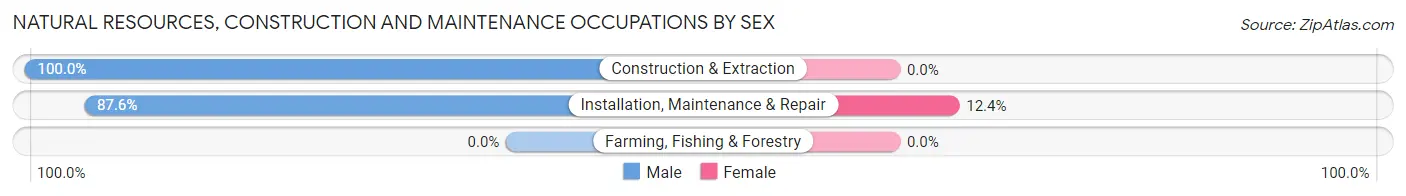
| Occupation | Male | Female |
| Farming, Fishing & Forestry | 0 (0.0%) | 0 (0.0%) |
| Construction & Extraction | 99 (100.0%) | 0 (0.0%) |
| Installation, Maintenance & Repair | 78 (87.6%) | 11 (12.4%) |
| Total (Category) | 177 (94.2%) | 11 (5.9%) |
| Total (Overall) | 1,648 (49.3%) | 1,692 (50.7%) |
Production, Transportation and Moving Occupations
The most common Production, Transportation and Moving occupations in Savannah are Production (109 | 3.3%), Material Moving (14 | 0.4%), and Transportation (12 | 0.4%).
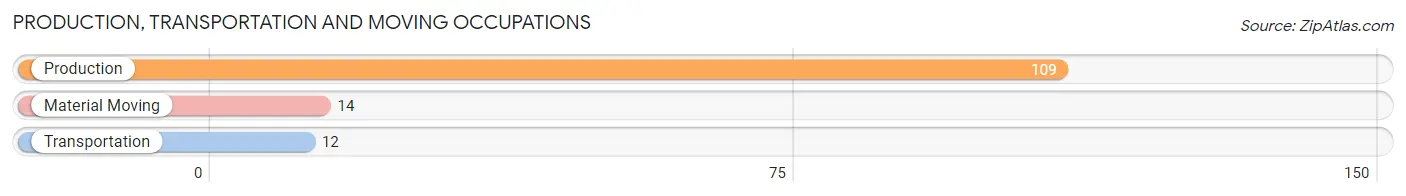
Production, Transportation and Moving Occupations by Sex
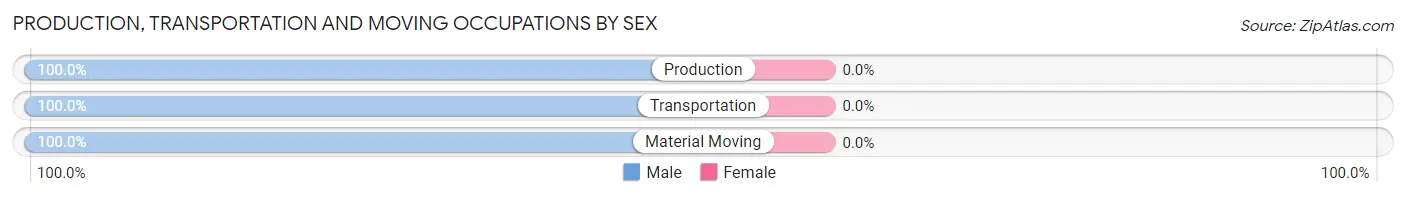
| Occupation | Male | Female |
| Production | 109 (100.0%) | 0 (0.0%) |
| Transportation | 12 (100.0%) | 0 (0.0%) |
| Material Moving | 14 (100.0%) | 0 (0.0%) |
| Total (Category) | 135 (100.0%) | 0 (0.0%) |
| Total (Overall) | 1,648 (49.3%) | 1,692 (50.7%) |
Employment Industries by Sex in Savannah
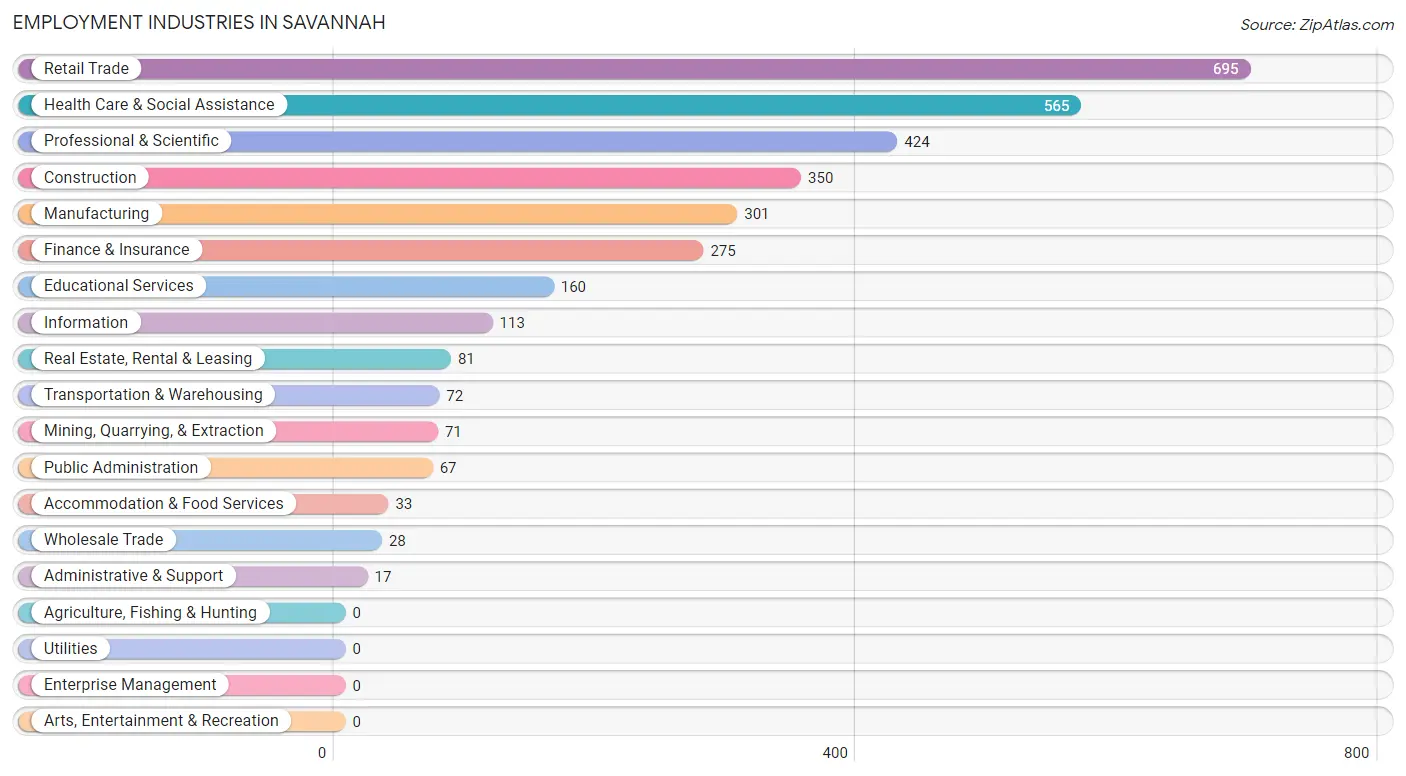
Employment Industries in Savannah
The major employment industries in Savannah include Retail Trade (695 | 20.8%), Health Care & Social Assistance (565 | 16.9%), Professional & Scientific (424 | 12.7%), Construction (350 | 10.5%), and Manufacturing (301 | 9.0%).
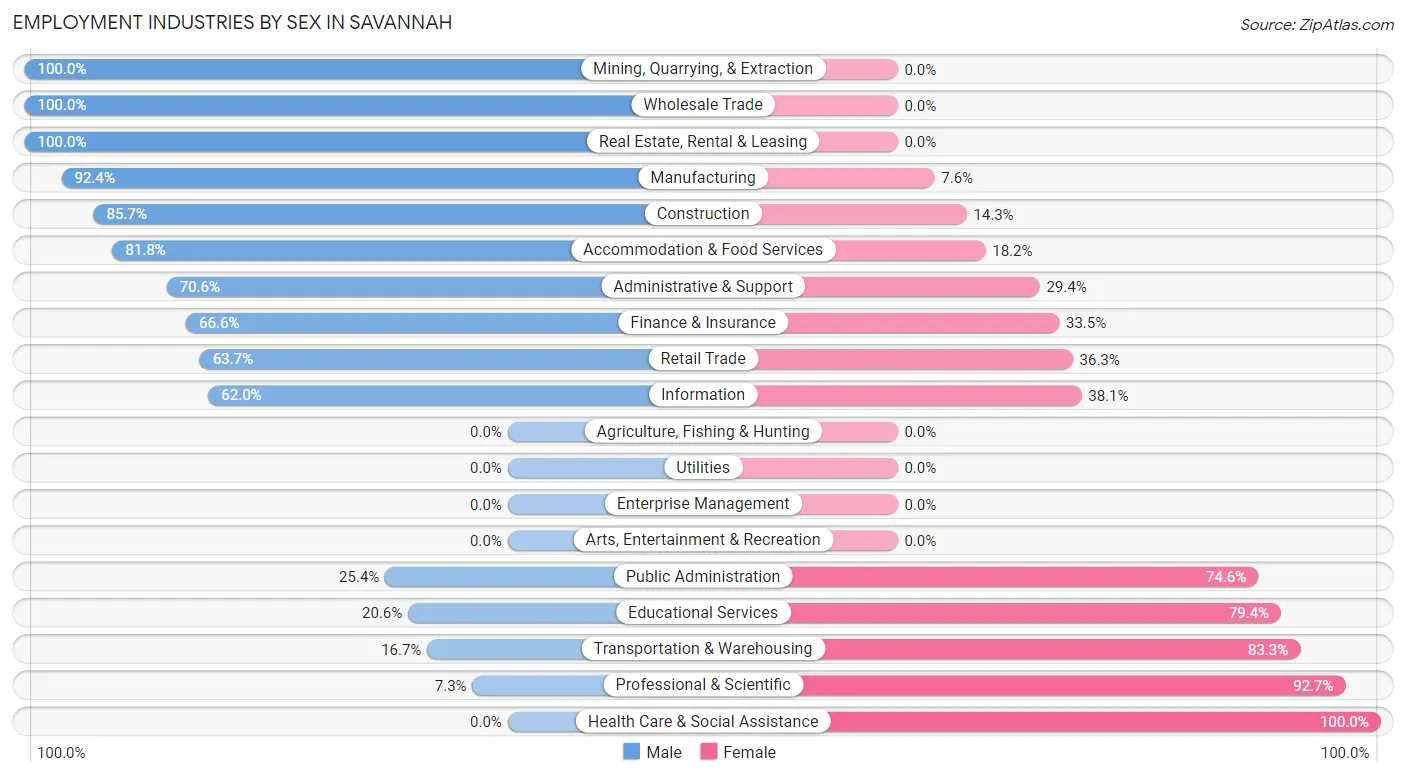
Employment Industries by Sex in Savannah
The Savannah industries that see more men than women are Mining, Quarrying, & Extraction (100.0%), Wholesale Trade (100.0%), and Real Estate, Rental & Leasing (100.0%), whereas the industries that tend to have a higher number of women are Health Care & Social Assistance (100.0%), Professional & Scientific (92.7%), and Transportation & Warehousing (83.3%).
| Industry | Male | Female |
| Agriculture, Fishing & Hunting | 0 (0.0%) | 0 (0.0%) |
| Mining, Quarrying, & Extraction | 71 (100.0%) | 0 (0.0%) |
| Construction | 300 (85.7%) | 50 (14.3%) |
| Manufacturing | 278 (92.4%) | 23 (7.6%) |
| Wholesale Trade | 28 (100.0%) | 0 (0.0%) |
| Retail Trade | 443 (63.7%) | 252 (36.3%) |
| Transportation & Warehousing | 12 (16.7%) | 60 (83.3%) |
| Utilities | 0 (0.0%) | 0 (0.0%) |
| Information | 70 (62.0%) | 43 (38.1%) |
| Finance & Insurance | 183 (66.5%) | 92 (33.5%) |
| Real Estate, Rental & Leasing | 81 (100.0%) | 0 (0.0%) |
| Professional & Scientific | 31 (7.3%) | 393 (92.7%) |
| Enterprise Management | 0 (0.0%) | 0 (0.0%) |
| Administrative & Support | 12 (70.6%) | 5 (29.4%) |
| Educational Services | 33 (20.6%) | 127 (79.4%) |
| Health Care & Social Assistance | 0 (0.0%) | 565 (100.0%) |
| Arts, Entertainment & Recreation | 0 (0.0%) | 0 (0.0%) |
| Accommodation & Food Services | 27 (81.8%) | 6 (18.2%) |
| Public Administration | 17 (25.4%) | 50 (74.6%) |
| Total | 1,648 (49.3%) | 1,692 (50.7%) |
Education in Savannah
School Enrollment in Savannah
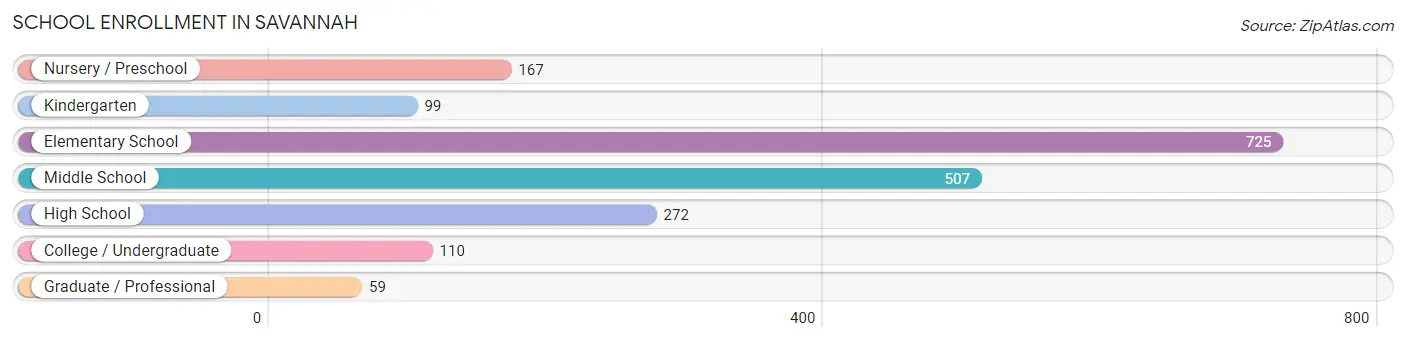
The most common levels of schooling among the 1,939 students in Savannah are elementary school (725 | 37.4%), middle school (507 | 26.2%), and high school (272 | 14.0%).
| School Level | # Students | % Students |
| Nursery / Preschool | 167 | 8.6% |
| Kindergarten | 99 | 5.1% |
| Elementary School | 725 | 37.4% |
| Middle School | 507 | 26.2% |
| High School | 272 | 14.0% |
| College / Undergraduate | 110 | 5.7% |
| Graduate / Professional | 59 | 3.0% |
| Total | 1,939 | 100.0% |
School Enrollment by Age by Funding Source in Savannah
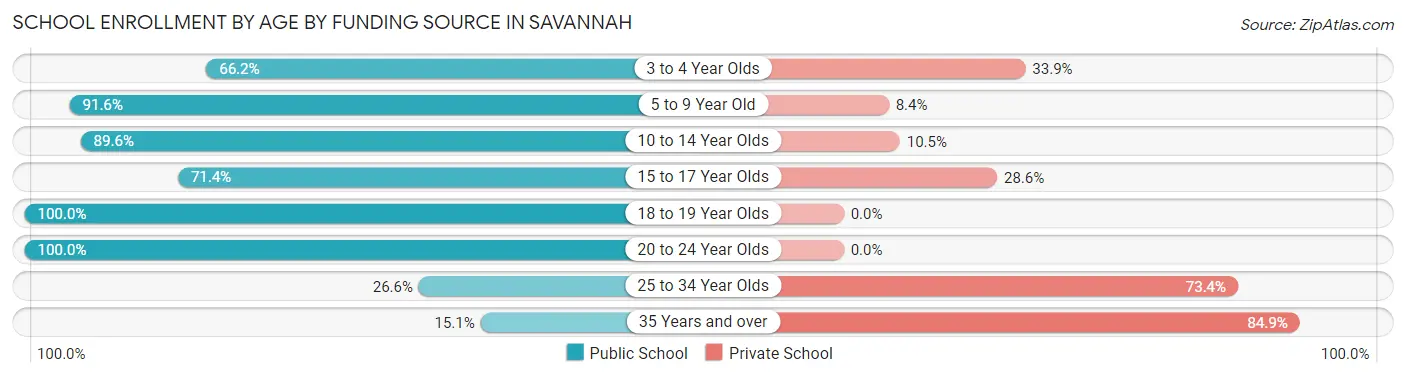
Out of a total of 1,939 students who are enrolled in schools in Savannah, 353 (18.2%) attend a private institution, while the remaining 1,586 (81.8%) are enrolled in public schools. The age group of 35 years and over has the highest likelihood of being enrolled in private schools, with 62 (84.9% in the age bracket) enrolled. Conversely, the age group of 18 to 19 year olds has the lowest likelihood of being enrolled in a private school, with 6 (100.0% in the age bracket) attending a public institution.
| Age Bracket | Public School | Private School |
| 3 to 4 Year Olds | 43 (66.1%) | 22 (33.9%) |
| 5 to 9 Year Old | 699 (91.6%) | 64 (8.4%) |
| 10 to 14 Year Olds | 600 (89.5%) | 70 (10.4%) |
| 15 to 17 Year Olds | 190 (71.4%) | 76 (28.6%) |
| 18 to 19 Year Olds | 6 (100.0%) | 0 (0.0%) |
| 20 to 24 Year Olds | 17 (100.0%) | 0 (0.0%) |
| 25 to 34 Year Olds | 21 (26.6%) | 58 (73.4%) |
| 35 Years and over | 11 (15.1%) | 62 (84.9%) |
| Total | 1,586 (81.8%) | 353 (18.2%) |
Educational Attainment by Field of Study in Savannah
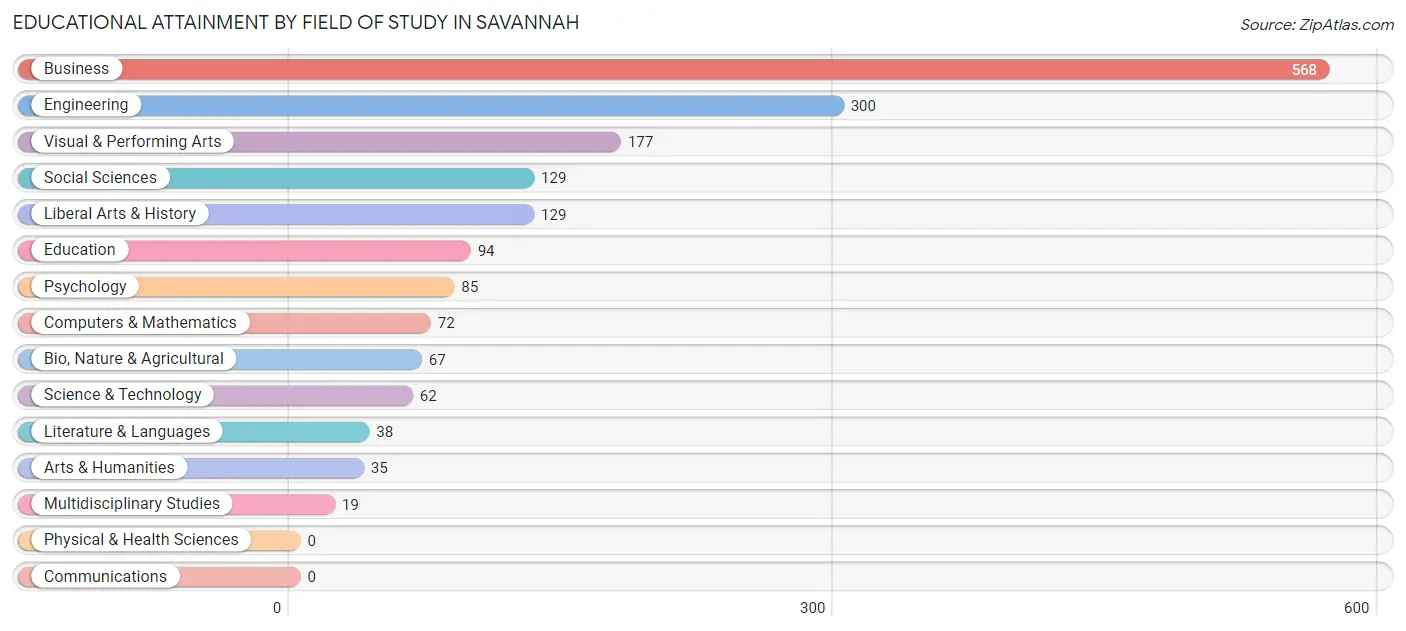
Business (568 | 32.0%), engineering (300 | 16.9%), visual & performing arts (177 | 10.0%), social sciences (129 | 7.3%), and liberal arts & history (129 | 7.3%) are the most common fields of study among 1,775 individuals in Savannah who have obtained a bachelor's degree or higher.
| Field of Study | # Graduates | % Graduates |
| Computers & Mathematics | 72 | 4.1% |
| Bio, Nature & Agricultural | 67 | 3.8% |
| Physical & Health Sciences | 0 | 0.0% |
| Psychology | 85 | 4.8% |
| Social Sciences | 129 | 7.3% |
| Engineering | 300 | 16.9% |
| Multidisciplinary Studies | 19 | 1.1% |
| Science & Technology | 62 | 3.5% |
| Business | 568 | 32.0% |
| Education | 94 | 5.3% |
| Literature & Languages | 38 | 2.1% |
| Liberal Arts & History | 129 | 7.3% |
| Visual & Performing Arts | 177 | 10.0% |
| Communications | 0 | 0.0% |
| Arts & Humanities | 35 | 2.0% |
| Total | 1,775 | 100.0% |
Transportation & Commute in Savannah
Vehicle Availability by Sex in Savannah
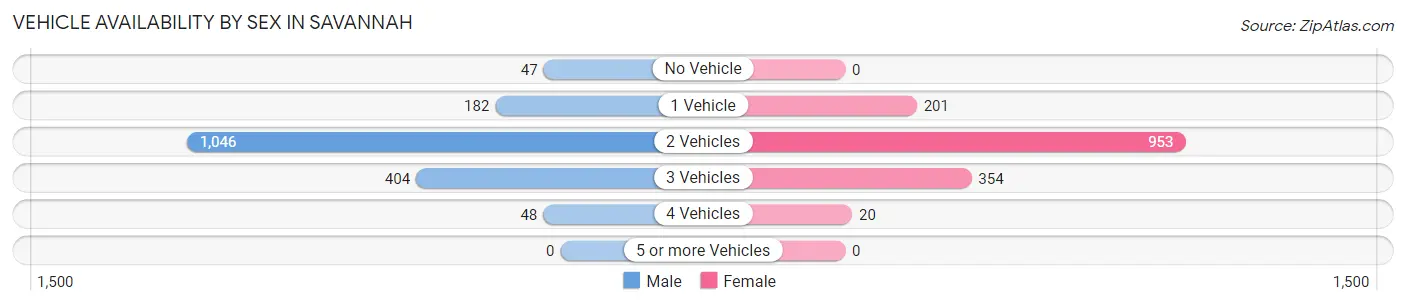
The most prevalent vehicle ownership categories in Savannah are males with 2 vehicles (1,046, accounting for 60.6%) and females with 2 vehicles (953, making up 68.5%).
| Vehicles Available | Male | Female |
| No Vehicle | 47 (2.7%) | 0 (0.0%) |
| 1 Vehicle | 182 (10.5%) | 201 (13.2%) |
| 2 Vehicles | 1,046 (60.6%) | 953 (62.4%) |
| 3 Vehicles | 404 (23.4%) | 354 (23.2%) |
| 4 Vehicles | 48 (2.8%) | 20 (1.3%) |
| 5 or more Vehicles | 0 (0.0%) | 0 (0.0%) |
| Total | 1,727 (100.0%) | 1,528 (100.0%) |
Commute Time in Savannah
The most frequently occuring commute durations in Savannah are 60 to 89 minutes (667 commuters, 27.4%), 45 to 59 minutes (362 commuters, 14.9%), and 30 to 34 minutes (251 commuters, 10.3%).
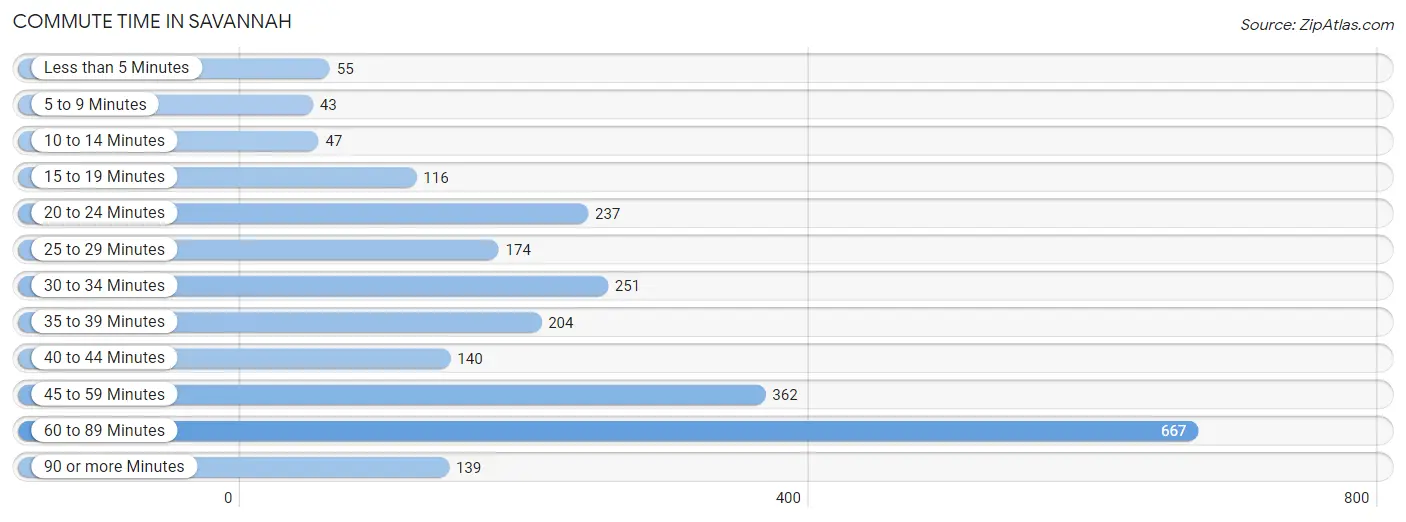
| Commute Time | # Commuters | % Commuters |
| Less than 5 Minutes | 55 | 2.3% |
| 5 to 9 Minutes | 43 | 1.8% |
| 10 to 14 Minutes | 47 | 1.9% |
| 15 to 19 Minutes | 116 | 4.8% |
| 20 to 24 Minutes | 237 | 9.7% |
| 25 to 29 Minutes | 174 | 7.1% |
| 30 to 34 Minutes | 251 | 10.3% |
| 35 to 39 Minutes | 204 | 8.4% |
| 40 to 44 Minutes | 140 | 5.8% |
| 45 to 59 Minutes | 362 | 14.9% |
| 60 to 89 Minutes | 667 | 27.4% |
| 90 or more Minutes | 139 | 5.7% |
Commute Time by Sex in Savannah
The most common commute times in Savannah are 60 to 89 minutes (445 commuters, 27.6%) for males and 60 to 89 minutes (222 commuters, 27.0%) for females.
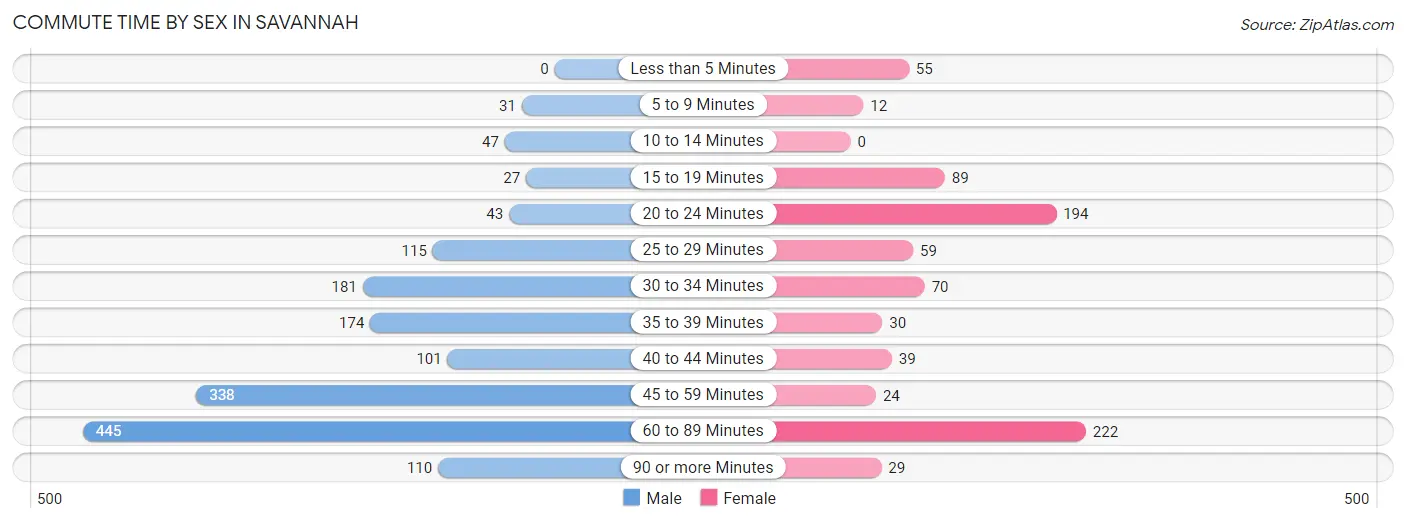
| Commute Time | Male | Female |
| Less than 5 Minutes | 0 (0.0%) | 55 (6.7%) |
| 5 to 9 Minutes | 31 (1.9%) | 12 (1.5%) |
| 10 to 14 Minutes | 47 (2.9%) | 0 (0.0%) |
| 15 to 19 Minutes | 27 (1.7%) | 89 (10.8%) |
| 20 to 24 Minutes | 43 (2.7%) | 194 (23.6%) |
| 25 to 29 Minutes | 115 (7.1%) | 59 (7.2%) |
| 30 to 34 Minutes | 181 (11.2%) | 70 (8.5%) |
| 35 to 39 Minutes | 174 (10.8%) | 30 (3.6%) |
| 40 to 44 Minutes | 101 (6.3%) | 39 (4.7%) |
| 45 to 59 Minutes | 338 (21.0%) | 24 (2.9%) |
| 60 to 89 Minutes | 445 (27.6%) | 222 (27.0%) |
| 90 or more Minutes | 110 (6.8%) | 29 (3.5%) |
Time of Departure to Work by Sex in Savannah
The most frequent times of departure to work in Savannah are 12:00 AM to 4:59 AM (289, 17.9%) for males and 7:30 AM to 7:59 AM (260, 31.6%) for females.
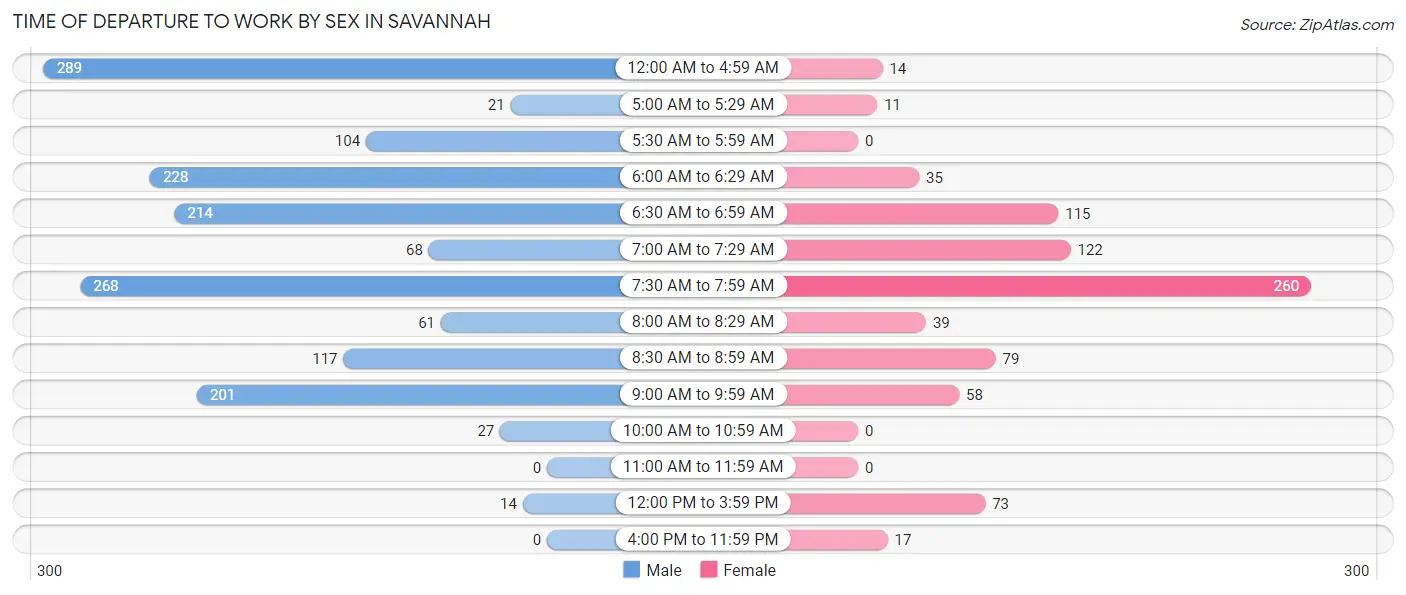
| Time of Departure | Male | Female |
| 12:00 AM to 4:59 AM | 289 (17.9%) | 14 (1.7%) |
| 5:00 AM to 5:29 AM | 21 (1.3%) | 11 (1.3%) |
| 5:30 AM to 5:59 AM | 104 (6.5%) | 0 (0.0%) |
| 6:00 AM to 6:29 AM | 228 (14.1%) | 35 (4.3%) |
| 6:30 AM to 6:59 AM | 214 (13.3%) | 115 (14.0%) |
| 7:00 AM to 7:29 AM | 68 (4.2%) | 122 (14.8%) |
| 7:30 AM to 7:59 AM | 268 (16.6%) | 260 (31.6%) |
| 8:00 AM to 8:29 AM | 61 (3.8%) | 39 (4.7%) |
| 8:30 AM to 8:59 AM | 117 (7.3%) | 79 (9.6%) |
| 9:00 AM to 9:59 AM | 201 (12.5%) | 58 (7.0%) |
| 10:00 AM to 10:59 AM | 27 (1.7%) | 0 (0.0%) |
| 11:00 AM to 11:59 AM | 0 (0.0%) | 0 (0.0%) |
| 12:00 PM to 3:59 PM | 14 (0.9%) | 73 (8.9%) |
| 4:00 PM to 11:59 PM | 0 (0.0%) | 17 (2.1%) |
| Total | 1,612 (100.0%) | 823 (100.0%) |
Housing Occupancy in Savannah
Occupancy by Ownership in Savannah
Of the total 2,208 dwellings in Savannah, owner-occupied units account for 1,652 (74.8%), while renter-occupied units make up 556 (25.2%).
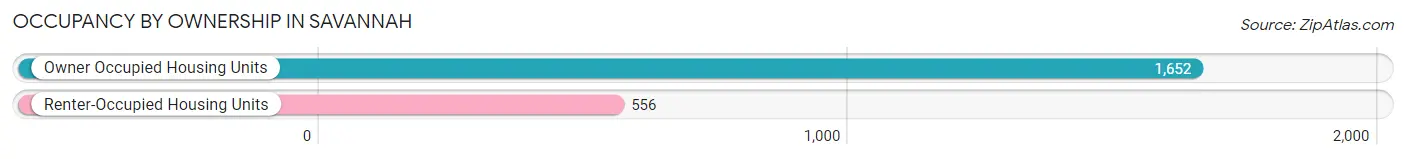
| Occupancy | # Housing Units | % Housing Units |
| Owner Occupied Housing Units | 1,652 | 74.8% |
| Renter-Occupied Housing Units | 556 | 25.2% |
| Total Occupied Housing Units | 2,208 | 100.0% |
Occupancy by Household Size in Savannah
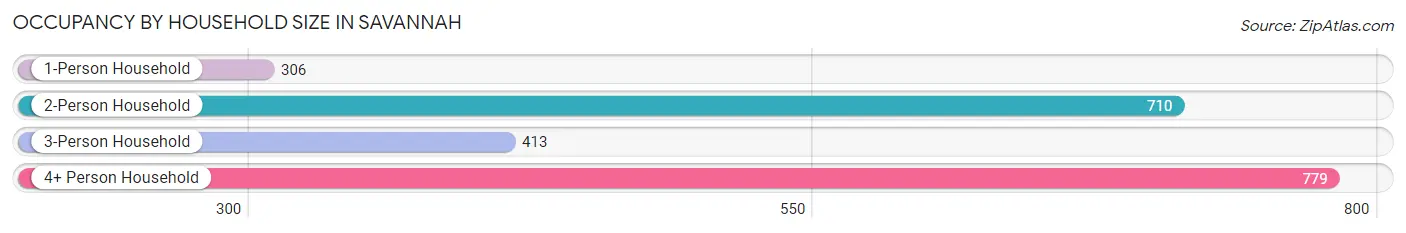
| Household Size | # Housing Units | % Housing Units |
| 1-Person Household | 306 | 13.9% |
| 2-Person Household | 710 | 32.2% |
| 3-Person Household | 413 | 18.7% |
| 4+ Person Household | 779 | 35.3% |
| Total Housing Units | 2,208 | 100.0% |
Occupancy by Ownership by Household Size in Savannah
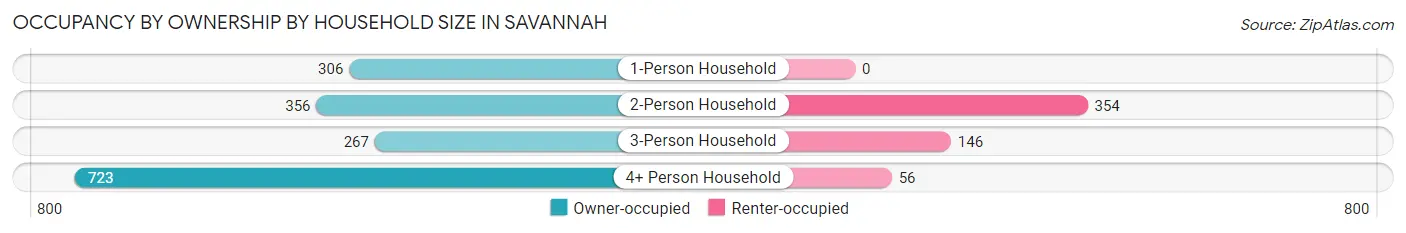
| Household Size | Owner-occupied | Renter-occupied |
| 1-Person Household | 306 (100.0%) | 0 (0.0%) |
| 2-Person Household | 356 (50.1%) | 354 (49.9%) |
| 3-Person Household | 267 (64.6%) | 146 (35.3%) |
| 4+ Person Household | 723 (92.8%) | 56 (7.2%) |
| Total Housing Units | 1,652 (74.8%) | 556 (25.2%) |
Occupancy by Educational Attainment in Savannah
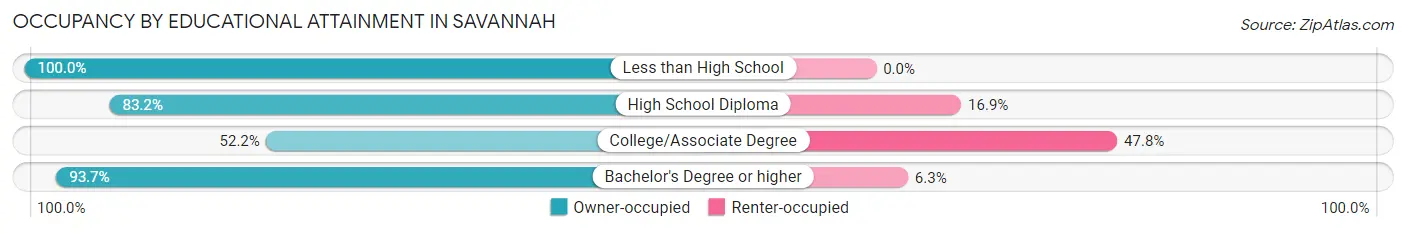
| Household Size | Owner-occupied | Renter-occupied |
| Less than High School | 43 (100.0%) | 0 (0.0%) |
| High School Diploma | 222 (83.2%) | 45 (16.9%) |
| College/Associate Degree | 493 (52.2%) | 451 (47.8%) |
| Bachelor's Degree or higher | 894 (93.7%) | 60 (6.3%) |
Occupancy by Age of Householder in Savannah
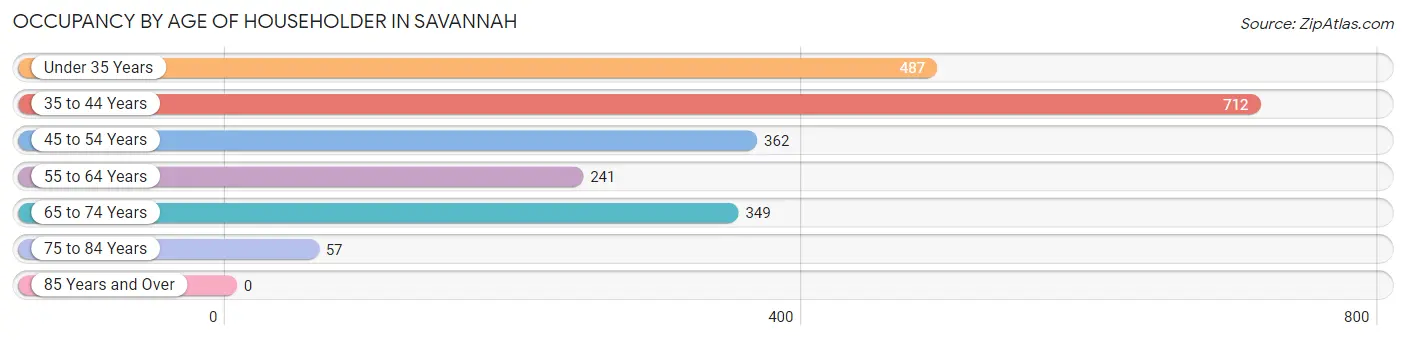
| Age Bracket | # Households | % Households |
| Under 35 Years | 487 | 22.1% |
| 35 to 44 Years | 712 | 32.3% |
| 45 to 54 Years | 362 | 16.4% |
| 55 to 64 Years | 241 | 10.9% |
| 65 to 74 Years | 349 | 15.8% |
| 75 to 84 Years | 57 | 2.6% |
| 85 Years and Over | 0 | 0.0% |
| Total | 2,208 | 100.0% |
Housing Finances in Savannah
Median Income by Occupancy in Savannah
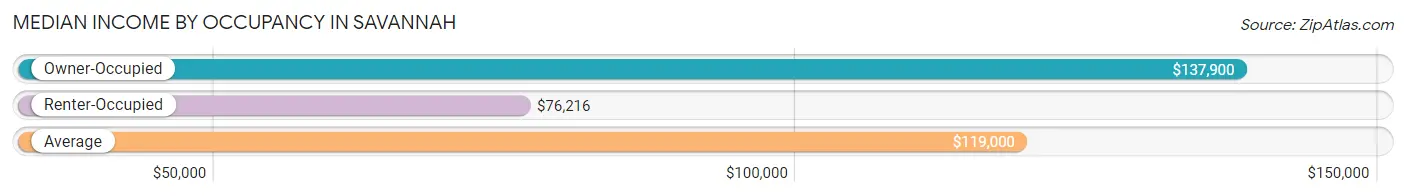
| Occupancy Type | # Households | Median Income |
| Owner-Occupied | 1,652 (74.8%) | $137,900 |
| Renter-Occupied | 556 (25.2%) | $76,216 |
| Average | 2,208 (100.0%) | $119,000 |
Occupancy by Householder Income Bracket in Savannah
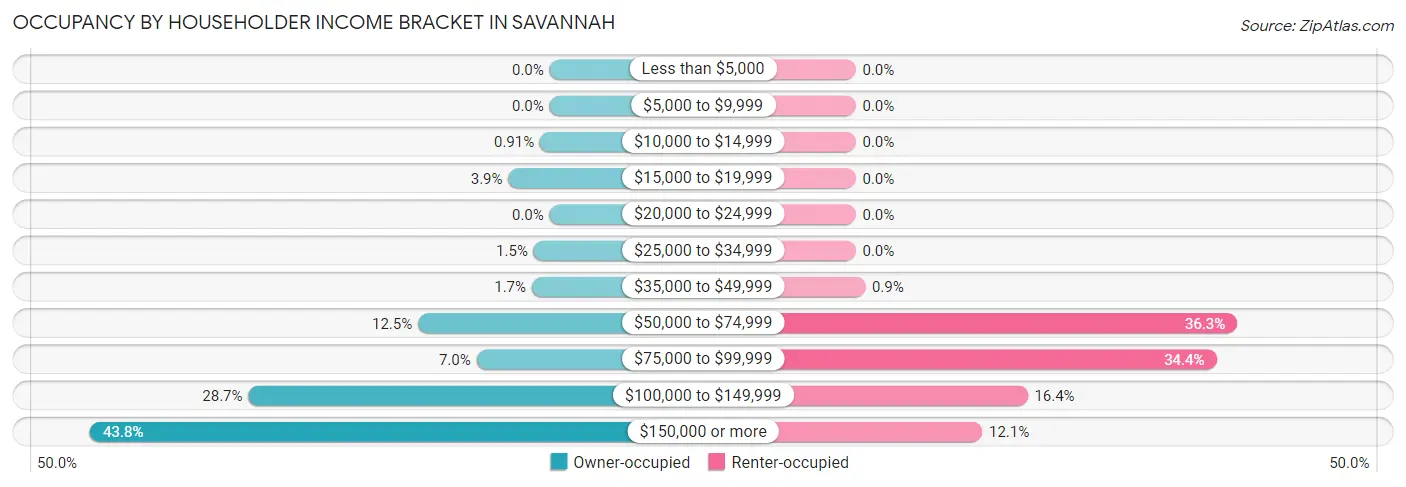
| Income Bracket | Owner-occupied | Renter-occupied |
| Less than $5,000 | 0 (0.0%) | 0 (0.0%) |
| $5,000 to $9,999 | 0 (0.0%) | 0 (0.0%) |
| $10,000 to $14,999 | 15 (0.9%) | 0 (0.0%) |
| $15,000 to $19,999 | 65 (3.9%) | 0 (0.0%) |
| $20,000 to $24,999 | 0 (0.0%) | 0 (0.0%) |
| $25,000 to $34,999 | 25 (1.5%) | 0 (0.0%) |
| $35,000 to $49,999 | 28 (1.7%) | 5 (0.9%) |
| $50,000 to $74,999 | 207 (12.5%) | 202 (36.3%) |
| $75,000 to $99,999 | 115 (7.0%) | 191 (34.4%) |
| $100,000 to $149,999 | 474 (28.7%) | 91 (16.4%) |
| $150,000 or more | 723 (43.8%) | 67 (12.0%) |
| Total | 1,652 (100.0%) | 556 (100.0%) |
Monthly Housing Cost Tiers in Savannah
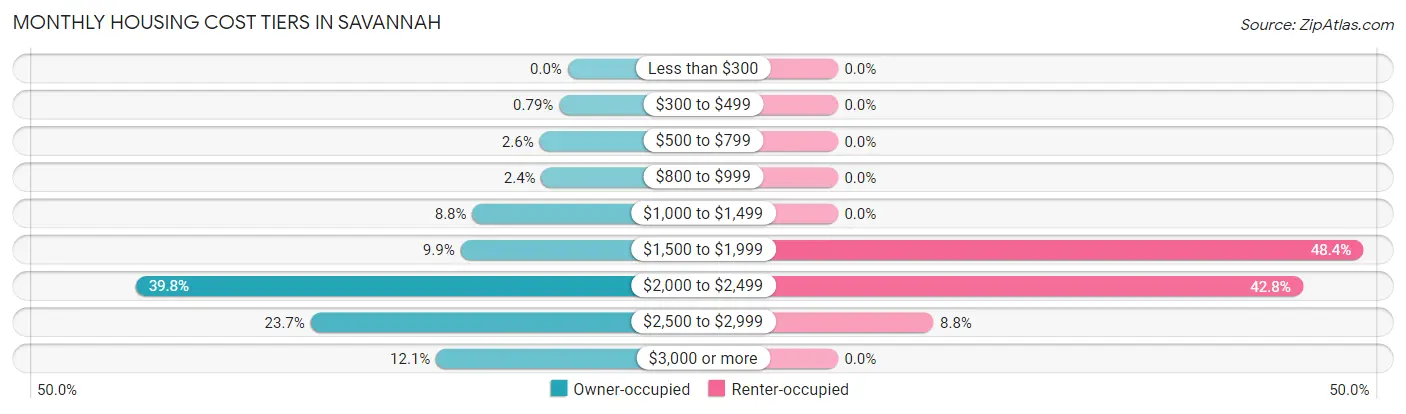
| Monthly Cost | Owner-occupied | Renter-occupied |
| Less than $300 | 0 (0.0%) | 0 (0.0%) |
| $300 to $499 | 13 (0.8%) | 0 (0.0%) |
| $500 to $799 | 43 (2.6%) | 0 (0.0%) |
| $800 to $999 | 40 (2.4%) | 0 (0.0%) |
| $1,000 to $1,499 | 145 (8.8%) | 0 (0.0%) |
| $1,500 to $1,999 | 163 (9.9%) | 269 (48.4%) |
| $2,000 to $2,499 | 657 (39.8%) | 238 (42.8%) |
| $2,500 to $2,999 | 391 (23.7%) | 49 (8.8%) |
| $3,000 or more | 200 (12.1%) | 0 (0.0%) |
| Total | 1,652 (100.0%) | 556 (100.0%) |
Physical Housing Characteristics in Savannah
Housing Structures in Savannah
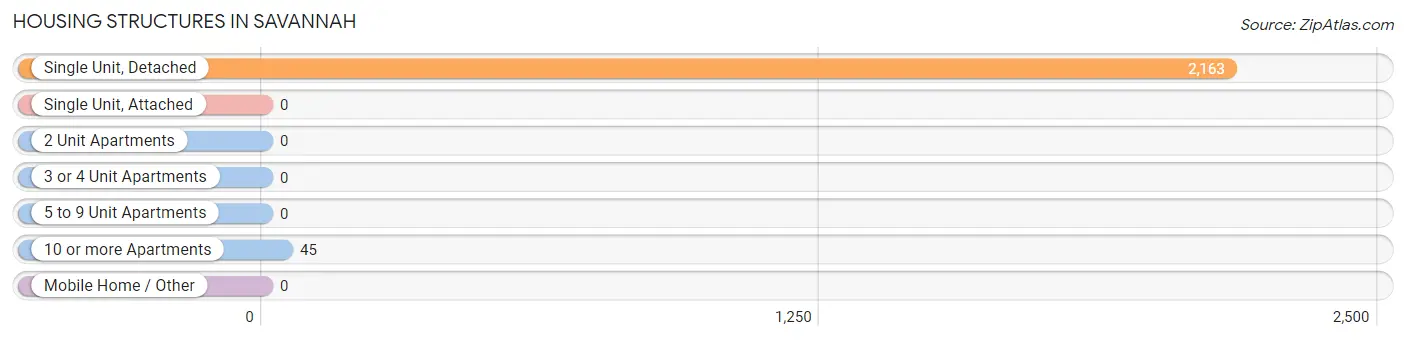
| Structure Type | # Housing Units | % Housing Units |
| Single Unit, Detached | 2,163 | 98.0% |
| Single Unit, Attached | 0 | 0.0% |
| 2 Unit Apartments | 0 | 0.0% |
| 3 or 4 Unit Apartments | 0 | 0.0% |
| 5 to 9 Unit Apartments | 0 | 0.0% |
| 10 or more Apartments | 45 | 2.0% |
| Mobile Home / Other | 0 | 0.0% |
| Total | 2,208 | 100.0% |
Housing Structures by Occupancy in Savannah
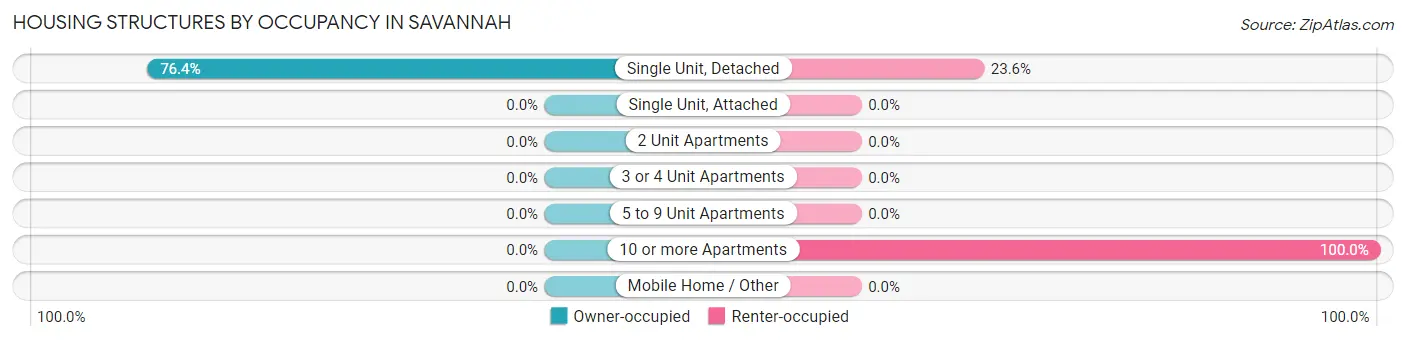
| Structure Type | Owner-occupied | Renter-occupied |
| Single Unit, Detached | 1,652 (76.4%) | 511 (23.6%) |
| Single Unit, Attached | 0 (0.0%) | 0 (0.0%) |
| 2 Unit Apartments | 0 (0.0%) | 0 (0.0%) |
| 3 or 4 Unit Apartments | 0 (0.0%) | 0 (0.0%) |
| 5 to 9 Unit Apartments | 0 (0.0%) | 0 (0.0%) |
| 10 or more Apartments | 0 (0.0%) | 45 (100.0%) |
| Mobile Home / Other | 0 (0.0%) | 0 (0.0%) |
| Total | 1,652 (74.8%) | 556 (25.2%) |
Housing Structures by Number of Rooms in Savannah
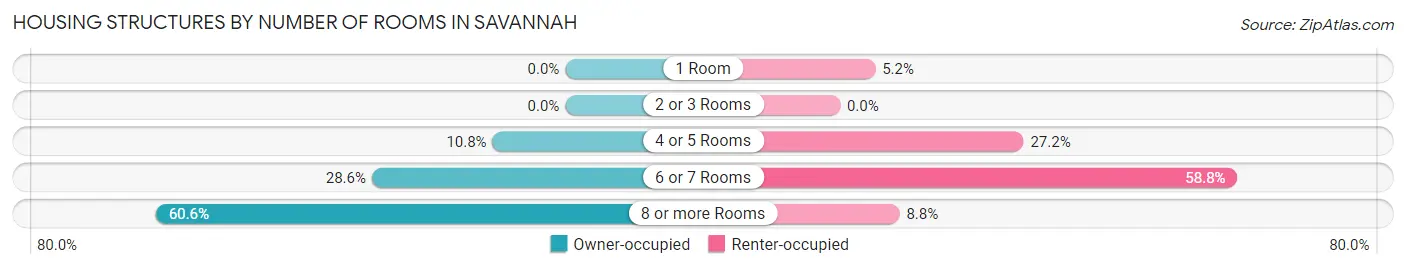
| Number of Rooms | Owner-occupied | Renter-occupied |
| 1 Room | 0 (0.0%) | 29 (5.2%) |
| 2 or 3 Rooms | 0 (0.0%) | 0 (0.0%) |
| 4 or 5 Rooms | 178 (10.8%) | 151 (27.2%) |
| 6 or 7 Rooms | 473 (28.6%) | 327 (58.8%) |
| 8 or more Rooms | 1,001 (60.6%) | 49 (8.8%) |
| Total | 1,652 (100.0%) | 556 (100.0%) |
Housing Structure by Heating Type in Savannah
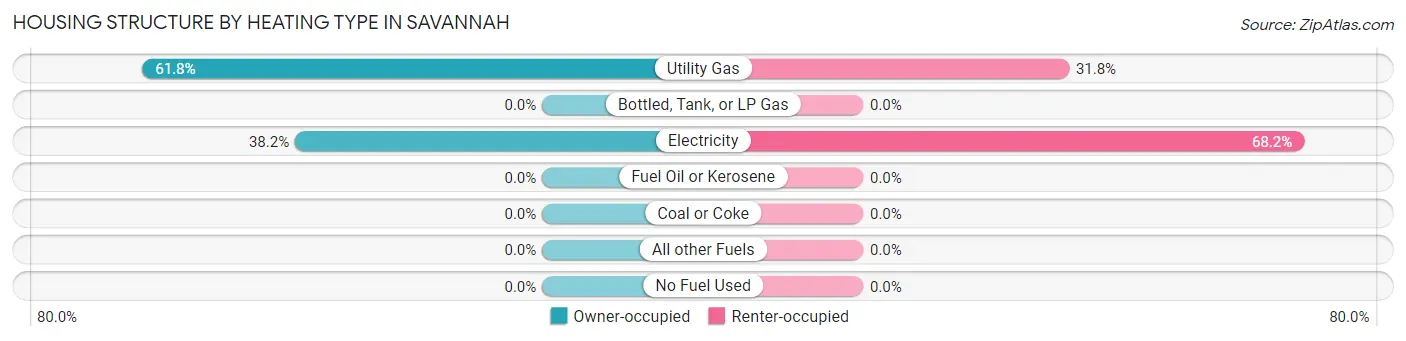
| Heating Type | Owner-occupied | Renter-occupied |
| Utility Gas | 1,021 (61.8%) | 177 (31.8%) |
| Bottled, Tank, or LP Gas | 0 (0.0%) | 0 (0.0%) |
| Electricity | 631 (38.2%) | 379 (68.2%) |
| Fuel Oil or Kerosene | 0 (0.0%) | 0 (0.0%) |
| Coal or Coke | 0 (0.0%) | 0 (0.0%) |
| All other Fuels | 0 (0.0%) | 0 (0.0%) |
| No Fuel Used | 0 (0.0%) | 0 (0.0%) |
| Total | 1,652 (100.0%) | 556 (100.0%) |
Household Vehicle Usage in Savannah
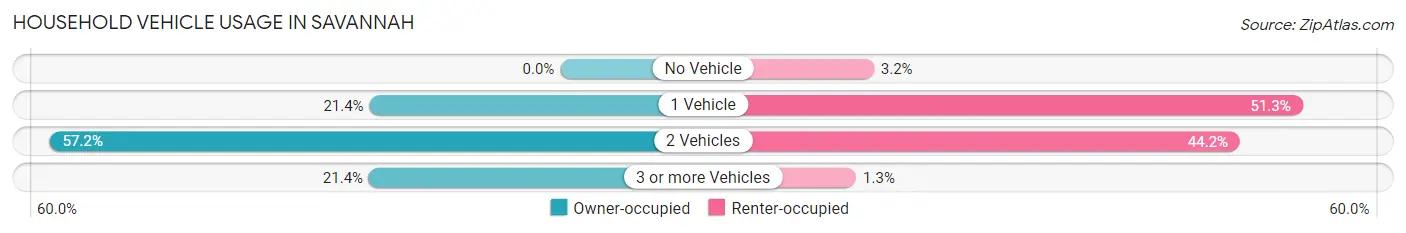
| Vehicles per Household | Owner-occupied | Renter-occupied |
| No Vehicle | 0 (0.0%) | 18 (3.2%) |
| 1 Vehicle | 353 (21.4%) | 285 (51.3%) |
| 2 Vehicles | 945 (57.2%) | 246 (44.2%) |
| 3 or more Vehicles | 354 (21.4%) | 7 (1.3%) |
| Total | 1,652 (100.0%) | 556 (100.0%) |
Real Estate & Mortgages in Savannah
Real Estate and Mortgage Overview in Savannah
| Characteristic | Without Mortgage | With Mortgage |
| Housing Units | 169 | 1,483 |
| Median Property Value | $396,600 | $334,100 |
| Median Household Income | $139,760 | $684 |
| Monthly Housing Costs | $871 | $200 |
| Real Estate Taxes | $8,179 | $15 |
Property Value by Mortgage Status in Savannah
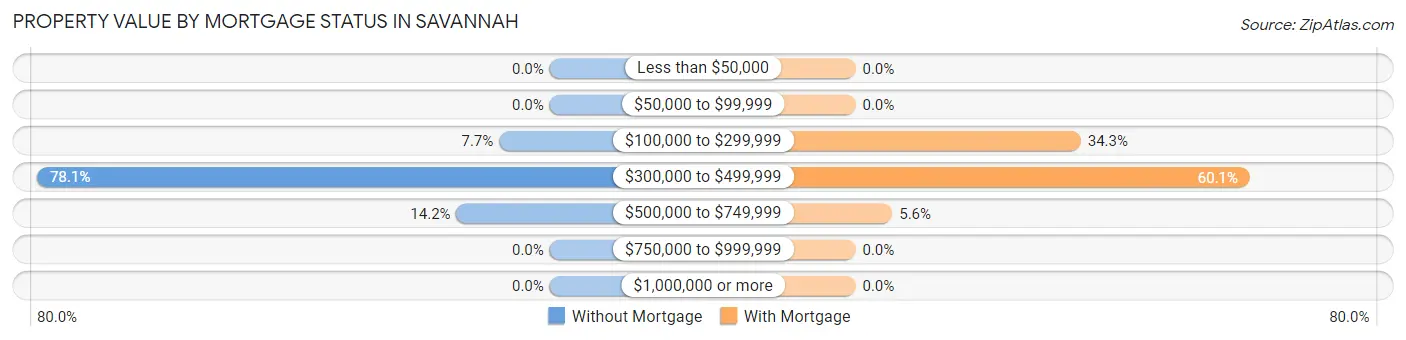
| Property Value | Without Mortgage | With Mortgage |
| Less than $50,000 | 0 (0.0%) | 0 (0.0%) |
| $50,000 to $99,999 | 0 (0.0%) | 0 (0.0%) |
| $100,000 to $299,999 | 13 (7.7%) | 509 (34.3%) |
| $300,000 to $499,999 | 132 (78.1%) | 891 (60.1%) |
| $500,000 to $749,999 | 24 (14.2%) | 83 (5.6%) |
| $750,000 to $999,999 | 0 (0.0%) | 0 (0.0%) |
| $1,000,000 or more | 0 (0.0%) | 0 (0.0%) |
| Total | 169 (100.0%) | 1,483 (100.0%) |
Household Income by Mortgage Status in Savannah
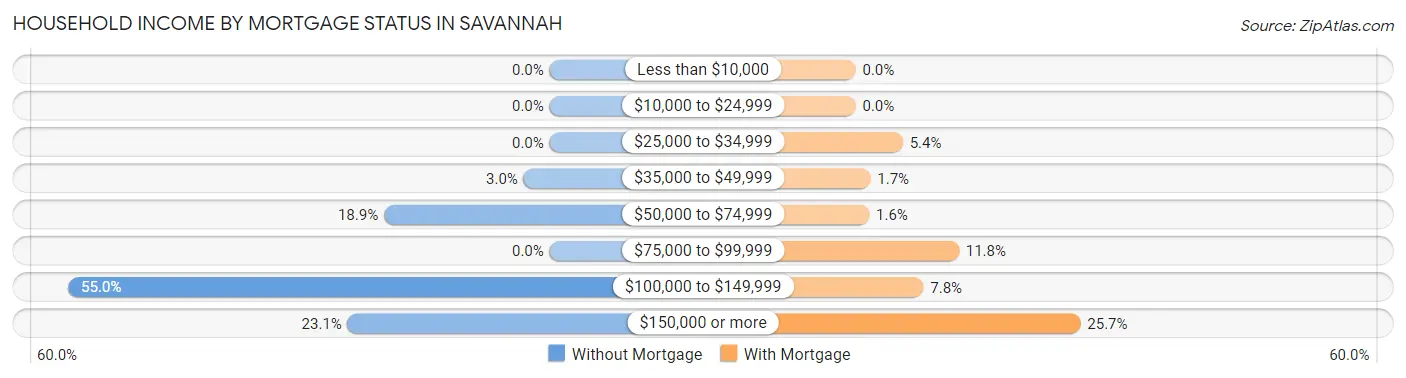
| Household Income | Without Mortgage | With Mortgage |
| Less than $10,000 | 0 (0.0%) | 0 (0.0%) |
| $10,000 to $24,999 | 0 (0.0%) | 0 (0.0%) |
| $25,000 to $34,999 | 0 (0.0%) | 80 (5.4%) |
| $35,000 to $49,999 | 5 (3.0%) | 25 (1.7%) |
| $50,000 to $74,999 | 32 (18.9%) | 23 (1.5%) |
| $75,000 to $99,999 | 0 (0.0%) | 175 (11.8%) |
| $100,000 to $149,999 | 93 (55.0%) | 115 (7.7%) |
| $150,000 or more | 39 (23.1%) | 381 (25.7%) |
| Total | 169 (100.0%) | 1,483 (100.0%) |
Property Value to Household Income Ratio in Savannah
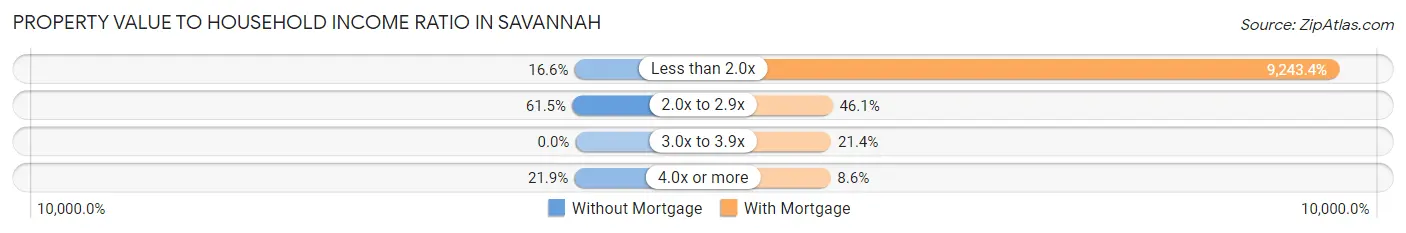
| Value-to-Income Ratio | Without Mortgage | With Mortgage |
| Less than 2.0x | 28 (16.6%) | 137,079 (9,243.4%) |
| 2.0x to 2.9x | 104 (61.5%) | 684 (46.1%) |
| 3.0x to 3.9x | 0 (0.0%) | 318 (21.4%) |
| 4.0x or more | 37 (21.9%) | 128 (8.6%) |
| Total | 169 (100.0%) | 1,483 (100.0%) |
Real Estate Taxes by Mortgage Status in Savannah
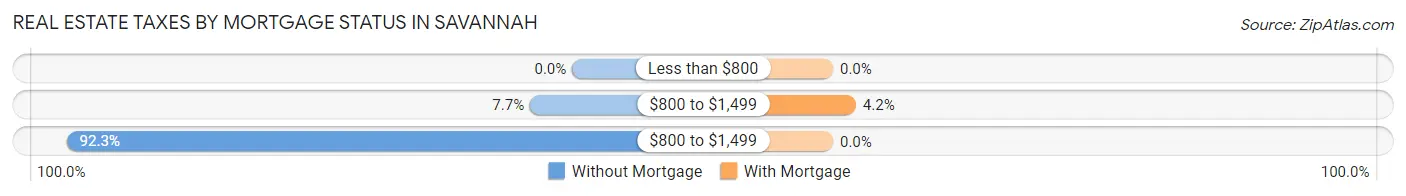
| Property Taxes | Without Mortgage | With Mortgage |
| Less than $800 | 0 (0.0%) | 0 (0.0%) |
| $800 to $1,499 | 13 (7.7%) | 62 (4.2%) |
| $800 to $1,499 | 156 (92.3%) | 0 (0.0%) |
| Total | 169 (100.0%) | 1,483 (100.0%) |
Health & Disability in Savannah
Health Insurance Coverage by Age in Savannah
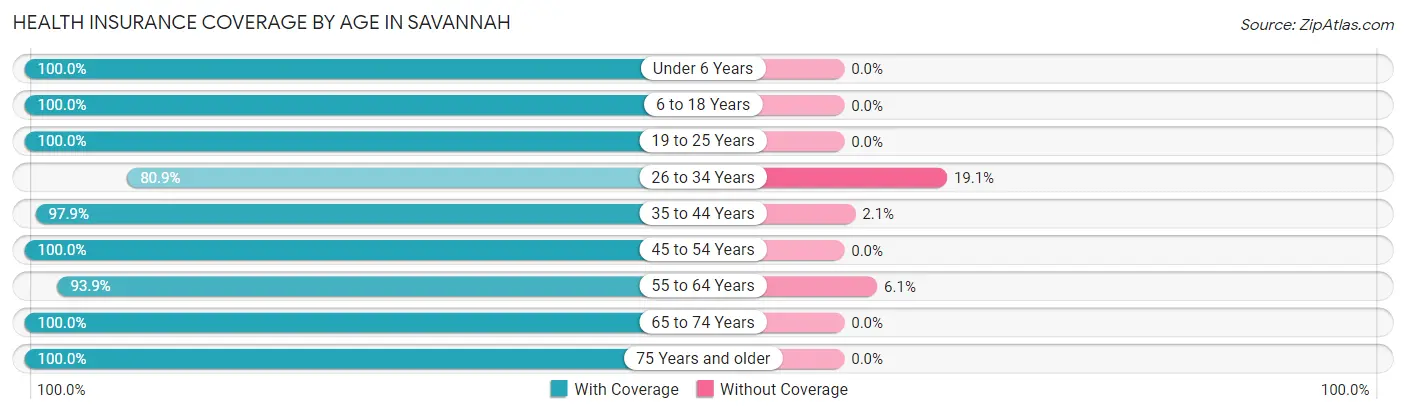
| Age Bracket | With Coverage | Without Coverage |
| Under 6 Years | 607 (100.0%) | 0 (0.0%) |
| 6 to 18 Years | 1,498 (100.0%) | 0 (0.0%) |
| 19 to 25 Years | 367 (100.0%) | 0 (0.0%) |
| 26 to 34 Years | 621 (80.9%) | 147 (19.1%) |
| 35 to 44 Years | 1,281 (97.9%) | 27 (2.1%) |
| 45 to 54 Years | 850 (100.0%) | 0 (0.0%) |
| 55 to 64 Years | 536 (93.9%) | 35 (6.1%) |
| 65 to 74 Years | 498 (100.0%) | 0 (0.0%) |
| 75 Years and older | 172 (100.0%) | 0 (0.0%) |
| Total | 6,430 (96.9%) | 209 (3.2%) |
Health Insurance Coverage by Citizenship Status in Savannah
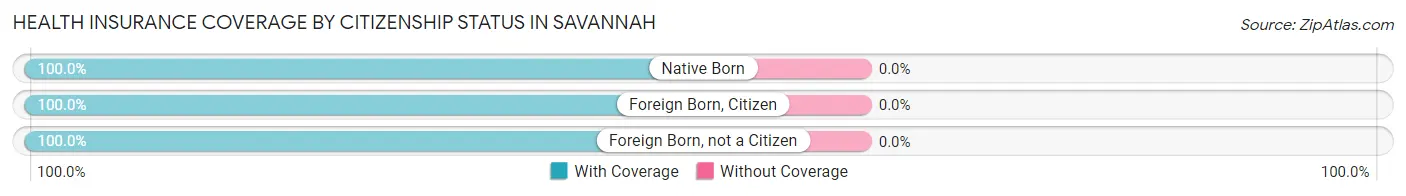
| Citizenship Status | With Coverage | Without Coverage |
| Native Born | 607 (100.0%) | 0 (0.0%) |
| Foreign Born, Citizen | 1,498 (100.0%) | 0 (0.0%) |
| Foreign Born, not a Citizen | 367 (100.0%) | 0 (0.0%) |
Health Insurance Coverage by Household Income in Savannah
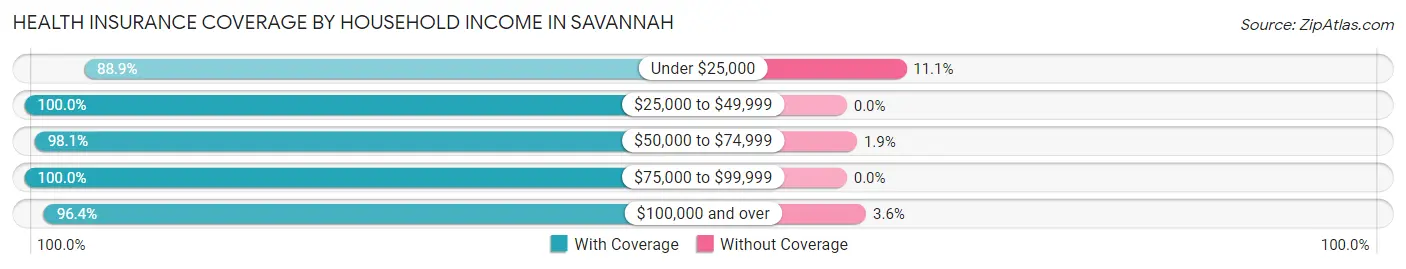
| Household Income | With Coverage | Without Coverage |
| Under $25,000 | 303 (88.9%) | 38 (11.1%) |
| $25,000 to $49,999 | 86 (100.0%) | 0 (0.0%) |
| $50,000 to $74,999 | 874 (98.1%) | 17 (1.9%) |
| $75,000 to $99,999 | 1,055 (100.0%) | 0 (0.0%) |
| $100,000 and over | 4,112 (96.4%) | 154 (3.6%) |
Public vs Private Health Insurance Coverage by Age in Savannah
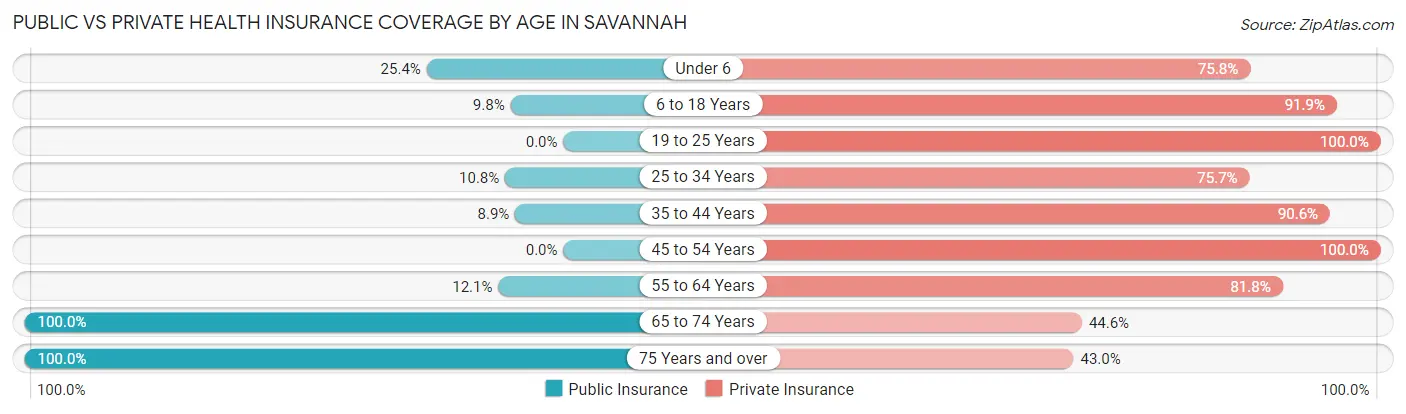
| Age Bracket | Public Insurance | Private Insurance |
| Under 6 | 154 (25.4%) | 460 (75.8%) |
| 6 to 18 Years | 147 (9.8%) | 1,376 (91.9%) |
| 19 to 25 Years | 0 (0.0%) | 367 (100.0%) |
| 25 to 34 Years | 83 (10.8%) | 581 (75.6%) |
| 35 to 44 Years | 117 (8.9%) | 1,185 (90.6%) |
| 45 to 54 Years | 0 (0.0%) | 850 (100.0%) |
| 55 to 64 Years | 69 (12.1%) | 467 (81.8%) |
| 65 to 74 Years | 498 (100.0%) | 222 (44.6%) |
| 75 Years and over | 172 (100.0%) | 74 (43.0%) |
| Total | 1,240 (18.7%) | 5,582 (84.1%) |
Disability Status by Sex by Age in Savannah
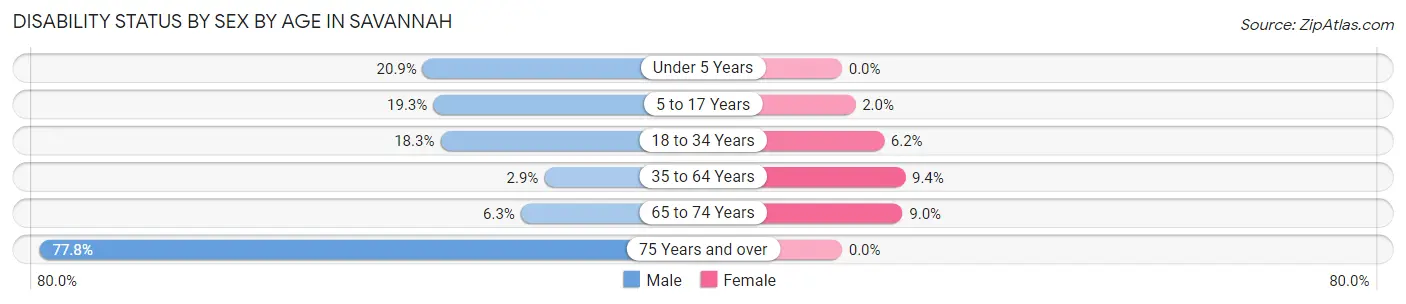
| Age Bracket | Male | Female |
| Under 5 Years | 42 (20.9%) | 0 (0.0%) |
| 5 to 17 Years | 163 (19.3%) | 17 (2.0%) |
| 18 to 34 Years | 102 (18.3%) | 36 (6.2%) |
| 35 to 64 Years | 35 (2.9%) | 141 (9.4%) |
| 65 to 74 Years | 9 (6.3%) | 32 (9.0%) |
| 75 Years and over | 77 (77.8%) | 0 (0.0%) |
Disability Class by Sex by Age in Savannah
Disability Class: Hearing Difficulty
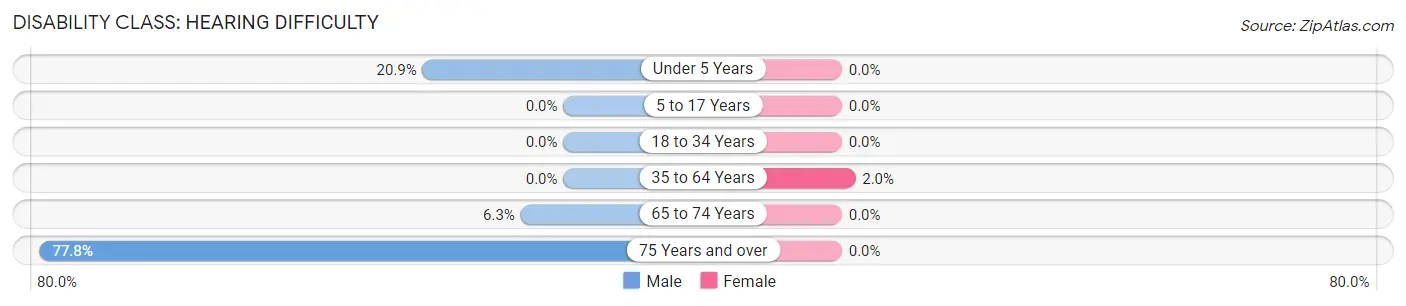
| Age Bracket | Male | Female |
| Under 5 Years | 42 (20.9%) | 0 (0.0%) |
| 5 to 17 Years | 0 (0.0%) | 0 (0.0%) |
| 18 to 34 Years | 0 (0.0%) | 0 (0.0%) |
| 35 to 64 Years | 0 (0.0%) | 30 (2.0%) |
| 65 to 74 Years | 9 (6.3%) | 0 (0.0%) |
| 75 Years and over | 77 (77.8%) | 0 (0.0%) |
Disability Class: Vision Difficulty
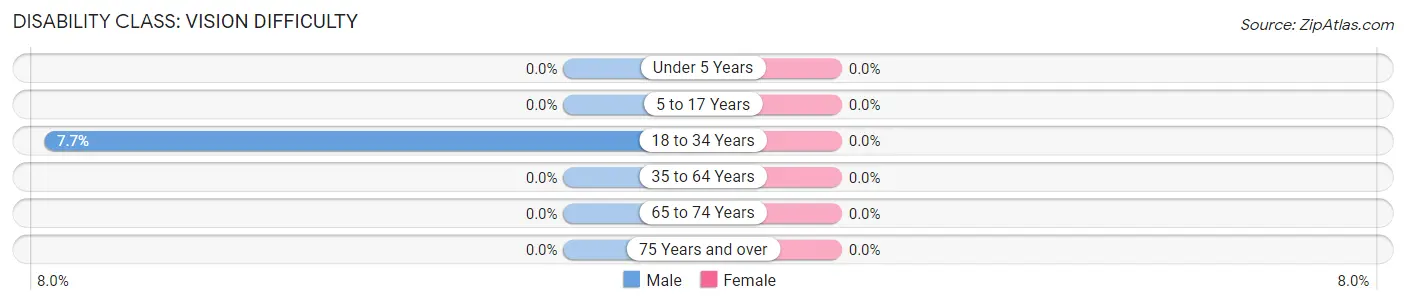
| Age Bracket | Male | Female |
| Under 5 Years | 0 (0.0%) | 0 (0.0%) |
| 5 to 17 Years | 0 (0.0%) | 0 (0.0%) |
| 18 to 34 Years | 43 (7.7%) | 0 (0.0%) |
| 35 to 64 Years | 0 (0.0%) | 0 (0.0%) |
| 65 to 74 Years | 0 (0.0%) | 0 (0.0%) |
| 75 Years and over | 0 (0.0%) | 0 (0.0%) |
Disability Class: Cognitive Difficulty
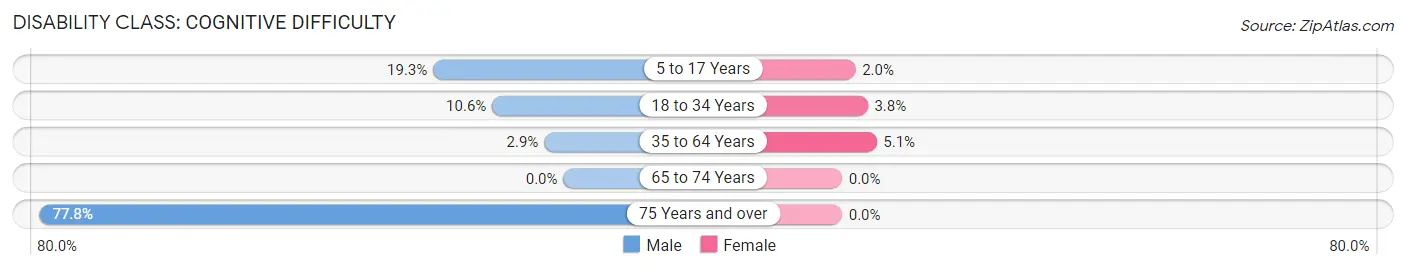
| Age Bracket | Male | Female |
| 5 to 17 Years | 163 (19.3%) | 17 (2.0%) |
| 18 to 34 Years | 59 (10.6%) | 22 (3.8%) |
| 35 to 64 Years | 35 (2.9%) | 77 (5.1%) |
| 65 to 74 Years | 0 (0.0%) | 0 (0.0%) |
| 75 Years and over | 77 (77.8%) | 0 (0.0%) |
Disability Class: Ambulatory Difficulty
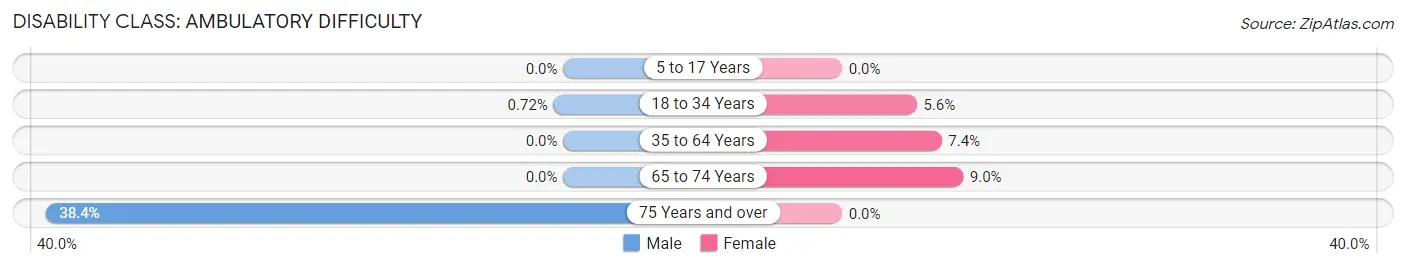
| Age Bracket | Male | Female |
| 5 to 17 Years | 0 (0.0%) | 0 (0.0%) |
| 18 to 34 Years | 4 (0.7%) | 32 (5.6%) |
| 35 to 64 Years | 0 (0.0%) | 111 (7.4%) |
| 65 to 74 Years | 0 (0.0%) | 32 (9.0%) |
| 75 Years and over | 38 (38.4%) | 0 (0.0%) |
Disability Class: Self-Care Difficulty
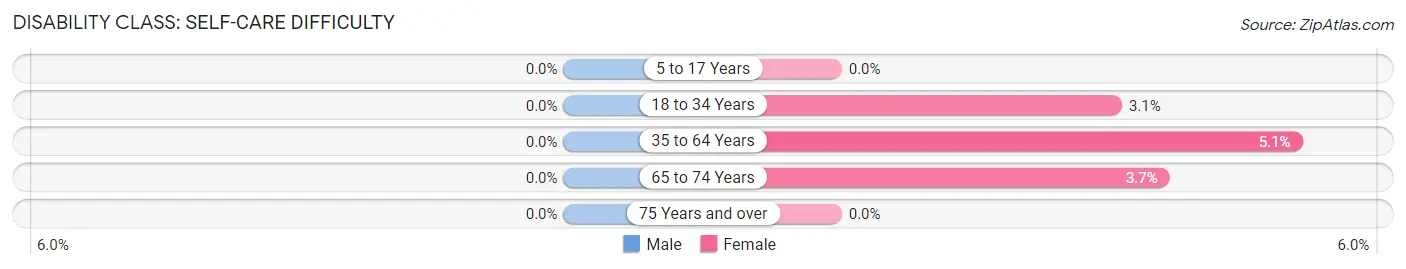
| Age Bracket | Male | Female |
| 5 to 17 Years | 0 (0.0%) | 0 (0.0%) |
| 18 to 34 Years | 0 (0.0%) | 18 (3.1%) |
| 35 to 64 Years | 0 (0.0%) | 77 (5.1%) |
| 65 to 74 Years | 0 (0.0%) | 13 (3.6%) |
| 75 Years and over | 0 (0.0%) | 0 (0.0%) |
Technology Access in Savannah
Computing Device Access in Savannah
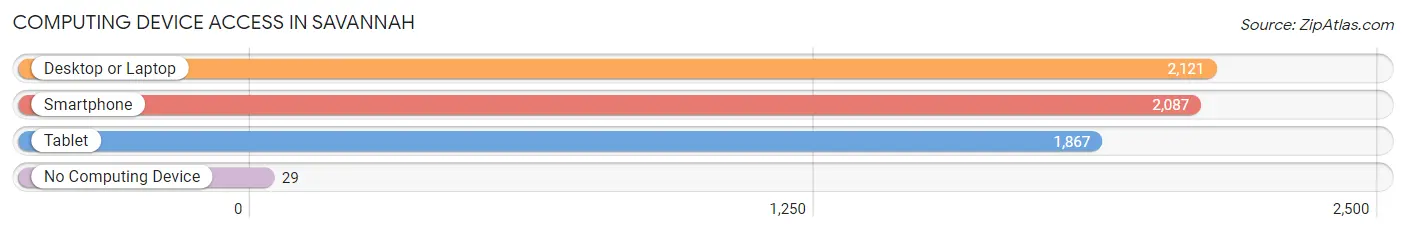
| Device Type | # Households | % Households |
| Desktop or Laptop | 2,121 | 96.1% |
| Smartphone | 2,087 | 94.5% |
| Tablet | 1,867 | 84.6% |
| No Computing Device | 29 | 1.3% |
| Total | 2,208 | 100.0% |
Internet Access in Savannah
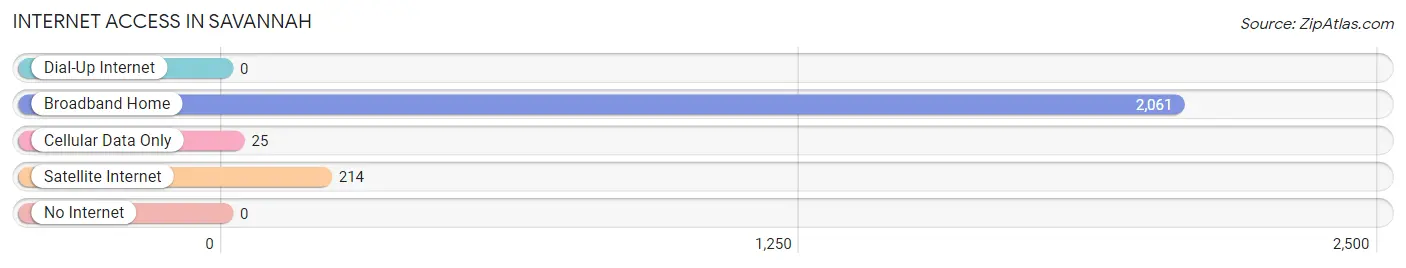
| Internet Type | # Households | % Households |
| Dial-Up Internet | 0 | 0.0% |
| Broadband Home | 2,061 | 93.3% |
| Cellular Data Only | 25 | 1.1% |
| Satellite Internet | 214 | 9.7% |
| No Internet | 0 | 0.0% |
| Total | 2,208 | 100.0% |
Savannah Summary
Savannah, Texas is a small town located in Hardin County, Texas. It is situated on the banks of the Neches River, about 25 miles east of Beaumont. The town was founded in 1837 and is named after the Savannah River in Georgia. Savannah is a rural community with a population of 1,717 as of the 2010 census.
Geography
Savannah is located at 30°45'25"N 94°17'45"W (30.756944, -94.295833). It is situated on the banks of the Neches River, about 25 miles east of Beaumont. The town is located in Hardin County, Texas, and is part of the Beaumont–Port Arthur Metropolitan Statistical Area. The town has a total area of 1.3 square miles, all of which is land.
History
Savannah was founded in 1837 by settlers from Georgia and named after the Savannah River in Georgia. The town was originally a trading post and was later incorporated in 1845. In the late 19th century, Savannah was a thriving river port and was home to several sawmills and lumber companies. The town was also home to a cotton gin and a grist mill.
In the early 20th century, Savannah was a popular tourist destination, with several hotels and resorts located in the area. The town was also home to a number of churches, schools, and businesses.
Economy
The economy of Savannah is largely based on agriculture and timber. The town is home to several farms and ranches, as well as several timber companies. The town is also home to several small businesses, including restaurants, retail stores, and service providers.
Demographics
As of the 2010 census, there were 1,717 people, 690 households, and 463 families residing in the town. The population density was 1,312.7 people per square mile. The racial makeup of the town was 79.2% White, 17.2% African American, 0.5% Native American, 0.2% Asian, 0.1% Pacific Islander, 1.2% from other races, and 1.7% from two or more races. Hispanic or Latino of any race were 4.2% of the population.
The median income for a household in the town was $31,250, and the median income for a family was $37,500. Males had a median income of $30,000 versus $20,000 for females. The per capita income for the town was $15,845. About 16.2% of families and 19.2% of the population were below the poverty line, including 25.2% of those under age 18 and 15.2% of those age 65 or over.
Conclusion
Savannah, Texas is a small rural town located in Hardin County, Texas. It is situated on the banks of the Neches River, about 25 miles east of Beaumont. The town was founded in 1837 and is named after the Savannah River in Georgia. The economy of Savannah is largely based on agriculture and timber, and the town is home to several farms and ranches, as well as several timber companies. As of the 2010 census, the population of Savannah was 1,717. The town is home to several small businesses, including restaurants, retail stores, and service providers.
Common Questions
What is Per Capita Income in Savannah?
Per Capita income in Savannah is $47,968.
What is the Median Family Income in Savannah?
Median Family Income in Savannah is $117,389.
What is the Median Household income in Savannah?
Median Household Income in Savannah is $119,000.
What is Income or Wage Gap in Savannah?
Income or Wage Gap in Savannah is 48.1%.
Women in Savannah earn 51.9 cents for every dollar earned by a man.
What is Inequality or Gini Index in Savannah?
Inequality or Gini Index in Savannah is 0.35.
What is the Total Population of Savannah?
Total Population of Savannah is 6,718.
What is the Total Male Population of Savannah?
Total Male Population of Savannah is 3,149.
What is the Total Female Population of Savannah?
Total Female Population of Savannah is 3,569.
What is the Ratio of Males per 100 Females in Savannah?
There are 88.23 Males per 100 Females in Savannah.
What is the Ratio of Females per 100 Males in Savannah?
There are 113.34 Females per 100 Males in Savannah.
What is the Median Population Age in Savannah?
Median Population Age in Savannah is 35.7 Years.
What is the Average Family Size in Savannah
Average Family Size in Savannah is 3.3 People.
What is the Average Household Size in Savannah
Average Household Size in Savannah is 3.0 People.
How Large is the Labor Force in Savannah?
There are 3,646 People in the Labor Forcein in Savannah.
What is the Percentage of People in the Labor Force in Savannah?
77.0% of People are in the Labor Force in Savannah.
What is the Unemployment Rate in Savannah?
Unemployment Rate in Savannah is 6.3%.