Silver City, NM Map & Demographics
Silver City Map
Silver City Overview
$24,101
PER CAPITA INCOME
$60,373
AVG FAMILY INCOME
$36,853
AVG HOUSEHOLD INCOME
25.8%
WAGE / INCOME GAP [ % ]
74.2¢/ $1
WAGE / INCOME GAP [ $ ]
0.45
INEQUALITY / GINI INDEX
9,650
TOTAL POPULATION
4,707
MALE POPULATION
4,943
FEMALE POPULATION
95.23
MALES / 100 FEMALES
105.01
FEMALES / 100 MALES
36.7
MEDIAN AGE
3.9
AVG FAMILY SIZE
2.5
AVG HOUSEHOLD SIZE
4,109
LABOR FORCE [ PEOPLE ]
55.3%
PERCENT IN LABOR FORCE
9.9%
UNEMPLOYMENT RATE
Silver City Zip Codes
Income in Silver City
Income Overview in Silver City
Per Capita Income in Silver City is $24,101, while median incomes of families and households are $60,373 and $36,853 respectively.
| Characteristic | Number | Measure |
| Per Capita Income | 9,650 | $24,101 |
| Median Family Income | 1,641 | $60,373 |
| Mean Family Income | 1,641 | $74,280 |
| Median Household Income | 3,724 | $36,853 |
| Mean Household Income | 3,724 | $54,737 |
| Income Deficit | 1,641 | $0 |
| Wage / Income Gap (%) | 9,650 | 25.83% |
| Wage / Income Gap ($) | 9,650 | 74.17¢ per $1 |
| Gini / Inequality Index | 9,650 | 0.45 |
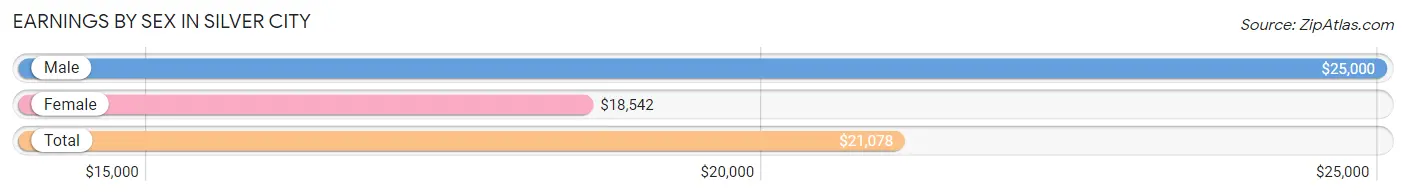
Earnings by Sex in Silver City
Average Earnings in Silver City are $21,078, $25,000 for men and $18,542 for women, a difference of 25.8%.
| Sex | Number | Average Earnings |
| Male | 2,034 (46.2%) | $25,000 |
| Female | 2,370 (53.8%) | $18,542 |
| Total | 4,404 (100.0%) | $21,078 |
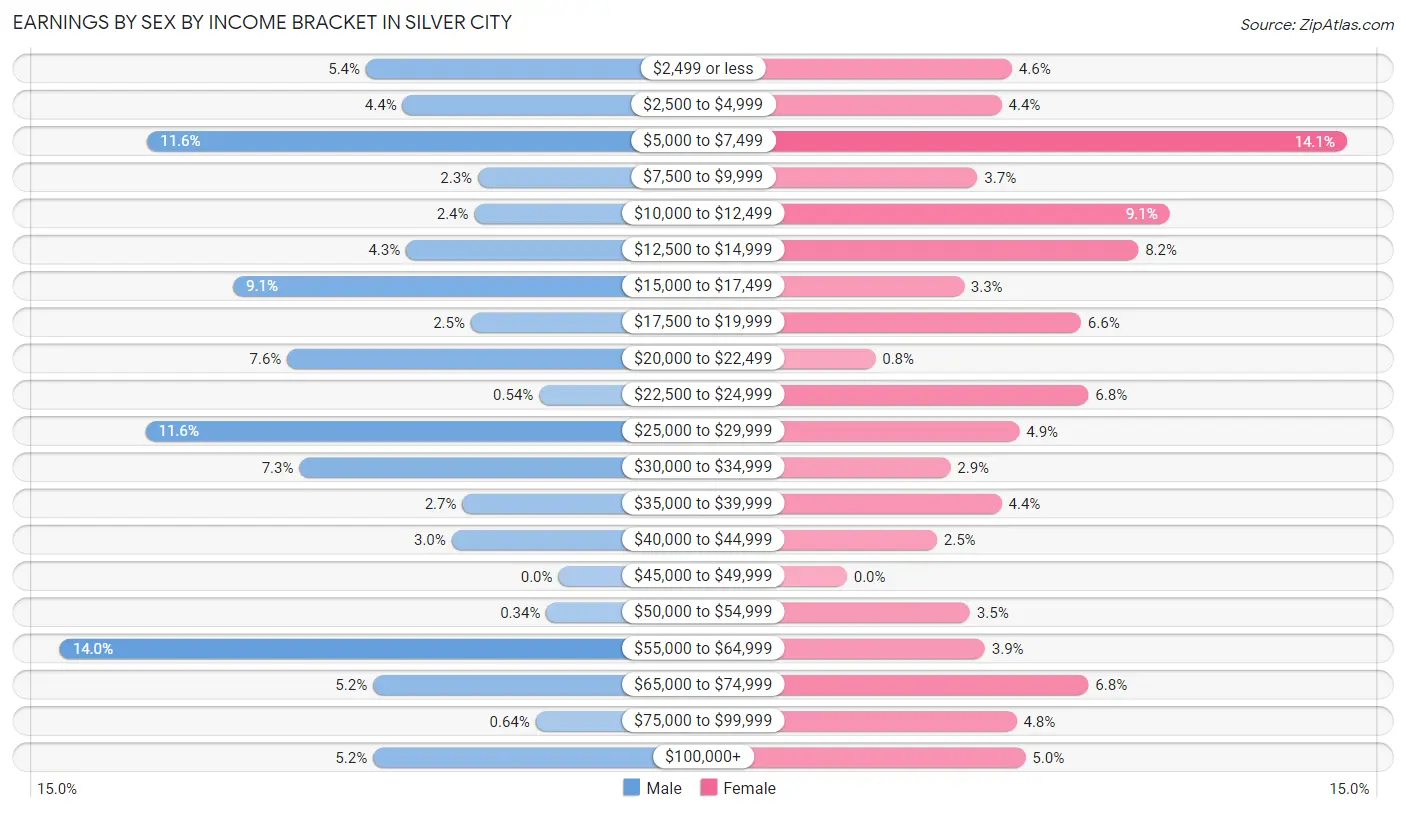
Earnings by Sex by Income Bracket in Silver City
The most common earnings brackets in Silver City are $55,000 to $64,999 for men (285 | 14.0%) and $5,000 to $7,499 for women (333 | 14.1%).
| Income | Male | Female |
| $2,499 or less | 110 (5.4%) | 110 (4.6%) |
| $2,500 to $4,999 | 89 (4.4%) | 103 (4.3%) |
| $5,000 to $7,499 | 235 (11.6%) | 333 (14.1%) |
| $7,500 to $9,999 | 46 (2.3%) | 87 (3.7%) |
| $10,000 to $12,499 | 48 (2.4%) | 215 (9.1%) |
| $12,500 to $14,999 | 87 (4.3%) | 194 (8.2%) |
| $15,000 to $17,499 | 186 (9.1%) | 78 (3.3%) |
| $17,500 to $19,999 | 50 (2.5%) | 156 (6.6%) |
| $20,000 to $22,499 | 155 (7.6%) | 19 (0.8%) |
| $22,500 to $24,999 | 11 (0.5%) | 161 (6.8%) |
| $25,000 to $29,999 | 236 (11.6%) | 115 (4.9%) |
| $30,000 to $34,999 | 148 (7.3%) | 69 (2.9%) |
| $35,000 to $39,999 | 55 (2.7%) | 103 (4.3%) |
| $40,000 to $44,999 | 61 (3.0%) | 60 (2.5%) |
| $45,000 to $49,999 | 0 (0.0%) | 0 (0.0%) |
| $50,000 to $54,999 | 7 (0.3%) | 82 (3.5%) |
| $55,000 to $64,999 | 285 (14.0%) | 92 (3.9%) |
| $65,000 to $74,999 | 106 (5.2%) | 161 (6.8%) |
| $75,000 to $99,999 | 13 (0.6%) | 113 (4.8%) |
| $100,000+ | 106 (5.2%) | 119 (5.0%) |
| Total | 2,034 (100.0%) | 2,370 (100.0%) |
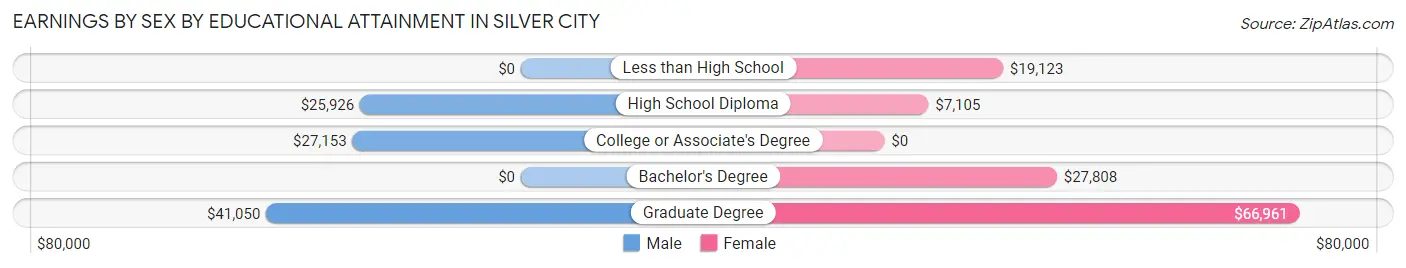
Earnings by Sex by Educational Attainment in Silver City
Average earnings in Silver City are $27,066 for men and $19,690 for women, a difference of 27.3%. Men with an educational attainment of graduate degree enjoy the highest average annual earnings of $41,050, while those with high school diploma education earn the least with $25,926. Women with an educational attainment of graduate degree earn the most with the average annual earnings of $66,961, while those with high school diploma education have the smallest earnings of $7,105.
| Educational Attainment | Male Income | Female Income |
| Less than High School | - | - |
| High School Diploma | $25,926 | $7,105 |
| College or Associate's Degree | $27,153 | $0 |
| Bachelor's Degree | - | - |
| Graduate Degree | $41,050 | $66,961 |
| Total | $27,066 | $19,690 |
Family Income in Silver City
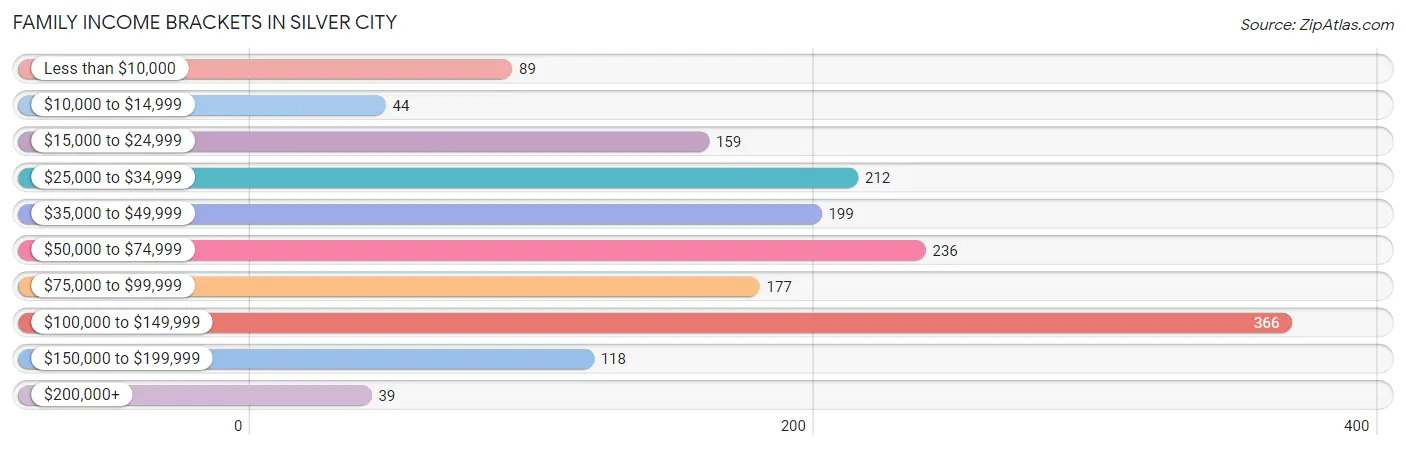
Family Income Brackets in Silver City
According to the Silver City family income data, there are 366 families falling into the $100,000 to $149,999 income range, which is the most common income bracket and makes up 22.3% of all families. Conversely, the $200,000+ income bracket is the least frequent group with only 39 families (2.4%) belonging to this category.
| Income Bracket | # Families | % Families |
| Less than $10,000 | 89 | 5.4% |
| $10,000 to $14,999 | 44 | 2.7% |
| $15,000 to $24,999 | 159 | 9.7% |
| $25,000 to $34,999 | 212 | 12.9% |
| $35,000 to $49,999 | 199 | 12.1% |
| $50,000 to $74,999 | 236 | 14.4% |
| $75,000 to $99,999 | 177 | 10.8% |
| $100,000 to $149,999 | 366 | 22.3% |
| $150,000 to $199,999 | 118 | 7.2% |
| $200,000+ | 39 | 2.4% |
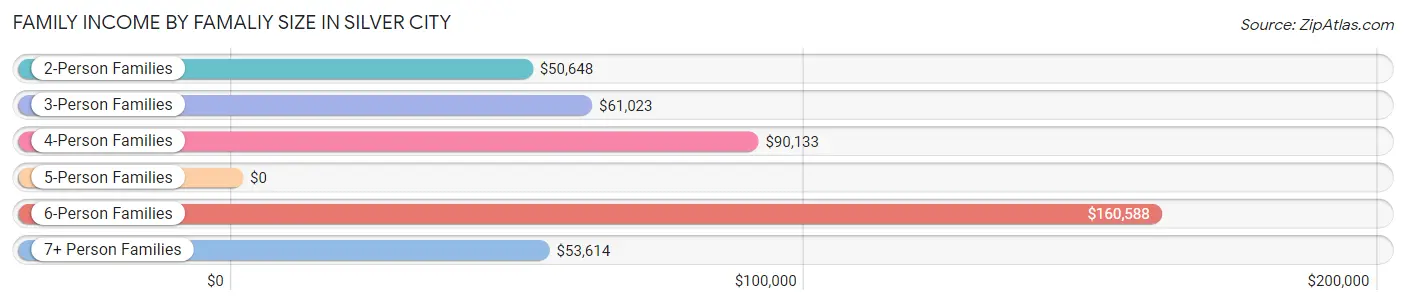
Family Income by Famaliy Size in Silver City
6-person families (42 | 2.6%) account for the highest median family income in Silver City with $160,588 per family, while 6-person families (42 | 2.6%) have the highest median income of $26,765 per family member.
| Income Bracket | # Families | Median Income |
| 2-Person Families | 954 (58.1%) | $50,648 |
| 3-Person Families | 317 (19.3%) | $61,023 |
| 4-Person Families | 177 (10.8%) | $90,133 |
| 5-Person Families | 58 (3.5%) | $0 |
| 6-Person Families | 42 (2.6%) | $160,588 |
| 7+ Person Families | 93 (5.7%) | $53,614 |
| Total | 1,641 (100.0%) | $60,373 |
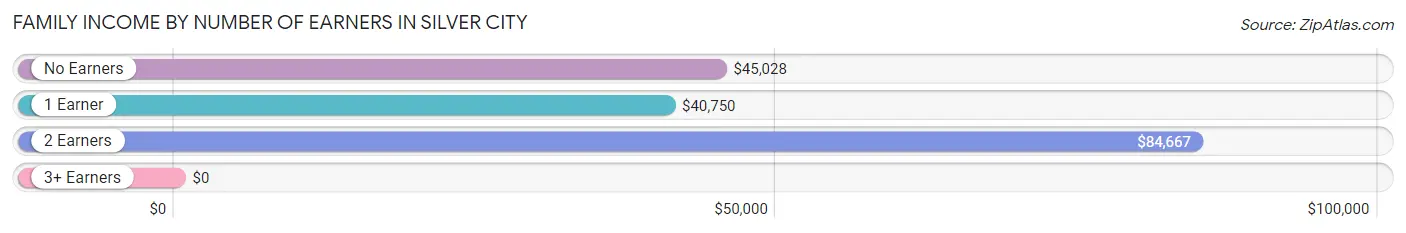
Family Income by Number of Earners in Silver City
| Number of Earners | # Families | Median Income |
| No Earners | 409 (24.9%) | $45,028 |
| 1 Earner | 629 (38.3%) | $40,750 |
| 2 Earners | 550 (33.5%) | $84,667 |
| 3+ Earners | 53 (3.2%) | $0 |
| Total | 1,641 (100.0%) | $60,373 |
Household Income in Silver City
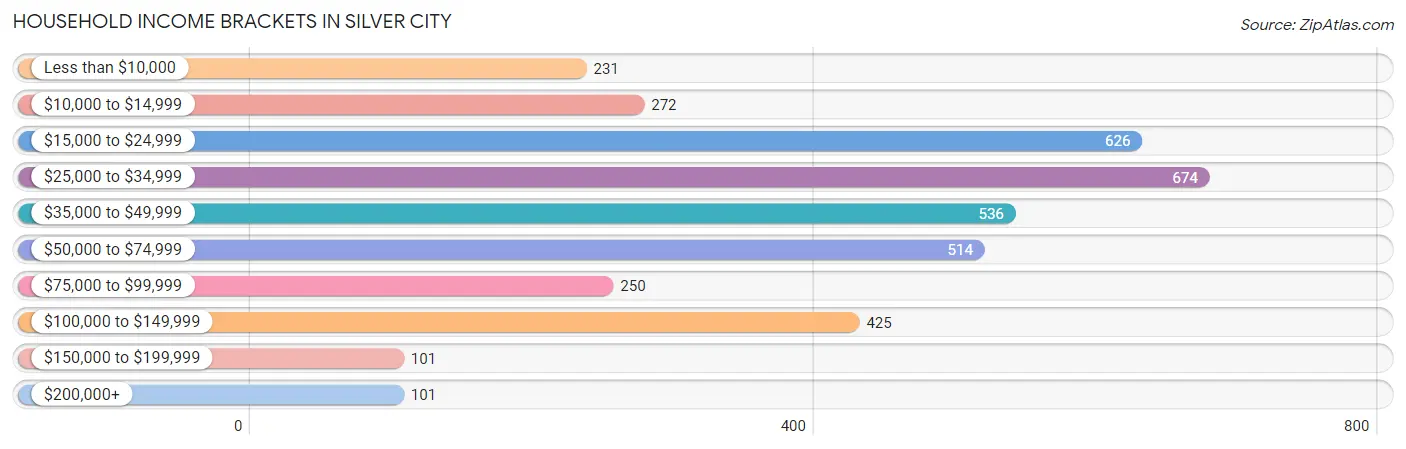
Household Income Brackets in Silver City
With 674 households falling in the category, the $25,000 to $34,999 income range is the most frequent in Silver City, accounting for 18.1% of all households. In contrast, only 101 households (2.7%) fall into the $150,000 to $199,999 income bracket, making it the least populous group.
| Income Bracket | # Households | % Households |
| Less than $10,000 | 231 | 6.2% |
| $10,000 to $14,999 | 272 | 7.3% |
| $15,000 to $24,999 | 626 | 16.8% |
| $25,000 to $34,999 | 674 | 18.1% |
| $35,000 to $49,999 | 536 | 14.4% |
| $50,000 to $74,999 | 514 | 13.8% |
| $75,000 to $99,999 | 250 | 6.7% |
| $100,000 to $149,999 | 425 | 11.4% |
| $150,000 to $199,999 | 101 | 2.7% |
| $200,000+ | 101 | 2.7% |
Household Income by Householder Age in Silver City
The median household income in Silver City is $36,853, with the highest median household income of $41,305 found in the 45 to 64 years age bracket for the primary householder. A total of 1,045 households (28.1%) fall into this category. Meanwhile, the 15 to 24 years age bracket for the primary householder has the lowest median household income of $20,553, with 229 households (6.1%) in this group.
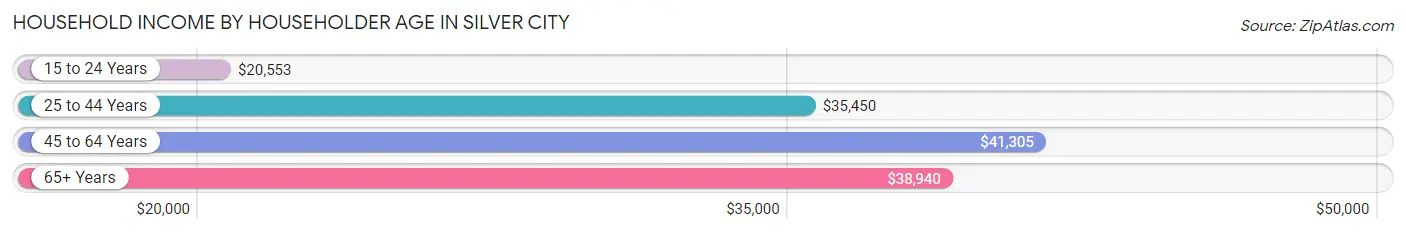
| Income Bracket | # Households | Median Income |
| 15 to 24 Years | 229 (6.1%) | $20,553 |
| 25 to 44 Years | 1,185 (31.8%) | $35,450 |
| 45 to 64 Years | 1,045 (28.1%) | $41,305 |
| 65+ Years | 1,265 (34.0%) | $38,940 |
| Total | 3,724 (100.0%) | $36,853 |
Poverty in Silver City
Income Below Poverty by Sex and Age in Silver City
With 16.6% poverty level for males and 27.0% for females among the residents of Silver City, under 5 year old males and 25 to 34 year old females are the most vulnerable to poverty, with 194 males (41.8%) and 266 females (39.5%) in their respective age groups living below the poverty level.
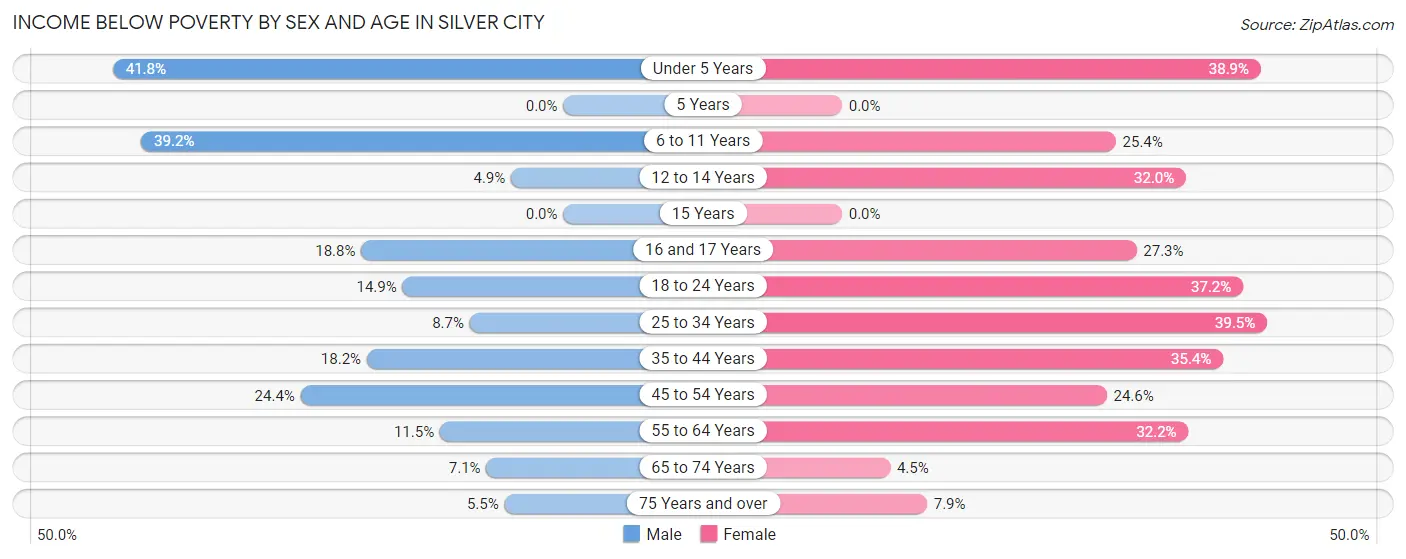
| Age Bracket | Male | Female |
| Under 5 Years | 194 (41.8%) | 126 (38.9%) |
| 5 Years | 0 (0.0%) | 0 (0.0%) |
| 6 to 11 Years | 125 (39.2%) | 94 (25.4%) |
| 12 to 14 Years | 10 (4.9%) | 85 (32.0%) |
| 15 Years | 0 (0.0%) | 0 (0.0%) |
| 16 and 17 Years | 12 (18.8%) | 35 (27.3%) |
| 18 to 24 Years | 27 (14.9%) | 127 (37.2%) |
| 25 to 34 Years | 64 (8.7%) | 266 (39.5%) |
| 35 to 44 Years | 99 (18.2%) | 224 (35.4%) |
| 45 to 54 Years | 109 (24.4%) | 100 (24.6%) |
| 55 to 64 Years | 41 (11.5%) | 148 (32.2%) |
| 65 to 74 Years | 44 (7.1%) | 28 (4.5%) |
| 75 Years and over | 20 (5.5%) | 34 (7.9%) |
| Total | 745 (16.6%) | 1,267 (27.0%) |
Income Above Poverty by Sex and Age in Silver City
According to the poverty statistics in Silver City, males aged 5 years and females aged 5 years are the age groups that are most secure financially, with 100.0% of males and 100.0% of females in these age groups living above the poverty line.
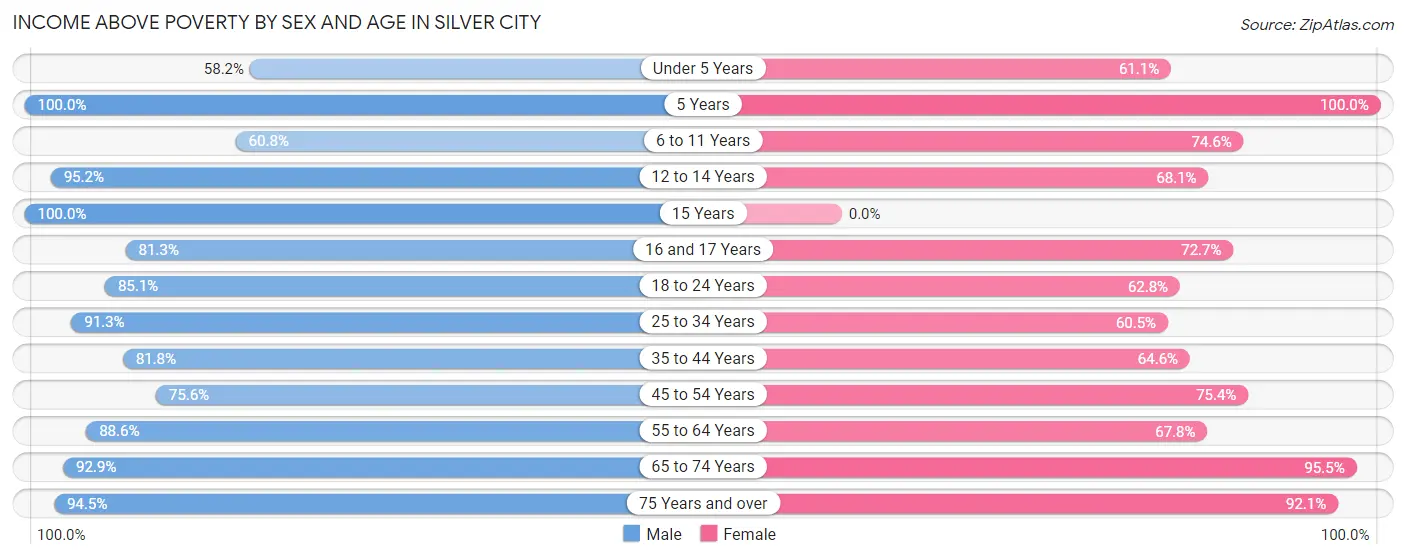
| Age Bracket | Male | Female |
| Under 5 Years | 270 (58.2%) | 198 (61.1%) |
| 5 Years | 78 (100.0%) | 28 (100.0%) |
| 6 to 11 Years | 194 (60.8%) | 276 (74.6%) |
| 12 to 14 Years | 196 (95.2%) | 181 (68.0%) |
| 15 Years | 118 (100.0%) | 0 (0.0%) |
| 16 and 17 Years | 52 (81.2%) | 93 (72.7%) |
| 18 to 24 Years | 154 (85.1%) | 214 (62.8%) |
| 25 to 34 Years | 673 (91.3%) | 408 (60.5%) |
| 35 to 44 Years | 444 (81.8%) | 409 (64.6%) |
| 45 to 54 Years | 338 (75.6%) | 307 (75.4%) |
| 55 to 64 Years | 317 (88.5%) | 312 (67.8%) |
| 65 to 74 Years | 572 (92.9%) | 599 (95.5%) |
| 75 Years and over | 346 (94.5%) | 397 (92.1%) |
| Total | 3,752 (83.4%) | 3,422 (73.0%) |
Income Below Poverty Among Married-Couple Families in Silver City
The poverty statistics for married-couple families in Silver City show that 7.2% or 77 of the total 1,068 families live below the poverty line. Families with 3 or 4 children have the highest poverty rate of 44.4%, comprising of 20 families. On the other hand, families with 1 or 2 children have the lowest poverty rate of 0.0%, which includes 0 families.
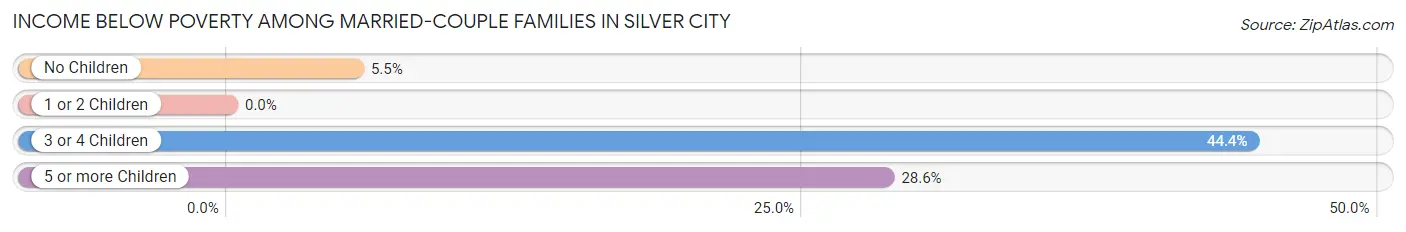
| Children | Above Poverty | Below Poverty |
| No Children | 604 (94.5%) | 35 (5.5%) |
| 1 or 2 Children | 307 (100.0%) | 0 (0.0%) |
| 3 or 4 Children | 25 (55.6%) | 20 (44.4%) |
| 5 or more Children | 55 (71.4%) | 22 (28.6%) |
| Total | 991 (92.8%) | 77 (7.2%) |
Income Below Poverty Among Single-Parent Households in Silver City
According to the poverty data in Silver City, 16.4% or 10 single-father households and 37.9% or 194 single-mother households are living below the poverty line. Among single-father households, those with 1 or 2 children have the highest poverty rate, with 10 households (100.0%) experiencing poverty. Likewise, among single-mother households, those with 3 or 4 children have the highest poverty rate, with 20 households (54.0%) falling below the poverty line.
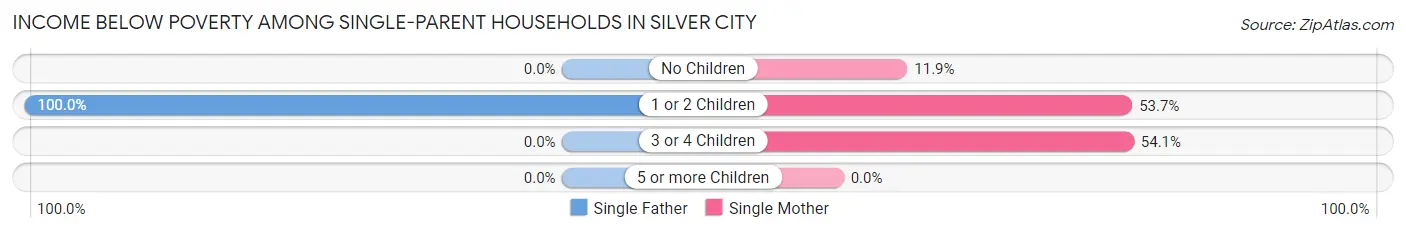
| Children | Single Father | Single Mother |
| No Children | 0 (0.0%) | 23 (11.9%) |
| 1 or 2 Children | 10 (100.0%) | 151 (53.7%) |
| 3 or 4 Children | 0 (0.0%) | 20 (54.0%) |
| 5 or more Children | 0 (0.0%) | 0 (0.0%) |
| Total | 10 (16.4%) | 194 (37.9%) |
Income Below Poverty Among Married-Couple vs Single-Parent Households in Silver City
The poverty data for Silver City shows that 77 of the married-couple family households (7.2%) and 204 of the single-parent households (35.6%) are living below the poverty level. Within the married-couple family households, those with 3 or 4 children have the highest poverty rate, with 20 households (44.4%) falling below the poverty line. Among the single-parent households, those with 1 or 2 children have the highest poverty rate, with 161 household (55.3%) living below poverty.
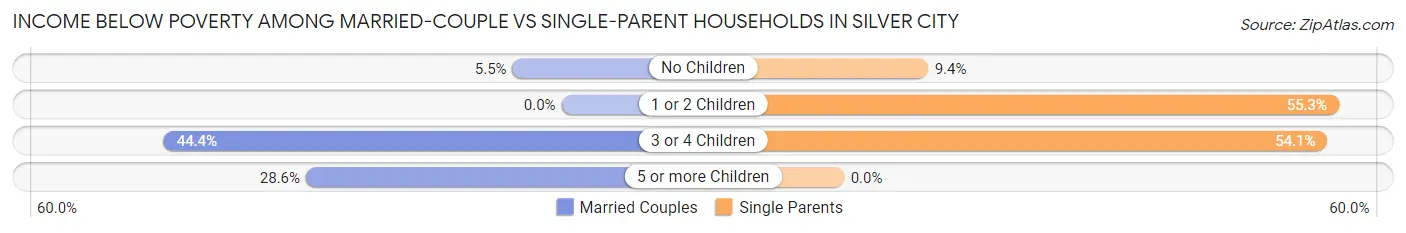
| Children | Married-Couple Families | Single-Parent Households |
| No Children | 35 (5.5%) | 23 (9.4%) |
| 1 or 2 Children | 0 (0.0%) | 161 (55.3%) |
| 3 or 4 Children | 20 (44.4%) | 20 (54.0%) |
| 5 or more Children | 22 (28.6%) | 0 (0.0%) |
| Total | 77 (7.2%) | 204 (35.6%) |
Race in Silver City
The most populous races in Silver City are White / Caucasian (6,901 | 71.5%), Hispanic or Latino (4,940 | 51.2%), and Two or more Races (1,665 | 17.2%).
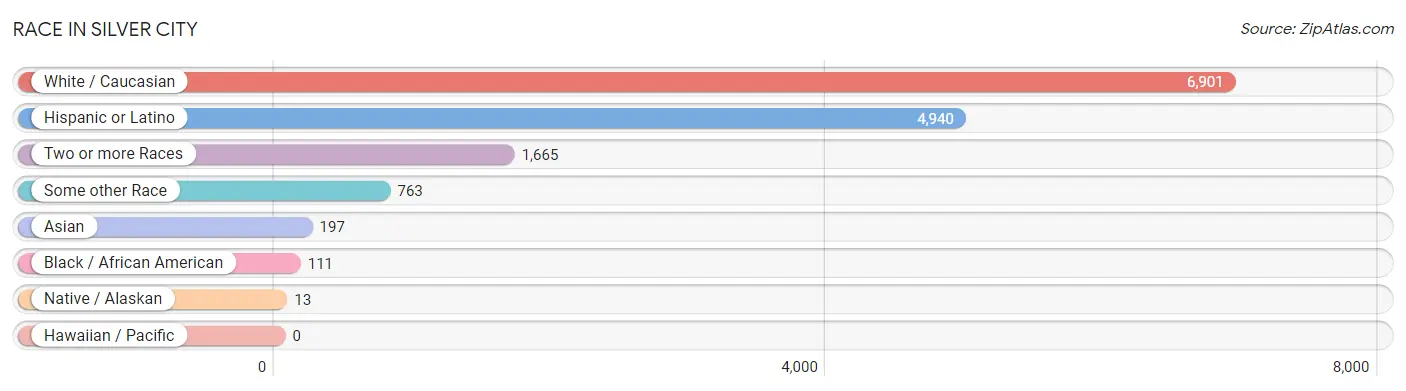
| Race | # Population | % Population |
| Asian | 197 | 2.0% |
| Black / African American | 111 | 1.1% |
| Hawaiian / Pacific | 0 | 0.0% |
| Hispanic or Latino | 4,940 | 51.2% |
| Native / Alaskan | 13 | 0.1% |
| White / Caucasian | 6,901 | 71.5% |
| Two or more Races | 1,665 | 17.2% |
| Some other Race | 763 | 7.9% |
| Total | 9,650 | 100.0% |
Ancestry in Silver City
The most populous ancestries reported in Silver City are Mexican (4,169 | 43.2%), English (1,094 | 11.3%), Irish (1,057 | 11.0%), German (726 | 7.5%), and Norwegian (349 | 3.6%), together accounting for 76.6% of all Silver City residents.
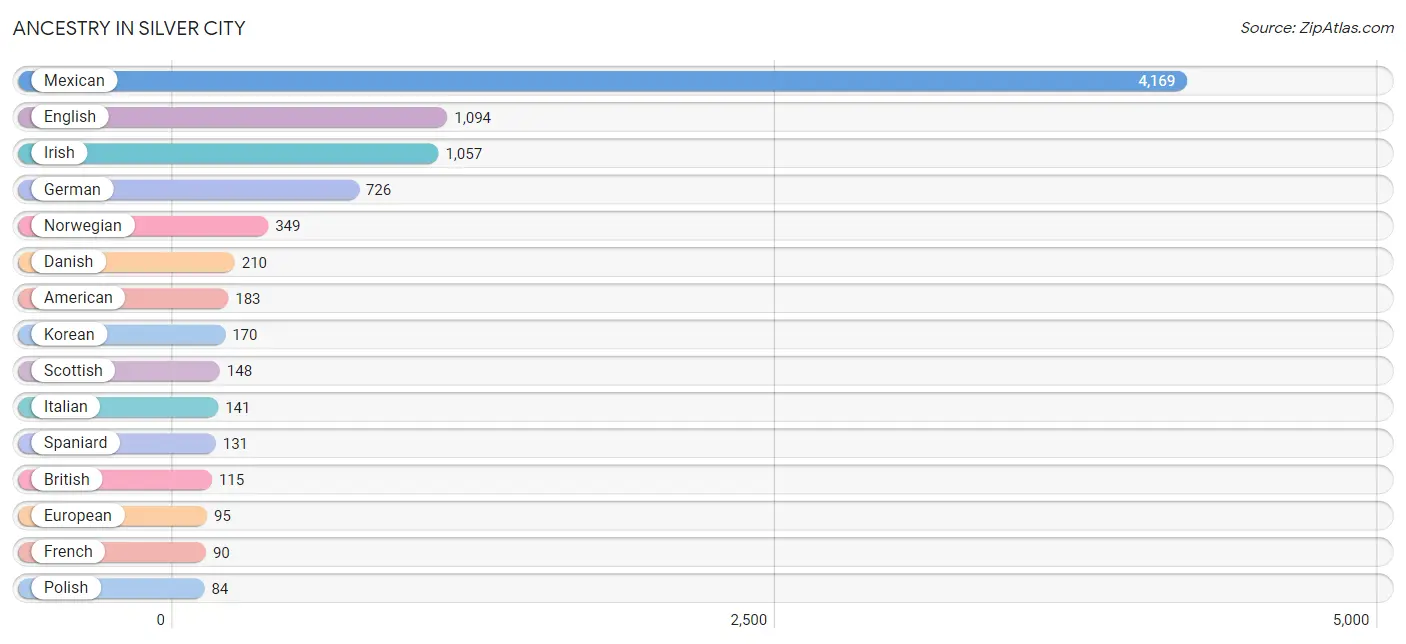
| Ancestry | # Population | % Population |
| American | 183 | 1.9% |
| Apache | 12 | 0.1% |
| Arab | 4 | 0.0% |
| Armenian | 17 | 0.2% |
| Bhutanese | 8 | 0.1% |
| British | 115 | 1.2% |
| Burmese | 22 | 0.2% |
| Central American | 59 | 0.6% |
| Central American Indian | 32 | 0.3% |
| Cherokee | 40 | 0.4% |
| Cheyenne | 13 | 0.1% |
| Cuban | 62 | 0.6% |
| Czech | 13 | 0.1% |
| Danish | 210 | 2.2% |
| Dutch | 41 | 0.4% |
| Eastern European | 20 | 0.2% |
| Egyptian | 4 | 0.0% |
| English | 1,094 | 11.3% |
| European | 95 | 1.0% |
| Finnish | 20 | 0.2% |
| French | 90 | 0.9% |
| French Canadian | 23 | 0.2% |
| German | 726 | 7.5% |
| Haitian | 4 | 0.0% |
| Indian (Asian) | 16 | 0.2% |
| Irish | 1,057 | 11.0% |
| Italian | 141 | 1.5% |
| Korean | 170 | 1.8% |
| Mexican | 4,169 | 43.2% |
| Mexican American Indian | 32 | 0.3% |
| Nicaraguan | 32 | 0.3% |
| Northern European | 18 | 0.2% |
| Norwegian | 349 | 3.6% |
| Pakistani | 1 | 0.0% |
| Peruvian | 14 | 0.2% |
| Polish | 84 | 0.9% |
| Portuguese | 28 | 0.3% |
| Pueblo | 8 | 0.1% |
| Puerto Rican | 7 | 0.1% |
| Russian | 13 | 0.1% |
| Salvadoran | 27 | 0.3% |
| Scandinavian | 12 | 0.1% |
| Scotch-Irish | 51 | 0.5% |
| Scottish | 148 | 1.5% |
| Serbian | 52 | 0.5% |
| Slovak | 24 | 0.3% |
| South American | 14 | 0.2% |
| Spaniard | 131 | 1.4% |
| Spanish | 44 | 0.5% |
| Swedish | 57 | 0.6% |
| Welsh | 25 | 0.3% | View All 51 Rows |
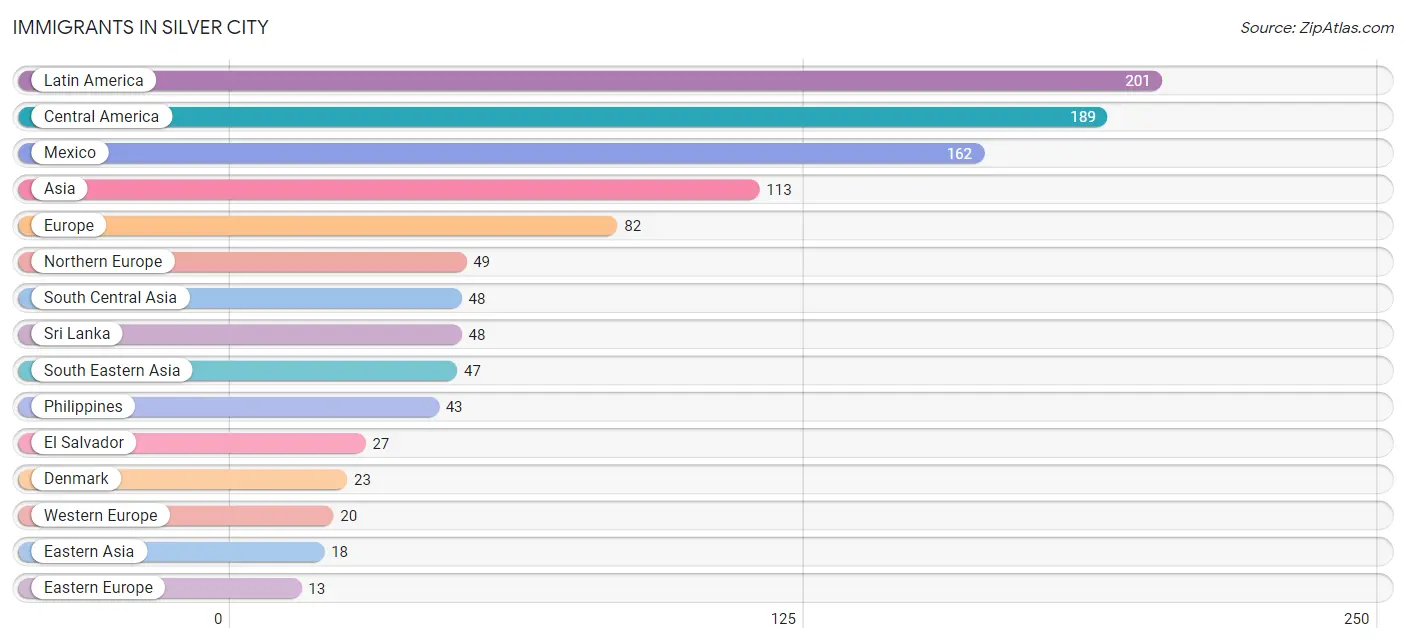
Immigrants in Silver City
The most numerous immigrant groups reported in Silver City came from Latin America (201 | 2.1%), Central America (189 | 2.0%), Mexico (162 | 1.7%), Asia (113 | 1.2%), and Europe (82 | 0.9%), together accounting for 7.7% of all Silver City residents.
| Immigration Origin | # Population | % Population |
| Asia | 113 | 1.2% |
| Brazil | 12 | 0.1% |
| Central America | 189 | 2.0% |
| Denmark | 23 | 0.2% |
| Eastern Asia | 18 | 0.2% |
| Eastern Europe | 13 | 0.1% |
| El Salvador | 27 | 0.3% |
| England | 7 | 0.1% |
| Europe | 82 | 0.9% |
| Germany | 12 | 0.1% |
| Japan | 8 | 0.1% |
| Korea | 10 | 0.1% |
| Latin America | 201 | 2.1% |
| Malaysia | 3 | 0.0% |
| Mexico | 162 | 1.7% |
| Northern Europe | 49 | 0.5% |
| Philippines | 43 | 0.4% |
| Serbia | 13 | 0.1% |
| South America | 12 | 0.1% |
| South Central Asia | 48 | 0.5% |
| South Eastern Asia | 47 | 0.5% |
| Sri Lanka | 48 | 0.5% |
| Switzerland | 8 | 0.1% |
| Thailand | 1 | 0.0% |
| Western Europe | 20 | 0.2% | View All 25 Rows |
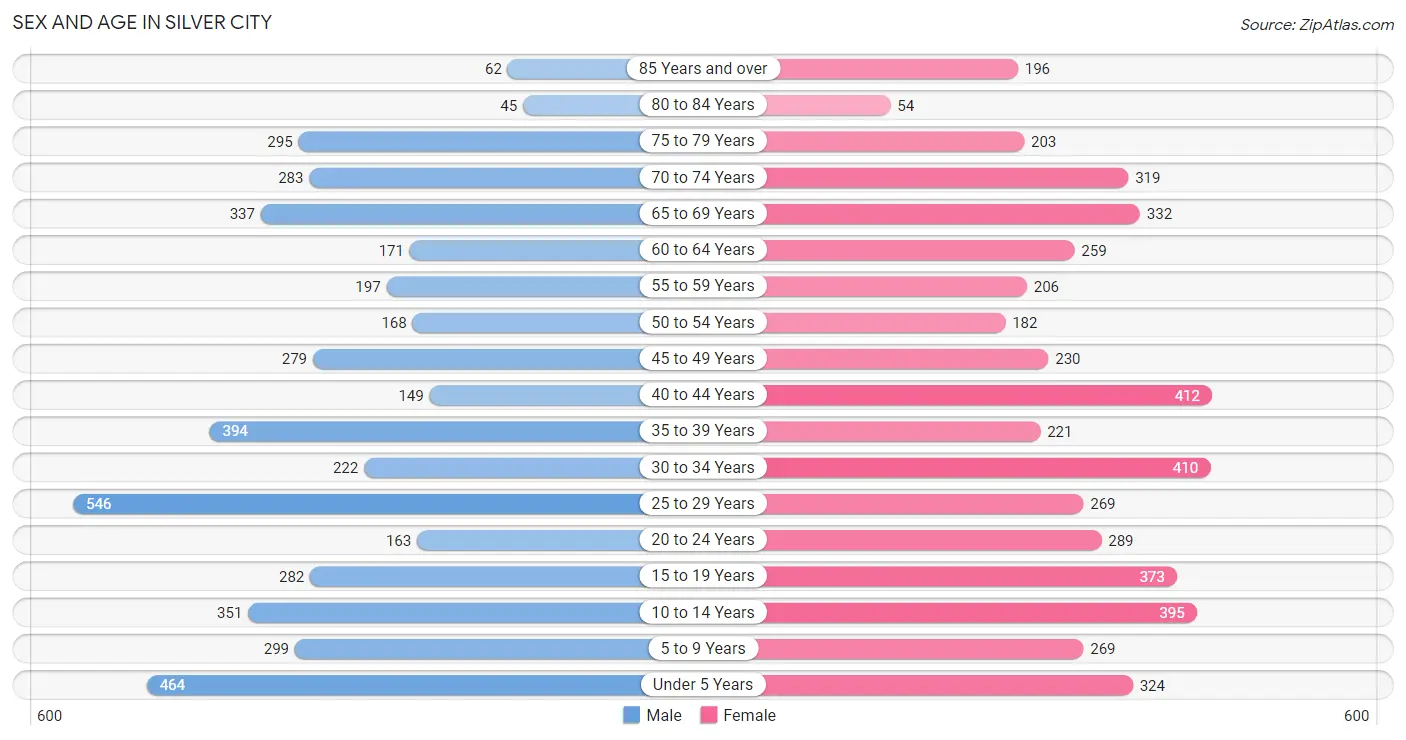
Sex and Age in Silver City
Sex and Age in Silver City
The most populous age groups in Silver City are 25 to 29 Years (546 | 11.6%) for men and 40 to 44 Years (412 | 8.3%) for women.
| Age Bracket | Male | Female |
| Under 5 Years | 464 (9.9%) | 324 (6.6%) |
| 5 to 9 Years | 299 (6.4%) | 269 (5.4%) |
| 10 to 14 Years | 351 (7.5%) | 395 (8.0%) |
| 15 to 19 Years | 282 (6.0%) | 373 (7.5%) |
| 20 to 24 Years | 163 (3.5%) | 289 (5.9%) |
| 25 to 29 Years | 546 (11.6%) | 269 (5.4%) |
| 30 to 34 Years | 222 (4.7%) | 410 (8.3%) |
| 35 to 39 Years | 394 (8.4%) | 221 (4.5%) |
| 40 to 44 Years | 149 (3.2%) | 412 (8.3%) |
| 45 to 49 Years | 279 (5.9%) | 230 (4.6%) |
| 50 to 54 Years | 168 (3.6%) | 182 (3.7%) |
| 55 to 59 Years | 197 (4.2%) | 206 (4.2%) |
| 60 to 64 Years | 171 (3.6%) | 259 (5.2%) |
| 65 to 69 Years | 337 (7.2%) | 332 (6.7%) |
| 70 to 74 Years | 283 (6.0%) | 319 (6.5%) |
| 75 to 79 Years | 295 (6.3%) | 203 (4.1%) |
| 80 to 84 Years | 45 (1.0%) | 54 (1.1%) |
| 85 Years and over | 62 (1.3%) | 196 (4.0%) |
| Total | 4,707 (100.0%) | 4,943 (100.0%) |
Families and Households in Silver City
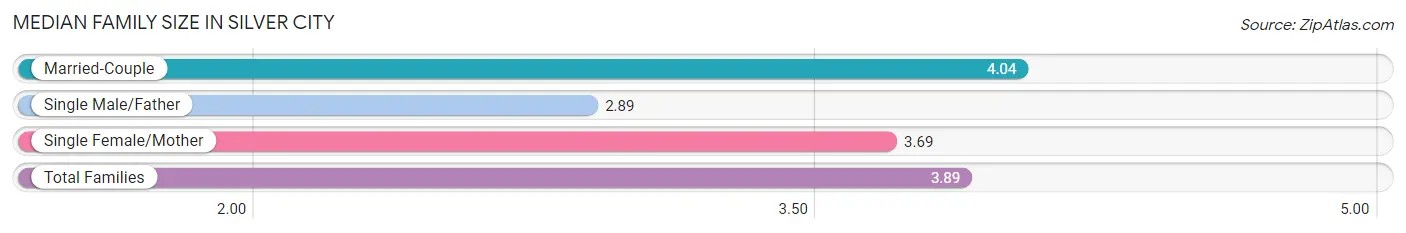
Median Family Size in Silver City
The median family size in Silver City is 3.89 persons per family, with married-couple families (1,068 | 65.1%) accounting for the largest median family size of 4.04 persons per family. On the other hand, single male/father families (61 | 3.7%) represent the smallest median family size with 2.89 persons per family.
| Family Type | # Families | Family Size |
| Married-Couple | 1,068 (65.1%) | 4.04 |
| Single Male/Father | 61 (3.7%) | 2.89 |
| Single Female/Mother | 512 (31.2%) | 3.69 |
| Total Families | 1,641 (100.0%) | 3.89 |
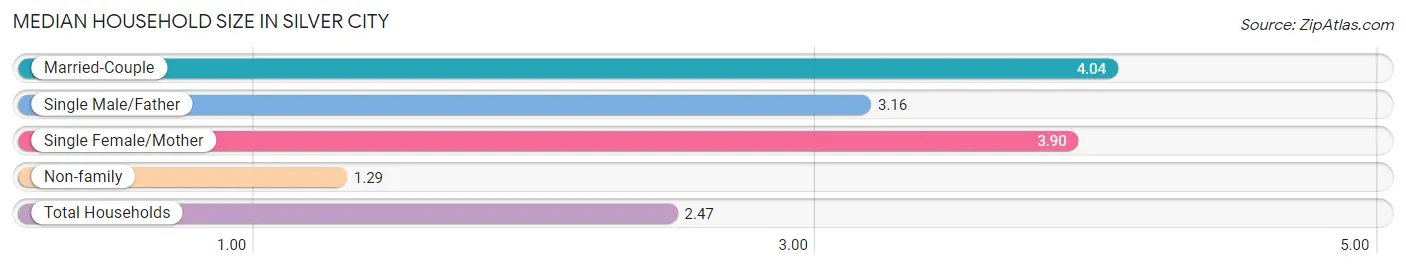
Median Household Size in Silver City
The median household size in Silver City is 2.47 persons per household, with married-couple households (1,068 | 28.7%) accounting for the largest median household size of 4.04 persons per household. non-family households (2,083 | 55.9%) represent the smallest median household size with 1.29 persons per household.
| Household Type | # Households | Household Size |
| Married-Couple | 1,068 (28.7%) | 4.04 |
| Single Male/Father | 61 (1.6%) | 3.16 |
| Single Female/Mother | 512 (13.8%) | 3.90 |
| Non-family | 2,083 (55.9%) | 1.29 |
| Total Households | 3,724 (100.0%) | 2.47 |
Household Size by Marriage Status in Silver City
Out of a total of 3,724 households in Silver City, 1,641 (44.1%) are family households, while 2,083 (55.9%) are nonfamily households. The most numerous type of family households are 2-person households, comprising 903, and the most common type of nonfamily households are 1-person households, comprising 1,595.
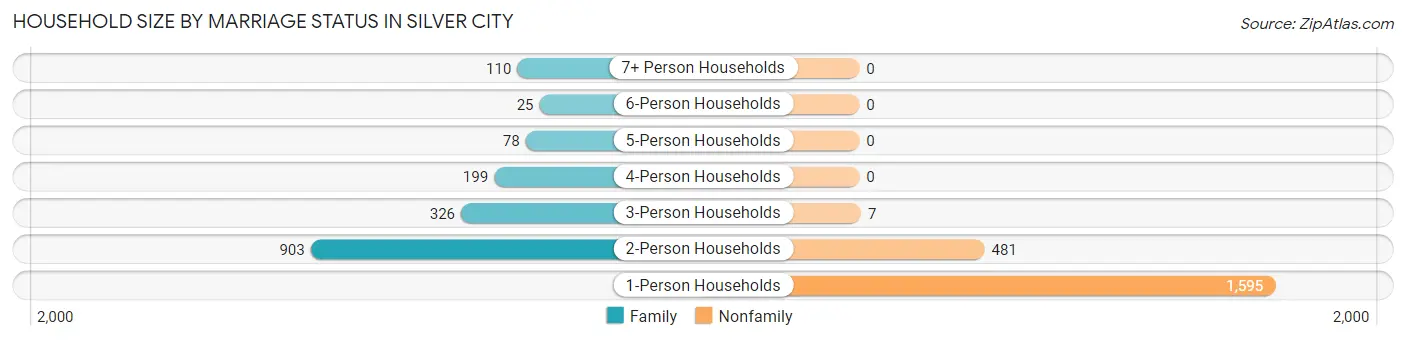
| Household Size | Family Households | Nonfamily Households |
| 1-Person Households | - | 1,595 (42.8%) |
| 2-Person Households | 903 (24.2%) | 481 (12.9%) |
| 3-Person Households | 326 (8.7%) | 7 (0.2%) |
| 4-Person Households | 199 (5.3%) | 0 (0.0%) |
| 5-Person Households | 78 (2.1%) | 0 (0.0%) |
| 6-Person Households | 25 (0.7%) | 0 (0.0%) |
| 7+ Person Households | 110 (2.9%) | 0 (0.0%) |
| Total | 1,641 (44.1%) | 2,083 (55.9%) |
Female Fertility in Silver City
Fertility by Age in Silver City
Average fertility rate in Silver City is 67.0 births per 1,000 women. Women in the age bracket of 20 to 34 years have the highest fertility rate with 105.0 births per 1,000 women. Women in the age bracket of 20 to 34 years acount for 68.5% of all women with births.
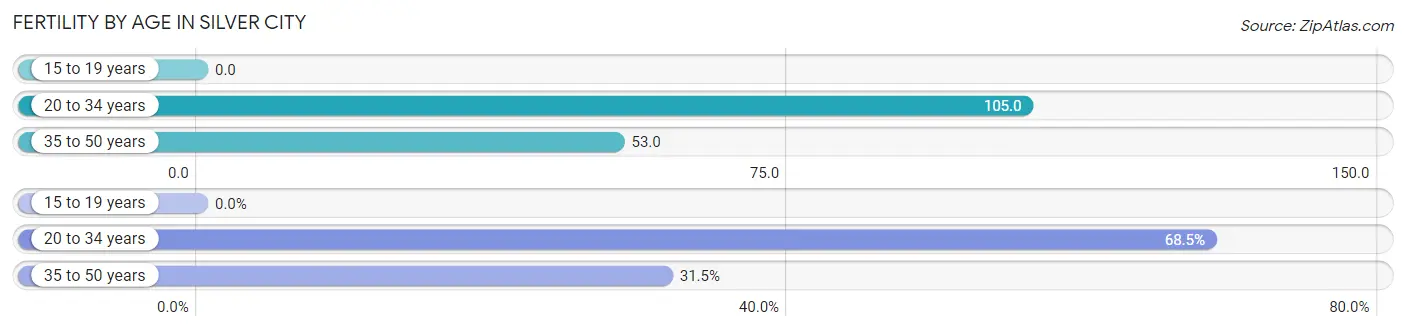
| Age Bracket | Women with Births | Births / 1,000 Women |
| 15 to 19 years | 0 (0.0%) | 0.0 |
| 20 to 34 years | 102 (68.5%) | 105.0 |
| 35 to 50 years | 47 (31.5%) | 53.0 |
| Total | 149 (100.0%) | 67.0 |
Fertility by Age by Marriage Status in Silver City
68.5% of women with births (149) in Silver City are married. The highest percentage of unmarried women with births falls into 20 to 34 years age bracket with 46.1% of them unmarried at the time of birth, while the lowest percentage of unmarried women with births belong to 35 to 50 years age bracket with 0.0% of them unmarried.
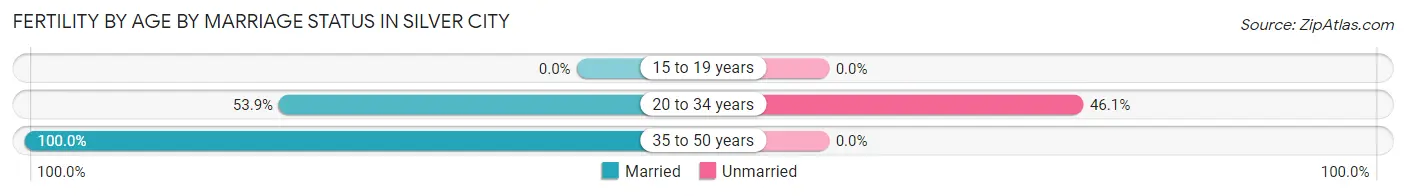
| Age Bracket | Married | Unmarried |
| 15 to 19 years | 0 (0.0%) | 0 (0.0%) |
| 20 to 34 years | 55 (53.9%) | 47 (46.1%) |
| 35 to 50 years | 47 (100.0%) | 0 (0.0%) |
| Total | 102 (68.5%) | 47 (31.5%) |
Fertility by Education in Silver City
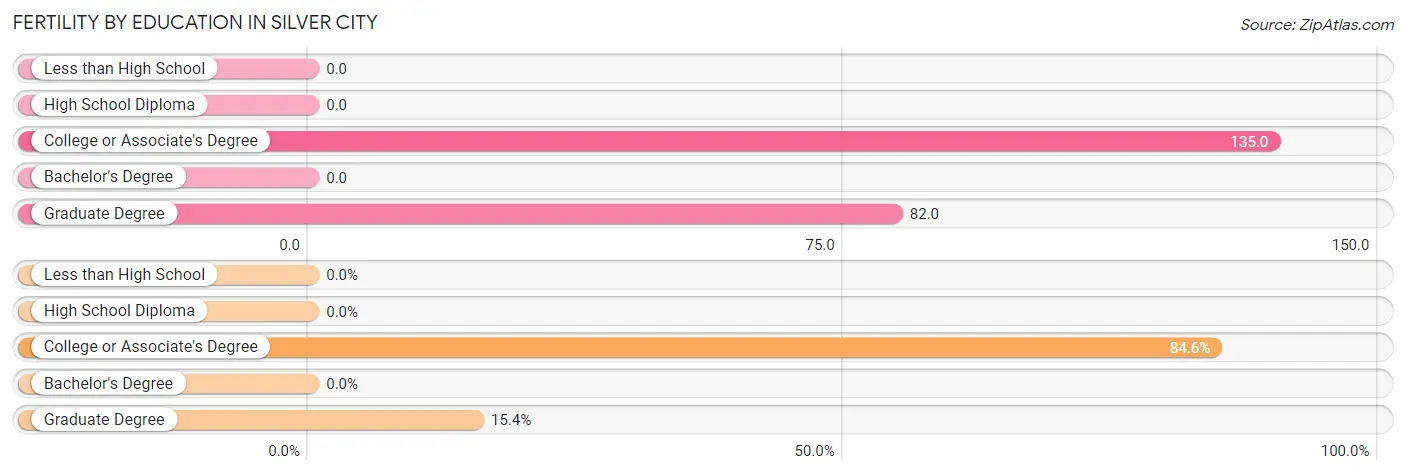
| Educational Attainment | Women with Births | Births / 1,000 Women |
| Less than High School | 0 (0.0%) | 0.0 |
| High School Diploma | 0 (0.0%) | 0.0 |
| College or Associate's Degree | 126 (84.6%) | 135.0 |
| Bachelor's Degree | 0 (0.0%) | 0.0 |
| Graduate Degree | 23 (15.4%) | 82.0 |
| Total | 149 (100.0%) | 67.0 |
Fertility by Education by Marriage Status in Silver City
31.5% of women with births in Silver City are unmarried. Women with the educational attainment of graduate degree are most likely to be married with 100.0% of them married at childbirth, while women with the educational attainment of college or associate's degree are least likely to be married with 37.3% of them unmarried at childbirth.
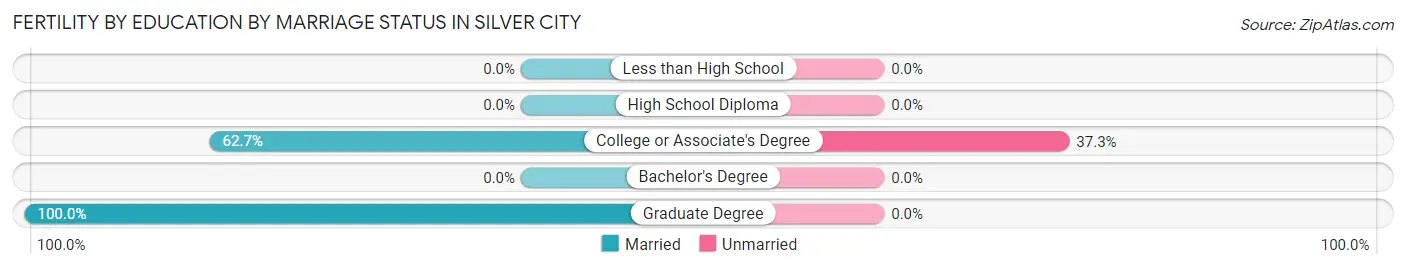
| Educational Attainment | Married | Unmarried |
| Less than High School | 0 (0.0%) | 0 (0.0%) |
| High School Diploma | 0 (0.0%) | 0 (0.0%) |
| College or Associate's Degree | 79 (62.7%) | 47 (37.3%) |
| Bachelor's Degree | 0 (0.0%) | 0 (0.0%) |
| Graduate Degree | 23 (100.0%) | 0 (0.0%) |
| Total | 102 (68.5%) | 47 (31.5%) |
Employment Characteristics in Silver City
Employment by Class of Employer in Silver City
Among the 3,702 employed individuals in Silver City, private company employees (2,107 | 56.9%), state government employees (450 | 12.2%), and self-employed (not incorporated) (427 | 11.5%) make up the most common classes of employment.
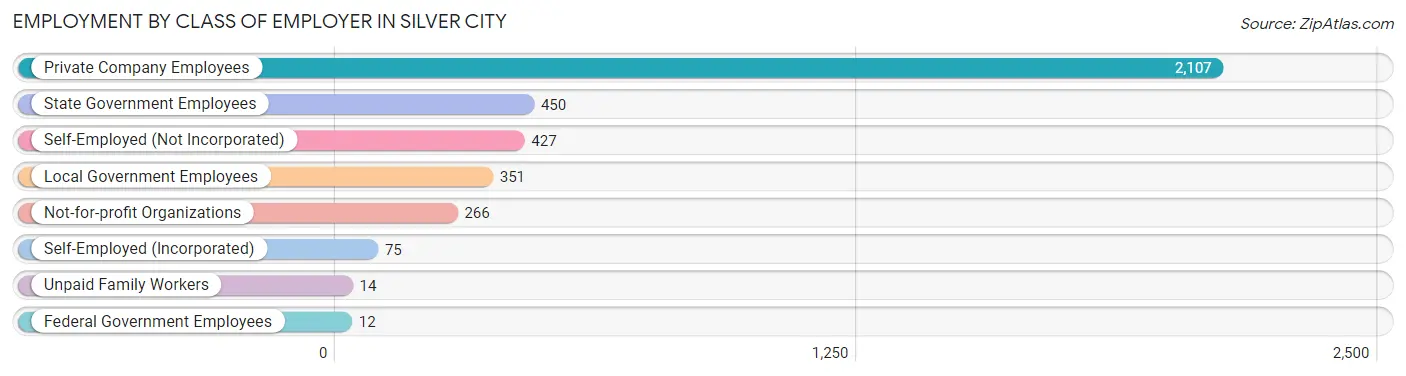
| Employer Class | # Employees | % Employees |
| Private Company Employees | 2,107 | 56.9% |
| Self-Employed (Incorporated) | 75 | 2.0% |
| Self-Employed (Not Incorporated) | 427 | 11.5% |
| Not-for-profit Organizations | 266 | 7.2% |
| Local Government Employees | 351 | 9.5% |
| State Government Employees | 450 | 12.2% |
| Federal Government Employees | 12 | 0.3% |
| Unpaid Family Workers | 14 | 0.4% |
| Total | 3,702 | 100.0% |
Employment Status by Age in Silver City
According to the labor force statistics for Silver City, out of the total population over 16 years of age (7,430), 55.3% or 4,109 individuals are in the labor force, with 9.9% or 407 of them unemployed. The age group with the highest labor force participation rate is 30 to 34 years, with 98.1% or 620 individuals in the labor force. Within the labor force, the 35 to 44 years age range has the highest percentage of unemployed individuals, with 20.5% or 217 of them being unemployed.
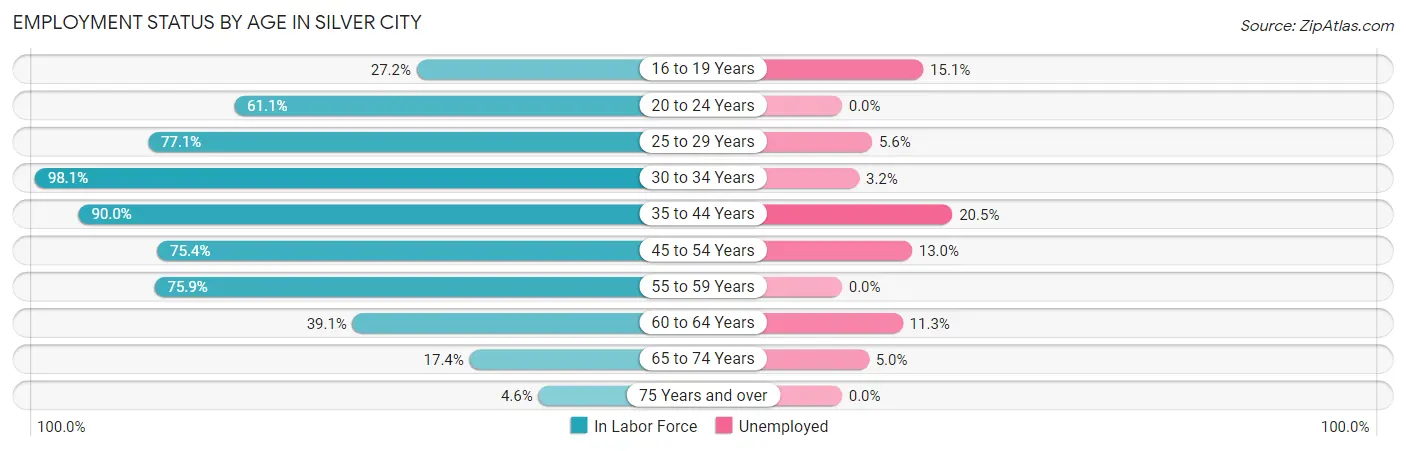
| Age Bracket | In Labor Force | Unemployed |
| 16 to 19 Years | 146 (27.2%) | 22 (15.1%) |
| 20 to 24 Years | 276 (61.1%) | 0 (0.0%) |
| 25 to 29 Years | 628 (77.1%) | 35 (5.6%) |
| 30 to 34 Years | 620 (98.1%) | 20 (3.2%) |
| 35 to 44 Years | 1,058 (90.0%) | 217 (20.5%) |
| 45 to 54 Years | 648 (75.4%) | 84 (13.0%) |
| 55 to 59 Years | 306 (75.9%) | 0 (0.0%) |
| 60 to 64 Years | 168 (39.1%) | 19 (11.3%) |
| 65 to 74 Years | 221 (17.4%) | 11 (5.0%) |
| 75 Years and over | 39 (4.6%) | 0 (0.0%) |
| Total | 4,109 (55.3%) | 407 (9.9%) |
Employment Status by Educational Attainment in Silver City
According to labor force statistics for Silver City, 79.4% of individuals (3,426) out of the total population between 25 and 64 years of age (4,315) are in the labor force, with 10.9% or 373 of them being unemployed. The group with the highest labor force participation rate are those with the educational attainment of bachelor's degree or higher, with 88.7% or 1,111 individuals in the labor force. Within the labor force, individuals with high school diploma education have the highest percentage of unemployment, with 27.2% or 252 of them being unemployed.
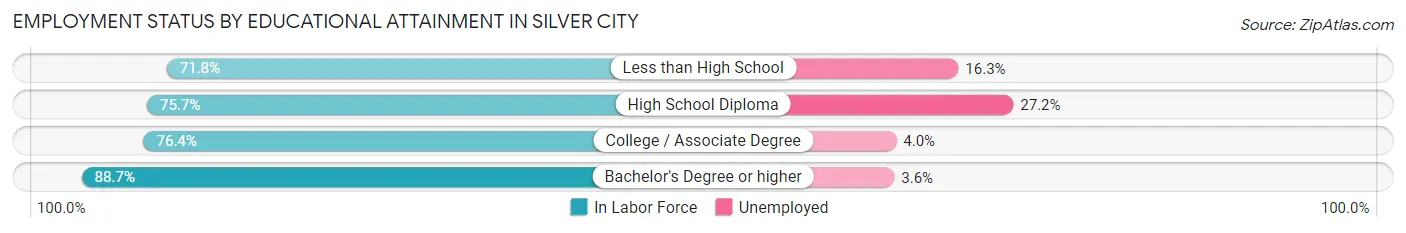
| Educational Attainment | In Labor Force | Unemployed |
| Less than High School | 221 (71.8%) | 50 (16.3%) |
| High School Diploma | 927 (75.7%) | 333 (27.2%) |
| College / Associate Degree | 1,169 (76.4%) | 61 (4.0%) |
| Bachelor's Degree or higher | 1,111 (88.7%) | 45 (3.6%) |
| Total | 3,426 (79.4%) | 470 (10.9%) |
Employment Occupations by Sex in Silver City
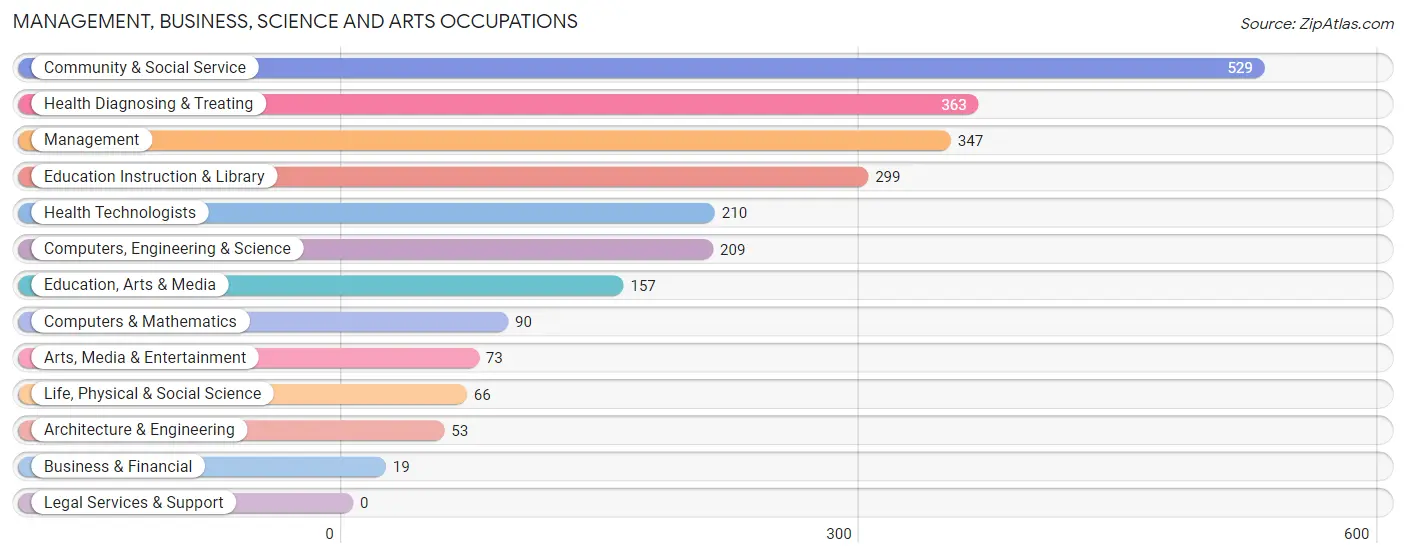
Management, Business, Science and Arts Occupations
The most common Management, Business, Science and Arts occupations in Silver City are Community & Social Service (529 | 14.3%), Health Diagnosing & Treating (363 | 9.8%), Management (347 | 9.4%), Education Instruction & Library (299 | 8.1%), and Health Technologists (210 | 5.7%).
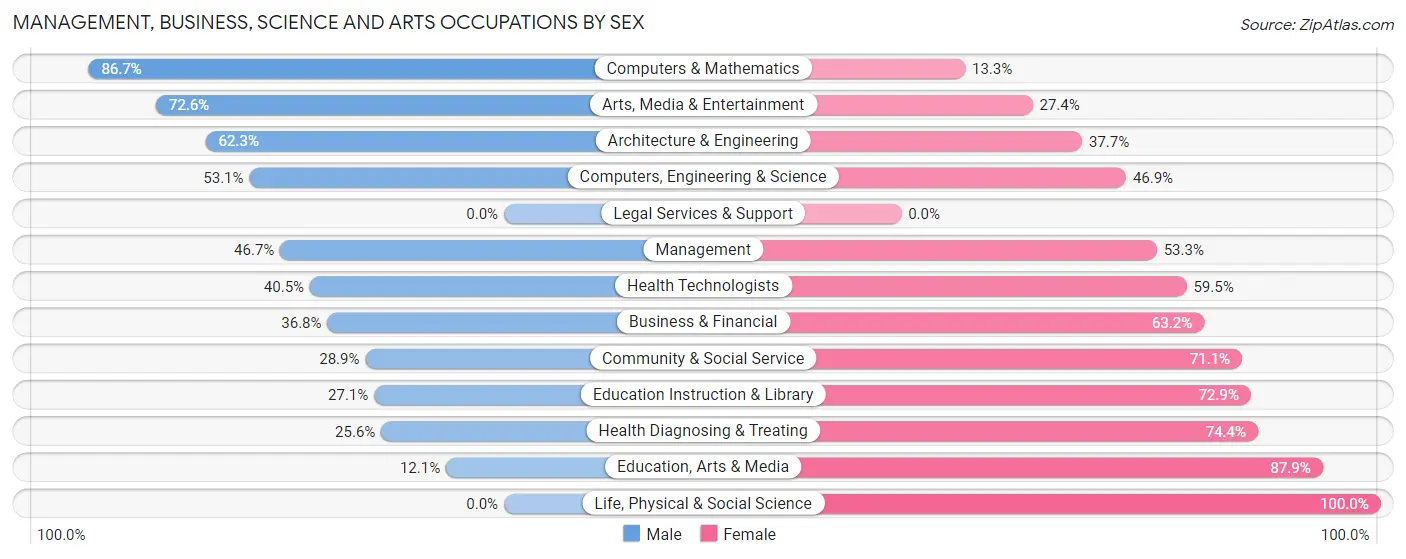
Management, Business, Science and Arts Occupations by Sex
Within the Management, Business, Science and Arts occupations in Silver City, the most male-oriented occupations are Computers & Mathematics (86.7%), Arts, Media & Entertainment (72.6%), and Architecture & Engineering (62.3%), while the most female-oriented occupations are Life, Physical & Social Science (100.0%), Education, Arts & Media (87.9%), and Health Diagnosing & Treating (74.4%).
| Occupation | Male | Female |
| Management | 162 (46.7%) | 185 (53.3%) |
| Business & Financial | 7 (36.8%) | 12 (63.2%) |
| Computers, Engineering & Science | 111 (53.1%) | 98 (46.9%) |
| Computers & Mathematics | 78 (86.7%) | 12 (13.3%) |
| Architecture & Engineering | 33 (62.3%) | 20 (37.7%) |
| Life, Physical & Social Science | 0 (0.0%) | 66 (100.0%) |
| Community & Social Service | 153 (28.9%) | 376 (71.1%) |
| Education, Arts & Media | 19 (12.1%) | 138 (87.9%) |
| Legal Services & Support | 0 (0.0%) | 0 (0.0%) |
| Education Instruction & Library | 81 (27.1%) | 218 (72.9%) |
| Arts, Media & Entertainment | 53 (72.6%) | 20 (27.4%) |
| Health Diagnosing & Treating | 93 (25.6%) | 270 (74.4%) |
| Health Technologists | 85 (40.5%) | 125 (59.5%) |
| Total (Category) | 526 (35.9%) | 941 (64.1%) |
| Total (Overall) | 1,896 (51.2%) | 1,806 (48.8%) |
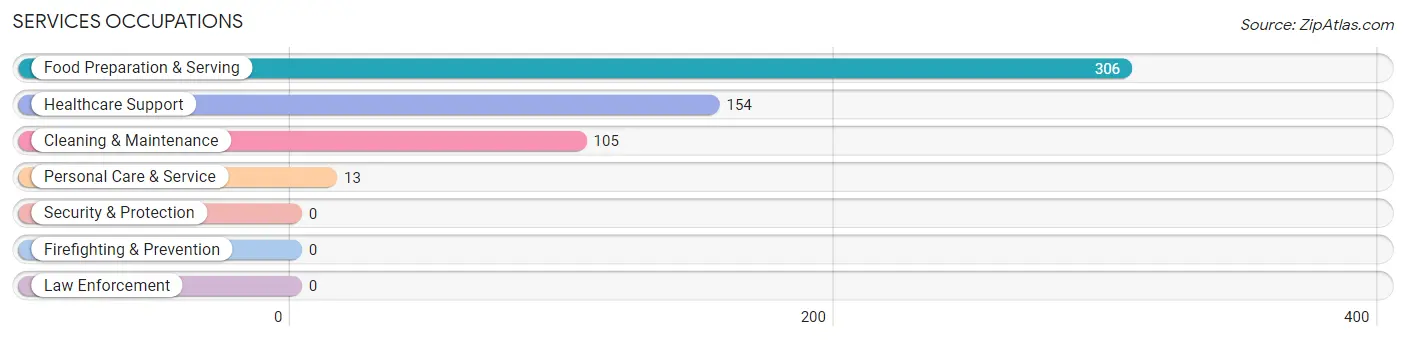
Services Occupations
The most common Services occupations in Silver City are Food Preparation & Serving (306 | 8.3%), Healthcare Support (154 | 4.2%), Cleaning & Maintenance (105 | 2.8%), and Personal Care & Service (13 | 0.4%).
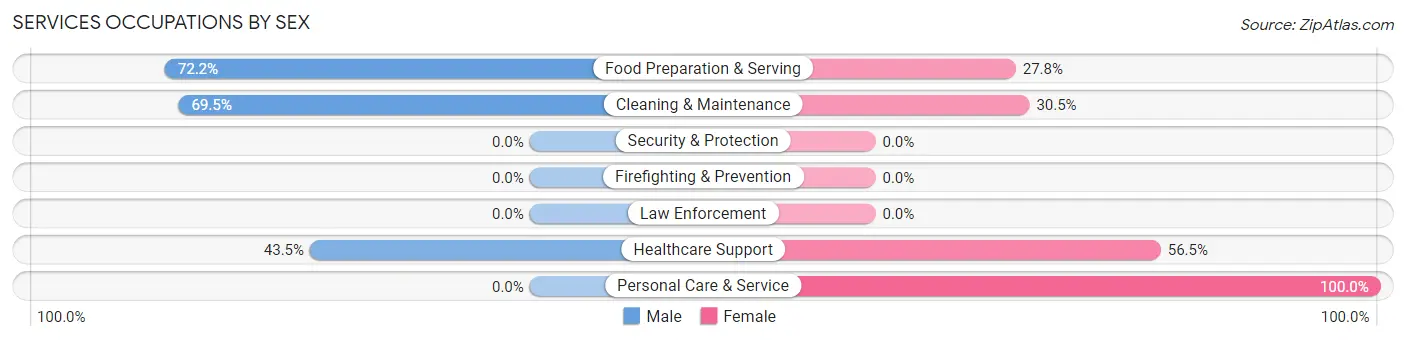
Services Occupations by Sex
Within the Services occupations in Silver City, the most male-oriented occupations are Food Preparation & Serving (72.2%), Cleaning & Maintenance (69.5%), and Healthcare Support (43.5%), while the most female-oriented occupations are Personal Care & Service (100.0%), Healthcare Support (56.5%), and Cleaning & Maintenance (30.5%).
| Occupation | Male | Female |
| Healthcare Support | 67 (43.5%) | 87 (56.5%) |
| Security & Protection | 0 (0.0%) | 0 (0.0%) |
| Firefighting & Prevention | 0 (0.0%) | 0 (0.0%) |
| Law Enforcement | 0 (0.0%) | 0 (0.0%) |
| Food Preparation & Serving | 221 (72.2%) | 85 (27.8%) |
| Cleaning & Maintenance | 73 (69.5%) | 32 (30.5%) |
| Personal Care & Service | 0 (0.0%) | 13 (100.0%) |
| Total (Category) | 361 (62.5%) | 217 (37.5%) |
| Total (Overall) | 1,896 (51.2%) | 1,806 (48.8%) |
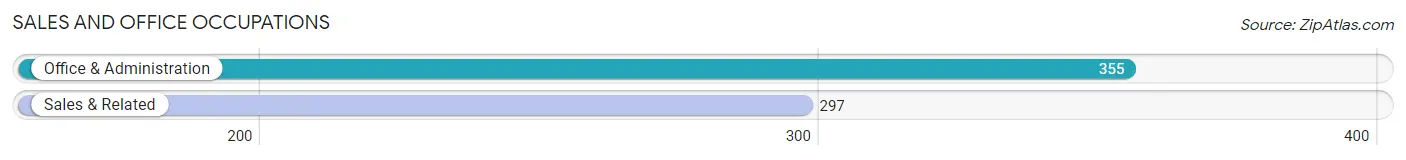
Sales and Office Occupations
The most common Sales and Office occupations in Silver City are Office & Administration (355 | 9.6%), and Sales & Related (297 | 8.0%).
Sales and Office Occupations by Sex
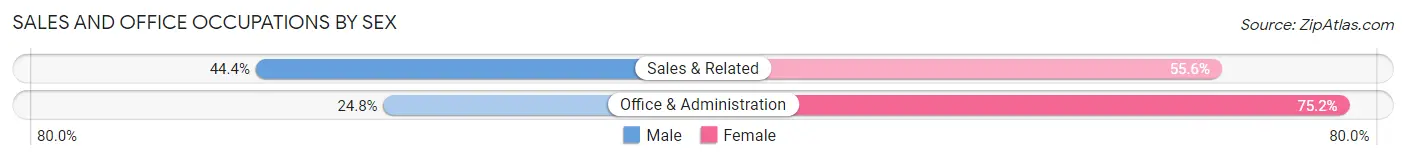
| Occupation | Male | Female |
| Sales & Related | 132 (44.4%) | 165 (55.6%) |
| Office & Administration | 88 (24.8%) | 267 (75.2%) |
| Total (Category) | 220 (33.7%) | 432 (66.3%) |
| Total (Overall) | 1,896 (51.2%) | 1,806 (48.8%) |
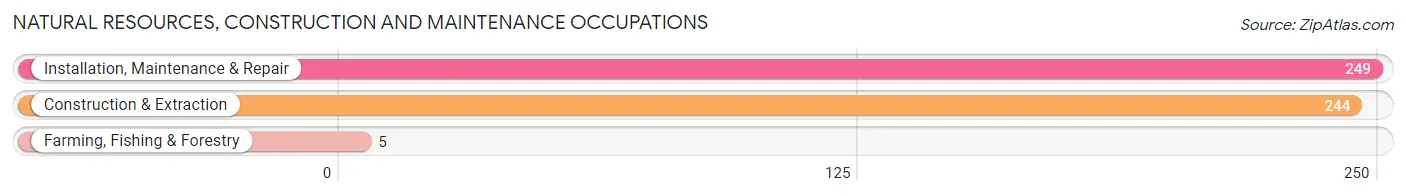
Natural Resources, Construction and Maintenance Occupations
The most common Natural Resources, Construction and Maintenance occupations in Silver City are Installation, Maintenance & Repair (249 | 6.7%), Construction & Extraction (244 | 6.6%), and Farming, Fishing & Forestry (5 | 0.1%).
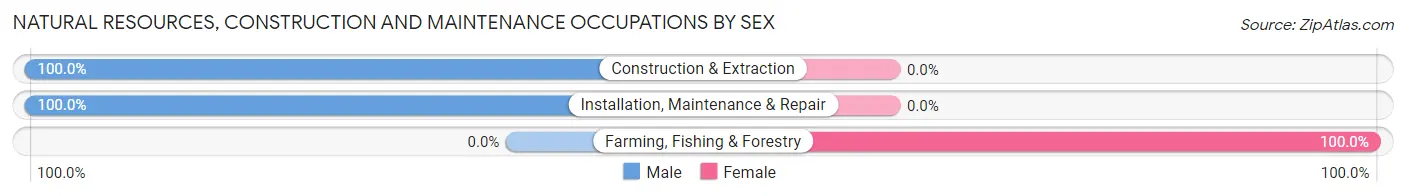
Natural Resources, Construction and Maintenance Occupations by Sex
| Occupation | Male | Female |
| Farming, Fishing & Forestry | 0 (0.0%) | 5 (100.0%) |
| Construction & Extraction | 244 (100.0%) | 0 (0.0%) |
| Installation, Maintenance & Repair | 249 (100.0%) | 0 (0.0%) |
| Total (Category) | 493 (99.0%) | 5 (1.0%) |
| Total (Overall) | 1,896 (51.2%) | 1,806 (48.8%) |
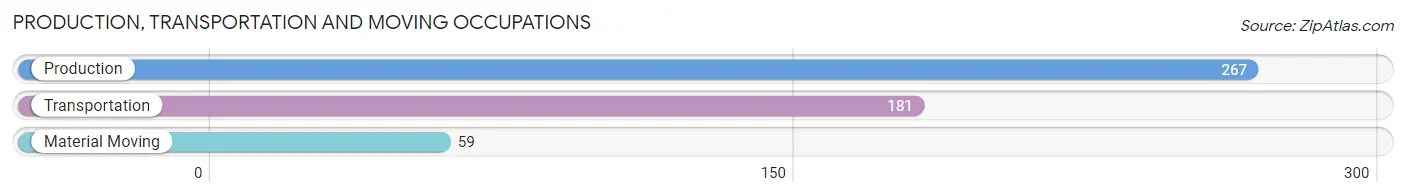
Production, Transportation and Moving Occupations
The most common Production, Transportation and Moving occupations in Silver City are Production (267 | 7.2%), Transportation (181 | 4.9%), and Material Moving (59 | 1.6%).
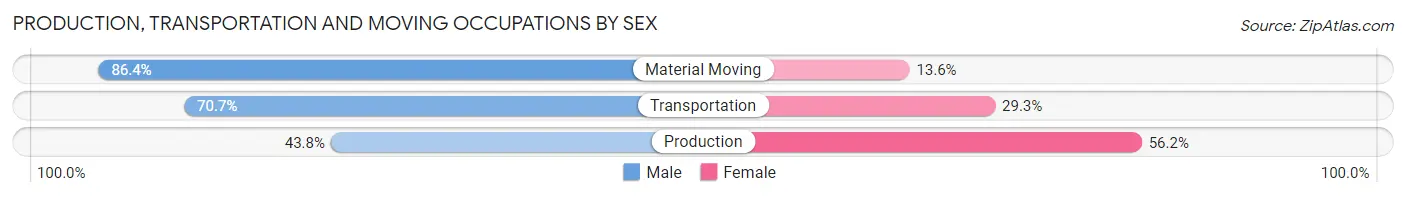
Production, Transportation and Moving Occupations by Sex
| Occupation | Male | Female |
| Production | 117 (43.8%) | 150 (56.2%) |
| Transportation | 128 (70.7%) | 53 (29.3%) |
| Material Moving | 51 (86.4%) | 8 (13.6%) |
| Total (Category) | 296 (58.4%) | 211 (41.6%) |
| Total (Overall) | 1,896 (51.2%) | 1,806 (48.8%) |
Employment Industries by Sex in Silver City
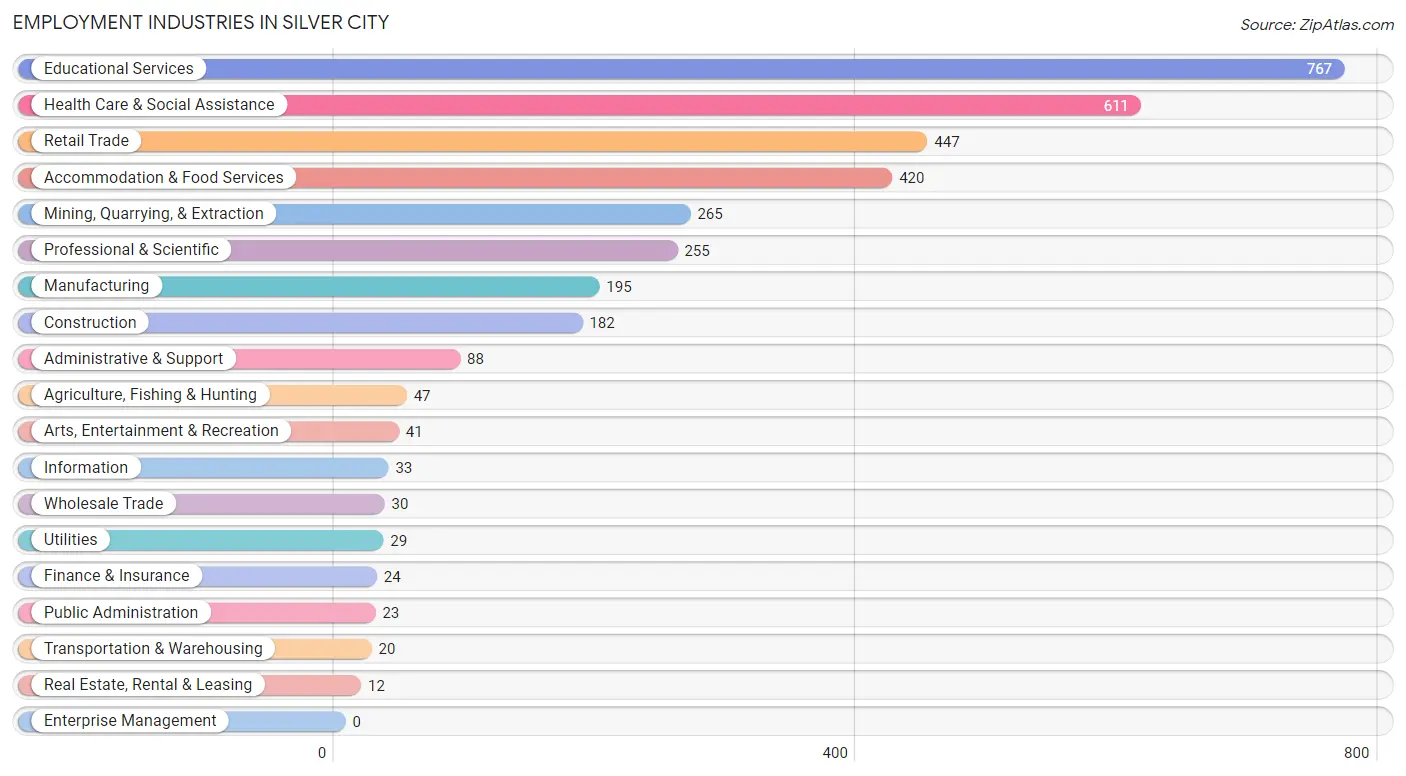
Employment Industries in Silver City
The major employment industries in Silver City include Educational Services (767 | 20.7%), Health Care & Social Assistance (611 | 16.5%), Retail Trade (447 | 12.1%), Accommodation & Food Services (420 | 11.4%), and Mining, Quarrying, & Extraction (265 | 7.2%).
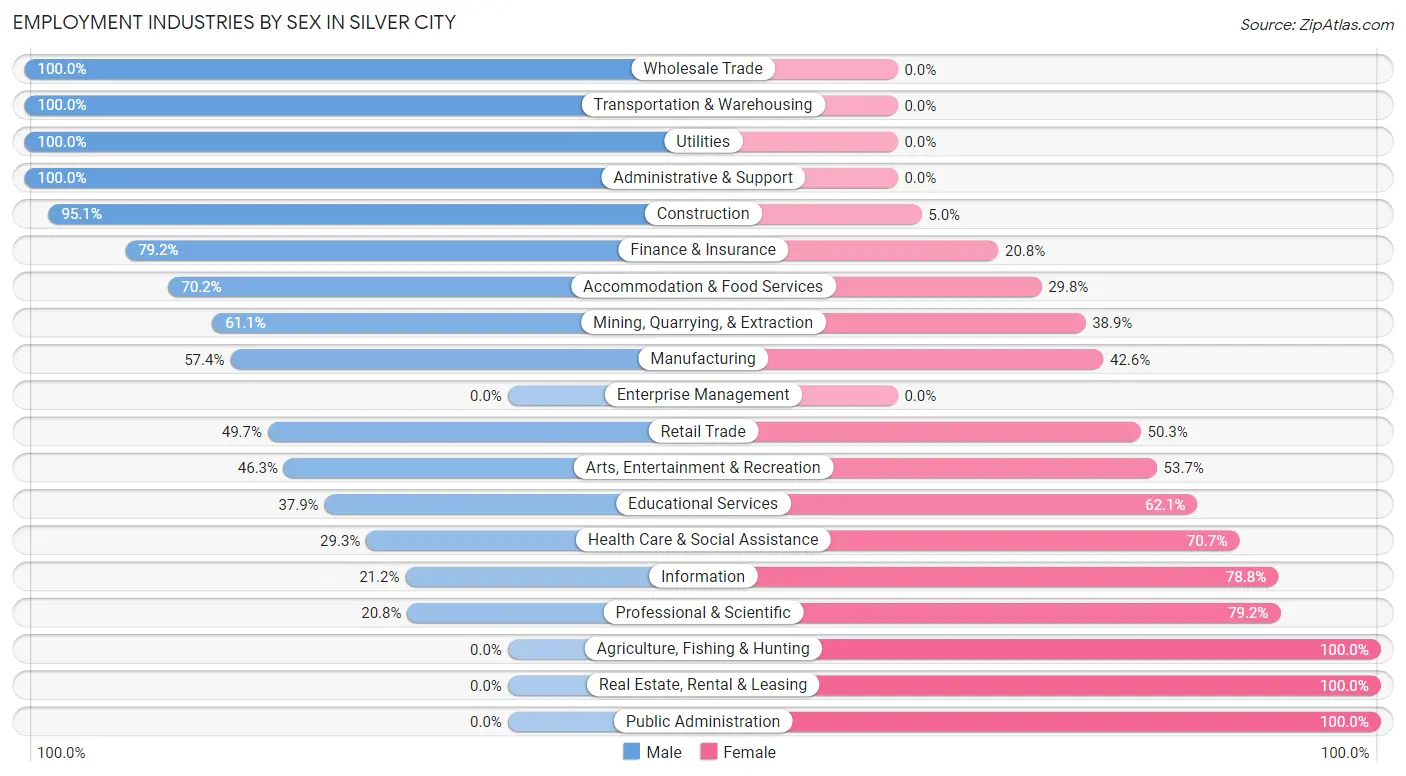
Employment Industries by Sex in Silver City
The Silver City industries that see more men than women are Wholesale Trade (100.0%), Transportation & Warehousing (100.0%), and Utilities (100.0%), whereas the industries that tend to have a higher number of women are Agriculture, Fishing & Hunting (100.0%), Real Estate, Rental & Leasing (100.0%), and Public Administration (100.0%).
| Industry | Male | Female |
| Agriculture, Fishing & Hunting | 0 (0.0%) | 47 (100.0%) |
| Mining, Quarrying, & Extraction | 162 (61.1%) | 103 (38.9%) |
| Construction | 173 (95.1%) | 9 (5.0%) |
| Manufacturing | 112 (57.4%) | 83 (42.6%) |
| Wholesale Trade | 30 (100.0%) | 0 (0.0%) |
| Retail Trade | 222 (49.7%) | 225 (50.3%) |
| Transportation & Warehousing | 20 (100.0%) | 0 (0.0%) |
| Utilities | 29 (100.0%) | 0 (0.0%) |
| Information | 7 (21.2%) | 26 (78.8%) |
| Finance & Insurance | 19 (79.2%) | 5 (20.8%) |
| Real Estate, Rental & Leasing | 0 (0.0%) | 12 (100.0%) |
| Professional & Scientific | 53 (20.8%) | 202 (79.2%) |
| Enterprise Management | 0 (0.0%) | 0 (0.0%) |
| Administrative & Support | 88 (100.0%) | 0 (0.0%) |
| Educational Services | 291 (37.9%) | 476 (62.1%) |
| Health Care & Social Assistance | 179 (29.3%) | 432 (70.7%) |
| Arts, Entertainment & Recreation | 19 (46.3%) | 22 (53.7%) |
| Accommodation & Food Services | 295 (70.2%) | 125 (29.8%) |
| Public Administration | 0 (0.0%) | 23 (100.0%) |
| Total | 1,896 (51.2%) | 1,806 (48.8%) |
Education in Silver City
School Enrollment in Silver City
The most common levels of schooling among the 2,665 students in Silver City are college / undergraduate (700 | 26.3%), elementary school (525 | 19.7%), and middle school (522 | 19.6%).
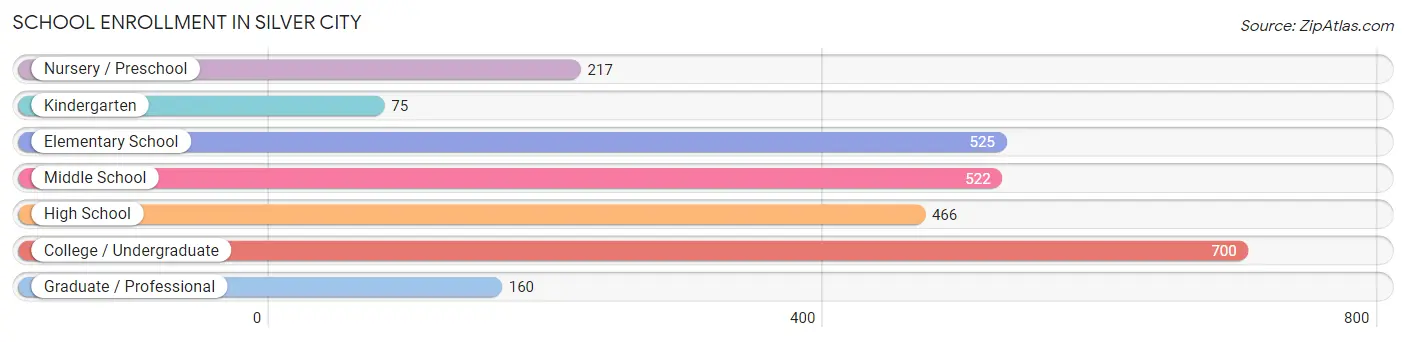
| School Level | # Students | % Students |
| Nursery / Preschool | 217 | 8.1% |
| Kindergarten | 75 | 2.8% |
| Elementary School | 525 | 19.7% |
| Middle School | 522 | 19.6% |
| High School | 466 | 17.5% |
| College / Undergraduate | 700 | 26.3% |
| Graduate / Professional | 160 | 6.0% |
| Total | 2,665 | 100.0% |
School Enrollment by Age by Funding Source in Silver City
Out of a total of 2,665 students who are enrolled in schools in Silver City, 288 (10.8%) attend a private institution, while the remaining 2,377 (89.2%) are enrolled in public schools. The age group of 25 to 34 year olds has the highest likelihood of being enrolled in private schools, with 75 (45.7% in the age bracket) enrolled. Conversely, the age group of 3 to 4 year olds has the lowest likelihood of being enrolled in a private school, with 217 (100.0% in the age bracket) attending a public institution.
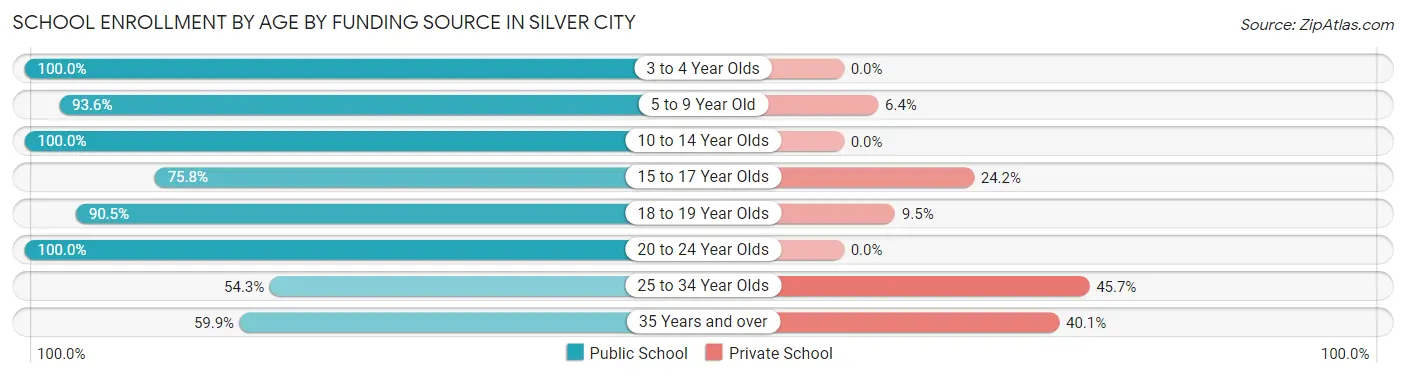
| Age Bracket | Public School | Private School |
| 3 to 4 Year Olds | 217 (100.0%) | 0 (0.0%) |
| 5 to 9 Year Old | 437 (93.6%) | 30 (6.4%) |
| 10 to 14 Year Olds | 712 (100.0%) | 0 (0.0%) |
| 15 to 17 Year Olds | 250 (75.8%) | 80 (24.2%) |
| 18 to 19 Year Olds | 294 (90.5%) | 31 (9.5%) |
| 20 to 24 Year Olds | 273 (100.0%) | 0 (0.0%) |
| 25 to 34 Year Olds | 89 (54.3%) | 75 (45.7%) |
| 35 Years and over | 106 (59.9%) | 71 (40.1%) |
| Total | 2,377 (89.2%) | 288 (10.8%) |
Educational Attainment by Field of Study in Silver City
Science & technology (290 | 14.3%), social sciences (234 | 11.5%), business (220 | 10.8%), education (198 | 9.8%), and arts & humanities (192 | 9.5%) are the most common fields of study among 2,027 individuals in Silver City who have obtained a bachelor's degree or higher.
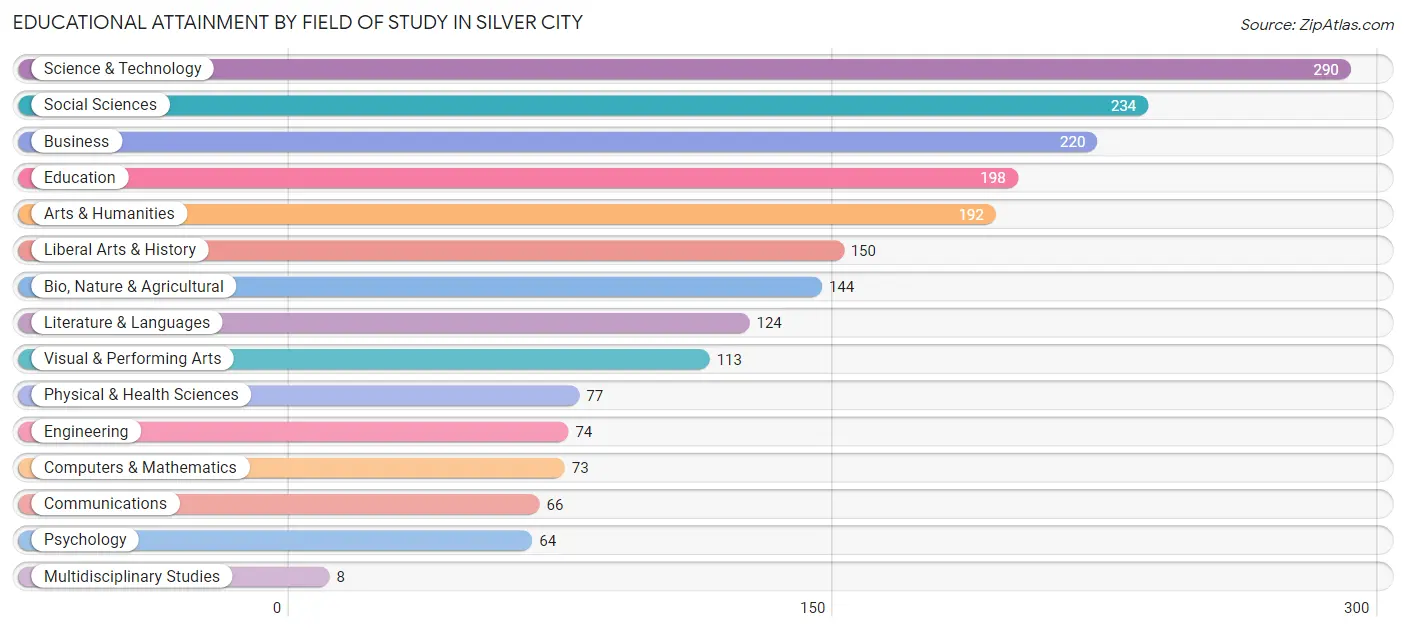
| Field of Study | # Graduates | % Graduates |
| Computers & Mathematics | 73 | 3.6% |
| Bio, Nature & Agricultural | 144 | 7.1% |
| Physical & Health Sciences | 77 | 3.8% |
| Psychology | 64 | 3.2% |
| Social Sciences | 234 | 11.5% |
| Engineering | 74 | 3.6% |
| Multidisciplinary Studies | 8 | 0.4% |
| Science & Technology | 290 | 14.3% |
| Business | 220 | 10.8% |
| Education | 198 | 9.8% |
| Literature & Languages | 124 | 6.1% |
| Liberal Arts & History | 150 | 7.4% |
| Visual & Performing Arts | 113 | 5.6% |
| Communications | 66 | 3.3% |
| Arts & Humanities | 192 | 9.5% |
| Total | 2,027 | 100.0% |
Transportation & Commute in Silver City
Vehicle Availability by Sex in Silver City
The most prevalent vehicle ownership categories in Silver City are males with 2 vehicles (609, accounting for 32.7%) and females with 2 vehicles (585, making up 35.2%).
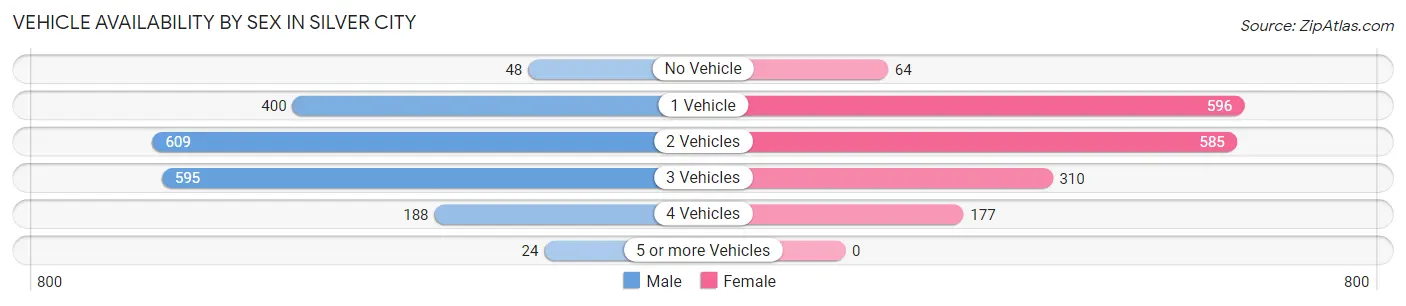
| Vehicles Available | Male | Female |
| No Vehicle | 48 (2.6%) | 64 (3.7%) |
| 1 Vehicle | 400 (21.5%) | 596 (34.4%) |
| 2 Vehicles | 609 (32.7%) | 585 (33.8%) |
| 3 Vehicles | 595 (31.9%) | 310 (17.9%) |
| 4 Vehicles | 188 (10.1%) | 177 (10.2%) |
| 5 or more Vehicles | 24 (1.3%) | 0 (0.0%) |
| Total | 1,864 (100.0%) | 1,732 (100.0%) |
Commute Time in Silver City
The most frequently occuring commute durations in Silver City are 10 to 14 minutes (1,112 commuters, 34.0%), 5 to 9 minutes (960 commuters, 29.4%), and 15 to 19 minutes (343 commuters, 10.5%).
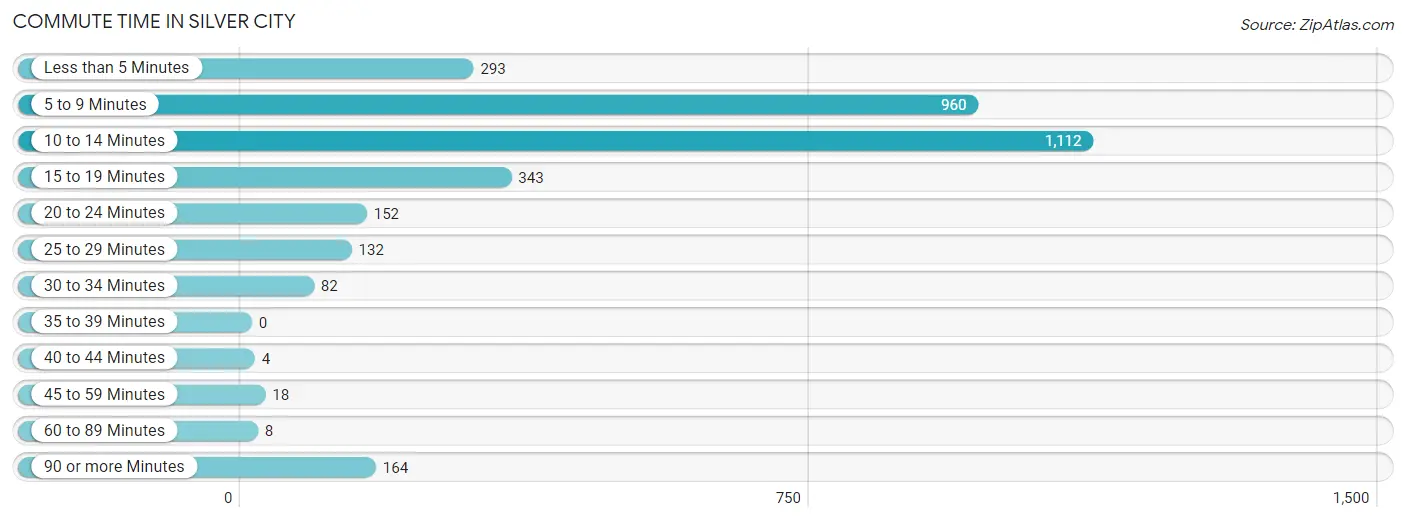
| Commute Time | # Commuters | % Commuters |
| Less than 5 Minutes | 293 | 9.0% |
| 5 to 9 Minutes | 960 | 29.4% |
| 10 to 14 Minutes | 1,112 | 34.0% |
| 15 to 19 Minutes | 343 | 10.5% |
| 20 to 24 Minutes | 152 | 4.6% |
| 25 to 29 Minutes | 132 | 4.0% |
| 30 to 34 Minutes | 82 | 2.5% |
| 35 to 39 Minutes | 0 | 0.0% |
| 40 to 44 Minutes | 4 | 0.1% |
| 45 to 59 Minutes | 18 | 0.5% |
| 60 to 89 Minutes | 8 | 0.2% |
| 90 or more Minutes | 164 | 5.0% |
Commute Time by Sex in Silver City
The most common commute times in Silver City are 5 to 9 minutes (392 commuters, 25.3%) for males and 10 to 14 minutes (722 commuters, 42.0%) for females.
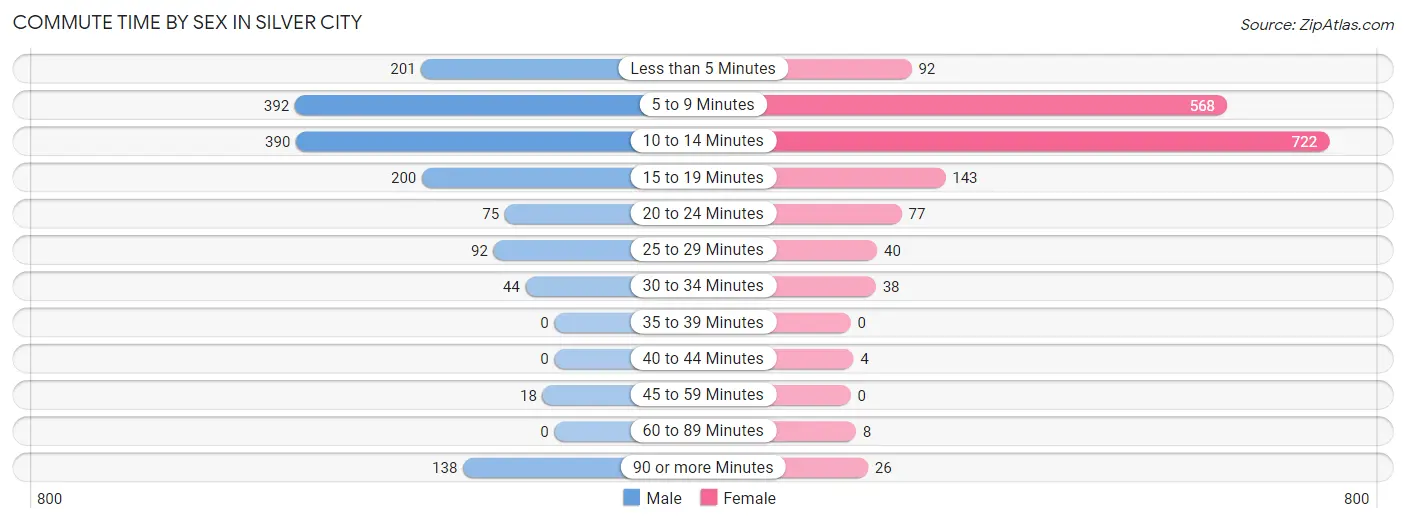
| Commute Time | Male | Female |
| Less than 5 Minutes | 201 (13.0%) | 92 (5.4%) |
| 5 to 9 Minutes | 392 (25.3%) | 568 (33.1%) |
| 10 to 14 Minutes | 390 (25.2%) | 722 (42.0%) |
| 15 to 19 Minutes | 200 (12.9%) | 143 (8.3%) |
| 20 to 24 Minutes | 75 (4.8%) | 77 (4.5%) |
| 25 to 29 Minutes | 92 (5.9%) | 40 (2.3%) |
| 30 to 34 Minutes | 44 (2.8%) | 38 (2.2%) |
| 35 to 39 Minutes | 0 (0.0%) | 0 (0.0%) |
| 40 to 44 Minutes | 0 (0.0%) | 4 (0.2%) |
| 45 to 59 Minutes | 18 (1.2%) | 0 (0.0%) |
| 60 to 89 Minutes | 0 (0.0%) | 8 (0.5%) |
| 90 or more Minutes | 138 (8.9%) | 26 (1.5%) |
Time of Departure to Work by Sex in Silver City
The most frequent times of departure to work in Silver City are 7:30 AM to 7:59 AM (278, 17.9%) for males and 8:00 AM to 8:29 AM (675, 39.3%) for females.
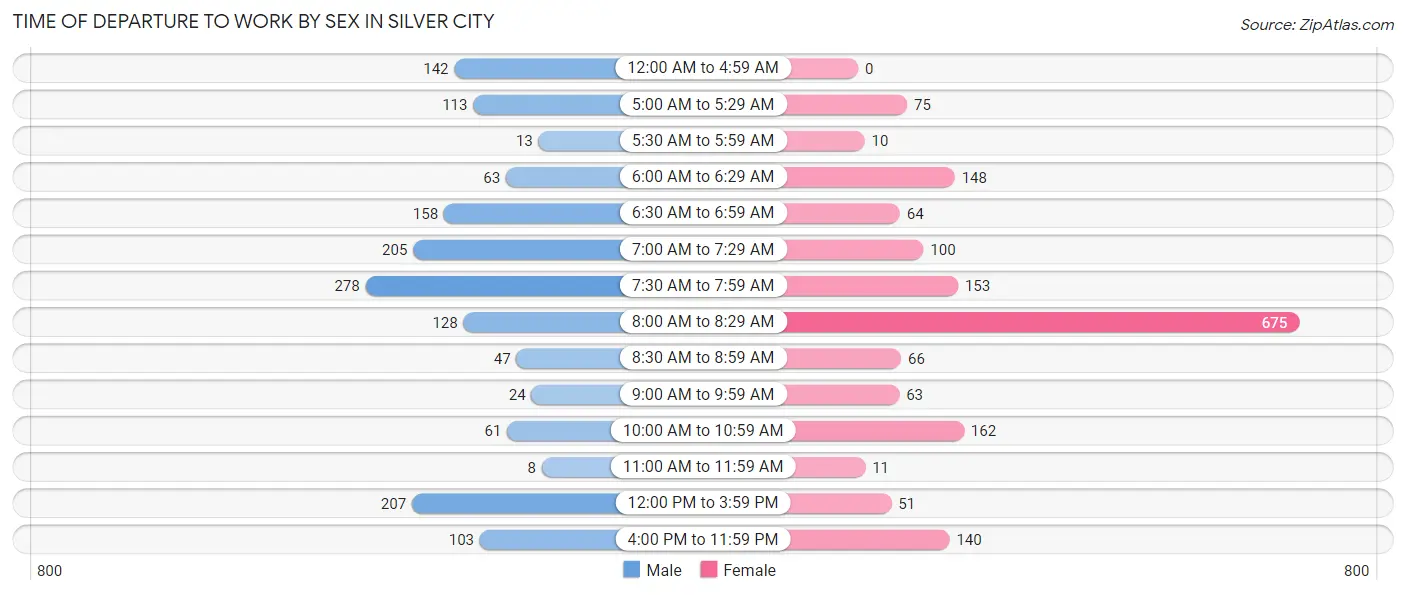
| Time of Departure | Male | Female |
| 12:00 AM to 4:59 AM | 142 (9.2%) | 0 (0.0%) |
| 5:00 AM to 5:29 AM | 113 (7.3%) | 75 (4.4%) |
| 5:30 AM to 5:59 AM | 13 (0.8%) | 10 (0.6%) |
| 6:00 AM to 6:29 AM | 63 (4.1%) | 148 (8.6%) |
| 6:30 AM to 6:59 AM | 158 (10.2%) | 64 (3.7%) |
| 7:00 AM to 7:29 AM | 205 (13.2%) | 100 (5.8%) |
| 7:30 AM to 7:59 AM | 278 (17.9%) | 153 (8.9%) |
| 8:00 AM to 8:29 AM | 128 (8.3%) | 675 (39.3%) |
| 8:30 AM to 8:59 AM | 47 (3.0%) | 66 (3.8%) |
| 9:00 AM to 9:59 AM | 24 (1.5%) | 63 (3.7%) |
| 10:00 AM to 10:59 AM | 61 (3.9%) | 162 (9.4%) |
| 11:00 AM to 11:59 AM | 8 (0.5%) | 11 (0.6%) |
| 12:00 PM to 3:59 PM | 207 (13.4%) | 51 (3.0%) |
| 4:00 PM to 11:59 PM | 103 (6.7%) | 140 (8.2%) |
| Total | 1,550 (100.0%) | 1,718 (100.0%) |
Housing Occupancy in Silver City
Occupancy by Ownership in Silver City
Of the total 3,724 dwellings in Silver City, owner-occupied units account for 1,952 (52.4%), while renter-occupied units make up 1,772 (47.6%).
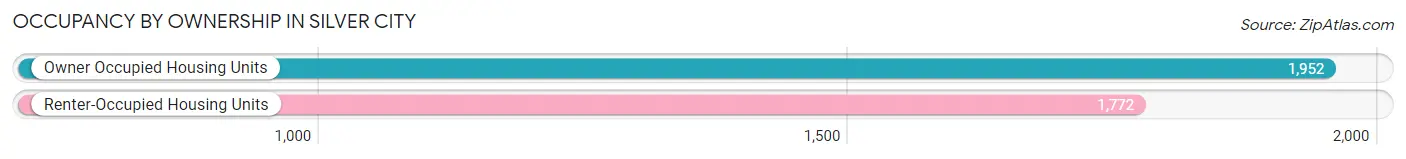
| Occupancy | # Housing Units | % Housing Units |
| Owner Occupied Housing Units | 1,952 | 52.4% |
| Renter-Occupied Housing Units | 1,772 | 47.6% |
| Total Occupied Housing Units | 3,724 | 100.0% |
Occupancy by Household Size in Silver City
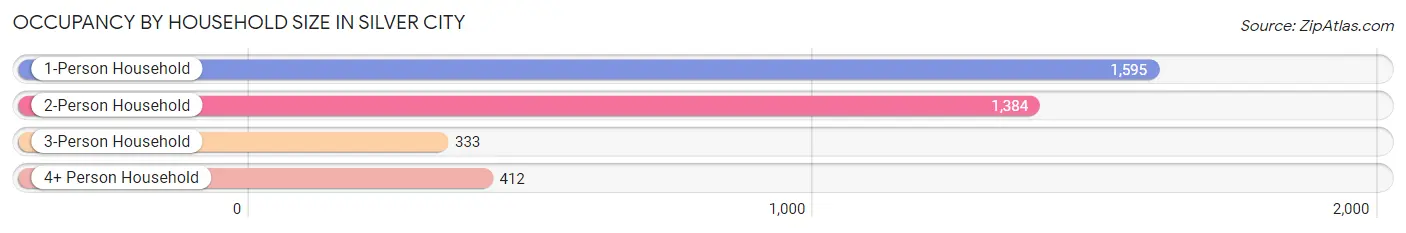
| Household Size | # Housing Units | % Housing Units |
| 1-Person Household | 1,595 | 42.8% |
| 2-Person Household | 1,384 | 37.2% |
| 3-Person Household | 333 | 8.9% |
| 4+ Person Household | 412 | 11.1% |
| Total Housing Units | 3,724 | 100.0% |
Occupancy by Ownership by Household Size in Silver City
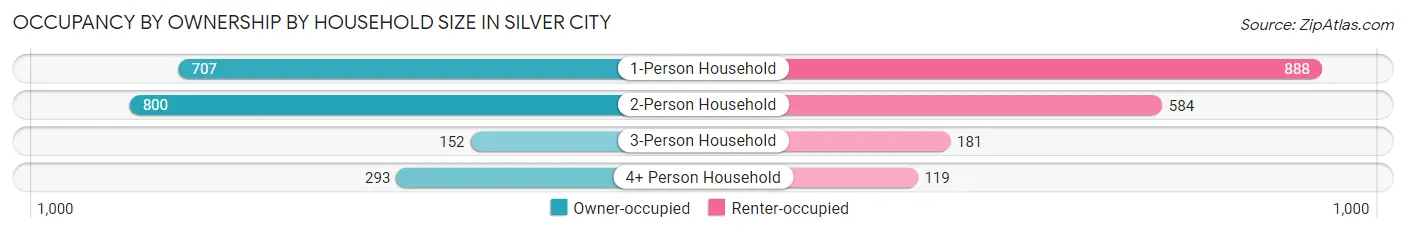
| Household Size | Owner-occupied | Renter-occupied |
| 1-Person Household | 707 (44.3%) | 888 (55.7%) |
| 2-Person Household | 800 (57.8%) | 584 (42.2%) |
| 3-Person Household | 152 (45.7%) | 181 (54.3%) |
| 4+ Person Household | 293 (71.1%) | 119 (28.9%) |
| Total Housing Units | 1,952 (52.4%) | 1,772 (47.6%) |
Occupancy by Educational Attainment in Silver City
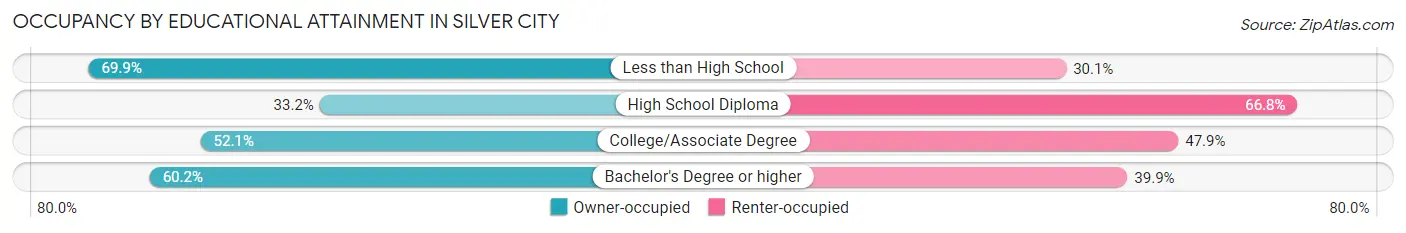
| Household Size | Owner-occupied | Renter-occupied |
| Less than High School | 197 (69.9%) | 85 (30.1%) |
| High School Diploma | 250 (33.2%) | 503 (66.8%) |
| College/Associate Degree | 726 (52.1%) | 668 (47.9%) |
| Bachelor's Degree or higher | 779 (60.2%) | 516 (39.9%) |
Occupancy by Age of Householder in Silver City
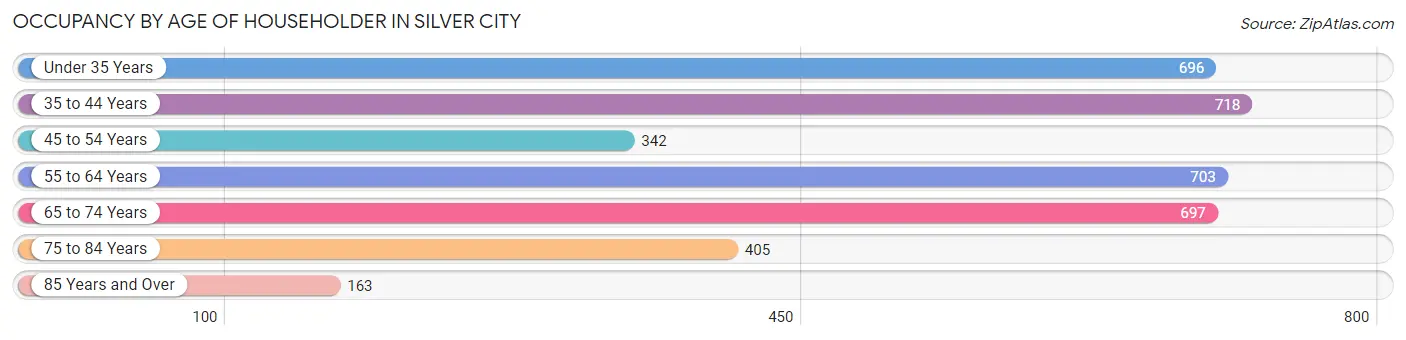
| Age Bracket | # Households | % Households |
| Under 35 Years | 696 | 18.7% |
| 35 to 44 Years | 718 | 19.3% |
| 45 to 54 Years | 342 | 9.2% |
| 55 to 64 Years | 703 | 18.9% |
| 65 to 74 Years | 697 | 18.7% |
| 75 to 84 Years | 405 | 10.9% |
| 85 Years and Over | 163 | 4.4% |
| Total | 3,724 | 100.0% |
Housing Finances in Silver City
Median Income by Occupancy in Silver City
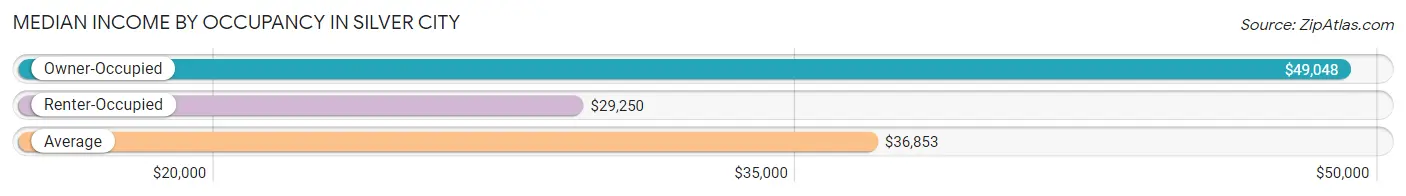
| Occupancy Type | # Households | Median Income |
| Owner-Occupied | 1,952 (52.4%) | $49,048 |
| Renter-Occupied | 1,772 (47.6%) | $29,250 |
| Average | 3,724 (100.0%) | $36,853 |
Occupancy by Householder Income Bracket in Silver City
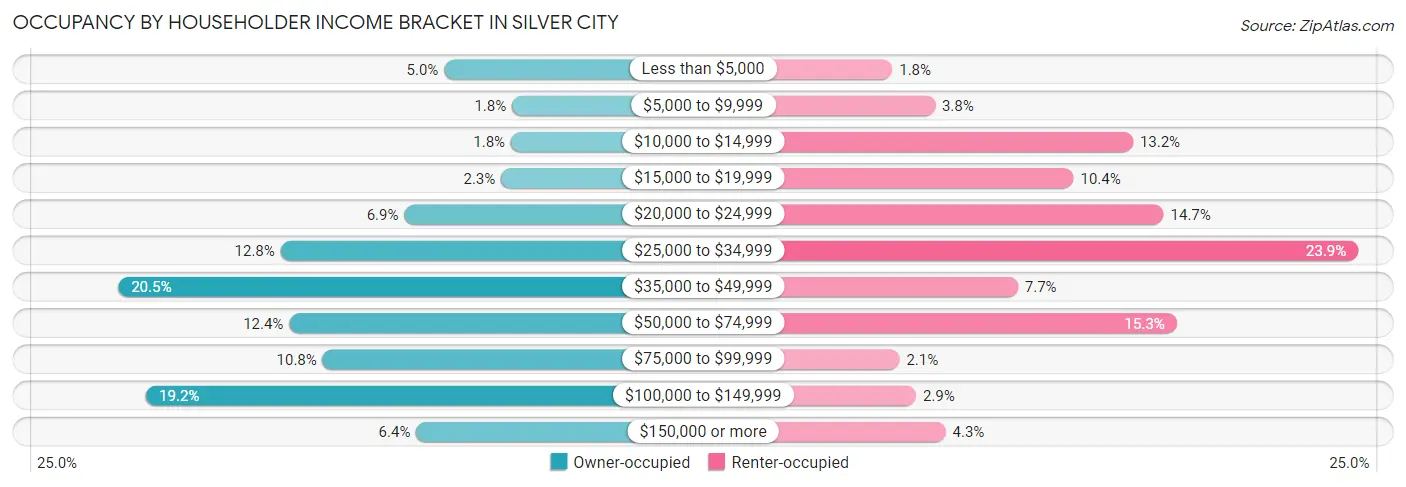
| Income Bracket | Owner-occupied | Renter-occupied |
| Less than $5,000 | 98 (5.0%) | 31 (1.8%) |
| $5,000 to $9,999 | 35 (1.8%) | 67 (3.8%) |
| $10,000 to $14,999 | 36 (1.8%) | 234 (13.2%) |
| $15,000 to $19,999 | 45 (2.3%) | 184 (10.4%) |
| $20,000 to $24,999 | 135 (6.9%) | 260 (14.7%) |
| $25,000 to $34,999 | 250 (12.8%) | 424 (23.9%) |
| $35,000 to $49,999 | 401 (20.5%) | 137 (7.7%) |
| $50,000 to $74,999 | 242 (12.4%) | 271 (15.3%) |
| $75,000 to $99,999 | 211 (10.8%) | 37 (2.1%) |
| $100,000 to $149,999 | 375 (19.2%) | 51 (2.9%) |
| $150,000 or more | 124 (6.4%) | 76 (4.3%) |
| Total | 1,952 (100.0%) | 1,772 (100.0%) |
Monthly Housing Cost Tiers in Silver City
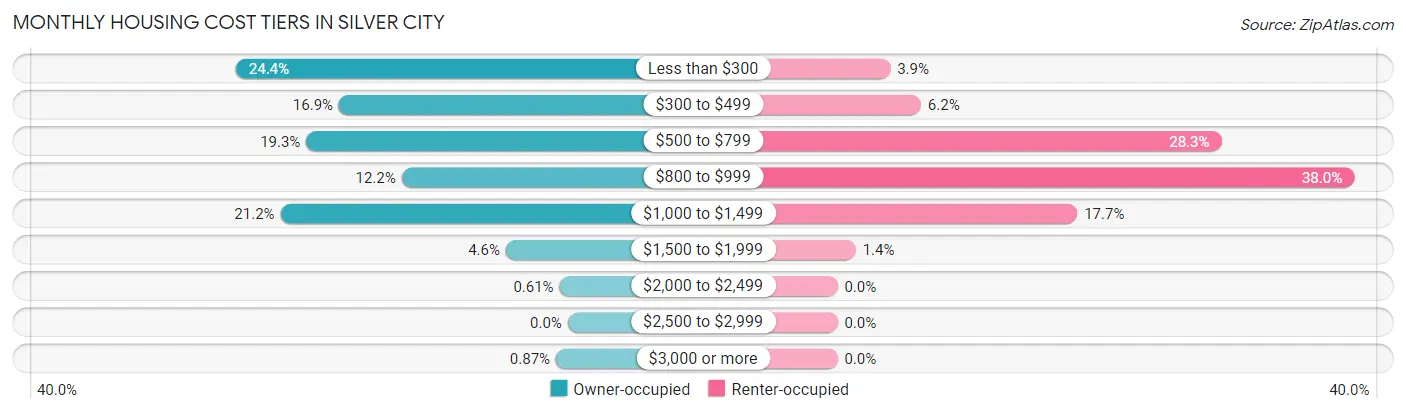
| Monthly Cost | Owner-occupied | Renter-occupied |
| Less than $300 | 477 (24.4%) | 69 (3.9%) |
| $300 to $499 | 329 (16.9%) | 109 (6.1%) |
| $500 to $799 | 376 (19.3%) | 501 (28.3%) |
| $800 to $999 | 239 (12.2%) | 674 (38.0%) |
| $1,000 to $1,499 | 413 (21.2%) | 313 (17.7%) |
| $1,500 to $1,999 | 89 (4.6%) | 24 (1.3%) |
| $2,000 to $2,499 | 12 (0.6%) | 0 (0.0%) |
| $2,500 to $2,999 | 0 (0.0%) | 0 (0.0%) |
| $3,000 or more | 17 (0.9%) | 0 (0.0%) |
| Total | 1,952 (100.0%) | 1,772 (100.0%) |
Physical Housing Characteristics in Silver City
Housing Structures in Silver City
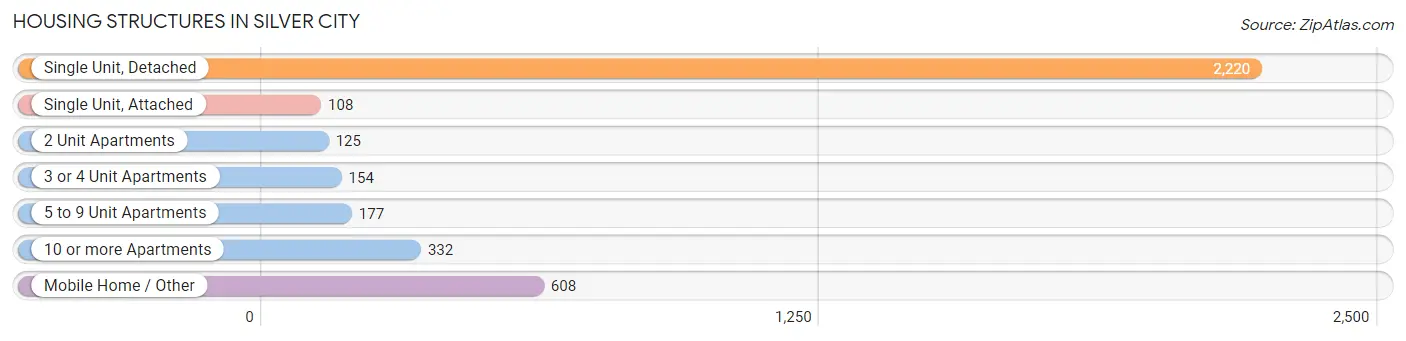
| Structure Type | # Housing Units | % Housing Units |
| Single Unit, Detached | 2,220 | 59.6% |
| Single Unit, Attached | 108 | 2.9% |
| 2 Unit Apartments | 125 | 3.4% |
| 3 or 4 Unit Apartments | 154 | 4.1% |
| 5 to 9 Unit Apartments | 177 | 4.8% |
| 10 or more Apartments | 332 | 8.9% |
| Mobile Home / Other | 608 | 16.3% |
| Total | 3,724 | 100.0% |
Housing Structures by Occupancy in Silver City
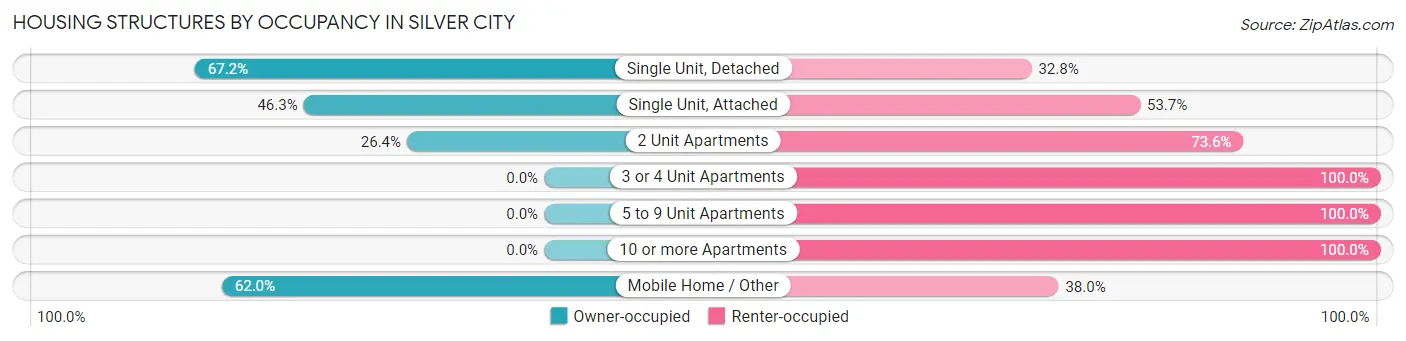
| Structure Type | Owner-occupied | Renter-occupied |
| Single Unit, Detached | 1,492 (67.2%) | 728 (32.8%) |
| Single Unit, Attached | 50 (46.3%) | 58 (53.7%) |
| 2 Unit Apartments | 33 (26.4%) | 92 (73.6%) |
| 3 or 4 Unit Apartments | 0 (0.0%) | 154 (100.0%) |
| 5 to 9 Unit Apartments | 0 (0.0%) | 177 (100.0%) |
| 10 or more Apartments | 0 (0.0%) | 332 (100.0%) |
| Mobile Home / Other | 377 (62.0%) | 231 (38.0%) |
| Total | 1,952 (52.4%) | 1,772 (47.6%) |
Housing Structures by Number of Rooms in Silver City
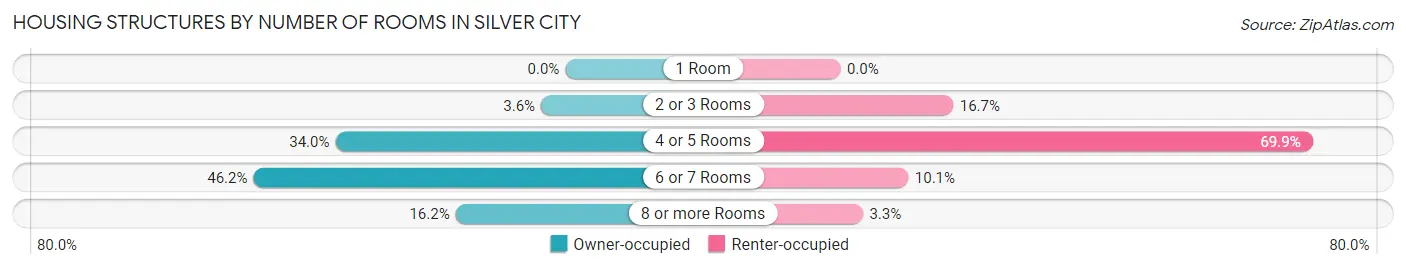
| Number of Rooms | Owner-occupied | Renter-occupied |
| 1 Room | 0 (0.0%) | 0 (0.0%) |
| 2 or 3 Rooms | 70 (3.6%) | 296 (16.7%) |
| 4 or 5 Rooms | 664 (34.0%) | 1,239 (69.9%) |
| 6 or 7 Rooms | 901 (46.2%) | 178 (10.1%) |
| 8 or more Rooms | 317 (16.2%) | 59 (3.3%) |
| Total | 1,952 (100.0%) | 1,772 (100.0%) |
Housing Structure by Heating Type in Silver City
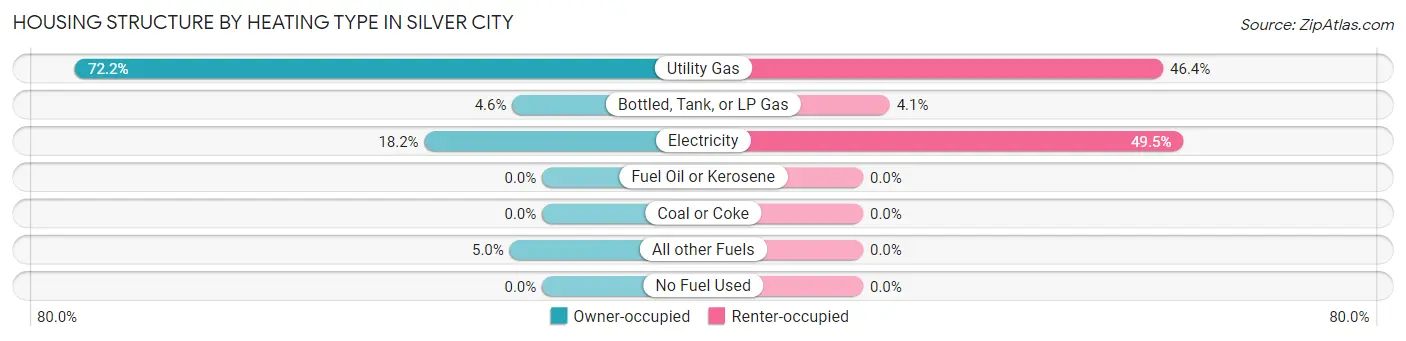
| Heating Type | Owner-occupied | Renter-occupied |
| Utility Gas | 1,409 (72.2%) | 822 (46.4%) |
| Bottled, Tank, or LP Gas | 90 (4.6%) | 73 (4.1%) |
| Electricity | 355 (18.2%) | 877 (49.5%) |
| Fuel Oil or Kerosene | 0 (0.0%) | 0 (0.0%) |
| Coal or Coke | 0 (0.0%) | 0 (0.0%) |
| All other Fuels | 98 (5.0%) | 0 (0.0%) |
| No Fuel Used | 0 (0.0%) | 0 (0.0%) |
| Total | 1,952 (100.0%) | 1,772 (100.0%) |
Household Vehicle Usage in Silver City
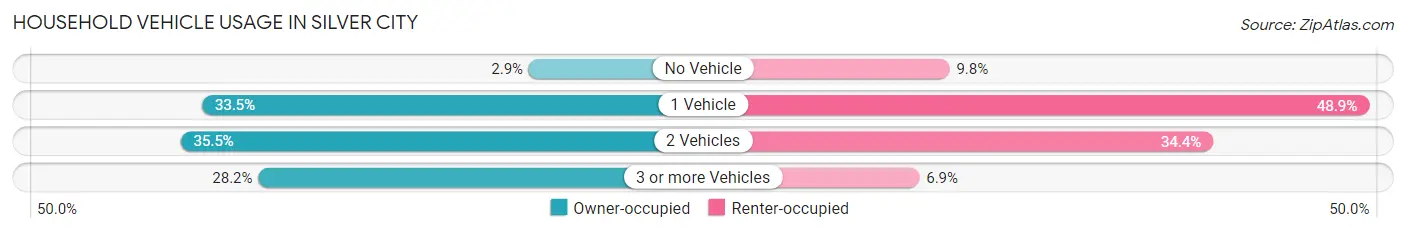
| Vehicles per Household | Owner-occupied | Renter-occupied |
| No Vehicle | 57 (2.9%) | 173 (9.8%) |
| 1 Vehicle | 653 (33.5%) | 867 (48.9%) |
| 2 Vehicles | 692 (35.4%) | 609 (34.4%) |
| 3 or more Vehicles | 550 (28.2%) | 123 (6.9%) |
| Total | 1,952 (100.0%) | 1,772 (100.0%) |
Real Estate & Mortgages in Silver City
Real Estate and Mortgage Overview in Silver City
| Characteristic | Without Mortgage | With Mortgage |
| Housing Units | 1,017 | 935 |
| Median Property Value | $163,000 | $136,500 |
| Median Household Income | $46,472 | $64 |
| Monthly Housing Costs | $312 | $17 |
| Real Estate Taxes | $829 | $67 |
Property Value by Mortgage Status in Silver City
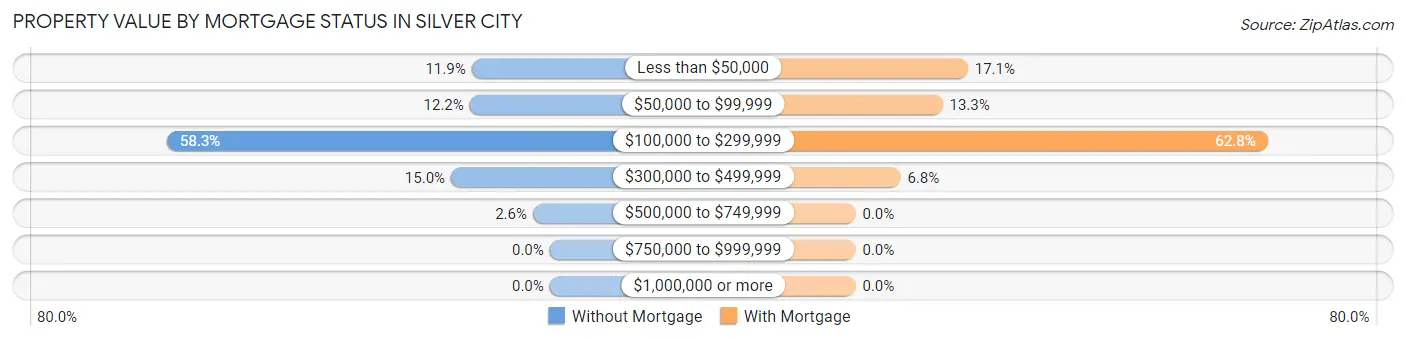
| Property Value | Without Mortgage | With Mortgage |
| Less than $50,000 | 121 (11.9%) | 160 (17.1%) |
| $50,000 to $99,999 | 124 (12.2%) | 124 (13.3%) |
| $100,000 to $299,999 | 593 (58.3%) | 587 (62.8%) |
| $300,000 to $499,999 | 153 (15.0%) | 64 (6.8%) |
| $500,000 to $749,999 | 26 (2.6%) | 0 (0.0%) |
| $750,000 to $999,999 | 0 (0.0%) | 0 (0.0%) |
| $1,000,000 or more | 0 (0.0%) | 0 (0.0%) |
| Total | 1,017 (100.0%) | 935 (100.0%) |
Household Income by Mortgage Status in Silver City
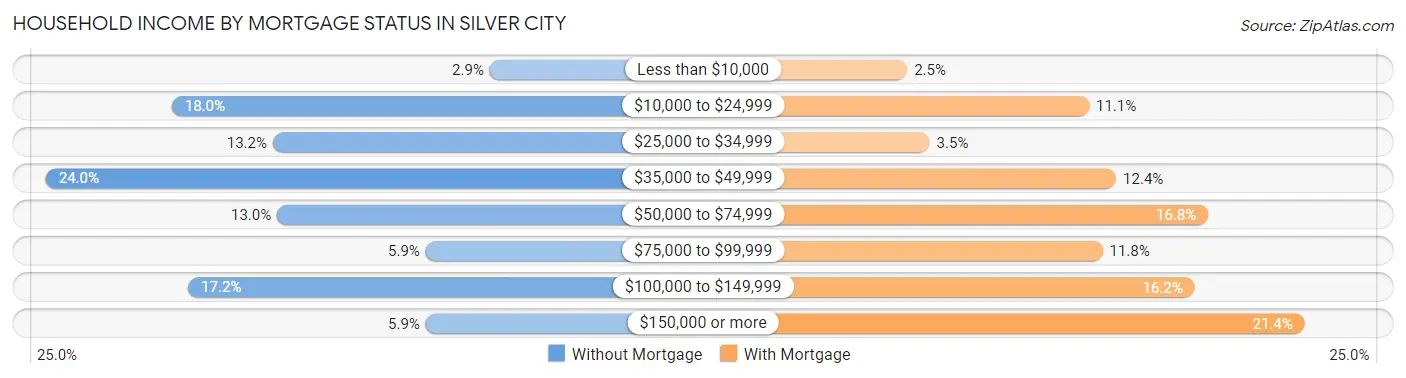
| Household Income | Without Mortgage | With Mortgage |
| Less than $10,000 | 29 (2.9%) | 23 (2.5%) |
| $10,000 to $24,999 | 183 (18.0%) | 104 (11.1%) |
| $25,000 to $34,999 | 134 (13.2%) | 33 (3.5%) |
| $35,000 to $49,999 | 244 (24.0%) | 116 (12.4%) |
| $50,000 to $74,999 | 132 (13.0%) | 157 (16.8%) |
| $75,000 to $99,999 | 60 (5.9%) | 110 (11.8%) |
| $100,000 to $149,999 | 175 (17.2%) | 151 (16.2%) |
| $150,000 or more | 60 (5.9%) | 200 (21.4%) |
| Total | 1,017 (100.0%) | 935 (100.0%) |
Property Value to Household Income Ratio in Silver City
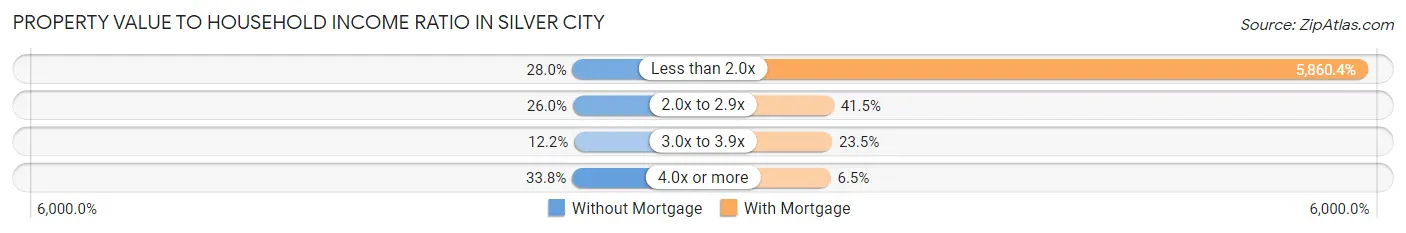
| Value-to-Income Ratio | Without Mortgage | With Mortgage |
| Less than 2.0x | 285 (28.0%) | 54,795 (5,860.4%) |
| 2.0x to 2.9x | 264 (26.0%) | 388 (41.5%) |
| 3.0x to 3.9x | 124 (12.2%) | 220 (23.5%) |
| 4.0x or more | 344 (33.8%) | 61 (6.5%) |
| Total | 1,017 (100.0%) | 935 (100.0%) |
Real Estate Taxes by Mortgage Status in Silver City
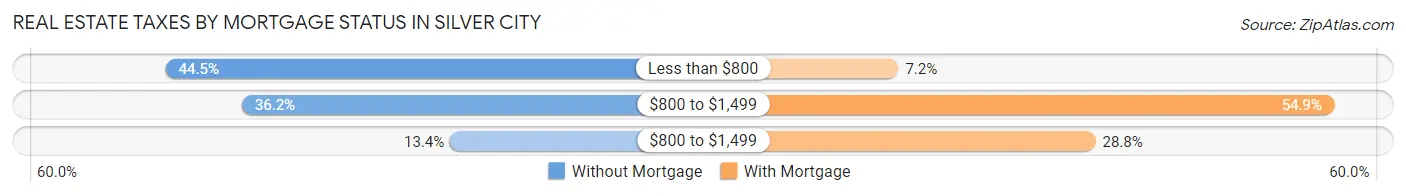
| Property Taxes | Without Mortgage | With Mortgage |
| Less than $800 | 453 (44.5%) | 67 (7.2%) |
| $800 to $1,499 | 368 (36.2%) | 513 (54.9%) |
| $800 to $1,499 | 136 (13.4%) | 269 (28.8%) |
| Total | 1,017 (100.0%) | 935 (100.0%) |
Health & Disability in Silver City
Health Insurance Coverage by Age in Silver City
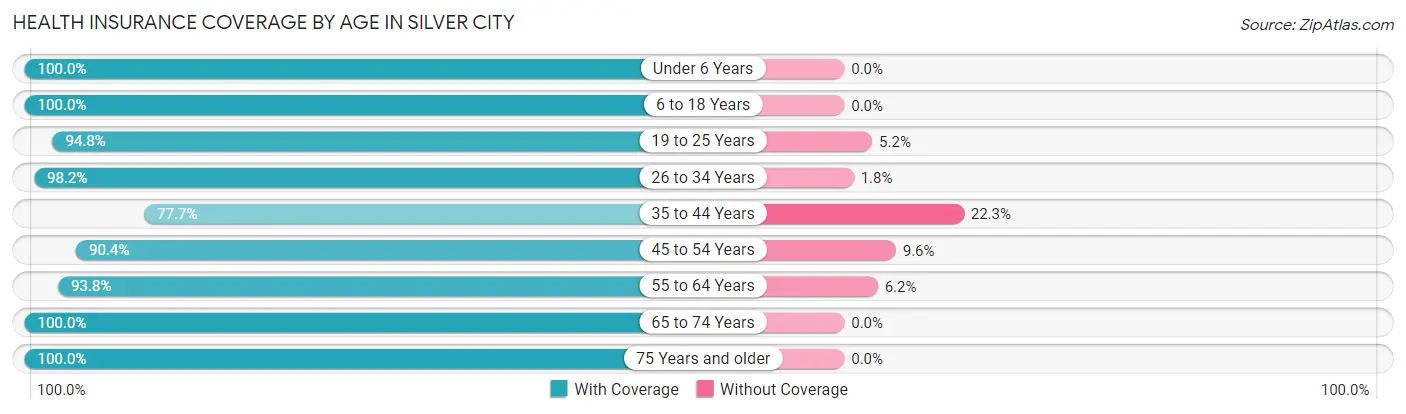
| Age Bracket | With Coverage | Without Coverage |
| Under 6 Years | 894 (100.0%) | 0 (0.0%) |
| 6 to 18 Years | 1,726 (100.0%) | 0 (0.0%) |
| 19 to 25 Years | 674 (94.8%) | 37 (5.2%) |
| 26 to 34 Years | 1,284 (98.2%) | 23 (1.8%) |
| 35 to 44 Years | 914 (77.7%) | 262 (22.3%) |
| 45 to 54 Years | 772 (90.4%) | 82 (9.6%) |
| 55 to 64 Years | 767 (93.8%) | 51 (6.2%) |
| 65 to 74 Years | 1,243 (100.0%) | 0 (0.0%) |
| 75 Years and older | 797 (100.0%) | 0 (0.0%) |
| Total | 9,071 (95.2%) | 455 (4.8%) |
Health Insurance Coverage by Citizenship Status in Silver City
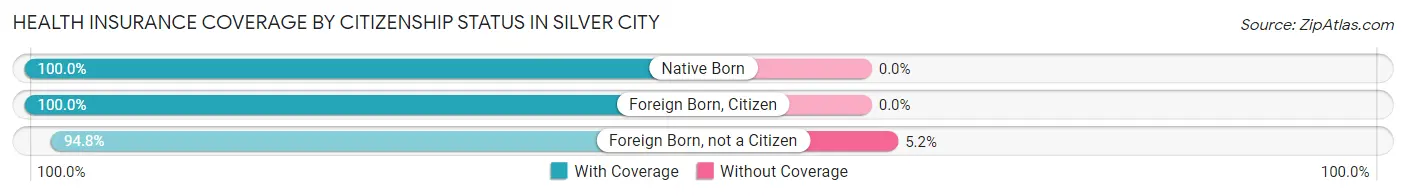
| Citizenship Status | With Coverage | Without Coverage |
| Native Born | 894 (100.0%) | 0 (0.0%) |
| Foreign Born, Citizen | 1,726 (100.0%) | 0 (0.0%) |
| Foreign Born, not a Citizen | 674 (94.8%) | 37 (5.2%) |
Health Insurance Coverage by Household Income in Silver City
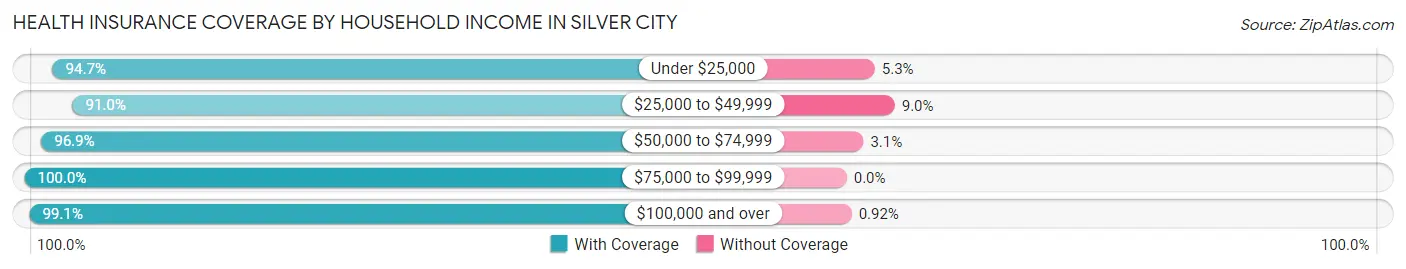
| Household Income | With Coverage | Without Coverage |
| Under $25,000 | 1,441 (94.7%) | 80 (5.3%) |
| $25,000 to $49,999 | 2,743 (91.0%) | 271 (9.0%) |
| $50,000 to $74,999 | 1,360 (96.9%) | 44 (3.1%) |
| $75,000 to $99,999 | 853 (100.0%) | 0 (0.0%) |
| $100,000 and over | 2,381 (99.1%) | 22 (0.9%) |
Public vs Private Health Insurance Coverage by Age in Silver City
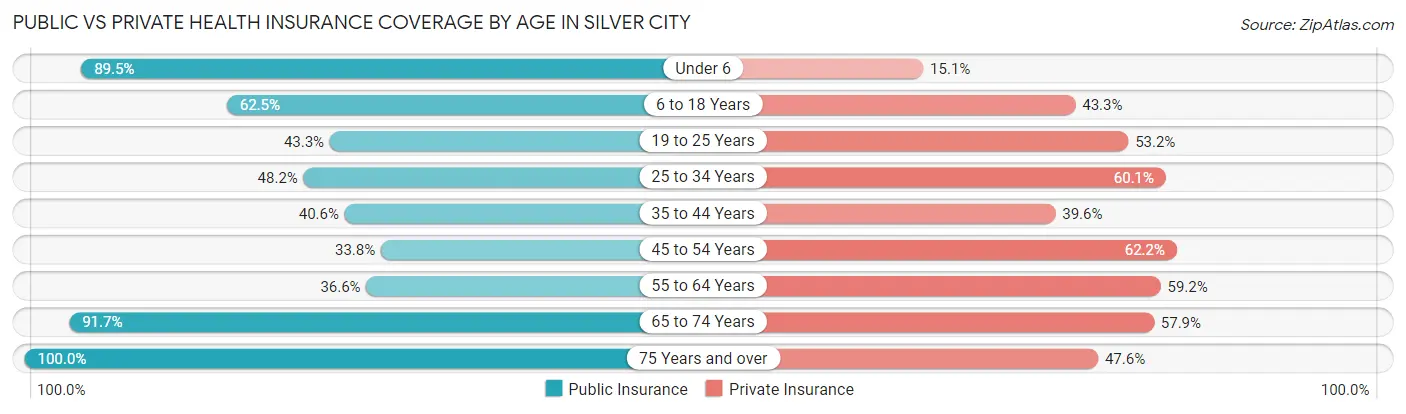
| Age Bracket | Public Insurance | Private Insurance |
| Under 6 | 800 (89.5%) | 135 (15.1%) |
| 6 to 18 Years | 1,078 (62.5%) | 748 (43.3%) |
| 19 to 25 Years | 308 (43.3%) | 378 (53.2%) |
| 25 to 34 Years | 630 (48.2%) | 786 (60.1%) |
| 35 to 44 Years | 477 (40.6%) | 466 (39.6%) |
| 45 to 54 Years | 289 (33.8%) | 531 (62.2%) |
| 55 to 64 Years | 299 (36.5%) | 484 (59.2%) |
| 65 to 74 Years | 1,140 (91.7%) | 720 (57.9%) |
| 75 Years and over | 797 (100.0%) | 379 (47.5%) |
| Total | 5,818 (61.1%) | 4,627 (48.6%) |
Disability Status by Sex by Age in Silver City
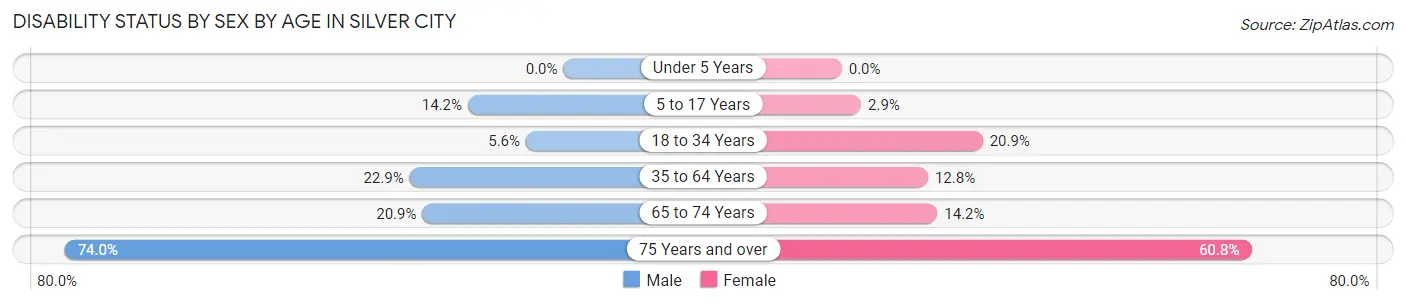
| Age Bracket | Male | Female |
| Under 5 Years | 0 (0.0%) | 0 (0.0%) |
| 5 to 17 Years | 119 (14.2%) | 23 (2.9%) |
| 18 to 34 Years | 56 (5.6%) | 251 (20.9%) |
| 35 to 64 Years | 308 (22.9%) | 192 (12.8%) |
| 65 to 74 Years | 129 (20.9%) | 89 (14.2%) |
| 75 Years and over | 271 (74.0%) | 262 (60.8%) |
Disability Class by Sex by Age in Silver City
Disability Class: Hearing Difficulty
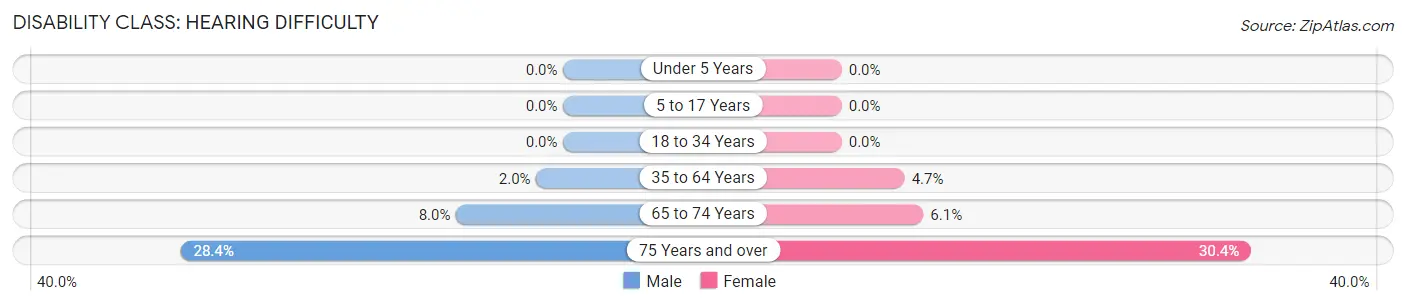
| Age Bracket | Male | Female |
| Under 5 Years | 0 (0.0%) | 0 (0.0%) |
| 5 to 17 Years | 0 (0.0%) | 0 (0.0%) |
| 18 to 34 Years | 0 (0.0%) | 0 (0.0%) |
| 35 to 64 Years | 27 (2.0%) | 70 (4.7%) |
| 65 to 74 Years | 49 (8.0%) | 38 (6.1%) |
| 75 Years and over | 104 (28.4%) | 131 (30.4%) |
Disability Class: Vision Difficulty
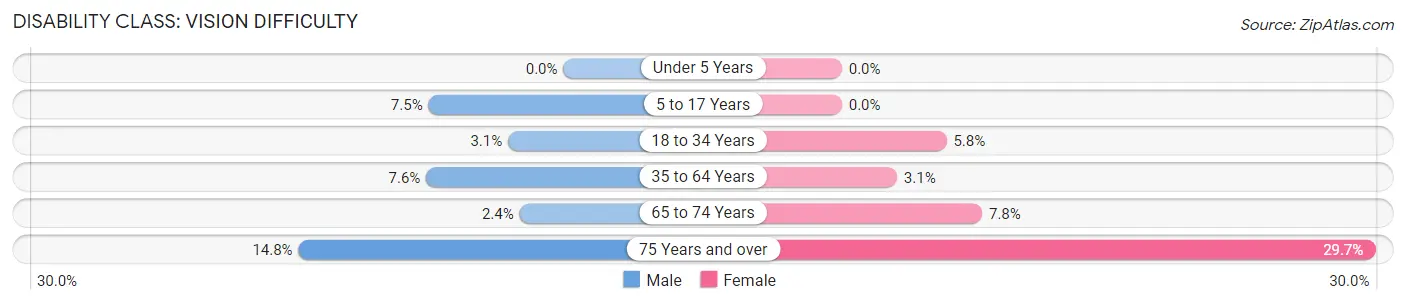
| Age Bracket | Male | Female |
| Under 5 Years | 0 (0.0%) | 0 (0.0%) |
| 5 to 17 Years | 63 (7.5%) | 0 (0.0%) |
| 18 to 34 Years | 31 (3.1%) | 70 (5.8%) |
| 35 to 64 Years | 103 (7.6%) | 46 (3.1%) |
| 65 to 74 Years | 15 (2.4%) | 49 (7.8%) |
| 75 Years and over | 54 (14.7%) | 128 (29.7%) |
Disability Class: Cognitive Difficulty
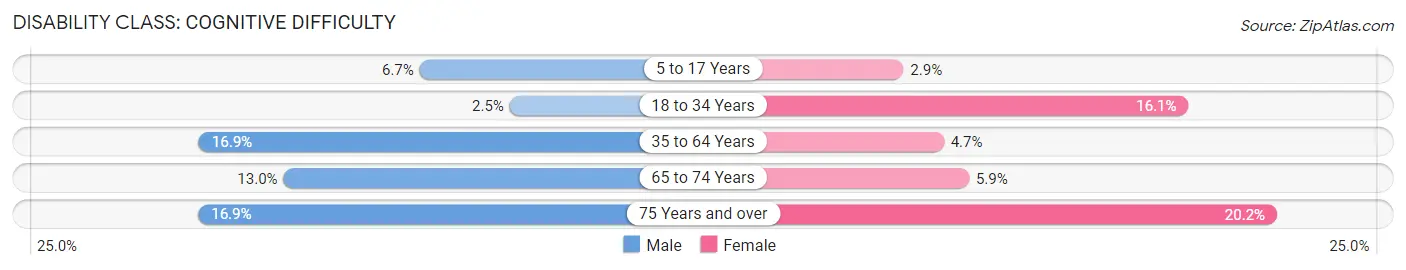
| Age Bracket | Male | Female |
| 5 to 17 Years | 56 (6.7%) | 23 (2.9%) |
| 18 to 34 Years | 25 (2.5%) | 193 (16.1%) |
| 35 to 64 Years | 228 (16.9%) | 71 (4.7%) |
| 65 to 74 Years | 80 (13.0%) | 37 (5.9%) |
| 75 Years and over | 62 (16.9%) | 87 (20.2%) |
Disability Class: Ambulatory Difficulty
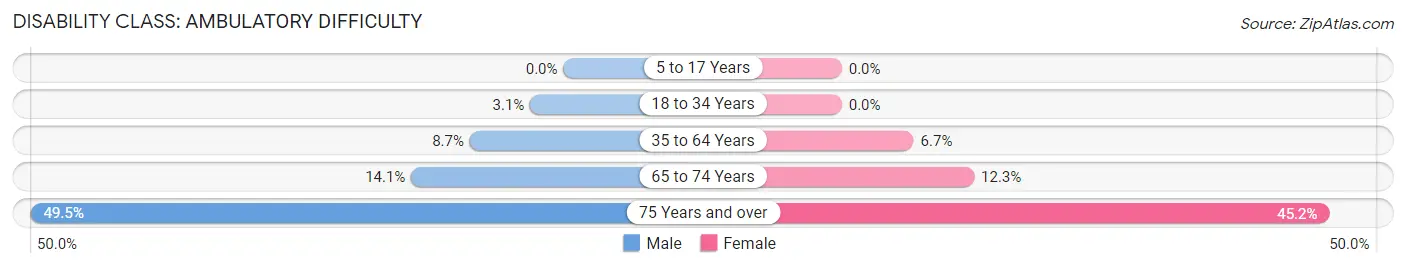
| Age Bracket | Male | Female |
| 5 to 17 Years | 0 (0.0%) | 0 (0.0%) |
| 18 to 34 Years | 31 (3.1%) | 0 (0.0%) |
| 35 to 64 Years | 117 (8.7%) | 100 (6.7%) |
| 65 to 74 Years | 87 (14.1%) | 77 (12.3%) |
| 75 Years and over | 181 (49.4%) | 195 (45.2%) |
Disability Class: Self-Care Difficulty
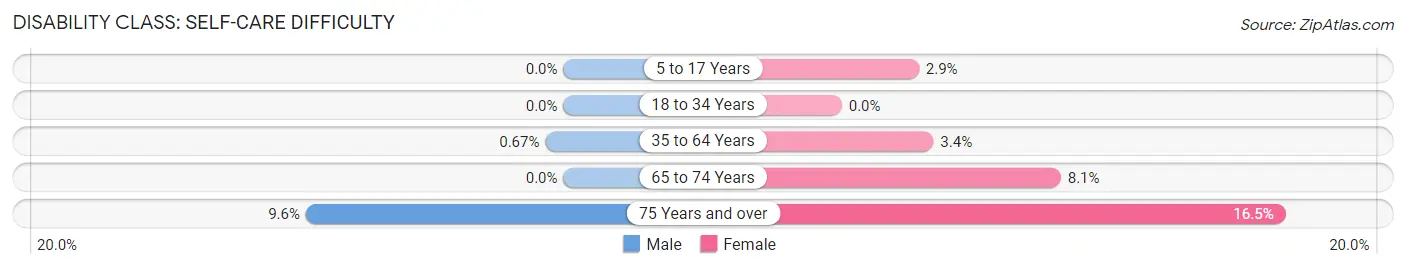
| Age Bracket | Male | Female |
| 5 to 17 Years | 0 (0.0%) | 23 (2.9%) |
| 18 to 34 Years | 0 (0.0%) | 0 (0.0%) |
| 35 to 64 Years | 9 (0.7%) | 51 (3.4%) |
| 65 to 74 Years | 0 (0.0%) | 51 (8.1%) |
| 75 Years and over | 35 (9.6%) | 71 (16.5%) |
Technology Access in Silver City
Computing Device Access in Silver City
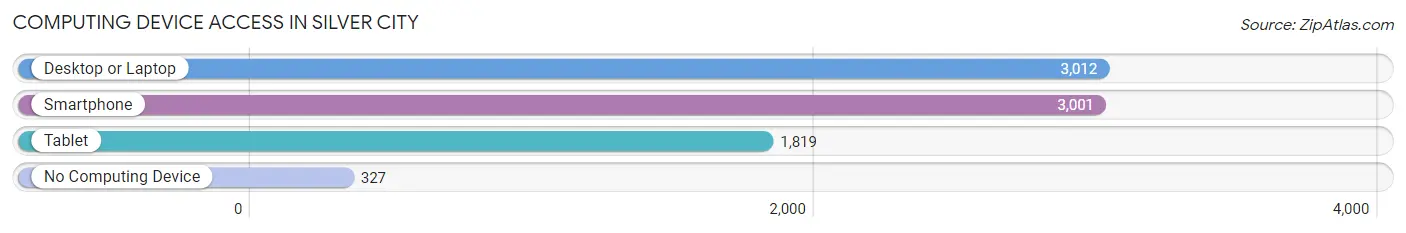
| Device Type | # Households | % Households |
| Desktop or Laptop | 3,012 | 80.9% |
| Smartphone | 3,001 | 80.6% |
| Tablet | 1,819 | 48.8% |
| No Computing Device | 327 | 8.8% |
| Total | 3,724 | 100.0% |
Internet Access in Silver City
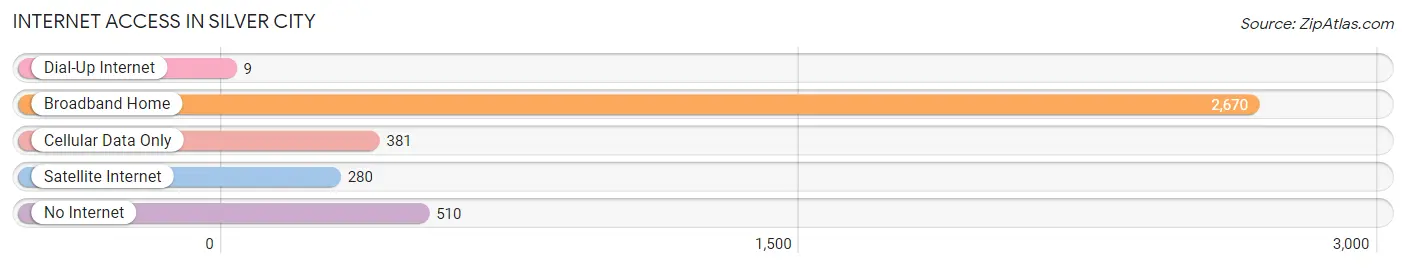
| Internet Type | # Households | % Households |
| Dial-Up Internet | 9 | 0.2% |
| Broadband Home | 2,670 | 71.7% |
| Cellular Data Only | 381 | 10.2% |
| Satellite Internet | 280 | 7.5% |
| No Internet | 510 | 13.7% |
| Total | 3,724 | 100.0% |
Silver City Summary
Silver City is a town located in Grant County, New Mexico, United States. It is the county seat and the largest town in the county. The population was 10,315 at the 2010 census. Silver City is located in the southwestern corner of New Mexico, near the Arizona border. It is the principal city of the Silver City Micropolitan Statistical Area, which includes all of Grant County.
Geography
Silver City is located in the southwestern corner of New Mexico, near the Arizona border. It is situated in the Gila National Forest, at an elevation of 5,906 feet (1,800 m). The town is located in the Upper Gila River Valley, surrounded by the Gila National Forest and the Gila Wilderness. The Gila River runs through the town, and the Mimbres River is nearby.
The town is located in a semi-arid climate, with hot summers and mild winters. The average annual precipitation is 12.7 inches (323 mm).
History
Silver City was founded in 1870, when silver was discovered in the area. The town quickly grew, and by 1880 it had a population of over 5,000. The town was incorporated in 1885.
Silver City was a major mining center in the late 19th and early 20th centuries. The town was home to several large mines, including the Chloride, the Silver City, and the Silver King. The mines produced silver, lead, and zinc.
The town was also home to several smelters, which processed the ore from the mines. The smelters produced lead, zinc, and copper.
The town's economy declined in the mid-20th century, as the mines closed and the smelters moved away. The town's population declined, and by the 1970s it had fallen to just over 5,000.
Economy
Silver City's economy is largely based on tourism and services. The town is a popular destination for outdoor recreation, and it is home to several state parks and national monuments. The town is also home to Western New Mexico University, which provides educational and cultural opportunities.
The town is also home to several manufacturing companies, including a copper smelter and a lead smelter. The town is also home to several retail stores, restaurants, and other businesses.
Demographics
As of the 2010 census, Silver City had a population of 10,315. The racial makeup of the town was 75.3% White, 0.9% African American, 1.2% Native American, 0.7% Asian, 0.1% Pacific Islander, 18.3% from other races, and 3.5% from two or more races. Hispanic or Latino of any race were 43.2% of the population.
The median income for a household in Silver City was $30,938, and the median income for a family was $37,813. The per capita income for the town was $17,845. About 19.2% of families and 24.2% of the population were below the poverty line, including 33.3% of those under age 18 and 11.2% of those age 65 or over.
Silver City is a diverse community, with a mix of cultures and backgrounds. The town is home to a large Hispanic population, as well as a growing Native American population. The town is also home to a large number of retirees, who have moved to the area for its mild climate and outdoor recreation opportunities.
Common Questions
What is Per Capita Income in Silver City?
Per Capita income in Silver City is $24,101.
What is the Median Family Income in Silver City?
Median Family Income in Silver City is $60,373.
What is the Median Household income in Silver City?
Median Household Income in Silver City is $36,853.
What is Income or Wage Gap in Silver City?
Income or Wage Gap in Silver City is 25.8%.
Women in Silver City earn 74.2 cents for every dollar earned by a man.
What is Inequality or Gini Index in Silver City?
Inequality or Gini Index in Silver City is 0.45.
What is the Total Population of Silver City?
Total Population of Silver City is 9,650.
What is the Total Male Population of Silver City?
Total Male Population of Silver City is 4,707.
What is the Total Female Population of Silver City?
Total Female Population of Silver City is 4,943.
What is the Ratio of Males per 100 Females in Silver City?
There are 95.23 Males per 100 Females in Silver City.
What is the Ratio of Females per 100 Males in Silver City?
There are 105.01 Females per 100 Males in Silver City.
What is the Median Population Age in Silver City?
Median Population Age in Silver City is 36.7 Years.
What is the Average Family Size in Silver City
Average Family Size in Silver City is 3.9 People.
What is the Average Household Size in Silver City
Average Household Size in Silver City is 2.5 People.
How Large is the Labor Force in Silver City?
There are 4,109 People in the Labor Forcein in Silver City.
What is the Percentage of People in the Labor Force in Silver City?
55.3% of People are in the Labor Force in Silver City.
What is the Unemployment Rate in Silver City?
Unemployment Rate in Silver City is 9.9%.