San Leon, TX Map & Demographics
San Leon Map
San Leon Overview
$39,417
PER CAPITA INCOME
$88,750
AVG FAMILY INCOME
$74,818
AVG HOUSEHOLD INCOME
32.9%
WAGE / INCOME GAP [ % ]
67.1¢/ $1
WAGE / INCOME GAP [ $ ]
0.43
INEQUALITY / GINI INDEX
5,709
TOTAL POPULATION
3,188
MALE POPULATION
2,521
FEMALE POPULATION
126.46
MALES / 100 FEMALES
79.08
FEMALES / 100 MALES
51.7
MEDIAN AGE
2.7
AVG FAMILY SIZE
2.3
AVG HOUSEHOLD SIZE
3,231
LABOR FORCE [ PEOPLE ]
61.9%
PERCENT IN LABOR FORCE
7.5%
UNEMPLOYMENT RATE
Income in San Leon
Income Overview in San Leon
Per Capita Income in San Leon is $39,417, while median incomes of families and households are $88,750 and $74,818 respectively.
| Characteristic | Number | Measure |
| Per Capita Income | 5,709 | $39,417 |
| Median Family Income | 1,702 | $88,750 |
| Mean Family Income | 1,702 | $101,677 |
| Median Household Income | 2,472 | $74,818 |
| Mean Household Income | 2,472 | $91,465 |
| Income Deficit | 1,702 | $0 |
| Wage / Income Gap (%) | 5,709 | 32.86% |
| Wage / Income Gap ($) | 5,709 | 67.14¢ per $1 |
| Gini / Inequality Index | 5,709 | 0.43 |
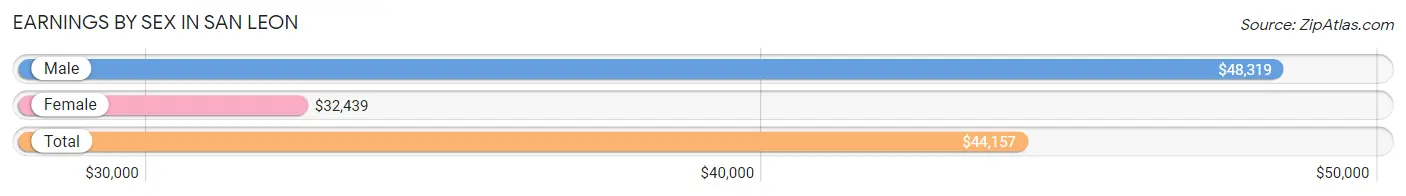
Earnings by Sex in San Leon
Average Earnings in San Leon are $44,157, $48,319 for men and $32,439 for women, a difference of 32.9%.
| Sex | Number | Average Earnings |
| Male | 1,950 (62.4%) | $48,319 |
| Female | 1,176 (37.6%) | $32,439 |
| Total | 3,126 (100.0%) | $44,157 |
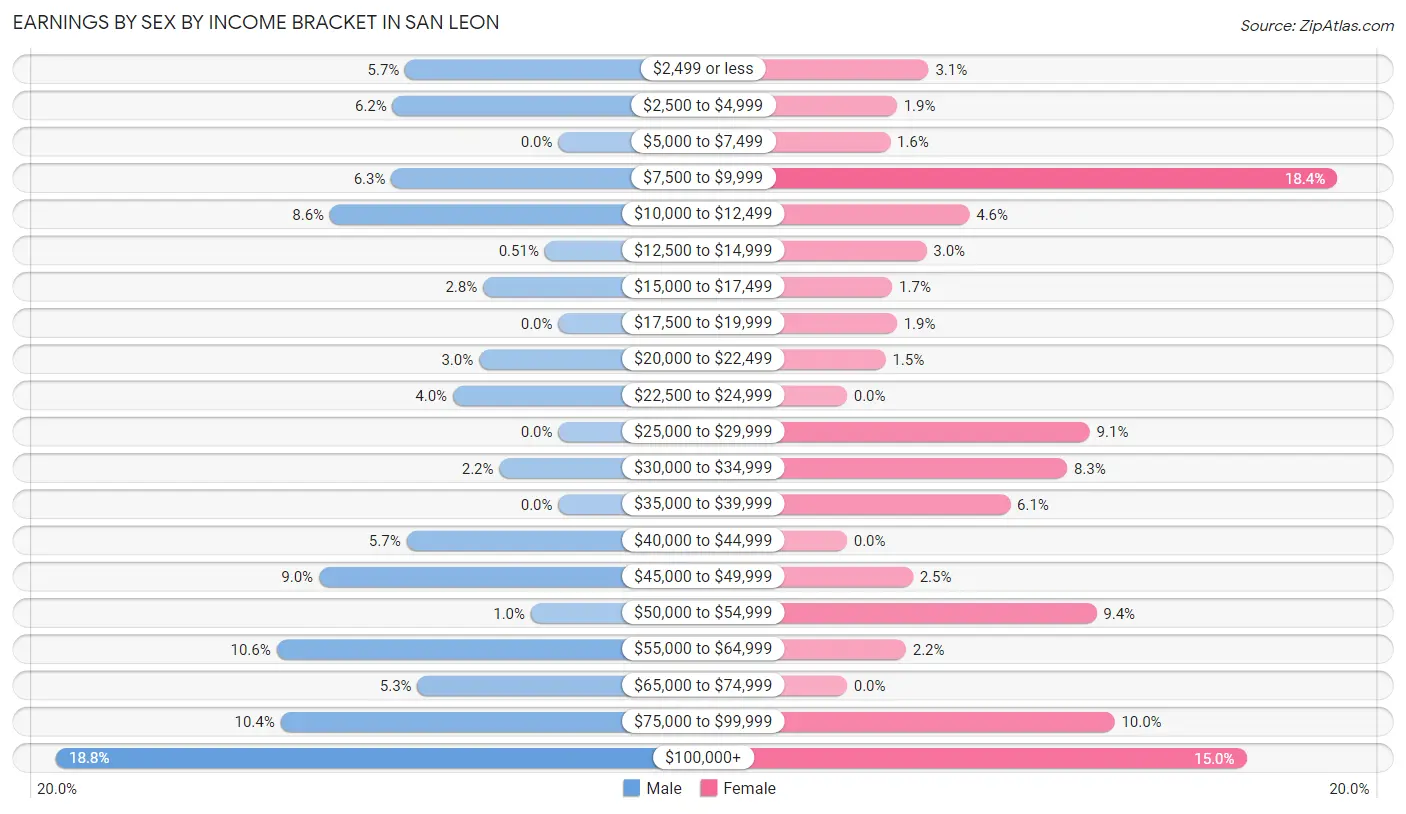
Earnings by Sex by Income Bracket in San Leon
The most common earnings brackets in San Leon are $100,000+ for men (367 | 18.8%) and $7,500 to $9,999 for women (216 | 18.4%).
| Income | Male | Female |
| $2,499 or less | 112 (5.7%) | 36 (3.1%) |
| $2,500 to $4,999 | 121 (6.2%) | 22 (1.9%) |
| $5,000 to $7,499 | 0 (0.0%) | 19 (1.6%) |
| $7,500 to $9,999 | 122 (6.3%) | 216 (18.4%) |
| $10,000 to $12,499 | 167 (8.6%) | 54 (4.6%) |
| $12,500 to $14,999 | 10 (0.5%) | 35 (3.0%) |
| $15,000 to $17,499 | 55 (2.8%) | 20 (1.7%) |
| $17,500 to $19,999 | 0 (0.0%) | 22 (1.9%) |
| $20,000 to $22,499 | 58 (3.0%) | 17 (1.5%) |
| $22,500 to $24,999 | 77 (4.0%) | 0 (0.0%) |
| $25,000 to $29,999 | 0 (0.0%) | 107 (9.1%) |
| $30,000 to $34,999 | 43 (2.2%) | 97 (8.3%) |
| $35,000 to $39,999 | 0 (0.0%) | 72 (6.1%) |
| $40,000 to $44,999 | 111 (5.7%) | 0 (0.0%) |
| $45,000 to $49,999 | 175 (9.0%) | 29 (2.5%) |
| $50,000 to $54,999 | 20 (1.0%) | 110 (9.3%) |
| $55,000 to $64,999 | 206 (10.6%) | 26 (2.2%) |
| $65,000 to $74,999 | 103 (5.3%) | 0 (0.0%) |
| $75,000 to $99,999 | 203 (10.4%) | 118 (10.0%) |
| $100,000+ | 367 (18.8%) | 176 (15.0%) |
| Total | 1,950 (100.0%) | 1,176 (100.0%) |
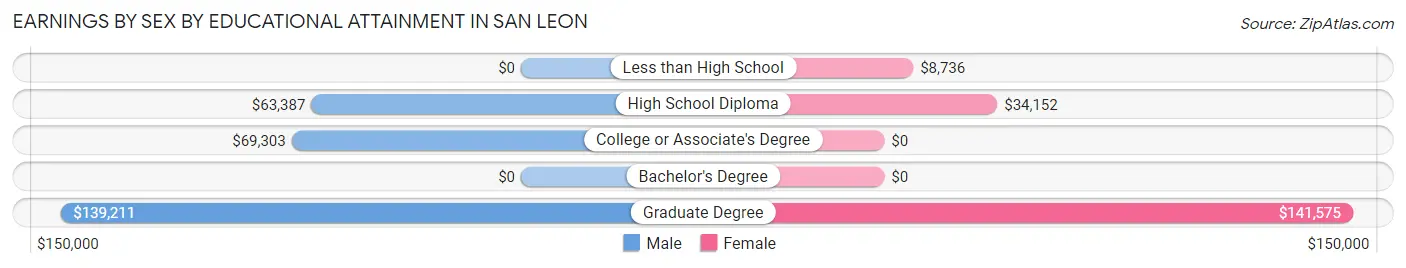
Earnings by Sex by Educational Attainment in San Leon
Average earnings in San Leon are $56,758 for men and $37,596 for women, a difference of 33.8%. Men with an educational attainment of graduate degree enjoy the highest average annual earnings of $139,211, while those with high school diploma education earn the least with $63,387. Women with an educational attainment of graduate degree earn the most with the average annual earnings of $141,575, while those with less than high school education have the smallest earnings of $8,736.
| Educational Attainment | Male Income | Female Income |
| Less than High School | - | - |
| High School Diploma | $63,387 | $34,152 |
| College or Associate's Degree | $69,303 | $0 |
| Bachelor's Degree | - | - |
| Graduate Degree | $139,211 | $141,575 |
| Total | $56,758 | $37,596 |
Family Income in San Leon
Family Income Brackets in San Leon
According to the San Leon family income data, there are 407 families falling into the $75,000 to $99,999 income range, which is the most common income bracket and makes up 23.9% of all families. Conversely, the $15,000 to $24,999 income bracket is the least frequent group with only 19 families (1.1%) belonging to this category.
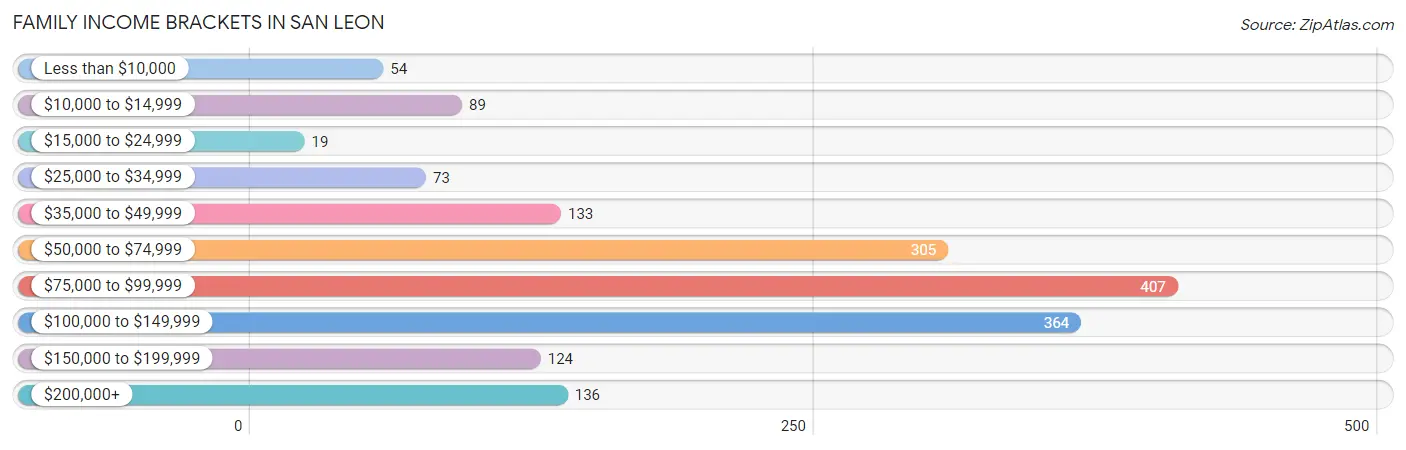
| Income Bracket | # Families | % Families |
| Less than $10,000 | 54 | 3.2% |
| $10,000 to $14,999 | 89 | 5.2% |
| $15,000 to $24,999 | 19 | 1.1% |
| $25,000 to $34,999 | 73 | 4.3% |
| $35,000 to $49,999 | 133 | 7.8% |
| $50,000 to $74,999 | 305 | 17.9% |
| $75,000 to $99,999 | 407 | 23.9% |
| $100,000 to $149,999 | 364 | 21.4% |
| $150,000 to $199,999 | 124 | 7.3% |
| $200,000+ | 136 | 8.0% |
Family Income by Famaliy Size in San Leon
2-person families (970 | 57.0%) account for the highest median family income in San Leon with $98,864 per family, while 2-person families (970 | 57.0%) have the highest median income of $49,432 per family member.
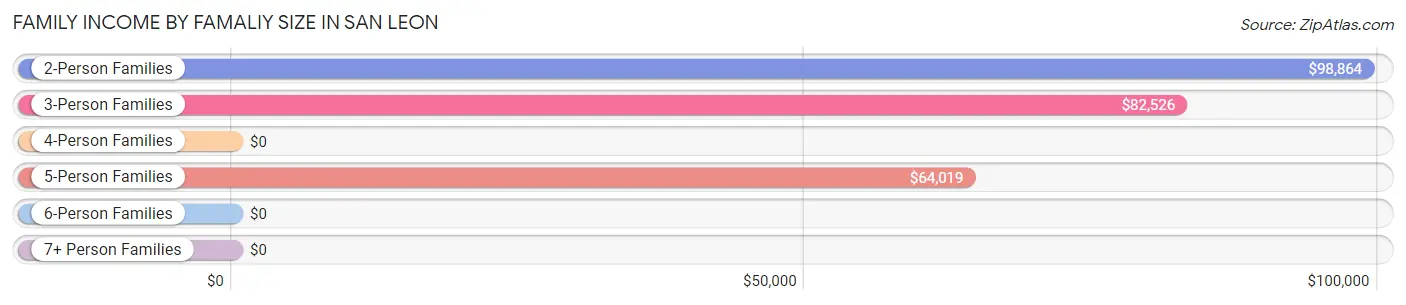
| Income Bracket | # Families | Median Income |
| 2-Person Families | 970 (57.0%) | $98,864 |
| 3-Person Families | 400 (23.5%) | $82,526 |
| 4-Person Families | 109 (6.4%) | $0 |
| 5-Person Families | 223 (13.1%) | $64,019 |
| 6-Person Families | 0 (0.0%) | $0 |
| 7+ Person Families | 0 (0.0%) | $0 |
| Total | 1,702 (100.0%) | $88,750 |
Family Income by Number of Earners in San Leon
The median family income in San Leon is $88,750, with families comprising 2 earners (672) having the highest median family income of $119,471, while families with no earners (355) have the lowest median family income of $41,647, accounting for 39.5% and 20.9% of families, respectively.
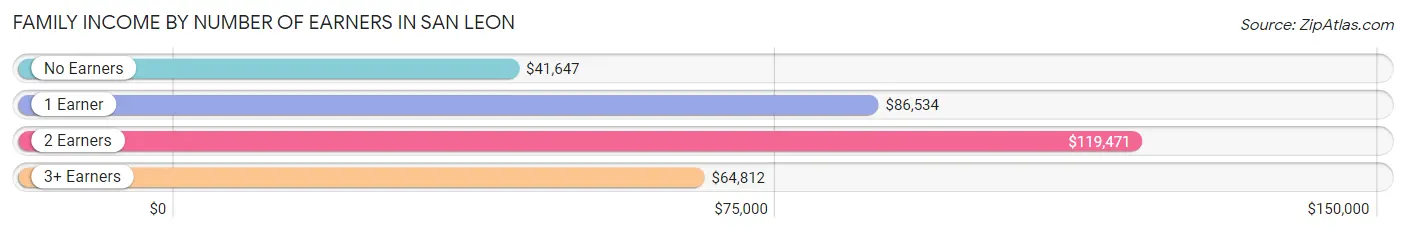
| Number of Earners | # Families | Median Income |
| No Earners | 355 (20.9%) | $41,647 |
| 1 Earner | 393 (23.1%) | $86,534 |
| 2 Earners | 672 (39.5%) | $119,471 |
| 3+ Earners | 282 (16.6%) | $64,812 |
| Total | 1,702 (100.0%) | $88,750 |
Household Income in San Leon
Household Income Brackets in San Leon
With 470 households falling in the category, the $75,000 to $99,999 income range is the most frequent in San Leon, accounting for 19.0% of all households. In contrast, only 79 households (3.2%) fall into the less than $10,000 income bracket, making it the least populous group.
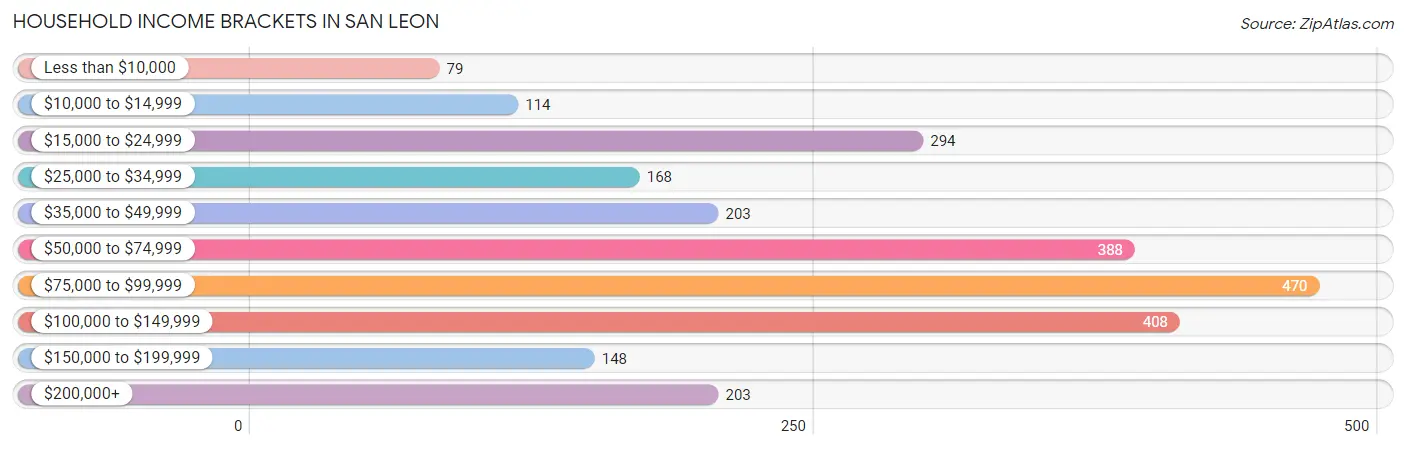
| Income Bracket | # Households | % Households |
| Less than $10,000 | 79 | 3.2% |
| $10,000 to $14,999 | 114 | 4.6% |
| $15,000 to $24,999 | 294 | 11.9% |
| $25,000 to $34,999 | 168 | 6.8% |
| $35,000 to $49,999 | 203 | 8.2% |
| $50,000 to $74,999 | 388 | 15.7% |
| $75,000 to $99,999 | 470 | 19.0% |
| $100,000 to $149,999 | 408 | 16.5% |
| $150,000 to $199,999 | 148 | 6.0% |
| $200,000+ | 203 | 8.2% |
Household Income by Householder Age in San Leon
The median household income in San Leon is $74,818, with the highest median household income of $116,646 found in the 45 to 64 years age bracket for the primary householder. A total of 1,137 households (46.0%) fall into this category. Meanwhile, the 15 to 24 years age bracket for the primary householder has the lowest median household income of $0, with 21 households (0.9%) in this group.
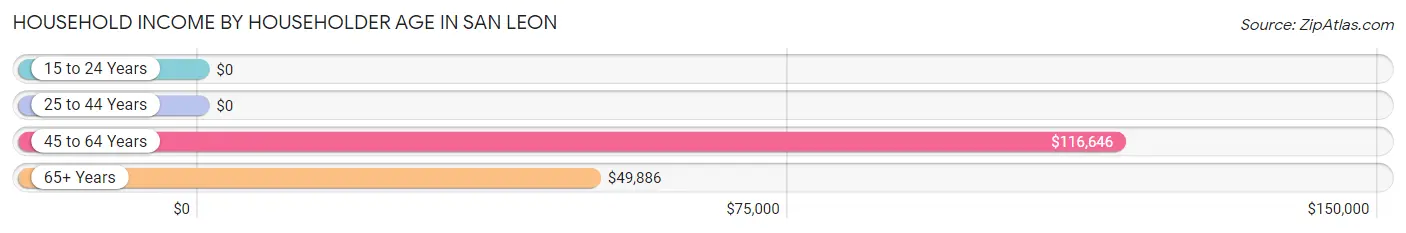
| Income Bracket | # Households | Median Income |
| 15 to 24 Years | 21 (0.9%) | $0 |
| 25 to 44 Years | 580 (23.5%) | $0 |
| 45 to 64 Years | 1,137 (46.0%) | $116,646 |
| 65+ Years | 734 (29.7%) | $49,886 |
| Total | 2,472 (100.0%) | $74,818 |
Poverty in San Leon
Income Below Poverty by Sex and Age in San Leon
With 10.2% poverty level for males and 11.9% for females among the residents of San Leon, 15 year old males and 35 to 44 year old females are the most vulnerable to poverty, with 37 males (100.0%) and 67 females (30.4%) in their respective age groups living below the poverty level.
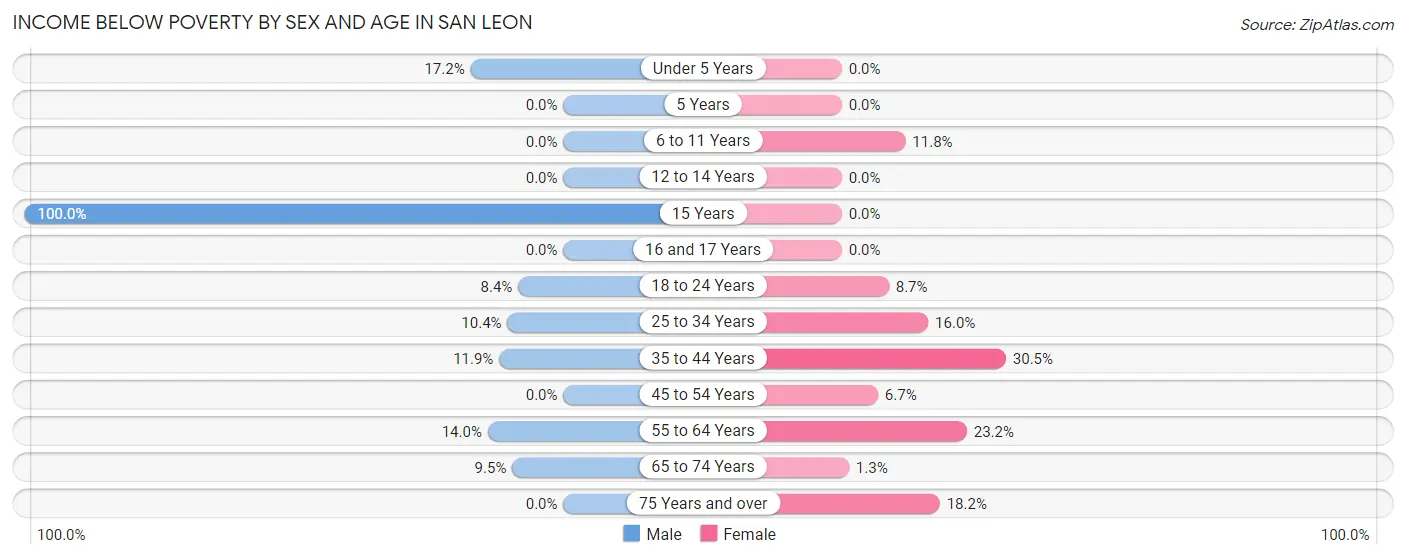
| Age Bracket | Male | Female |
| Under 5 Years | 15 (17.2%) | 0 (0.0%) |
| 5 Years | 0 (0.0%) | 0 (0.0%) |
| 6 to 11 Years | 0 (0.0%) | 17 (11.8%) |
| 12 to 14 Years | 0 (0.0%) | 0 (0.0%) |
| 15 Years | 37 (100.0%) | 0 (0.0%) |
| 16 and 17 Years | 0 (0.0%) | 0 (0.0%) |
| 18 to 24 Years | 24 (8.4%) | 17 (8.7%) |
| 25 to 34 Years | 46 (10.4%) | 42 (16.0%) |
| 35 to 44 Years | 58 (11.9%) | 67 (30.4%) |
| 45 to 54 Years | 0 (0.0%) | 42 (6.7%) |
| 55 to 64 Years | 85 (14.0%) | 100 (23.2%) |
| 65 to 74 Years | 60 (9.5%) | 6 (1.3%) |
| 75 Years and over | 0 (0.0%) | 8 (18.2%) |
| Total | 325 (10.2%) | 299 (11.9%) |
Income Above Poverty by Sex and Age in San Leon
According to the poverty statistics in San Leon, males aged 6 to 11 years and females aged under 5 years are the age groups that are most secure financially, with 100.0% of males and 100.0% of females in these age groups living above the poverty line.
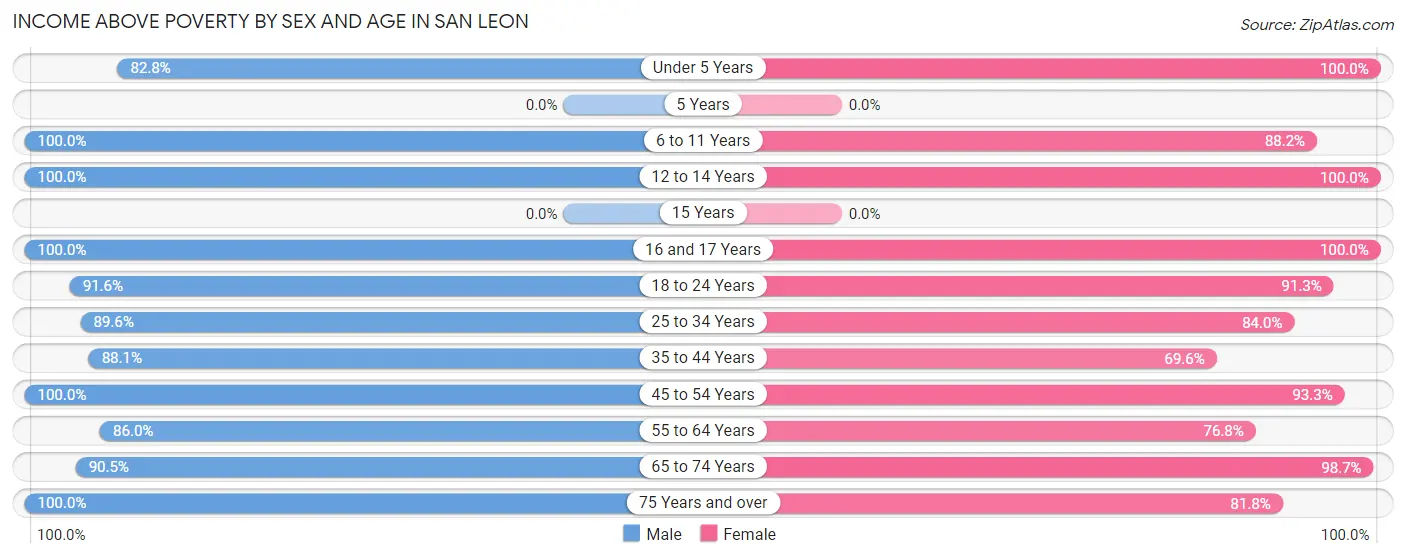
| Age Bracket | Male | Female |
| Under 5 Years | 72 (82.8%) | 22 (100.0%) |
| 5 Years | 0 (0.0%) | 0 (0.0%) |
| 6 to 11 Years | 76 (100.0%) | 127 (88.2%) |
| 12 to 14 Years | 38 (100.0%) | 86 (100.0%) |
| 15 Years | 0 (0.0%) | 0 (0.0%) |
| 16 and 17 Years | 62 (100.0%) | 34 (100.0%) |
| 18 to 24 Years | 262 (91.6%) | 178 (91.3%) |
| 25 to 34 Years | 397 (89.6%) | 220 (84.0%) |
| 35 to 44 Years | 429 (88.1%) | 153 (69.6%) |
| 45 to 54 Years | 364 (100.0%) | 585 (93.3%) |
| 55 to 64 Years | 521 (86.0%) | 331 (76.8%) |
| 65 to 74 Years | 572 (90.5%) | 450 (98.7%) |
| 75 Years and over | 70 (100.0%) | 36 (81.8%) |
| Total | 2,863 (89.8%) | 2,222 (88.1%) |
Income Below Poverty Among Married-Couple Families in San Leon
The poverty statistics for married-couple families in San Leon show that 6.3% or 88 of the total 1,401 families live below the poverty line. Families with 1 or 2 children have the highest poverty rate of 13.1%, comprising of 58 families. On the other hand, families with no children have the lowest poverty rate of 3.1%, which includes 30 families.
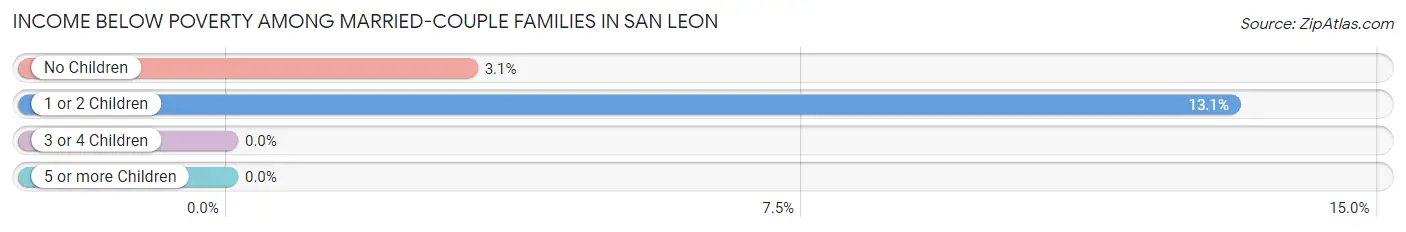
| Children | Above Poverty | Below Poverty |
| No Children | 928 (96.9%) | 30 (3.1%) |
| 1 or 2 Children | 385 (86.9%) | 58 (13.1%) |
| 3 or 4 Children | 0 (0.0%) | 0 (0.0%) |
| 5 or more Children | 0 (0.0%) | 0 (0.0%) |
| Total | 1,313 (93.7%) | 88 (6.3%) |
Income Below Poverty Among Single-Parent Households in San Leon
According to the poverty data in San Leon, 24.6% or 46 single-father households and 23.7% or 27 single-mother households are living below the poverty line. Among single-father households, those with 1 or 2 children have the highest poverty rate, with 46 households (100.0%) experiencing poverty. Likewise, among single-mother households, those with no children have the highest poverty rate, with 27 households (33.3%) falling below the poverty line.
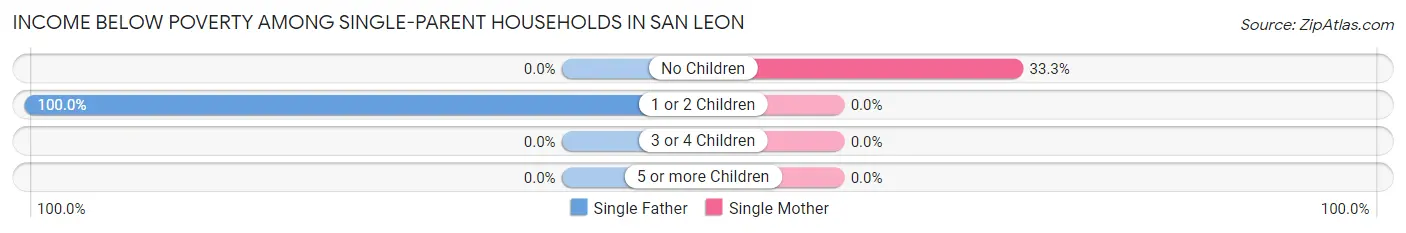
| Children | Single Father | Single Mother |
| No Children | 0 (0.0%) | 27 (33.3%) |
| 1 or 2 Children | 46 (100.0%) | 0 (0.0%) |
| 3 or 4 Children | 0 (0.0%) | 0 (0.0%) |
| 5 or more Children | 0 (0.0%) | 0 (0.0%) |
| Total | 46 (24.6%) | 27 (23.7%) |
Income Below Poverty Among Married-Couple vs Single-Parent Households in San Leon
The poverty data for San Leon shows that 88 of the married-couple family households (6.3%) and 73 of the single-parent households (24.2%) are living below the poverty level. Within the married-couple family households, those with 1 or 2 children have the highest poverty rate, with 58 households (13.1%) falling below the poverty line. Among the single-parent households, those with 1 or 2 children have the highest poverty rate, with 46 household (58.2%) living below poverty.
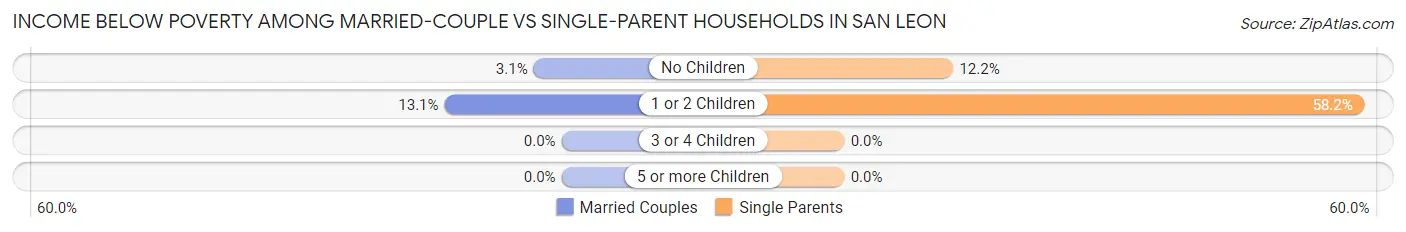
| Children | Married-Couple Families | Single-Parent Households |
| No Children | 30 (3.1%) | 27 (12.2%) |
| 1 or 2 Children | 58 (13.1%) | 46 (58.2%) |
| 3 or 4 Children | 0 (0.0%) | 0 (0.0%) |
| 5 or more Children | 0 (0.0%) | 0 (0.0%) |
| Total | 88 (6.3%) | 73 (24.2%) |
Race in San Leon
The most populous races in San Leon are White / Caucasian (4,558 | 79.8%), Hispanic or Latino (2,158 | 37.8%), and Some other Race (586 | 10.3%).
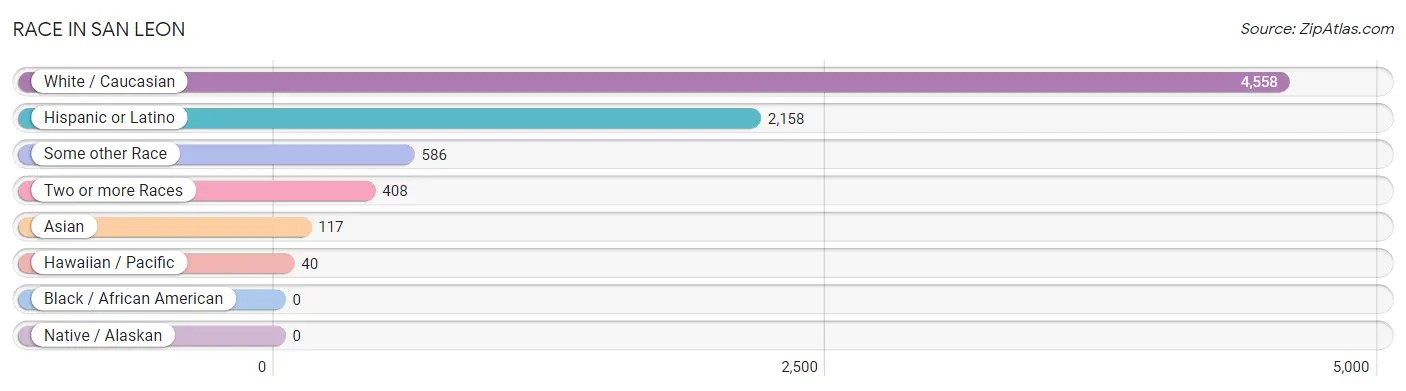
| Race | # Population | % Population |
| Asian | 117 | 2.1% |
| Black / African American | 0 | 0.0% |
| Hawaiian / Pacific | 40 | 0.7% |
| Hispanic or Latino | 2,158 | 37.8% |
| Native / Alaskan | 0 | 0.0% |
| White / Caucasian | 4,558 | 79.8% |
| Two or more Races | 408 | 7.1% |
| Some other Race | 586 | 10.3% |
| Total | 5,709 | 100.0% |
Ancestry in San Leon
The most populous ancestries reported in San Leon are Mexican (1,989 | 34.8%), Irish (642 | 11.3%), German (628 | 11.0%), European (360 | 6.3%), and American (320 | 5.6%), together accounting for 69.0% of all San Leon residents.
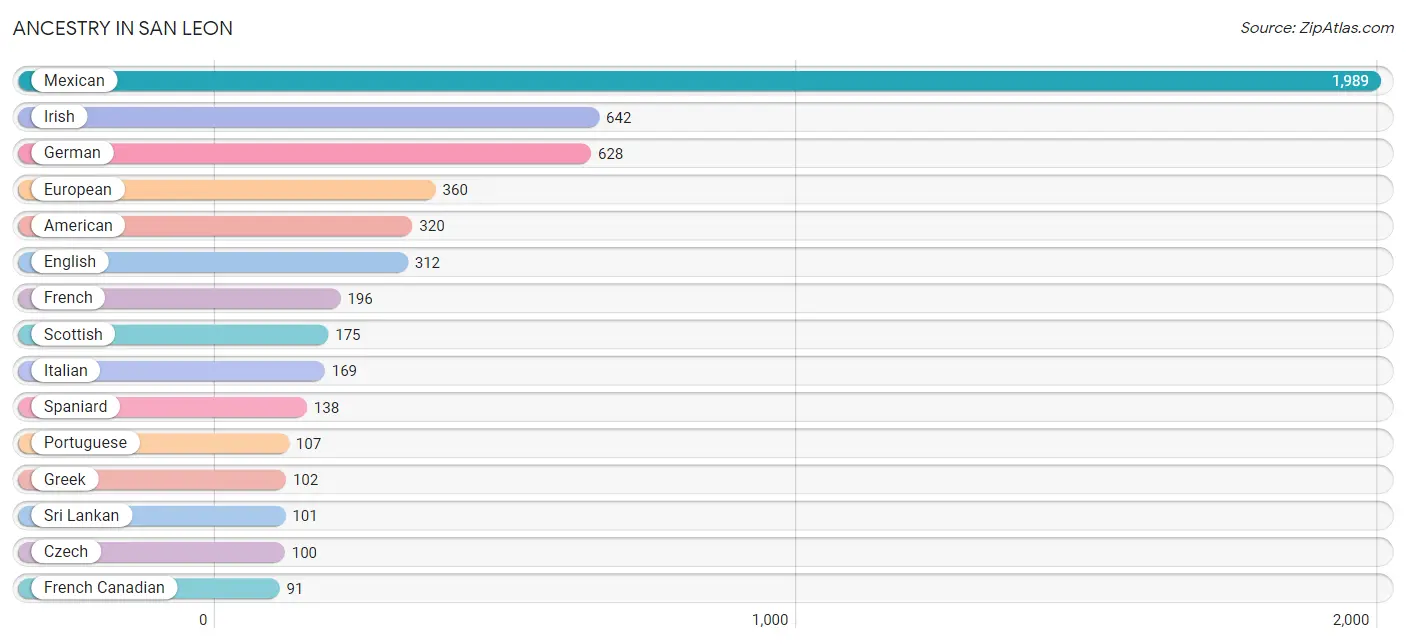
| Ancestry | # Population | % Population |
| American | 320 | 5.6% |
| Burmese | 16 | 0.3% |
| Central American | 31 | 0.5% |
| Costa Rican | 31 | 0.5% |
| Czech | 100 | 1.8% |
| Dutch | 64 | 1.1% |
| English | 312 | 5.5% |
| European | 360 | 6.3% |
| French | 196 | 3.4% |
| French Canadian | 91 | 1.6% |
| German | 628 | 11.0% |
| Greek | 102 | 1.8% |
| Icelander | 19 | 0.3% |
| Indian (Asian) | 16 | 0.3% |
| Irish | 642 | 11.3% |
| Italian | 169 | 3.0% |
| Mexican | 1,989 | 34.8% |
| Native Hawaiian | 40 | 0.7% |
| Northern European | 20 | 0.4% |
| Norwegian | 25 | 0.4% |
| Polish | 77 | 1.3% |
| Portuguese | 107 | 1.9% |
| Scotch-Irish | 23 | 0.4% |
| Scottish | 175 | 3.1% |
| Slavic | 18 | 0.3% |
| Spaniard | 138 | 2.4% |
| Sri Lankan | 101 | 1.8% |
| Swedish | 19 | 0.3% |
| Welsh | 50 | 0.9% | View All 29 Rows |
Immigrants in San Leon
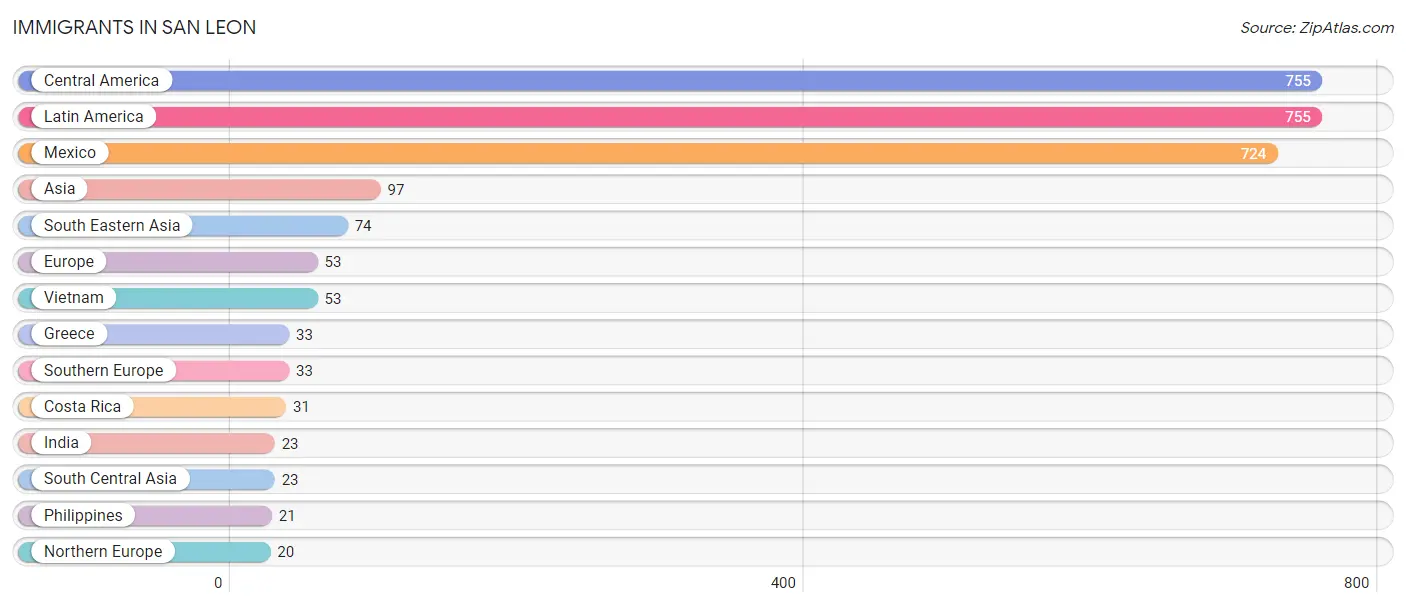
The most numerous immigrant groups reported in San Leon came from Central America (755 | 13.2%), Latin America (755 | 13.2%), Mexico (724 | 12.7%), Asia (97 | 1.7%), and South Eastern Asia (74 | 1.3%), together accounting for 42.1% of all San Leon residents.
| Immigration Origin | # Population | % Population |
| Asia | 97 | 1.7% |
| Central America | 755 | 13.2% |
| Costa Rica | 31 | 0.5% |
| Europe | 53 | 0.9% |
| Greece | 33 | 0.6% |
| India | 23 | 0.4% |
| Latin America | 755 | 13.2% |
| Mexico | 724 | 12.7% |
| Northern Europe | 20 | 0.4% |
| Philippines | 21 | 0.4% |
| South Central Asia | 23 | 0.4% |
| South Eastern Asia | 74 | 1.3% |
| Southern Europe | 33 | 0.6% |
| Vietnam | 53 | 0.9% | View All 14 Rows |
Sex and Age in San Leon
Sex and Age in San Leon
The most populous age groups in San Leon are 65 to 69 Years (387 | 12.1%) for men and 50 to 54 Years (489 | 19.4%) for women.
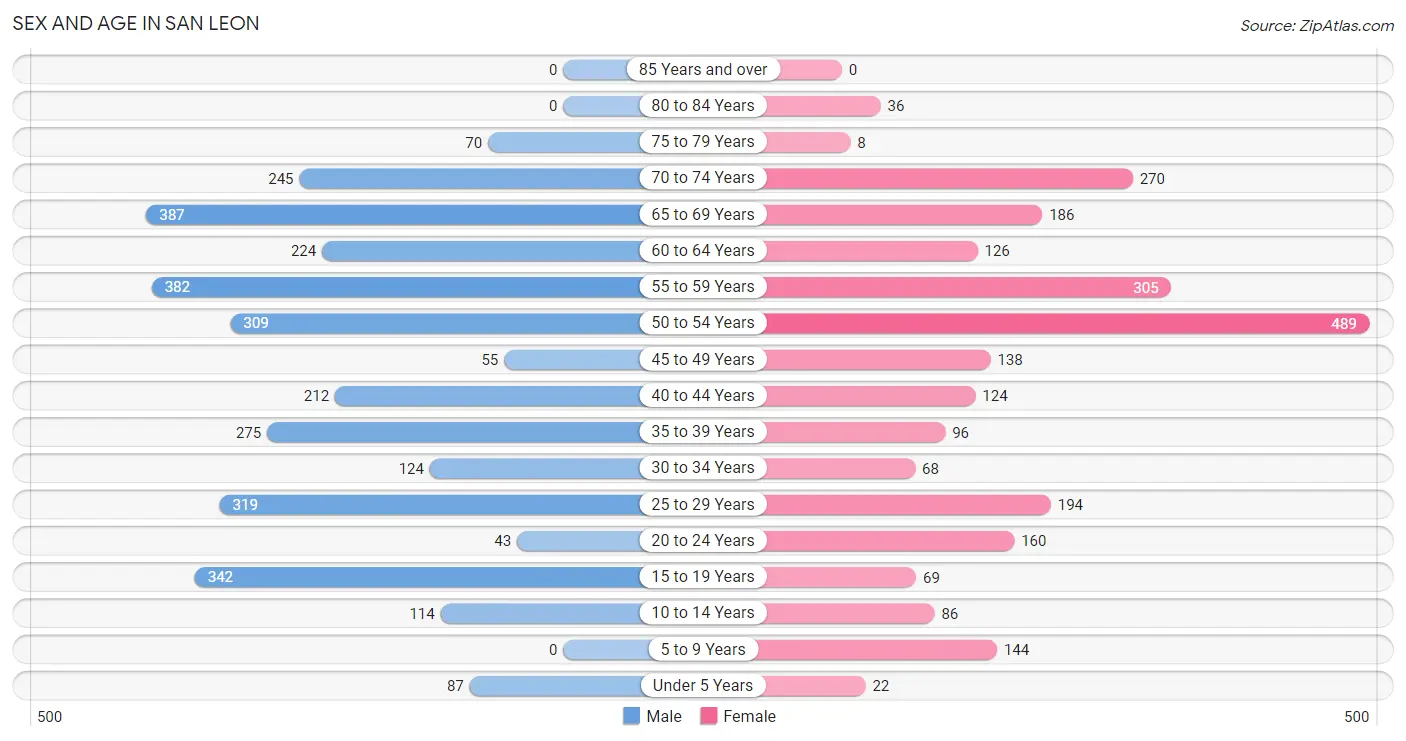
| Age Bracket | Male | Female |
| Under 5 Years | 87 (2.7%) | 22 (0.9%) |
| 5 to 9 Years | 0 (0.0%) | 144 (5.7%) |
| 10 to 14 Years | 114 (3.6%) | 86 (3.4%) |
| 15 to 19 Years | 342 (10.7%) | 69 (2.7%) |
| 20 to 24 Years | 43 (1.3%) | 160 (6.4%) |
| 25 to 29 Years | 319 (10.0%) | 194 (7.7%) |
| 30 to 34 Years | 124 (3.9%) | 68 (2.7%) |
| 35 to 39 Years | 275 (8.6%) | 96 (3.8%) |
| 40 to 44 Years | 212 (6.7%) | 124 (4.9%) |
| 45 to 49 Years | 55 (1.7%) | 138 (5.5%) |
| 50 to 54 Years | 309 (9.7%) | 489 (19.4%) |
| 55 to 59 Years | 382 (12.0%) | 305 (12.1%) |
| 60 to 64 Years | 224 (7.0%) | 126 (5.0%) |
| 65 to 69 Years | 387 (12.1%) | 186 (7.4%) |
| 70 to 74 Years | 245 (7.7%) | 270 (10.7%) |
| 75 to 79 Years | 70 (2.2%) | 8 (0.3%) |
| 80 to 84 Years | 0 (0.0%) | 36 (1.4%) |
| 85 Years and over | 0 (0.0%) | 0 (0.0%) |
| Total | 3,188 (100.0%) | 2,521 (100.0%) |
Families and Households in San Leon
Median Family Size in San Leon
The median family size in San Leon is 2.69 persons per family, with married-couple families (1,401 | 82.3%) accounting for the largest median family size of 2.76 persons per family. On the other hand, single male/father families (187 | 11.0%) represent the smallest median family size with 2.32 persons per family.
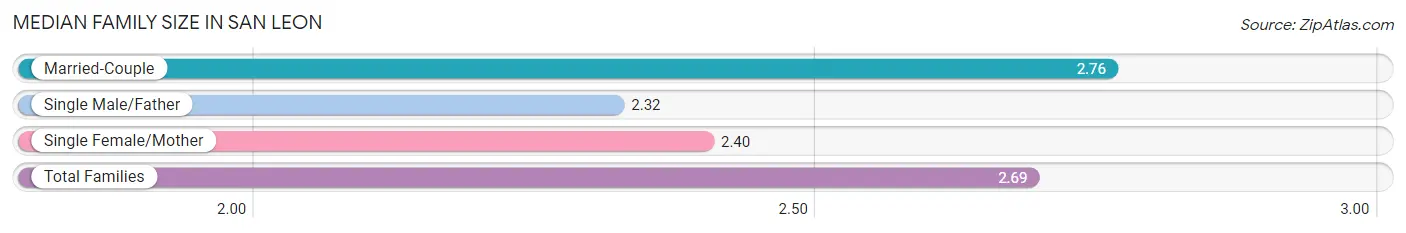
| Family Type | # Families | Family Size |
| Married-Couple | 1,401 (82.3%) | 2.76 |
| Single Male/Father | 187 (11.0%) | 2.32 |
| Single Female/Mother | 114 (6.7%) | 2.40 |
| Total Families | 1,702 (100.0%) | 2.69 |
Median Household Size in San Leon
The median household size in San Leon is 2.31 persons per household, with married-couple households (1,401 | 56.7%) accounting for the largest median household size of 2.81 persons per household. non-family households (770 | 31.1%) represent the smallest median household size with 1.28 persons per household.
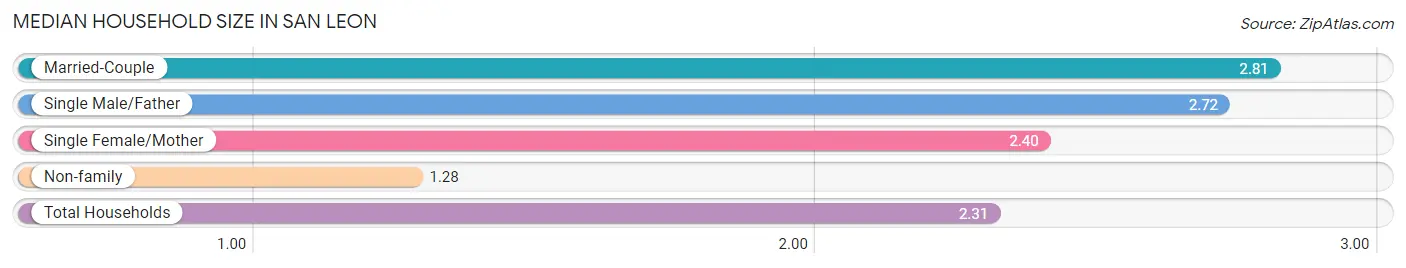
| Household Type | # Households | Household Size |
| Married-Couple | 1,401 (56.7%) | 2.81 |
| Single Male/Father | 187 (7.6%) | 2.72 |
| Single Female/Mother | 114 (4.6%) | 2.40 |
| Non-family | 770 (31.1%) | 1.28 |
| Total Households | 2,472 (100.0%) | 2.31 |
Household Size by Marriage Status in San Leon
Out of a total of 2,472 households in San Leon, 1,702 (68.9%) are family households, while 770 (31.1%) are nonfamily households. The most numerous type of family households are 2-person households, comprising 916, and the most common type of nonfamily households are 1-person households, comprising 563.
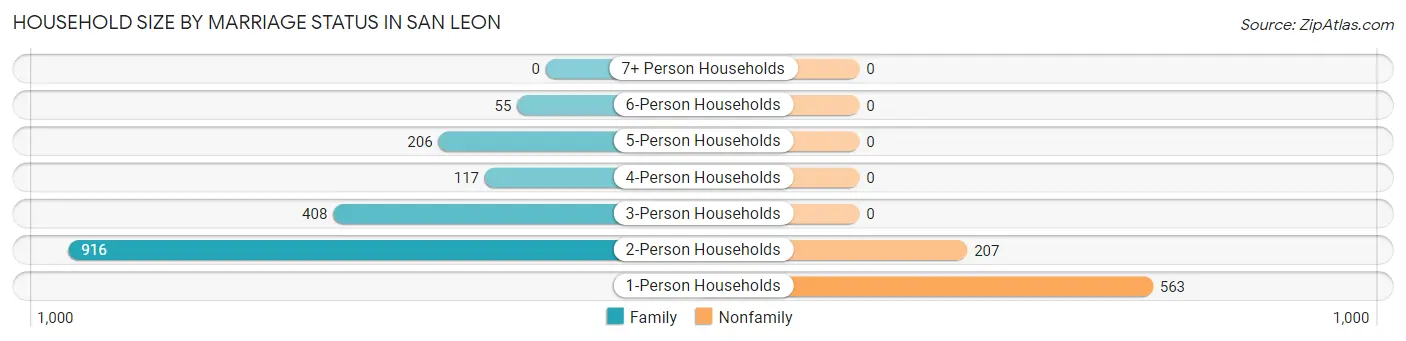
| Household Size | Family Households | Nonfamily Households |
| 1-Person Households | - | 563 (22.8%) |
| 2-Person Households | 916 (37.1%) | 207 (8.4%) |
| 3-Person Households | 408 (16.5%) | 0 (0.0%) |
| 4-Person Households | 117 (4.7%) | 0 (0.0%) |
| 5-Person Households | 206 (8.3%) | 0 (0.0%) |
| 6-Person Households | 55 (2.2%) | 0 (0.0%) |
| 7+ Person Households | 0 (0.0%) | 0 (0.0%) |
| Total | 1,702 (68.9%) | 770 (31.1%) |
Female Fertility in San Leon
Fertility by Age in San Leon
Average fertility rate in San Leon is 94.0 births per 1,000 women. Women in the age bracket of 20 to 34 years have the highest fertility rate with 220.0 births per 1,000 women. Women in the age bracket of 20 to 34 years acount for 100.0% of all women with births.
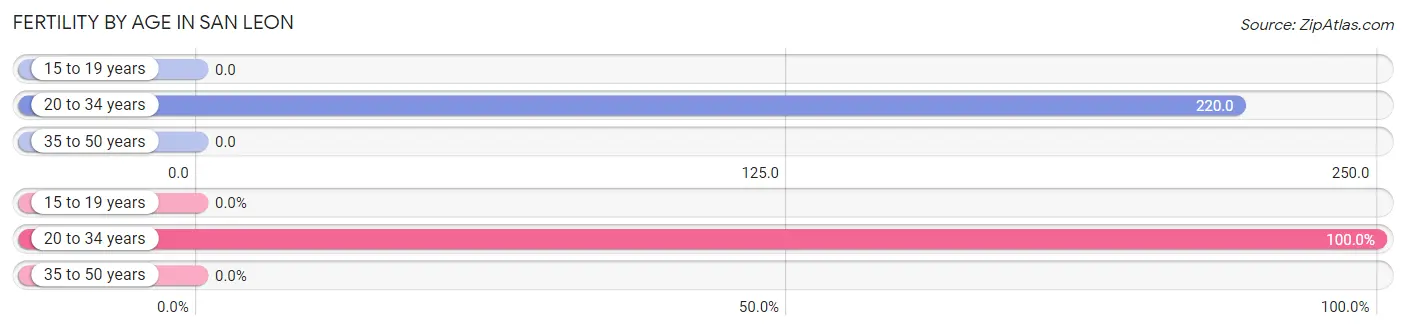
| Age Bracket | Women with Births | Births / 1,000 Women |
| 15 to 19 years | 0 (0.0%) | 0.0 |
| 20 to 34 years | 93 (100.0%) | 220.0 |
| 35 to 50 years | 0 (0.0%) | 0.0 |
| Total | 93 (100.0%) | 94.0 |
Fertility by Age by Marriage Status in San Leon
81.7% of women with births (93) in San Leon are married. The highest percentage of unmarried women with births falls into 20 to 34 years age bracket with 18.3% of them unmarried at the time of birth, while the lowest percentage of unmarried women with births belong to 20 to 34 years age bracket with 18.3% of them unmarried.
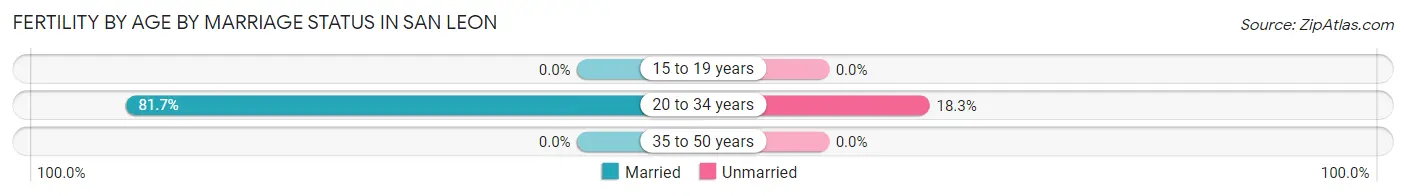
| Age Bracket | Married | Unmarried |
| 15 to 19 years | 0 (0.0%) | 0 (0.0%) |
| 20 to 34 years | 76 (81.7%) | 17 (18.3%) |
| 35 to 50 years | 0 (0.0%) | 0 (0.0%) |
| Total | 76 (81.7%) | 17 (18.3%) |
Fertility by Education in San Leon
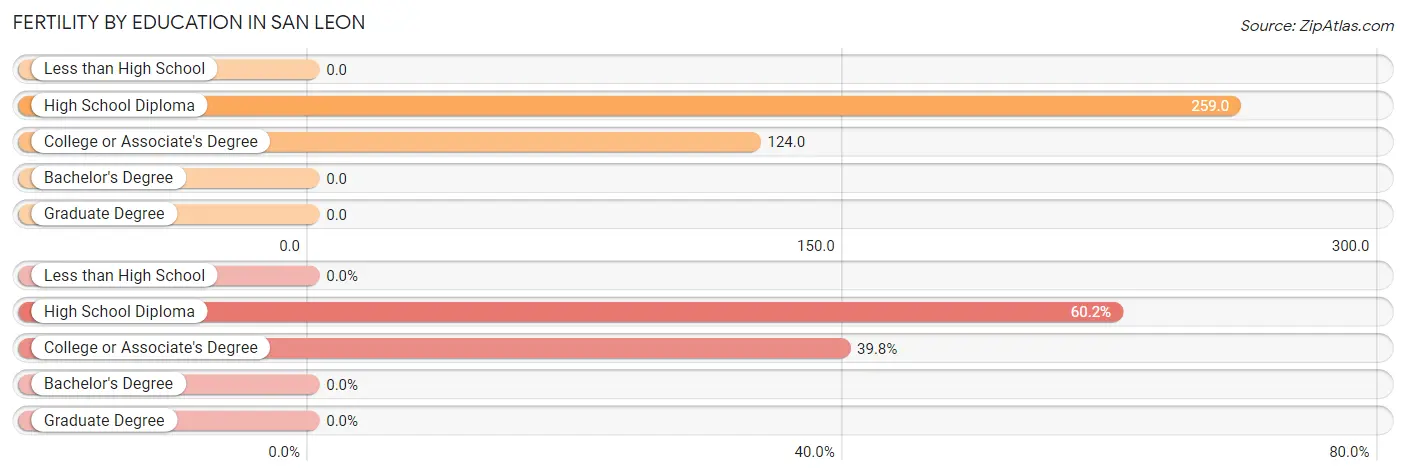
| Educational Attainment | Women with Births | Births / 1,000 Women |
| Less than High School | 0 (0.0%) | 0.0 |
| High School Diploma | 56 (60.2%) | 259.0 |
| College or Associate's Degree | 37 (39.8%) | 124.0 |
| Bachelor's Degree | 0 (0.0%) | 0.0 |
| Graduate Degree | 0 (0.0%) | 0.0 |
| Total | 93 (100.0%) | 94.0 |
Fertility by Education by Marriage Status in San Leon
18.3% of women with births in San Leon are unmarried. Women with the educational attainment of high school diploma are most likely to be married with 100.0% of them married at childbirth, while women with the educational attainment of college or associate's degree are least likely to be married with 46.0% of them unmarried at childbirth.
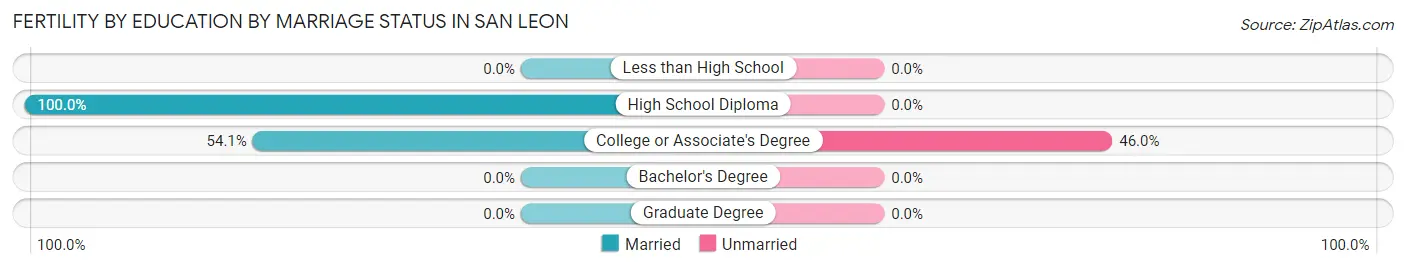
| Educational Attainment | Married | Unmarried |
| Less than High School | 0 (0.0%) | 0 (0.0%) |
| High School Diploma | 56 (100.0%) | 0 (0.0%) |
| College or Associate's Degree | 20 (54.0%) | 17 (46.0%) |
| Bachelor's Degree | 0 (0.0%) | 0 (0.0%) |
| Graduate Degree | 0 (0.0%) | 0 (0.0%) |
| Total | 76 (81.7%) | 17 (18.3%) |
Employment Characteristics in San Leon
Employment by Class of Employer in San Leon
Among the 2,788 employed individuals in San Leon, private company employees (2,274 | 81.6%), self-employed (not incorporated) (227 | 8.1%), and not-for-profit organizations (144 | 5.2%) make up the most common classes of employment.
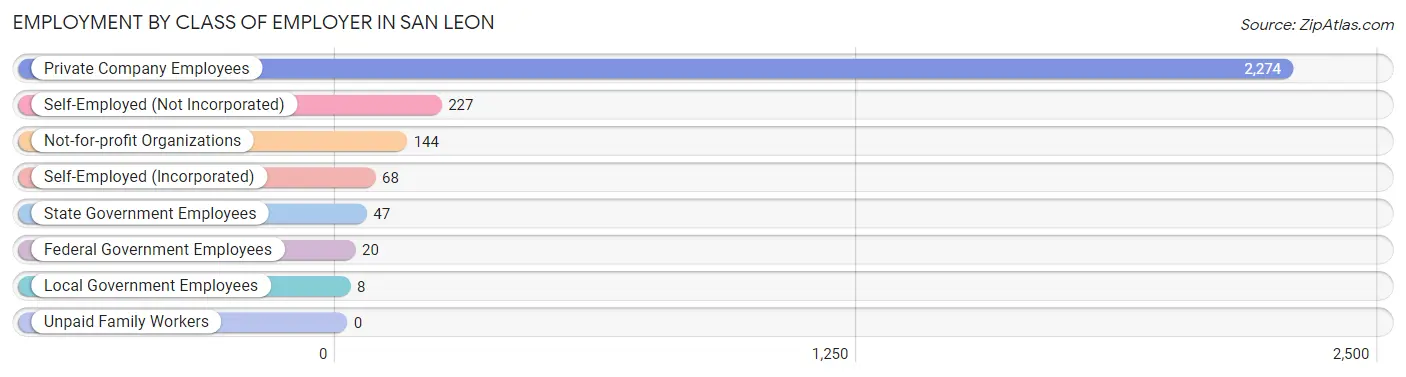
| Employer Class | # Employees | % Employees |
| Private Company Employees | 2,274 | 81.6% |
| Self-Employed (Incorporated) | 68 | 2.4% |
| Self-Employed (Not Incorporated) | 227 | 8.1% |
| Not-for-profit Organizations | 144 | 5.2% |
| Local Government Employees | 8 | 0.3% |
| State Government Employees | 47 | 1.7% |
| Federal Government Employees | 20 | 0.7% |
| Unpaid Family Workers | 0 | 0.0% |
| Total | 2,788 | 100.0% |
Employment Status by Age in San Leon
According to the labor force statistics for San Leon, out of the total population over 16 years of age (5,219), 61.9% or 3,231 individuals are in the labor force, with 7.5% or 242 of them unemployed. The age group with the highest labor force participation rate is 25 to 29 years, with 80.7% or 414 individuals in the labor force. Within the labor force, the 25 to 29 years age range has the highest percentage of unemployed individuals, with 27.5% or 114 of them being unemployed.
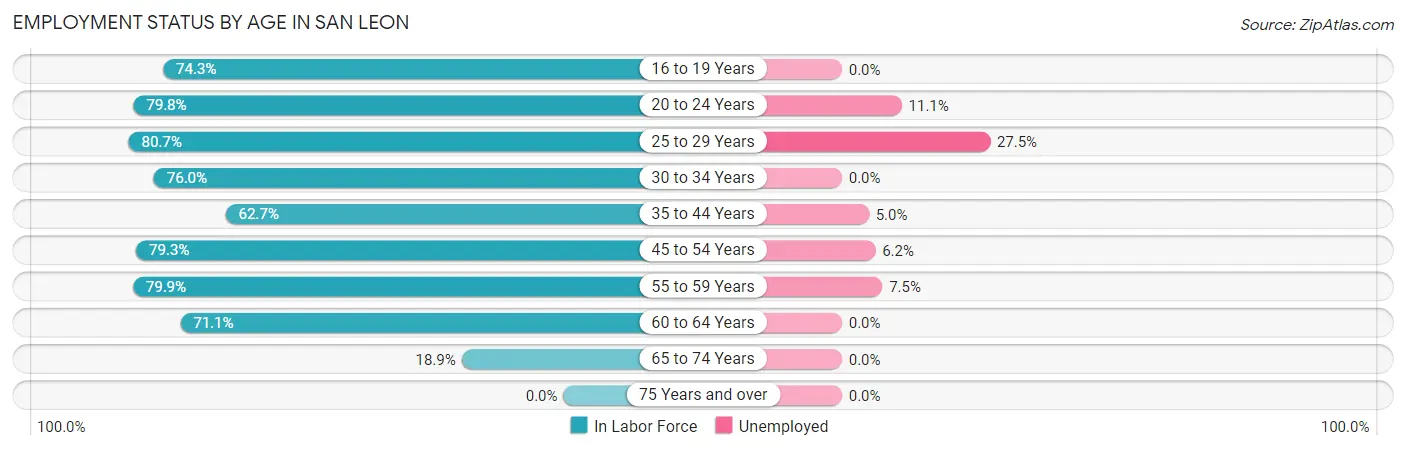
| Age Bracket | In Labor Force | Unemployed |
| 16 to 19 Years | 278 (74.3%) | 0 (0.0%) |
| 20 to 24 Years | 162 (79.8%) | 18 (11.1%) |
| 25 to 29 Years | 414 (80.7%) | 114 (27.5%) |
| 30 to 34 Years | 146 (76.0%) | 0 (0.0%) |
| 35 to 44 Years | 443 (62.7%) | 22 (5.0%) |
| 45 to 54 Years | 786 (79.3%) | 49 (6.2%) |
| 55 to 59 Years | 549 (79.9%) | 41 (7.5%) |
| 60 to 64 Years | 249 (71.1%) | 0 (0.0%) |
| 65 to 74 Years | 206 (18.9%) | 0 (0.0%) |
| 75 Years and over | 0 (0.0%) | 0 (0.0%) |
| Total | 3,231 (61.9%) | 242 (7.5%) |
Employment Status by Educational Attainment in San Leon
According to labor force statistics for San Leon, 75.2% of individuals (2,587) out of the total population between 25 and 64 years of age (3,440) are in the labor force, with 8.7% or 225 of them being unemployed. The group with the highest labor force participation rate are those with the educational attainment of bachelor's degree or higher, with 93.9% or 306 individuals in the labor force. Within the labor force, individuals with high school diploma education have the highest percentage of unemployment, with 19.4% or 155 of them being unemployed.
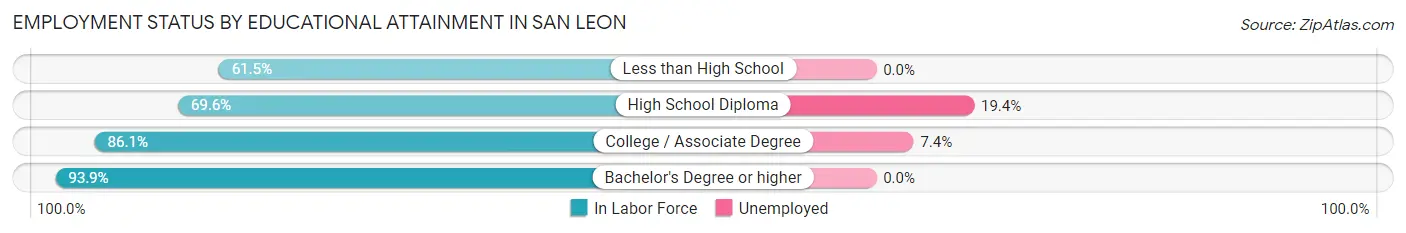
| Educational Attainment | In Labor Force | Unemployed |
| Less than High School | 528 (61.5%) | 0 (0.0%) |
| High School Diploma | 798 (69.6%) | 222 (19.4%) |
| College / Associate Degree | 955 (86.1%) | 82 (7.4%) |
| Bachelor's Degree or higher | 306 (93.9%) | 0 (0.0%) |
| Total | 2,587 (75.2%) | 299 (8.7%) |
Employment Occupations by Sex in San Leon
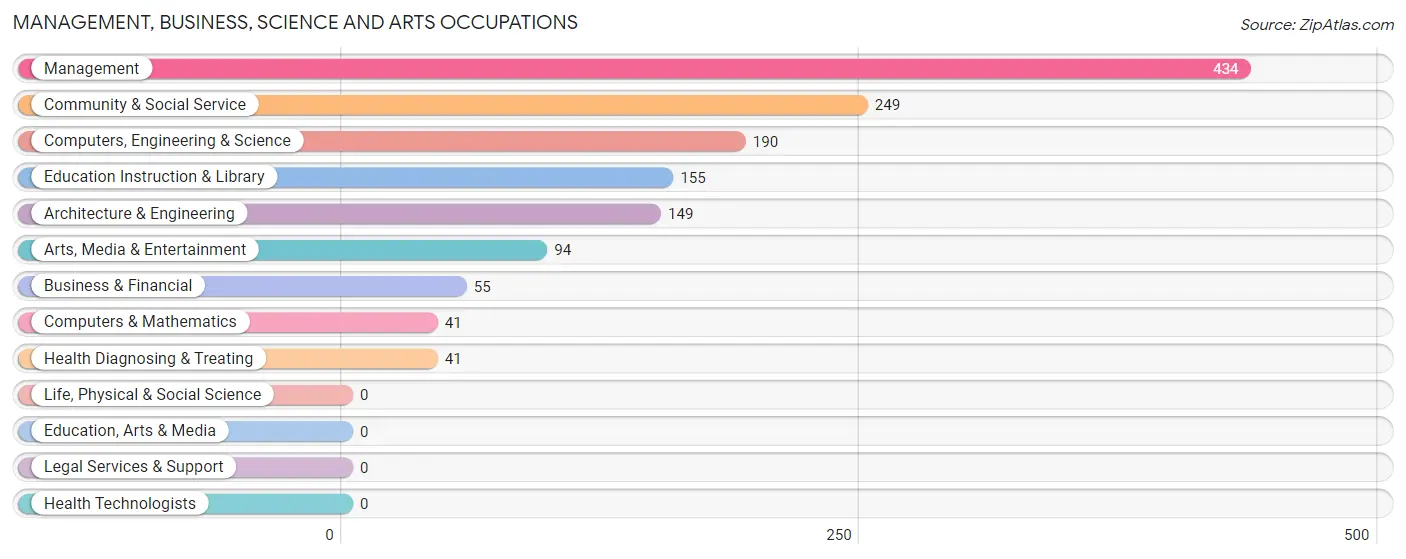
Management, Business, Science and Arts Occupations
The most common Management, Business, Science and Arts occupations in San Leon are Management (434 | 14.5%), Community & Social Service (249 | 8.3%), Computers, Engineering & Science (190 | 6.4%), Education Instruction & Library (155 | 5.2%), and Architecture & Engineering (149 | 5.0%).
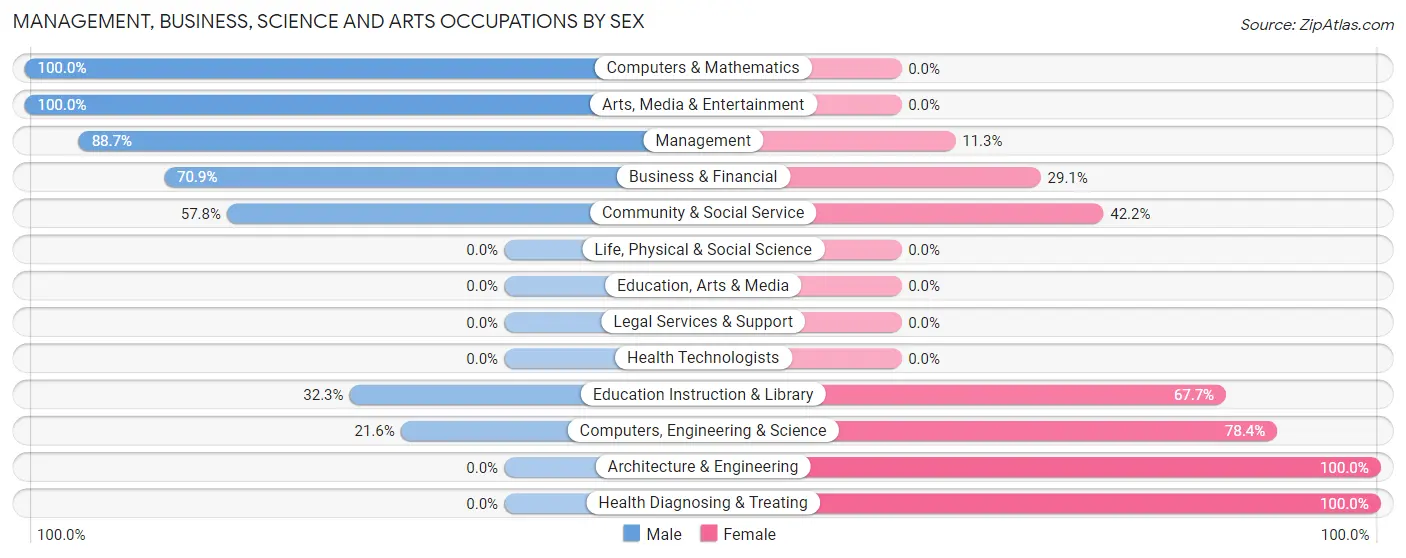
Management, Business, Science and Arts Occupations by Sex
Within the Management, Business, Science and Arts occupations in San Leon, the most male-oriented occupations are Computers & Mathematics (100.0%), Arts, Media & Entertainment (100.0%), and Management (88.7%), while the most female-oriented occupations are Architecture & Engineering (100.0%), Health Diagnosing & Treating (100.0%), and Computers, Engineering & Science (78.4%).
| Occupation | Male | Female |
| Management | 385 (88.7%) | 49 (11.3%) |
| Business & Financial | 39 (70.9%) | 16 (29.1%) |
| Computers, Engineering & Science | 41 (21.6%) | 149 (78.4%) |
| Computers & Mathematics | 41 (100.0%) | 0 (0.0%) |
| Architecture & Engineering | 0 (0.0%) | 149 (100.0%) |
| Life, Physical & Social Science | 0 (0.0%) | 0 (0.0%) |
| Community & Social Service | 144 (57.8%) | 105 (42.2%) |
| Education, Arts & Media | 0 (0.0%) | 0 (0.0%) |
| Legal Services & Support | 0 (0.0%) | 0 (0.0%) |
| Education Instruction & Library | 50 (32.3%) | 105 (67.7%) |
| Arts, Media & Entertainment | 94 (100.0%) | 0 (0.0%) |
| Health Diagnosing & Treating | 0 (0.0%) | 41 (100.0%) |
| Health Technologists | 0 (0.0%) | 0 (0.0%) |
| Total (Category) | 609 (62.8%) | 360 (37.1%) |
| Total (Overall) | 1,910 (63.9%) | 1,079 (36.1%) |
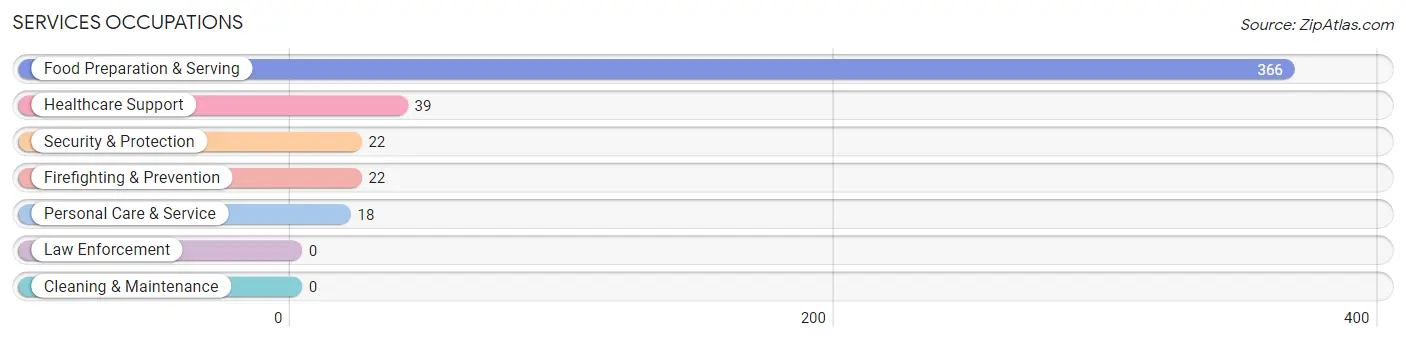
Services Occupations
The most common Services occupations in San Leon are Food Preparation & Serving (366 | 12.2%), Healthcare Support (39 | 1.3%), Security & Protection (22 | 0.7%), Firefighting & Prevention (22 | 0.7%), and Personal Care & Service (18 | 0.6%).
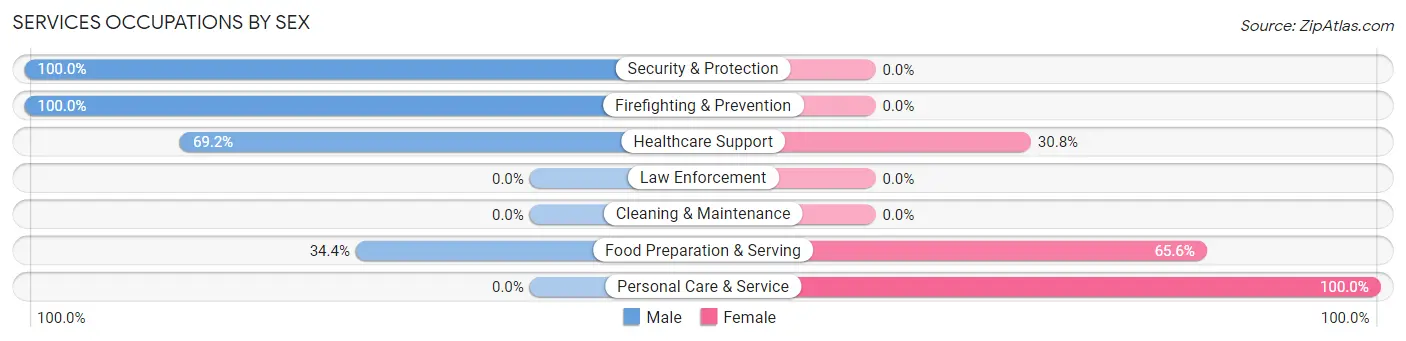
Services Occupations by Sex
Within the Services occupations in San Leon, the most male-oriented occupations are Security & Protection (100.0%), Firefighting & Prevention (100.0%), and Healthcare Support (69.2%), while the most female-oriented occupations are Personal Care & Service (100.0%), Food Preparation & Serving (65.6%), and Healthcare Support (30.8%).
| Occupation | Male | Female |
| Healthcare Support | 27 (69.2%) | 12 (30.8%) |
| Security & Protection | 22 (100.0%) | 0 (0.0%) |
| Firefighting & Prevention | 22 (100.0%) | 0 (0.0%) |
| Law Enforcement | 0 (0.0%) | 0 (0.0%) |
| Food Preparation & Serving | 126 (34.4%) | 240 (65.6%) |
| Cleaning & Maintenance | 0 (0.0%) | 0 (0.0%) |
| Personal Care & Service | 0 (0.0%) | 18 (100.0%) |
| Total (Category) | 175 (39.3%) | 270 (60.7%) |
| Total (Overall) | 1,910 (63.9%) | 1,079 (36.1%) |
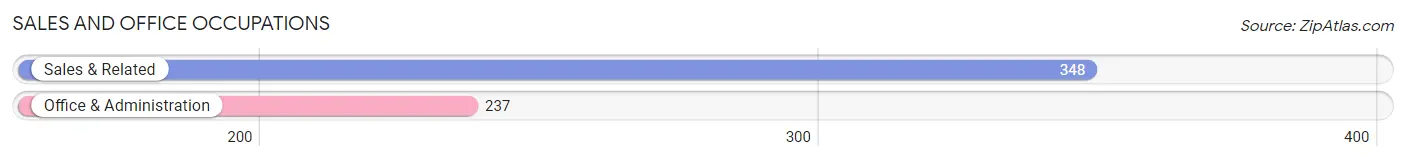
Sales and Office Occupations
The most common Sales and Office occupations in San Leon are Sales & Related (348 | 11.6%), and Office & Administration (237 | 7.9%).
Sales and Office Occupations by Sex
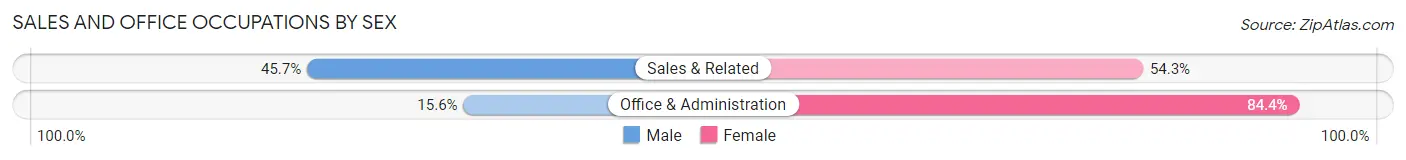
| Occupation | Male | Female |
| Sales & Related | 159 (45.7%) | 189 (54.3%) |
| Office & Administration | 37 (15.6%) | 200 (84.4%) |
| Total (Category) | 196 (33.5%) | 389 (66.5%) |
| Total (Overall) | 1,910 (63.9%) | 1,079 (36.1%) |
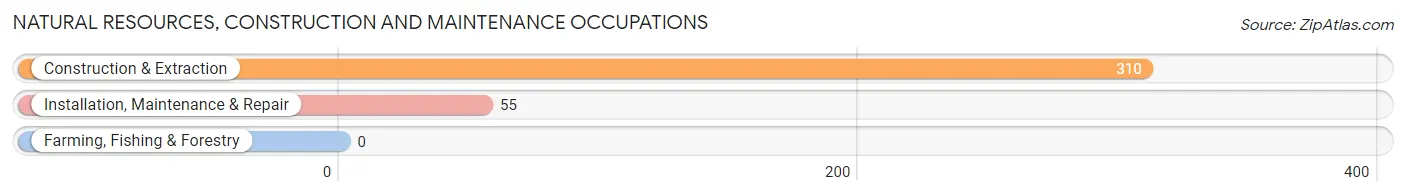
Natural Resources, Construction and Maintenance Occupations
The most common Natural Resources, Construction and Maintenance occupations in San Leon are Construction & Extraction (310 | 10.4%), and Installation, Maintenance & Repair (55 | 1.8%).
Natural Resources, Construction and Maintenance Occupations by Sex
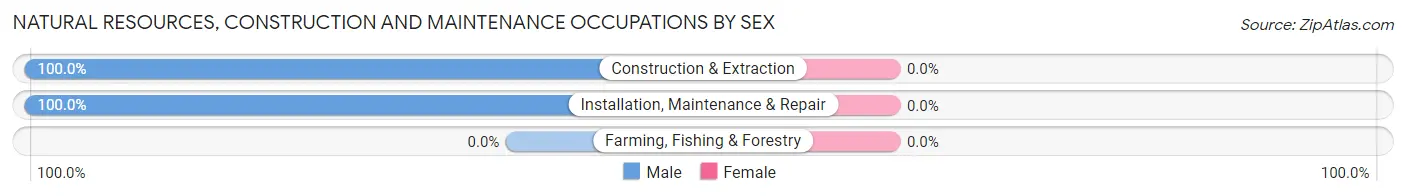
| Occupation | Male | Female |
| Farming, Fishing & Forestry | 0 (0.0%) | 0 (0.0%) |
| Construction & Extraction | 310 (100.0%) | 0 (0.0%) |
| Installation, Maintenance & Repair | 55 (100.0%) | 0 (0.0%) |
| Total (Category) | 365 (100.0%) | 0 (0.0%) |
| Total (Overall) | 1,910 (63.9%) | 1,079 (36.1%) |
Production, Transportation and Moving Occupations
The most common Production, Transportation and Moving occupations in San Leon are Production (305 | 10.2%), Transportation (182 | 6.1%), and Material Moving (138 | 4.6%).
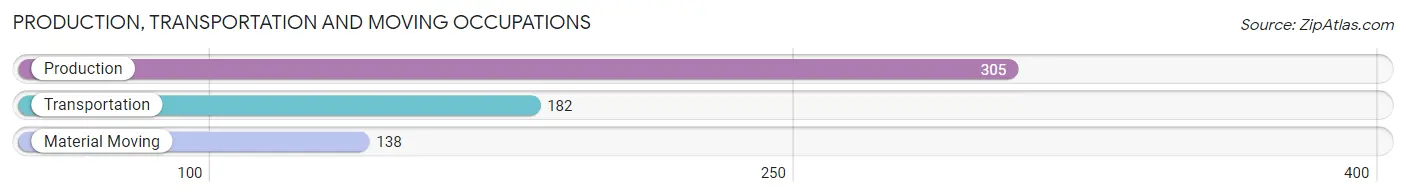
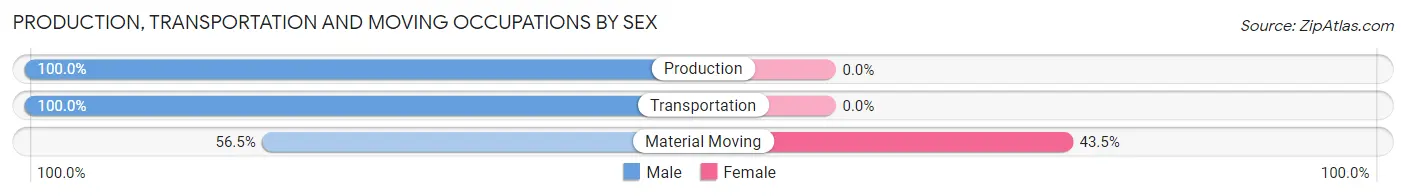
Production, Transportation and Moving Occupations by Sex
| Occupation | Male | Female |
| Production | 305 (100.0%) | 0 (0.0%) |
| Transportation | 182 (100.0%) | 0 (0.0%) |
| Material Moving | 78 (56.5%) | 60 (43.5%) |
| Total (Category) | 565 (90.4%) | 60 (9.6%) |
| Total (Overall) | 1,910 (63.9%) | 1,079 (36.1%) |
Employment Industries by Sex in San Leon
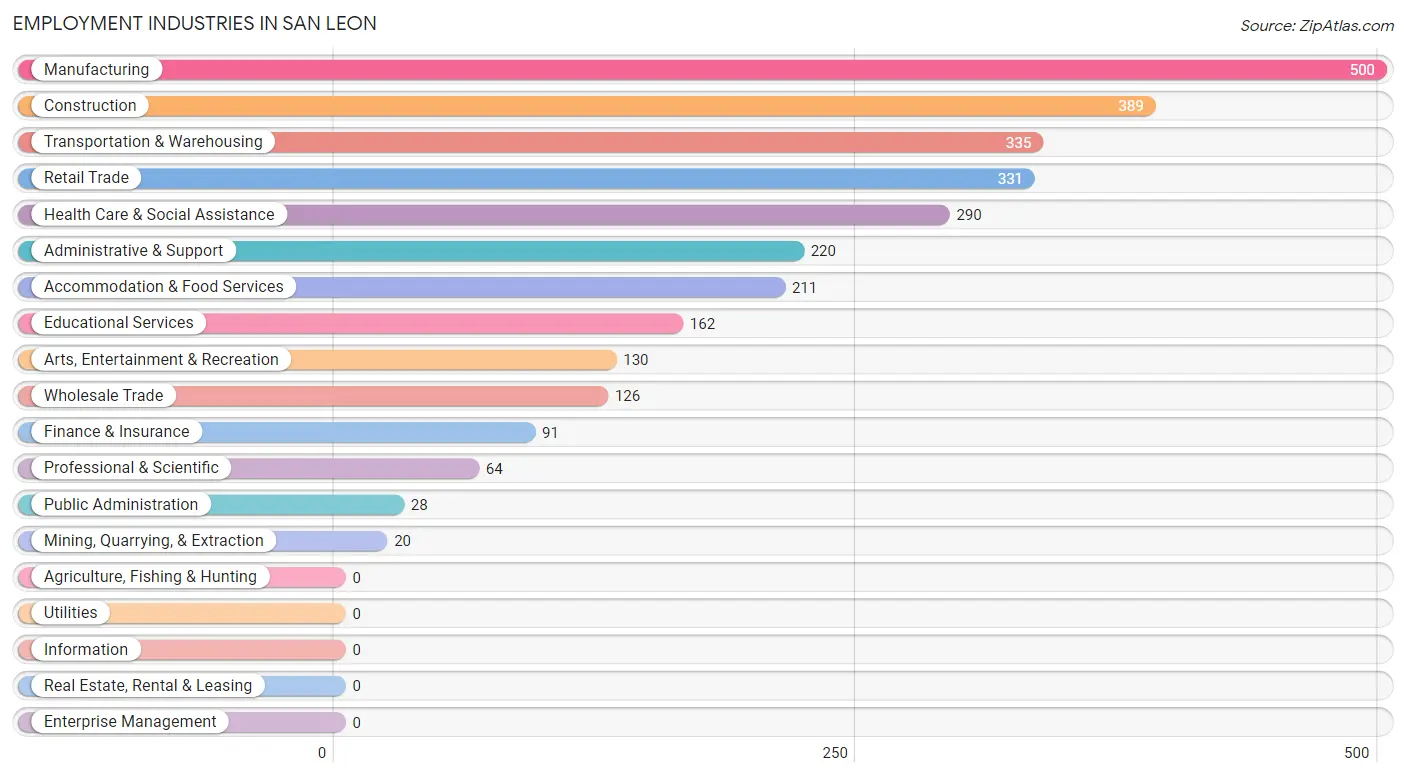
Employment Industries in San Leon
The major employment industries in San Leon include Manufacturing (500 | 16.7%), Construction (389 | 13.0%), Transportation & Warehousing (335 | 11.2%), Retail Trade (331 | 11.1%), and Health Care & Social Assistance (290 | 9.7%).
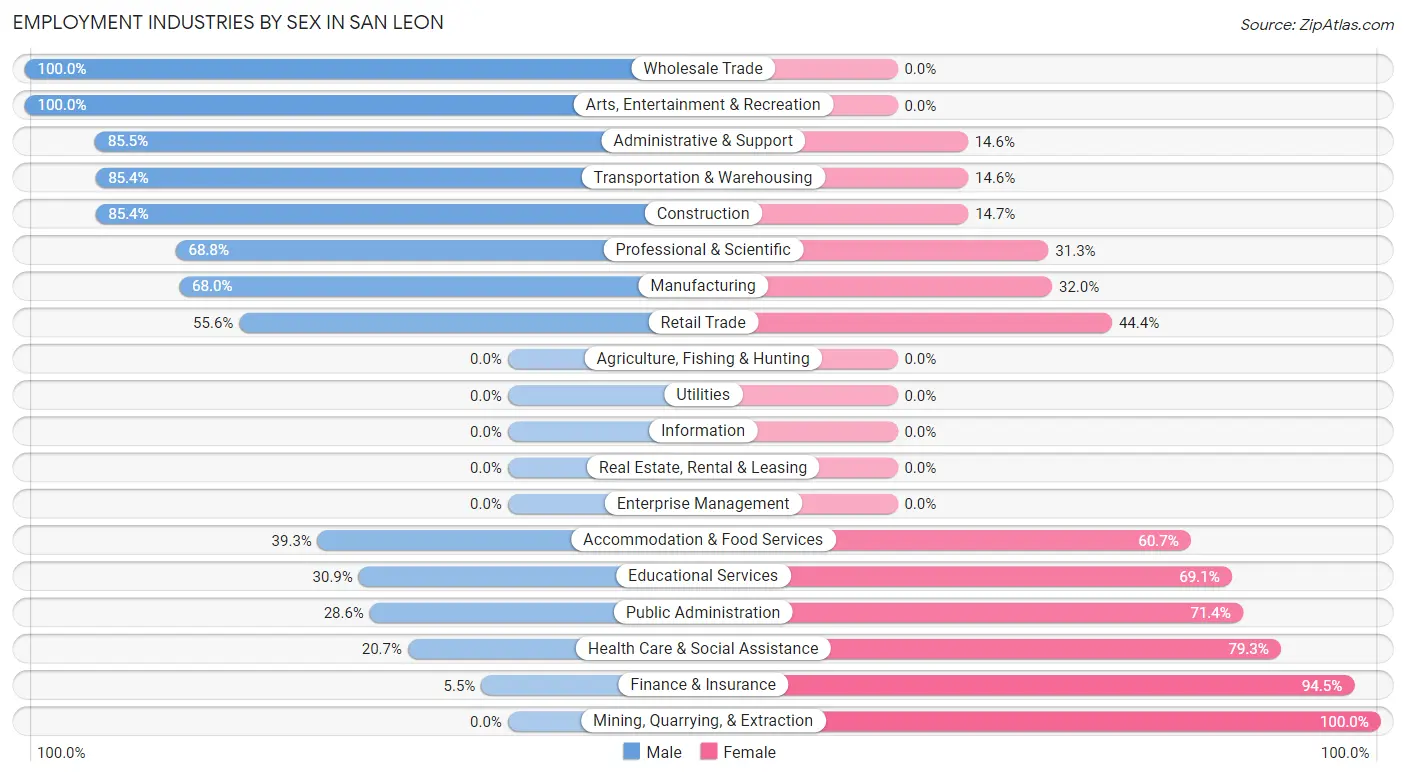
Employment Industries by Sex in San Leon
The San Leon industries that see more men than women are Wholesale Trade (100.0%), Arts, Entertainment & Recreation (100.0%), and Administrative & Support (85.5%), whereas the industries that tend to have a higher number of women are Mining, Quarrying, & Extraction (100.0%), Finance & Insurance (94.5%), and Health Care & Social Assistance (79.3%).
| Industry | Male | Female |
| Agriculture, Fishing & Hunting | 0 (0.0%) | 0 (0.0%) |
| Mining, Quarrying, & Extraction | 0 (0.0%) | 20 (100.0%) |
| Construction | 332 (85.4%) | 57 (14.6%) |
| Manufacturing | 340 (68.0%) | 160 (32.0%) |
| Wholesale Trade | 126 (100.0%) | 0 (0.0%) |
| Retail Trade | 184 (55.6%) | 147 (44.4%) |
| Transportation & Warehousing | 286 (85.4%) | 49 (14.6%) |
| Utilities | 0 (0.0%) | 0 (0.0%) |
| Information | 0 (0.0%) | 0 (0.0%) |
| Finance & Insurance | 5 (5.5%) | 86 (94.5%) |
| Real Estate, Rental & Leasing | 0 (0.0%) | 0 (0.0%) |
| Professional & Scientific | 44 (68.8%) | 20 (31.2%) |
| Enterprise Management | 0 (0.0%) | 0 (0.0%) |
| Administrative & Support | 188 (85.5%) | 32 (14.5%) |
| Educational Services | 50 (30.9%) | 112 (69.1%) |
| Health Care & Social Assistance | 60 (20.7%) | 230 (79.3%) |
| Arts, Entertainment & Recreation | 130 (100.0%) | 0 (0.0%) |
| Accommodation & Food Services | 83 (39.3%) | 128 (60.7%) |
| Public Administration | 8 (28.6%) | 20 (71.4%) |
| Total | 1,910 (63.9%) | 1,079 (36.1%) |
Education in San Leon
School Enrollment in San Leon
The most common levels of schooling among the 837 students in San Leon are high school (319 | 38.1%), college / undergraduate (209 | 25.0%), and elementary school (144 | 17.2%).
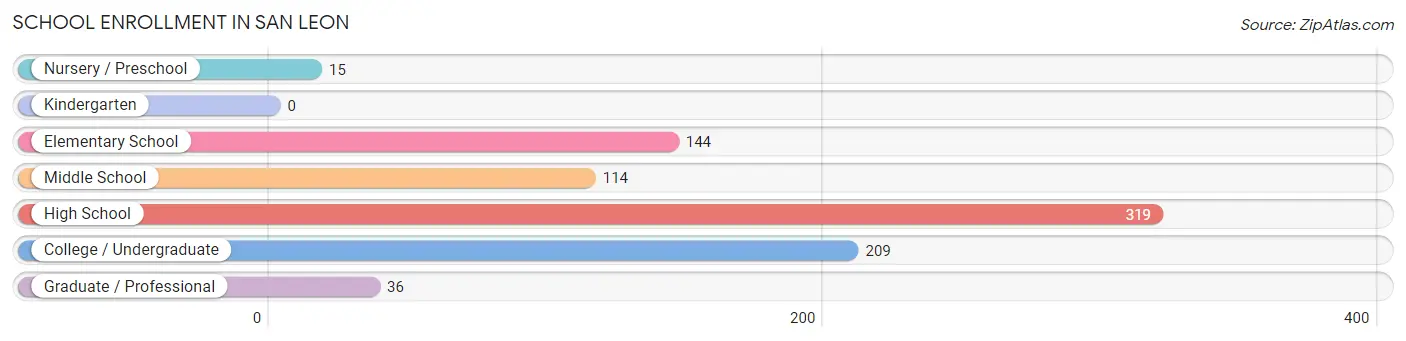
| School Level | # Students | % Students |
| Nursery / Preschool | 15 | 1.8% |
| Kindergarten | 0 | 0.0% |
| Elementary School | 144 | 17.2% |
| Middle School | 114 | 13.6% |
| High School | 319 | 38.1% |
| College / Undergraduate | 209 | 25.0% |
| Graduate / Professional | 36 | 4.3% |
| Total | 837 | 100.0% |
School Enrollment by Age by Funding Source in San Leon
Out of a total of 837 students who are enrolled in schools in San Leon, 33 (3.9%) attend a private institution, while the remaining 804 (96.1%) are enrolled in public schools. The age group of 25 to 34 year olds has the highest likelihood of being enrolled in private schools, with 16 (28.1% in the age bracket) enrolled. Conversely, the age group of 3 to 4 year olds has the lowest likelihood of being enrolled in a private school, with 15 (100.0% in the age bracket) attending a public institution.
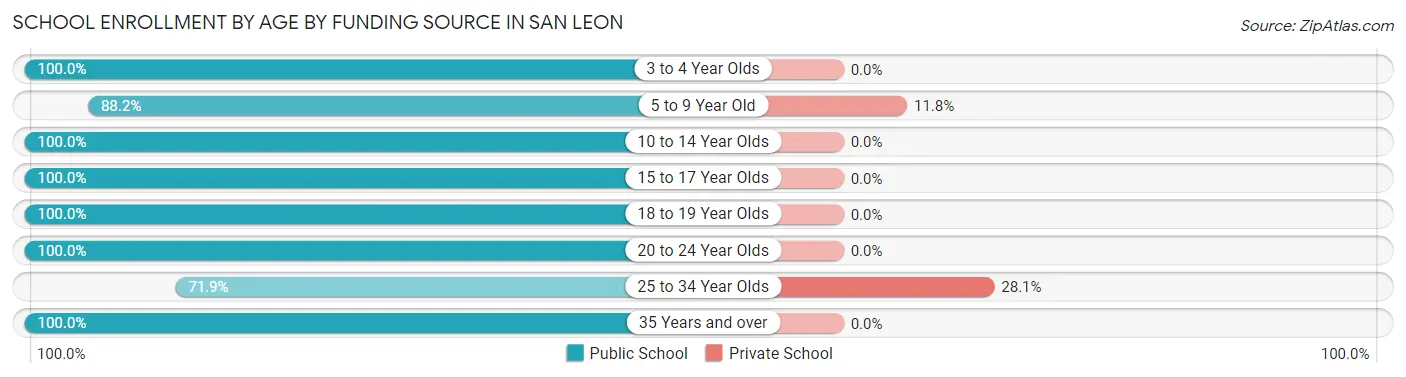
| Age Bracket | Public School | Private School |
| 3 to 4 Year Olds | 15 (100.0%) | 0 (0.0%) |
| 5 to 9 Year Old | 127 (88.2%) | 17 (11.8%) |
| 10 to 14 Year Olds | 200 (100.0%) | 0 (0.0%) |
| 15 to 17 Year Olds | 133 (100.0%) | 0 (0.0%) |
| 18 to 19 Year Olds | 124 (100.0%) | 0 (0.0%) |
| 20 to 24 Year Olds | 109 (100.0%) | 0 (0.0%) |
| 25 to 34 Year Olds | 41 (71.9%) | 16 (28.1%) |
| 35 Years and over | 55 (100.0%) | 0 (0.0%) |
| Total | 804 (96.1%) | 33 (3.9%) |
Educational Attainment by Field of Study in San Leon
Engineering (120 | 19.2%), bio, nature & agricultural (85 | 13.6%), social sciences (76 | 12.2%), computers & mathematics (68 | 10.9%), and psychology (50 | 8.0%) are the most common fields of study among 625 individuals in San Leon who have obtained a bachelor's degree or higher.
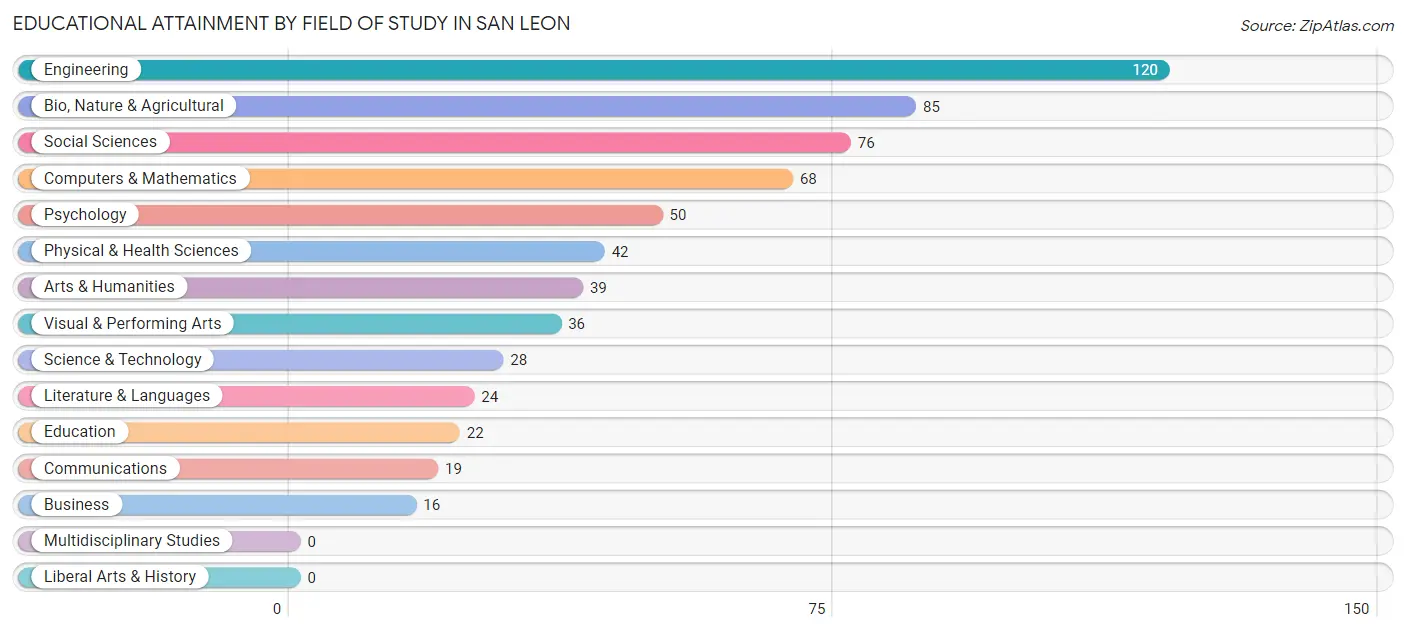
| Field of Study | # Graduates | % Graduates |
| Computers & Mathematics | 68 | 10.9% |
| Bio, Nature & Agricultural | 85 | 13.6% |
| Physical & Health Sciences | 42 | 6.7% |
| Psychology | 50 | 8.0% |
| Social Sciences | 76 | 12.2% |
| Engineering | 120 | 19.2% |
| Multidisciplinary Studies | 0 | 0.0% |
| Science & Technology | 28 | 4.5% |
| Business | 16 | 2.6% |
| Education | 22 | 3.5% |
| Literature & Languages | 24 | 3.8% |
| Liberal Arts & History | 0 | 0.0% |
| Visual & Performing Arts | 36 | 5.8% |
| Communications | 19 | 3.0% |
| Arts & Humanities | 39 | 6.2% |
| Total | 625 | 100.0% |
Transportation & Commute in San Leon
Vehicle Availability by Sex in San Leon
The most prevalent vehicle ownership categories in San Leon are males with 2 vehicles (615, accounting for 33.5%) and females with 2 vehicles (314, making up 64.5%).
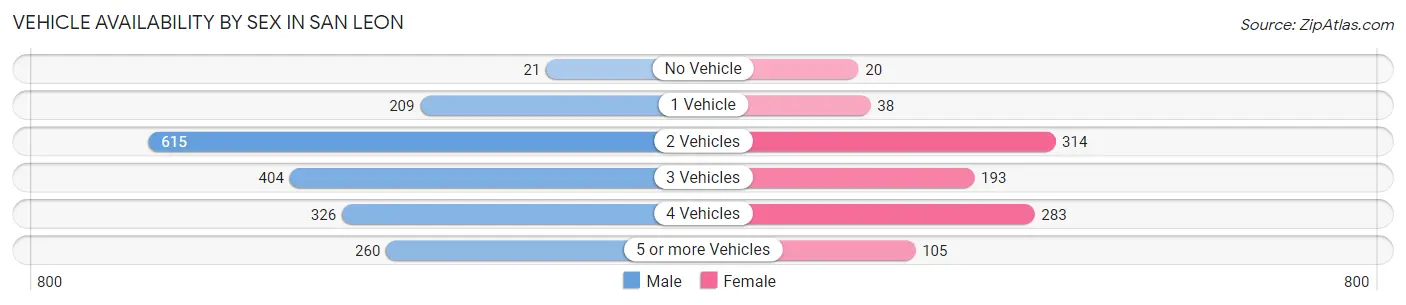
| Vehicles Available | Male | Female |
| No Vehicle | 21 (1.1%) | 20 (2.1%) |
| 1 Vehicle | 209 (11.4%) | 38 (4.0%) |
| 2 Vehicles | 615 (33.5%) | 314 (33.0%) |
| 3 Vehicles | 404 (22.0%) | 193 (20.3%) |
| 4 Vehicles | 326 (17.8%) | 283 (29.7%) |
| 5 or more Vehicles | 260 (14.2%) | 105 (11.0%) |
| Total | 1,835 (100.0%) | 953 (100.0%) |
Commute Time in San Leon
The most frequently occuring commute durations in San Leon are 20 to 24 minutes (443 commuters, 17.6%), 5 to 9 minutes (317 commuters, 12.6%), and 15 to 19 minutes (317 commuters, 12.6%).
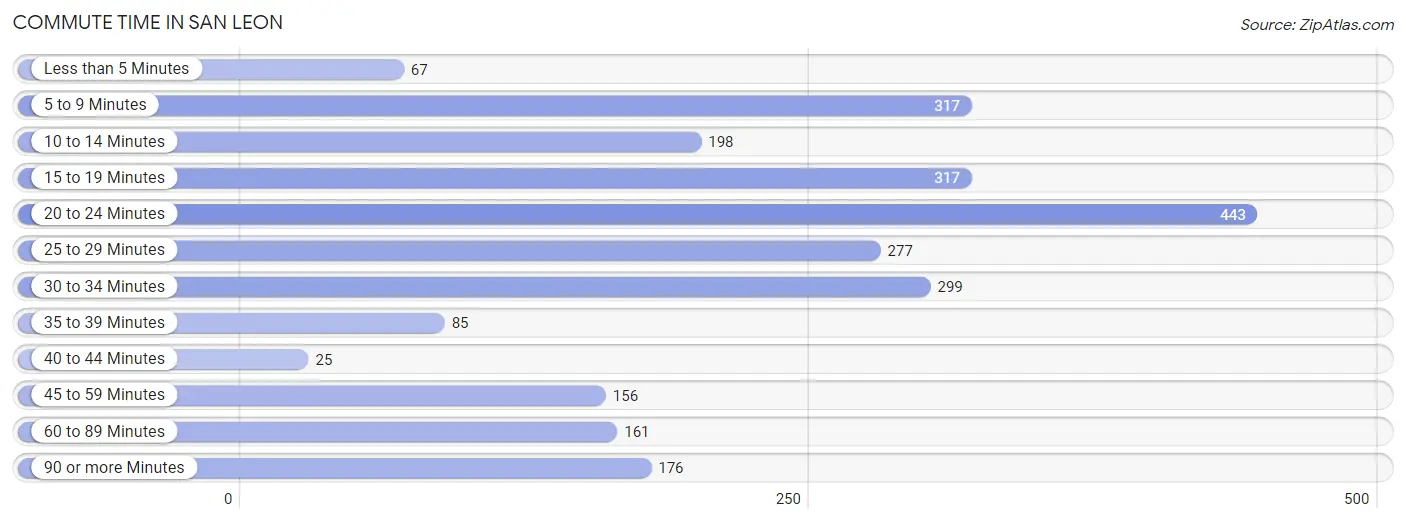
| Commute Time | # Commuters | % Commuters |
| Less than 5 Minutes | 67 | 2.7% |
| 5 to 9 Minutes | 317 | 12.6% |
| 10 to 14 Minutes | 198 | 7.9% |
| 15 to 19 Minutes | 317 | 12.6% |
| 20 to 24 Minutes | 443 | 17.6% |
| 25 to 29 Minutes | 277 | 11.0% |
| 30 to 34 Minutes | 299 | 11.9% |
| 35 to 39 Minutes | 85 | 3.4% |
| 40 to 44 Minutes | 25 | 1.0% |
| 45 to 59 Minutes | 156 | 6.2% |
| 60 to 89 Minutes | 161 | 6.4% |
| 90 or more Minutes | 176 | 7.0% |
Commute Time by Sex in San Leon
The most common commute times in San Leon are 20 to 24 minutes (296 commuters, 16.8%) for males and 20 to 24 minutes (147 commuters, 19.4%) for females.
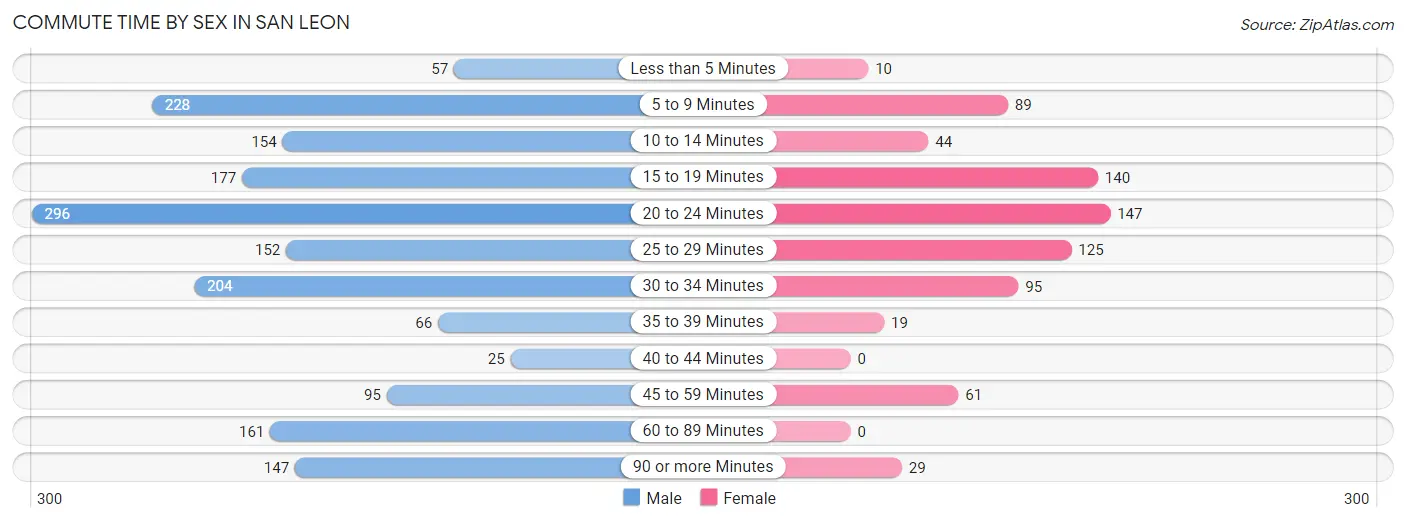
| Commute Time | Male | Female |
| Less than 5 Minutes | 57 (3.2%) | 10 (1.3%) |
| 5 to 9 Minutes | 228 (12.9%) | 89 (11.7%) |
| 10 to 14 Minutes | 154 (8.7%) | 44 (5.8%) |
| 15 to 19 Minutes | 177 (10.1%) | 140 (18.4%) |
| 20 to 24 Minutes | 296 (16.8%) | 147 (19.4%) |
| 25 to 29 Minutes | 152 (8.6%) | 125 (16.5%) |
| 30 to 34 Minutes | 204 (11.6%) | 95 (12.5%) |
| 35 to 39 Minutes | 66 (3.7%) | 19 (2.5%) |
| 40 to 44 Minutes | 25 (1.4%) | 0 (0.0%) |
| 45 to 59 Minutes | 95 (5.4%) | 61 (8.0%) |
| 60 to 89 Minutes | 161 (9.1%) | 0 (0.0%) |
| 90 or more Minutes | 147 (8.3%) | 29 (3.8%) |
Time of Departure to Work by Sex in San Leon
The most frequent times of departure to work in San Leon are 6:00 AM to 6:29 AM (283, 16.1%) for males and 8:00 AM to 8:29 AM (185, 24.4%) for females.
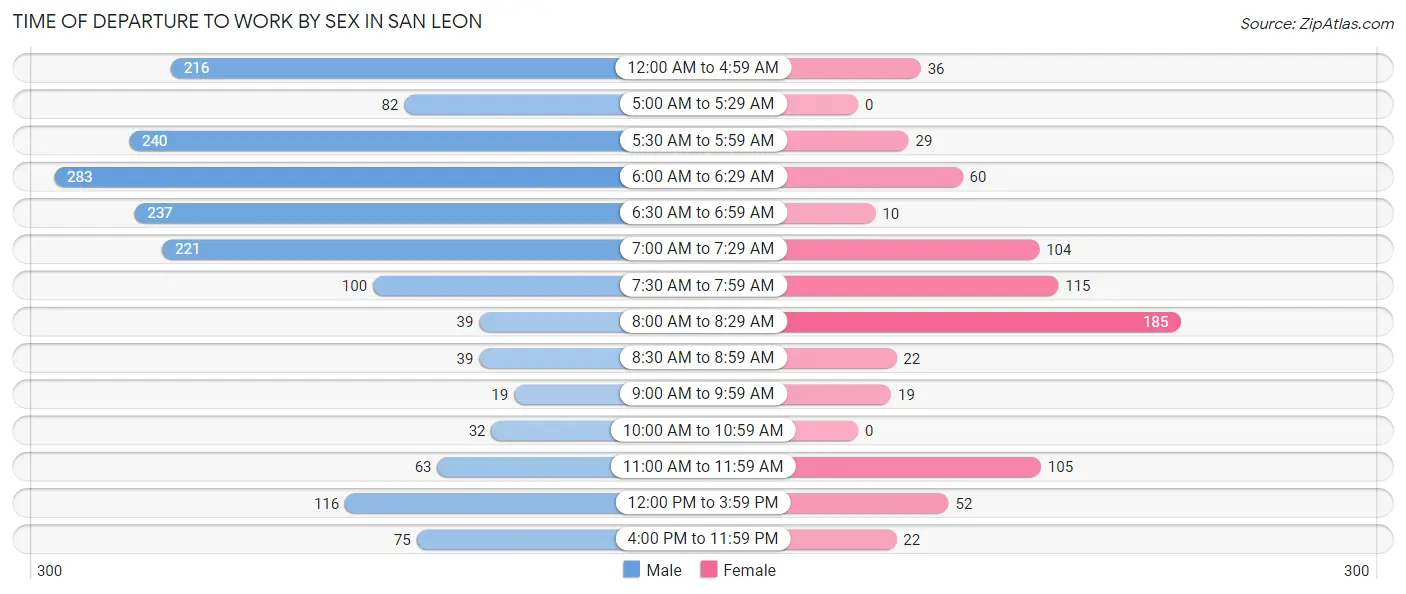
| Time of Departure | Male | Female |
| 12:00 AM to 4:59 AM | 216 (12.3%) | 36 (4.7%) |
| 5:00 AM to 5:29 AM | 82 (4.6%) | 0 (0.0%) |
| 5:30 AM to 5:59 AM | 240 (13.6%) | 29 (3.8%) |
| 6:00 AM to 6:29 AM | 283 (16.1%) | 60 (7.9%) |
| 6:30 AM to 6:59 AM | 237 (13.5%) | 10 (1.3%) |
| 7:00 AM to 7:29 AM | 221 (12.5%) | 104 (13.7%) |
| 7:30 AM to 7:59 AM | 100 (5.7%) | 115 (15.1%) |
| 8:00 AM to 8:29 AM | 39 (2.2%) | 185 (24.4%) |
| 8:30 AM to 8:59 AM | 39 (2.2%) | 22 (2.9%) |
| 9:00 AM to 9:59 AM | 19 (1.1%) | 19 (2.5%) |
| 10:00 AM to 10:59 AM | 32 (1.8%) | 0 (0.0%) |
| 11:00 AM to 11:59 AM | 63 (3.6%) | 105 (13.8%) |
| 12:00 PM to 3:59 PM | 116 (6.6%) | 52 (6.9%) |
| 4:00 PM to 11:59 PM | 75 (4.3%) | 22 (2.9%) |
| Total | 1,762 (100.0%) | 759 (100.0%) |
Housing Occupancy in San Leon
Occupancy by Ownership in San Leon
Of the total 2,472 dwellings in San Leon, owner-occupied units account for 1,931 (78.1%), while renter-occupied units make up 541 (21.9%).
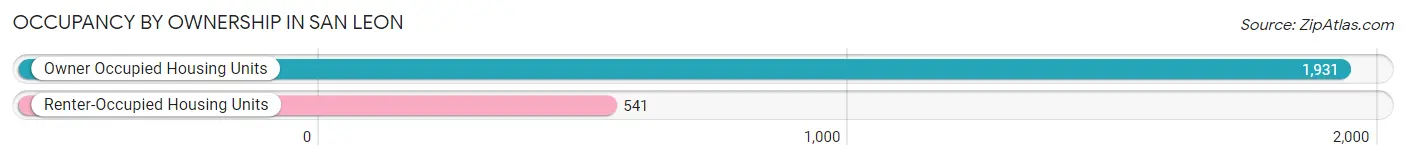
| Occupancy | # Housing Units | % Housing Units |
| Owner Occupied Housing Units | 1,931 | 78.1% |
| Renter-Occupied Housing Units | 541 | 21.9% |
| Total Occupied Housing Units | 2,472 | 100.0% |
Occupancy by Household Size in San Leon
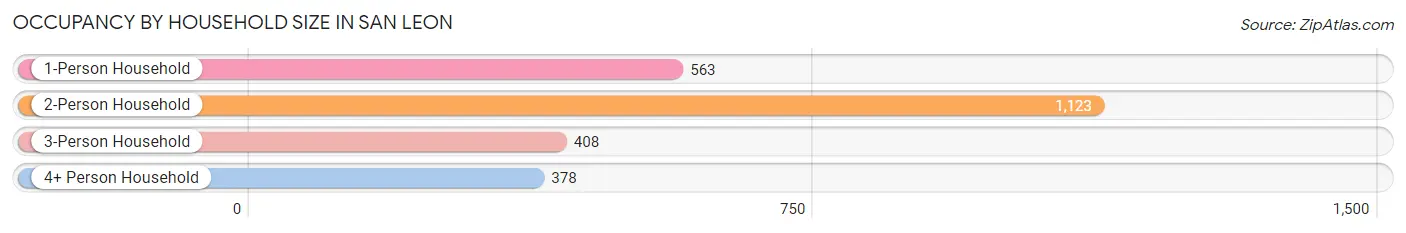
| Household Size | # Housing Units | % Housing Units |
| 1-Person Household | 563 | 22.8% |
| 2-Person Household | 1,123 | 45.4% |
| 3-Person Household | 408 | 16.5% |
| 4+ Person Household | 378 | 15.3% |
| Total Housing Units | 2,472 | 100.0% |
Occupancy by Ownership by Household Size in San Leon
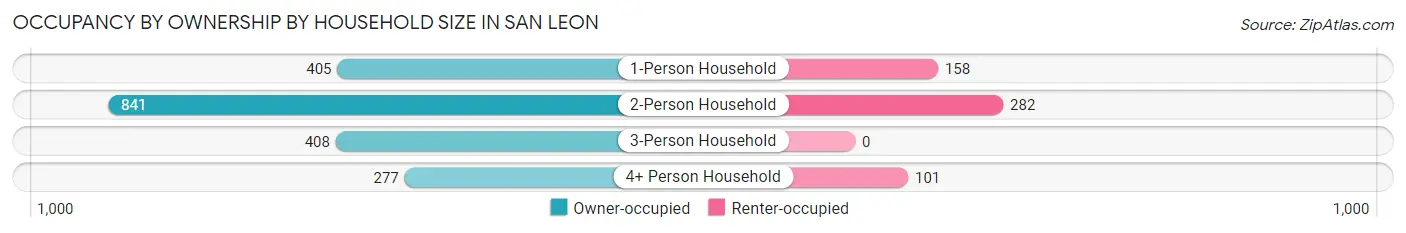
| Household Size | Owner-occupied | Renter-occupied |
| 1-Person Household | 405 (71.9%) | 158 (28.1%) |
| 2-Person Household | 841 (74.9%) | 282 (25.1%) |
| 3-Person Household | 408 (100.0%) | 0 (0.0%) |
| 4+ Person Household | 277 (73.3%) | 101 (26.7%) |
| Total Housing Units | 1,931 (78.1%) | 541 (21.9%) |
Occupancy by Educational Attainment in San Leon
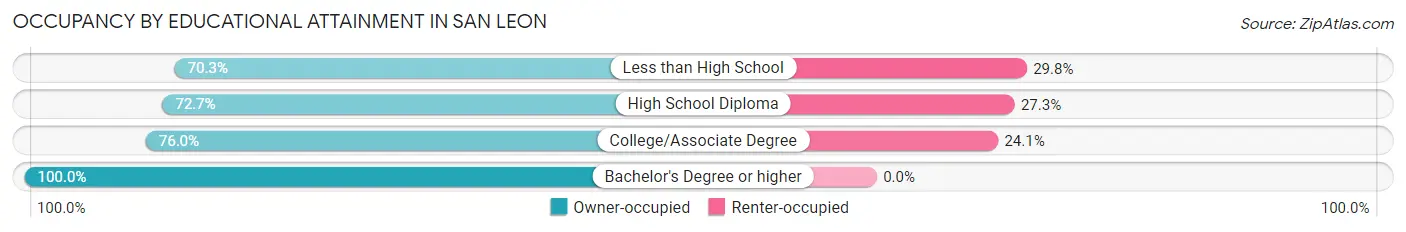
| Household Size | Owner-occupied | Renter-occupied |
| Less than High School | 307 (70.3%) | 130 (29.7%) |
| High School Diploma | 439 (72.7%) | 165 (27.3%) |
| College/Associate Degree | 777 (75.9%) | 246 (24.0%) |
| Bachelor's Degree or higher | 408 (100.0%) | 0 (0.0%) |
Occupancy by Age of Householder in San Leon
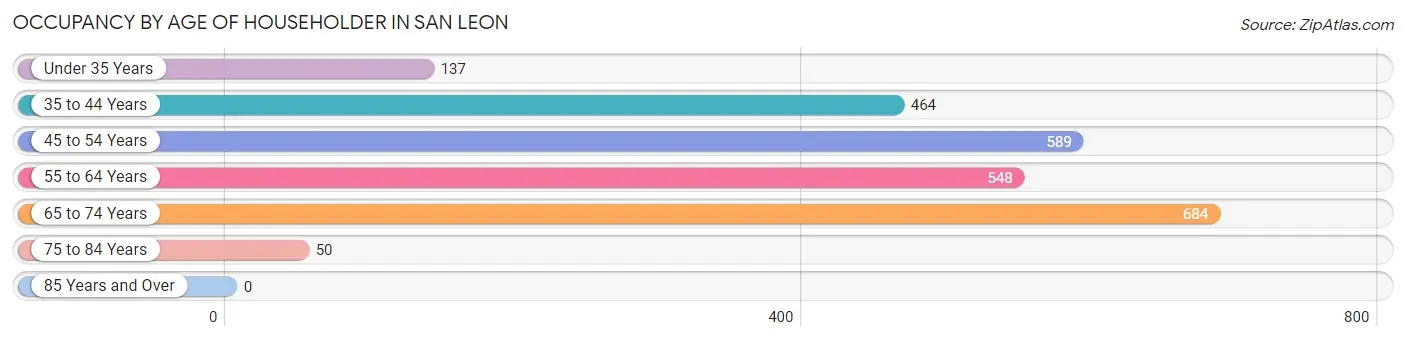
| Age Bracket | # Households | % Households |
| Under 35 Years | 137 | 5.5% |
| 35 to 44 Years | 464 | 18.8% |
| 45 to 54 Years | 589 | 23.8% |
| 55 to 64 Years | 548 | 22.2% |
| 65 to 74 Years | 684 | 27.7% |
| 75 to 84 Years | 50 | 2.0% |
| 85 Years and Over | 0 | 0.0% |
| Total | 2,472 | 100.0% |
Housing Finances in San Leon
Median Income by Occupancy in San Leon
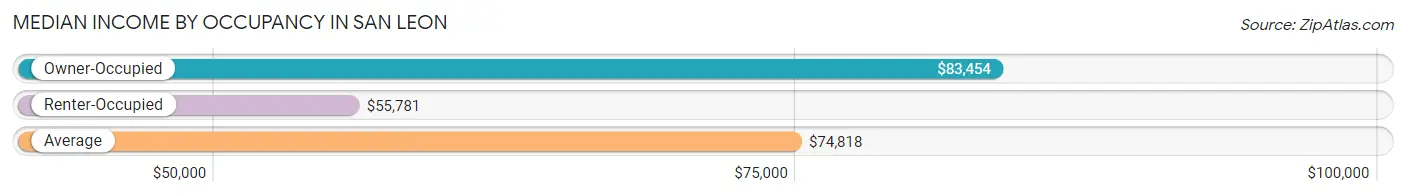
| Occupancy Type | # Households | Median Income |
| Owner-Occupied | 1,931 (78.1%) | $83,454 |
| Renter-Occupied | 541 (21.9%) | $55,781 |
| Average | 2,472 (100.0%) | $74,818 |
Occupancy by Householder Income Bracket in San Leon
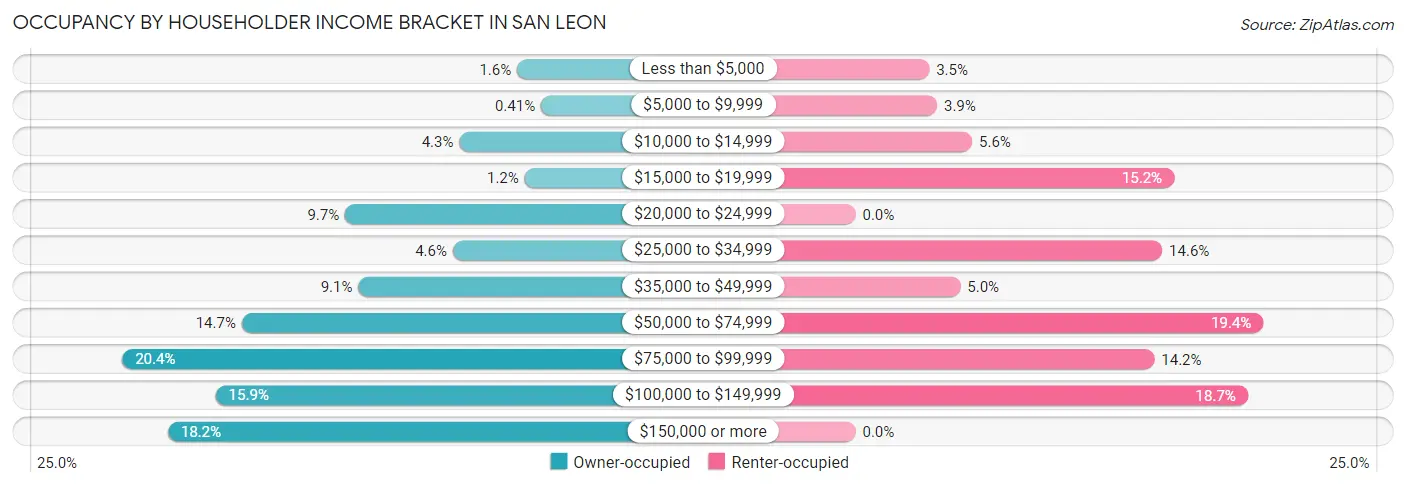
| Income Bracket | Owner-occupied | Renter-occupied |
| Less than $5,000 | 30 (1.5%) | 19 (3.5%) |
| $5,000 to $9,999 | 8 (0.4%) | 21 (3.9%) |
| $10,000 to $14,999 | 83 (4.3%) | 30 (5.6%) |
| $15,000 to $19,999 | 23 (1.2%) | 82 (15.2%) |
| $20,000 to $24,999 | 188 (9.7%) | 0 (0.0%) |
| $25,000 to $34,999 | 89 (4.6%) | 79 (14.6%) |
| $35,000 to $49,999 | 176 (9.1%) | 27 (5.0%) |
| $50,000 to $74,999 | 283 (14.7%) | 105 (19.4%) |
| $75,000 to $99,999 | 393 (20.3%) | 77 (14.2%) |
| $100,000 to $149,999 | 307 (15.9%) | 101 (18.7%) |
| $150,000 or more | 351 (18.2%) | 0 (0.0%) |
| Total | 1,931 (100.0%) | 541 (100.0%) |
Monthly Housing Cost Tiers in San Leon
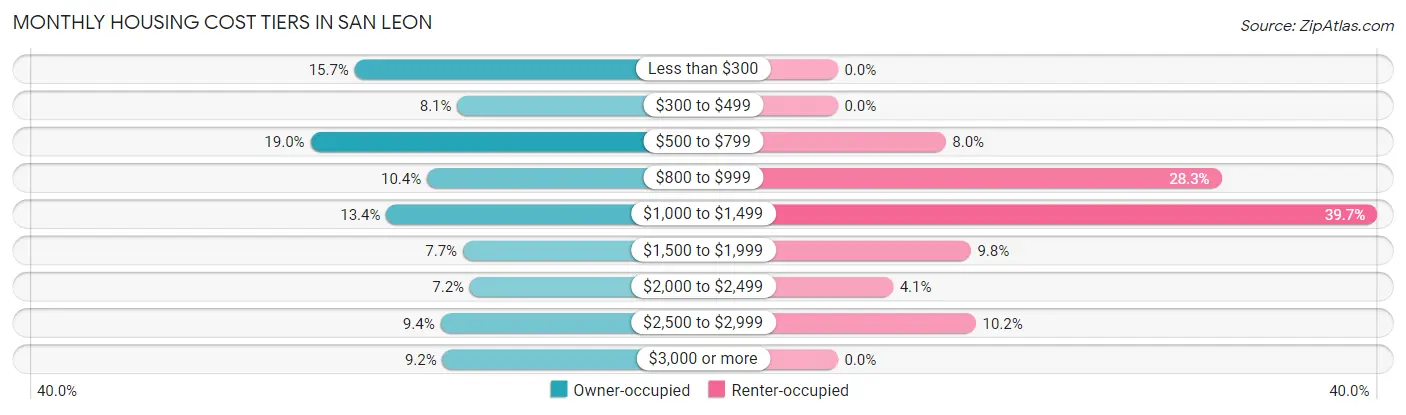
| Monthly Cost | Owner-occupied | Renter-occupied |
| Less than $300 | 303 (15.7%) | 0 (0.0%) |
| $300 to $499 | 157 (8.1%) | 0 (0.0%) |
| $500 to $799 | 366 (19.0%) | 43 (8.0%) |
| $800 to $999 | 200 (10.4%) | 153 (28.3%) |
| $1,000 to $1,499 | 258 (13.4%) | 215 (39.7%) |
| $1,500 to $1,999 | 149 (7.7%) | 53 (9.8%) |
| $2,000 to $2,499 | 139 (7.2%) | 22 (4.1%) |
| $2,500 to $2,999 | 181 (9.4%) | 55 (10.2%) |
| $3,000 or more | 178 (9.2%) | 0 (0.0%) |
| Total | 1,931 (100.0%) | 541 (100.0%) |
Physical Housing Characteristics in San Leon
Housing Structures in San Leon
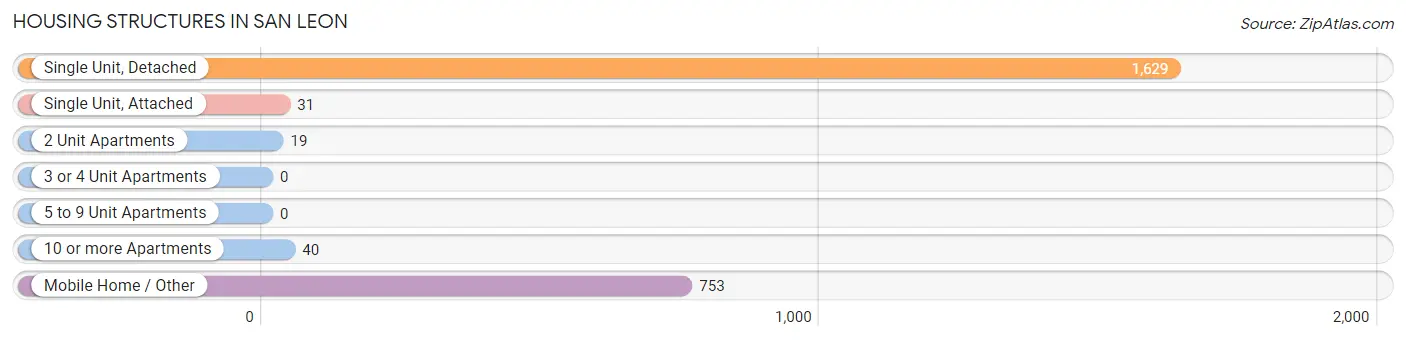
| Structure Type | # Housing Units | % Housing Units |
| Single Unit, Detached | 1,629 | 65.9% |
| Single Unit, Attached | 31 | 1.3% |
| 2 Unit Apartments | 19 | 0.8% |
| 3 or 4 Unit Apartments | 0 | 0.0% |
| 5 to 9 Unit Apartments | 0 | 0.0% |
| 10 or more Apartments | 40 | 1.6% |
| Mobile Home / Other | 753 | 30.5% |
| Total | 2,472 | 100.0% |
Housing Structures by Occupancy in San Leon
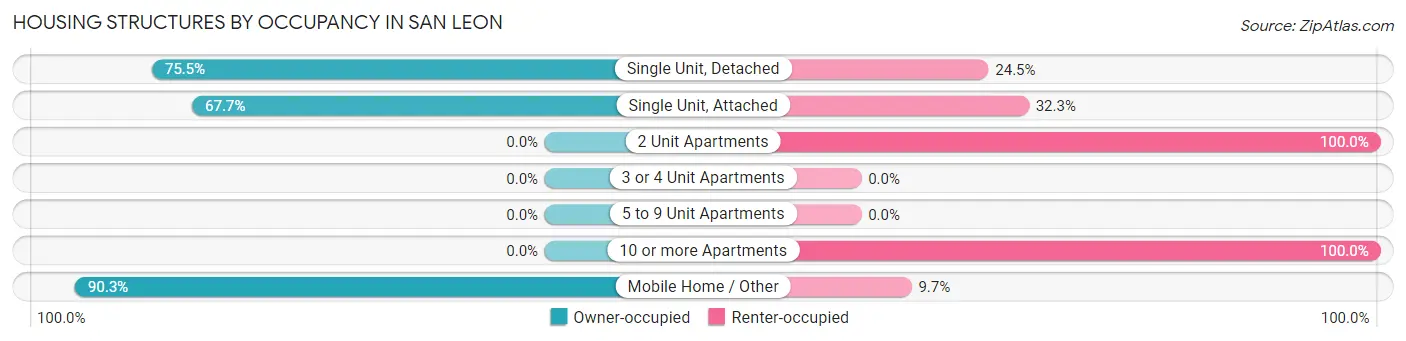
| Structure Type | Owner-occupied | Renter-occupied |
| Single Unit, Detached | 1,230 (75.5%) | 399 (24.5%) |
| Single Unit, Attached | 21 (67.7%) | 10 (32.3%) |
| 2 Unit Apartments | 0 (0.0%) | 19 (100.0%) |
| 3 or 4 Unit Apartments | 0 (0.0%) | 0 (0.0%) |
| 5 to 9 Unit Apartments | 0 (0.0%) | 0 (0.0%) |
| 10 or more Apartments | 0 (0.0%) | 40 (100.0%) |
| Mobile Home / Other | 680 (90.3%) | 73 (9.7%) |
| Total | 1,931 (78.1%) | 541 (21.9%) |
Housing Structures by Number of Rooms in San Leon
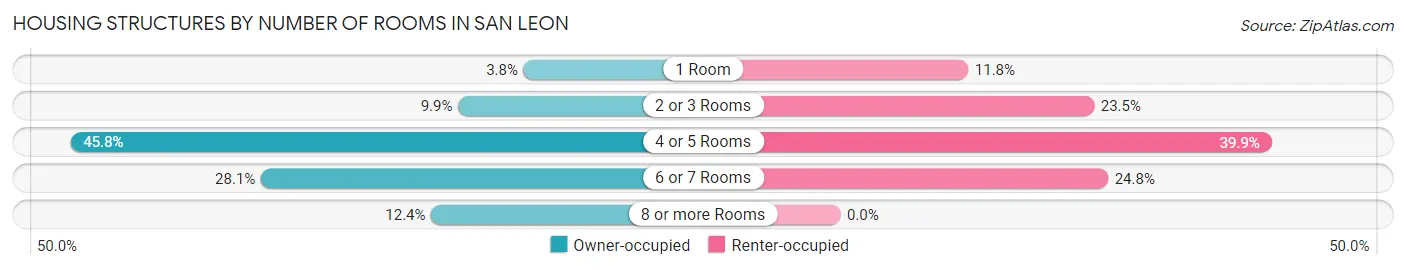
| Number of Rooms | Owner-occupied | Renter-occupied |
| 1 Room | 74 (3.8%) | 64 (11.8%) |
| 2 or 3 Rooms | 191 (9.9%) | 127 (23.5%) |
| 4 or 5 Rooms | 884 (45.8%) | 216 (39.9%) |
| 6 or 7 Rooms | 543 (28.1%) | 134 (24.8%) |
| 8 or more Rooms | 239 (12.4%) | 0 (0.0%) |
| Total | 1,931 (100.0%) | 541 (100.0%) |
Housing Structure by Heating Type in San Leon
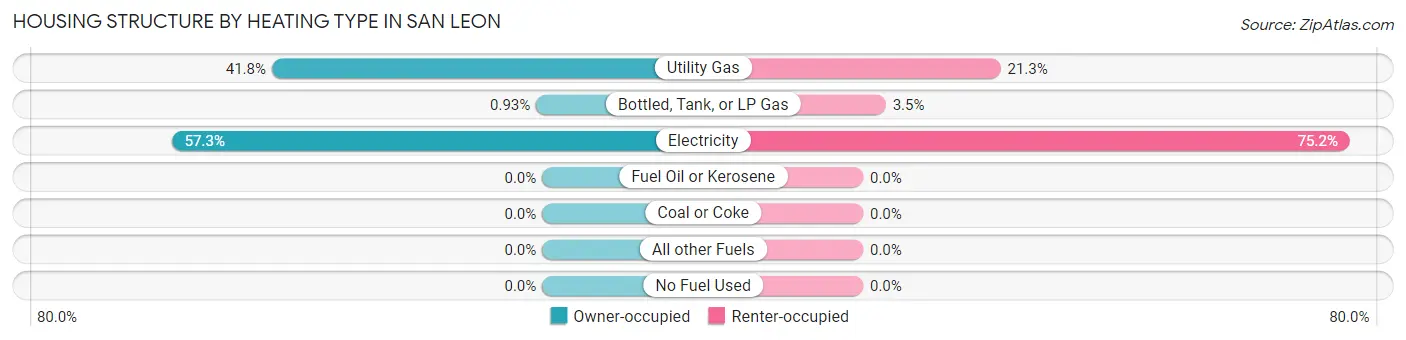
| Heating Type | Owner-occupied | Renter-occupied |
| Utility Gas | 807 (41.8%) | 115 (21.3%) |
| Bottled, Tank, or LP Gas | 18 (0.9%) | 19 (3.5%) |
| Electricity | 1,106 (57.3%) | 407 (75.2%) |
| Fuel Oil or Kerosene | 0 (0.0%) | 0 (0.0%) |
| Coal or Coke | 0 (0.0%) | 0 (0.0%) |
| All other Fuels | 0 (0.0%) | 0 (0.0%) |
| No Fuel Used | 0 (0.0%) | 0 (0.0%) |
| Total | 1,931 (100.0%) | 541 (100.0%) |
Household Vehicle Usage in San Leon
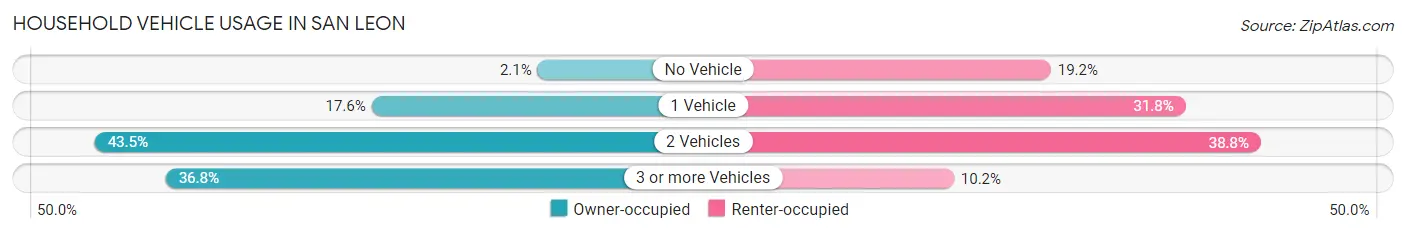
| Vehicles per Household | Owner-occupied | Renter-occupied |
| No Vehicle | 41 (2.1%) | 104 (19.2%) |
| 1 Vehicle | 340 (17.6%) | 172 (31.8%) |
| 2 Vehicles | 839 (43.4%) | 210 (38.8%) |
| 3 or more Vehicles | 711 (36.8%) | 55 (10.2%) |
| Total | 1,931 (100.0%) | 541 (100.0%) |
Real Estate & Mortgages in San Leon
Real Estate and Mortgage Overview in San Leon
| Characteristic | Without Mortgage | With Mortgage |
| Housing Units | 1,057 | 874 |
| Median Property Value | - | - |
| Median Household Income | $63,723 | $324 |
| Monthly Housing Costs | $552 | $178 |
| Real Estate Taxes | $1,264 | $29 |
Property Value by Mortgage Status in San Leon
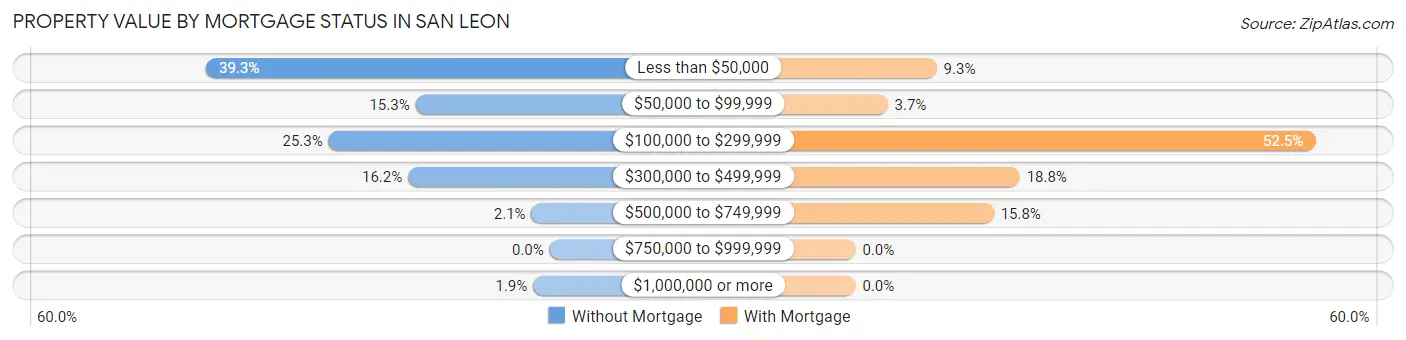
| Property Value | Without Mortgage | With Mortgage |
| Less than $50,000 | 415 (39.3%) | 81 (9.3%) |
| $50,000 to $99,999 | 162 (15.3%) | 32 (3.7%) |
| $100,000 to $299,999 | 267 (25.3%) | 459 (52.5%) |
| $300,000 to $499,999 | 171 (16.2%) | 164 (18.8%) |
| $500,000 to $749,999 | 22 (2.1%) | 138 (15.8%) |
| $750,000 to $999,999 | 0 (0.0%) | 0 (0.0%) |
| $1,000,000 or more | 20 (1.9%) | 0 (0.0%) |
| Total | 1,057 (100.0%) | 874 (100.0%) |
Household Income by Mortgage Status in San Leon
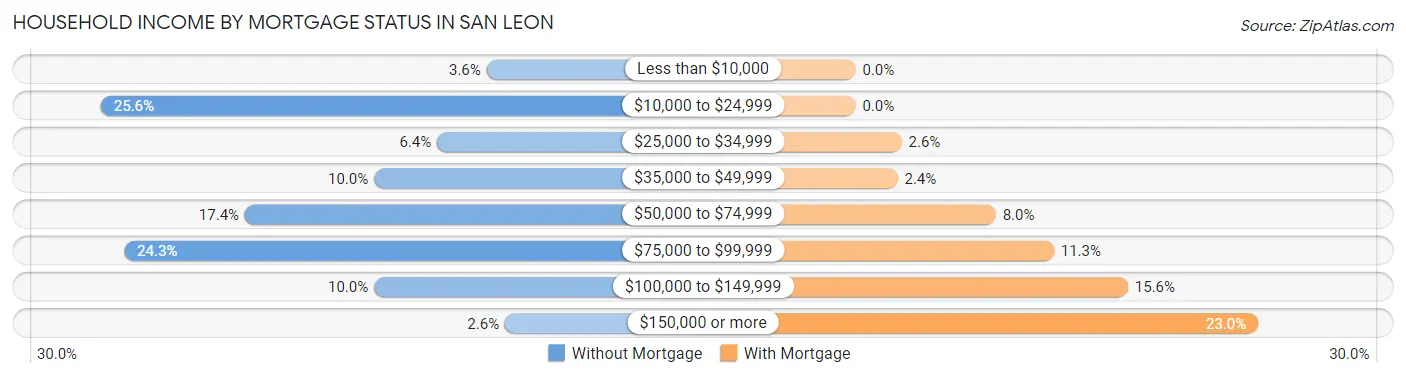
| Household Income | Without Mortgage | With Mortgage |
| Less than $10,000 | 38 (3.6%) | 0 (0.0%) |
| $10,000 to $24,999 | 271 (25.6%) | 0 (0.0%) |
| $25,000 to $34,999 | 68 (6.4%) | 23 (2.6%) |
| $35,000 to $49,999 | 106 (10.0%) | 21 (2.4%) |
| $50,000 to $74,999 | 184 (17.4%) | 70 (8.0%) |
| $75,000 to $99,999 | 257 (24.3%) | 99 (11.3%) |
| $100,000 to $149,999 | 106 (10.0%) | 136 (15.6%) |
| $150,000 or more | 27 (2.5%) | 201 (23.0%) |
| Total | 1,057 (100.0%) | 874 (100.0%) |
Property Value to Household Income Ratio in San Leon
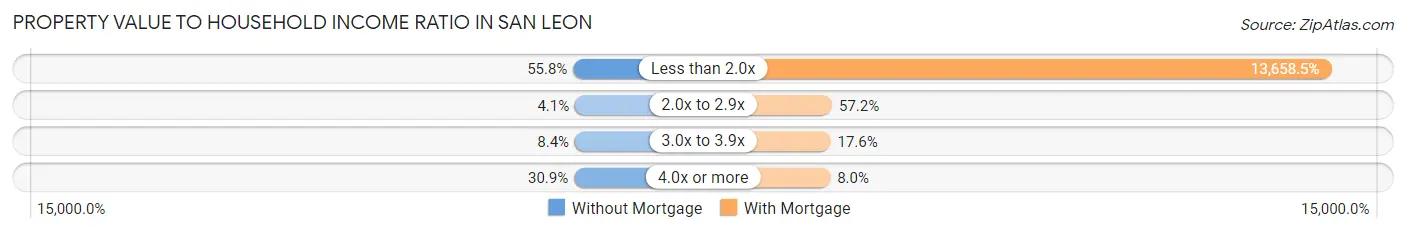
| Value-to-Income Ratio | Without Mortgage | With Mortgage |
| Less than 2.0x | 590 (55.8%) | 119,375 (13,658.5%) |
| 2.0x to 2.9x | 43 (4.1%) | 500 (57.2%) |
| 3.0x to 3.9x | 89 (8.4%) | 154 (17.6%) |
| 4.0x or more | 327 (30.9%) | 70 (8.0%) |
| Total | 1,057 (100.0%) | 874 (100.0%) |
Real Estate Taxes by Mortgage Status in San Leon
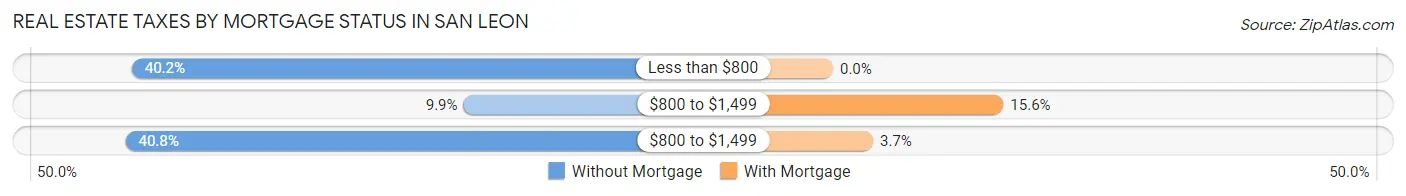
| Property Taxes | Without Mortgage | With Mortgage |
| Less than $800 | 425 (40.2%) | 0 (0.0%) |
| $800 to $1,499 | 105 (9.9%) | 136 (15.6%) |
| $800 to $1,499 | 431 (40.8%) | 32 (3.7%) |
| Total | 1,057 (100.0%) | 874 (100.0%) |
Health & Disability in San Leon
Health Insurance Coverage by Age in San Leon
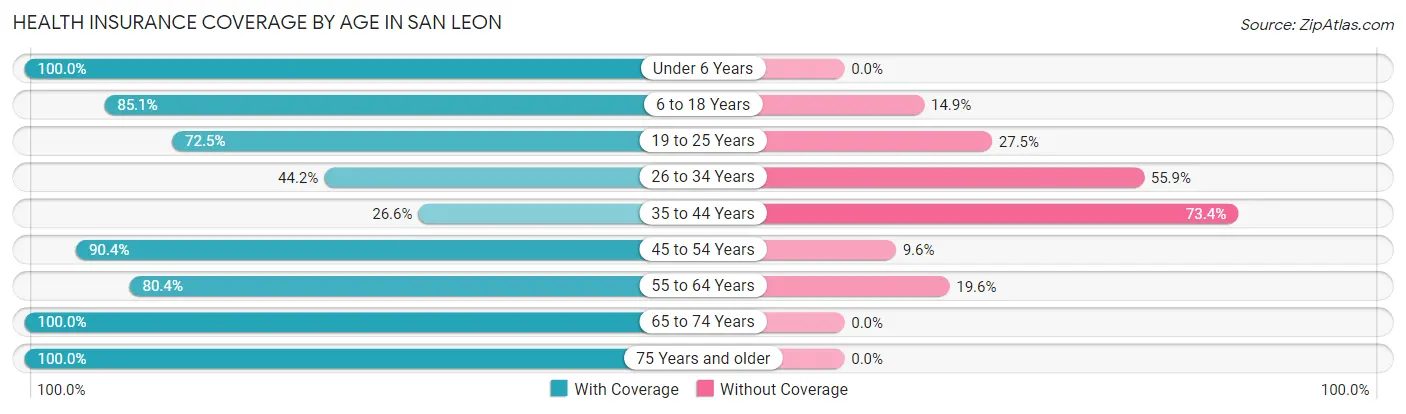
| Age Bracket | With Coverage | Without Coverage |
| Under 6 Years | 109 (100.0%) | 0 (0.0%) |
| 6 to 18 Years | 521 (85.1%) | 91 (14.9%) |
| 19 to 25 Years | 266 (72.5%) | 101 (27.5%) |
| 26 to 34 Years | 302 (44.2%) | 382 (55.8%) |
| 35 to 44 Years | 188 (26.6%) | 519 (73.4%) |
| 45 to 54 Years | 896 (90.4%) | 95 (9.6%) |
| 55 to 64 Years | 834 (80.4%) | 203 (19.6%) |
| 65 to 74 Years | 1,088 (100.0%) | 0 (0.0%) |
| 75 Years and older | 114 (100.0%) | 0 (0.0%) |
| Total | 4,318 (75.6%) | 1,391 (24.4%) |
Health Insurance Coverage by Citizenship Status in San Leon
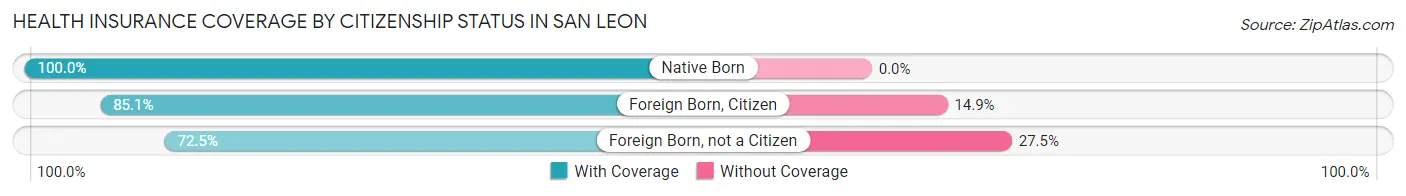
| Citizenship Status | With Coverage | Without Coverage |
| Native Born | 109 (100.0%) | 0 (0.0%) |
| Foreign Born, Citizen | 521 (85.1%) | 91 (14.9%) |
| Foreign Born, not a Citizen | 266 (72.5%) | 101 (27.5%) |
Health Insurance Coverage by Household Income in San Leon
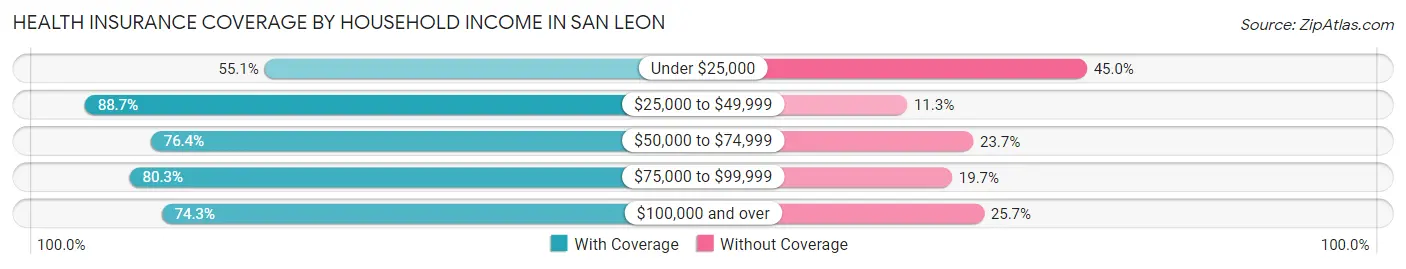
| Household Income | With Coverage | Without Coverage |
| Under $25,000 | 387 (55.0%) | 316 (45.0%) |
| $25,000 to $49,999 | 684 (88.7%) | 87 (11.3%) |
| $50,000 to $74,999 | 888 (76.3%) | 275 (23.6%) |
| $75,000 to $99,999 | 1,016 (80.3%) | 249 (19.7%) |
| $100,000 and over | 1,343 (74.3%) | 464 (25.7%) |
Public vs Private Health Insurance Coverage by Age in San Leon
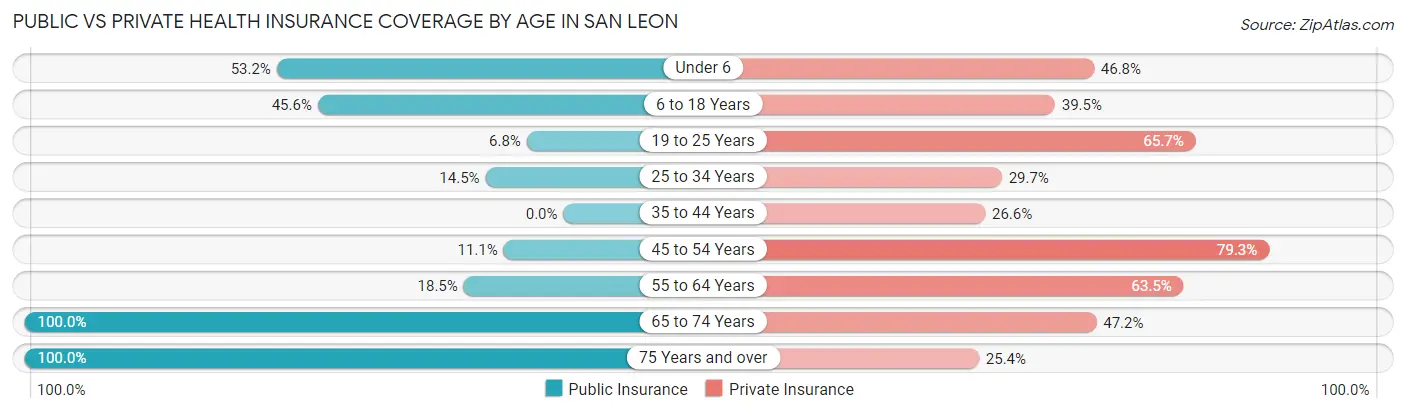
| Age Bracket | Public Insurance | Private Insurance |
| Under 6 | 58 (53.2%) | 51 (46.8%) |
| 6 to 18 Years | 279 (45.6%) | 242 (39.5%) |
| 19 to 25 Years | 25 (6.8%) | 241 (65.7%) |
| 25 to 34 Years | 99 (14.5%) | 203 (29.7%) |
| 35 to 44 Years | 0 (0.0%) | 188 (26.6%) |
| 45 to 54 Years | 110 (11.1%) | 786 (79.3%) |
| 55 to 64 Years | 192 (18.5%) | 658 (63.4%) |
| 65 to 74 Years | 1,088 (100.0%) | 514 (47.2%) |
| 75 Years and over | 114 (100.0%) | 29 (25.4%) |
| Total | 1,965 (34.4%) | 2,912 (51.0%) |
Disability Status by Sex by Age in San Leon
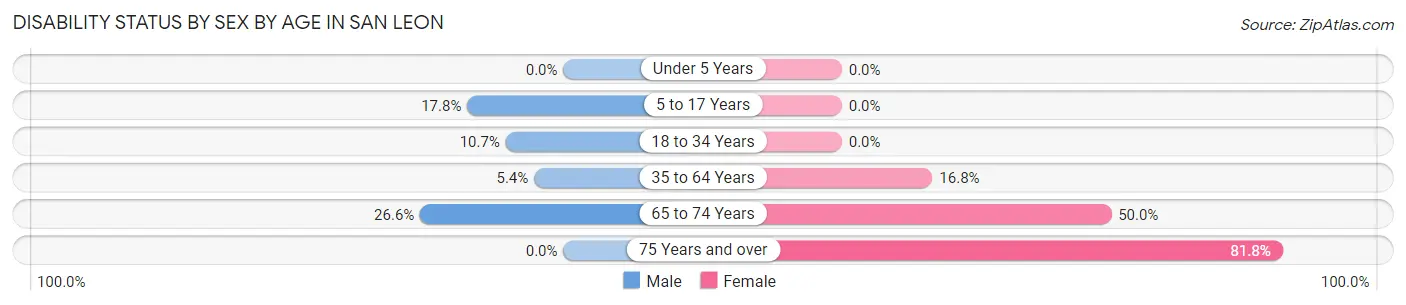
| Age Bracket | Male | Female |
| Under 5 Years | 0 (0.0%) | 0 (0.0%) |
| 5 to 17 Years | 38 (17.8%) | 0 (0.0%) |
| 18 to 34 Years | 78 (10.7%) | 0 (0.0%) |
| 35 to 64 Years | 79 (5.4%) | 215 (16.8%) |
| 65 to 74 Years | 168 (26.6%) | 228 (50.0%) |
| 75 Years and over | 0 (0.0%) | 36 (81.8%) |
Disability Class by Sex by Age in San Leon
Disability Class: Hearing Difficulty
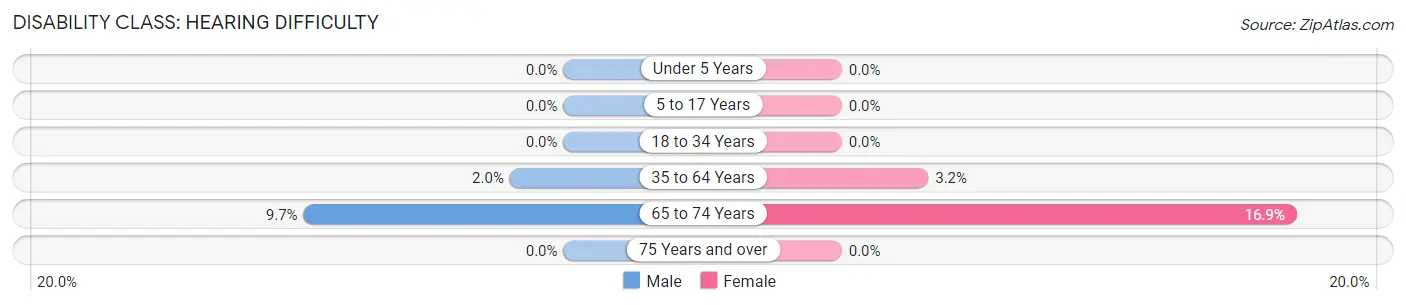
| Age Bracket | Male | Female |
| Under 5 Years | 0 (0.0%) | 0 (0.0%) |
| 5 to 17 Years | 0 (0.0%) | 0 (0.0%) |
| 18 to 34 Years | 0 (0.0%) | 0 (0.0%) |
| 35 to 64 Years | 29 (2.0%) | 41 (3.2%) |
| 65 to 74 Years | 61 (9.7%) | 77 (16.9%) |
| 75 Years and over | 0 (0.0%) | 0 (0.0%) |
Disability Class: Vision Difficulty
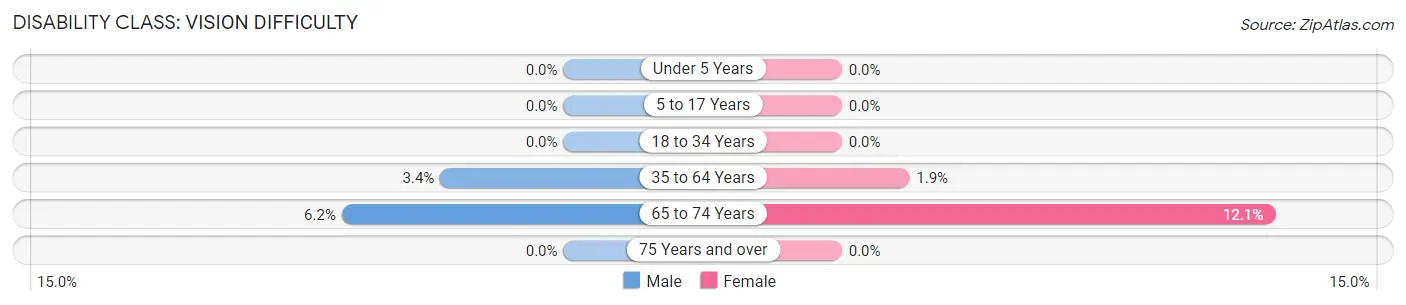
| Age Bracket | Male | Female |
| Under 5 Years | 0 (0.0%) | 0 (0.0%) |
| 5 to 17 Years | 0 (0.0%) | 0 (0.0%) |
| 18 to 34 Years | 0 (0.0%) | 0 (0.0%) |
| 35 to 64 Years | 50 (3.4%) | 24 (1.9%) |
| 65 to 74 Years | 39 (6.2%) | 55 (12.1%) |
| 75 Years and over | 0 (0.0%) | 0 (0.0%) |
Disability Class: Cognitive Difficulty
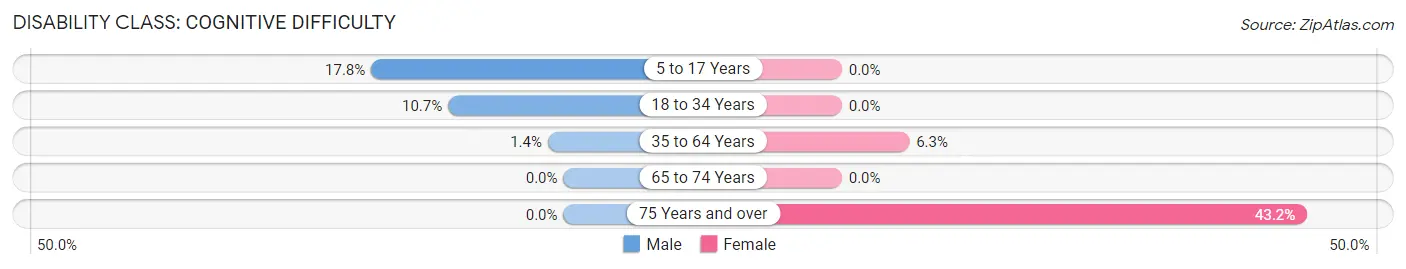
| Age Bracket | Male | Female |
| 5 to 17 Years | 38 (17.8%) | 0 (0.0%) |
| 18 to 34 Years | 78 (10.7%) | 0 (0.0%) |
| 35 to 64 Years | 21 (1.4%) | 80 (6.3%) |
| 65 to 74 Years | 0 (0.0%) | 0 (0.0%) |
| 75 Years and over | 0 (0.0%) | 19 (43.2%) |
Disability Class: Ambulatory Difficulty
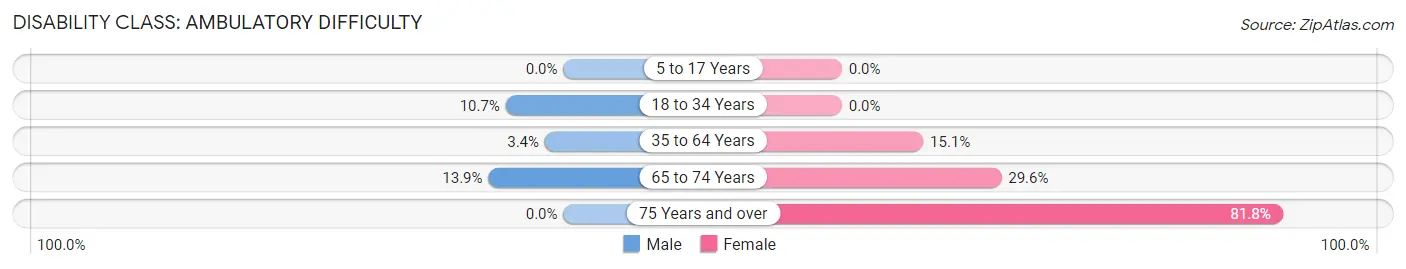
| Age Bracket | Male | Female |
| 5 to 17 Years | 0 (0.0%) | 0 (0.0%) |
| 18 to 34 Years | 78 (10.7%) | 0 (0.0%) |
| 35 to 64 Years | 50 (3.4%) | 193 (15.1%) |
| 65 to 74 Years | 88 (13.9%) | 135 (29.6%) |
| 75 Years and over | 0 (0.0%) | 36 (81.8%) |
Disability Class: Self-Care Difficulty
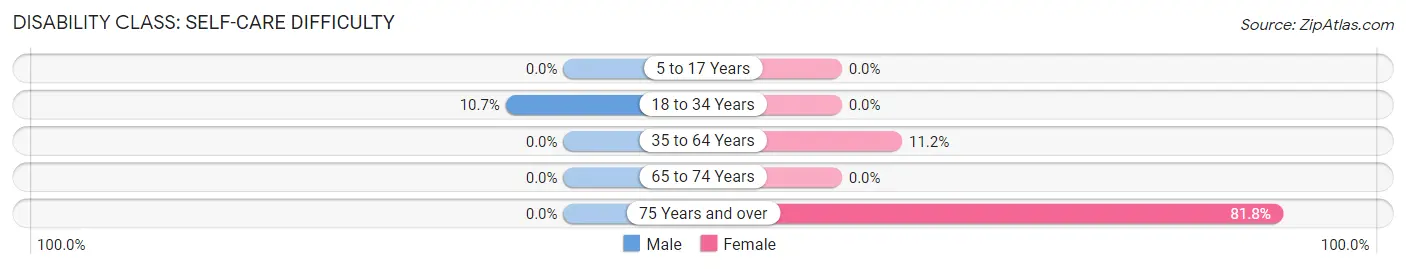
| Age Bracket | Male | Female |
| 5 to 17 Years | 0 (0.0%) | 0 (0.0%) |
| 18 to 34 Years | 78 (10.7%) | 0 (0.0%) |
| 35 to 64 Years | 0 (0.0%) | 143 (11.2%) |
| 65 to 74 Years | 0 (0.0%) | 0 (0.0%) |
| 75 Years and over | 0 (0.0%) | 36 (81.8%) |
Technology Access in San Leon
Computing Device Access in San Leon
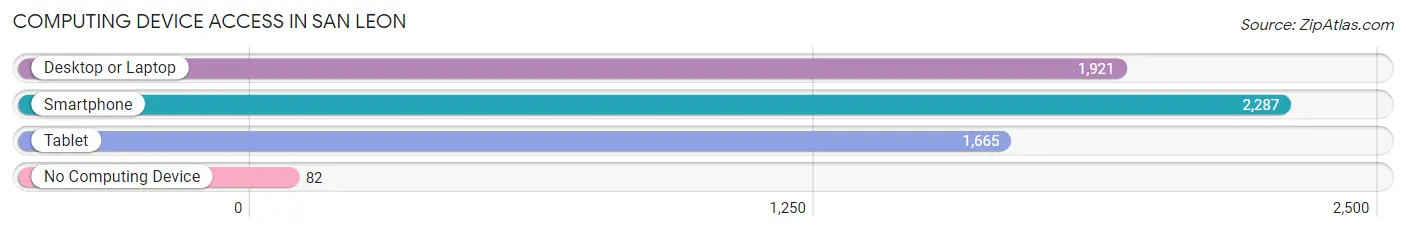
| Device Type | # Households | % Households |
| Desktop or Laptop | 1,921 | 77.7% |
| Smartphone | 2,287 | 92.5% |
| Tablet | 1,665 | 67.3% |
| No Computing Device | 82 | 3.3% |
| Total | 2,472 | 100.0% |
Internet Access in San Leon
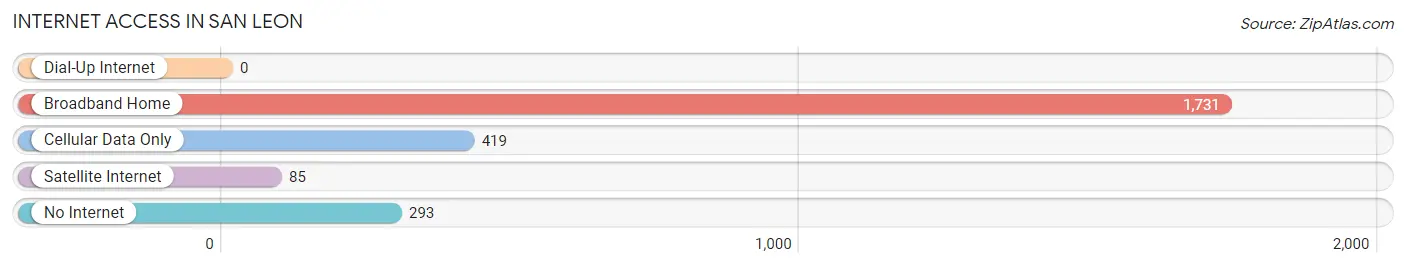
| Internet Type | # Households | % Households |
| Dial-Up Internet | 0 | 0.0% |
| Broadband Home | 1,731 | 70.0% |
| Cellular Data Only | 419 | 17.0% |
| Satellite Internet | 85 | 3.4% |
| No Internet | 293 | 11.8% |
| Total | 2,472 | 100.0% |
San Leon Summary
San Leon, Texas is a small unincorporated community located in Galveston County, Texas. It is situated on the west side of Galveston Bay, approximately 25 miles southeast of Houston. The town was founded in 1895 by a group of immigrants from the Mediterranean island of Malta. The town was named after the patron saint of Malta, Saint Leon.
History
San Leon was founded in 1895 by a group of immigrants from the Mediterranean island of Malta. The town was named after the patron saint of Malta, Saint Leon. The immigrants were attracted to the area by the abundance of fish and oysters in the bay. The town quickly grew and by the early 1900s, it had become a thriving fishing village.
The town was also home to a number of other industries, including a brickyard, a cannery, and a boat building business. The town was also home to a number of saloons and gambling halls.
In the early 1900s, San Leon was a popular tourist destination. Tourists would come to the town to enjoy the fishing, boating, and other activities. The town was also home to a number of resorts and hotels.
In the 1920s, the town began to decline as the fishing industry began to decline. The town was also hit hard by the Great Depression. In the 1940s, the town began to experience a resurgence as the oil industry began to boom in the area.
Geography
San Leon is located in Galveston County, Texas. It is situated on the west side of Galveston Bay, approximately 25 miles southeast of Houston. The town is bordered by the cities of Bacliff and Kemah to the north, and by the cities of Dickinson and League City to the south.
The town is located on a peninsula that is surrounded by the bay on three sides. The town is located at an elevation of 8 feet above sea level. The climate in San Leon is classified as humid subtropical, with hot, humid summers and mild winters.
Economy
San Leon’s economy is largely based on the oil and gas industry. The town is home to a number of oil and gas companies, including Chevron, Shell, and ExxonMobil. The town is also home to a number of seafood processing plants, as well as a number of boat building businesses.
The town is also home to a number of small businesses, including restaurants, bars, and retail stores. The town is also home to a number of marinas, which provide services to boaters and fishermen.
Demographics
As of the 2010 census, the population of San Leon was 5,976. The racial makeup of the town was 79.3% White, 11.2% African American, 0.7% Native American, 0.7% Asian, 0.1% Pacific Islander, and 6.9% from other races. Hispanic or Latino of any race were 18.2% of the population.
The median household income in San Leon was $45,938, and the median family income was $50,938. The per capita income in the town was $20,938. About 11.2% of families and 14.2% of the population were below the poverty line, including 18.2% of those under age 18 and 8.2% of those age 65 or over.
Common Questions
What is Per Capita Income in San Leon?
Per Capita income in San Leon is $39,417.
What is the Median Family Income in San Leon?
Median Family Income in San Leon is $88,750.
What is the Median Household income in San Leon?
Median Household Income in San Leon is $74,818.
What is Income or Wage Gap in San Leon?
Income or Wage Gap in San Leon is 32.9%.
Women in San Leon earn 67.1 cents for every dollar earned by a man.
What is Inequality or Gini Index in San Leon?
Inequality or Gini Index in San Leon is 0.43.
What is the Total Population of San Leon?
Total Population of San Leon is 5,709.
What is the Total Male Population of San Leon?
Total Male Population of San Leon is 3,188.
What is the Total Female Population of San Leon?
Total Female Population of San Leon is 2,521.
What is the Ratio of Males per 100 Females in San Leon?
There are 126.46 Males per 100 Females in San Leon.
What is the Ratio of Females per 100 Males in San Leon?
There are 79.08 Females per 100 Males in San Leon.
What is the Median Population Age in San Leon?
Median Population Age in San Leon is 51.7 Years.
What is the Average Family Size in San Leon
Average Family Size in San Leon is 2.7 People.
What is the Average Household Size in San Leon
Average Household Size in San Leon is 2.3 People.
How Large is the Labor Force in San Leon?
There are 3,231 People in the Labor Forcein in San Leon.
What is the Percentage of People in the Labor Force in San Leon?
61.9% of People are in the Labor Force in San Leon.
What is the Unemployment Rate in San Leon?
Unemployment Rate in San Leon is 7.5%.