Jackson, LA Map & Demographics
Jackson Map
Jackson Overview
$9,295
PER CAPITA INCOME
$50,125
AVG FAMILY INCOME
$40,642
AVG HOUSEHOLD INCOME
10.4%
WAGE / INCOME GAP [ % ]
89.6¢/ $1
WAGE / INCOME GAP [ $ ]
0.47
INEQUALITY / GINI INDEX
4,600
TOTAL POPULATION
3,452
MALE POPULATION
1,148
FEMALE POPULATION
300.70
MALES / 100 FEMALES
33.26
FEMALES / 100 MALES
37.5
MEDIAN AGE
3.2
AVG FAMILY SIZE
2.8
AVG HOUSEHOLD SIZE
749
LABOR FORCE [ PEOPLE ]
17.5%
PERCENT IN LABOR FORCE
13.7%
UNEMPLOYMENT RATE
Jackson Zip Codes
Jackson Area Codes
Income in Jackson
Income Overview in Jackson
Per Capita Income in Jackson is $9,295, while median incomes of families and households are $50,125 and $40,642 respectively.
| Characteristic | Number | Measure |
| Per Capita Income | 4,600 | $9,295 |
| Median Family Income | 531 | $50,125 |
| Mean Family Income | 531 | $66,359 |
| Median Household Income | 697 | $40,642 |
| Mean Household Income | 697 | $56,460 |
| Income Deficit | 531 | $0 |
| Wage / Income Gap (%) | 4,600 | 10.44% |
| Wage / Income Gap ($) | 4,600 | 89.56¢ per $1 |
| Gini / Inequality Index | 4,600 | 0.47 |
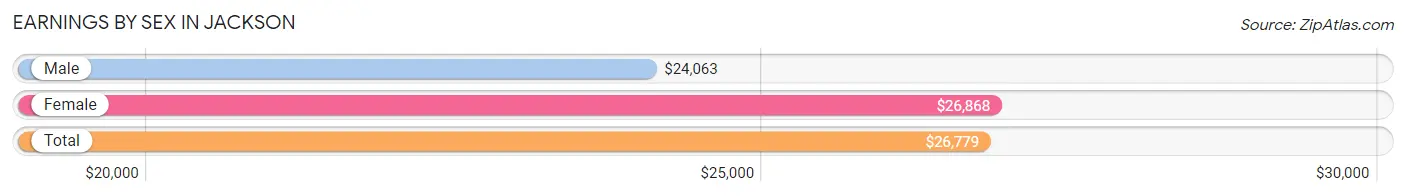
Earnings by Sex in Jackson
Average Earnings in Jackson are $26,779, $24,063 for men and $26,868 for women, a difference of 10.4%.
| Sex | Number | Average Earnings |
| Male | 368 (43.2%) | $24,063 |
| Female | 483 (56.8%) | $26,868 |
| Total | 851 (100.0%) | $26,779 |
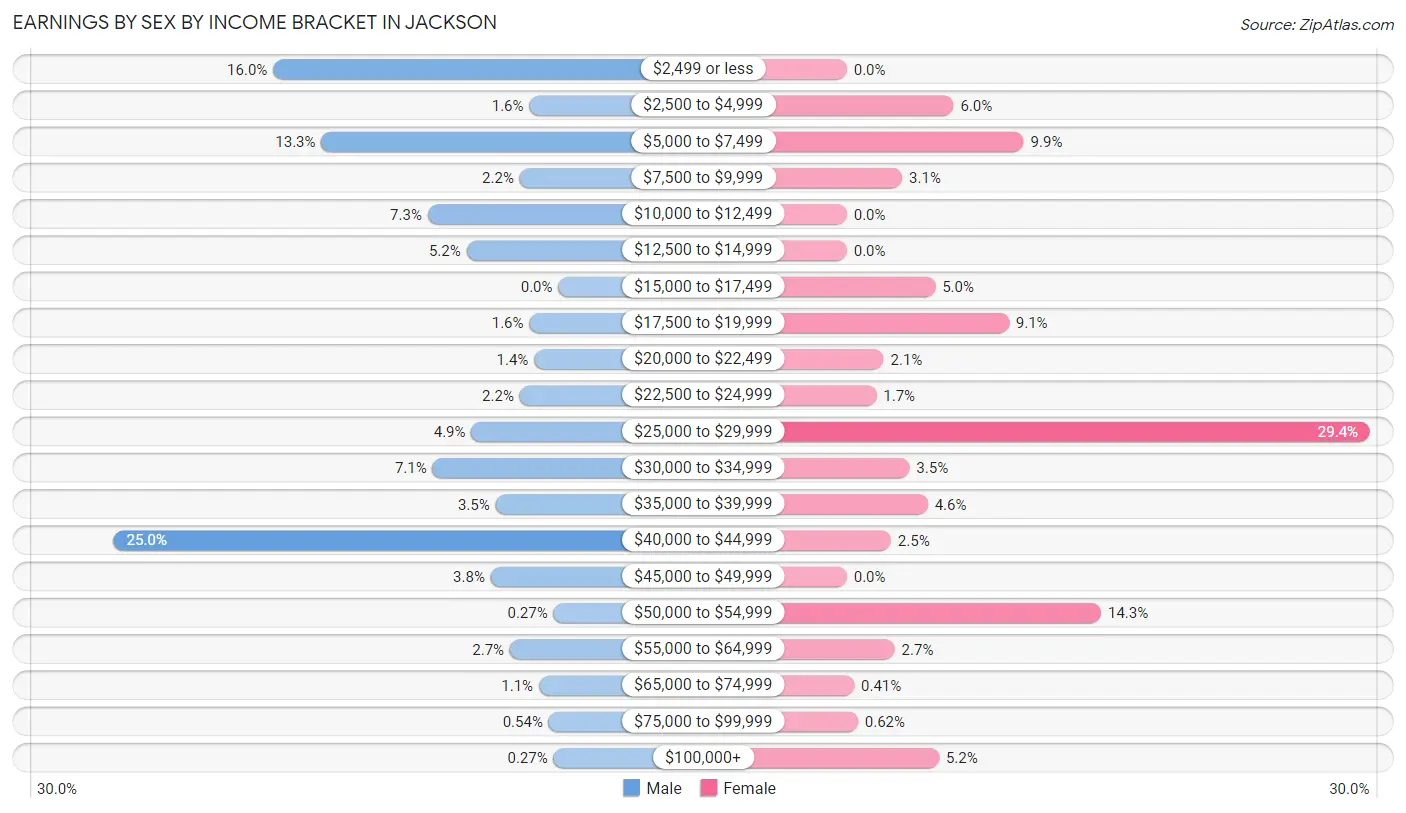
Earnings by Sex by Income Bracket in Jackson
The most common earnings brackets in Jackson are $40,000 to $44,999 for men (92 | 25.0%) and $25,000 to $29,999 for women (142 | 29.4%).
| Income | Male | Female |
| $2,499 or less | 59 (16.0%) | 0 (0.0%) |
| $2,500 to $4,999 | 6 (1.6%) | 29 (6.0%) |
| $5,000 to $7,499 | 49 (13.3%) | 48 (9.9%) |
| $7,500 to $9,999 | 8 (2.2%) | 15 (3.1%) |
| $10,000 to $12,499 | 27 (7.3%) | 0 (0.0%) |
| $12,500 to $14,999 | 19 (5.2%) | 0 (0.0%) |
| $15,000 to $17,499 | 0 (0.0%) | 24 (5.0%) |
| $17,500 to $19,999 | 6 (1.6%) | 44 (9.1%) |
| $20,000 to $22,499 | 5 (1.4%) | 10 (2.1%) |
| $22,500 to $24,999 | 8 (2.2%) | 8 (1.7%) |
| $25,000 to $29,999 | 18 (4.9%) | 142 (29.4%) |
| $30,000 to $34,999 | 26 (7.1%) | 17 (3.5%) |
| $35,000 to $39,999 | 13 (3.5%) | 22 (4.5%) |
| $40,000 to $44,999 | 92 (25.0%) | 12 (2.5%) |
| $45,000 to $49,999 | 14 (3.8%) | 0 (0.0%) |
| $50,000 to $54,999 | 1 (0.3%) | 69 (14.3%) |
| $55,000 to $64,999 | 10 (2.7%) | 13 (2.7%) |
| $65,000 to $74,999 | 4 (1.1%) | 2 (0.4%) |
| $75,000 to $99,999 | 2 (0.5%) | 3 (0.6%) |
| $100,000+ | 1 (0.3%) | 25 (5.2%) |
| Total | 368 (100.0%) | 483 (100.0%) |
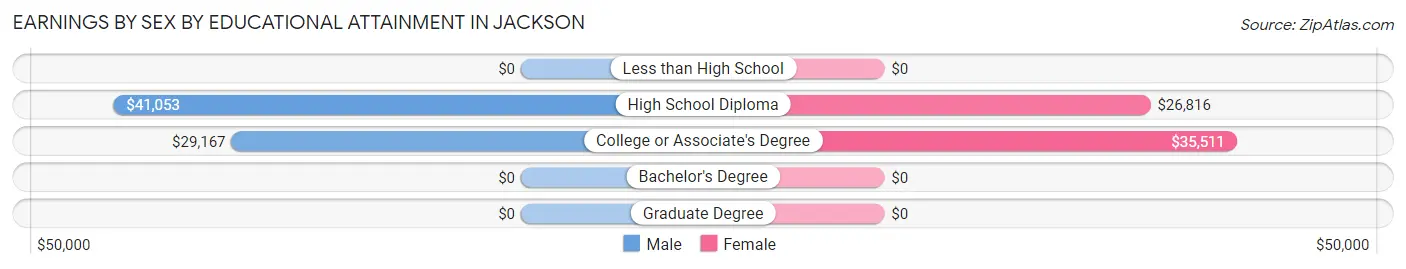
Earnings by Sex by Educational Attainment in Jackson
Average earnings in Jackson are $36,346 for men and $27,241 for women, a difference of 25.1%. Men with an educational attainment of high school diploma enjoy the highest average annual earnings of $41,053, while those with college or associate's degree education earn the least with $29,167. Women with an educational attainment of college or associate's degree earn the most with the average annual earnings of $35,511, while those with high school diploma education have the smallest earnings of $26,816.
| Educational Attainment | Male Income | Female Income |
| Less than High School | - | - |
| High School Diploma | $41,053 | $26,816 |
| College or Associate's Degree | $29,167 | $35,511 |
| Bachelor's Degree | - | - |
| Graduate Degree | - | - |
| Total | $36,346 | $27,241 |
Family Income in Jackson
Family Income Brackets in Jackson
According to the Jackson family income data, there are 131 families falling into the $75,000 to $99,999 income range, which is the most common income bracket and makes up 24.7% of all families. Conversely, the $150,000 to $199,999 income bracket is the least frequent group with only 3 families (0.6%) belonging to this category.
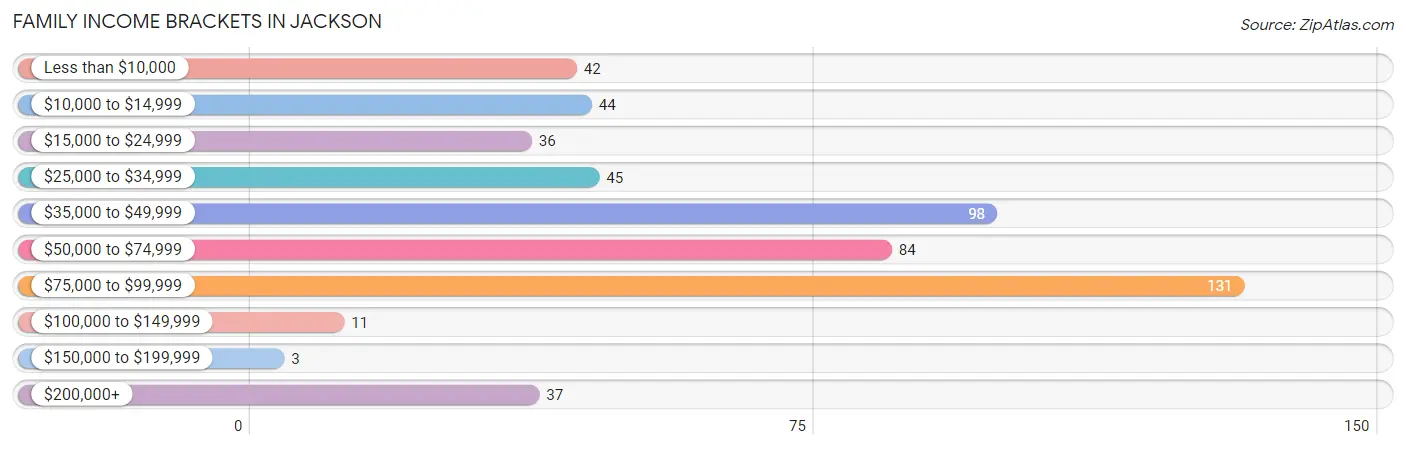
| Income Bracket | # Families | % Families |
| Less than $10,000 | 42 | 7.9% |
| $10,000 to $14,999 | 44 | 8.3% |
| $15,000 to $24,999 | 36 | 6.8% |
| $25,000 to $34,999 | 45 | 8.5% |
| $35,000 to $49,999 | 98 | 18.5% |
| $50,000 to $74,999 | 84 | 15.8% |
| $75,000 to $99,999 | 131 | 24.7% |
| $100,000 to $149,999 | 11 | 2.1% |
| $150,000 to $199,999 | 3 | 0.6% |
| $200,000+ | 37 | 7.0% |
Family Income by Famaliy Size in Jackson
2-person families (270 | 50.8%) account for the highest median family income in Jackson with $77,614 per family, while 2-person families (270 | 50.8%) have the highest median income of $38,807 per family member.
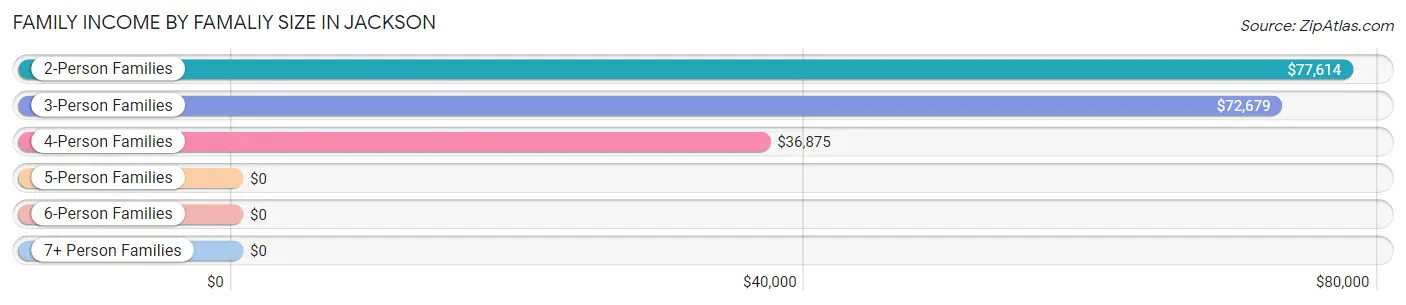
| Income Bracket | # Families | Median Income |
| 2-Person Families | 270 (50.8%) | $77,614 |
| 3-Person Families | 141 (26.6%) | $72,679 |
| 4-Person Families | 53 (10.0%) | $36,875 |
| 5-Person Families | 27 (5.1%) | $0 |
| 6-Person Families | 31 (5.8%) | $0 |
| 7+ Person Families | 9 (1.7%) | $0 |
| Total | 531 (100.0%) | $50,125 |
Family Income by Number of Earners in Jackson
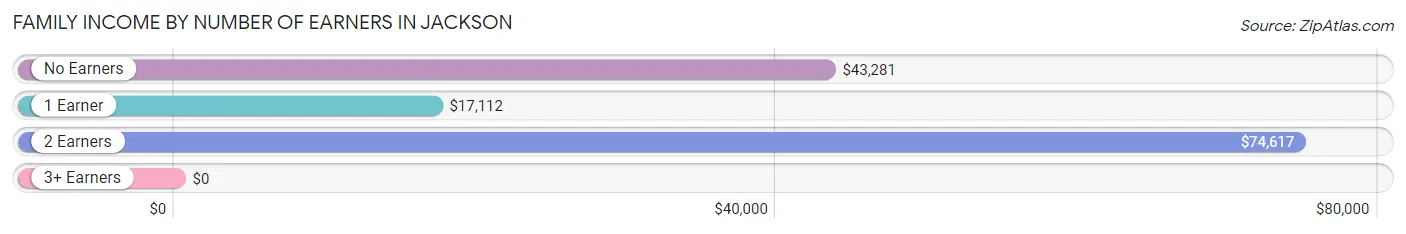
| Number of Earners | # Families | Median Income |
| No Earners | 129 (24.3%) | $43,281 |
| 1 Earner | 157 (29.6%) | $17,112 |
| 2 Earners | 225 (42.4%) | $74,617 |
| 3+ Earners | 20 (3.8%) | $0 |
| Total | 531 (100.0%) | $50,125 |
Household Income in Jackson
Household Income Brackets in Jackson
With 134 households falling in the category, the $75,000 to $99,999 income range is the most frequent in Jackson, accounting for 19.2% of all households. In contrast, only 3 households (0.4%) fall into the $150,000 to $199,999 income bracket, making it the least populous group.
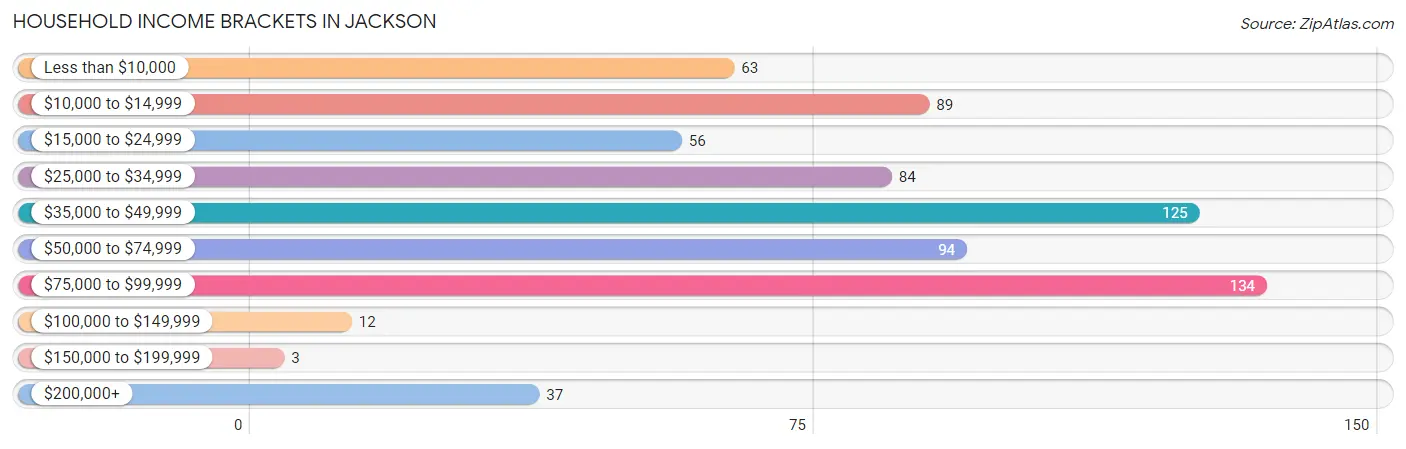
| Income Bracket | # Households | % Households |
| Less than $10,000 | 63 | 9.0% |
| $10,000 to $14,999 | 89 | 12.8% |
| $15,000 to $24,999 | 56 | 8.0% |
| $25,000 to $34,999 | 84 | 12.1% |
| $35,000 to $49,999 | 125 | 17.9% |
| $50,000 to $74,999 | 94 | 13.5% |
| $75,000 to $99,999 | 134 | 19.2% |
| $100,000 to $149,999 | 12 | 1.7% |
| $150,000 to $199,999 | 3 | 0.4% |
| $200,000+ | 37 | 5.3% |
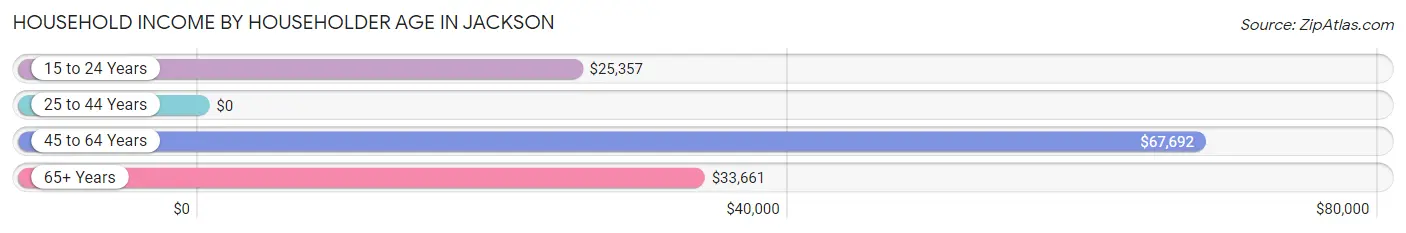
Household Income by Householder Age in Jackson
The median household income in Jackson is $40,642, with the highest median household income of $67,692 found in the 45 to 64 years age bracket for the primary householder. A total of 302 households (43.3%) fall into this category. Meanwhile, the 25 to 44 years age bracket for the primary householder has the lowest median household income of $0, with 172 households (24.7%) in this group.
| Income Bracket | # Households | Median Income |
| 15 to 24 Years | 36 (5.2%) | $25,357 |
| 25 to 44 Years | 172 (24.7%) | $0 |
| 45 to 64 Years | 302 (43.3%) | $67,692 |
| 65+ Years | 187 (26.8%) | $33,661 |
| Total | 697 (100.0%) | $40,642 |
Poverty in Jackson
Income Below Poverty by Sex and Age in Jackson
With 40.9% poverty level for males and 36.1% for females among the residents of Jackson, 16 and 17 year old males and 5 year old females are the most vulnerable to poverty, with 101 males (88.6%) and 7 females (100.0%) in their respective age groups living below the poverty level.
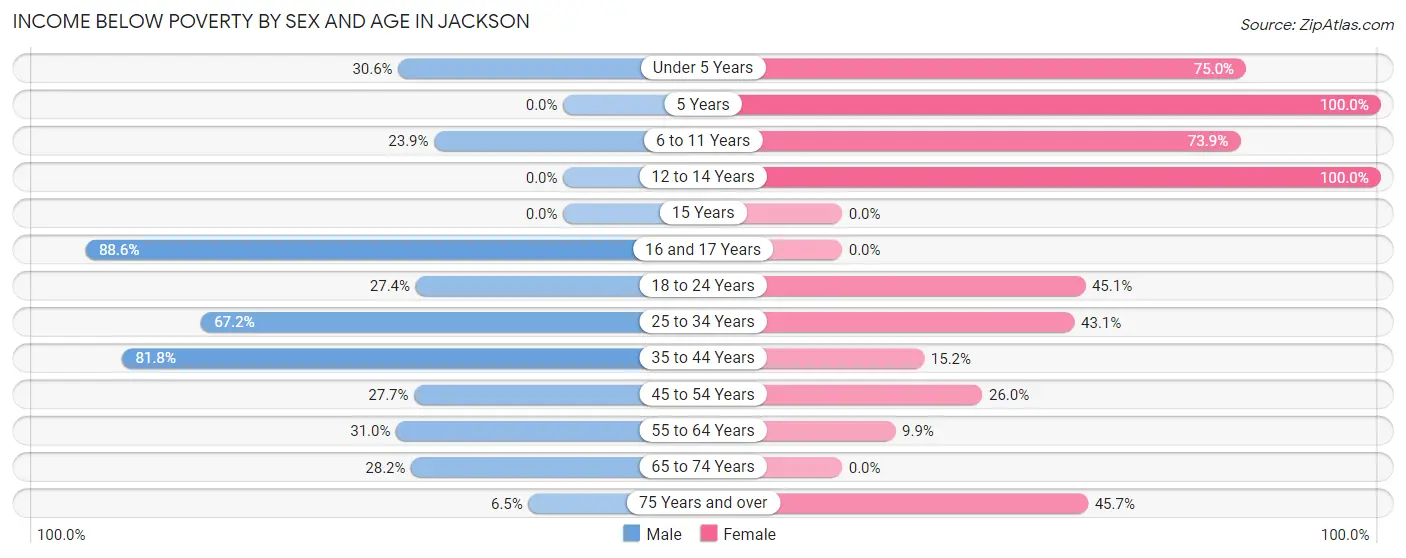
| Age Bracket | Male | Female |
| Under 5 Years | 15 (30.6%) | 30 (75.0%) |
| 5 Years | 0 (0.0%) | 7 (100.0%) |
| 6 to 11 Years | 17 (23.9%) | 34 (73.9%) |
| 12 to 14 Years | 0 (0.0%) | 62 (100.0%) |
| 15 Years | 0 (0.0%) | 0 (0.0%) |
| 16 and 17 Years | 101 (88.6%) | 0 (0.0%) |
| 18 to 24 Years | 46 (27.4%) | 79 (45.1%) |
| 25 to 34 Years | 82 (67.2%) | 47 (43.1%) |
| 35 to 44 Years | 72 (81.8%) | 23 (15.2%) |
| 45 to 54 Years | 39 (27.7%) | 63 (26.0%) |
| 55 to 64 Years | 31 (31.0%) | 10 (9.9%) |
| 65 to 74 Years | 33 (28.2%) | 0 (0.0%) |
| 75 Years and over | 4 (6.5%) | 42 (45.7%) |
| Total | 440 (40.9%) | 397 (36.1%) |
Income Above Poverty by Sex and Age in Jackson
According to the poverty statistics in Jackson, males aged 12 to 14 years and females aged 16 and 17 years are the age groups that are most secure financially, with 100.0% of males and 100.0% of females in these age groups living above the poverty line.
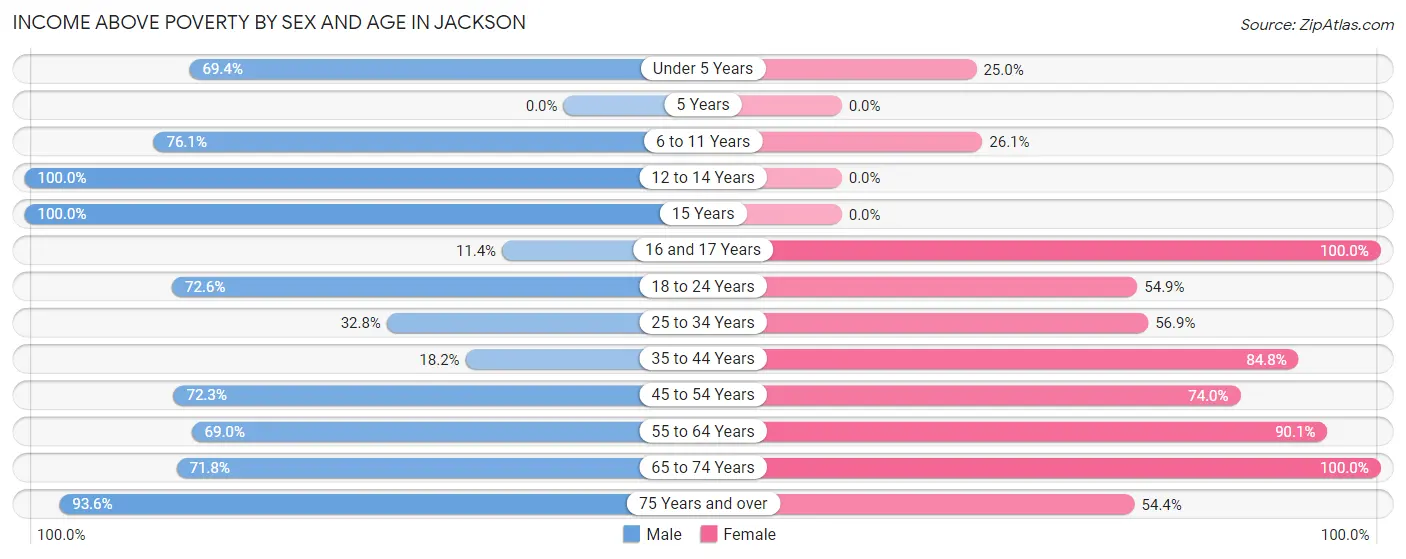
| Age Bracket | Male | Female |
| Under 5 Years | 34 (69.4%) | 10 (25.0%) |
| 5 Years | 0 (0.0%) | 0 (0.0%) |
| 6 to 11 Years | 54 (76.1%) | 12 (26.1%) |
| 12 to 14 Years | 20 (100.0%) | 0 (0.0%) |
| 15 Years | 23 (100.0%) | 0 (0.0%) |
| 16 and 17 Years | 13 (11.4%) | 2 (100.0%) |
| 18 to 24 Years | 122 (72.6%) | 96 (54.9%) |
| 25 to 34 Years | 40 (32.8%) | 62 (56.9%) |
| 35 to 44 Years | 16 (18.2%) | 128 (84.8%) |
| 45 to 54 Years | 102 (72.3%) | 179 (74.0%) |
| 55 to 64 Years | 69 (69.0%) | 91 (90.1%) |
| 65 to 74 Years | 84 (71.8%) | 74 (100.0%) |
| 75 Years and over | 58 (93.5%) | 50 (54.3%) |
| Total | 635 (59.1%) | 704 (63.9%) |
Income Below Poverty Among Married-Couple Families in Jackson
The poverty statistics for married-couple families in Jackson show that 19.5% or 75 of the total 384 families live below the poverty line. Families with 3 or 4 children have the highest poverty rate of 75.0%, comprising of 30 families. On the other hand, families with no children have the lowest poverty rate of 7.0%, which includes 20 families.
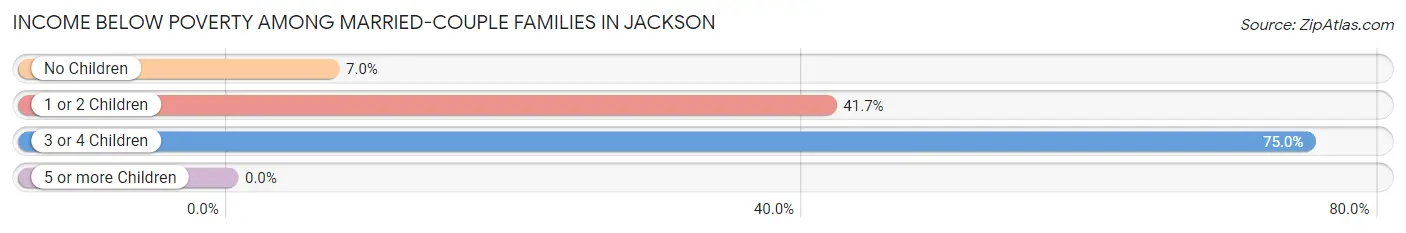
| Children | Above Poverty | Below Poverty |
| No Children | 264 (93.0%) | 20 (7.0%) |
| 1 or 2 Children | 35 (58.3%) | 25 (41.7%) |
| 3 or 4 Children | 10 (25.0%) | 30 (75.0%) |
| 5 or more Children | 0 (0.0%) | 0 (0.0%) |
| Total | 309 (80.5%) | 75 (19.5%) |
Income Below Poverty Among Single-Parent Households in Jackson
According to the poverty data in Jackson, 33.3% or 16 single-father households and 36.4% or 36 single-mother households are living below the poverty line. Among single-father households, those with 1 or 2 children have the highest poverty rate, with 16 households (100.0%) experiencing poverty. Likewise, among single-mother households, those with 1 or 2 children have the highest poverty rate, with 15 households (100.0%) falling below the poverty line.
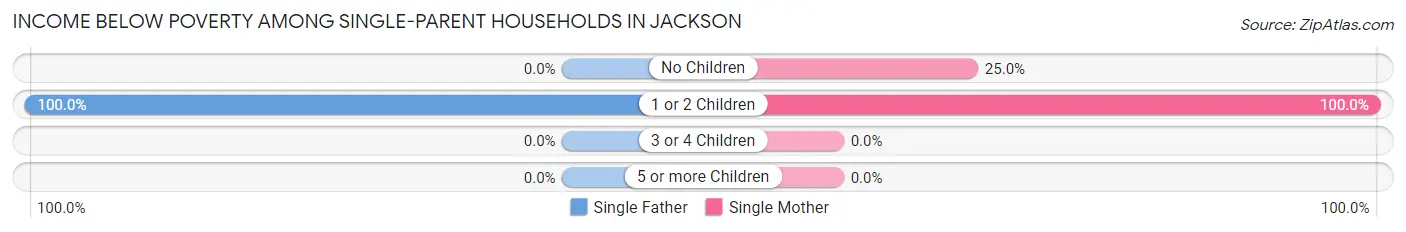
| Children | Single Father | Single Mother |
| No Children | 0 (0.0%) | 21 (25.0%) |
| 1 or 2 Children | 16 (100.0%) | 15 (100.0%) |
| 3 or 4 Children | 0 (0.0%) | 0 (0.0%) |
| 5 or more Children | 0 (0.0%) | 0 (0.0%) |
| Total | 16 (33.3%) | 36 (36.4%) |
Income Below Poverty Among Married-Couple vs Single-Parent Households in Jackson
The poverty data for Jackson shows that 75 of the married-couple family households (19.5%) and 52 of the single-parent households (35.4%) are living below the poverty level. Within the married-couple family households, those with 3 or 4 children have the highest poverty rate, with 30 households (75.0%) falling below the poverty line. Among the single-parent households, those with 1 or 2 children have the highest poverty rate, with 31 household (100.0%) living below poverty.
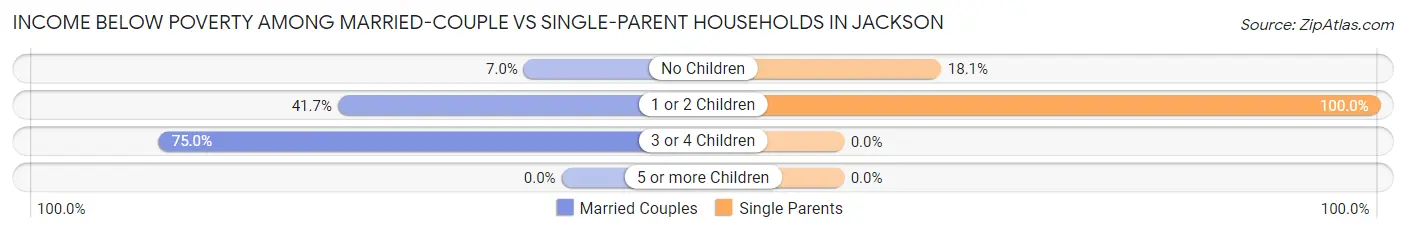
| Children | Married-Couple Families | Single-Parent Households |
| No Children | 20 (7.0%) | 21 (18.1%) |
| 1 or 2 Children | 25 (41.7%) | 31 (100.0%) |
| 3 or 4 Children | 30 (75.0%) | 0 (0.0%) |
| 5 or more Children | 0 (0.0%) | 0 (0.0%) |
| Total | 75 (19.5%) | 52 (35.4%) |
Race in Jackson
The most populous races in Jackson are Black / African American (2,609 | 56.7%), White / Caucasian (1,629 | 35.4%), and Two or more Races (256 | 5.6%).
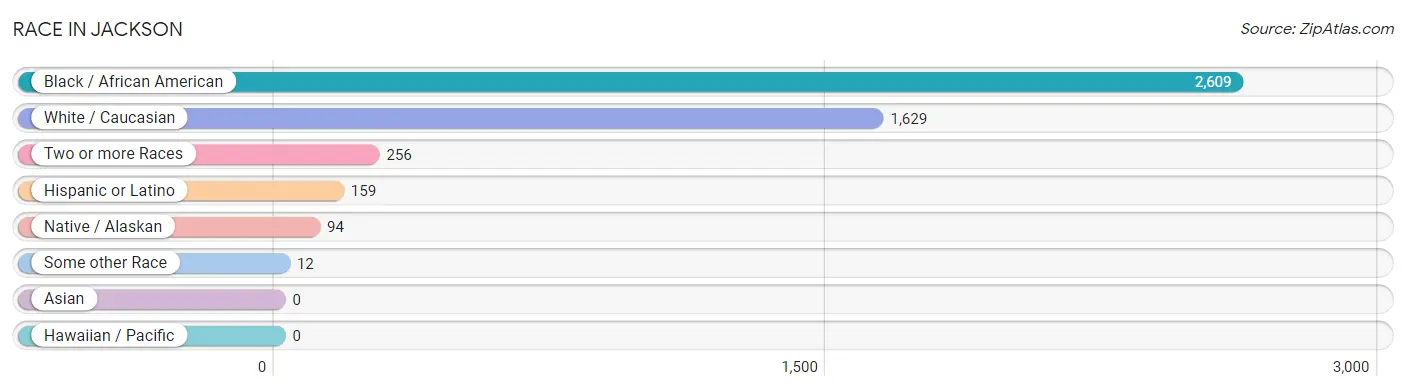
| Race | # Population | % Population |
| Asian | 0 | 0.0% |
| Black / African American | 2,609 | 56.7% |
| Hawaiian / Pacific | 0 | 0.0% |
| Hispanic or Latino | 159 | 3.5% |
| Native / Alaskan | 94 | 2.0% |
| White / Caucasian | 1,629 | 35.4% |
| Two or more Races | 256 | 5.6% |
| Some other Race | 12 | 0.3% |
| Total | 4,600 | 100.0% |
Ancestry in Jackson
The most populous ancestries reported in Jackson are American (543 | 11.8%), French (348 | 7.6%), English (198 | 4.3%), Cherokee (159 | 3.5%), and French Canadian (76 | 1.7%), together accounting for 28.8% of all Jackson residents.
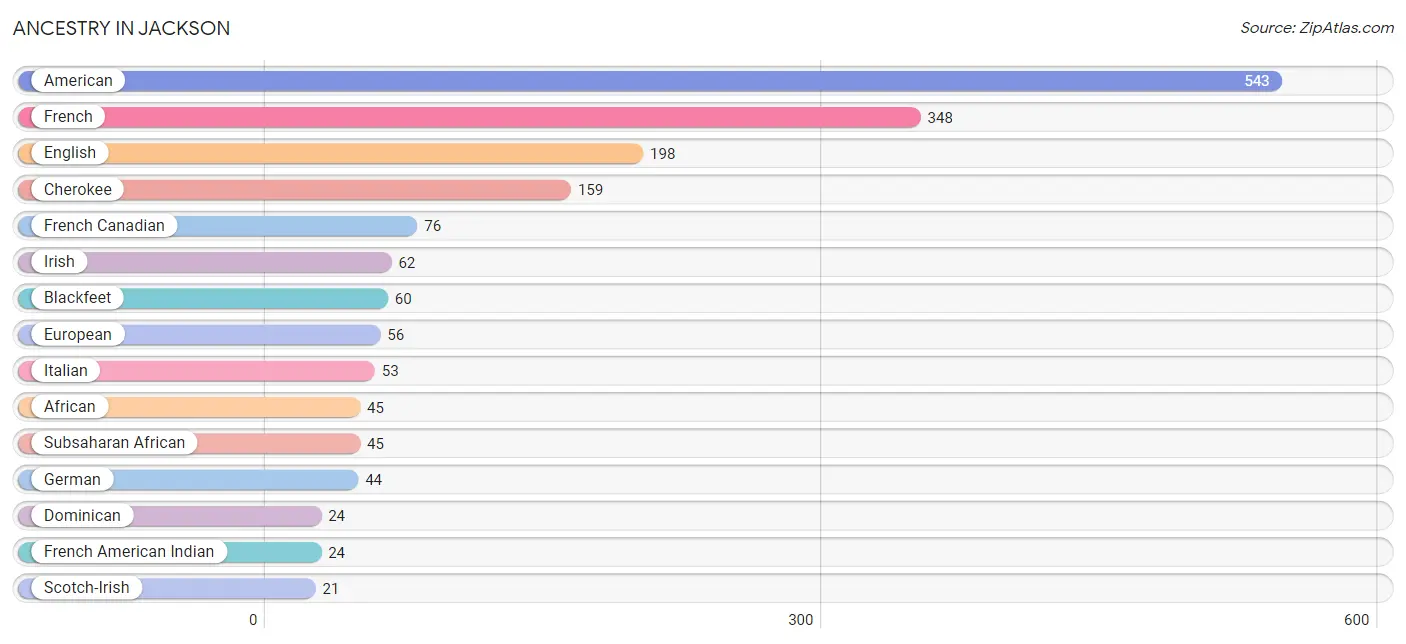
| Ancestry | # Population | % Population |
| African | 45 | 1.0% |
| American | 543 | 11.8% |
| Apache | 5 | 0.1% |
| Blackfeet | 60 | 1.3% |
| Cajun | 12 | 0.3% |
| Cherokee | 159 | 3.5% |
| Choctaw | 14 | 0.3% |
| Cuban | 17 | 0.4% |
| Dominican | 24 | 0.5% |
| English | 198 | 4.3% |
| European | 56 | 1.2% |
| French | 348 | 7.6% |
| French American Indian | 24 | 0.5% |
| French Canadian | 76 | 1.7% |
| German | 44 | 1.0% |
| Houma | 20 | 0.4% |
| Irish | 62 | 1.3% |
| Italian | 53 | 1.1% |
| Mexican | 14 | 0.3% |
| Polish | 14 | 0.3% |
| Puerto Rican | 15 | 0.3% |
| Romanian | 6 | 0.1% |
| Scotch-Irish | 21 | 0.5% |
| Scottish | 15 | 0.3% |
| Spaniard | 5 | 0.1% |
| Spanish | 12 | 0.3% |
| Subsaharan African | 45 | 1.0% |
| Ukrainian | 14 | 0.3% |
| Welsh | 1 | 0.0% |
| West Indian | 12 | 0.3% | View All 30 Rows |
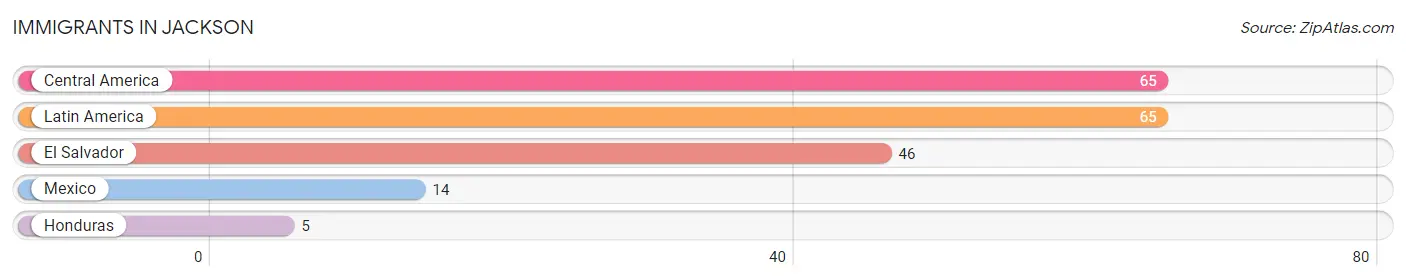
Immigrants in Jackson
The most numerous immigrant groups reported in Jackson came from Central America (65 | 1.4%), Latin America (65 | 1.4%), El Salvador (46 | 1.0%), Mexico (14 | 0.3%), and Honduras (5 | 0.1%), together accounting for 4.2% of all Jackson residents.
| Immigration Origin | # Population | % Population |
| Central America | 65 | 1.4% |
| El Salvador | 46 | 1.0% |
| Honduras | 5 | 0.1% |
| Latin America | 65 | 1.4% |
| Mexico | 14 | 0.3% | View All 5 Rows |
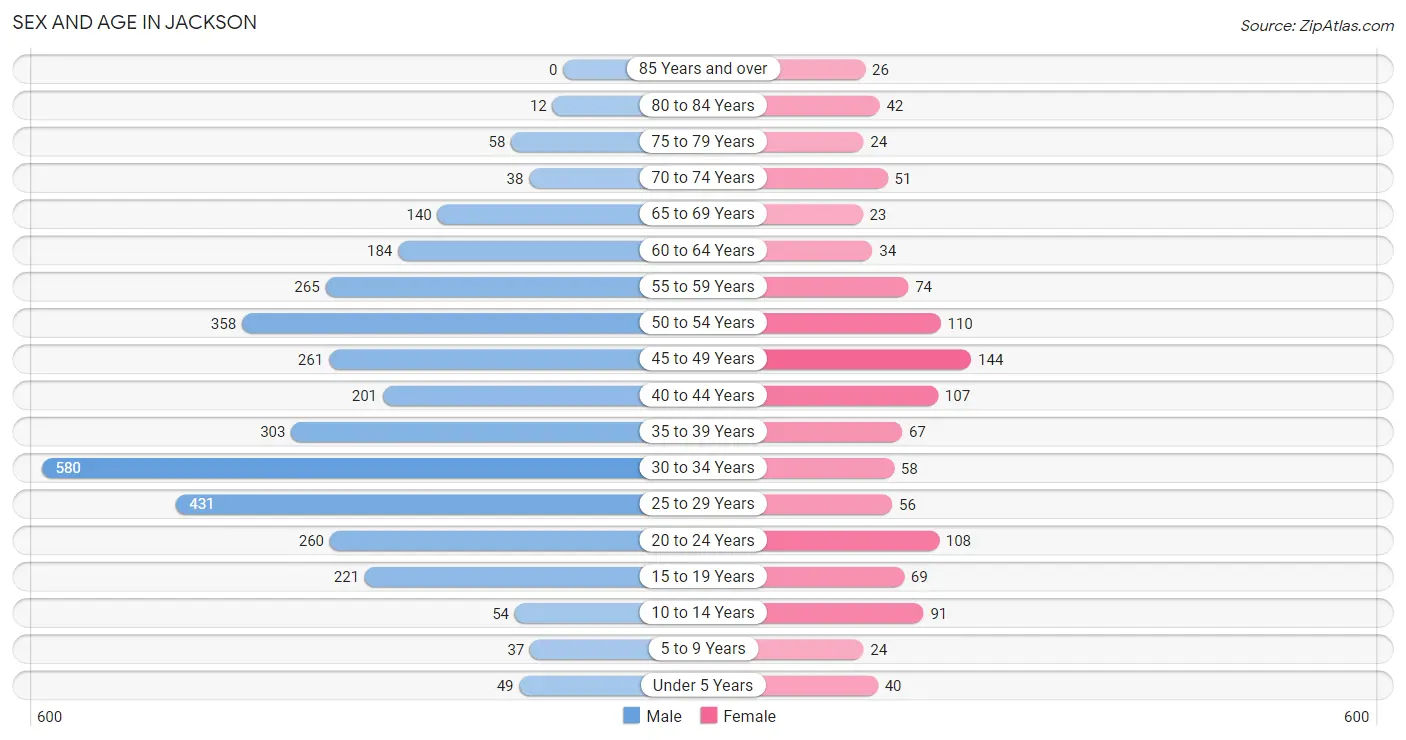
Sex and Age in Jackson
Sex and Age in Jackson
The most populous age groups in Jackson are 30 to 34 Years (580 | 16.8%) for men and 45 to 49 Years (144 | 12.5%) for women.
| Age Bracket | Male | Female |
| Under 5 Years | 49 (1.4%) | 40 (3.5%) |
| 5 to 9 Years | 37 (1.1%) | 24 (2.1%) |
| 10 to 14 Years | 54 (1.6%) | 91 (7.9%) |
| 15 to 19 Years | 221 (6.4%) | 69 (6.0%) |
| 20 to 24 Years | 260 (7.5%) | 108 (9.4%) |
| 25 to 29 Years | 431 (12.5%) | 56 (4.9%) |
| 30 to 34 Years | 580 (16.8%) | 58 (5.1%) |
| 35 to 39 Years | 303 (8.8%) | 67 (5.8%) |
| 40 to 44 Years | 201 (5.8%) | 107 (9.3%) |
| 45 to 49 Years | 261 (7.6%) | 144 (12.5%) |
| 50 to 54 Years | 358 (10.4%) | 110 (9.6%) |
| 55 to 59 Years | 265 (7.7%) | 74 (6.5%) |
| 60 to 64 Years | 184 (5.3%) | 34 (3.0%) |
| 65 to 69 Years | 140 (4.1%) | 23 (2.0%) |
| 70 to 74 Years | 38 (1.1%) | 51 (4.4%) |
| 75 to 79 Years | 58 (1.7%) | 24 (2.1%) |
| 80 to 84 Years | 12 (0.4%) | 42 (3.7%) |
| 85 Years and over | 0 (0.0%) | 26 (2.3%) |
| Total | 3,452 (100.0%) | 1,148 (100.0%) |
Families and Households in Jackson
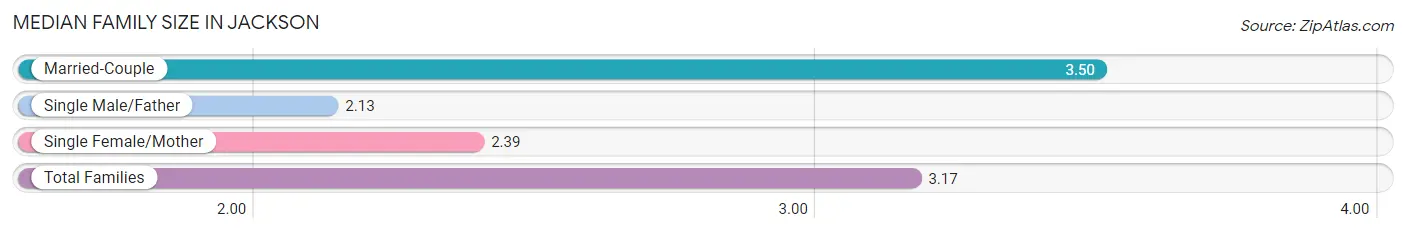
Median Family Size in Jackson
The median family size in Jackson is 3.17 persons per family, with married-couple families (384 | 72.3%) accounting for the largest median family size of 3.5 persons per family. On the other hand, single male/father families (48 | 9.0%) represent the smallest median family size with 2.13 persons per family.
| Family Type | # Families | Family Size |
| Married-Couple | 384 (72.3%) | 3.50 |
| Single Male/Father | 48 (9.0%) | 2.13 |
| Single Female/Mother | 99 (18.6%) | 2.39 |
| Total Families | 531 (100.0%) | 3.17 |
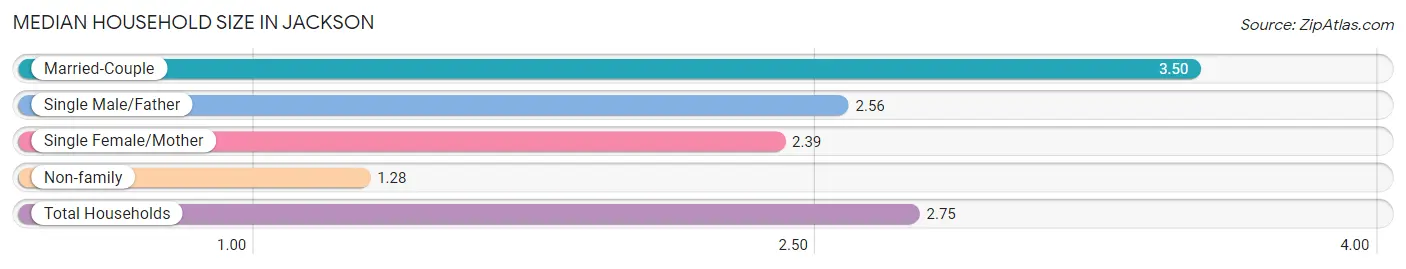
Median Household Size in Jackson
The median household size in Jackson is 2.75 persons per household, with married-couple households (384 | 55.1%) accounting for the largest median household size of 3.5 persons per household. non-family households (166 | 23.8%) represent the smallest median household size with 1.28 persons per household.
| Household Type | # Households | Household Size |
| Married-Couple | 384 (55.1%) | 3.50 |
| Single Male/Father | 48 (6.9%) | 2.56 |
| Single Female/Mother | 99 (14.2%) | 2.39 |
| Non-family | 166 (23.8%) | 1.28 |
| Total Households | 697 (100.0%) | 2.75 |
Household Size by Marriage Status in Jackson
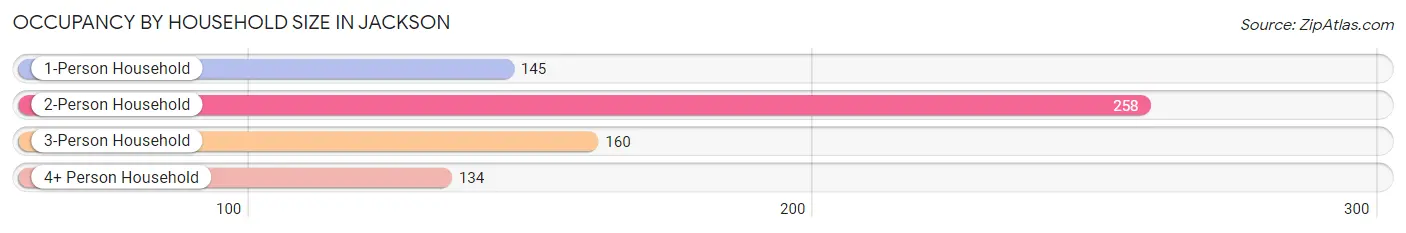
Out of a total of 697 households in Jackson, 531 (76.2%) are family households, while 166 (23.8%) are nonfamily households. The most numerous type of family households are 2-person households, comprising 258, and the most common type of nonfamily households are 1-person households, comprising 145.
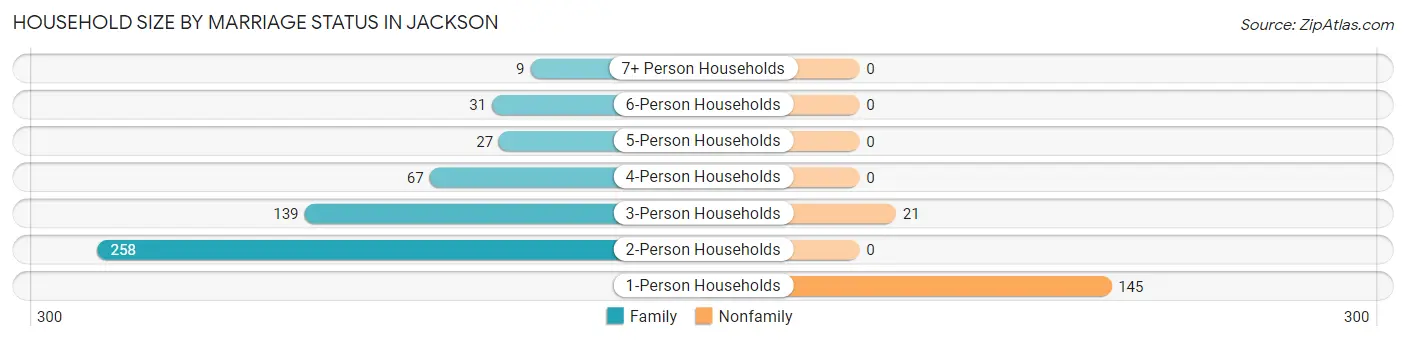
| Household Size | Family Households | Nonfamily Households |
| 1-Person Households | - | 145 (20.8%) |
| 2-Person Households | 258 (37.0%) | 0 (0.0%) |
| 3-Person Households | 139 (19.9%) | 21 (3.0%) |
| 4-Person Households | 67 (9.6%) | 0 (0.0%) |
| 5-Person Households | 27 (3.9%) | 0 (0.0%) |
| 6-Person Households | 31 (4.4%) | 0 (0.0%) |
| 7+ Person Households | 9 (1.3%) | 0 (0.0%) |
| Total | 531 (76.2%) | 166 (23.8%) |
Female Fertility in Jackson
Fertility by Age in Jackson
Average fertility rate in Jackson is 7.0 births per 1,000 women. Women in the age bracket of 35 to 50 years have the highest fertility rate with 12.0 births per 1,000 women. Women in the age bracket of 35 to 50 years acount for 100.0% of all women with births.
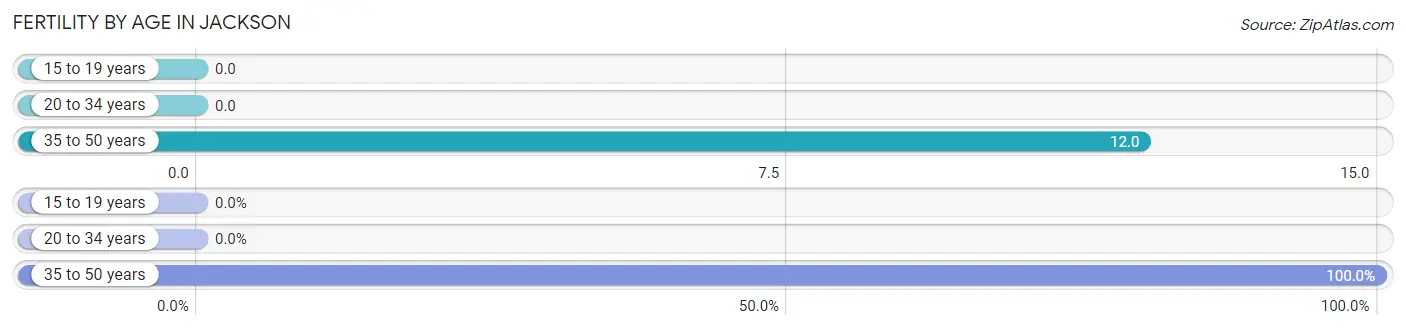
| Age Bracket | Women with Births | Births / 1,000 Women |
| 15 to 19 years | 0 (0.0%) | 0.0 |
| 20 to 34 years | 0 (0.0%) | 0.0 |
| 35 to 50 years | 5 (100.0%) | 12.0 |
| Total | 5 (100.0%) | 7.0 |
Fertility by Age by Marriage Status in Jackson
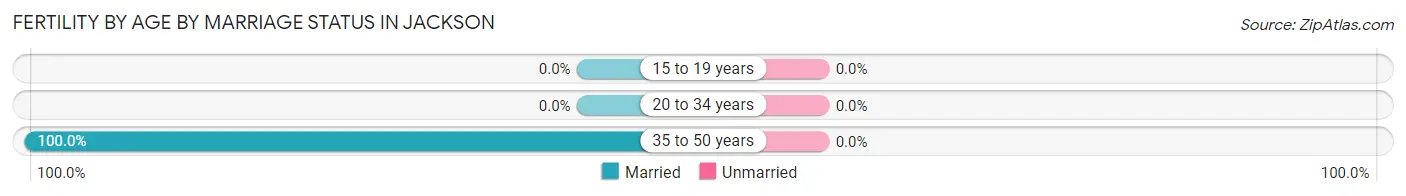
| Age Bracket | Married | Unmarried |
| 15 to 19 years | 0 (0.0%) | 0 (0.0%) |
| 20 to 34 years | 0 (0.0%) | 0 (0.0%) |
| 35 to 50 years | 5 (100.0%) | 0 (0.0%) |
| Total | 5 (100.0%) | 0 (0.0%) |
Fertility by Education in Jackson
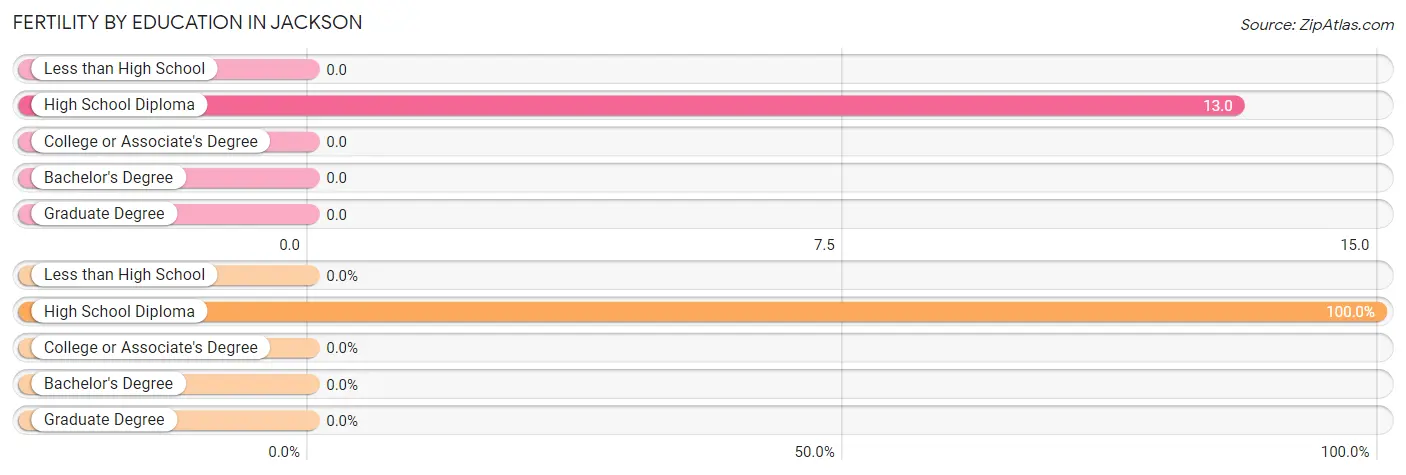
| Educational Attainment | Women with Births | Births / 1,000 Women |
| Less than High School | 0 (0.0%) | 0.0 |
| High School Diploma | 5 (100.0%) | 13.0 |
| College or Associate's Degree | 0 (0.0%) | 0.0 |
| Bachelor's Degree | 0 (0.0%) | 0.0 |
| Graduate Degree | 0 (0.0%) | 0.0 |
| Total | 5 (100.0%) | 7.0 |
Fertility by Education by Marriage Status in Jackson
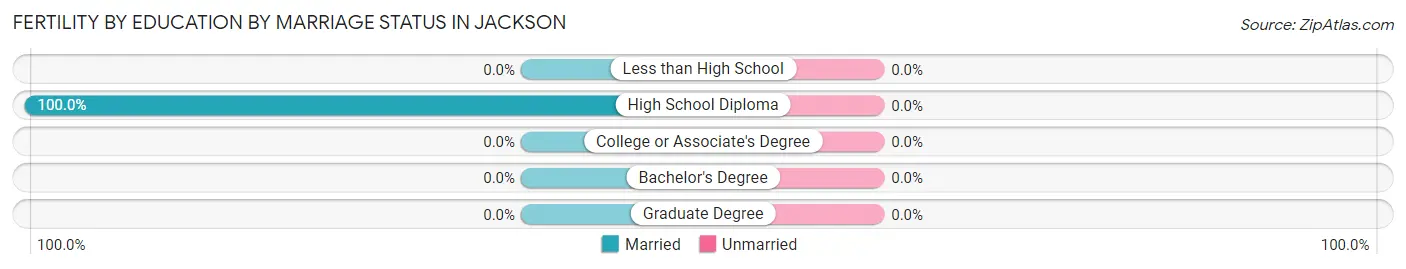
| Educational Attainment | Married | Unmarried |
| Less than High School | 0 (0.0%) | 0 (0.0%) |
| High School Diploma | 5 (100.0%) | 0 (0.0%) |
| College or Associate's Degree | 0 (0.0%) | 0 (0.0%) |
| Bachelor's Degree | 0 (0.0%) | 0 (0.0%) |
| Graduate Degree | 0 (0.0%) | 0 (0.0%) |
| Total | 5 (100.0%) | 0 (0.0%) |
Employment Characteristics in Jackson
Employment by Class of Employer in Jackson
Among the 632 employed individuals in Jackson, state government employees (284 | 44.9%), private company employees (187 | 29.6%), and self-employed (not incorporated) (66 | 10.4%) make up the most common classes of employment.
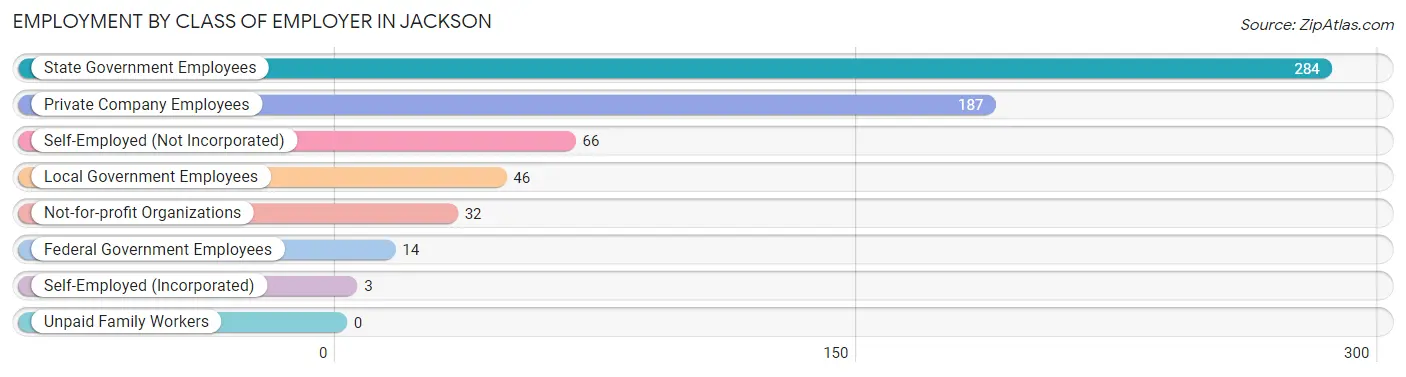
| Employer Class | # Employees | % Employees |
| Private Company Employees | 187 | 29.6% |
| Self-Employed (Incorporated) | 3 | 0.5% |
| Self-Employed (Not Incorporated) | 66 | 10.4% |
| Not-for-profit Organizations | 32 | 5.1% |
| Local Government Employees | 46 | 7.3% |
| State Government Employees | 284 | 44.9% |
| Federal Government Employees | 14 | 2.2% |
| Unpaid Family Workers | 0 | 0.0% |
| Total | 632 | 100.0% |
Employment Status by Age in Jackson
According to the labor force statistics for Jackson, out of the total population over 16 years of age (4,282), 17.5% or 749 individuals are in the labor force, with 13.7% or 103 of them unemployed. The age group with the highest labor force participation rate is 20 to 24 years, with 41.3% or 152 individuals in the labor force. Within the labor force, the 20 to 24 years age range has the highest percentage of unemployed individuals, with 54.6% or 83 of them being unemployed.
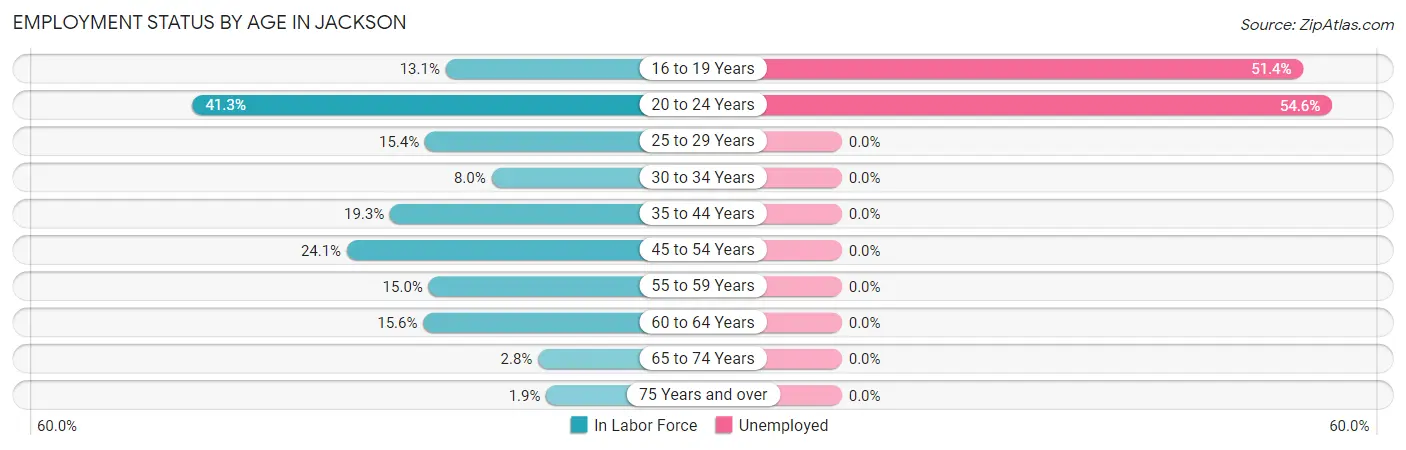
| Age Bracket | In Labor Force | Unemployed |
| 16 to 19 Years | 35 (13.1%) | 18 (51.4%) |
| 20 to 24 Years | 152 (41.3%) | 83 (54.6%) |
| 25 to 29 Years | 75 (15.4%) | 0 (0.0%) |
| 30 to 34 Years | 51 (8.0%) | 0 (0.0%) |
| 35 to 44 Years | 131 (19.3%) | 0 (0.0%) |
| 45 to 54 Years | 210 (24.1%) | 0 (0.0%) |
| 55 to 59 Years | 51 (15.0%) | 0 (0.0%) |
| 60 to 64 Years | 34 (15.6%) | 0 (0.0%) |
| 65 to 74 Years | 7 (2.8%) | 0 (0.0%) |
| 75 Years and over | 3 (1.9%) | 0 (0.0%) |
| Total | 749 (17.5%) | 103 (13.7%) |
Employment Status by Educational Attainment in Jackson
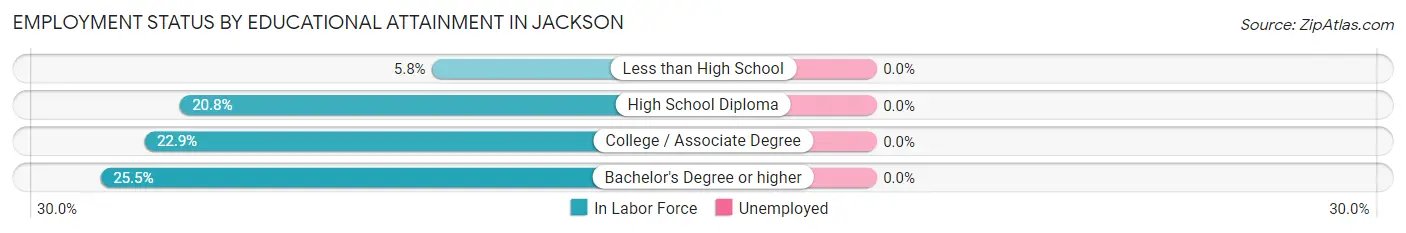
| Educational Attainment | In Labor Force | Unemployed |
| Less than High School | 52 (5.8%) | 0 (0.0%) |
| High School Diploma | 352 (20.8%) | 0 (0.0%) |
| College / Associate Degree | 120 (22.9%) | 0 (0.0%) |
| Bachelor's Degree or higher | 28 (25.5%) | 0 (0.0%) |
| Total | 553 (17.1%) | 0 (0.0%) |
Employment Occupations by Sex in Jackson
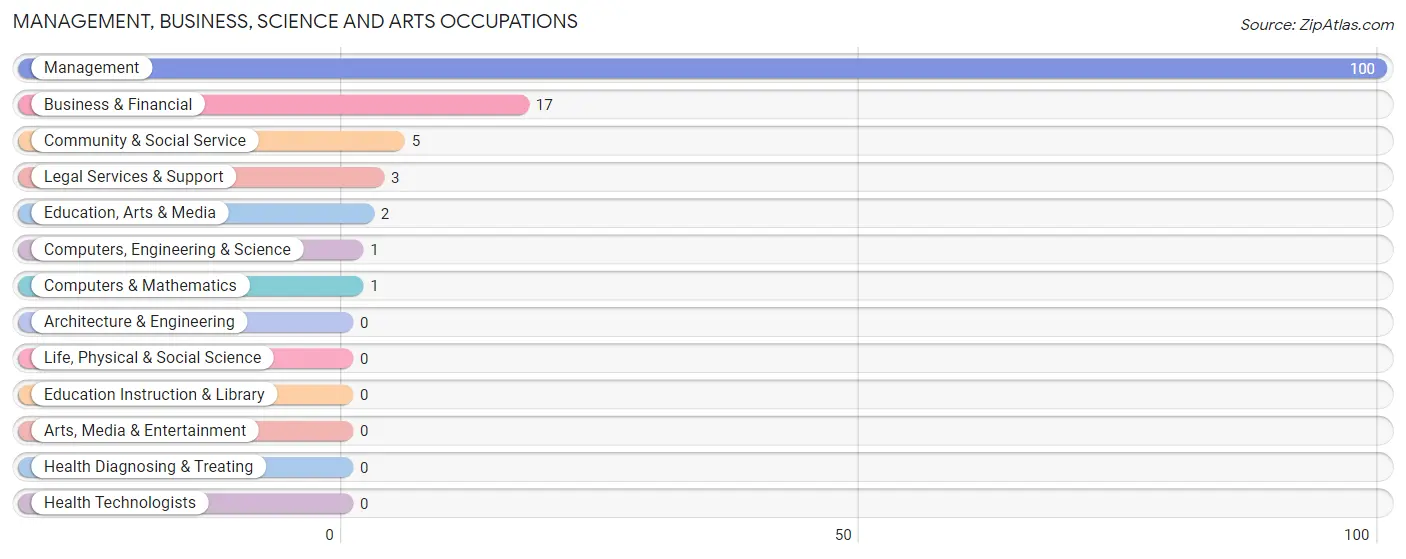
Management, Business, Science and Arts Occupations
The most common Management, Business, Science and Arts occupations in Jackson are Management (100 | 15.7%), Business & Financial (17 | 2.7%), Community & Social Service (5 | 0.8%), Legal Services & Support (3 | 0.5%), and Education, Arts & Media (2 | 0.3%).
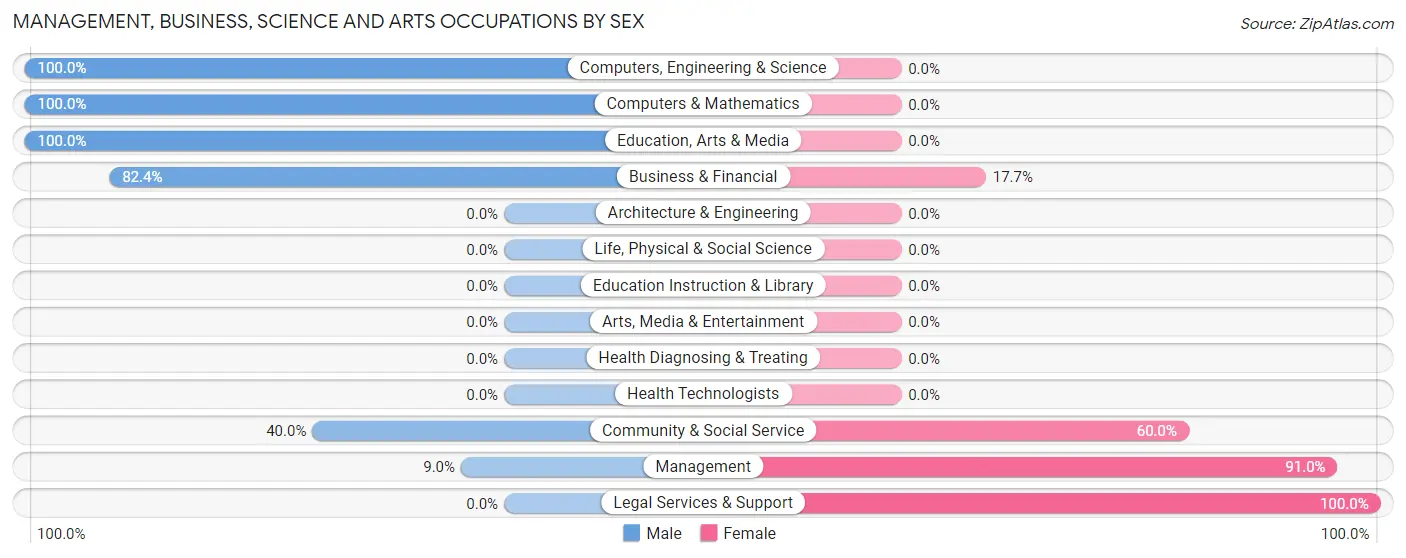
Management, Business, Science and Arts Occupations by Sex
Within the Management, Business, Science and Arts occupations in Jackson, the most male-oriented occupations are Computers, Engineering & Science (100.0%), Computers & Mathematics (100.0%), and Education, Arts & Media (100.0%), while the most female-oriented occupations are Legal Services & Support (100.0%), Management (91.0%), and Community & Social Service (60.0%).
| Occupation | Male | Female |
| Management | 9 (9.0%) | 91 (91.0%) |
| Business & Financial | 14 (82.4%) | 3 (17.6%) |
| Computers, Engineering & Science | 1 (100.0%) | 0 (0.0%) |
| Computers & Mathematics | 1 (100.0%) | 0 (0.0%) |
| Architecture & Engineering | 0 (0.0%) | 0 (0.0%) |
| Life, Physical & Social Science | 0 (0.0%) | 0 (0.0%) |
| Community & Social Service | 2 (40.0%) | 3 (60.0%) |
| Education, Arts & Media | 2 (100.0%) | 0 (0.0%) |
| Legal Services & Support | 0 (0.0%) | 3 (100.0%) |
| Education Instruction & Library | 0 (0.0%) | 0 (0.0%) |
| Arts, Media & Entertainment | 0 (0.0%) | 0 (0.0%) |
| Health Diagnosing & Treating | 0 (0.0%) | 0 (0.0%) |
| Health Technologists | 0 (0.0%) | 0 (0.0%) |
| Total (Category) | 26 (21.1%) | 97 (78.9%) |
| Total (Overall) | 214 (33.7%) | 422 (66.3%) |
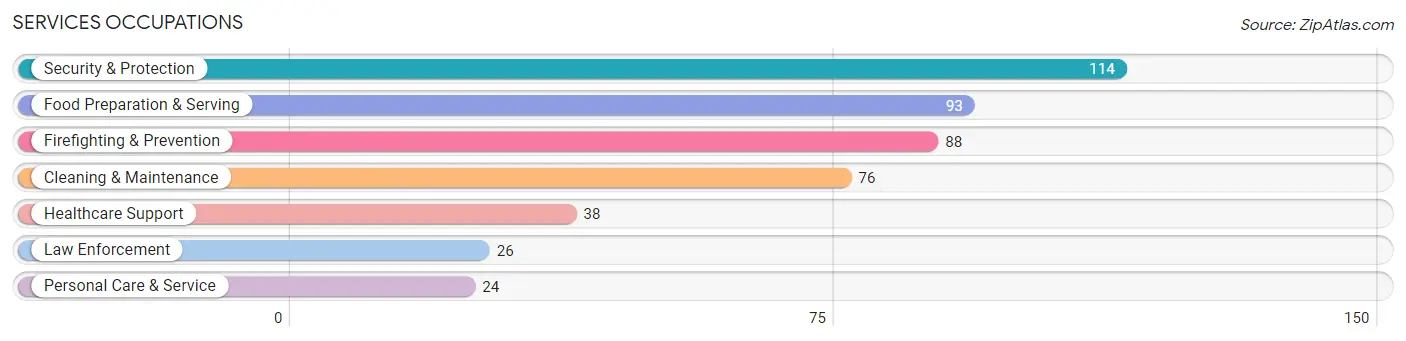
Services Occupations
The most common Services occupations in Jackson are Security & Protection (114 | 17.9%), Food Preparation & Serving (93 | 14.6%), Firefighting & Prevention (88 | 13.8%), Cleaning & Maintenance (76 | 11.9%), and Healthcare Support (38 | 6.0%).
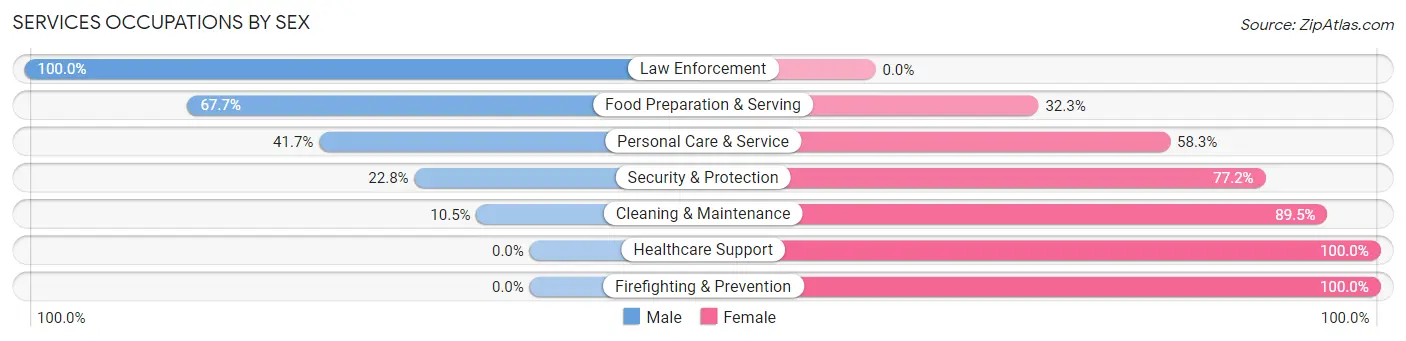
Services Occupations by Sex
Within the Services occupations in Jackson, the most male-oriented occupations are Law Enforcement (100.0%), Food Preparation & Serving (67.7%), and Personal Care & Service (41.7%), while the most female-oriented occupations are Healthcare Support (100.0%), Firefighting & Prevention (100.0%), and Cleaning & Maintenance (89.5%).
| Occupation | Male | Female |
| Healthcare Support | 0 (0.0%) | 38 (100.0%) |
| Security & Protection | 26 (22.8%) | 88 (77.2%) |
| Firefighting & Prevention | 0 (0.0%) | 88 (100.0%) |
| Law Enforcement | 26 (100.0%) | 0 (0.0%) |
| Food Preparation & Serving | 63 (67.7%) | 30 (32.3%) |
| Cleaning & Maintenance | 8 (10.5%) | 68 (89.5%) |
| Personal Care & Service | 10 (41.7%) | 14 (58.3%) |
| Total (Category) | 107 (31.0%) | 238 (69.0%) |
| Total (Overall) | 214 (33.7%) | 422 (66.3%) |
Sales and Office Occupations
The most common Sales and Office occupations in Jackson are Office & Administration (80 | 12.6%), and Sales & Related (4 | 0.6%).
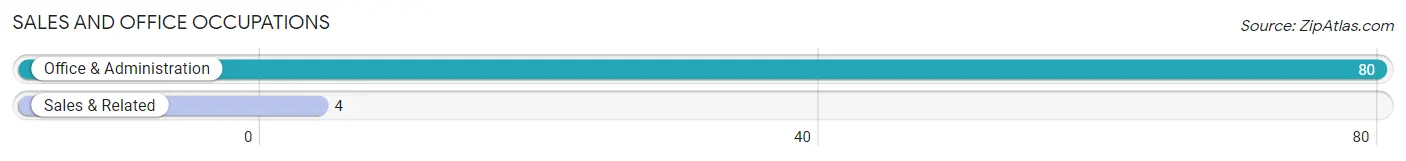
Sales and Office Occupations by Sex
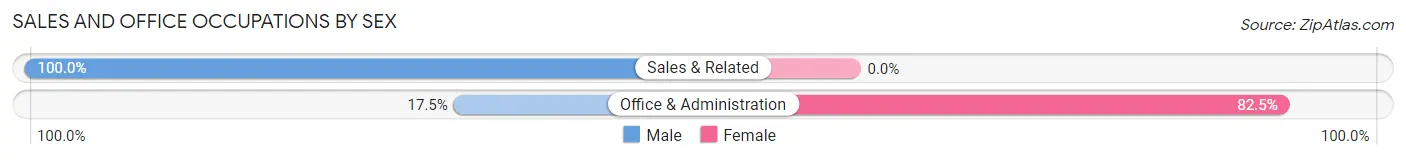
| Occupation | Male | Female |
| Sales & Related | 4 (100.0%) | 0 (0.0%) |
| Office & Administration | 14 (17.5%) | 66 (82.5%) |
| Total (Category) | 18 (21.4%) | 66 (78.6%) |
| Total (Overall) | 214 (33.7%) | 422 (66.3%) |
Natural Resources, Construction and Maintenance Occupations
The most common Natural Resources, Construction and Maintenance occupations in Jackson are Installation, Maintenance & Repair (45 | 7.1%), and Construction & Extraction (13 | 2.0%).
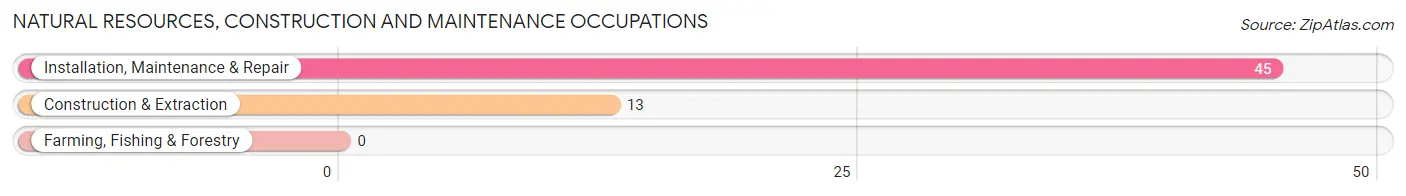
Natural Resources, Construction and Maintenance Occupations by Sex
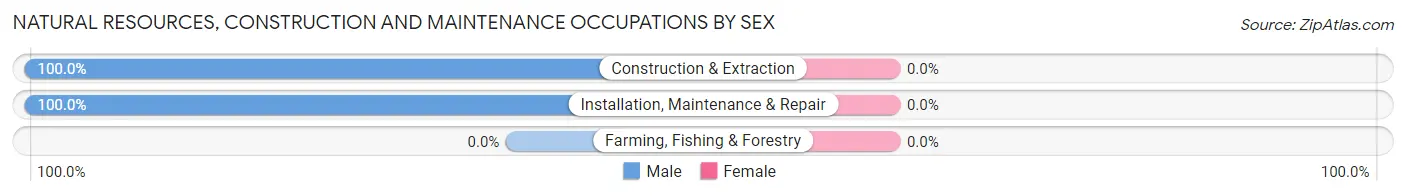
| Occupation | Male | Female |
| Farming, Fishing & Forestry | 0 (0.0%) | 0 (0.0%) |
| Construction & Extraction | 13 (100.0%) | 0 (0.0%) |
| Installation, Maintenance & Repair | 45 (100.0%) | 0 (0.0%) |
| Total (Category) | 58 (100.0%) | 0 (0.0%) |
| Total (Overall) | 214 (33.7%) | 422 (66.3%) |
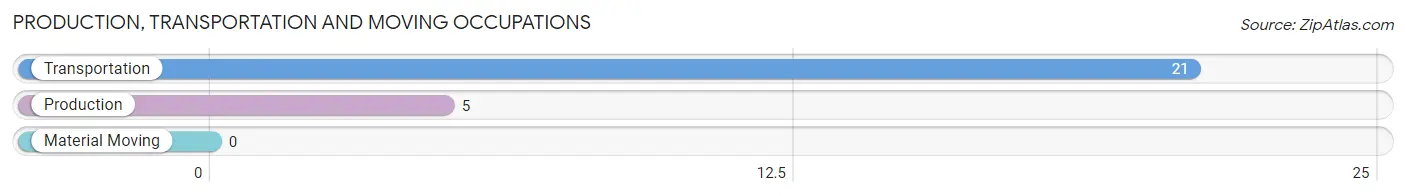
Production, Transportation and Moving Occupations
The most common Production, Transportation and Moving occupations in Jackson are Transportation (21 | 3.3%), and Production (5 | 0.8%).
Production, Transportation and Moving Occupations by Sex
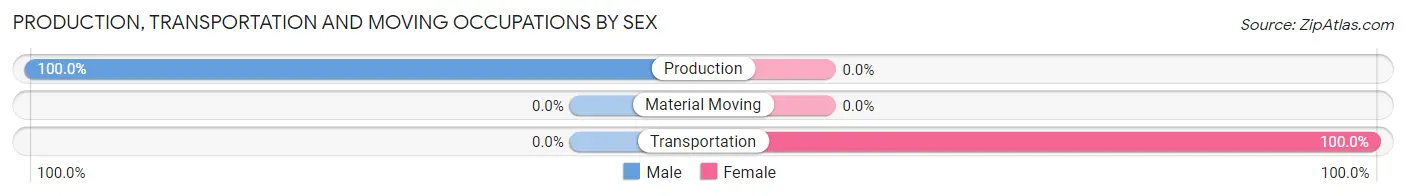
| Occupation | Male | Female |
| Production | 5 (100.0%) | 0 (0.0%) |
| Transportation | 0 (0.0%) | 21 (100.0%) |
| Material Moving | 0 (0.0%) | 0 (0.0%) |
| Total (Category) | 5 (19.2%) | 21 (80.8%) |
| Total (Overall) | 214 (33.7%) | 422 (66.3%) |
Employment Industries by Sex in Jackson
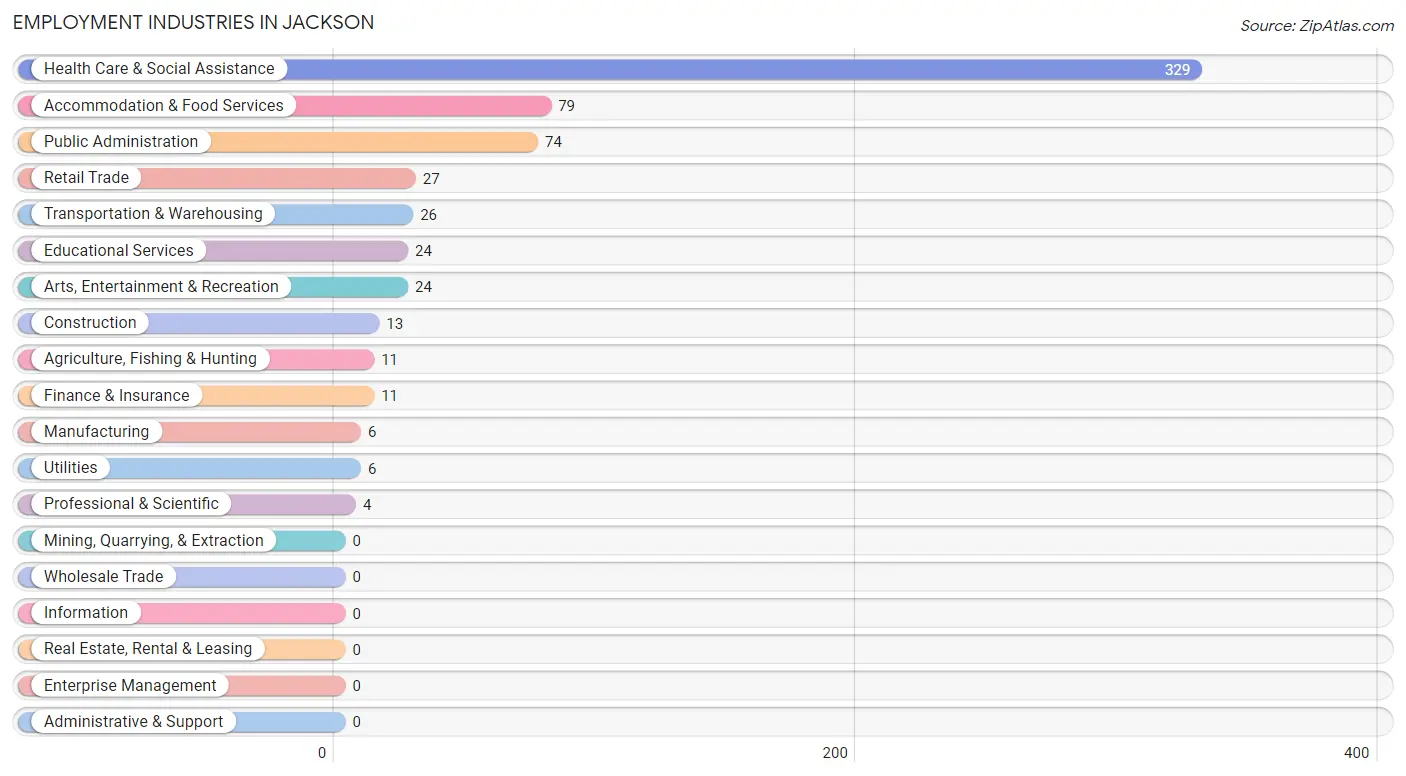
Employment Industries in Jackson
The major employment industries in Jackson include Health Care & Social Assistance (329 | 51.7%), Accommodation & Food Services (79 | 12.4%), Public Administration (74 | 11.6%), Retail Trade (27 | 4.3%), and Transportation & Warehousing (26 | 4.1%).
Employment Industries by Sex in Jackson
The Jackson industries that see more men than women are Agriculture, Fishing & Hunting (100.0%), Construction (100.0%), and Manufacturing (100.0%), whereas the industries that tend to have a higher number of women are Finance & Insurance (100.0%), Transportation & Warehousing (92.3%), and Health Care & Social Assistance (77.8%).
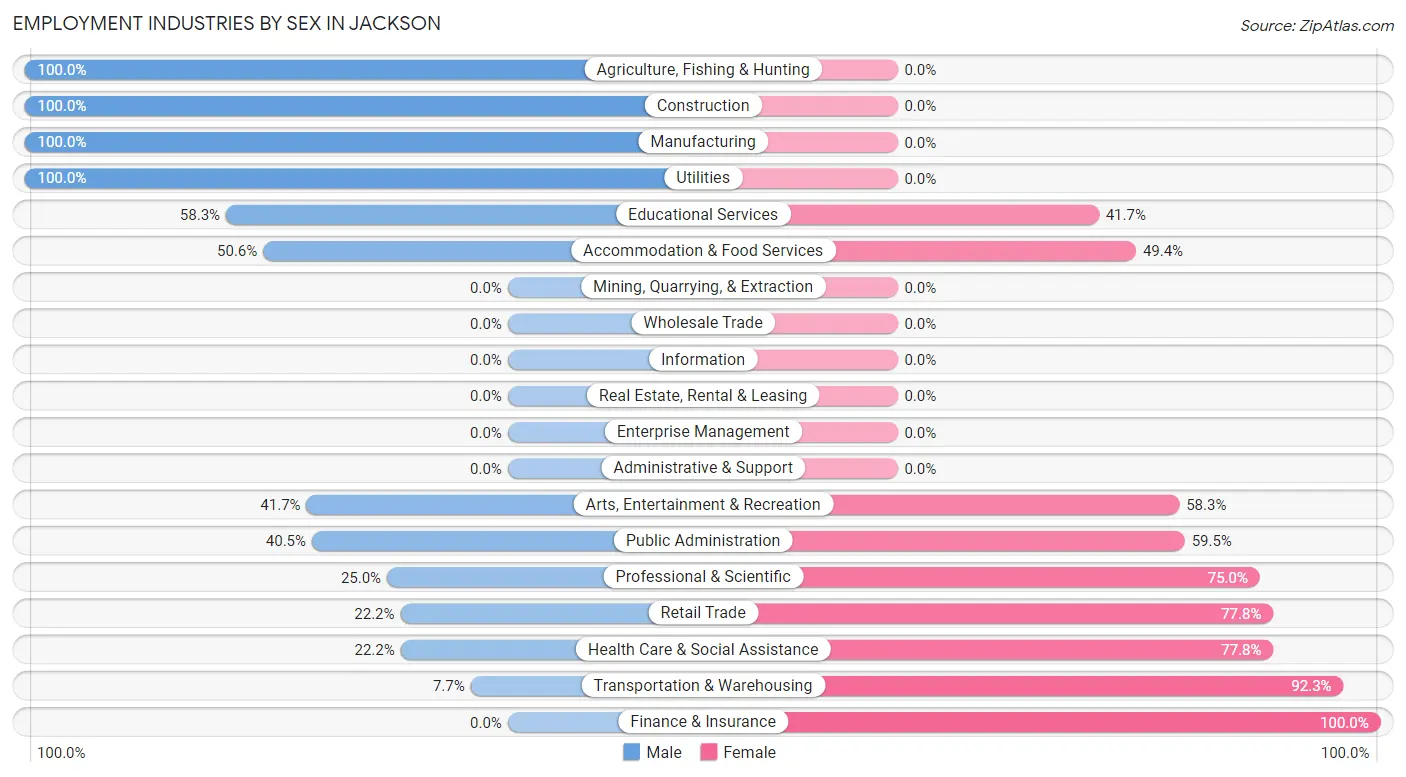
| Industry | Male | Female |
| Agriculture, Fishing & Hunting | 11 (100.0%) | 0 (0.0%) |
| Mining, Quarrying, & Extraction | 0 (0.0%) | 0 (0.0%) |
| Construction | 13 (100.0%) | 0 (0.0%) |
| Manufacturing | 6 (100.0%) | 0 (0.0%) |
| Wholesale Trade | 0 (0.0%) | 0 (0.0%) |
| Retail Trade | 6 (22.2%) | 21 (77.8%) |
| Transportation & Warehousing | 2 (7.7%) | 24 (92.3%) |
| Utilities | 6 (100.0%) | 0 (0.0%) |
| Information | 0 (0.0%) | 0 (0.0%) |
| Finance & Insurance | 0 (0.0%) | 11 (100.0%) |
| Real Estate, Rental & Leasing | 0 (0.0%) | 0 (0.0%) |
| Professional & Scientific | 1 (25.0%) | 3 (75.0%) |
| Enterprise Management | 0 (0.0%) | 0 (0.0%) |
| Administrative & Support | 0 (0.0%) | 0 (0.0%) |
| Educational Services | 14 (58.3%) | 10 (41.7%) |
| Health Care & Social Assistance | 73 (22.2%) | 256 (77.8%) |
| Arts, Entertainment & Recreation | 10 (41.7%) | 14 (58.3%) |
| Accommodation & Food Services | 40 (50.6%) | 39 (49.4%) |
| Public Administration | 30 (40.5%) | 44 (59.5%) |
| Total | 214 (33.7%) | 422 (66.3%) |
Education in Jackson
School Enrollment in Jackson
The most common levels of schooling among the 622 students in Jackson are high school (325 | 52.2%), college / undergraduate (111 | 17.8%), and middle school (74 | 11.9%).
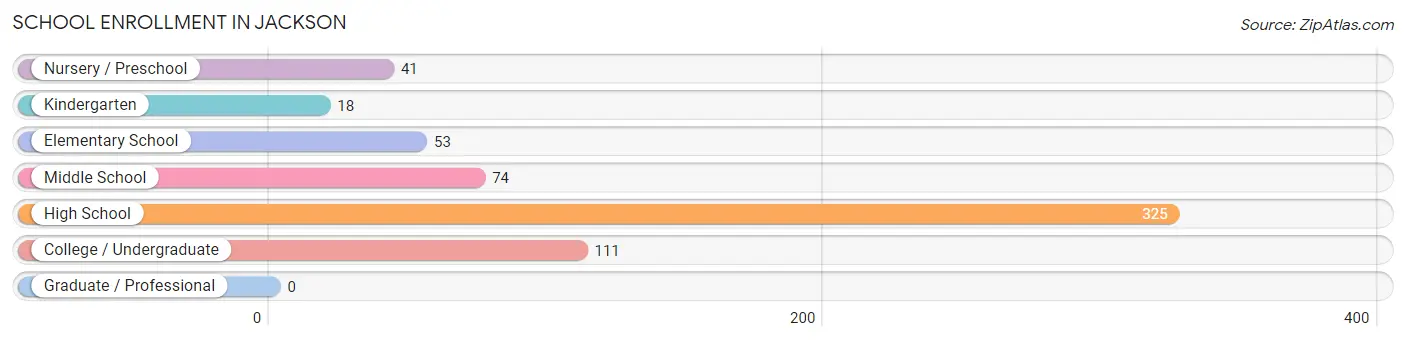
| School Level | # Students | % Students |
| Nursery / Preschool | 41 | 6.6% |
| Kindergarten | 18 | 2.9% |
| Elementary School | 53 | 8.5% |
| Middle School | 74 | 11.9% |
| High School | 325 | 52.2% |
| College / Undergraduate | 111 | 17.8% |
| Graduate / Professional | 0 | 0.0% |
| Total | 622 | 100.0% |
School Enrollment by Age by Funding Source in Jackson
Out of a total of 622 students who are enrolled in schools in Jackson, 35 (5.6%) attend a private institution, while the remaining 587 (94.4%) are enrolled in public schools. The age group of 15 to 17 year olds has the highest likelihood of being enrolled in private schools, with 21 (14.3% in the age bracket) enrolled. Conversely, the age group of 10 to 14 year olds has the lowest likelihood of being enrolled in a private school, with 145 (100.0% in the age bracket) attending a public institution.
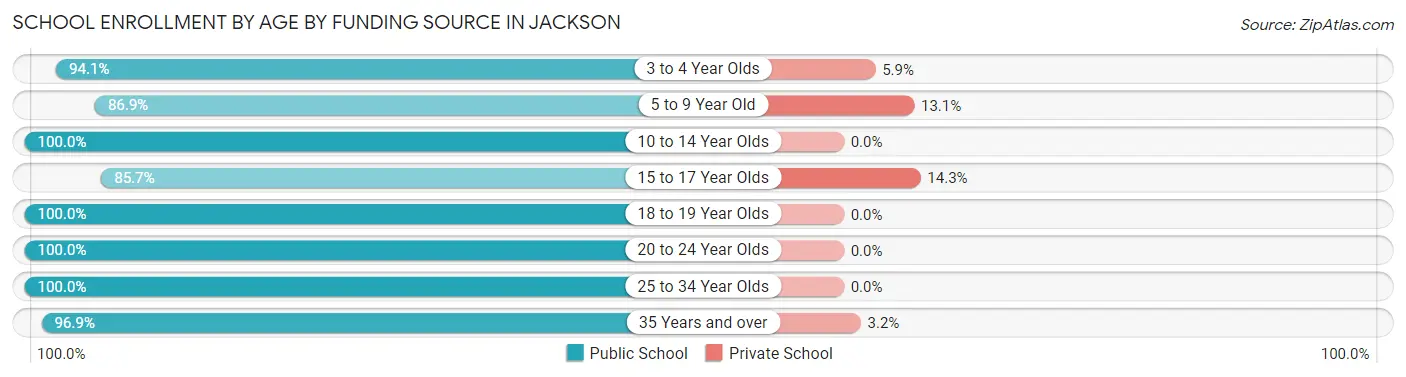
| Age Bracket | Public School | Private School |
| 3 to 4 Year Olds | 32 (94.1%) | 2 (5.9%) |
| 5 to 9 Year Old | 53 (86.9%) | 8 (13.1%) |
| 10 to 14 Year Olds | 145 (100.0%) | 0 (0.0%) |
| 15 to 17 Year Olds | 126 (85.7%) | 21 (14.3%) |
| 18 to 19 Year Olds | 50 (100.0%) | 0 (0.0%) |
| 20 to 24 Year Olds | 14 (100.0%) | 0 (0.0%) |
| 25 to 34 Year Olds | 44 (100.0%) | 0 (0.0%) |
| 35 Years and over | 123 (96.9%) | 4 (3.2%) |
| Total | 587 (94.4%) | 35 (5.6%) |
Educational Attainment by Field of Study in Jackson
Liberal arts & history (84 | 42.4%), physical & health sciences (30 | 15.1%), bio, nature & agricultural (23 | 11.6%), psychology (21 | 10.6%), and education (14 | 7.1%) are the most common fields of study among 198 individuals in Jackson who have obtained a bachelor's degree or higher.
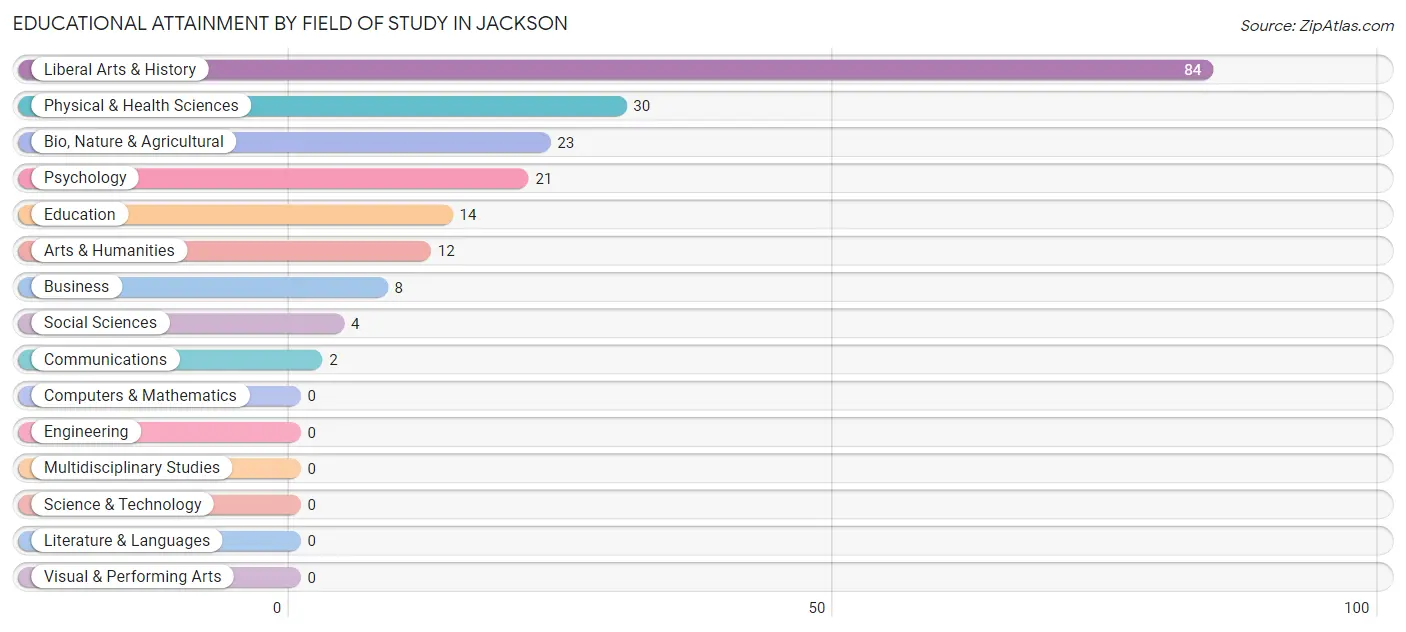
| Field of Study | # Graduates | % Graduates |
| Computers & Mathematics | 0 | 0.0% |
| Bio, Nature & Agricultural | 23 | 11.6% |
| Physical & Health Sciences | 30 | 15.1% |
| Psychology | 21 | 10.6% |
| Social Sciences | 4 | 2.0% |
| Engineering | 0 | 0.0% |
| Multidisciplinary Studies | 0 | 0.0% |
| Science & Technology | 0 | 0.0% |
| Business | 8 | 4.0% |
| Education | 14 | 7.1% |
| Literature & Languages | 0 | 0.0% |
| Liberal Arts & History | 84 | 42.4% |
| Visual & Performing Arts | 0 | 0.0% |
| Communications | 2 | 1.0% |
| Arts & Humanities | 12 | 6.1% |
| Total | 198 | 100.0% |
Transportation & Commute in Jackson
Vehicle Availability by Sex in Jackson
The most prevalent vehicle ownership categories in Jackson are males with 3 vehicles (58, accounting for 30.2%) and females with 3 vehicles (94, making up 14.3%).
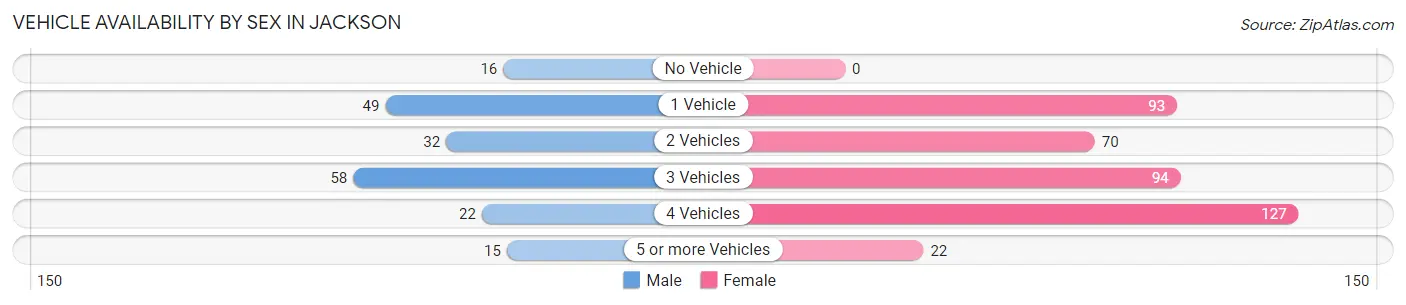
| Vehicles Available | Male | Female |
| No Vehicle | 16 (8.3%) | 0 (0.0%) |
| 1 Vehicle | 49 (25.5%) | 93 (22.9%) |
| 2 Vehicles | 32 (16.7%) | 70 (17.2%) |
| 3 Vehicles | 58 (30.2%) | 94 (23.2%) |
| 4 Vehicles | 22 (11.5%) | 127 (31.3%) |
| 5 or more Vehicles | 15 (7.8%) | 22 (5.4%) |
| Total | 192 (100.0%) | 406 (100.0%) |
Commute Time in Jackson
The most frequently occuring commute durations in Jackson are 20 to 24 minutes (141 commuters, 23.8%), 5 to 9 minutes (114 commuters, 19.2%), and 10 to 14 minutes (111 commuters, 18.7%).
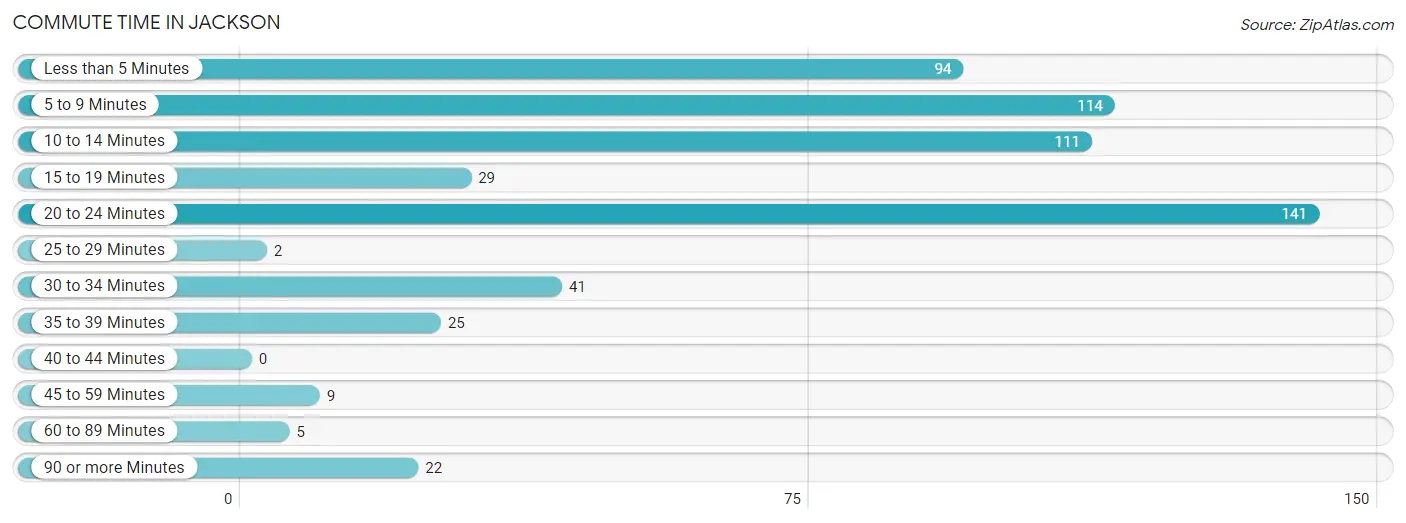
| Commute Time | # Commuters | % Commuters |
| Less than 5 Minutes | 94 | 15.9% |
| 5 to 9 Minutes | 114 | 19.2% |
| 10 to 14 Minutes | 111 | 18.7% |
| 15 to 19 Minutes | 29 | 4.9% |
| 20 to 24 Minutes | 141 | 23.8% |
| 25 to 29 Minutes | 2 | 0.3% |
| 30 to 34 Minutes | 41 | 6.9% |
| 35 to 39 Minutes | 25 | 4.2% |
| 40 to 44 Minutes | 0 | 0.0% |
| 45 to 59 Minutes | 9 | 1.5% |
| 60 to 89 Minutes | 5 | 0.8% |
| 90 or more Minutes | 22 | 3.7% |
Commute Time by Sex in Jackson
The most common commute times in Jackson are 5 to 9 minutes (52 commuters, 24.3%) for males and 20 to 24 minutes (102 commuters, 26.9%) for females.
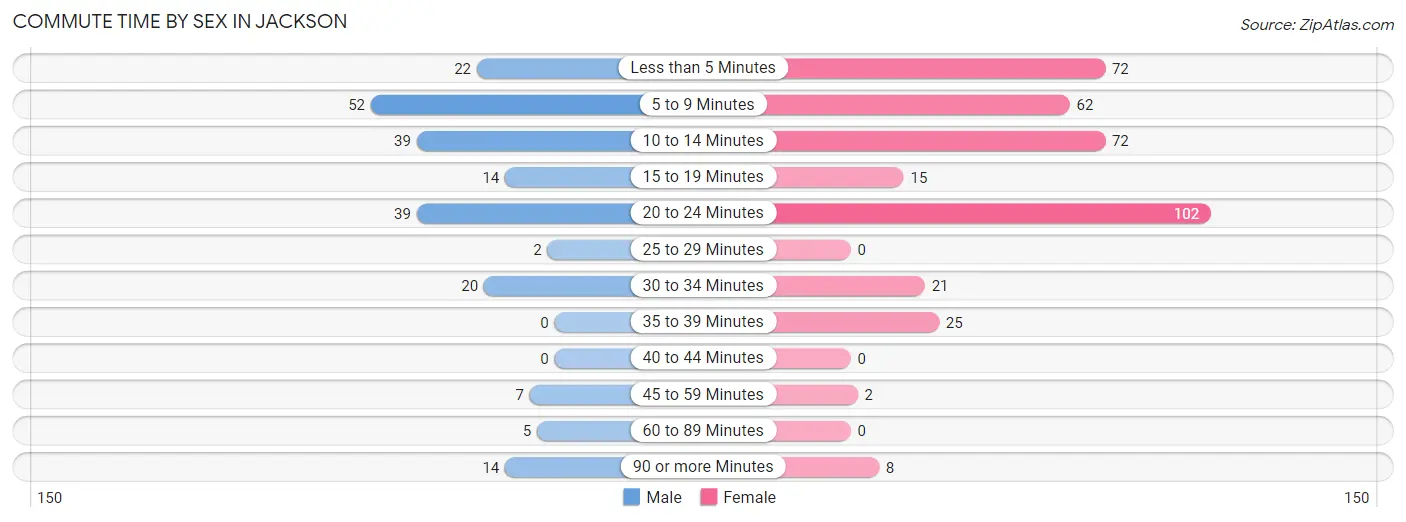
| Commute Time | Male | Female |
| Less than 5 Minutes | 22 (10.3%) | 72 (19.0%) |
| 5 to 9 Minutes | 52 (24.3%) | 62 (16.4%) |
| 10 to 14 Minutes | 39 (18.2%) | 72 (19.0%) |
| 15 to 19 Minutes | 14 (6.5%) | 15 (4.0%) |
| 20 to 24 Minutes | 39 (18.2%) | 102 (26.9%) |
| 25 to 29 Minutes | 2 (0.9%) | 0 (0.0%) |
| 30 to 34 Minutes | 20 (9.3%) | 21 (5.5%) |
| 35 to 39 Minutes | 0 (0.0%) | 25 (6.6%) |
| 40 to 44 Minutes | 0 (0.0%) | 0 (0.0%) |
| 45 to 59 Minutes | 7 (3.3%) | 2 (0.5%) |
| 60 to 89 Minutes | 5 (2.3%) | 0 (0.0%) |
| 90 or more Minutes | 14 (6.5%) | 8 (2.1%) |
Time of Departure to Work by Sex in Jackson
The most frequent times of departure to work in Jackson are 6:30 AM to 6:59 AM (63, 29.4%) for males and 4:00 PM to 11:59 PM (135, 35.6%) for females.
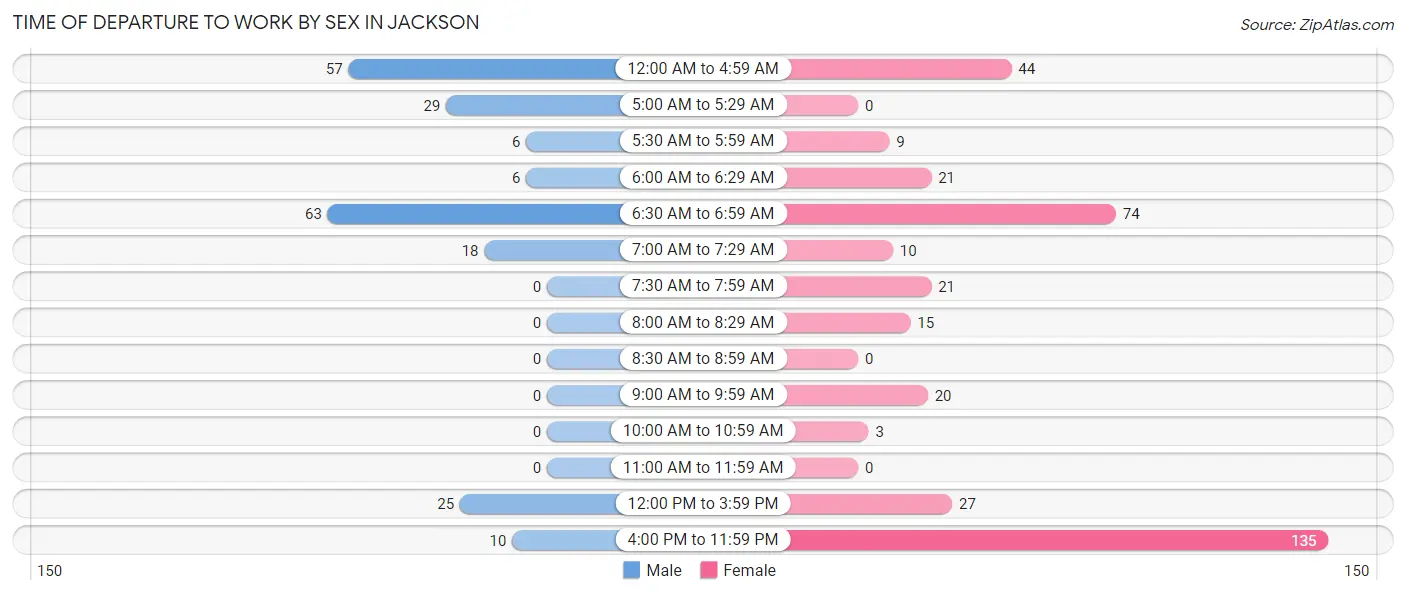
| Time of Departure | Male | Female |
| 12:00 AM to 4:59 AM | 57 (26.6%) | 44 (11.6%) |
| 5:00 AM to 5:29 AM | 29 (13.6%) | 0 (0.0%) |
| 5:30 AM to 5:59 AM | 6 (2.8%) | 9 (2.4%) |
| 6:00 AM to 6:29 AM | 6 (2.8%) | 21 (5.5%) |
| 6:30 AM to 6:59 AM | 63 (29.4%) | 74 (19.5%) |
| 7:00 AM to 7:29 AM | 18 (8.4%) | 10 (2.6%) |
| 7:30 AM to 7:59 AM | 0 (0.0%) | 21 (5.5%) |
| 8:00 AM to 8:29 AM | 0 (0.0%) | 15 (4.0%) |
| 8:30 AM to 8:59 AM | 0 (0.0%) | 0 (0.0%) |
| 9:00 AM to 9:59 AM | 0 (0.0%) | 20 (5.3%) |
| 10:00 AM to 10:59 AM | 0 (0.0%) | 3 (0.8%) |
| 11:00 AM to 11:59 AM | 0 (0.0%) | 0 (0.0%) |
| 12:00 PM to 3:59 PM | 25 (11.7%) | 27 (7.1%) |
| 4:00 PM to 11:59 PM | 10 (4.7%) | 135 (35.6%) |
| Total | 214 (100.0%) | 379 (100.0%) |
Housing Occupancy in Jackson
Occupancy by Ownership in Jackson
Of the total 697 dwellings in Jackson, owner-occupied units account for 419 (60.1%), while renter-occupied units make up 278 (39.9%).
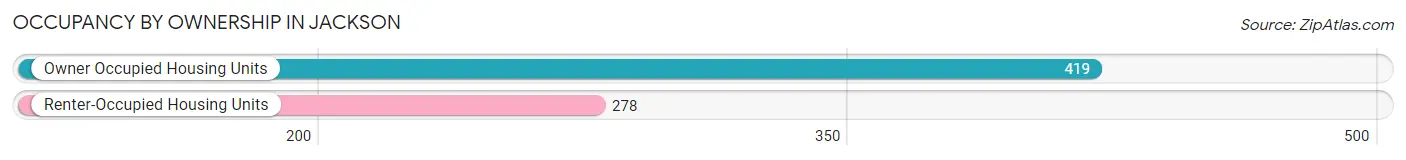
| Occupancy | # Housing Units | % Housing Units |
| Owner Occupied Housing Units | 419 | 60.1% |
| Renter-Occupied Housing Units | 278 | 39.9% |
| Total Occupied Housing Units | 697 | 100.0% |
Occupancy by Household Size in Jackson
| Household Size | # Housing Units | % Housing Units |
| 1-Person Household | 145 | 20.8% |
| 2-Person Household | 258 | 37.0% |
| 3-Person Household | 160 | 23.0% |
| 4+ Person Household | 134 | 19.2% |
| Total Housing Units | 697 | 100.0% |
Occupancy by Ownership by Household Size in Jackson
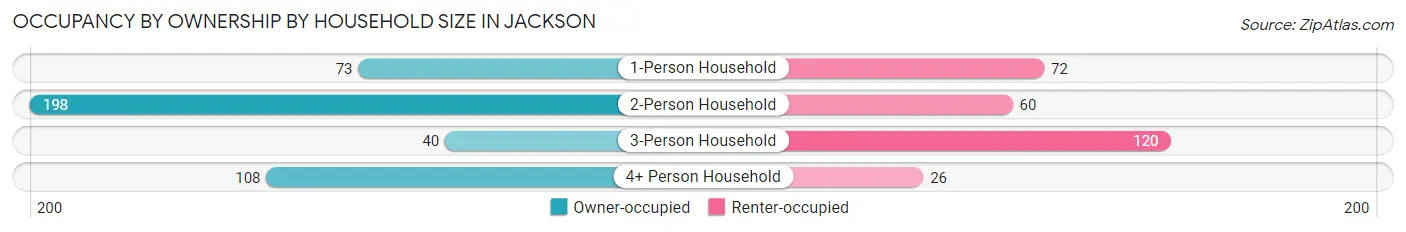
| Household Size | Owner-occupied | Renter-occupied |
| 1-Person Household | 73 (50.3%) | 72 (49.7%) |
| 2-Person Household | 198 (76.7%) | 60 (23.3%) |
| 3-Person Household | 40 (25.0%) | 120 (75.0%) |
| 4+ Person Household | 108 (80.6%) | 26 (19.4%) |
| Total Housing Units | 419 (60.1%) | 278 (39.9%) |
Occupancy by Educational Attainment in Jackson
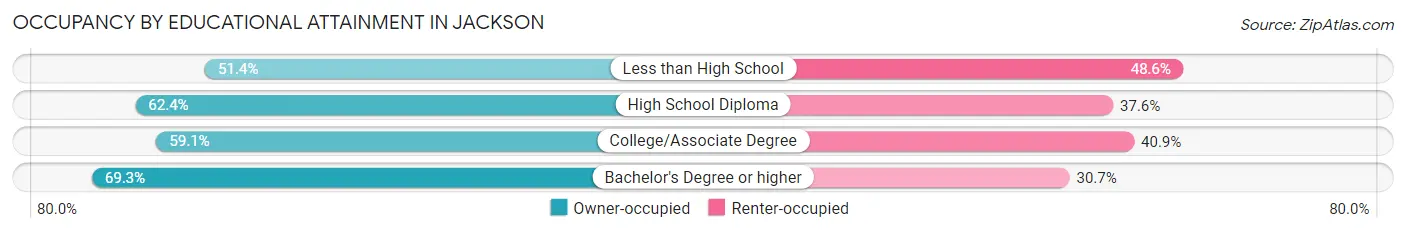
| Household Size | Owner-occupied | Renter-occupied |
| Less than High School | 75 (51.4%) | 71 (48.6%) |
| High School Diploma | 201 (62.4%) | 121 (37.6%) |
| College/Associate Degree | 91 (59.1%) | 63 (40.9%) |
| Bachelor's Degree or higher | 52 (69.3%) | 23 (30.7%) |
Occupancy by Age of Householder in Jackson
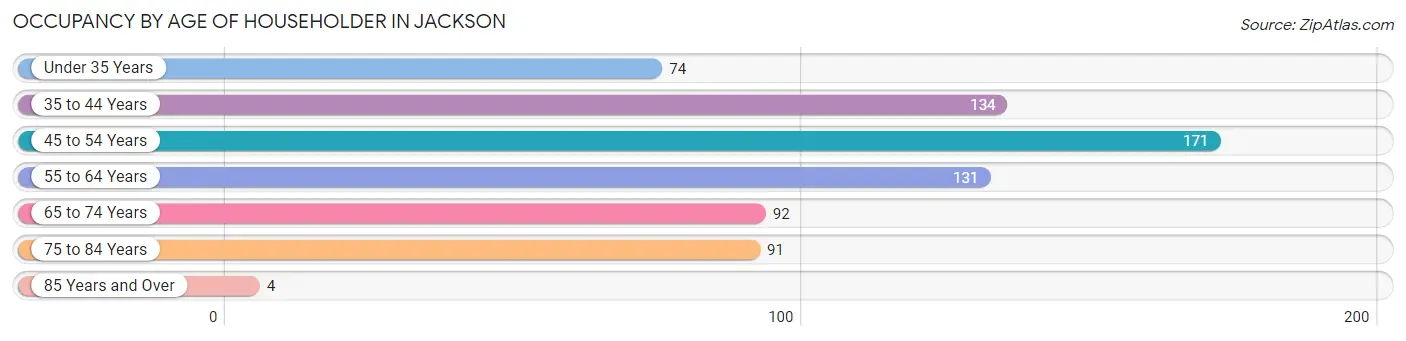
| Age Bracket | # Households | % Households |
| Under 35 Years | 74 | 10.6% |
| 35 to 44 Years | 134 | 19.2% |
| 45 to 54 Years | 171 | 24.5% |
| 55 to 64 Years | 131 | 18.8% |
| 65 to 74 Years | 92 | 13.2% |
| 75 to 84 Years | 91 | 13.1% |
| 85 Years and Over | 4 | 0.6% |
| Total | 697 | 100.0% |
Housing Finances in Jackson
Median Income by Occupancy in Jackson
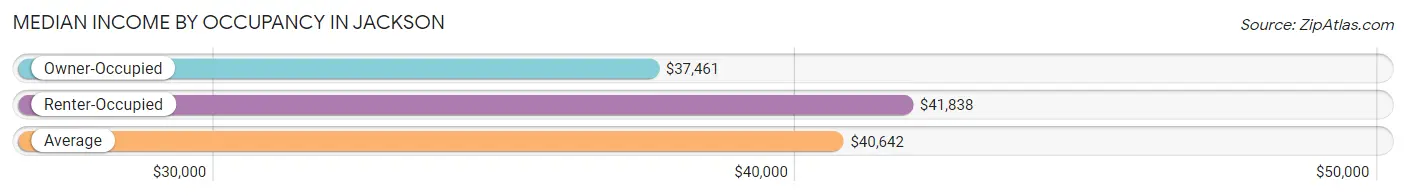
| Occupancy Type | # Households | Median Income |
| Owner-Occupied | 419 (60.1%) | $37,461 |
| Renter-Occupied | 278 (39.9%) | $41,838 |
| Average | 697 (100.0%) | $40,642 |
Occupancy by Householder Income Bracket in Jackson
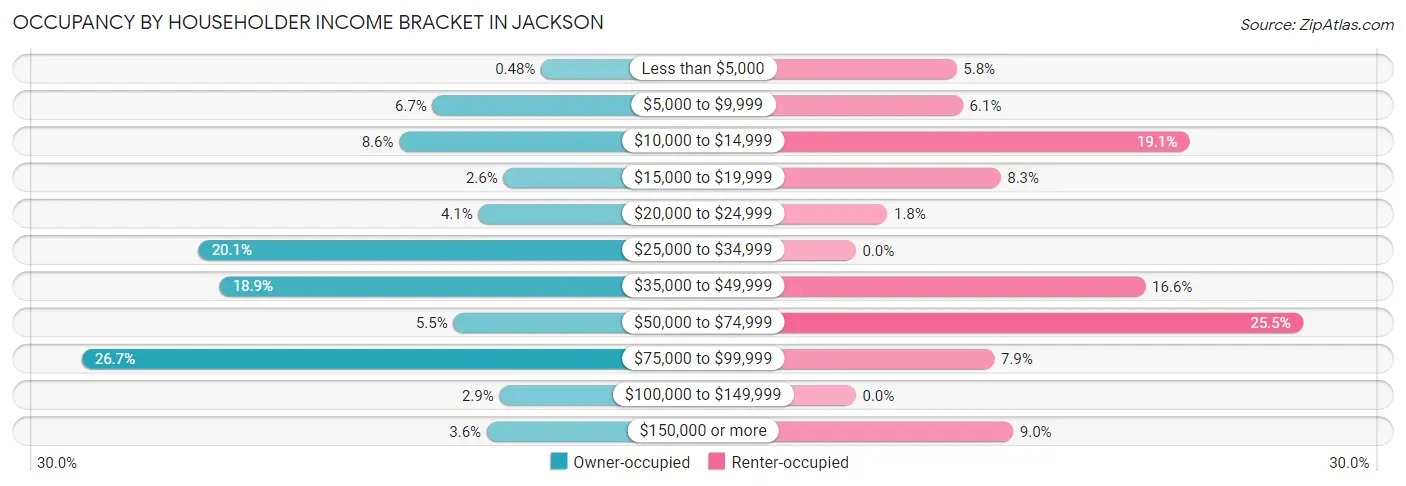
| Income Bracket | Owner-occupied | Renter-occupied |
| Less than $5,000 | 2 (0.5%) | 16 (5.8%) |
| $5,000 to $9,999 | 28 (6.7%) | 17 (6.1%) |
| $10,000 to $14,999 | 36 (8.6%) | 53 (19.1%) |
| $15,000 to $19,999 | 11 (2.6%) | 23 (8.3%) |
| $20,000 to $24,999 | 17 (4.1%) | 5 (1.8%) |
| $25,000 to $34,999 | 84 (20.1%) | 0 (0.0%) |
| $35,000 to $49,999 | 79 (18.9%) | 46 (16.6%) |
| $50,000 to $74,999 | 23 (5.5%) | 71 (25.5%) |
| $75,000 to $99,999 | 112 (26.7%) | 22 (7.9%) |
| $100,000 to $149,999 | 12 (2.9%) | 0 (0.0%) |
| $150,000 or more | 15 (3.6%) | 25 (9.0%) |
| Total | 419 (100.0%) | 278 (100.0%) |
Monthly Housing Cost Tiers in Jackson
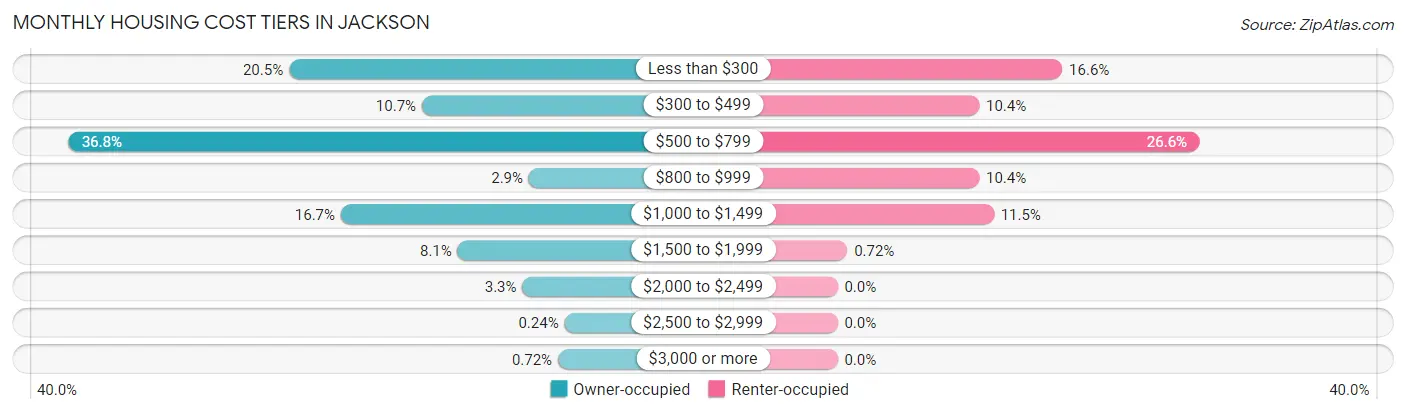
| Monthly Cost | Owner-occupied | Renter-occupied |
| Less than $300 | 86 (20.5%) | 46 (16.6%) |
| $300 to $499 | 45 (10.7%) | 29 (10.4%) |
| $500 to $799 | 154 (36.7%) | 74 (26.6%) |
| $800 to $999 | 12 (2.9%) | 29 (10.4%) |
| $1,000 to $1,499 | 70 (16.7%) | 32 (11.5%) |
| $1,500 to $1,999 | 34 (8.1%) | 2 (0.7%) |
| $2,000 to $2,499 | 14 (3.3%) | 0 (0.0%) |
| $2,500 to $2,999 | 1 (0.2%) | 0 (0.0%) |
| $3,000 or more | 3 (0.7%) | 0 (0.0%) |
| Total | 419 (100.0%) | 278 (100.0%) |
Physical Housing Characteristics in Jackson
Housing Structures in Jackson
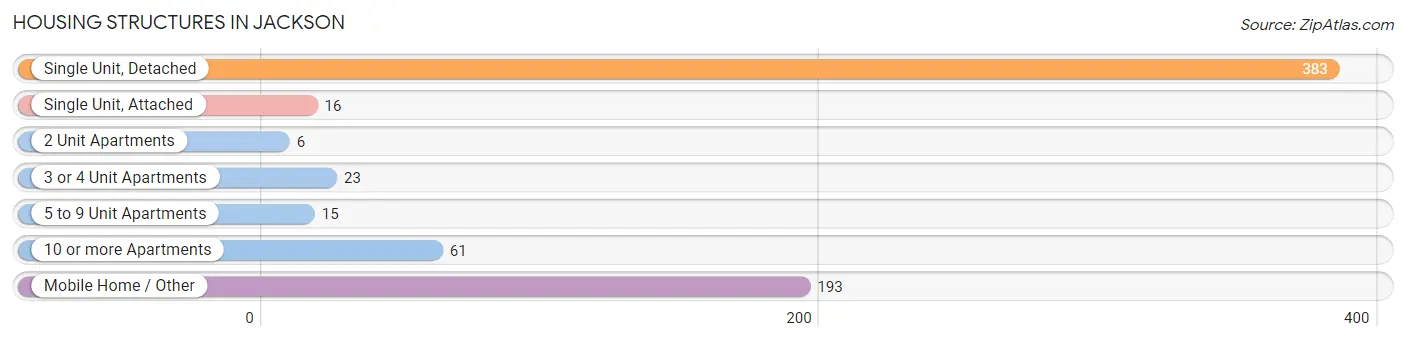
| Structure Type | # Housing Units | % Housing Units |
| Single Unit, Detached | 383 | 54.9% |
| Single Unit, Attached | 16 | 2.3% |
| 2 Unit Apartments | 6 | 0.9% |
| 3 or 4 Unit Apartments | 23 | 3.3% |
| 5 to 9 Unit Apartments | 15 | 2.1% |
| 10 or more Apartments | 61 | 8.7% |
| Mobile Home / Other | 193 | 27.7% |
| Total | 697 | 100.0% |
Housing Structures by Occupancy in Jackson
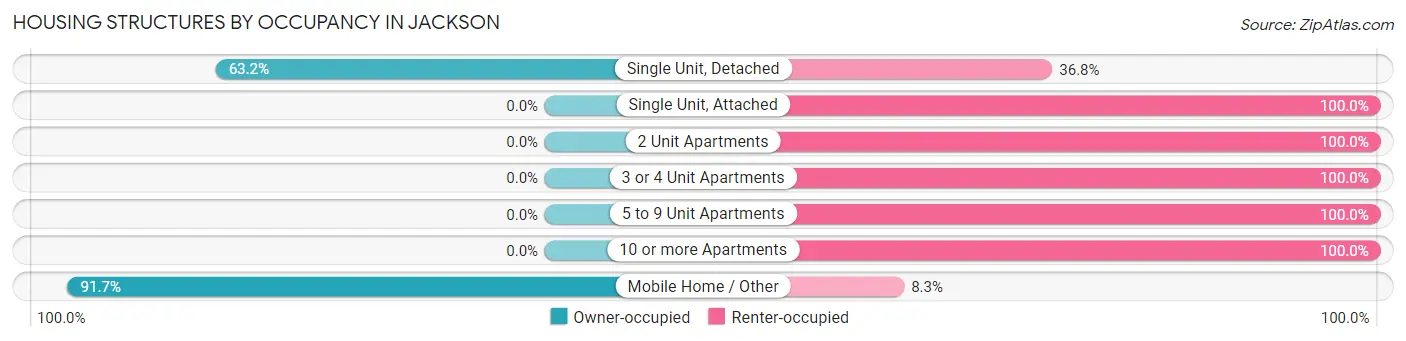
| Structure Type | Owner-occupied | Renter-occupied |
| Single Unit, Detached | 242 (63.2%) | 141 (36.8%) |
| Single Unit, Attached | 0 (0.0%) | 16 (100.0%) |
| 2 Unit Apartments | 0 (0.0%) | 6 (100.0%) |
| 3 or 4 Unit Apartments | 0 (0.0%) | 23 (100.0%) |
| 5 to 9 Unit Apartments | 0 (0.0%) | 15 (100.0%) |
| 10 or more Apartments | 0 (0.0%) | 61 (100.0%) |
| Mobile Home / Other | 177 (91.7%) | 16 (8.3%) |
| Total | 419 (60.1%) | 278 (39.9%) |
Housing Structures by Number of Rooms in Jackson
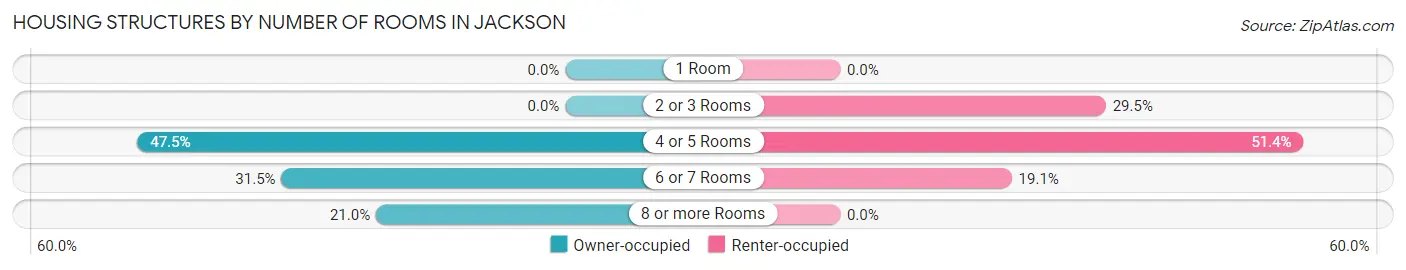
| Number of Rooms | Owner-occupied | Renter-occupied |
| 1 Room | 0 (0.0%) | 0 (0.0%) |
| 2 or 3 Rooms | 0 (0.0%) | 82 (29.5%) |
| 4 or 5 Rooms | 199 (47.5%) | 143 (51.4%) |
| 6 or 7 Rooms | 132 (31.5%) | 53 (19.1%) |
| 8 or more Rooms | 88 (21.0%) | 0 (0.0%) |
| Total | 419 (100.0%) | 278 (100.0%) |
Housing Structure by Heating Type in Jackson
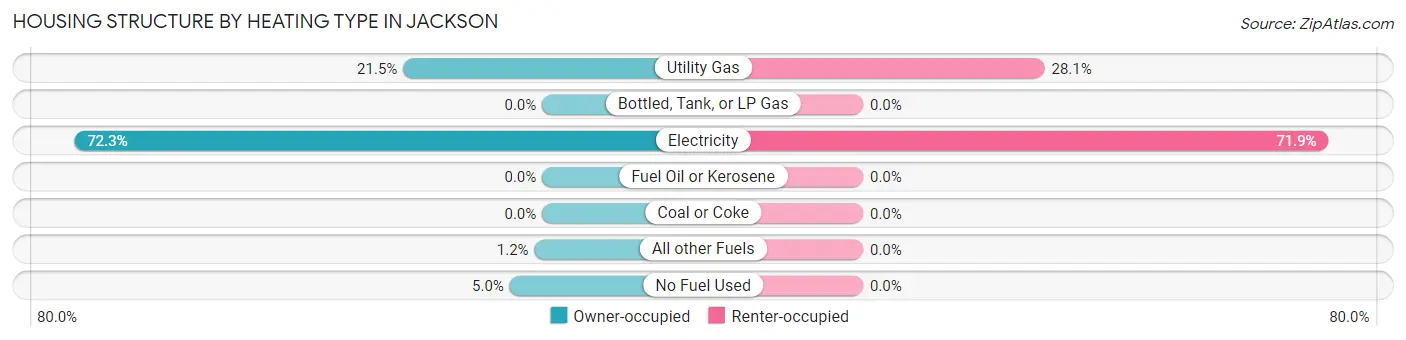
| Heating Type | Owner-occupied | Renter-occupied |
| Utility Gas | 90 (21.5%) | 78 (28.1%) |
| Bottled, Tank, or LP Gas | 0 (0.0%) | 0 (0.0%) |
| Electricity | 303 (72.3%) | 200 (71.9%) |
| Fuel Oil or Kerosene | 0 (0.0%) | 0 (0.0%) |
| Coal or Coke | 0 (0.0%) | 0 (0.0%) |
| All other Fuels | 5 (1.2%) | 0 (0.0%) |
| No Fuel Used | 21 (5.0%) | 0 (0.0%) |
| Total | 419 (100.0%) | 278 (100.0%) |
Household Vehicle Usage in Jackson
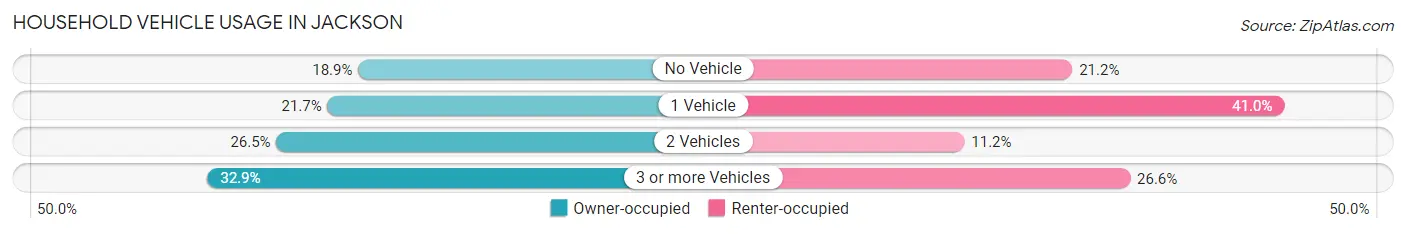
| Vehicles per Household | Owner-occupied | Renter-occupied |
| No Vehicle | 79 (18.9%) | 59 (21.2%) |
| 1 Vehicle | 91 (21.7%) | 114 (41.0%) |
| 2 Vehicles | 111 (26.5%) | 31 (11.2%) |
| 3 or more Vehicles | 138 (32.9%) | 74 (26.6%) |
| Total | 419 (100.0%) | 278 (100.0%) |
Real Estate & Mortgages in Jackson
Real Estate and Mortgage Overview in Jackson
| Characteristic | Without Mortgage | With Mortgage |
| Housing Units | 245 | 174 |
| Median Property Value | $71,500 | $139,700 |
| Median Household Income | $30,655 | $1 |
| Monthly Housing Costs | $503 | $3 |
| Real Estate Taxes | $199 | $21 |
Property Value by Mortgage Status in Jackson
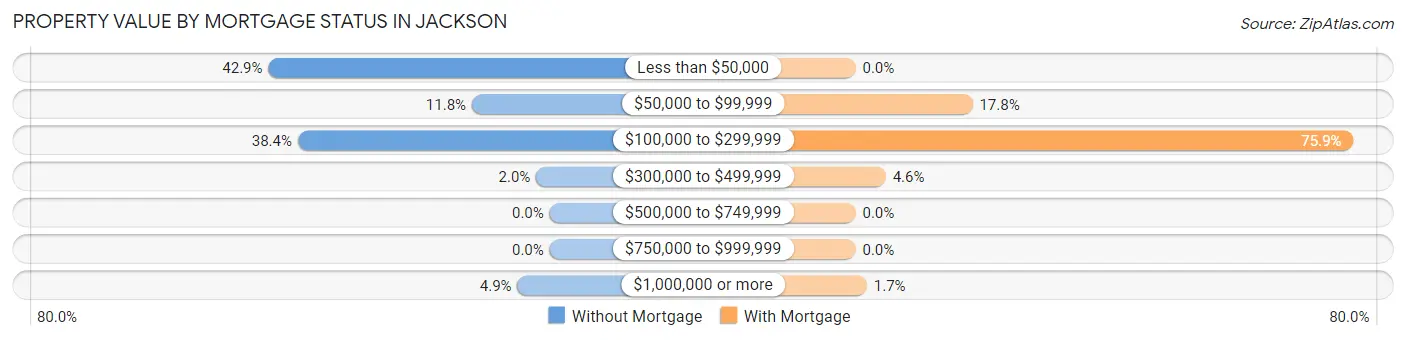
| Property Value | Without Mortgage | With Mortgage |
| Less than $50,000 | 105 (42.9%) | 0 (0.0%) |
| $50,000 to $99,999 | 29 (11.8%) | 31 (17.8%) |
| $100,000 to $299,999 | 94 (38.4%) | 132 (75.9%) |
| $300,000 to $499,999 | 5 (2.0%) | 8 (4.6%) |
| $500,000 to $749,999 | 0 (0.0%) | 0 (0.0%) |
| $750,000 to $999,999 | 0 (0.0%) | 0 (0.0%) |
| $1,000,000 or more | 12 (4.9%) | 3 (1.7%) |
| Total | 245 (100.0%) | 174 (100.0%) |
Household Income by Mortgage Status in Jackson
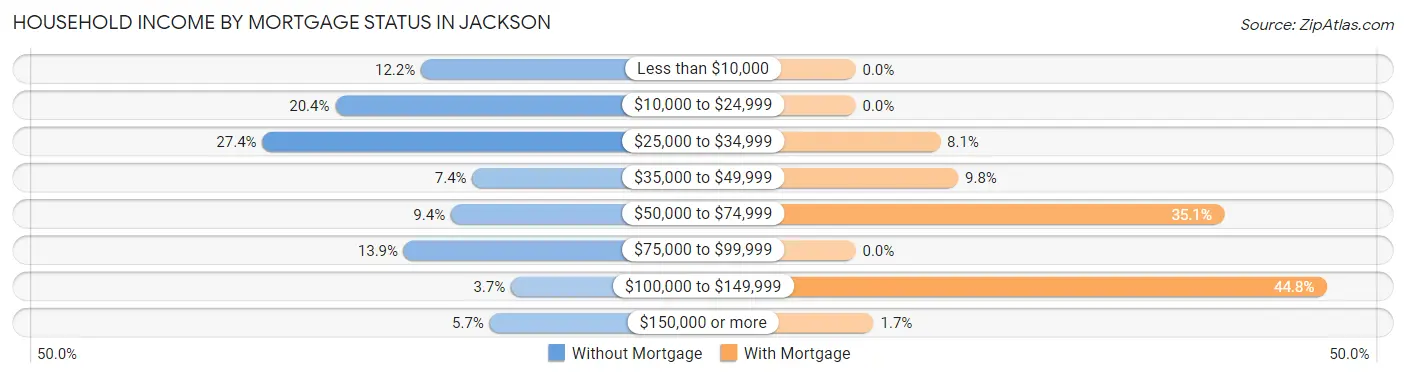
| Household Income | Without Mortgage | With Mortgage |
| Less than $10,000 | 30 (12.2%) | 0 (0.0%) |
| $10,000 to $24,999 | 50 (20.4%) | 0 (0.0%) |
| $25,000 to $34,999 | 67 (27.4%) | 14 (8.1%) |
| $35,000 to $49,999 | 18 (7.3%) | 17 (9.8%) |
| $50,000 to $74,999 | 23 (9.4%) | 61 (35.1%) |
| $75,000 to $99,999 | 34 (13.9%) | 0 (0.0%) |
| $100,000 to $149,999 | 9 (3.7%) | 78 (44.8%) |
| $150,000 or more | 14 (5.7%) | 3 (1.7%) |
| Total | 245 (100.0%) | 174 (100.0%) |
Property Value to Household Income Ratio in Jackson
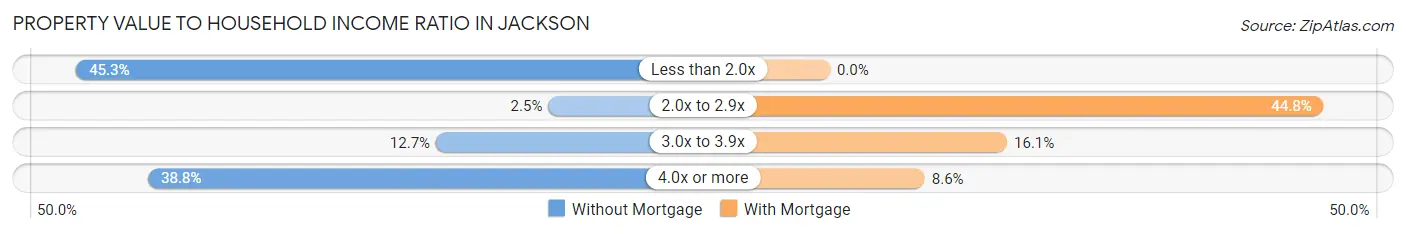
| Value-to-Income Ratio | Without Mortgage | With Mortgage |
| Less than 2.0x | 111 (45.3%) | 0 (0.0%) |
| 2.0x to 2.9x | 6 (2.5%) | 78 (44.8%) |
| 3.0x to 3.9x | 31 (12.7%) | 28 (16.1%) |
| 4.0x or more | 95 (38.8%) | 15 (8.6%) |
| Total | 245 (100.0%) | 174 (100.0%) |
Real Estate Taxes by Mortgage Status in Jackson
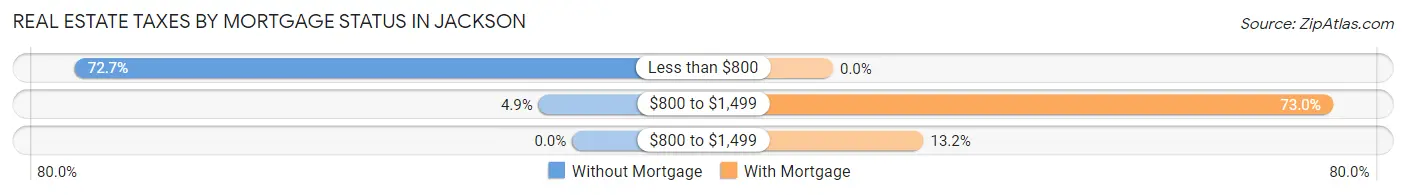
| Property Taxes | Without Mortgage | With Mortgage |
| Less than $800 | 178 (72.7%) | 0 (0.0%) |
| $800 to $1,499 | 12 (4.9%) | 127 (73.0%) |
| $800 to $1,499 | 0 (0.0%) | 23 (13.2%) |
| Total | 245 (100.0%) | 174 (100.0%) |
Health & Disability in Jackson
Health Insurance Coverage by Age in Jackson
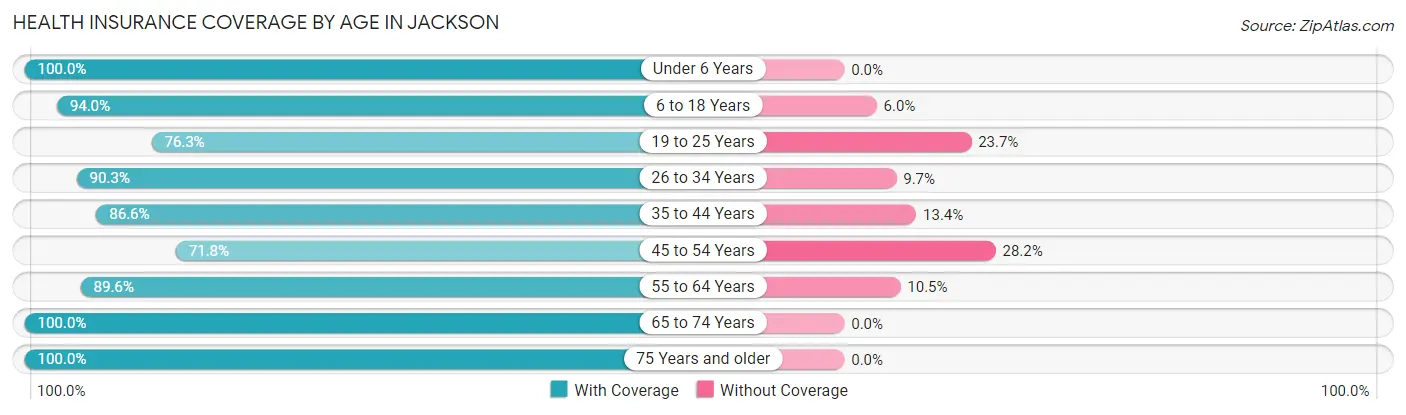
| Age Bracket | With Coverage | Without Coverage |
| Under 6 Years | 96 (100.0%) | 0 (0.0%) |
| 6 to 18 Years | 328 (94.0%) | 21 (6.0%) |
| 19 to 25 Years | 271 (76.3%) | 84 (23.7%) |
| 26 to 34 Years | 177 (90.3%) | 19 (9.7%) |
| 35 to 44 Years | 207 (86.6%) | 32 (13.4%) |
| 45 to 54 Years | 275 (71.8%) | 108 (28.2%) |
| 55 to 64 Years | 180 (89.5%) | 21 (10.4%) |
| 65 to 74 Years | 191 (100.0%) | 0 (0.0%) |
| 75 Years and older | 154 (100.0%) | 0 (0.0%) |
| Total | 1,879 (86.8%) | 285 (13.2%) |
Health Insurance Coverage by Citizenship Status in Jackson
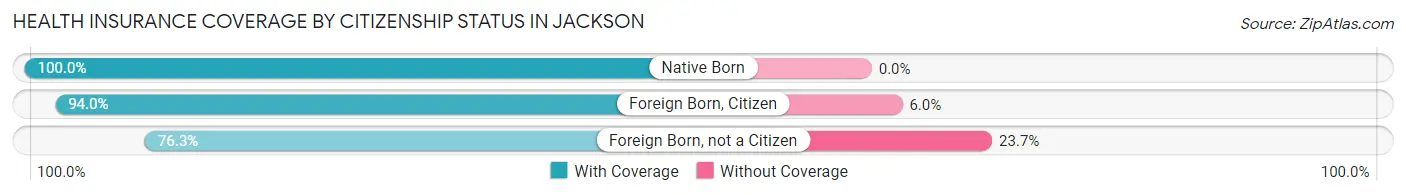
| Citizenship Status | With Coverage | Without Coverage |
| Native Born | 96 (100.0%) | 0 (0.0%) |
| Foreign Born, Citizen | 328 (94.0%) | 21 (6.0%) |
| Foreign Born, not a Citizen | 271 (76.3%) | 84 (23.7%) |
Health Insurance Coverage by Household Income in Jackson
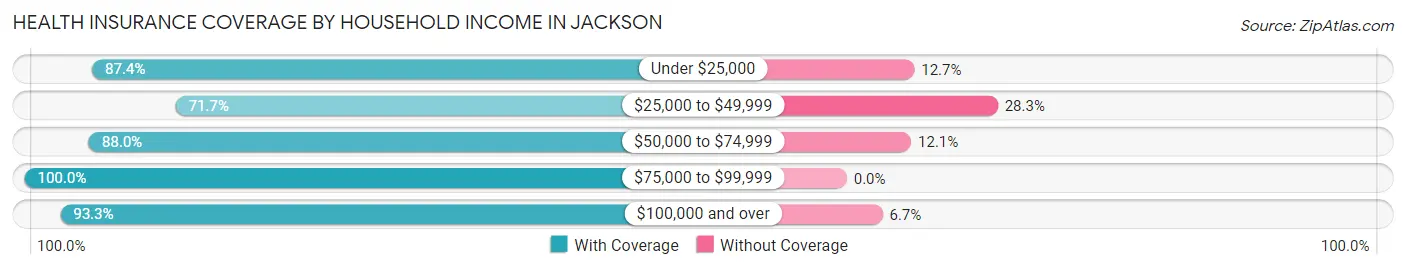
| Household Income | With Coverage | Without Coverage |
| Under $25,000 | 504 (87.4%) | 73 (12.7%) |
| $25,000 to $49,999 | 350 (71.7%) | 138 (28.3%) |
| $50,000 to $74,999 | 219 (87.9%) | 30 (12.0%) |
| $75,000 to $99,999 | 272 (100.0%) | 0 (0.0%) |
| $100,000 and over | 307 (93.3%) | 22 (6.7%) |
Public vs Private Health Insurance Coverage by Age in Jackson
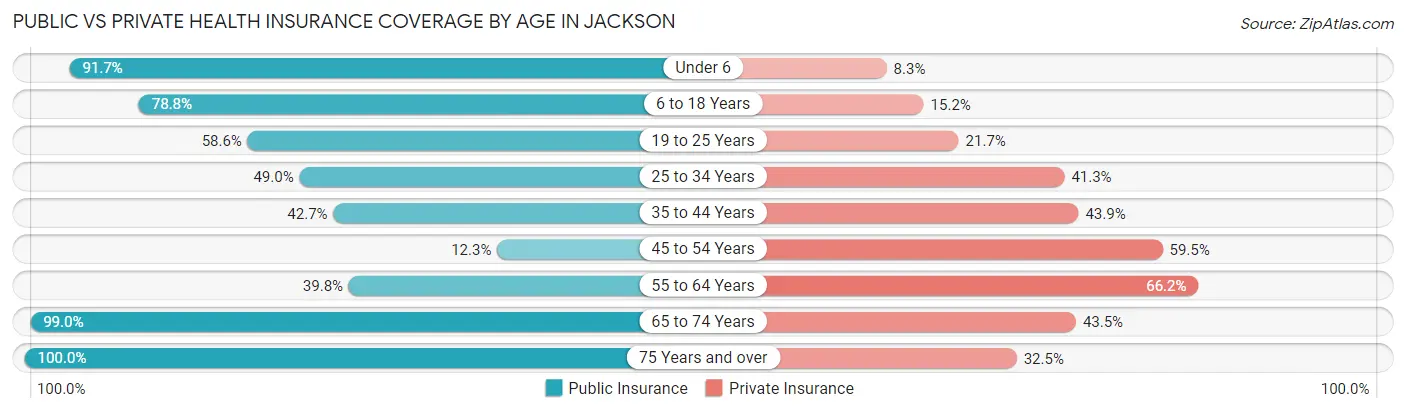
| Age Bracket | Public Insurance | Private Insurance |
| Under 6 | 88 (91.7%) | 8 (8.3%) |
| 6 to 18 Years | 275 (78.8%) | 53 (15.2%) |
| 19 to 25 Years | 208 (58.6%) | 77 (21.7%) |
| 25 to 34 Years | 96 (49.0%) | 81 (41.3%) |
| 35 to 44 Years | 102 (42.7%) | 105 (43.9%) |
| 45 to 54 Years | 47 (12.3%) | 228 (59.5%) |
| 55 to 64 Years | 80 (39.8%) | 133 (66.2%) |
| 65 to 74 Years | 189 (99.0%) | 83 (43.5%) |
| 75 Years and over | 154 (100.0%) | 50 (32.5%) |
| Total | 1,239 (57.3%) | 818 (37.8%) |
Disability Status by Sex by Age in Jackson
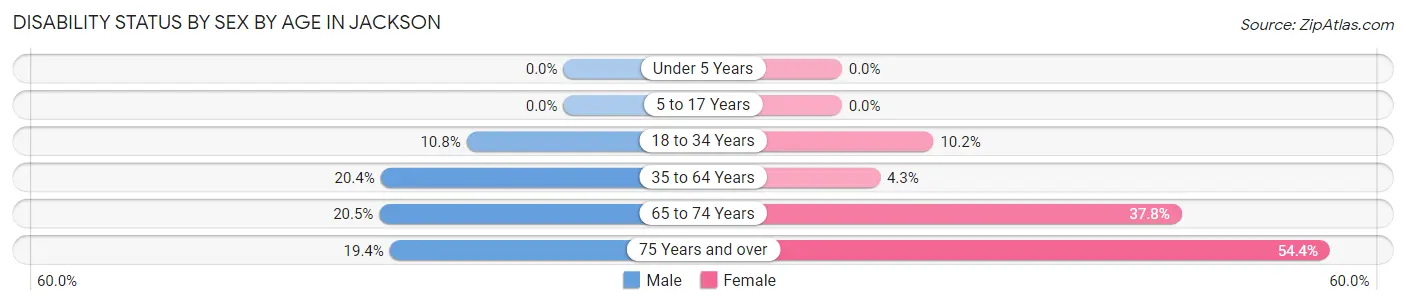
| Age Bracket | Male | Female |
| Under 5 Years | 0 (0.0%) | 0 (0.0%) |
| 5 to 17 Years | 0 (0.0%) | 0 (0.0%) |
| 18 to 34 Years | 30 (10.8%) | 29 (10.2%) |
| 35 to 64 Years | 67 (20.4%) | 21 (4.3%) |
| 65 to 74 Years | 24 (20.5%) | 28 (37.8%) |
| 75 Years and over | 12 (19.4%) | 50 (54.3%) |
Disability Class by Sex by Age in Jackson
Disability Class: Hearing Difficulty
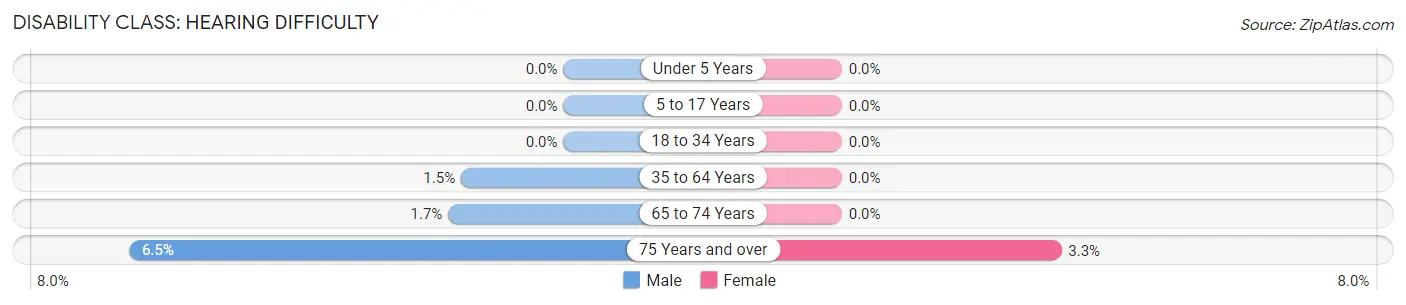
| Age Bracket | Male | Female |
| Under 5 Years | 0 (0.0%) | 0 (0.0%) |
| 5 to 17 Years | 0 (0.0%) | 0 (0.0%) |
| 18 to 34 Years | 0 (0.0%) | 0 (0.0%) |
| 35 to 64 Years | 5 (1.5%) | 0 (0.0%) |
| 65 to 74 Years | 2 (1.7%) | 0 (0.0%) |
| 75 Years and over | 4 (6.5%) | 3 (3.3%) |
Disability Class: Vision Difficulty
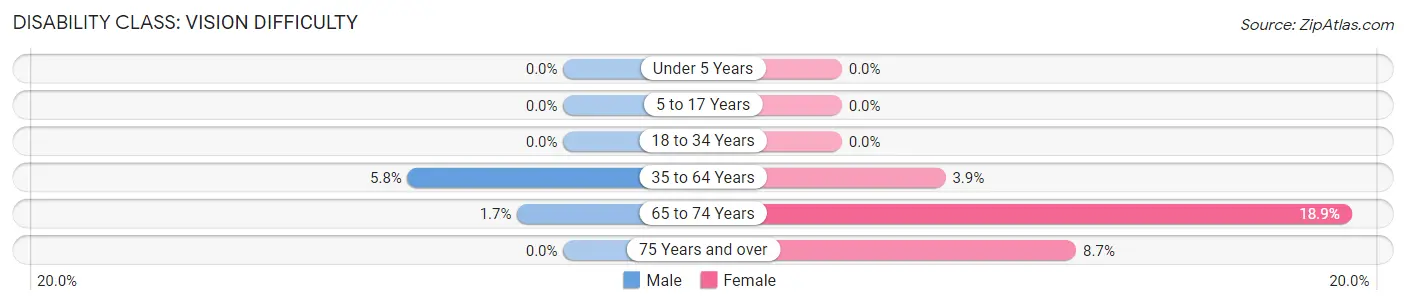
| Age Bracket | Male | Female |
| Under 5 Years | 0 (0.0%) | 0 (0.0%) |
| 5 to 17 Years | 0 (0.0%) | 0 (0.0%) |
| 18 to 34 Years | 0 (0.0%) | 0 (0.0%) |
| 35 to 64 Years | 19 (5.8%) | 19 (3.8%) |
| 65 to 74 Years | 2 (1.7%) | 14 (18.9%) |
| 75 Years and over | 0 (0.0%) | 8 (8.7%) |
Disability Class: Cognitive Difficulty
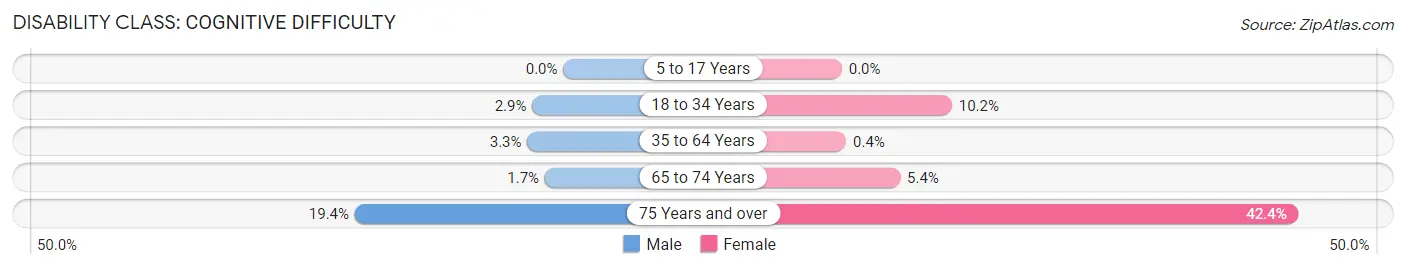
| Age Bracket | Male | Female |
| 5 to 17 Years | 0 (0.0%) | 0 (0.0%) |
| 18 to 34 Years | 8 (2.9%) | 29 (10.2%) |
| 35 to 64 Years | 11 (3.3%) | 2 (0.4%) |
| 65 to 74 Years | 2 (1.7%) | 4 (5.4%) |
| 75 Years and over | 12 (19.4%) | 39 (42.4%) |
Disability Class: Ambulatory Difficulty
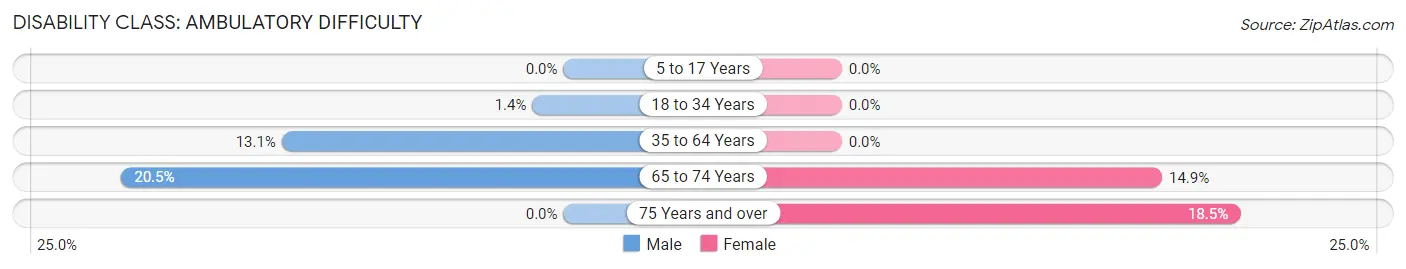
| Age Bracket | Male | Female |
| 5 to 17 Years | 0 (0.0%) | 0 (0.0%) |
| 18 to 34 Years | 4 (1.4%) | 0 (0.0%) |
| 35 to 64 Years | 43 (13.1%) | 0 (0.0%) |
| 65 to 74 Years | 24 (20.5%) | 11 (14.9%) |
| 75 Years and over | 0 (0.0%) | 17 (18.5%) |
Disability Class: Self-Care Difficulty
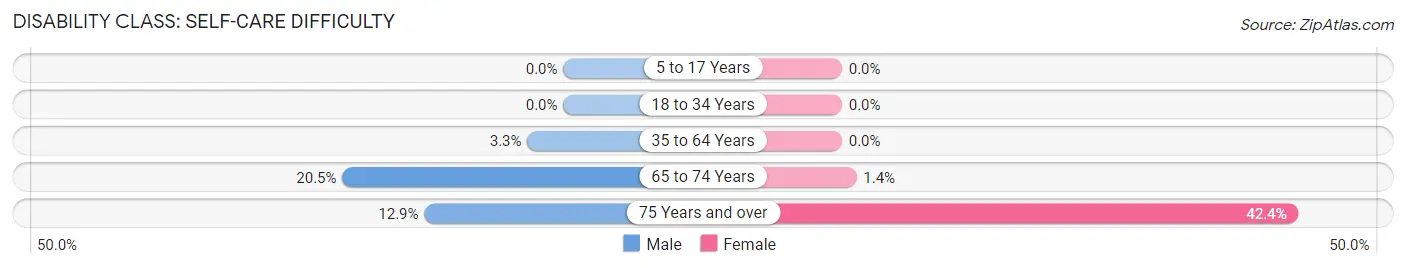
| Age Bracket | Male | Female |
| 5 to 17 Years | 0 (0.0%) | 0 (0.0%) |
| 18 to 34 Years | 0 (0.0%) | 0 (0.0%) |
| 35 to 64 Years | 11 (3.3%) | 0 (0.0%) |
| 65 to 74 Years | 24 (20.5%) | 1 (1.3%) |
| 75 Years and over | 8 (12.9%) | 39 (42.4%) |
Technology Access in Jackson
Computing Device Access in Jackson
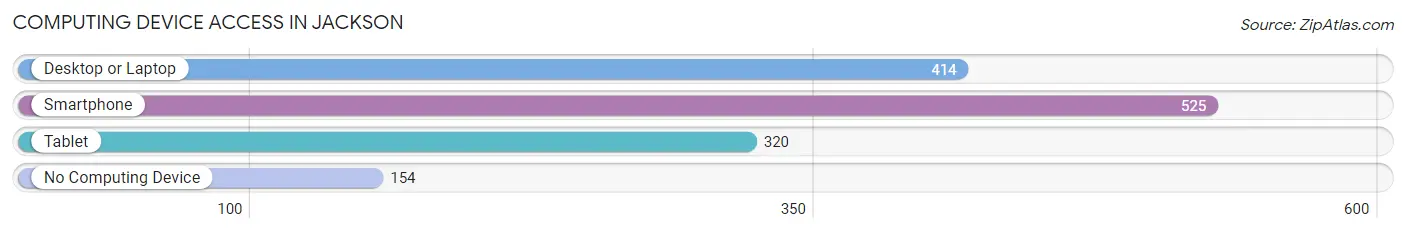
| Device Type | # Households | % Households |
| Desktop or Laptop | 414 | 59.4% |
| Smartphone | 525 | 75.3% |
| Tablet | 320 | 45.9% |
| No Computing Device | 154 | 22.1% |
| Total | 697 | 100.0% |
Internet Access in Jackson
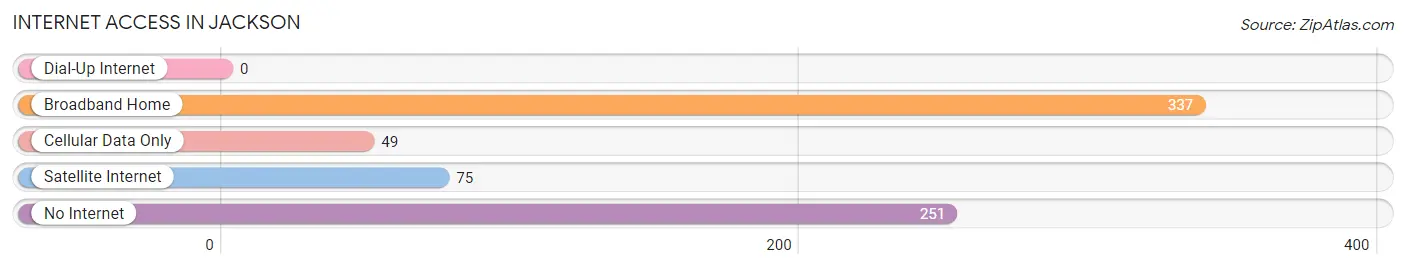
| Internet Type | # Households | % Households |
| Dial-Up Internet | 0 | 0.0% |
| Broadband Home | 337 | 48.3% |
| Cellular Data Only | 49 | 7.0% |
| Satellite Internet | 75 | 10.8% |
| No Internet | 251 | 36.0% |
| Total | 697 | 100.0% |
Jackson Summary
Jackson, Louisiana is a small city located in East Feliciana Parish, Louisiana. It is situated on the banks of the Mississippi River, approximately 40 miles north of Baton Rouge. The city has a population of approximately 2,500 people and is the county seat of East Feliciana Parish.
History
Jackson was founded in 1817 by William Jackson, a planter from Virginia. He purchased the land from the Choctaw Indians and named the town after himself. The town was incorporated in 1821 and quickly became a center of commerce and industry. The town was a major port for cotton and other goods, and it was also a major stop on the stagecoach line between New Orleans and Natchez.
In the late 19th century, Jackson became a major railroad hub, with the New Orleans, Jackson and Great Northern Railroad connecting the town to New Orleans and other cities in the region. The railroad also brought an influx of new residents to the town, and the population grew to over 3,000 by the turn of the century.
In the early 20th century, Jackson experienced a period of economic decline. The railroad was replaced by the automobile, and the town’s population began to decline. By the 1950s, the population had dropped to just over 1,000.
Geography
Jackson is located in East Feliciana Parish, Louisiana, approximately 40 miles north of Baton Rouge. The city is situated on the banks of the Mississippi River, and is surrounded by rolling hills and forests. The climate is humid subtropical, with hot, humid summers and mild winters.
Economy
Jackson’s economy is largely based on agriculture and tourism. The town is home to several farms, which produce cotton, soybeans, corn, and other crops. The town is also home to several small businesses, including restaurants, shops, and other services.
Tourism is an important part of the local economy. The town is home to several historic sites, including the Jackson Historic District, which is listed on the National Register of Historic Places. The town also hosts several festivals and events throughout the year, including the Jackson Mardi Gras Festival and the Jackson Jazz Festival.
Demographics
As of the 2010 census, Jackson had a population of 2,500 people. The racial makeup of the town was 65.2% White, 32.2% African American, 0.4% Native American, 0.4% Asian, 0.2% from other races, and 1.8% from two or more races. Hispanic or Latino of any race were 1.2% of the population.
The median income for a household in Jackson was $30,938, and the median income for a family was $37,500. The per capita income for the town was $15,945. About 18.2% of families and 22.2% of the population were below the poverty line, including 28.2% of those under age 18 and 16.7% of those age 65 or over.
Common Questions
What is Per Capita Income in Jackson?
Per Capita income in Jackson is $9,295.
What is the Median Family Income in Jackson?
Median Family Income in Jackson is $50,125.
What is the Median Household income in Jackson?
Median Household Income in Jackson is $40,642.
What is Income or Wage Gap in Jackson?
Income or Wage Gap in Jackson is 10.4%.
Women in Jackson earn 89.6 cents for every dollar earned by a man.
What is Inequality or Gini Index in Jackson?
Inequality or Gini Index in Jackson is 0.47.
What is the Total Population of Jackson?
Total Population of Jackson is 4,600.
What is the Total Male Population of Jackson?
Total Male Population of Jackson is 3,452.
What is the Total Female Population of Jackson?
Total Female Population of Jackson is 1,148.
What is the Ratio of Males per 100 Females in Jackson?
There are 300.70 Males per 100 Females in Jackson.
What is the Ratio of Females per 100 Males in Jackson?
There are 33.26 Females per 100 Males in Jackson.
What is the Median Population Age in Jackson?
Median Population Age in Jackson is 37.5 Years.
What is the Average Family Size in Jackson
Average Family Size in Jackson is 3.2 People.
What is the Average Household Size in Jackson
Average Household Size in Jackson is 2.8 People.
How Large is the Labor Force in Jackson?
There are 749 People in the Labor Forcein in Jackson.
What is the Percentage of People in the Labor Force in Jackson?
17.5% of People are in the Labor Force in Jackson.
What is the Unemployment Rate in Jackson?
Unemployment Rate in Jackson is 13.7%.