Haughton, LA Map & Demographics
Haughton Map
Haughton Overview
$31,763
PER CAPITA INCOME
$67,995
AVG FAMILY INCOME
$46,567
AVG HOUSEHOLD INCOME
50.3%
WAGE / INCOME GAP [ % ]
49.7¢/ $1
WAGE / INCOME GAP [ $ ]
0.50
INEQUALITY / GINI INDEX
4,450
TOTAL POPULATION
2,210
MALE POPULATION
2,240
FEMALE POPULATION
98.66
MALES / 100 FEMALES
101.36
FEMALES / 100 MALES
31.6
MEDIAN AGE
3.6
AVG FAMILY SIZE
2.9
AVG HOUSEHOLD SIZE
2,470
LABOR FORCE [ PEOPLE ]
70.2%
PERCENT IN LABOR FORCE
5.6%
UNEMPLOYMENT RATE
Haughton Zip Codes
Haughton Area Codes
Income in Haughton
Income Overview in Haughton
Per Capita Income in Haughton is $31,763, while median incomes of families and households are $67,995 and $46,567 respectively.
| Characteristic | Number | Measure |
| Per Capita Income | 4,450 | $31,763 |
| Median Family Income | 949 | $67,995 |
| Mean Family Income | 949 | $101,927 |
| Median Household Income | 1,535 | $46,567 |
| Mean Household Income | 1,535 | $75,443 |
| Income Deficit | 949 | $0 |
| Wage / Income Gap (%) | 4,450 | 50.33% |
| Wage / Income Gap ($) | 4,450 | 49.67¢ per $1 |
| Gini / Inequality Index | 4,450 | 0.50 |
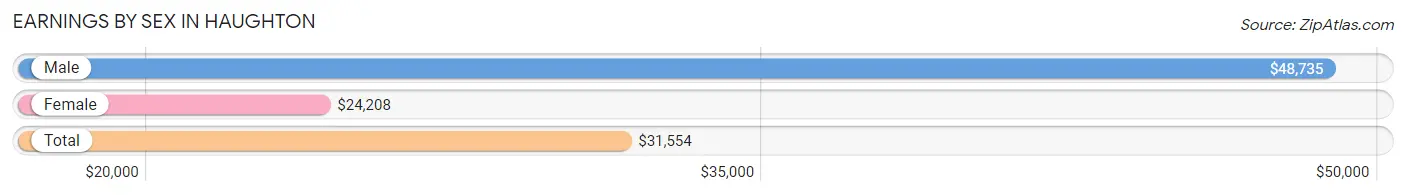
Earnings by Sex in Haughton
Average Earnings in Haughton are $31,554, $48,735 for men and $24,208 for women, a difference of 50.3%.
| Sex | Number | Average Earnings |
| Male | 1,467 (58.0%) | $48,735 |
| Female | 1,062 (42.0%) | $24,208 |
| Total | 2,529 (100.0%) | $31,554 |
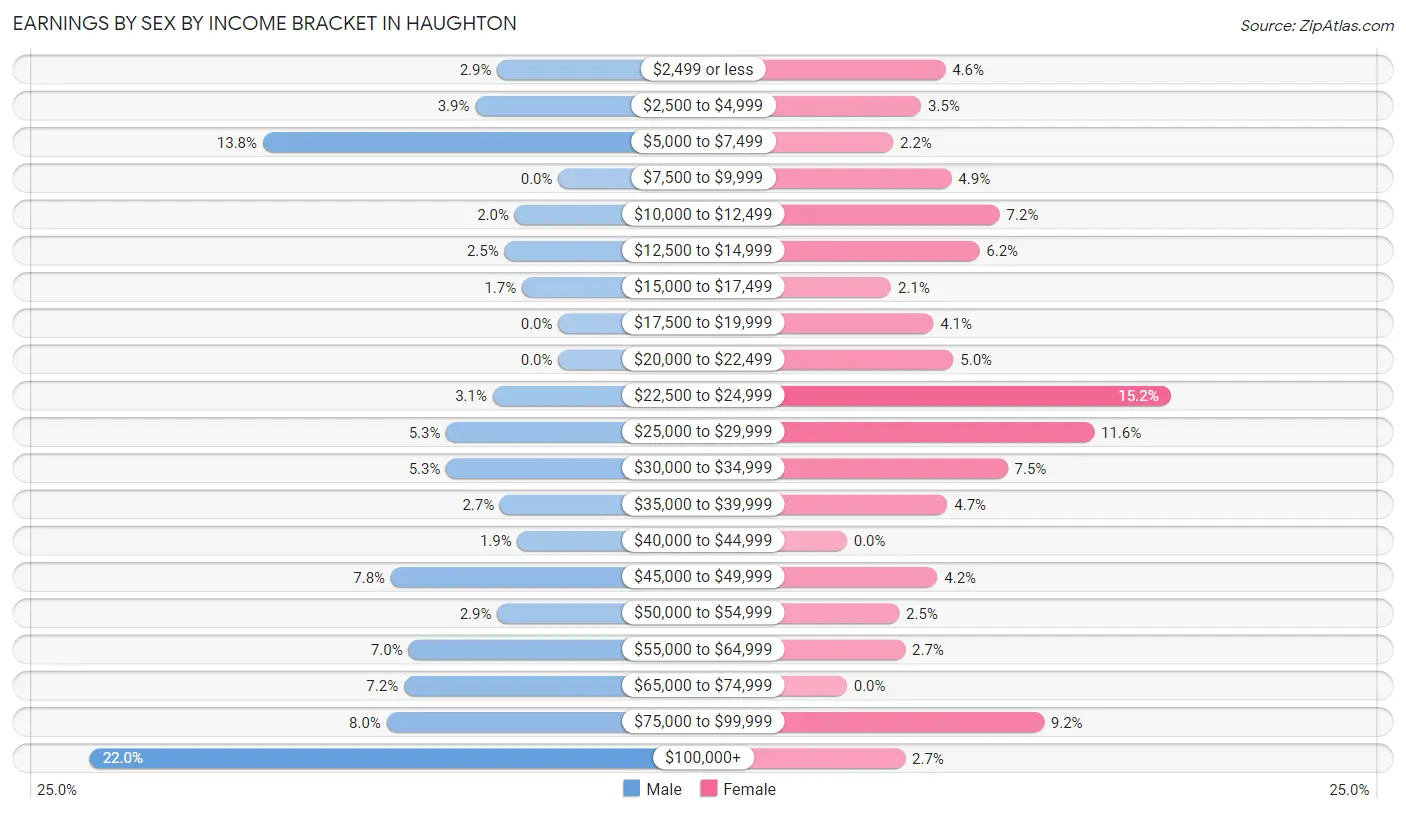
Earnings by Sex by Income Bracket in Haughton
The most common earnings brackets in Haughton are $100,000+ for men (322 | 22.0%) and $22,500 to $24,999 for women (161 | 15.2%).
| Income | Male | Female |
| $2,499 or less | 42 (2.9%) | 49 (4.6%) |
| $2,500 to $4,999 | 57 (3.9%) | 37 (3.5%) |
| $5,000 to $7,499 | 203 (13.8%) | 23 (2.2%) |
| $7,500 to $9,999 | 0 (0.0%) | 52 (4.9%) |
| $10,000 to $12,499 | 30 (2.0%) | 76 (7.2%) |
| $12,500 to $14,999 | 37 (2.5%) | 66 (6.2%) |
| $15,000 to $17,499 | 25 (1.7%) | 22 (2.1%) |
| $17,500 to $19,999 | 0 (0.0%) | 43 (4.1%) |
| $20,000 to $22,499 | 0 (0.0%) | 53 (5.0%) |
| $22,500 to $24,999 | 45 (3.1%) | 161 (15.2%) |
| $25,000 to $29,999 | 77 (5.2%) | 123 (11.6%) |
| $30,000 to $34,999 | 77 (5.2%) | 80 (7.5%) |
| $35,000 to $39,999 | 40 (2.7%) | 50 (4.7%) |
| $40,000 to $44,999 | 28 (1.9%) | 0 (0.0%) |
| $45,000 to $49,999 | 115 (7.8%) | 45 (4.2%) |
| $50,000 to $54,999 | 42 (2.9%) | 26 (2.5%) |
| $55,000 to $64,999 | 103 (7.0%) | 29 (2.7%) |
| $65,000 to $74,999 | 106 (7.2%) | 0 (0.0%) |
| $75,000 to $99,999 | 118 (8.0%) | 98 (9.2%) |
| $100,000+ | 322 (22.0%) | 29 (2.7%) |
| Total | 1,467 (100.0%) | 1,062 (100.0%) |
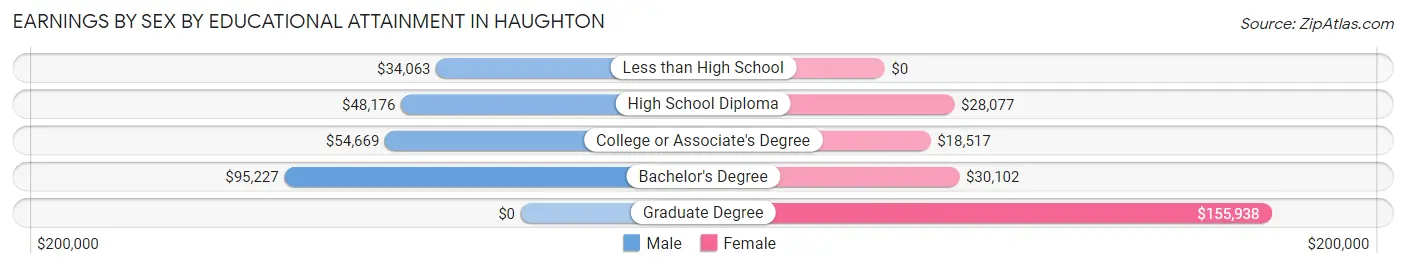
Earnings by Sex by Educational Attainment in Haughton
Average earnings in Haughton are $53,787 for men and $25,104 for women, a difference of 53.3%. Men with an educational attainment of bachelor's degree enjoy the highest average annual earnings of $95,227, while those with less than high school education earn the least with $34,063. Women with an educational attainment of graduate degree earn the most with the average annual earnings of $155,938, while those with college or associate's degree education have the smallest earnings of $18,517.
| Educational Attainment | Male Income | Female Income |
| Less than High School | $34,063 | $0 |
| High School Diploma | $48,176 | $28,077 |
| College or Associate's Degree | $54,669 | $18,517 |
| Bachelor's Degree | $95,227 | $30,102 |
| Graduate Degree | - | - |
| Total | $53,787 | $25,104 |
Family Income in Haughton
Family Income Brackets in Haughton
According to the Haughton family income data, there are 230 families falling into the $50,000 to $74,999 income range, which is the most common income bracket and makes up 24.2% of all families. Conversely, the $15,000 to $24,999 income bracket is the least frequent group with only 7 families (0.7%) belonging to this category.
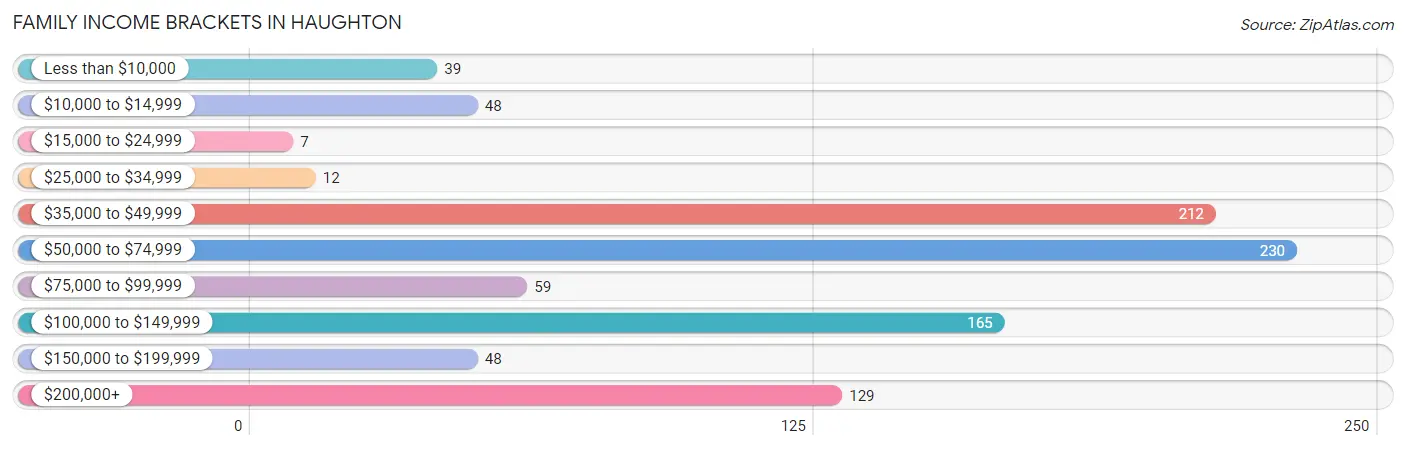
| Income Bracket | # Families | % Families |
| Less than $10,000 | 39 | 4.1% |
| $10,000 to $14,999 | 48 | 5.1% |
| $15,000 to $24,999 | 7 | 0.7% |
| $25,000 to $34,999 | 12 | 1.3% |
| $35,000 to $49,999 | 212 | 22.3% |
| $50,000 to $74,999 | 230 | 24.2% |
| $75,000 to $99,999 | 59 | 6.2% |
| $100,000 to $149,999 | 165 | 17.4% |
| $150,000 to $199,999 | 48 | 5.1% |
| $200,000+ | 129 | 13.6% |
Family Income by Famaliy Size in Haughton
3-person families (326 | 34.4%) account for the highest median family income in Haughton with $96,250 per family, while 3-person families (326 | 34.4%) have the highest median income of $32,083 per family member.
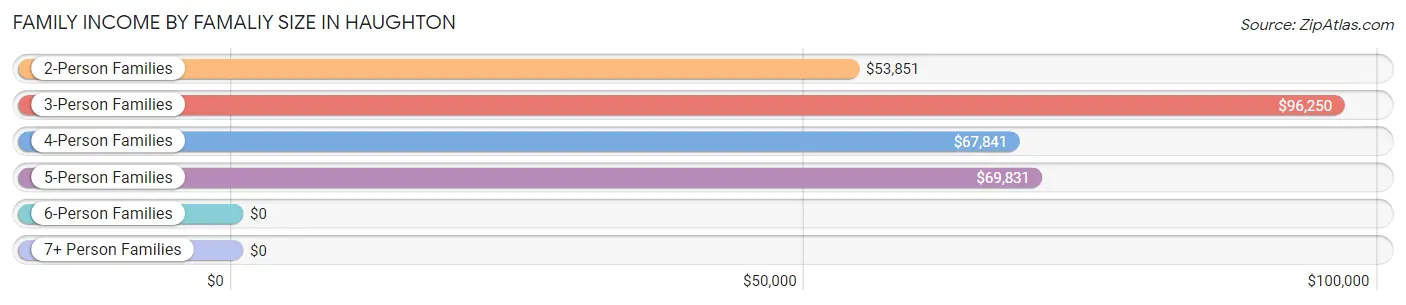
| Income Bracket | # Families | Median Income |
| 2-Person Families | 267 (28.1%) | $53,851 |
| 3-Person Families | 326 (34.4%) | $96,250 |
| 4-Person Families | 233 (24.5%) | $67,841 |
| 5-Person Families | 107 (11.3%) | $69,831 |
| 6-Person Families | 0 (0.0%) | $0 |
| 7+ Person Families | 16 (1.7%) | $0 |
| Total | 949 (100.0%) | $67,995 |
Family Income by Number of Earners in Haughton
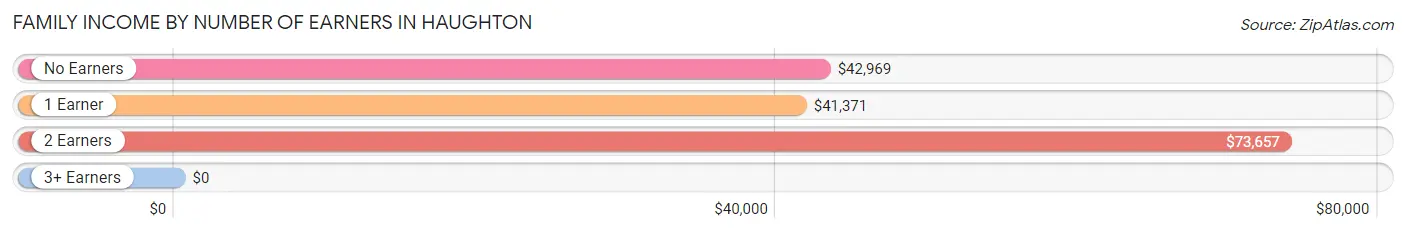
| Number of Earners | # Families | Median Income |
| No Earners | 74 (7.8%) | $42,969 |
| 1 Earner | 300 (31.6%) | $41,371 |
| 2 Earners | 375 (39.5%) | $73,657 |
| 3+ Earners | 200 (21.1%) | $0 |
| Total | 949 (100.0%) | $67,995 |
Household Income in Haughton
Household Income Brackets in Haughton
With 312 households falling in the category, the $35,000 to $49,999 income range is the most frequent in Haughton, accounting for 20.3% of all households. In contrast, only 18 households (1.2%) fall into the $25,000 to $34,999 income bracket, making it the least populous group.
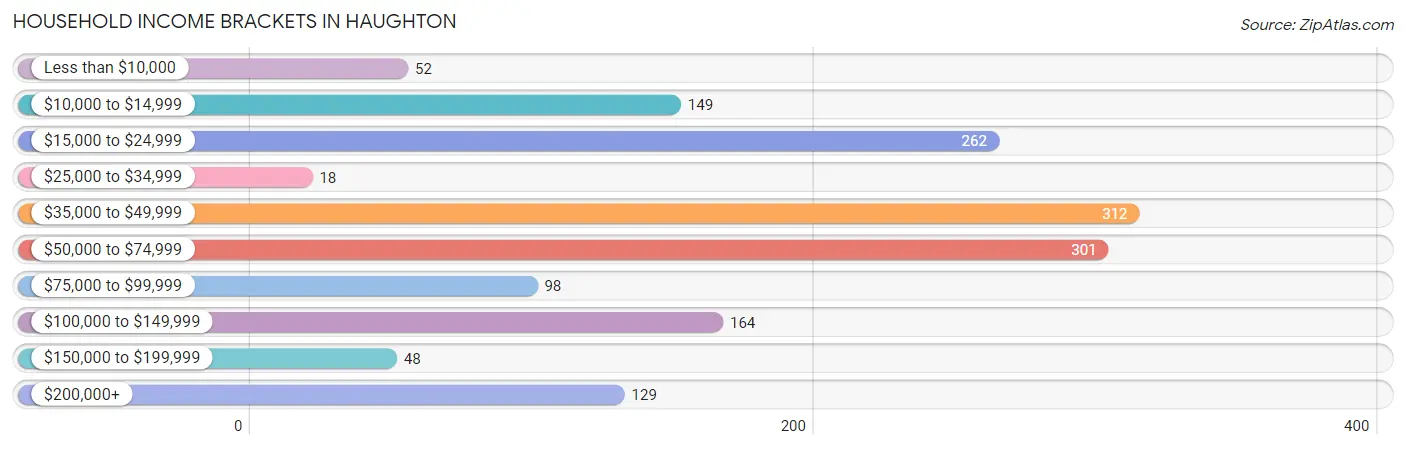
| Income Bracket | # Households | % Households |
| Less than $10,000 | 52 | 3.4% |
| $10,000 to $14,999 | 149 | 9.7% |
| $15,000 to $24,999 | 262 | 17.1% |
| $25,000 to $34,999 | 18 | 1.2% |
| $35,000 to $49,999 | 312 | 20.3% |
| $50,000 to $74,999 | 301 | 19.6% |
| $75,000 to $99,999 | 98 | 6.4% |
| $100,000 to $149,999 | 164 | 10.7% |
| $150,000 to $199,999 | 48 | 3.1% |
| $200,000+ | 129 | 8.4% |
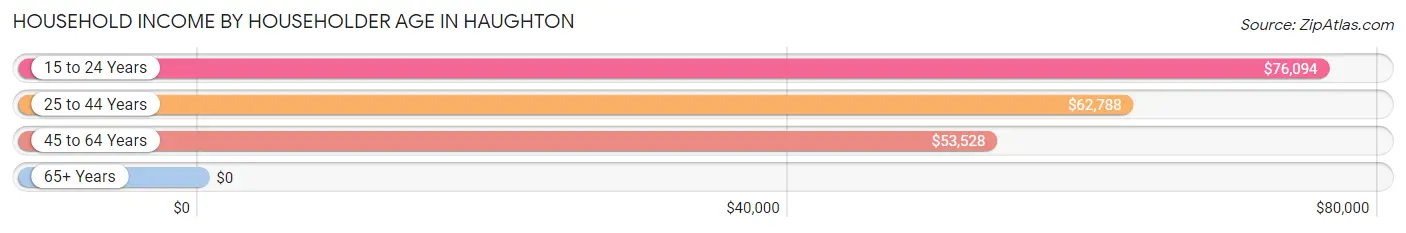
Household Income by Householder Age in Haughton
The median household income in Haughton is $46,567, with the highest median household income of $76,094 found in the 15 to 24 years age bracket for the primary householder. A total of 25 households (1.6%) fall into this category. Meanwhile, the 65+ years age bracket for the primary householder has the lowest median household income of $0, with 330 households (21.5%) in this group.
| Income Bracket | # Households | Median Income |
| 15 to 24 Years | 25 (1.6%) | $76,094 |
| 25 to 44 Years | 601 (39.2%) | $62,788 |
| 45 to 64 Years | 579 (37.7%) | $53,528 |
| 65+ Years | 330 (21.5%) | $0 |
| Total | 1,535 (100.0%) | $46,567 |
Poverty in Haughton
Income Below Poverty by Sex and Age in Haughton
With 21.0% poverty level for males and 13.4% for females among the residents of Haughton, 16 and 17 year old males and 65 to 74 year old females are the most vulnerable to poverty, with 13 males (48.1%) and 30 females (25.9%) in their respective age groups living below the poverty level.
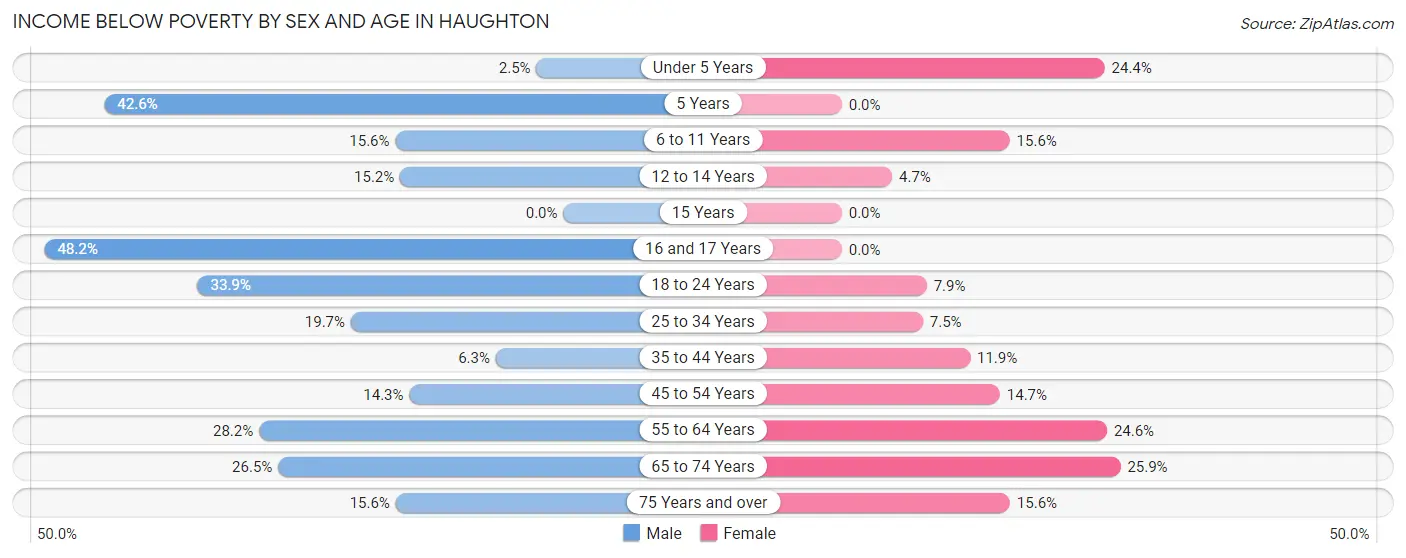
| Age Bracket | Male | Female |
| Under 5 Years | 3 (2.5%) | 40 (24.4%) |
| 5 Years | 23 (42.6%) | 0 (0.0%) |
| 6 to 11 Years | 29 (15.6%) | 24 (15.6%) |
| 12 to 14 Years | 10 (15.1%) | 7 (4.7%) |
| 15 Years | 0 (0.0%) | 0 (0.0%) |
| 16 and 17 Years | 13 (48.1%) | 0 (0.0%) |
| 18 to 24 Years | 185 (33.9%) | 13 (7.9%) |
| 25 to 34 Years | 57 (19.7%) | 27 (7.5%) |
| 35 to 44 Years | 21 (6.3%) | 37 (11.9%) |
| 45 to 54 Years | 37 (14.3%) | 54 (14.7%) |
| 55 to 64 Years | 61 (28.2%) | 47 (24.6%) |
| 65 to 74 Years | 18 (26.5%) | 30 (25.9%) |
| 75 Years and over | 7 (15.6%) | 22 (15.6%) |
| Total | 464 (21.0%) | 301 (13.4%) |
Income Above Poverty by Sex and Age in Haughton
According to the poverty statistics in Haughton, males aged under 5 years and females aged 5 years are the age groups that are most secure financially, with 97.5% of males and 100.0% of females in these age groups living above the poverty line.
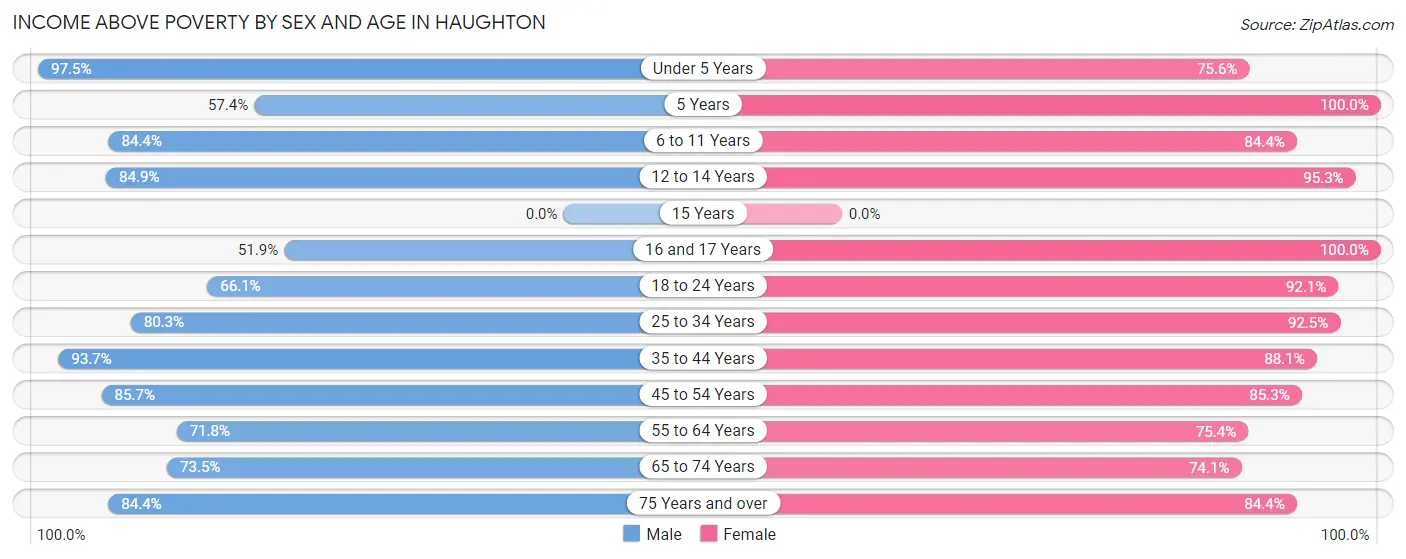
| Age Bracket | Male | Female |
| Under 5 Years | 117 (97.5%) | 124 (75.6%) |
| 5 Years | 31 (57.4%) | 37 (100.0%) |
| 6 to 11 Years | 157 (84.4%) | 130 (84.4%) |
| 12 to 14 Years | 56 (84.9%) | 143 (95.3%) |
| 15 Years | 0 (0.0%) | 0 (0.0%) |
| 16 and 17 Years | 14 (51.8%) | 84 (100.0%) |
| 18 to 24 Years | 360 (66.1%) | 152 (92.1%) |
| 25 to 34 Years | 232 (80.3%) | 332 (92.5%) |
| 35 to 44 Years | 314 (93.7%) | 274 (88.1%) |
| 45 to 54 Years | 222 (85.7%) | 314 (85.3%) |
| 55 to 64 Years | 155 (71.8%) | 144 (75.4%) |
| 65 to 74 Years | 50 (73.5%) | 86 (74.1%) |
| 75 Years and over | 38 (84.4%) | 119 (84.4%) |
| Total | 1,746 (79.0%) | 1,939 (86.6%) |
Income Below Poverty Among Married-Couple Families in Haughton
The poverty statistics for married-couple families in Haughton show that 0.4% or 3 of the total 710 families live below the poverty line. Families with 5 or more children have the highest poverty rate of 100.0%, comprising of 3 families. On the other hand, families with no children have the lowest poverty rate of 0.0%, which includes 0 families.
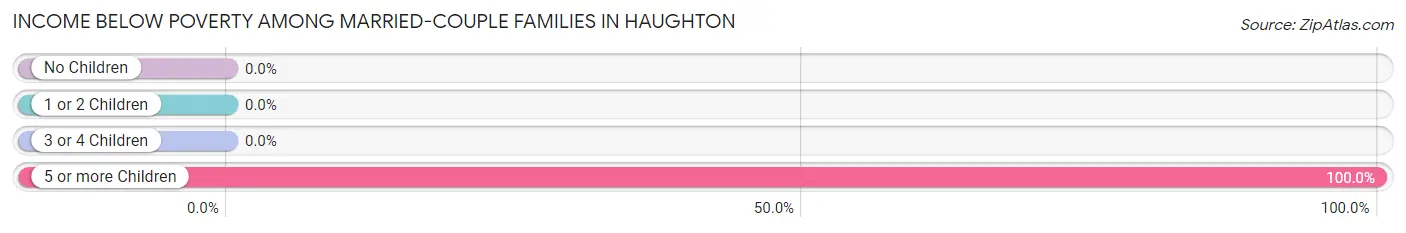
| Children | Above Poverty | Below Poverty |
| No Children | 329 (100.0%) | 0 (0.0%) |
| 1 or 2 Children | 317 (100.0%) | 0 (0.0%) |
| 3 or 4 Children | 61 (100.0%) | 0 (0.0%) |
| 5 or more Children | 0 (0.0%) | 3 (100.0%) |
| Total | 707 (99.6%) | 3 (0.4%) |
Income Below Poverty Among Single-Parent Households in Haughton
According to the poverty data in Haughton, 67.3% or 37 single-father households and 25.5% or 47 single-mother households are living below the poverty line. Among single-father households, those with 1 or 2 children have the highest poverty rate, with 37 households (100.0%) experiencing poverty. Likewise, among single-mother households, those with no children have the highest poverty rate, with 12 households (100.0%) falling below the poverty line.
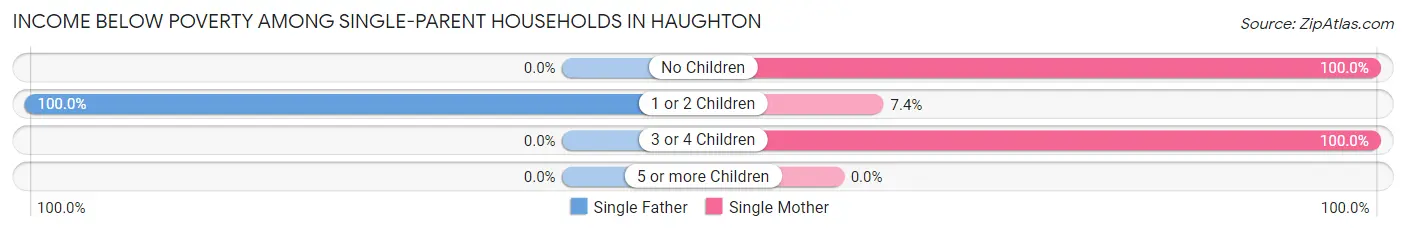
| Children | Single Father | Single Mother |
| No Children | 0 (0.0%) | 12 (100.0%) |
| 1 or 2 Children | 37 (100.0%) | 11 (7.4%) |
| 3 or 4 Children | 0 (0.0%) | 24 (100.0%) |
| 5 or more Children | 0 (0.0%) | 0 (0.0%) |
| Total | 37 (67.3%) | 47 (25.5%) |
Income Below Poverty Among Married-Couple vs Single-Parent Households in Haughton
The poverty data for Haughton shows that 3 of the married-couple family households (0.4%) and 84 of the single-parent households (35.1%) are living below the poverty level. Within the married-couple family households, those with 5 or more children have the highest poverty rate, with 3 households (100.0%) falling below the poverty line. Among the single-parent households, those with 3 or 4 children have the highest poverty rate, with 24 household (100.0%) living below poverty.
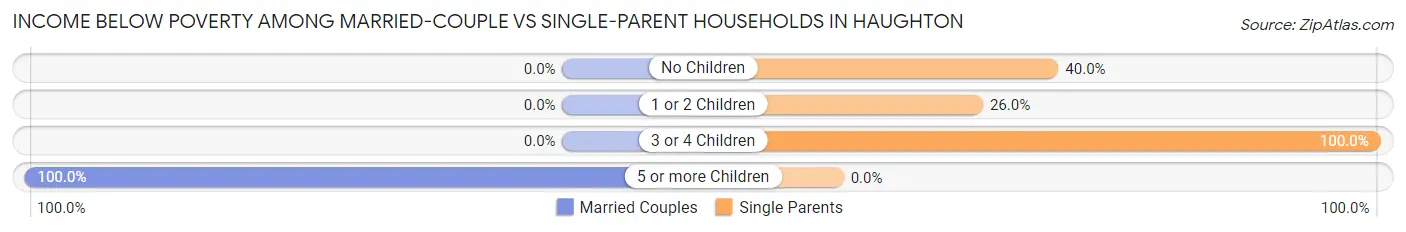
| Children | Married-Couple Families | Single-Parent Households |
| No Children | 0 (0.0%) | 12 (40.0%) |
| 1 or 2 Children | 0 (0.0%) | 48 (26.0%) |
| 3 or 4 Children | 0 (0.0%) | 24 (100.0%) |
| 5 or more Children | 3 (100.0%) | 0 (0.0%) |
| Total | 3 (0.4%) | 84 (35.1%) |
Race in Haughton
The most populous races in Haughton are White / Caucasian (3,388 | 76.1%), Black / African American (1,004 | 22.6%), and Hispanic or Latino (88 | 2.0%).
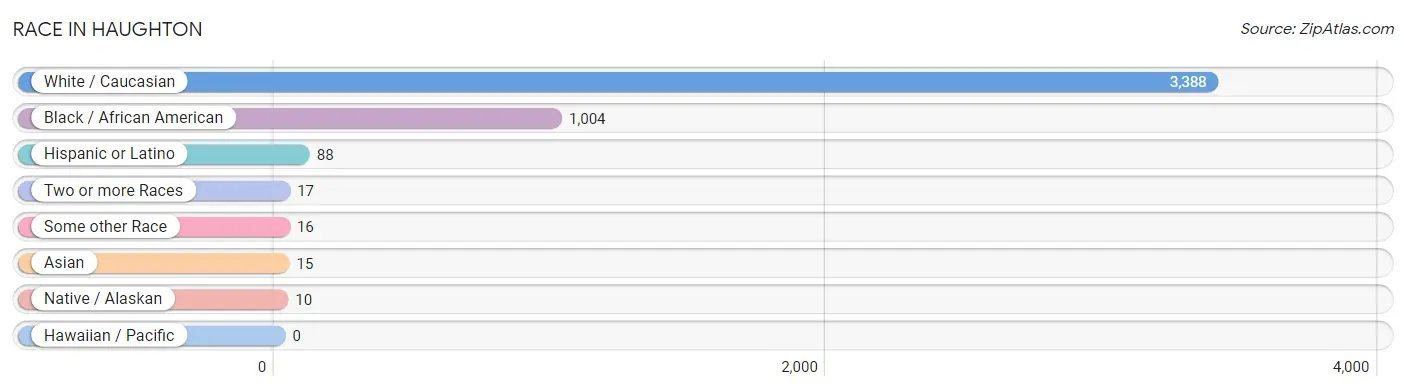
| Race | # Population | % Population |
| Asian | 15 | 0.3% |
| Black / African American | 1,004 | 22.6% |
| Hawaiian / Pacific | 0 | 0.0% |
| Hispanic or Latino | 88 | 2.0% |
| Native / Alaskan | 10 | 0.2% |
| White / Caucasian | 3,388 | 76.1% |
| Two or more Races | 17 | 0.4% |
| Some other Race | 16 | 0.4% |
| Total | 4,450 | 100.0% |
Ancestry in Haughton
The most populous ancestries reported in Haughton are American (723 | 16.3%), English (279 | 6.3%), German (169 | 3.8%), Irish (92 | 2.1%), and Mexican (78 | 1.8%), together accounting for 30.1% of all Haughton residents.
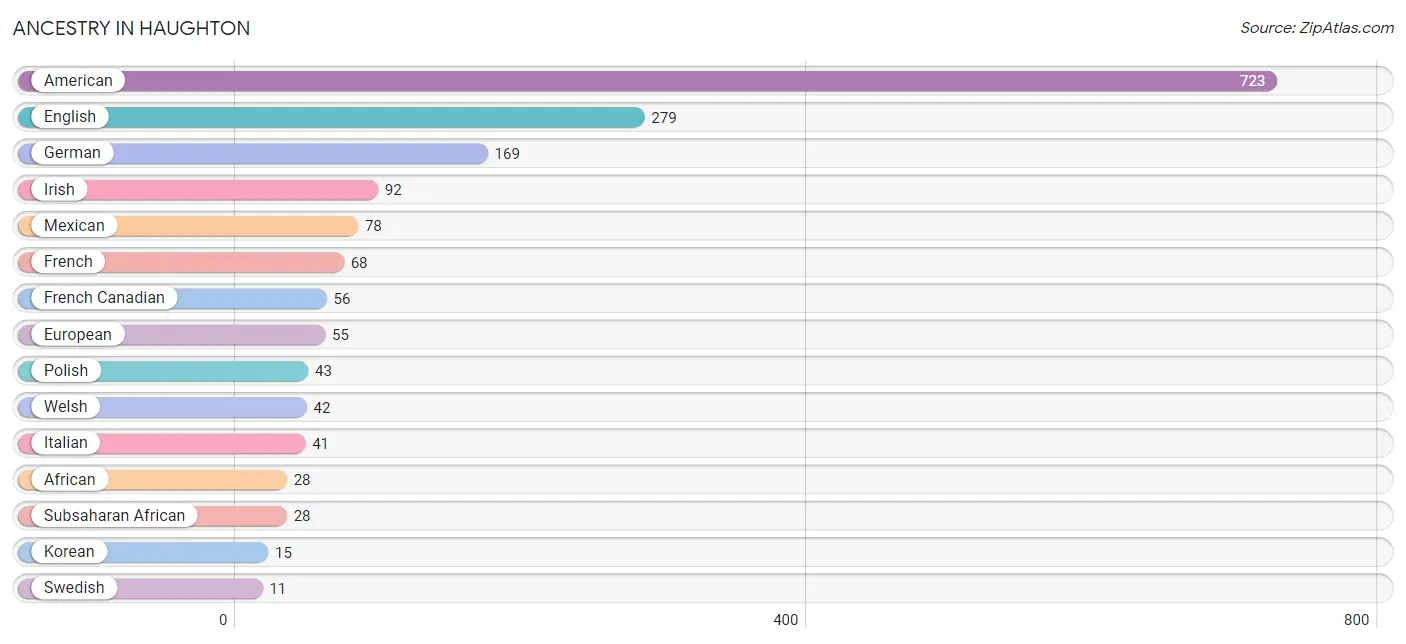
| Ancestry | # Population | % Population |
| African | 28 | 0.6% |
| American | 723 | 16.3% |
| Central American Indian | 10 | 0.2% |
| English | 279 | 6.3% |
| European | 55 | 1.2% |
| French | 68 | 1.5% |
| French Canadian | 56 | 1.3% |
| German | 169 | 3.8% |
| Irish | 92 | 2.1% |
| Italian | 41 | 0.9% |
| Korean | 15 | 0.3% |
| Mexican | 78 | 1.8% |
| Polish | 43 | 1.0% |
| Subsaharan African | 28 | 0.6% |
| Swedish | 11 | 0.3% |
| Welsh | 42 | 0.9% | View All 16 Rows |
Immigrants in Haughton
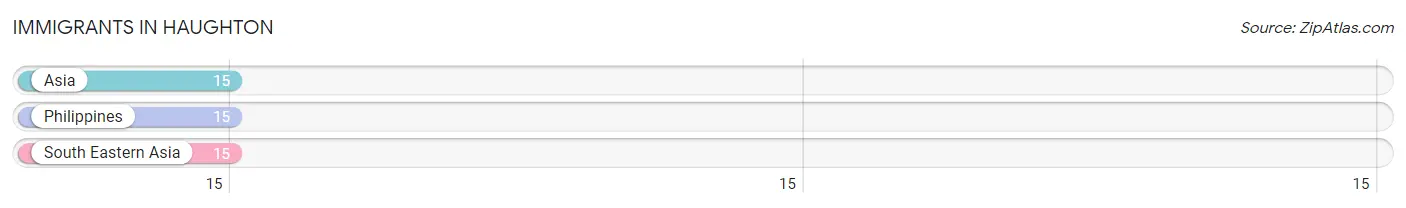
The most numerous immigrant groups reported in Haughton came from Asia (15 | 0.3%), Philippines (15 | 0.3%), and South Eastern Asia (15 | 0.3%), together accounting for 1.0% of all Haughton residents.
| Immigration Origin | # Population | % Population |
| Asia | 15 | 0.3% |
| Philippines | 15 | 0.3% |
| South Eastern Asia | 15 | 0.3% | View All 3 Rows |
Sex and Age in Haughton
Sex and Age in Haughton
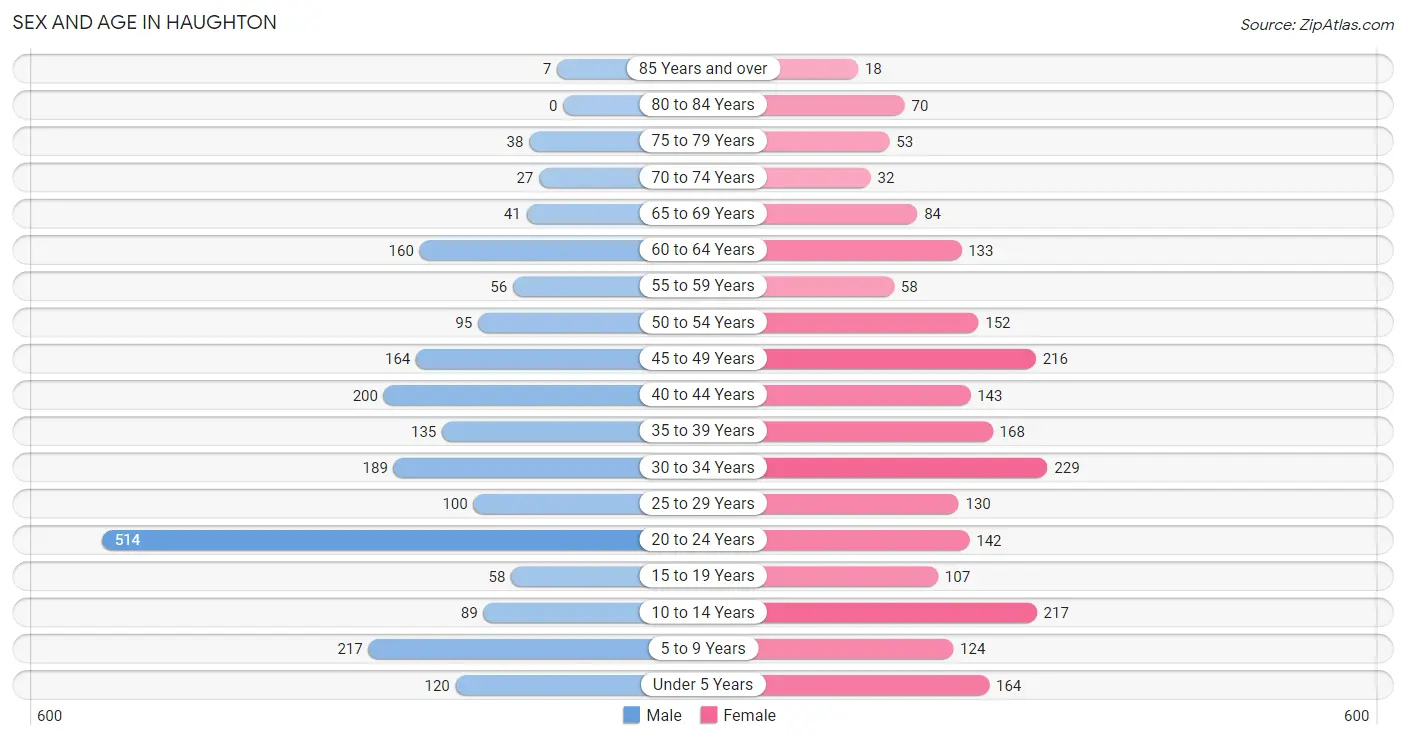
The most populous age groups in Haughton are 20 to 24 Years (514 | 23.3%) for men and 30 to 34 Years (229 | 10.2%) for women.
| Age Bracket | Male | Female |
| Under 5 Years | 120 (5.4%) | 164 (7.3%) |
| 5 to 9 Years | 217 (9.8%) | 124 (5.5%) |
| 10 to 14 Years | 89 (4.0%) | 217 (9.7%) |
| 15 to 19 Years | 58 (2.6%) | 107 (4.8%) |
| 20 to 24 Years | 514 (23.3%) | 142 (6.3%) |
| 25 to 29 Years | 100 (4.5%) | 130 (5.8%) |
| 30 to 34 Years | 189 (8.6%) | 229 (10.2%) |
| 35 to 39 Years | 135 (6.1%) | 168 (7.5%) |
| 40 to 44 Years | 200 (9.0%) | 143 (6.4%) |
| 45 to 49 Years | 164 (7.4%) | 216 (9.6%) |
| 50 to 54 Years | 95 (4.3%) | 152 (6.8%) |
| 55 to 59 Years | 56 (2.5%) | 58 (2.6%) |
| 60 to 64 Years | 160 (7.2%) | 133 (5.9%) |
| 65 to 69 Years | 41 (1.9%) | 84 (3.7%) |
| 70 to 74 Years | 27 (1.2%) | 32 (1.4%) |
| 75 to 79 Years | 38 (1.7%) | 53 (2.4%) |
| 80 to 84 Years | 0 (0.0%) | 70 (3.1%) |
| 85 Years and over | 7 (0.3%) | 18 (0.8%) |
| Total | 2,210 (100.0%) | 2,240 (100.0%) |
Families and Households in Haughton
Median Family Size in Haughton
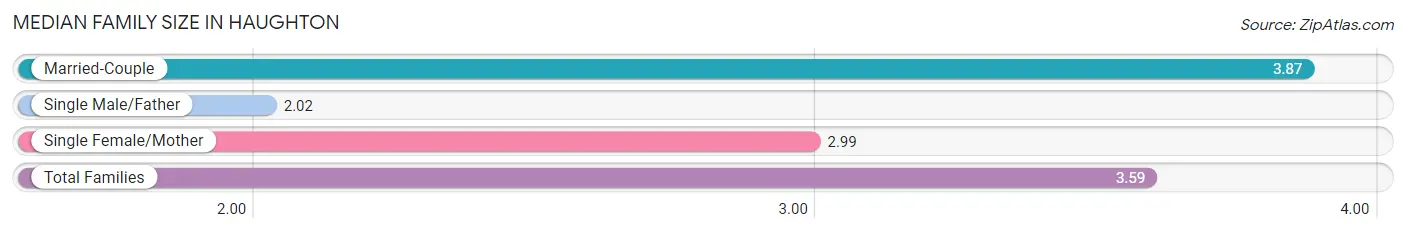
The median family size in Haughton is 3.59 persons per family, with married-couple families (710 | 74.8%) accounting for the largest median family size of 3.87 persons per family. On the other hand, single male/father families (55 | 5.8%) represent the smallest median family size with 2.02 persons per family.
| Family Type | # Families | Family Size |
| Married-Couple | 710 (74.8%) | 3.87 |
| Single Male/Father | 55 (5.8%) | 2.02 |
| Single Female/Mother | 184 (19.4%) | 2.99 |
| Total Families | 949 (100.0%) | 3.59 |
Median Household Size in Haughton
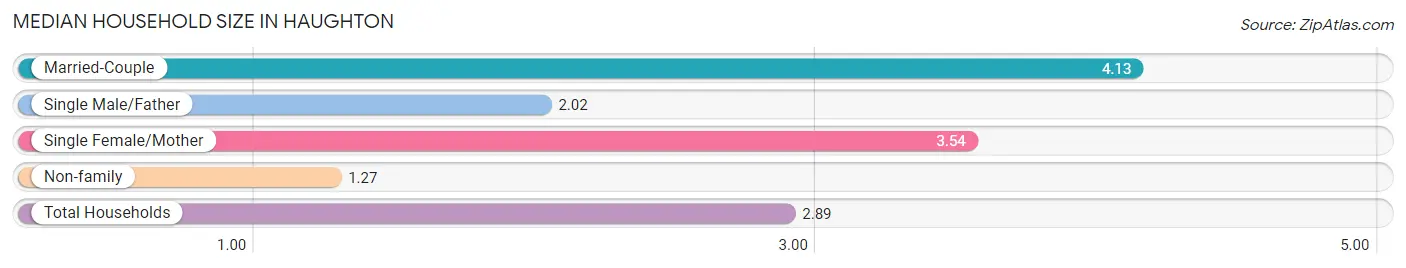
The median household size in Haughton is 2.89 persons per household, with married-couple households (710 | 46.3%) accounting for the largest median household size of 4.13 persons per household. non-family households (586 | 38.2%) represent the smallest median household size with 1.27 persons per household.
| Household Type | # Households | Household Size |
| Married-Couple | 710 (46.3%) | 4.13 |
| Single Male/Father | 55 (3.6%) | 2.02 |
| Single Female/Mother | 184 (12.0%) | 3.54 |
| Non-family | 586 (38.2%) | 1.27 |
| Total Households | 1,535 (100.0%) | 2.89 |
Household Size by Marriage Status in Haughton
Out of a total of 1,535 households in Haughton, 949 (61.8%) are family households, while 586 (38.2%) are nonfamily households. The most numerous type of family households are 3-person households, comprising 286, and the most common type of nonfamily households are 1-person households, comprising 462.
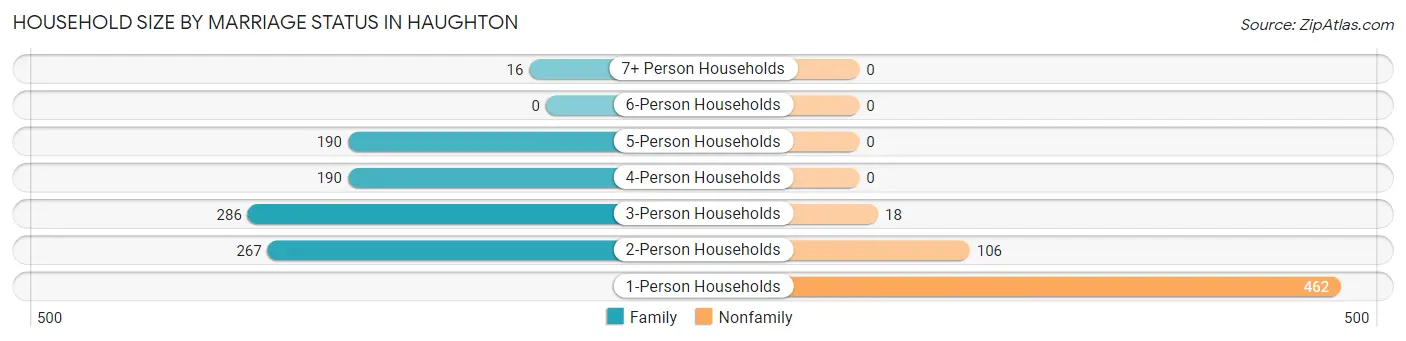
| Household Size | Family Households | Nonfamily Households |
| 1-Person Households | - | 462 (30.1%) |
| 2-Person Households | 267 (17.4%) | 106 (6.9%) |
| 3-Person Households | 286 (18.6%) | 18 (1.2%) |
| 4-Person Households | 190 (12.4%) | 0 (0.0%) |
| 5-Person Households | 190 (12.4%) | 0 (0.0%) |
| 6-Person Households | 0 (0.0%) | 0 (0.0%) |
| 7+ Person Households | 16 (1.0%) | 0 (0.0%) |
| Total | 949 (61.8%) | 586 (38.2%) |
Female Fertility in Haughton
Fertility by Age in Haughton
Average fertility rate in Haughton is 80.0 births per 1,000 women. Women in the age bracket of 35 to 50 years have the highest fertility rate with 89.0 births per 1,000 women. Women in the age bracket of 35 to 50 years acount for 53.7% of all women with births.
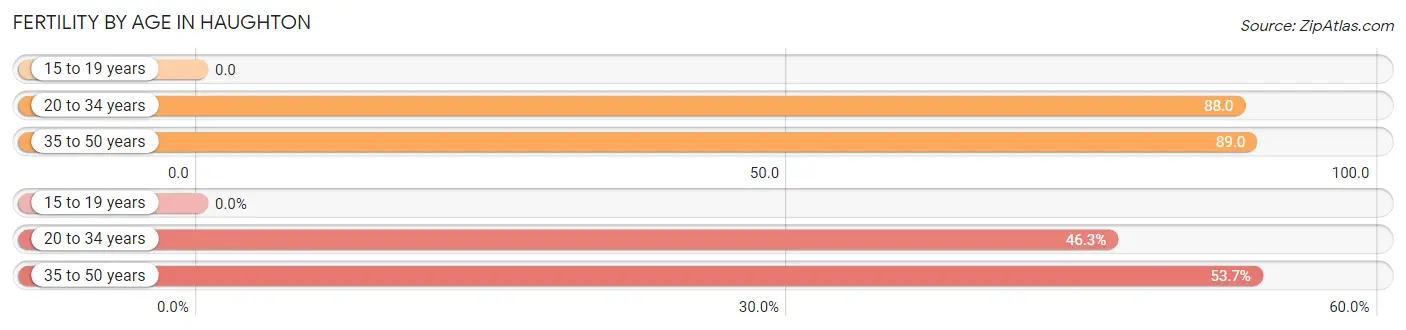
| Age Bracket | Women with Births | Births / 1,000 Women |
| 15 to 19 years | 0 (0.0%) | 0.0 |
| 20 to 34 years | 44 (46.3%) | 88.0 |
| 35 to 50 years | 51 (53.7%) | 89.0 |
| Total | 95 (100.0%) | 80.0 |
Fertility by Age by Marriage Status in Haughton
38.9% of women with births (95) in Haughton are married. The highest percentage of unmarried women with births falls into 20 to 34 years age bracket with 90.9% of them unmarried at the time of birth, while the lowest percentage of unmarried women with births belong to 35 to 50 years age bracket with 35.3% of them unmarried.
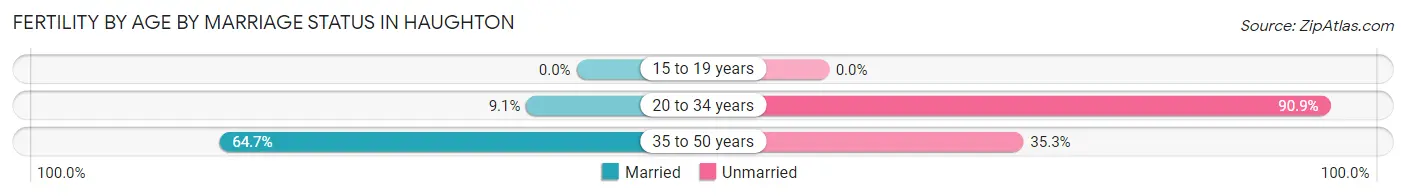
| Age Bracket | Married | Unmarried |
| 15 to 19 years | 0 (0.0%) | 0 (0.0%) |
| 20 to 34 years | 4 (9.1%) | 40 (90.9%) |
| 35 to 50 years | 33 (64.7%) | 18 (35.3%) |
| Total | 37 (39.0%) | 58 (61.1%) |
Fertility by Education in Haughton

| Educational Attainment | Women with Births | Births / 1,000 Women |
| Less than High School | 0 (0.0%) | 0.0 |
| High School Diploma | 40 (42.1%) | 100.0 |
| College or Associate's Degree | 33 (34.7%) | 70.0 |
| Bachelor's Degree | 18 (19.0%) | 106.0 |
| Graduate Degree | 4 (4.2%) | 100.0 |
| Total | 95 (100.0%) | 80.0 |
Fertility by Education by Marriage Status in Haughton
61.1% of women with births in Haughton are unmarried. Women with the educational attainment of college or associate's degree are most likely to be married with 100.0% of them married at childbirth, while women with the educational attainment of high school diploma are least likely to be married with 100.0% of them unmarried at childbirth.
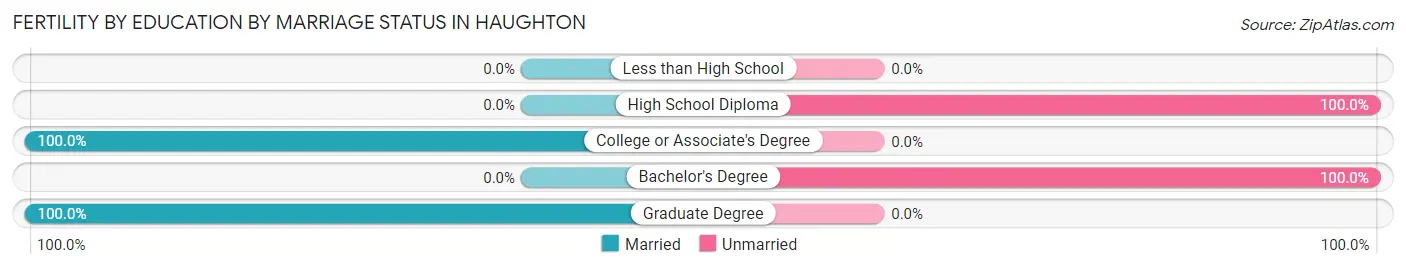
| Educational Attainment | Married | Unmarried |
| Less than High School | 0 (0.0%) | 0 (0.0%) |
| High School Diploma | 0 (0.0%) | 40 (100.0%) |
| College or Associate's Degree | 33 (100.0%) | 0 (0.0%) |
| Bachelor's Degree | 0 (0.0%) | 18 (100.0%) |
| Graduate Degree | 4 (100.0%) | 0 (0.0%) |
| Total | 37 (39.0%) | 58 (61.1%) |
Employment Characteristics in Haughton
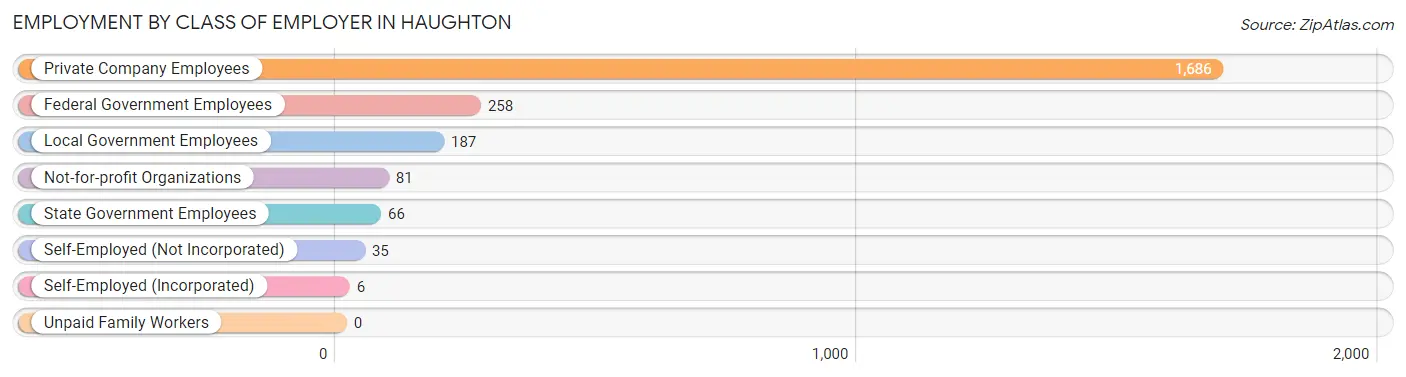
Employment by Class of Employer in Haughton
Among the 2,319 employed individuals in Haughton, private company employees (1,686 | 72.7%), federal government employees (258 | 11.1%), and local government employees (187 | 8.1%) make up the most common classes of employment.
| Employer Class | # Employees | % Employees |
| Private Company Employees | 1,686 | 72.7% |
| Self-Employed (Incorporated) | 6 | 0.3% |
| Self-Employed (Not Incorporated) | 35 | 1.5% |
| Not-for-profit Organizations | 81 | 3.5% |
| Local Government Employees | 187 | 8.1% |
| State Government Employees | 66 | 2.9% |
| Federal Government Employees | 258 | 11.1% |
| Unpaid Family Workers | 0 | 0.0% |
| Total | 2,319 | 100.0% |
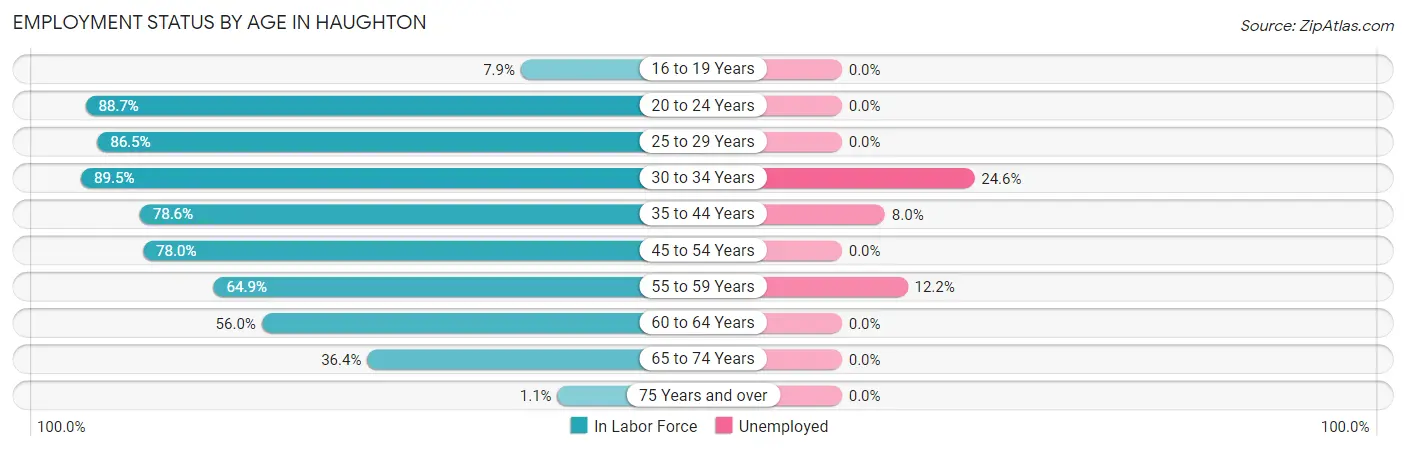
Employment Status by Age in Haughton
According to the labor force statistics for Haughton, out of the total population over 16 years of age (3,519), 70.2% or 2,470 individuals are in the labor force, with 5.6% or 138 of them unemployed. The age group with the highest labor force participation rate is 30 to 34 years, with 89.5% or 374 individuals in the labor force. Within the labor force, the 30 to 34 years age range has the highest percentage of unemployed individuals, with 24.6% or 92 of them being unemployed.
| Age Bracket | In Labor Force | Unemployed |
| 16 to 19 Years | 13 (7.9%) | 0 (0.0%) |
| 20 to 24 Years | 582 (88.7%) | 0 (0.0%) |
| 25 to 29 Years | 199 (86.5%) | 0 (0.0%) |
| 30 to 34 Years | 374 (89.5%) | 92 (24.6%) |
| 35 to 44 Years | 508 (78.6%) | 41 (8.0%) |
| 45 to 54 Years | 489 (78.0%) | 0 (0.0%) |
| 55 to 59 Years | 74 (64.9%) | 9 (12.2%) |
| 60 to 64 Years | 164 (56.0%) | 0 (0.0%) |
| 65 to 74 Years | 67 (36.4%) | 0 (0.0%) |
| 75 Years and over | 2 (1.1%) | 0 (0.0%) |
| Total | 2,470 (70.2%) | 138 (5.6%) |
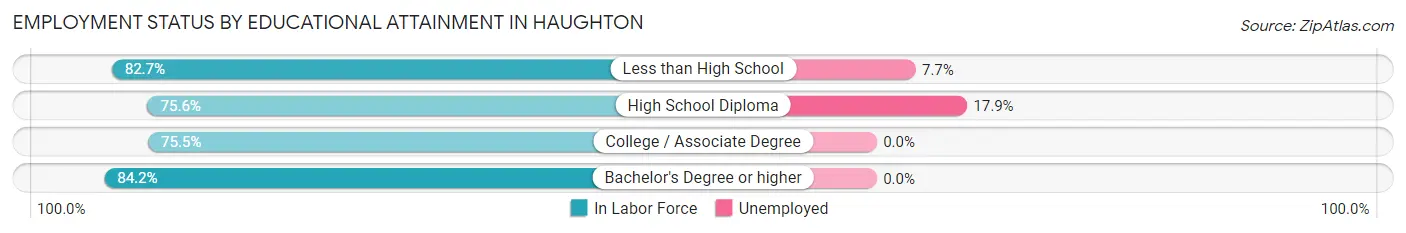
Employment Status by Educational Attainment in Haughton
According to labor force statistics for Haughton, 77.7% of individuals (1,809) out of the total population between 25 and 64 years of age (2,328) are in the labor force, with 7.9% or 143 of them being unemployed. The group with the highest labor force participation rate are those with the educational attainment of bachelor's degree or higher, with 84.2% or 362 individuals in the labor force. Within the labor force, individuals with high school diploma education have the highest percentage of unemployment, with 17.9% or 131 of them being unemployed.
| Educational Attainment | In Labor Force | Unemployed |
| Less than High School | 143 (82.7%) | 13 (7.7%) |
| High School Diploma | 734 (75.6%) | 174 (17.9%) |
| College / Associate Degree | 569 (75.5%) | 0 (0.0%) |
| Bachelor's Degree or higher | 362 (84.2%) | 0 (0.0%) |
| Total | 1,809 (77.7%) | 184 (7.9%) |
Employment Occupations by Sex in Haughton
Management, Business, Science and Arts Occupations
The most common Management, Business, Science and Arts occupations in Haughton are Health Diagnosing & Treating (179 | 8.2%), Management (126 | 5.8%), Community & Social Service (123 | 5.7%), Business & Financial (115 | 5.3%), and Health Technologists (90 | 4.1%).
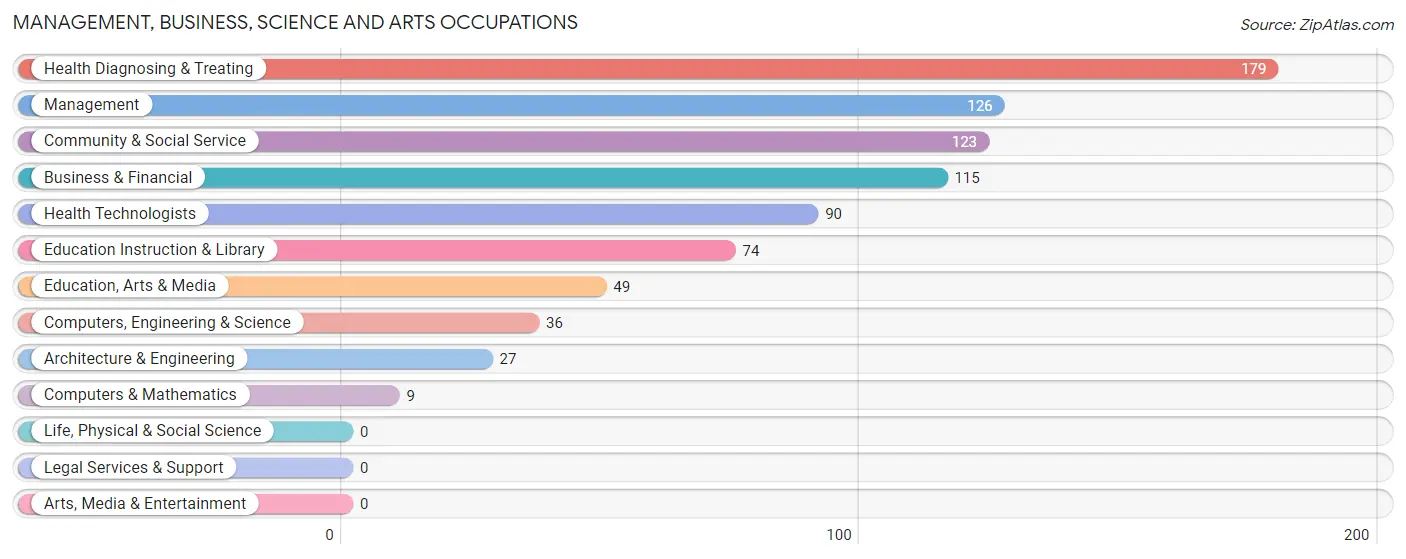
Management, Business, Science and Arts Occupations by Sex
Within the Management, Business, Science and Arts occupations in Haughton, the most male-oriented occupations are Management (100.0%), Computers, Engineering & Science (100.0%), and Computers & Mathematics (100.0%), while the most female-oriented occupations are Community & Social Service (100.0%), Education, Arts & Media (100.0%), and Education Instruction & Library (100.0%).
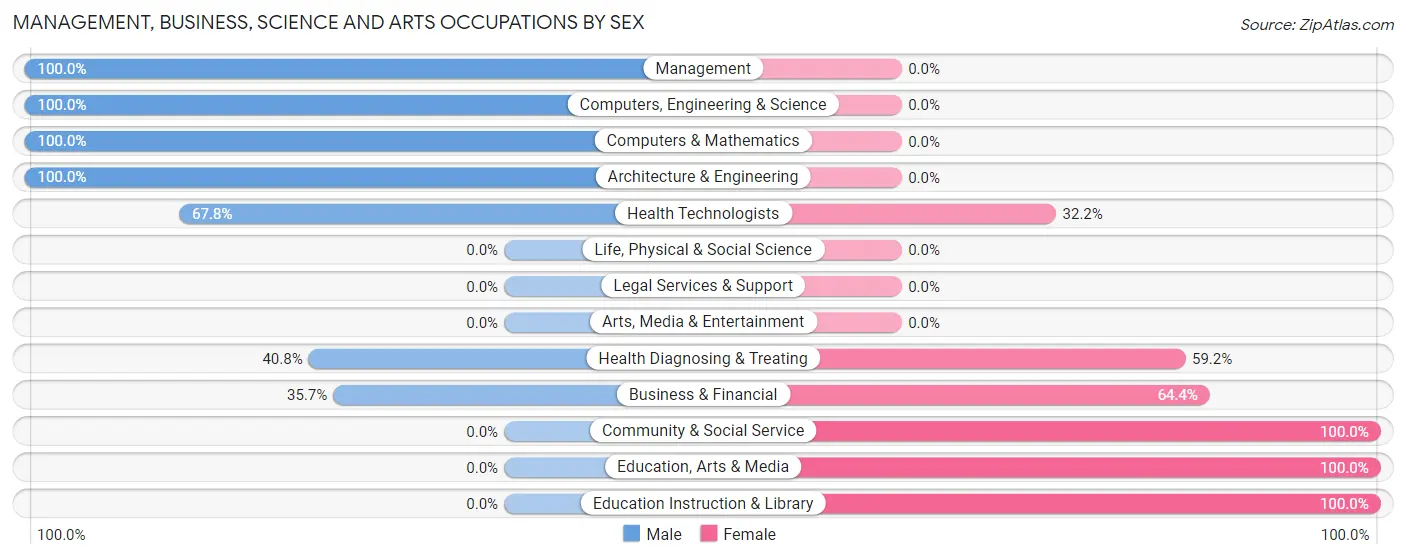
| Occupation | Male | Female |
| Management | 126 (100.0%) | 0 (0.0%) |
| Business & Financial | 41 (35.6%) | 74 (64.3%) |
| Computers, Engineering & Science | 36 (100.0%) | 0 (0.0%) |
| Computers & Mathematics | 9 (100.0%) | 0 (0.0%) |
| Architecture & Engineering | 27 (100.0%) | 0 (0.0%) |
| Life, Physical & Social Science | 0 (0.0%) | 0 (0.0%) |
| Community & Social Service | 0 (0.0%) | 123 (100.0%) |
| Education, Arts & Media | 0 (0.0%) | 49 (100.0%) |
| Legal Services & Support | 0 (0.0%) | 0 (0.0%) |
| Education Instruction & Library | 0 (0.0%) | 74 (100.0%) |
| Arts, Media & Entertainment | 0 (0.0%) | 0 (0.0%) |
| Health Diagnosing & Treating | 73 (40.8%) | 106 (59.2%) |
| Health Technologists | 61 (67.8%) | 29 (32.2%) |
| Total (Category) | 276 (47.7%) | 303 (52.3%) |
| Total (Overall) | 1,195 (54.9%) | 983 (45.1%) |
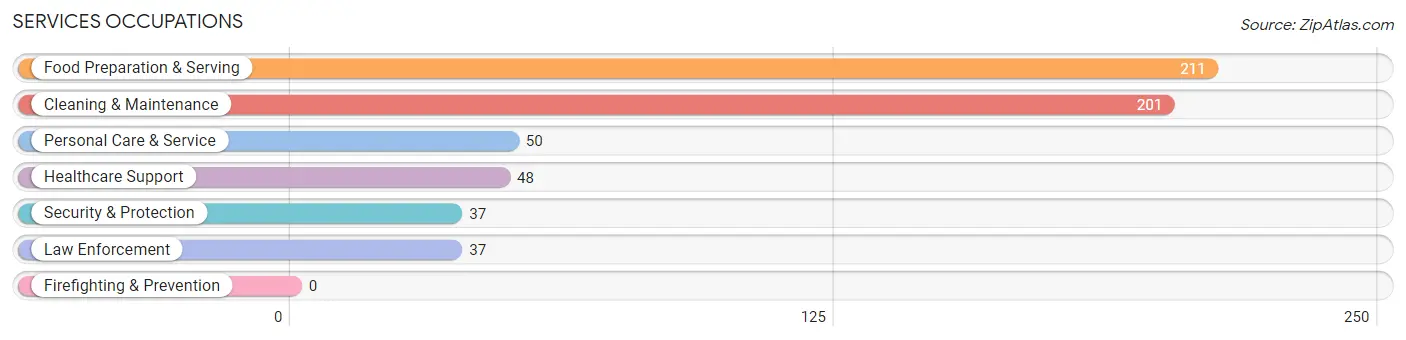
Services Occupations
The most common Services occupations in Haughton are Food Preparation & Serving (211 | 9.7%), Cleaning & Maintenance (201 | 9.2%), Personal Care & Service (50 | 2.3%), Healthcare Support (48 | 2.2%), and Security & Protection (37 | 1.7%).
Services Occupations by Sex
Within the Services occupations in Haughton, the most male-oriented occupations are Security & Protection (100.0%), Law Enforcement (100.0%), and Food Preparation & Serving (87.7%), while the most female-oriented occupations are Healthcare Support (100.0%), Cleaning & Maintenance (78.1%), and Personal Care & Service (58.0%).
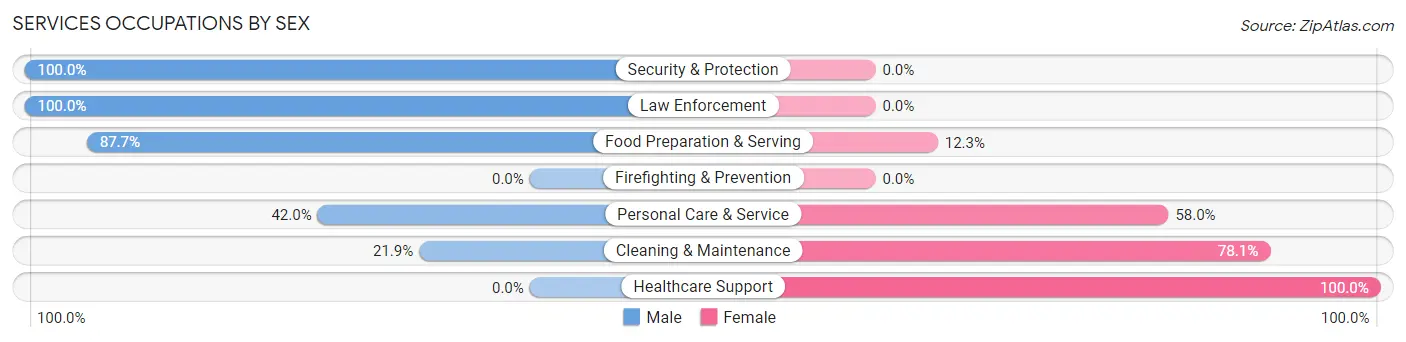
| Occupation | Male | Female |
| Healthcare Support | 0 (0.0%) | 48 (100.0%) |
| Security & Protection | 37 (100.0%) | 0 (0.0%) |
| Firefighting & Prevention | 0 (0.0%) | 0 (0.0%) |
| Law Enforcement | 37 (100.0%) | 0 (0.0%) |
| Food Preparation & Serving | 185 (87.7%) | 26 (12.3%) |
| Cleaning & Maintenance | 44 (21.9%) | 157 (78.1%) |
| Personal Care & Service | 21 (42.0%) | 29 (58.0%) |
| Total (Category) | 287 (52.5%) | 260 (47.5%) |
| Total (Overall) | 1,195 (54.9%) | 983 (45.1%) |
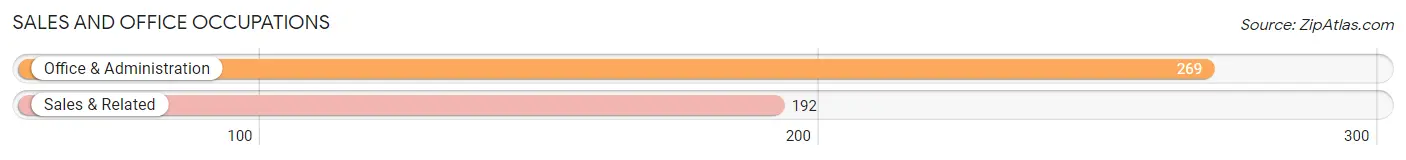
Sales and Office Occupations
The most common Sales and Office occupations in Haughton are Office & Administration (269 | 12.3%), and Sales & Related (192 | 8.8%).
Sales and Office Occupations by Sex
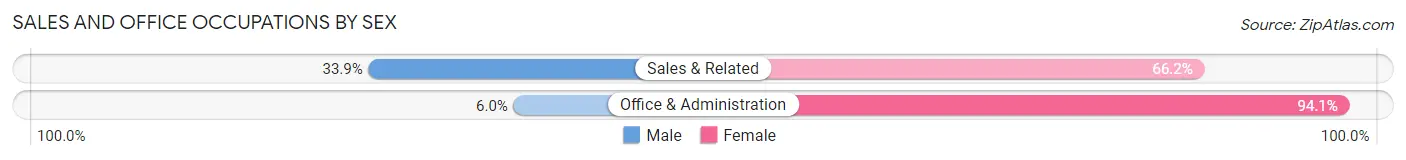
| Occupation | Male | Female |
| Sales & Related | 65 (33.9%) | 127 (66.1%) |
| Office & Administration | 16 (5.9%) | 253 (94.1%) |
| Total (Category) | 81 (17.6%) | 380 (82.4%) |
| Total (Overall) | 1,195 (54.9%) | 983 (45.1%) |
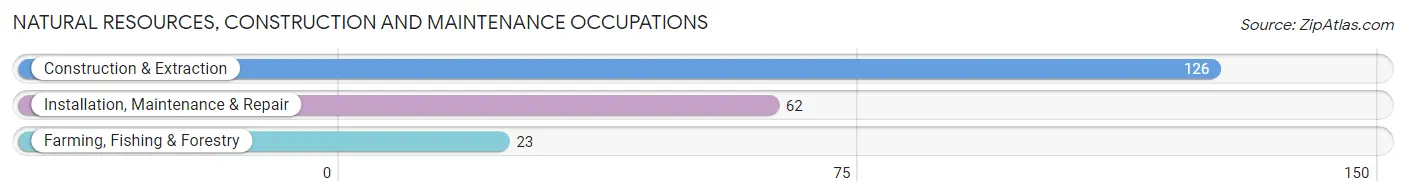
Natural Resources, Construction and Maintenance Occupations
The most common Natural Resources, Construction and Maintenance occupations in Haughton are Construction & Extraction (126 | 5.8%), Installation, Maintenance & Repair (62 | 2.9%), and Farming, Fishing & Forestry (23 | 1.1%).
Natural Resources, Construction and Maintenance Occupations by Sex
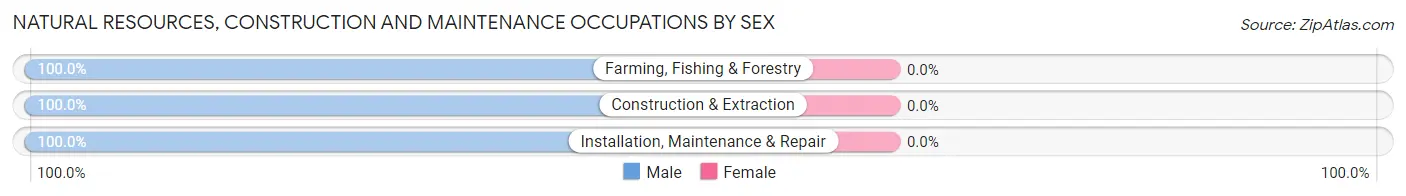
| Occupation | Male | Female |
| Farming, Fishing & Forestry | 23 (100.0%) | 0 (0.0%) |
| Construction & Extraction | 126 (100.0%) | 0 (0.0%) |
| Installation, Maintenance & Repair | 62 (100.0%) | 0 (0.0%) |
| Total (Category) | 211 (100.0%) | 0 (0.0%) |
| Total (Overall) | 1,195 (54.9%) | 983 (45.1%) |
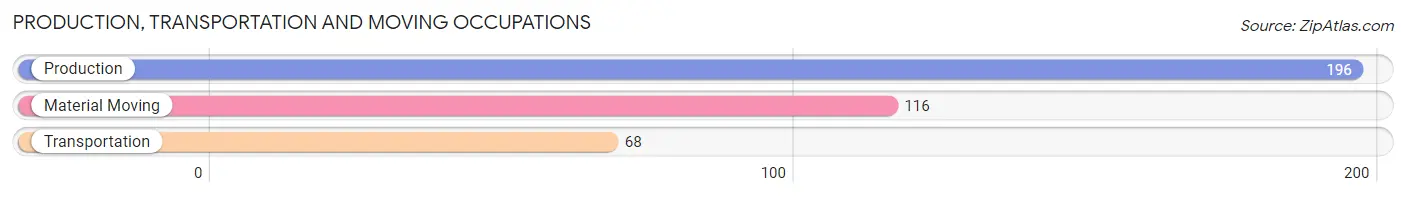
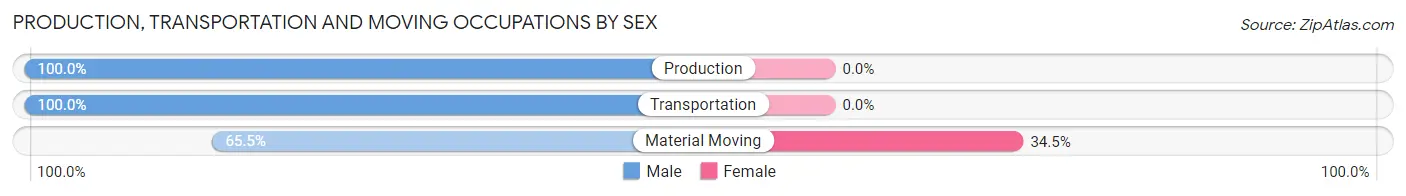
Production, Transportation and Moving Occupations
The most common Production, Transportation and Moving occupations in Haughton are Production (196 | 9.0%), Material Moving (116 | 5.3%), and Transportation (68 | 3.1%).
Production, Transportation and Moving Occupations by Sex
| Occupation | Male | Female |
| Production | 196 (100.0%) | 0 (0.0%) |
| Transportation | 68 (100.0%) | 0 (0.0%) |
| Material Moving | 76 (65.5%) | 40 (34.5%) |
| Total (Category) | 340 (89.5%) | 40 (10.5%) |
| Total (Overall) | 1,195 (54.9%) | 983 (45.1%) |
Employment Industries by Sex in Haughton
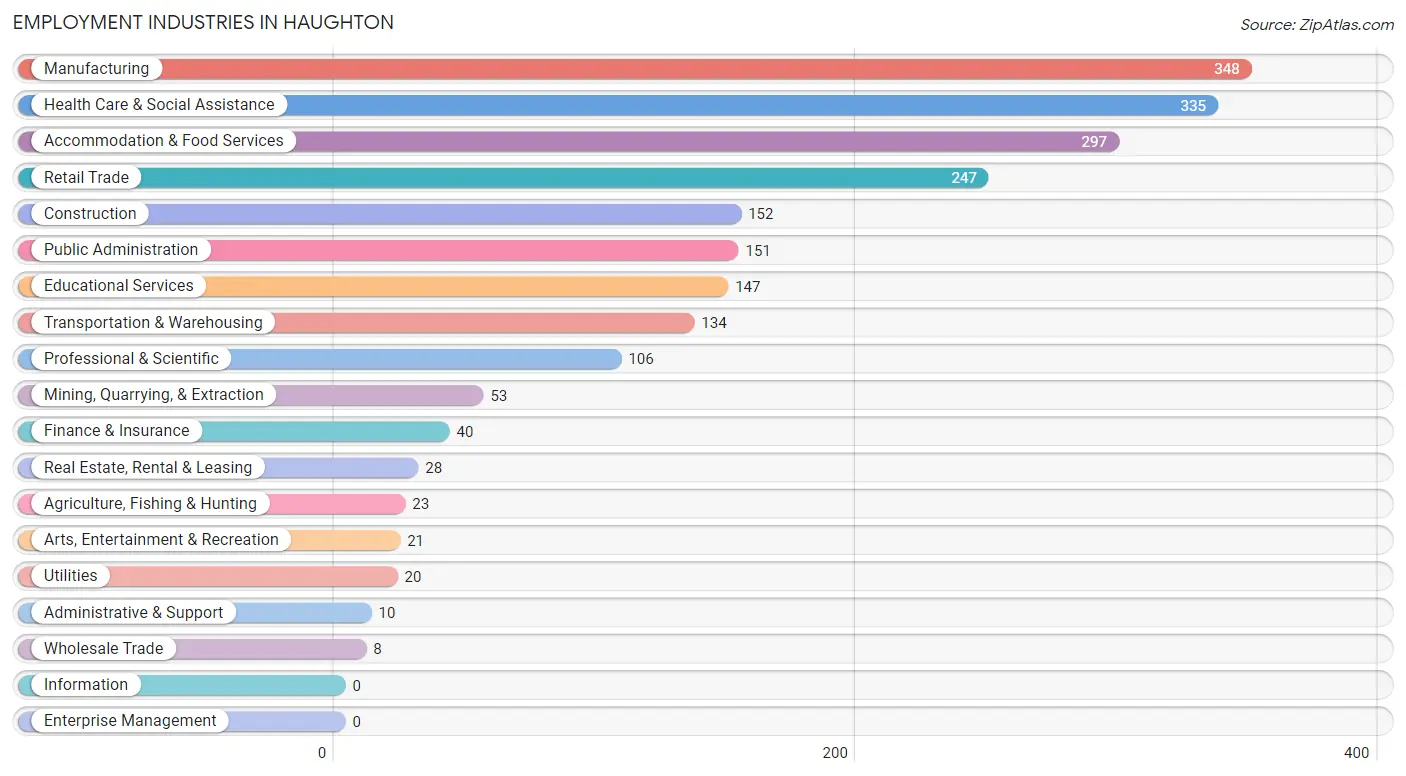
Employment Industries in Haughton
The major employment industries in Haughton include Manufacturing (348 | 16.0%), Health Care & Social Assistance (335 | 15.4%), Accommodation & Food Services (297 | 13.6%), Retail Trade (247 | 11.3%), and Construction (152 | 7.0%).
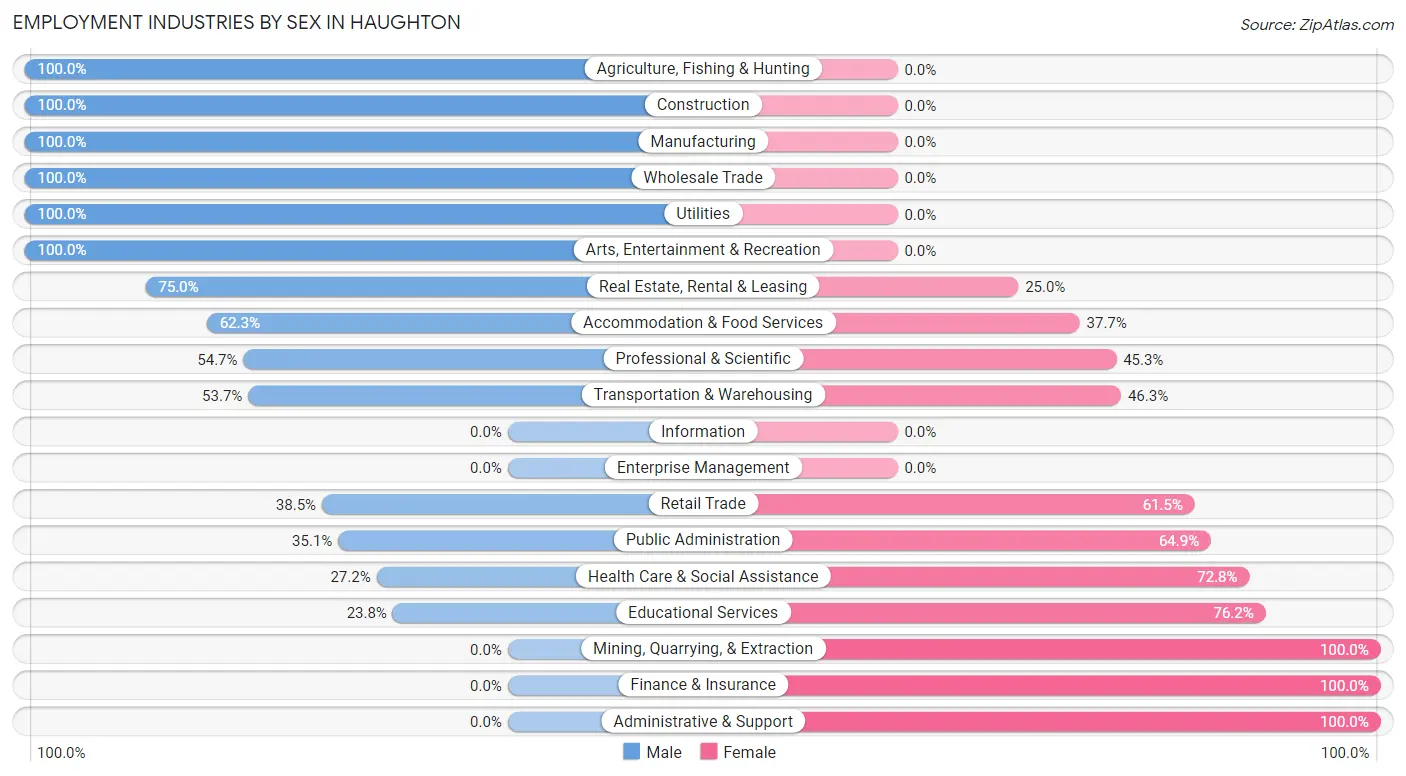
Employment Industries by Sex in Haughton
The Haughton industries that see more men than women are Agriculture, Fishing & Hunting (100.0%), Construction (100.0%), and Manufacturing (100.0%), whereas the industries that tend to have a higher number of women are Mining, Quarrying, & Extraction (100.0%), Finance & Insurance (100.0%), and Administrative & Support (100.0%).
| Industry | Male | Female |
| Agriculture, Fishing & Hunting | 23 (100.0%) | 0 (0.0%) |
| Mining, Quarrying, & Extraction | 0 (0.0%) | 53 (100.0%) |
| Construction | 152 (100.0%) | 0 (0.0%) |
| Manufacturing | 348 (100.0%) | 0 (0.0%) |
| Wholesale Trade | 8 (100.0%) | 0 (0.0%) |
| Retail Trade | 95 (38.5%) | 152 (61.5%) |
| Transportation & Warehousing | 72 (53.7%) | 62 (46.3%) |
| Utilities | 20 (100.0%) | 0 (0.0%) |
| Information | 0 (0.0%) | 0 (0.0%) |
| Finance & Insurance | 0 (0.0%) | 40 (100.0%) |
| Real Estate, Rental & Leasing | 21 (75.0%) | 7 (25.0%) |
| Professional & Scientific | 58 (54.7%) | 48 (45.3%) |
| Enterprise Management | 0 (0.0%) | 0 (0.0%) |
| Administrative & Support | 0 (0.0%) | 10 (100.0%) |
| Educational Services | 35 (23.8%) | 112 (76.2%) |
| Health Care & Social Assistance | 91 (27.2%) | 244 (72.8%) |
| Arts, Entertainment & Recreation | 21 (100.0%) | 0 (0.0%) |
| Accommodation & Food Services | 185 (62.3%) | 112 (37.7%) |
| Public Administration | 53 (35.1%) | 98 (64.9%) |
| Total | 1,195 (54.9%) | 983 (45.1%) |
Education in Haughton
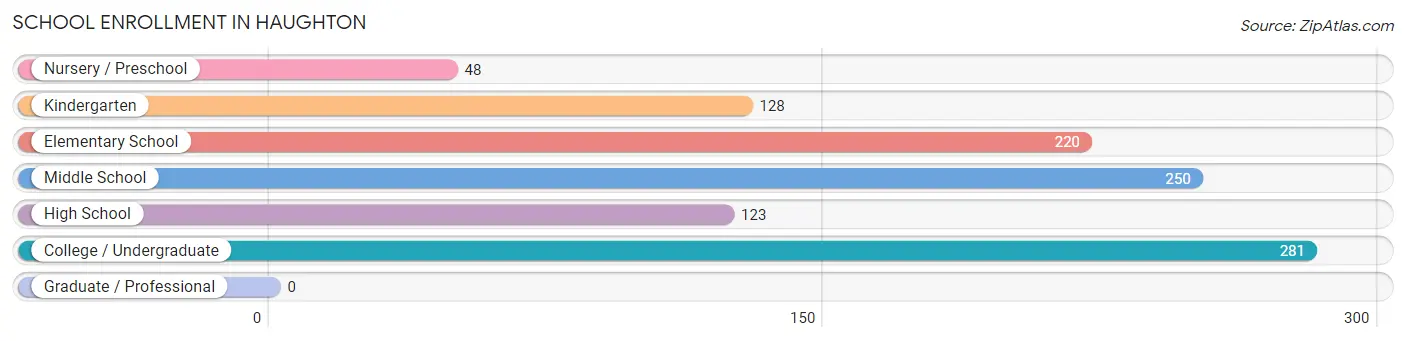
School Enrollment in Haughton
The most common levels of schooling among the 1,050 students in Haughton are college / undergraduate (281 | 26.8%), middle school (250 | 23.8%), and elementary school (220 | 20.9%).
| School Level | # Students | % Students |
| Nursery / Preschool | 48 | 4.6% |
| Kindergarten | 128 | 12.2% |
| Elementary School | 220 | 20.9% |
| Middle School | 250 | 23.8% |
| High School | 123 | 11.7% |
| College / Undergraduate | 281 | 26.8% |
| Graduate / Professional | 0 | 0.0% |
| Total | 1,050 | 100.0% |
School Enrollment by Age by Funding Source in Haughton
Out of a total of 1,050 students who are enrolled in schools in Haughton, 133 (12.7%) attend a private institution, while the remaining 917 (87.3%) are enrolled in public schools. The age group of 3 to 4 year olds has the highest likelihood of being enrolled in private schools, with 12 (38.7% in the age bracket) enrolled. Conversely, the age group of 10 to 14 year olds has the lowest likelihood of being enrolled in a private school, with 306 (100.0% in the age bracket) attending a public institution.
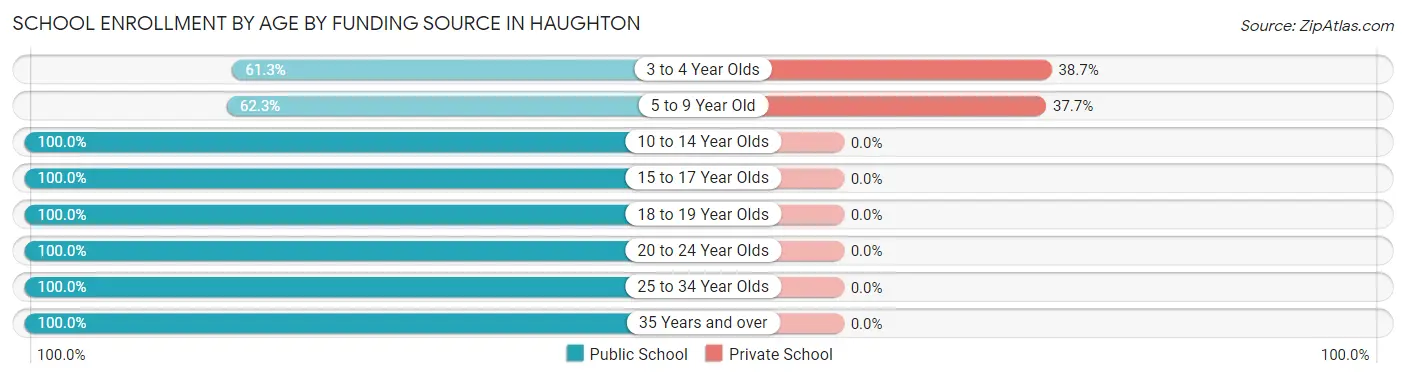
| Age Bracket | Public School | Private School |
| 3 to 4 Year Olds | 19 (61.3%) | 12 (38.7%) |
| 5 to 9 Year Old | 200 (62.3%) | 121 (37.7%) |
| 10 to 14 Year Olds | 306 (100.0%) | 0 (0.0%) |
| 15 to 17 Year Olds | 111 (100.0%) | 0 (0.0%) |
| 18 to 19 Year Olds | 44 (100.0%) | 0 (0.0%) |
| 20 to 24 Year Olds | 184 (100.0%) | 0 (0.0%) |
| 25 to 34 Year Olds | 21 (100.0%) | 0 (0.0%) |
| 35 Years and over | 32 (100.0%) | 0 (0.0%) |
| Total | 917 (87.3%) | 133 (12.7%) |
Educational Attainment by Field of Study in Haughton
Business (194 | 37.7%), arts & humanities (79 | 15.3%), science & technology (48 | 9.3%), bio, nature & agricultural (42 | 8.2%), and visual & performing arts (42 | 8.2%) are the most common fields of study among 515 individuals in Haughton who have obtained a bachelor's degree or higher.
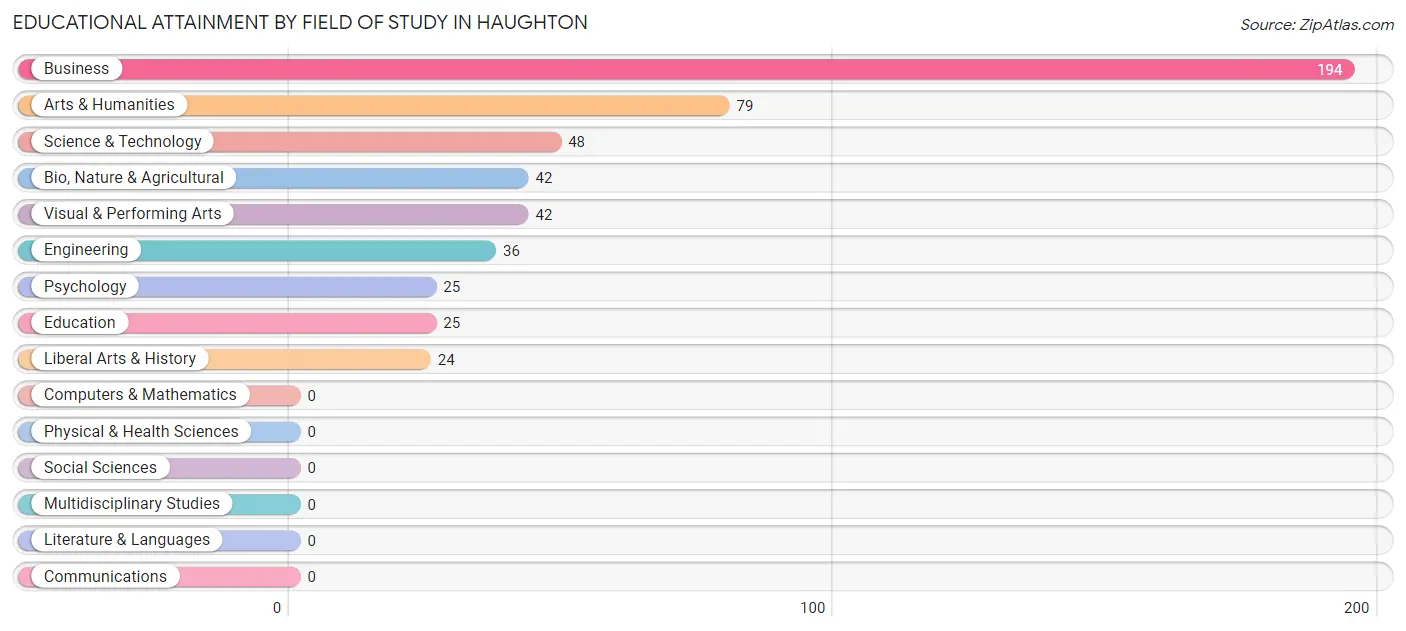
| Field of Study | # Graduates | % Graduates |
| Computers & Mathematics | 0 | 0.0% |
| Bio, Nature & Agricultural | 42 | 8.2% |
| Physical & Health Sciences | 0 | 0.0% |
| Psychology | 25 | 4.9% |
| Social Sciences | 0 | 0.0% |
| Engineering | 36 | 7.0% |
| Multidisciplinary Studies | 0 | 0.0% |
| Science & Technology | 48 | 9.3% |
| Business | 194 | 37.7% |
| Education | 25 | 4.9% |
| Literature & Languages | 0 | 0.0% |
| Liberal Arts & History | 24 | 4.7% |
| Visual & Performing Arts | 42 | 8.2% |
| Communications | 0 | 0.0% |
| Arts & Humanities | 79 | 15.3% |
| Total | 515 | 100.0% |
Transportation & Commute in Haughton
Vehicle Availability by Sex in Haughton
The most prevalent vehicle ownership categories in Haughton are males with 2 vehicles (603, accounting for 44.4%) and females with 2 vehicles (292, making up 62.9%).
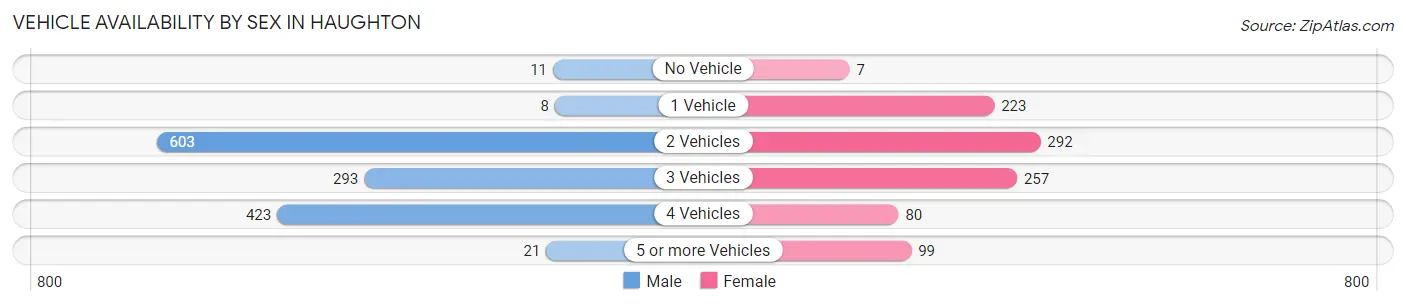
| Vehicles Available | Male | Female |
| No Vehicle | 11 (0.8%) | 7 (0.7%) |
| 1 Vehicle | 8 (0.6%) | 223 (23.3%) |
| 2 Vehicles | 603 (44.4%) | 292 (30.5%) |
| 3 Vehicles | 293 (21.6%) | 257 (26.8%) |
| 4 Vehicles | 423 (31.1%) | 80 (8.4%) |
| 5 or more Vehicles | 21 (1.5%) | 99 (10.3%) |
| Total | 1,359 (100.0%) | 958 (100.0%) |
Commute Time in Haughton
The most frequently occuring commute durations in Haughton are 20 to 24 minutes (634 commuters, 29.6%), 30 to 34 minutes (449 commuters, 21.0%), and 25 to 29 minutes (232 commuters, 10.8%).
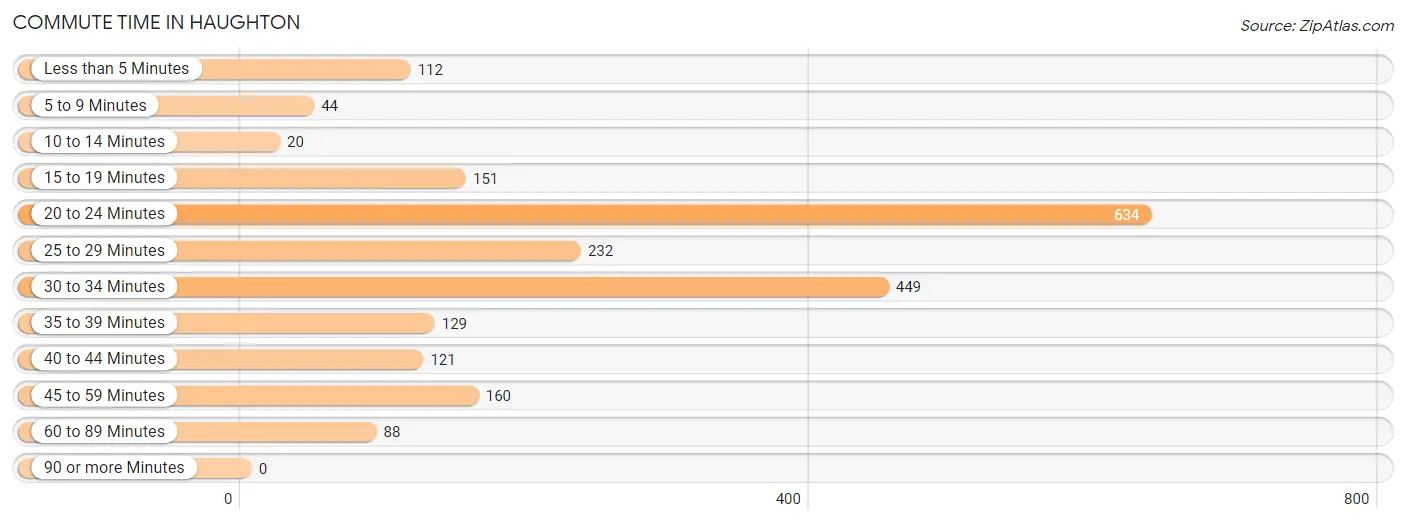
| Commute Time | # Commuters | % Commuters |
| Less than 5 Minutes | 112 | 5.2% |
| 5 to 9 Minutes | 44 | 2.1% |
| 10 to 14 Minutes | 20 | 0.9% |
| 15 to 19 Minutes | 151 | 7.1% |
| 20 to 24 Minutes | 634 | 29.6% |
| 25 to 29 Minutes | 232 | 10.8% |
| 30 to 34 Minutes | 449 | 21.0% |
| 35 to 39 Minutes | 129 | 6.0% |
| 40 to 44 Minutes | 121 | 5.7% |
| 45 to 59 Minutes | 160 | 7.5% |
| 60 to 89 Minutes | 88 | 4.1% |
| 90 or more Minutes | 0 | 0.0% |
Commute Time by Sex in Haughton
The most common commute times in Haughton are 20 to 24 minutes (424 commuters, 35.2%) for males and 20 to 24 minutes (210 commuters, 22.5%) for females.
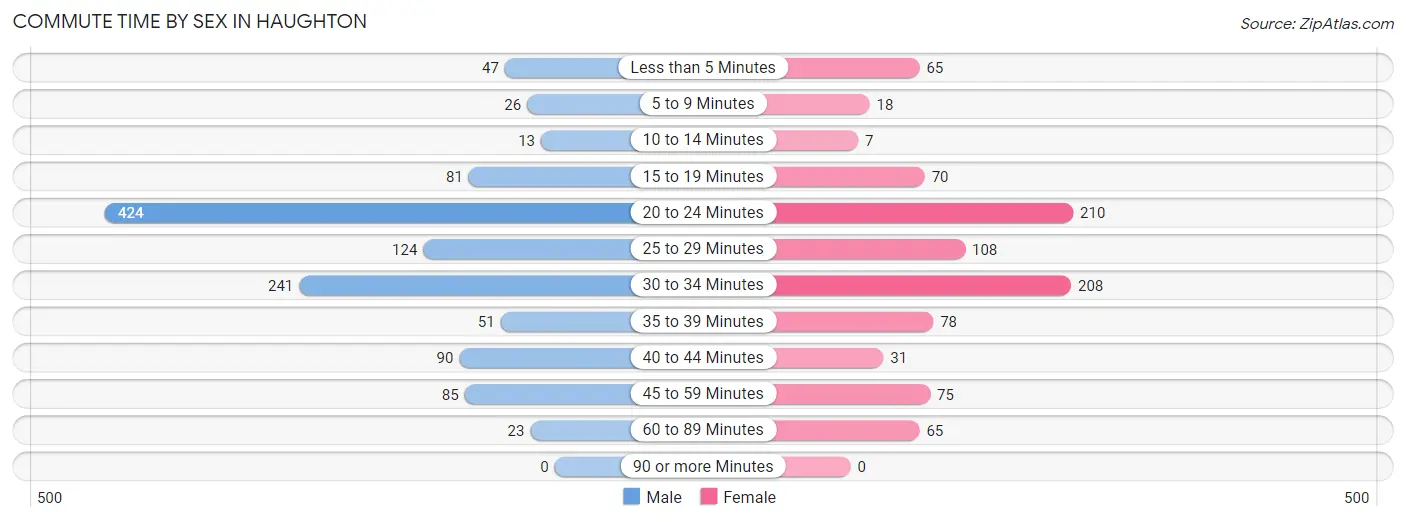
| Commute Time | Male | Female |
| Less than 5 Minutes | 47 (3.9%) | 65 (7.0%) |
| 5 to 9 Minutes | 26 (2.2%) | 18 (1.9%) |
| 10 to 14 Minutes | 13 (1.1%) | 7 (0.7%) |
| 15 to 19 Minutes | 81 (6.7%) | 70 (7.5%) |
| 20 to 24 Minutes | 424 (35.2%) | 210 (22.5%) |
| 25 to 29 Minutes | 124 (10.3%) | 108 (11.6%) |
| 30 to 34 Minutes | 241 (20.0%) | 208 (22.3%) |
| 35 to 39 Minutes | 51 (4.2%) | 78 (8.3%) |
| 40 to 44 Minutes | 90 (7.5%) | 31 (3.3%) |
| 45 to 59 Minutes | 85 (7.0%) | 75 (8.0%) |
| 60 to 89 Minutes | 23 (1.9%) | 65 (7.0%) |
| 90 or more Minutes | 0 (0.0%) | 0 (0.0%) |
Time of Departure to Work by Sex in Haughton
The most frequent times of departure to work in Haughton are 7:30 AM to 7:59 AM (342, 28.4%) for males and 7:00 AM to 7:29 AM (232, 24.8%) for females.
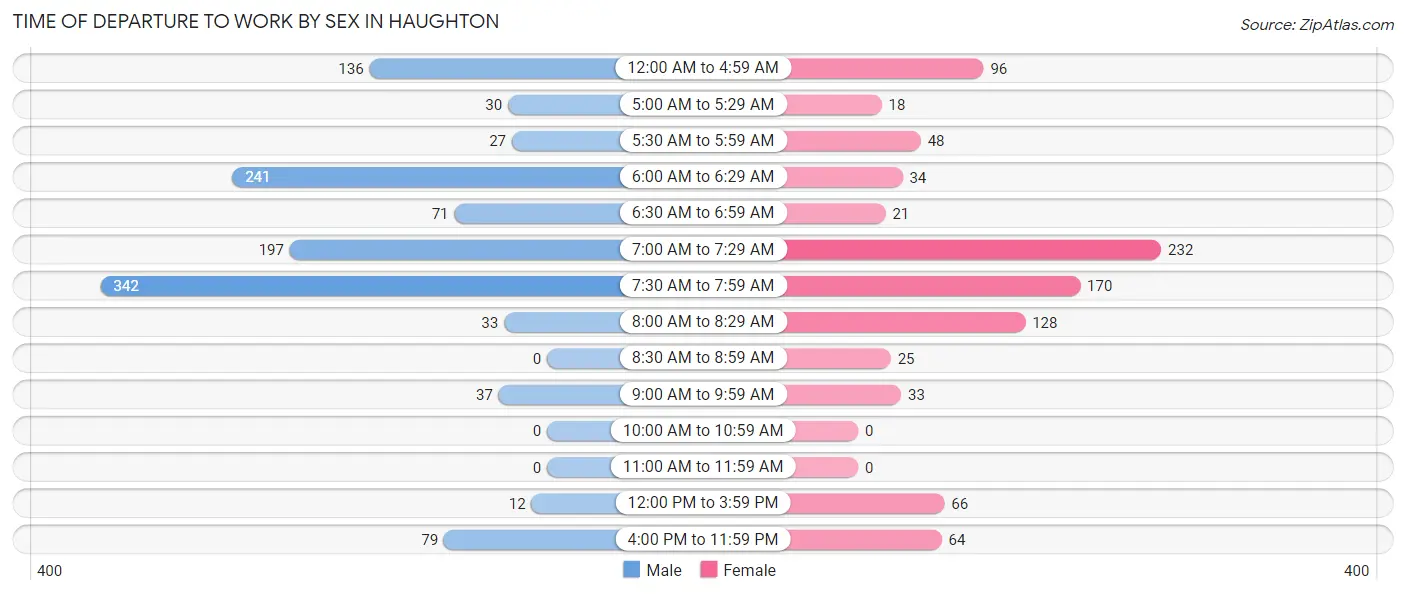
| Time of Departure | Male | Female |
| 12:00 AM to 4:59 AM | 136 (11.3%) | 96 (10.3%) |
| 5:00 AM to 5:29 AM | 30 (2.5%) | 18 (1.9%) |
| 5:30 AM to 5:59 AM | 27 (2.2%) | 48 (5.1%) |
| 6:00 AM to 6:29 AM | 241 (20.0%) | 34 (3.6%) |
| 6:30 AM to 6:59 AM | 71 (5.9%) | 21 (2.2%) |
| 7:00 AM to 7:29 AM | 197 (16.4%) | 232 (24.8%) |
| 7:30 AM to 7:59 AM | 342 (28.4%) | 170 (18.2%) |
| 8:00 AM to 8:29 AM | 33 (2.7%) | 128 (13.7%) |
| 8:30 AM to 8:59 AM | 0 (0.0%) | 25 (2.7%) |
| 9:00 AM to 9:59 AM | 37 (3.1%) | 33 (3.5%) |
| 10:00 AM to 10:59 AM | 0 (0.0%) | 0 (0.0%) |
| 11:00 AM to 11:59 AM | 0 (0.0%) | 0 (0.0%) |
| 12:00 PM to 3:59 PM | 12 (1.0%) | 66 (7.1%) |
| 4:00 PM to 11:59 PM | 79 (6.6%) | 64 (6.8%) |
| Total | 1,205 (100.0%) | 935 (100.0%) |
Housing Occupancy in Haughton
Occupancy by Ownership in Haughton
Of the total 1,535 dwellings in Haughton, owner-occupied units account for 1,299 (84.6%), while renter-occupied units make up 236 (15.4%).
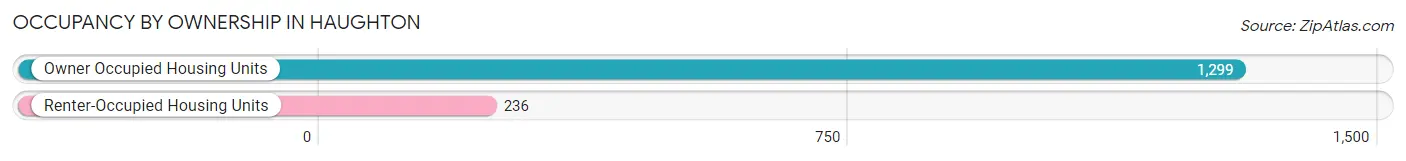
| Occupancy | # Housing Units | % Housing Units |
| Owner Occupied Housing Units | 1,299 | 84.6% |
| Renter-Occupied Housing Units | 236 | 15.4% |
| Total Occupied Housing Units | 1,535 | 100.0% |
Occupancy by Household Size in Haughton
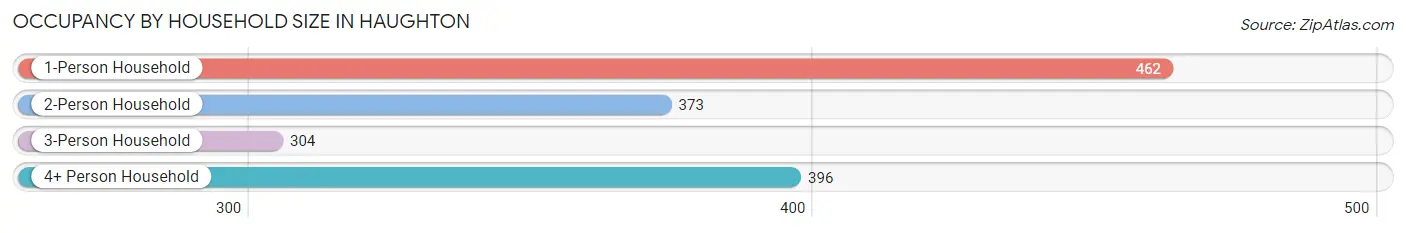
| Household Size | # Housing Units | % Housing Units |
| 1-Person Household | 462 | 30.1% |
| 2-Person Household | 373 | 24.3% |
| 3-Person Household | 304 | 19.8% |
| 4+ Person Household | 396 | 25.8% |
| Total Housing Units | 1,535 | 100.0% |
Occupancy by Ownership by Household Size in Haughton
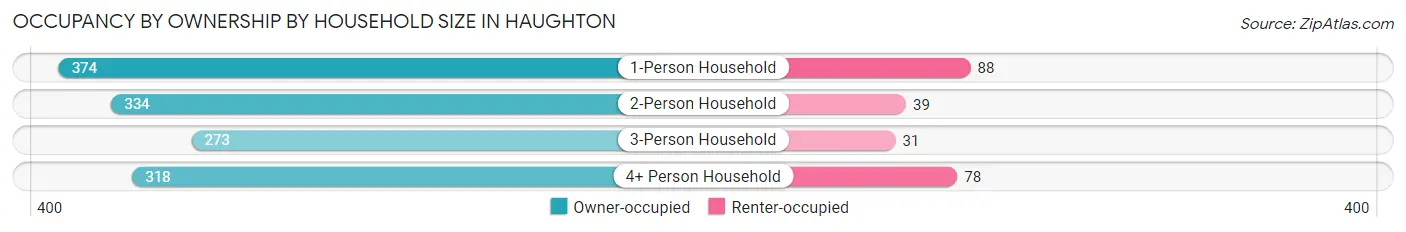
| Household Size | Owner-occupied | Renter-occupied |
| 1-Person Household | 374 (80.9%) | 88 (19.1%) |
| 2-Person Household | 334 (89.5%) | 39 (10.5%) |
| 3-Person Household | 273 (89.8%) | 31 (10.2%) |
| 4+ Person Household | 318 (80.3%) | 78 (19.7%) |
| Total Housing Units | 1,299 (84.6%) | 236 (15.4%) |
Occupancy by Educational Attainment in Haughton
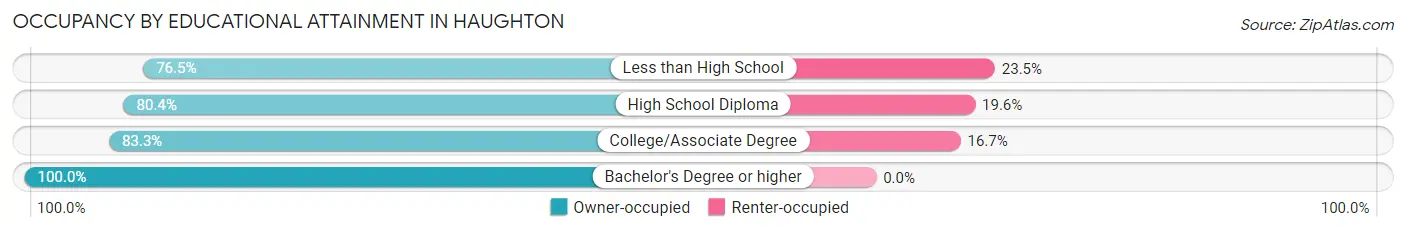
| Household Size | Owner-occupied | Renter-occupied |
| Less than High School | 104 (76.5%) | 32 (23.5%) |
| High School Diploma | 455 (80.4%) | 111 (19.6%) |
| College/Associate Degree | 463 (83.3%) | 93 (16.7%) |
| Bachelor's Degree or higher | 277 (100.0%) | 0 (0.0%) |
Occupancy by Age of Householder in Haughton
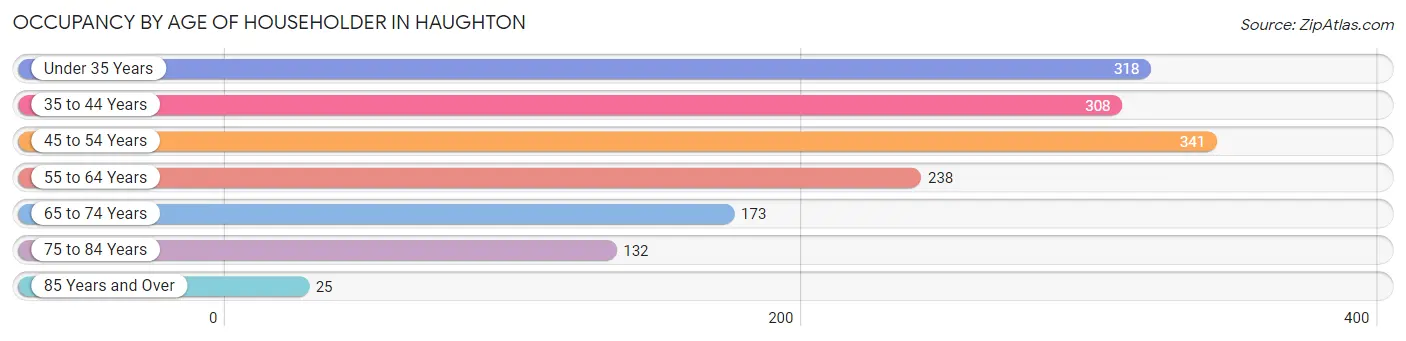
| Age Bracket | # Households | % Households |
| Under 35 Years | 318 | 20.7% |
| 35 to 44 Years | 308 | 20.1% |
| 45 to 54 Years | 341 | 22.2% |
| 55 to 64 Years | 238 | 15.5% |
| 65 to 74 Years | 173 | 11.3% |
| 75 to 84 Years | 132 | 8.6% |
| 85 Years and Over | 25 | 1.6% |
| Total | 1,535 | 100.0% |
Housing Finances in Haughton
Median Income by Occupancy in Haughton
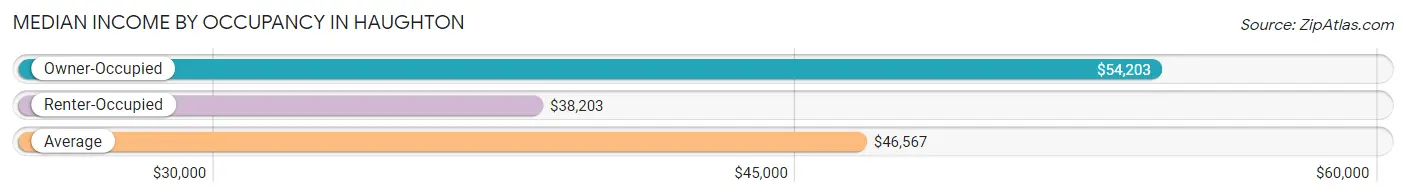
| Occupancy Type | # Households | Median Income |
| Owner-Occupied | 1,299 (84.6%) | $54,203 |
| Renter-Occupied | 236 (15.4%) | $38,203 |
| Average | 1,535 (100.0%) | $46,567 |
Occupancy by Householder Income Bracket in Haughton
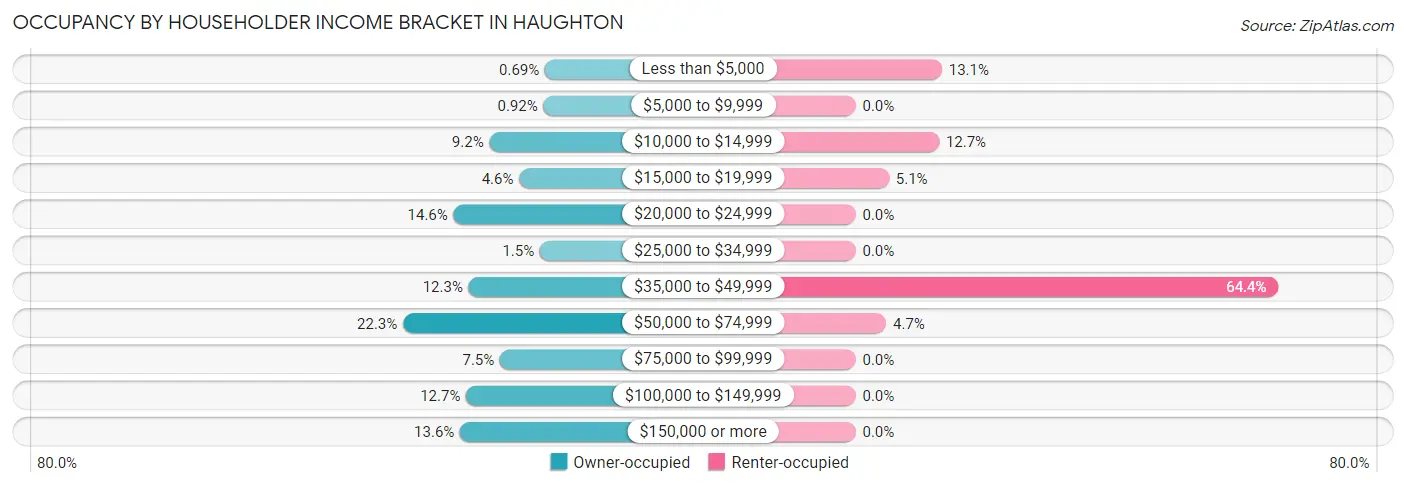
| Income Bracket | Owner-occupied | Renter-occupied |
| Less than $5,000 | 9 (0.7%) | 31 (13.1%) |
| $5,000 to $9,999 | 12 (0.9%) | 0 (0.0%) |
| $10,000 to $14,999 | 119 (9.2%) | 30 (12.7%) |
| $15,000 to $19,999 | 60 (4.6%) | 12 (5.1%) |
| $20,000 to $24,999 | 190 (14.6%) | 0 (0.0%) |
| $25,000 to $34,999 | 19 (1.5%) | 0 (0.0%) |
| $35,000 to $49,999 | 160 (12.3%) | 152 (64.4%) |
| $50,000 to $74,999 | 290 (22.3%) | 11 (4.7%) |
| $75,000 to $99,999 | 98 (7.5%) | 0 (0.0%) |
| $100,000 to $149,999 | 165 (12.7%) | 0 (0.0%) |
| $150,000 or more | 177 (13.6%) | 0 (0.0%) |
| Total | 1,299 (100.0%) | 236 (100.0%) |
Monthly Housing Cost Tiers in Haughton
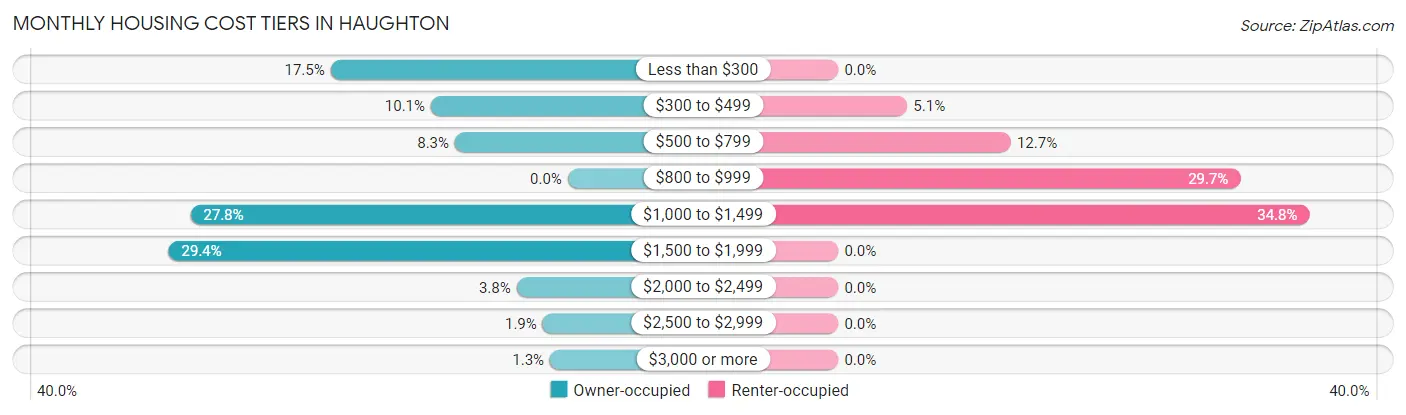
| Monthly Cost | Owner-occupied | Renter-occupied |
| Less than $300 | 227 (17.5%) | 0 (0.0%) |
| $300 to $499 | 131 (10.1%) | 12 (5.1%) |
| $500 to $799 | 108 (8.3%) | 30 (12.7%) |
| $800 to $999 | 0 (0.0%) | 70 (29.7%) |
| $1,000 to $1,499 | 361 (27.8%) | 82 (34.7%) |
| $1,500 to $1,999 | 382 (29.4%) | 0 (0.0%) |
| $2,000 to $2,499 | 49 (3.8%) | 0 (0.0%) |
| $2,500 to $2,999 | 24 (1.8%) | 0 (0.0%) |
| $3,000 or more | 17 (1.3%) | 0 (0.0%) |
| Total | 1,299 (100.0%) | 236 (100.0%) |
Physical Housing Characteristics in Haughton
Housing Structures in Haughton
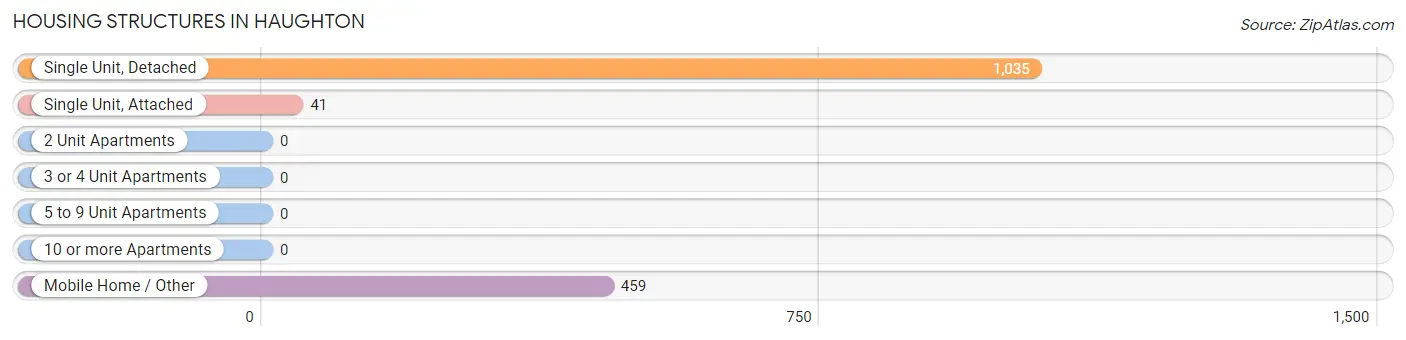
| Structure Type | # Housing Units | % Housing Units |
| Single Unit, Detached | 1,035 | 67.4% |
| Single Unit, Attached | 41 | 2.7% |
| 2 Unit Apartments | 0 | 0.0% |
| 3 or 4 Unit Apartments | 0 | 0.0% |
| 5 to 9 Unit Apartments | 0 | 0.0% |
| 10 or more Apartments | 0 | 0.0% |
| Mobile Home / Other | 459 | 29.9% |
| Total | 1,535 | 100.0% |
Housing Structures by Occupancy in Haughton
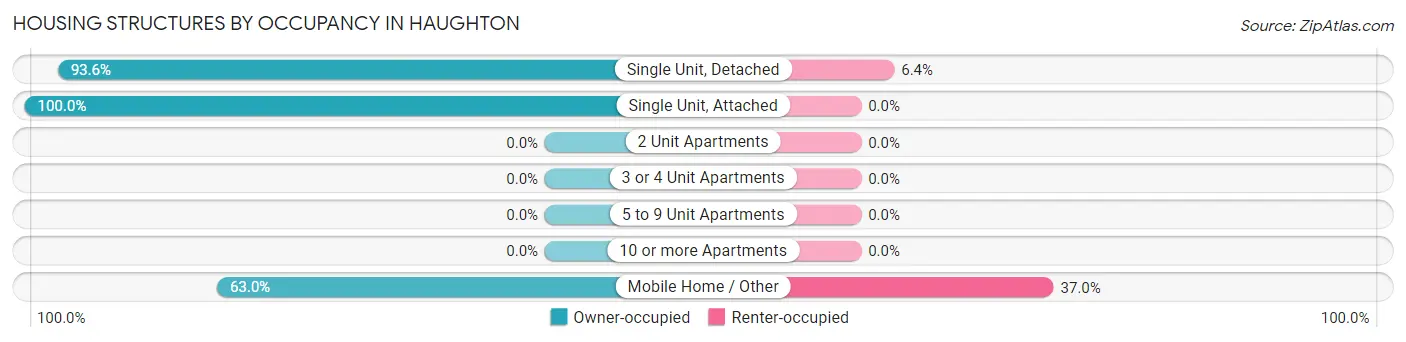
| Structure Type | Owner-occupied | Renter-occupied |
| Single Unit, Detached | 969 (93.6%) | 66 (6.4%) |
| Single Unit, Attached | 41 (100.0%) | 0 (0.0%) |
| 2 Unit Apartments | 0 (0.0%) | 0 (0.0%) |
| 3 or 4 Unit Apartments | 0 (0.0%) | 0 (0.0%) |
| 5 to 9 Unit Apartments | 0 (0.0%) | 0 (0.0%) |
| 10 or more Apartments | 0 (0.0%) | 0 (0.0%) |
| Mobile Home / Other | 289 (63.0%) | 170 (37.0%) |
| Total | 1,299 (84.6%) | 236 (15.4%) |
Housing Structures by Number of Rooms in Haughton
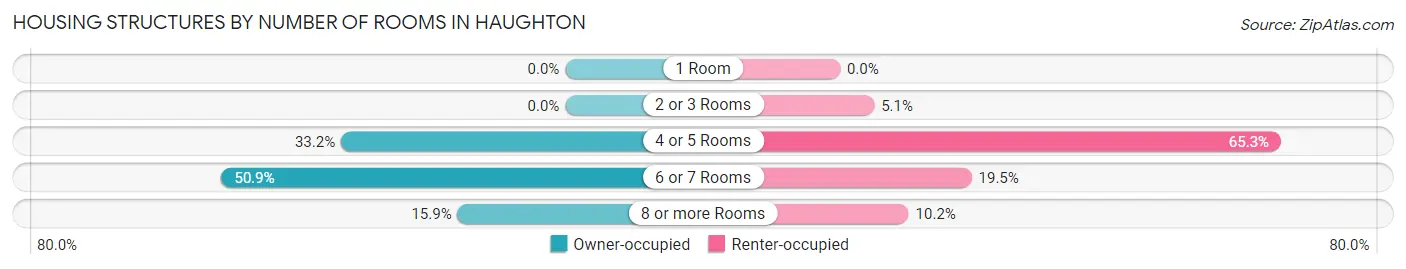
| Number of Rooms | Owner-occupied | Renter-occupied |
| 1 Room | 0 (0.0%) | 0 (0.0%) |
| 2 or 3 Rooms | 0 (0.0%) | 12 (5.1%) |
| 4 or 5 Rooms | 431 (33.2%) | 154 (65.2%) |
| 6 or 7 Rooms | 661 (50.9%) | 46 (19.5%) |
| 8 or more Rooms | 207 (15.9%) | 24 (10.2%) |
| Total | 1,299 (100.0%) | 236 (100.0%) |
Housing Structure by Heating Type in Haughton
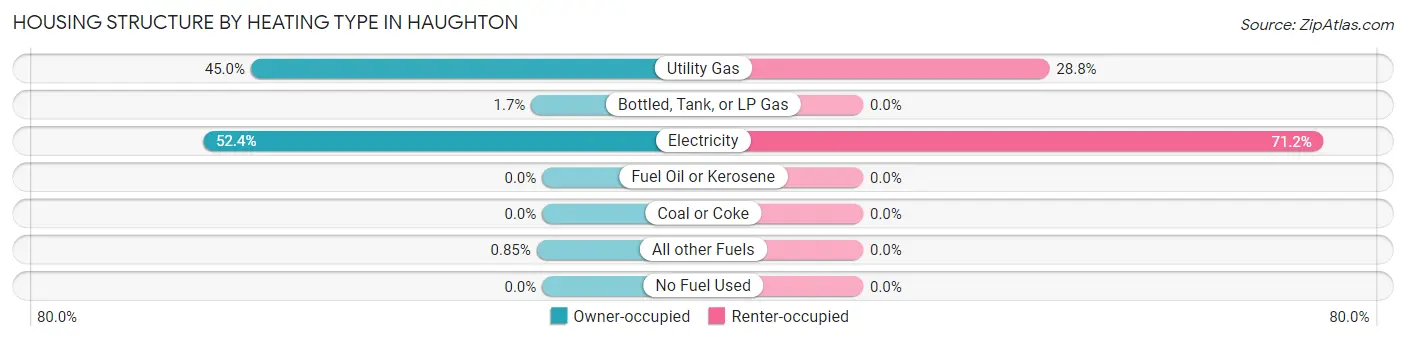
| Heating Type | Owner-occupied | Renter-occupied |
| Utility Gas | 585 (45.0%) | 68 (28.8%) |
| Bottled, Tank, or LP Gas | 22 (1.7%) | 0 (0.0%) |
| Electricity | 681 (52.4%) | 168 (71.2%) |
| Fuel Oil or Kerosene | 0 (0.0%) | 0 (0.0%) |
| Coal or Coke | 0 (0.0%) | 0 (0.0%) |
| All other Fuels | 11 (0.9%) | 0 (0.0%) |
| No Fuel Used | 0 (0.0%) | 0 (0.0%) |
| Total | 1,299 (100.0%) | 236 (100.0%) |
Household Vehicle Usage in Haughton
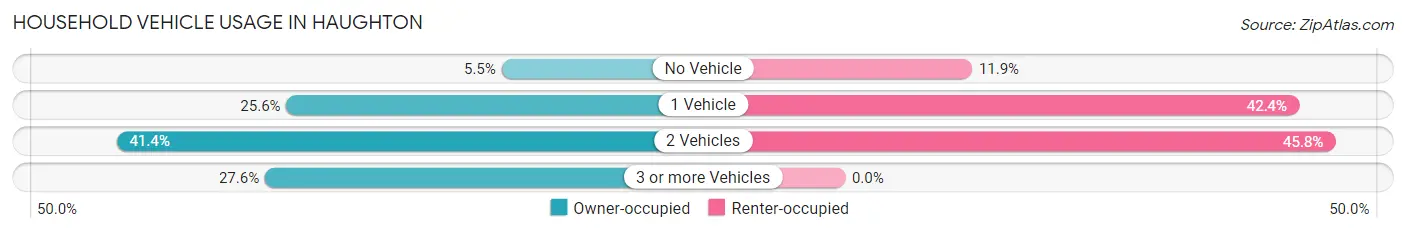
| Vehicles per Household | Owner-occupied | Renter-occupied |
| No Vehicle | 71 (5.5%) | 28 (11.9%) |
| 1 Vehicle | 332 (25.6%) | 100 (42.4%) |
| 2 Vehicles | 538 (41.4%) | 108 (45.8%) |
| 3 or more Vehicles | 358 (27.6%) | 0 (0.0%) |
| Total | 1,299 (100.0%) | 236 (100.0%) |
Real Estate & Mortgages in Haughton
Real Estate and Mortgage Overview in Haughton
| Characteristic | Without Mortgage | With Mortgage |
| Housing Units | 386 | 913 |
| Median Property Value | $71,700 | $211,800 |
| Median Household Income | $21,402 | $177 |
| Monthly Housing Costs | $278 | $17 |
| Real Estate Taxes | $791 | $107 |
Property Value by Mortgage Status in Haughton
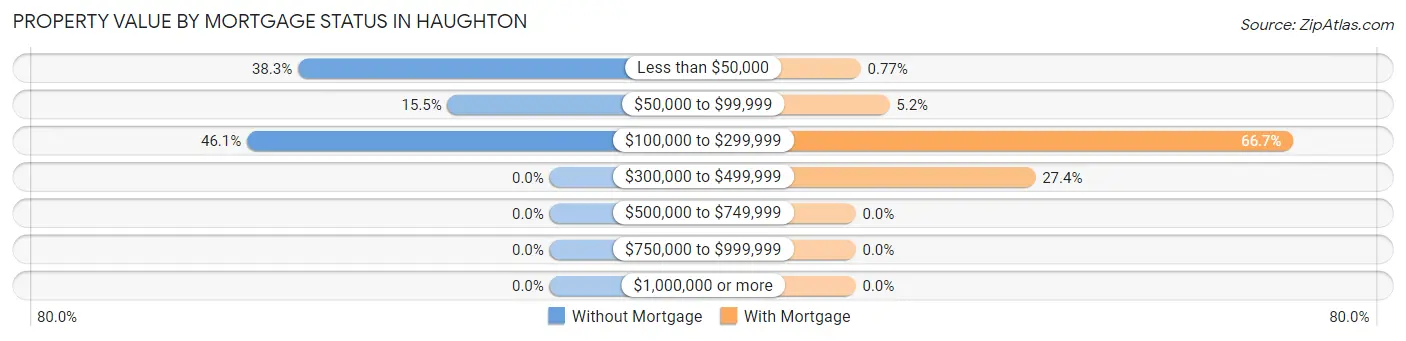
| Property Value | Without Mortgage | With Mortgage |
| Less than $50,000 | 148 (38.3%) | 7 (0.8%) |
| $50,000 to $99,999 | 60 (15.5%) | 47 (5.1%) |
| $100,000 to $299,999 | 178 (46.1%) | 609 (66.7%) |
| $300,000 to $499,999 | 0 (0.0%) | 250 (27.4%) |
| $500,000 to $749,999 | 0 (0.0%) | 0 (0.0%) |
| $750,000 to $999,999 | 0 (0.0%) | 0 (0.0%) |
| $1,000,000 or more | 0 (0.0%) | 0 (0.0%) |
| Total | 386 (100.0%) | 913 (100.0%) |
Household Income by Mortgage Status in Haughton
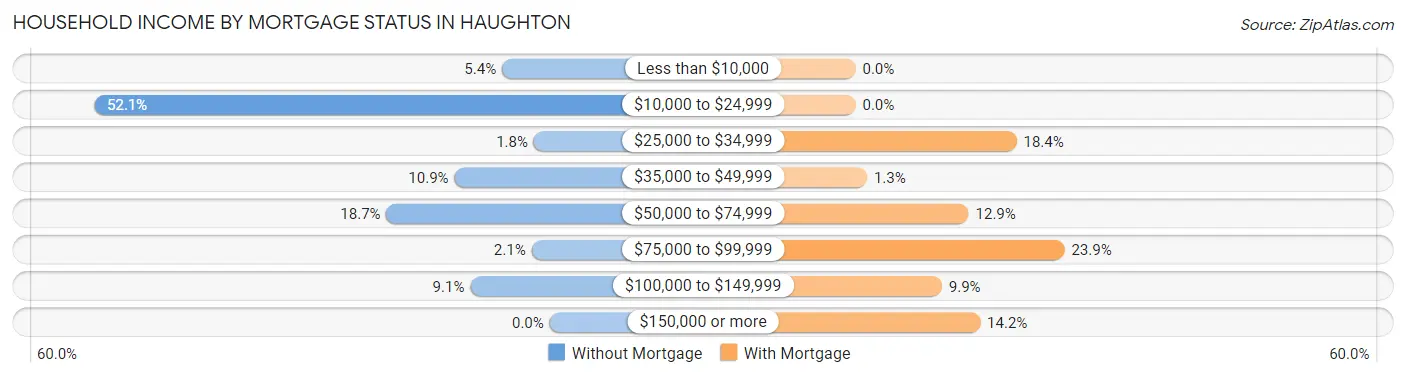
| Household Income | Without Mortgage | With Mortgage |
| Less than $10,000 | 21 (5.4%) | 0 (0.0%) |
| $10,000 to $24,999 | 201 (52.1%) | 0 (0.0%) |
| $25,000 to $34,999 | 7 (1.8%) | 168 (18.4%) |
| $35,000 to $49,999 | 42 (10.9%) | 12 (1.3%) |
| $50,000 to $74,999 | 72 (18.6%) | 118 (12.9%) |
| $75,000 to $99,999 | 8 (2.1%) | 218 (23.9%) |
| $100,000 to $149,999 | 35 (9.1%) | 90 (9.9%) |
| $150,000 or more | 0 (0.0%) | 130 (14.2%) |
| Total | 386 (100.0%) | 913 (100.0%) |
Property Value to Household Income Ratio in Haughton
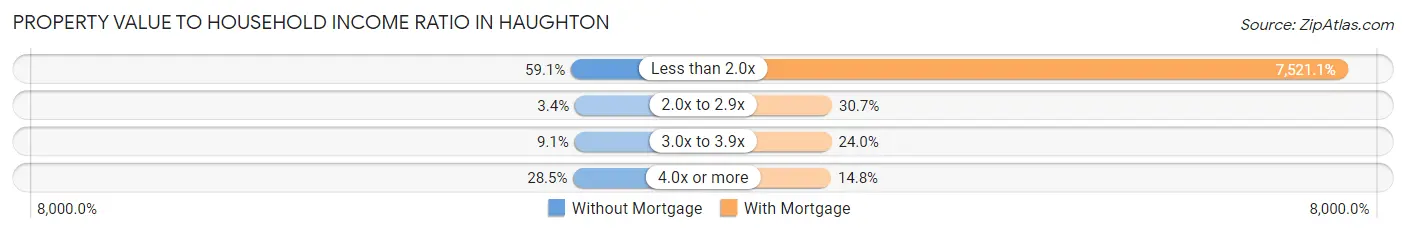
| Value-to-Income Ratio | Without Mortgage | With Mortgage |
| Less than 2.0x | 228 (59.1%) | 68,668 (7,521.1%) |
| 2.0x to 2.9x | 13 (3.4%) | 280 (30.7%) |
| 3.0x to 3.9x | 35 (9.1%) | 219 (24.0%) |
| 4.0x or more | 110 (28.5%) | 135 (14.8%) |
| Total | 386 (100.0%) | 913 (100.0%) |
Real Estate Taxes by Mortgage Status in Haughton
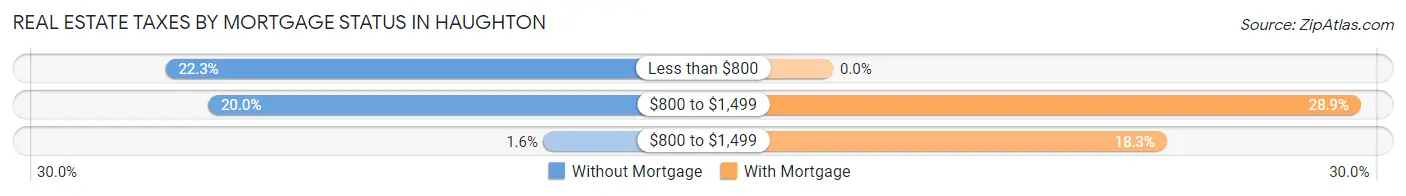
| Property Taxes | Without Mortgage | With Mortgage |
| Less than $800 | 86 (22.3%) | 0 (0.0%) |
| $800 to $1,499 | 77 (20.0%) | 264 (28.9%) |
| $800 to $1,499 | 6 (1.5%) | 167 (18.3%) |
| Total | 386 (100.0%) | 913 (100.0%) |
Health & Disability in Haughton
Health Insurance Coverage by Age in Haughton
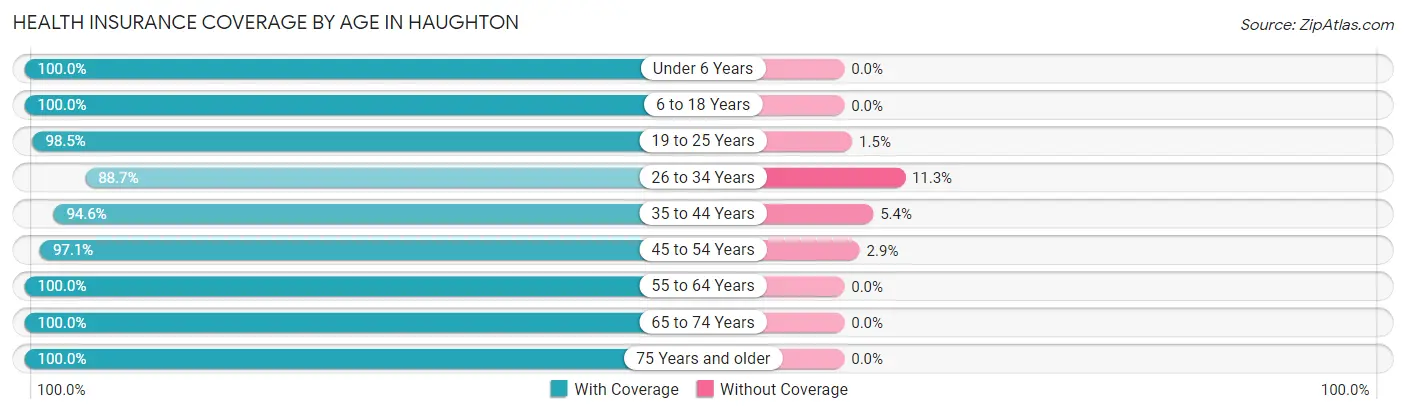
| Age Bracket | With Coverage | Without Coverage |
| Under 6 Years | 375 (100.0%) | 0 (0.0%) |
| 6 to 18 Years | 708 (100.0%) | 0 (0.0%) |
| 19 to 25 Years | 669 (98.5%) | 10 (1.5%) |
| 26 to 34 Years | 549 (88.7%) | 70 (11.3%) |
| 35 to 44 Years | 474 (94.6%) | 27 (5.4%) |
| 45 to 54 Years | 609 (97.1%) | 18 (2.9%) |
| 55 to 64 Years | 407 (100.0%) | 0 (0.0%) |
| 65 to 74 Years | 184 (100.0%) | 0 (0.0%) |
| 75 Years and older | 186 (100.0%) | 0 (0.0%) |
| Total | 4,161 (97.1%) | 125 (2.9%) |
Health Insurance Coverage by Citizenship Status in Haughton
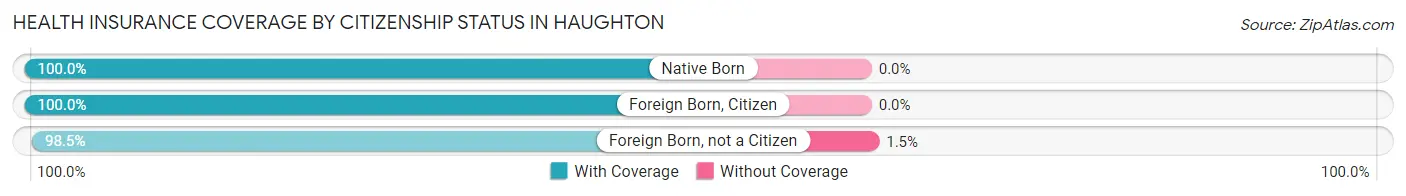
| Citizenship Status | With Coverage | Without Coverage |
| Native Born | 375 (100.0%) | 0 (0.0%) |
| Foreign Born, Citizen | 708 (100.0%) | 0 (0.0%) |
| Foreign Born, not a Citizen | 669 (98.5%) | 10 (1.5%) |
Health Insurance Coverage by Household Income in Haughton
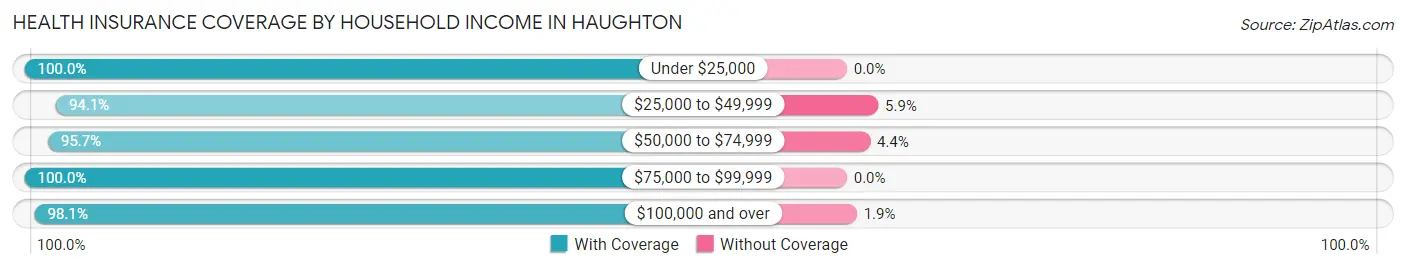
| Household Income | With Coverage | Without Coverage |
| Under $25,000 | 646 (100.0%) | 0 (0.0%) |
| $25,000 to $49,999 | 880 (94.1%) | 55 (5.9%) |
| $50,000 to $74,999 | 946 (95.7%) | 43 (4.3%) |
| $75,000 to $99,999 | 251 (100.0%) | 0 (0.0%) |
| $100,000 and over | 1,427 (98.1%) | 27 (1.9%) |
Public vs Private Health Insurance Coverage by Age in Haughton
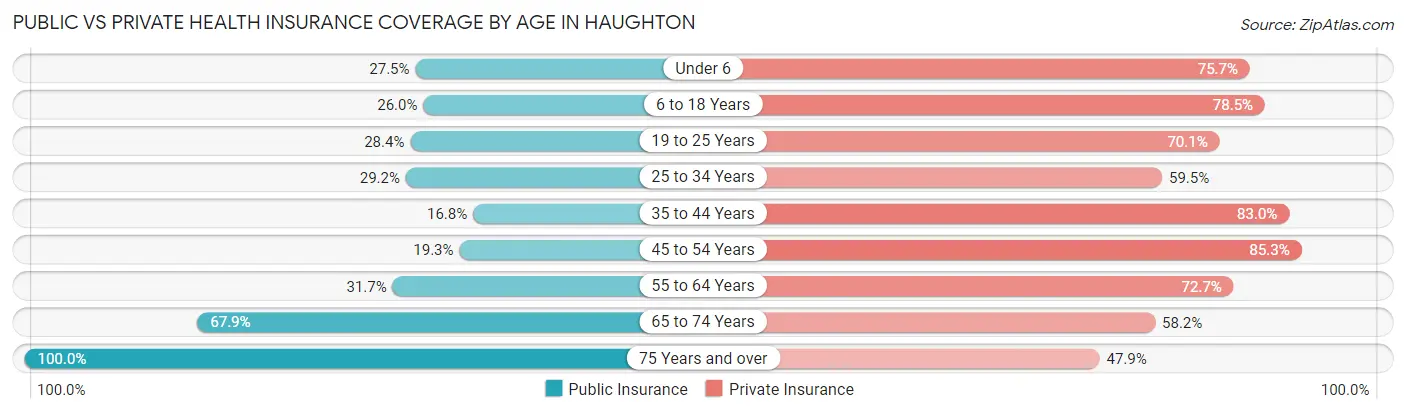
| Age Bracket | Public Insurance | Private Insurance |
| Under 6 | 103 (27.5%) | 284 (75.7%) |
| 6 to 18 Years | 184 (26.0%) | 556 (78.5%) |
| 19 to 25 Years | 193 (28.4%) | 476 (70.1%) |
| 25 to 34 Years | 181 (29.2%) | 368 (59.5%) |
| 35 to 44 Years | 84 (16.8%) | 416 (83.0%) |
| 45 to 54 Years | 121 (19.3%) | 535 (85.3%) |
| 55 to 64 Years | 129 (31.7%) | 296 (72.7%) |
| 65 to 74 Years | 125 (67.9%) | 107 (58.2%) |
| 75 Years and over | 186 (100.0%) | 89 (47.8%) |
| Total | 1,306 (30.5%) | 3,127 (73.0%) |
Disability Status by Sex by Age in Haughton
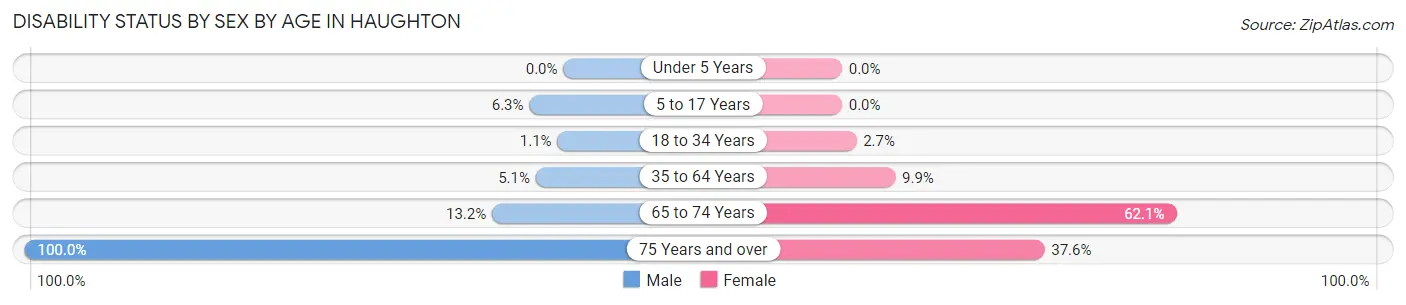
| Age Bracket | Male | Female |
| Under 5 Years | 0 (0.0%) | 0 (0.0%) |
| 5 to 17 Years | 21 (6.3%) | 0 (0.0%) |
| 18 to 34 Years | 9 (1.1%) | 14 (2.7%) |
| 35 to 64 Years | 34 (5.1%) | 86 (9.9%) |
| 65 to 74 Years | 9 (13.2%) | 72 (62.1%) |
| 75 Years and over | 45 (100.0%) | 53 (37.6%) |
Disability Class by Sex by Age in Haughton
Disability Class: Hearing Difficulty
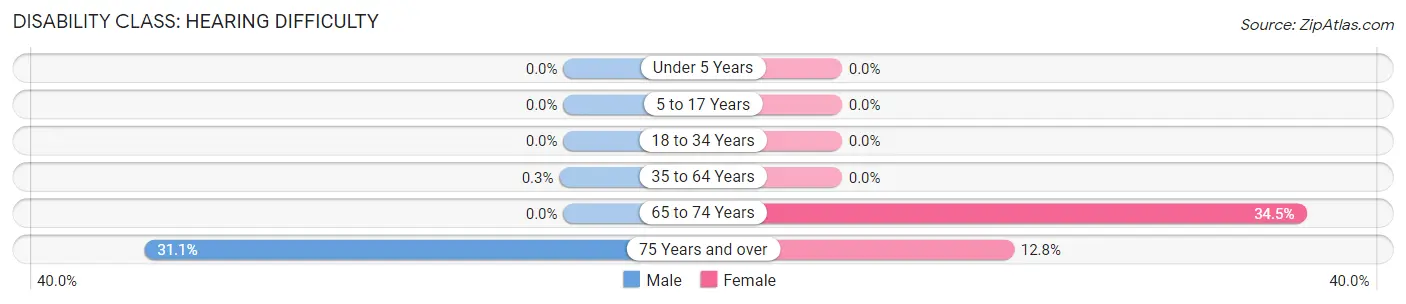
| Age Bracket | Male | Female |
| Under 5 Years | 0 (0.0%) | 0 (0.0%) |
| 5 to 17 Years | 0 (0.0%) | 0 (0.0%) |
| 18 to 34 Years | 0 (0.0%) | 0 (0.0%) |
| 35 to 64 Years | 2 (0.3%) | 0 (0.0%) |
| 65 to 74 Years | 0 (0.0%) | 40 (34.5%) |
| 75 Years and over | 14 (31.1%) | 18 (12.8%) |
Disability Class: Vision Difficulty
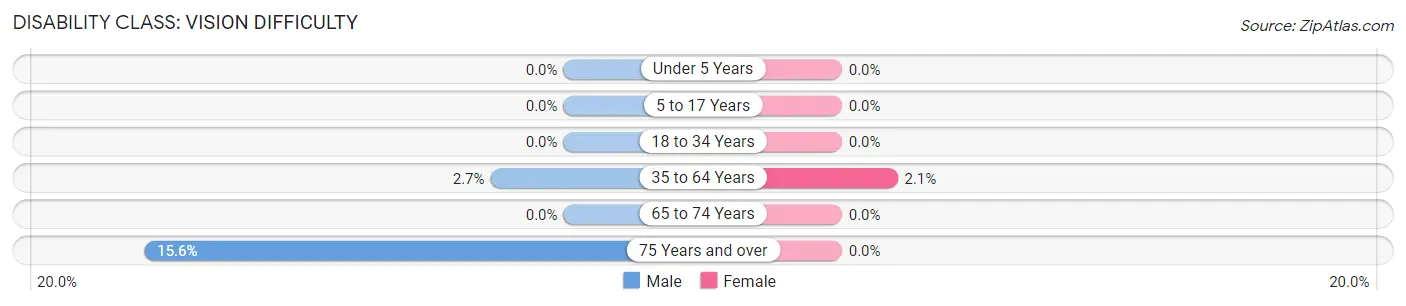
| Age Bracket | Male | Female |
| Under 5 Years | 0 (0.0%) | 0 (0.0%) |
| 5 to 17 Years | 0 (0.0%) | 0 (0.0%) |
| 18 to 34 Years | 0 (0.0%) | 0 (0.0%) |
| 35 to 64 Years | 18 (2.7%) | 18 (2.1%) |
| 65 to 74 Years | 0 (0.0%) | 0 (0.0%) |
| 75 Years and over | 7 (15.6%) | 0 (0.0%) |
Disability Class: Cognitive Difficulty
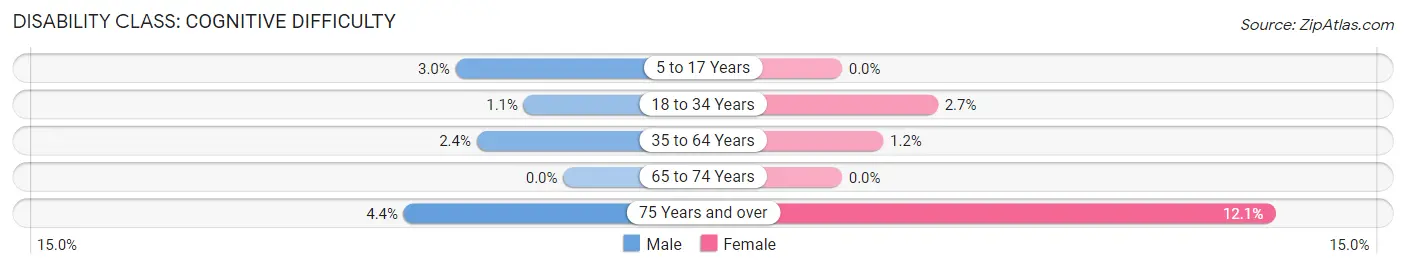
| Age Bracket | Male | Female |
| 5 to 17 Years | 10 (3.0%) | 0 (0.0%) |
| 18 to 34 Years | 9 (1.1%) | 14 (2.7%) |
| 35 to 64 Years | 16 (2.4%) | 10 (1.1%) |
| 65 to 74 Years | 0 (0.0%) | 0 (0.0%) |
| 75 Years and over | 2 (4.4%) | 17 (12.1%) |
Disability Class: Ambulatory Difficulty
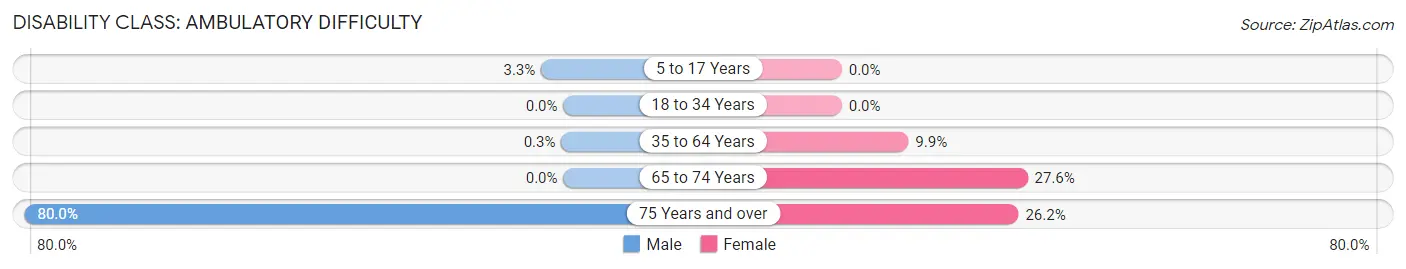
| Age Bracket | Male | Female |
| 5 to 17 Years | 11 (3.3%) | 0 (0.0%) |
| 18 to 34 Years | 0 (0.0%) | 0 (0.0%) |
| 35 to 64 Years | 2 (0.3%) | 86 (9.9%) |
| 65 to 74 Years | 0 (0.0%) | 32 (27.6%) |
| 75 Years and over | 36 (80.0%) | 37 (26.2%) |
Disability Class: Self-Care Difficulty
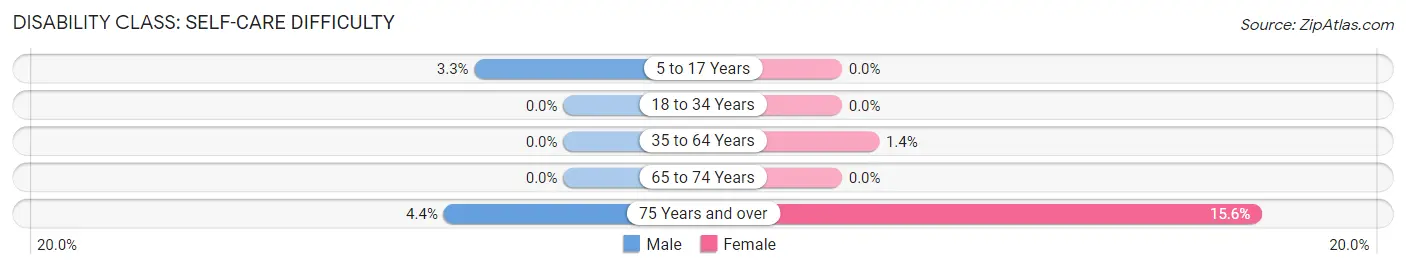
| Age Bracket | Male | Female |
| 5 to 17 Years | 11 (3.3%) | 0 (0.0%) |
| 18 to 34 Years | 0 (0.0%) | 0 (0.0%) |
| 35 to 64 Years | 0 (0.0%) | 12 (1.4%) |
| 65 to 74 Years | 0 (0.0%) | 0 (0.0%) |
| 75 Years and over | 2 (4.4%) | 22 (15.6%) |
Technology Access in Haughton
Computing Device Access in Haughton
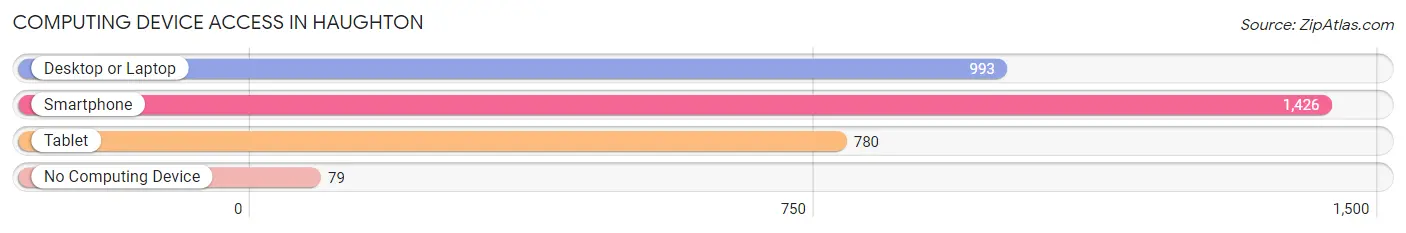
| Device Type | # Households | % Households |
| Desktop or Laptop | 993 | 64.7% |
| Smartphone | 1,426 | 92.9% |
| Tablet | 780 | 50.8% |
| No Computing Device | 79 | 5.1% |
| Total | 1,535 | 100.0% |
Internet Access in Haughton
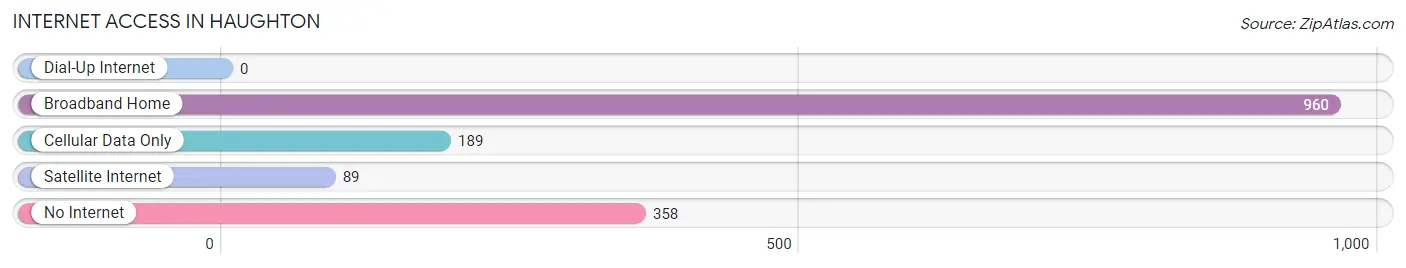
| Internet Type | # Households | % Households |
| Dial-Up Internet | 0 | 0.0% |
| Broadband Home | 960 | 62.5% |
| Cellular Data Only | 189 | 12.3% |
| Satellite Internet | 89 | 5.8% |
| No Internet | 358 | 23.3% |
| Total | 1,535 | 100.0% |
Haughton Summary
Haughton is a town located in Bossier Parish, Louisiana. It is located about 15 miles northwest of Shreveport, the parish seat. The population of Haughton was estimated to be 3,454 in 2019.
History
Haughton was founded in 1884 by William H. Haughton, a former Confederate soldier. The town was originally known as Haughton Station, as it was a stop on the Texas and Pacific Railway. The town was incorporated in 1908.
Geography
Haughton is located in the northwest corner of Bossier Parish, Louisiana. It is situated at the intersection of Interstate 20 and Louisiana Highway 157. The town is located about 15 miles northwest of Shreveport, the parish seat. The town is located in a rural area, with the nearest large city being Shreveport.
The town has a total area of 4.2 square miles, all of which is land. The town is located in a humid subtropical climate zone, with hot, humid summers and mild winters.
Economy
The economy of Haughton is largely based on agriculture and manufacturing. The town is home to several large manufacturing plants, including a paper mill, a steel mill, and a plastics plant. The town is also home to several small businesses, including restaurants, retail stores, and service providers.
The town is also home to several large employers, including the Haughton School District, the Bossier Parish Sheriff's Office, and the Haughton Fire Department.
Demographics
As of the 2019 census, the population of Haughton was estimated to be 3,454. The racial makeup of the town was 79.2% White, 17.2% African American, 0.7% Native American, 0.7% Asian, 0.2% Pacific Islander, and 1.9% from other races. Hispanic or Latino of any race were 2.3% of the population.
The median household income in Haughton was $45,938, and the median family income was $54,938. The per capita income for the town was $20,938. About 11.2% of families and 14.2% of the population were below the poverty line, including 19.2% of those under age 18 and 8.2% of those age 65 or over.
Common Questions
What is Per Capita Income in Haughton?
Per Capita income in Haughton is $31,763.
What is the Median Family Income in Haughton?
Median Family Income in Haughton is $67,995.
What is the Median Household income in Haughton?
Median Household Income in Haughton is $46,567.
What is Income or Wage Gap in Haughton?
Income or Wage Gap in Haughton is 50.3%.
Women in Haughton earn 49.7 cents for every dollar earned by a man.
What is Inequality or Gini Index in Haughton?
Inequality or Gini Index in Haughton is 0.50.
What is the Total Population of Haughton?
Total Population of Haughton is 4,450.
What is the Total Male Population of Haughton?
Total Male Population of Haughton is 2,210.
What is the Total Female Population of Haughton?
Total Female Population of Haughton is 2,240.
What is the Ratio of Males per 100 Females in Haughton?
There are 98.66 Males per 100 Females in Haughton.
What is the Ratio of Females per 100 Males in Haughton?
There are 101.36 Females per 100 Males in Haughton.
What is the Median Population Age in Haughton?
Median Population Age in Haughton is 31.6 Years.
What is the Average Family Size in Haughton
Average Family Size in Haughton is 3.6 People.
What is the Average Household Size in Haughton
Average Household Size in Haughton is 2.9 People.
How Large is the Labor Force in Haughton?
There are 2,470 People in the Labor Forcein in Haughton.
What is the Percentage of People in the Labor Force in Haughton?
70.2% of People are in the Labor Force in Haughton.
What is the Unemployment Rate in Haughton?
Unemployment Rate in Haughton is 5.6%.