Doctor Phillips, FL Map & Demographics
Doctor Phillips Map
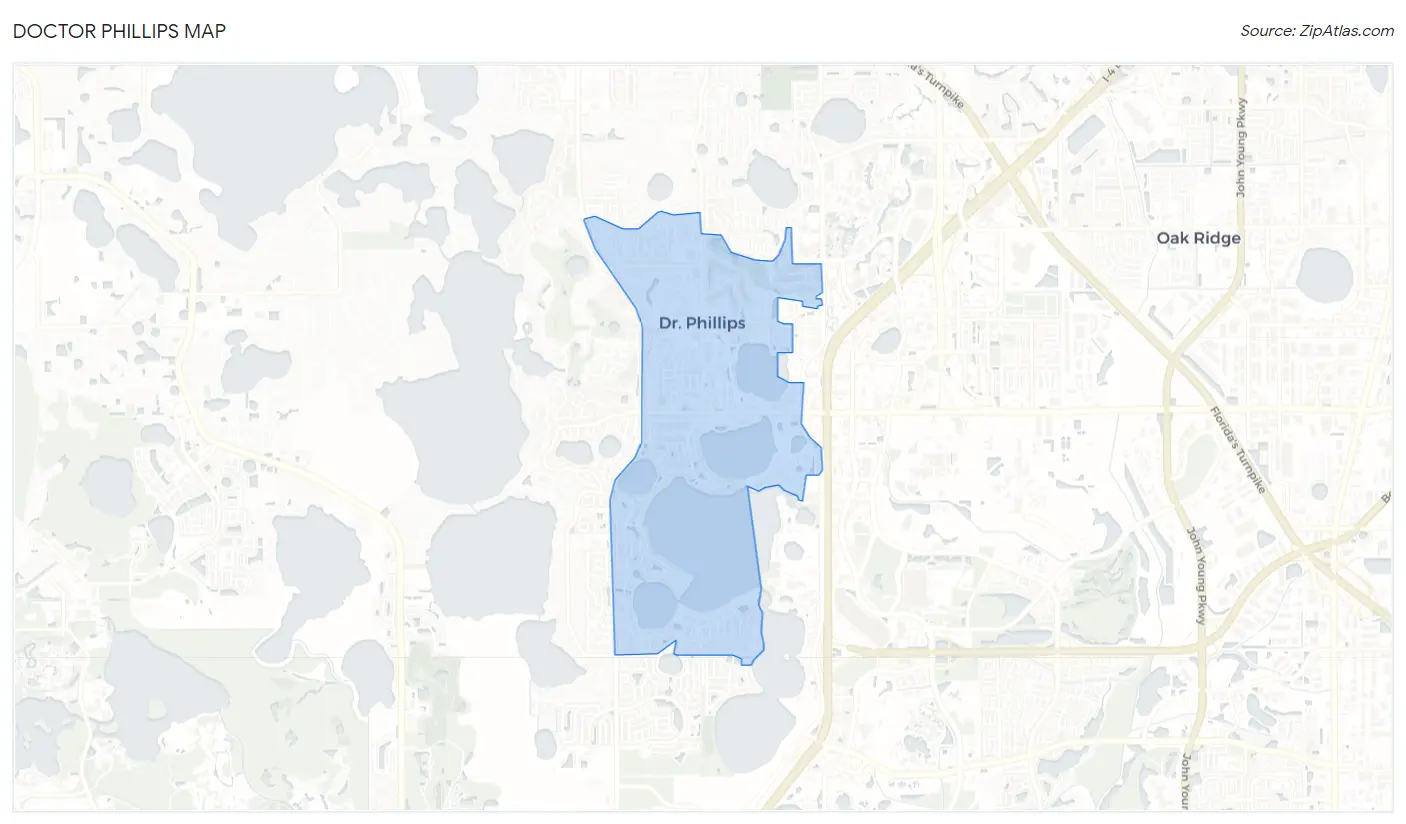
Doctor Phillips Overview
$60,047
PER CAPITA INCOME
$104,667
AVG FAMILY INCOME
$100,034
AVG HOUSEHOLD INCOME
19.6%
WAGE / INCOME GAP [ % ]
80.4¢/ $1
WAGE / INCOME GAP [ $ ]
0.52
INEQUALITY / GINI INDEX
12,278
TOTAL POPULATION
5,836
MALE POPULATION
6,442
FEMALE POPULATION
90.59
MALES / 100 FEMALES
110.38
FEMALES / 100 MALES
44.9
MEDIAN AGE
3.1
AVG FAMILY SIZE
2.6
AVG HOUSEHOLD SIZE
6,380
LABOR FORCE [ PEOPLE ]
59.4%
PERCENT IN LABOR FORCE
11.3%
UNEMPLOYMENT RATE
Income in Doctor Phillips
Income Overview in Doctor Phillips
Per Capita Income in Doctor Phillips is $60,047, while median incomes of families and households are $104,667 and $100,034 respectively.
| Characteristic | Number | Measure |
| Per Capita Income | 12,278 | $60,047 |
| Median Family Income | 3,270 | $104,667 |
| Mean Family Income | 3,270 | $167,866 |
| Median Household Income | 4,742 | $100,034 |
| Mean Household Income | 4,742 | $150,931 |
| Income Deficit | 3,270 | $0 |
| Wage / Income Gap (%) | 12,278 | 19.62% |
| Wage / Income Gap ($) | 12,278 | 80.38¢ per $1 |
| Gini / Inequality Index | 12,278 | 0.52 |
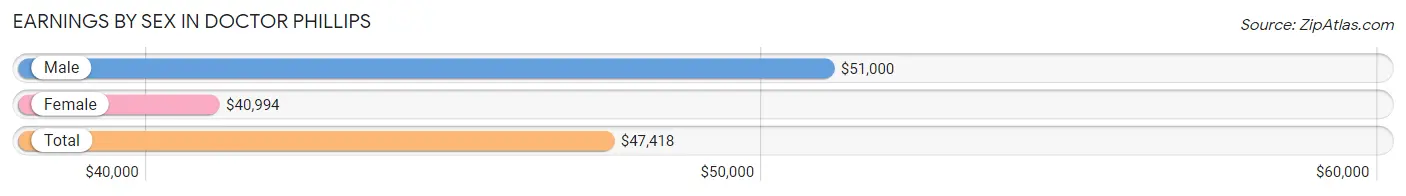
Earnings by Sex in Doctor Phillips
Average Earnings in Doctor Phillips are $47,418, $51,000 for men and $40,994 for women, a difference of 19.6%.
| Sex | Number | Average Earnings |
| Male | 3,630 (58.9%) | $51,000 |
| Female | 2,532 (41.1%) | $40,994 |
| Total | 6,162 (100.0%) | $47,418 |
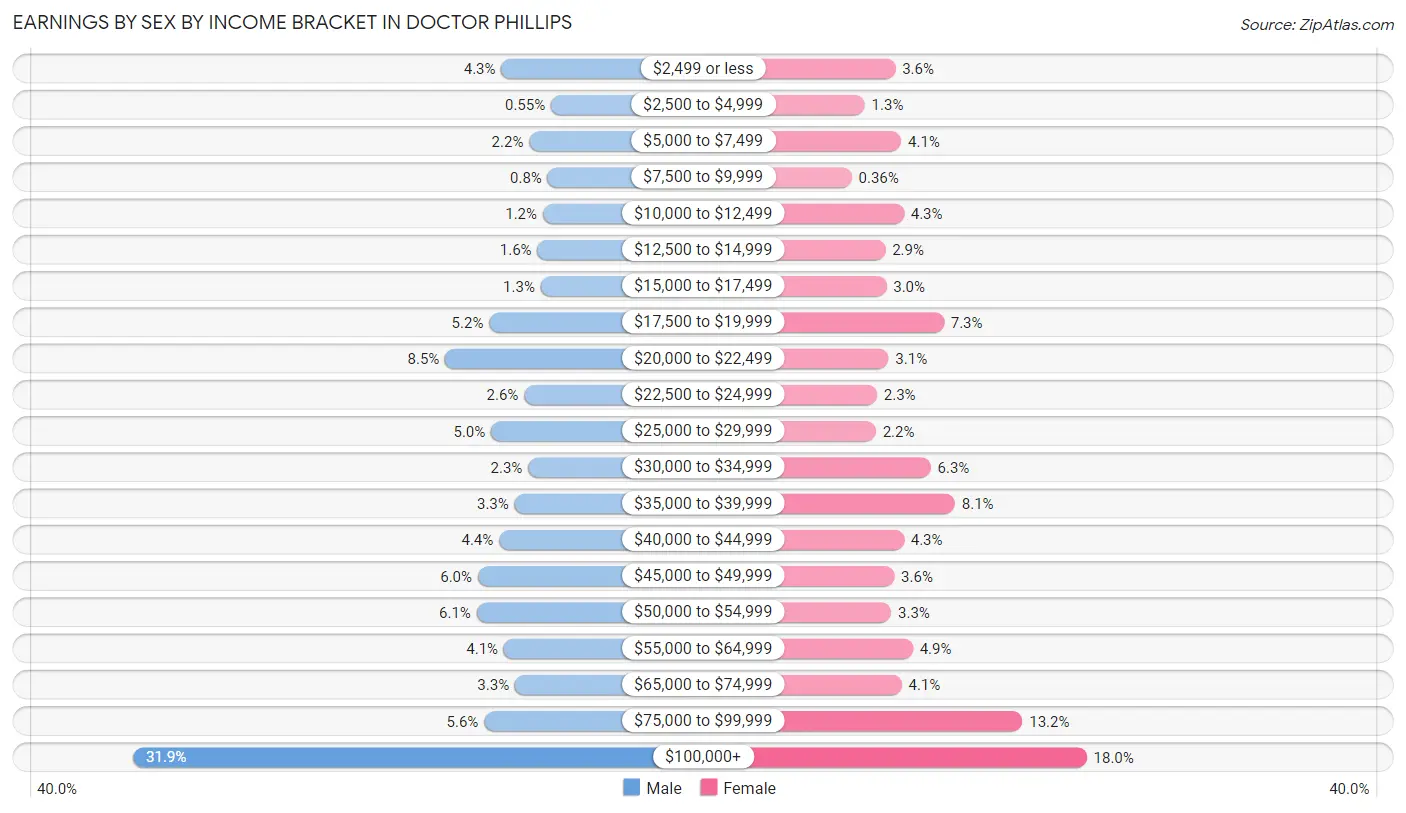
Earnings by Sex by Income Bracket in Doctor Phillips
The most common earnings brackets in Doctor Phillips are $100,000+ for men (1,157 | 31.9%) and $100,000+ for women (455 | 18.0%).
| Income | Male | Female |
| $2,499 or less | 155 (4.3%) | 92 (3.6%) |
| $2,500 to $4,999 | 20 (0.5%) | 34 (1.3%) |
| $5,000 to $7,499 | 79 (2.2%) | 103 (4.1%) |
| $7,500 to $9,999 | 29 (0.8%) | 9 (0.4%) |
| $10,000 to $12,499 | 42 (1.2%) | 108 (4.3%) |
| $12,500 to $14,999 | 57 (1.6%) | 73 (2.9%) |
| $15,000 to $17,499 | 48 (1.3%) | 75 (3.0%) |
| $17,500 to $19,999 | 188 (5.2%) | 184 (7.3%) |
| $20,000 to $22,499 | 308 (8.5%) | 79 (3.1%) |
| $22,500 to $24,999 | 93 (2.6%) | 57 (2.2%) |
| $25,000 to $29,999 | 183 (5.0%) | 55 (2.2%) |
| $30,000 to $34,999 | 82 (2.3%) | 159 (6.3%) |
| $35,000 to $39,999 | 119 (3.3%) | 205 (8.1%) |
| $40,000 to $44,999 | 161 (4.4%) | 108 (4.3%) |
| $45,000 to $49,999 | 219 (6.0%) | 90 (3.5%) |
| $50,000 to $54,999 | 222 (6.1%) | 84 (3.3%) |
| $55,000 to $64,999 | 148 (4.1%) | 125 (4.9%) |
| $65,000 to $74,999 | 118 (3.3%) | 104 (4.1%) |
| $75,000 to $99,999 | 202 (5.6%) | 333 (13.2%) |
| $100,000+ | 1,157 (31.9%) | 455 (18.0%) |
| Total | 3,630 (100.0%) | 2,532 (100.0%) |
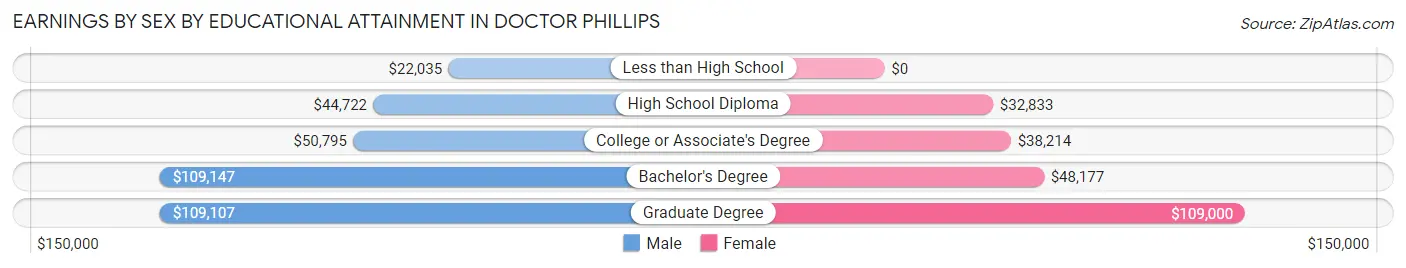
Earnings by Sex by Educational Attainment in Doctor Phillips
Average earnings in Doctor Phillips are $61,310 for men and $45,928 for women, a difference of 25.1%. Men with an educational attainment of bachelor's degree enjoy the highest average annual earnings of $109,147, while those with less than high school education earn the least with $22,035. Women with an educational attainment of graduate degree earn the most with the average annual earnings of $109,000, while those with high school diploma education have the smallest earnings of $32,833.
| Educational Attainment | Male Income | Female Income |
| Less than High School | $22,035 | $0 |
| High School Diploma | $44,722 | $32,833 |
| College or Associate's Degree | $50,795 | $38,214 |
| Bachelor's Degree | $109,147 | $48,177 |
| Graduate Degree | $109,107 | $109,000 |
| Total | $61,310 | $45,928 |
Family Income in Doctor Phillips
Family Income Brackets in Doctor Phillips
According to the Doctor Phillips family income data, there are 762 families falling into the $100,000 to $149,999 income range, which is the most common income bracket and makes up 23.3% of all families. Conversely, the $10,000 to $14,999 income bracket is the least frequent group with only 36 families (1.1%) belonging to this category.
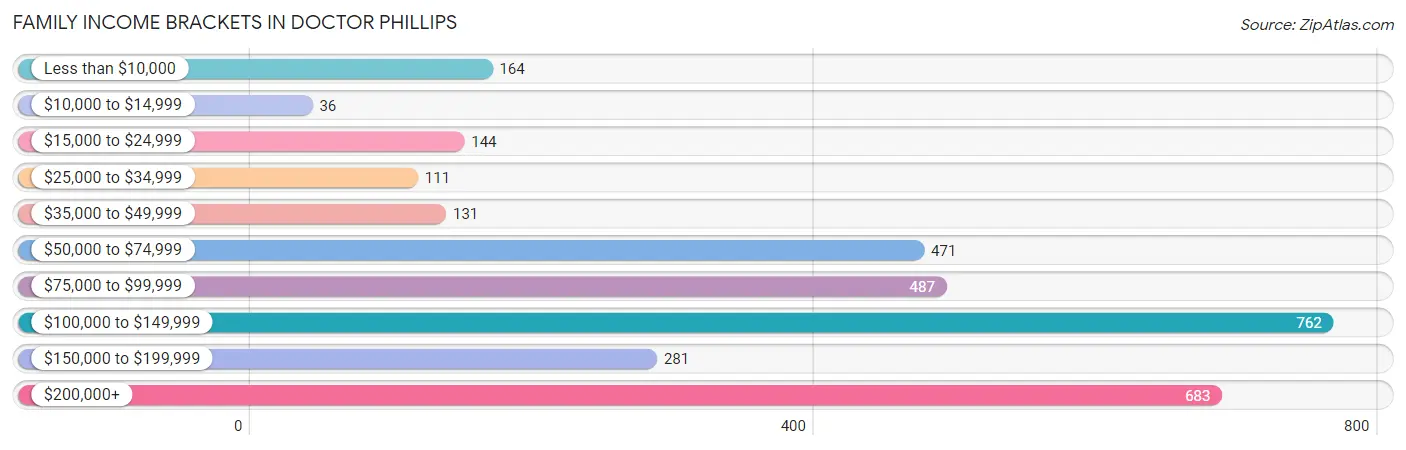
| Income Bracket | # Families | % Families |
| Less than $10,000 | 164 | 5.0% |
| $10,000 to $14,999 | 36 | 1.1% |
| $15,000 to $24,999 | 144 | 4.4% |
| $25,000 to $34,999 | 111 | 3.4% |
| $35,000 to $49,999 | 131 | 4.0% |
| $50,000 to $74,999 | 471 | 14.4% |
| $75,000 to $99,999 | 487 | 14.9% |
| $100,000 to $149,999 | 762 | 23.3% |
| $150,000 to $199,999 | 281 | 8.6% |
| $200,000+ | 683 | 20.9% |
Family Income by Famaliy Size in Doctor Phillips
4-person families (428 | 13.1%) account for the highest median family income in Doctor Phillips with $135,926 per family, while 2-person families (1,681 | 51.4%) have the highest median income of $48,464 per family member.
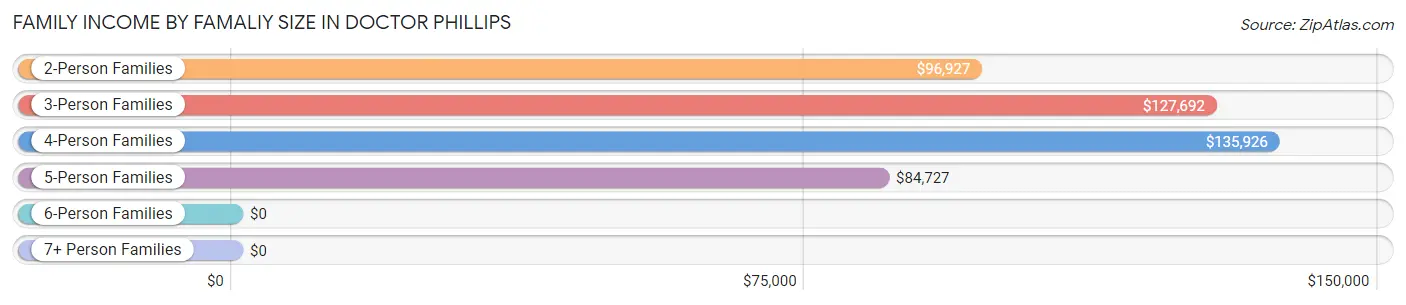
| Income Bracket | # Families | Median Income |
| 2-Person Families | 1,681 (51.4%) | $96,927 |
| 3-Person Families | 832 (25.4%) | $127,692 |
| 4-Person Families | 428 (13.1%) | $135,926 |
| 5-Person Families | 294 (9.0%) | $84,727 |
| 6-Person Families | 35 (1.1%) | $0 |
| 7+ Person Families | 0 (0.0%) | $0 |
| Total | 3,270 (100.0%) | $104,667 |
Family Income by Number of Earners in Doctor Phillips
The median family income in Doctor Phillips is $104,667, with families comprising 2 earners (1,123) having the highest median family income of $153,839, while families with no earners (725) have the lowest median family income of $64,280, accounting for 34.3% and 22.2% of families, respectively.
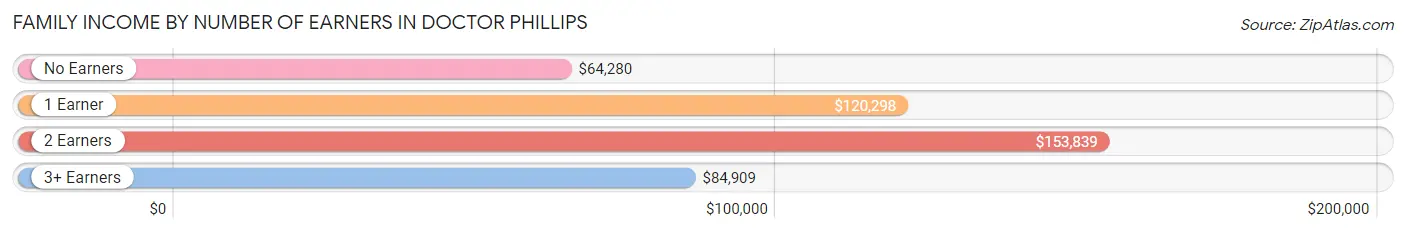
| Number of Earners | # Families | Median Income |
| No Earners | 725 (22.2%) | $64,280 |
| 1 Earner | 1,098 (33.6%) | $120,298 |
| 2 Earners | 1,123 (34.3%) | $153,839 |
| 3+ Earners | 324 (9.9%) | $84,909 |
| Total | 3,270 (100.0%) | $104,667 |
Household Income in Doctor Phillips
Household Income Brackets in Doctor Phillips
With 1,048 households falling in the category, the $100,000 to $149,999 income range is the most frequent in Doctor Phillips, accounting for 22.1% of all households. In contrast, only 76 households (1.6%) fall into the $10,000 to $14,999 income bracket, making it the least populous group.
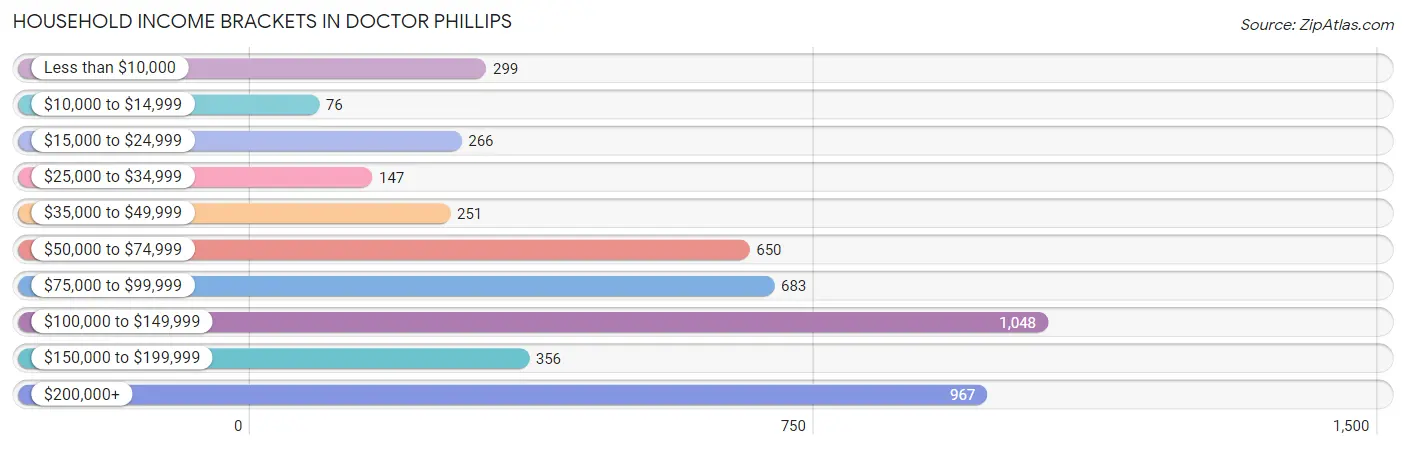
| Income Bracket | # Households | % Households |
| Less than $10,000 | 299 | 6.3% |
| $10,000 to $14,999 | 76 | 1.6% |
| $15,000 to $24,999 | 266 | 5.6% |
| $25,000 to $34,999 | 147 | 3.1% |
| $35,000 to $49,999 | 251 | 5.3% |
| $50,000 to $74,999 | 650 | 13.7% |
| $75,000 to $99,999 | 683 | 14.4% |
| $100,000 to $149,999 | 1,048 | 22.1% |
| $150,000 to $199,999 | 356 | 7.5% |
| $200,000+ | 967 | 20.4% |
Household Income by Householder Age in Doctor Phillips
The median household income in Doctor Phillips is $100,034, with the highest median household income of $124,659 found in the 45 to 64 years age bracket for the primary householder. A total of 1,615 households (34.1%) fall into this category. Meanwhile, the 65+ years age bracket for the primary householder has the lowest median household income of $80,061, with 1,642 households (34.6%) in this group.
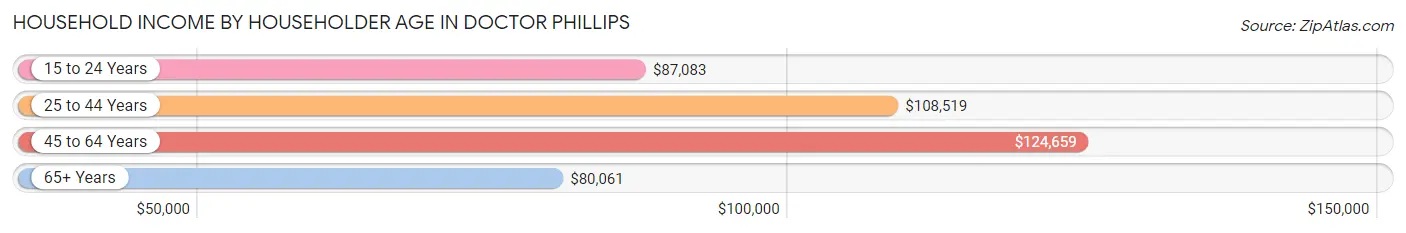
| Income Bracket | # Households | Median Income |
| 15 to 24 Years | 89 (1.9%) | $87,083 |
| 25 to 44 Years | 1,396 (29.4%) | $108,519 |
| 45 to 64 Years | 1,615 (34.1%) | $124,659 |
| 65+ Years | 1,642 (34.6%) | $80,061 |
| Total | 4,742 (100.0%) | $100,034 |
Poverty in Doctor Phillips
Income Below Poverty by Sex and Age in Doctor Phillips
With 8.1% poverty level for males and 12.7% for females among the residents of Doctor Phillips, 15 year old males and 16 and 17 year old females are the most vulnerable to poverty, with 26 males (41.3%) and 42 females (57.5%) in their respective age groups living below the poverty level.
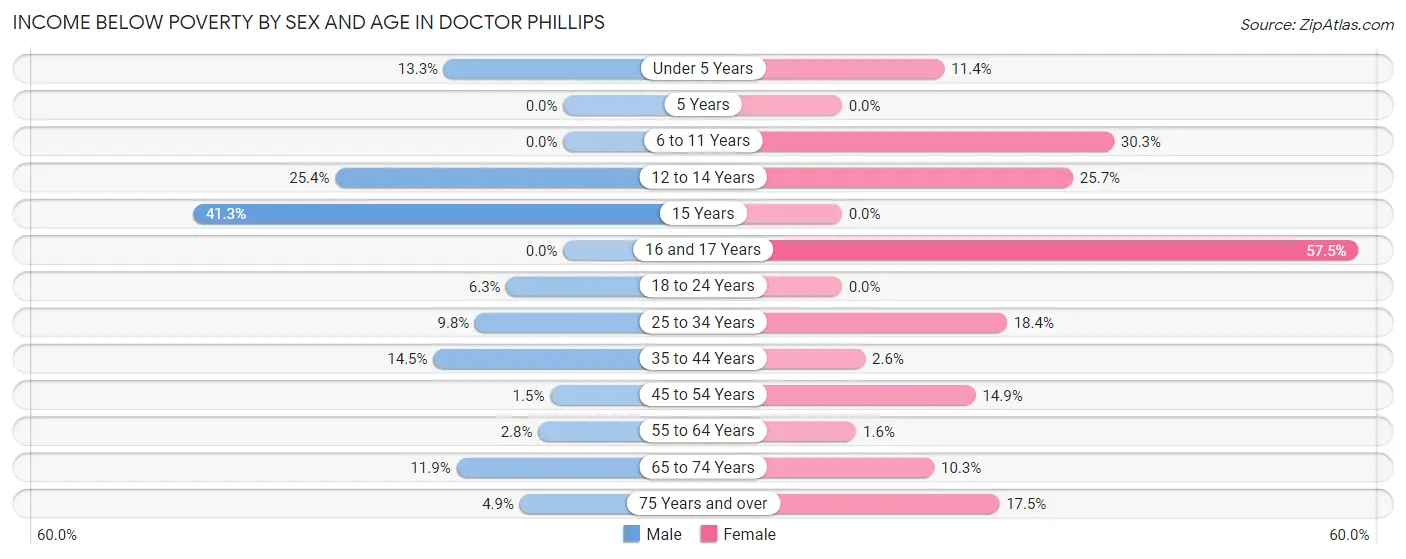
| Age Bracket | Male | Female |
| Under 5 Years | 48 (13.3%) | 8 (11.4%) |
| 5 Years | 0 (0.0%) | 0 (0.0%) |
| 6 to 11 Years | 0 (0.0%) | 160 (30.3%) |
| 12 to 14 Years | 32 (25.4%) | 26 (25.7%) |
| 15 Years | 26 (41.3%) | 0 (0.0%) |
| 16 and 17 Years | 0 (0.0%) | 42 (57.5%) |
| 18 to 24 Years | 41 (6.3%) | 0 (0.0%) |
| 25 to 34 Years | 54 (9.8%) | 248 (18.4%) |
| 35 to 44 Years | 117 (14.5%) | 22 (2.6%) |
| 45 to 54 Years | 10 (1.5%) | 91 (14.9%) |
| 55 to 64 Years | 27 (2.8%) | 16 (1.6%) |
| 65 to 74 Years | 89 (11.9%) | 85 (10.3%) |
| 75 Years and over | 28 (4.9%) | 112 (17.5%) |
| Total | 472 (8.1%) | 810 (12.7%) |
Income Above Poverty by Sex and Age in Doctor Phillips
According to the poverty statistics in Doctor Phillips, males aged 6 to 11 years and females aged 5 years are the age groups that are most secure financially, with 100.0% of males and 100.0% of females in these age groups living above the poverty line.
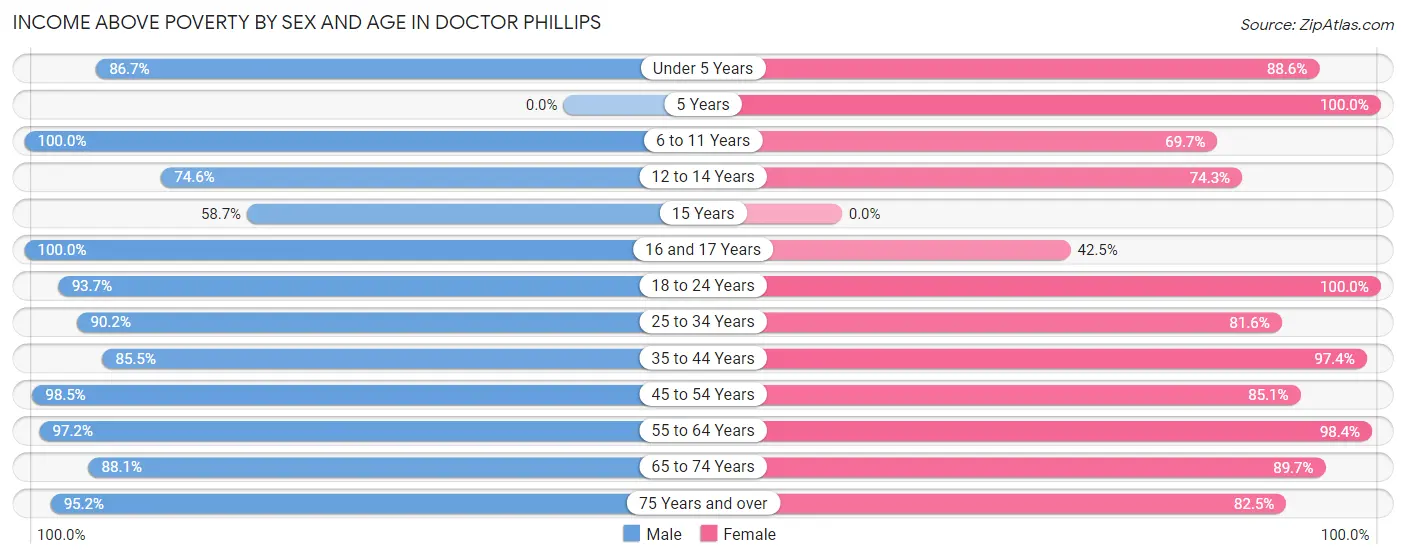
| Age Bracket | Male | Female |
| Under 5 Years | 313 (86.7%) | 62 (88.6%) |
| 5 Years | 0 (0.0%) | 27 (100.0%) |
| 6 to 11 Years | 234 (100.0%) | 368 (69.7%) |
| 12 to 14 Years | 94 (74.6%) | 75 (74.3%) |
| 15 Years | 37 (58.7%) | 0 (0.0%) |
| 16 and 17 Years | 61 (100.0%) | 31 (42.5%) |
| 18 to 24 Years | 606 (93.7%) | 286 (100.0%) |
| 25 to 34 Years | 496 (90.2%) | 1,102 (81.6%) |
| 35 to 44 Years | 691 (85.5%) | 824 (97.4%) |
| 45 to 54 Years | 676 (98.5%) | 520 (85.1%) |
| 55 to 64 Years | 941 (97.2%) | 986 (98.4%) |
| 65 to 74 Years | 659 (88.1%) | 743 (89.7%) |
| 75 Years and over | 549 (95.2%) | 527 (82.5%) |
| Total | 5,357 (91.9%) | 5,551 (87.3%) |
Income Below Poverty Among Married-Couple Families in Doctor Phillips
The poverty statistics for married-couple families in Doctor Phillips show that 7.1% or 191 of the total 2,671 families live below the poverty line. Families with 1 or 2 children have the highest poverty rate of 11.6%, comprising of 74 families. On the other hand, families with 3 or 4 children have the lowest poverty rate of 0.0%, which includes 0 families.
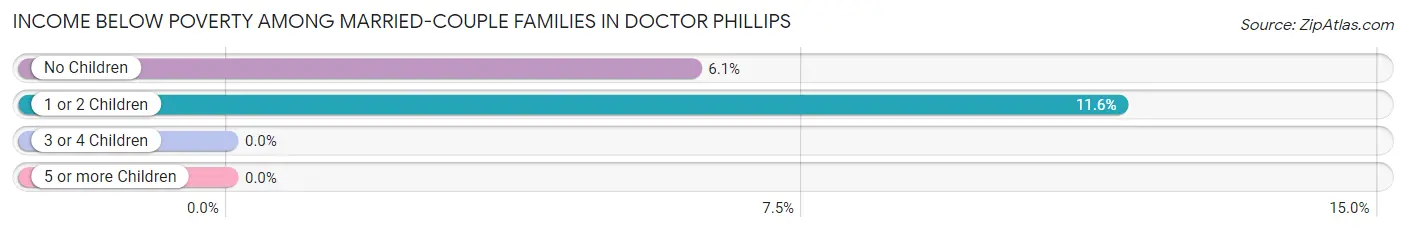
| Children | Above Poverty | Below Poverty |
| No Children | 1,818 (94.0%) | 117 (6.0%) |
| 1 or 2 Children | 563 (88.4%) | 74 (11.6%) |
| 3 or 4 Children | 99 (100.0%) | 0 (0.0%) |
| 5 or more Children | 0 (0.0%) | 0 (0.0%) |
| Total | 2,480 (92.8%) | 191 (7.1%) |
Income Below Poverty Among Single-Parent Households in Doctor Phillips
According to the poverty data in Doctor Phillips, 29.0% or 53 single-father households and 23.3% or 97 single-mother households are living below the poverty line. Among single-father households, those with 1 or 2 children have the highest poverty rate, with 45 households (100.0%) experiencing poverty. Likewise, among single-mother households, those with 1 or 2 children have the highest poverty rate, with 82 households (43.4%) falling below the poverty line.
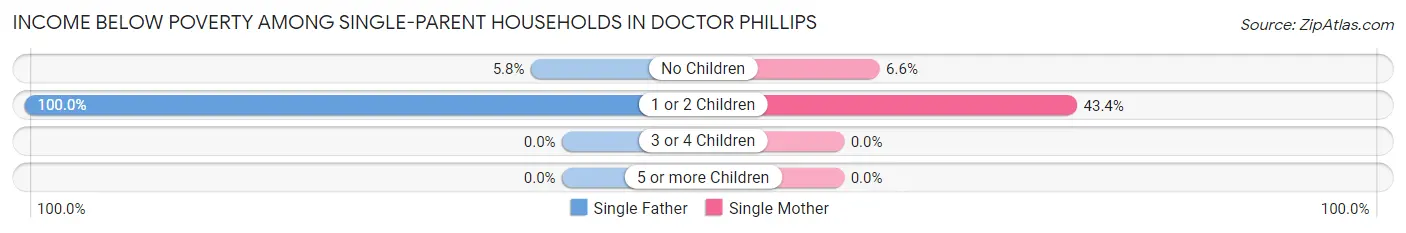
| Children | Single Father | Single Mother |
| No Children | 8 (5.8%) | 15 (6.6%) |
| 1 or 2 Children | 45 (100.0%) | 82 (43.4%) |
| 3 or 4 Children | 0 (0.0%) | 0 (0.0%) |
| 5 or more Children | 0 (0.0%) | 0 (0.0%) |
| Total | 53 (29.0%) | 97 (23.3%) |
Income Below Poverty Among Married-Couple vs Single-Parent Households in Doctor Phillips
The poverty data for Doctor Phillips shows that 191 of the married-couple family households (7.1%) and 150 of the single-parent households (25.0%) are living below the poverty level. Within the married-couple family households, those with 1 or 2 children have the highest poverty rate, with 74 households (11.6%) falling below the poverty line. Among the single-parent households, those with 1 or 2 children have the highest poverty rate, with 127 household (54.3%) living below poverty.
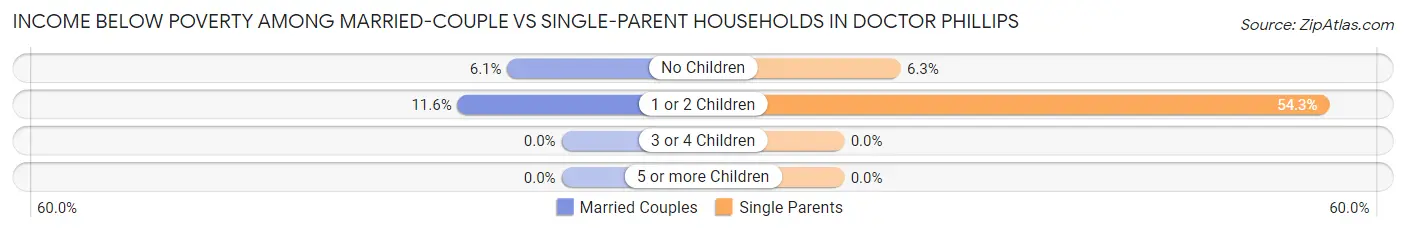
| Children | Married-Couple Families | Single-Parent Households |
| No Children | 117 (6.0%) | 23 (6.3%) |
| 1 or 2 Children | 74 (11.6%) | 127 (54.3%) |
| 3 or 4 Children | 0 (0.0%) | 0 (0.0%) |
| 5 or more Children | 0 (0.0%) | 0 (0.0%) |
| Total | 191 (7.1%) | 150 (25.0%) |
Race in Doctor Phillips
The most populous races in Doctor Phillips are White / Caucasian (7,832 | 63.8%), Hispanic or Latino (1,455 | 11.8%), and Asian (1,432 | 11.7%).
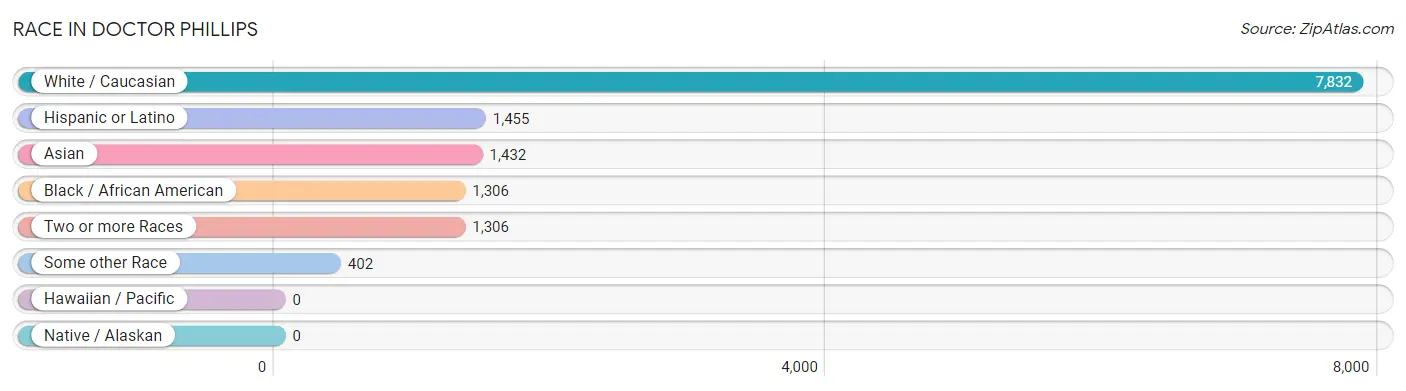
| Race | # Population | % Population |
| Asian | 1,432 | 11.7% |
| Black / African American | 1,306 | 10.6% |
| Hawaiian / Pacific | 0 | 0.0% |
| Hispanic or Latino | 1,455 | 11.8% |
| Native / Alaskan | 0 | 0.0% |
| White / Caucasian | 7,832 | 63.8% |
| Two or more Races | 1,306 | 10.6% |
| Some other Race | 402 | 3.3% |
| Total | 12,278 | 100.0% |
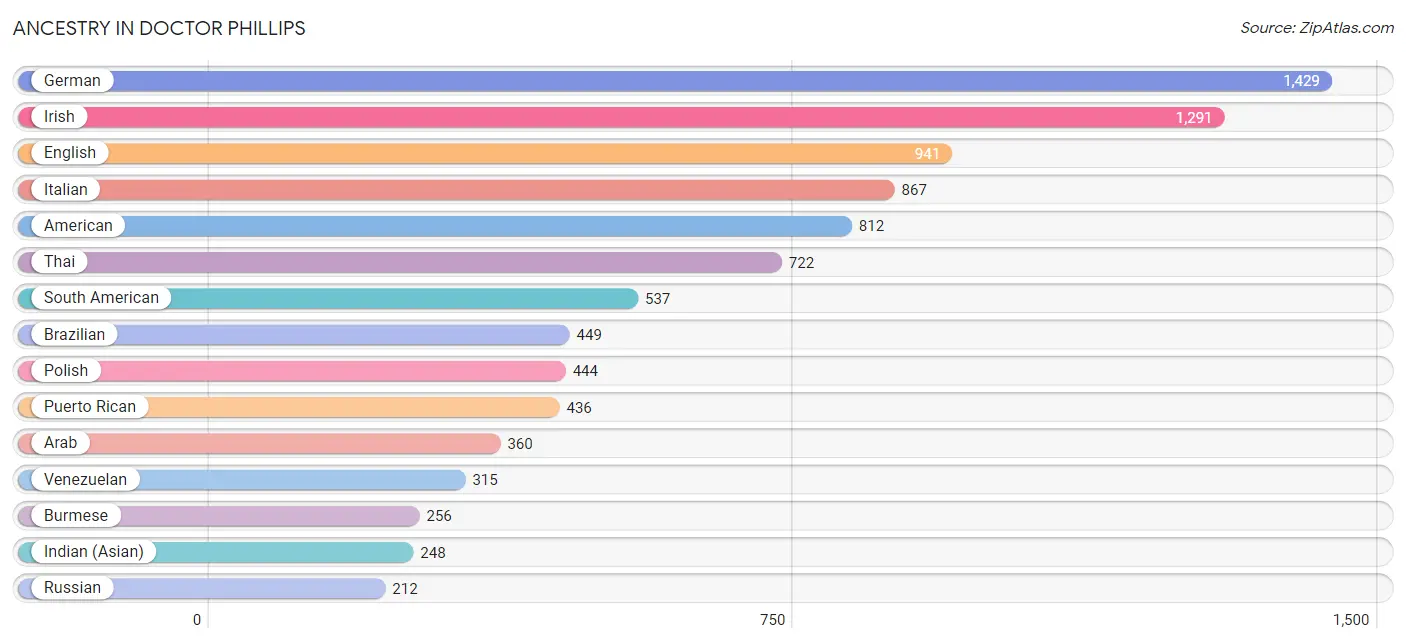
Ancestry in Doctor Phillips
The most populous ancestries reported in Doctor Phillips are German (1,429 | 11.6%), Irish (1,291 | 10.5%), English (941 | 7.7%), Italian (867 | 7.1%), and American (812 | 6.6%), together accounting for 43.5% of all Doctor Phillips residents.
| Ancestry | # Population | % Population |
| Albanian | 6 | 0.1% |
| American | 812 | 6.6% |
| Arab | 360 | 2.9% |
| Argentinean | 117 | 0.9% |
| Austrian | 111 | 0.9% |
| Bahamian | 16 | 0.1% |
| Bhutanese | 92 | 0.7% |
| Brazilian | 449 | 3.7% |
| British | 149 | 1.2% |
| Bulgarian | 41 | 0.3% |
| Burmese | 256 | 2.1% |
| Canadian | 74 | 0.6% |
| Central American | 38 | 0.3% |
| Cherokee | 5 | 0.0% |
| Chilean | 16 | 0.1% |
| Colombian | 41 | 0.3% |
| Cuban | 148 | 1.2% |
| Czech | 6 | 0.1% |
| Danish | 52 | 0.4% |
| Dominican | 38 | 0.3% |
| Dutch | 100 | 0.8% |
| Eastern European | 75 | 0.6% |
| Ecuadorian | 23 | 0.2% |
| English | 941 | 7.7% |
| European | 125 | 1.0% |
| Filipino | 29 | 0.2% |
| French | 157 | 1.3% |
| French Canadian | 16 | 0.1% |
| German | 1,429 | 11.6% |
| Greek | 57 | 0.5% |
| Honduran | 38 | 0.3% |
| Hungarian | 60 | 0.5% |
| Indian (Asian) | 248 | 2.0% |
| Iranian | 13 | 0.1% |
| Irish | 1,291 | 10.5% |
| Israeli | 55 | 0.4% |
| Italian | 867 | 7.1% |
| Korean | 174 | 1.4% |
| Latvian | 15 | 0.1% |
| Lebanese | 39 | 0.3% |
| Lithuanian | 38 | 0.3% |
| Malaysian | 8 | 0.1% |
| Mexican | 110 | 0.9% |
| Mexican American Indian | 17 | 0.1% |
| Moroccan | 21 | 0.2% |
| Northern European | 11 | 0.1% |
| Norwegian | 205 | 1.7% |
| Pakistani | 17 | 0.1% |
| Peruvian | 25 | 0.2% |
| Polish | 444 | 3.6% |
| Portuguese | 195 | 1.6% |
| Puerto Rican | 436 | 3.5% |
| Romanian | 15 | 0.1% |
| Russian | 212 | 1.7% |
| Scandinavian | 17 | 0.1% |
| Scotch-Irish | 29 | 0.2% |
| Scottish | 122 | 1.0% |
| Serbian | 41 | 0.3% |
| South American | 537 | 4.4% |
| Spaniard | 51 | 0.4% |
| Spanish | 10 | 0.1% |
| Sri Lankan | 15 | 0.1% |
| Swedish | 102 | 0.8% |
| Swiss | 54 | 0.4% |
| Syrian | 203 | 1.7% |
| Thai | 722 | 5.9% |
| Turkish | 13 | 0.1% |
| Ukrainian | 16 | 0.1% |
| Venezuelan | 315 | 2.6% |
| Welsh | 9 | 0.1% | View All 70 Rows |
Immigrants in Doctor Phillips
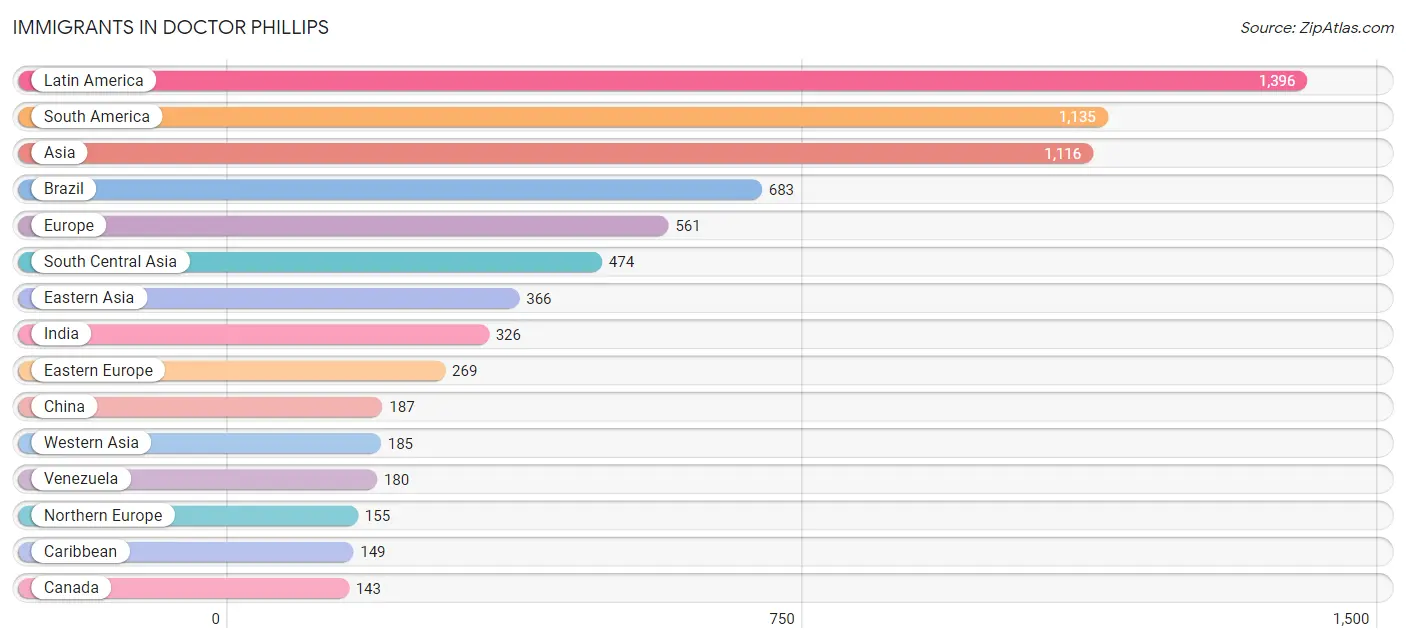
The most numerous immigrant groups reported in Doctor Phillips came from Latin America (1,396 | 11.4%), South America (1,135 | 9.2%), Asia (1,116 | 9.1%), Brazil (683 | 5.6%), and Europe (561 | 4.6%), together accounting for 39.8% of all Doctor Phillips residents.
| Immigration Origin | # Population | % Population |
| Africa | 91 | 0.7% |
| Albania | 6 | 0.1% |
| Argentina | 97 | 0.8% |
| Asia | 1,116 | 9.1% |
| Bahamas | 16 | 0.1% |
| Bangladesh | 73 | 0.6% |
| Brazil | 683 | 5.6% |
| Bulgaria | 22 | 0.2% |
| Canada | 143 | 1.2% |
| Caribbean | 149 | 1.2% |
| Central America | 112 | 0.9% |
| Chile | 16 | 0.1% |
| China | 187 | 1.5% |
| Colombia | 41 | 0.3% |
| Cuba | 79 | 0.6% |
| Dominican Republic | 25 | 0.2% |
| Eastern Africa | 70 | 0.6% |
| Eastern Asia | 366 | 3.0% |
| Eastern Europe | 269 | 2.2% |
| Ecuador | 28 | 0.2% |
| England | 49 | 0.4% |
| Europe | 561 | 4.6% |
| France | 26 | 0.2% |
| Germany | 14 | 0.1% |
| Greece | 43 | 0.4% |
| Guyana | 65 | 0.5% |
| Honduras | 33 | 0.3% |
| India | 326 | 2.7% |
| Israel | 60 | 0.5% |
| Italy | 12 | 0.1% |
| Jamaica | 29 | 0.2% |
| Japan | 58 | 0.5% |
| Kenya | 20 | 0.2% |
| Korea | 121 | 1.0% |
| Latin America | 1,396 | 11.4% |
| Latvia | 60 | 0.5% |
| Mexico | 79 | 0.6% |
| Morocco | 21 | 0.2% |
| Northern Africa | 21 | 0.2% |
| Northern Europe | 155 | 1.3% |
| Norway | 73 | 0.6% |
| Pakistan | 75 | 0.6% |
| Peru | 25 | 0.2% |
| Philippines | 81 | 0.7% |
| Romania | 39 | 0.3% |
| Russia | 101 | 0.8% |
| Scotland | 11 | 0.1% |
| Serbia | 41 | 0.3% |
| South America | 1,135 | 9.2% |
| South Central Asia | 474 | 3.9% |
| South Eastern Asia | 91 | 0.7% |
| Southern Europe | 97 | 0.8% |
| Spain | 42 | 0.3% |
| Syria | 112 | 0.9% |
| Taiwan | 80 | 0.6% |
| Turkey | 13 | 0.1% |
| Venezuela | 180 | 1.5% |
| Vietnam | 10 | 0.1% |
| Western Asia | 185 | 1.5% |
| Western Europe | 40 | 0.3% |
| Zimbabwe | 50 | 0.4% | View All 61 Rows |
Sex and Age in Doctor Phillips
Sex and Age in Doctor Phillips
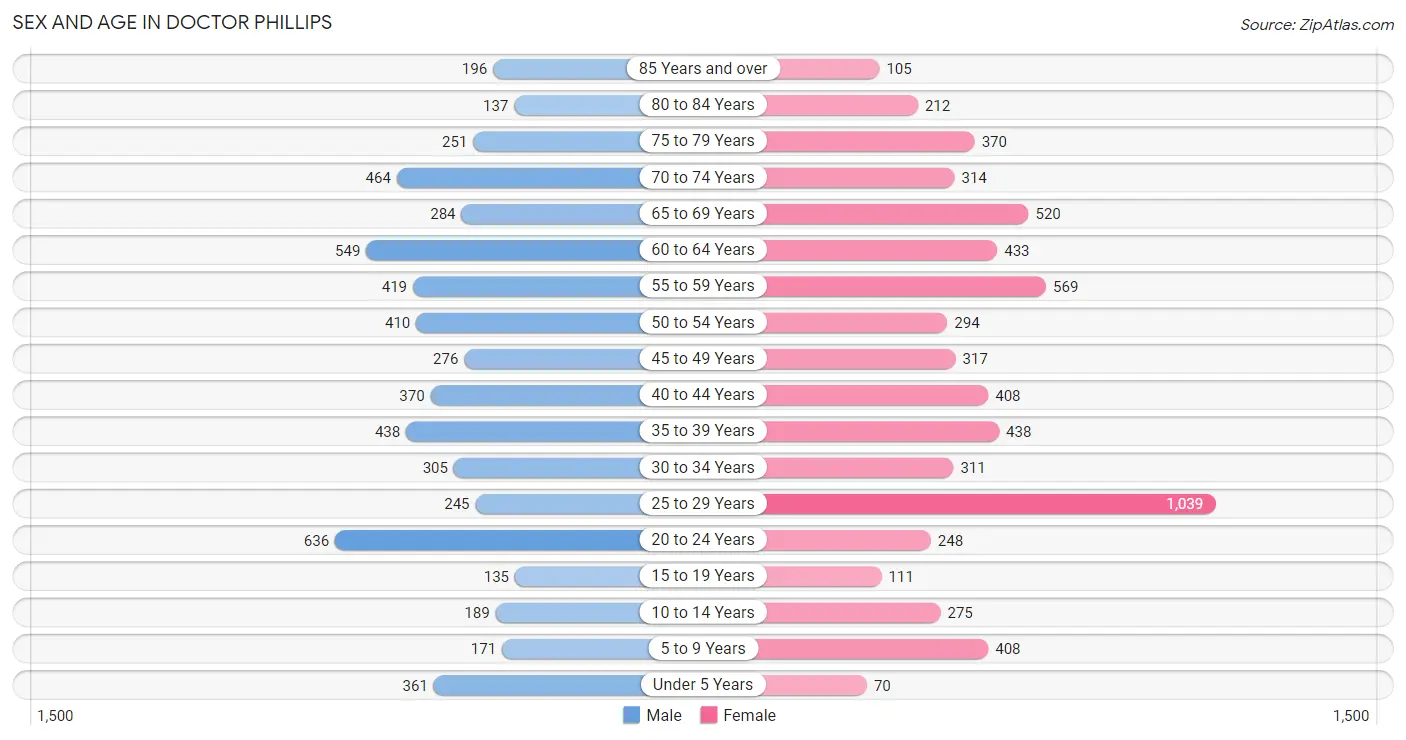
The most populous age groups in Doctor Phillips are 20 to 24 Years (636 | 10.9%) for men and 25 to 29 Years (1,039 | 16.1%) for women.
| Age Bracket | Male | Female |
| Under 5 Years | 361 (6.2%) | 70 (1.1%) |
| 5 to 9 Years | 171 (2.9%) | 408 (6.3%) |
| 10 to 14 Years | 189 (3.2%) | 275 (4.3%) |
| 15 to 19 Years | 135 (2.3%) | 111 (1.7%) |
| 20 to 24 Years | 636 (10.9%) | 248 (3.8%) |
| 25 to 29 Years | 245 (4.2%) | 1,039 (16.1%) |
| 30 to 34 Years | 305 (5.2%) | 311 (4.8%) |
| 35 to 39 Years | 438 (7.5%) | 438 (6.8%) |
| 40 to 44 Years | 370 (6.3%) | 408 (6.3%) |
| 45 to 49 Years | 276 (4.7%) | 317 (4.9%) |
| 50 to 54 Years | 410 (7.0%) | 294 (4.6%) |
| 55 to 59 Years | 419 (7.2%) | 569 (8.8%) |
| 60 to 64 Years | 549 (9.4%) | 433 (6.7%) |
| 65 to 69 Years | 284 (4.9%) | 520 (8.1%) |
| 70 to 74 Years | 464 (8.0%) | 314 (4.9%) |
| 75 to 79 Years | 251 (4.3%) | 370 (5.7%) |
| 80 to 84 Years | 137 (2.4%) | 212 (3.3%) |
| 85 Years and over | 196 (3.4%) | 105 (1.6%) |
| Total | 5,836 (100.0%) | 6,442 (100.0%) |
Families and Households in Doctor Phillips
Median Family Size in Doctor Phillips
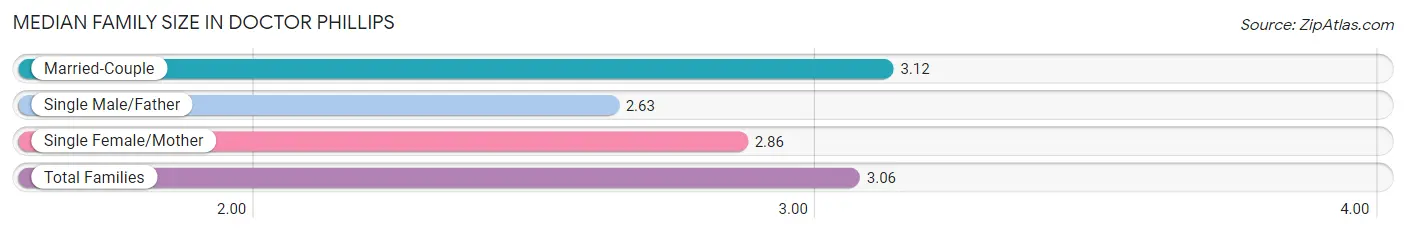
The median family size in Doctor Phillips is 3.06 persons per family, with married-couple families (2,671 | 81.7%) accounting for the largest median family size of 3.12 persons per family. On the other hand, single male/father families (183 | 5.6%) represent the smallest median family size with 2.63 persons per family.
| Family Type | # Families | Family Size |
| Married-Couple | 2,671 (81.7%) | 3.12 |
| Single Male/Father | 183 (5.6%) | 2.63 |
| Single Female/Mother | 416 (12.7%) | 2.86 |
| Total Families | 3,270 (100.0%) | 3.06 |
Median Household Size in Doctor Phillips
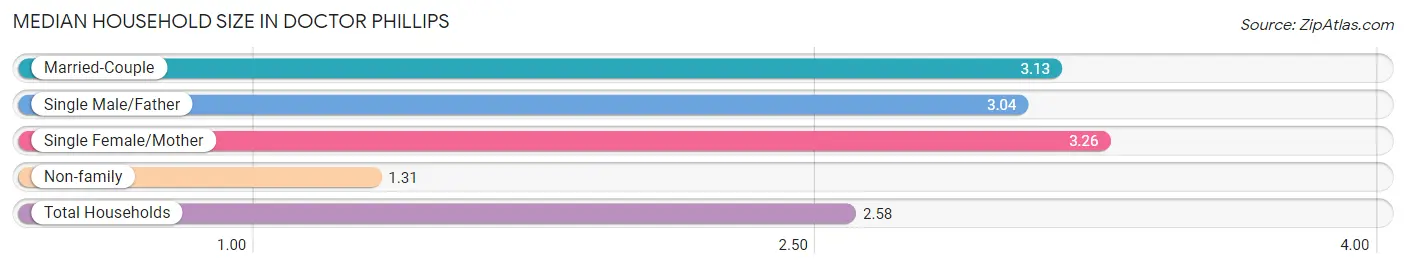
The median household size in Doctor Phillips is 2.58 persons per household, with single female/mother households (416 | 8.8%) accounting for the largest median household size of 3.26 persons per household. non-family households (1,472 | 31.0%) represent the smallest median household size with 1.31 persons per household.
| Household Type | # Households | Household Size |
| Married-Couple | 2,671 (56.3%) | 3.13 |
| Single Male/Father | 183 (3.9%) | 3.04 |
| Single Female/Mother | 416 (8.8%) | 3.26 |
| Non-family | 1,472 (31.0%) | 1.31 |
| Total Households | 4,742 (100.0%) | 2.58 |
Household Size by Marriage Status in Doctor Phillips
Out of a total of 4,742 households in Doctor Phillips, 3,270 (69.0%) are family households, while 1,472 (31.0%) are nonfamily households. The most numerous type of family households are 2-person households, comprising 1,560, and the most common type of nonfamily households are 1-person households, comprising 1,178.
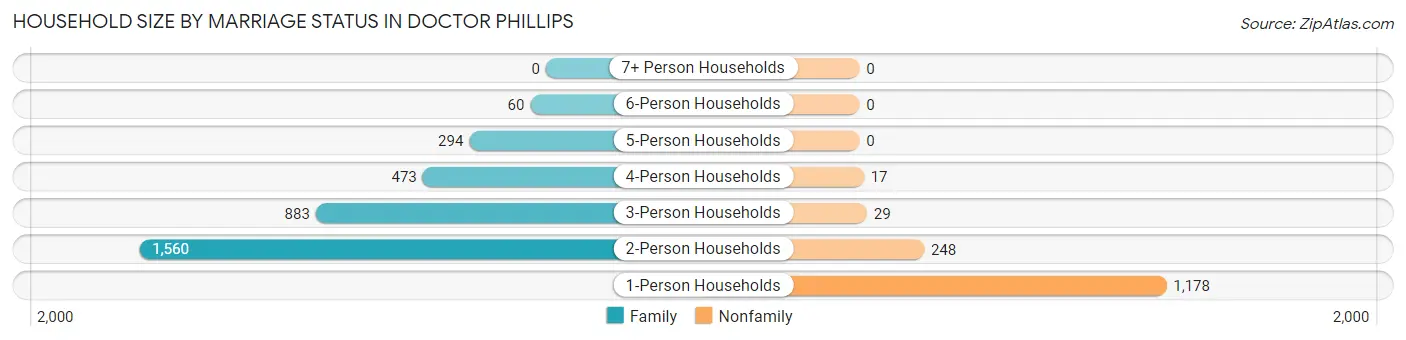
| Household Size | Family Households | Nonfamily Households |
| 1-Person Households | - | 1,178 (24.8%) |
| 2-Person Households | 1,560 (32.9%) | 248 (5.2%) |
| 3-Person Households | 883 (18.6%) | 29 (0.6%) |
| 4-Person Households | 473 (10.0%) | 17 (0.4%) |
| 5-Person Households | 294 (6.2%) | 0 (0.0%) |
| 6-Person Households | 60 (1.3%) | 0 (0.0%) |
| 7+ Person Households | 0 (0.0%) | 0 (0.0%) |
| Total | 3,270 (69.0%) | 1,472 (31.0%) |
Female Fertility in Doctor Phillips
Fertility by Age in Doctor Phillips
Average fertility rate in Doctor Phillips is 39.0 births per 1,000 women. Women in the age bracket of 20 to 34 years have the highest fertility rate with 46.0 births per 1,000 women. Women in the age bracket of 20 to 34 years acount for 64.9% of all women with births.
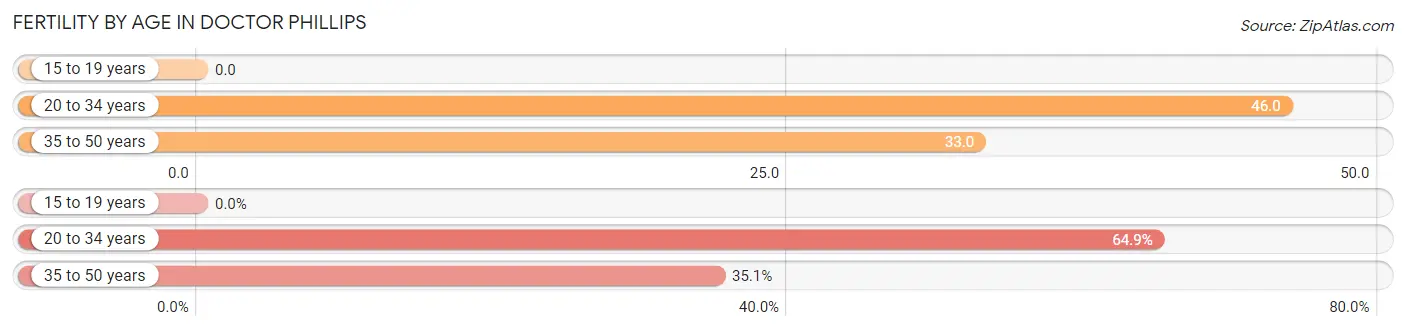
| Age Bracket | Women with Births | Births / 1,000 Women |
| 15 to 19 years | 0 (0.0%) | 0.0 |
| 20 to 34 years | 74 (64.9%) | 46.0 |
| 35 to 50 years | 40 (35.1%) | 33.0 |
| Total | 114 (100.0%) | 39.0 |
Fertility by Age by Marriage Status in Doctor Phillips
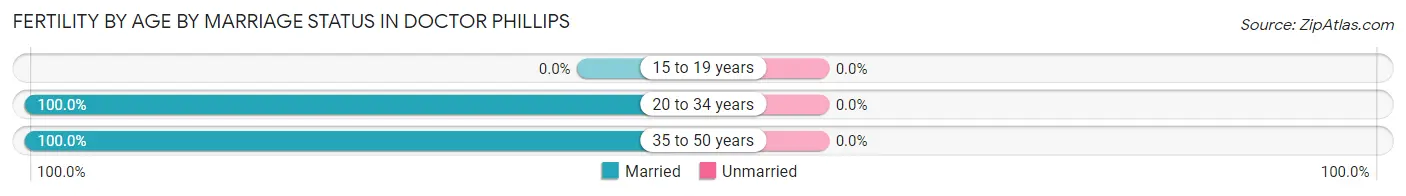
| Age Bracket | Married | Unmarried |
| 15 to 19 years | 0 (0.0%) | 0 (0.0%) |
| 20 to 34 years | 74 (100.0%) | 0 (0.0%) |
| 35 to 50 years | 40 (100.0%) | 0 (0.0%) |
| Total | 114 (100.0%) | 0 (0.0%) |
Fertility by Education in Doctor Phillips
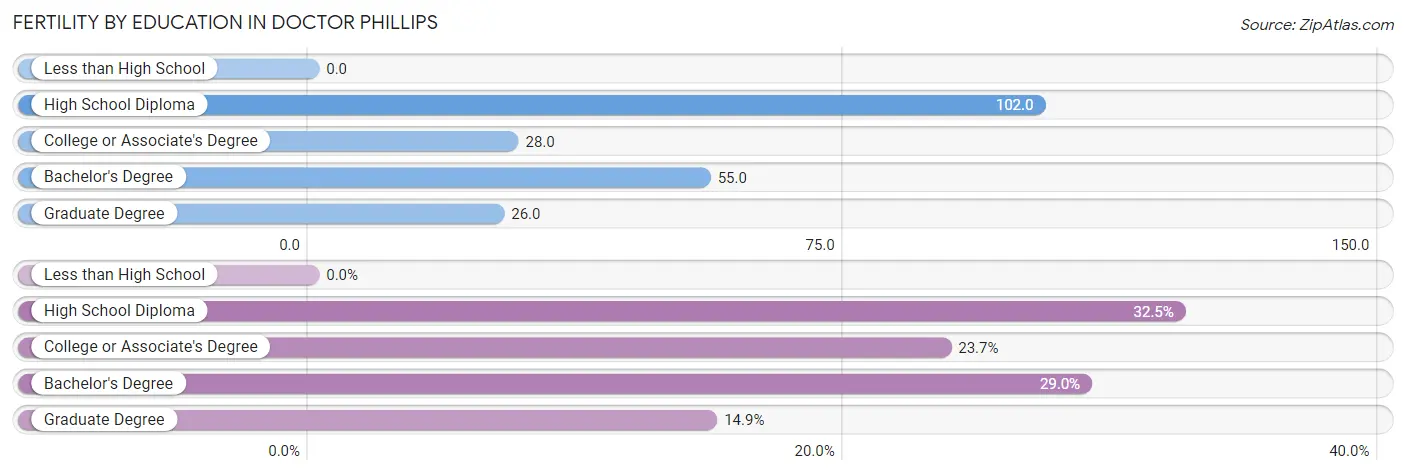
| Educational Attainment | Women with Births | Births / 1,000 Women |
| Less than High School | 0 (0.0%) | 0.0 |
| High School Diploma | 37 (32.5%) | 102.0 |
| College or Associate's Degree | 27 (23.7%) | 28.0 |
| Bachelor's Degree | 33 (28.9%) | 55.0 |
| Graduate Degree | 17 (14.9%) | 26.0 |
| Total | 114 (100.0%) | 39.0 |
Fertility by Education by Marriage Status in Doctor Phillips
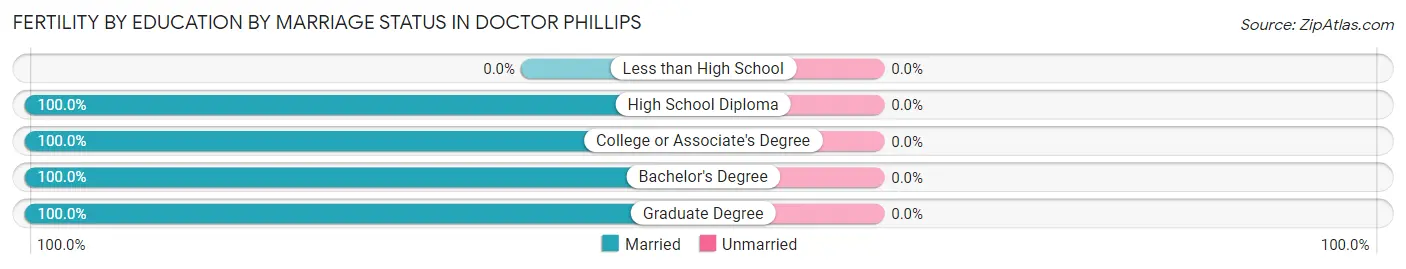
| Educational Attainment | Married | Unmarried |
| Less than High School | 0 (0.0%) | 0 (0.0%) |
| High School Diploma | 37 (100.0%) | 0 (0.0%) |
| College or Associate's Degree | 27 (100.0%) | 0 (0.0%) |
| Bachelor's Degree | 33 (100.0%) | 0 (0.0%) |
| Graduate Degree | 17 (100.0%) | 0 (0.0%) |
| Total | 114 (100.0%) | 0 (0.0%) |
Employment Characteristics in Doctor Phillips
Employment by Class of Employer in Doctor Phillips
Among the 5,541 employed individuals in Doctor Phillips, private company employees (4,123 | 74.4%), self-employed (incorporated) (590 | 10.6%), and not-for-profit organizations (276 | 5.0%) make up the most common classes of employment.
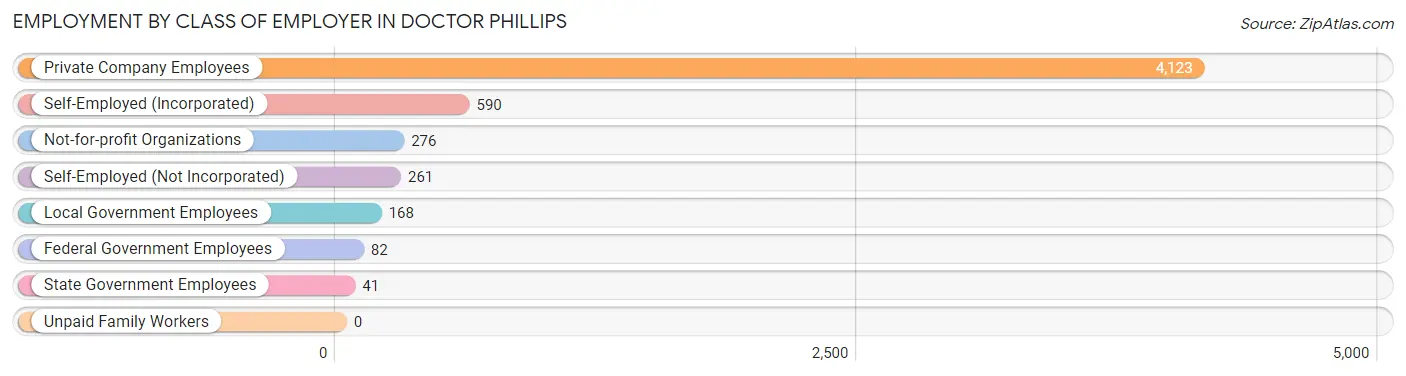
| Employer Class | # Employees | % Employees |
| Private Company Employees | 4,123 | 74.4% |
| Self-Employed (Incorporated) | 590 | 10.6% |
| Self-Employed (Not Incorporated) | 261 | 4.7% |
| Not-for-profit Organizations | 276 | 5.0% |
| Local Government Employees | 168 | 3.0% |
| State Government Employees | 41 | 0.7% |
| Federal Government Employees | 82 | 1.5% |
| Unpaid Family Workers | 0 | 0.0% |
| Total | 5,541 | 100.0% |
Employment Status by Age in Doctor Phillips
According to the labor force statistics for Doctor Phillips, out of the total population over 16 years of age (10,741), 59.4% or 6,380 individuals are in the labor force, with 11.3% or 721 of them unemployed. The age group with the highest labor force participation rate is 30 to 34 years, with 92.7% or 571 individuals in the labor force. Within the labor force, the 25 to 29 years age range has the highest percentage of unemployed individuals, with 42.0% or 304 of them being unemployed.
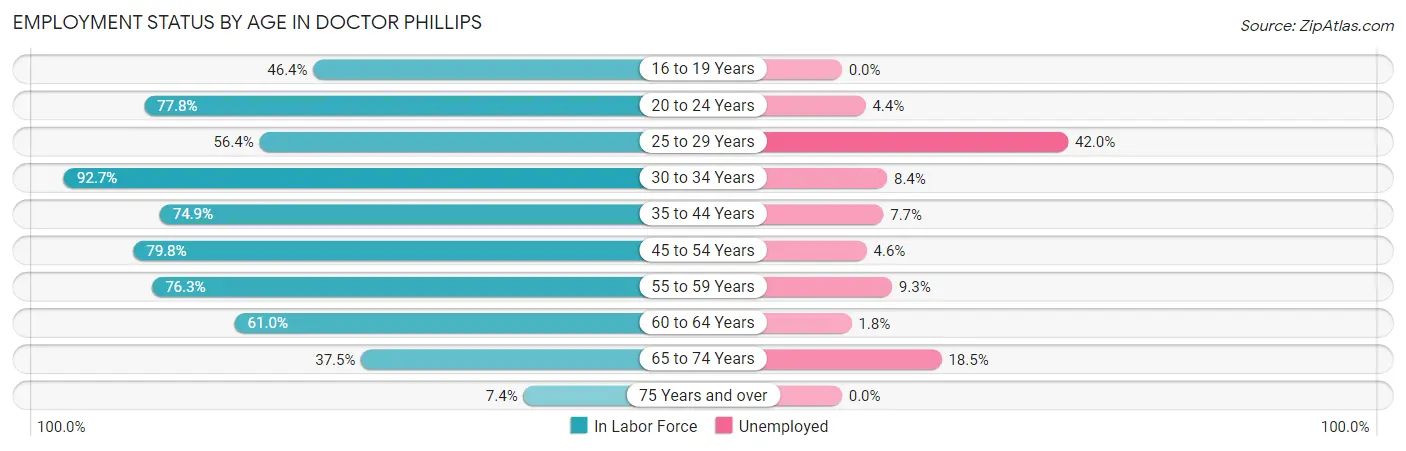
| Age Bracket | In Labor Force | Unemployed |
| 16 to 19 Years | 85 (46.4%) | 0 (0.0%) |
| 20 to 24 Years | 688 (77.8%) | 30 (4.4%) |
| 25 to 29 Years | 724 (56.4%) | 304 (42.0%) |
| 30 to 34 Years | 571 (92.7%) | 48 (8.4%) |
| 35 to 44 Years | 1,239 (74.9%) | 95 (7.7%) |
| 45 to 54 Years | 1,035 (79.8%) | 48 (4.6%) |
| 55 to 59 Years | 754 (76.3%) | 70 (9.3%) |
| 60 to 64 Years | 599 (61.0%) | 11 (1.8%) |
| 65 to 74 Years | 593 (37.5%) | 110 (18.5%) |
| 75 Years and over | 94 (7.4%) | 0 (0.0%) |
| Total | 6,380 (59.4%) | 721 (11.3%) |
Employment Status by Educational Attainment in Doctor Phillips
According to labor force statistics for Doctor Phillips, 72.2% of individuals (4,925) out of the total population between 25 and 64 years of age (6,821) are in the labor force, with 11.7% or 576 of them being unemployed. The group with the highest labor force participation rate are those with the educational attainment of less than high school, with 85.5% or 396 individuals in the labor force. Within the labor force, individuals with less than high school education have the highest percentage of unemployment, with 76.8% or 304 of them being unemployed.
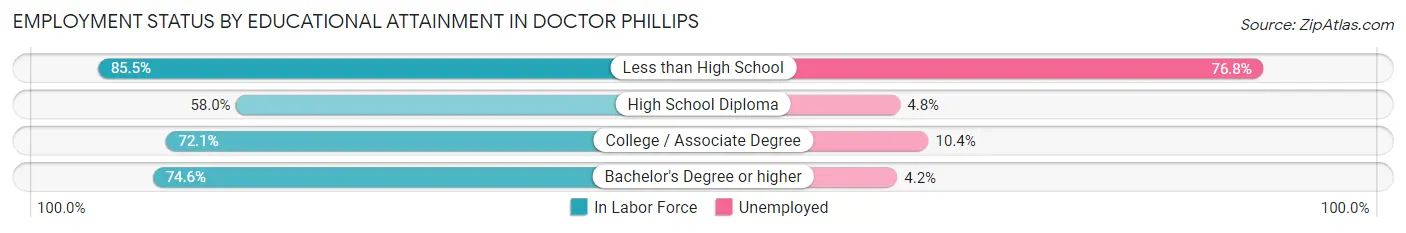
| Educational Attainment | In Labor Force | Unemployed |
| Less than High School | 396 (85.5%) | 356 (76.8%) |
| High School Diploma | 601 (58.0%) | 50 (4.8%) |
| College / Associate Degree | 1,286 (72.1%) | 185 (10.4%) |
| Bachelor's Degree or higher | 2,639 (74.6%) | 149 (4.2%) |
| Total | 4,925 (72.2%) | 798 (11.7%) |
Employment Occupations by Sex in Doctor Phillips
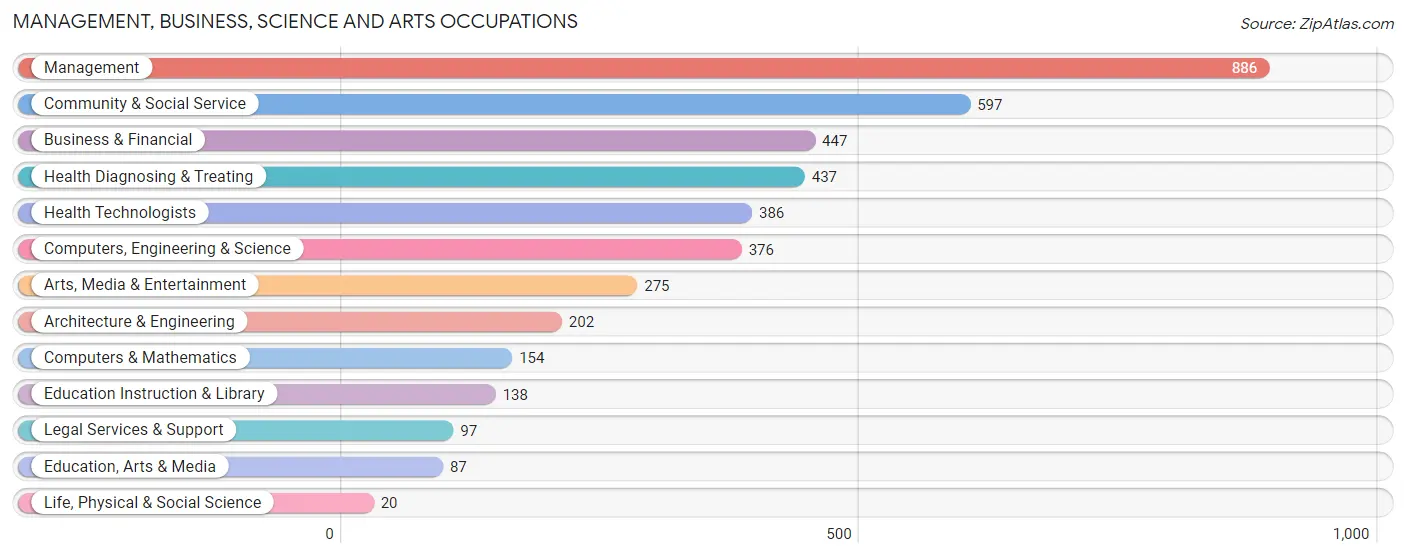
Management, Business, Science and Arts Occupations
The most common Management, Business, Science and Arts occupations in Doctor Phillips are Management (886 | 15.7%), Community & Social Service (597 | 10.6%), Business & Financial (447 | 7.9%), Health Diagnosing & Treating (437 | 7.8%), and Health Technologists (386 | 6.9%).
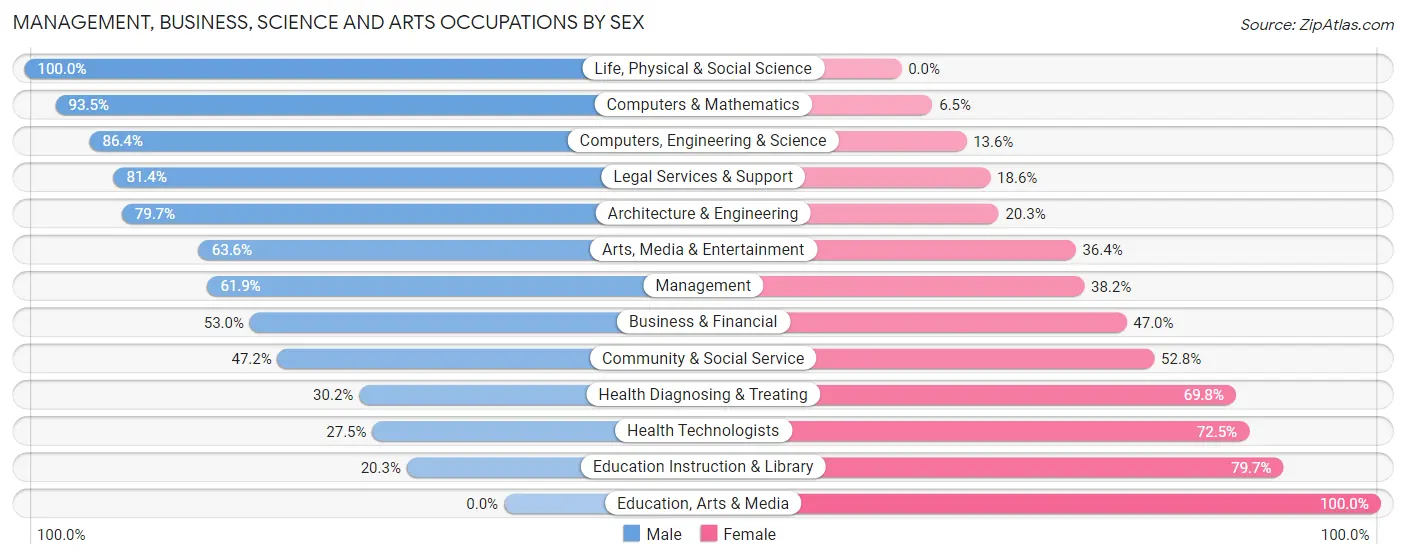
Management, Business, Science and Arts Occupations by Sex
Within the Management, Business, Science and Arts occupations in Doctor Phillips, the most male-oriented occupations are Life, Physical & Social Science (100.0%), Computers & Mathematics (93.5%), and Computers, Engineering & Science (86.4%), while the most female-oriented occupations are Education, Arts & Media (100.0%), Education Instruction & Library (79.7%), and Health Technologists (72.5%).
| Occupation | Male | Female |
| Management | 548 (61.9%) | 338 (38.2%) |
| Business & Financial | 237 (53.0%) | 210 (47.0%) |
| Computers, Engineering & Science | 325 (86.4%) | 51 (13.6%) |
| Computers & Mathematics | 144 (93.5%) | 10 (6.5%) |
| Architecture & Engineering | 161 (79.7%) | 41 (20.3%) |
| Life, Physical & Social Science | 20 (100.0%) | 0 (0.0%) |
| Community & Social Service | 282 (47.2%) | 315 (52.8%) |
| Education, Arts & Media | 0 (0.0%) | 87 (100.0%) |
| Legal Services & Support | 79 (81.4%) | 18 (18.6%) |
| Education Instruction & Library | 28 (20.3%) | 110 (79.7%) |
| Arts, Media & Entertainment | 175 (63.6%) | 100 (36.4%) |
| Health Diagnosing & Treating | 132 (30.2%) | 305 (69.8%) |
| Health Technologists | 106 (27.5%) | 280 (72.5%) |
| Total (Category) | 1,524 (55.6%) | 1,219 (44.4%) |
| Total (Overall) | 3,316 (58.9%) | 2,319 (41.1%) |
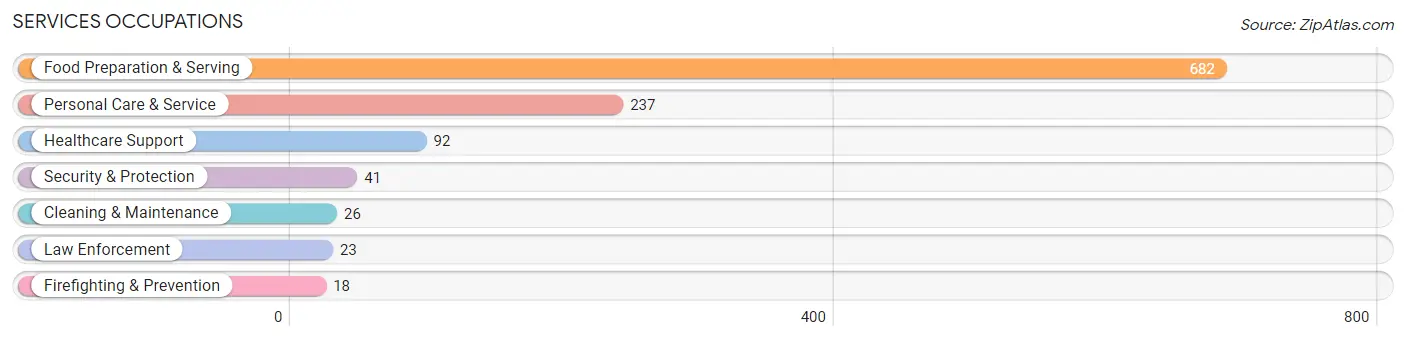
Services Occupations
The most common Services occupations in Doctor Phillips are Food Preparation & Serving (682 | 12.1%), Personal Care & Service (237 | 4.2%), Healthcare Support (92 | 1.6%), Security & Protection (41 | 0.7%), and Cleaning & Maintenance (26 | 0.5%).
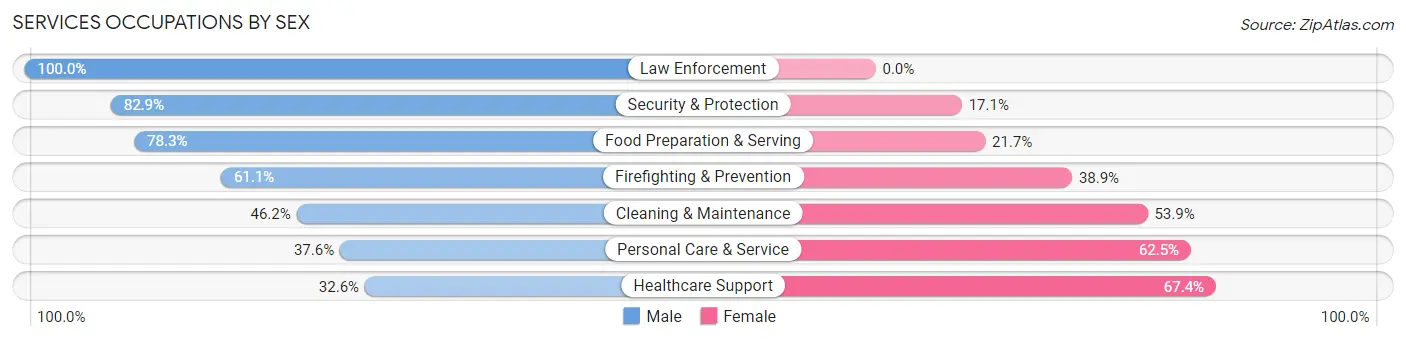
Services Occupations by Sex
Within the Services occupations in Doctor Phillips, the most male-oriented occupations are Law Enforcement (100.0%), Security & Protection (82.9%), and Food Preparation & Serving (78.3%), while the most female-oriented occupations are Healthcare Support (67.4%), Personal Care & Service (62.5%), and Cleaning & Maintenance (53.8%).
| Occupation | Male | Female |
| Healthcare Support | 30 (32.6%) | 62 (67.4%) |
| Security & Protection | 34 (82.9%) | 7 (17.1%) |
| Firefighting & Prevention | 11 (61.1%) | 7 (38.9%) |
| Law Enforcement | 23 (100.0%) | 0 (0.0%) |
| Food Preparation & Serving | 534 (78.3%) | 148 (21.7%) |
| Cleaning & Maintenance | 12 (46.2%) | 14 (53.8%) |
| Personal Care & Service | 89 (37.6%) | 148 (62.5%) |
| Total (Category) | 699 (64.8%) | 379 (35.2%) |
| Total (Overall) | 3,316 (58.9%) | 2,319 (41.1%) |
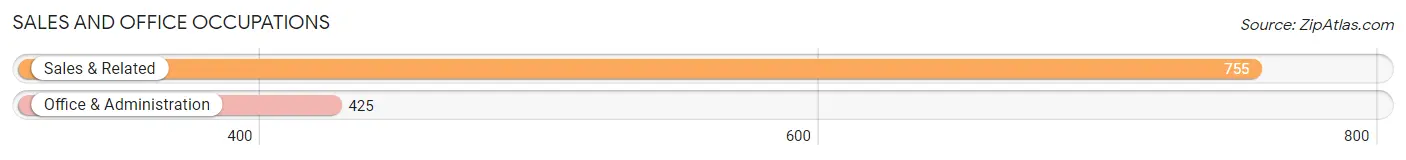
Sales and Office Occupations
The most common Sales and Office occupations in Doctor Phillips are Sales & Related (755 | 13.4%), and Office & Administration (425 | 7.5%).
Sales and Office Occupations by Sex
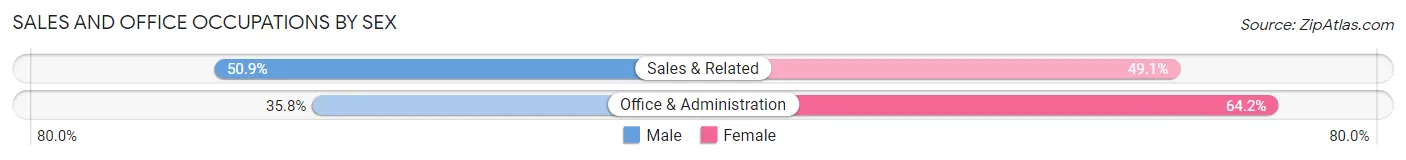
| Occupation | Male | Female |
| Sales & Related | 384 (50.9%) | 371 (49.1%) |
| Office & Administration | 152 (35.8%) | 273 (64.2%) |
| Total (Category) | 536 (45.4%) | 644 (54.6%) |
| Total (Overall) | 3,316 (58.9%) | 2,319 (41.1%) |
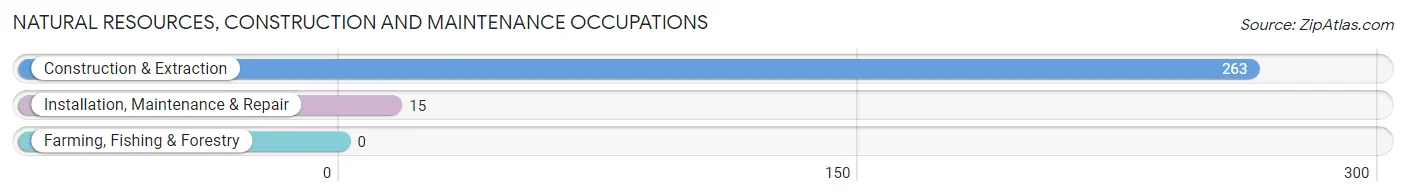
Natural Resources, Construction and Maintenance Occupations
The most common Natural Resources, Construction and Maintenance occupations in Doctor Phillips are Construction & Extraction (263 | 4.7%), and Installation, Maintenance & Repair (15 | 0.3%).
Natural Resources, Construction and Maintenance Occupations by Sex
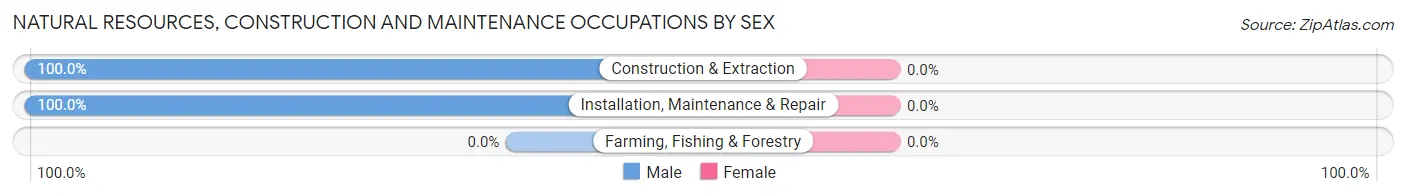
| Occupation | Male | Female |
| Farming, Fishing & Forestry | 0 (0.0%) | 0 (0.0%) |
| Construction & Extraction | 263 (100.0%) | 0 (0.0%) |
| Installation, Maintenance & Repair | 15 (100.0%) | 0 (0.0%) |
| Total (Category) | 278 (100.0%) | 0 (0.0%) |
| Total (Overall) | 3,316 (58.9%) | 2,319 (41.1%) |
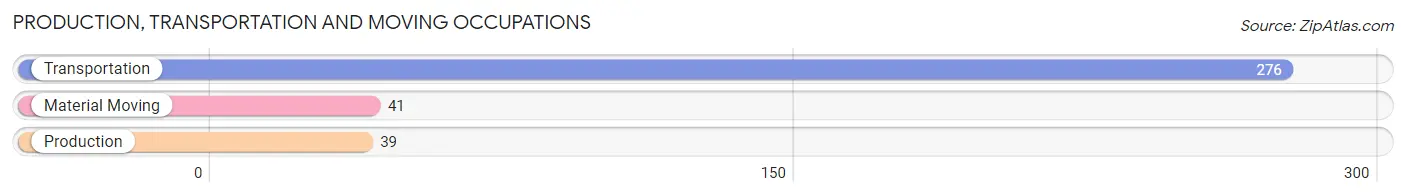
Production, Transportation and Moving Occupations
The most common Production, Transportation and Moving occupations in Doctor Phillips are Transportation (276 | 4.9%), Material Moving (41 | 0.7%), and Production (39 | 0.7%).
Production, Transportation and Moving Occupations by Sex
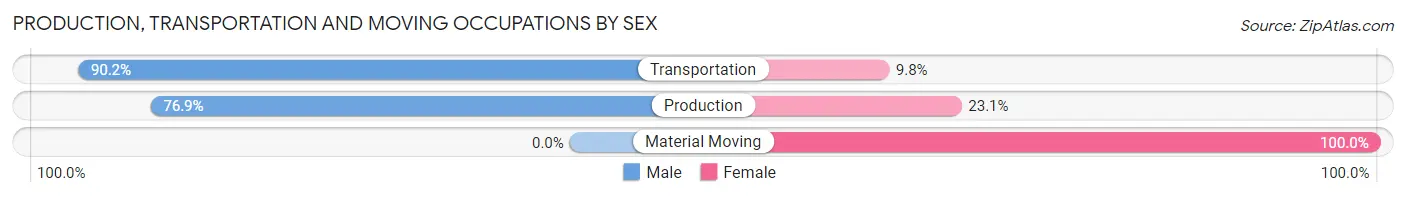
| Occupation | Male | Female |
| Production | 30 (76.9%) | 9 (23.1%) |
| Transportation | 249 (90.2%) | 27 (9.8%) |
| Material Moving | 0 (0.0%) | 41 (100.0%) |
| Total (Category) | 279 (78.4%) | 77 (21.6%) |
| Total (Overall) | 3,316 (58.9%) | 2,319 (41.1%) |
Employment Industries by Sex in Doctor Phillips
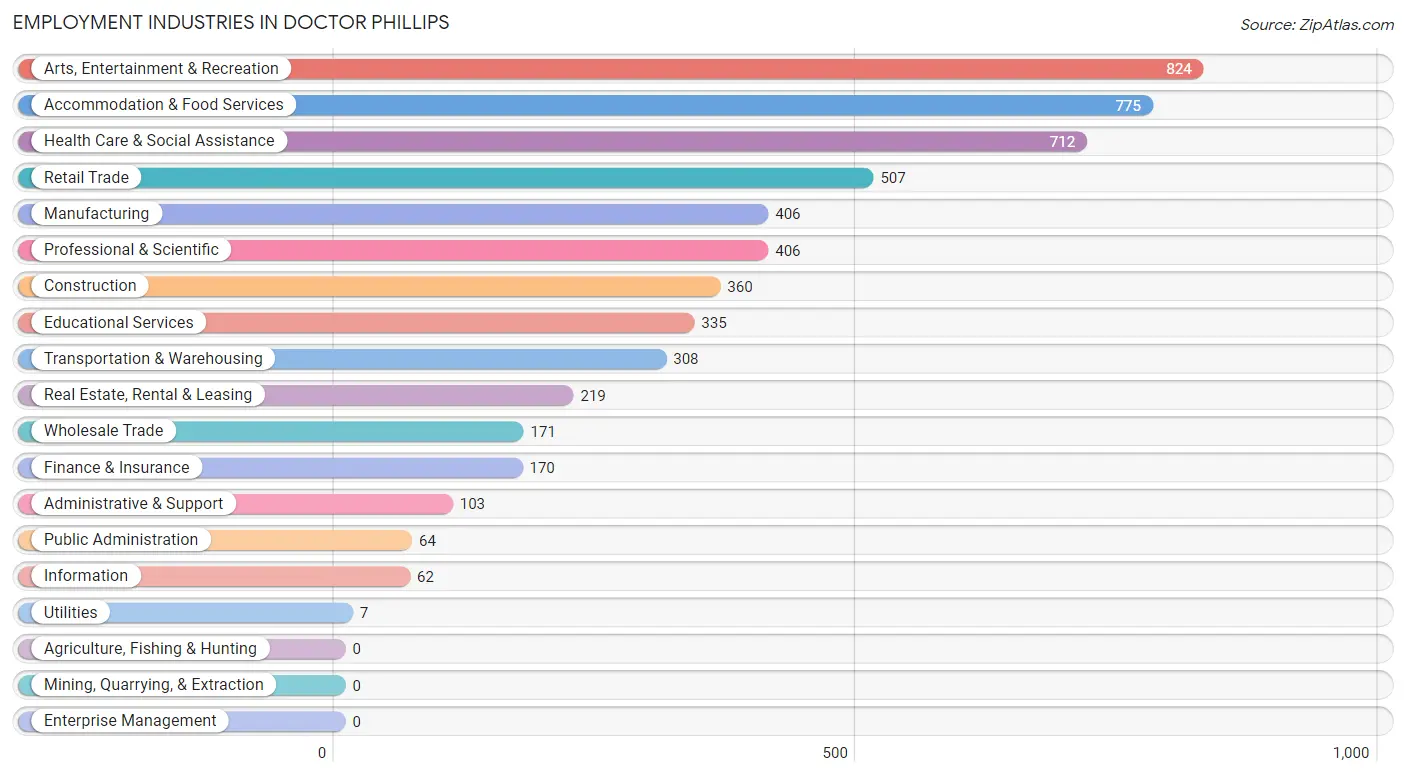
Employment Industries in Doctor Phillips
The major employment industries in Doctor Phillips include Arts, Entertainment & Recreation (824 | 14.6%), Accommodation & Food Services (775 | 13.8%), Health Care & Social Assistance (712 | 12.6%), Retail Trade (507 | 9.0%), and Manufacturing (406 | 7.2%).
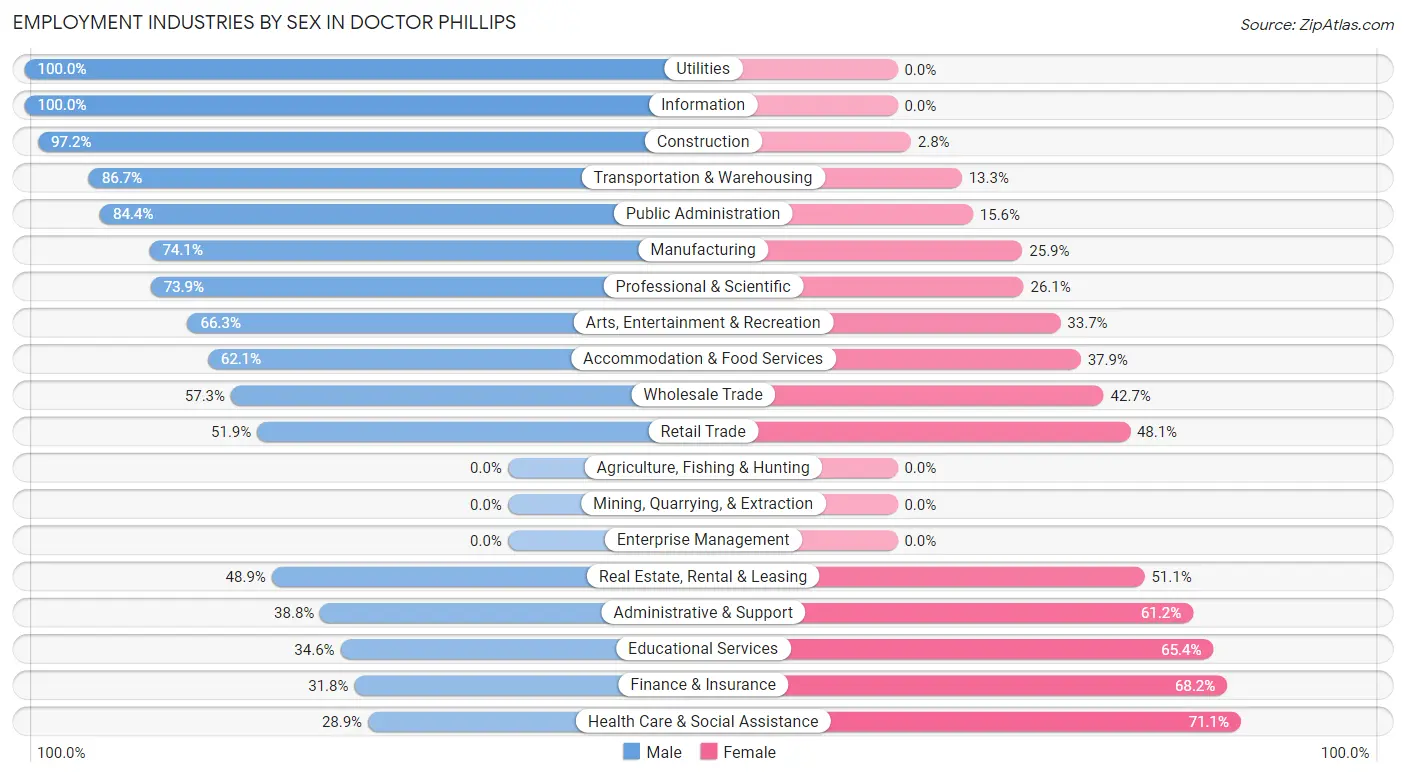
Employment Industries by Sex in Doctor Phillips
The Doctor Phillips industries that see more men than women are Utilities (100.0%), Information (100.0%), and Construction (97.2%), whereas the industries that tend to have a higher number of women are Health Care & Social Assistance (71.1%), Finance & Insurance (68.2%), and Educational Services (65.4%).
| Industry | Male | Female |
| Agriculture, Fishing & Hunting | 0 (0.0%) | 0 (0.0%) |
| Mining, Quarrying, & Extraction | 0 (0.0%) | 0 (0.0%) |
| Construction | 350 (97.2%) | 10 (2.8%) |
| Manufacturing | 301 (74.1%) | 105 (25.9%) |
| Wholesale Trade | 98 (57.3%) | 73 (42.7%) |
| Retail Trade | 263 (51.9%) | 244 (48.1%) |
| Transportation & Warehousing | 267 (86.7%) | 41 (13.3%) |
| Utilities | 7 (100.0%) | 0 (0.0%) |
| Information | 62 (100.0%) | 0 (0.0%) |
| Finance & Insurance | 54 (31.8%) | 116 (68.2%) |
| Real Estate, Rental & Leasing | 107 (48.9%) | 112 (51.1%) |
| Professional & Scientific | 300 (73.9%) | 106 (26.1%) |
| Enterprise Management | 0 (0.0%) | 0 (0.0%) |
| Administrative & Support | 40 (38.8%) | 63 (61.2%) |
| Educational Services | 116 (34.6%) | 219 (65.4%) |
| Health Care & Social Assistance | 206 (28.9%) | 506 (71.1%) |
| Arts, Entertainment & Recreation | 546 (66.3%) | 278 (33.7%) |
| Accommodation & Food Services | 481 (62.1%) | 294 (37.9%) |
| Public Administration | 54 (84.4%) | 10 (15.6%) |
| Total | 3,316 (58.9%) | 2,319 (41.1%) |
Education in Doctor Phillips
School Enrollment in Doctor Phillips
The most common levels of schooling among the 2,177 students in Doctor Phillips are college / undergraduate (548 | 25.2%), elementary school (497 | 22.8%), and middle school (345 | 15.9%).
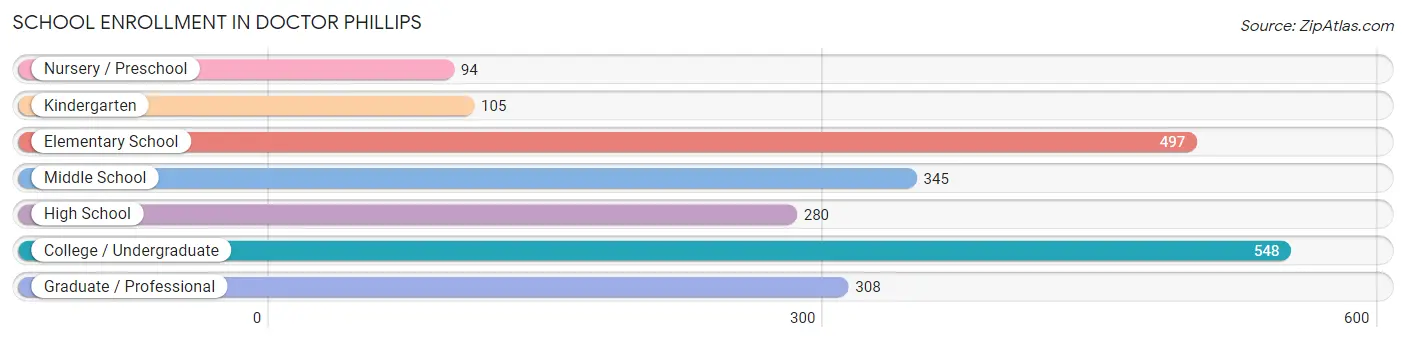
| School Level | # Students | % Students |
| Nursery / Preschool | 94 | 4.3% |
| Kindergarten | 105 | 4.8% |
| Elementary School | 497 | 22.8% |
| Middle School | 345 | 15.9% |
| High School | 280 | 12.9% |
| College / Undergraduate | 548 | 25.2% |
| Graduate / Professional | 308 | 14.1% |
| Total | 2,177 | 100.0% |
School Enrollment by Age by Funding Source in Doctor Phillips
Out of a total of 2,177 students who are enrolled in schools in Doctor Phillips, 470 (21.6%) attend a private institution, while the remaining 1,707 (78.4%) are enrolled in public schools. The age group of 25 to 34 year olds has the highest likelihood of being enrolled in private schools, with 247 (76.9% in the age bracket) enrolled. Conversely, the age group of 18 to 19 year olds has the lowest likelihood of being enrolled in a private school, with 38 (100.0% in the age bracket) attending a public institution.
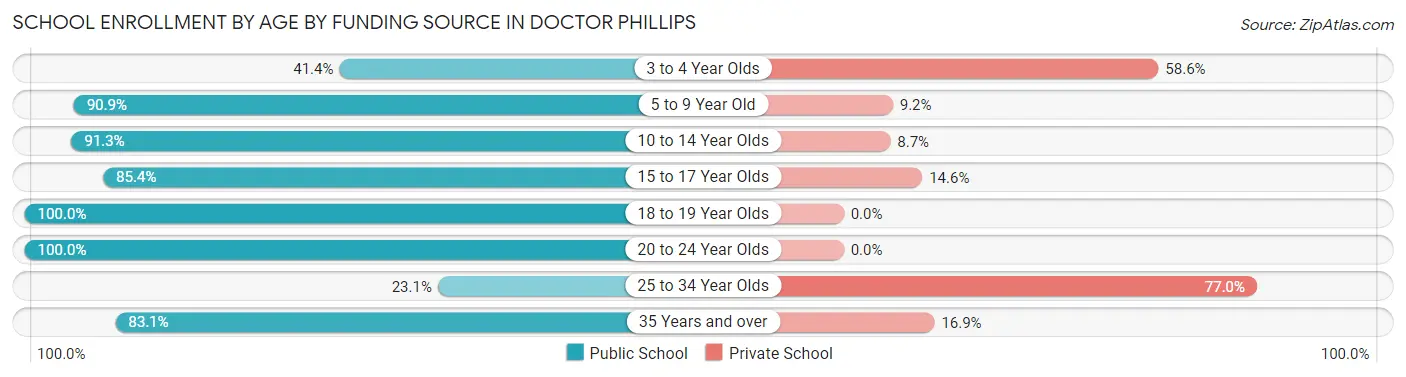
| Age Bracket | Public School | Private School |
| 3 to 4 Year Olds | 36 (41.4%) | 51 (58.6%) |
| 5 to 9 Year Old | 526 (90.8%) | 53 (9.1%) |
| 10 to 14 Year Olds | 399 (91.3%) | 38 (8.7%) |
| 15 to 17 Year Olds | 140 (85.4%) | 24 (14.6%) |
| 18 to 19 Year Olds | 38 (100.0%) | 0 (0.0%) |
| 20 to 24 Year Olds | 214 (100.0%) | 0 (0.0%) |
| 25 to 34 Year Olds | 74 (23.1%) | 247 (76.9%) |
| 35 Years and over | 280 (83.1%) | 57 (16.9%) |
| Total | 1,707 (78.4%) | 470 (21.6%) |
Educational Attainment by Field of Study in Doctor Phillips
Business (1,647 | 30.9%), engineering (626 | 11.7%), education (411 | 7.7%), bio, nature & agricultural (361 | 6.8%), and science & technology (357 | 6.7%) are the most common fields of study among 5,335 individuals in Doctor Phillips who have obtained a bachelor's degree or higher.
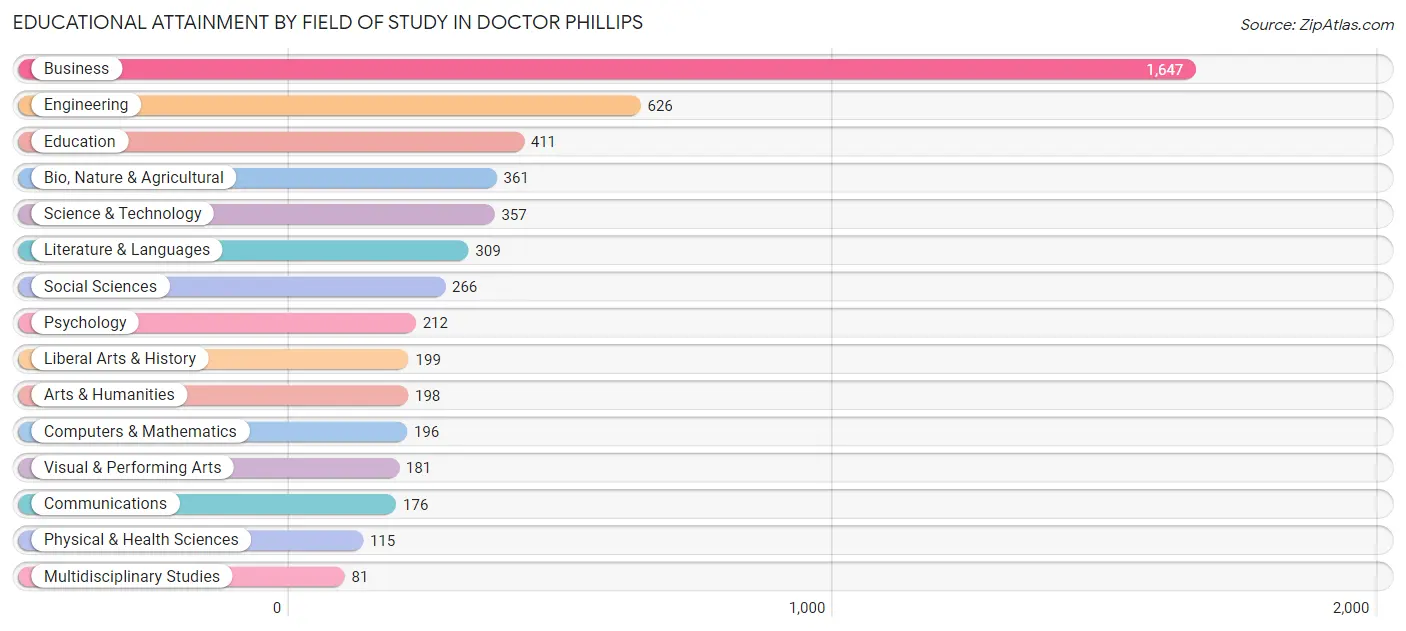
| Field of Study | # Graduates | % Graduates |
| Computers & Mathematics | 196 | 3.7% |
| Bio, Nature & Agricultural | 361 | 6.8% |
| Physical & Health Sciences | 115 | 2.2% |
| Psychology | 212 | 4.0% |
| Social Sciences | 266 | 5.0% |
| Engineering | 626 | 11.7% |
| Multidisciplinary Studies | 81 | 1.5% |
| Science & Technology | 357 | 6.7% |
| Business | 1,647 | 30.9% |
| Education | 411 | 7.7% |
| Literature & Languages | 309 | 5.8% |
| Liberal Arts & History | 199 | 3.7% |
| Visual & Performing Arts | 181 | 3.4% |
| Communications | 176 | 3.3% |
| Arts & Humanities | 198 | 3.7% |
| Total | 5,335 | 100.0% |
Transportation & Commute in Doctor Phillips
Vehicle Availability by Sex in Doctor Phillips
The most prevalent vehicle ownership categories in Doctor Phillips are males with 2 vehicles (1,493, accounting for 45.1%) and females with 2 vehicles (944, making up 66.9%).
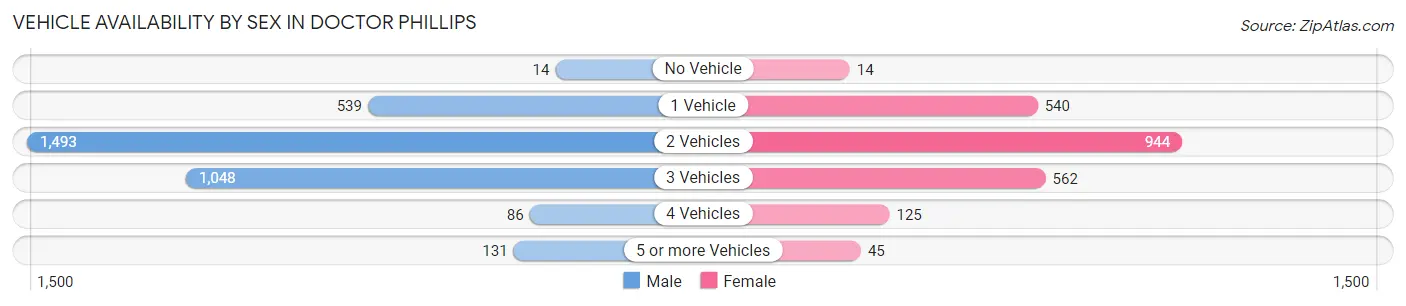
| Vehicles Available | Male | Female |
| No Vehicle | 14 (0.4%) | 14 (0.6%) |
| 1 Vehicle | 539 (16.3%) | 540 (24.2%) |
| 2 Vehicles | 1,493 (45.1%) | 944 (42.3%) |
| 3 Vehicles | 1,048 (31.7%) | 562 (25.2%) |
| 4 Vehicles | 86 (2.6%) | 125 (5.6%) |
| 5 or more Vehicles | 131 (4.0%) | 45 (2.0%) |
| Total | 3,311 (100.0%) | 2,230 (100.0%) |
Commute Time in Doctor Phillips
The most frequently occuring commute durations in Doctor Phillips are 30 to 34 minutes (1,143 commuters, 24.1%), 15 to 19 minutes (950 commuters, 20.0%), and 20 to 24 minutes (915 commuters, 19.3%).
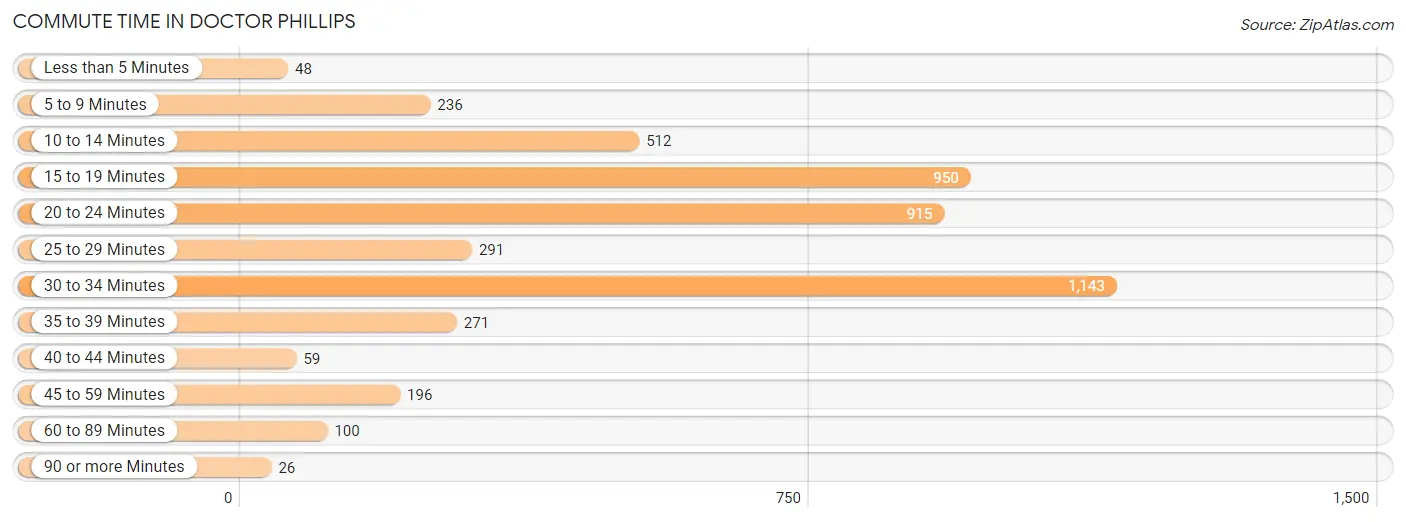
| Commute Time | # Commuters | % Commuters |
| Less than 5 Minutes | 48 | 1.0% |
| 5 to 9 Minutes | 236 | 5.0% |
| 10 to 14 Minutes | 512 | 10.8% |
| 15 to 19 Minutes | 950 | 20.0% |
| 20 to 24 Minutes | 915 | 19.3% |
| 25 to 29 Minutes | 291 | 6.1% |
| 30 to 34 Minutes | 1,143 | 24.1% |
| 35 to 39 Minutes | 271 | 5.7% |
| 40 to 44 Minutes | 59 | 1.2% |
| 45 to 59 Minutes | 196 | 4.1% |
| 60 to 89 Minutes | 100 | 2.1% |
| 90 or more Minutes | 26 | 0.5% |
Commute Time by Sex in Doctor Phillips
The most common commute times in Doctor Phillips are 30 to 34 minutes (822 commuters, 28.2%) for males and 15 to 19 minutes (508 commuters, 27.7%) for females.
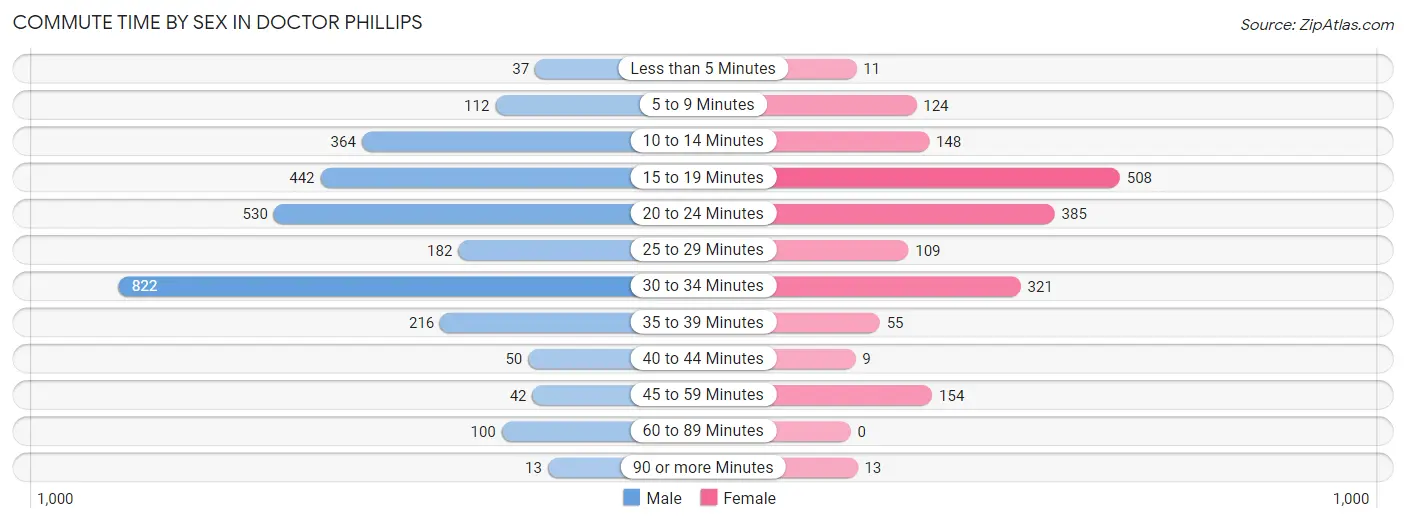
| Commute Time | Male | Female |
| Less than 5 Minutes | 37 (1.3%) | 11 (0.6%) |
| 5 to 9 Minutes | 112 (3.8%) | 124 (6.8%) |
| 10 to 14 Minutes | 364 (12.5%) | 148 (8.1%) |
| 15 to 19 Minutes | 442 (15.2%) | 508 (27.7%) |
| 20 to 24 Minutes | 530 (18.2%) | 385 (21.0%) |
| 25 to 29 Minutes | 182 (6.2%) | 109 (5.9%) |
| 30 to 34 Minutes | 822 (28.2%) | 321 (17.5%) |
| 35 to 39 Minutes | 216 (7.4%) | 55 (3.0%) |
| 40 to 44 Minutes | 50 (1.7%) | 9 (0.5%) |
| 45 to 59 Minutes | 42 (1.4%) | 154 (8.4%) |
| 60 to 89 Minutes | 100 (3.4%) | 0 (0.0%) |
| 90 or more Minutes | 13 (0.4%) | 13 (0.7%) |
Time of Departure to Work by Sex in Doctor Phillips
The most frequent times of departure to work in Doctor Phillips are 7:00 AM to 7:29 AM (763, 26.2%) for males and 8:00 AM to 8:29 AM (389, 21.2%) for females.
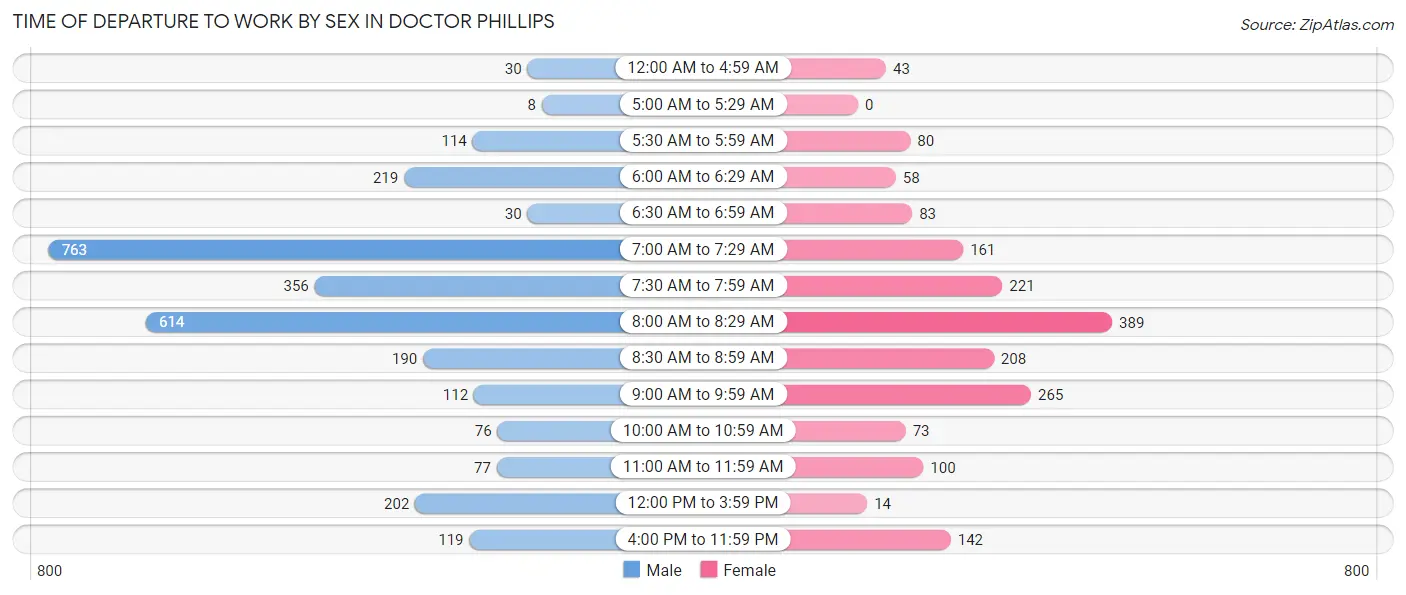
| Time of Departure | Male | Female |
| 12:00 AM to 4:59 AM | 30 (1.0%) | 43 (2.3%) |
| 5:00 AM to 5:29 AM | 8 (0.3%) | 0 (0.0%) |
| 5:30 AM to 5:59 AM | 114 (3.9%) | 80 (4.3%) |
| 6:00 AM to 6:29 AM | 219 (7.5%) | 58 (3.2%) |
| 6:30 AM to 6:59 AM | 30 (1.0%) | 83 (4.5%) |
| 7:00 AM to 7:29 AM | 763 (26.2%) | 161 (8.8%) |
| 7:30 AM to 7:59 AM | 356 (12.2%) | 221 (12.0%) |
| 8:00 AM to 8:29 AM | 614 (21.1%) | 389 (21.2%) |
| 8:30 AM to 8:59 AM | 190 (6.5%) | 208 (11.3%) |
| 9:00 AM to 9:59 AM | 112 (3.8%) | 265 (14.4%) |
| 10:00 AM to 10:59 AM | 76 (2.6%) | 73 (4.0%) |
| 11:00 AM to 11:59 AM | 77 (2.6%) | 100 (5.4%) |
| 12:00 PM to 3:59 PM | 202 (6.9%) | 14 (0.8%) |
| 4:00 PM to 11:59 PM | 119 (4.1%) | 142 (7.7%) |
| Total | 2,910 (100.0%) | 1,837 (100.0%) |
Housing Occupancy in Doctor Phillips
Occupancy by Ownership in Doctor Phillips
Of the total 4,742 dwellings in Doctor Phillips, owner-occupied units account for 3,458 (72.9%), while renter-occupied units make up 1,284 (27.1%).
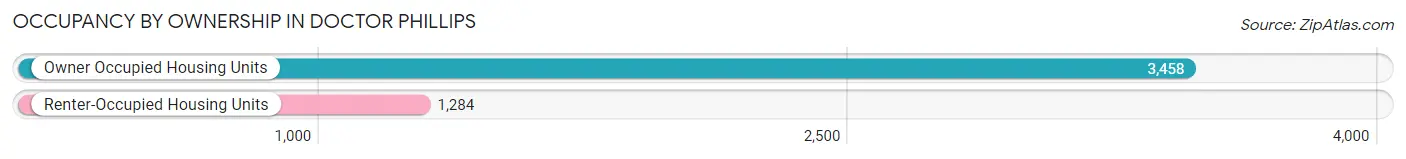
| Occupancy | # Housing Units | % Housing Units |
| Owner Occupied Housing Units | 3,458 | 72.9% |
| Renter-Occupied Housing Units | 1,284 | 27.1% |
| Total Occupied Housing Units | 4,742 | 100.0% |
Occupancy by Household Size in Doctor Phillips
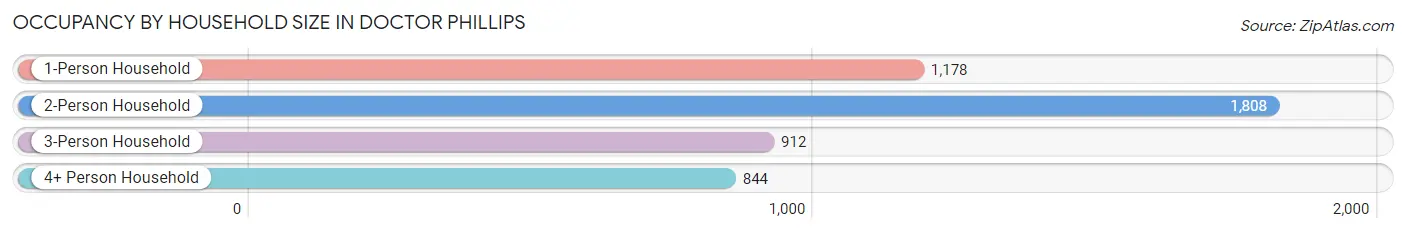
| Household Size | # Housing Units | % Housing Units |
| 1-Person Household | 1,178 | 24.8% |
| 2-Person Household | 1,808 | 38.1% |
| 3-Person Household | 912 | 19.2% |
| 4+ Person Household | 844 | 17.8% |
| Total Housing Units | 4,742 | 100.0% |
Occupancy by Ownership by Household Size in Doctor Phillips
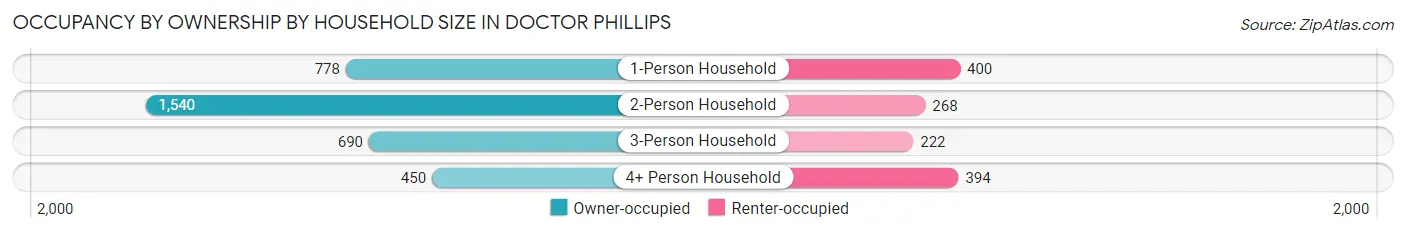
| Household Size | Owner-occupied | Renter-occupied |
| 1-Person Household | 778 (66.0%) | 400 (34.0%) |
| 2-Person Household | 1,540 (85.2%) | 268 (14.8%) |
| 3-Person Household | 690 (75.7%) | 222 (24.3%) |
| 4+ Person Household | 450 (53.3%) | 394 (46.7%) |
| Total Housing Units | 3,458 (72.9%) | 1,284 (27.1%) |
Occupancy by Educational Attainment in Doctor Phillips
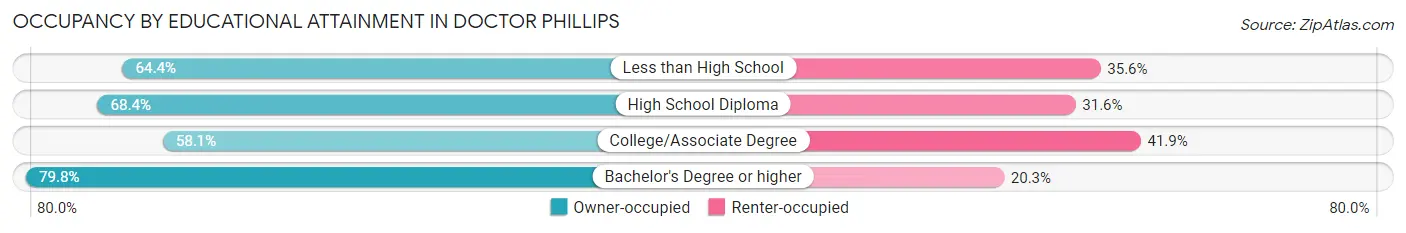
| Household Size | Owner-occupied | Renter-occupied |
| Less than High School | 87 (64.4%) | 48 (35.6%) |
| High School Diploma | 353 (68.4%) | 163 (31.6%) |
| College/Associate Degree | 655 (58.1%) | 473 (41.9%) |
| Bachelor's Degree or higher | 2,363 (79.7%) | 600 (20.3%) |
Occupancy by Age of Householder in Doctor Phillips
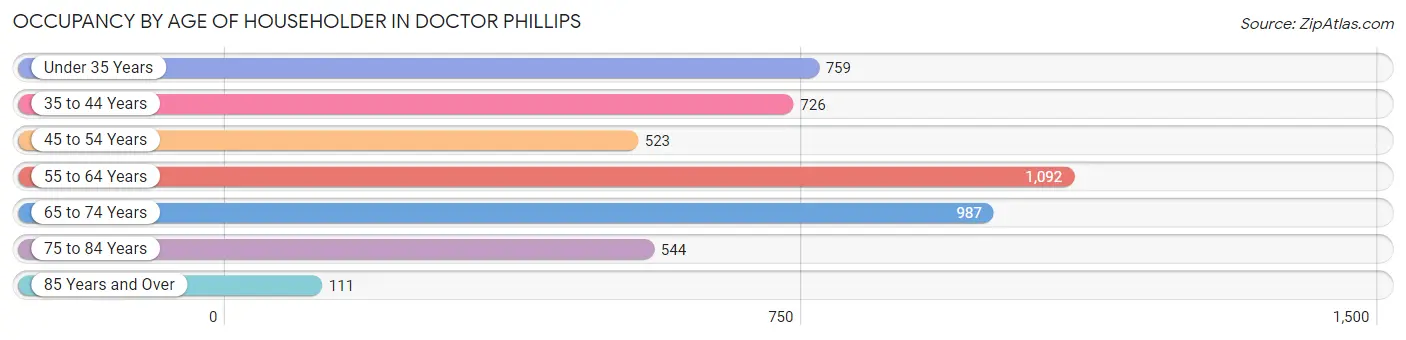
| Age Bracket | # Households | % Households |
| Under 35 Years | 759 | 16.0% |
| 35 to 44 Years | 726 | 15.3% |
| 45 to 54 Years | 523 | 11.0% |
| 55 to 64 Years | 1,092 | 23.0% |
| 65 to 74 Years | 987 | 20.8% |
| 75 to 84 Years | 544 | 11.5% |
| 85 Years and Over | 111 | 2.3% |
| Total | 4,742 | 100.0% |
Housing Finances in Doctor Phillips
Median Income by Occupancy in Doctor Phillips
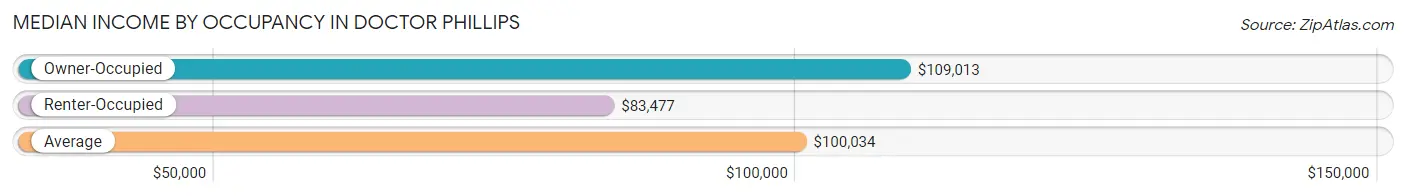
| Occupancy Type | # Households | Median Income |
| Owner-Occupied | 3,458 (72.9%) | $109,013 |
| Renter-Occupied | 1,284 (27.1%) | $83,477 |
| Average | 4,742 (100.0%) | $100,034 |
Occupancy by Householder Income Bracket in Doctor Phillips
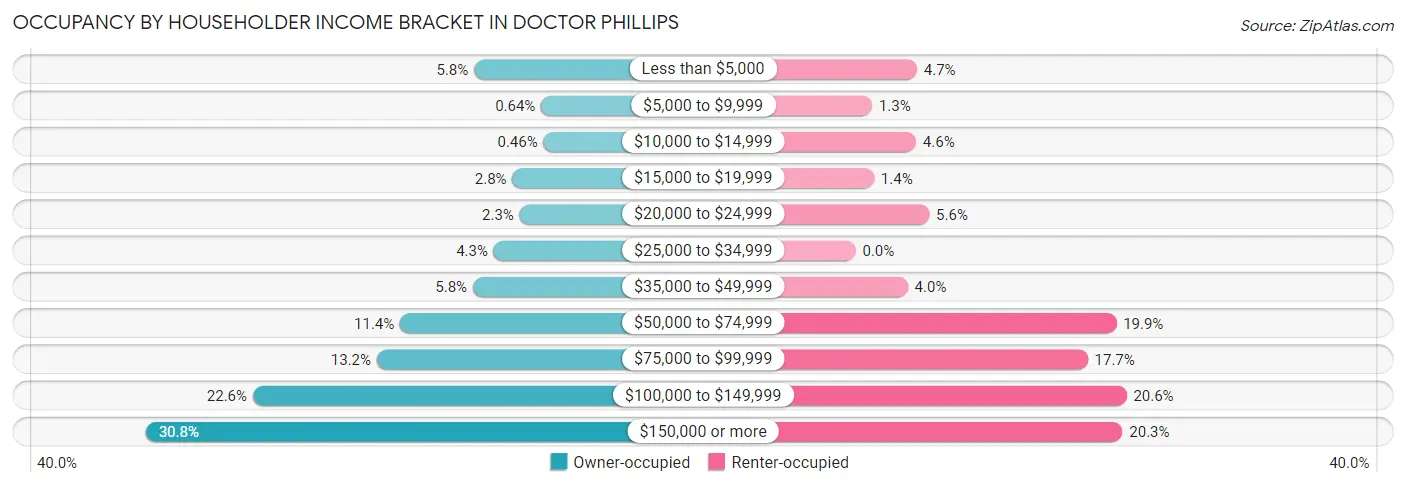
| Income Bracket | Owner-occupied | Renter-occupied |
| Less than $5,000 | 199 (5.8%) | 60 (4.7%) |
| $5,000 to $9,999 | 22 (0.6%) | 16 (1.3%) |
| $10,000 to $14,999 | 16 (0.5%) | 59 (4.6%) |
| $15,000 to $19,999 | 98 (2.8%) | 18 (1.4%) |
| $20,000 to $24,999 | 79 (2.3%) | 72 (5.6%) |
| $25,000 to $34,999 | 147 (4.3%) | 0 (0.0%) |
| $35,000 to $49,999 | 202 (5.8%) | 51 (4.0%) |
| $50,000 to $74,999 | 394 (11.4%) | 255 (19.9%) |
| $75,000 to $99,999 | 455 (13.2%) | 227 (17.7%) |
| $100,000 to $149,999 | 782 (22.6%) | 265 (20.6%) |
| $150,000 or more | 1,064 (30.8%) | 261 (20.3%) |
| Total | 3,458 (100.0%) | 1,284 (100.0%) |
Monthly Housing Cost Tiers in Doctor Phillips
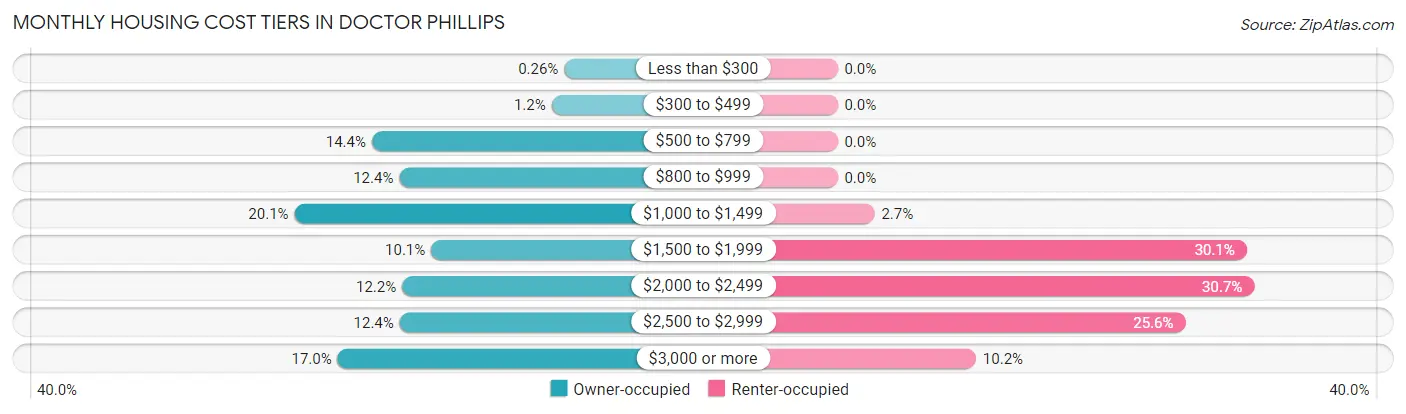
| Monthly Cost | Owner-occupied | Renter-occupied |
| Less than $300 | 9 (0.3%) | 0 (0.0%) |
| $300 to $499 | 41 (1.2%) | 0 (0.0%) |
| $500 to $799 | 499 (14.4%) | 0 (0.0%) |
| $800 to $999 | 429 (12.4%) | 0 (0.0%) |
| $1,000 to $1,499 | 696 (20.1%) | 35 (2.7%) |
| $1,500 to $1,999 | 348 (10.1%) | 387 (30.1%) |
| $2,000 to $2,499 | 422 (12.2%) | 394 (30.7%) |
| $2,500 to $2,999 | 428 (12.4%) | 329 (25.6%) |
| $3,000 or more | 586 (17.0%) | 131 (10.2%) |
| Total | 3,458 (100.0%) | 1,284 (100.0%) |
Physical Housing Characteristics in Doctor Phillips
Housing Structures in Doctor Phillips
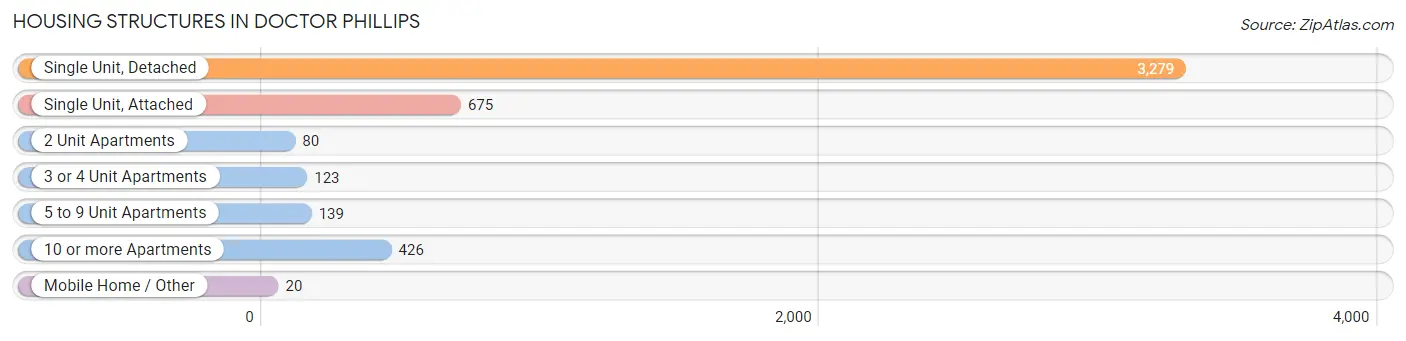
| Structure Type | # Housing Units | % Housing Units |
| Single Unit, Detached | 3,279 | 69.2% |
| Single Unit, Attached | 675 | 14.2% |
| 2 Unit Apartments | 80 | 1.7% |
| 3 or 4 Unit Apartments | 123 | 2.6% |
| 5 to 9 Unit Apartments | 139 | 2.9% |
| 10 or more Apartments | 426 | 9.0% |
| Mobile Home / Other | 20 | 0.4% |
| Total | 4,742 | 100.0% |
Housing Structures by Occupancy in Doctor Phillips
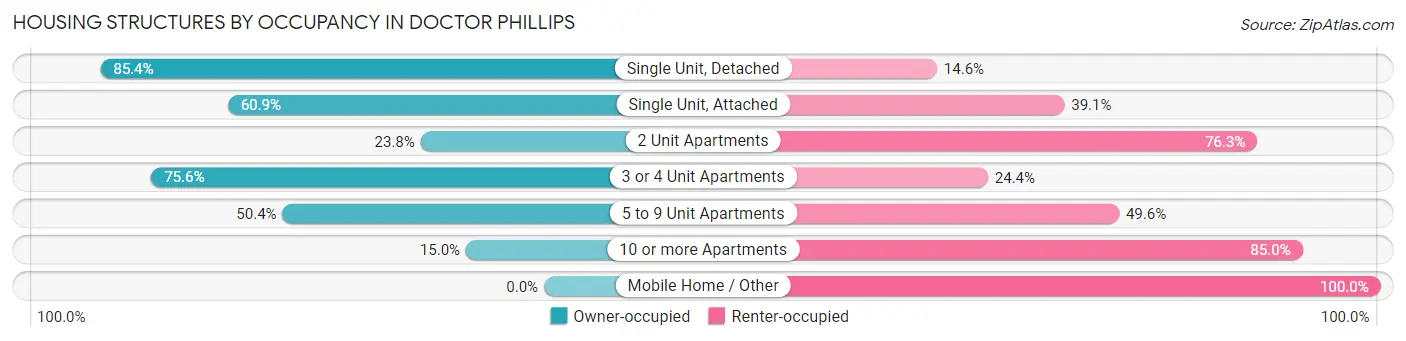
| Structure Type | Owner-occupied | Renter-occupied |
| Single Unit, Detached | 2,801 (85.4%) | 478 (14.6%) |
| Single Unit, Attached | 411 (60.9%) | 264 (39.1%) |
| 2 Unit Apartments | 19 (23.7%) | 61 (76.2%) |
| 3 or 4 Unit Apartments | 93 (75.6%) | 30 (24.4%) |
| 5 to 9 Unit Apartments | 70 (50.4%) | 69 (49.6%) |
| 10 or more Apartments | 64 (15.0%) | 362 (85.0%) |
| Mobile Home / Other | 0 (0.0%) | 20 (100.0%) |
| Total | 3,458 (72.9%) | 1,284 (27.1%) |
Housing Structures by Number of Rooms in Doctor Phillips
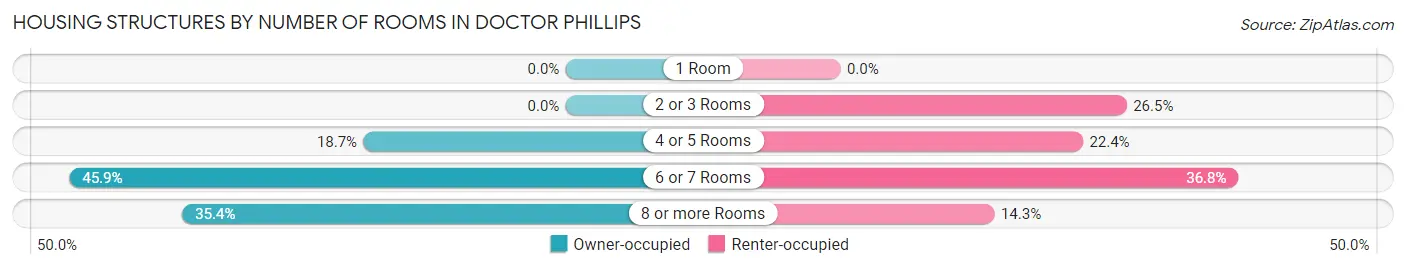
| Number of Rooms | Owner-occupied | Renter-occupied |
| 1 Room | 0 (0.0%) | 0 (0.0%) |
| 2 or 3 Rooms | 0 (0.0%) | 340 (26.5%) |
| 4 or 5 Rooms | 647 (18.7%) | 288 (22.4%) |
| 6 or 7 Rooms | 1,586 (45.9%) | 473 (36.8%) |
| 8 or more Rooms | 1,225 (35.4%) | 183 (14.2%) |
| Total | 3,458 (100.0%) | 1,284 (100.0%) |
Housing Structure by Heating Type in Doctor Phillips
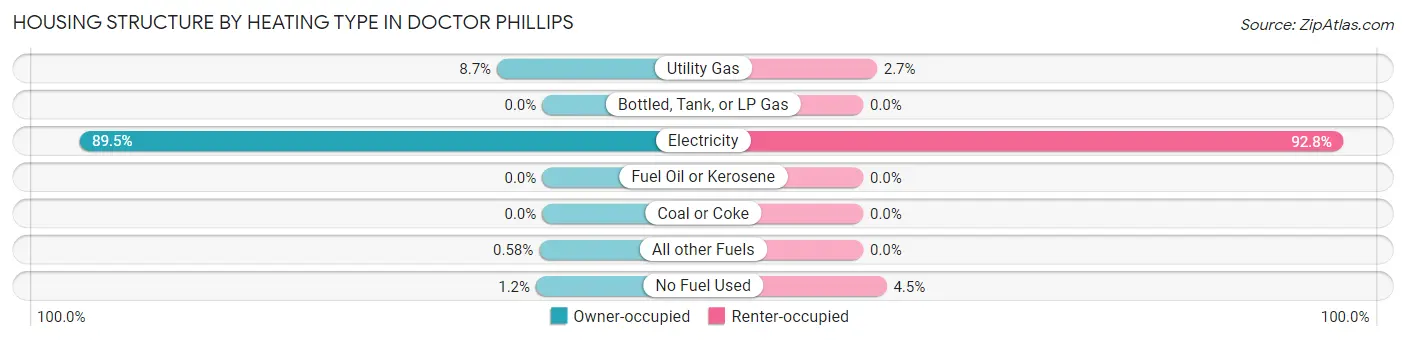
| Heating Type | Owner-occupied | Renter-occupied |
| Utility Gas | 302 (8.7%) | 34 (2.6%) |
| Bottled, Tank, or LP Gas | 0 (0.0%) | 0 (0.0%) |
| Electricity | 3,094 (89.5%) | 1,192 (92.8%) |
| Fuel Oil or Kerosene | 0 (0.0%) | 0 (0.0%) |
| Coal or Coke | 0 (0.0%) | 0 (0.0%) |
| All other Fuels | 20 (0.6%) | 0 (0.0%) |
| No Fuel Used | 42 (1.2%) | 58 (4.5%) |
| Total | 3,458 (100.0%) | 1,284 (100.0%) |
Household Vehicle Usage in Doctor Phillips
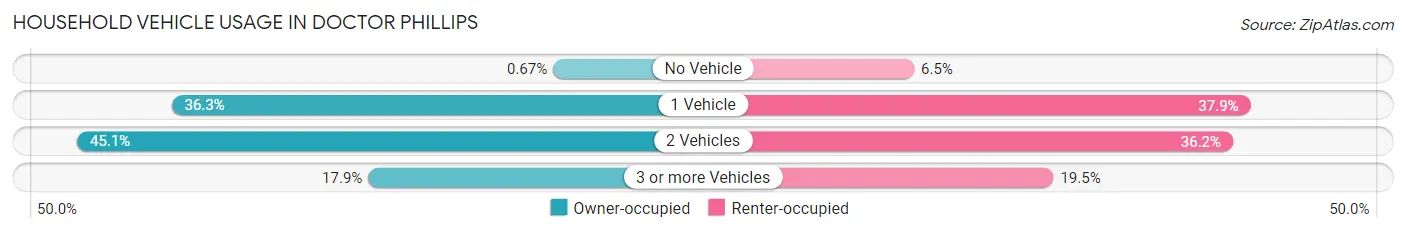
| Vehicles per Household | Owner-occupied | Renter-occupied |
| No Vehicle | 23 (0.7%) | 83 (6.5%) |
| 1 Vehicle | 1,255 (36.3%) | 486 (37.9%) |
| 2 Vehicles | 1,560 (45.1%) | 465 (36.2%) |
| 3 or more Vehicles | 620 (17.9%) | 250 (19.5%) |
| Total | 3,458 (100.0%) | 1,284 (100.0%) |
Real Estate & Mortgages in Doctor Phillips
Real Estate and Mortgage Overview in Doctor Phillips
| Characteristic | Without Mortgage | With Mortgage |
| Housing Units | 1,537 | 1,921 |
| Median Property Value | $461,200 | $457,700 |
| Median Household Income | $94,063 | $686 |
| Monthly Housing Costs | $942 | $576 |
| Real Estate Taxes | $4,502 | $29 |
Property Value by Mortgage Status in Doctor Phillips
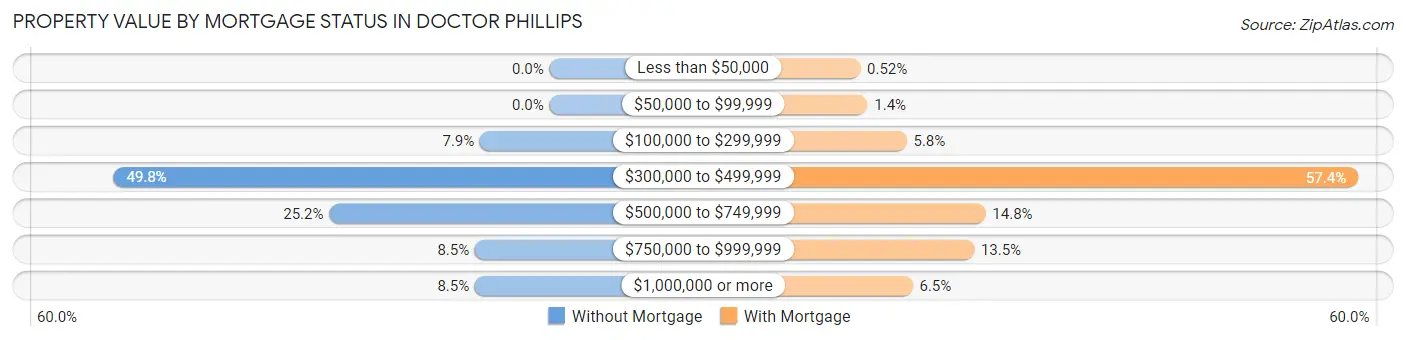
| Property Value | Without Mortgage | With Mortgage |
| Less than $50,000 | 0 (0.0%) | 10 (0.5%) |
| $50,000 to $99,999 | 0 (0.0%) | 26 (1.3%) |
| $100,000 to $299,999 | 122 (7.9%) | 112 (5.8%) |
| $300,000 to $499,999 | 766 (49.8%) | 1,103 (57.4%) |
| $500,000 to $749,999 | 387 (25.2%) | 285 (14.8%) |
| $750,000 to $999,999 | 131 (8.5%) | 260 (13.5%) |
| $1,000,000 or more | 131 (8.5%) | 125 (6.5%) |
| Total | 1,537 (100.0%) | 1,921 (100.0%) |
Household Income by Mortgage Status in Doctor Phillips
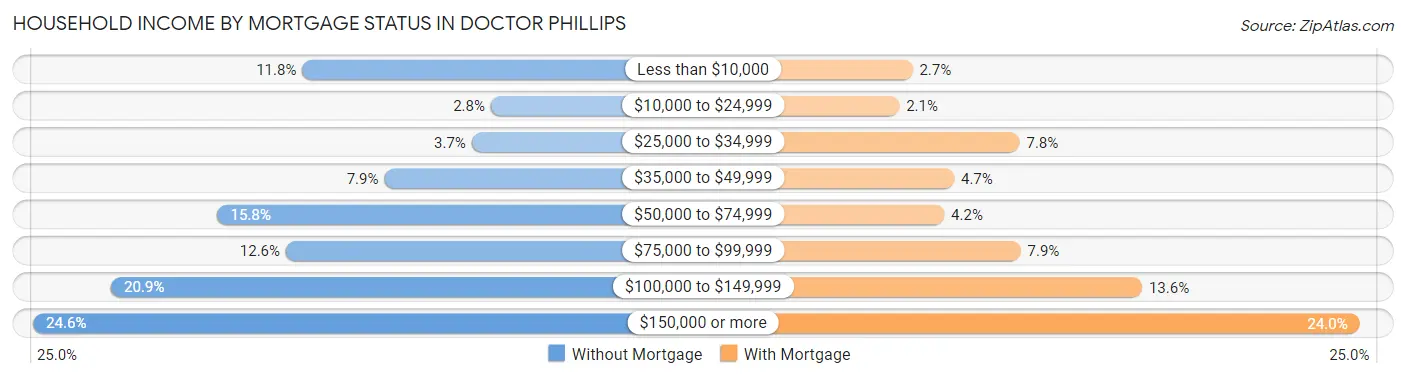
| Household Income | Without Mortgage | With Mortgage |
| Less than $10,000 | 181 (11.8%) | 52 (2.7%) |
| $10,000 to $24,999 | 43 (2.8%) | 40 (2.1%) |
| $25,000 to $34,999 | 57 (3.7%) | 150 (7.8%) |
| $35,000 to $49,999 | 121 (7.9%) | 90 (4.7%) |
| $50,000 to $74,999 | 243 (15.8%) | 81 (4.2%) |
| $75,000 to $99,999 | 193 (12.6%) | 151 (7.9%) |
| $100,000 to $149,999 | 321 (20.9%) | 262 (13.6%) |
| $150,000 or more | 378 (24.6%) | 461 (24.0%) |
| Total | 1,537 (100.0%) | 1,921 (100.0%) |
Property Value to Household Income Ratio in Doctor Phillips
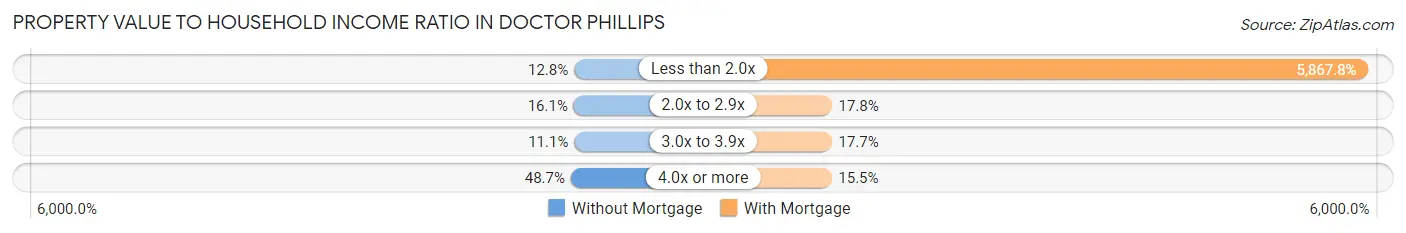
| Value-to-Income Ratio | Without Mortgage | With Mortgage |
| Less than 2.0x | 196 (12.8%) | 112,721 (5,867.8%) |
| 2.0x to 2.9x | 248 (16.1%) | 341 (17.7%) |
| 3.0x to 3.9x | 170 (11.1%) | 339 (17.6%) |
| 4.0x or more | 748 (48.7%) | 298 (15.5%) |
| Total | 1,537 (100.0%) | 1,921 (100.0%) |
Real Estate Taxes by Mortgage Status in Doctor Phillips
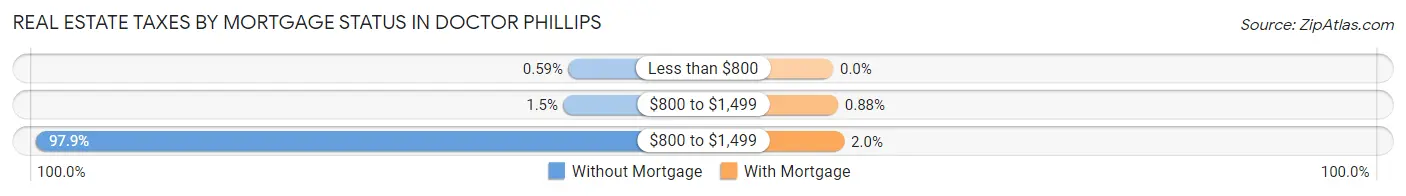
| Property Taxes | Without Mortgage | With Mortgage |
| Less than $800 | 9 (0.6%) | 0 (0.0%) |
| $800 to $1,499 | 23 (1.5%) | 17 (0.9%) |
| $800 to $1,499 | 1,505 (97.9%) | 39 (2.0%) |
| Total | 1,537 (100.0%) | 1,921 (100.0%) |
Health & Disability in Doctor Phillips
Health Insurance Coverage by Age in Doctor Phillips
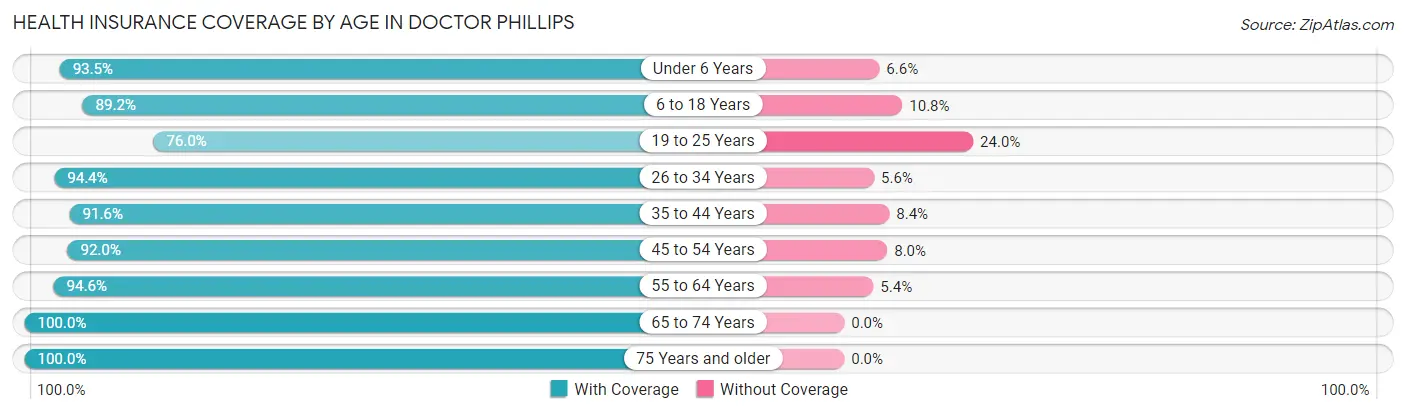
| Age Bracket | With Coverage | Without Coverage |
| Under 6 Years | 428 (93.4%) | 30 (6.6%) |
| 6 to 18 Years | 1,103 (89.2%) | 134 (10.8%) |
| 19 to 25 Years | 702 (76.0%) | 222 (24.0%) |
| 26 to 34 Years | 1,750 (94.4%) | 103 (5.6%) |
| 35 to 44 Years | 1,515 (91.6%) | 139 (8.4%) |
| 45 to 54 Years | 1,193 (92.0%) | 104 (8.0%) |
| 55 to 64 Years | 1,863 (94.6%) | 107 (5.4%) |
| 65 to 74 Years | 1,576 (100.0%) | 0 (0.0%) |
| 75 Years and older | 1,216 (100.0%) | 0 (0.0%) |
| Total | 11,346 (93.1%) | 839 (6.9%) |
Health Insurance Coverage by Citizenship Status in Doctor Phillips
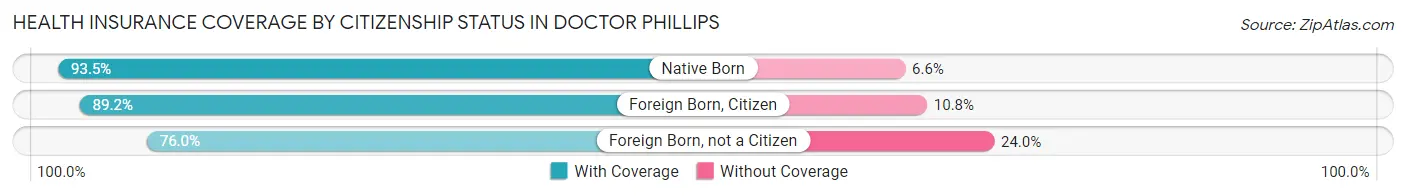
| Citizenship Status | With Coverage | Without Coverage |
| Native Born | 428 (93.4%) | 30 (6.6%) |
| Foreign Born, Citizen | 1,103 (89.2%) | 134 (10.8%) |
| Foreign Born, not a Citizen | 702 (76.0%) | 222 (24.0%) |
Health Insurance Coverage by Household Income in Doctor Phillips
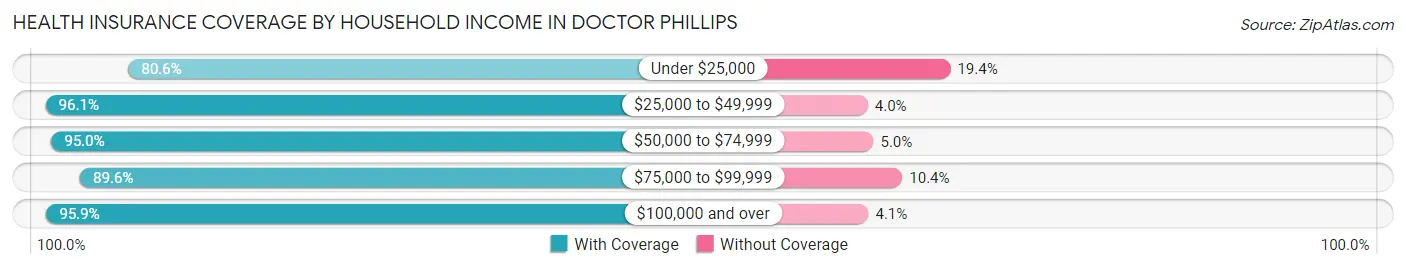
| Household Income | With Coverage | Without Coverage |
| Under $25,000 | 883 (80.6%) | 213 (19.4%) |
| $25,000 to $49,999 | 729 (96.1%) | 30 (4.0%) |
| $50,000 to $74,999 | 1,555 (95.0%) | 82 (5.0%) |
| $75,000 to $99,999 | 2,264 (89.6%) | 263 (10.4%) |
| $100,000 and over | 5,913 (95.9%) | 251 (4.1%) |
Public vs Private Health Insurance Coverage by Age in Doctor Phillips
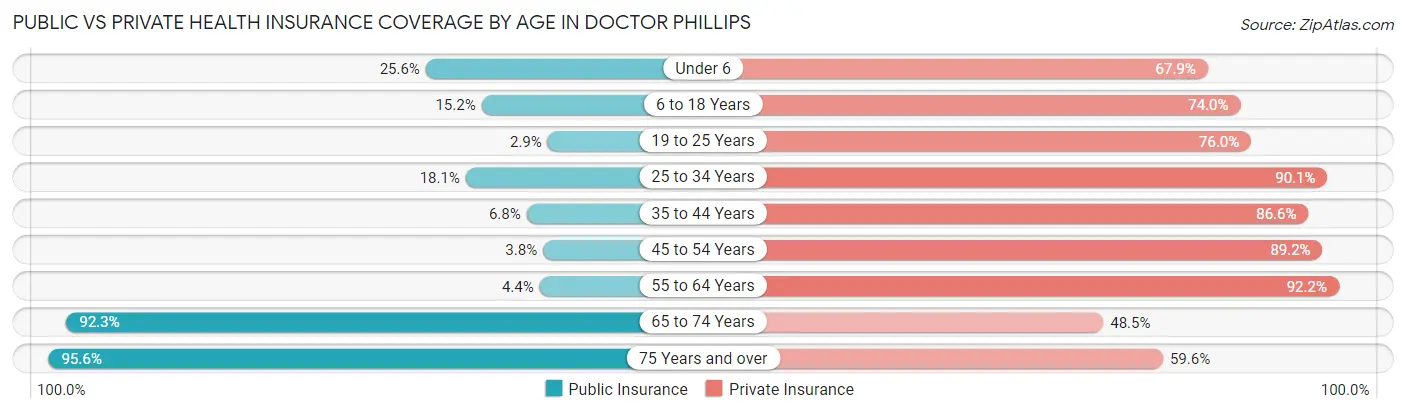
| Age Bracket | Public Insurance | Private Insurance |
| Under 6 | 117 (25.6%) | 311 (67.9%) |
| 6 to 18 Years | 188 (15.2%) | 915 (74.0%) |
| 19 to 25 Years | 27 (2.9%) | 702 (76.0%) |
| 25 to 34 Years | 336 (18.1%) | 1,670 (90.1%) |
| 35 to 44 Years | 113 (6.8%) | 1,432 (86.6%) |
| 45 to 54 Years | 49 (3.8%) | 1,157 (89.2%) |
| 55 to 64 Years | 87 (4.4%) | 1,817 (92.2%) |
| 65 to 74 Years | 1,454 (92.3%) | 765 (48.5%) |
| 75 Years and over | 1,162 (95.6%) | 725 (59.6%) |
| Total | 3,533 (29.0%) | 9,494 (77.9%) |
Disability Status by Sex by Age in Doctor Phillips
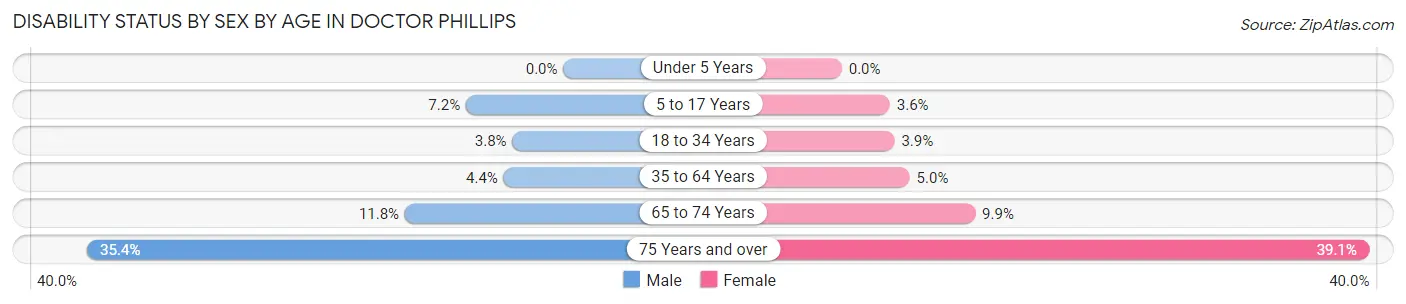
| Age Bracket | Male | Female |
| Under 5 Years | 0 (0.0%) | 0 (0.0%) |
| 5 to 17 Years | 35 (7.2%) | 27 (3.6%) |
| 18 to 34 Years | 44 (3.8%) | 64 (3.9%) |
| 35 to 64 Years | 109 (4.4%) | 124 (5.0%) |
| 65 to 74 Years | 88 (11.8%) | 82 (9.9%) |
| 75 Years and over | 204 (35.4%) | 250 (39.1%) |
Disability Class by Sex by Age in Doctor Phillips
Disability Class: Hearing Difficulty
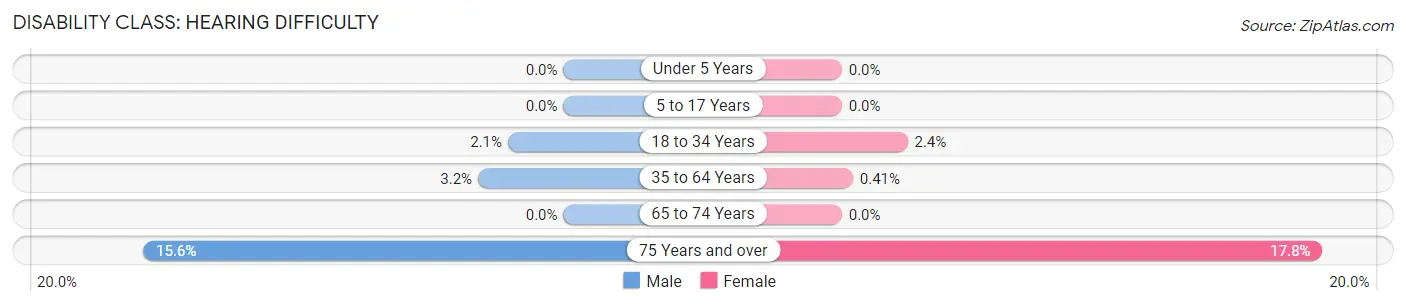
| Age Bracket | Male | Female |
| Under 5 Years | 0 (0.0%) | 0 (0.0%) |
| 5 to 17 Years | 0 (0.0%) | 0 (0.0%) |
| 18 to 34 Years | 24 (2.1%) | 40 (2.4%) |
| 35 to 64 Years | 78 (3.2%) | 10 (0.4%) |
| 65 to 74 Years | 0 (0.0%) | 0 (0.0%) |
| 75 Years and over | 90 (15.6%) | 114 (17.8%) |
Disability Class: Vision Difficulty
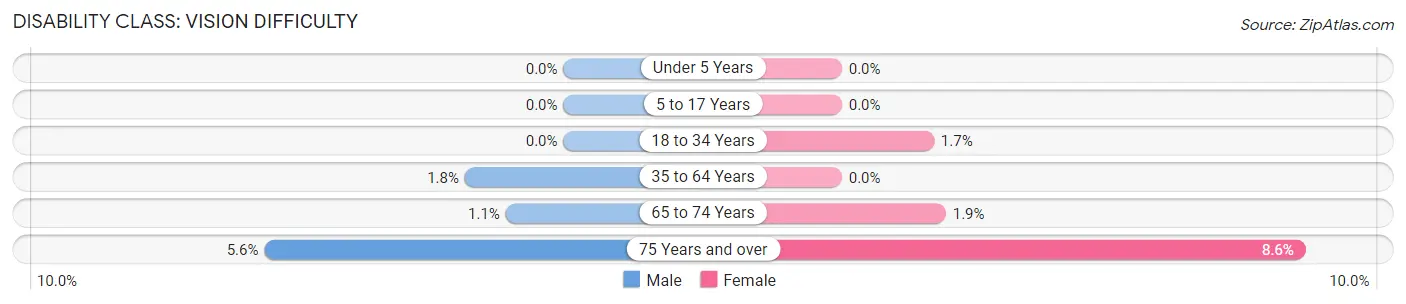
| Age Bracket | Male | Female |
| Under 5 Years | 0 (0.0%) | 0 (0.0%) |
| 5 to 17 Years | 0 (0.0%) | 0 (0.0%) |
| 18 to 34 Years | 0 (0.0%) | 28 (1.7%) |
| 35 to 64 Years | 45 (1.8%) | 0 (0.0%) |
| 65 to 74 Years | 8 (1.1%) | 16 (1.9%) |
| 75 Years and over | 32 (5.6%) | 55 (8.6%) |
Disability Class: Cognitive Difficulty
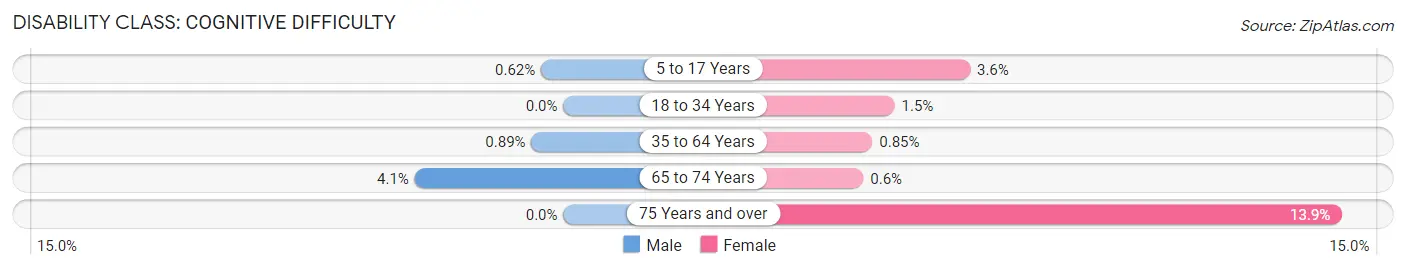
| Age Bracket | Male | Female |
| 5 to 17 Years | 3 (0.6%) | 27 (3.6%) |
| 18 to 34 Years | 0 (0.0%) | 24 (1.5%) |
| 35 to 64 Years | 22 (0.9%) | 21 (0.9%) |
| 65 to 74 Years | 31 (4.1%) | 5 (0.6%) |
| 75 Years and over | 0 (0.0%) | 89 (13.9%) |
Disability Class: Ambulatory Difficulty
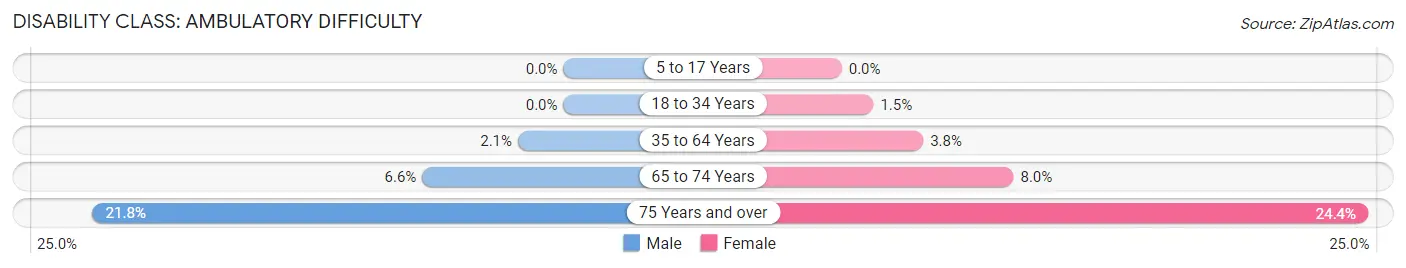
| Age Bracket | Male | Female |
| 5 to 17 Years | 0 (0.0%) | 0 (0.0%) |
| 18 to 34 Years | 0 (0.0%) | 24 (1.5%) |
| 35 to 64 Years | 52 (2.1%) | 93 (3.8%) |
| 65 to 74 Years | 49 (6.6%) | 66 (8.0%) |
| 75 Years and over | 126 (21.8%) | 156 (24.4%) |
Disability Class: Self-Care Difficulty
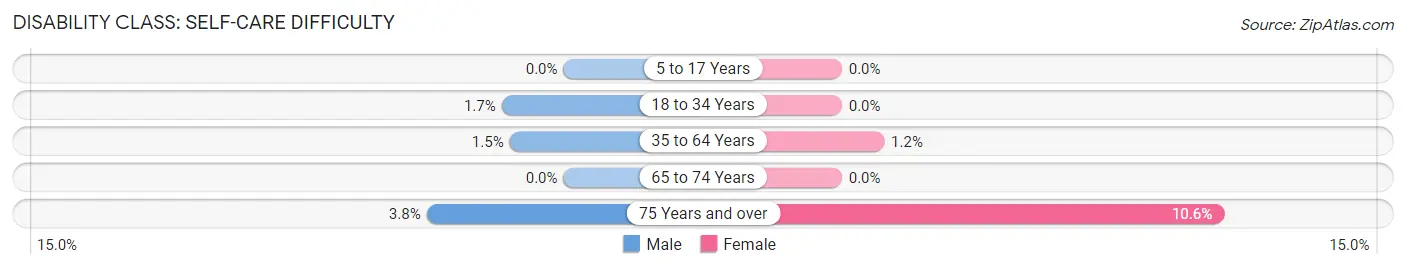
| Age Bracket | Male | Female |
| 5 to 17 Years | 0 (0.0%) | 0 (0.0%) |
| 18 to 34 Years | 20 (1.7%) | 0 (0.0%) |
| 35 to 64 Years | 37 (1.5%) | 29 (1.2%) |
| 65 to 74 Years | 0 (0.0%) | 0 (0.0%) |
| 75 Years and over | 22 (3.8%) | 68 (10.6%) |
Technology Access in Doctor Phillips
Computing Device Access in Doctor Phillips
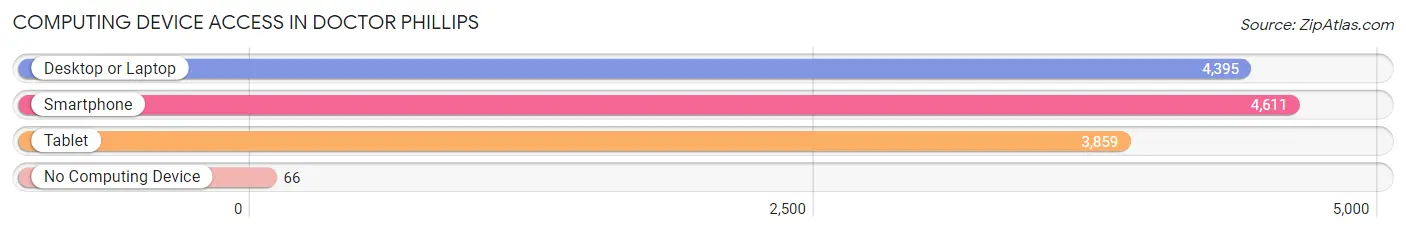
| Device Type | # Households | % Households |
| Desktop or Laptop | 4,395 | 92.7% |
| Smartphone | 4,611 | 97.2% |
| Tablet | 3,859 | 81.4% |
| No Computing Device | 66 | 1.4% |
| Total | 4,742 | 100.0% |
Internet Access in Doctor Phillips
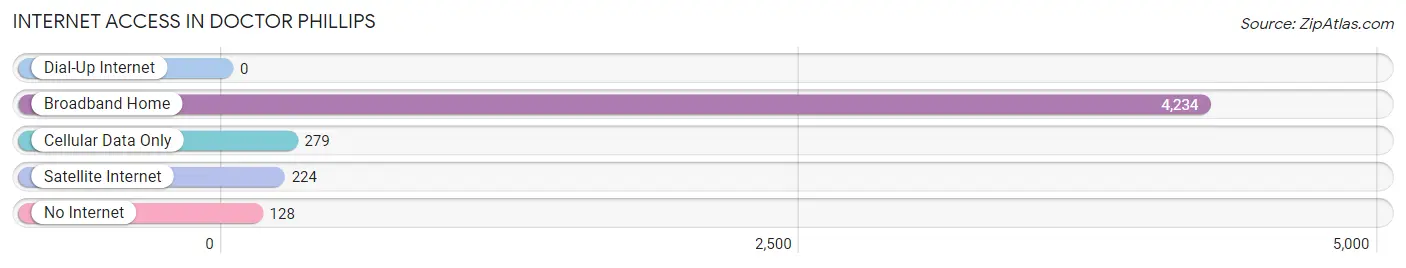
| Internet Type | # Households | % Households |
| Dial-Up Internet | 0 | 0.0% |
| Broadband Home | 4,234 | 89.3% |
| Cellular Data Only | 279 | 5.9% |
| Satellite Internet | 224 | 4.7% |
| No Internet | 128 | 2.7% |
| Total | 4,742 | 100.0% |
Doctor Phillips Summary
Phillips, Florida is a small unincorporated community located in Orange County, Florida. It is located in the heart of Central Florida, just south of Orlando. The community is named after Dr. Phillips, a prominent local physician and citrus grower who donated land for the community's first school.
History
Phillips, Florida was founded in the late 1800s by Dr. Phillips, a prominent local physician and citrus grower. He donated land for the community's first school, which was built in 1891. The school was named after Dr. Phillips and served as the center of the community.
In the early 1900s, the community began to grow and develop. The first post office was established in 1910 and the first church was built in 1911. The community continued to grow and by the 1920s, it had become a thriving agricultural center.
In the 1950s, the community began to experience a population boom as people moved to the area for its proximity to Orlando. The population continued to grow throughout the 1960s and 1970s, and by the 1980s, the community had become a popular residential area.
Geography
Phillips, Florida is located in Orange County, Florida. It is situated in the heart of Central Florida, just south of Orlando. The community is bordered by the cities of Orlando, Winter Park, and Maitland.
The community is located in a flat, low-lying area and is surrounded by wetlands and lakes. The area is known for its natural beauty and is home to a variety of wildlife, including alligators, turtles, and birds.
Economy
Phillips, Florida is primarily a residential community, but it does have a few businesses. The community is home to a variety of restaurants, shops, and services. It is also home to a number of medical facilities, including a hospital and several clinics.
The community is also home to a number of educational institutions, including a public elementary school, a middle school, and a high school. The community is also home to a number of parks and recreational facilities, including a golf course and a community center.
Demographics
As of the 2010 census, the population of Phillips, Florida was 8,945. The population is primarily white (83.3%) and Hispanic (14.2%). The median household income is $50,945 and the median home value is $179,000.
Conclusion
Phillips, Florida is a small unincorporated community located in Orange County, Florida. It is located in the heart of Central Florida, just south of Orlando. The community is named after Dr. Phillips, a prominent local physician and citrus grower who donated land for the community's first school. The community is primarily a residential area, but it does have a few businesses. The population is primarily white and Hispanic and the median household income is $50,945. Phillips, Florida is a beautiful community with a rich history and a bright future.
Common Questions
What is Per Capita Income in Doctor Phillips?
Per Capita income in Doctor Phillips is $60,047.
What is the Median Family Income in Doctor Phillips?
Median Family Income in Doctor Phillips is $104,667.
What is the Median Household income in Doctor Phillips?
Median Household Income in Doctor Phillips is $100,034.
What is Income or Wage Gap in Doctor Phillips?
Income or Wage Gap in Doctor Phillips is 19.6%.
Women in Doctor Phillips earn 80.4 cents for every dollar earned by a man.
What is Inequality or Gini Index in Doctor Phillips?
Inequality or Gini Index in Doctor Phillips is 0.52.
What is the Total Population of Doctor Phillips?
Total Population of Doctor Phillips is 12,278.
What is the Total Male Population of Doctor Phillips?
Total Male Population of Doctor Phillips is 5,836.
What is the Total Female Population of Doctor Phillips?
Total Female Population of Doctor Phillips is 6,442.
What is the Ratio of Males per 100 Females in Doctor Phillips?
There are 90.59 Males per 100 Females in Doctor Phillips.
What is the Ratio of Females per 100 Males in Doctor Phillips?
There are 110.38 Females per 100 Males in Doctor Phillips.
What is the Median Population Age in Doctor Phillips?
Median Population Age in Doctor Phillips is 44.9 Years.
What is the Average Family Size in Doctor Phillips
Average Family Size in Doctor Phillips is 3.1 People.
What is the Average Household Size in Doctor Phillips
Average Household Size in Doctor Phillips is 2.6 People.
How Large is the Labor Force in Doctor Phillips?
There are 6,380 People in the Labor Forcein in Doctor Phillips.
What is the Percentage of People in the Labor Force in Doctor Phillips?
59.4% of People are in the Labor Force in Doctor Phillips.
What is the Unemployment Rate in Doctor Phillips?
Unemployment Rate in Doctor Phillips is 11.3%.