San Isidro, PR Map & Demographics
San Isidro Map
San Isidro Overview
$11,524
PER CAPITA INCOME
$25,363
AVG FAMILY INCOME
$22,753
AVG HOUSEHOLD INCOME
4.8%
WAGE / INCOME GAP [ % ]
95.2¢/ $1
WAGE / INCOME GAP [ $ ]
$11,055
FAMILY INCOME DEFICIT
0.44
INEQUALITY / GINI INDEX
7,285
TOTAL POPULATION
3,668
MALE POPULATION
3,617
FEMALE POPULATION
101.41
MALES / 100 FEMALES
98.61
FEMALES / 100 MALES
43.8
MEDIAN AGE
3.6
AVG FAMILY SIZE
2.8
AVG HOUSEHOLD SIZE
3,211
LABOR FORCE [ PEOPLE ]
53.3%
PERCENT IN LABOR FORCE
19.7%
UNEMPLOYMENT RATE
Income in San Isidro
Income Overview in San Isidro
Per Capita Income in San Isidro is $11,524, while median incomes of families and households are $25,363 and $22,753 respectively.
| Characteristic | Number | Measure |
| Per Capita Income | 7,285 | $11,524 |
| Median Family Income | 1,653 | $25,363 |
| Mean Family Income | 1,653 | $31,697 |
| Median Household Income | 2,584 | $22,753 |
| Mean Household Income | 2,584 | $27,466 |
| Income Deficit | 1,653 | $11,055 |
| Wage / Income Gap (%) | 7,285 | 4.83% |
| Wage / Income Gap ($) | 7,285 | 95.17¢ per $1 |
| Gini / Inequality Index | 7,285 | 0.44 |
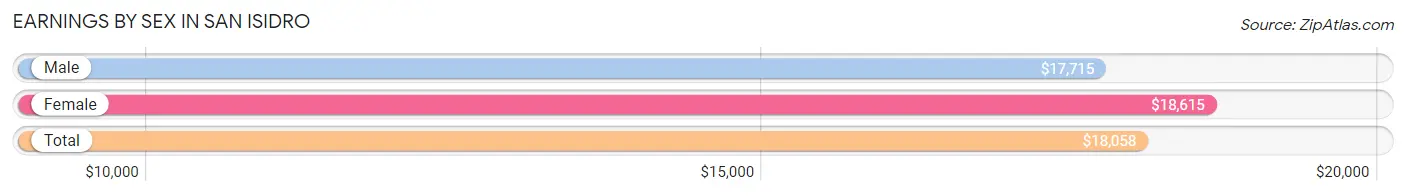
Earnings by Sex in San Isidro
Average Earnings in San Isidro are $18,058, $17,715 for men and $18,615 for women, a difference of 4.8%.
| Sex | Number | Average Earnings |
| Male | 1,597 (57.3%) | $17,715 |
| Female | 1,189 (42.7%) | $18,615 |
| Total | 2,786 (100.0%) | $18,058 |
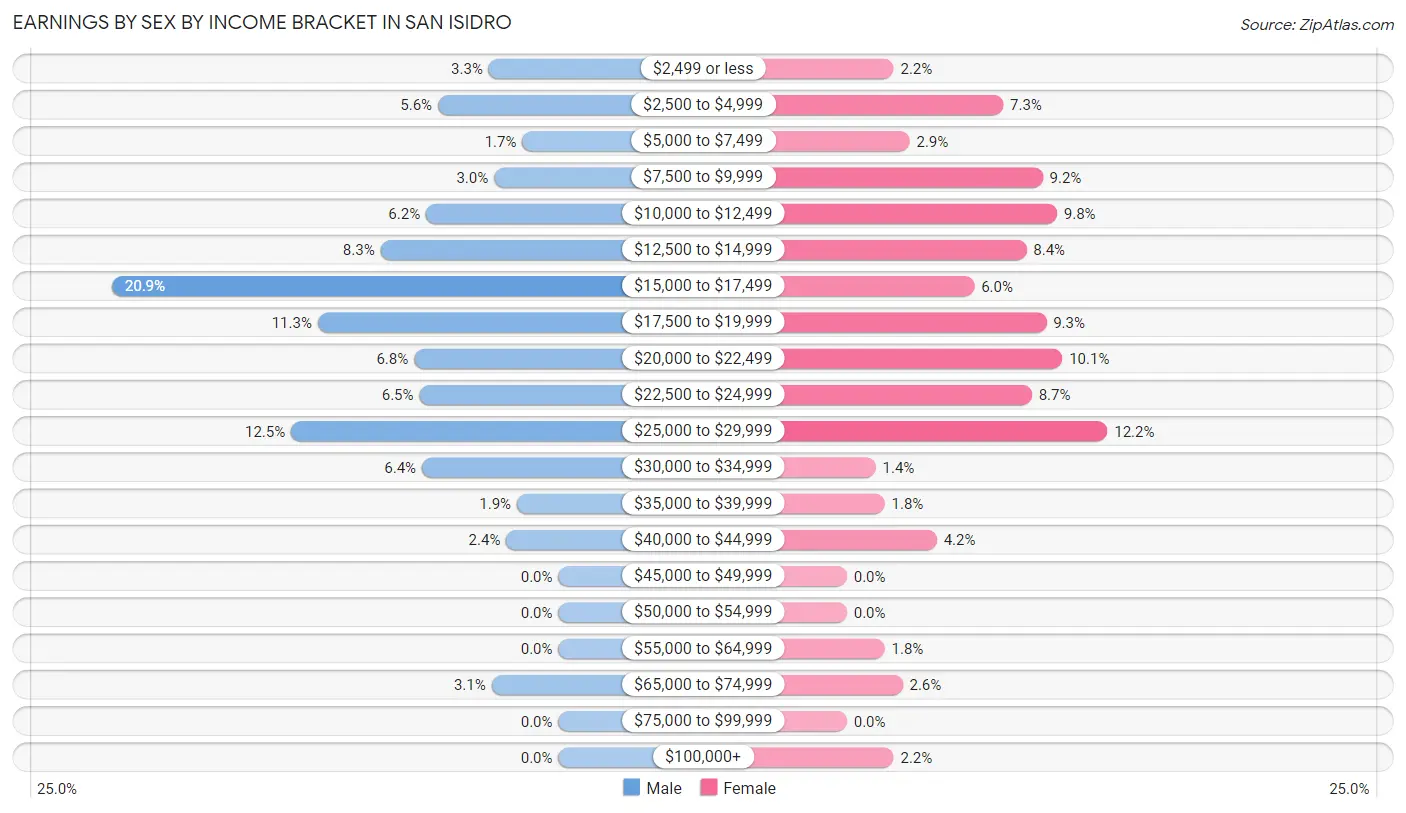
Earnings by Sex by Income Bracket in San Isidro
The most common earnings brackets in San Isidro are $15,000 to $17,499 for men (334 | 20.9%) and $25,000 to $29,999 for women (145 | 12.2%).
| Income | Male | Female |
| $2,499 or less | 52 (3.3%) | 26 (2.2%) |
| $2,500 to $4,999 | 90 (5.6%) | 87 (7.3%) |
| $5,000 to $7,499 | 27 (1.7%) | 35 (2.9%) |
| $7,500 to $9,999 | 48 (3.0%) | 109 (9.2%) |
| $10,000 to $12,499 | 99 (6.2%) | 117 (9.8%) |
| $12,500 to $14,999 | 133 (8.3%) | 100 (8.4%) |
| $15,000 to $17,499 | 334 (20.9%) | 71 (6.0%) |
| $17,500 to $19,999 | 180 (11.3%) | 111 (9.3%) |
| $20,000 to $22,499 | 108 (6.8%) | 120 (10.1%) |
| $22,500 to $24,999 | 104 (6.5%) | 103 (8.7%) |
| $25,000 to $29,999 | 200 (12.5%) | 145 (12.2%) |
| $30,000 to $34,999 | 102 (6.4%) | 16 (1.3%) |
| $35,000 to $39,999 | 31 (1.9%) | 21 (1.8%) |
| $40,000 to $44,999 | 39 (2.4%) | 50 (4.2%) |
| $45,000 to $49,999 | 0 (0.0%) | 0 (0.0%) |
| $50,000 to $54,999 | 0 (0.0%) | 0 (0.0%) |
| $55,000 to $64,999 | 0 (0.0%) | 21 (1.8%) |
| $65,000 to $74,999 | 50 (3.1%) | 31 (2.6%) |
| $75,000 to $99,999 | 0 (0.0%) | 0 (0.0%) |
| $100,000+ | 0 (0.0%) | 26 (2.2%) |
| Total | 1,597 (100.0%) | 1,189 (100.0%) |
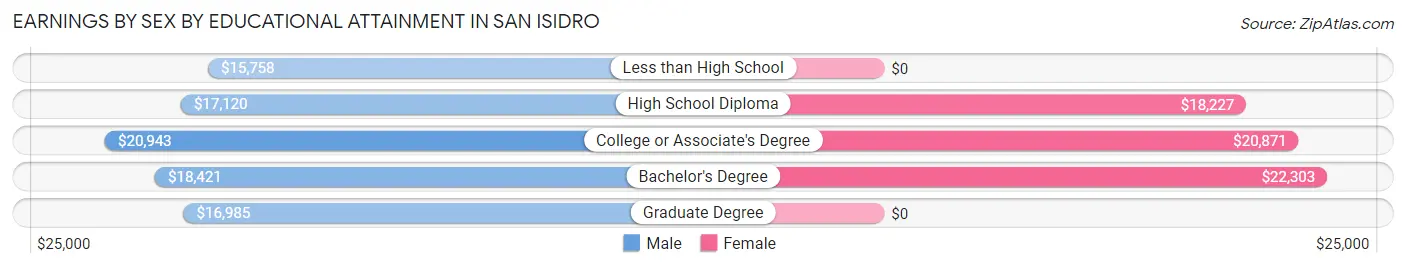
Earnings by Sex by Educational Attainment in San Isidro
Average earnings in San Isidro are $17,537 for men and $19,854 for women, a difference of 11.7%. Men with an educational attainment of college or associate's degree enjoy the highest average annual earnings of $20,943, while those with less than high school education earn the least with $15,758. Women with an educational attainment of bachelor's degree earn the most with the average annual earnings of $22,303, while those with high school diploma education have the smallest earnings of $18,227.
| Educational Attainment | Male Income | Female Income |
| Less than High School | $15,758 | $0 |
| High School Diploma | $17,120 | $18,227 |
| College or Associate's Degree | $20,943 | $20,871 |
| Bachelor's Degree | $18,421 | $22,303 |
| Graduate Degree | $16,985 | $0 |
| Total | $17,537 | $19,854 |
Family Income in San Isidro
Family Income Brackets in San Isidro
According to the San Isidro family income data, there are 445 families falling into the $15,000 to $24,999 income range, which is the most common income bracket and makes up 26.9% of all families.
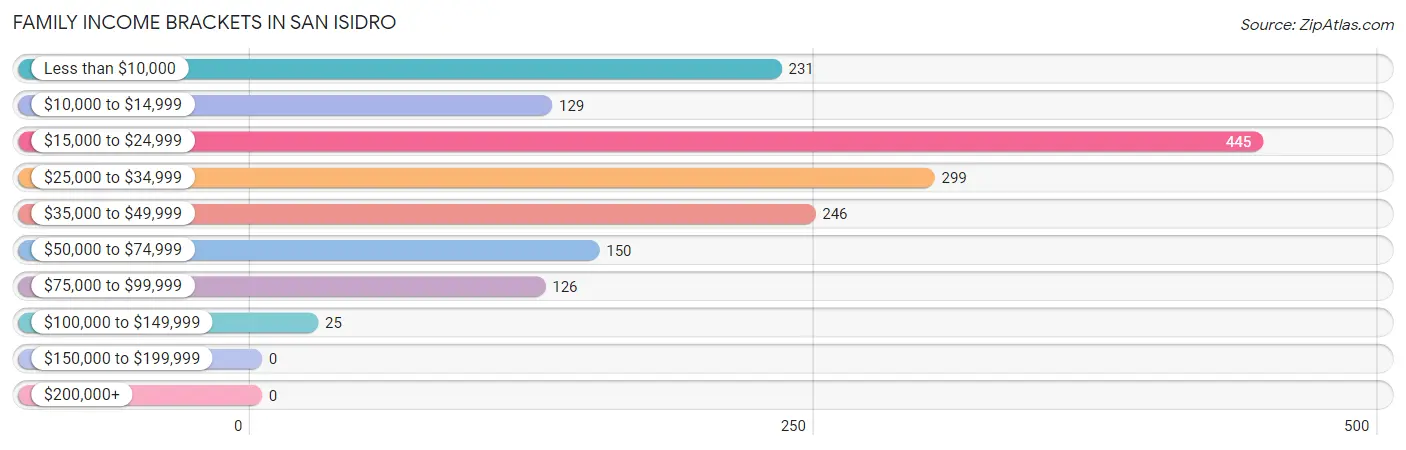
| Income Bracket | # Families | % Families |
| Less than $10,000 | 231 | 14.0% |
| $10,000 to $14,999 | 129 | 7.8% |
| $15,000 to $24,999 | 445 | 26.9% |
| $25,000 to $34,999 | 299 | 18.1% |
| $35,000 to $49,999 | 246 | 14.9% |
| $50,000 to $74,999 | 150 | 9.1% |
| $75,000 to $99,999 | 126 | 7.6% |
| $100,000 to $149,999 | 25 | 1.5% |
| $150,000 to $199,999 | 0 | 0.0% |
| $200,000+ | 0 | 0.0% |
Family Income by Famaliy Size in San Isidro
4-person families (355 | 21.5%) account for the highest median family income in San Isidro with $38,393 per family, while 2-person families (804 | 48.6%) have the highest median income of $10,373 per family member.
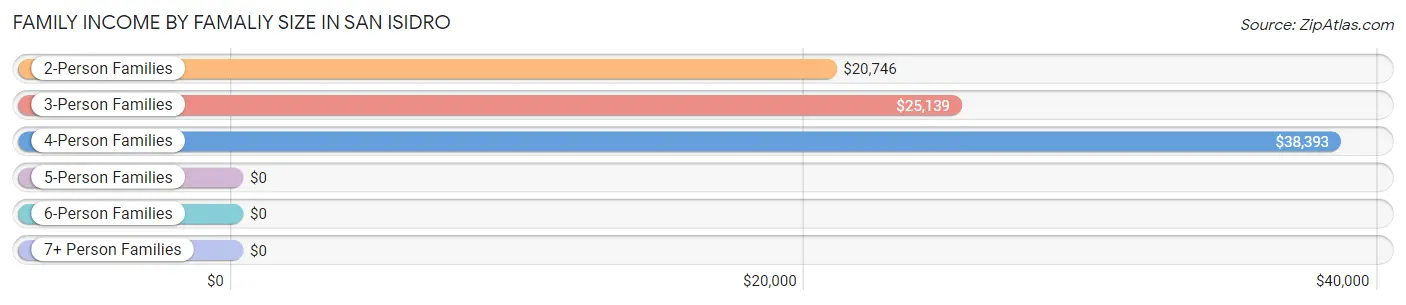
| Income Bracket | # Families | Median Income |
| 2-Person Families | 804 (48.6%) | $20,746 |
| 3-Person Families | 305 (18.4%) | $25,139 |
| 4-Person Families | 355 (21.5%) | $38,393 |
| 5-Person Families | 120 (7.3%) | $0 |
| 6-Person Families | 31 (1.9%) | $0 |
| 7+ Person Families | 38 (2.3%) | $0 |
| Total | 1,653 (100.0%) | $25,363 |
Family Income by Number of Earners in San Isidro
The median family income in San Isidro is $25,363, with families comprising 3+ earners (50) having the highest median family income of $52,895, while families with no earners (483) have the lowest median family income of $14,375, accounting for 3.0% and 29.2% of families, respectively.
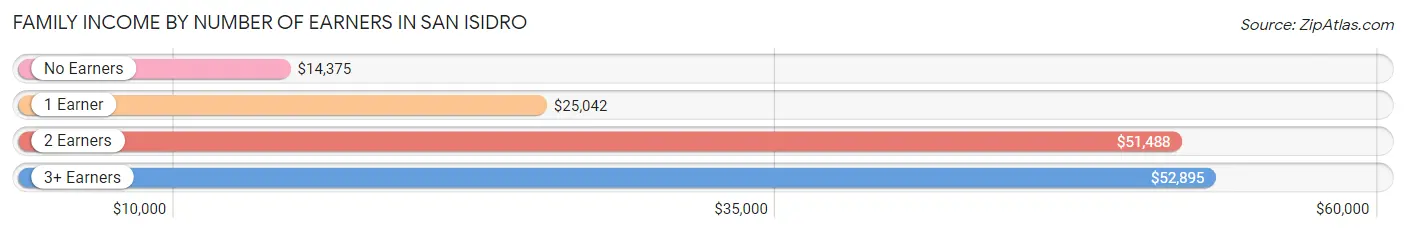
| Number of Earners | # Families | Median Income |
| No Earners | 483 (29.2%) | $14,375 |
| 1 Earner | 745 (45.1%) | $25,042 |
| 2 Earners | 375 (22.7%) | $51,488 |
| 3+ Earners | 50 (3.0%) | $52,895 |
| Total | 1,653 (100.0%) | $25,363 |
Household Income in San Isidro
Household Income Brackets in San Isidro
With 623 households falling in the category, the $15,000 to $24,999 income range is the most frequent in San Isidro, accounting for 24.1% of all households.
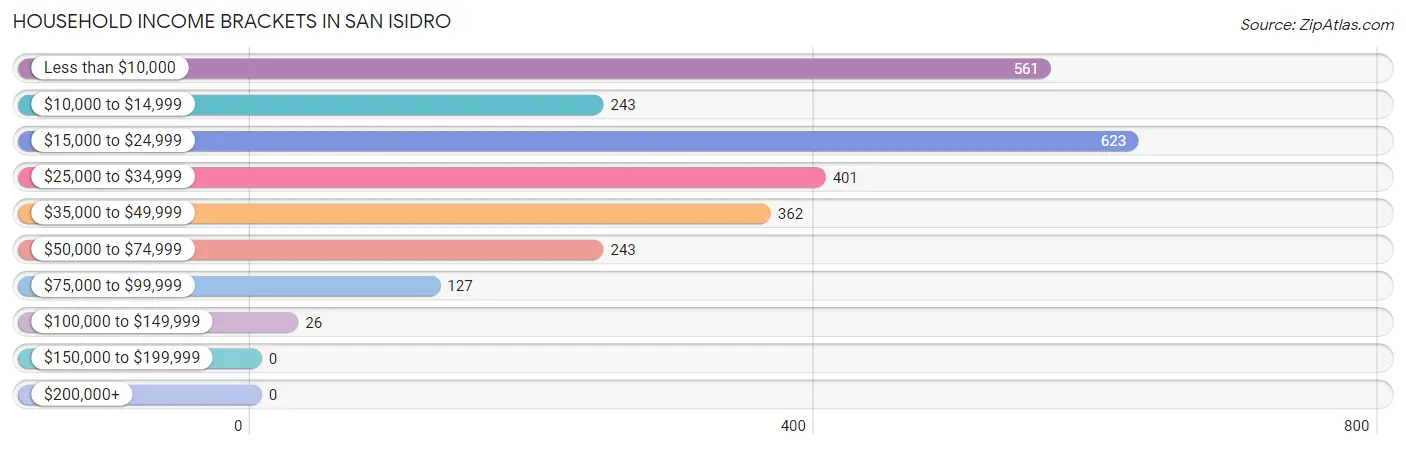
| Income Bracket | # Households | % Households |
| Less than $10,000 | 561 | 21.7% |
| $10,000 to $14,999 | 243 | 9.4% |
| $15,000 to $24,999 | 623 | 24.1% |
| $25,000 to $34,999 | 401 | 15.5% |
| $35,000 to $49,999 | 362 | 14.0% |
| $50,000 to $74,999 | 243 | 9.4% |
| $75,000 to $99,999 | 127 | 4.9% |
| $100,000 to $149,999 | 26 | 1.0% |
| $150,000 to $199,999 | 0 | 0.0% |
| $200,000+ | 0 | 0.0% |
Household Income by Householder Age in San Isidro
The median household income in San Isidro is $22,753, with the highest median household income of $25,383 found in the 25 to 44 years age bracket for the primary householder. A total of 577 households (22.3%) fall into this category. Meanwhile, the 15 to 24 years age bracket for the primary householder has the lowest median household income of $0, with 42 households (1.6%) in this group.
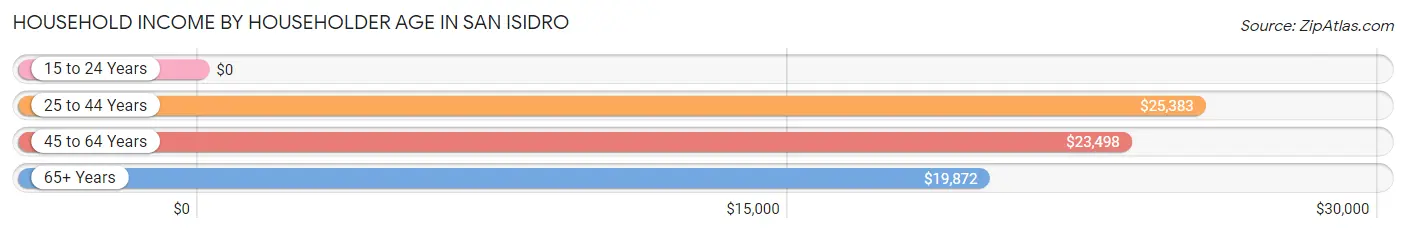
| Income Bracket | # Households | Median Income |
| 15 to 24 Years | 42 (1.6%) | $0 |
| 25 to 44 Years | 577 (22.3%) | $25,383 |
| 45 to 64 Years | 1,105 (42.8%) | $23,498 |
| 65+ Years | 860 (33.3%) | $19,872 |
| Total | 2,584 (100.0%) | $22,753 |
Poverty in San Isidro
Income Below Poverty by Sex and Age in San Isidro
With 40.5% poverty level for males and 46.6% for females among the residents of San Isidro, 16 and 17 year old males and under 5 year old females are the most vulnerable to poverty, with 51 males (69.9%) and 138 females (100.0%) in their respective age groups living below the poverty level.
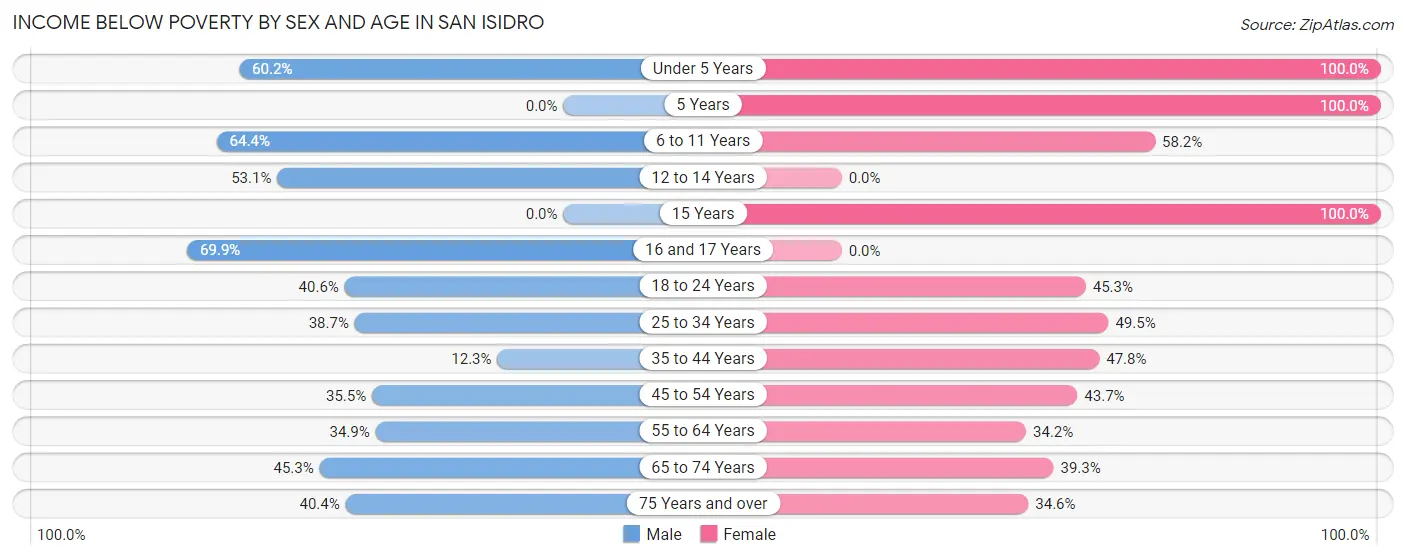
| Age Bracket | Male | Female |
| Under 5 Years | 139 (60.2%) | 138 (100.0%) |
| 5 Years | 0 (0.0%) | 67 (100.0%) |
| 6 to 11 Years | 139 (64.3%) | 157 (58.2%) |
| 12 to 14 Years | 128 (53.1%) | 0 (0.0%) |
| 15 Years | 0 (0.0%) | 17 (100.0%) |
| 16 and 17 Years | 51 (69.9%) | 0 (0.0%) |
| 18 to 24 Years | 110 (40.6%) | 149 (45.3%) |
| 25 to 34 Years | 182 (38.7%) | 249 (49.5%) |
| 35 to 44 Years | 31 (12.2%) | 250 (47.8%) |
| 45 to 54 Years | 288 (35.5%) | 244 (43.7%) |
| 55 to 64 Years | 145 (34.9%) | 156 (34.2%) |
| 65 to 74 Years | 181 (45.3%) | 134 (39.3%) |
| 75 Years and over | 93 (40.4%) | 125 (34.6%) |
| Total | 1,487 (40.5%) | 1,686 (46.6%) |
Income Above Poverty by Sex and Age in San Isidro
According to the poverty statistics in San Isidro, males aged 5 years and females aged 12 to 14 years are the age groups that are most secure financially, with 100.0% of males and 100.0% of females in these age groups living above the poverty line.
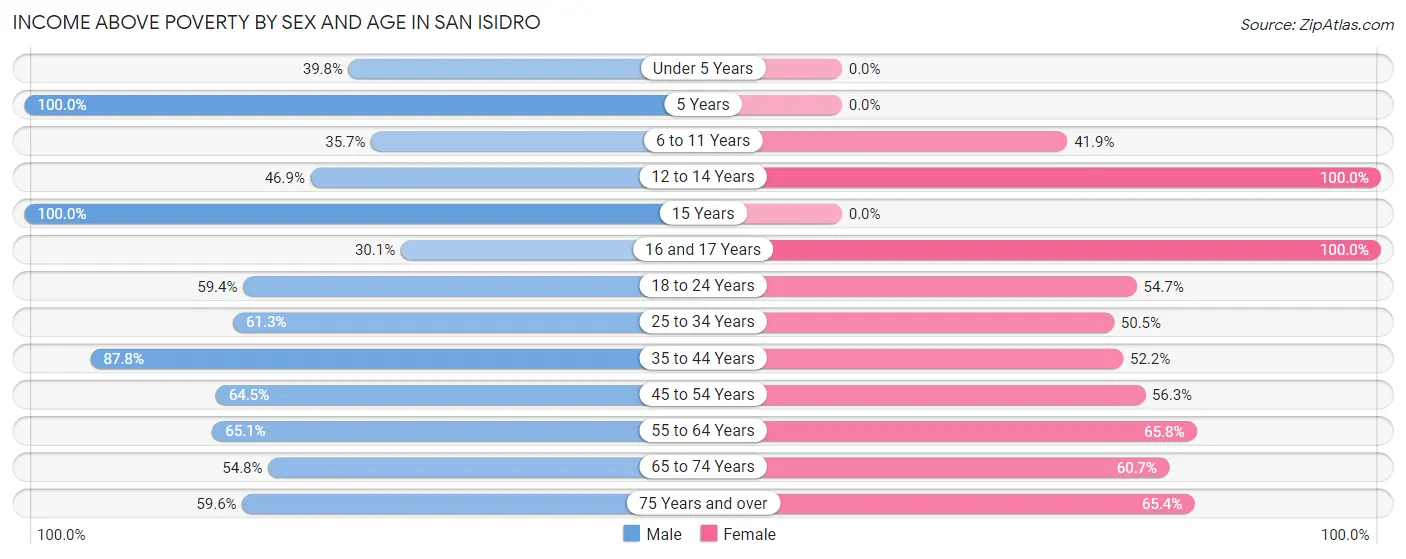
| Age Bracket | Male | Female |
| Under 5 Years | 92 (39.8%) | 0 (0.0%) |
| 5 Years | 22 (100.0%) | 0 (0.0%) |
| 6 to 11 Years | 77 (35.6%) | 113 (41.8%) |
| 12 to 14 Years | 113 (46.9%) | 25 (100.0%) |
| 15 Years | 34 (100.0%) | 0 (0.0%) |
| 16 and 17 Years | 22 (30.1%) | 29 (100.0%) |
| 18 to 24 Years | 161 (59.4%) | 180 (54.7%) |
| 25 to 34 Years | 288 (61.3%) | 254 (50.5%) |
| 35 to 44 Years | 222 (87.7%) | 273 (52.2%) |
| 45 to 54 Years | 523 (64.5%) | 314 (56.3%) |
| 55 to 64 Years | 271 (65.1%) | 300 (65.8%) |
| 65 to 74 Years | 219 (54.7%) | 207 (60.7%) |
| 75 Years and over | 137 (59.6%) | 236 (65.4%) |
| Total | 2,181 (59.5%) | 1,931 (53.4%) |
Income Below Poverty Among Married-Couple Families in San Isidro
The poverty statistics for married-couple families in San Isidro show that 26.4% or 214 of the total 812 families live below the poverty line. Families with 3 or 4 children have the highest poverty rate of 50.0%, comprising of 20 families. On the other hand, families with no children have the lowest poverty rate of 24.0%, which includes 142 families.
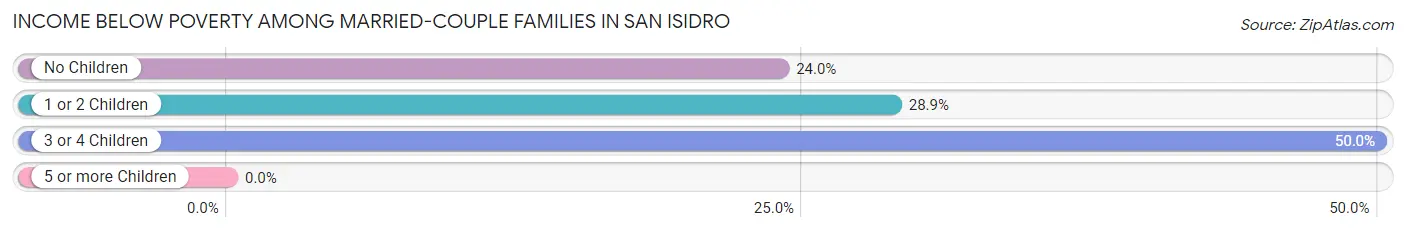
| Children | Above Poverty | Below Poverty |
| No Children | 450 (76.0%) | 142 (24.0%) |
| 1 or 2 Children | 128 (71.1%) | 52 (28.9%) |
| 3 or 4 Children | 20 (50.0%) | 20 (50.0%) |
| 5 or more Children | 0 (0.0%) | 0 (0.0%) |
| Total | 598 (73.7%) | 214 (26.4%) |
Income Below Poverty Among Single-Parent Households in San Isidro
According to the poverty data in San Isidro, 75.6% or 87 single-father households and 51.4% or 373 single-mother households are living below the poverty line. Among single-father households, those with 1 or 2 children have the highest poverty rate, with 27 households (100.0%) experiencing poverty. Likewise, among single-mother households, those with 5 or more children have the highest poverty rate, with 17 households (100.0%) falling below the poverty line.
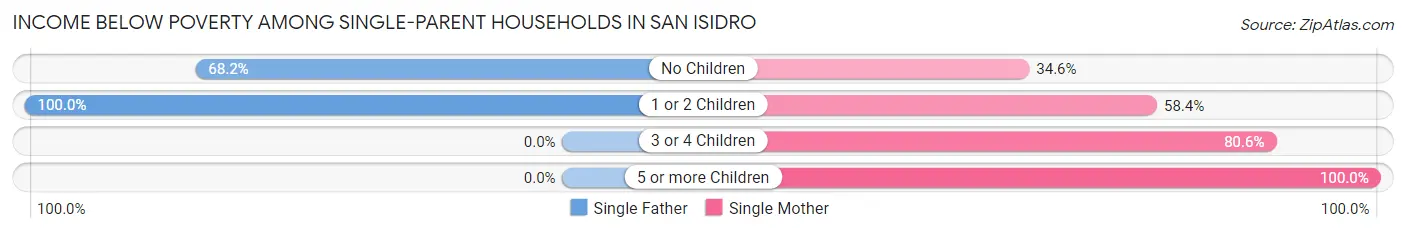
| Children | Single Father | Single Mother |
| No Children | 60 (68.2%) | 119 (34.6%) |
| 1 or 2 Children | 27 (100.0%) | 150 (58.4%) |
| 3 or 4 Children | 0 (0.0%) | 87 (80.6%) |
| 5 or more Children | 0 (0.0%) | 17 (100.0%) |
| Total | 87 (75.6%) | 373 (51.4%) |
Income Below Poverty Among Married-Couple vs Single-Parent Households in San Isidro
The poverty data for San Isidro shows that 214 of the married-couple family households (26.4%) and 460 of the single-parent households (54.7%) are living below the poverty level. Within the married-couple family households, those with 3 or 4 children have the highest poverty rate, with 20 households (50.0%) falling below the poverty line. Among the single-parent households, those with 5 or more children have the highest poverty rate, with 17 household (100.0%) living below poverty.
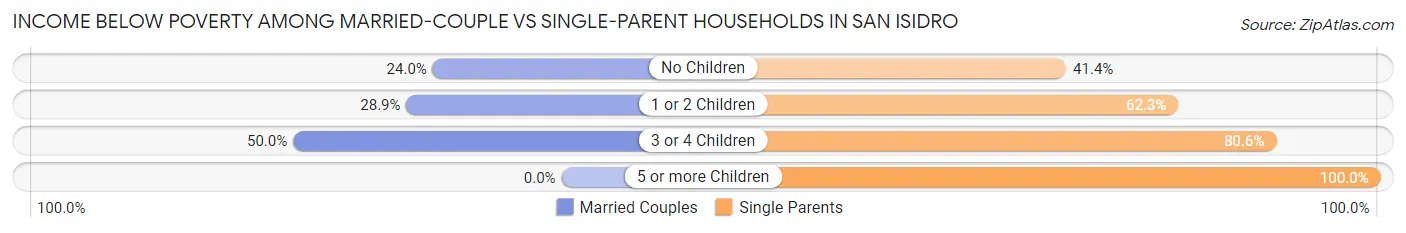
| Children | Married-Couple Families | Single-Parent Households |
| No Children | 142 (24.0%) | 179 (41.4%) |
| 1 or 2 Children | 52 (28.9%) | 177 (62.3%) |
| 3 or 4 Children | 20 (50.0%) | 87 (80.6%) |
| 5 or more Children | 0 (0.0%) | 17 (100.0%) |
| Total | 214 (26.4%) | 460 (54.7%) |
Race in San Isidro
The most populous races in San Isidro are Hispanic or Latino (7,285 | 100.0%), Some other Race (3,418 | 46.9%), and White / Caucasian (1,997 | 27.4%).
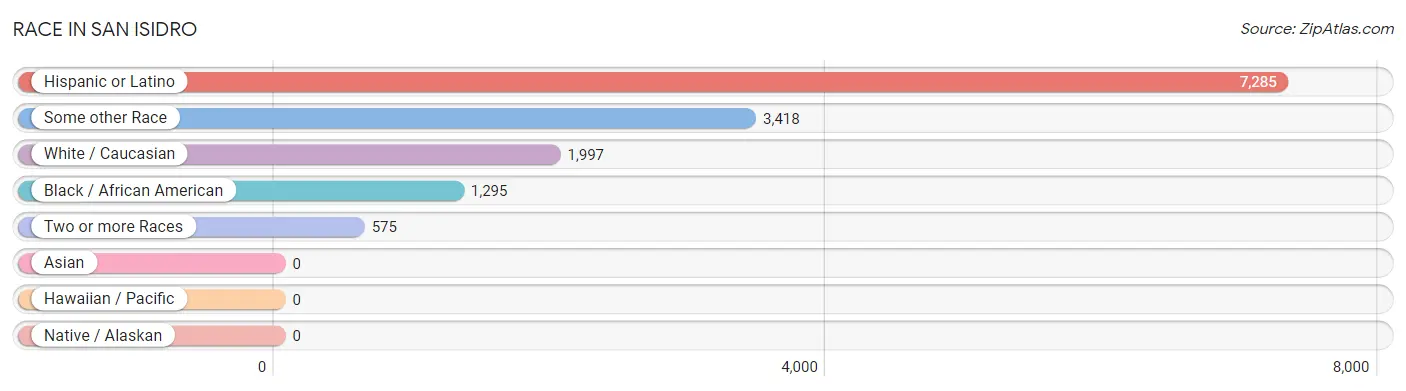
| Race | # Population | % Population |
| Asian | 0 | 0.0% |
| Black / African American | 1,295 | 17.8% |
| Hawaiian / Pacific | 0 | 0.0% |
| Hispanic or Latino | 7,285 | 100.0% |
| Native / Alaskan | 0 | 0.0% |
| White / Caucasian | 1,997 | 27.4% |
| Two or more Races | 575 | 7.9% |
| Some other Race | 3,418 | 46.9% |
| Total | 7,285 | 100.0% |
Ancestry in San Isidro
The most populous ancestries reported in San Isidro are Puerto Rican (7,114 | 97.7%), Dominican (171 | 2.4%), African (35 | 0.5%), Subsaharan African (35 | 0.5%), and American (30 | 0.4%), together accounting for 101.4% of all San Isidro residents.
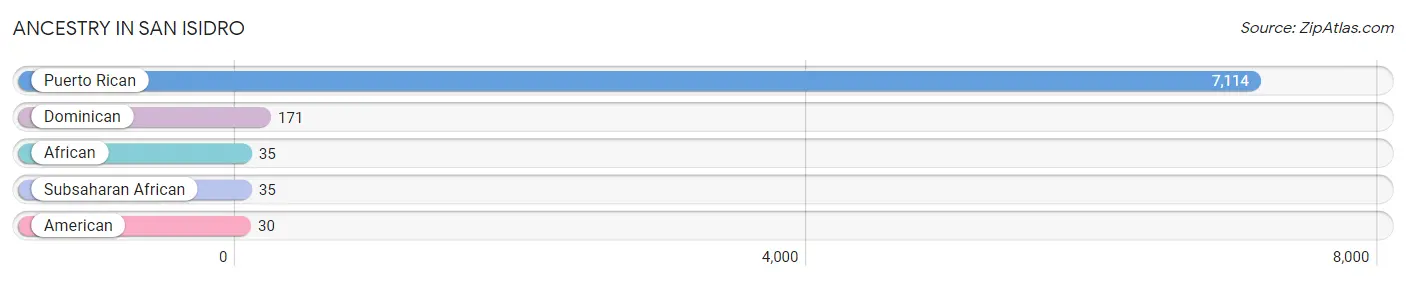
| Ancestry | # Population | % Population |
| African | 35 | 0.5% |
| American | 30 | 0.4% |
| Dominican | 171 | 2.4% |
| Puerto Rican | 7,114 | 97.7% |
| Subsaharan African | 35 | 0.5% | View All 5 Rows |
Immigrants in San Isidro

| Immigration Origin | # Population | % Population | View All 0 Rows |
Sex and Age in San Isidro
Sex and Age in San Isidro
The most populous age groups in San Isidro are 50 to 54 Years (467 | 12.7%) for men and 25 to 29 Years (323 | 8.9%) for women.
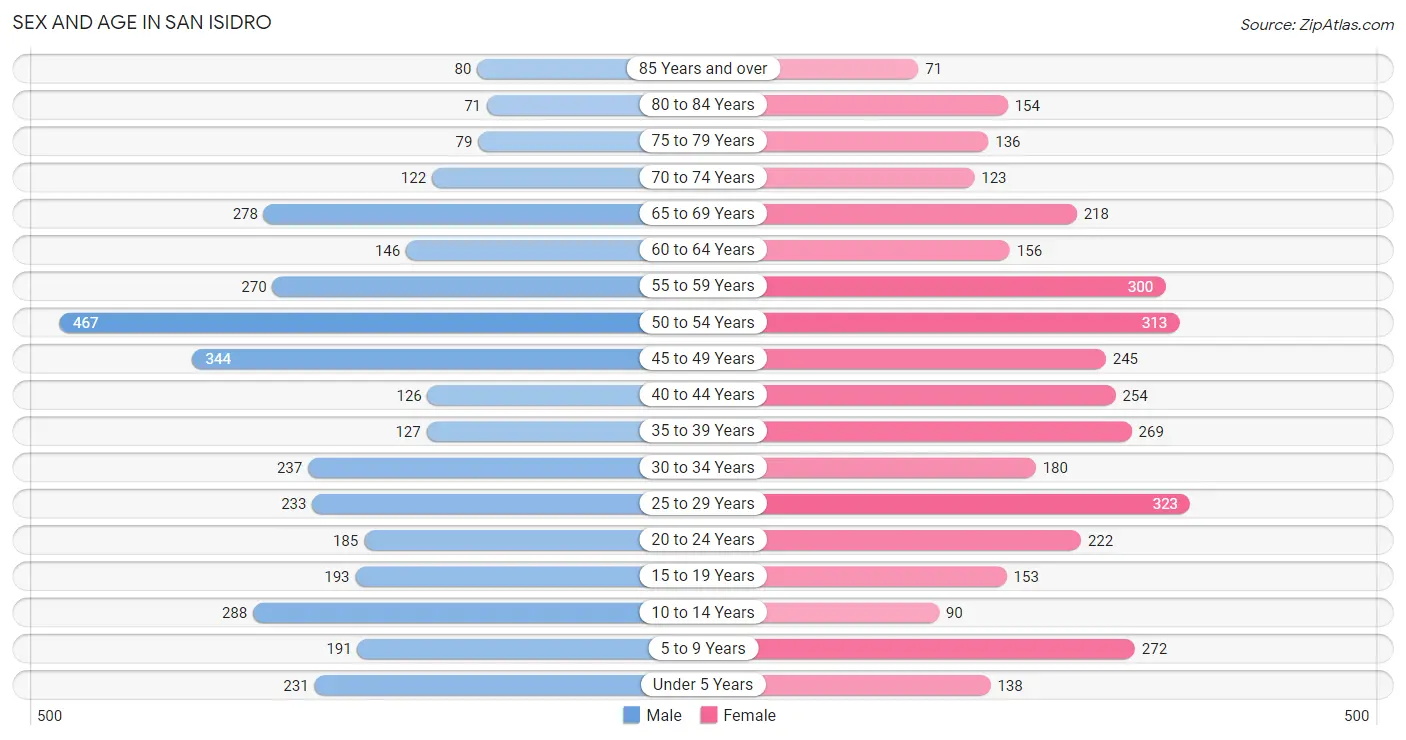
| Age Bracket | Male | Female |
| Under 5 Years | 231 (6.3%) | 138 (3.8%) |
| 5 to 9 Years | 191 (5.2%) | 272 (7.5%) |
| 10 to 14 Years | 288 (7.9%) | 90 (2.5%) |
| 15 to 19 Years | 193 (5.3%) | 153 (4.2%) |
| 20 to 24 Years | 185 (5.0%) | 222 (6.1%) |
| 25 to 29 Years | 233 (6.4%) | 323 (8.9%) |
| 30 to 34 Years | 237 (6.5%) | 180 (5.0%) |
| 35 to 39 Years | 127 (3.5%) | 269 (7.4%) |
| 40 to 44 Years | 126 (3.4%) | 254 (7.0%) |
| 45 to 49 Years | 344 (9.4%) | 245 (6.8%) |
| 50 to 54 Years | 467 (12.7%) | 313 (8.6%) |
| 55 to 59 Years | 270 (7.4%) | 300 (8.3%) |
| 60 to 64 Years | 146 (4.0%) | 156 (4.3%) |
| 65 to 69 Years | 278 (7.6%) | 218 (6.0%) |
| 70 to 74 Years | 122 (3.3%) | 123 (3.4%) |
| 75 to 79 Years | 79 (2.1%) | 136 (3.8%) |
| 80 to 84 Years | 71 (1.9%) | 154 (4.3%) |
| 85 Years and over | 80 (2.2%) | 71 (2.0%) |
| Total | 3,668 (100.0%) | 3,617 (100.0%) |
Families and Households in San Isidro
Median Family Size in San Isidro
The median family size in San Isidro is 3.63 persons per family, with married-couple families (812 | 49.1%) accounting for the largest median family size of 3.69 persons per family. On the other hand, single male/father families (115 | 7.0%) represent the smallest median family size with 3.17 persons per family.
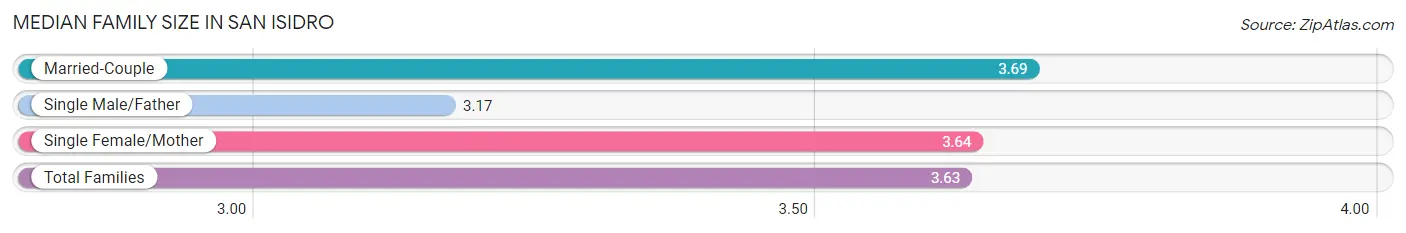
| Family Type | # Families | Family Size |
| Married-Couple | 812 (49.1%) | 3.69 |
| Single Male/Father | 115 (7.0%) | 3.17 |
| Single Female/Mother | 726 (43.9%) | 3.64 |
| Total Families | 1,653 (100.0%) | 3.63 |
Median Household Size in San Isidro
The median household size in San Isidro is 2.82 persons per household, with single female/mother households (726 | 28.1%) accounting for the largest median household size of 3.75 persons per household. non-family households (931 | 36.0%) represent the smallest median household size with 1.22 persons per household.
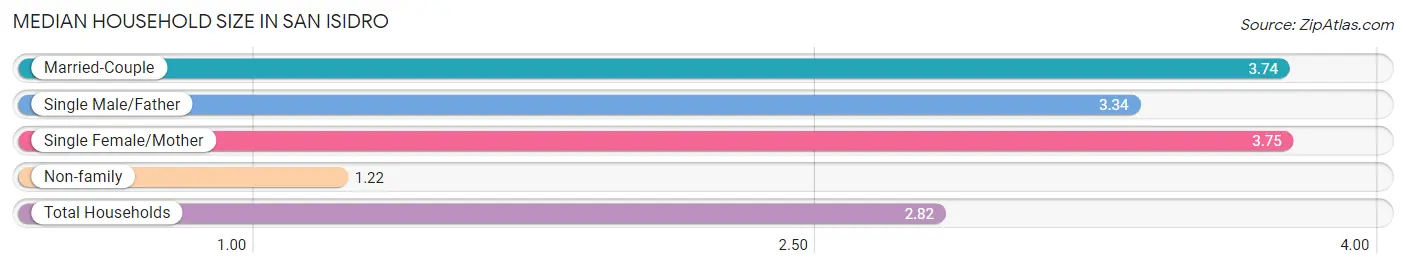
| Household Type | # Households | Household Size |
| Married-Couple | 812 (31.4%) | 3.74 |
| Single Male/Father | 115 (4.4%) | 3.34 |
| Single Female/Mother | 726 (28.1%) | 3.75 |
| Non-family | 931 (36.0%) | 1.22 |
| Total Households | 2,584 (100.0%) | 2.82 |
Household Size by Marriage Status in San Isidro
Out of a total of 2,584 households in San Isidro, 1,653 (64.0%) are family households, while 931 (36.0%) are nonfamily households. The most numerous type of family households are 2-person households, comprising 735, and the most common type of nonfamily households are 1-person households, comprising 708.
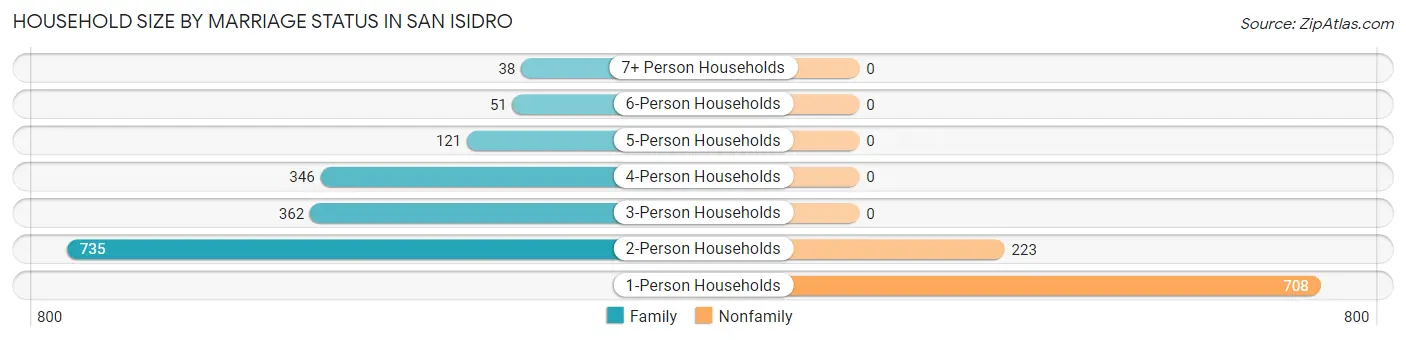
| Household Size | Family Households | Nonfamily Households |
| 1-Person Households | - | 708 (27.4%) |
| 2-Person Households | 735 (28.4%) | 223 (8.6%) |
| 3-Person Households | 362 (14.0%) | 0 (0.0%) |
| 4-Person Households | 346 (13.4%) | 0 (0.0%) |
| 5-Person Households | 121 (4.7%) | 0 (0.0%) |
| 6-Person Households | 51 (2.0%) | 0 (0.0%) |
| 7+ Person Households | 38 (1.5%) | 0 (0.0%) |
| Total | 1,653 (64.0%) | 931 (36.0%) |
Female Fertility in San Isidro
Fertility by Age in San Isidro
Average fertility rate in San Isidro is 40.0 births per 1,000 women. Women in the age bracket of 15 to 19 years have the highest fertility rate with 137.0 births per 1,000 women. Women in the age bracket of 20 to 34 years acount for 68.7% of all women with births.
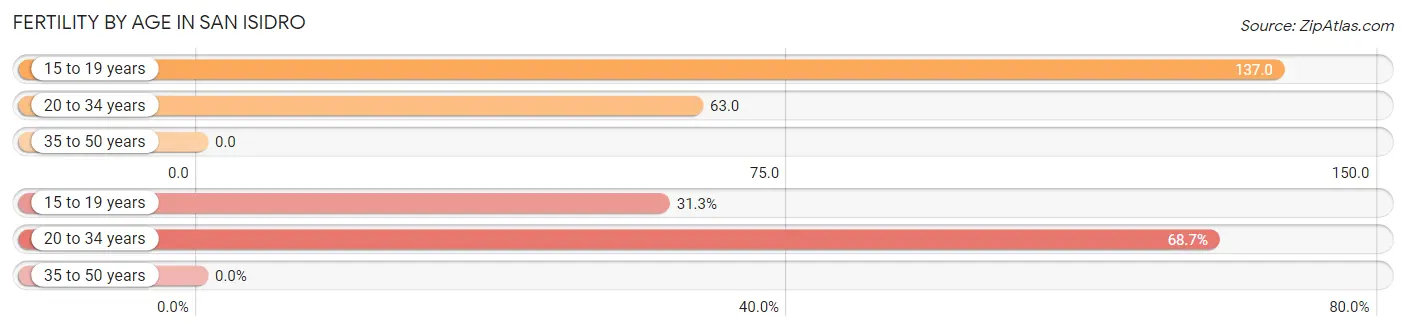
| Age Bracket | Women with Births | Births / 1,000 Women |
| 15 to 19 years | 21 (31.3%) | 137.0 |
| 20 to 34 years | 46 (68.7%) | 63.0 |
| 35 to 50 years | 0 (0.0%) | 0.0 |
| Total | 67 (100.0%) | 40.0 |
Fertility by Age by Marriage Status in San Isidro
29.9% of women with births (67) in San Isidro are married. The highest percentage of unmarried women with births falls into 15 to 19 years age bracket with 100.0% of them unmarried at the time of birth, while the lowest percentage of unmarried women with births belong to 20 to 34 years age bracket with 56.5% of them unmarried.
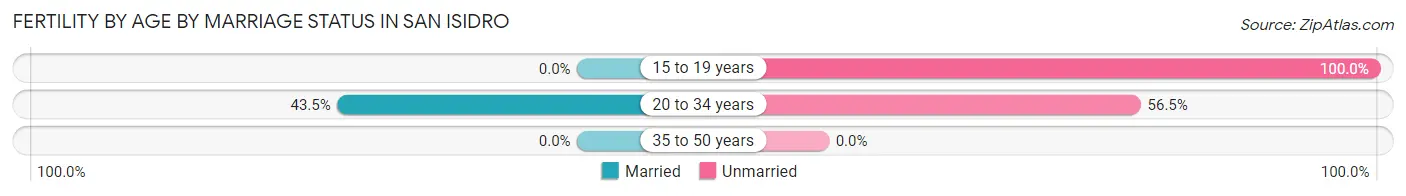
| Age Bracket | Married | Unmarried |
| 15 to 19 years | 0 (0.0%) | 21 (100.0%) |
| 20 to 34 years | 20 (43.5%) | 26 (56.5%) |
| 35 to 50 years | 0 (0.0%) | 0 (0.0%) |
| Total | 20 (29.8%) | 47 (70.2%) |
Fertility by Education in San Isidro
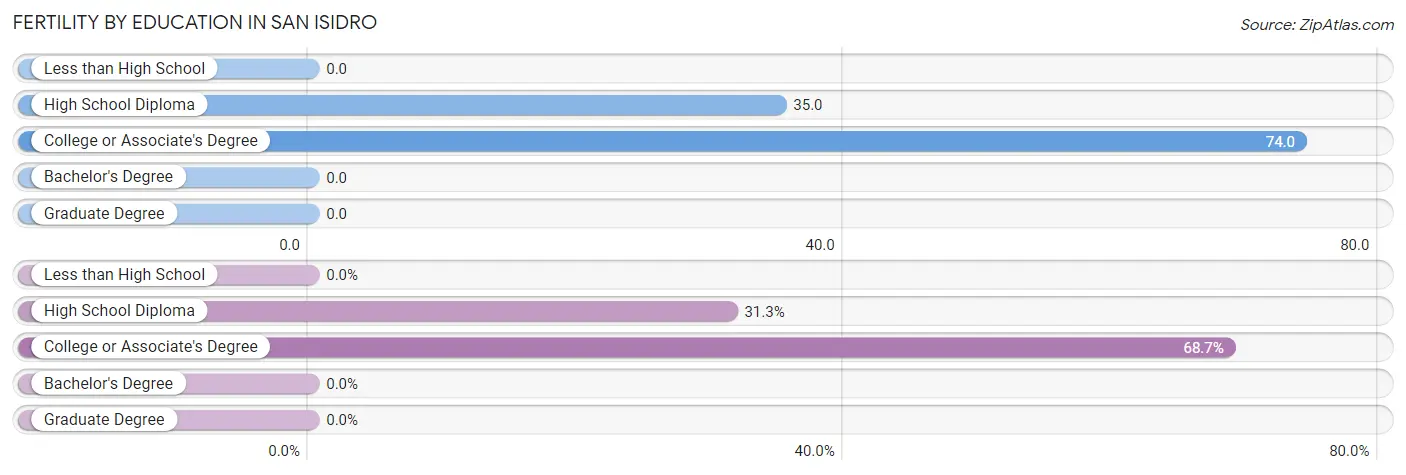
| Educational Attainment | Women with Births | Births / 1,000 Women |
| Less than High School | 0 (0.0%) | 0.0 |
| High School Diploma | 21 (31.3%) | 35.0 |
| College or Associate's Degree | 46 (68.7%) | 74.0 |
| Bachelor's Degree | 0 (0.0%) | 0.0 |
| Graduate Degree | 0 (0.0%) | 0.0 |
| Total | 67 (100.0%) | 40.0 |
Fertility by Education by Marriage Status in San Isidro
70.2% of women with births in San Isidro are unmarried. Women with the educational attainment of college or associate's degree are most likely to be married with 43.5% of them married at childbirth, while women with the educational attainment of high school diploma are least likely to be married with 100.0% of them unmarried at childbirth.
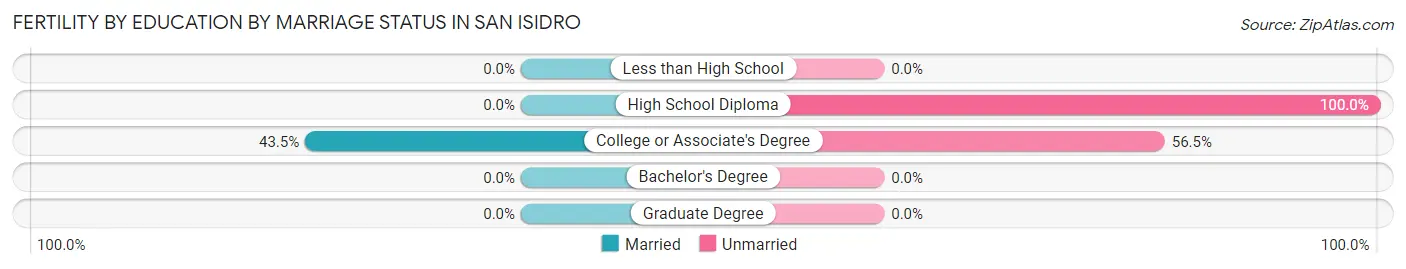
| Educational Attainment | Married | Unmarried |
| Less than High School | 0 (0.0%) | 0 (0.0%) |
| High School Diploma | 0 (0.0%) | 21 (100.0%) |
| College or Associate's Degree | 20 (43.5%) | 26 (56.5%) |
| Bachelor's Degree | 0 (0.0%) | 0 (0.0%) |
| Graduate Degree | 0 (0.0%) | 0 (0.0%) |
| Total | 20 (29.8%) | 47 (70.2%) |
Employment Characteristics in San Isidro
Employment by Class of Employer in San Isidro
Among the 2,376 employed individuals in San Isidro, private company employees (1,662 | 70.0%), state government employees (291 | 12.2%), and self-employed (not incorporated) (258 | 10.9%) make up the most common classes of employment.
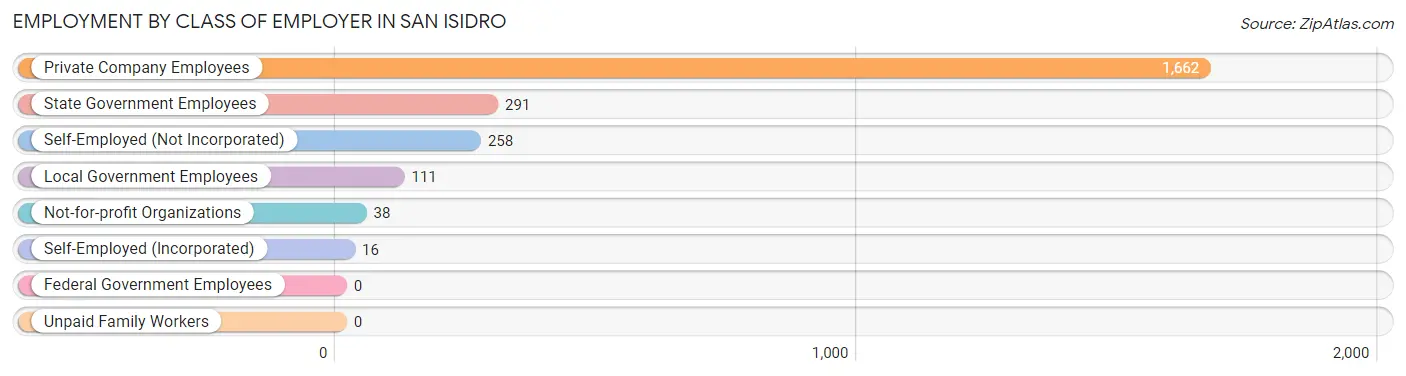
| Employer Class | # Employees | % Employees |
| Private Company Employees | 1,662 | 70.0% |
| Self-Employed (Incorporated) | 16 | 0.7% |
| Self-Employed (Not Incorporated) | 258 | 10.9% |
| Not-for-profit Organizations | 38 | 1.6% |
| Local Government Employees | 111 | 4.7% |
| State Government Employees | 291 | 12.2% |
| Federal Government Employees | 0 | 0.0% |
| Unpaid Family Workers | 0 | 0.0% |
| Total | 2,376 | 100.0% |
Employment Status by Age in San Isidro
According to the labor force statistics for San Isidro, out of the total population over 16 years of age (6,024), 53.3% or 3,211 individuals are in the labor force, with 19.7% or 633 of them unemployed. The age group with the highest labor force participation rate is 35 to 44 years, with 91.5% or 710 individuals in the labor force. Within the labor force, the 16 to 19 years age range has the highest percentage of unemployed individuals, with 82.9% or 34 of them being unemployed.
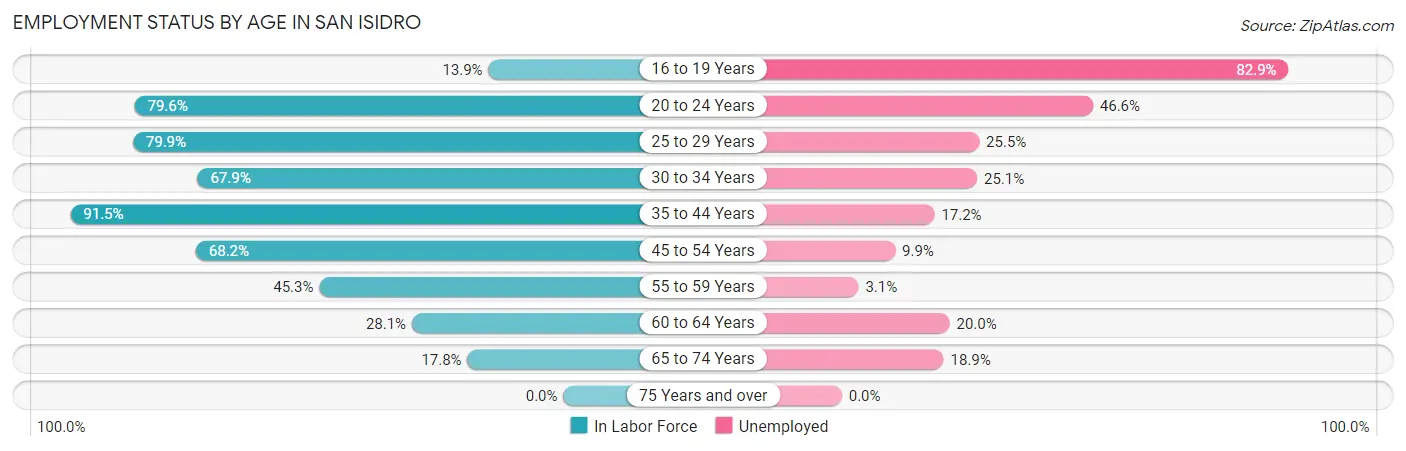
| Age Bracket | In Labor Force | Unemployed |
| 16 to 19 Years | 41 (13.9%) | 34 (82.9%) |
| 20 to 24 Years | 324 (79.6%) | 151 (46.6%) |
| 25 to 29 Years | 444 (79.9%) | 113 (25.5%) |
| 30 to 34 Years | 283 (67.9%) | 71 (25.1%) |
| 35 to 44 Years | 710 (91.5%) | 122 (17.2%) |
| 45 to 54 Years | 934 (68.2%) | 92 (9.9%) |
| 55 to 59 Years | 258 (45.3%) | 8 (3.1%) |
| 60 to 64 Years | 85 (28.1%) | 17 (20.0%) |
| 65 to 74 Years | 132 (17.8%) | 25 (18.9%) |
| 75 Years and over | 0 (0.0%) | 0 (0.0%) |
| Total | 3,211 (53.3%) | 633 (19.7%) |
Employment Status by Educational Attainment in San Isidro
According to labor force statistics for San Isidro, 68.0% of individuals (2,713) out of the total population between 25 and 64 years of age (3,990) are in the labor force, with 15.6% or 423 of them being unemployed. The group with the highest labor force participation rate are those with the educational attainment of bachelor's degree or higher, with 87.4% or 456 individuals in the labor force. Within the labor force, individuals with high school diploma education have the highest percentage of unemployment, with 26.6% or 287 of them being unemployed.
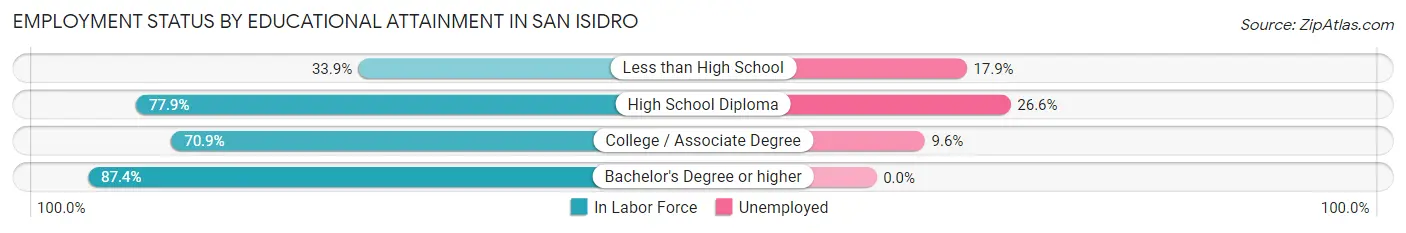
| Educational Attainment | In Labor Force | Unemployed |
| Less than High School | 273 (33.9%) | 144 (17.9%) |
| High School Diploma | 1,078 (77.9%) | 368 (26.6%) |
| College / Associate Degree | 906 (70.9%) | 123 (9.6%) |
| Bachelor's Degree or higher | 456 (87.4%) | 0 (0.0%) |
| Total | 2,713 (68.0%) | 622 (15.6%) |
Employment Occupations by Sex in San Isidro
Management, Business, Science and Arts Occupations
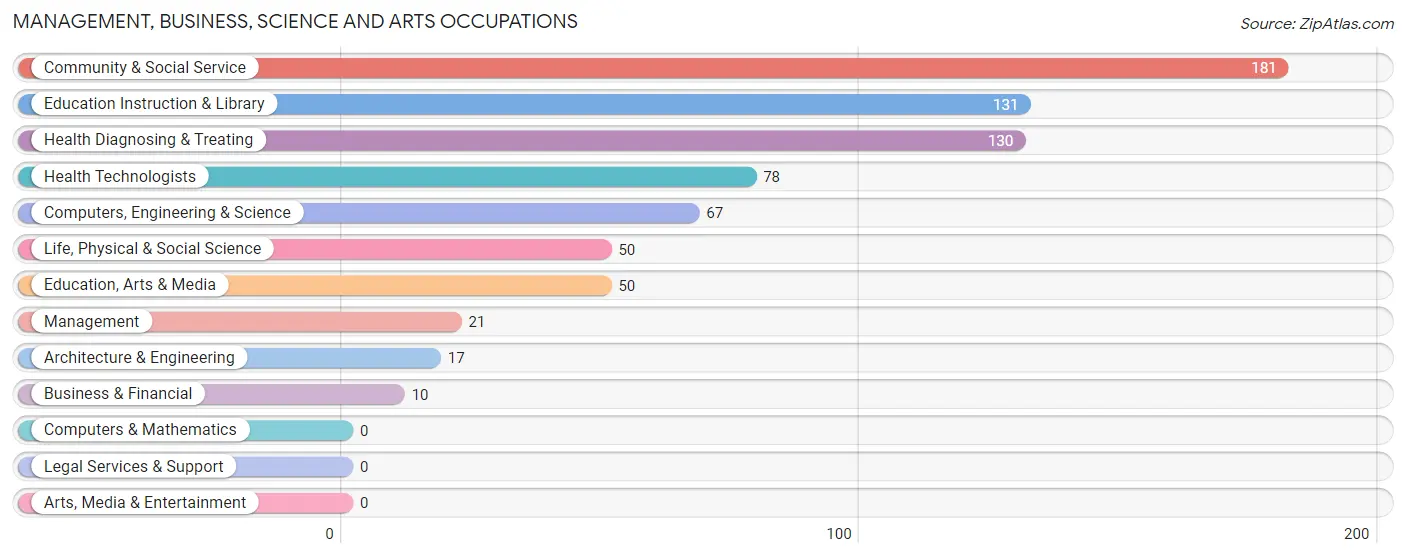
The most common Management, Business, Science and Arts occupations in San Isidro are Community & Social Service (181 | 7.0%), Education Instruction & Library (131 | 5.1%), Health Diagnosing & Treating (130 | 5.0%), Health Technologists (78 | 3.0%), and Computers, Engineering & Science (67 | 2.6%).
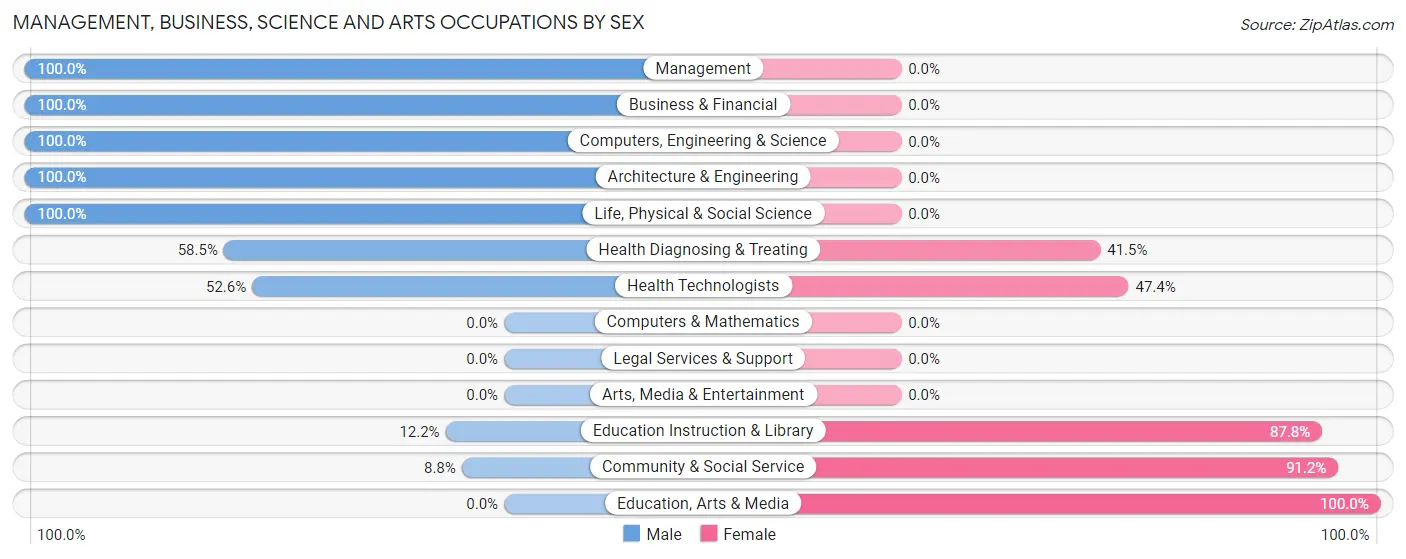
Management, Business, Science and Arts Occupations by Sex
Within the Management, Business, Science and Arts occupations in San Isidro, the most male-oriented occupations are Management (100.0%), Business & Financial (100.0%), and Computers, Engineering & Science (100.0%), while the most female-oriented occupations are Education, Arts & Media (100.0%), Community & Social Service (91.2%), and Education Instruction & Library (87.8%).
| Occupation | Male | Female |
| Management | 21 (100.0%) | 0 (0.0%) |
| Business & Financial | 10 (100.0%) | 0 (0.0%) |
| Computers, Engineering & Science | 67 (100.0%) | 0 (0.0%) |
| Computers & Mathematics | 0 (0.0%) | 0 (0.0%) |
| Architecture & Engineering | 17 (100.0%) | 0 (0.0%) |
| Life, Physical & Social Science | 50 (100.0%) | 0 (0.0%) |
| Community & Social Service | 16 (8.8%) | 165 (91.2%) |
| Education, Arts & Media | 0 (0.0%) | 50 (100.0%) |
| Legal Services & Support | 0 (0.0%) | 0 (0.0%) |
| Education Instruction & Library | 16 (12.2%) | 115 (87.8%) |
| Arts, Media & Entertainment | 0 (0.0%) | 0 (0.0%) |
| Health Diagnosing & Treating | 76 (58.5%) | 54 (41.5%) |
| Health Technologists | 41 (52.6%) | 37 (47.4%) |
| Total (Category) | 190 (46.5%) | 219 (53.5%) |
| Total (Overall) | 1,488 (57.7%) | 1,089 (42.3%) |
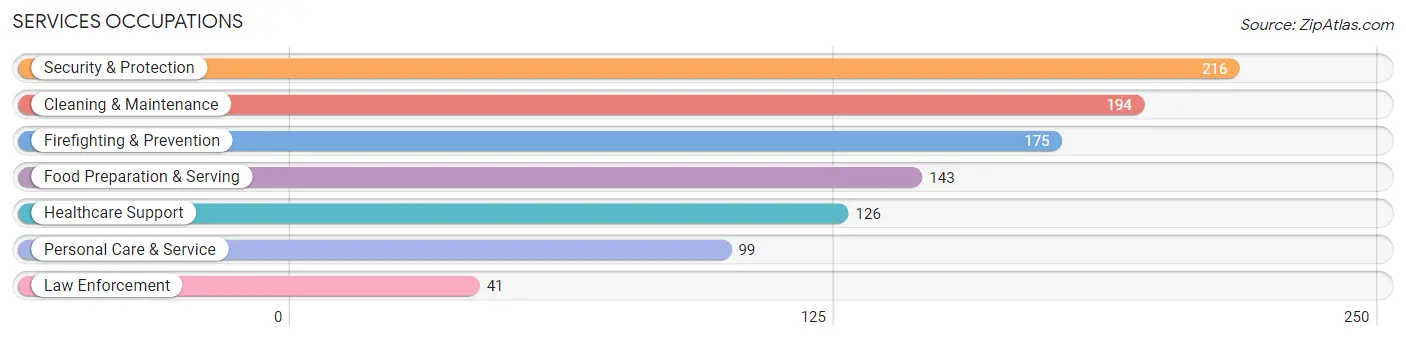
Services Occupations
The most common Services occupations in San Isidro are Security & Protection (216 | 8.4%), Cleaning & Maintenance (194 | 7.5%), Firefighting & Prevention (175 | 6.8%), Food Preparation & Serving (143 | 5.6%), and Healthcare Support (126 | 4.9%).
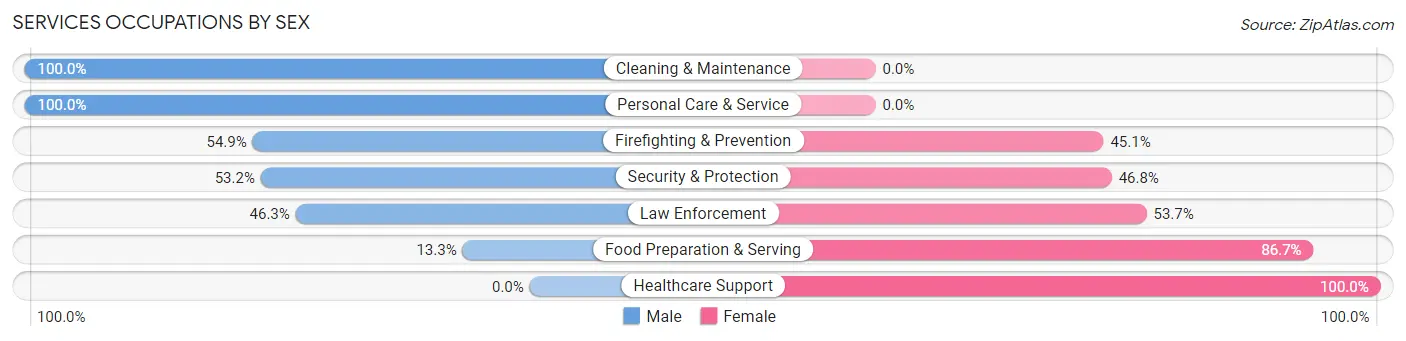
Services Occupations by Sex
Within the Services occupations in San Isidro, the most male-oriented occupations are Cleaning & Maintenance (100.0%), Personal Care & Service (100.0%), and Firefighting & Prevention (54.9%), while the most female-oriented occupations are Healthcare Support (100.0%), Food Preparation & Serving (86.7%), and Law Enforcement (53.7%).
| Occupation | Male | Female |
| Healthcare Support | 0 (0.0%) | 126 (100.0%) |
| Security & Protection | 115 (53.2%) | 101 (46.8%) |
| Firefighting & Prevention | 96 (54.9%) | 79 (45.1%) |
| Law Enforcement | 19 (46.3%) | 22 (53.7%) |
| Food Preparation & Serving | 19 (13.3%) | 124 (86.7%) |
| Cleaning & Maintenance | 194 (100.0%) | 0 (0.0%) |
| Personal Care & Service | 99 (100.0%) | 0 (0.0%) |
| Total (Category) | 427 (54.9%) | 351 (45.1%) |
| Total (Overall) | 1,488 (57.7%) | 1,089 (42.3%) |
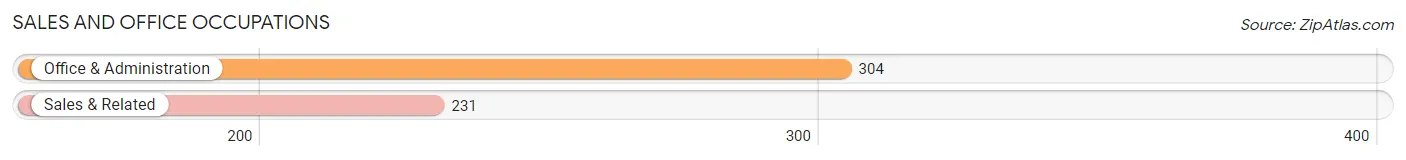
Sales and Office Occupations
The most common Sales and Office occupations in San Isidro are Office & Administration (304 | 11.8%), and Sales & Related (231 | 9.0%).
Sales and Office Occupations by Sex
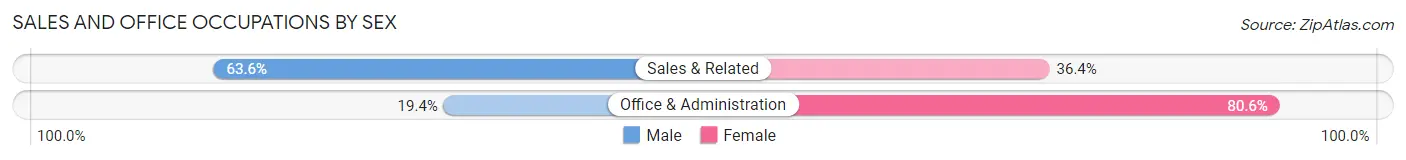
| Occupation | Male | Female |
| Sales & Related | 147 (63.6%) | 84 (36.4%) |
| Office & Administration | 59 (19.4%) | 245 (80.6%) |
| Total (Category) | 206 (38.5%) | 329 (61.5%) |
| Total (Overall) | 1,488 (57.7%) | 1,089 (42.3%) |
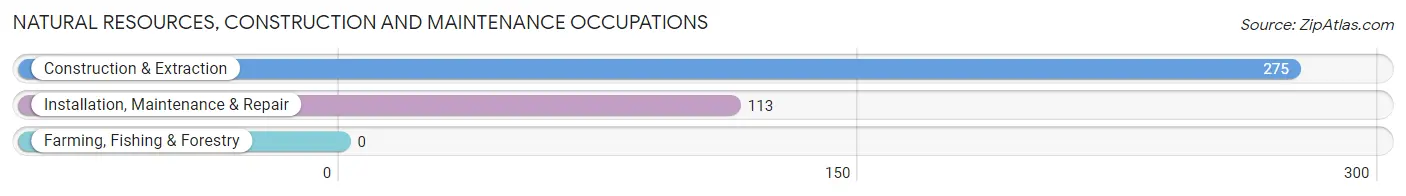
Natural Resources, Construction and Maintenance Occupations
The most common Natural Resources, Construction and Maintenance occupations in San Isidro are Construction & Extraction (275 | 10.7%), and Installation, Maintenance & Repair (113 | 4.4%).
Natural Resources, Construction and Maintenance Occupations by Sex
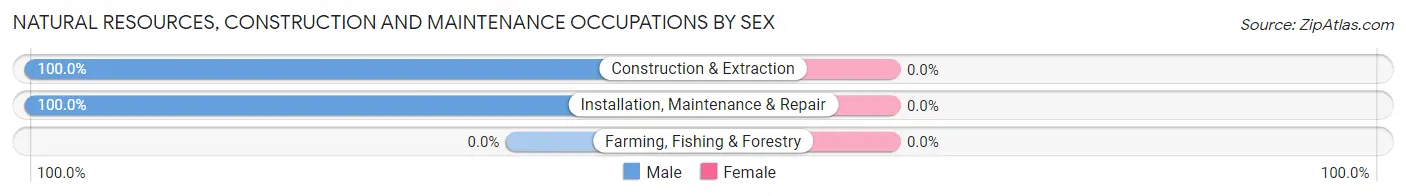
| Occupation | Male | Female |
| Farming, Fishing & Forestry | 0 (0.0%) | 0 (0.0%) |
| Construction & Extraction | 275 (100.0%) | 0 (0.0%) |
| Installation, Maintenance & Repair | 113 (100.0%) | 0 (0.0%) |
| Total (Category) | 388 (100.0%) | 0 (0.0%) |
| Total (Overall) | 1,488 (57.7%) | 1,089 (42.3%) |
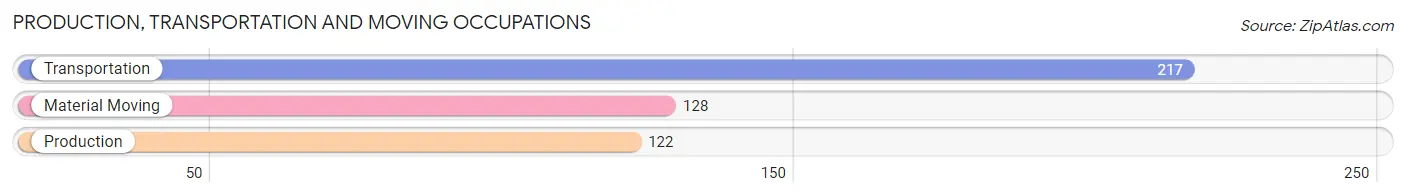
Production, Transportation and Moving Occupations
The most common Production, Transportation and Moving occupations in San Isidro are Transportation (217 | 8.4%), Material Moving (128 | 5.0%), and Production (122 | 4.7%).
Production, Transportation and Moving Occupations by Sex
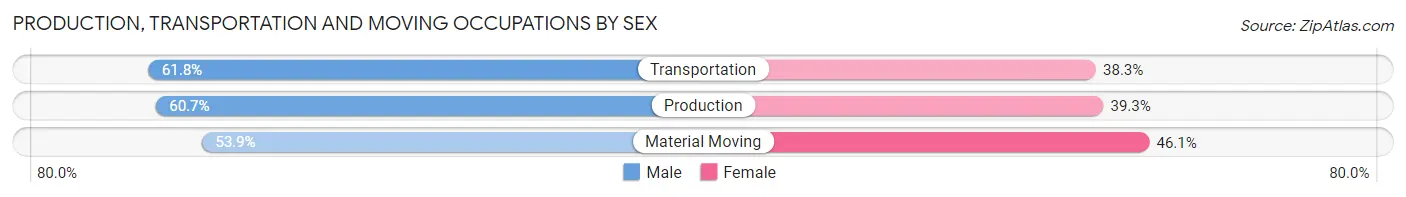
| Occupation | Male | Female |
| Production | 74 (60.7%) | 48 (39.3%) |
| Transportation | 134 (61.8%) | 83 (38.3%) |
| Material Moving | 69 (53.9%) | 59 (46.1%) |
| Total (Category) | 277 (59.3%) | 190 (40.7%) |
| Total (Overall) | 1,488 (57.7%) | 1,089 (42.3%) |
Employment Industries by Sex in San Isidro
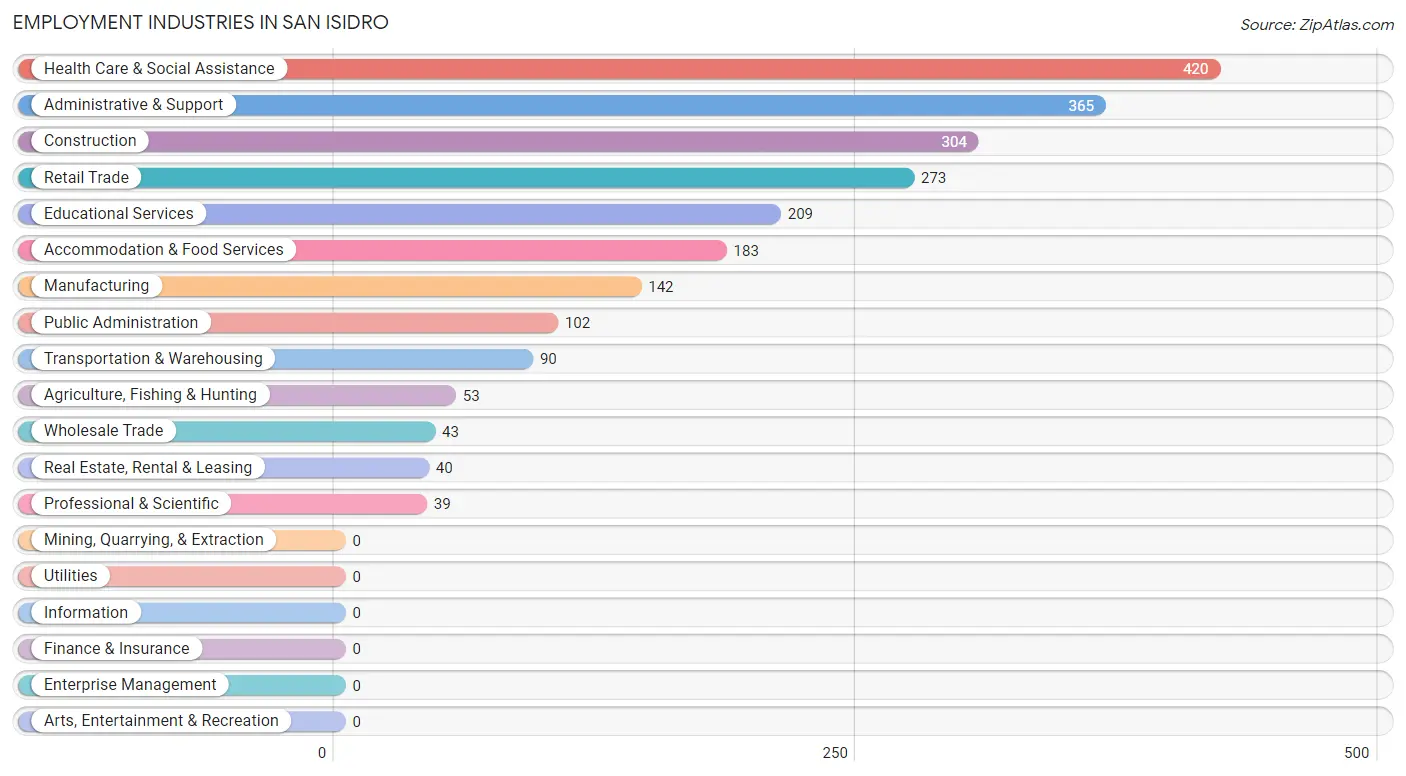
Employment Industries in San Isidro
The major employment industries in San Isidro include Health Care & Social Assistance (420 | 16.3%), Administrative & Support (365 | 14.2%), Construction (304 | 11.8%), Retail Trade (273 | 10.6%), and Educational Services (209 | 8.1%).
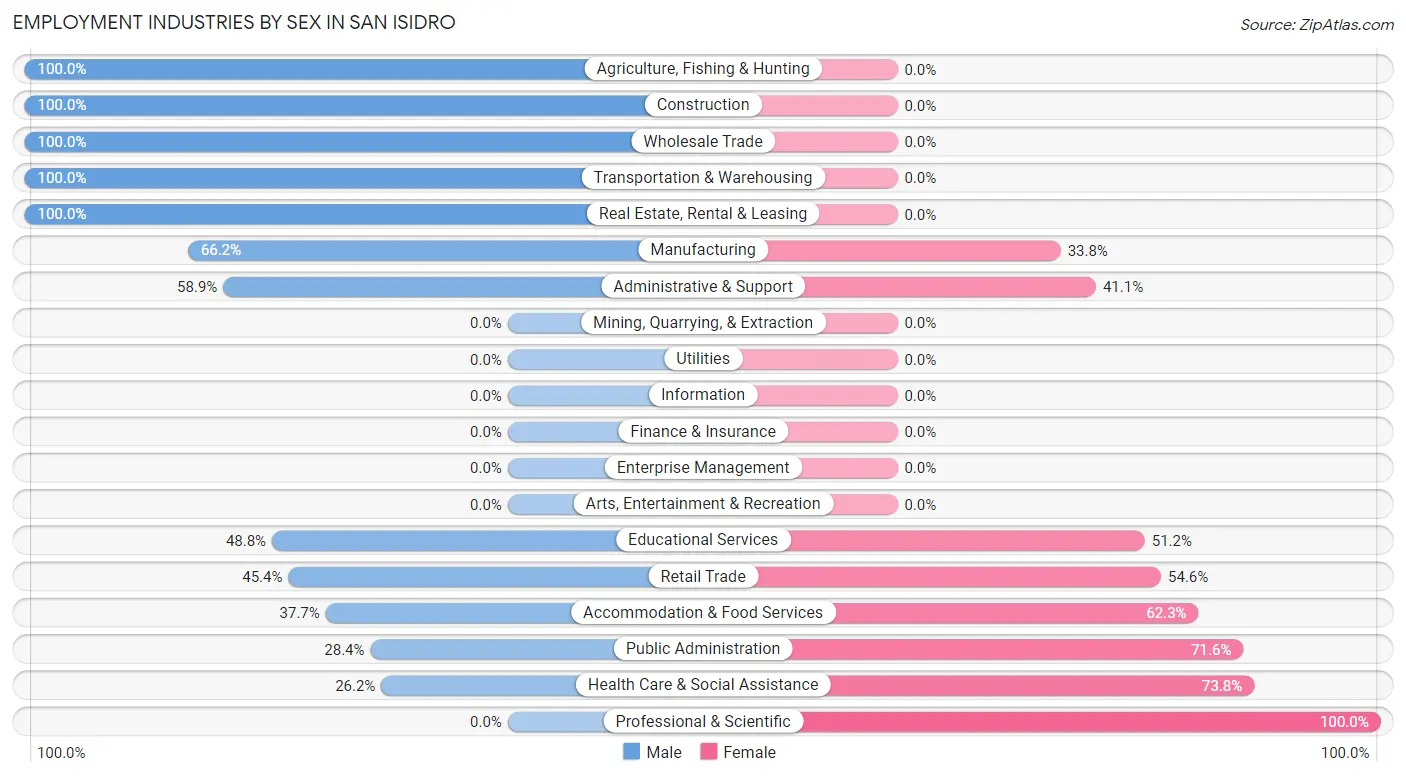
Employment Industries by Sex in San Isidro
The San Isidro industries that see more men than women are Agriculture, Fishing & Hunting (100.0%), Construction (100.0%), and Wholesale Trade (100.0%), whereas the industries that tend to have a higher number of women are Professional & Scientific (100.0%), Health Care & Social Assistance (73.8%), and Public Administration (71.6%).
| Industry | Male | Female |
| Agriculture, Fishing & Hunting | 53 (100.0%) | 0 (0.0%) |
| Mining, Quarrying, & Extraction | 0 (0.0%) | 0 (0.0%) |
| Construction | 304 (100.0%) | 0 (0.0%) |
| Manufacturing | 94 (66.2%) | 48 (33.8%) |
| Wholesale Trade | 43 (100.0%) | 0 (0.0%) |
| Retail Trade | 124 (45.4%) | 149 (54.6%) |
| Transportation & Warehousing | 90 (100.0%) | 0 (0.0%) |
| Utilities | 0 (0.0%) | 0 (0.0%) |
| Information | 0 (0.0%) | 0 (0.0%) |
| Finance & Insurance | 0 (0.0%) | 0 (0.0%) |
| Real Estate, Rental & Leasing | 40 (100.0%) | 0 (0.0%) |
| Professional & Scientific | 0 (0.0%) | 39 (100.0%) |
| Enterprise Management | 0 (0.0%) | 0 (0.0%) |
| Administrative & Support | 215 (58.9%) | 150 (41.1%) |
| Educational Services | 102 (48.8%) | 107 (51.2%) |
| Health Care & Social Assistance | 110 (26.2%) | 310 (73.8%) |
| Arts, Entertainment & Recreation | 0 (0.0%) | 0 (0.0%) |
| Accommodation & Food Services | 69 (37.7%) | 114 (62.3%) |
| Public Administration | 29 (28.4%) | 73 (71.6%) |
| Total | 1,488 (57.7%) | 1,089 (42.3%) |
Education in San Isidro
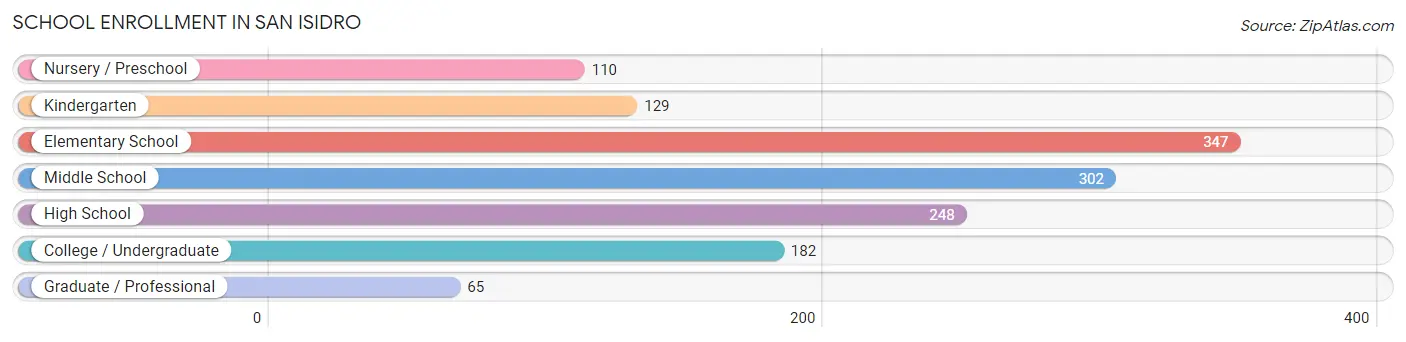
School Enrollment in San Isidro
The most common levels of schooling among the 1,383 students in San Isidro are elementary school (347 | 25.1%), middle school (302 | 21.8%), and high school (248 | 17.9%).
| School Level | # Students | % Students |
| Nursery / Preschool | 110 | 8.0% |
| Kindergarten | 129 | 9.3% |
| Elementary School | 347 | 25.1% |
| Middle School | 302 | 21.8% |
| High School | 248 | 17.9% |
| College / Undergraduate | 182 | 13.2% |
| Graduate / Professional | 65 | 4.7% |
| Total | 1,383 | 100.0% |
School Enrollment by Age by Funding Source in San Isidro
Out of a total of 1,383 students who are enrolled in schools in San Isidro, 301 (21.8%) attend a private institution, while the remaining 1,082 (78.2%) are enrolled in public schools. The age group of 20 to 24 year olds has the highest likelihood of being enrolled in private schools, with 75 (100.0% in the age bracket) enrolled. Conversely, the age group of 10 to 14 year olds has the lowest likelihood of being enrolled in a private school, with 378 (100.0% in the age bracket) attending a public institution.
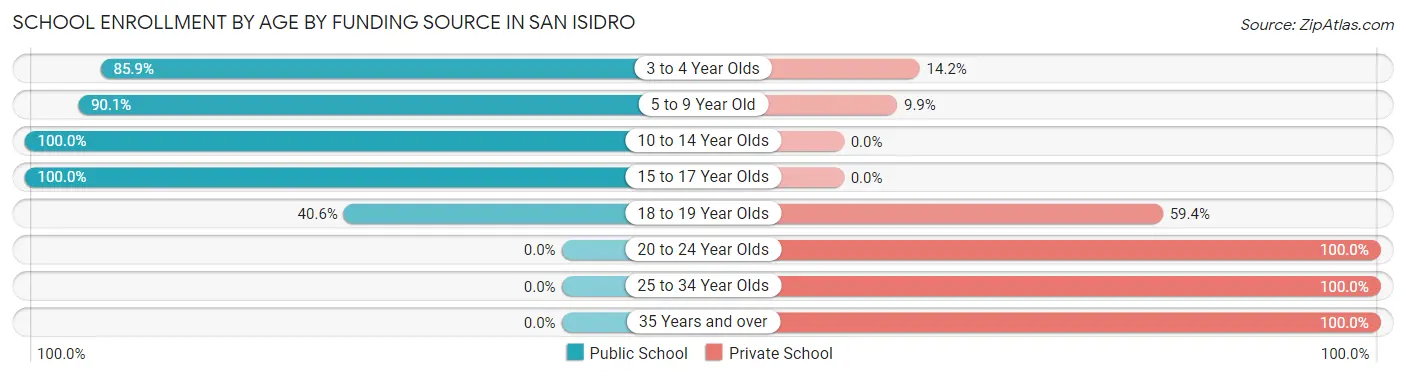
| Age Bracket | Public School | Private School |
| 3 to 4 Year Olds | 91 (85.9%) | 15 (14.1%) |
| 5 to 9 Year Old | 417 (90.1%) | 46 (9.9%) |
| 10 to 14 Year Olds | 378 (100.0%) | 0 (0.0%) |
| 15 to 17 Year Olds | 153 (100.0%) | 0 (0.0%) |
| 18 to 19 Year Olds | 43 (40.6%) | 63 (59.4%) |
| 20 to 24 Year Olds | 0 (0.0%) | 75 (100.0%) |
| 25 to 34 Year Olds | 0 (0.0%) | 37 (100.0%) |
| 35 Years and over | 0 (0.0%) | 65 (100.0%) |
| Total | 1,082 (78.2%) | 301 (21.8%) |
Educational Attainment by Field of Study in San Isidro
Science & technology (234 | 35.5%), business (108 | 16.4%), education (106 | 16.1%), arts & humanities (61 | 9.3%), and liberal arts & history (48 | 7.3%) are the most common fields of study among 659 individuals in San Isidro who have obtained a bachelor's degree or higher.
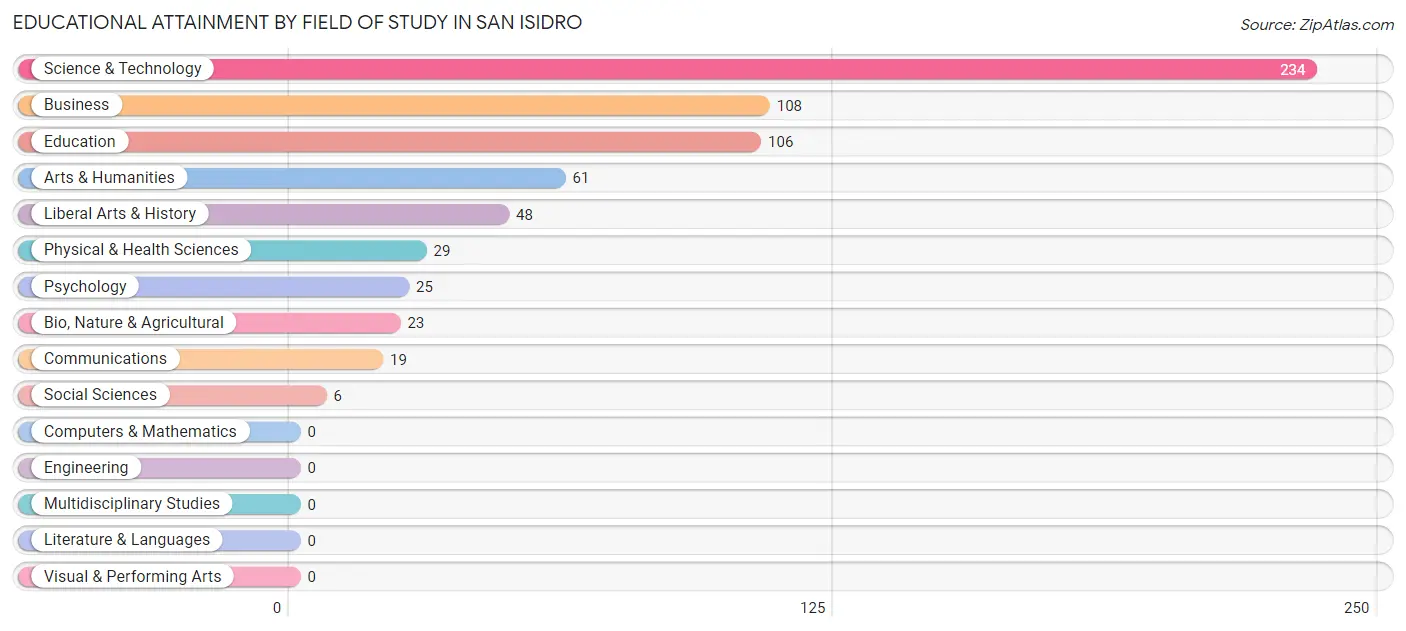
| Field of Study | # Graduates | % Graduates |
| Computers & Mathematics | 0 | 0.0% |
| Bio, Nature & Agricultural | 23 | 3.5% |
| Physical & Health Sciences | 29 | 4.4% |
| Psychology | 25 | 3.8% |
| Social Sciences | 6 | 0.9% |
| Engineering | 0 | 0.0% |
| Multidisciplinary Studies | 0 | 0.0% |
| Science & Technology | 234 | 35.5% |
| Business | 108 | 16.4% |
| Education | 106 | 16.1% |
| Literature & Languages | 0 | 0.0% |
| Liberal Arts & History | 48 | 7.3% |
| Visual & Performing Arts | 0 | 0.0% |
| Communications | 19 | 2.9% |
| Arts & Humanities | 61 | 9.3% |
| Total | 659 | 100.0% |
Transportation & Commute in San Isidro
Vehicle Availability by Sex in San Isidro
The most prevalent vehicle ownership categories in San Isidro are males with 2 vehicles (597, accounting for 44.5%) and females with 2 vehicles (365, making up 57.7%).
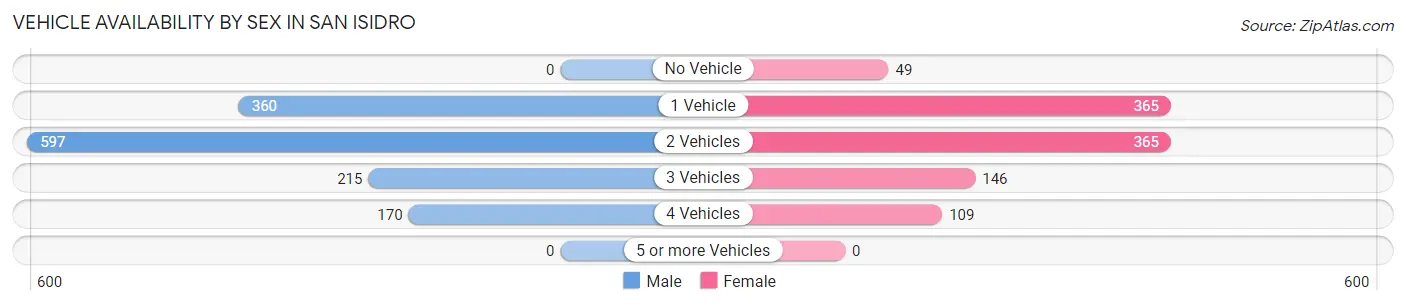
| Vehicles Available | Male | Female |
| No Vehicle | 0 (0.0%) | 49 (4.7%) |
| 1 Vehicle | 360 (26.8%) | 365 (35.3%) |
| 2 Vehicles | 597 (44.5%) | 365 (35.3%) |
| 3 Vehicles | 215 (16.0%) | 146 (14.1%) |
| 4 Vehicles | 170 (12.7%) | 109 (10.5%) |
| 5 or more Vehicles | 0 (0.0%) | 0 (0.0%) |
| Total | 1,342 (100.0%) | 1,034 (100.0%) |
Commute Time in San Isidro
The most frequently occuring commute durations in San Isidro are 60 to 89 minutes (414 commuters, 17.9%), 15 to 19 minutes (398 commuters, 17.2%), and 30 to 34 minutes (353 commuters, 15.2%).
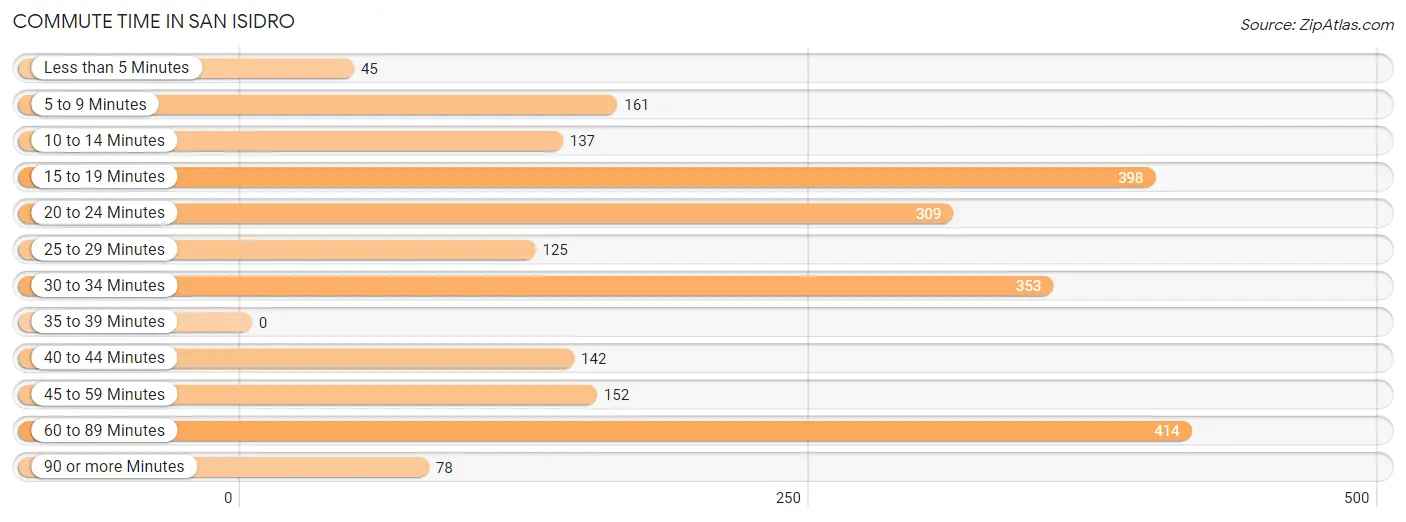
| Commute Time | # Commuters | % Commuters |
| Less than 5 Minutes | 45 | 1.9% |
| 5 to 9 Minutes | 161 | 7.0% |
| 10 to 14 Minutes | 137 | 5.9% |
| 15 to 19 Minutes | 398 | 17.2% |
| 20 to 24 Minutes | 309 | 13.4% |
| 25 to 29 Minutes | 125 | 5.4% |
| 30 to 34 Minutes | 353 | 15.2% |
| 35 to 39 Minutes | 0 | 0.0% |
| 40 to 44 Minutes | 142 | 6.1% |
| 45 to 59 Minutes | 152 | 6.6% |
| 60 to 89 Minutes | 414 | 17.9% |
| 90 or more Minutes | 78 | 3.4% |
Commute Time by Sex in San Isidro
The most common commute times in San Isidro are 60 to 89 minutes (257 commuters, 19.5%) for males and 15 to 19 minutes (253 commuters, 25.4%) for females.
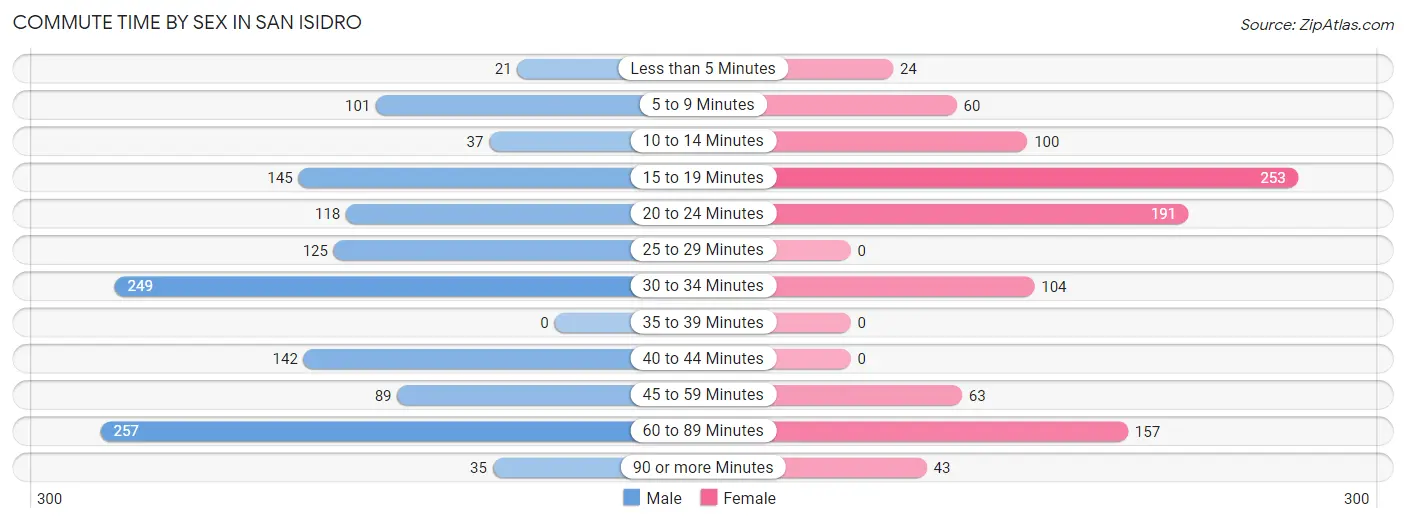
| Commute Time | Male | Female |
| Less than 5 Minutes | 21 (1.6%) | 24 (2.4%) |
| 5 to 9 Minutes | 101 (7.7%) | 60 (6.0%) |
| 10 to 14 Minutes | 37 (2.8%) | 100 (10.1%) |
| 15 to 19 Minutes | 145 (11.0%) | 253 (25.4%) |
| 20 to 24 Minutes | 118 (8.9%) | 191 (19.2%) |
| 25 to 29 Minutes | 125 (9.5%) | 0 (0.0%) |
| 30 to 34 Minutes | 249 (18.9%) | 104 (10.4%) |
| 35 to 39 Minutes | 0 (0.0%) | 0 (0.0%) |
| 40 to 44 Minutes | 142 (10.8%) | 0 (0.0%) |
| 45 to 59 Minutes | 89 (6.8%) | 63 (6.3%) |
| 60 to 89 Minutes | 257 (19.5%) | 157 (15.8%) |
| 90 or more Minutes | 35 (2.6%) | 43 (4.3%) |
Time of Departure to Work by Sex in San Isidro
The most frequent times of departure to work in San Isidro are 6:00 AM to 6:29 AM (453, 34.3%) for males and 12:00 PM to 3:59 PM (210, 21.1%) for females.
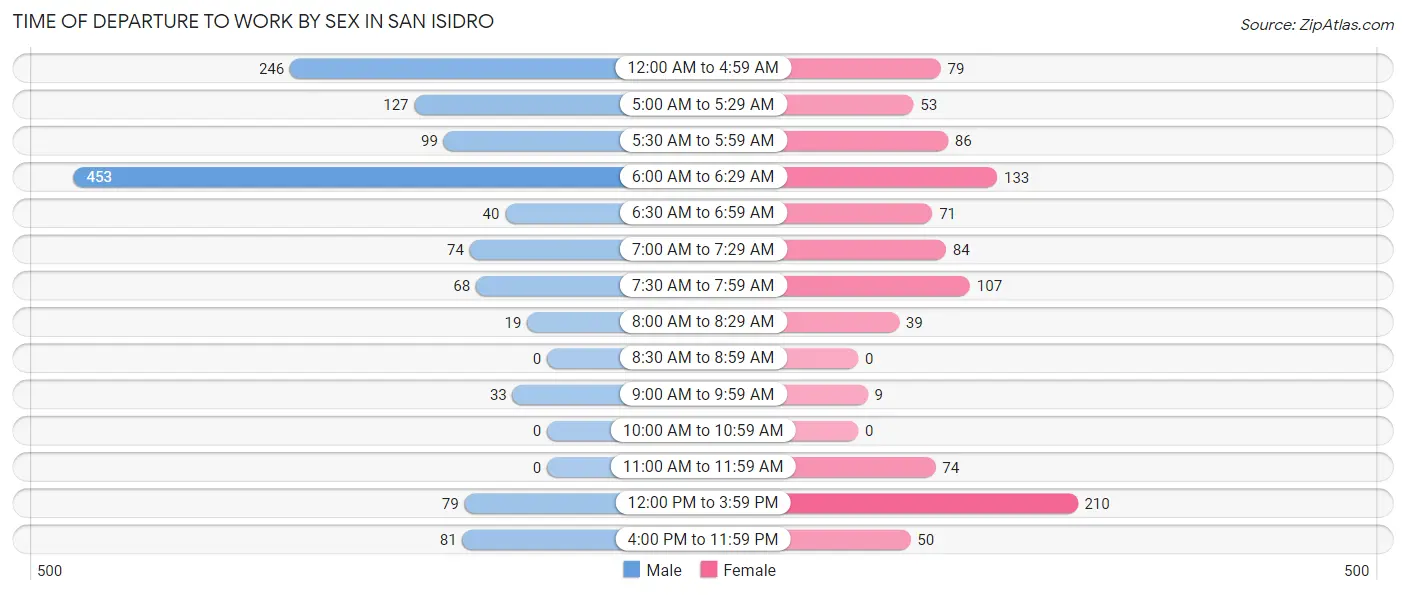
| Time of Departure | Male | Female |
| 12:00 AM to 4:59 AM | 246 (18.6%) | 79 (7.9%) |
| 5:00 AM to 5:29 AM | 127 (9.6%) | 53 (5.3%) |
| 5:30 AM to 5:59 AM | 99 (7.5%) | 86 (8.6%) |
| 6:00 AM to 6:29 AM | 453 (34.3%) | 133 (13.4%) |
| 6:30 AM to 6:59 AM | 40 (3.0%) | 71 (7.1%) |
| 7:00 AM to 7:29 AM | 74 (5.6%) | 84 (8.4%) |
| 7:30 AM to 7:59 AM | 68 (5.2%) | 107 (10.7%) |
| 8:00 AM to 8:29 AM | 19 (1.4%) | 39 (3.9%) |
| 8:30 AM to 8:59 AM | 0 (0.0%) | 0 (0.0%) |
| 9:00 AM to 9:59 AM | 33 (2.5%) | 9 (0.9%) |
| 10:00 AM to 10:59 AM | 0 (0.0%) | 0 (0.0%) |
| 11:00 AM to 11:59 AM | 0 (0.0%) | 74 (7.4%) |
| 12:00 PM to 3:59 PM | 79 (6.0%) | 210 (21.1%) |
| 4:00 PM to 11:59 PM | 81 (6.1%) | 50 (5.0%) |
| Total | 1,319 (100.0%) | 995 (100.0%) |
Housing Occupancy in San Isidro
Occupancy by Ownership in San Isidro
Of the total 2,584 dwellings in San Isidro, owner-occupied units account for 1,653 (64.0%), while renter-occupied units make up 931 (36.0%).
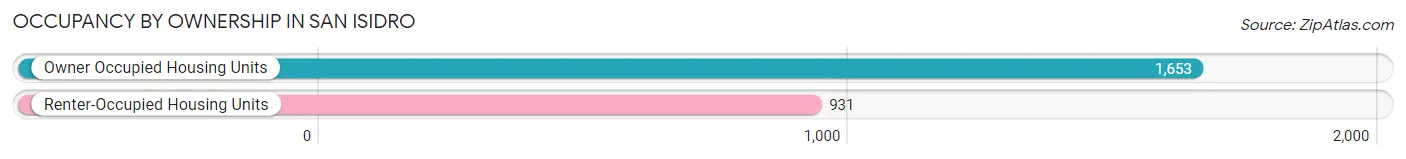
| Occupancy | # Housing Units | % Housing Units |
| Owner Occupied Housing Units | 1,653 | 64.0% |
| Renter-Occupied Housing Units | 931 | 36.0% |
| Total Occupied Housing Units | 2,584 | 100.0% |
Occupancy by Household Size in San Isidro
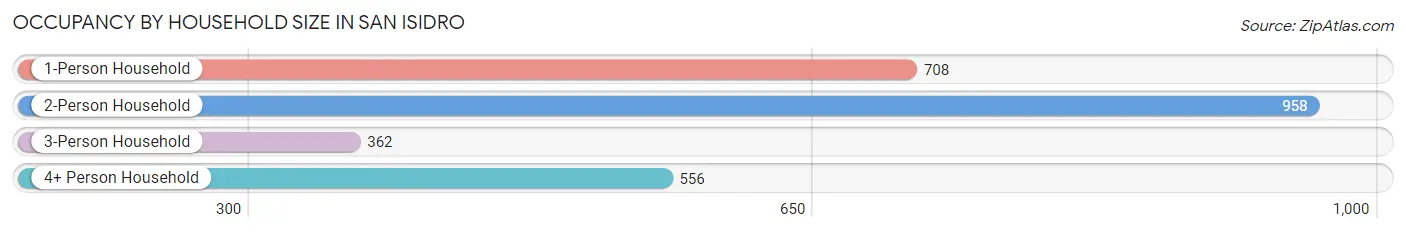
| Household Size | # Housing Units | % Housing Units |
| 1-Person Household | 708 | 27.4% |
| 2-Person Household | 958 | 37.1% |
| 3-Person Household | 362 | 14.0% |
| 4+ Person Household | 556 | 21.5% |
| Total Housing Units | 2,584 | 100.0% |
Occupancy by Ownership by Household Size in San Isidro
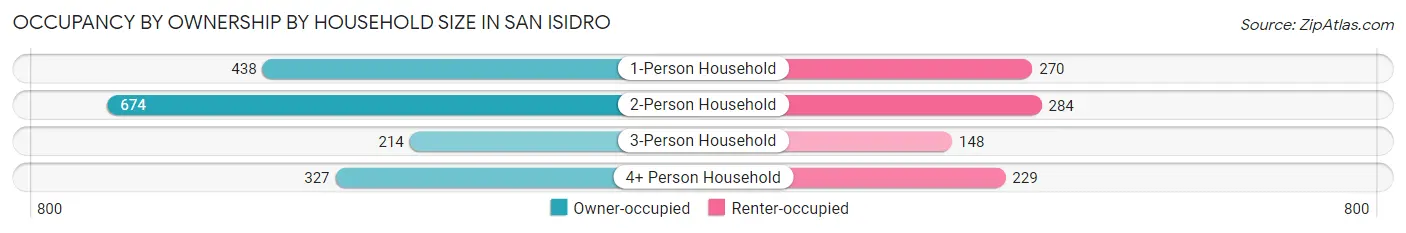
| Household Size | Owner-occupied | Renter-occupied |
| 1-Person Household | 438 (61.9%) | 270 (38.1%) |
| 2-Person Household | 674 (70.4%) | 284 (29.6%) |
| 3-Person Household | 214 (59.1%) | 148 (40.9%) |
| 4+ Person Household | 327 (58.8%) | 229 (41.2%) |
| Total Housing Units | 1,653 (64.0%) | 931 (36.0%) |
Occupancy by Educational Attainment in San Isidro
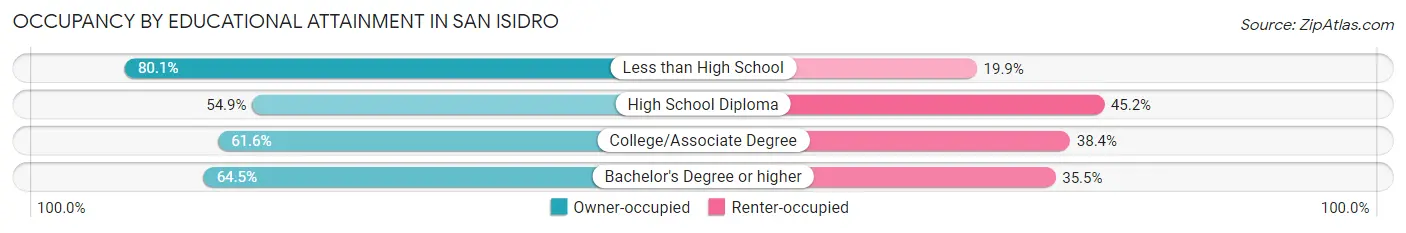
| Household Size | Owner-occupied | Renter-occupied |
| Less than High School | 519 (80.1%) | 129 (19.9%) |
| High School Diploma | 537 (54.8%) | 442 (45.2%) |
| College/Associate Degree | 430 (61.6%) | 268 (38.4%) |
| Bachelor's Degree or higher | 167 (64.5%) | 92 (35.5%) |
Occupancy by Age of Householder in San Isidro
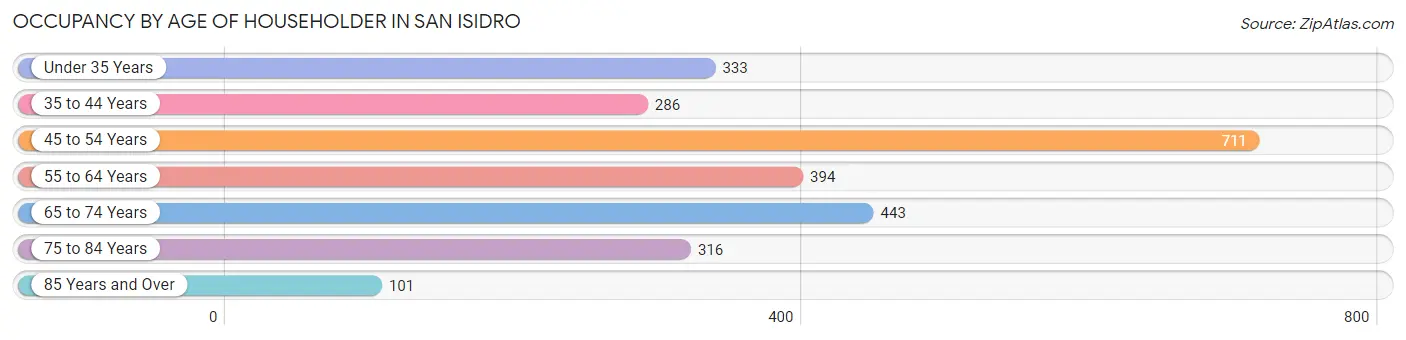
| Age Bracket | # Households | % Households |
| Under 35 Years | 333 | 12.9% |
| 35 to 44 Years | 286 | 11.1% |
| 45 to 54 Years | 711 | 27.5% |
| 55 to 64 Years | 394 | 15.2% |
| 65 to 74 Years | 443 | 17.1% |
| 75 to 84 Years | 316 | 12.2% |
| 85 Years and Over | 101 | 3.9% |
| Total | 2,584 | 100.0% |
Housing Finances in San Isidro
Median Income by Occupancy in San Isidro
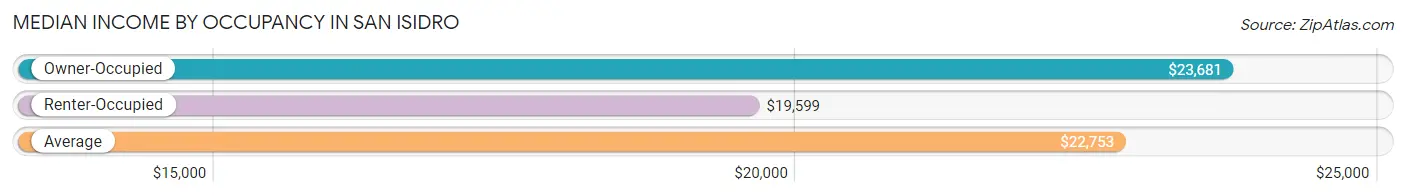
| Occupancy Type | # Households | Median Income |
| Owner-Occupied | 1,653 (64.0%) | $23,681 |
| Renter-Occupied | 931 (36.0%) | $19,599 |
| Average | 2,584 (100.0%) | $22,753 |
Occupancy by Householder Income Bracket in San Isidro
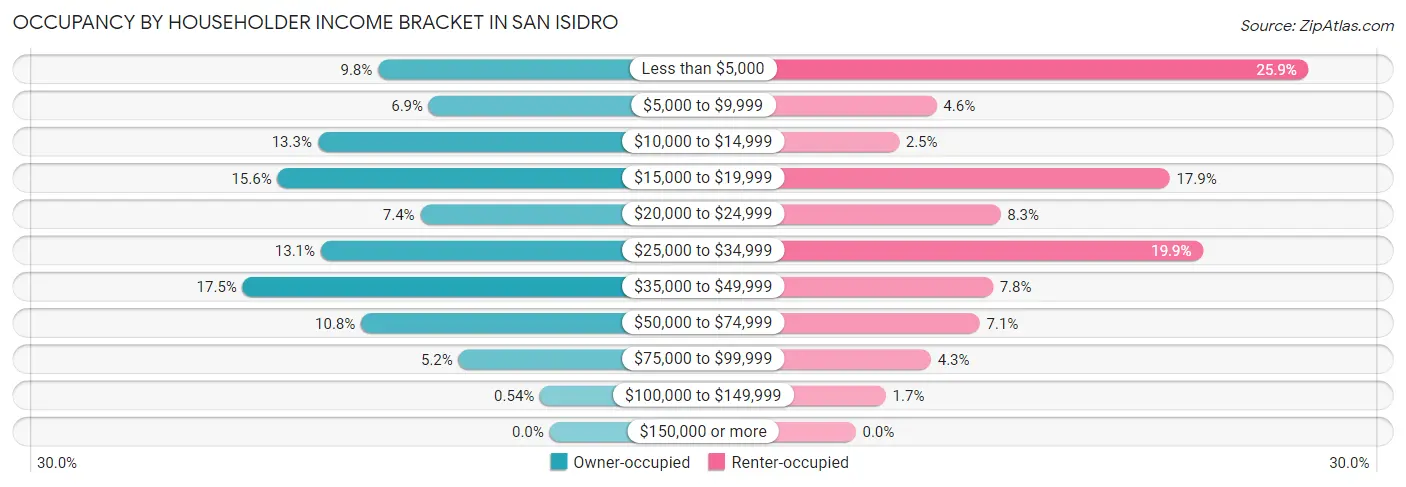
| Income Bracket | Owner-occupied | Renter-occupied |
| Less than $5,000 | 162 (9.8%) | 241 (25.9%) |
| $5,000 to $9,999 | 114 (6.9%) | 43 (4.6%) |
| $10,000 to $14,999 | 219 (13.3%) | 23 (2.5%) |
| $15,000 to $19,999 | 257 (15.5%) | 167 (17.9%) |
| $20,000 to $24,999 | 122 (7.4%) | 77 (8.3%) |
| $25,000 to $34,999 | 216 (13.1%) | 185 (19.9%) |
| $35,000 to $49,999 | 290 (17.5%) | 73 (7.8%) |
| $50,000 to $74,999 | 178 (10.8%) | 66 (7.1%) |
| $75,000 to $99,999 | 86 (5.2%) | 40 (4.3%) |
| $100,000 to $149,999 | 9 (0.5%) | 16 (1.7%) |
| $150,000 or more | 0 (0.0%) | 0 (0.0%) |
| Total | 1,653 (100.0%) | 931 (100.0%) |
Monthly Housing Cost Tiers in San Isidro
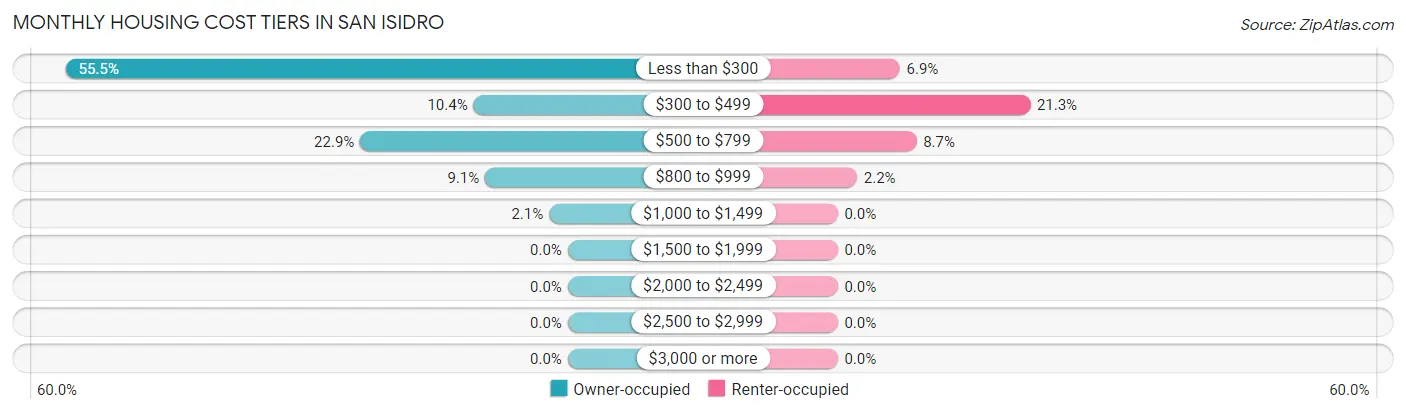
| Monthly Cost | Owner-occupied | Renter-occupied |
| Less than $300 | 917 (55.5%) | 64 (6.9%) |
| $300 to $499 | 172 (10.4%) | 198 (21.3%) |
| $500 to $799 | 379 (22.9%) | 81 (8.7%) |
| $800 to $999 | 151 (9.1%) | 20 (2.1%) |
| $1,000 to $1,499 | 34 (2.1%) | 0 (0.0%) |
| $1,500 to $1,999 | 0 (0.0%) | 0 (0.0%) |
| $2,000 to $2,499 | 0 (0.0%) | 0 (0.0%) |
| $2,500 to $2,999 | 0 (0.0%) | 0 (0.0%) |
| $3,000 or more | 0 (0.0%) | 0 (0.0%) |
| Total | 1,653 (100.0%) | 931 (100.0%) |
Physical Housing Characteristics in San Isidro
Housing Structures in San Isidro
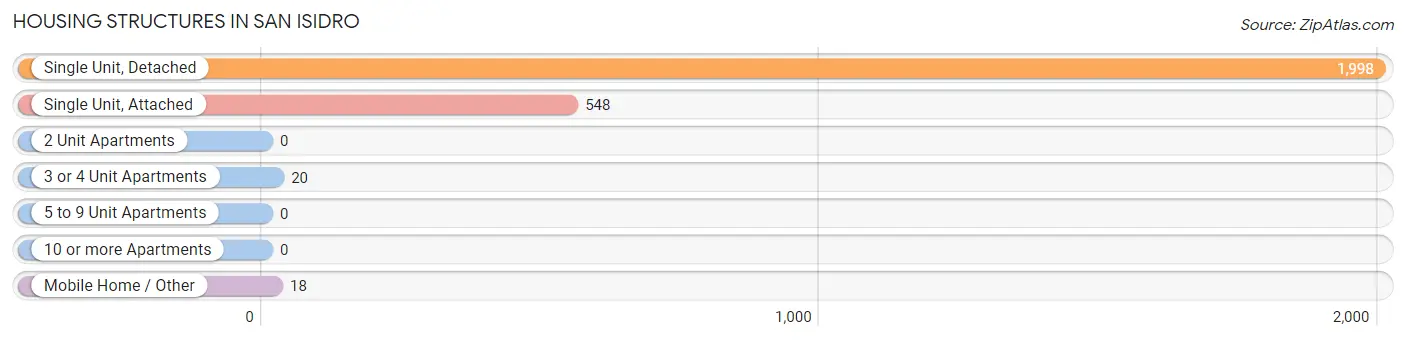
| Structure Type | # Housing Units | % Housing Units |
| Single Unit, Detached | 1,998 | 77.3% |
| Single Unit, Attached | 548 | 21.2% |
| 2 Unit Apartments | 0 | 0.0% |
| 3 or 4 Unit Apartments | 20 | 0.8% |
| 5 to 9 Unit Apartments | 0 | 0.0% |
| 10 or more Apartments | 0 | 0.0% |
| Mobile Home / Other | 18 | 0.7% |
| Total | 2,584 | 100.0% |
Housing Structures by Occupancy in San Isidro
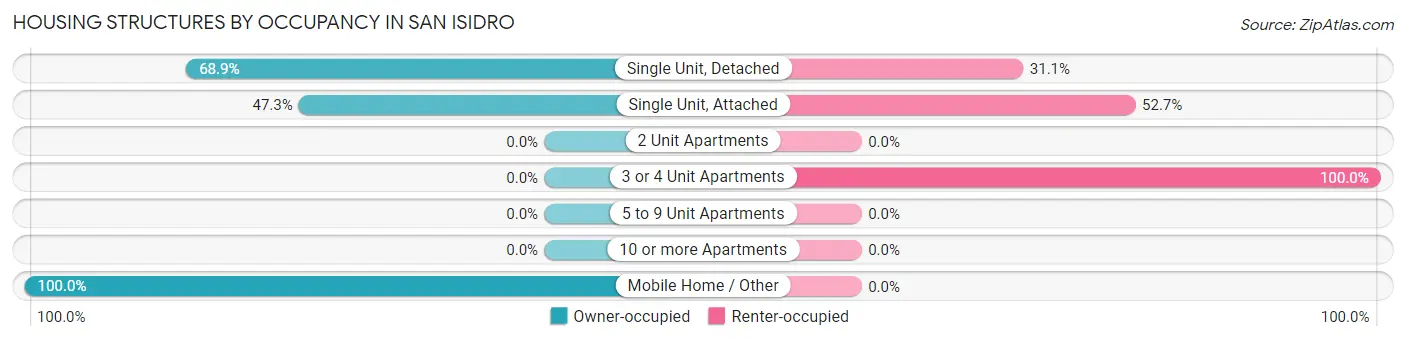
| Structure Type | Owner-occupied | Renter-occupied |
| Single Unit, Detached | 1,376 (68.9%) | 622 (31.1%) |
| Single Unit, Attached | 259 (47.3%) | 289 (52.7%) |
| 2 Unit Apartments | 0 (0.0%) | 0 (0.0%) |
| 3 or 4 Unit Apartments | 0 (0.0%) | 20 (100.0%) |
| 5 to 9 Unit Apartments | 0 (0.0%) | 0 (0.0%) |
| 10 or more Apartments | 0 (0.0%) | 0 (0.0%) |
| Mobile Home / Other | 18 (100.0%) | 0 (0.0%) |
| Total | 1,653 (64.0%) | 931 (36.0%) |
Housing Structures by Number of Rooms in San Isidro
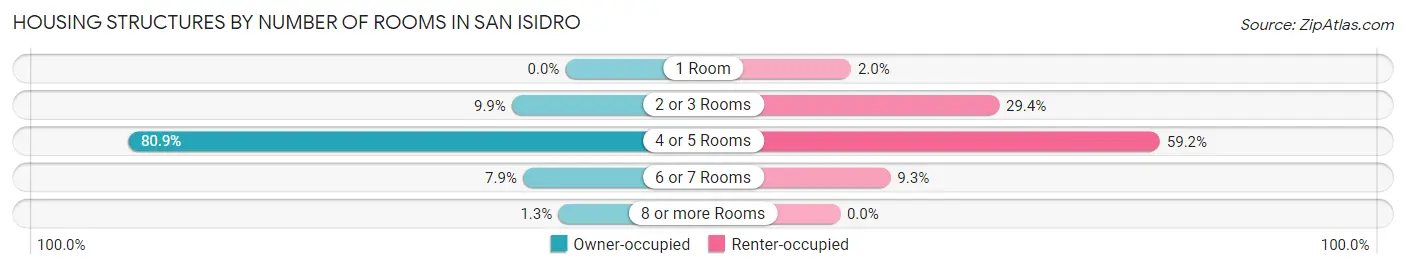
| Number of Rooms | Owner-occupied | Renter-occupied |
| 1 Room | 0 (0.0%) | 19 (2.0%) |
| 2 or 3 Rooms | 164 (9.9%) | 274 (29.4%) |
| 4 or 5 Rooms | 1,337 (80.9%) | 551 (59.2%) |
| 6 or 7 Rooms | 130 (7.9%) | 87 (9.3%) |
| 8 or more Rooms | 22 (1.3%) | 0 (0.0%) |
| Total | 1,653 (100.0%) | 931 (100.0%) |
Housing Structure by Heating Type in San Isidro
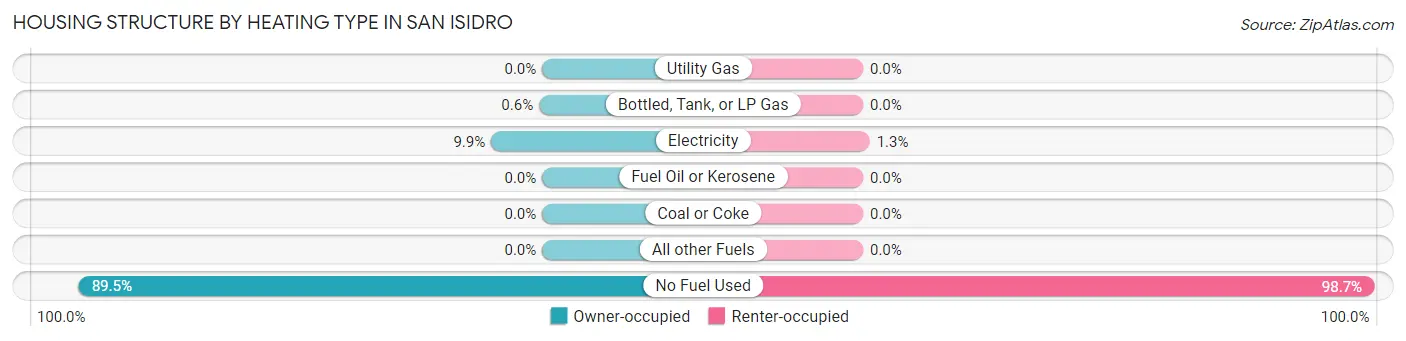
| Heating Type | Owner-occupied | Renter-occupied |
| Utility Gas | 0 (0.0%) | 0 (0.0%) |
| Bottled, Tank, or LP Gas | 10 (0.6%) | 0 (0.0%) |
| Electricity | 163 (9.9%) | 12 (1.3%) |
| Fuel Oil or Kerosene | 0 (0.0%) | 0 (0.0%) |
| Coal or Coke | 0 (0.0%) | 0 (0.0%) |
| All other Fuels | 0 (0.0%) | 0 (0.0%) |
| No Fuel Used | 1,480 (89.5%) | 919 (98.7%) |
| Total | 1,653 (100.0%) | 931 (100.0%) |
Household Vehicle Usage in San Isidro
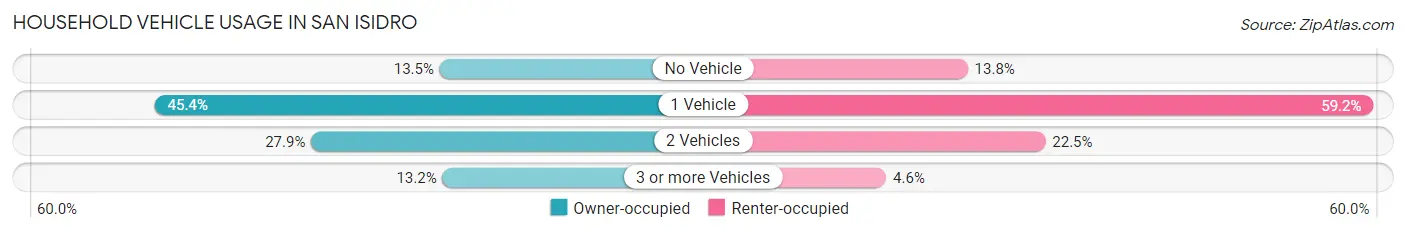
| Vehicles per Household | Owner-occupied | Renter-occupied |
| No Vehicle | 223 (13.5%) | 128 (13.8%) |
| 1 Vehicle | 751 (45.4%) | 551 (59.2%) |
| 2 Vehicles | 461 (27.9%) | 209 (22.5%) |
| 3 or more Vehicles | 218 (13.2%) | 43 (4.6%) |
| Total | 1,653 (100.0%) | 931 (100.0%) |
Real Estate & Mortgages in San Isidro
Real Estate and Mortgage Overview in San Isidro
| Characteristic | Without Mortgage | With Mortgage |
| Housing Units | 1,117 | 536 |
| Median Property Value | $78,500 | $98,600 |
| Median Household Income | $20,039 | $0 |
| Monthly Housing Costs | $173 | $0 |
| Real Estate Taxes | $391 | $499 |
Property Value by Mortgage Status in San Isidro
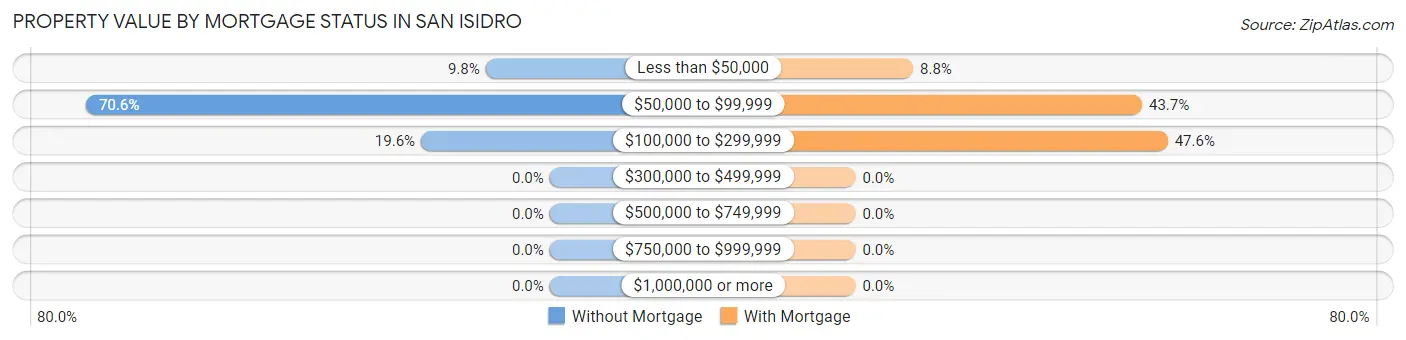
| Property Value | Without Mortgage | With Mortgage |
| Less than $50,000 | 109 (9.8%) | 47 (8.8%) |
| $50,000 to $99,999 | 789 (70.6%) | 234 (43.7%) |
| $100,000 to $299,999 | 219 (19.6%) | 255 (47.6%) |
| $300,000 to $499,999 | 0 (0.0%) | 0 (0.0%) |
| $500,000 to $749,999 | 0 (0.0%) | 0 (0.0%) |
| $750,000 to $999,999 | 0 (0.0%) | 0 (0.0%) |
| $1,000,000 or more | 0 (0.0%) | 0 (0.0%) |
| Total | 1,117 (100.0%) | 536 (100.0%) |
Household Income by Mortgage Status in San Isidro
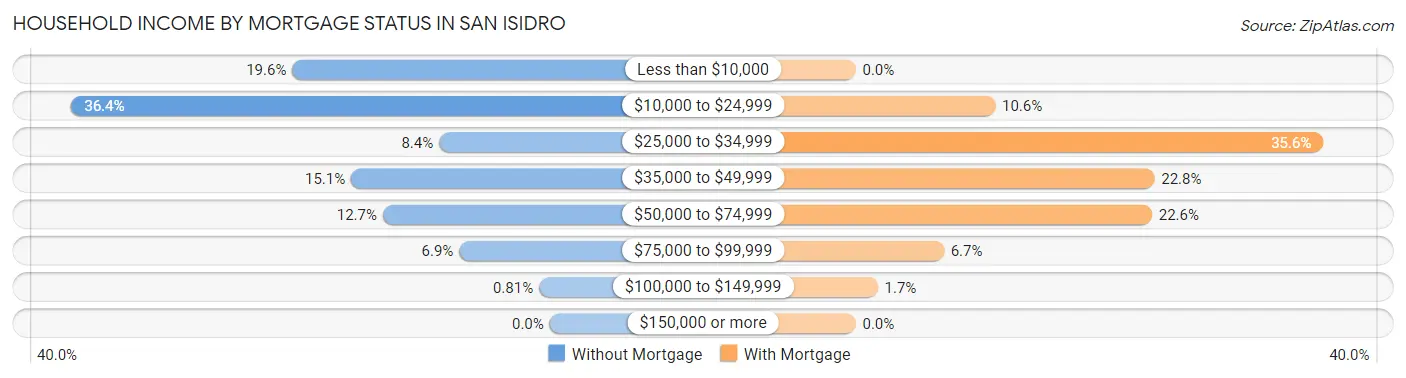
| Household Income | Without Mortgage | With Mortgage |
| Less than $10,000 | 219 (19.6%) | 0 (0.0%) |
| $10,000 to $24,999 | 407 (36.4%) | 57 (10.6%) |
| $25,000 to $34,999 | 94 (8.4%) | 191 (35.6%) |
| $35,000 to $49,999 | 169 (15.1%) | 122 (22.8%) |
| $50,000 to $74,999 | 142 (12.7%) | 121 (22.6%) |
| $75,000 to $99,999 | 77 (6.9%) | 36 (6.7%) |
| $100,000 to $149,999 | 9 (0.8%) | 9 (1.7%) |
| $150,000 or more | 0 (0.0%) | 0 (0.0%) |
| Total | 1,117 (100.0%) | 536 (100.0%) |
Property Value to Household Income Ratio in San Isidro
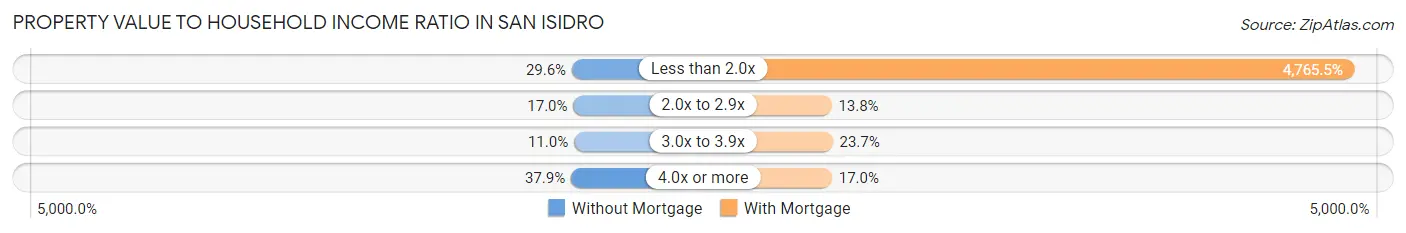
| Value-to-Income Ratio | Without Mortgage | With Mortgage |
| Less than 2.0x | 331 (29.6%) | 25,543 (4,765.5%) |
| 2.0x to 2.9x | 190 (17.0%) | 74 (13.8%) |
| 3.0x to 3.9x | 123 (11.0%) | 127 (23.7%) |
| 4.0x or more | 423 (37.9%) | 91 (17.0%) |
| Total | 1,117 (100.0%) | 536 (100.0%) |
Real Estate Taxes by Mortgage Status in San Isidro
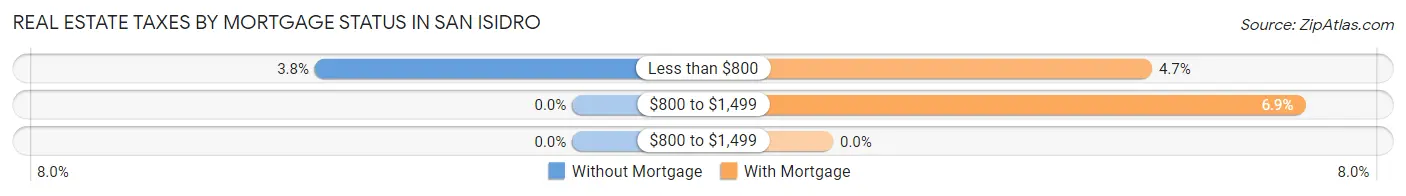
| Property Taxes | Without Mortgage | With Mortgage |
| Less than $800 | 42 (3.8%) | 25 (4.7%) |
| $800 to $1,499 | 0 (0.0%) | 37 (6.9%) |
| $800 to $1,499 | 0 (0.0%) | 0 (0.0%) |
| Total | 1,117 (100.0%) | 536 (100.0%) |
Health & Disability in San Isidro
Health Insurance Coverage by Age in San Isidro
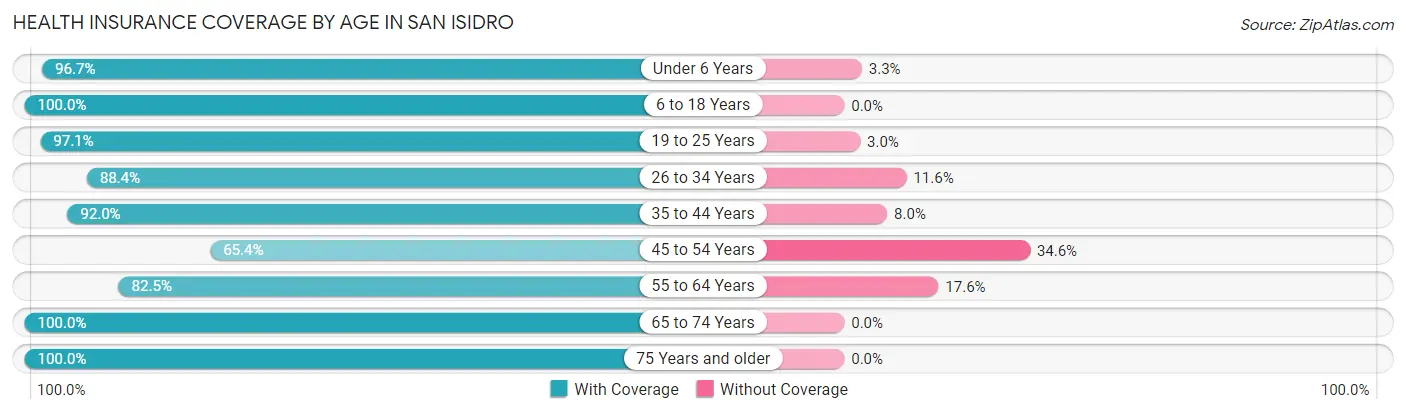
| Age Bracket | With Coverage | Without Coverage |
| Under 6 Years | 443 (96.7%) | 15 (3.3%) |
| 6 to 18 Years | 956 (100.0%) | 0 (0.0%) |
| 19 to 25 Years | 624 (97.1%) | 19 (2.9%) |
| 26 to 34 Years | 777 (88.4%) | 102 (11.6%) |
| 35 to 44 Years | 714 (92.0%) | 62 (8.0%) |
| 45 to 54 Years | 895 (65.4%) | 474 (34.6%) |
| 55 to 64 Years | 719 (82.5%) | 153 (17.5%) |
| 65 to 74 Years | 741 (100.0%) | 0 (0.0%) |
| 75 Years and older | 591 (100.0%) | 0 (0.0%) |
| Total | 6,460 (88.7%) | 825 (11.3%) |
Health Insurance Coverage by Citizenship Status in San Isidro
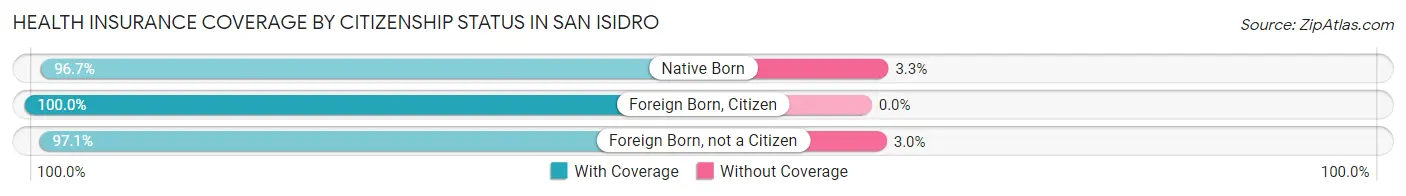
| Citizenship Status | With Coverage | Without Coverage |
| Native Born | 443 (96.7%) | 15 (3.3%) |
| Foreign Born, Citizen | 956 (100.0%) | 0 (0.0%) |
| Foreign Born, not a Citizen | 624 (97.1%) | 19 (2.9%) |
Health Insurance Coverage by Household Income in San Isidro
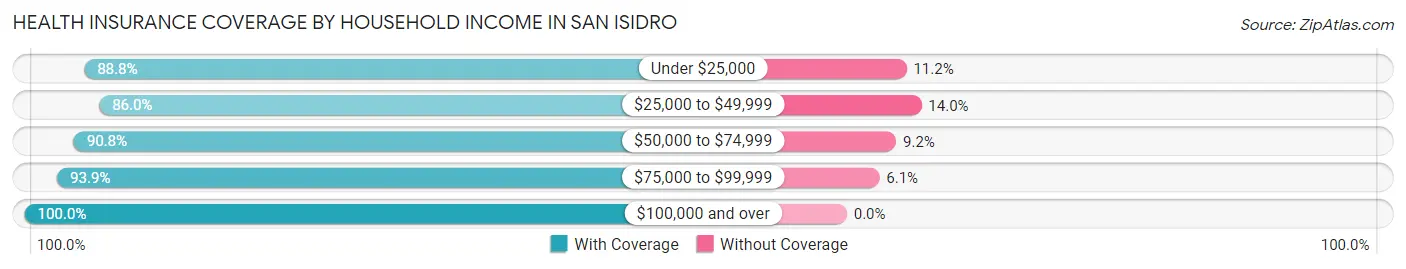
| Household Income | With Coverage | Without Coverage |
| Under $25,000 | 2,805 (88.8%) | 353 (11.2%) |
| $25,000 to $49,999 | 2,159 (86.0%) | 351 (14.0%) |
| $50,000 to $74,999 | 797 (90.8%) | 81 (9.2%) |
| $75,000 to $99,999 | 616 (93.9%) | 40 (6.1%) |
| $100,000 and over | 82 (100.0%) | 0 (0.0%) |
Public vs Private Health Insurance Coverage by Age in San Isidro
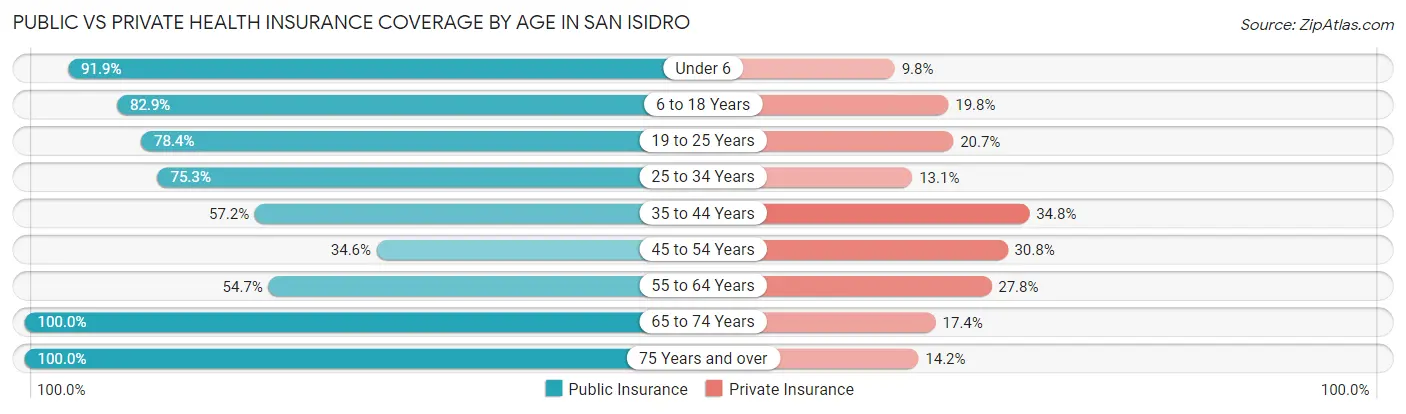
| Age Bracket | Public Insurance | Private Insurance |
| Under 6 | 421 (91.9%) | 45 (9.8%) |
| 6 to 18 Years | 792 (82.9%) | 189 (19.8%) |
| 19 to 25 Years | 504 (78.4%) | 133 (20.7%) |
| 25 to 34 Years | 662 (75.3%) | 115 (13.1%) |
| 35 to 44 Years | 444 (57.2%) | 270 (34.8%) |
| 45 to 54 Years | 474 (34.6%) | 421 (30.7%) |
| 55 to 64 Years | 477 (54.7%) | 242 (27.8%) |
| 65 to 74 Years | 741 (100.0%) | 129 (17.4%) |
| 75 Years and over | 591 (100.0%) | 84 (14.2%) |
| Total | 5,106 (70.1%) | 1,628 (22.4%) |
Disability Status by Sex by Age in San Isidro
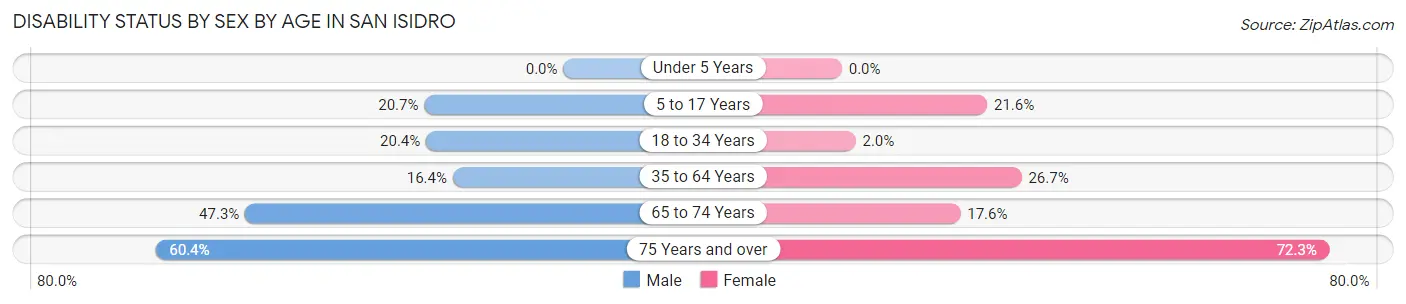
| Age Bracket | Male | Female |
| Under 5 Years | 0 (0.0%) | 0 (0.0%) |
| 5 to 17 Years | 121 (20.6%) | 88 (21.6%) |
| 18 to 34 Years | 151 (20.4%) | 17 (2.0%) |
| 35 to 64 Years | 243 (16.4%) | 410 (26.7%) |
| 65 to 74 Years | 189 (47.2%) | 60 (17.6%) |
| 75 Years and over | 139 (60.4%) | 261 (72.3%) |
Disability Class by Sex by Age in San Isidro
Disability Class: Hearing Difficulty
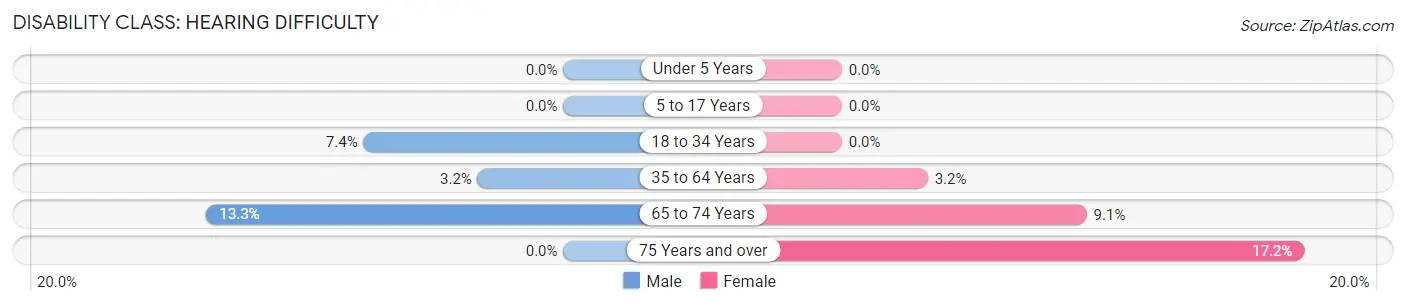
| Age Bracket | Male | Female |
| Under 5 Years | 0 (0.0%) | 0 (0.0%) |
| 5 to 17 Years | 0 (0.0%) | 0 (0.0%) |
| 18 to 34 Years | 55 (7.4%) | 0 (0.0%) |
| 35 to 64 Years | 47 (3.2%) | 49 (3.2%) |
| 65 to 74 Years | 53 (13.3%) | 31 (9.1%) |
| 75 Years and over | 0 (0.0%) | 62 (17.2%) |
Disability Class: Vision Difficulty
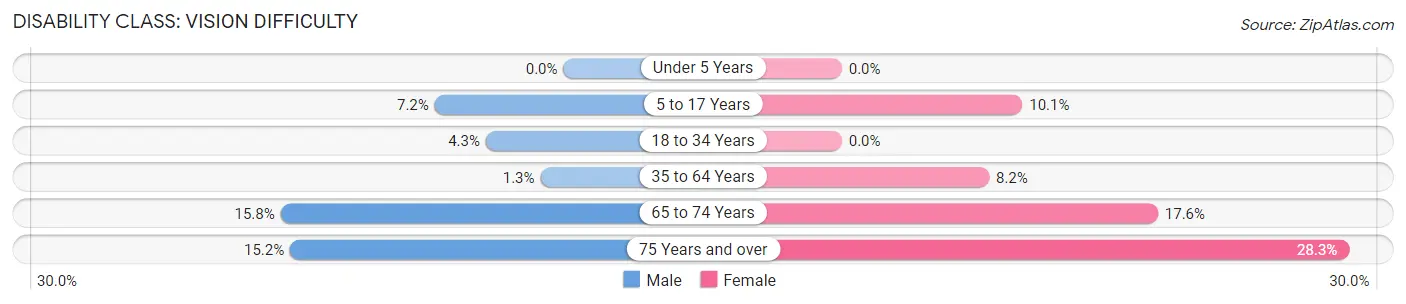
| Age Bracket | Male | Female |
| Under 5 Years | 0 (0.0%) | 0 (0.0%) |
| 5 to 17 Years | 42 (7.2%) | 41 (10.1%) |
| 18 to 34 Years | 32 (4.3%) | 0 (0.0%) |
| 35 to 64 Years | 19 (1.3%) | 126 (8.2%) |
| 65 to 74 Years | 63 (15.8%) | 60 (17.6%) |
| 75 Years and over | 35 (15.2%) | 102 (28.2%) |
Disability Class: Cognitive Difficulty
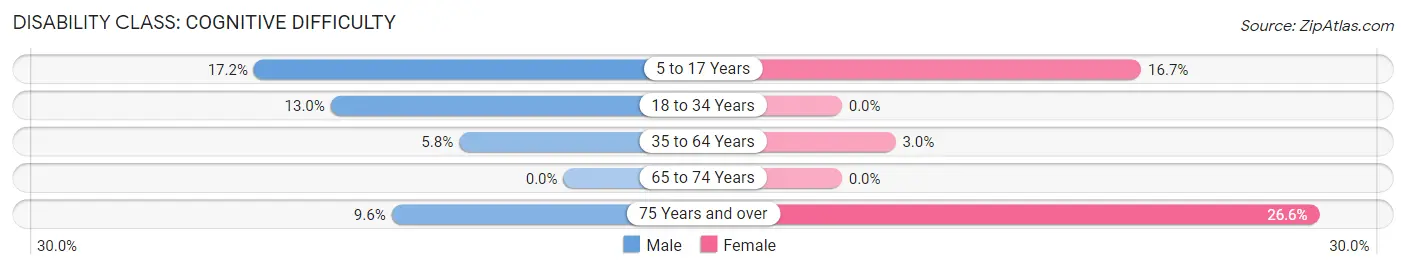
| Age Bracket | Male | Female |
| 5 to 17 Years | 101 (17.2%) | 68 (16.7%) |
| 18 to 34 Years | 96 (13.0%) | 0 (0.0%) |
| 35 to 64 Years | 86 (5.8%) | 46 (3.0%) |
| 65 to 74 Years | 0 (0.0%) | 0 (0.0%) |
| 75 Years and over | 22 (9.6%) | 96 (26.6%) |
Disability Class: Ambulatory Difficulty
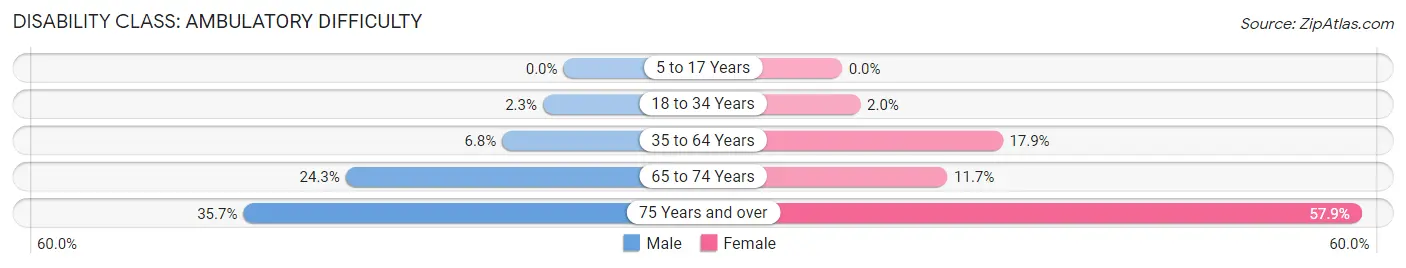
| Age Bracket | Male | Female |
| 5 to 17 Years | 0 (0.0%) | 0 (0.0%) |
| 18 to 34 Years | 17 (2.3%) | 17 (2.0%) |
| 35 to 64 Years | 101 (6.8%) | 275 (17.9%) |
| 65 to 74 Years | 97 (24.2%) | 40 (11.7%) |
| 75 Years and over | 82 (35.6%) | 209 (57.9%) |
Disability Class: Self-Care Difficulty
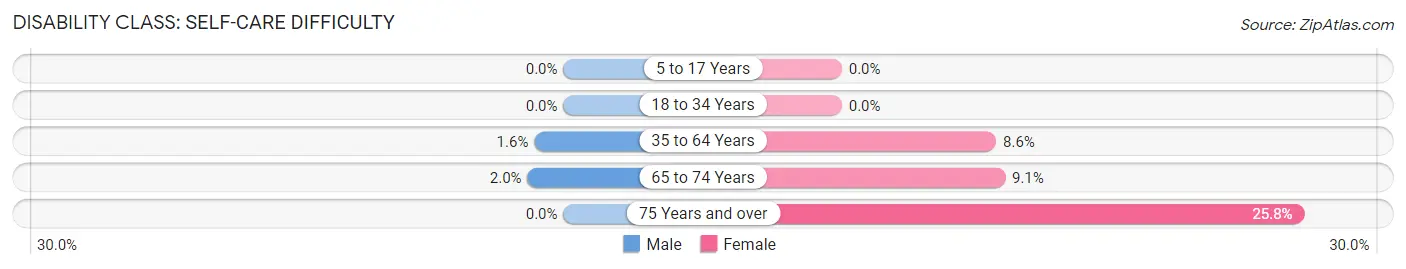
| Age Bracket | Male | Female |
| 5 to 17 Years | 0 (0.0%) | 0 (0.0%) |
| 18 to 34 Years | 0 (0.0%) | 0 (0.0%) |
| 35 to 64 Years | 24 (1.6%) | 132 (8.6%) |
| 65 to 74 Years | 8 (2.0%) | 31 (9.1%) |
| 75 Years and over | 0 (0.0%) | 93 (25.8%) |
Technology Access in San Isidro
Computing Device Access in San Isidro
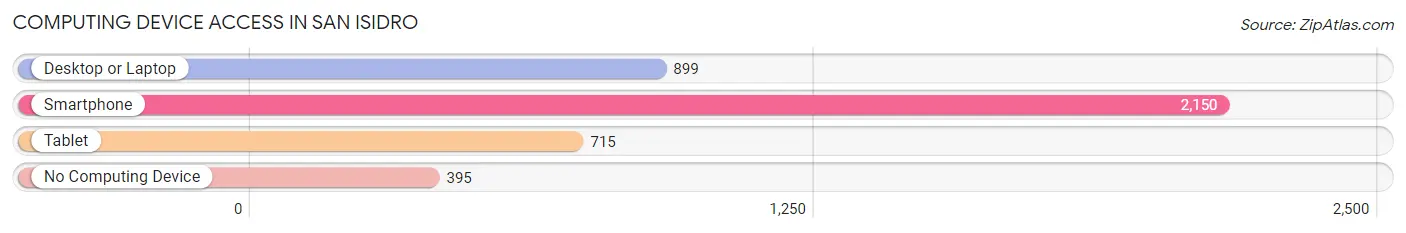
| Device Type | # Households | % Households |
| Desktop or Laptop | 899 | 34.8% |
| Smartphone | 2,150 | 83.2% |
| Tablet | 715 | 27.7% |
| No Computing Device | 395 | 15.3% |
| Total | 2,584 | 100.0% |
Internet Access in San Isidro
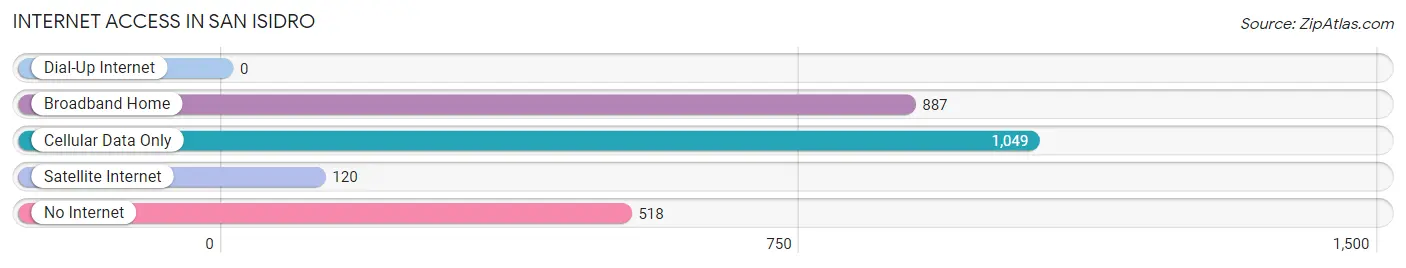
| Internet Type | # Households | % Households |
| Dial-Up Internet | 0 | 0.0% |
| Broadband Home | 887 | 34.3% |
| Cellular Data Only | 1,049 | 40.6% |
| Satellite Internet | 120 | 4.6% |
| No Internet | 518 | 20.1% |
| Total | 2,584 | 100.0% |
San Isidro Summary
San Isidro is a municipality located in the northern region of Puerto Rico. It is part of the San Juan-Caguas-Guaynabo Metropolitan Statistical Area. As of the 2010 census, the population of San Isidro was 8,845.
Geography
San Isidro is located in the northern region of Puerto Rico, in the northern part of the San Juan-Caguas-Guaynabo Metropolitan Statistical Area. It is bordered by the municipalities of Toa Alta, Toa Baja, Bayamón, and Naranjito. The municipality covers an area of 8.9 square miles (23.1 km2).
The terrain of San Isidro is mostly flat, with some hills in the northern part of the municipality. The highest point is Cerro La Pica, which rises to an elevation of 1,068 feet (325 m). The municipality is drained by the Rio Grande de Manatí, which flows through the center of the municipality.
History
San Isidro was founded in 1813 by Don Isidro de la Torre. The town was named after him, and it was officially recognized as a municipality in 1831.
In the early 20th century, San Isidro was a rural agricultural community. The economy was based on the production of sugar cane, coffee, and tobacco. In the 1950s, the economy began to diversify, and the municipality began to attract new industries.
Economy
San Isidro’s economy is largely based on manufacturing and services. The municipality is home to several industrial parks, including the San Isidro Industrial Park and the San Isidro Industrial Center. These parks are home to a variety of industries, including electronics, pharmaceuticals, and food processing.
The municipality also has a growing tourism industry. San Isidro is home to several attractions, including the San Isidro Museum, the San Isidro Plaza, and the San Isidro Cathedral.
Demographics
As of the 2010 census, the population of San Isidro was 8,845. The population is mostly of Puerto Rican descent, with a small minority of African and European descent. The median age is 37.5 years, and the median household income is $20,845.
San Isidro is a predominantly Roman Catholic municipality. The majority of the population speaks Spanish, although English is also spoken.
Conclusion
San Isidro is a municipality located in the northern region of Puerto Rico. It is part of the San Juan-Caguas-Guaynabo Metropolitan Statistical Area. As of the 2010 census, the population of San Isidro was 8,845. The municipality is mostly flat, with some hills in the northern part of the municipality. The economy is largely based on manufacturing and services, and the municipality has a growing tourism industry. The population is mostly of Puerto Rican descent, with a small minority of African and European descent. San Isidro is a predominantly Roman Catholic municipality, and the majority of the population speaks Spanish.
Common Questions
What is Per Capita Income in San Isidro?
Per Capita income in San Isidro is $11,524.
What is the Median Family Income in San Isidro?
Median Family Income in San Isidro is $25,363.
What is the Median Household income in San Isidro?
Median Household Income in San Isidro is $22,753.
What is Income or Wage Gap in San Isidro?
Income or Wage Gap in San Isidro is 4.8%.
Women in San Isidro earn 95.2 cents for every dollar earned by a man.
What is Family Income Deficit in San Isidro?
Family Income Deficit in San Isidro is $11,055.
Families that are below poverty line in San Isidro earn $11,055 less on average than the poverty threshold level.
What is Inequality or Gini Index in San Isidro?
Inequality or Gini Index in San Isidro is 0.44.
What is the Total Population of San Isidro?
Total Population of San Isidro is 7,285.
What is the Total Male Population of San Isidro?
Total Male Population of San Isidro is 3,668.
What is the Total Female Population of San Isidro?
Total Female Population of San Isidro is 3,617.
What is the Ratio of Males per 100 Females in San Isidro?
There are 101.41 Males per 100 Females in San Isidro.
What is the Ratio of Females per 100 Males in San Isidro?
There are 98.61 Females per 100 Males in San Isidro.
What is the Median Population Age in San Isidro?
Median Population Age in San Isidro is 43.8 Years.
What is the Average Family Size in San Isidro
Average Family Size in San Isidro is 3.6 People.
What is the Average Household Size in San Isidro
Average Household Size in San Isidro is 2.8 People.
How Large is the Labor Force in San Isidro?
There are 3,211 People in the Labor Forcein in San Isidro.
What is the Percentage of People in the Labor Force in San Isidro?
53.3% of People are in the Labor Force in San Isidro.
What is the Unemployment Rate in San Isidro?
Unemployment Rate in San Isidro is 19.7%.