Lake Worth, TX Map & Demographics
Lake Worth Map
Lake Worth Overview
$49,212
PER CAPITA INCOME
$84,375
AVG FAMILY INCOME
$82,114
AVG HOUSEHOLD INCOME
36.0%
WAGE / INCOME GAP [ % ]
64.0¢/ $1
WAGE / INCOME GAP [ $ ]
0.49
INEQUALITY / GINI INDEX
4,701
TOTAL POPULATION
2,111
MALE POPULATION
2,590
FEMALE POPULATION
81.51
MALES / 100 FEMALES
122.69
FEMALES / 100 MALES
44.9
MEDIAN AGE
2.9
AVG FAMILY SIZE
2.5
AVG HOUSEHOLD SIZE
2,687
LABOR FORCE [ PEOPLE ]
64.4%
PERCENT IN LABOR FORCE
8.0%
UNEMPLOYMENT RATE
Income in Lake Worth
Income Overview in Lake Worth
Per Capita Income in Lake Worth is $49,212, while median incomes of families and households are $84,375 and $82,114 respectively.
| Characteristic | Number | Measure |
| Per Capita Income | 4,701 | $49,212 |
| Median Family Income | 1,081 | $84,375 |
| Mean Family Income | 1,081 | $95,833 |
| Median Household Income | 1,845 | $82,114 |
| Mean Household Income | 1,845 | $123,222 |
| Income Deficit | 1,081 | $0 |
| Wage / Income Gap (%) | 4,701 | 36.04% |
| Wage / Income Gap ($) | 4,701 | 63.96¢ per $1 |
| Gini / Inequality Index | 4,701 | 0.49 |
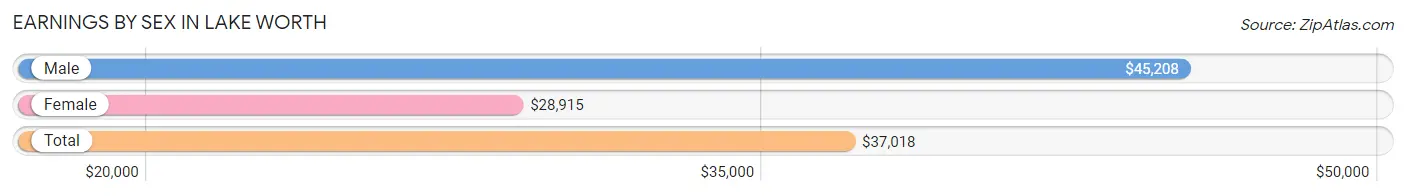
Earnings by Sex in Lake Worth
Average Earnings in Lake Worth are $37,018, $45,208 for men and $28,915 for women, a difference of 36.0%.
| Sex | Number | Average Earnings |
| Male | 1,339 (49.3%) | $45,208 |
| Female | 1,376 (50.7%) | $28,915 |
| Total | 2,715 (100.0%) | $37,018 |
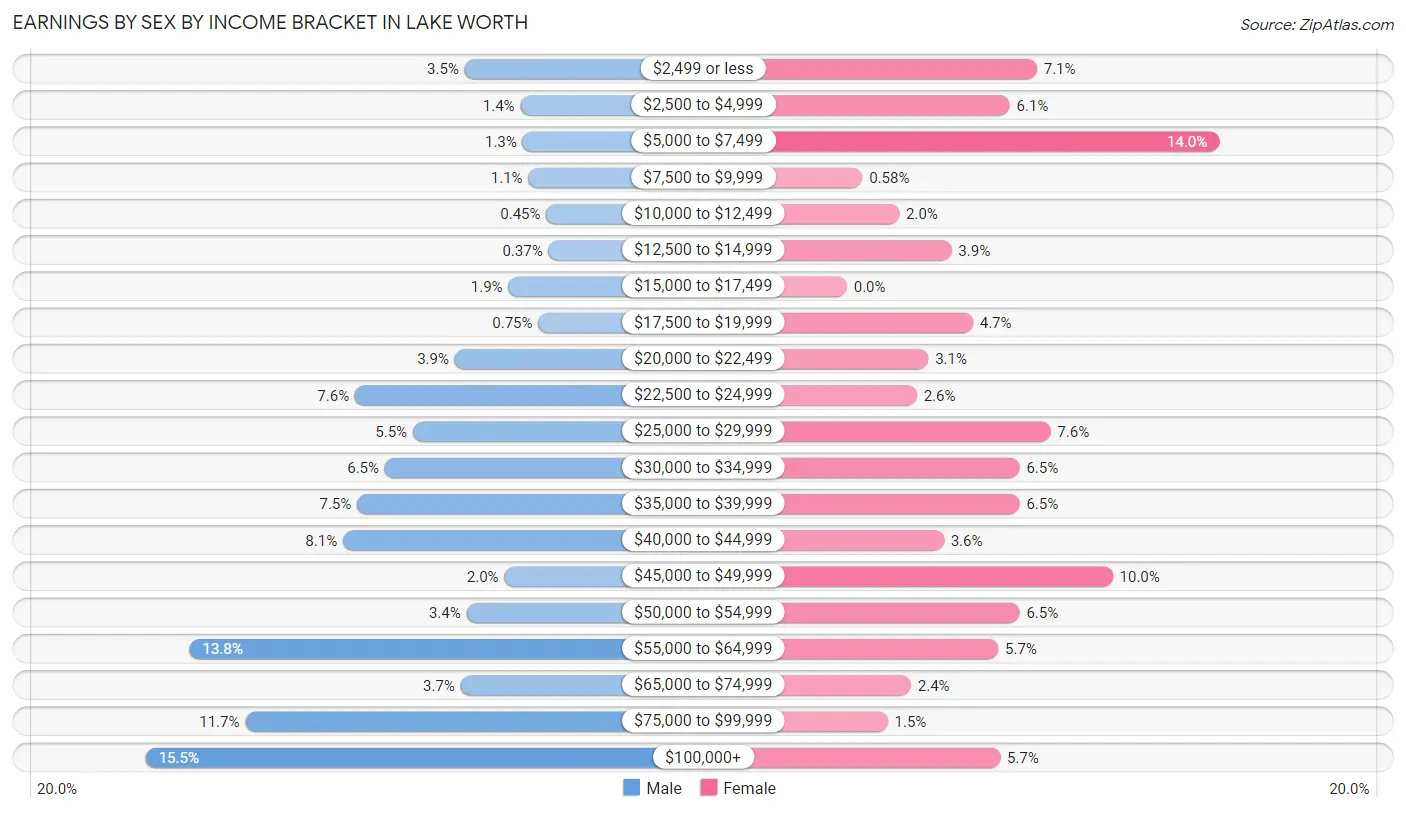
Earnings by Sex by Income Bracket in Lake Worth
The most common earnings brackets in Lake Worth are $100,000+ for men (207 | 15.5%) and $5,000 to $7,499 for women (192 | 14.0%).
| Income | Male | Female |
| $2,499 or less | 47 (3.5%) | 98 (7.1%) |
| $2,500 to $4,999 | 19 (1.4%) | 84 (6.1%) |
| $5,000 to $7,499 | 18 (1.3%) | 192 (14.0%) |
| $7,500 to $9,999 | 15 (1.1%) | 8 (0.6%) |
| $10,000 to $12,499 | 6 (0.4%) | 27 (2.0%) |
| $12,500 to $14,999 | 5 (0.4%) | 54 (3.9%) |
| $15,000 to $17,499 | 25 (1.9%) | 0 (0.0%) |
| $17,500 to $19,999 | 10 (0.7%) | 65 (4.7%) |
| $20,000 to $22,499 | 52 (3.9%) | 42 (3.0%) |
| $22,500 to $24,999 | 102 (7.6%) | 36 (2.6%) |
| $25,000 to $29,999 | 73 (5.4%) | 105 (7.6%) |
| $30,000 to $34,999 | 87 (6.5%) | 89 (6.5%) |
| $35,000 to $39,999 | 101 (7.5%) | 89 (6.5%) |
| $40,000 to $44,999 | 108 (8.1%) | 50 (3.6%) |
| $45,000 to $49,999 | 27 (2.0%) | 137 (10.0%) |
| $50,000 to $54,999 | 46 (3.4%) | 89 (6.5%) |
| $55,000 to $64,999 | 185 (13.8%) | 78 (5.7%) |
| $65,000 to $74,999 | 49 (3.7%) | 33 (2.4%) |
| $75,000 to $99,999 | 157 (11.7%) | 21 (1.5%) |
| $100,000+ | 207 (15.5%) | 79 (5.7%) |
| Total | 1,339 (100.0%) | 1,376 (100.0%) |
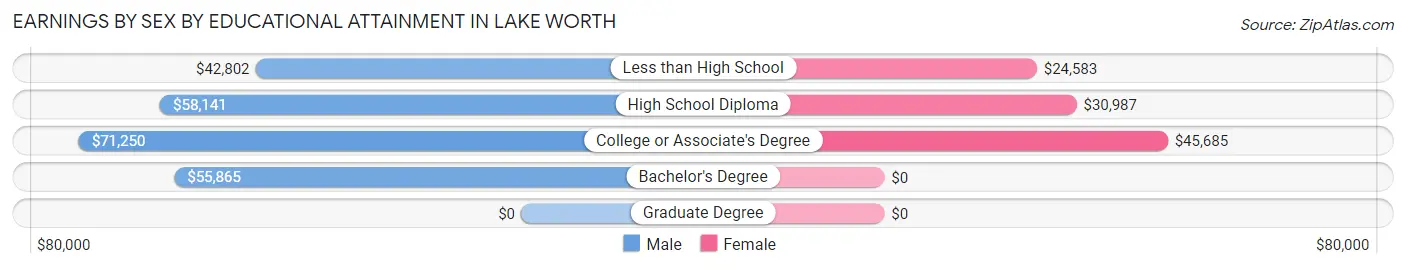
Earnings by Sex by Educational Attainment in Lake Worth
Average earnings in Lake Worth are $56,488 for men and $32,982 for women, a difference of 41.6%. Men with an educational attainment of college or associate's degree enjoy the highest average annual earnings of $71,250, while those with less than high school education earn the least with $42,802. Women with an educational attainment of college or associate's degree earn the most with the average annual earnings of $45,685, while those with less than high school education have the smallest earnings of $24,583.
| Educational Attainment | Male Income | Female Income |
| Less than High School | $42,802 | $24,583 |
| High School Diploma | $58,141 | $30,987 |
| College or Associate's Degree | $71,250 | $45,685 |
| Bachelor's Degree | $55,865 | $0 |
| Graduate Degree | - | - |
| Total | $56,488 | $32,982 |
Family Income in Lake Worth
Family Income Brackets in Lake Worth
According to the Lake Worth family income data, there are 270 families falling into the $100,000 to $149,999 income range, which is the most common income bracket and makes up 25.0% of all families.
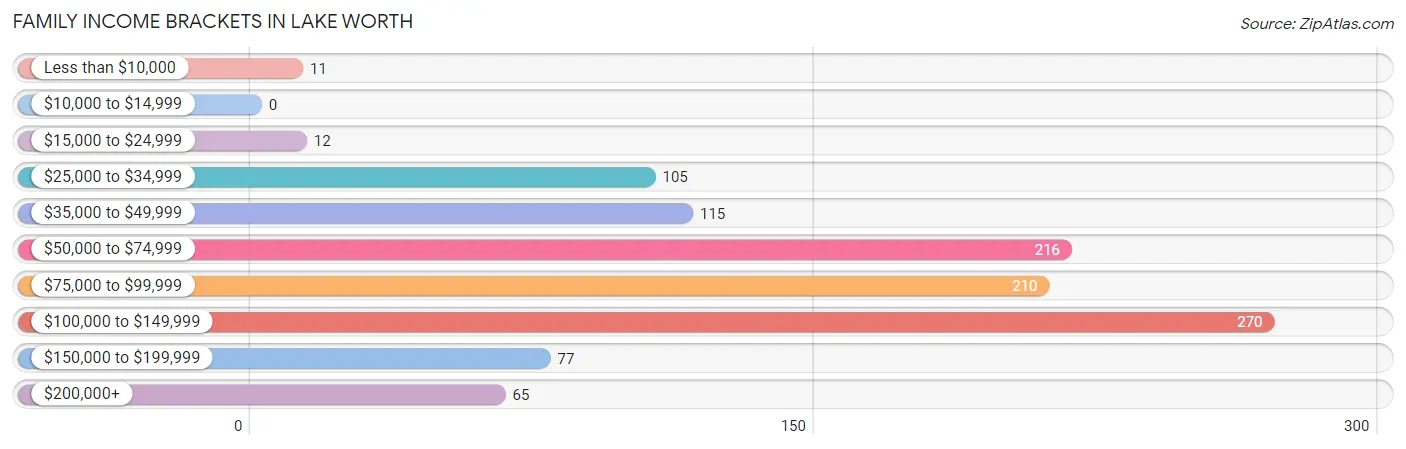
| Income Bracket | # Families | % Families |
| Less than $10,000 | 11 | 1.0% |
| $10,000 to $14,999 | 0 | 0.0% |
| $15,000 to $24,999 | 12 | 1.1% |
| $25,000 to $34,999 | 105 | 9.7% |
| $35,000 to $49,999 | 115 | 10.6% |
| $50,000 to $74,999 | 216 | 20.0% |
| $75,000 to $99,999 | 210 | 19.4% |
| $100,000 to $149,999 | 270 | 25.0% |
| $150,000 to $199,999 | 77 | 7.1% |
| $200,000+ | 65 | 6.0% |
Family Income by Famaliy Size in Lake Worth
5-person families (58 | 5.4%) account for the highest median family income in Lake Worth with $109,821 per family, while 2-person families (689 | 63.7%) have the highest median income of $40,491 per family member.
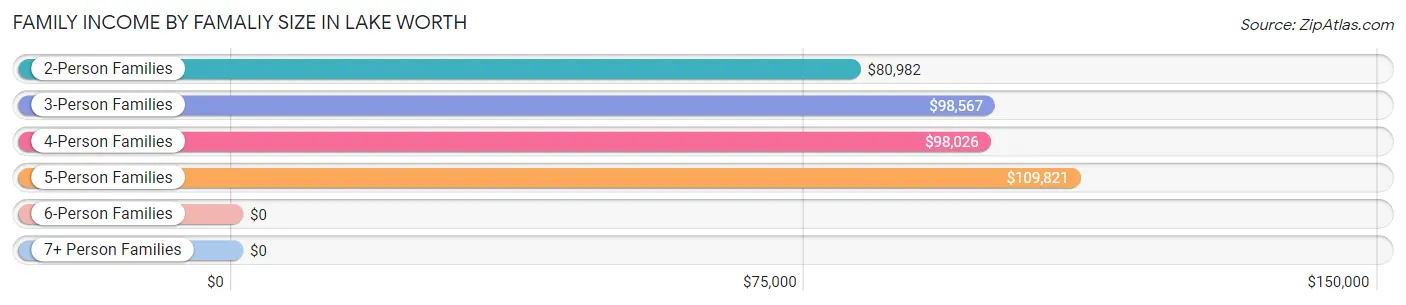
| Income Bracket | # Families | Median Income |
| 2-Person Families | 689 (63.7%) | $80,982 |
| 3-Person Families | 163 (15.1%) | $98,567 |
| 4-Person Families | 126 (11.7%) | $98,026 |
| 5-Person Families | 58 (5.4%) | $109,821 |
| 6-Person Families | 0 (0.0%) | $0 |
| 7+ Person Families | 45 (4.2%) | $0 |
| Total | 1,081 (100.0%) | $84,375 |
Family Income by Number of Earners in Lake Worth
The median family income in Lake Worth is $84,375, with families comprising 2 earners (488) having the highest median family income of $107,857, while families with 1 earner (291) have the lowest median family income of $56,458, accounting for 45.1% and 26.9% of families, respectively.
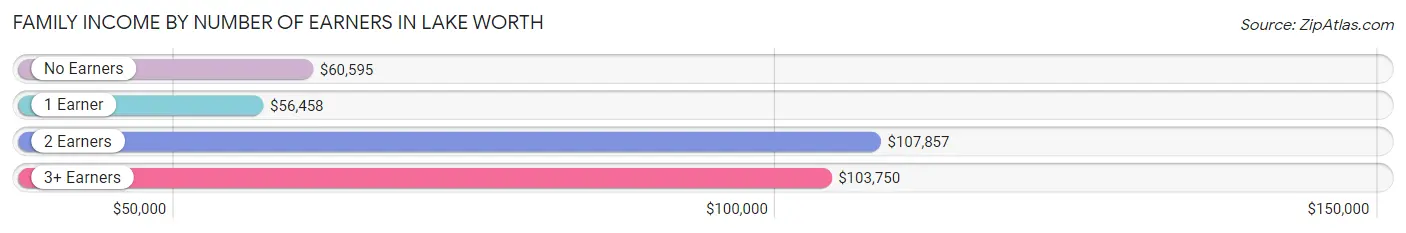
| Number of Earners | # Families | Median Income |
| No Earners | 160 (14.8%) | $60,595 |
| 1 Earner | 291 (26.9%) | $56,458 |
| 2 Earners | 488 (45.1%) | $107,857 |
| 3+ Earners | 142 (13.1%) | $103,750 |
| Total | 1,081 (100.0%) | $84,375 |
Household Income in Lake Worth
Household Income Brackets in Lake Worth
With 387 households falling in the category, the $100,000 to $149,999 income range is the most frequent in Lake Worth, accounting for 21.0% of all households. In contrast, only 26 households (1.4%) fall into the $10,000 to $14,999 income bracket, making it the least populous group.
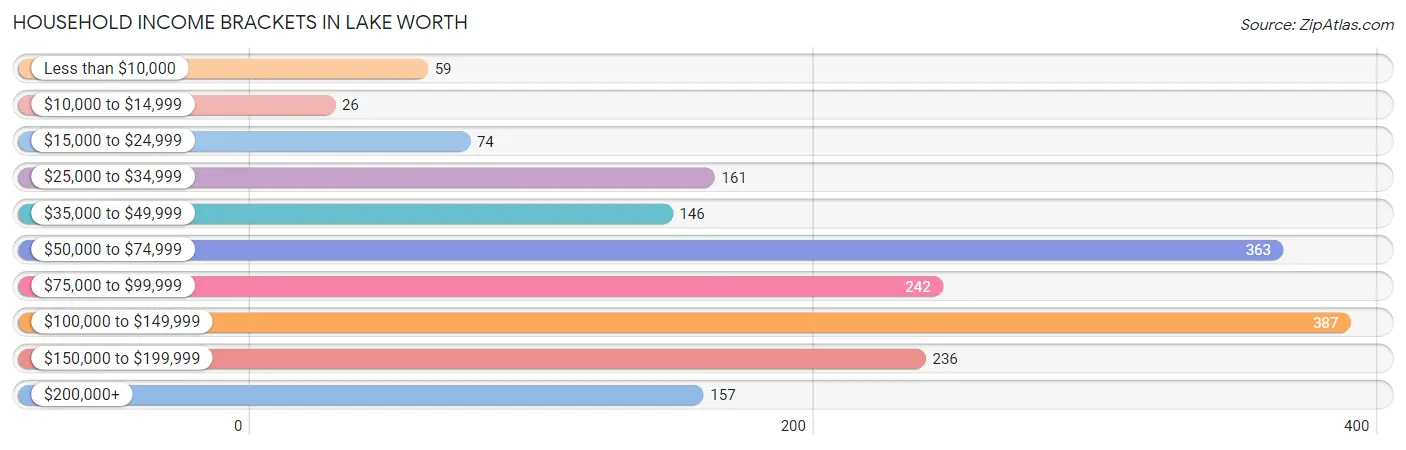
| Income Bracket | # Households | % Households |
| Less than $10,000 | 59 | 3.2% |
| $10,000 to $14,999 | 26 | 1.4% |
| $15,000 to $24,999 | 74 | 4.0% |
| $25,000 to $34,999 | 161 | 8.7% |
| $35,000 to $49,999 | 146 | 7.9% |
| $50,000 to $74,999 | 363 | 19.7% |
| $75,000 to $99,999 | 242 | 13.1% |
| $100,000 to $149,999 | 387 | 21.0% |
| $150,000 to $199,999 | 236 | 12.8% |
| $200,000+ | 157 | 8.5% |
Household Income by Householder Age in Lake Worth
The median household income in Lake Worth is $82,114, with the highest median household income of $112,539 found in the 45 to 64 years age bracket for the primary householder. A total of 843 households (45.7%) fall into this category. Meanwhile, the 15 to 24 years age bracket for the primary householder has the lowest median household income of $0, with 55 households (3.0%) in this group.
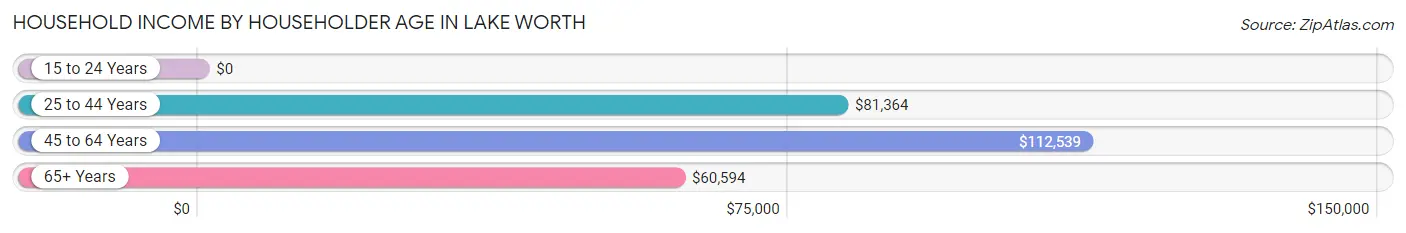
| Income Bracket | # Households | Median Income |
| 15 to 24 Years | 55 (3.0%) | $0 |
| 25 to 44 Years | 520 (28.2%) | $81,364 |
| 45 to 64 Years | 843 (45.7%) | $112,539 |
| 65+ Years | 427 (23.1%) | $60,594 |
| Total | 1,845 (100.0%) | $82,114 |
Poverty in Lake Worth
Income Below Poverty by Sex and Age in Lake Worth
With 11.4% poverty level for males and 14.3% for females among the residents of Lake Worth, 6 to 11 year old males and 18 to 24 year old females are the most vulnerable to poverty, with 70 males (68.0%) and 103 females (62.4%) in their respective age groups living below the poverty level.
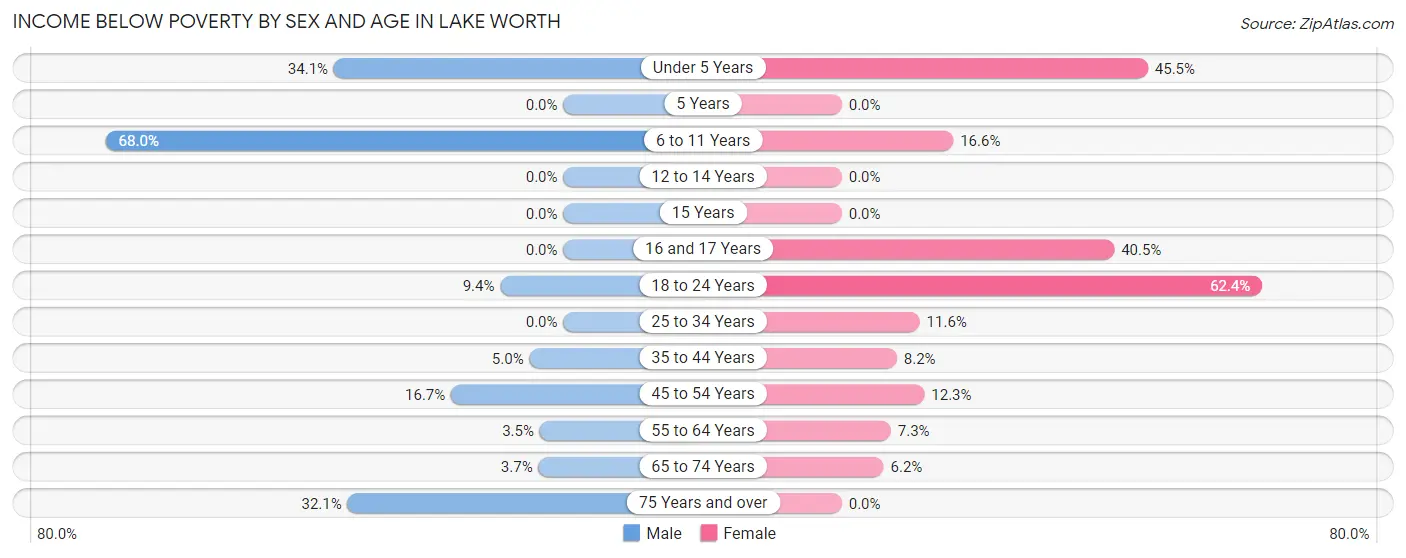
| Age Bracket | Male | Female |
| Under 5 Years | 31 (34.1%) | 30 (45.5%) |
| 5 Years | 0 (0.0%) | 0 (0.0%) |
| 6 to 11 Years | 70 (68.0%) | 23 (16.6%) |
| 12 to 14 Years | 0 (0.0%) | 0 (0.0%) |
| 15 Years | 0 (0.0%) | 0 (0.0%) |
| 16 and 17 Years | 0 (0.0%) | 36 (40.5%) |
| 18 to 24 Years | 19 (9.4%) | 103 (62.4%) |
| 25 to 34 Years | 0 (0.0%) | 37 (11.6%) |
| 35 to 44 Years | 22 (5.0%) | 26 (8.2%) |
| 45 to 54 Years | 47 (16.7%) | 39 (12.3%) |
| 55 to 64 Years | 10 (3.5%) | 34 (7.3%) |
| 65 to 74 Years | 8 (3.7%) | 26 (6.2%) |
| 75 Years and over | 25 (32.1%) | 0 (0.0%) |
| Total | 232 (11.4%) | 354 (14.3%) |
Income Above Poverty by Sex and Age in Lake Worth
According to the poverty statistics in Lake Worth, males aged 12 to 14 years and females aged 12 to 14 years are the age groups that are most secure financially, with 100.0% of males and 100.0% of females in these age groups living above the poverty line.
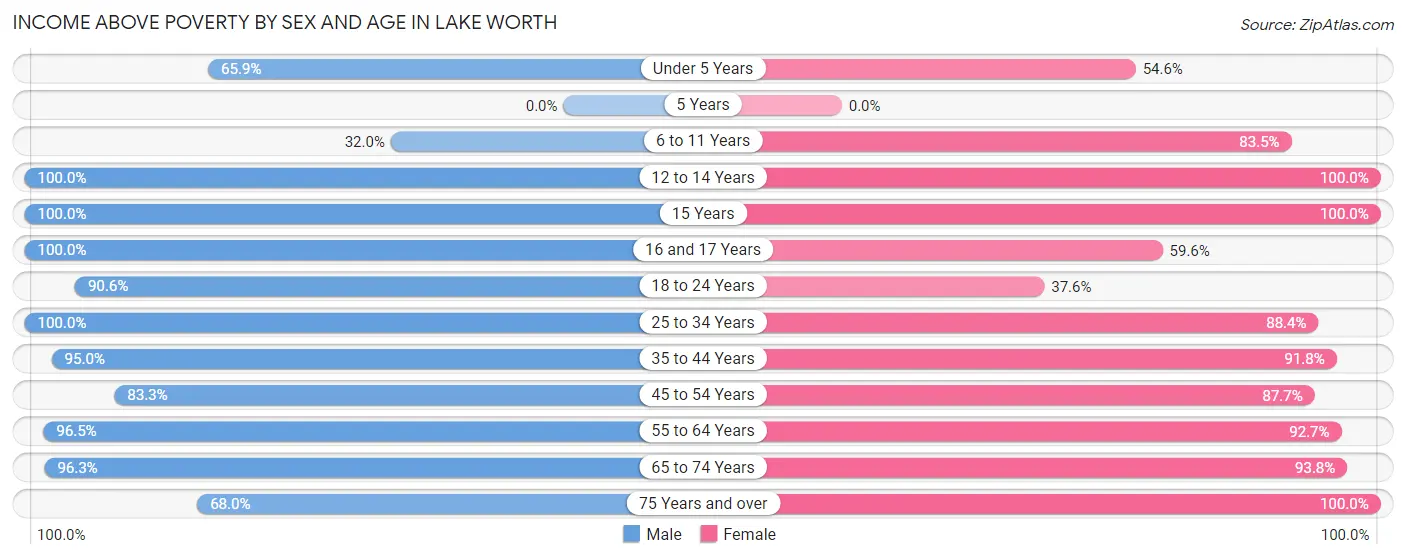
| Age Bracket | Male | Female |
| Under 5 Years | 60 (65.9%) | 36 (54.5%) |
| 5 Years | 0 (0.0%) | 0 (0.0%) |
| 6 to 11 Years | 33 (32.0%) | 116 (83.5%) |
| 12 to 14 Years | 39 (100.0%) | 33 (100.0%) |
| 15 Years | 14 (100.0%) | 43 (100.0%) |
| 16 and 17 Years | 5 (100.0%) | 53 (59.6%) |
| 18 to 24 Years | 184 (90.6%) | 62 (37.6%) |
| 25 to 34 Years | 288 (100.0%) | 283 (88.4%) |
| 35 to 44 Years | 415 (95.0%) | 292 (91.8%) |
| 45 to 54 Years | 235 (83.3%) | 279 (87.7%) |
| 55 to 64 Years | 276 (96.5%) | 433 (92.7%) |
| 65 to 74 Years | 209 (96.3%) | 393 (93.8%) |
| 75 Years and over | 53 (67.9%) | 101 (100.0%) |
| Total | 1,811 (88.6%) | 2,124 (85.7%) |
Income Below Poverty Among Married-Couple Families in Lake Worth
The poverty statistics for married-couple families in Lake Worth show that 6.0% or 49 of the total 810 families live below the poverty line. Families with 3 or 4 children have the highest poverty rate of 36.7%, comprising of 29 families. On the other hand, families with no children have the lowest poverty rate of 0.0%, which includes 0 families.
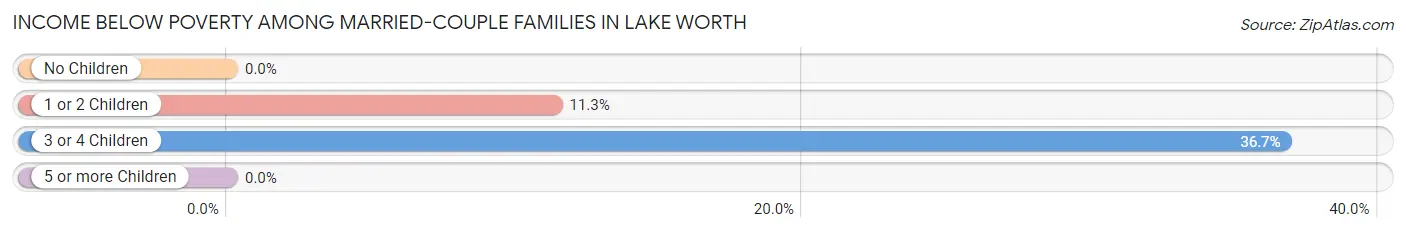
| Children | Above Poverty | Below Poverty |
| No Children | 554 (100.0%) | 0 (0.0%) |
| 1 or 2 Children | 157 (88.7%) | 20 (11.3%) |
| 3 or 4 Children | 50 (63.3%) | 29 (36.7%) |
| 5 or more Children | 0 (0.0%) | 0 (0.0%) |
| Total | 761 (94.0%) | 49 (6.0%) |
Income Below Poverty Among Single-Parent Households in Lake Worth
According to the poverty data in Lake Worth, 9.8% or 5 single-father households and 2.7% or 6 single-mother households are living below the poverty line. Among single-father households, those with 1 or 2 children have the highest poverty rate, with 5 households (100.0%) experiencing poverty. Likewise, among single-mother households, those with 1 or 2 children have the highest poverty rate, with 6 households (9.4%) falling below the poverty line.
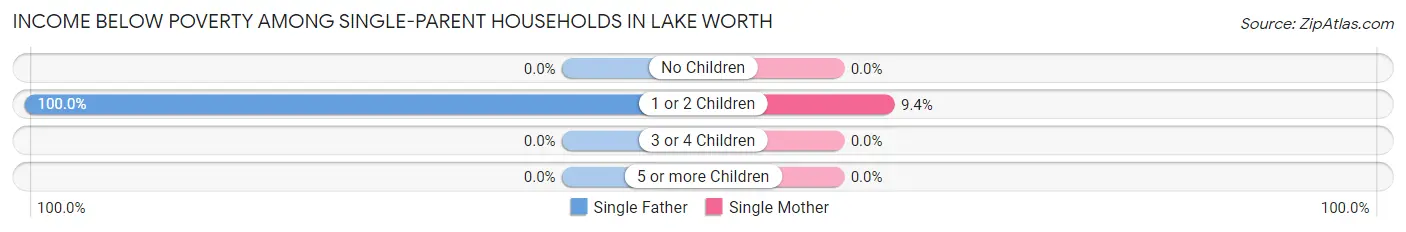
| Children | Single Father | Single Mother |
| No Children | 0 (0.0%) | 0 (0.0%) |
| 1 or 2 Children | 5 (100.0%) | 6 (9.4%) |
| 3 or 4 Children | 0 (0.0%) | 0 (0.0%) |
| 5 or more Children | 0 (0.0%) | 0 (0.0%) |
| Total | 5 (9.8%) | 6 (2.7%) |
Income Below Poverty Among Married-Couple vs Single-Parent Households in Lake Worth
The poverty data for Lake Worth shows that 49 of the married-couple family households (6.0%) and 11 of the single-parent households (4.1%) are living below the poverty level. Within the married-couple family households, those with 3 or 4 children have the highest poverty rate, with 29 households (36.7%) falling below the poverty line. Among the single-parent households, those with 1 or 2 children have the highest poverty rate, with 11 household (15.9%) living below poverty.
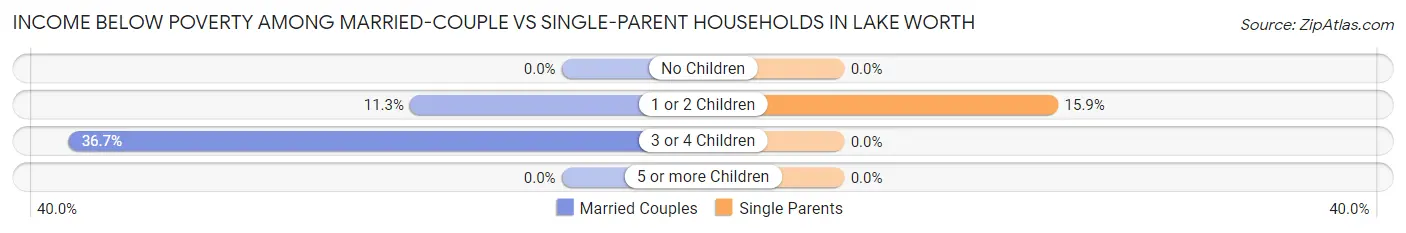
| Children | Married-Couple Families | Single-Parent Households |
| No Children | 0 (0.0%) | 0 (0.0%) |
| 1 or 2 Children | 20 (11.3%) | 11 (15.9%) |
| 3 or 4 Children | 29 (36.7%) | 0 (0.0%) |
| 5 or more Children | 0 (0.0%) | 0 (0.0%) |
| Total | 49 (6.0%) | 11 (4.1%) |
Race in Lake Worth
The most populous races in Lake Worth are White / Caucasian (3,648 | 77.6%), Hispanic or Latino (1,481 | 31.5%), and Two or more Races (752 | 16.0%).
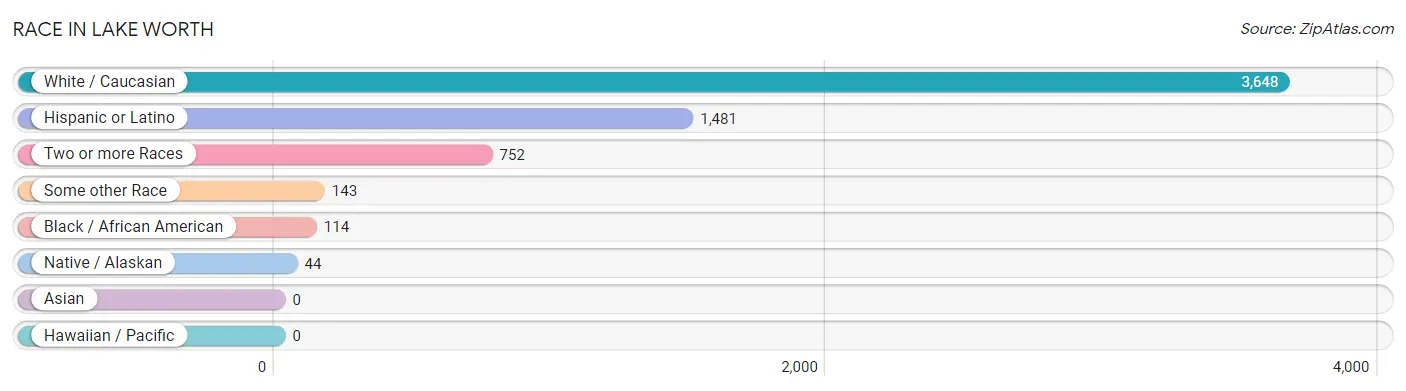
| Race | # Population | % Population |
| Asian | 0 | 0.0% |
| Black / African American | 114 | 2.4% |
| Hawaiian / Pacific | 0 | 0.0% |
| Hispanic or Latino | 1,481 | 31.5% |
| Native / Alaskan | 44 | 0.9% |
| White / Caucasian | 3,648 | 77.6% |
| Two or more Races | 752 | 16.0% |
| Some other Race | 143 | 3.0% |
| Total | 4,701 | 100.0% |
Ancestry in Lake Worth
The most populous ancestries reported in Lake Worth are Mexican (1,301 | 27.7%), English (598 | 12.7%), Irish (347 | 7.4%), German (290 | 6.2%), and American (235 | 5.0%), together accounting for 58.9% of all Lake Worth residents.
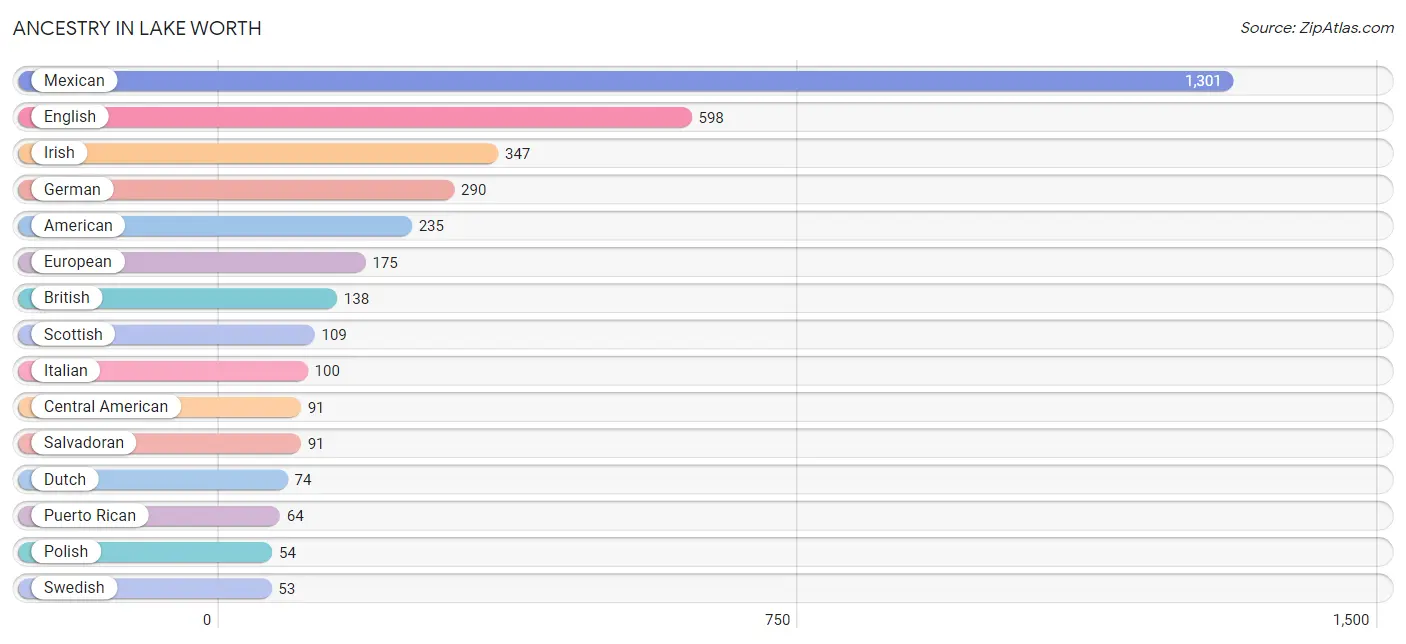
| Ancestry | # Population | % Population |
| African | 11 | 0.2% |
| American | 235 | 5.0% |
| Bhutanese | 31 | 0.7% |
| British | 138 | 2.9% |
| Central American | 91 | 1.9% |
| Cherokee | 5 | 0.1% |
| Chickasaw | 7 | 0.2% |
| Comanche | 6 | 0.1% |
| Czech | 42 | 0.9% |
| Danish | 5 | 0.1% |
| Dutch | 74 | 1.6% |
| English | 598 | 12.7% |
| European | 175 | 3.7% |
| French | 15 | 0.3% |
| German | 290 | 6.2% |
| Irish | 347 | 7.4% |
| Italian | 100 | 2.1% |
| Mexican | 1,301 | 27.7% |
| Mexican American Indian | 31 | 0.7% |
| Norwegian | 19 | 0.4% |
| Polish | 54 | 1.1% |
| Portuguese | 11 | 0.2% |
| Puerto Rican | 64 | 1.4% |
| Salvadoran | 91 | 1.9% |
| Scandinavian | 7 | 0.2% |
| Scotch-Irish | 10 | 0.2% |
| Scottish | 109 | 2.3% |
| Spaniard | 12 | 0.3% |
| Subsaharan African | 11 | 0.2% |
| Swedish | 53 | 1.1% |
| Swiss | 10 | 0.2% |
| Welsh | 29 | 0.6% | View All 32 Rows |
Immigrants in Lake Worth
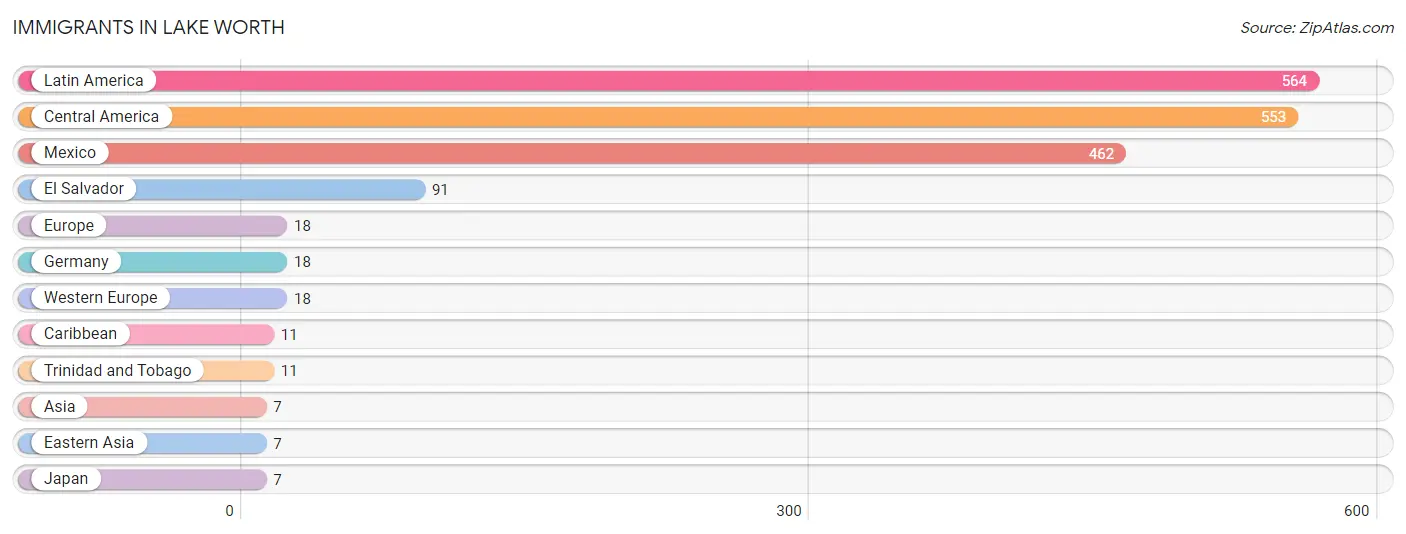
The most numerous immigrant groups reported in Lake Worth came from Latin America (564 | 12.0%), Central America (553 | 11.8%), Mexico (462 | 9.8%), El Salvador (91 | 1.9%), and Europe (18 | 0.4%), together accounting for 35.9% of all Lake Worth residents.
| Immigration Origin | # Population | % Population |
| Asia | 7 | 0.2% |
| Caribbean | 11 | 0.2% |
| Central America | 553 | 11.8% |
| Eastern Asia | 7 | 0.2% |
| El Salvador | 91 | 1.9% |
| Europe | 18 | 0.4% |
| Germany | 18 | 0.4% |
| Japan | 7 | 0.2% |
| Latin America | 564 | 12.0% |
| Mexico | 462 | 9.8% |
| Trinidad and Tobago | 11 | 0.2% |
| Western Europe | 18 | 0.4% | View All 12 Rows |
Sex and Age in Lake Worth
Sex and Age in Lake Worth
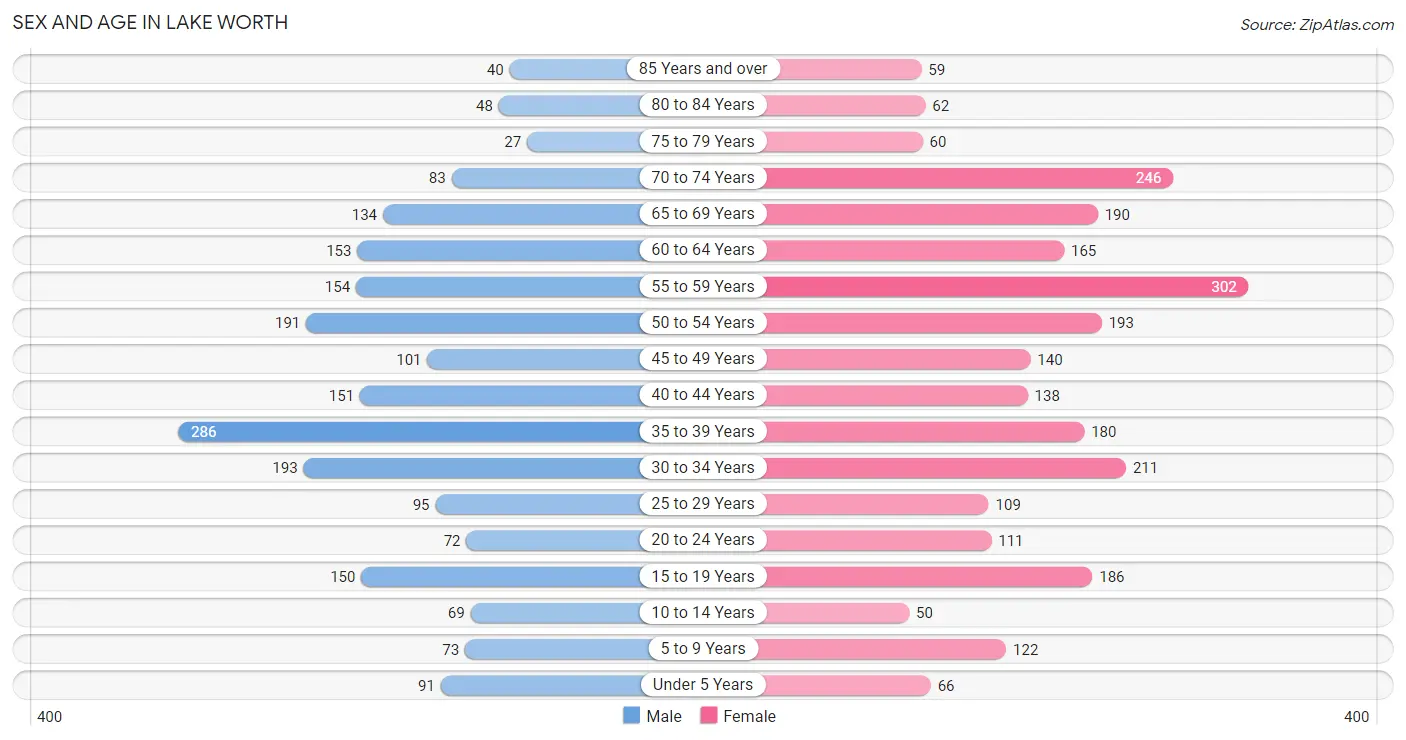
The most populous age groups in Lake Worth are 35 to 39 Years (286 | 13.6%) for men and 55 to 59 Years (302 | 11.7%) for women.
| Age Bracket | Male | Female |
| Under 5 Years | 91 (4.3%) | 66 (2.5%) |
| 5 to 9 Years | 73 (3.5%) | 122 (4.7%) |
| 10 to 14 Years | 69 (3.3%) | 50 (1.9%) |
| 15 to 19 Years | 150 (7.1%) | 186 (7.2%) |
| 20 to 24 Years | 72 (3.4%) | 111 (4.3%) |
| 25 to 29 Years | 95 (4.5%) | 109 (4.2%) |
| 30 to 34 Years | 193 (9.1%) | 211 (8.2%) |
| 35 to 39 Years | 286 (13.6%) | 180 (7.0%) |
| 40 to 44 Years | 151 (7.1%) | 138 (5.3%) |
| 45 to 49 Years | 101 (4.8%) | 140 (5.4%) |
| 50 to 54 Years | 191 (9.0%) | 193 (7.4%) |
| 55 to 59 Years | 154 (7.3%) | 302 (11.7%) |
| 60 to 64 Years | 153 (7.2%) | 165 (6.4%) |
| 65 to 69 Years | 134 (6.4%) | 190 (7.3%) |
| 70 to 74 Years | 83 (3.9%) | 246 (9.5%) |
| 75 to 79 Years | 27 (1.3%) | 60 (2.3%) |
| 80 to 84 Years | 48 (2.3%) | 62 (2.4%) |
| 85 Years and over | 40 (1.9%) | 59 (2.3%) |
| Total | 2,111 (100.0%) | 2,590 (100.0%) |
Families and Households in Lake Worth
Median Family Size in Lake Worth
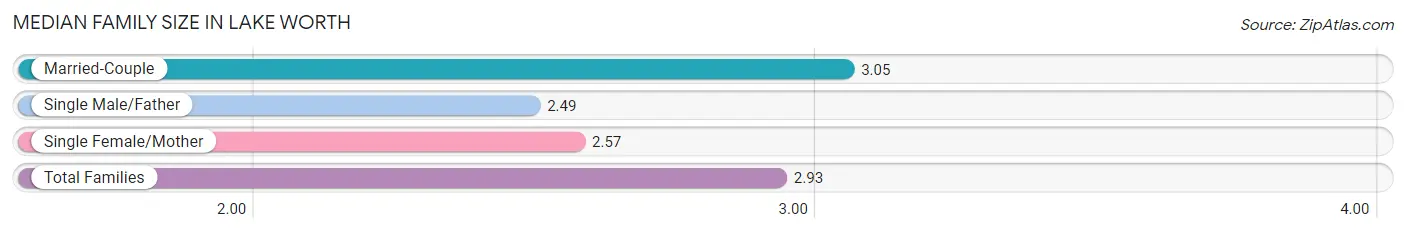
The median family size in Lake Worth is 2.93 persons per family, with married-couple families (810 | 74.9%) accounting for the largest median family size of 3.05 persons per family. On the other hand, single male/father families (51 | 4.7%) represent the smallest median family size with 2.49 persons per family.
| Family Type | # Families | Family Size |
| Married-Couple | 810 (74.9%) | 3.05 |
| Single Male/Father | 51 (4.7%) | 2.49 |
| Single Female/Mother | 220 (20.3%) | 2.57 |
| Total Families | 1,081 (100.0%) | 2.93 |
Median Household Size in Lake Worth
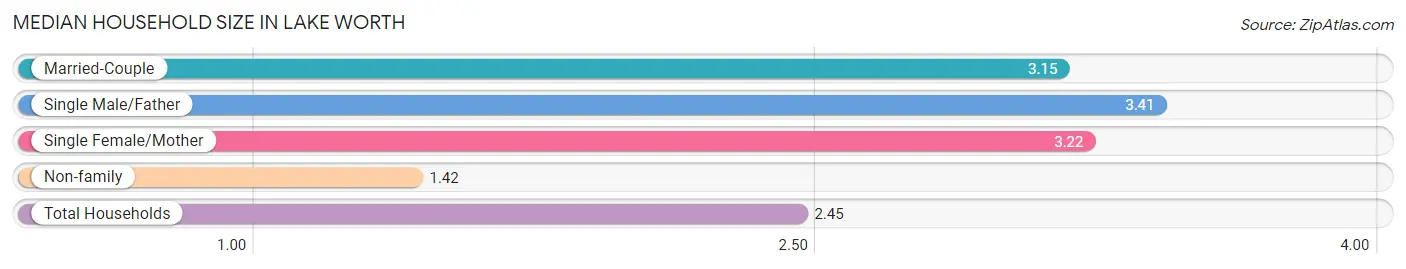
The median household size in Lake Worth is 2.45 persons per household, with single male/father households (51 | 2.8%) accounting for the largest median household size of 3.41 persons per household. non-family households (764 | 41.4%) represent the smallest median household size with 1.42 persons per household.
| Household Type | # Households | Household Size |
| Married-Couple | 810 (43.9%) | 3.15 |
| Single Male/Father | 51 (2.8%) | 3.41 |
| Single Female/Mother | 220 (11.9%) | 3.22 |
| Non-family | 764 (41.4%) | 1.42 |
| Total Households | 1,845 (100.0%) | 2.45 |
Household Size by Marriage Status in Lake Worth
Out of a total of 1,845 households in Lake Worth, 1,081 (58.6%) are family households, while 764 (41.4%) are nonfamily households. The most numerous type of family households are 2-person households, comprising 627, and the most common type of nonfamily households are 1-person households, comprising 443.
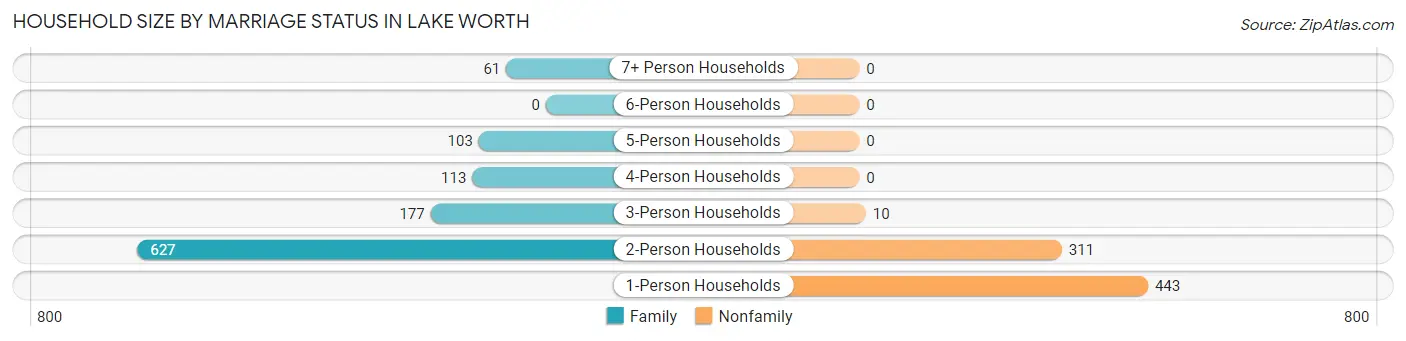
| Household Size | Family Households | Nonfamily Households |
| 1-Person Households | - | 443 (24.0%) |
| 2-Person Households | 627 (34.0%) | 311 (16.9%) |
| 3-Person Households | 177 (9.6%) | 10 (0.5%) |
| 4-Person Households | 113 (6.1%) | 0 (0.0%) |
| 5-Person Households | 103 (5.6%) | 0 (0.0%) |
| 6-Person Households | 0 (0.0%) | 0 (0.0%) |
| 7+ Person Households | 61 (3.3%) | 0 (0.0%) |
| Total | 1,081 (58.6%) | 764 (41.4%) |
Female Fertility in Lake Worth
Fertility by Age in Lake Worth
Average fertility rate in Lake Worth is 74.0 births per 1,000 women. Women in the age bracket of 15 to 19 years have the highest fertility rate with 199.0 births per 1,000 women. Women in the age bracket of 20 to 34 years acount for 55.4% of all women with births.
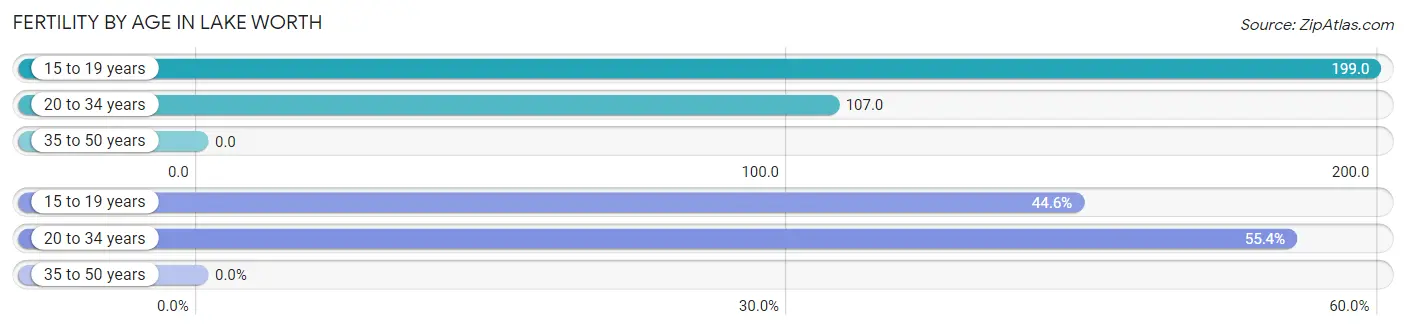
| Age Bracket | Women with Births | Births / 1,000 Women |
| 15 to 19 years | 37 (44.6%) | 199.0 |
| 20 to 34 years | 46 (55.4%) | 107.0 |
| 35 to 50 years | 0 (0.0%) | 0.0 |
| Total | 83 (100.0%) | 74.0 |
Fertility by Age by Marriage Status in Lake Worth
10.8% of women with births (83) in Lake Worth are married. The highest percentage of unmarried women with births falls into 15 to 19 years age bracket with 100.0% of them unmarried at the time of birth, while the lowest percentage of unmarried women with births belong to 20 to 34 years age bracket with 80.4% of them unmarried.
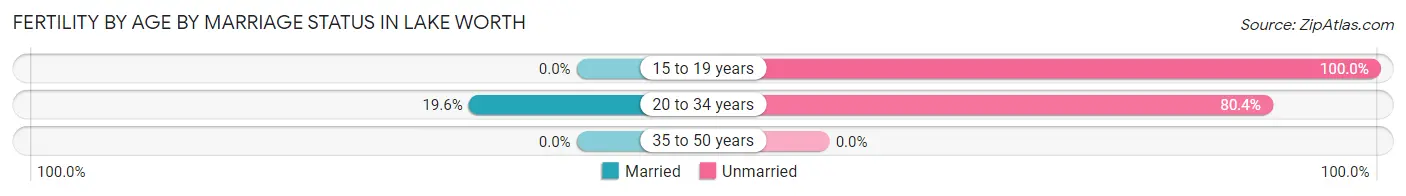
| Age Bracket | Married | Unmarried |
| 15 to 19 years | 0 (0.0%) | 37 (100.0%) |
| 20 to 34 years | 9 (19.6%) | 37 (80.4%) |
| 35 to 50 years | 0 (0.0%) | 0 (0.0%) |
| Total | 9 (10.8%) | 74 (89.2%) |
Fertility by Education in Lake Worth
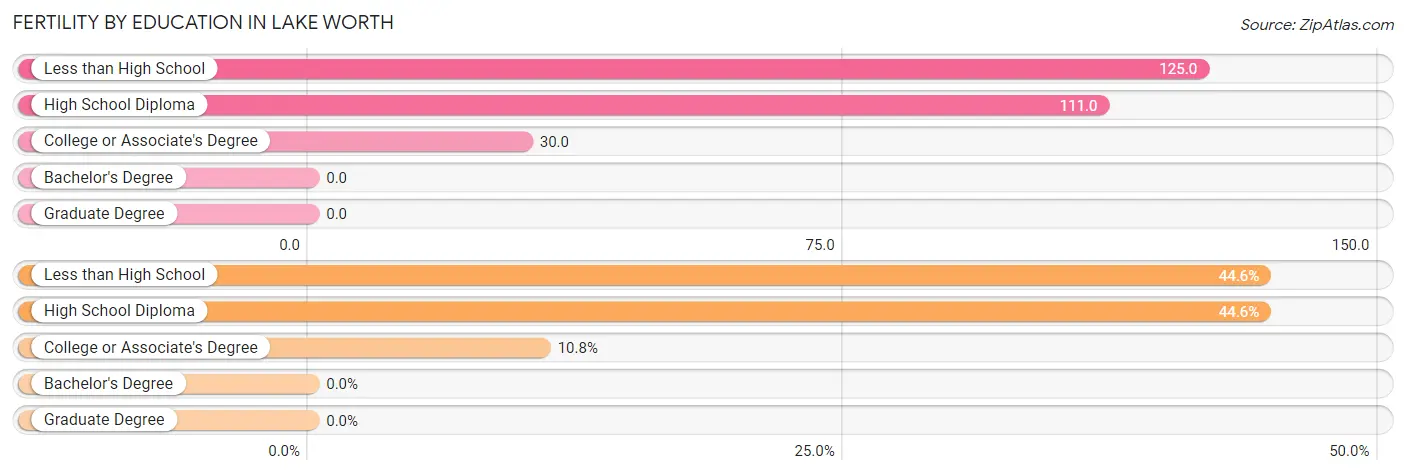
| Educational Attainment | Women with Births | Births / 1,000 Women |
| Less than High School | 37 (44.6%) | 125.0 |
| High School Diploma | 37 (44.6%) | 111.0 |
| College or Associate's Degree | 9 (10.8%) | 30.0 |
| Bachelor's Degree | 0 (0.0%) | 0.0 |
| Graduate Degree | 0 (0.0%) | 0.0 |
| Total | 83 (100.0%) | 74.0 |
Fertility by Education by Marriage Status in Lake Worth
89.2% of women with births in Lake Worth are unmarried. Women with the educational attainment of college or associate's degree are most likely to be married with 100.0% of them married at childbirth, while women with the educational attainment of less than high school are least likely to be married with 100.0% of them unmarried at childbirth.
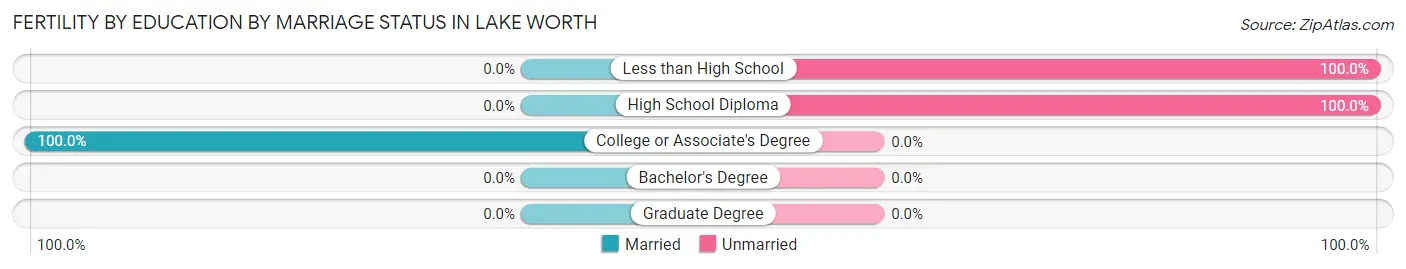
| Educational Attainment | Married | Unmarried |
| Less than High School | 0 (0.0%) | 37 (100.0%) |
| High School Diploma | 0 (0.0%) | 37 (100.0%) |
| College or Associate's Degree | 9 (100.0%) | 0 (0.0%) |
| Bachelor's Degree | 0 (0.0%) | 0 (0.0%) |
| Graduate Degree | 0 (0.0%) | 0 (0.0%) |
| Total | 9 (10.8%) | 74 (89.2%) |
Employment Characteristics in Lake Worth
Employment by Class of Employer in Lake Worth
Among the 2,427 employed individuals in Lake Worth, private company employees (1,805 | 74.4%), self-employed (not incorporated) (344 | 14.2%), and local government employees (144 | 5.9%) make up the most common classes of employment.
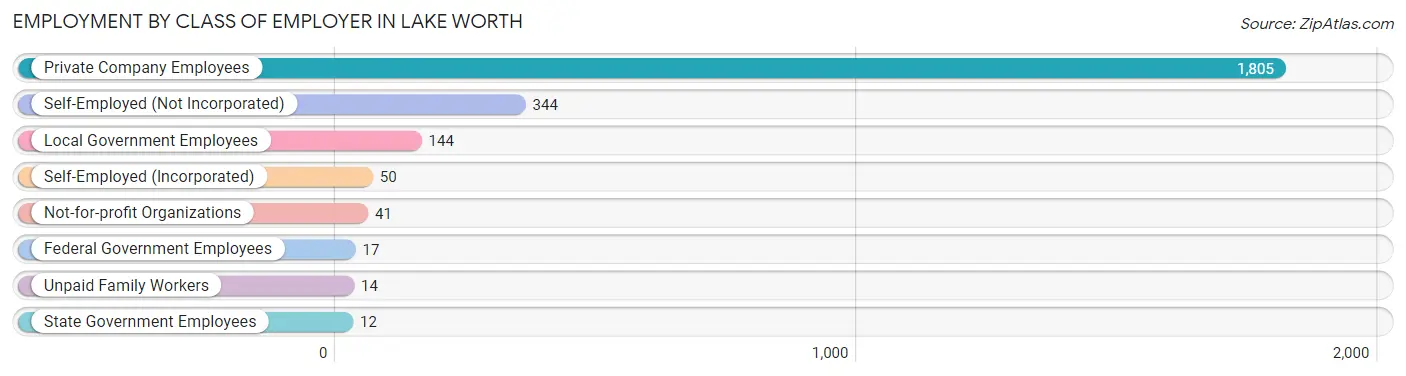
| Employer Class | # Employees | % Employees |
| Private Company Employees | 1,805 | 74.4% |
| Self-Employed (Incorporated) | 50 | 2.1% |
| Self-Employed (Not Incorporated) | 344 | 14.2% |
| Not-for-profit Organizations | 41 | 1.7% |
| Local Government Employees | 144 | 5.9% |
| State Government Employees | 12 | 0.5% |
| Federal Government Employees | 17 | 0.7% |
| Unpaid Family Workers | 14 | 0.6% |
| Total | 2,427 | 100.0% |
Employment Status by Age in Lake Worth
According to the labor force statistics for Lake Worth, out of the total population over 16 years of age (4,173), 64.4% or 2,687 individuals are in the labor force, with 8.0% or 215 of them unemployed. The age group with the highest labor force participation rate is 55 to 59 years, with 96.9% or 442 individuals in the labor force. Within the labor force, the 20 to 24 years age range has the highest percentage of unemployed individuals, with 36.8% or 56 of them being unemployed.
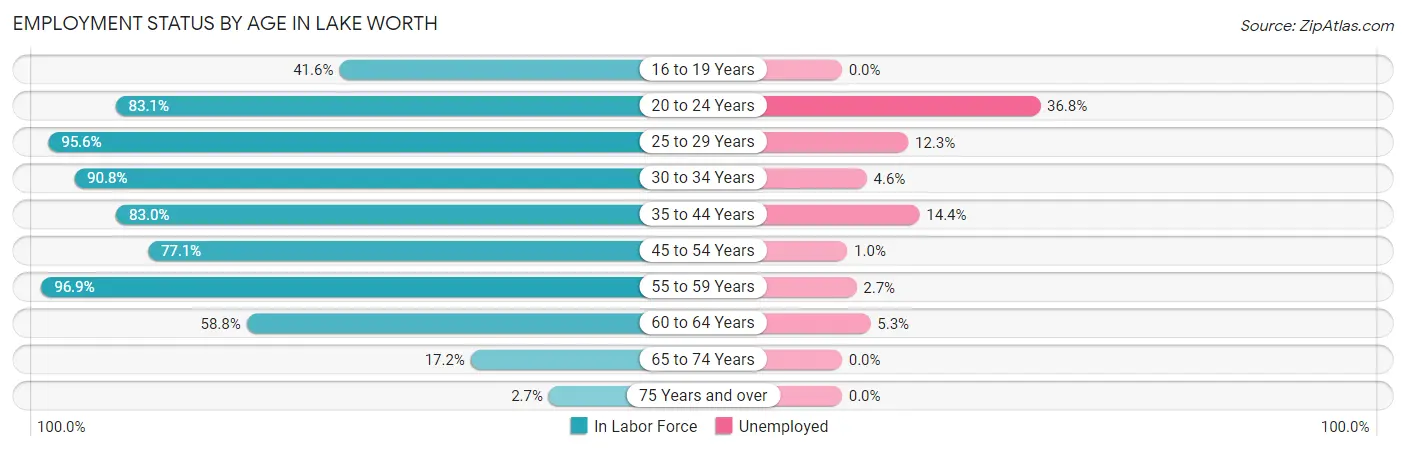
| Age Bracket | In Labor Force | Unemployed |
| 16 to 19 Years | 116 (41.6%) | 0 (0.0%) |
| 20 to 24 Years | 152 (83.1%) | 56 (36.8%) |
| 25 to 29 Years | 195 (95.6%) | 24 (12.3%) |
| 30 to 34 Years | 367 (90.8%) | 17 (4.6%) |
| 35 to 44 Years | 627 (83.0%) | 90 (14.4%) |
| 45 to 54 Years | 482 (77.1%) | 5 (1.0%) |
| 55 to 59 Years | 442 (96.9%) | 12 (2.7%) |
| 60 to 64 Years | 187 (58.8%) | 10 (5.3%) |
| 65 to 74 Years | 112 (17.2%) | 0 (0.0%) |
| 75 Years and over | 8 (2.7%) | 0 (0.0%) |
| Total | 2,687 (64.4%) | 215 (8.0%) |
Employment Status by Educational Attainment in Lake Worth
According to labor force statistics for Lake Worth, 83.3% of individuals (2,301) out of the total population between 25 and 64 years of age (2,762) are in the labor force, with 6.9% or 159 of them being unemployed. The group with the highest labor force participation rate are those with the educational attainment of college / associate degree, with 92.9% or 689 individuals in the labor force. Within the labor force, individuals with high school diploma education have the highest percentage of unemployment, with 10.8% or 95 of them being unemployed.
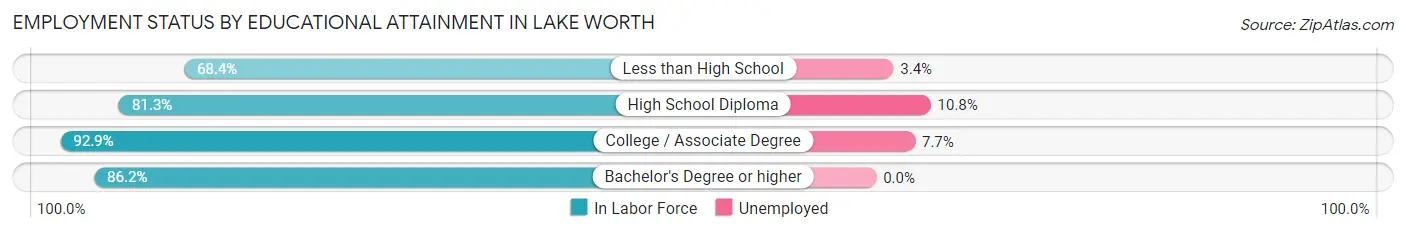
| Educational Attainment | In Labor Force | Unemployed |
| Less than High School | 297 (68.4%) | 15 (3.4%) |
| High School Diploma | 877 (81.3%) | 117 (10.8%) |
| College / Associate Degree | 689 (92.9%) | 57 (7.7%) |
| Bachelor's Degree or higher | 437 (86.2%) | 0 (0.0%) |
| Total | 2,301 (83.3%) | 191 (6.9%) |
Employment Occupations by Sex in Lake Worth
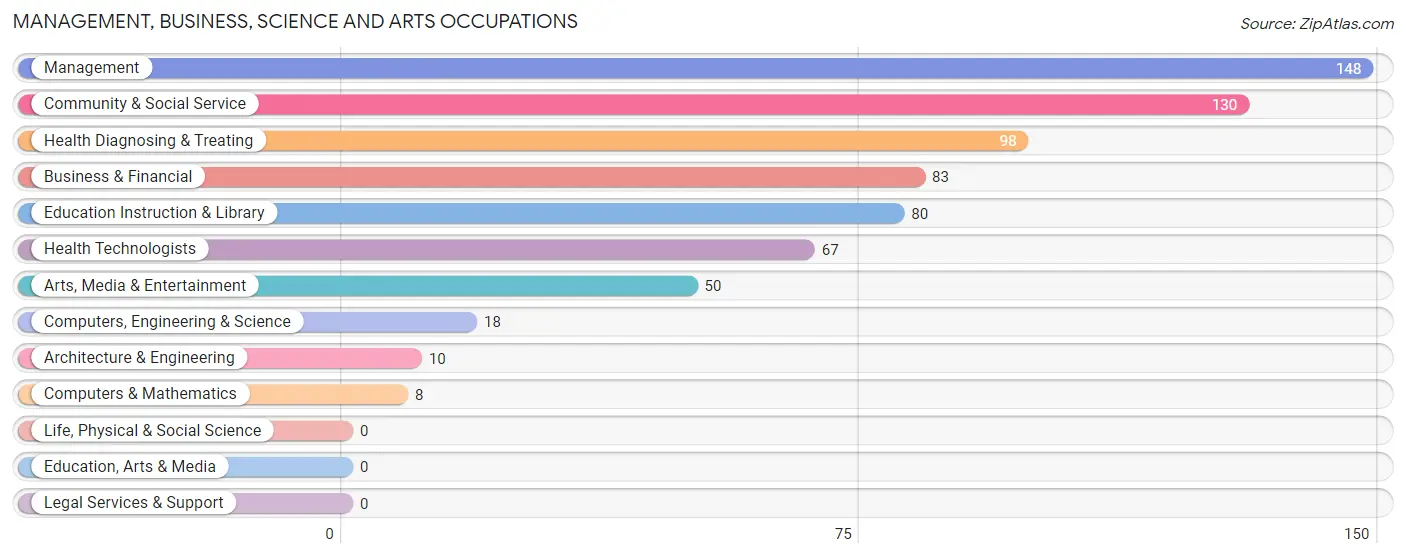
Management, Business, Science and Arts Occupations
The most common Management, Business, Science and Arts occupations in Lake Worth are Management (148 | 6.0%), Community & Social Service (130 | 5.2%), Health Diagnosing & Treating (98 | 4.0%), Business & Financial (83 | 3.4%), and Education Instruction & Library (80 | 3.2%).
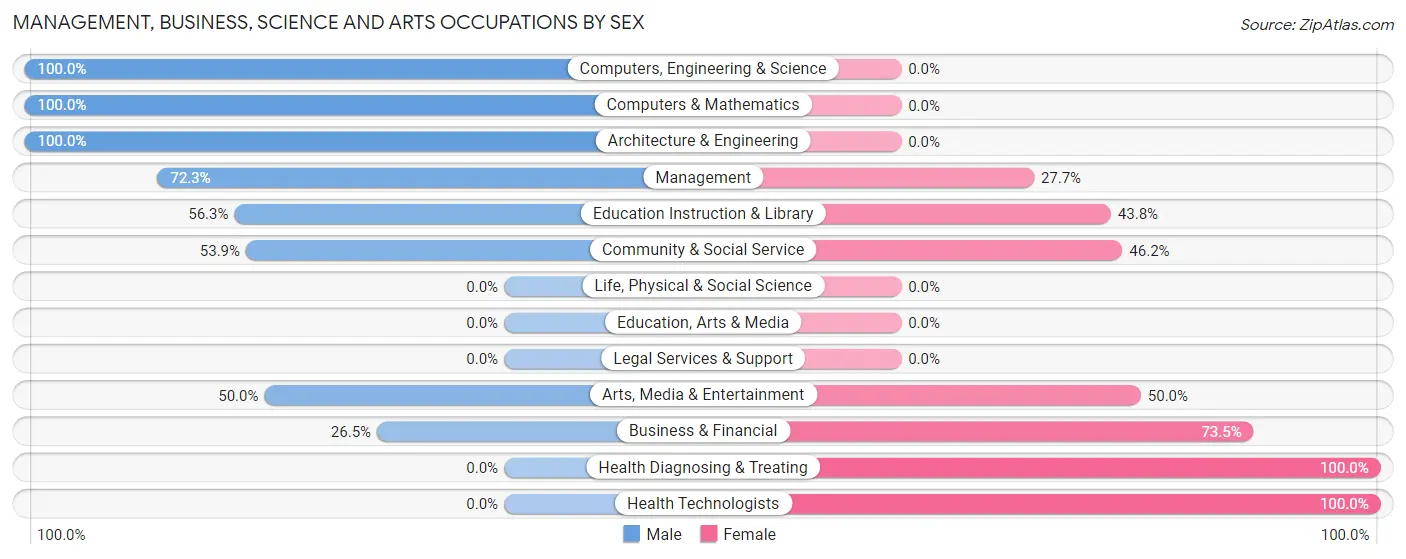
Management, Business, Science and Arts Occupations by Sex
Within the Management, Business, Science and Arts occupations in Lake Worth, the most male-oriented occupations are Computers, Engineering & Science (100.0%), Computers & Mathematics (100.0%), and Architecture & Engineering (100.0%), while the most female-oriented occupations are Health Diagnosing & Treating (100.0%), Health Technologists (100.0%), and Business & Financial (73.5%).
| Occupation | Male | Female |
| Management | 107 (72.3%) | 41 (27.7%) |
| Business & Financial | 22 (26.5%) | 61 (73.5%) |
| Computers, Engineering & Science | 18 (100.0%) | 0 (0.0%) |
| Computers & Mathematics | 8 (100.0%) | 0 (0.0%) |
| Architecture & Engineering | 10 (100.0%) | 0 (0.0%) |
| Life, Physical & Social Science | 0 (0.0%) | 0 (0.0%) |
| Community & Social Service | 70 (53.8%) | 60 (46.2%) |
| Education, Arts & Media | 0 (0.0%) | 0 (0.0%) |
| Legal Services & Support | 0 (0.0%) | 0 (0.0%) |
| Education Instruction & Library | 45 (56.2%) | 35 (43.8%) |
| Arts, Media & Entertainment | 25 (50.0%) | 25 (50.0%) |
| Health Diagnosing & Treating | 0 (0.0%) | 98 (100.0%) |
| Health Technologists | 0 (0.0%) | 67 (100.0%) |
| Total (Category) | 217 (45.5%) | 260 (54.5%) |
| Total (Overall) | 1,257 (50.8%) | 1,217 (49.2%) |
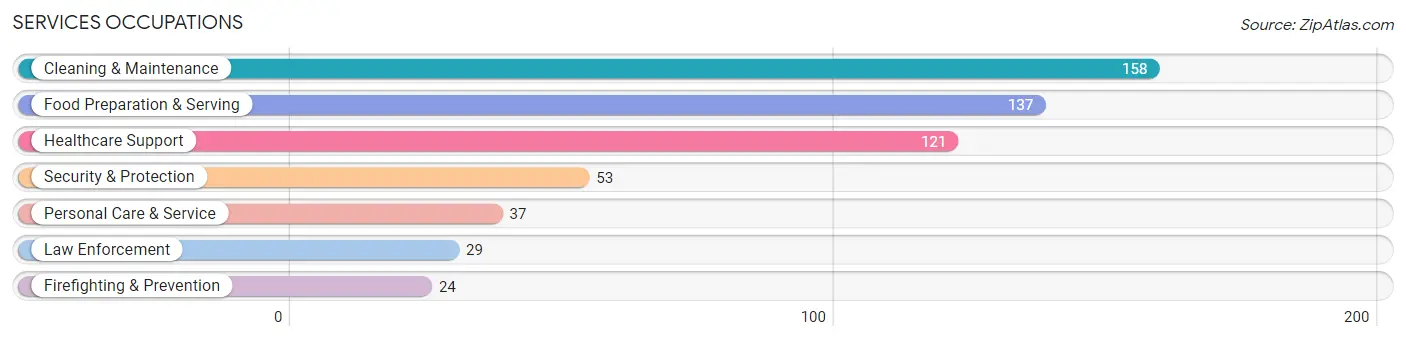
Services Occupations
The most common Services occupations in Lake Worth are Cleaning & Maintenance (158 | 6.4%), Food Preparation & Serving (137 | 5.5%), Healthcare Support (121 | 4.9%), Security & Protection (53 | 2.1%), and Personal Care & Service (37 | 1.5%).
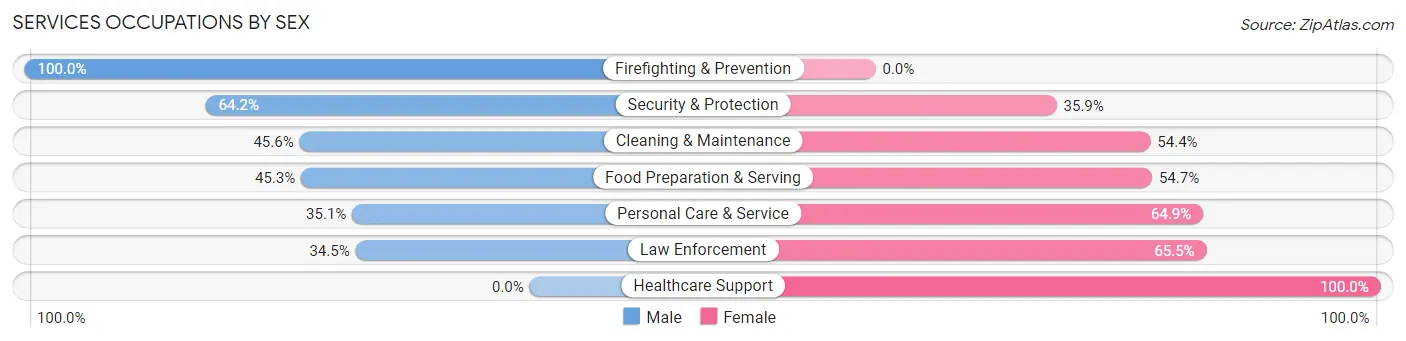
Services Occupations by Sex
Within the Services occupations in Lake Worth, the most male-oriented occupations are Firefighting & Prevention (100.0%), Security & Protection (64.1%), and Cleaning & Maintenance (45.6%), while the most female-oriented occupations are Healthcare Support (100.0%), Law Enforcement (65.5%), and Personal Care & Service (64.9%).
| Occupation | Male | Female |
| Healthcare Support | 0 (0.0%) | 121 (100.0%) |
| Security & Protection | 34 (64.1%) | 19 (35.8%) |
| Firefighting & Prevention | 24 (100.0%) | 0 (0.0%) |
| Law Enforcement | 10 (34.5%) | 19 (65.5%) |
| Food Preparation & Serving | 62 (45.3%) | 75 (54.7%) |
| Cleaning & Maintenance | 72 (45.6%) | 86 (54.4%) |
| Personal Care & Service | 13 (35.1%) | 24 (64.9%) |
| Total (Category) | 181 (35.8%) | 325 (64.2%) |
| Total (Overall) | 1,257 (50.8%) | 1,217 (49.2%) |
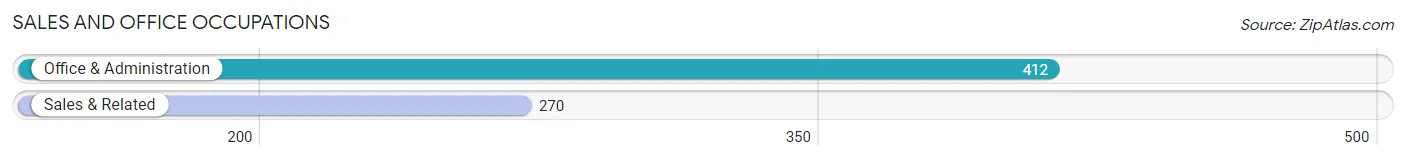
Sales and Office Occupations
The most common Sales and Office occupations in Lake Worth are Office & Administration (412 | 16.7%), and Sales & Related (270 | 10.9%).
Sales and Office Occupations by Sex
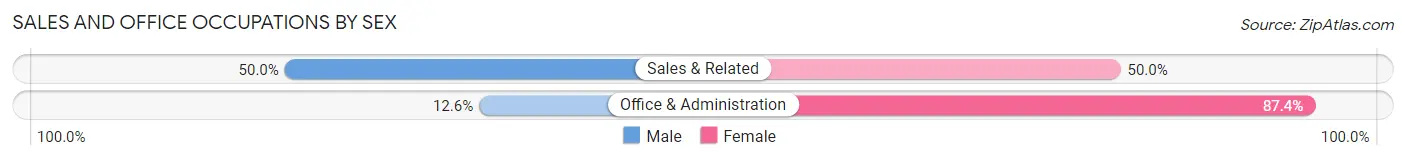
| Occupation | Male | Female |
| Sales & Related | 135 (50.0%) | 135 (50.0%) |
| Office & Administration | 52 (12.6%) | 360 (87.4%) |
| Total (Category) | 187 (27.4%) | 495 (72.6%) |
| Total (Overall) | 1,257 (50.8%) | 1,217 (49.2%) |
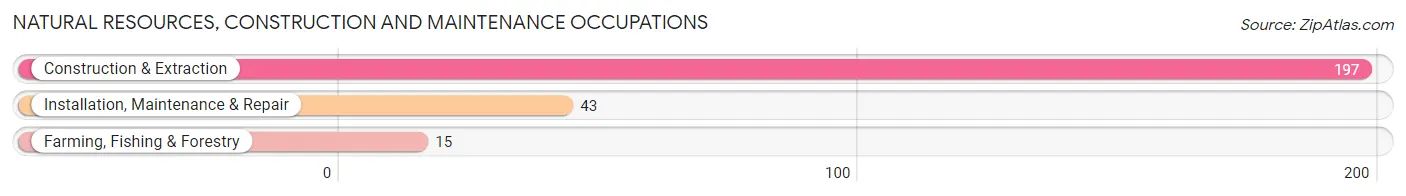
Natural Resources, Construction and Maintenance Occupations
The most common Natural Resources, Construction and Maintenance occupations in Lake Worth are Construction & Extraction (197 | 8.0%), Installation, Maintenance & Repair (43 | 1.7%), and Farming, Fishing & Forestry (15 | 0.6%).
Natural Resources, Construction and Maintenance Occupations by Sex
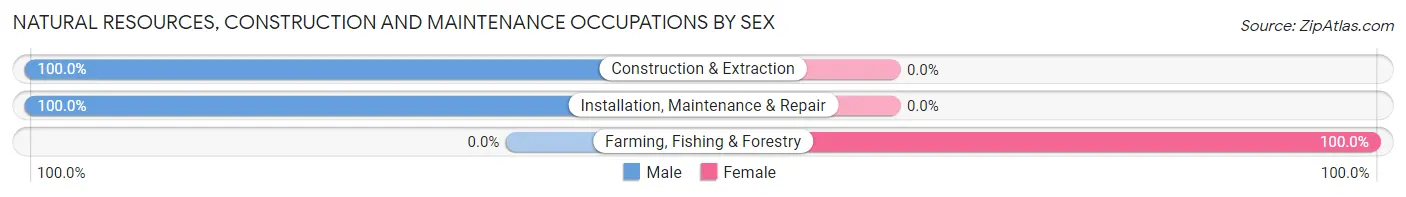
| Occupation | Male | Female |
| Farming, Fishing & Forestry | 0 (0.0%) | 15 (100.0%) |
| Construction & Extraction | 197 (100.0%) | 0 (0.0%) |
| Installation, Maintenance & Repair | 43 (100.0%) | 0 (0.0%) |
| Total (Category) | 240 (94.1%) | 15 (5.9%) |
| Total (Overall) | 1,257 (50.8%) | 1,217 (49.2%) |
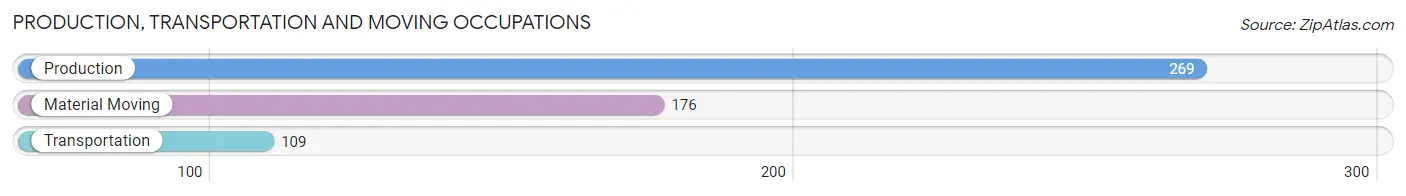
Production, Transportation and Moving Occupations
The most common Production, Transportation and Moving occupations in Lake Worth are Production (269 | 10.9%), Material Moving (176 | 7.1%), and Transportation (109 | 4.4%).
Production, Transportation and Moving Occupations by Sex
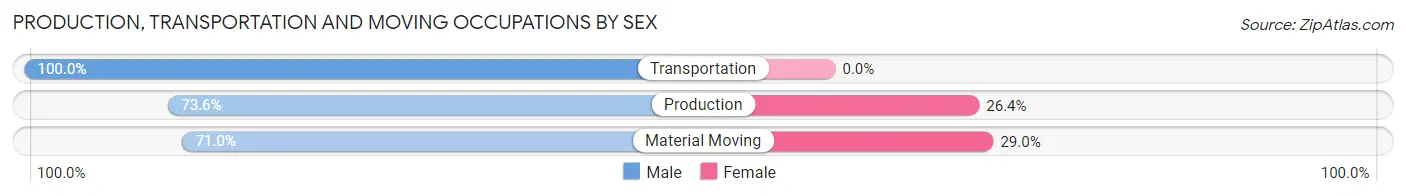
| Occupation | Male | Female |
| Production | 198 (73.6%) | 71 (26.4%) |
| Transportation | 109 (100.0%) | 0 (0.0%) |
| Material Moving | 125 (71.0%) | 51 (29.0%) |
| Total (Category) | 432 (78.0%) | 122 (22.0%) |
| Total (Overall) | 1,257 (50.8%) | 1,217 (49.2%) |
Employment Industries by Sex in Lake Worth
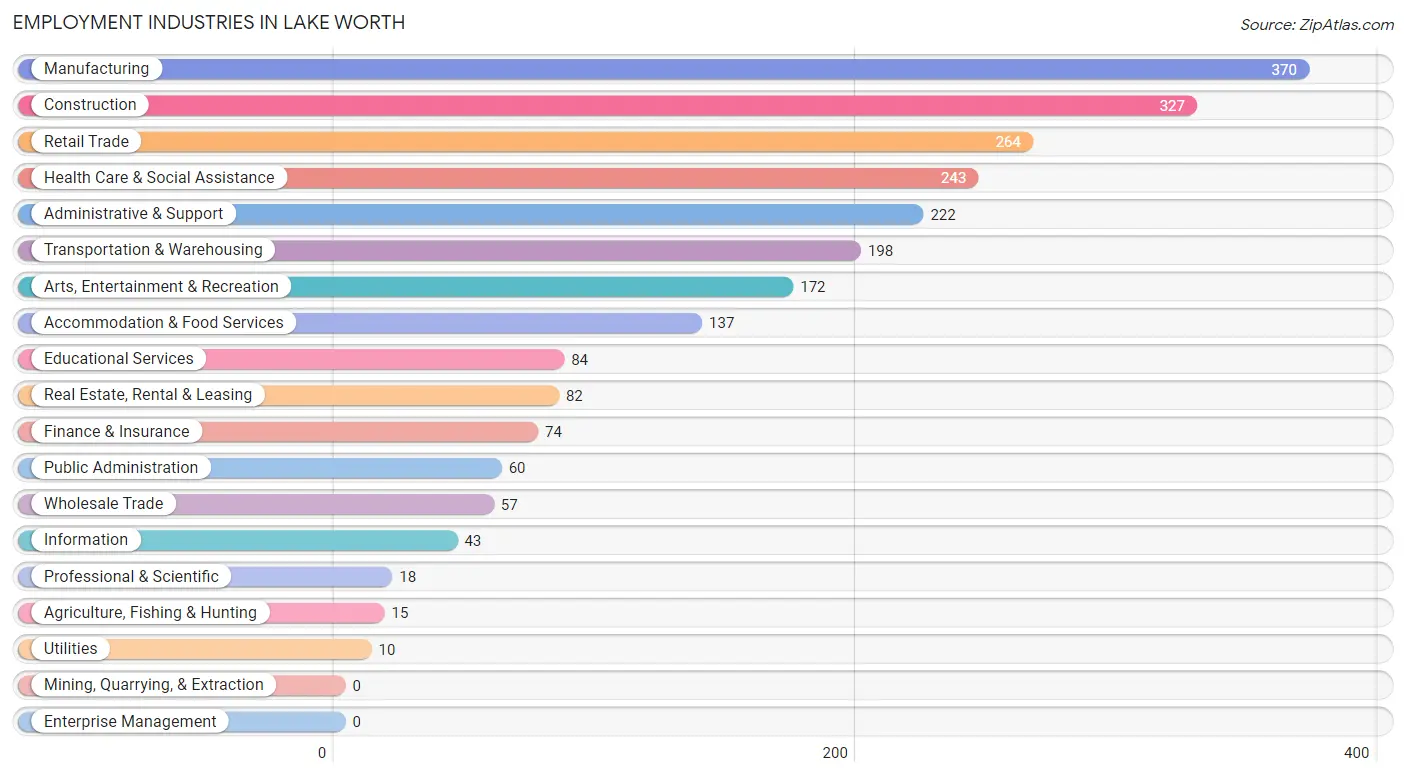
Employment Industries in Lake Worth
The major employment industries in Lake Worth include Manufacturing (370 | 15.0%), Construction (327 | 13.2%), Retail Trade (264 | 10.7%), Health Care & Social Assistance (243 | 9.8%), and Administrative & Support (222 | 9.0%).
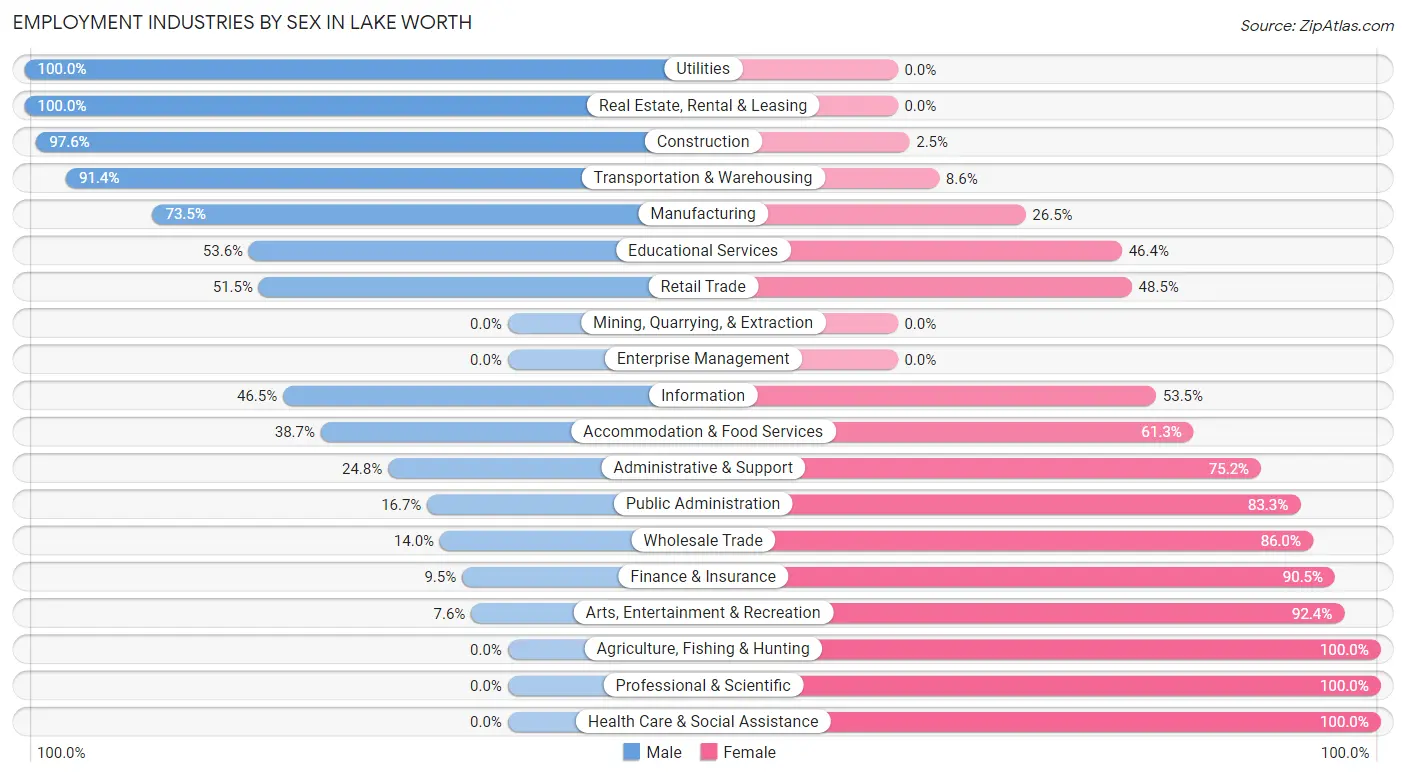
Employment Industries by Sex in Lake Worth
The Lake Worth industries that see more men than women are Utilities (100.0%), Real Estate, Rental & Leasing (100.0%), and Construction (97.6%), whereas the industries that tend to have a higher number of women are Agriculture, Fishing & Hunting (100.0%), Professional & Scientific (100.0%), and Health Care & Social Assistance (100.0%).
| Industry | Male | Female |
| Agriculture, Fishing & Hunting | 0 (0.0%) | 15 (100.0%) |
| Mining, Quarrying, & Extraction | 0 (0.0%) | 0 (0.0%) |
| Construction | 319 (97.6%) | 8 (2.5%) |
| Manufacturing | 272 (73.5%) | 98 (26.5%) |
| Wholesale Trade | 8 (14.0%) | 49 (86.0%) |
| Retail Trade | 136 (51.5%) | 128 (48.5%) |
| Transportation & Warehousing | 181 (91.4%) | 17 (8.6%) |
| Utilities | 10 (100.0%) | 0 (0.0%) |
| Information | 20 (46.5%) | 23 (53.5%) |
| Finance & Insurance | 7 (9.5%) | 67 (90.5%) |
| Real Estate, Rental & Leasing | 82 (100.0%) | 0 (0.0%) |
| Professional & Scientific | 0 (0.0%) | 18 (100.0%) |
| Enterprise Management | 0 (0.0%) | 0 (0.0%) |
| Administrative & Support | 55 (24.8%) | 167 (75.2%) |
| Educational Services | 45 (53.6%) | 39 (46.4%) |
| Health Care & Social Assistance | 0 (0.0%) | 243 (100.0%) |
| Arts, Entertainment & Recreation | 13 (7.6%) | 159 (92.4%) |
| Accommodation & Food Services | 53 (38.7%) | 84 (61.3%) |
| Public Administration | 10 (16.7%) | 50 (83.3%) |
| Total | 1,257 (50.8%) | 1,217 (49.2%) |
Education in Lake Worth
School Enrollment in Lake Worth
The most common levels of schooling among the 496 students in Lake Worth are high school (174 | 35.1%), elementary school (144 | 29.0%), and college / undergraduate (77 | 15.5%).
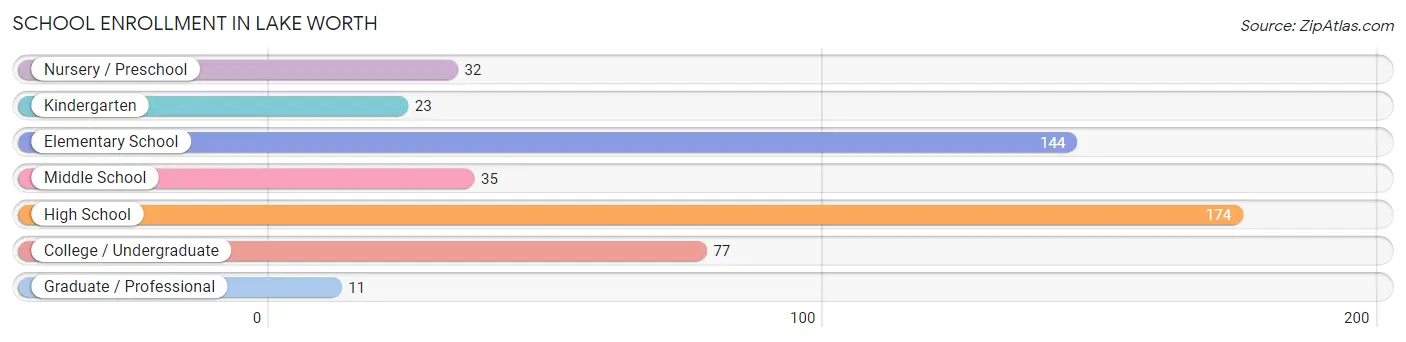
| School Level | # Students | % Students |
| Nursery / Preschool | 32 | 6.5% |
| Kindergarten | 23 | 4.6% |
| Elementary School | 144 | 29.0% |
| Middle School | 35 | 7.1% |
| High School | 174 | 35.1% |
| College / Undergraduate | 77 | 15.5% |
| Graduate / Professional | 11 | 2.2% |
| Total | 496 | 100.0% |
School Enrollment by Age by Funding Source in Lake Worth
Out of a total of 496 students who are enrolled in schools in Lake Worth, 62 (12.5%) attend a private institution, while the remaining 434 (87.5%) are enrolled in public schools. The age group of 18 to 19 year olds has the highest likelihood of being enrolled in private schools, with 15 (100.0% in the age bracket) enrolled. Conversely, the age group of 20 to 24 year olds has the lowest likelihood of being enrolled in a private school, with 19 (100.0% in the age bracket) attending a public institution.
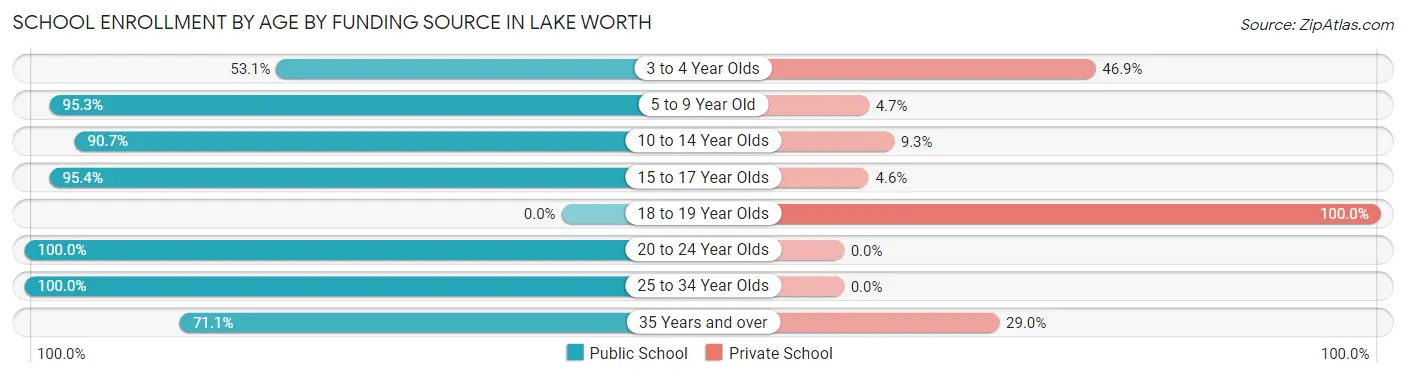
| Age Bracket | Public School | Private School |
| 3 to 4 Year Olds | 17 (53.1%) | 15 (46.9%) |
| 5 to 9 Year Old | 143 (95.3%) | 7 (4.7%) |
| 10 to 14 Year Olds | 68 (90.7%) | 7 (9.3%) |
| 15 to 17 Year Olds | 144 (95.4%) | 7 (4.6%) |
| 18 to 19 Year Olds | 0 (0.0%) | 15 (100.0%) |
| 20 to 24 Year Olds | 19 (100.0%) | 0 (0.0%) |
| 25 to 34 Year Olds | 16 (100.0%) | 0 (0.0%) |
| 35 Years and over | 27 (71.1%) | 11 (28.9%) |
| Total | 434 (87.5%) | 62 (12.5%) |
Educational Attainment by Field of Study in Lake Worth
Education (359 | 46.5%), business (119 | 15.4%), science & technology (48 | 6.2%), visual & performing arts (48 | 6.2%), and bio, nature & agricultural (42 | 5.4%) are the most common fields of study among 772 individuals in Lake Worth who have obtained a bachelor's degree or higher.
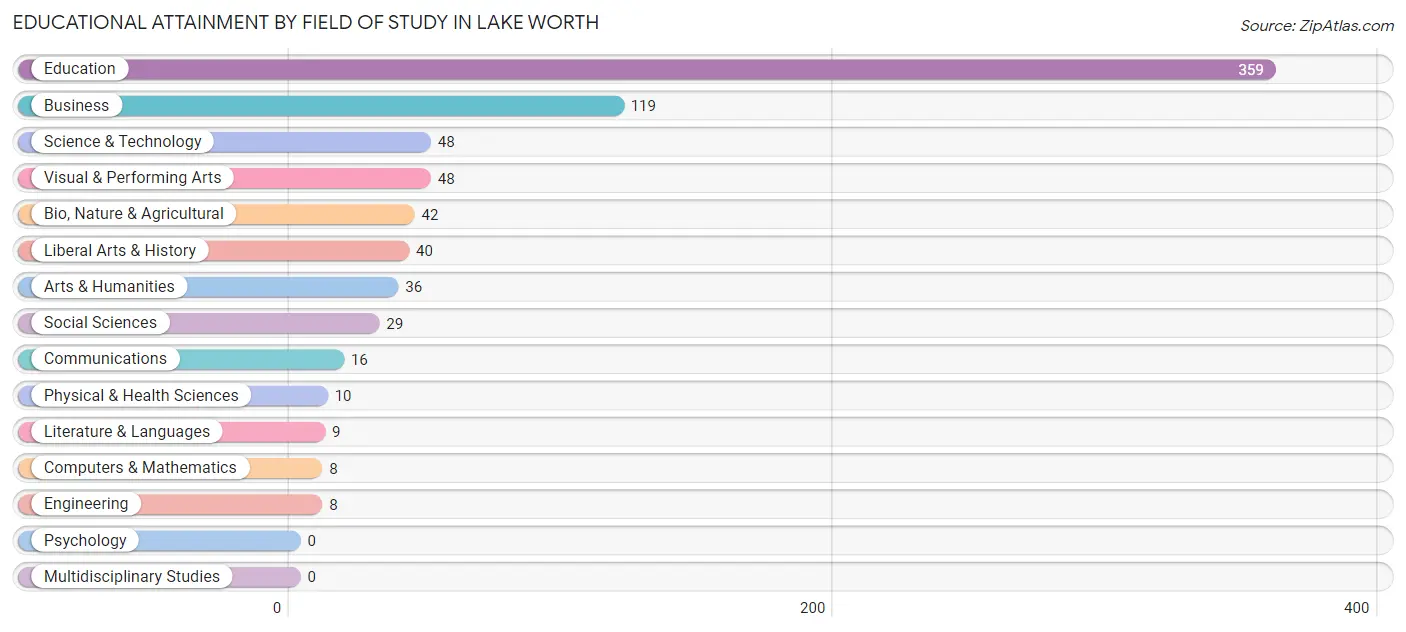
| Field of Study | # Graduates | % Graduates |
| Computers & Mathematics | 8 | 1.0% |
| Bio, Nature & Agricultural | 42 | 5.4% |
| Physical & Health Sciences | 10 | 1.3% |
| Psychology | 0 | 0.0% |
| Social Sciences | 29 | 3.8% |
| Engineering | 8 | 1.0% |
| Multidisciplinary Studies | 0 | 0.0% |
| Science & Technology | 48 | 6.2% |
| Business | 119 | 15.4% |
| Education | 359 | 46.5% |
| Literature & Languages | 9 | 1.2% |
| Liberal Arts & History | 40 | 5.2% |
| Visual & Performing Arts | 48 | 6.2% |
| Communications | 16 | 2.1% |
| Arts & Humanities | 36 | 4.7% |
| Total | 772 | 100.0% |
Transportation & Commute in Lake Worth
Vehicle Availability by Sex in Lake Worth
The most prevalent vehicle ownership categories in Lake Worth are males with 2 vehicles (630, accounting for 50.5%) and females with 2 vehicles (735, making up 53.4%).
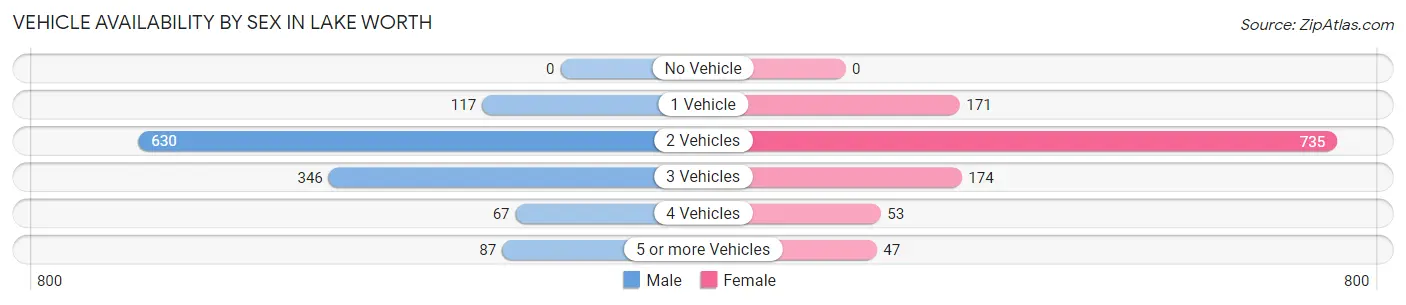
| Vehicles Available | Male | Female |
| No Vehicle | 0 (0.0%) | 0 (0.0%) |
| 1 Vehicle | 117 (9.4%) | 171 (14.5%) |
| 2 Vehicles | 630 (50.5%) | 735 (62.3%) |
| 3 Vehicles | 346 (27.8%) | 174 (14.7%) |
| 4 Vehicles | 67 (5.4%) | 53 (4.5%) |
| 5 or more Vehicles | 87 (7.0%) | 47 (4.0%) |
| Total | 1,247 (100.0%) | 1,180 (100.0%) |
Commute Time in Lake Worth
The most frequently occuring commute durations in Lake Worth are 20 to 24 minutes (435 commuters, 20.5%), 30 to 34 minutes (380 commuters, 17.9%), and 10 to 14 minutes (292 commuters, 13.8%).
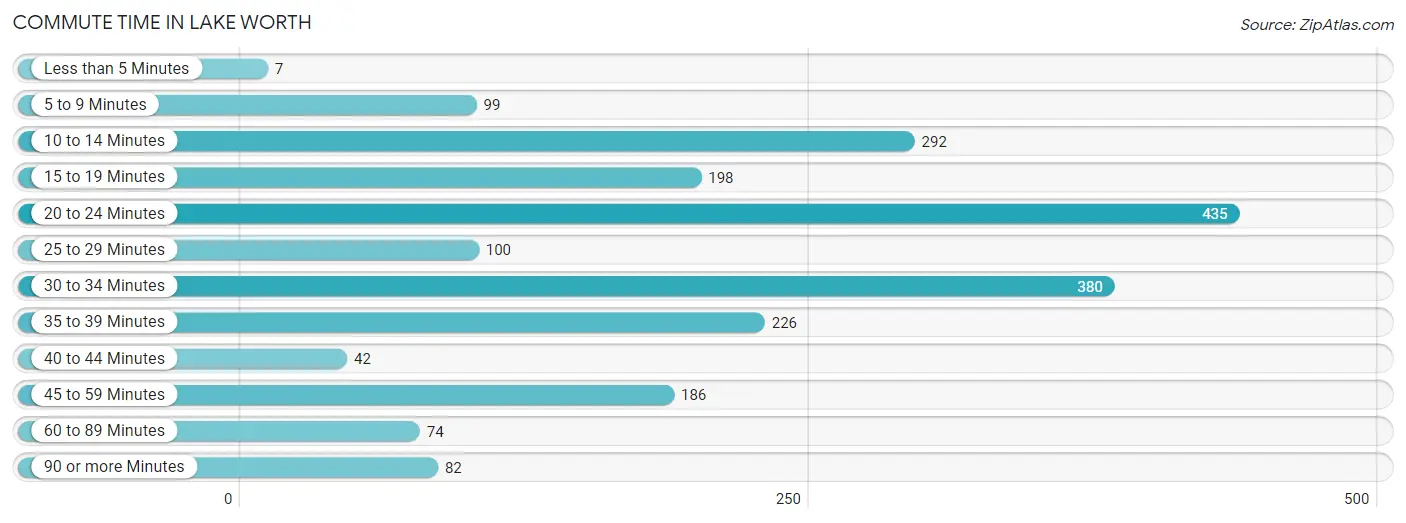
| Commute Time | # Commuters | % Commuters |
| Less than 5 Minutes | 7 | 0.3% |
| 5 to 9 Minutes | 99 | 4.7% |
| 10 to 14 Minutes | 292 | 13.8% |
| 15 to 19 Minutes | 198 | 9.3% |
| 20 to 24 Minutes | 435 | 20.5% |
| 25 to 29 Minutes | 100 | 4.7% |
| 30 to 34 Minutes | 380 | 17.9% |
| 35 to 39 Minutes | 226 | 10.7% |
| 40 to 44 Minutes | 42 | 2.0% |
| 45 to 59 Minutes | 186 | 8.8% |
| 60 to 89 Minutes | 74 | 3.5% |
| 90 or more Minutes | 82 | 3.9% |
Commute Time by Sex in Lake Worth
The most common commute times in Lake Worth are 30 to 34 minutes (271 commuters, 23.0%) for males and 10 to 14 minutes (263 commuters, 28.0%) for females.
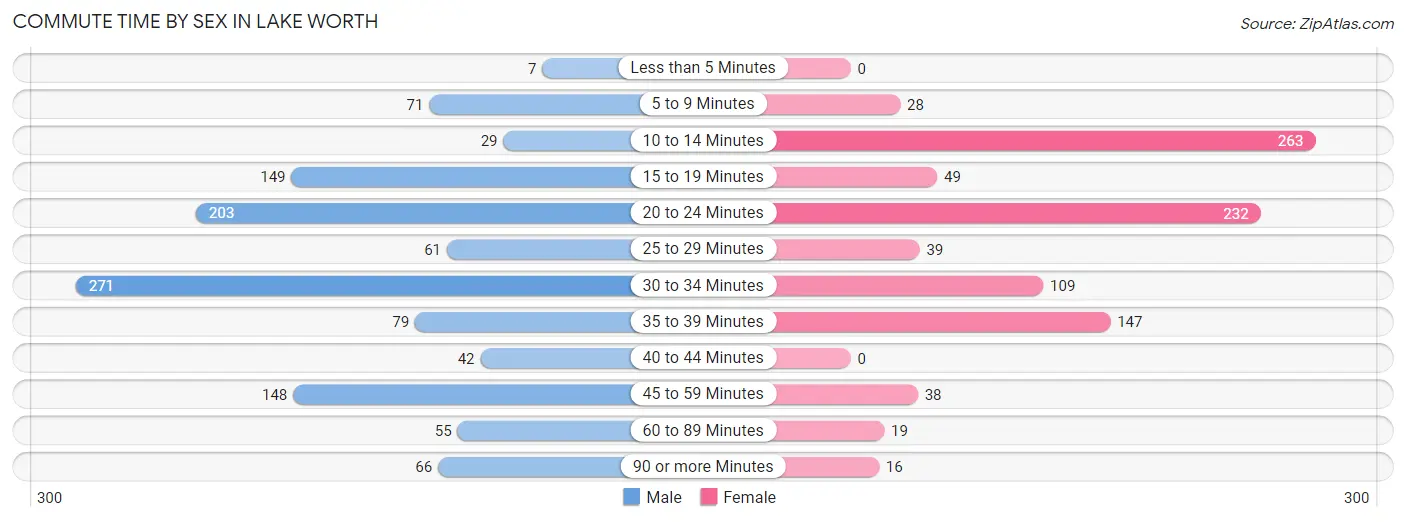
| Commute Time | Male | Female |
| Less than 5 Minutes | 7 (0.6%) | 0 (0.0%) |
| 5 to 9 Minutes | 71 (6.0%) | 28 (3.0%) |
| 10 to 14 Minutes | 29 (2.5%) | 263 (28.0%) |
| 15 to 19 Minutes | 149 (12.6%) | 49 (5.2%) |
| 20 to 24 Minutes | 203 (17.2%) | 232 (24.7%) |
| 25 to 29 Minutes | 61 (5.2%) | 39 (4.2%) |
| 30 to 34 Minutes | 271 (23.0%) | 109 (11.6%) |
| 35 to 39 Minutes | 79 (6.7%) | 147 (15.6%) |
| 40 to 44 Minutes | 42 (3.6%) | 0 (0.0%) |
| 45 to 59 Minutes | 148 (12.5%) | 38 (4.0%) |
| 60 to 89 Minutes | 55 (4.7%) | 19 (2.0%) |
| 90 or more Minutes | 66 (5.6%) | 16 (1.7%) |
Time of Departure to Work by Sex in Lake Worth
The most frequent times of departure to work in Lake Worth are 6:30 AM to 6:59 AM (229, 19.4%) for males and 8:00 AM to 8:29 AM (244, 26.0%) for females.
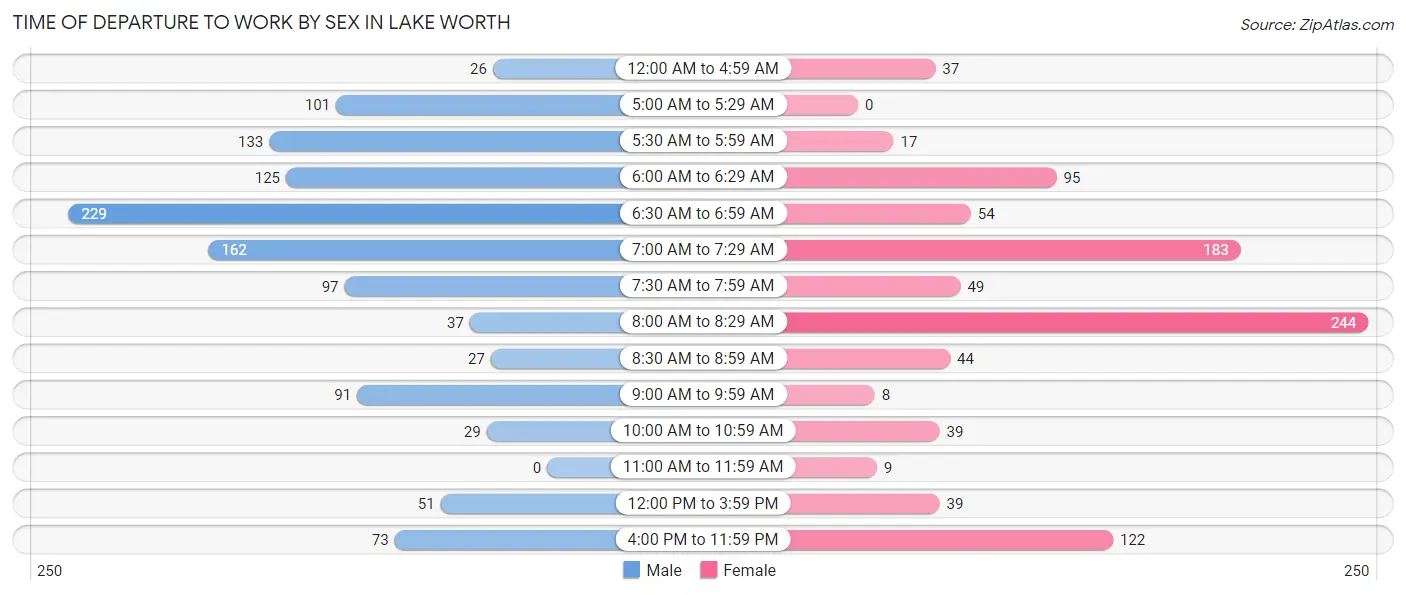
| Time of Departure | Male | Female |
| 12:00 AM to 4:59 AM | 26 (2.2%) | 37 (3.9%) |
| 5:00 AM to 5:29 AM | 101 (8.6%) | 0 (0.0%) |
| 5:30 AM to 5:59 AM | 133 (11.3%) | 17 (1.8%) |
| 6:00 AM to 6:29 AM | 125 (10.6%) | 95 (10.1%) |
| 6:30 AM to 6:59 AM | 229 (19.4%) | 54 (5.7%) |
| 7:00 AM to 7:29 AM | 162 (13.7%) | 183 (19.5%) |
| 7:30 AM to 7:59 AM | 97 (8.2%) | 49 (5.2%) |
| 8:00 AM to 8:29 AM | 37 (3.1%) | 244 (26.0%) |
| 8:30 AM to 8:59 AM | 27 (2.3%) | 44 (4.7%) |
| 9:00 AM to 9:59 AM | 91 (7.7%) | 8 (0.9%) |
| 10:00 AM to 10:59 AM | 29 (2.5%) | 39 (4.2%) |
| 11:00 AM to 11:59 AM | 0 (0.0%) | 9 (1.0%) |
| 12:00 PM to 3:59 PM | 51 (4.3%) | 39 (4.2%) |
| 4:00 PM to 11:59 PM | 73 (6.2%) | 122 (13.0%) |
| Total | 1,181 (100.0%) | 940 (100.0%) |
Housing Occupancy in Lake Worth
Occupancy by Ownership in Lake Worth
Of the total 1,845 dwellings in Lake Worth, owner-occupied units account for 1,408 (76.3%), while renter-occupied units make up 437 (23.7%).
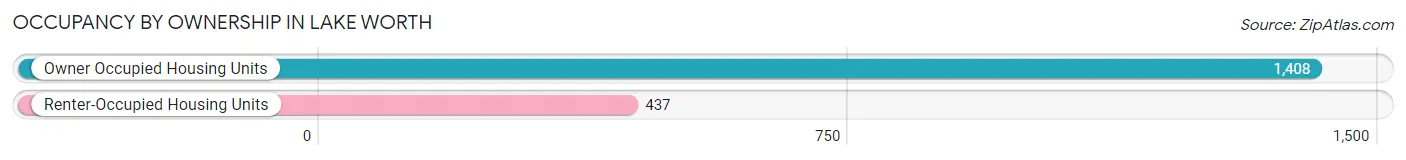
| Occupancy | # Housing Units | % Housing Units |
| Owner Occupied Housing Units | 1,408 | 76.3% |
| Renter-Occupied Housing Units | 437 | 23.7% |
| Total Occupied Housing Units | 1,845 | 100.0% |
Occupancy by Household Size in Lake Worth
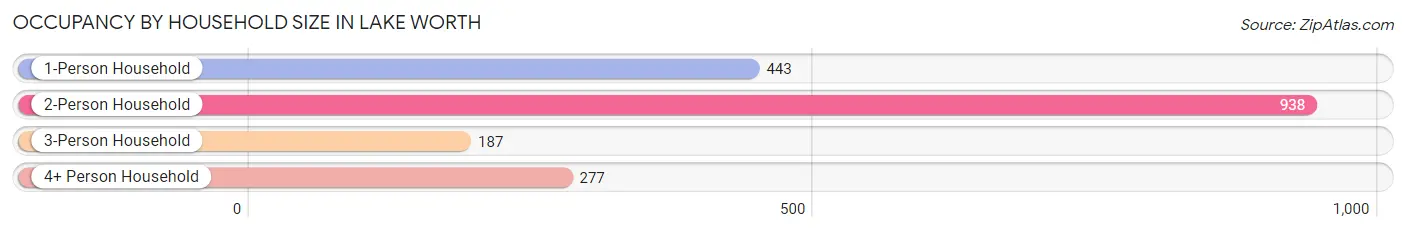
| Household Size | # Housing Units | % Housing Units |
| 1-Person Household | 443 | 24.0% |
| 2-Person Household | 938 | 50.8% |
| 3-Person Household | 187 | 10.1% |
| 4+ Person Household | 277 | 15.0% |
| Total Housing Units | 1,845 | 100.0% |
Occupancy by Ownership by Household Size in Lake Worth
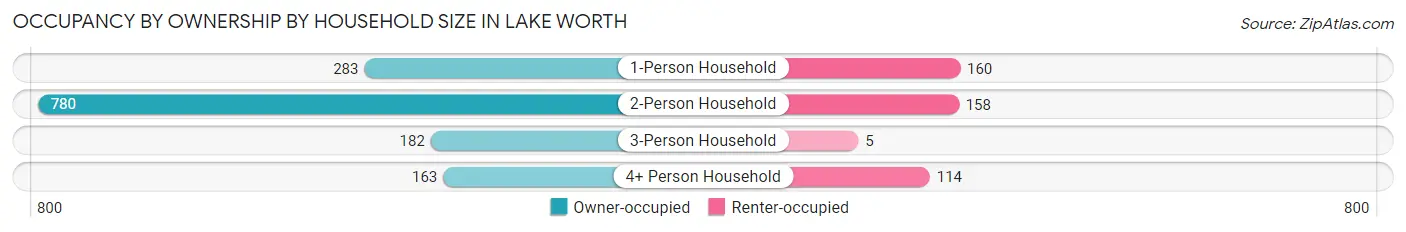
| Household Size | Owner-occupied | Renter-occupied |
| 1-Person Household | 283 (63.9%) | 160 (36.1%) |
| 2-Person Household | 780 (83.2%) | 158 (16.8%) |
| 3-Person Household | 182 (97.3%) | 5 (2.7%) |
| 4+ Person Household | 163 (58.8%) | 114 (41.2%) |
| Total Housing Units | 1,408 (76.3%) | 437 (23.7%) |
Occupancy by Educational Attainment in Lake Worth
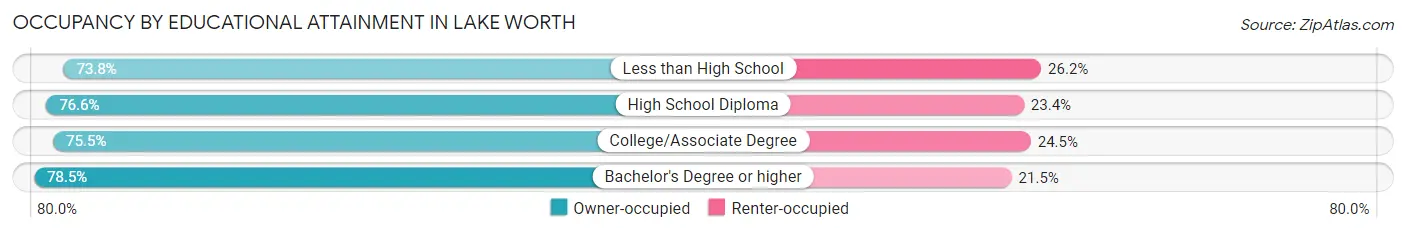
| Household Size | Owner-occupied | Renter-occupied |
| Less than High School | 189 (73.8%) | 67 (26.2%) |
| High School Diploma | 438 (76.6%) | 134 (23.4%) |
| College/Associate Degree | 434 (75.5%) | 141 (24.5%) |
| Bachelor's Degree or higher | 347 (78.5%) | 95 (21.5%) |
Occupancy by Age of Householder in Lake Worth
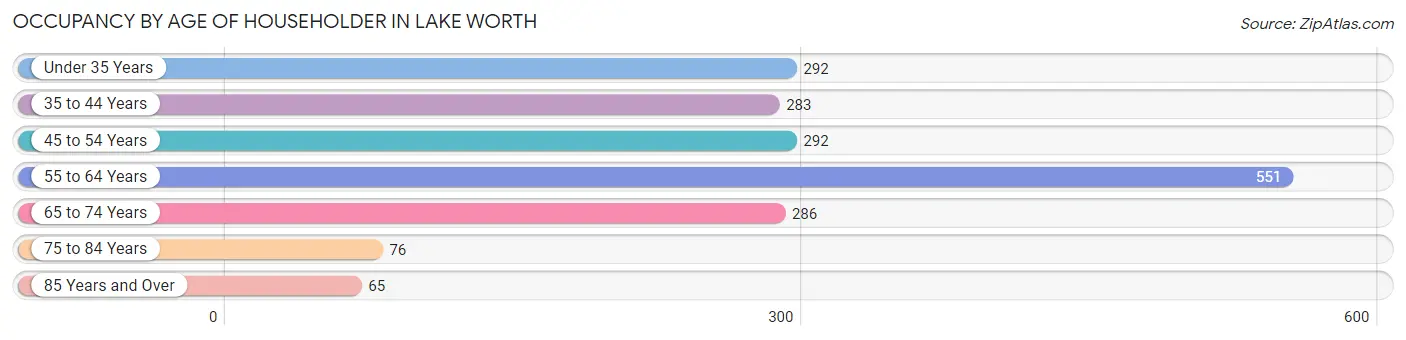
| Age Bracket | # Households | % Households |
| Under 35 Years | 292 | 15.8% |
| 35 to 44 Years | 283 | 15.3% |
| 45 to 54 Years | 292 | 15.8% |
| 55 to 64 Years | 551 | 29.9% |
| 65 to 74 Years | 286 | 15.5% |
| 75 to 84 Years | 76 | 4.1% |
| 85 Years and Over | 65 | 3.5% |
| Total | 1,845 | 100.0% |
Housing Finances in Lake Worth
Median Income by Occupancy in Lake Worth
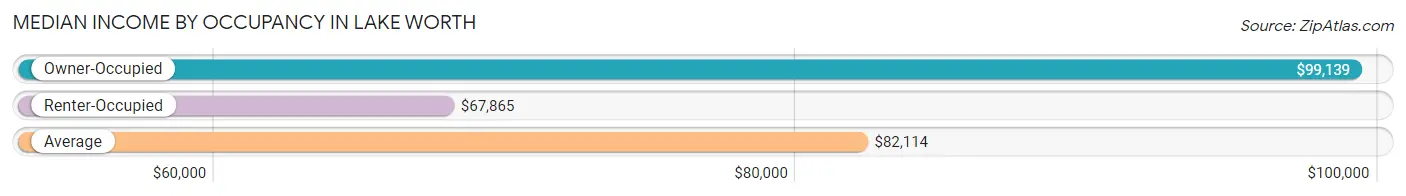
| Occupancy Type | # Households | Median Income |
| Owner-Occupied | 1,408 (76.3%) | $99,139 |
| Renter-Occupied | 437 (23.7%) | $67,865 |
| Average | 1,845 (100.0%) | $82,114 |
Occupancy by Householder Income Bracket in Lake Worth
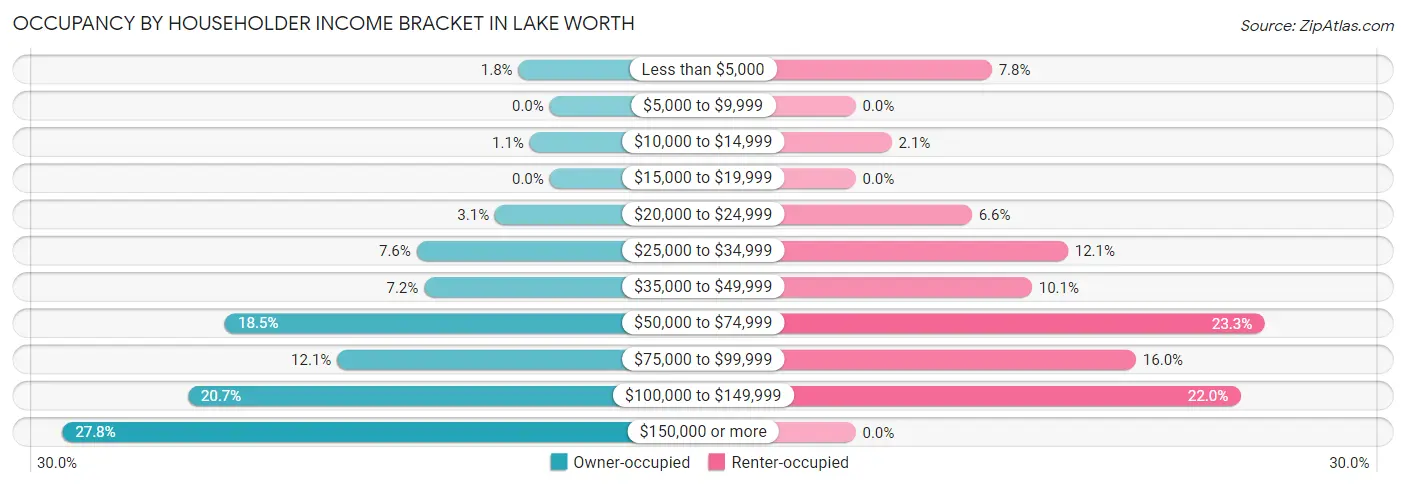
| Income Bracket | Owner-occupied | Renter-occupied |
| Less than $5,000 | 25 (1.8%) | 34 (7.8%) |
| $5,000 to $9,999 | 0 (0.0%) | 0 (0.0%) |
| $10,000 to $14,999 | 16 (1.1%) | 9 (2.1%) |
| $15,000 to $19,999 | 0 (0.0%) | 0 (0.0%) |
| $20,000 to $24,999 | 44 (3.1%) | 29 (6.6%) |
| $25,000 to $34,999 | 107 (7.6%) | 53 (12.1%) |
| $35,000 to $49,999 | 101 (7.2%) | 44 (10.1%) |
| $50,000 to $74,999 | 261 (18.5%) | 102 (23.3%) |
| $75,000 to $99,999 | 171 (12.1%) | 70 (16.0%) |
| $100,000 to $149,999 | 291 (20.7%) | 96 (22.0%) |
| $150,000 or more | 392 (27.8%) | 0 (0.0%) |
| Total | 1,408 (100.0%) | 437 (100.0%) |
Monthly Housing Cost Tiers in Lake Worth
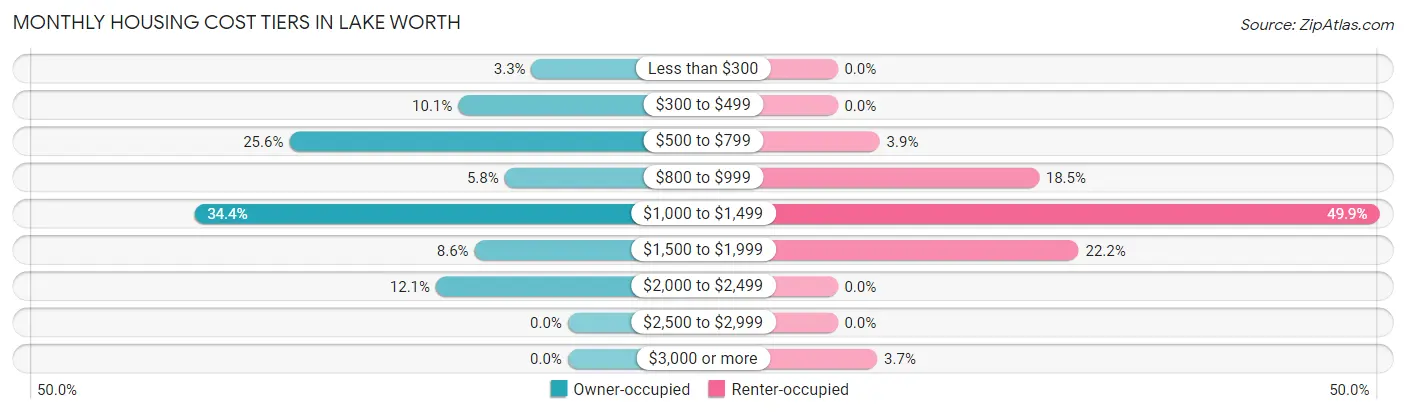
| Monthly Cost | Owner-occupied | Renter-occupied |
| Less than $300 | 47 (3.3%) | 0 (0.0%) |
| $300 to $499 | 142 (10.1%) | 0 (0.0%) |
| $500 to $799 | 361 (25.6%) | 17 (3.9%) |
| $800 to $999 | 82 (5.8%) | 81 (18.5%) |
| $1,000 to $1,499 | 484 (34.4%) | 218 (49.9%) |
| $1,500 to $1,999 | 121 (8.6%) | 97 (22.2%) |
| $2,000 to $2,499 | 171 (12.1%) | 0 (0.0%) |
| $2,500 to $2,999 | 0 (0.0%) | 0 (0.0%) |
| $3,000 or more | 0 (0.0%) | 16 (3.7%) |
| Total | 1,408 (100.0%) | 437 (100.0%) |
Physical Housing Characteristics in Lake Worth
Housing Structures in Lake Worth
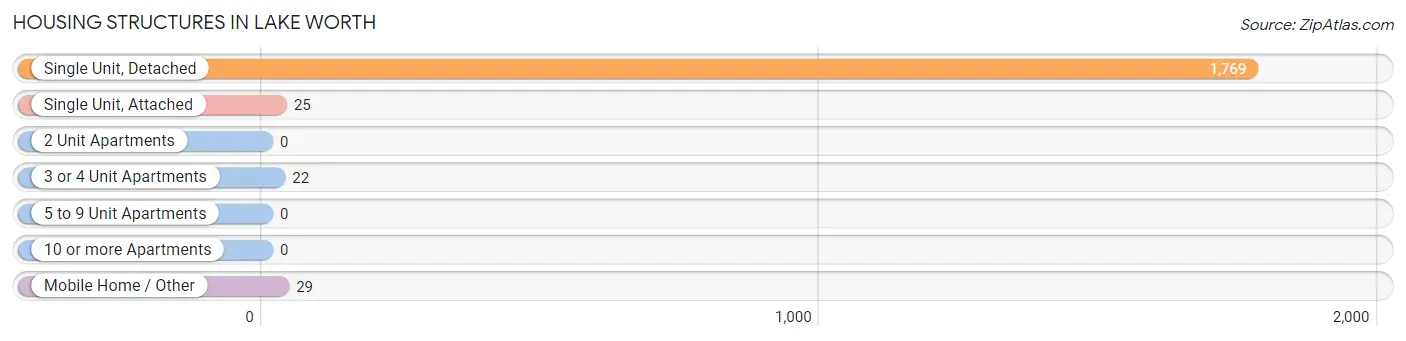
| Structure Type | # Housing Units | % Housing Units |
| Single Unit, Detached | 1,769 | 95.9% |
| Single Unit, Attached | 25 | 1.4% |
| 2 Unit Apartments | 0 | 0.0% |
| 3 or 4 Unit Apartments | 22 | 1.2% |
| 5 to 9 Unit Apartments | 0 | 0.0% |
| 10 or more Apartments | 0 | 0.0% |
| Mobile Home / Other | 29 | 1.6% |
| Total | 1,845 | 100.0% |
Housing Structures by Occupancy in Lake Worth
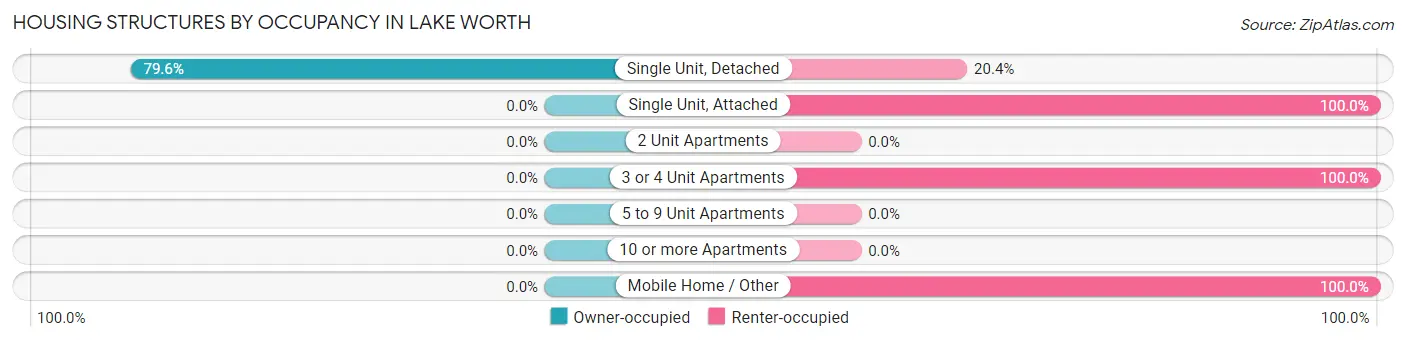
| Structure Type | Owner-occupied | Renter-occupied |
| Single Unit, Detached | 1,408 (79.6%) | 361 (20.4%) |
| Single Unit, Attached | 0 (0.0%) | 25 (100.0%) |
| 2 Unit Apartments | 0 (0.0%) | 0 (0.0%) |
| 3 or 4 Unit Apartments | 0 (0.0%) | 22 (100.0%) |
| 5 to 9 Unit Apartments | 0 (0.0%) | 0 (0.0%) |
| 10 or more Apartments | 0 (0.0%) | 0 (0.0%) |
| Mobile Home / Other | 0 (0.0%) | 29 (100.0%) |
| Total | 1,408 (76.3%) | 437 (23.7%) |
Housing Structures by Number of Rooms in Lake Worth
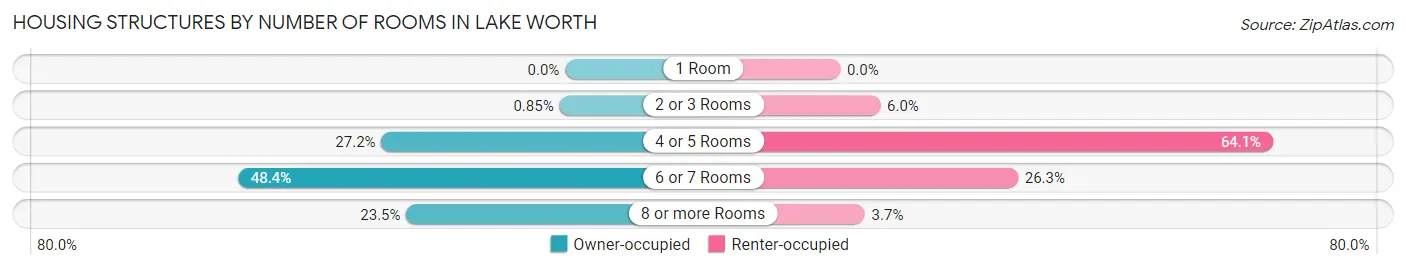
| Number of Rooms | Owner-occupied | Renter-occupied |
| 1 Room | 0 (0.0%) | 0 (0.0%) |
| 2 or 3 Rooms | 12 (0.9%) | 26 (5.9%) |
| 4 or 5 Rooms | 383 (27.2%) | 280 (64.1%) |
| 6 or 7 Rooms | 682 (48.4%) | 115 (26.3%) |
| 8 or more Rooms | 331 (23.5%) | 16 (3.7%) |
| Total | 1,408 (100.0%) | 437 (100.0%) |
Housing Structure by Heating Type in Lake Worth
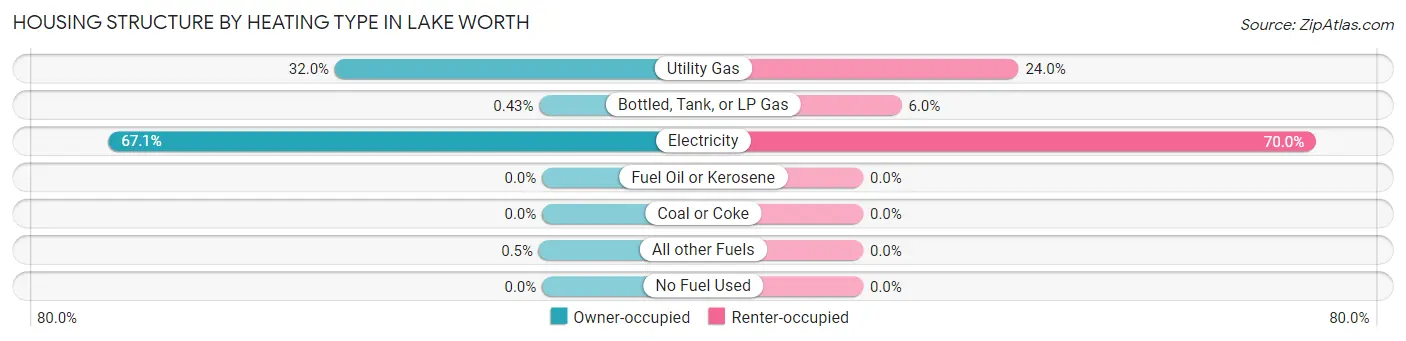
| Heating Type | Owner-occupied | Renter-occupied |
| Utility Gas | 451 (32.0%) | 105 (24.0%) |
| Bottled, Tank, or LP Gas | 6 (0.4%) | 26 (5.9%) |
| Electricity | 944 (67.0%) | 306 (70.0%) |
| Fuel Oil or Kerosene | 0 (0.0%) | 0 (0.0%) |
| Coal or Coke | 0 (0.0%) | 0 (0.0%) |
| All other Fuels | 7 (0.5%) | 0 (0.0%) |
| No Fuel Used | 0 (0.0%) | 0 (0.0%) |
| Total | 1,408 (100.0%) | 437 (100.0%) |
Household Vehicle Usage in Lake Worth
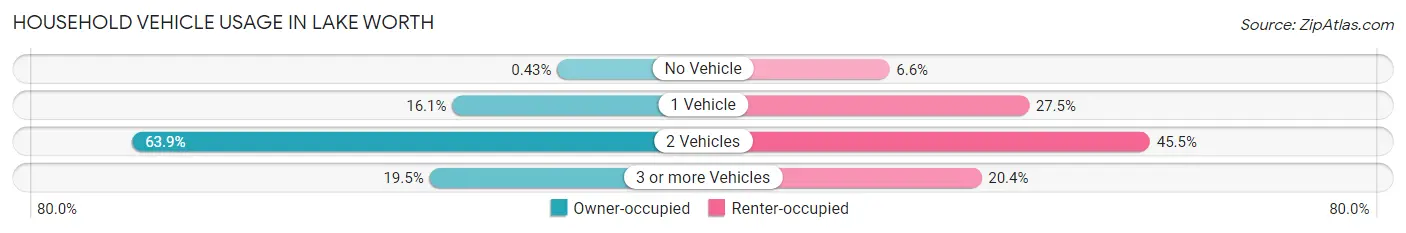
| Vehicles per Household | Owner-occupied | Renter-occupied |
| No Vehicle | 6 (0.4%) | 29 (6.6%) |
| 1 Vehicle | 227 (16.1%) | 120 (27.5%) |
| 2 Vehicles | 900 (63.9%) | 199 (45.5%) |
| 3 or more Vehicles | 275 (19.5%) | 89 (20.4%) |
| Total | 1,408 (100.0%) | 437 (100.0%) |
Real Estate & Mortgages in Lake Worth
Real Estate and Mortgage Overview in Lake Worth
| Characteristic | Without Mortgage | With Mortgage |
| Housing Units | 597 | 811 |
| Median Property Value | $187,600 | $191,500 |
| Median Household Income | $84,732 | $323 |
| Monthly Housing Costs | $563 | $0 |
| Real Estate Taxes | $1,707 | $0 |
Property Value by Mortgage Status in Lake Worth
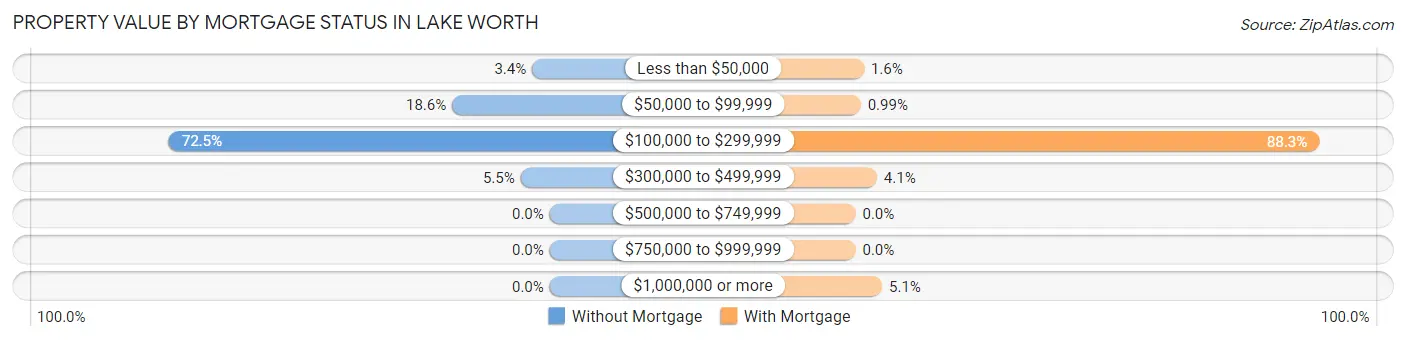
| Property Value | Without Mortgage | With Mortgage |
| Less than $50,000 | 20 (3.4%) | 13 (1.6%) |
| $50,000 to $99,999 | 111 (18.6%) | 8 (1.0%) |
| $100,000 to $299,999 | 433 (72.5%) | 716 (88.3%) |
| $300,000 to $499,999 | 33 (5.5%) | 33 (4.1%) |
| $500,000 to $749,999 | 0 (0.0%) | 0 (0.0%) |
| $750,000 to $999,999 | 0 (0.0%) | 0 (0.0%) |
| $1,000,000 or more | 0 (0.0%) | 41 (5.1%) |
| Total | 597 (100.0%) | 811 (100.0%) |
Household Income by Mortgage Status in Lake Worth
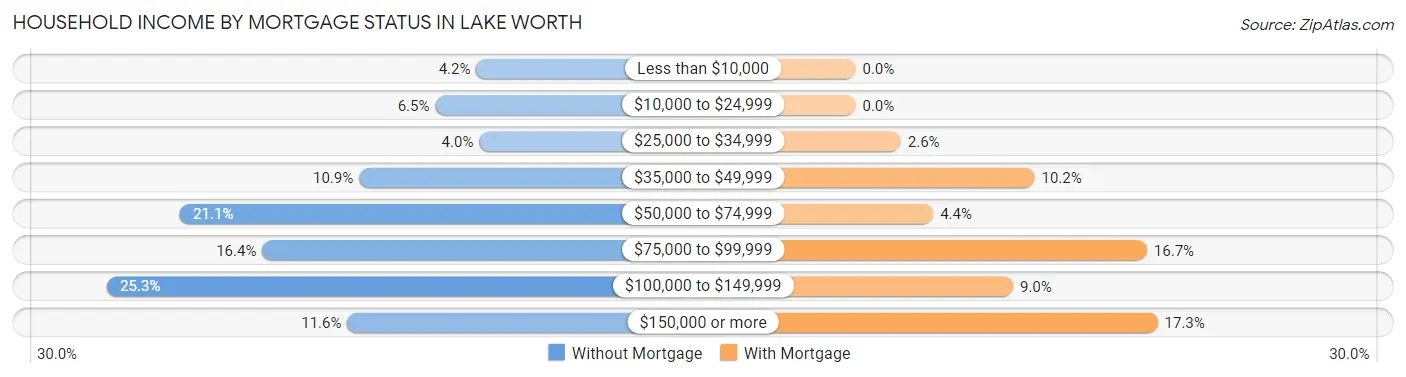
| Household Income | Without Mortgage | With Mortgage |
| Less than $10,000 | 25 (4.2%) | 0 (0.0%) |
| $10,000 to $24,999 | 39 (6.5%) | 0 (0.0%) |
| $25,000 to $34,999 | 24 (4.0%) | 21 (2.6%) |
| $35,000 to $49,999 | 65 (10.9%) | 83 (10.2%) |
| $50,000 to $74,999 | 126 (21.1%) | 36 (4.4%) |
| $75,000 to $99,999 | 98 (16.4%) | 135 (16.7%) |
| $100,000 to $149,999 | 151 (25.3%) | 73 (9.0%) |
| $150,000 or more | 69 (11.6%) | 140 (17.3%) |
| Total | 597 (100.0%) | 811 (100.0%) |
Property Value to Household Income Ratio in Lake Worth
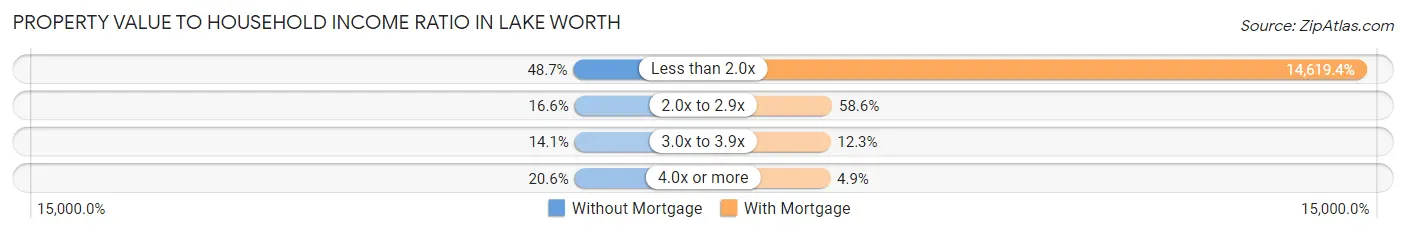
| Value-to-Income Ratio | Without Mortgage | With Mortgage |
| Less than 2.0x | 291 (48.7%) | 118,563 (14,619.4%) |
| 2.0x to 2.9x | 99 (16.6%) | 475 (58.6%) |
| 3.0x to 3.9x | 84 (14.1%) | 100 (12.3%) |
| 4.0x or more | 123 (20.6%) | 40 (4.9%) |
| Total | 597 (100.0%) | 811 (100.0%) |
Real Estate Taxes by Mortgage Status in Lake Worth
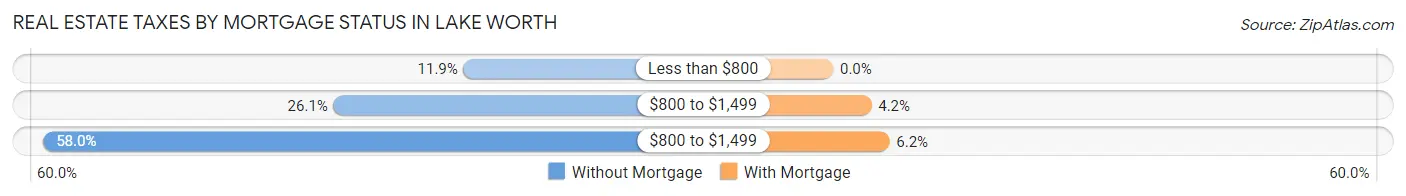
| Property Taxes | Without Mortgage | With Mortgage |
| Less than $800 | 71 (11.9%) | 0 (0.0%) |
| $800 to $1,499 | 156 (26.1%) | 34 (4.2%) |
| $800 to $1,499 | 346 (58.0%) | 50 (6.2%) |
| Total | 597 (100.0%) | 811 (100.0%) |
Health & Disability in Lake Worth
Health Insurance Coverage by Age in Lake Worth
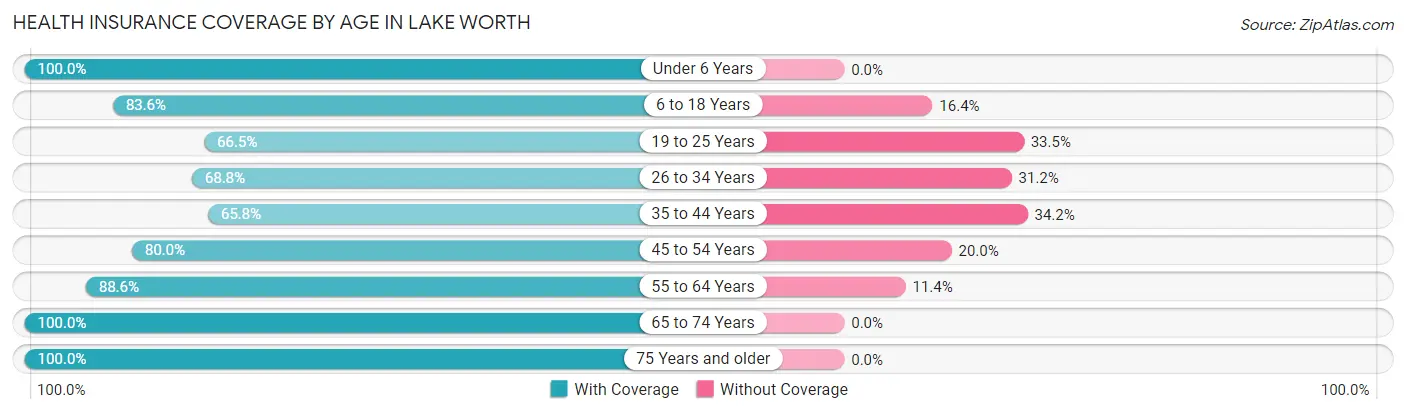
| Age Bracket | With Coverage | Without Coverage |
| Under 6 Years | 157 (100.0%) | 0 (0.0%) |
| 6 to 18 Years | 529 (83.6%) | 104 (16.4%) |
| 19 to 25 Years | 173 (66.5%) | 87 (33.5%) |
| 26 to 34 Years | 377 (68.8%) | 171 (31.2%) |
| 35 to 44 Years | 497 (65.8%) | 258 (34.2%) |
| 45 to 54 Years | 480 (80.0%) | 120 (20.0%) |
| 55 to 64 Years | 667 (88.6%) | 86 (11.4%) |
| 65 to 74 Years | 636 (100.0%) | 0 (0.0%) |
| 75 Years and older | 179 (100.0%) | 0 (0.0%) |
| Total | 3,695 (81.7%) | 826 (18.3%) |
Health Insurance Coverage by Citizenship Status in Lake Worth
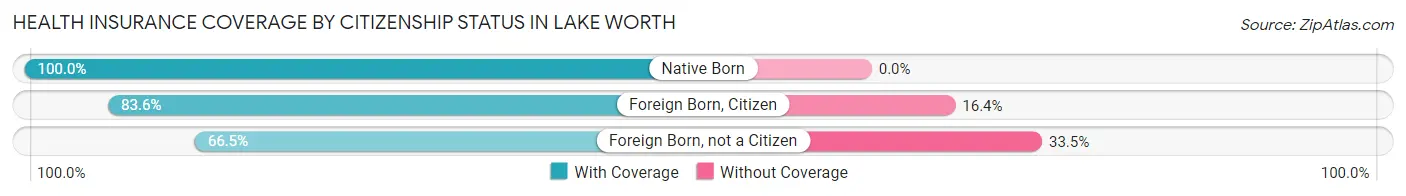
| Citizenship Status | With Coverage | Without Coverage |
| Native Born | 157 (100.0%) | 0 (0.0%) |
| Foreign Born, Citizen | 529 (83.6%) | 104 (16.4%) |
| Foreign Born, not a Citizen | 173 (66.5%) | 87 (33.5%) |
Health Insurance Coverage by Household Income in Lake Worth
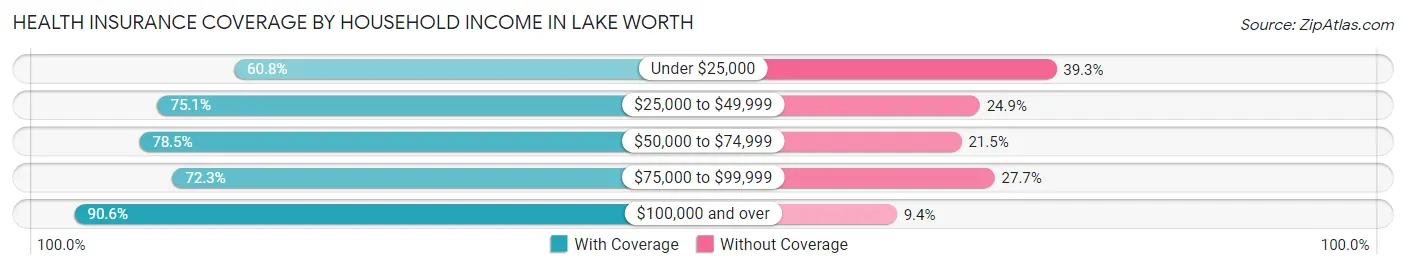
| Household Income | With Coverage | Without Coverage |
| Under $25,000 | 130 (60.8%) | 84 (39.3%) |
| $25,000 to $49,999 | 440 (75.1%) | 146 (24.9%) |
| $50,000 to $74,999 | 643 (78.5%) | 176 (21.5%) |
| $75,000 to $99,999 | 585 (72.3%) | 224 (27.7%) |
| $100,000 and over | 1,897 (90.6%) | 196 (9.4%) |
Public vs Private Health Insurance Coverage by Age in Lake Worth
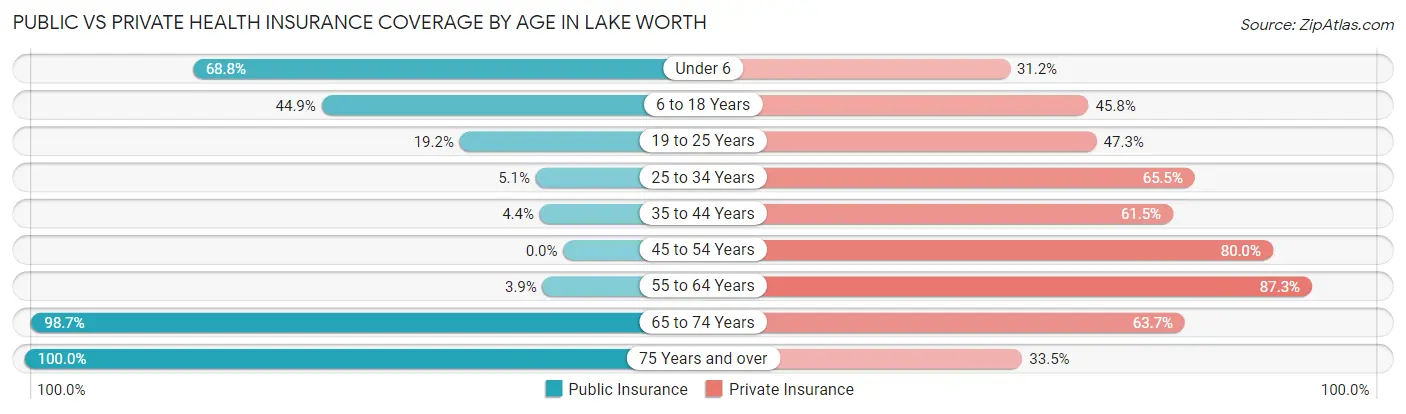
| Age Bracket | Public Insurance | Private Insurance |
| Under 6 | 108 (68.8%) | 49 (31.2%) |
| 6 to 18 Years | 284 (44.9%) | 290 (45.8%) |
| 19 to 25 Years | 50 (19.2%) | 123 (47.3%) |
| 25 to 34 Years | 28 (5.1%) | 359 (65.5%) |
| 35 to 44 Years | 33 (4.4%) | 464 (61.5%) |
| 45 to 54 Years | 0 (0.0%) | 480 (80.0%) |
| 55 to 64 Years | 29 (3.8%) | 657 (87.3%) |
| 65 to 74 Years | 628 (98.7%) | 405 (63.7%) |
| 75 Years and over | 179 (100.0%) | 60 (33.5%) |
| Total | 1,339 (29.6%) | 2,887 (63.9%) |
Disability Status by Sex by Age in Lake Worth
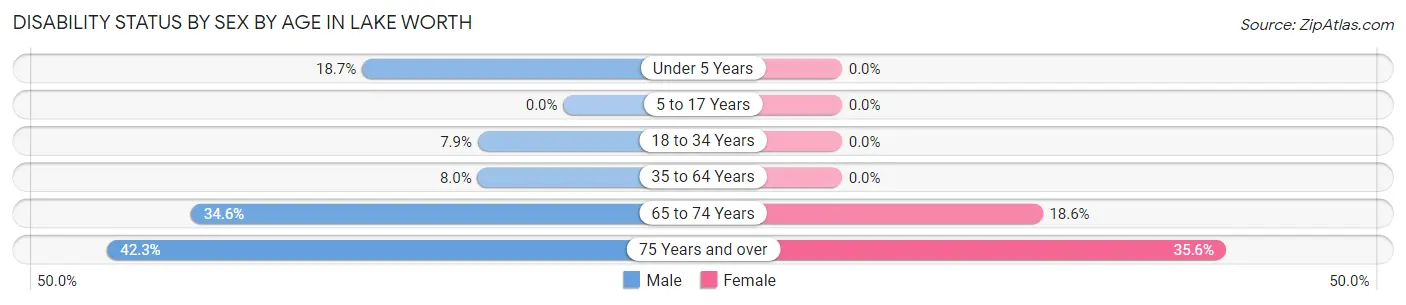
| Age Bracket | Male | Female |
| Under 5 Years | 17 (18.7%) | 0 (0.0%) |
| 5 to 17 Years | 0 (0.0%) | 0 (0.0%) |
| 18 to 34 Years | 39 (7.9%) | 0 (0.0%) |
| 35 to 64 Years | 80 (8.0%) | 0 (0.0%) |
| 65 to 74 Years | 75 (34.6%) | 78 (18.6%) |
| 75 Years and over | 33 (42.3%) | 36 (35.6%) |
Disability Class by Sex by Age in Lake Worth
Disability Class: Hearing Difficulty
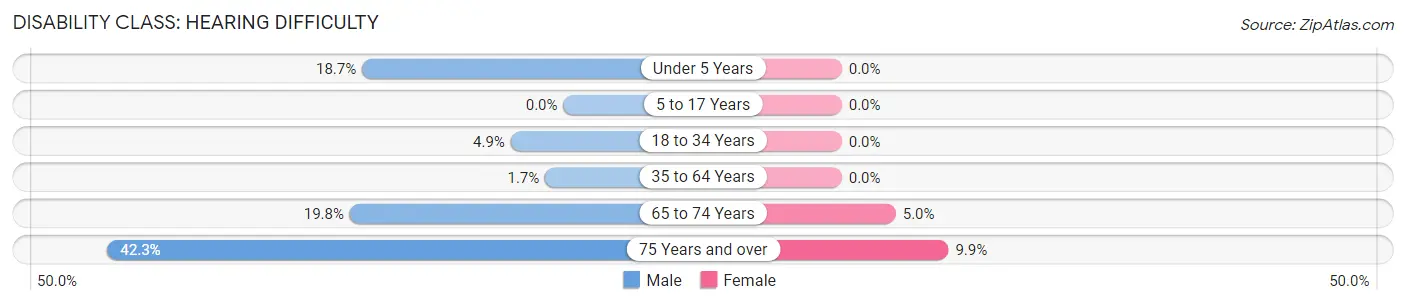
| Age Bracket | Male | Female |
| Under 5 Years | 17 (18.7%) | 0 (0.0%) |
| 5 to 17 Years | 0 (0.0%) | 0 (0.0%) |
| 18 to 34 Years | 24 (4.9%) | 0 (0.0%) |
| 35 to 64 Years | 17 (1.7%) | 0 (0.0%) |
| 65 to 74 Years | 43 (19.8%) | 21 (5.0%) |
| 75 Years and over | 33 (42.3%) | 10 (9.9%) |
Disability Class: Vision Difficulty
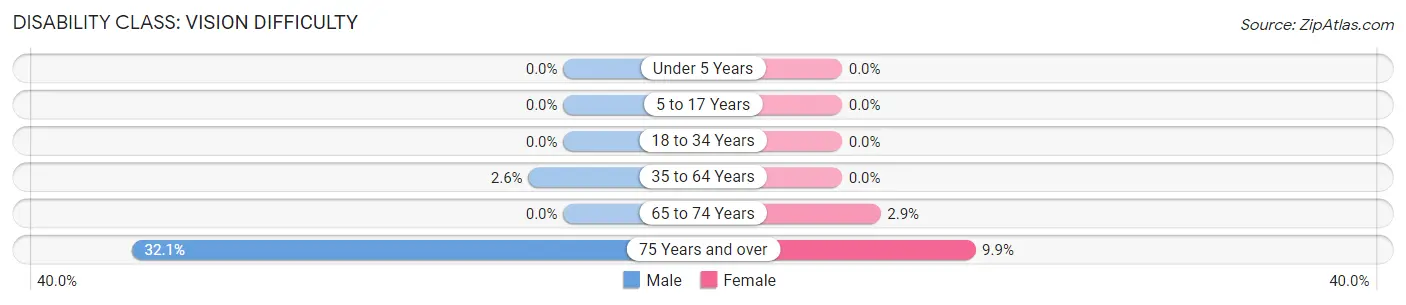
| Age Bracket | Male | Female |
| Under 5 Years | 0 (0.0%) | 0 (0.0%) |
| 5 to 17 Years | 0 (0.0%) | 0 (0.0%) |
| 18 to 34 Years | 0 (0.0%) | 0 (0.0%) |
| 35 to 64 Years | 26 (2.6%) | 0 (0.0%) |
| 65 to 74 Years | 0 (0.0%) | 12 (2.9%) |
| 75 Years and over | 25 (32.1%) | 10 (9.9%) |
Disability Class: Cognitive Difficulty
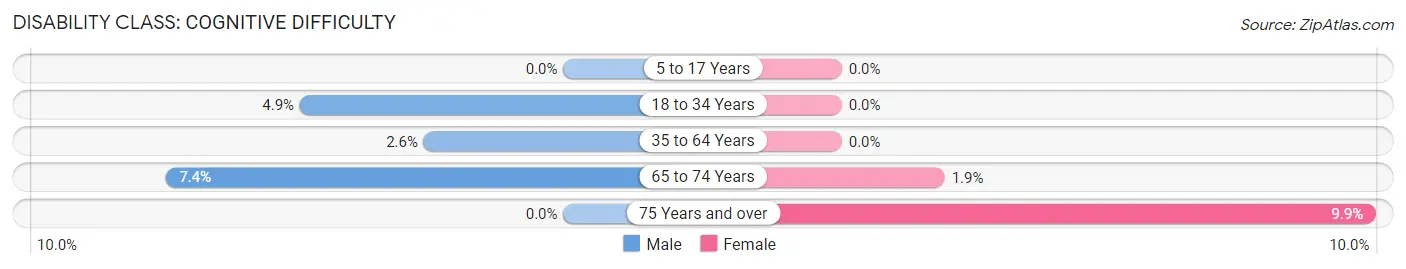
| Age Bracket | Male | Female |
| 5 to 17 Years | 0 (0.0%) | 0 (0.0%) |
| 18 to 34 Years | 24 (4.9%) | 0 (0.0%) |
| 35 to 64 Years | 26 (2.6%) | 0 (0.0%) |
| 65 to 74 Years | 16 (7.4%) | 8 (1.9%) |
| 75 Years and over | 0 (0.0%) | 10 (9.9%) |
Disability Class: Ambulatory Difficulty
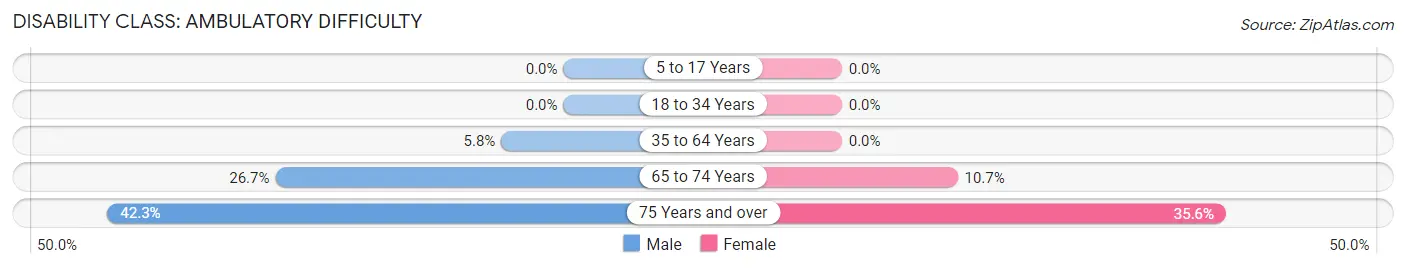
| Age Bracket | Male | Female |
| 5 to 17 Years | 0 (0.0%) | 0 (0.0%) |
| 18 to 34 Years | 0 (0.0%) | 0 (0.0%) |
| 35 to 64 Years | 58 (5.8%) | 0 (0.0%) |
| 65 to 74 Years | 58 (26.7%) | 45 (10.7%) |
| 75 Years and over | 33 (42.3%) | 36 (35.6%) |
Disability Class: Self-Care Difficulty
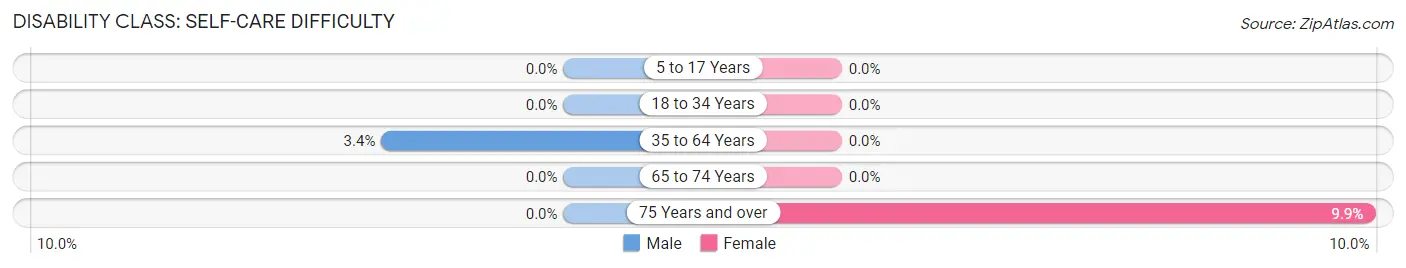
| Age Bracket | Male | Female |
| 5 to 17 Years | 0 (0.0%) | 0 (0.0%) |
| 18 to 34 Years | 0 (0.0%) | 0 (0.0%) |
| 35 to 64 Years | 34 (3.4%) | 0 (0.0%) |
| 65 to 74 Years | 0 (0.0%) | 0 (0.0%) |
| 75 Years and over | 0 (0.0%) | 10 (9.9%) |
Technology Access in Lake Worth
Computing Device Access in Lake Worth
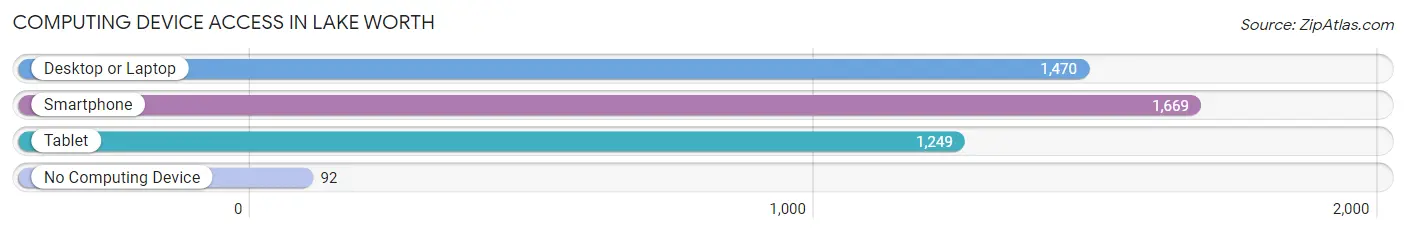
| Device Type | # Households | % Households |
| Desktop or Laptop | 1,470 | 79.7% |
| Smartphone | 1,669 | 90.5% |
| Tablet | 1,249 | 67.7% |
| No Computing Device | 92 | 5.0% |
| Total | 1,845 | 100.0% |
Internet Access in Lake Worth
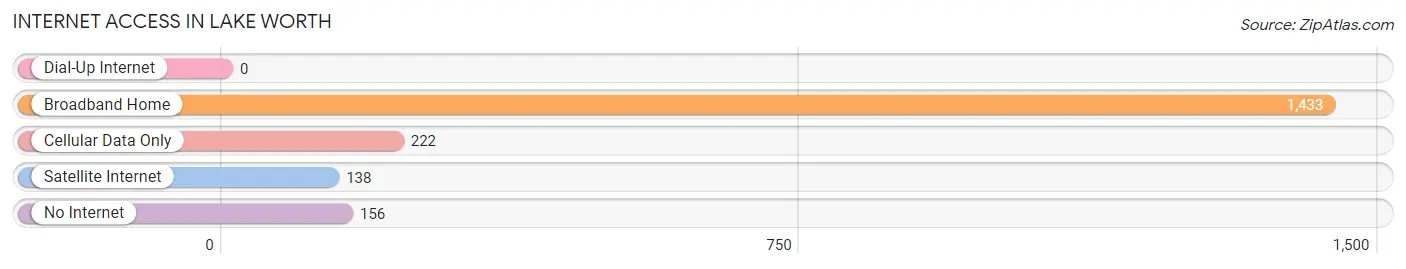
| Internet Type | # Households | % Households |
| Dial-Up Internet | 0 | 0.0% |
| Broadband Home | 1,433 | 77.7% |
| Cellular Data Only | 222 | 12.0% |
| Satellite Internet | 138 | 7.5% |
| No Internet | 156 | 8.5% |
| Total | 1,845 | 100.0% |
Lake Worth Summary
History
The city of Lake Worth, Texas is located in Tarrant County, just west of Fort Worth. It was founded in 1887 by a group of settlers from Fort Worth, who were looking for a place to settle and build a new town. The town was named after the nearby lake, which was named after the nearby town of Worth. The town was originally a farming community, but it soon grew to become a popular tourist destination.
The city of Lake Worth was officially incorporated in 1912, and it quickly became a popular destination for tourists. The city was known for its beautiful beaches, fishing, and other recreational activities. In the 1920s, the city began to attract more visitors, and it soon became a popular destination for vacationers.
In the 1950s, the city began to experience a population boom, as more people moved to the area. This growth was largely due to the city's proximity to Fort Worth and Dallas, as well as its close proximity to the Dallas-Fort Worth International Airport. By the 1970s, the city had become a major tourist destination, and it continues to be a popular destination for tourists today.
Geography
Lake Worth is located in Tarrant County, Texas, just west of Fort Worth. It is situated on the western edge of the Fort Worth metropolitan area, and it is bordered by the cities of Fort Worth, Arlington, and Grand Prairie. The city covers an area of approximately 8.5 square miles, and it is located at an elevation of approximately 600 feet above sea level.
The city is located in a flat, low-lying area, and it is surrounded by several small lakes and ponds. The city is also home to several parks, including Lake Worth Park, which is located on the north side of the city. The city is also home to several golf courses, including the Lake Worth Golf Course, which is located on the south side of the city.
Economy
The economy of Lake Worth is largely based on tourism, as the city is a popular destination for vacationers. The city is home to several hotels, restaurants, and other businesses that cater to tourists. The city is also home to several manufacturing companies, including a large paper mill and a large printing company.
The city is also home to several retail stores, including a large shopping mall. The city is also home to several banks, and it is home to several financial institutions, including a large credit union.
Demographics
As of the 2010 census, the population of Lake Worth was estimated to be 24,821. The population is largely white, with a small percentage of African Americans, Hispanics, and other ethnicities. The median household income in the city is $45,845, and the median home value is $133,000. The city has a high rate of homeownership, with approximately 70% of the population owning their own homes.
The city is served by several public schools, including Lake Worth High School, Lake Worth Middle School, and Lake Worth Elementary School. The city is also home to several private schools, including Lake Worth Christian School and Lake Worth Montessori School.
Conclusion
Lake Worth, Texas is a city located in Tarrant County, just west of Fort Worth. It was founded in 1887 by a group of settlers from Fort Worth, and it quickly became a popular tourist destination. The city is known for its beautiful beaches, fishing, and other recreational activities. The economy of the city is largely based on tourism, and it is home to several hotels, restaurants, and other businesses that cater to tourists. The population of the city is largely white, with a small percentage of African Americans, Hispanics, and other ethnicities. The city is served by several public schools, and it is home to several private schools.
Common Questions
What is Per Capita Income in Lake Worth?
Per Capita income in Lake Worth is $49,212.
What is the Median Family Income in Lake Worth?
Median Family Income in Lake Worth is $84,375.
What is the Median Household income in Lake Worth?
Median Household Income in Lake Worth is $82,114.
What is Income or Wage Gap in Lake Worth?
Income or Wage Gap in Lake Worth is 36.0%.
Women in Lake Worth earn 64.0 cents for every dollar earned by a man.
What is Inequality or Gini Index in Lake Worth?
Inequality or Gini Index in Lake Worth is 0.49.
What is the Total Population of Lake Worth?
Total Population of Lake Worth is 4,701.
What is the Total Male Population of Lake Worth?
Total Male Population of Lake Worth is 2,111.
What is the Total Female Population of Lake Worth?
Total Female Population of Lake Worth is 2,590.
What is the Ratio of Males per 100 Females in Lake Worth?
There are 81.51 Males per 100 Females in Lake Worth.
What is the Ratio of Females per 100 Males in Lake Worth?
There are 122.69 Females per 100 Males in Lake Worth.
What is the Median Population Age in Lake Worth?
Median Population Age in Lake Worth is 44.9 Years.
What is the Average Family Size in Lake Worth
Average Family Size in Lake Worth is 2.9 People.
What is the Average Household Size in Lake Worth
Average Household Size in Lake Worth is 2.5 People.
How Large is the Labor Force in Lake Worth?
There are 2,687 People in the Labor Forcein in Lake Worth.
What is the Percentage of People in the Labor Force in Lake Worth?
64.4% of People are in the Labor Force in Lake Worth.
What is the Unemployment Rate in Lake Worth?
Unemployment Rate in Lake Worth is 8.0%.