Iona, FL Map & Demographics
Iona Map
Iona Overview
$56,219
PER CAPITA INCOME
$73,137
AVG FAMILY INCOME
$62,655
AVG HOUSEHOLD INCOME
22.5%
WAGE / INCOME GAP [ % ]
77.5¢/ $1
WAGE / INCOME GAP [ $ ]
0.53
INEQUALITY / GINI INDEX
14,295
TOTAL POPULATION
6,519
MALE POPULATION
7,776
FEMALE POPULATION
83.83
MALES / 100 FEMALES
119.28
FEMALES / 100 MALES
67.9
MEDIAN AGE
2.3
AVG FAMILY SIZE
1.8
AVG HOUSEHOLD SIZE
4,701
LABOR FORCE [ PEOPLE ]
34.1%
PERCENT IN LABOR FORCE
2.5%
UNEMPLOYMENT RATE
Income in Iona
Income Overview in Iona
Per Capita Income in Iona is $56,219, while median incomes of families and households are $73,137 and $62,655 respectively.
| Characteristic | Number | Measure |
| Per Capita Income | 14,295 | $56,219 |
| Median Family Income | 4,341 | $73,137 |
| Mean Family Income | 4,341 | $123,787 |
| Median Household Income | 7,842 | $62,655 |
| Mean Household Income | 7,842 | $99,398 |
| Income Deficit | 4,341 | $0 |
| Wage / Income Gap (%) | 14,295 | 22.51% |
| Wage / Income Gap ($) | 14,295 | 77.49¢ per $1 |
| Gini / Inequality Index | 14,295 | 0.53 |
Earnings by Sex in Iona
Average Earnings in Iona are $37,695, $46,974 for men and $36,402 for women, a difference of 22.5%.
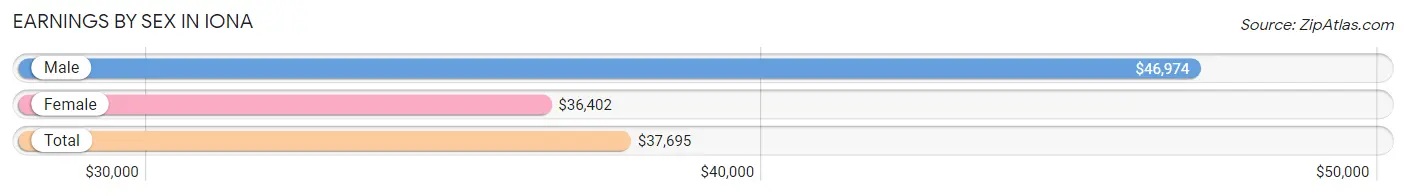
| Sex | Number | Average Earnings |
| Male | 2,610 (51.4%) | $46,974 |
| Female | 2,465 (48.6%) | $36,402 |
| Total | 5,075 (100.0%) | $37,695 |
Earnings by Sex by Income Bracket in Iona
The most common earnings brackets in Iona are $100,000+ for men (434 | 16.6%) and $100,000+ for women (416 | 16.9%).
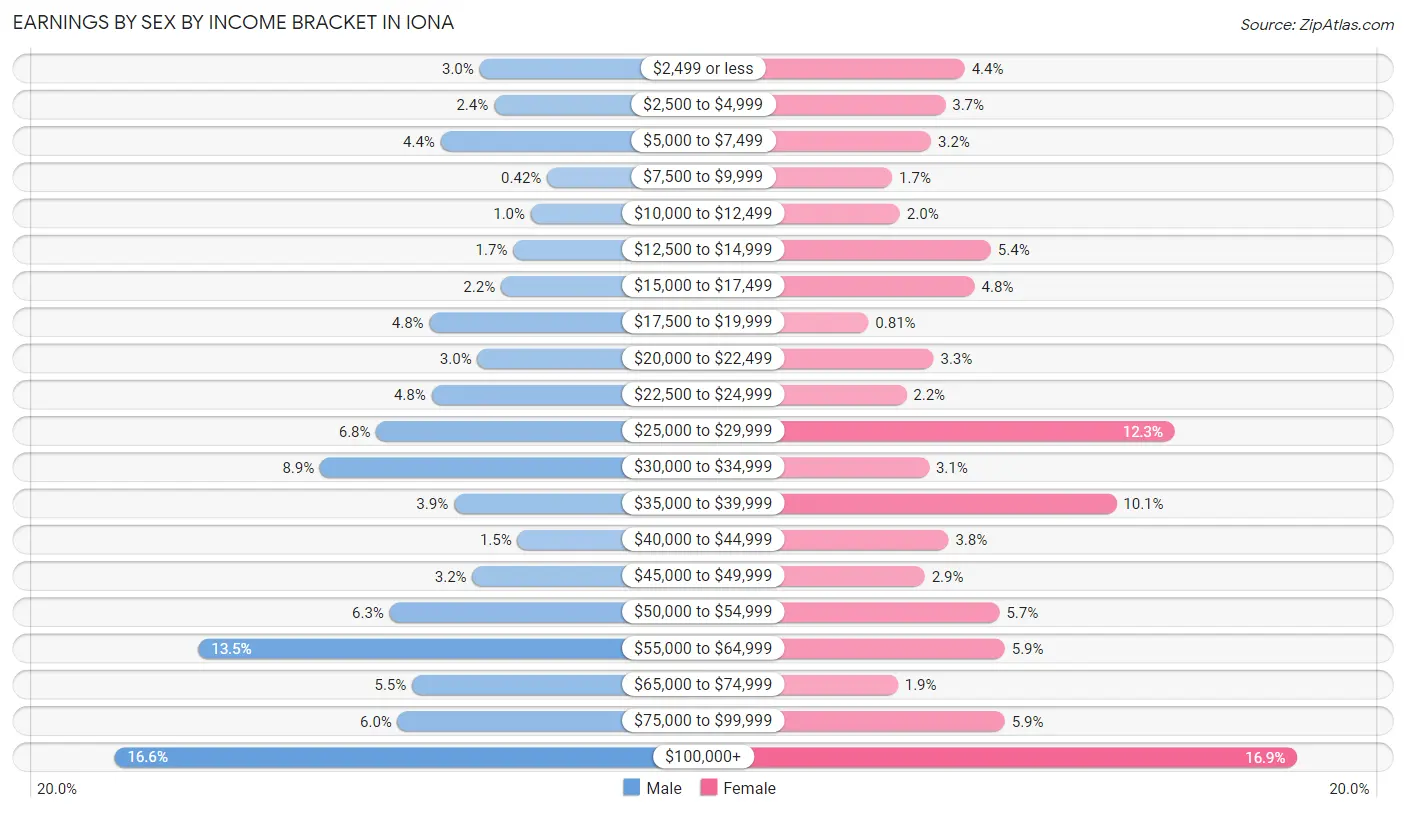
| Income | Male | Female |
| $2,499 or less | 77 (2.9%) | 109 (4.4%) |
| $2,500 to $4,999 | 63 (2.4%) | 91 (3.7%) |
| $5,000 to $7,499 | 115 (4.4%) | 78 (3.2%) |
| $7,500 to $9,999 | 11 (0.4%) | 42 (1.7%) |
| $10,000 to $12,499 | 27 (1.0%) | 49 (2.0%) |
| $12,500 to $14,999 | 44 (1.7%) | 133 (5.4%) |
| $15,000 to $17,499 | 56 (2.1%) | 118 (4.8%) |
| $17,500 to $19,999 | 126 (4.8%) | 20 (0.8%) |
| $20,000 to $22,499 | 79 (3.0%) | 80 (3.3%) |
| $22,500 to $24,999 | 124 (4.8%) | 55 (2.2%) |
| $25,000 to $29,999 | 178 (6.8%) | 303 (12.3%) |
| $30,000 to $34,999 | 233 (8.9%) | 76 (3.1%) |
| $35,000 to $39,999 | 102 (3.9%) | 249 (10.1%) |
| $40,000 to $44,999 | 40 (1.5%) | 94 (3.8%) |
| $45,000 to $49,999 | 84 (3.2%) | 72 (2.9%) |
| $50,000 to $54,999 | 165 (6.3%) | 141 (5.7%) |
| $55,000 to $64,999 | 352 (13.5%) | 146 (5.9%) |
| $65,000 to $74,999 | 143 (5.5%) | 47 (1.9%) |
| $75,000 to $99,999 | 157 (6.0%) | 146 (5.9%) |
| $100,000+ | 434 (16.6%) | 416 (16.9%) |
| Total | 2,610 (100.0%) | 2,465 (100.0%) |
Earnings by Sex by Educational Attainment in Iona
Average earnings in Iona are $51,375 for men and $37,071 for women, a difference of 27.8%. Men with an educational attainment of graduate degree enjoy the highest average annual earnings of $93,068, while those with college or associate's degree education earn the least with $33,931. Women with an educational attainment of graduate degree earn the most with the average annual earnings of $94,688, while those with high school diploma education have the smallest earnings of $29,626.
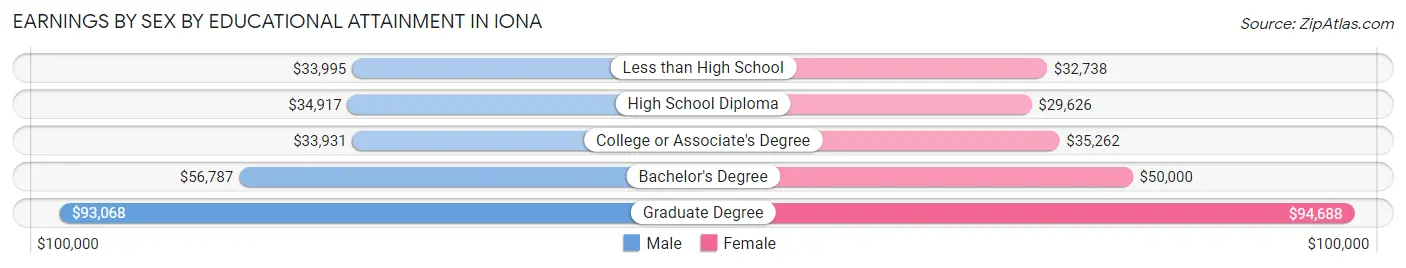
| Educational Attainment | Male Income | Female Income |
| Less than High School | $33,995 | $32,738 |
| High School Diploma | $34,917 | $29,626 |
| College or Associate's Degree | $33,931 | $35,262 |
| Bachelor's Degree | $56,787 | $50,000 |
| Graduate Degree | $93,068 | $94,688 |
| Total | $51,375 | $37,071 |
Family Income in Iona
Family Income Brackets in Iona
According to the Iona family income data, there are 1,046 families falling into the $50,000 to $74,999 income range, which is the most common income bracket and makes up 24.1% of all families. Conversely, the less than $10,000 income bracket is the least frequent group with only 52 families (1.2%) belonging to this category.
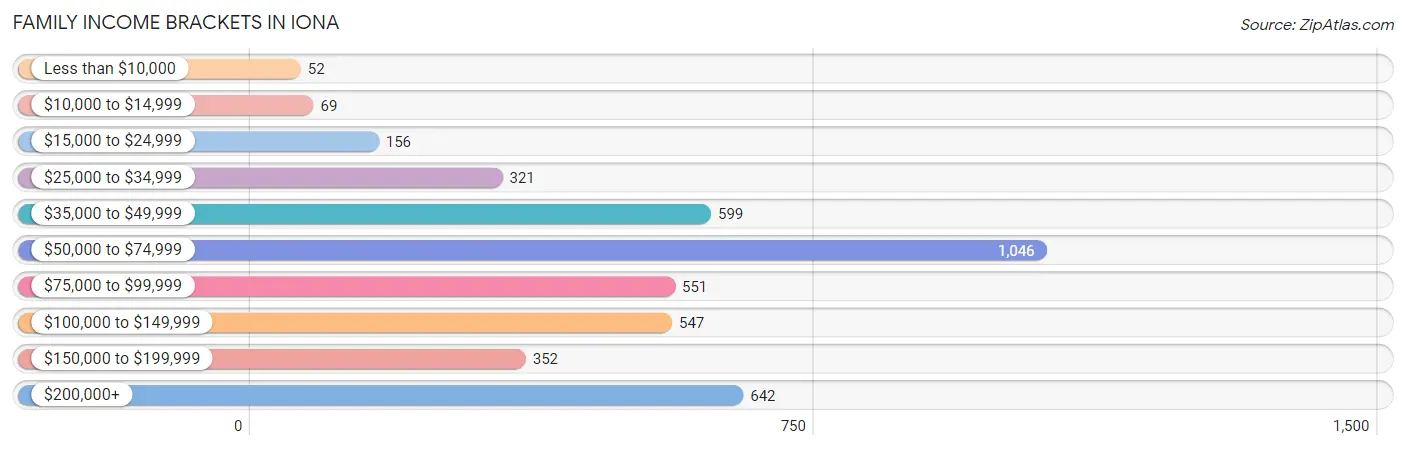
| Income Bracket | # Families | % Families |
| Less than $10,000 | 52 | 1.2% |
| $10,000 to $14,999 | 69 | 1.6% |
| $15,000 to $24,999 | 156 | 3.6% |
| $25,000 to $34,999 | 321 | 7.4% |
| $35,000 to $49,999 | 599 | 13.8% |
| $50,000 to $74,999 | 1,046 | 24.1% |
| $75,000 to $99,999 | 551 | 12.7% |
| $100,000 to $149,999 | 547 | 12.6% |
| $150,000 to $199,999 | 352 | 8.1% |
| $200,000+ | 642 | 14.8% |
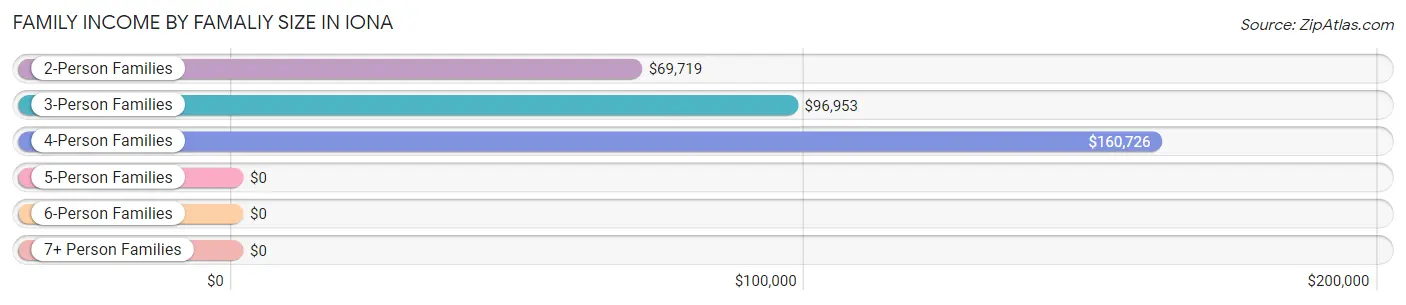
Family Income by Famaliy Size in Iona
4-person families (202 | 4.6%) account for the highest median family income in Iona with $160,726 per family, while 4-person families (202 | 4.6%) have the highest median income of $40,182 per family member.
| Income Bracket | # Families | Median Income |
| 2-Person Families | 3,778 (87.0%) | $69,719 |
| 3-Person Families | 353 (8.1%) | $96,953 |
| 4-Person Families | 202 (4.6%) | $160,726 |
| 5-Person Families | 8 (0.2%) | $0 |
| 6-Person Families | 0 (0.0%) | $0 |
| 7+ Person Families | 0 (0.0%) | $0 |
| Total | 4,341 (100.0%) | $73,137 |
Family Income by Number of Earners in Iona
The median family income in Iona is $73,137, with families comprising 3+ earners (127) having the highest median family income of $156,125, while families with no earners (2,135) have the lowest median family income of $62,399, accounting for 2.9% and 49.2% of families, respectively.
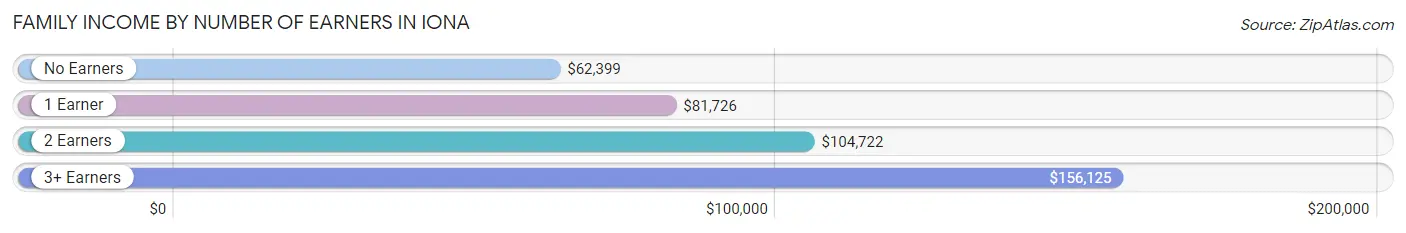
| Number of Earners | # Families | Median Income |
| No Earners | 2,135 (49.2%) | $62,399 |
| 1 Earner | 1,215 (28.0%) | $81,726 |
| 2 Earners | 864 (19.9%) | $104,722 |
| 3+ Earners | 127 (2.9%) | $156,125 |
| Total | 4,341 (100.0%) | $73,137 |
Household Income in Iona
Household Income Brackets in Iona
With 1,780 households falling in the category, the $50,000 to $74,999 income range is the most frequent in Iona, accounting for 22.7% of all households. In contrast, only 314 households (4.0%) fall into the less than $10,000 income bracket, making it the least populous group.
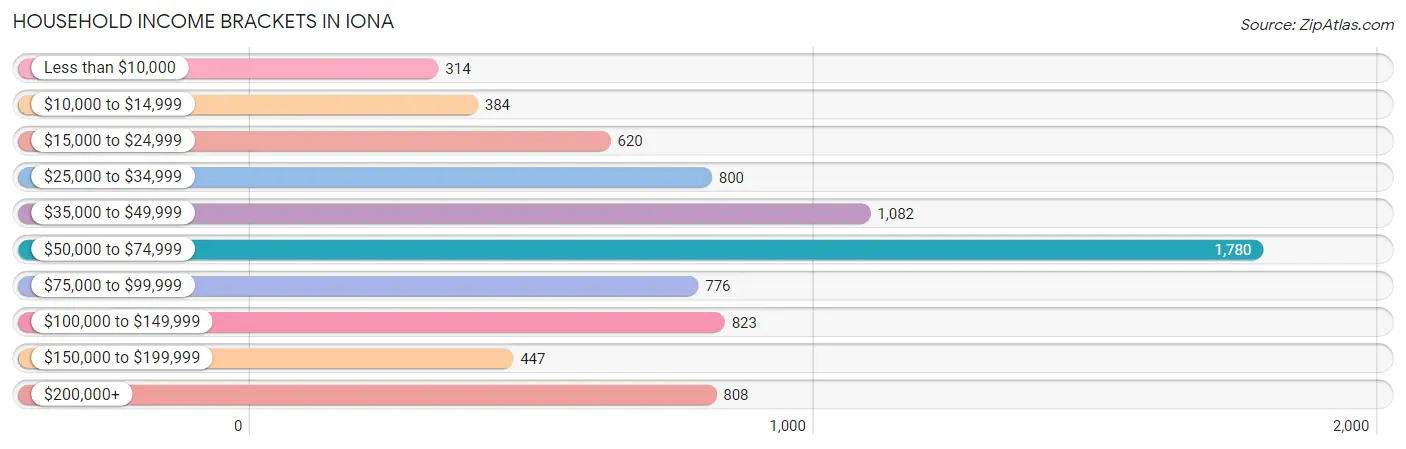
| Income Bracket | # Households | % Households |
| Less than $10,000 | 314 | 4.0% |
| $10,000 to $14,999 | 384 | 4.9% |
| $15,000 to $24,999 | 620 | 7.9% |
| $25,000 to $34,999 | 800 | 10.2% |
| $35,000 to $49,999 | 1,082 | 13.8% |
| $50,000 to $74,999 | 1,780 | 22.7% |
| $75,000 to $99,999 | 776 | 9.9% |
| $100,000 to $149,999 | 823 | 10.5% |
| $150,000 to $199,999 | 447 | 5.7% |
| $200,000+ | 808 | 10.3% |
Household Income by Householder Age in Iona
The median household income in Iona is $62,655, with the highest median household income of $73,362 found in the 45 to 64 years age bracket for the primary householder. A total of 1,905 households (24.3%) fall into this category. Meanwhile, the 15 to 24 years age bracket for the primary householder has the lowest median household income of $0, with 18 households (0.2%) in this group.
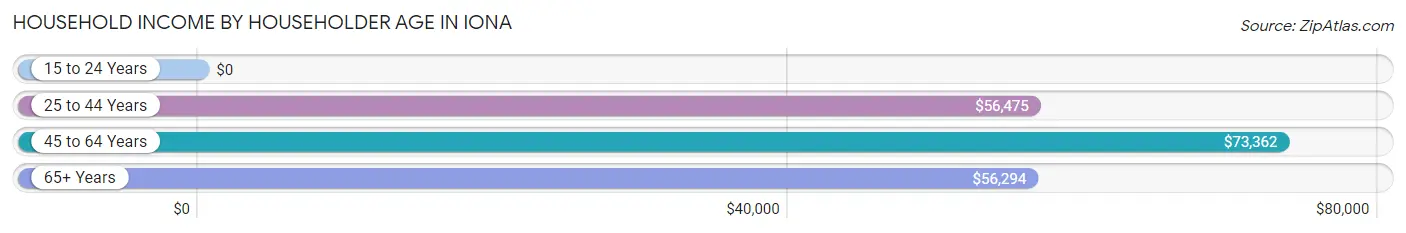
| Income Bracket | # Households | Median Income |
| 15 to 24 Years | 18 (0.2%) | $0 |
| 25 to 44 Years | 742 (9.5%) | $56,475 |
| 45 to 64 Years | 1,905 (24.3%) | $73,362 |
| 65+ Years | 5,177 (66.0%) | $56,294 |
| Total | 7,842 (100.0%) | $62,655 |
Poverty in Iona
Income Below Poverty by Sex and Age in Iona
With 5.0% poverty level for males and 8.3% for females among the residents of Iona, 16 and 17 year old males and 15 year old females are the most vulnerable to poverty, with 46 males (53.5%) and 7 females (25.0%) in their respective age groups living below the poverty level.
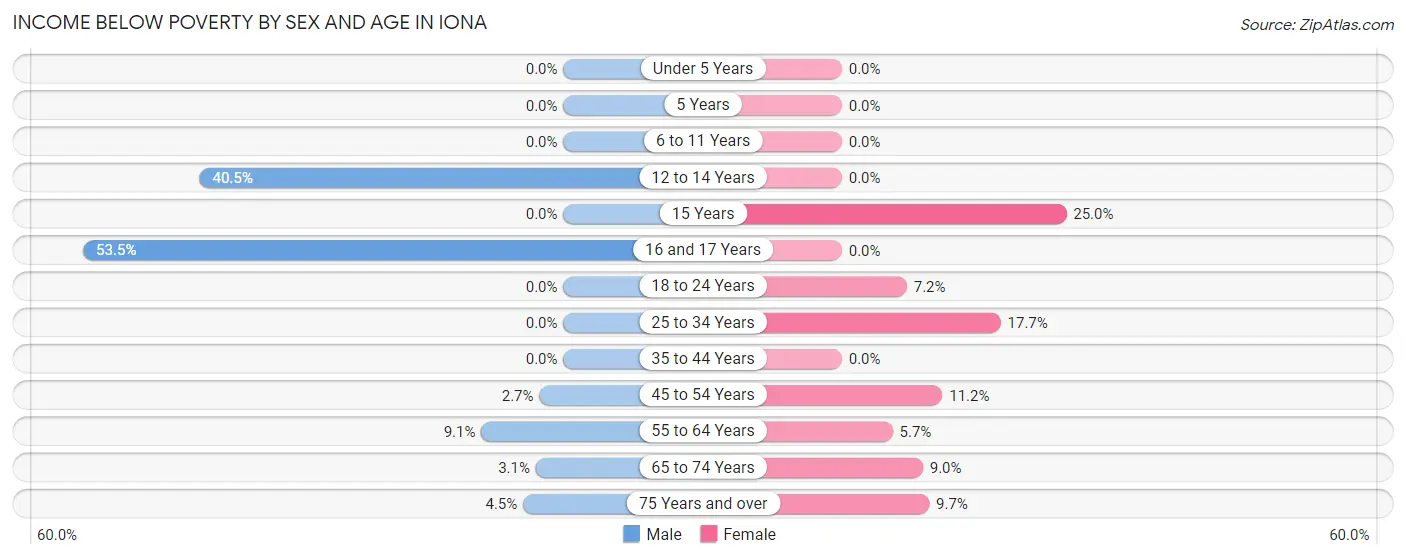
| Age Bracket | Male | Female |
| Under 5 Years | 0 (0.0%) | 0 (0.0%) |
| 5 Years | 0 (0.0%) | 0 (0.0%) |
| 6 to 11 Years | 0 (0.0%) | 0 (0.0%) |
| 12 to 14 Years | 32 (40.5%) | 0 (0.0%) |
| 15 Years | 0 (0.0%) | 7 (25.0%) |
| 16 and 17 Years | 46 (53.5%) | 0 (0.0%) |
| 18 to 24 Years | 0 (0.0%) | 11 (7.2%) |
| 25 to 34 Years | 0 (0.0%) | 52 (17.7%) |
| 35 to 44 Years | 0 (0.0%) | 0 (0.0%) |
| 45 to 54 Years | 16 (2.7%) | 67 (11.2%) |
| 55 to 64 Years | 83 (9.1%) | 76 (5.7%) |
| 65 to 74 Years | 49 (3.1%) | 166 (9.0%) |
| 75 Years and over | 99 (4.5%) | 242 (9.7%) |
| Total | 325 (5.0%) | 621 (8.3%) |
Income Above Poverty by Sex and Age in Iona
According to the poverty statistics in Iona, males aged under 5 years and females aged under 5 years are the age groups that are most secure financially, with 100.0% of males and 100.0% of females in these age groups living above the poverty line.
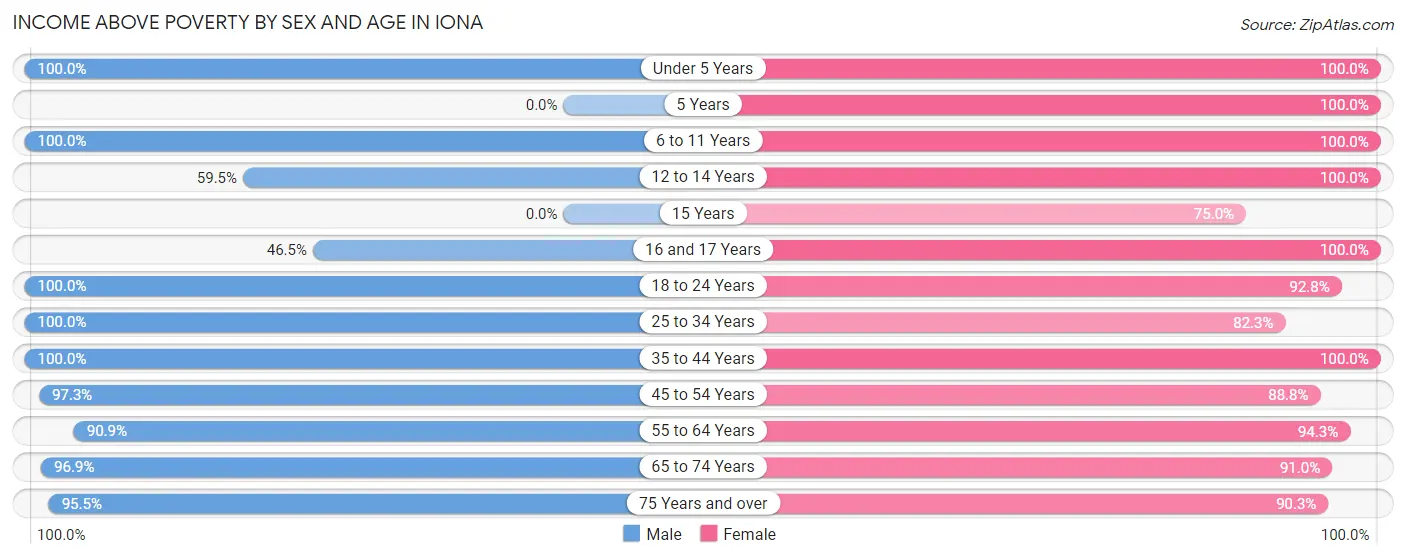
| Age Bracket | Male | Female |
| Under 5 Years | 48 (100.0%) | 125 (100.0%) |
| 5 Years | 0 (0.0%) | 44 (100.0%) |
| 6 to 11 Years | 24 (100.0%) | 70 (100.0%) |
| 12 to 14 Years | 47 (59.5%) | 91 (100.0%) |
| 15 Years | 0 (0.0%) | 21 (75.0%) |
| 16 and 17 Years | 40 (46.5%) | 24 (100.0%) |
| 18 to 24 Years | 237 (100.0%) | 141 (92.8%) |
| 25 to 34 Years | 296 (100.0%) | 242 (82.3%) |
| 35 to 44 Years | 361 (100.0%) | 411 (100.0%) |
| 45 to 54 Years | 583 (97.3%) | 532 (88.8%) |
| 55 to 64 Years | 825 (90.9%) | 1,266 (94.3%) |
| 65 to 74 Years | 1,548 (96.9%) | 1,675 (91.0%) |
| 75 Years and over | 2,112 (95.5%) | 2,248 (90.3%) |
| Total | 6,121 (95.0%) | 6,890 (91.7%) |
Income Below Poverty Among Married-Couple Families in Iona
The poverty statistics for married-couple families in Iona show that 3.0% or 118 of the total 3,976 families live below the poverty line. Families with no children have the highest poverty rate of 3.1%, comprising of 118 families. On the other hand, families with 1 or 2 children have the lowest poverty rate of 0.0%, which includes 0 families.
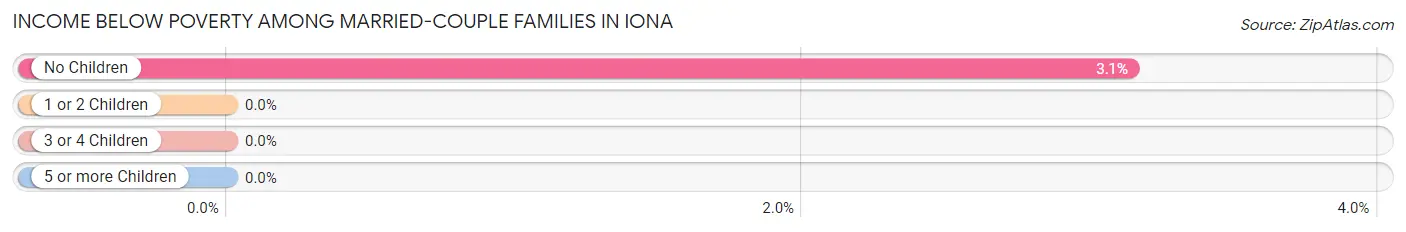
| Children | Above Poverty | Below Poverty |
| No Children | 3,643 (96.9%) | 118 (3.1%) |
| 1 or 2 Children | 215 (100.0%) | 0 (0.0%) |
| 3 or 4 Children | 0 (0.0%) | 0 (0.0%) |
| 5 or more Children | 0 (0.0%) | 0 (0.0%) |
| Total | 3,858 (97.0%) | 118 (3.0%) |
Income Below Poverty Among Single-Parent Households in Iona
According to the poverty data in Iona, 15.1% or 5 single-father households and 8.7% or 29 single-mother households are living below the poverty line. Among single-father households, those with 1 or 2 children have the highest poverty rate, with 5 households (100.0%) experiencing poverty. Likewise, among single-mother households, those with 1 or 2 children have the highest poverty rate, with 29 households (18.2%) falling below the poverty line.
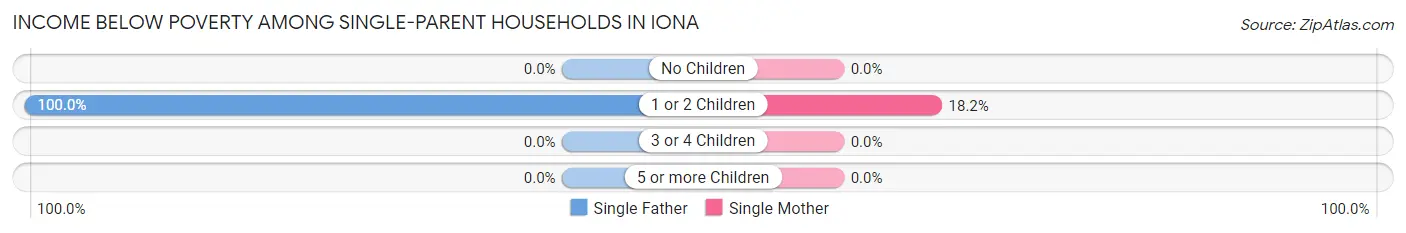
| Children | Single Father | Single Mother |
| No Children | 0 (0.0%) | 0 (0.0%) |
| 1 or 2 Children | 5 (100.0%) | 29 (18.2%) |
| 3 or 4 Children | 0 (0.0%) | 0 (0.0%) |
| 5 or more Children | 0 (0.0%) | 0 (0.0%) |
| Total | 5 (15.1%) | 29 (8.7%) |
Income Below Poverty Among Married-Couple vs Single-Parent Households in Iona
The poverty data for Iona shows that 118 of the married-couple family households (3.0%) and 34 of the single-parent households (9.3%) are living below the poverty level. Within the married-couple family households, those with no children have the highest poverty rate, with 118 households (3.1%) falling below the poverty line. Among the single-parent households, those with 1 or 2 children have the highest poverty rate, with 34 household (20.7%) living below poverty.
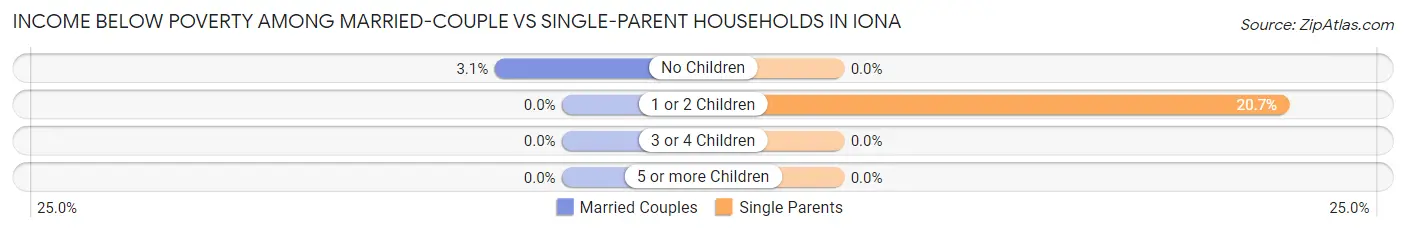
| Children | Married-Couple Families | Single-Parent Households |
| No Children | 118 (3.1%) | 0 (0.0%) |
| 1 or 2 Children | 0 (0.0%) | 34 (20.7%) |
| 3 or 4 Children | 0 (0.0%) | 0 (0.0%) |
| 5 or more Children | 0 (0.0%) | 0 (0.0%) |
| Total | 118 (3.0%) | 34 (9.3%) |
Race in Iona
The most populous races in Iona are White / Caucasian (13,267 | 92.8%), Hispanic or Latino (472 | 3.3%), and Two or more Races (463 | 3.2%).
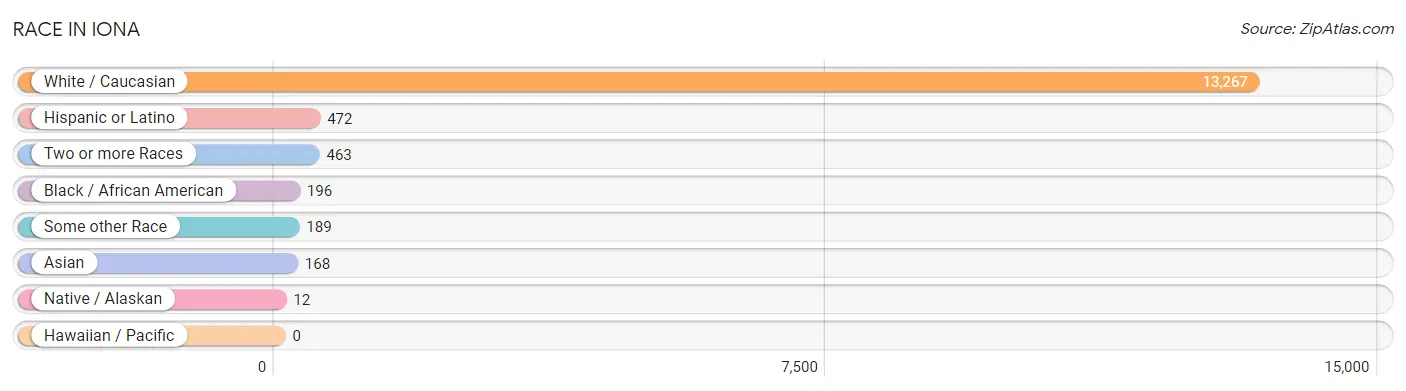
| Race | # Population | % Population |
| Asian | 168 | 1.2% |
| Black / African American | 196 | 1.4% |
| Hawaiian / Pacific | 0 | 0.0% |
| Hispanic or Latino | 472 | 3.3% |
| Native / Alaskan | 12 | 0.1% |
| White / Caucasian | 13,267 | 92.8% |
| Two or more Races | 463 | 3.2% |
| Some other Race | 189 | 1.3% |
| Total | 14,295 | 100.0% |
Ancestry in Iona
The most populous ancestries reported in Iona are German (2,696 | 18.9%), American (2,594 | 18.1%), English (1,755 | 12.3%), Irish (1,692 | 11.8%), and Italian (1,012 | 7.1%), together accounting for 68.2% of all Iona residents.
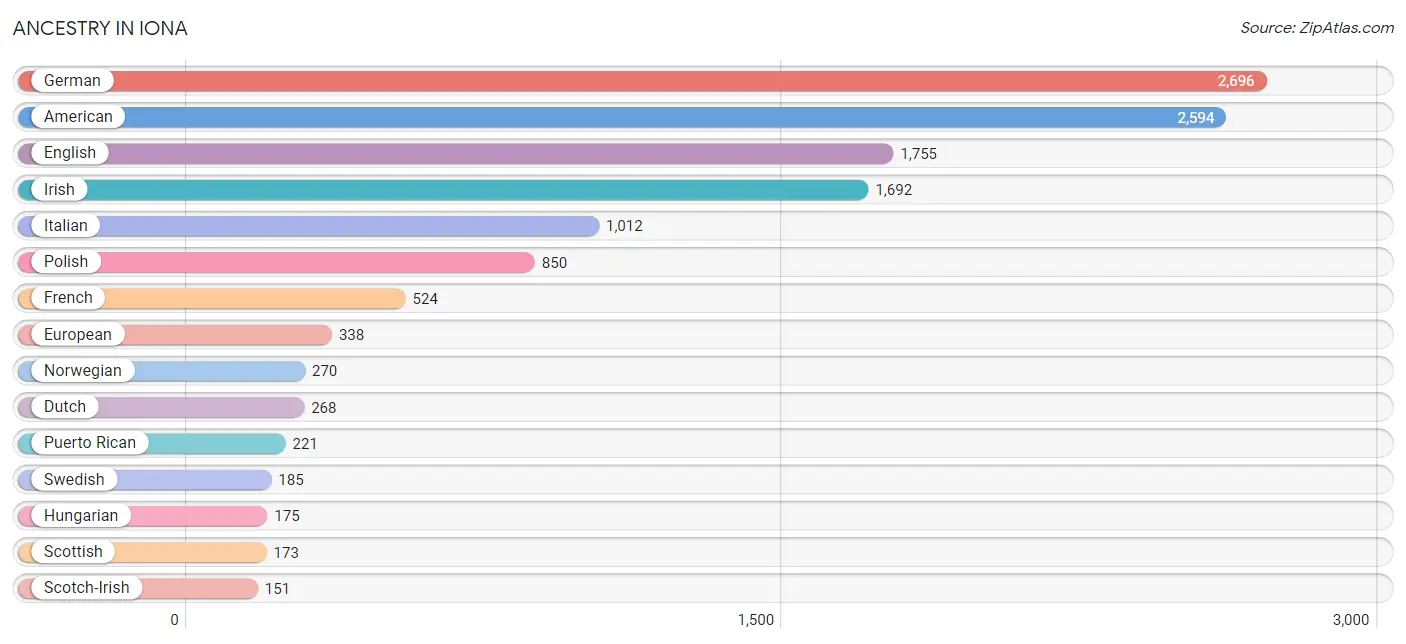
| Ancestry | # Population | % Population |
| African | 12 | 0.1% |
| American | 2,594 | 18.1% |
| Arab | 17 | 0.1% |
| Argentinean | 11 | 0.1% |
| Armenian | 90 | 0.6% |
| Austrian | 63 | 0.4% |
| Belgian | 15 | 0.1% |
| Bhutanese | 11 | 0.1% |
| Brazilian | 7 | 0.1% |
| British | 88 | 0.6% |
| Burmese | 23 | 0.2% |
| Canadian | 75 | 0.5% |
| Celtic | 10 | 0.1% |
| Central American | 78 | 0.5% |
| Central American Indian | 11 | 0.1% |
| Cherokee | 9 | 0.1% |
| Colombian | 31 | 0.2% |
| Croatian | 21 | 0.2% |
| Cuban | 50 | 0.4% |
| Czech | 28 | 0.2% |
| Czechoslovakian | 43 | 0.3% |
| Danish | 133 | 0.9% |
| Dutch | 268 | 1.9% |
| Eastern European | 12 | 0.1% |
| English | 1,755 | 12.3% |
| European | 338 | 2.4% |
| Finnish | 36 | 0.3% |
| French | 524 | 3.7% |
| French Canadian | 56 | 0.4% |
| German | 2,696 | 18.9% |
| German Russian | 11 | 0.1% |
| Greek | 78 | 0.5% |
| Guatemalan | 49 | 0.3% |
| Haitian | 90 | 0.6% |
| Honduran | 29 | 0.2% |
| Hungarian | 175 | 1.2% |
| Indian (Asian) | 41 | 0.3% |
| Irish | 1,692 | 11.8% |
| Italian | 1,012 | 7.1% |
| Korean | 109 | 0.8% |
| Lebanese | 13 | 0.1% |
| Lithuanian | 30 | 0.2% |
| Luxembourger | 8 | 0.1% |
| Malaysian | 11 | 0.1% |
| Mexican | 41 | 0.3% |
| Northern European | 18 | 0.1% |
| Norwegian | 270 | 1.9% |
| Pakistani | 13 | 0.1% |
| Palestinian | 4 | 0.0% |
| Peruvian | 9 | 0.1% |
| Polish | 850 | 5.9% |
| Portuguese | 54 | 0.4% |
| Puerto Rican | 221 | 1.5% |
| Romanian | 10 | 0.1% |
| Russian | 129 | 0.9% |
| Scandinavian | 27 | 0.2% |
| Scotch-Irish | 151 | 1.1% |
| Scottish | 173 | 1.2% |
| Slovak | 27 | 0.2% |
| Slovene | 11 | 0.1% |
| South American | 63 | 0.4% |
| Subsaharan African | 12 | 0.1% |
| Swedish | 185 | 1.3% |
| Swiss | 137 | 1.0% |
| Ukrainian | 28 | 0.2% |
| Venezuelan | 12 | 0.1% |
| Welsh | 99 | 0.7% | View All 67 Rows |
Immigrants in Iona
The most numerous immigrant groups reported in Iona came from Europe (486 | 3.4%), Latin America (348 | 2.4%), Asia (340 | 2.4%), Western Europe (292 | 2.0%), and Canada (173 | 1.2%), together accounting for 11.5% of all Iona residents.
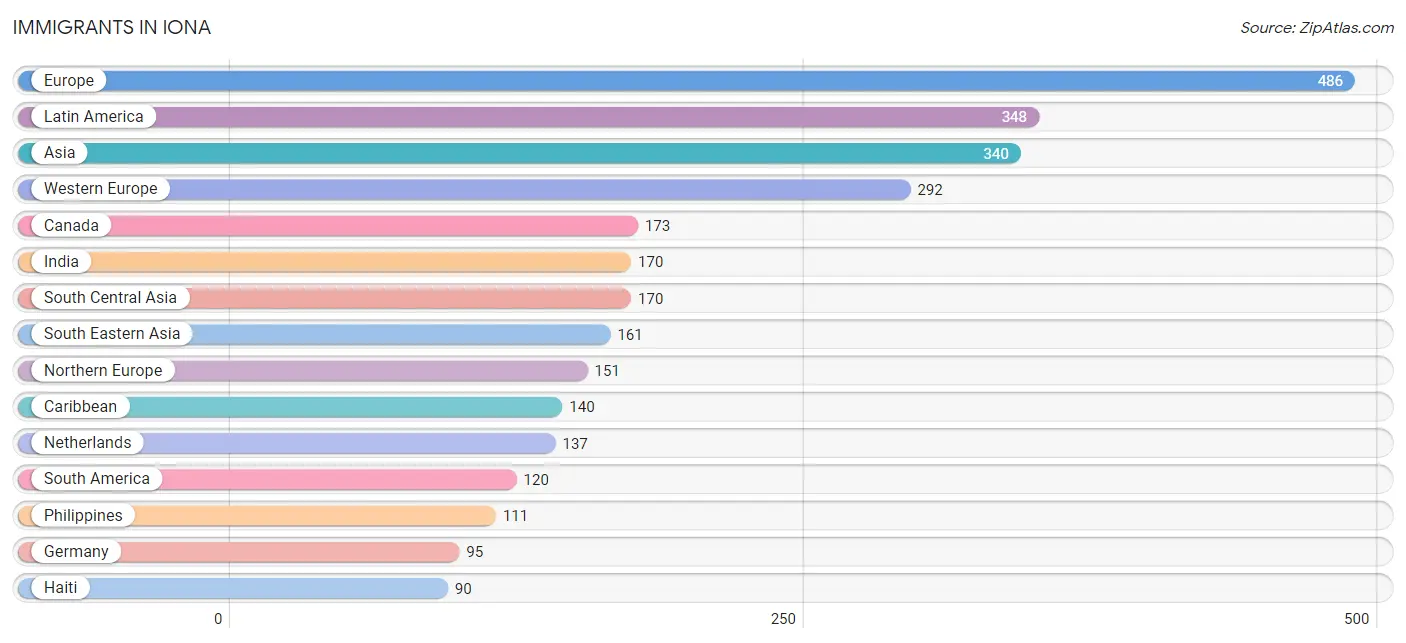
| Immigration Origin | # Population | % Population |
| Africa | 21 | 0.2% |
| Argentina | 21 | 0.2% |
| Asia | 340 | 2.4% |
| Austria | 52 | 0.4% |
| Brazil | 6 | 0.0% |
| Canada | 173 | 1.2% |
| Caribbean | 140 | 1.0% |
| Central America | 88 | 0.6% |
| China | 9 | 0.1% |
| Colombia | 31 | 0.2% |
| Cuba | 32 | 0.2% |
| Czechoslovakia | 9 | 0.1% |
| Eastern Asia | 9 | 0.1% |
| Eastern Europe | 43 | 0.3% |
| England | 26 | 0.2% |
| Europe | 486 | 3.4% |
| Germany | 95 | 0.7% |
| Guatemala | 49 | 0.3% |
| Haiti | 90 | 0.6% |
| Honduras | 29 | 0.2% |
| Hong Kong | 9 | 0.1% |
| Hungary | 22 | 0.2% |
| India | 170 | 1.2% |
| Ireland | 42 | 0.3% |
| Jamaica | 18 | 0.1% |
| Laos | 11 | 0.1% |
| Latin America | 348 | 2.4% |
| Malaysia | 11 | 0.1% |
| Mexico | 10 | 0.1% |
| Netherlands | 137 | 1.0% |
| Northern Europe | 151 | 1.1% |
| Norway | 10 | 0.1% |
| Peru | 9 | 0.1% |
| Philippines | 111 | 0.8% |
| Russia | 12 | 0.1% |
| South Africa | 9 | 0.1% |
| South America | 120 | 0.8% |
| South Central Asia | 170 | 1.2% |
| South Eastern Asia | 161 | 1.1% |
| Switzerland | 8 | 0.1% |
| Thailand | 13 | 0.1% |
| Venezuela | 53 | 0.4% |
| Vietnam | 15 | 0.1% |
| Western Africa | 12 | 0.1% |
| Western Europe | 292 | 2.0% | View All 45 Rows |
Sex and Age in Iona
Sex and Age in Iona
The most populous age groups in Iona are 65 to 69 Years (841 | 12.9%) for men and 65 to 69 Years (1,010 | 13.0%) for women.
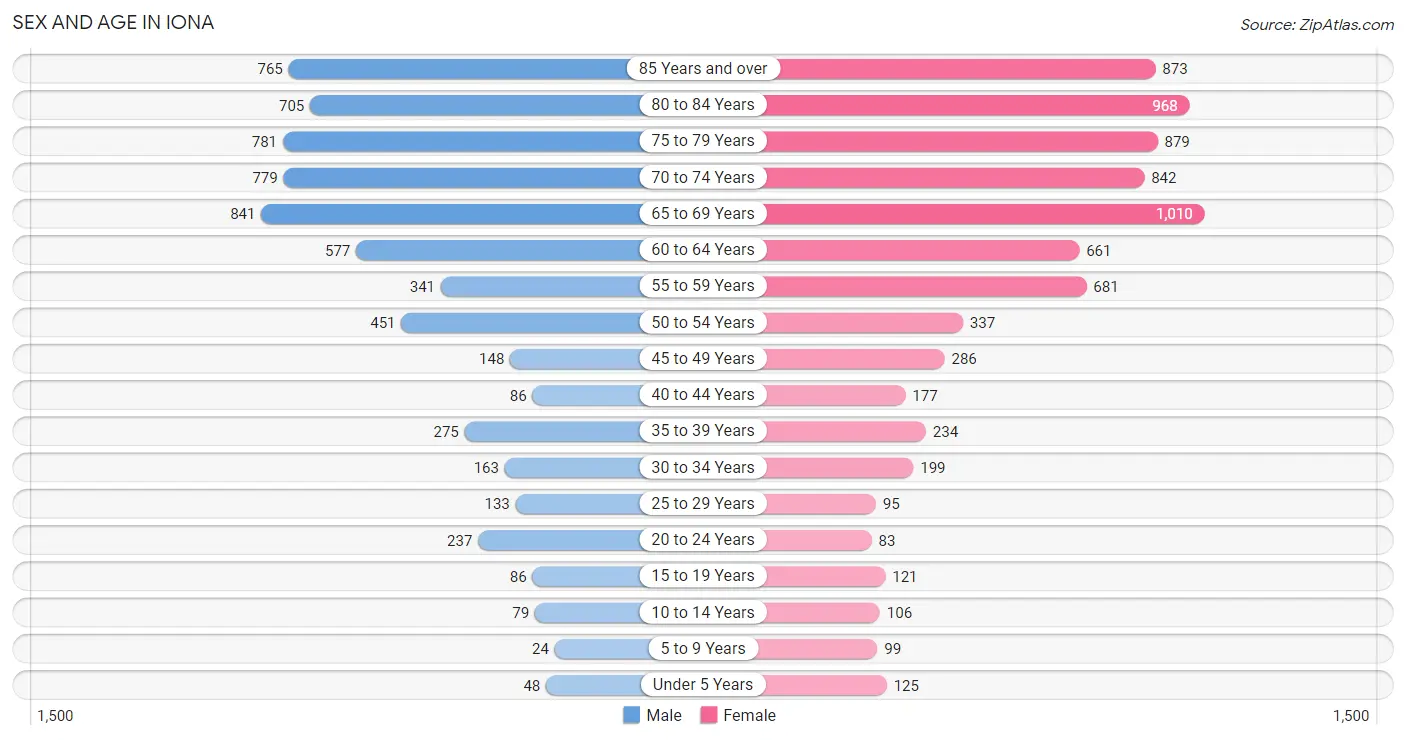
| Age Bracket | Male | Female |
| Under 5 Years | 48 (0.7%) | 125 (1.6%) |
| 5 to 9 Years | 24 (0.4%) | 99 (1.3%) |
| 10 to 14 Years | 79 (1.2%) | 106 (1.4%) |
| 15 to 19 Years | 86 (1.3%) | 121 (1.6%) |
| 20 to 24 Years | 237 (3.6%) | 83 (1.1%) |
| 25 to 29 Years | 133 (2.0%) | 95 (1.2%) |
| 30 to 34 Years | 163 (2.5%) | 199 (2.6%) |
| 35 to 39 Years | 275 (4.2%) | 234 (3.0%) |
| 40 to 44 Years | 86 (1.3%) | 177 (2.3%) |
| 45 to 49 Years | 148 (2.3%) | 286 (3.7%) |
| 50 to 54 Years | 451 (6.9%) | 337 (4.3%) |
| 55 to 59 Years | 341 (5.2%) | 681 (8.8%) |
| 60 to 64 Years | 577 (8.8%) | 661 (8.5%) |
| 65 to 69 Years | 841 (12.9%) | 1,010 (13.0%) |
| 70 to 74 Years | 779 (11.9%) | 842 (10.8%) |
| 75 to 79 Years | 781 (12.0%) | 879 (11.3%) |
| 80 to 84 Years | 705 (10.8%) | 968 (12.4%) |
| 85 Years and over | 765 (11.7%) | 873 (11.2%) |
| Total | 6,519 (100.0%) | 7,776 (100.0%) |
Families and Households in Iona
Median Family Size in Iona
The median family size in Iona is 2.30 persons per family, with single male/father families (33 | 0.8%) accounting for the largest median family size of 3.61 persons per family. On the other hand, married-couple families (3,976 | 91.6%) represent the smallest median family size with 2.26 persons per family.
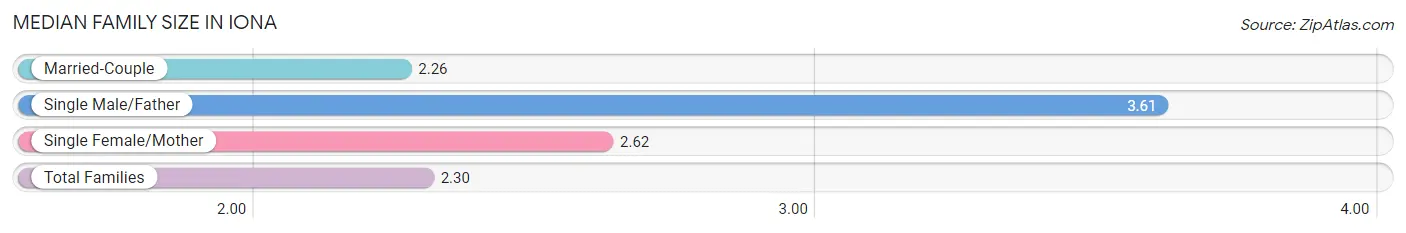
| Family Type | # Families | Family Size |
| Married-Couple | 3,976 (91.6%) | 2.26 |
| Single Male/Father | 33 (0.8%) | 3.61 |
| Single Female/Mother | 332 (7.6%) | 2.62 |
| Total Families | 4,341 (100.0%) | 2.30 |
Median Household Size in Iona
The median household size in Iona is 1.78 persons per household, with single male/father households (33 | 0.4%) accounting for the largest median household size of 4.09 persons per household. non-family households (3,501 | 44.6%) represent the smallest median household size with 1.12 persons per household.
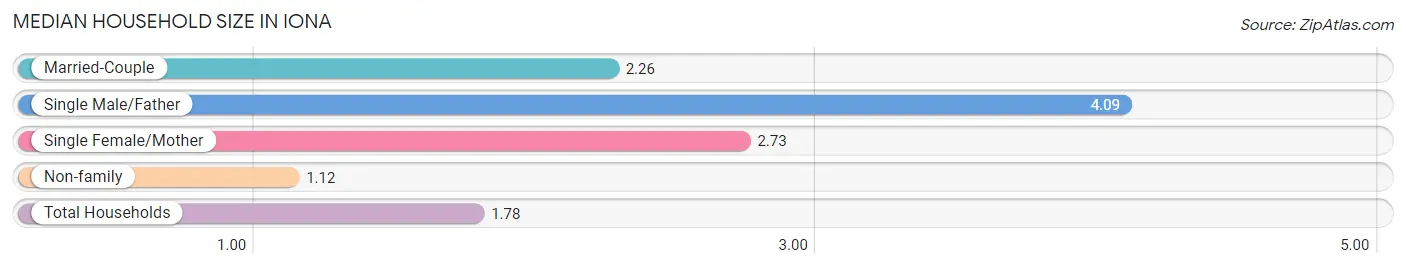
| Household Type | # Households | Household Size |
| Married-Couple | 3,976 (50.7%) | 2.26 |
| Single Male/Father | 33 (0.4%) | 4.09 |
| Single Female/Mother | 332 (4.2%) | 2.73 |
| Non-family | 3,501 (44.6%) | 1.12 |
| Total Households | 7,842 (100.0%) | 1.78 |
Household Size by Marriage Status in Iona
Out of a total of 7,842 households in Iona, 4,341 (55.4%) are family households, while 3,501 (44.6%) are nonfamily households. The most numerous type of family households are 2-person households, comprising 3,740, and the most common type of nonfamily households are 1-person households, comprising 3,166.
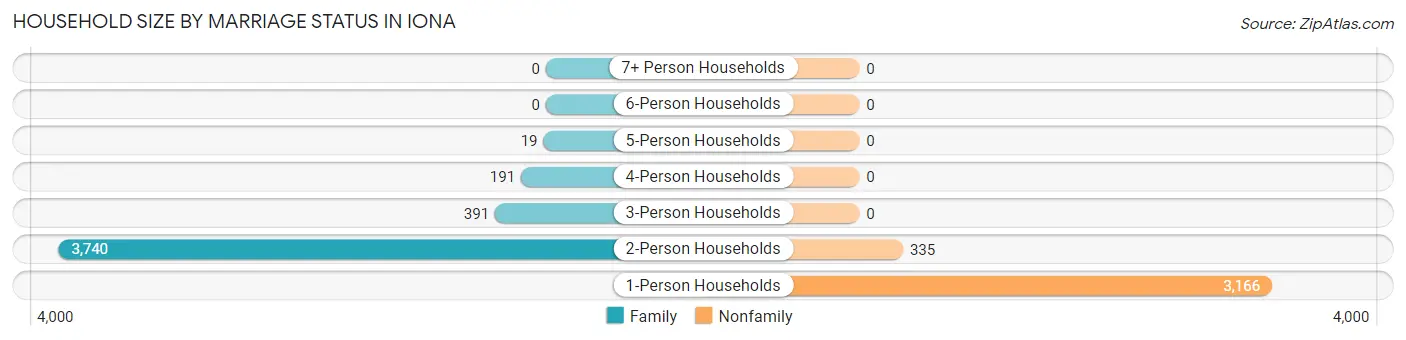
| Household Size | Family Households | Nonfamily Households |
| 1-Person Households | - | 3,166 (40.4%) |
| 2-Person Households | 3,740 (47.7%) | 335 (4.3%) |
| 3-Person Households | 391 (5.0%) | 0 (0.0%) |
| 4-Person Households | 191 (2.4%) | 0 (0.0%) |
| 5-Person Households | 19 (0.2%) | 0 (0.0%) |
| 6-Person Households | 0 (0.0%) | 0 (0.0%) |
| 7+ Person Households | 0 (0.0%) | 0 (0.0%) |
| Total | 4,341 (55.4%) | 3,501 (44.6%) |
Female Fertility in Iona
Fertility by Age in Iona
Average fertility rate in Iona is 6.0 births per 1,000 women. Women in the age bracket of 35 to 50 years have the highest fertility rate with 10.0 births per 1,000 women. Women in the age bracket of 35 to 50 years acount for 100.0% of all women with births.
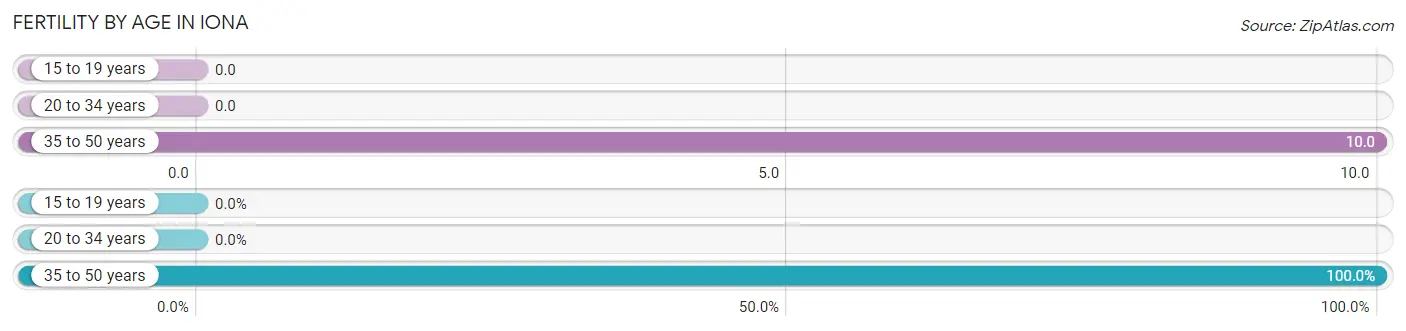
| Age Bracket | Women with Births | Births / 1,000 Women |
| 15 to 19 years | 0 (0.0%) | 0.0 |
| 20 to 34 years | 0 (0.0%) | 0.0 |
| 35 to 50 years | 7 (100.0%) | 10.0 |
| Total | 7 (100.0%) | 6.0 |
Fertility by Age by Marriage Status in Iona
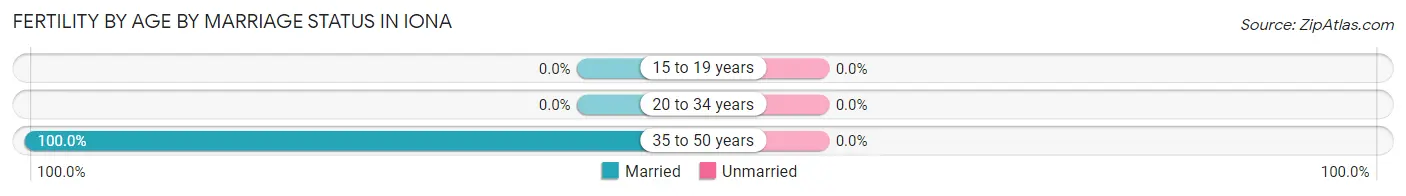
| Age Bracket | Married | Unmarried |
| 15 to 19 years | 0 (0.0%) | 0 (0.0%) |
| 20 to 34 years | 0 (0.0%) | 0 (0.0%) |
| 35 to 50 years | 7 (100.0%) | 0 (0.0%) |
| Total | 7 (100.0%) | 0 (0.0%) |
Fertility by Education in Iona
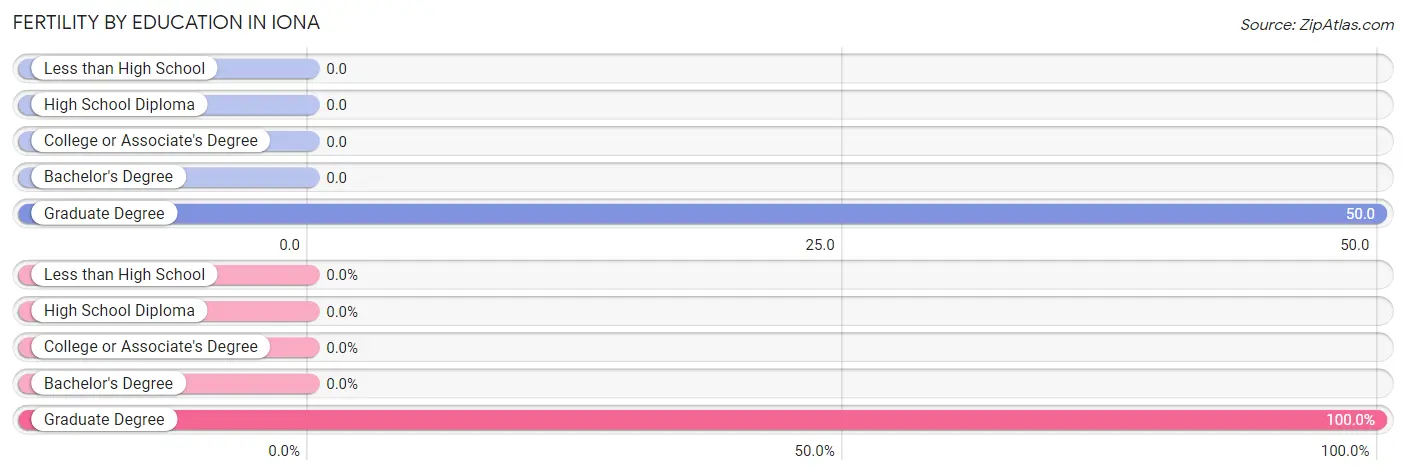
| Educational Attainment | Women with Births | Births / 1,000 Women |
| Less than High School | 0 (0.0%) | 0.0 |
| High School Diploma | 0 (0.0%) | 0.0 |
| College or Associate's Degree | 0 (0.0%) | 0.0 |
| Bachelor's Degree | 0 (0.0%) | 0.0 |
| Graduate Degree | 7 (100.0%) | 50.0 |
| Total | 7 (100.0%) | 6.0 |
Fertility by Education by Marriage Status in Iona
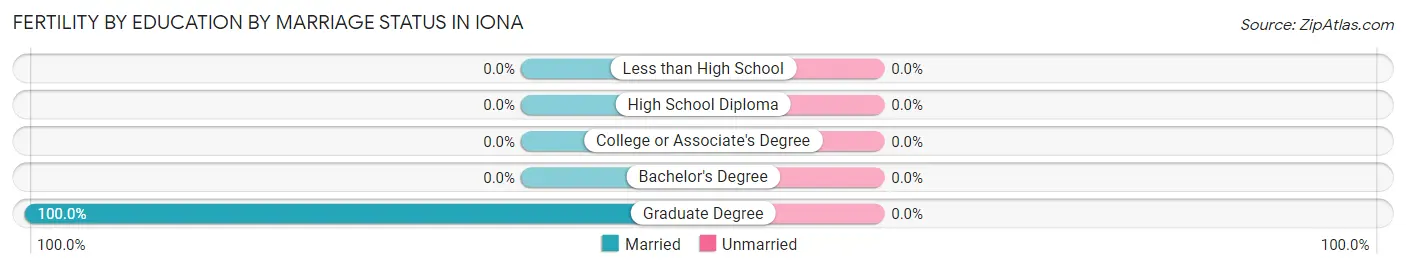
| Educational Attainment | Married | Unmarried |
| Less than High School | 0 (0.0%) | 0 (0.0%) |
| High School Diploma | 0 (0.0%) | 0 (0.0%) |
| College or Associate's Degree | 0 (0.0%) | 0 (0.0%) |
| Bachelor's Degree | 0 (0.0%) | 0 (0.0%) |
| Graduate Degree | 7 (100.0%) | 0 (0.0%) |
| Total | 7 (100.0%) | 0 (0.0%) |
Employment Characteristics in Iona
Employment by Class of Employer in Iona
Among the 4,436 employed individuals in Iona, private company employees (3,106 | 70.0%), self-employed (incorporated) (357 | 8.1%), and self-employed (not incorporated) (326 | 7.3%) make up the most common classes of employment.
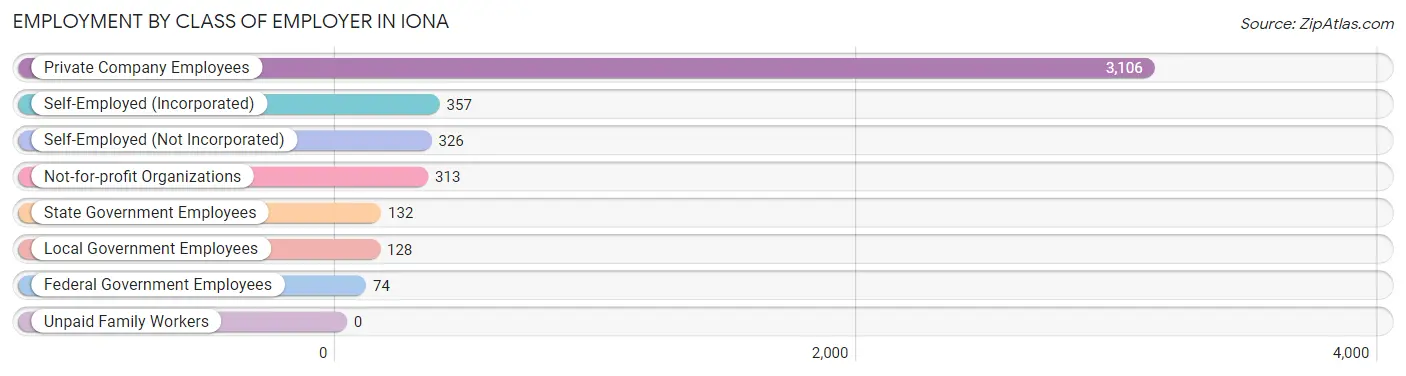
| Employer Class | # Employees | % Employees |
| Private Company Employees | 3,106 | 70.0% |
| Self-Employed (Incorporated) | 357 | 8.1% |
| Self-Employed (Not Incorporated) | 326 | 7.3% |
| Not-for-profit Organizations | 313 | 7.1% |
| Local Government Employees | 128 | 2.9% |
| State Government Employees | 132 | 3.0% |
| Federal Government Employees | 74 | 1.7% |
| Unpaid Family Workers | 0 | 0.0% |
| Total | 4,436 | 100.0% |
Employment Status by Age in Iona
According to the labor force statistics for Iona, out of the total population over 16 years of age (13,786), 34.1% or 4,701 individuals are in the labor force, with 2.5% or 118 of them unemployed. The age group with the highest labor force participation rate is 35 to 44 years, with 94.0% or 726 individuals in the labor force. Within the labor force, the 16 to 19 years age range has the highest percentage of unemployed individuals, with 48.3% or 28 of them being unemployed.
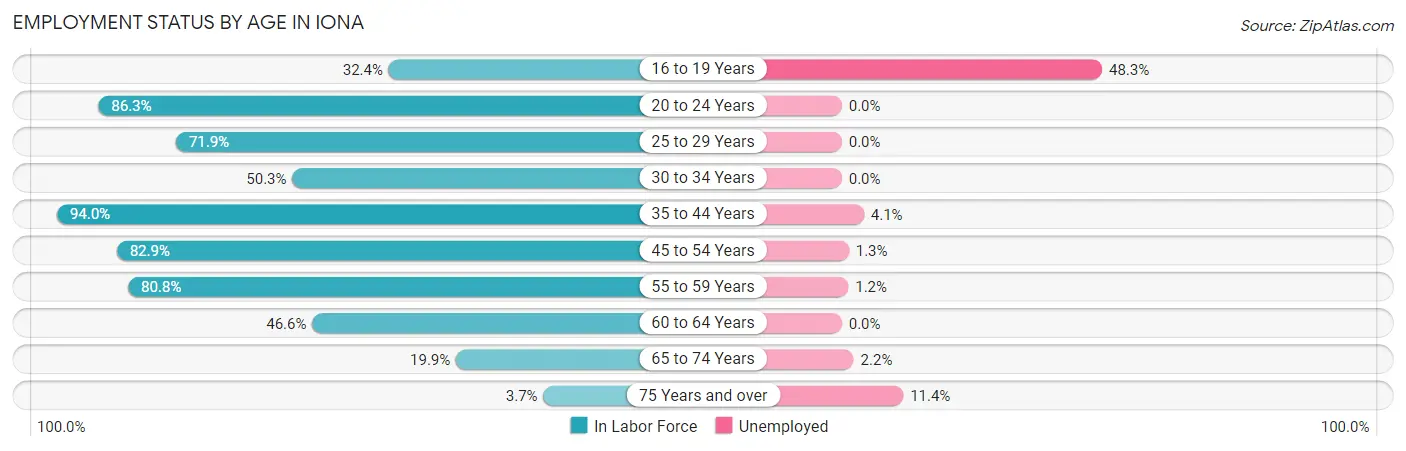
| Age Bracket | In Labor Force | Unemployed |
| 16 to 19 Years | 58 (32.4%) | 28 (48.3%) |
| 20 to 24 Years | 276 (86.3%) | 0 (0.0%) |
| 25 to 29 Years | 164 (71.9%) | 0 (0.0%) |
| 30 to 34 Years | 182 (50.3%) | 0 (0.0%) |
| 35 to 44 Years | 726 (94.0%) | 30 (4.1%) |
| 45 to 54 Years | 1,013 (82.9%) | 13 (1.3%) |
| 55 to 59 Years | 826 (80.8%) | 10 (1.2%) |
| 60 to 64 Years | 577 (46.6%) | 0 (0.0%) |
| 65 to 74 Years | 691 (19.9%) | 15 (2.2%) |
| 75 Years and over | 184 (3.7%) | 21 (11.4%) |
| Total | 4,701 (34.1%) | 118 (2.5%) |
Employment Status by Educational Attainment in Iona
According to labor force statistics for Iona, 72.0% of individuals (3,488) out of the total population between 25 and 64 years of age (4,844) are in the labor force, with 1.5% or 52 of them being unemployed. The group with the highest labor force participation rate are those with the educational attainment of college / associate degree, with 76.4% or 1,194 individuals in the labor force. Within the labor force, individuals with college / associate degree education have the highest percentage of unemployment, with 3.4% or 41 of them being unemployed.
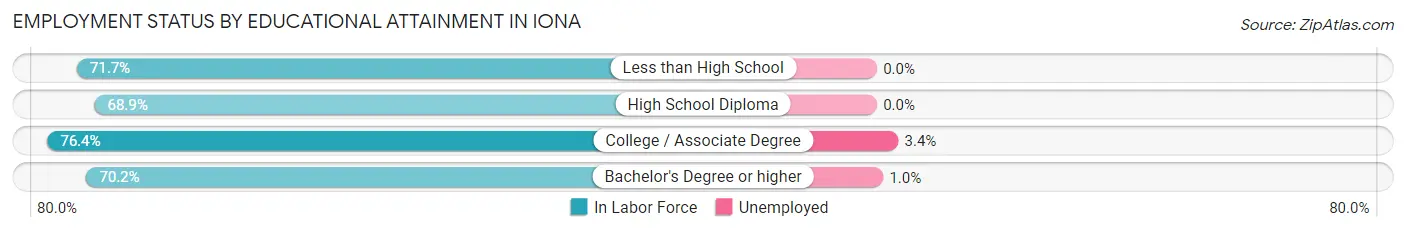
| Educational Attainment | In Labor Force | Unemployed |
| Less than High School | 215 (71.7%) | 0 (0.0%) |
| High School Diploma | 741 (68.9%) | 0 (0.0%) |
| College / Associate Degree | 1,194 (76.4%) | 53 (3.4%) |
| Bachelor's Degree or higher | 1,337 (70.2%) | 19 (1.0%) |
| Total | 3,488 (72.0%) | 73 (1.5%) |
Employment Occupations by Sex in Iona
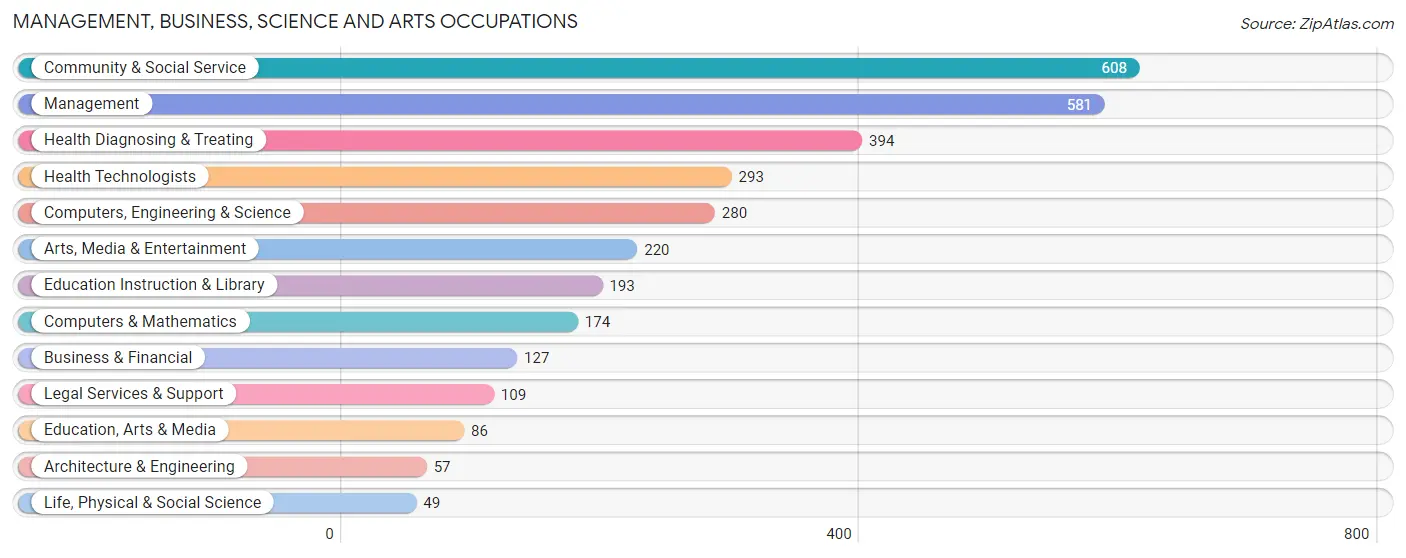
Management, Business, Science and Arts Occupations
The most common Management, Business, Science and Arts occupations in Iona are Community & Social Service (608 | 13.3%), Management (581 | 12.7%), Health Diagnosing & Treating (394 | 8.6%), Health Technologists (293 | 6.4%), and Computers, Engineering & Science (280 | 6.1%).
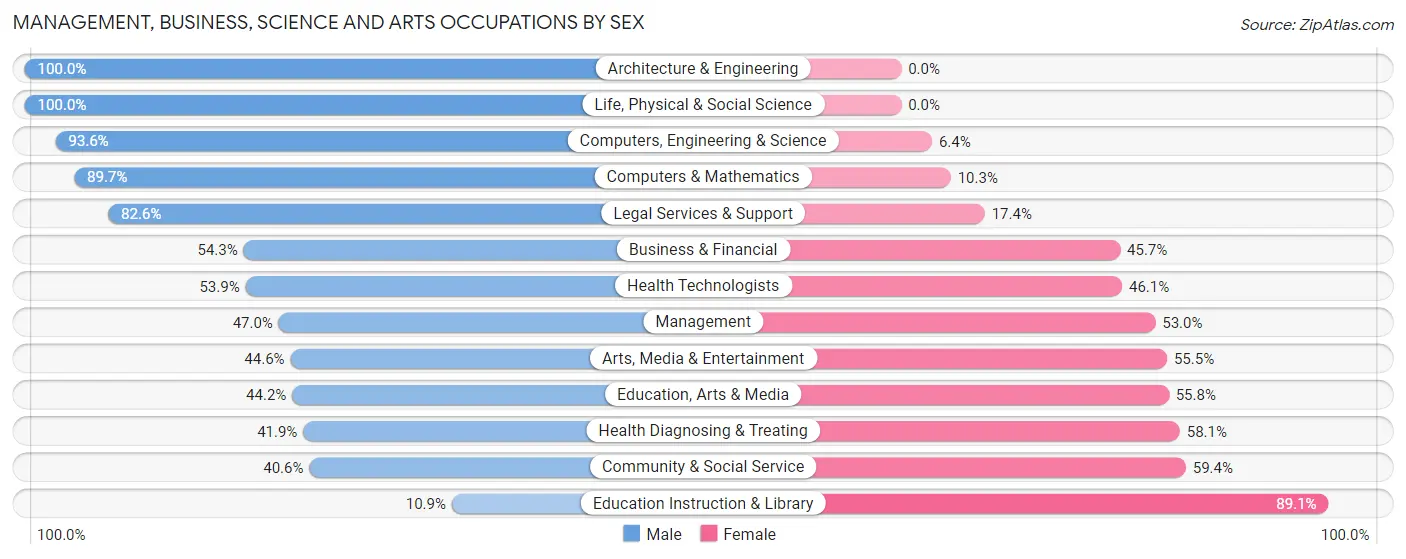
Management, Business, Science and Arts Occupations by Sex
Within the Management, Business, Science and Arts occupations in Iona, the most male-oriented occupations are Architecture & Engineering (100.0%), Life, Physical & Social Science (100.0%), and Computers, Engineering & Science (93.6%), while the most female-oriented occupations are Education Instruction & Library (89.1%), Community & Social Service (59.4%), and Health Diagnosing & Treating (58.1%).
| Occupation | Male | Female |
| Management | 273 (47.0%) | 308 (53.0%) |
| Business & Financial | 69 (54.3%) | 58 (45.7%) |
| Computers, Engineering & Science | 262 (93.6%) | 18 (6.4%) |
| Computers & Mathematics | 156 (89.7%) | 18 (10.3%) |
| Architecture & Engineering | 57 (100.0%) | 0 (0.0%) |
| Life, Physical & Social Science | 49 (100.0%) | 0 (0.0%) |
| Community & Social Service | 247 (40.6%) | 361 (59.4%) |
| Education, Arts & Media | 38 (44.2%) | 48 (55.8%) |
| Legal Services & Support | 90 (82.6%) | 19 (17.4%) |
| Education Instruction & Library | 21 (10.9%) | 172 (89.1%) |
| Arts, Media & Entertainment | 98 (44.6%) | 122 (55.4%) |
| Health Diagnosing & Treating | 165 (41.9%) | 229 (58.1%) |
| Health Technologists | 158 (53.9%) | 135 (46.1%) |
| Total (Category) | 1,016 (51.1%) | 974 (48.9%) |
| Total (Overall) | 2,339 (51.1%) | 2,242 (48.9%) |
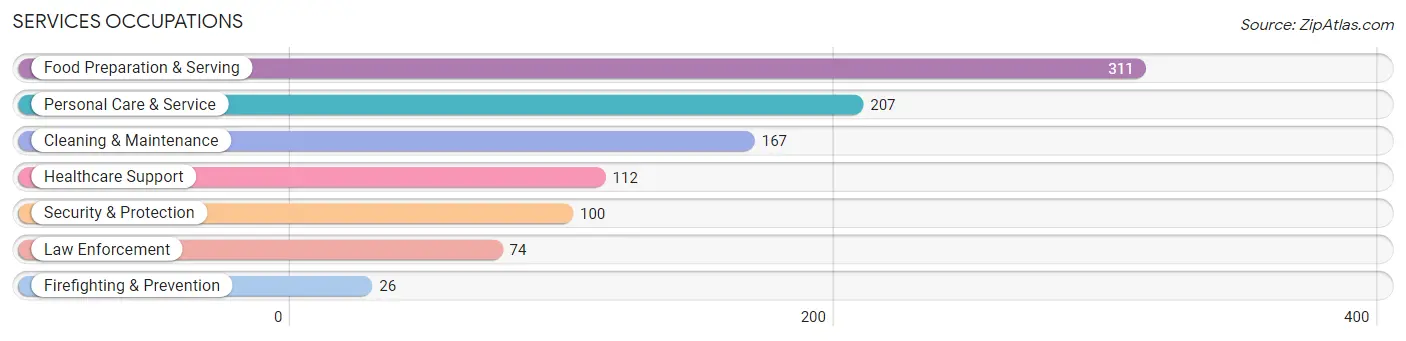
Services Occupations
The most common Services occupations in Iona are Food Preparation & Serving (311 | 6.8%), Personal Care & Service (207 | 4.5%), Cleaning & Maintenance (167 | 3.6%), Healthcare Support (112 | 2.4%), and Security & Protection (100 | 2.2%).
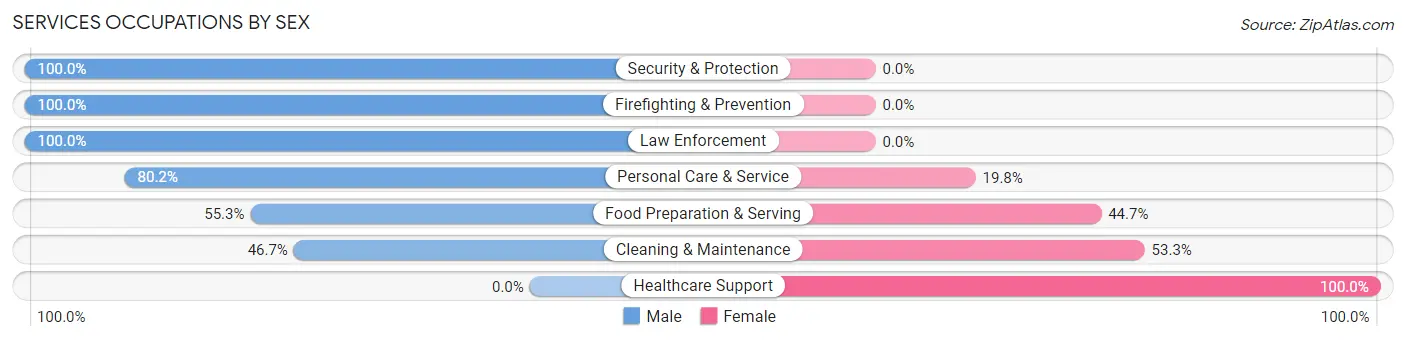
Services Occupations by Sex
Within the Services occupations in Iona, the most male-oriented occupations are Security & Protection (100.0%), Firefighting & Prevention (100.0%), and Law Enforcement (100.0%), while the most female-oriented occupations are Healthcare Support (100.0%), Cleaning & Maintenance (53.3%), and Food Preparation & Serving (44.7%).
| Occupation | Male | Female |
| Healthcare Support | 0 (0.0%) | 112 (100.0%) |
| Security & Protection | 100 (100.0%) | 0 (0.0%) |
| Firefighting & Prevention | 26 (100.0%) | 0 (0.0%) |
| Law Enforcement | 74 (100.0%) | 0 (0.0%) |
| Food Preparation & Serving | 172 (55.3%) | 139 (44.7%) |
| Cleaning & Maintenance | 78 (46.7%) | 89 (53.3%) |
| Personal Care & Service | 166 (80.2%) | 41 (19.8%) |
| Total (Category) | 516 (57.5%) | 381 (42.5%) |
| Total (Overall) | 2,339 (51.1%) | 2,242 (48.9%) |
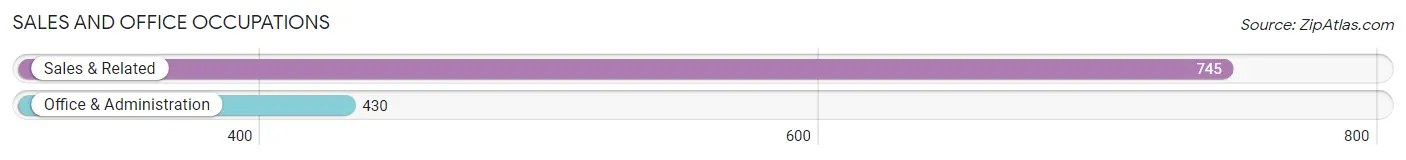
Sales and Office Occupations
The most common Sales and Office occupations in Iona are Sales & Related (745 | 16.3%), and Office & Administration (430 | 9.4%).
Sales and Office Occupations by Sex
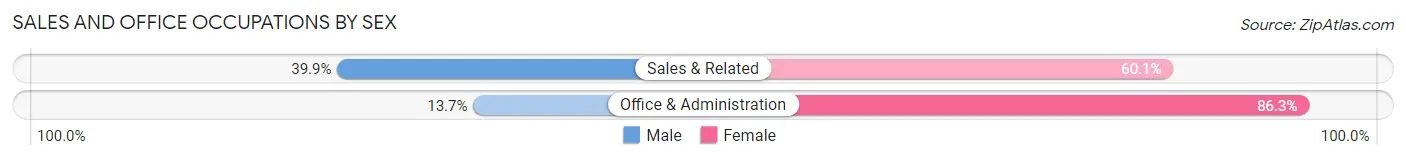
| Occupation | Male | Female |
| Sales & Related | 297 (39.9%) | 448 (60.1%) |
| Office & Administration | 59 (13.7%) | 371 (86.3%) |
| Total (Category) | 356 (30.3%) | 819 (69.7%) |
| Total (Overall) | 2,339 (51.1%) | 2,242 (48.9%) |
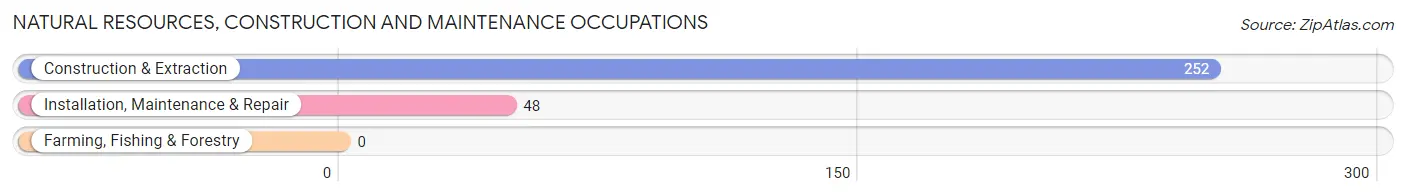
Natural Resources, Construction and Maintenance Occupations
The most common Natural Resources, Construction and Maintenance occupations in Iona are Construction & Extraction (252 | 5.5%), and Installation, Maintenance & Repair (48 | 1.1%).
Natural Resources, Construction and Maintenance Occupations by Sex
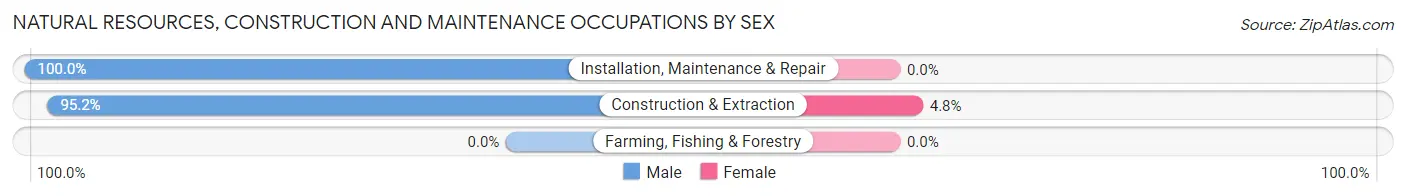
| Occupation | Male | Female |
| Farming, Fishing & Forestry | 0 (0.0%) | 0 (0.0%) |
| Construction & Extraction | 240 (95.2%) | 12 (4.8%) |
| Installation, Maintenance & Repair | 48 (100.0%) | 0 (0.0%) |
| Total (Category) | 288 (96.0%) | 12 (4.0%) |
| Total (Overall) | 2,339 (51.1%) | 2,242 (48.9%) |
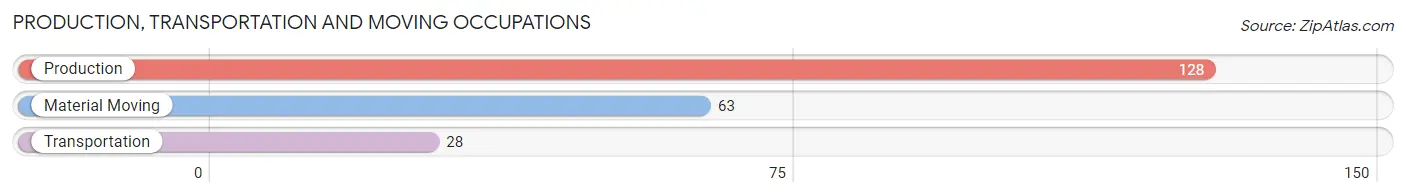
Production, Transportation and Moving Occupations
The most common Production, Transportation and Moving occupations in Iona are Production (128 | 2.8%), Material Moving (63 | 1.4%), and Transportation (28 | 0.6%).
Production, Transportation and Moving Occupations by Sex
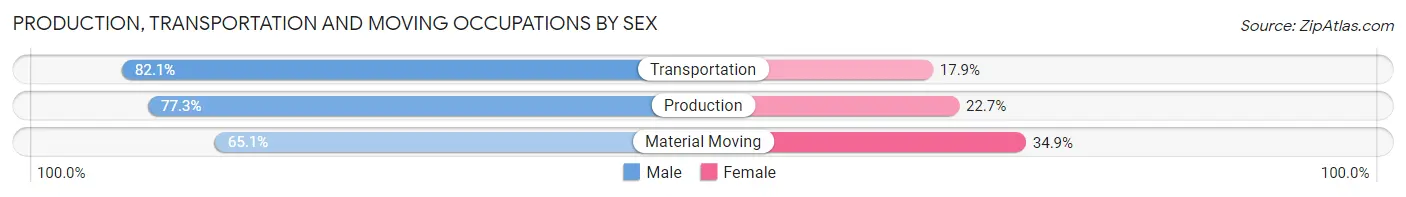
| Occupation | Male | Female |
| Production | 99 (77.3%) | 29 (22.7%) |
| Transportation | 23 (82.1%) | 5 (17.9%) |
| Material Moving | 41 (65.1%) | 22 (34.9%) |
| Total (Category) | 163 (74.4%) | 56 (25.6%) |
| Total (Overall) | 2,339 (51.1%) | 2,242 (48.9%) |
Employment Industries by Sex in Iona
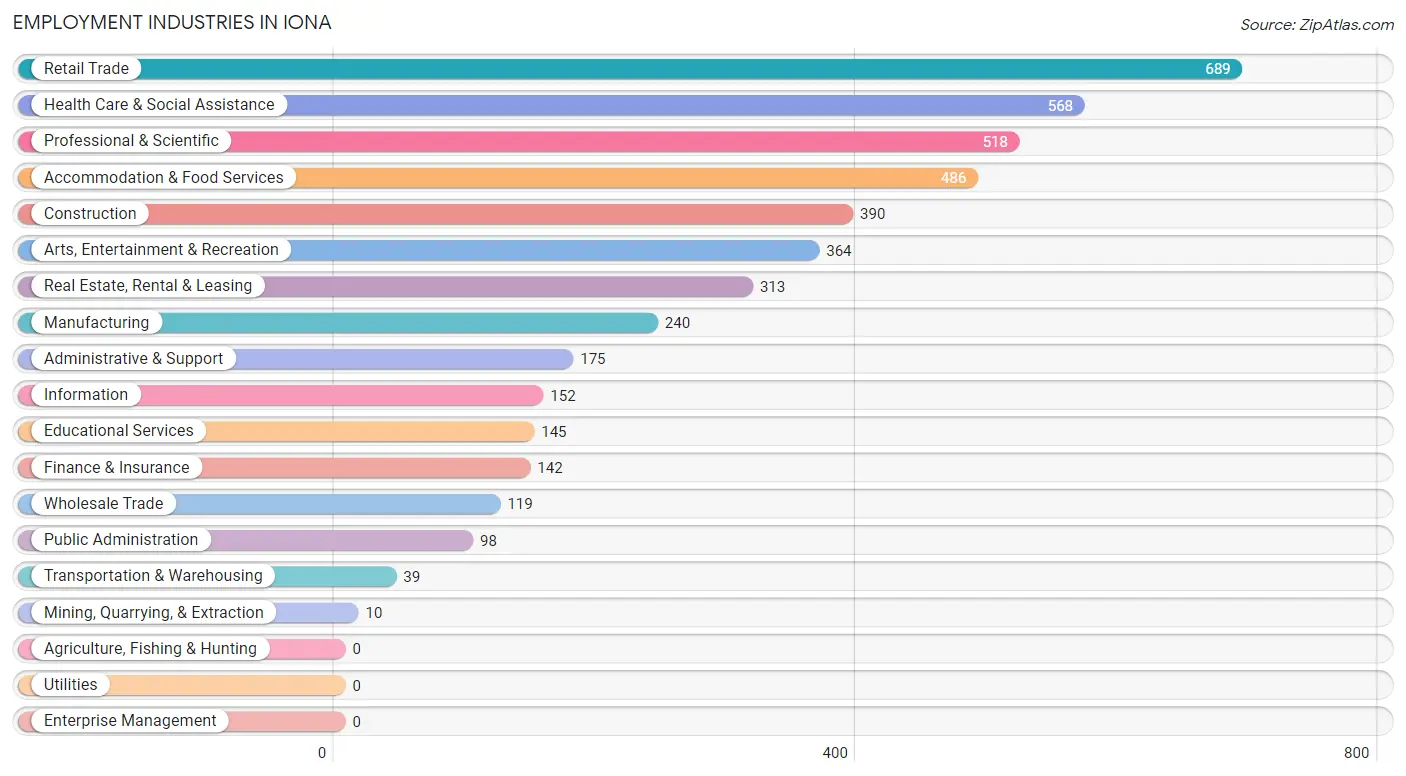
Employment Industries in Iona
The major employment industries in Iona include Retail Trade (689 | 15.0%), Health Care & Social Assistance (568 | 12.4%), Professional & Scientific (518 | 11.3%), Accommodation & Food Services (486 | 10.6%), and Construction (390 | 8.5%).
Employment Industries by Sex in Iona
The Iona industries that see more men than women are Mining, Quarrying, & Extraction (100.0%), Public Administration (95.9%), and Transportation & Warehousing (87.2%), whereas the industries that tend to have a higher number of women are Educational Services (73.8%), Retail Trade (71.4%), and Health Care & Social Assistance (68.0%).
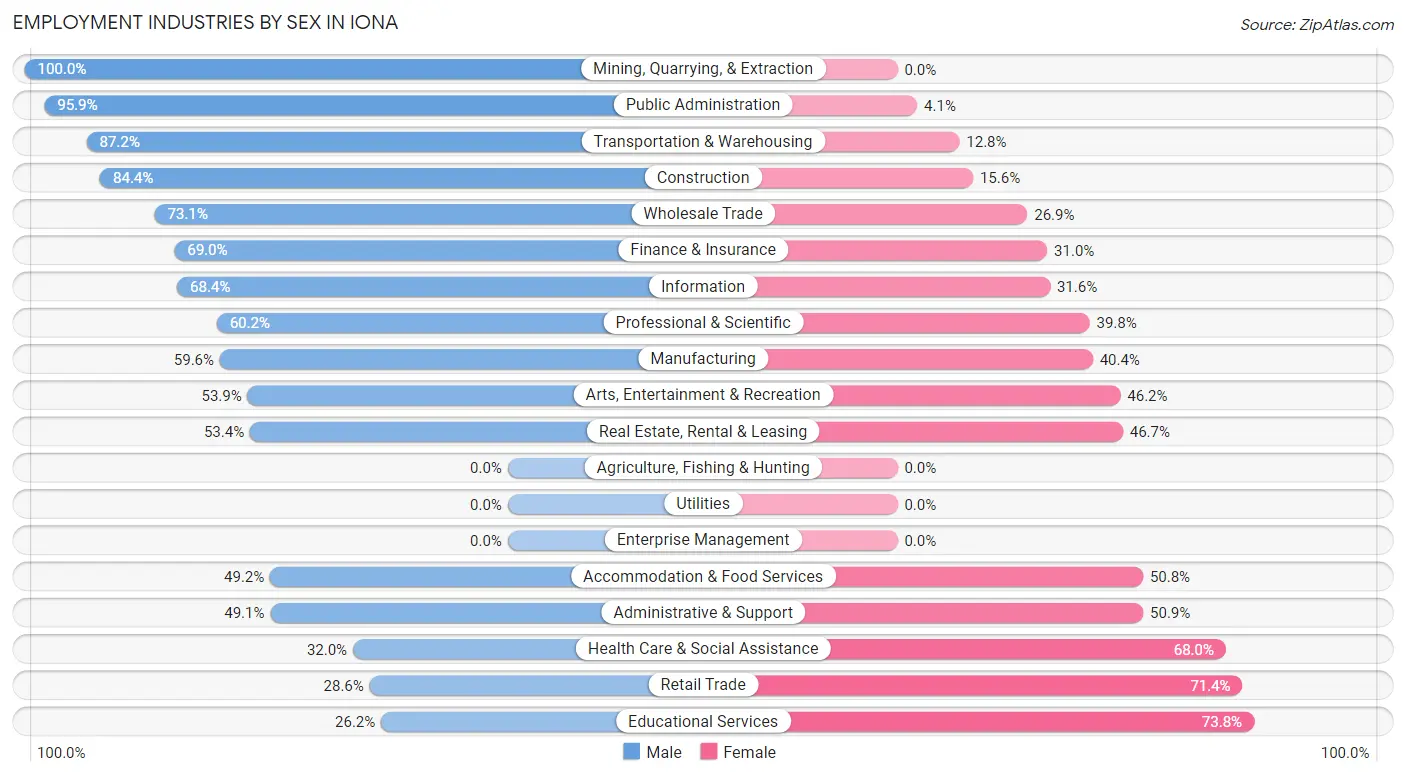
| Industry | Male | Female |
| Agriculture, Fishing & Hunting | 0 (0.0%) | 0 (0.0%) |
| Mining, Quarrying, & Extraction | 10 (100.0%) | 0 (0.0%) |
| Construction | 329 (84.4%) | 61 (15.6%) |
| Manufacturing | 143 (59.6%) | 97 (40.4%) |
| Wholesale Trade | 87 (73.1%) | 32 (26.9%) |
| Retail Trade | 197 (28.6%) | 492 (71.4%) |
| Transportation & Warehousing | 34 (87.2%) | 5 (12.8%) |
| Utilities | 0 (0.0%) | 0 (0.0%) |
| Information | 104 (68.4%) | 48 (31.6%) |
| Finance & Insurance | 98 (69.0%) | 44 (31.0%) |
| Real Estate, Rental & Leasing | 167 (53.3%) | 146 (46.7%) |
| Professional & Scientific | 312 (60.2%) | 206 (39.8%) |
| Enterprise Management | 0 (0.0%) | 0 (0.0%) |
| Administrative & Support | 86 (49.1%) | 89 (50.9%) |
| Educational Services | 38 (26.2%) | 107 (73.8%) |
| Health Care & Social Assistance | 182 (32.0%) | 386 (68.0%) |
| Arts, Entertainment & Recreation | 196 (53.8%) | 168 (46.2%) |
| Accommodation & Food Services | 239 (49.2%) | 247 (50.8%) |
| Public Administration | 94 (95.9%) | 4 (4.1%) |
| Total | 2,339 (51.1%) | 2,242 (48.9%) |
Education in Iona
School Enrollment in Iona
The most common levels of schooling among the 927 students in Iona are college / undergraduate (381 | 41.1%), high school (192 | 20.7%), and middle school (131 | 14.1%).
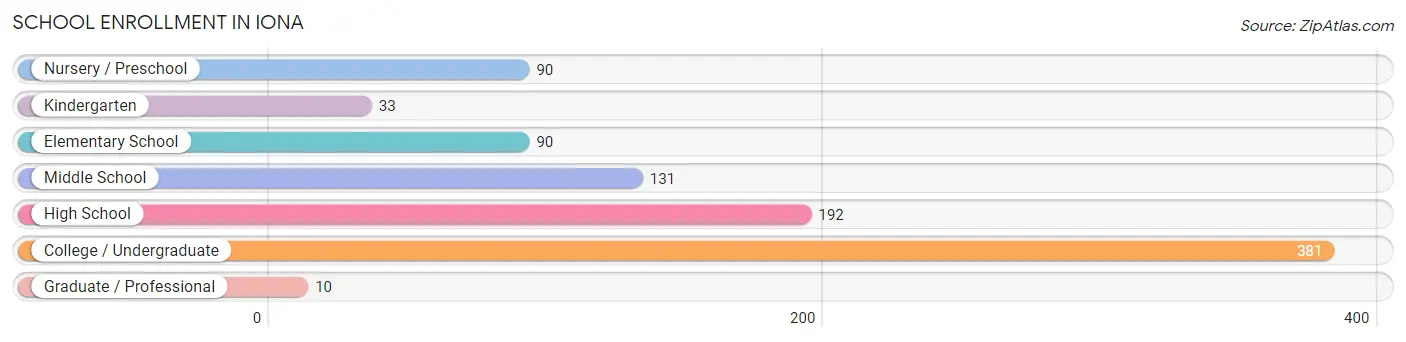
| School Level | # Students | % Students |
| Nursery / Preschool | 90 | 9.7% |
| Kindergarten | 33 | 3.6% |
| Elementary School | 90 | 9.7% |
| Middle School | 131 | 14.1% |
| High School | 192 | 20.7% |
| College / Undergraduate | 381 | 41.1% |
| Graduate / Professional | 10 | 1.1% |
| Total | 927 | 100.0% |
School Enrollment by Age by Funding Source in Iona
Out of a total of 927 students who are enrolled in schools in Iona, 113 (12.2%) attend a private institution, while the remaining 814 (87.8%) are enrolled in public schools. The age group of 10 to 14 year olds has the highest likelihood of being enrolled in private schools, with 40 (21.6% in the age bracket) enrolled. Conversely, the age group of 3 to 4 year olds has the lowest likelihood of being enrolled in a private school, with 79 (100.0% in the age bracket) attending a public institution.
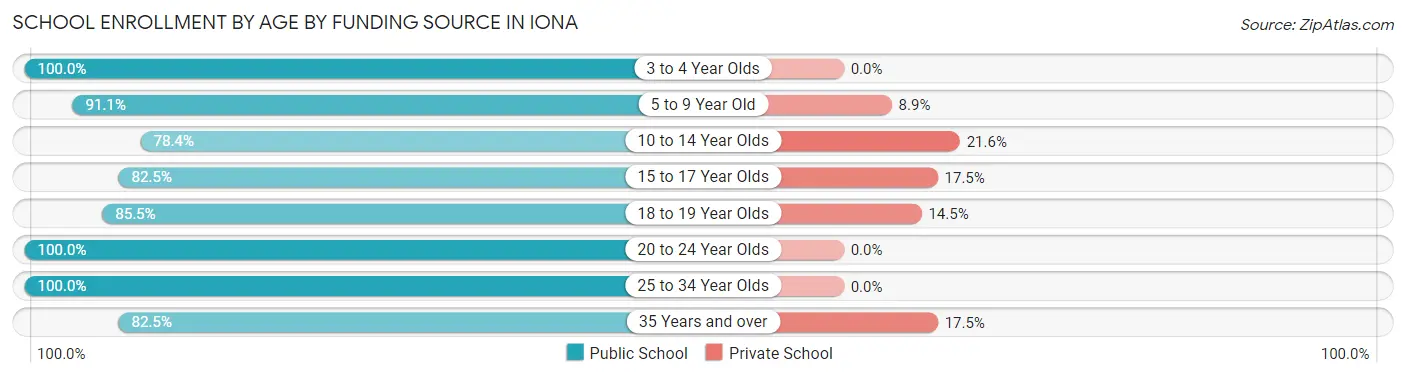
| Age Bracket | Public School | Private School |
| 3 to 4 Year Olds | 79 (100.0%) | 0 (0.0%) |
| 5 to 9 Year Old | 112 (91.1%) | 11 (8.9%) |
| 10 to 14 Year Olds | 145 (78.4%) | 40 (21.6%) |
| 15 to 17 Year Olds | 99 (82.5%) | 21 (17.5%) |
| 18 to 19 Year Olds | 59 (85.5%) | 10 (14.5%) |
| 20 to 24 Year Olds | 165 (100.0%) | 0 (0.0%) |
| 25 to 34 Year Olds | 9 (100.0%) | 0 (0.0%) |
| 35 Years and over | 146 (82.5%) | 31 (17.5%) |
| Total | 814 (87.8%) | 113 (12.2%) |
Educational Attainment by Field of Study in Iona
Business (1,111 | 19.6%), education (971 | 17.1%), social sciences (596 | 10.5%), science & technology (516 | 9.1%), and engineering (383 | 6.8%) are the most common fields of study among 5,677 individuals in Iona who have obtained a bachelor's degree or higher.
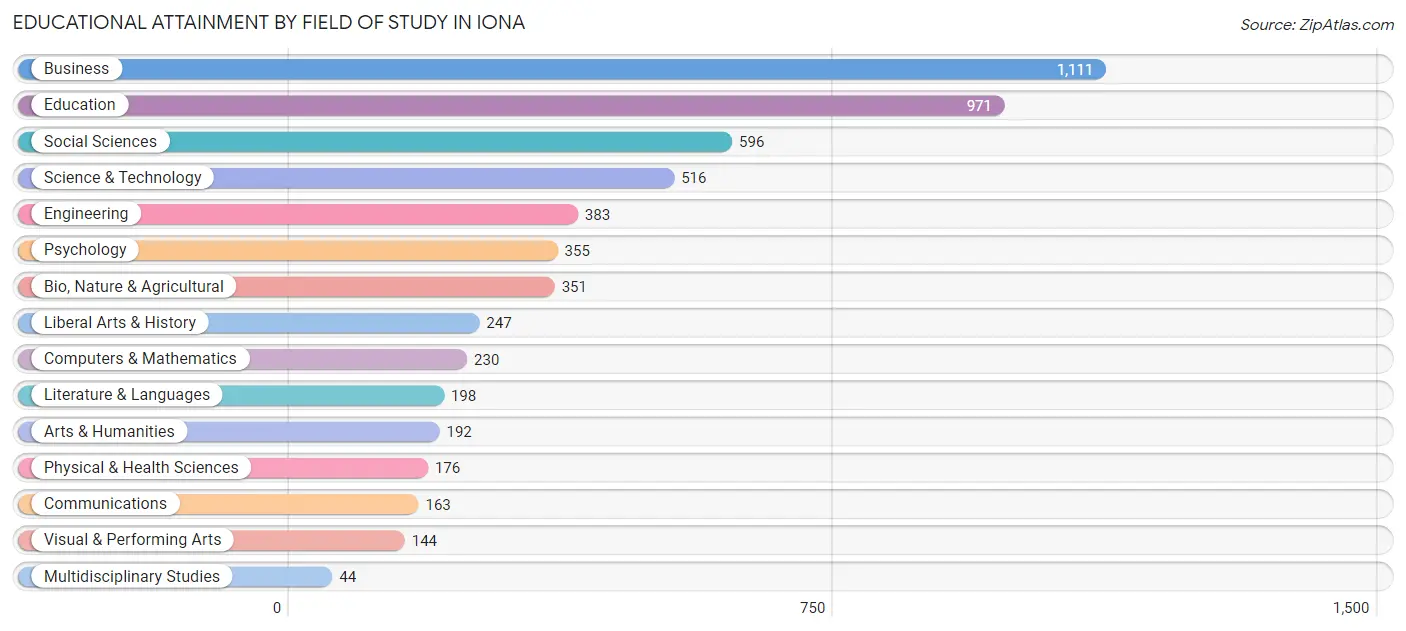
| Field of Study | # Graduates | % Graduates |
| Computers & Mathematics | 230 | 4.1% |
| Bio, Nature & Agricultural | 351 | 6.2% |
| Physical & Health Sciences | 176 | 3.1% |
| Psychology | 355 | 6.2% |
| Social Sciences | 596 | 10.5% |
| Engineering | 383 | 6.8% |
| Multidisciplinary Studies | 44 | 0.8% |
| Science & Technology | 516 | 9.1% |
| Business | 1,111 | 19.6% |
| Education | 971 | 17.1% |
| Literature & Languages | 198 | 3.5% |
| Liberal Arts & History | 247 | 4.3% |
| Visual & Performing Arts | 144 | 2.5% |
| Communications | 163 | 2.9% |
| Arts & Humanities | 192 | 3.4% |
| Total | 5,677 | 100.0% |
Transportation & Commute in Iona
Vehicle Availability by Sex in Iona
The most prevalent vehicle ownership categories in Iona are males with 2 vehicles (1,163, accounting for 51.4%) and females with 2 vehicles (1,081, making up 53.5%).
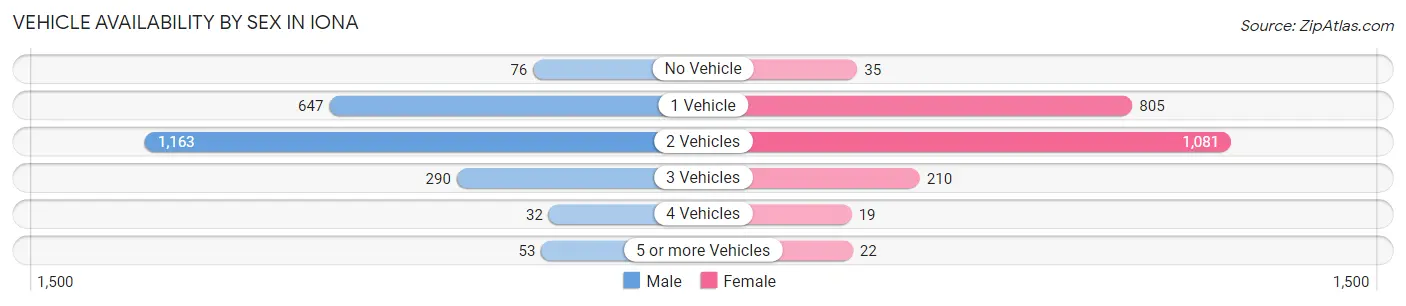
| Vehicles Available | Male | Female |
| No Vehicle | 76 (3.4%) | 35 (1.6%) |
| 1 Vehicle | 647 (28.6%) | 805 (37.1%) |
| 2 Vehicles | 1,163 (51.4%) | 1,081 (49.8%) |
| 3 Vehicles | 290 (12.8%) | 210 (9.7%) |
| 4 Vehicles | 32 (1.4%) | 19 (0.9%) |
| 5 or more Vehicles | 53 (2.3%) | 22 (1.0%) |
| Total | 2,261 (100.0%) | 2,172 (100.0%) |
Commute Time in Iona
The most frequently occuring commute durations in Iona are 15 to 19 minutes (608 commuters, 17.3%), 20 to 24 minutes (575 commuters, 16.4%), and 30 to 34 minutes (546 commuters, 15.6%).
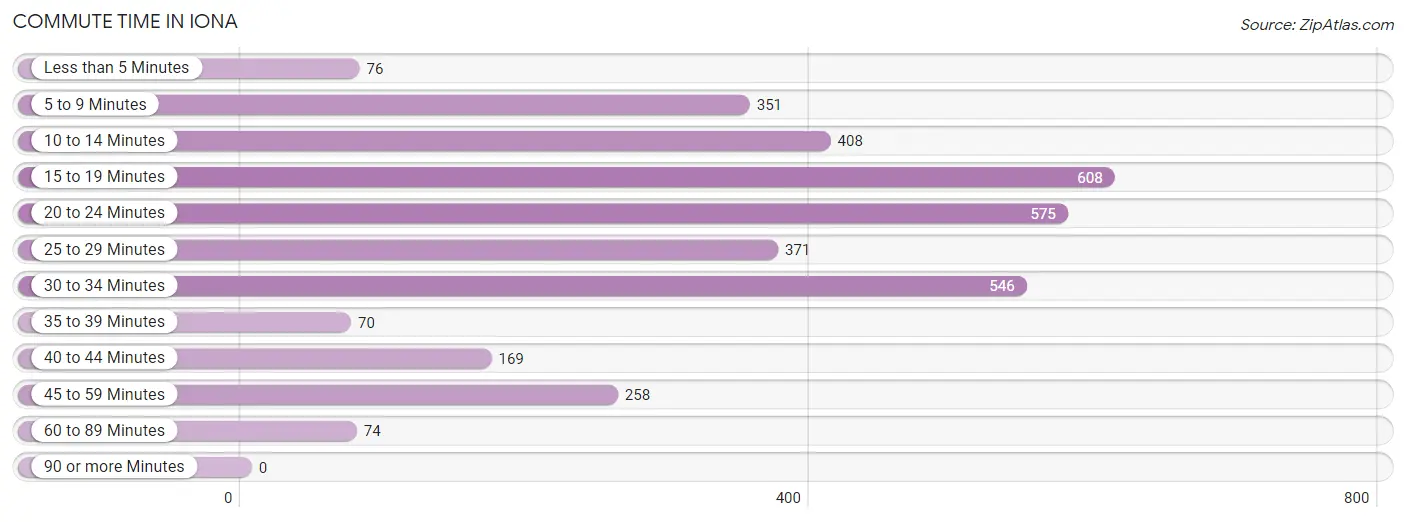
| Commute Time | # Commuters | % Commuters |
| Less than 5 Minutes | 76 | 2.2% |
| 5 to 9 Minutes | 351 | 10.0% |
| 10 to 14 Minutes | 408 | 11.6% |
| 15 to 19 Minutes | 608 | 17.3% |
| 20 to 24 Minutes | 575 | 16.4% |
| 25 to 29 Minutes | 371 | 10.6% |
| 30 to 34 Minutes | 546 | 15.6% |
| 35 to 39 Minutes | 70 | 2.0% |
| 40 to 44 Minutes | 169 | 4.8% |
| 45 to 59 Minutes | 258 | 7.4% |
| 60 to 89 Minutes | 74 | 2.1% |
| 90 or more Minutes | 0 | 0.0% |
Commute Time by Sex in Iona
The most common commute times in Iona are 30 to 34 minutes (324 commuters, 18.8%) for males and 20 to 24 minutes (413 commuters, 23.1%) for females.
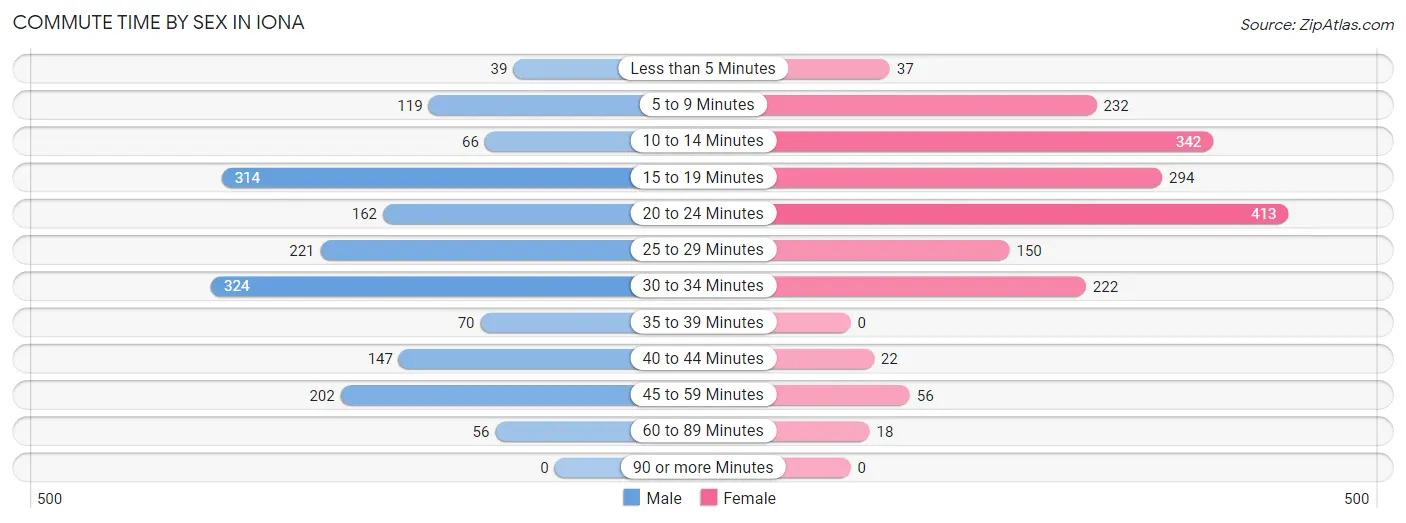
| Commute Time | Male | Female |
| Less than 5 Minutes | 39 (2.3%) | 37 (2.1%) |
| 5 to 9 Minutes | 119 (6.9%) | 232 (13.0%) |
| 10 to 14 Minutes | 66 (3.8%) | 342 (19.2%) |
| 15 to 19 Minutes | 314 (18.3%) | 294 (16.5%) |
| 20 to 24 Minutes | 162 (9.4%) | 413 (23.1%) |
| 25 to 29 Minutes | 221 (12.9%) | 150 (8.4%) |
| 30 to 34 Minutes | 324 (18.8%) | 222 (12.4%) |
| 35 to 39 Minutes | 70 (4.1%) | 0 (0.0%) |
| 40 to 44 Minutes | 147 (8.6%) | 22 (1.2%) |
| 45 to 59 Minutes | 202 (11.7%) | 56 (3.1%) |
| 60 to 89 Minutes | 56 (3.3%) | 18 (1.0%) |
| 90 or more Minutes | 0 (0.0%) | 0 (0.0%) |
Time of Departure to Work by Sex in Iona
The most frequent times of departure to work in Iona are 8:00 AM to 8:29 AM (346, 20.1%) for males and 9:00 AM to 9:59 AM (423, 23.7%) for females.
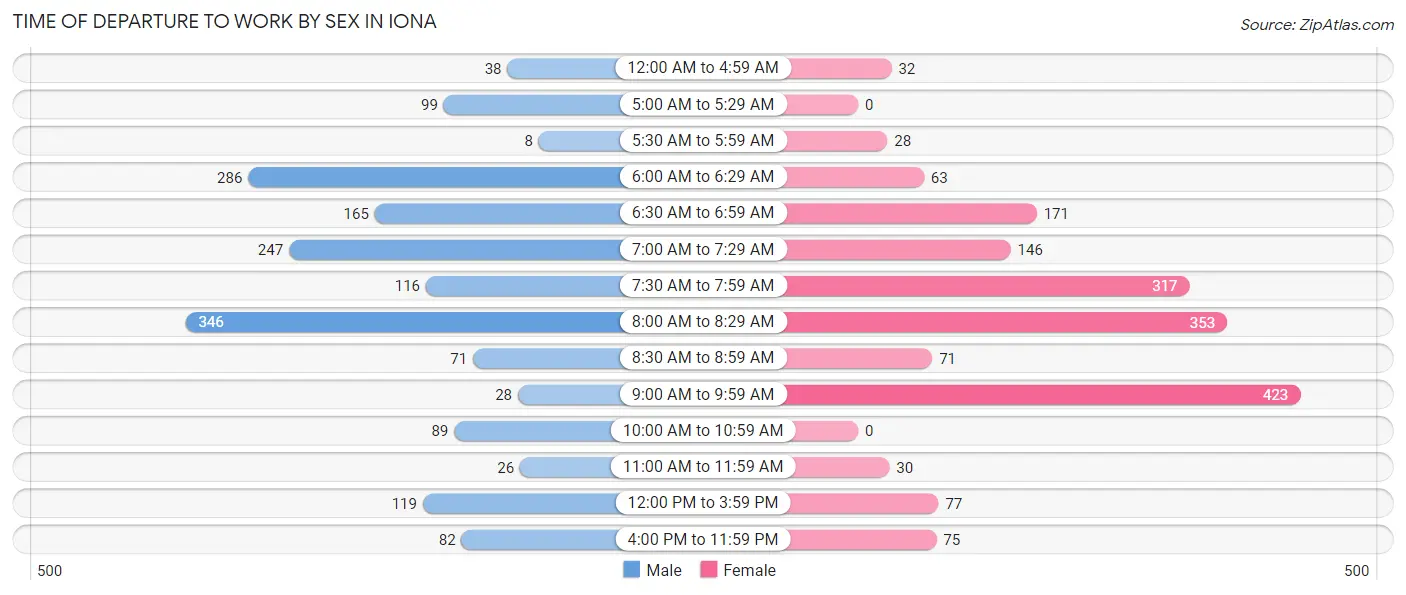
| Time of Departure | Male | Female |
| 12:00 AM to 4:59 AM | 38 (2.2%) | 32 (1.8%) |
| 5:00 AM to 5:29 AM | 99 (5.8%) | 0 (0.0%) |
| 5:30 AM to 5:59 AM | 8 (0.5%) | 28 (1.6%) |
| 6:00 AM to 6:29 AM | 286 (16.6%) | 63 (3.5%) |
| 6:30 AM to 6:59 AM | 165 (9.6%) | 171 (9.6%) |
| 7:00 AM to 7:29 AM | 247 (14.4%) | 146 (8.2%) |
| 7:30 AM to 7:59 AM | 116 (6.7%) | 317 (17.7%) |
| 8:00 AM to 8:29 AM | 346 (20.1%) | 353 (19.8%) |
| 8:30 AM to 8:59 AM | 71 (4.1%) | 71 (4.0%) |
| 9:00 AM to 9:59 AM | 28 (1.6%) | 423 (23.7%) |
| 10:00 AM to 10:59 AM | 89 (5.2%) | 0 (0.0%) |
| 11:00 AM to 11:59 AM | 26 (1.5%) | 30 (1.7%) |
| 12:00 PM to 3:59 PM | 119 (6.9%) | 77 (4.3%) |
| 4:00 PM to 11:59 PM | 82 (4.8%) | 75 (4.2%) |
| Total | 1,720 (100.0%) | 1,786 (100.0%) |
Housing Occupancy in Iona
Occupancy by Ownership in Iona
Of the total 7,842 dwellings in Iona, owner-occupied units account for 5,485 (69.9%), while renter-occupied units make up 2,357 (30.1%).
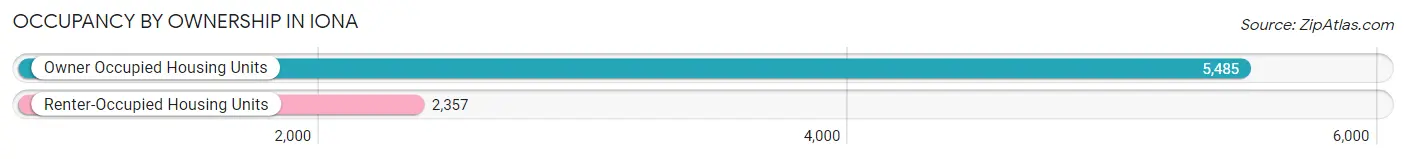
| Occupancy | # Housing Units | % Housing Units |
| Owner Occupied Housing Units | 5,485 | 69.9% |
| Renter-Occupied Housing Units | 2,357 | 30.1% |
| Total Occupied Housing Units | 7,842 | 100.0% |
Occupancy by Household Size in Iona
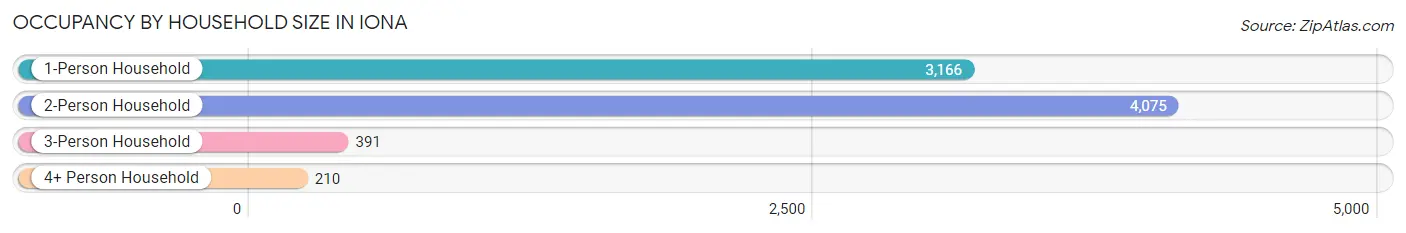
| Household Size | # Housing Units | % Housing Units |
| 1-Person Household | 3,166 | 40.4% |
| 2-Person Household | 4,075 | 52.0% |
| 3-Person Household | 391 | 5.0% |
| 4+ Person Household | 210 | 2.7% |
| Total Housing Units | 7,842 | 100.0% |
Occupancy by Ownership by Household Size in Iona
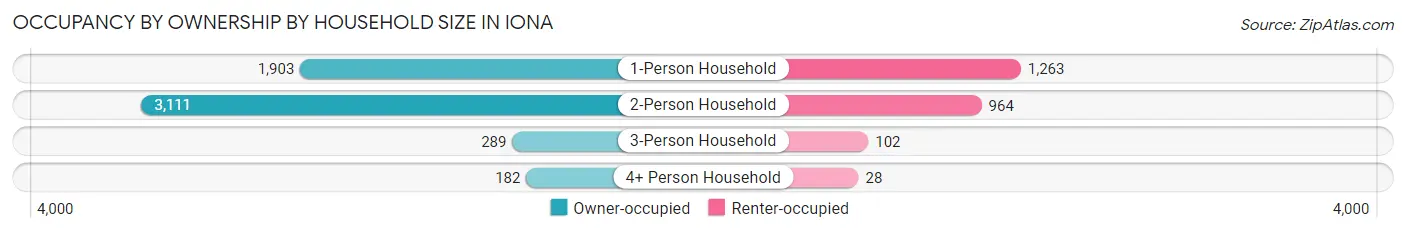
| Household Size | Owner-occupied | Renter-occupied |
| 1-Person Household | 1,903 (60.1%) | 1,263 (39.9%) |
| 2-Person Household | 3,111 (76.3%) | 964 (23.7%) |
| 3-Person Household | 289 (73.9%) | 102 (26.1%) |
| 4+ Person Household | 182 (86.7%) | 28 (13.3%) |
| Total Housing Units | 5,485 (69.9%) | 2,357 (30.1%) |
Occupancy by Educational Attainment in Iona
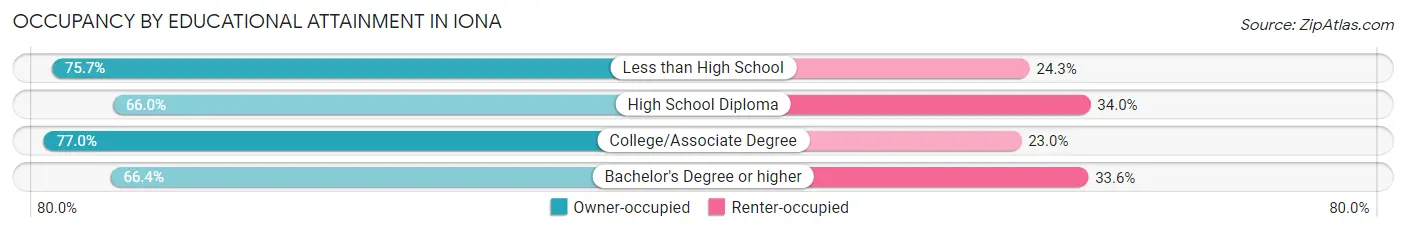
| Household Size | Owner-occupied | Renter-occupied |
| Less than High School | 373 (75.7%) | 120 (24.3%) |
| High School Diploma | 1,292 (66.0%) | 665 (34.0%) |
| College/Associate Degree | 1,750 (77.0%) | 523 (23.0%) |
| Bachelor's Degree or higher | 2,070 (66.4%) | 1,049 (33.6%) |
Occupancy by Age of Householder in Iona
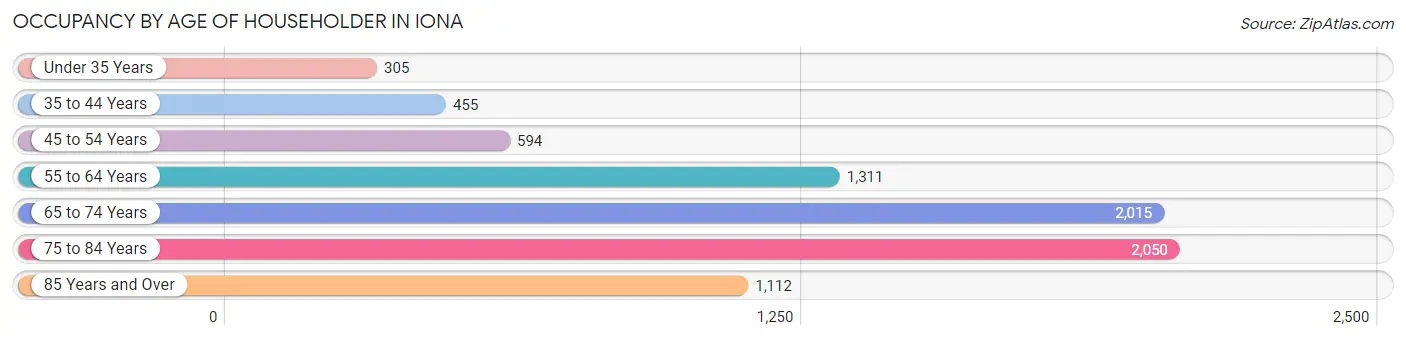
| Age Bracket | # Households | % Households |
| Under 35 Years | 305 | 3.9% |
| 35 to 44 Years | 455 | 5.8% |
| 45 to 54 Years | 594 | 7.6% |
| 55 to 64 Years | 1,311 | 16.7% |
| 65 to 74 Years | 2,015 | 25.7% |
| 75 to 84 Years | 2,050 | 26.1% |
| 85 Years and Over | 1,112 | 14.2% |
| Total | 7,842 | 100.0% |
Housing Finances in Iona
Median Income by Occupancy in Iona
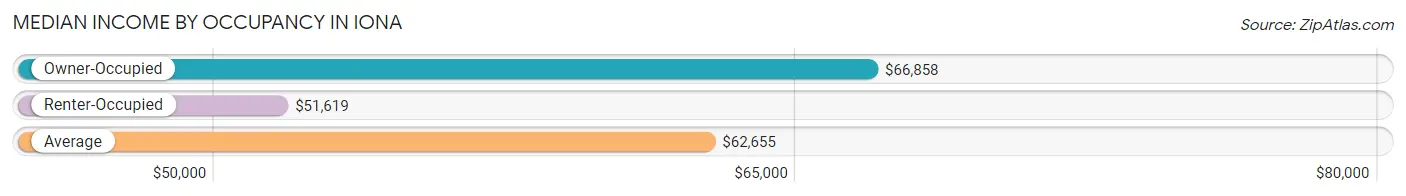
| Occupancy Type | # Households | Median Income |
| Owner-Occupied | 5,485 (69.9%) | $66,858 |
| Renter-Occupied | 2,357 (30.1%) | $51,619 |
| Average | 7,842 (100.0%) | $62,655 |
Occupancy by Householder Income Bracket in Iona
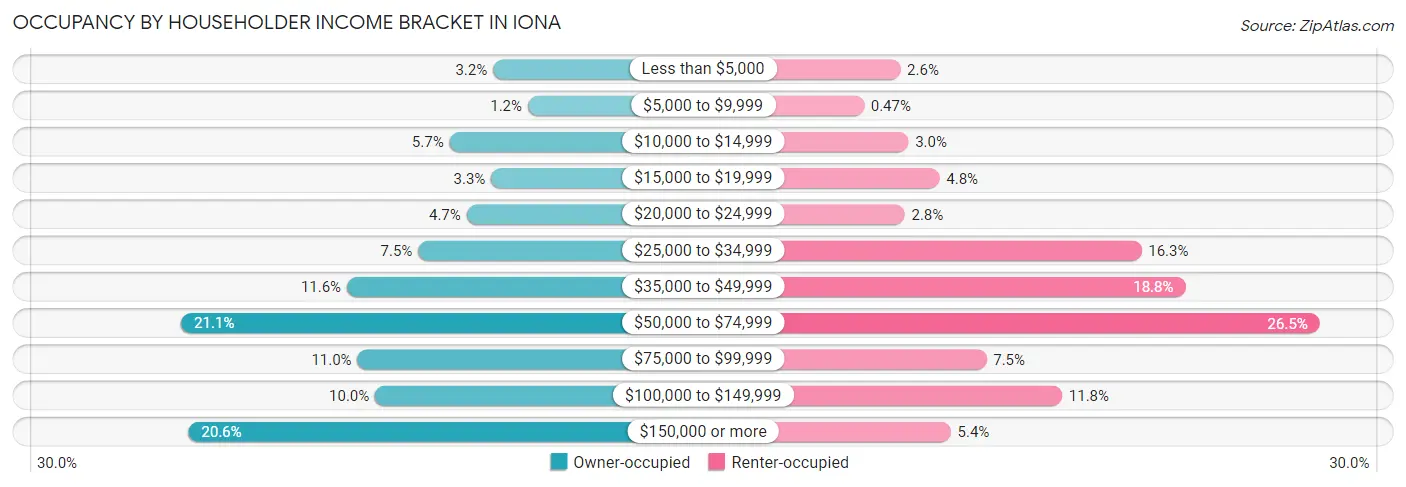
| Income Bracket | Owner-occupied | Renter-occupied |
| Less than $5,000 | 177 (3.2%) | 60 (2.5%) |
| $5,000 to $9,999 | 68 (1.2%) | 11 (0.5%) |
| $10,000 to $14,999 | 314 (5.7%) | 71 (3.0%) |
| $15,000 to $19,999 | 183 (3.3%) | 113 (4.8%) |
| $20,000 to $24,999 | 260 (4.7%) | 66 (2.8%) |
| $25,000 to $34,999 | 412 (7.5%) | 385 (16.3%) |
| $35,000 to $49,999 | 635 (11.6%) | 444 (18.8%) |
| $50,000 to $74,999 | 1,155 (21.1%) | 625 (26.5%) |
| $75,000 to $99,999 | 602 (11.0%) | 176 (7.5%) |
| $100,000 to $149,999 | 547 (10.0%) | 278 (11.8%) |
| $150,000 or more | 1,132 (20.6%) | 128 (5.4%) |
| Total | 5,485 (100.0%) | 2,357 (100.0%) |
Monthly Housing Cost Tiers in Iona
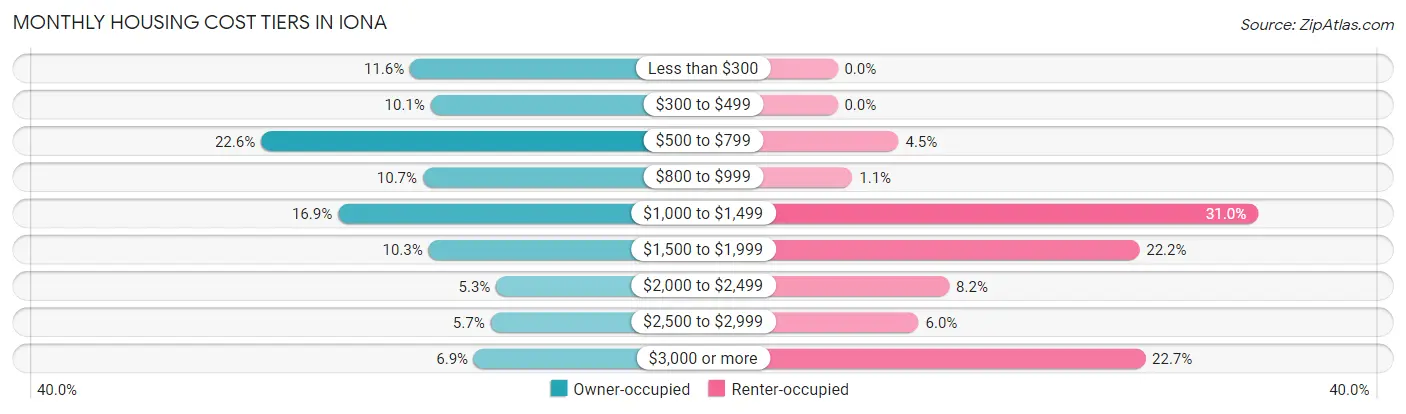
| Monthly Cost | Owner-occupied | Renter-occupied |
| Less than $300 | 637 (11.6%) | 0 (0.0%) |
| $300 to $499 | 554 (10.1%) | 0 (0.0%) |
| $500 to $799 | 1,239 (22.6%) | 106 (4.5%) |
| $800 to $999 | 585 (10.7%) | 26 (1.1%) |
| $1,000 to $1,499 | 928 (16.9%) | 730 (31.0%) |
| $1,500 to $1,999 | 562 (10.2%) | 524 (22.2%) |
| $2,000 to $2,499 | 289 (5.3%) | 194 (8.2%) |
| $2,500 to $2,999 | 312 (5.7%) | 141 (6.0%) |
| $3,000 or more | 379 (6.9%) | 534 (22.7%) |
| Total | 5,485 (100.0%) | 2,357 (100.0%) |
Physical Housing Characteristics in Iona
Housing Structures in Iona
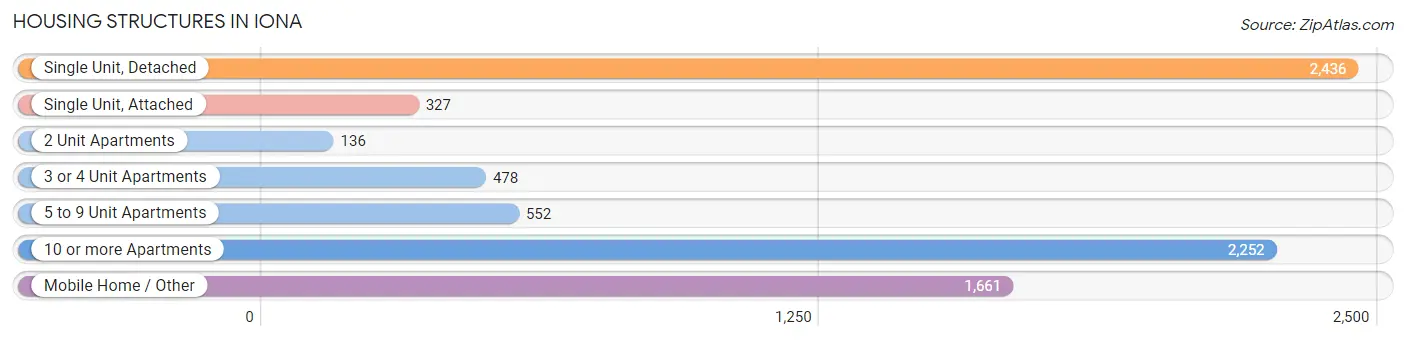
| Structure Type | # Housing Units | % Housing Units |
| Single Unit, Detached | 2,436 | 31.1% |
| Single Unit, Attached | 327 | 4.2% |
| 2 Unit Apartments | 136 | 1.7% |
| 3 or 4 Unit Apartments | 478 | 6.1% |
| 5 to 9 Unit Apartments | 552 | 7.0% |
| 10 or more Apartments | 2,252 | 28.7% |
| Mobile Home / Other | 1,661 | 21.2% |
| Total | 7,842 | 100.0% |
Housing Structures by Occupancy in Iona
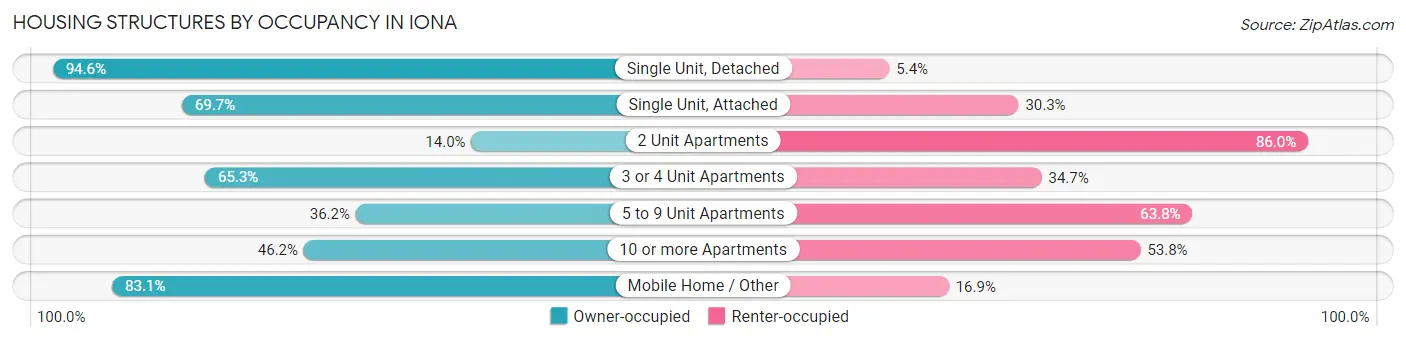
| Structure Type | Owner-occupied | Renter-occupied |
| Single Unit, Detached | 2,304 (94.6%) | 132 (5.4%) |
| Single Unit, Attached | 228 (69.7%) | 99 (30.3%) |
| 2 Unit Apartments | 19 (14.0%) | 117 (86.0%) |
| 3 or 4 Unit Apartments | 312 (65.3%) | 166 (34.7%) |
| 5 to 9 Unit Apartments | 200 (36.2%) | 352 (63.8%) |
| 10 or more Apartments | 1,041 (46.2%) | 1,211 (53.8%) |
| Mobile Home / Other | 1,381 (83.1%) | 280 (16.9%) |
| Total | 5,485 (69.9%) | 2,357 (30.1%) |
Housing Structures by Number of Rooms in Iona
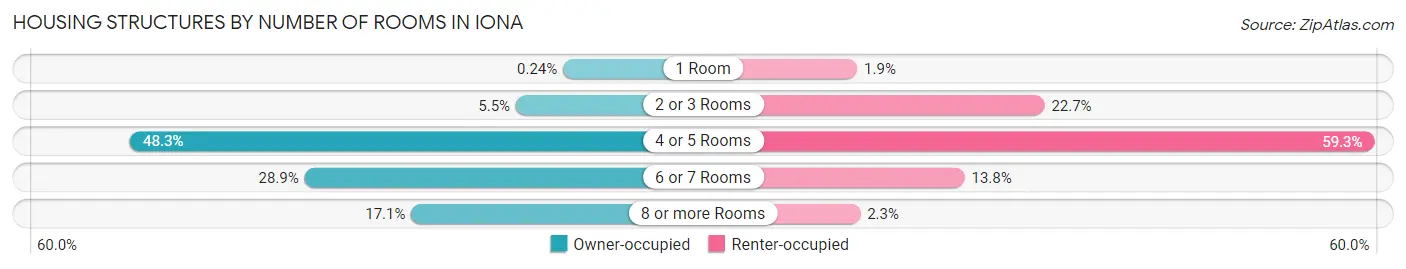
| Number of Rooms | Owner-occupied | Renter-occupied |
| 1 Room | 13 (0.2%) | 45 (1.9%) |
| 2 or 3 Rooms | 300 (5.5%) | 535 (22.7%) |
| 4 or 5 Rooms | 2,648 (48.3%) | 1,398 (59.3%) |
| 6 or 7 Rooms | 1,587 (28.9%) | 326 (13.8%) |
| 8 or more Rooms | 937 (17.1%) | 53 (2.2%) |
| Total | 5,485 (100.0%) | 2,357 (100.0%) |
Housing Structure by Heating Type in Iona
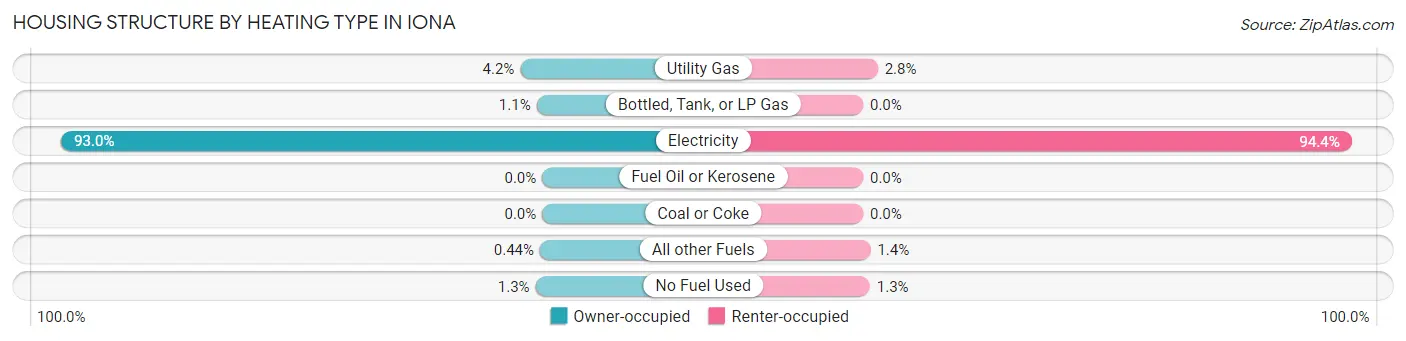
| Heating Type | Owner-occupied | Renter-occupied |
| Utility Gas | 232 (4.2%) | 67 (2.8%) |
| Bottled, Tank, or LP Gas | 59 (1.1%) | 0 (0.0%) |
| Electricity | 5,099 (93.0%) | 2,225 (94.4%) |
| Fuel Oil or Kerosene | 0 (0.0%) | 0 (0.0%) |
| Coal or Coke | 0 (0.0%) | 0 (0.0%) |
| All other Fuels | 24 (0.4%) | 34 (1.4%) |
| No Fuel Used | 71 (1.3%) | 31 (1.3%) |
| Total | 5,485 (100.0%) | 2,357 (100.0%) |
Household Vehicle Usage in Iona
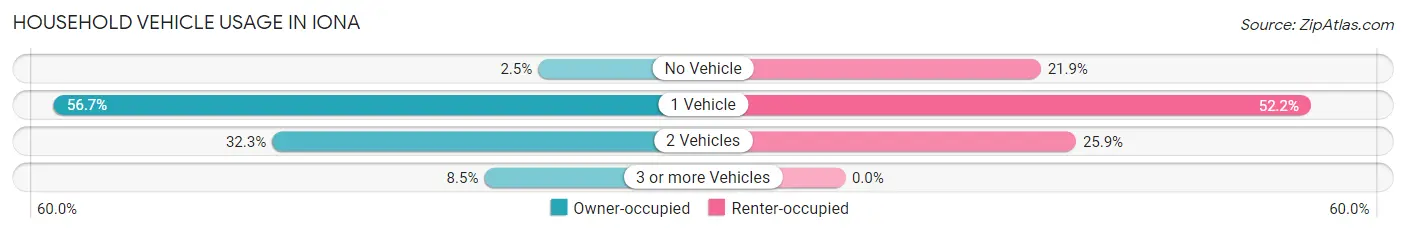
| Vehicles per Household | Owner-occupied | Renter-occupied |
| No Vehicle | 136 (2.5%) | 517 (21.9%) |
| 1 Vehicle | 3,111 (56.7%) | 1,230 (52.2%) |
| 2 Vehicles | 1,771 (32.3%) | 610 (25.9%) |
| 3 or more Vehicles | 467 (8.5%) | 0 (0.0%) |
| Total | 5,485 (100.0%) | 2,357 (100.0%) |
Real Estate & Mortgages in Iona
Real Estate and Mortgage Overview in Iona
| Characteristic | Without Mortgage | With Mortgage |
| Housing Units | 3,704 | 1,781 |
| Median Property Value | $197,700 | $367,700 |
| Median Household Income | $55,549 | $576 |
| Monthly Housing Costs | $660 | $312 |
| Real Estate Taxes | $1,763 | $40 |
Property Value by Mortgage Status in Iona
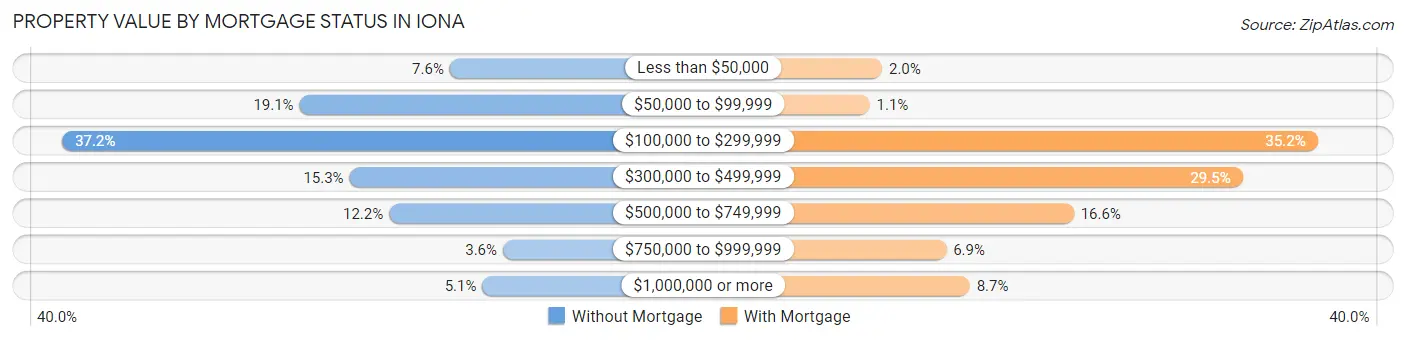
| Property Value | Without Mortgage | With Mortgage |
| Less than $50,000 | 282 (7.6%) | 36 (2.0%) |
| $50,000 to $99,999 | 706 (19.1%) | 19 (1.1%) |
| $100,000 to $299,999 | 1,376 (37.1%) | 627 (35.2%) |
| $300,000 to $499,999 | 565 (15.2%) | 525 (29.5%) |
| $500,000 to $749,999 | 453 (12.2%) | 296 (16.6%) |
| $750,000 to $999,999 | 132 (3.6%) | 123 (6.9%) |
| $1,000,000 or more | 190 (5.1%) | 155 (8.7%) |
| Total | 3,704 (100.0%) | 1,781 (100.0%) |
Household Income by Mortgage Status in Iona
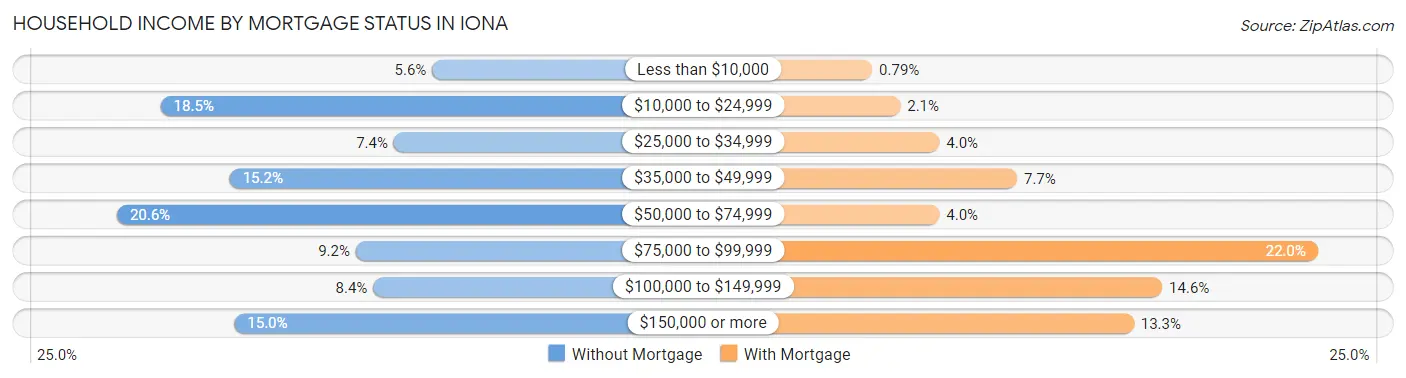
| Household Income | Without Mortgage | With Mortgage |
| Less than $10,000 | 207 (5.6%) | 14 (0.8%) |
| $10,000 to $24,999 | 686 (18.5%) | 38 (2.1%) |
| $25,000 to $34,999 | 275 (7.4%) | 71 (4.0%) |
| $35,000 to $49,999 | 564 (15.2%) | 137 (7.7%) |
| $50,000 to $74,999 | 763 (20.6%) | 71 (4.0%) |
| $75,000 to $99,999 | 342 (9.2%) | 392 (22.0%) |
| $100,000 to $149,999 | 311 (8.4%) | 260 (14.6%) |
| $150,000 or more | 556 (15.0%) | 236 (13.3%) |
| Total | 3,704 (100.0%) | 1,781 (100.0%) |
Property Value to Household Income Ratio in Iona
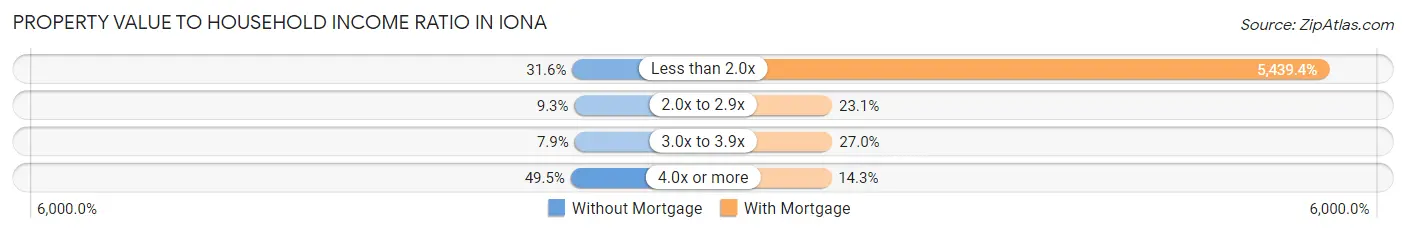
| Value-to-Income Ratio | Without Mortgage | With Mortgage |
| Less than 2.0x | 1,170 (31.6%) | 96,875 (5,439.4%) |
| 2.0x to 2.9x | 344 (9.3%) | 411 (23.1%) |
| 3.0x to 3.9x | 291 (7.9%) | 480 (27.0%) |
| 4.0x or more | 1,834 (49.5%) | 255 (14.3%) |
| Total | 3,704 (100.0%) | 1,781 (100.0%) |
Real Estate Taxes by Mortgage Status in Iona
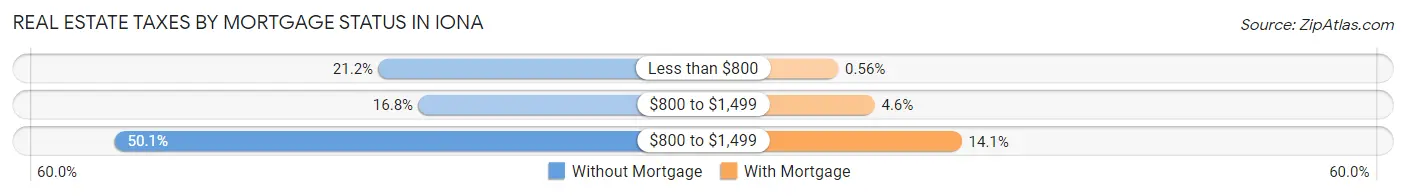
| Property Taxes | Without Mortgage | With Mortgage |
| Less than $800 | 784 (21.2%) | 10 (0.6%) |
| $800 to $1,499 | 622 (16.8%) | 81 (4.5%) |
| $800 to $1,499 | 1,857 (50.1%) | 251 (14.1%) |
| Total | 3,704 (100.0%) | 1,781 (100.0%) |
Health & Disability in Iona
Health Insurance Coverage by Age in Iona
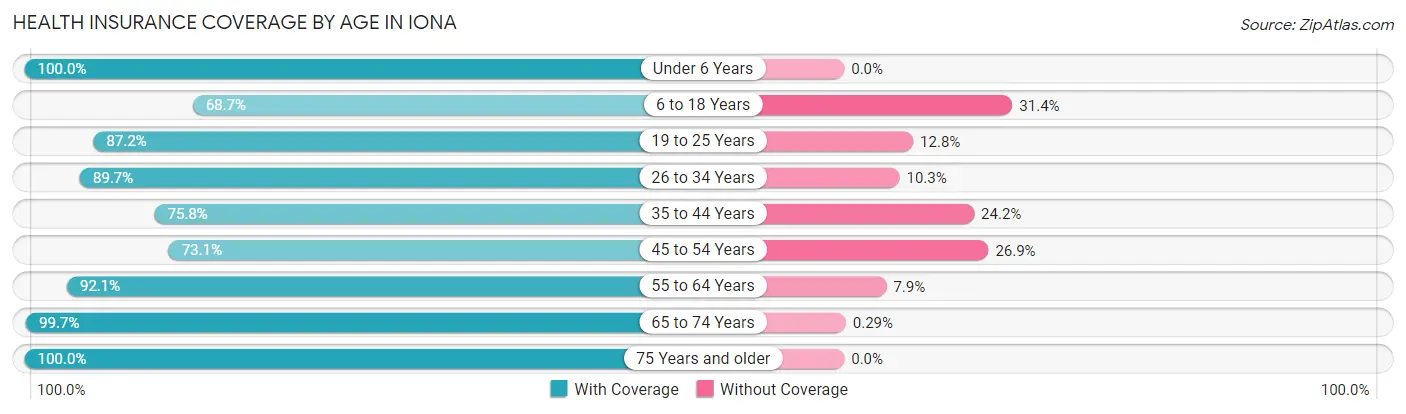
| Age Bracket | With Coverage | Without Coverage |
| Under 6 Years | 217 (100.0%) | 0 (0.0%) |
| 6 to 18 Years | 289 (68.6%) | 132 (31.4%) |
| 19 to 25 Years | 380 (87.2%) | 56 (12.8%) |
| 26 to 34 Years | 470 (89.7%) | 54 (10.3%) |
| 35 to 44 Years | 585 (75.8%) | 187 (24.2%) |
| 45 to 54 Years | 876 (73.1%) | 322 (26.9%) |
| 55 to 64 Years | 2,073 (92.1%) | 177 (7.9%) |
| 65 to 74 Years | 3,428 (99.7%) | 10 (0.3%) |
| 75 Years and older | 4,701 (100.0%) | 0 (0.0%) |
| Total | 13,019 (93.3%) | 938 (6.7%) |
Health Insurance Coverage by Citizenship Status in Iona
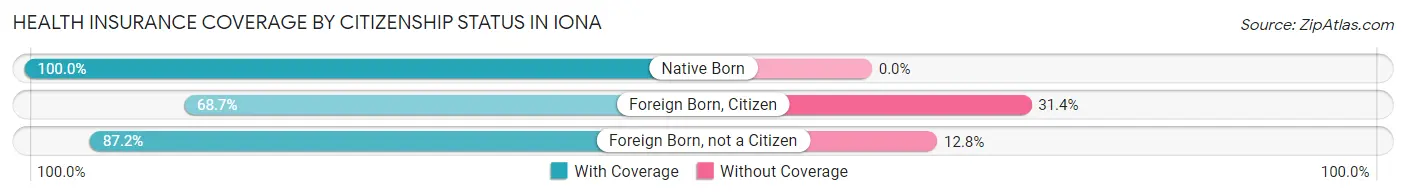
| Citizenship Status | With Coverage | Without Coverage |
| Native Born | 217 (100.0%) | 0 (0.0%) |
| Foreign Born, Citizen | 289 (68.6%) | 132 (31.4%) |
| Foreign Born, not a Citizen | 380 (87.2%) | 56 (12.8%) |
Health Insurance Coverage by Household Income in Iona
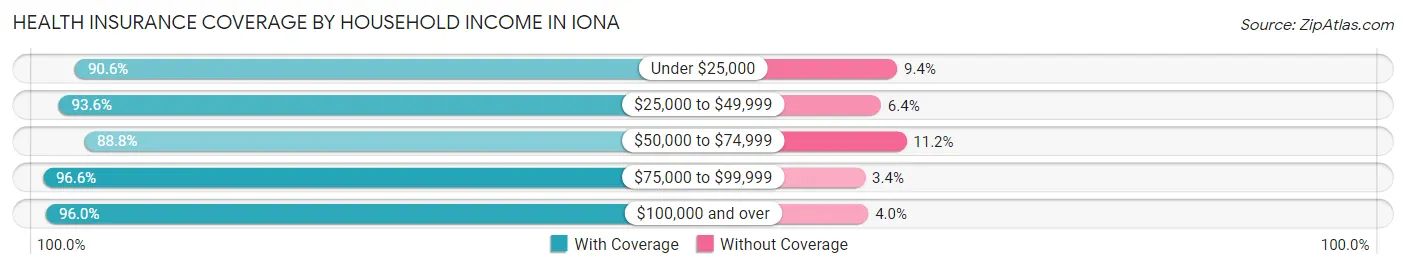
| Household Income | With Coverage | Without Coverage |
| Under $25,000 | 1,515 (90.6%) | 158 (9.4%) |
| $25,000 to $49,999 | 2,857 (93.6%) | 195 (6.4%) |
| $50,000 to $74,999 | 2,779 (88.8%) | 349 (11.2%) |
| $75,000 to $99,999 | 1,572 (96.6%) | 56 (3.4%) |
| $100,000 and over | 4,293 (96.0%) | 180 (4.0%) |
Public vs Private Health Insurance Coverage by Age in Iona
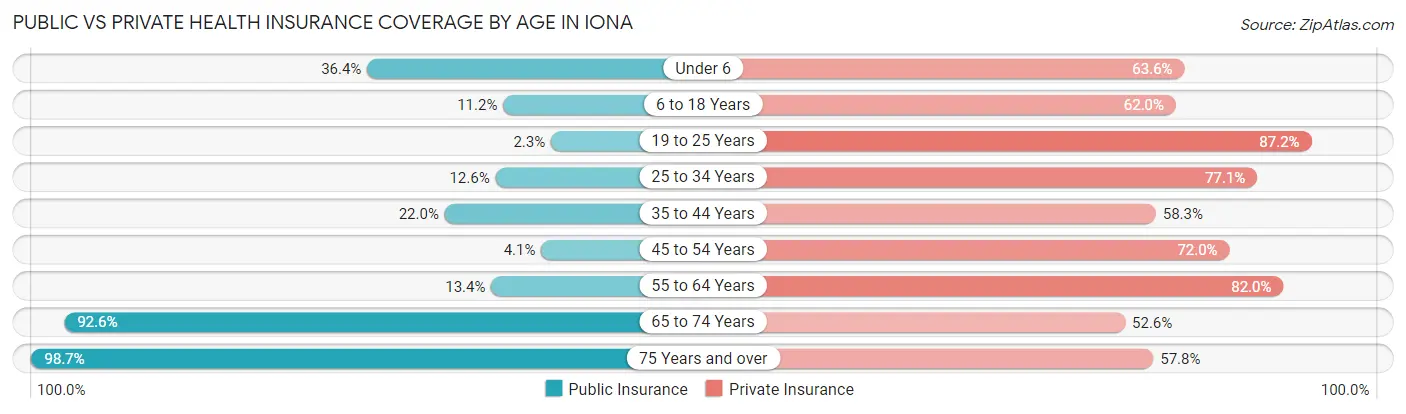
| Age Bracket | Public Insurance | Private Insurance |
| Under 6 | 79 (36.4%) | 138 (63.6%) |
| 6 to 18 Years | 47 (11.2%) | 261 (62.0%) |
| 19 to 25 Years | 10 (2.3%) | 380 (87.2%) |
| 25 to 34 Years | 66 (12.6%) | 404 (77.1%) |
| 35 to 44 Years | 170 (22.0%) | 450 (58.3%) |
| 45 to 54 Years | 49 (4.1%) | 862 (72.0%) |
| 55 to 64 Years | 301 (13.4%) | 1,844 (82.0%) |
| 65 to 74 Years | 3,185 (92.6%) | 1,808 (52.6%) |
| 75 Years and over | 4,642 (98.7%) | 2,718 (57.8%) |
| Total | 8,549 (61.3%) | 8,865 (63.5%) |
Disability Status by Sex by Age in Iona
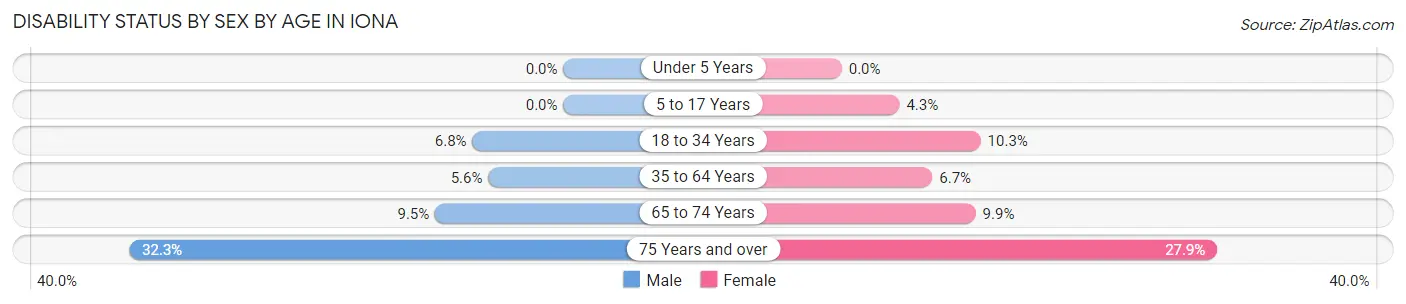
| Age Bracket | Male | Female |
| Under 5 Years | 0 (0.0%) | 0 (0.0%) |
| 5 to 17 Years | 0 (0.0%) | 11 (4.3%) |
| 18 to 34 Years | 36 (6.8%) | 46 (10.3%) |
| 35 to 64 Years | 104 (5.6%) | 158 (6.7%) |
| 65 to 74 Years | 152 (9.5%) | 183 (9.9%) |
| 75 Years and over | 713 (32.3%) | 694 (27.9%) |
Disability Class by Sex by Age in Iona
Disability Class: Hearing Difficulty
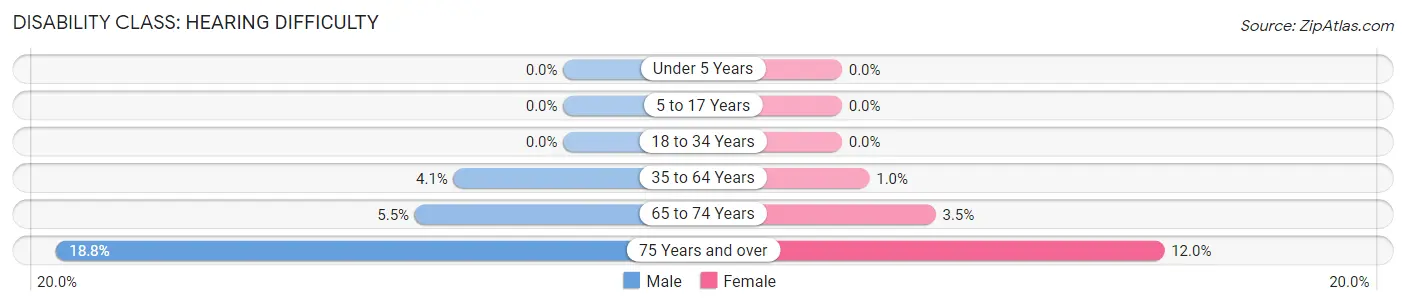
| Age Bracket | Male | Female |
| Under 5 Years | 0 (0.0%) | 0 (0.0%) |
| 5 to 17 Years | 0 (0.0%) | 0 (0.0%) |
| 18 to 34 Years | 0 (0.0%) | 0 (0.0%) |
| 35 to 64 Years | 76 (4.1%) | 24 (1.0%) |
| 65 to 74 Years | 88 (5.5%) | 64 (3.5%) |
| 75 Years and over | 416 (18.8%) | 298 (12.0%) |
Disability Class: Vision Difficulty
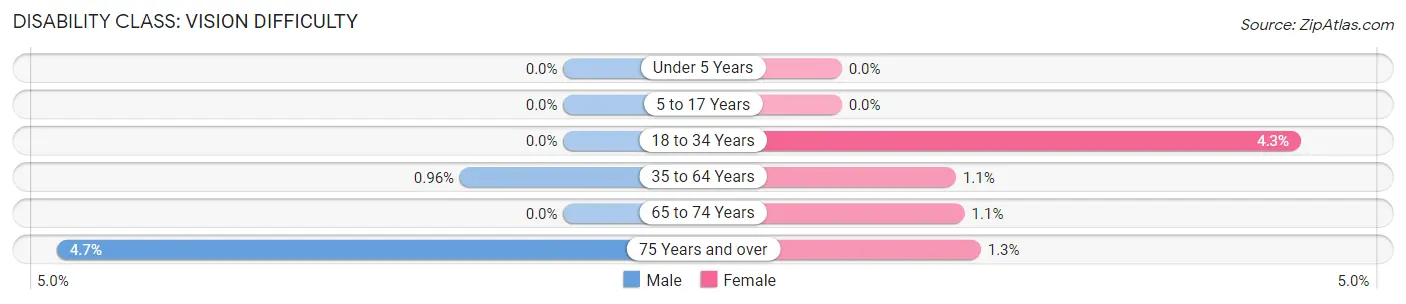
| Age Bracket | Male | Female |
| Under 5 Years | 0 (0.0%) | 0 (0.0%) |
| 5 to 17 Years | 0 (0.0%) | 0 (0.0%) |
| 18 to 34 Years | 0 (0.0%) | 19 (4.3%) |
| 35 to 64 Years | 18 (1.0%) | 25 (1.1%) |
| 65 to 74 Years | 0 (0.0%) | 21 (1.1%) |
| 75 Years and over | 104 (4.7%) | 32 (1.3%) |
Disability Class: Cognitive Difficulty
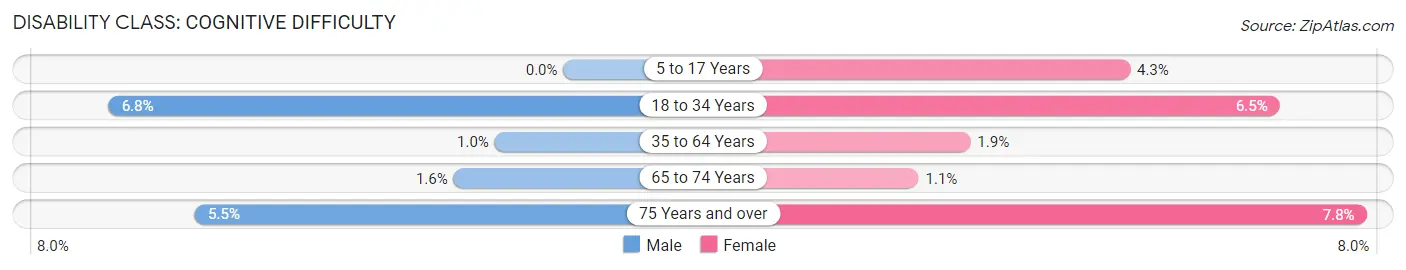
| Age Bracket | Male | Female |
| 5 to 17 Years | 0 (0.0%) | 11 (4.3%) |
| 18 to 34 Years | 36 (6.8%) | 29 (6.5%) |
| 35 to 64 Years | 19 (1.0%) | 45 (1.9%) |
| 65 to 74 Years | 26 (1.6%) | 21 (1.1%) |
| 75 Years and over | 121 (5.5%) | 194 (7.8%) |
Disability Class: Ambulatory Difficulty
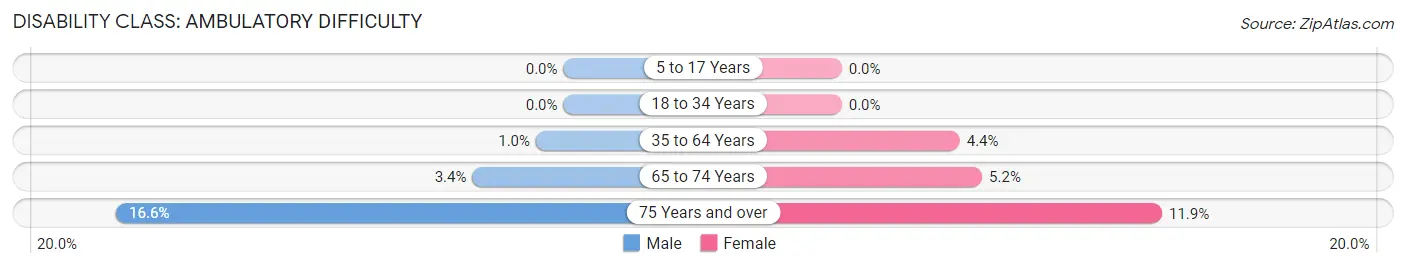
| Age Bracket | Male | Female |
| 5 to 17 Years | 0 (0.0%) | 0 (0.0%) |
| 18 to 34 Years | 0 (0.0%) | 0 (0.0%) |
| 35 to 64 Years | 19 (1.0%) | 103 (4.4%) |
| 65 to 74 Years | 54 (3.4%) | 96 (5.2%) |
| 75 Years and over | 367 (16.6%) | 296 (11.9%) |
Disability Class: Self-Care Difficulty
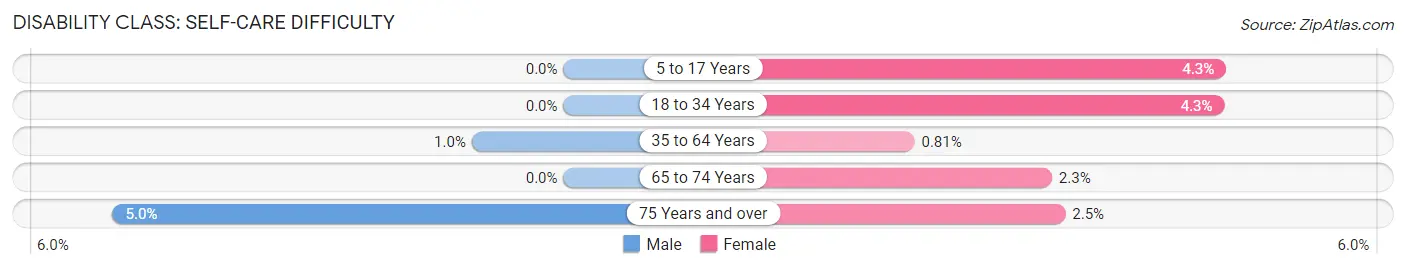
| Age Bracket | Male | Female |
| 5 to 17 Years | 0 (0.0%) | 11 (4.3%) |
| 18 to 34 Years | 0 (0.0%) | 19 (4.3%) |
| 35 to 64 Years | 19 (1.0%) | 19 (0.8%) |
| 65 to 74 Years | 0 (0.0%) | 43 (2.3%) |
| 75 Years and over | 111 (5.0%) | 62 (2.5%) |
Technology Access in Iona
Computing Device Access in Iona
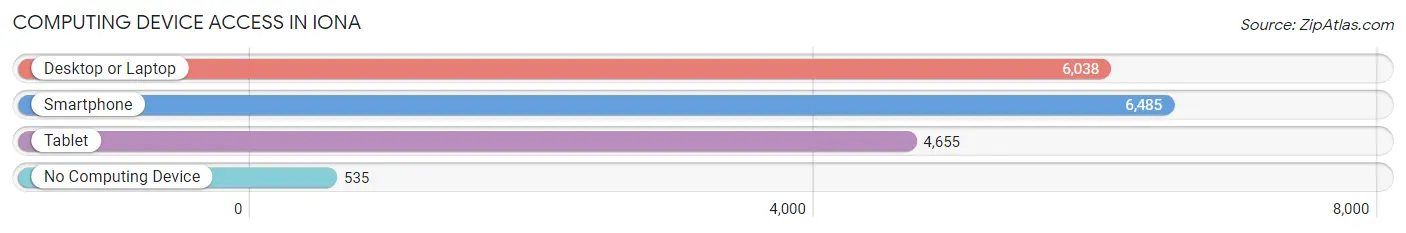
| Device Type | # Households | % Households |
| Desktop or Laptop | 6,038 | 77.0% |
| Smartphone | 6,485 | 82.7% |
| Tablet | 4,655 | 59.4% |
| No Computing Device | 535 | 6.8% |
| Total | 7,842 | 100.0% |
Internet Access in Iona
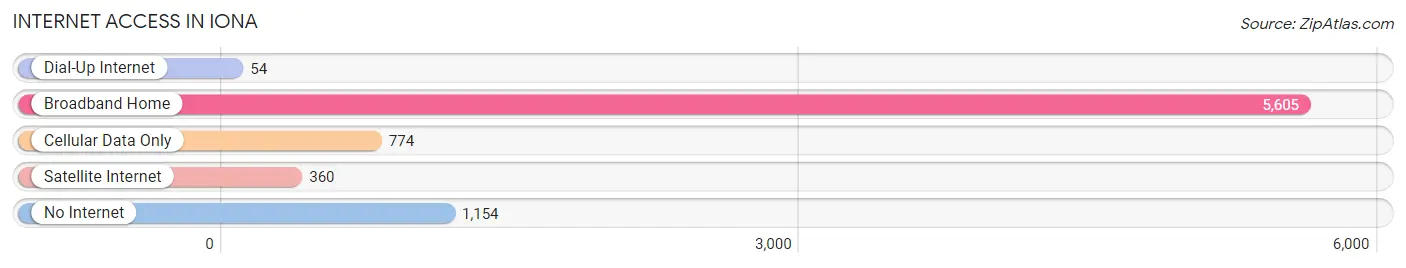
| Internet Type | # Households | % Households |
| Dial-Up Internet | 54 | 0.7% |
| Broadband Home | 5,605 | 71.5% |
| Cellular Data Only | 774 | 9.9% |
| Satellite Internet | 360 | 4.6% |
| No Internet | 1,154 | 14.7% |
| Total | 7,842 | 100.0% |
Iona Summary
Iona is a small unincorporated community located in Lee County, Florida, United States. It is situated on the Caloosahatchee River, approximately 15 miles (24 km) east of Fort Myers. The population of Iona was estimated to be 1,845 in 2019.
History
Iona was first settled in the late 19th century by settlers from the Bahamas. The settlement was named after the island of Iona in Scotland. The first post office was established in 1891. The town was incorporated in 1925, but the incorporation was dissolved in 1927.
Geography
Iona is located at 26°37'N 81°45'W (26.6167, -81.7500). It is situated on the Caloosahatchee River, approximately 15 miles (24 km) east of Fort Myers. The town is bordered by the Caloosahatchee River to the north, the Gulf of Mexico to the west, and the city of Fort Myers to the south.
Economy
Iona is primarily a residential community, with most of its residents commuting to nearby cities for work. The town is home to several small businesses, including a convenience store, a gas station, and a few restaurants. The town also has a marina, which provides access to the Caloosahatchee River and the Gulf of Mexico.
Demographics
As of the 2010 census, there were 1,717 people, 690 households, and 486 families residing in Iona. The population density was 1,072.3 people per square mile (414.7/km2). The racial makeup of the town was 94.2% White, 2.2% African American, 0.5% Native American, 0.7% Asian, 0.1% Pacific Islander, 0.9% from other races, and 1.4% from two or more races. Hispanic or Latino of any race were 4.2% of the population.
The median income for a household in Iona was $45,000, and the median income for a family was $50,000. Males had a median income of $35,000 versus $25,000 for females. The per capita income for the town was $20,000. About 8.2% of families and 10.2% of the population were below the poverty line, including 14.2% of those under age 18 and 6.2% of those age 65 or over.
Common Questions
What is Per Capita Income in Iona?
Per Capita income in Iona is $56,219.
What is the Median Family Income in Iona?
Median Family Income in Iona is $73,137.
What is the Median Household income in Iona?
Median Household Income in Iona is $62,655.
What is Income or Wage Gap in Iona?
Income or Wage Gap in Iona is 22.5%.
Women in Iona earn 77.5 cents for every dollar earned by a man.
What is Inequality or Gini Index in Iona?
Inequality or Gini Index in Iona is 0.53.
What is the Total Population of Iona?
Total Population of Iona is 14,295.
What is the Total Male Population of Iona?
Total Male Population of Iona is 6,519.
What is the Total Female Population of Iona?
Total Female Population of Iona is 7,776.
What is the Ratio of Males per 100 Females in Iona?
There are 83.83 Males per 100 Females in Iona.
What is the Ratio of Females per 100 Males in Iona?
There are 119.28 Females per 100 Males in Iona.
What is the Median Population Age in Iona?
Median Population Age in Iona is 67.9 Years.
What is the Average Family Size in Iona
Average Family Size in Iona is 2.3 People.
What is the Average Household Size in Iona
Average Household Size in Iona is 1.8 People.
How Large is the Labor Force in Iona?
There are 4,701 People in the Labor Forcein in Iona.
What is the Percentage of People in the Labor Force in Iona?
34.1% of People are in the Labor Force in Iona.
What is the Unemployment Rate in Iona?
Unemployment Rate in Iona is 2.5%.