Smithville, TN Map & Demographics
Smithville Map
Smithville Overview
$18,158
PER CAPITA INCOME
$43,311
AVG FAMILY INCOME
$30,526
AVG HOUSEHOLD INCOME
17.9%
WAGE / INCOME GAP [ % ]
82.1¢/ $1
WAGE / INCOME GAP [ $ ]
0.48
INEQUALITY / GINI INDEX
5,059
TOTAL POPULATION
2,239
MALE POPULATION
2,820
FEMALE POPULATION
79.40
MALES / 100 FEMALES
125.95
FEMALES / 100 MALES
43.0
MEDIAN AGE
3.4
AVG FAMILY SIZE
2.4
AVG HOUSEHOLD SIZE
1,542
LABOR FORCE [ PEOPLE ]
40.5%
PERCENT IN LABOR FORCE
5.6%
UNEMPLOYMENT RATE
Smithville Zip Codes
Income in Smithville
Income Overview in Smithville
Per Capita Income in Smithville is $18,158, while median incomes of families and households are $43,311 and $30,526 respectively.
| Characteristic | Number | Measure |
| Per Capita Income | 5,059 | $18,158 |
| Median Family Income | 1,068 | $43,311 |
| Mean Family Income | 1,068 | $60,232 |
| Median Household Income | 2,047 | $30,526 |
| Mean Household Income | 2,047 | $42,341 |
| Income Deficit | 1,068 | $0 |
| Wage / Income Gap (%) | 5,059 | 17.89% |
| Wage / Income Gap ($) | 5,059 | 82.11¢ per $1 |
| Gini / Inequality Index | 5,059 | 0.48 |
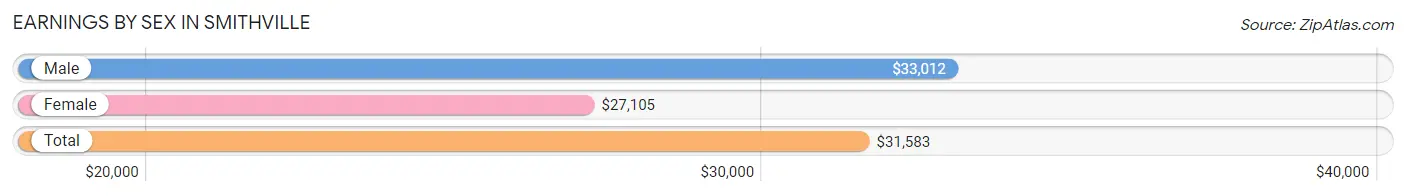
Earnings by Sex in Smithville
Average Earnings in Smithville are $31,583, $33,012 for men and $27,105 for women, a difference of 17.9%.
| Sex | Number | Average Earnings |
| Male | 769 (47.8%) | $33,012 |
| Female | 840 (52.2%) | $27,105 |
| Total | 1,609 (100.0%) | $31,583 |
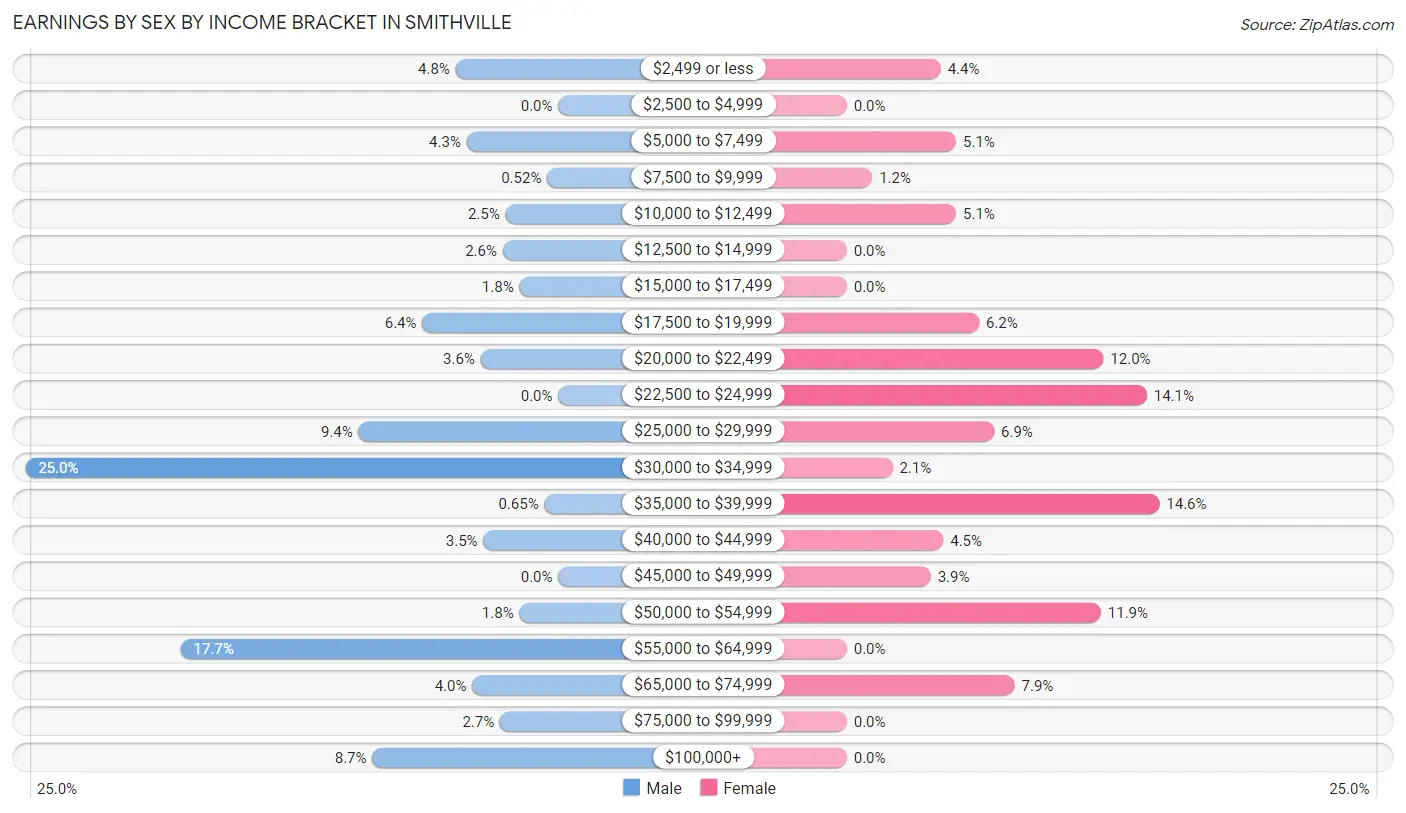
Earnings by Sex by Income Bracket in Smithville
The most common earnings brackets in Smithville are $30,000 to $34,999 for men (192 | 25.0%) and $35,000 to $39,999 for women (123 | 14.6%).
| Income | Male | Female |
| $2,499 or less | 37 (4.8%) | 37 (4.4%) |
| $2,500 to $4,999 | 0 (0.0%) | 0 (0.0%) |
| $5,000 to $7,499 | 33 (4.3%) | 43 (5.1%) |
| $7,500 to $9,999 | 4 (0.5%) | 10 (1.2%) |
| $10,000 to $12,499 | 19 (2.5%) | 43 (5.1%) |
| $12,500 to $14,999 | 20 (2.6%) | 0 (0.0%) |
| $15,000 to $17,499 | 14 (1.8%) | 0 (0.0%) |
| $17,500 to $19,999 | 49 (6.4%) | 52 (6.2%) |
| $20,000 to $22,499 | 28 (3.6%) | 101 (12.0%) |
| $22,500 to $24,999 | 0 (0.0%) | 118 (14.1%) |
| $25,000 to $29,999 | 72 (9.4%) | 58 (6.9%) |
| $30,000 to $34,999 | 192 (25.0%) | 18 (2.1%) |
| $35,000 to $39,999 | 5 (0.6%) | 123 (14.6%) |
| $40,000 to $44,999 | 27 (3.5%) | 38 (4.5%) |
| $45,000 to $49,999 | 0 (0.0%) | 33 (3.9%) |
| $50,000 to $54,999 | 14 (1.8%) | 100 (11.9%) |
| $55,000 to $64,999 | 136 (17.7%) | 0 (0.0%) |
| $65,000 to $74,999 | 31 (4.0%) | 66 (7.9%) |
| $75,000 to $99,999 | 21 (2.7%) | 0 (0.0%) |
| $100,000+ | 67 (8.7%) | 0 (0.0%) |
| Total | 769 (100.0%) | 840 (100.0%) |
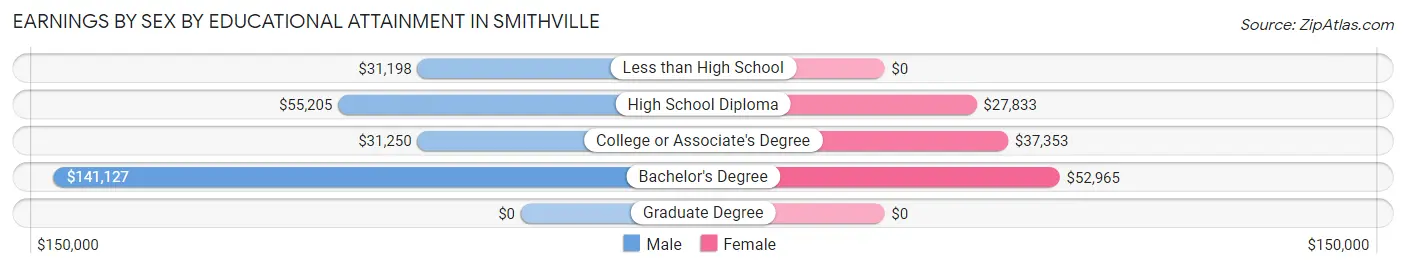
Earnings by Sex by Educational Attainment in Smithville
Average earnings in Smithville are $34,452 for men and $27,692 for women, a difference of 19.6%. Men with an educational attainment of bachelor's degree enjoy the highest average annual earnings of $141,127, while those with less than high school education earn the least with $31,198. Women with an educational attainment of bachelor's degree earn the most with the average annual earnings of $52,965, while those with high school diploma education have the smallest earnings of $27,833.
| Educational Attainment | Male Income | Female Income |
| Less than High School | $31,198 | $0 |
| High School Diploma | $55,205 | $27,833 |
| College or Associate's Degree | $31,250 | $37,353 |
| Bachelor's Degree | $141,127 | $52,965 |
| Graduate Degree | - | - |
| Total | $34,452 | $27,692 |
Family Income in Smithville
Family Income Brackets in Smithville
According to the Smithville family income data, there are 238 families falling into the $35,000 to $49,999 income range, which is the most common income bracket and makes up 22.3% of all families. Conversely, the $200,000+ income bracket is the least frequent group with only 16 families (1.5%) belonging to this category.
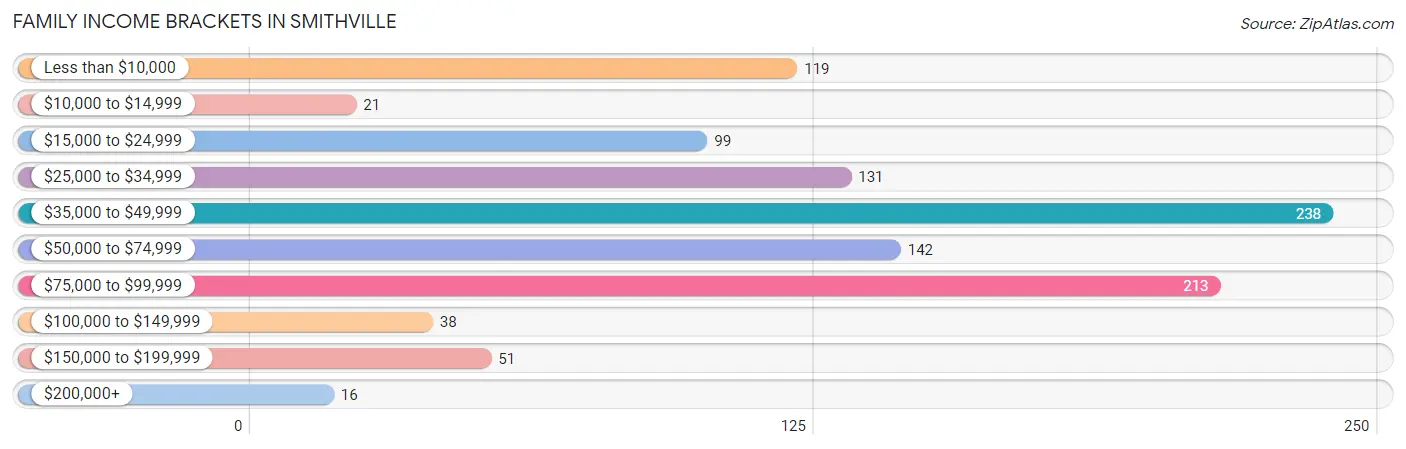
| Income Bracket | # Families | % Families |
| Less than $10,000 | 119 | 11.1% |
| $10,000 to $14,999 | 21 | 2.0% |
| $15,000 to $24,999 | 99 | 9.3% |
| $25,000 to $34,999 | 131 | 12.3% |
| $35,000 to $49,999 | 238 | 22.3% |
| $50,000 to $74,999 | 142 | 13.3% |
| $75,000 to $99,999 | 213 | 19.9% |
| $100,000 to $149,999 | 38 | 3.6% |
| $150,000 to $199,999 | 51 | 4.8% |
| $200,000+ | 16 | 1.5% |
Family Income by Famaliy Size in Smithville
5-person families (170 | 15.9%) account for the highest median family income in Smithville with $55,216 per family, while 2-person families (323 | 30.2%) have the highest median income of $22,174 per family member.
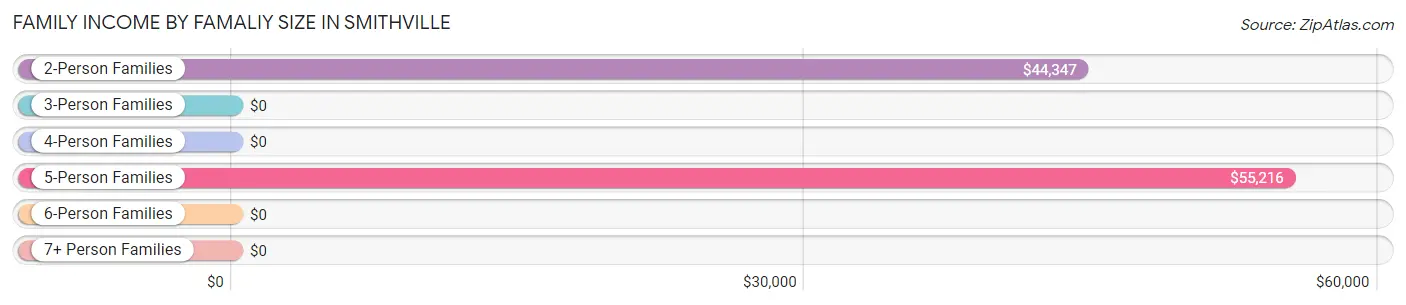
| Income Bracket | # Families | Median Income |
| 2-Person Families | 323 (30.2%) | $44,347 |
| 3-Person Families | 285 (26.7%) | $0 |
| 4-Person Families | 230 (21.5%) | $0 |
| 5-Person Families | 170 (15.9%) | $55,216 |
| 6-Person Families | 35 (3.3%) | $0 |
| 7+ Person Families | 25 (2.3%) | $0 |
| Total | 1,068 (100.0%) | $43,311 |
Family Income by Number of Earners in Smithville
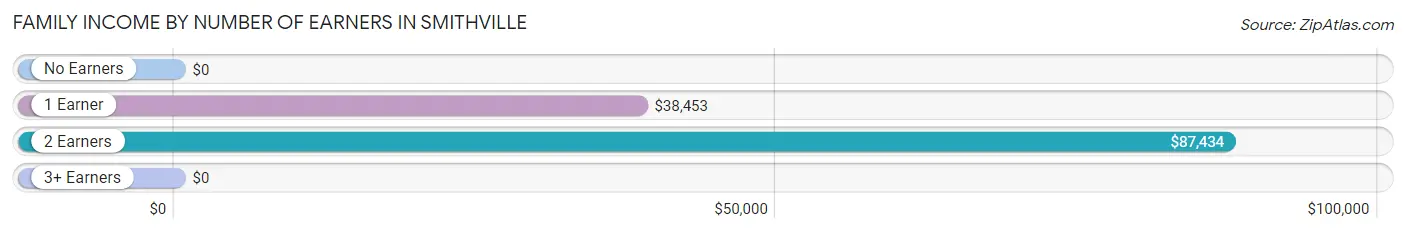
| Number of Earners | # Families | Median Income |
| No Earners | 285 (26.7%) | $0 |
| 1 Earner | 414 (38.8%) | $38,453 |
| 2 Earners | 362 (33.9%) | $87,434 |
| 3+ Earners | 7 (0.7%) | $0 |
| Total | 1,068 (100.0%) | $43,311 |
Household Income in Smithville
Household Income Brackets in Smithville
With 375 households falling in the category, the $15,000 to $24,999 income range is the most frequent in Smithville, accounting for 18.3% of all households. In contrast, only 16 households (0.8%) fall into the $200,000+ income bracket, making it the least populous group.
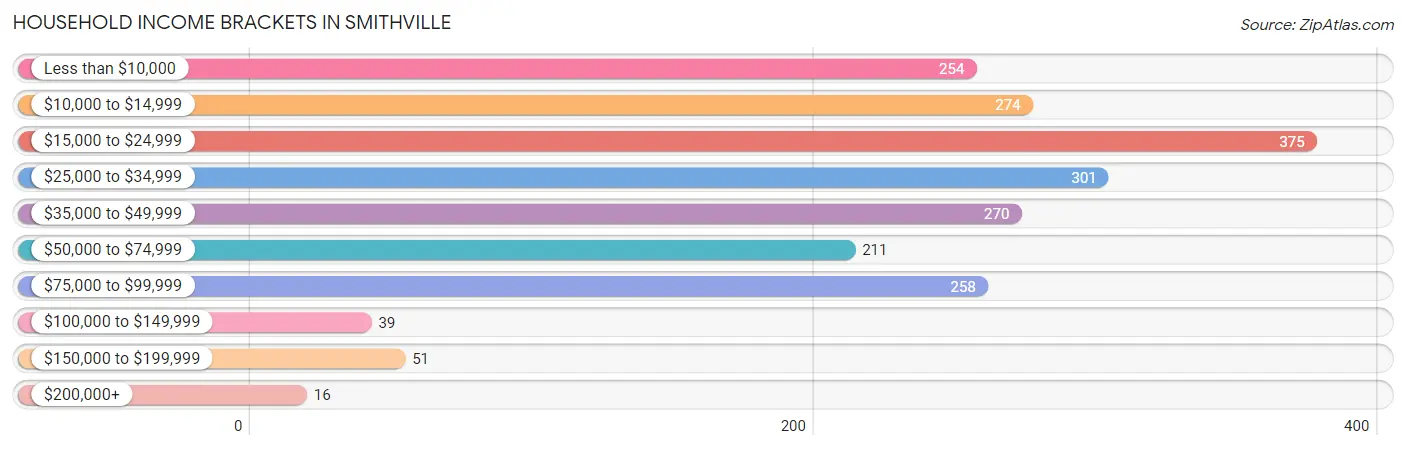
| Income Bracket | # Households | % Households |
| Less than $10,000 | 254 | 12.4% |
| $10,000 to $14,999 | 274 | 13.4% |
| $15,000 to $24,999 | 375 | 18.3% |
| $25,000 to $34,999 | 301 | 14.7% |
| $35,000 to $49,999 | 270 | 13.2% |
| $50,000 to $74,999 | 211 | 10.3% |
| $75,000 to $99,999 | 258 | 12.6% |
| $100,000 to $149,999 | 39 | 1.9% |
| $150,000 to $199,999 | 51 | 2.5% |
| $200,000+ | 16 | 0.8% |
Household Income by Householder Age in Smithville
The median household income in Smithville is $30,526, with the highest median household income of $46,538 found in the 25 to 44 years age bracket for the primary householder. A total of 606 households (29.6%) fall into this category. Meanwhile, the 15 to 24 years age bracket for the primary householder has the lowest median household income of $0, with 5 households (0.2%) in this group.
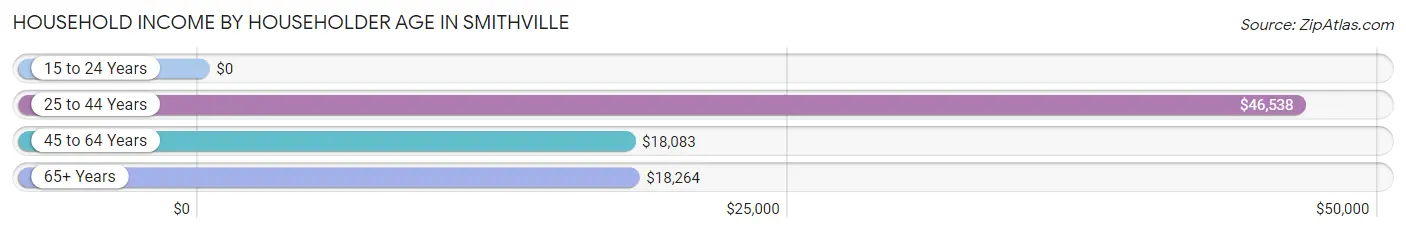
| Income Bracket | # Households | Median Income |
| 15 to 24 Years | 5 (0.2%) | $0 |
| 25 to 44 Years | 606 (29.6%) | $46,538 |
| 45 to 64 Years | 933 (45.6%) | $18,083 |
| 65+ Years | 503 (24.6%) | $18,264 |
| Total | 2,047 (100.0%) | $30,526 |
Poverty in Smithville
Income Below Poverty by Sex and Age in Smithville
With 31.4% poverty level for males and 37.4% for females among the residents of Smithville, 15 year old males and 55 to 64 year old females are the most vulnerable to poverty, with 12 males (100.0%) and 315 females (77.0%) in their respective age groups living below the poverty level.
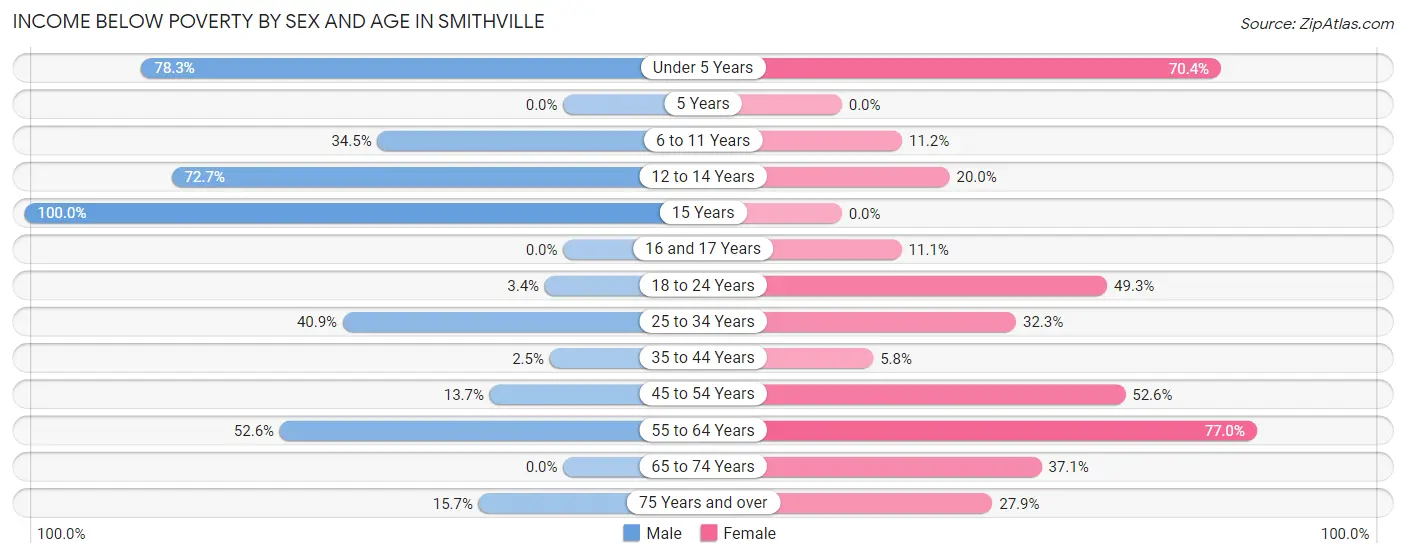
| Age Bracket | Male | Female |
| Under 5 Years | 278 (78.3%) | 133 (70.4%) |
| 5 Years | 0 (0.0%) | 0 (0.0%) |
| 6 to 11 Years | 59 (34.5%) | 17 (11.2%) |
| 12 to 14 Years | 40 (72.7%) | 25 (20.0%) |
| 15 Years | 12 (100.0%) | 0 (0.0%) |
| 16 and 17 Years | 0 (0.0%) | 2 (11.1%) |
| 18 to 24 Years | 5 (3.4%) | 33 (49.2%) |
| 25 to 34 Years | 72 (40.9%) | 87 (32.3%) |
| 35 to 44 Years | 6 (2.5%) | 26 (5.8%) |
| 45 to 54 Years | 58 (13.7%) | 221 (52.6%) |
| 55 to 64 Years | 111 (52.6%) | 315 (77.0%) |
| 65 to 74 Years | 0 (0.0%) | 89 (37.1%) |
| 75 Years and over | 19 (15.7%) | 62 (27.9%) |
| Total | 660 (31.4%) | 1,010 (37.4%) |
Income Above Poverty by Sex and Age in Smithville
According to the poverty statistics in Smithville, males aged 16 and 17 years and females aged 5 years are the age groups that are most secure financially, with 100.0% of males and 100.0% of females in these age groups living above the poverty line.
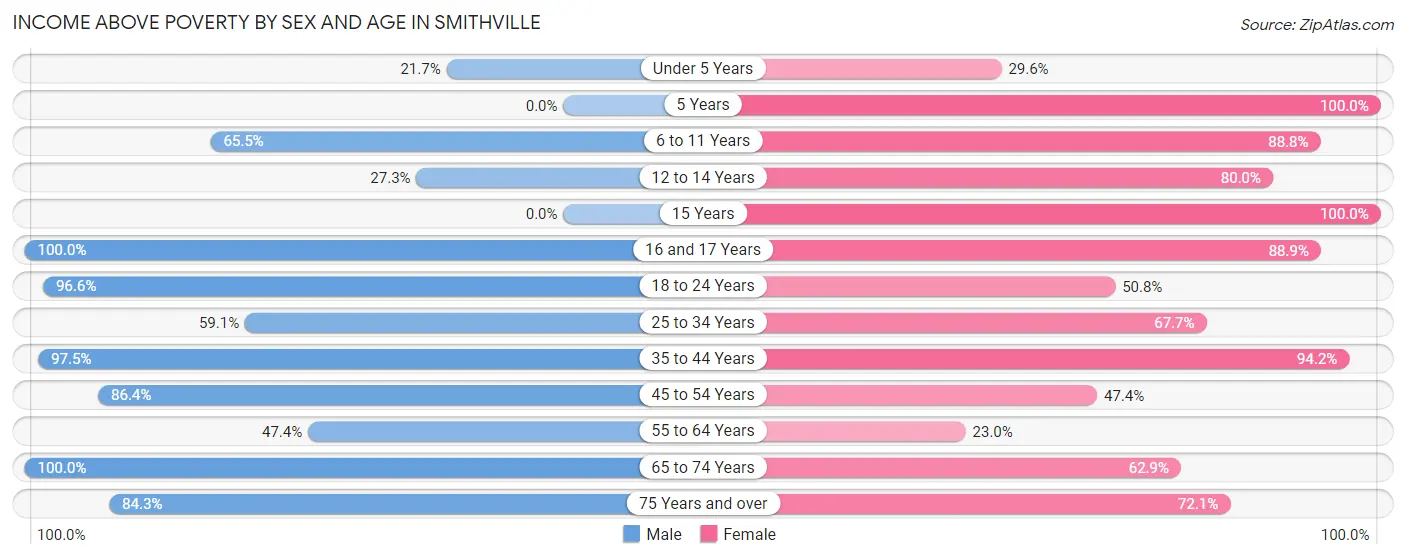
| Age Bracket | Male | Female |
| Under 5 Years | 77 (21.7%) | 56 (29.6%) |
| 5 Years | 0 (0.0%) | 7 (100.0%) |
| 6 to 11 Years | 112 (65.5%) | 135 (88.8%) |
| 12 to 14 Years | 15 (27.3%) | 100 (80.0%) |
| 15 Years | 0 (0.0%) | 133 (100.0%) |
| 16 and 17 Years | 109 (100.0%) | 16 (88.9%) |
| 18 to 24 Years | 141 (96.6%) | 34 (50.7%) |
| 25 to 34 Years | 104 (59.1%) | 182 (67.7%) |
| 35 to 44 Years | 232 (97.5%) | 420 (94.2%) |
| 45 to 54 Years | 367 (86.4%) | 199 (47.4%) |
| 55 to 64 Years | 100 (47.4%) | 94 (23.0%) |
| 65 to 74 Years | 84 (100.0%) | 151 (62.9%) |
| 75 Years and over | 102 (84.3%) | 160 (72.1%) |
| Total | 1,443 (68.6%) | 1,687 (62.5%) |
Income Below Poverty Among Married-Couple Families in Smithville
The poverty statistics for married-couple families in Smithville show that 19.8% or 176 of the total 888 families live below the poverty line. Families with 3 or 4 children have the highest poverty rate of 45.9%, comprising of 78 families. On the other hand, families with 5 or more children have the lowest poverty rate of 0.0%, which includes 0 families.
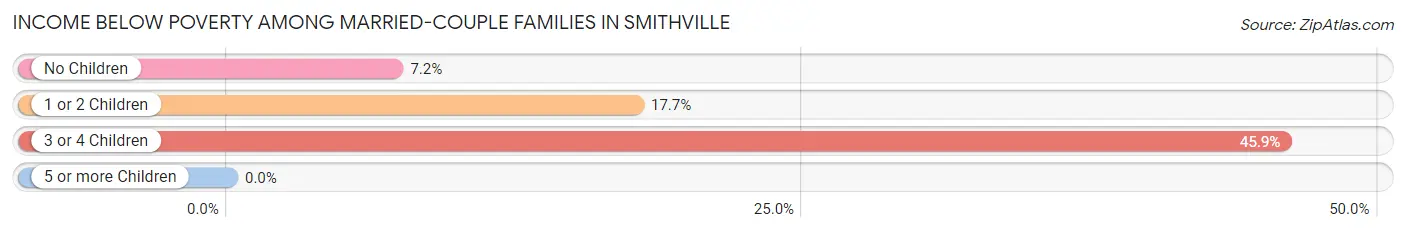
| Children | Above Poverty | Below Poverty |
| No Children | 245 (92.8%) | 19 (7.2%) |
| 1 or 2 Children | 368 (82.3%) | 79 (17.7%) |
| 3 or 4 Children | 92 (54.1%) | 78 (45.9%) |
| 5 or more Children | 7 (100.0%) | 0 (0.0%) |
| Total | 712 (80.2%) | 176 (19.8%) |
Income Below Poverty Among Single-Parent Households in Smithville
According to the poverty data in Smithville, 50.0% or 5 single-father households and 40.0% or 68 single-mother households are living below the poverty line. Among single-father households, those with 1 or 2 children have the highest poverty rate, with 5 households (100.0%) experiencing poverty. Likewise, among single-mother households, those with 3 or 4 children have the highest poverty rate, with 21 households (53.8%) falling below the poverty line.
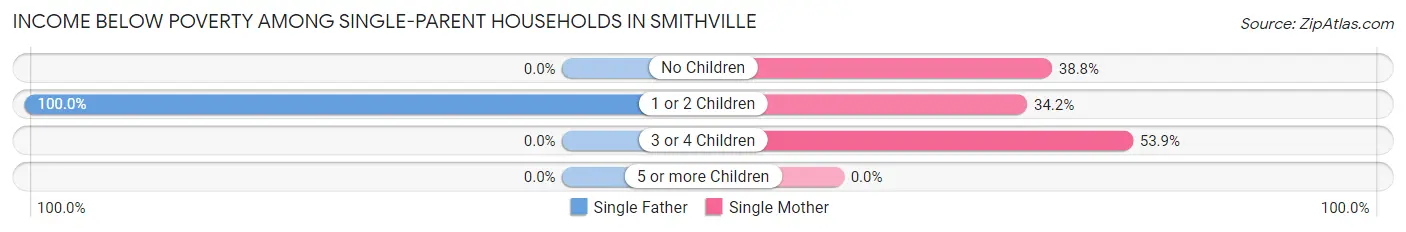
| Children | Single Father | Single Mother |
| No Children | 0 (0.0%) | 19 (38.8%) |
| 1 or 2 Children | 5 (100.0%) | 28 (34.2%) |
| 3 or 4 Children | 0 (0.0%) | 21 (53.8%) |
| 5 or more Children | 0 (0.0%) | 0 (0.0%) |
| Total | 5 (50.0%) | 68 (40.0%) |
Income Below Poverty Among Married-Couple vs Single-Parent Households in Smithville
The poverty data for Smithville shows that 176 of the married-couple family households (19.8%) and 73 of the single-parent households (40.6%) are living below the poverty level. Within the married-couple family households, those with 3 or 4 children have the highest poverty rate, with 78 households (45.9%) falling below the poverty line. Among the single-parent households, those with 3 or 4 children have the highest poverty rate, with 21 household (53.8%) living below poverty.
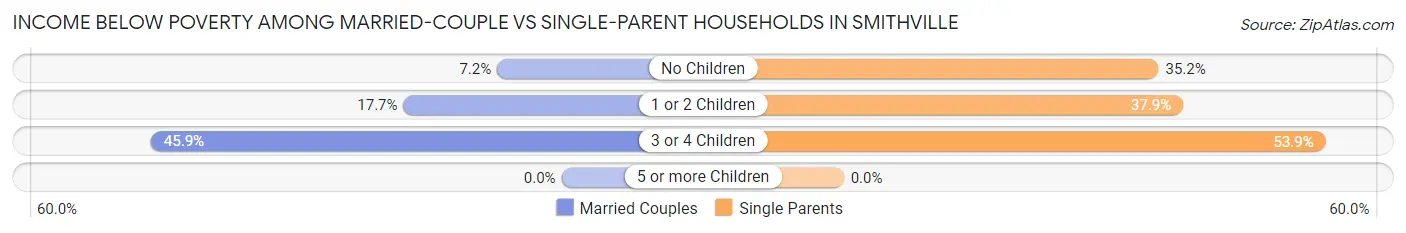
| Children | Married-Couple Families | Single-Parent Households |
| No Children | 19 (7.2%) | 19 (35.2%) |
| 1 or 2 Children | 79 (17.7%) | 33 (37.9%) |
| 3 or 4 Children | 78 (45.9%) | 21 (53.8%) |
| 5 or more Children | 0 (0.0%) | 0 (0.0%) |
| Total | 176 (19.8%) | 73 (40.6%) |
Race in Smithville
The most populous races in Smithville are White / Caucasian (4,346 | 85.9%), Hispanic or Latino (919 | 18.2%), and Two or more Races (302 | 6.0%).
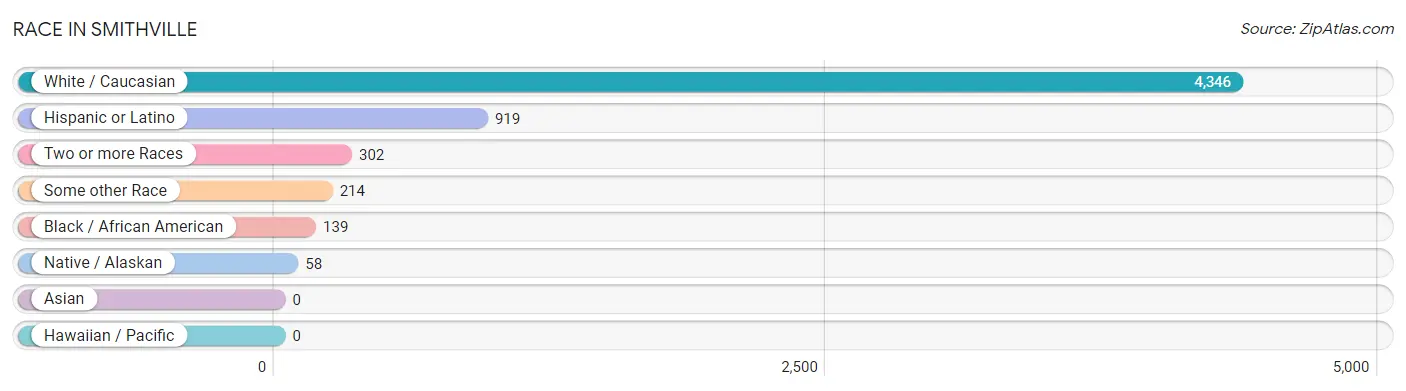
| Race | # Population | % Population |
| Asian | 0 | 0.0% |
| Black / African American | 139 | 2.8% |
| Hawaiian / Pacific | 0 | 0.0% |
| Hispanic or Latino | 919 | 18.2% |
| Native / Alaskan | 58 | 1.1% |
| White / Caucasian | 4,346 | 85.9% |
| Two or more Races | 302 | 6.0% |
| Some other Race | 214 | 4.2% |
| Total | 5,059 | 100.0% |
Ancestry in Smithville
The most populous ancestries reported in Smithville are Mexican (847 | 16.7%), American (796 | 15.7%), Irish (424 | 8.4%), English (345 | 6.8%), and German (281 | 5.6%), together accounting for 53.2% of all Smithville residents.
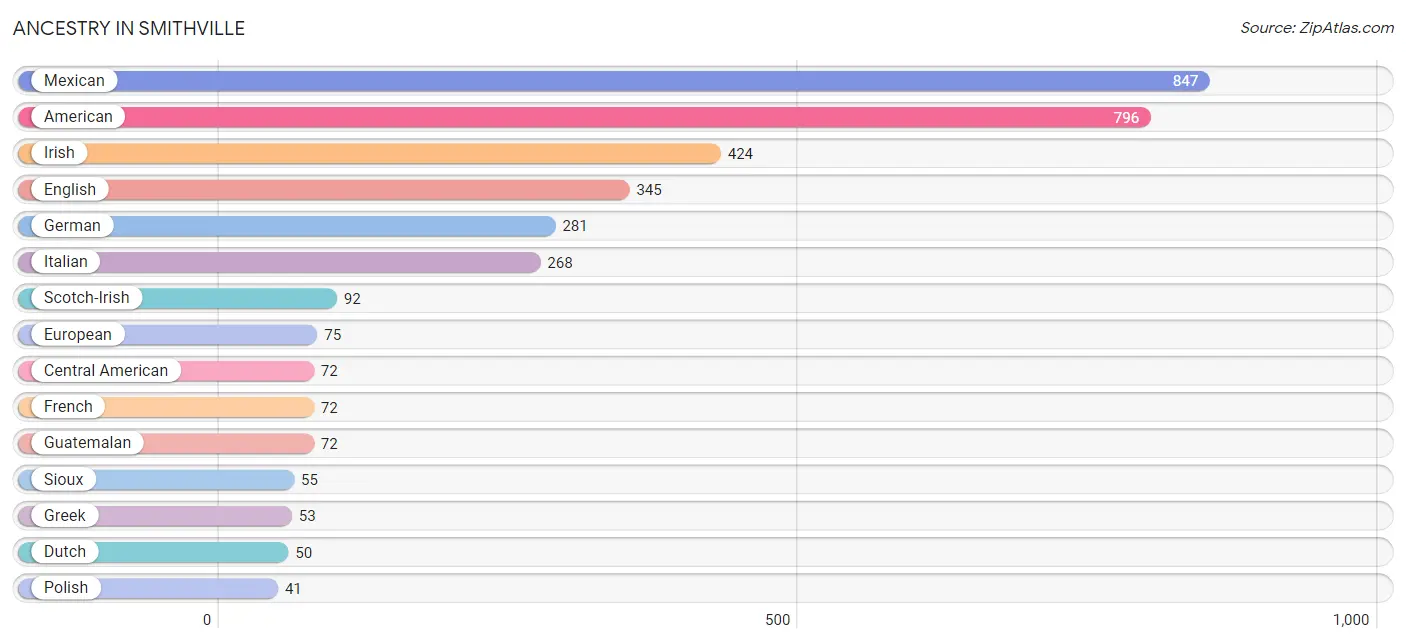
| Ancestry | # Population | % Population |
| American | 796 | 15.7% |
| Central American | 72 | 1.4% |
| Cherokee | 4 | 0.1% |
| Dutch | 50 | 1.0% |
| English | 345 | 6.8% |
| European | 75 | 1.5% |
| French | 72 | 1.4% |
| French Canadian | 30 | 0.6% |
| German | 281 | 5.6% |
| Greek | 53 | 1.1% |
| Guatemalan | 72 | 1.4% |
| Irish | 424 | 8.4% |
| Italian | 268 | 5.3% |
| Mexican | 847 | 16.7% |
| Polish | 41 | 0.8% |
| Russian | 23 | 0.4% |
| Scotch-Irish | 92 | 1.8% |
| Scottish | 22 | 0.4% |
| Sioux | 55 | 1.1% | View All 19 Rows |
Immigrants in Smithville
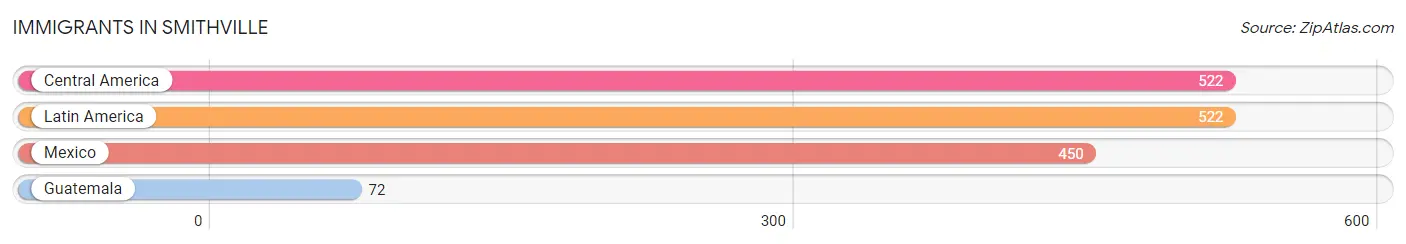
The most numerous immigrant groups reported in Smithville came from Central America (522 | 10.3%), Latin America (522 | 10.3%), Mexico (450 | 8.9%), and Guatemala (72 | 1.4%), together accounting for 31.0% of all Smithville residents.
| Immigration Origin | # Population | % Population |
| Central America | 522 | 10.3% |
| Guatemala | 72 | 1.4% |
| Latin America | 522 | 10.3% |
| Mexico | 450 | 8.9% | View All 4 Rows |
Sex and Age in Smithville
Sex and Age in Smithville
The most populous age groups in Smithville are Under 5 Years (355 | 15.9%) for men and 40 to 44 Years (413 | 14.6%) for women.
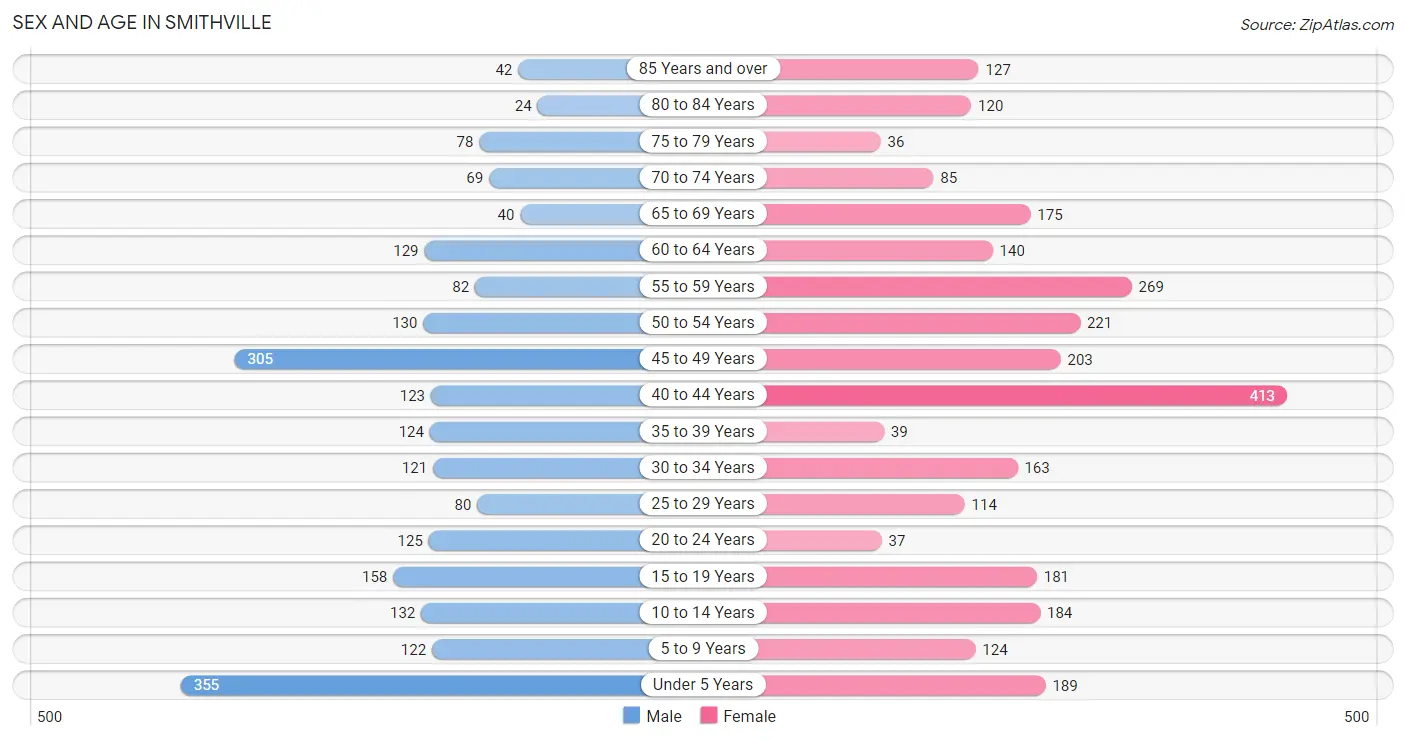
| Age Bracket | Male | Female |
| Under 5 Years | 355 (15.9%) | 189 (6.7%) |
| 5 to 9 Years | 122 (5.4%) | 124 (4.4%) |
| 10 to 14 Years | 132 (5.9%) | 184 (6.5%) |
| 15 to 19 Years | 158 (7.1%) | 181 (6.4%) |
| 20 to 24 Years | 125 (5.6%) | 37 (1.3%) |
| 25 to 29 Years | 80 (3.6%) | 114 (4.0%) |
| 30 to 34 Years | 121 (5.4%) | 163 (5.8%) |
| 35 to 39 Years | 124 (5.5%) | 39 (1.4%) |
| 40 to 44 Years | 123 (5.5%) | 413 (14.6%) |
| 45 to 49 Years | 305 (13.6%) | 203 (7.2%) |
| 50 to 54 Years | 130 (5.8%) | 221 (7.8%) |
| 55 to 59 Years | 82 (3.7%) | 269 (9.5%) |
| 60 to 64 Years | 129 (5.8%) | 140 (5.0%) |
| 65 to 69 Years | 40 (1.8%) | 175 (6.2%) |
| 70 to 74 Years | 69 (3.1%) | 85 (3.0%) |
| 75 to 79 Years | 78 (3.5%) | 36 (1.3%) |
| 80 to 84 Years | 24 (1.1%) | 120 (4.3%) |
| 85 Years and over | 42 (1.9%) | 127 (4.5%) |
| Total | 2,239 (100.0%) | 2,820 (100.0%) |
Families and Households in Smithville
Median Family Size in Smithville
The median family size in Smithville is 3.43 persons per family, with single male/father families (10 | 0.9%) accounting for the largest median family size of 21.2 persons per family. On the other hand, single female/mother families (170 | 15.9%) represent the smallest median family size with 2.98 persons per family.
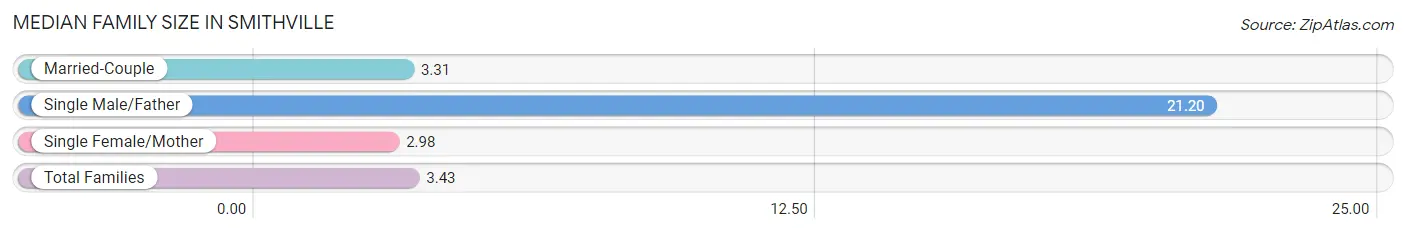
| Family Type | # Families | Family Size |
| Married-Couple | 888 (83.2%) | 3.31 |
| Single Male/Father | 10 (0.9%) | 21.20 |
| Single Female/Mother | 170 (15.9%) | 2.98 |
| Total Families | 1,068 (100.0%) | 3.43 |
Median Household Size in Smithville
The median household size in Smithville is 2.37 persons per household, with single male/father households (10 | 0.5%) accounting for the largest median household size of 21.2 persons per household. non-family households (979 | 47.8%) represent the smallest median household size with 1.21 persons per household.
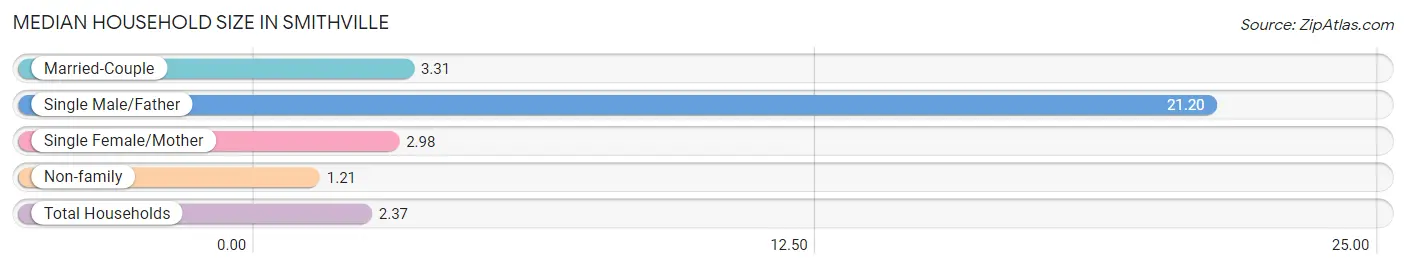
| Household Type | # Households | Household Size |
| Married-Couple | 888 (43.4%) | 3.31 |
| Single Male/Father | 10 (0.5%) | 21.20 |
| Single Female/Mother | 170 (8.3%) | 2.98 |
| Non-family | 979 (47.8%) | 1.21 |
| Total Households | 2,047 (100.0%) | 2.37 |
Household Size by Marriage Status in Smithville
Out of a total of 2,047 households in Smithville, 1,068 (52.2%) are family households, while 979 (47.8%) are nonfamily households. The most numerous type of family households are 2-person households, comprising 323, and the most common type of nonfamily households are 1-person households, comprising 798.
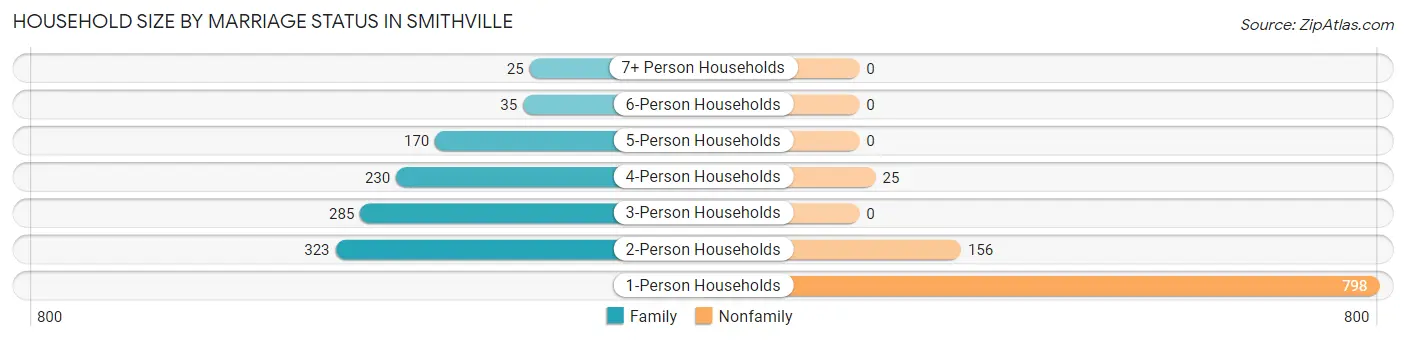
| Household Size | Family Households | Nonfamily Households |
| 1-Person Households | - | 798 (39.0%) |
| 2-Person Households | 323 (15.8%) | 156 (7.6%) |
| 3-Person Households | 285 (13.9%) | 0 (0.0%) |
| 4-Person Households | 230 (11.2%) | 25 (1.2%) |
| 5-Person Households | 170 (8.3%) | 0 (0.0%) |
| 6-Person Households | 35 (1.7%) | 0 (0.0%) |
| 7+ Person Households | 25 (1.2%) | 0 (0.0%) |
| Total | 1,068 (52.2%) | 979 (47.8%) |
Female Fertility in Smithville
Fertility by Age in Smithville
Average fertility rate in Smithville is 3.0 births per 1,000 women. Women in the age bracket of 20 to 34 years have the highest fertility rate with 13.0 births per 1,000 women. Women in the age bracket of 20 to 34 years acount for 100.0% of all women with births.
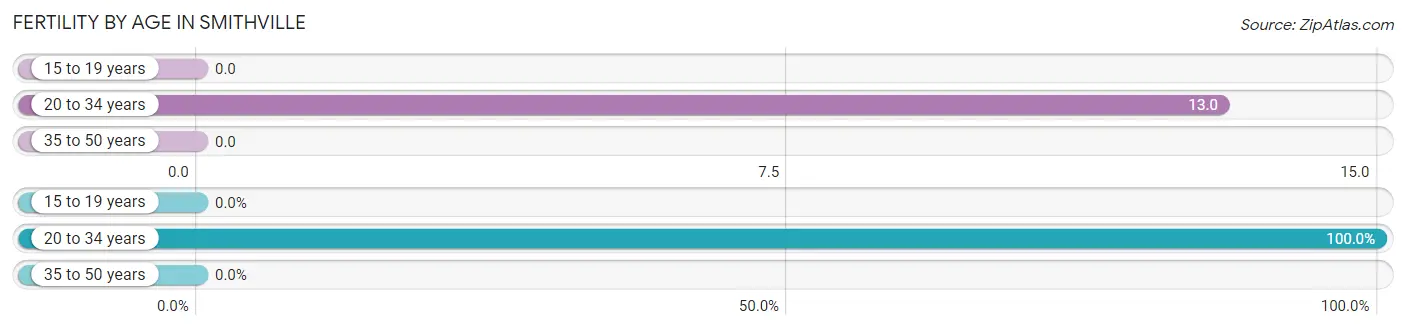
| Age Bracket | Women with Births | Births / 1,000 Women |
| 15 to 19 years | 0 (0.0%) | 0.0 |
| 20 to 34 years | 4 (100.0%) | 13.0 |
| 35 to 50 years | 0 (0.0%) | 0.0 |
| Total | 4 (100.0%) | 3.0 |
Fertility by Age by Marriage Status in Smithville
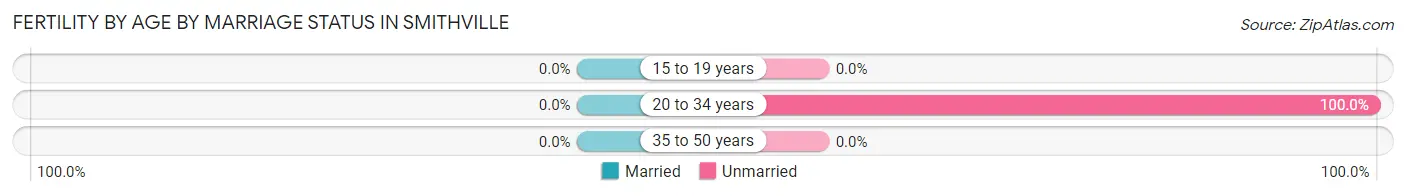
| Age Bracket | Married | Unmarried |
| 15 to 19 years | 0 (0.0%) | 0 (0.0%) |
| 20 to 34 years | 0 (0.0%) | 4 (100.0%) |
| 35 to 50 years | 0 (0.0%) | 0 (0.0%) |
| Total | 0 (0.0%) | 4 (100.0%) |
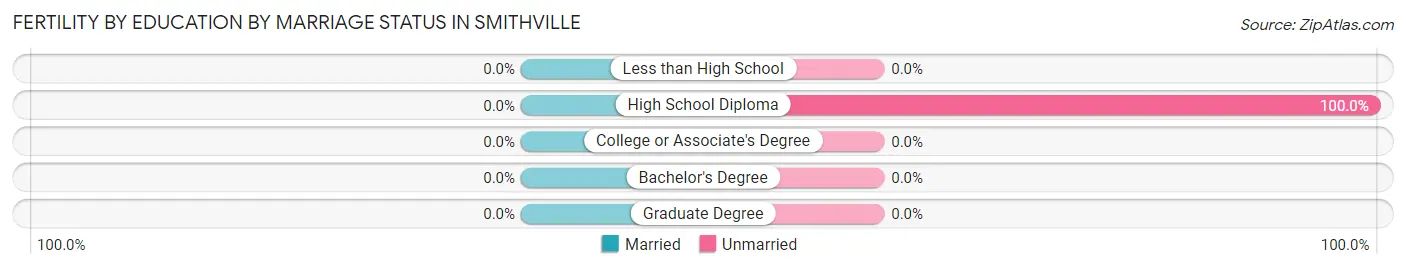
Fertility by Education in Smithville
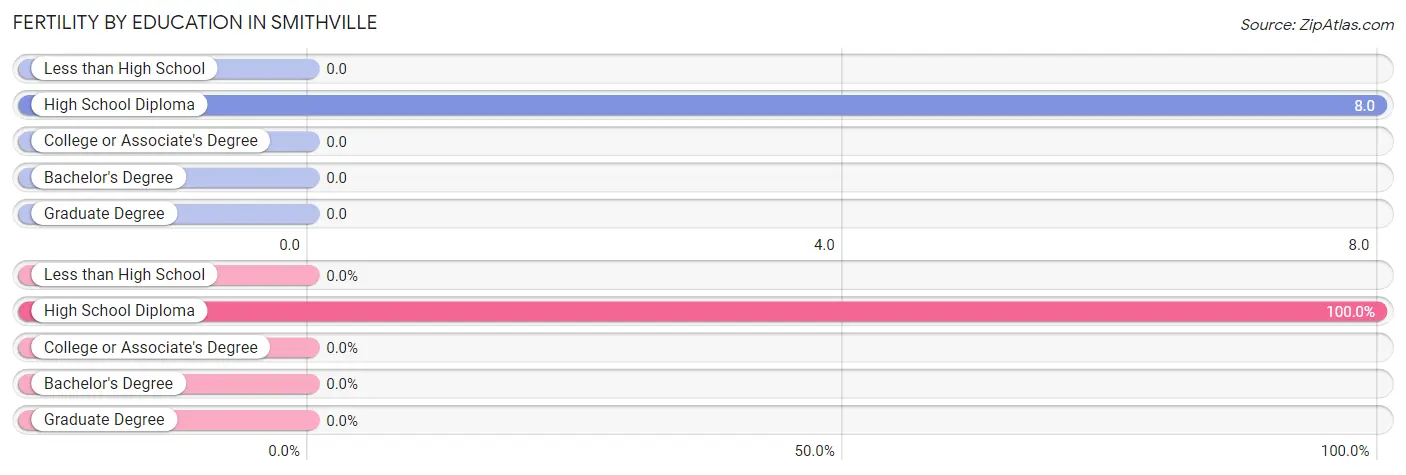
| Educational Attainment | Women with Births | Births / 1,000 Women |
| Less than High School | 0 (0.0%) | 0.0 |
| High School Diploma | 4 (100.0%) | 8.0 |
| College or Associate's Degree | 0 (0.0%) | 0.0 |
| Bachelor's Degree | 0 (0.0%) | 0.0 |
| Graduate Degree | 0 (0.0%) | 0.0 |
| Total | 4 (100.0%) | 3.0 |
Fertility by Education by Marriage Status in Smithville
| Educational Attainment | Married | Unmarried |
| Less than High School | 0 (0.0%) | 0 (0.0%) |
| High School Diploma | 0 (0.0%) | 4 (100.0%) |
| College or Associate's Degree | 0 (0.0%) | 0 (0.0%) |
| Bachelor's Degree | 0 (0.0%) | 0 (0.0%) |
| Graduate Degree | 0 (0.0%) | 0 (0.0%) |
| Total | 0 (0.0%) | 4 (100.0%) |
Employment Characteristics in Smithville
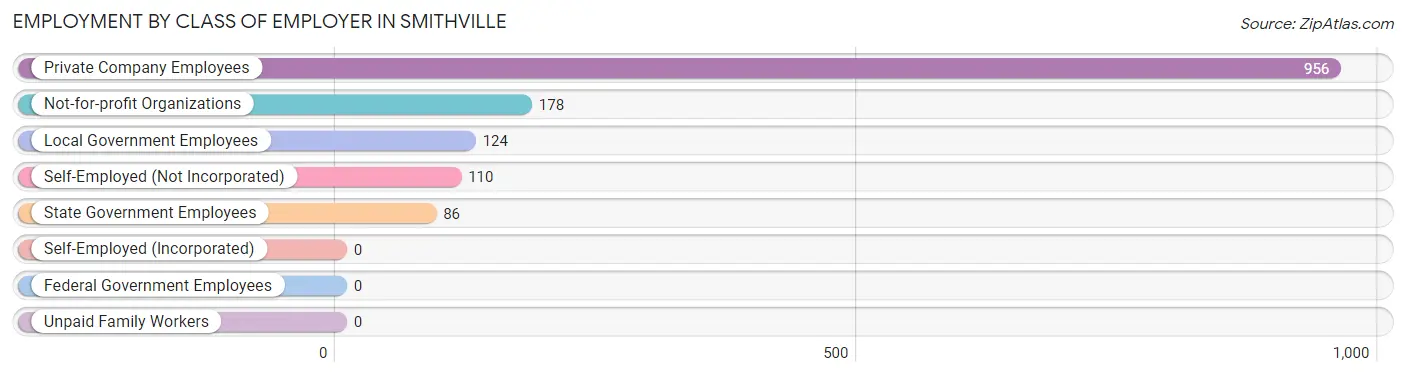
Employment by Class of Employer in Smithville
Among the 1,454 employed individuals in Smithville, private company employees (956 | 65.7%), not-for-profit organizations (178 | 12.2%), and local government employees (124 | 8.5%) make up the most common classes of employment.
| Employer Class | # Employees | % Employees |
| Private Company Employees | 956 | 65.7% |
| Self-Employed (Incorporated) | 0 | 0.0% |
| Self-Employed (Not Incorporated) | 110 | 7.6% |
| Not-for-profit Organizations | 178 | 12.2% |
| Local Government Employees | 124 | 8.5% |
| State Government Employees | 86 | 5.9% |
| Federal Government Employees | 0 | 0.0% |
| Unpaid Family Workers | 0 | 0.0% |
| Total | 1,454 | 100.0% |
Employment Status by Age in Smithville
According to the labor force statistics for Smithville, out of the total population over 16 years of age (3,808), 40.5% or 1,542 individuals are in the labor force, with 5.6% or 86 of them unemployed. The age group with the highest labor force participation rate is 35 to 44 years, with 84.5% or 591 individuals in the labor force. Within the labor force, the 25 to 29 years age range has the highest percentage of unemployed individuals, with 34.0% or 54 of them being unemployed.
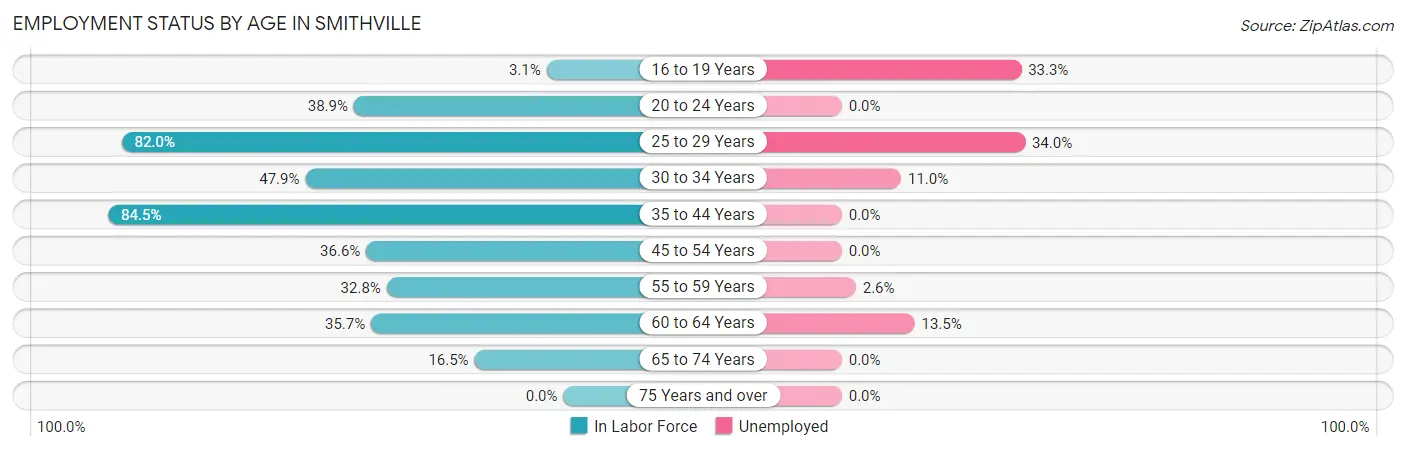
| Age Bracket | In Labor Force | Unemployed |
| 16 to 19 Years | 6 (3.1%) | 2 (33.3%) |
| 20 to 24 Years | 63 (38.9%) | 0 (0.0%) |
| 25 to 29 Years | 159 (82.0%) | 54 (34.0%) |
| 30 to 34 Years | 136 (47.9%) | 15 (11.0%) |
| 35 to 44 Years | 591 (84.5%) | 0 (0.0%) |
| 45 to 54 Years | 314 (36.6%) | 0 (0.0%) |
| 55 to 59 Years | 115 (32.8%) | 3 (2.6%) |
| 60 to 64 Years | 96 (35.7%) | 13 (13.5%) |
| 65 to 74 Years | 61 (16.5%) | 0 (0.0%) |
| 75 Years and over | 0 (0.0%) | 0 (0.0%) |
| Total | 1,542 (40.5%) | 86 (5.6%) |
Employment Status by Educational Attainment in Smithville
According to labor force statistics for Smithville, 53.1% of individuals (1,410) out of the total population between 25 and 64 years of age (2,656) are in the labor force, with 6.0% or 85 of them being unemployed. The group with the highest labor force participation rate are those with the educational attainment of bachelor's degree or higher, with 78.6% or 338 individuals in the labor force. Within the labor force, individuals with high school diploma education have the highest percentage of unemployment, with 8.2% or 45 of them being unemployed.
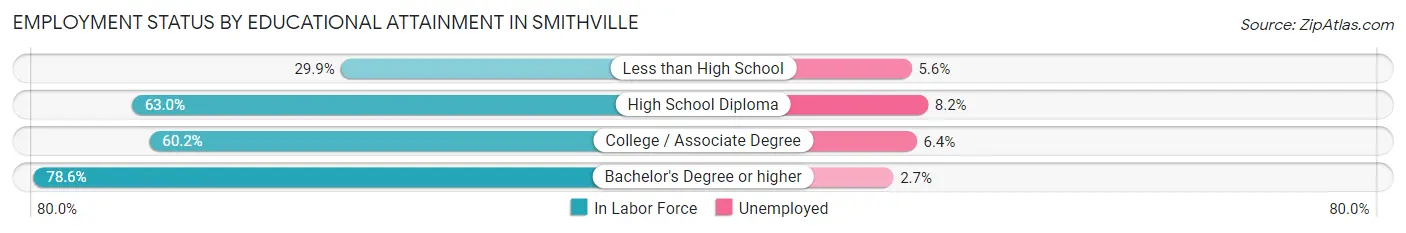
| Educational Attainment | In Labor Force | Unemployed |
| Less than High School | 287 (29.9%) | 54 (5.6%) |
| High School Diploma | 552 (63.0%) | 72 (8.2%) |
| College / Associate Degree | 234 (60.2%) | 25 (6.4%) |
| Bachelor's Degree or higher | 338 (78.6%) | 12 (2.7%) |
| Total | 1,410 (53.1%) | 159 (6.0%) |
Employment Occupations by Sex in Smithville
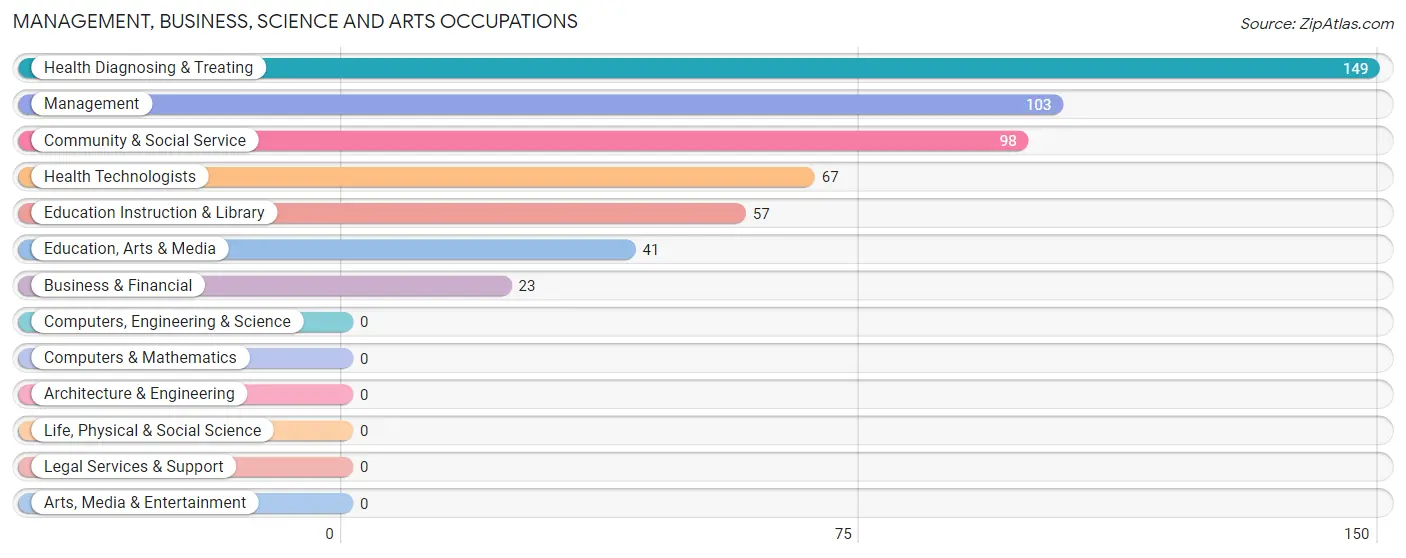
Management, Business, Science and Arts Occupations
The most common Management, Business, Science and Arts occupations in Smithville are Health Diagnosing & Treating (149 | 10.2%), Management (103 | 7.1%), Community & Social Service (98 | 6.7%), Health Technologists (67 | 4.6%), and Education Instruction & Library (57 | 3.9%).
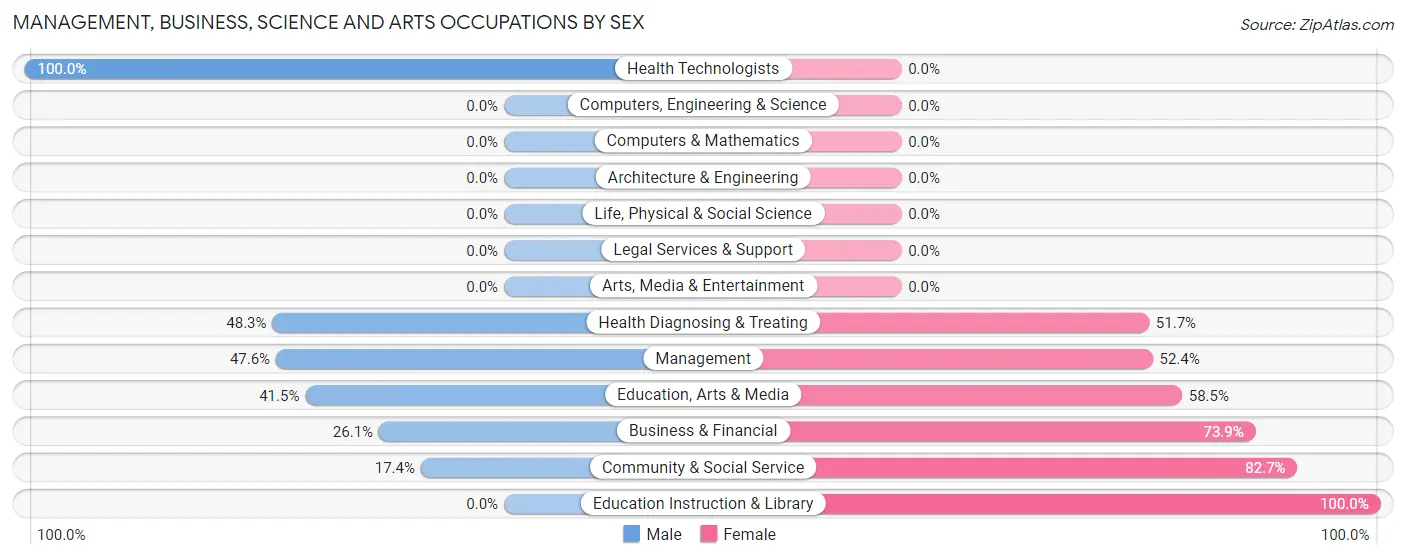
Management, Business, Science and Arts Occupations by Sex
Within the Management, Business, Science and Arts occupations in Smithville, the most male-oriented occupations are Health Technologists (100.0%), Health Diagnosing & Treating (48.3%), and Management (47.6%), while the most female-oriented occupations are Education Instruction & Library (100.0%), Community & Social Service (82.7%), and Business & Financial (73.9%).
| Occupation | Male | Female |
| Management | 49 (47.6%) | 54 (52.4%) |
| Business & Financial | 6 (26.1%) | 17 (73.9%) |
| Computers, Engineering & Science | 0 (0.0%) | 0 (0.0%) |
| Computers & Mathematics | 0 (0.0%) | 0 (0.0%) |
| Architecture & Engineering | 0 (0.0%) | 0 (0.0%) |
| Life, Physical & Social Science | 0 (0.0%) | 0 (0.0%) |
| Community & Social Service | 17 (17.3%) | 81 (82.7%) |
| Education, Arts & Media | 17 (41.5%) | 24 (58.5%) |
| Legal Services & Support | 0 (0.0%) | 0 (0.0%) |
| Education Instruction & Library | 0 (0.0%) | 57 (100.0%) |
| Arts, Media & Entertainment | 0 (0.0%) | 0 (0.0%) |
| Health Diagnosing & Treating | 72 (48.3%) | 77 (51.7%) |
| Health Technologists | 67 (100.0%) | 0 (0.0%) |
| Total (Category) | 144 (38.6%) | 229 (61.4%) |
| Total (Overall) | 642 (44.2%) | 812 (55.8%) |
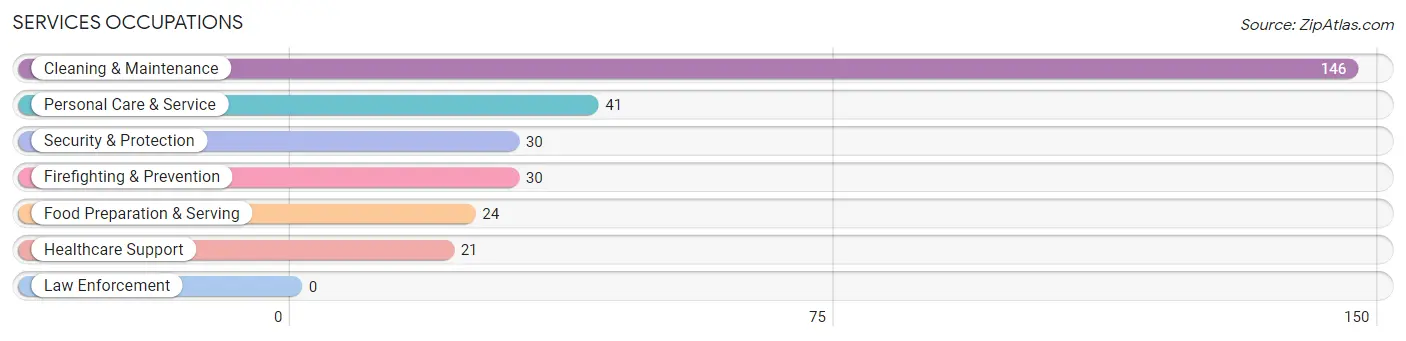
Services Occupations
The most common Services occupations in Smithville are Cleaning & Maintenance (146 | 10.0%), Personal Care & Service (41 | 2.8%), Security & Protection (30 | 2.1%), Firefighting & Prevention (30 | 2.1%), and Food Preparation & Serving (24 | 1.7%).
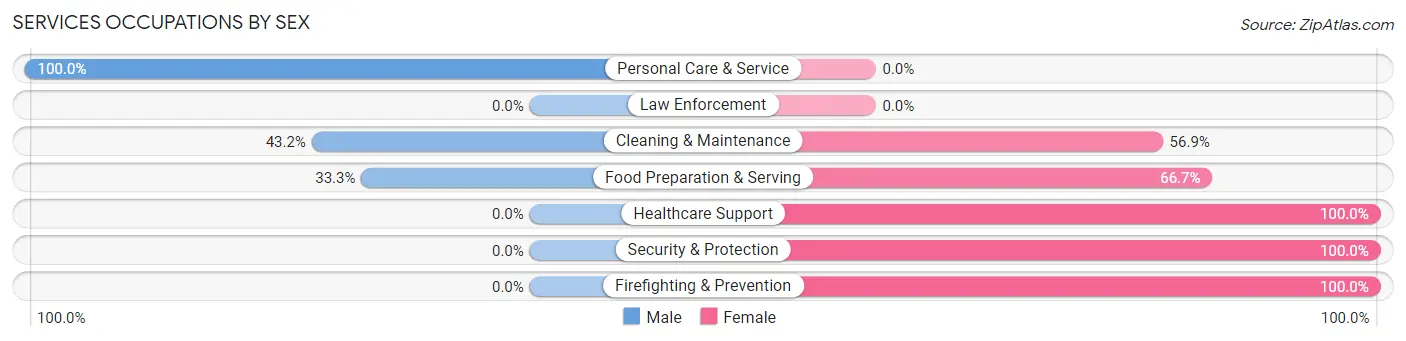
Services Occupations by Sex
Within the Services occupations in Smithville, the most male-oriented occupations are Personal Care & Service (100.0%), Cleaning & Maintenance (43.1%), and Food Preparation & Serving (33.3%), while the most female-oriented occupations are Healthcare Support (100.0%), Security & Protection (100.0%), and Firefighting & Prevention (100.0%).
| Occupation | Male | Female |
| Healthcare Support | 0 (0.0%) | 21 (100.0%) |
| Security & Protection | 0 (0.0%) | 30 (100.0%) |
| Firefighting & Prevention | 0 (0.0%) | 30 (100.0%) |
| Law Enforcement | 0 (0.0%) | 0 (0.0%) |
| Food Preparation & Serving | 8 (33.3%) | 16 (66.7%) |
| Cleaning & Maintenance | 63 (43.1%) | 83 (56.9%) |
| Personal Care & Service | 41 (100.0%) | 0 (0.0%) |
| Total (Category) | 112 (42.7%) | 150 (57.3%) |
| Total (Overall) | 642 (44.2%) | 812 (55.8%) |
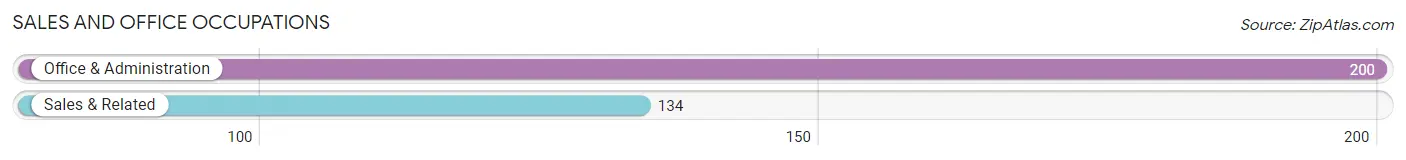
Sales and Office Occupations
The most common Sales and Office occupations in Smithville are Office & Administration (200 | 13.8%), and Sales & Related (134 | 9.2%).
Sales and Office Occupations by Sex
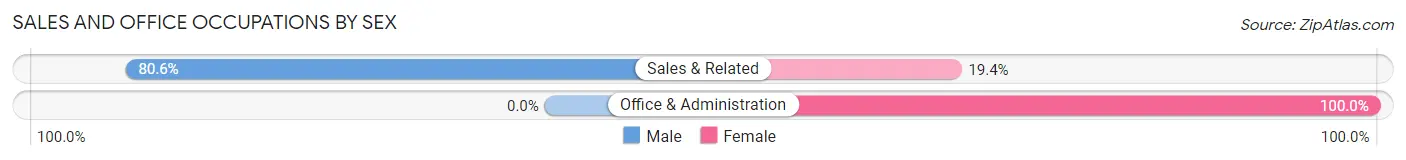
| Occupation | Male | Female |
| Sales & Related | 108 (80.6%) | 26 (19.4%) |
| Office & Administration | 0 (0.0%) | 200 (100.0%) |
| Total (Category) | 108 (32.3%) | 226 (67.7%) |
| Total (Overall) | 642 (44.2%) | 812 (55.8%) |
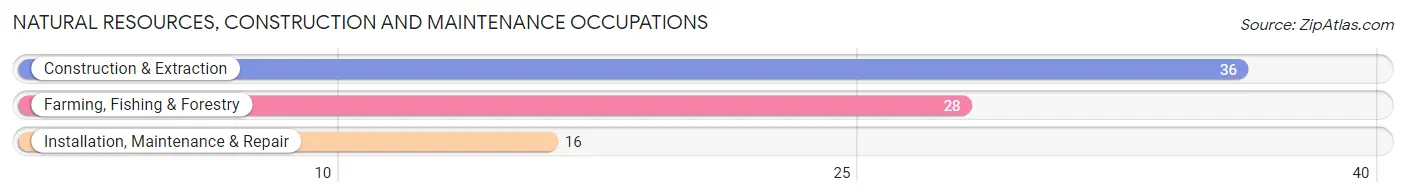
Natural Resources, Construction and Maintenance Occupations
The most common Natural Resources, Construction and Maintenance occupations in Smithville are Construction & Extraction (36 | 2.5%), Farming, Fishing & Forestry (28 | 1.9%), and Installation, Maintenance & Repair (16 | 1.1%).
Natural Resources, Construction and Maintenance Occupations by Sex
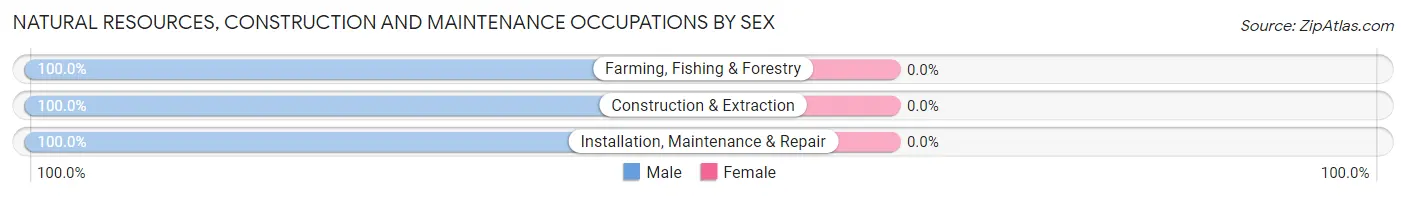
| Occupation | Male | Female |
| Farming, Fishing & Forestry | 28 (100.0%) | 0 (0.0%) |
| Construction & Extraction | 36 (100.0%) | 0 (0.0%) |
| Installation, Maintenance & Repair | 16 (100.0%) | 0 (0.0%) |
| Total (Category) | 80 (100.0%) | 0 (0.0%) |
| Total (Overall) | 642 (44.2%) | 812 (55.8%) |
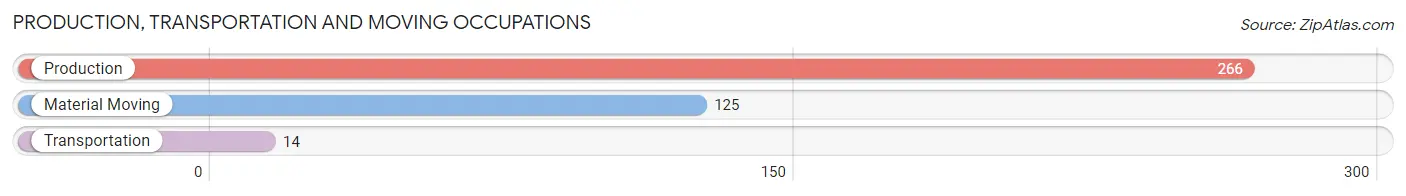
Production, Transportation and Moving Occupations
The most common Production, Transportation and Moving occupations in Smithville are Production (266 | 18.3%), Material Moving (125 | 8.6%), and Transportation (14 | 1.0%).
Production, Transportation and Moving Occupations by Sex
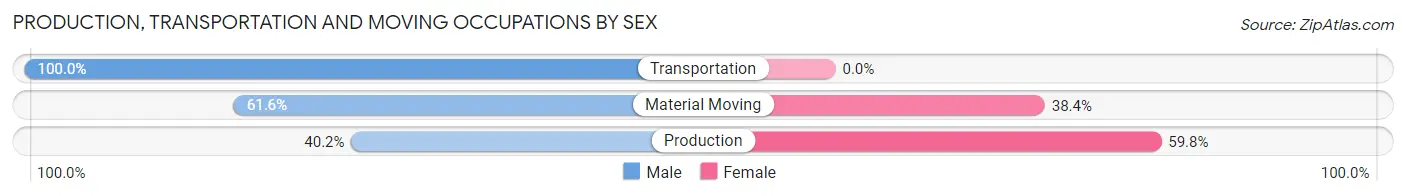
| Occupation | Male | Female |
| Production | 107 (40.2%) | 159 (59.8%) |
| Transportation | 14 (100.0%) | 0 (0.0%) |
| Material Moving | 77 (61.6%) | 48 (38.4%) |
| Total (Category) | 198 (48.9%) | 207 (51.1%) |
| Total (Overall) | 642 (44.2%) | 812 (55.8%) |
Employment Industries by Sex in Smithville
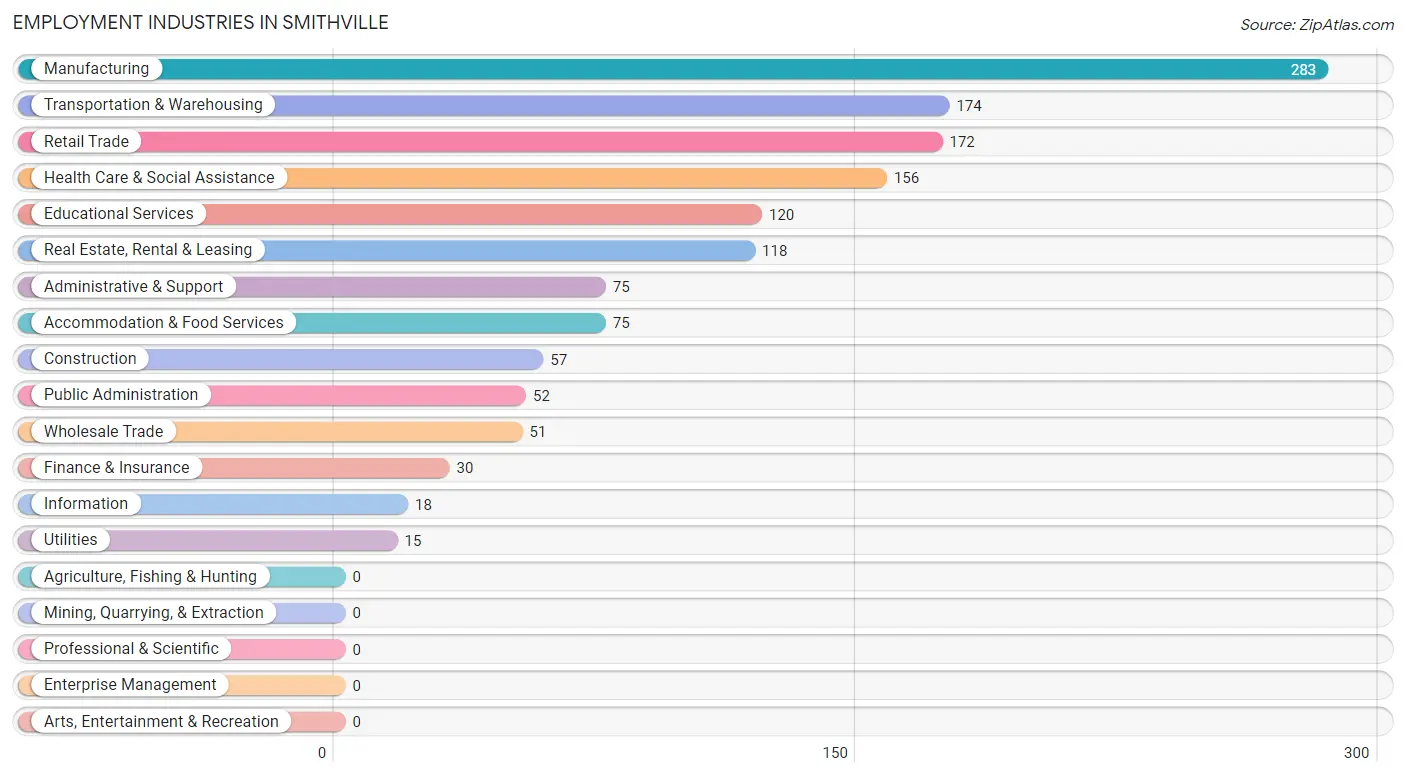
Employment Industries in Smithville
The major employment industries in Smithville include Manufacturing (283 | 19.5%), Transportation & Warehousing (174 | 12.0%), Retail Trade (172 | 11.8%), Health Care & Social Assistance (156 | 10.7%), and Educational Services (120 | 8.3%).
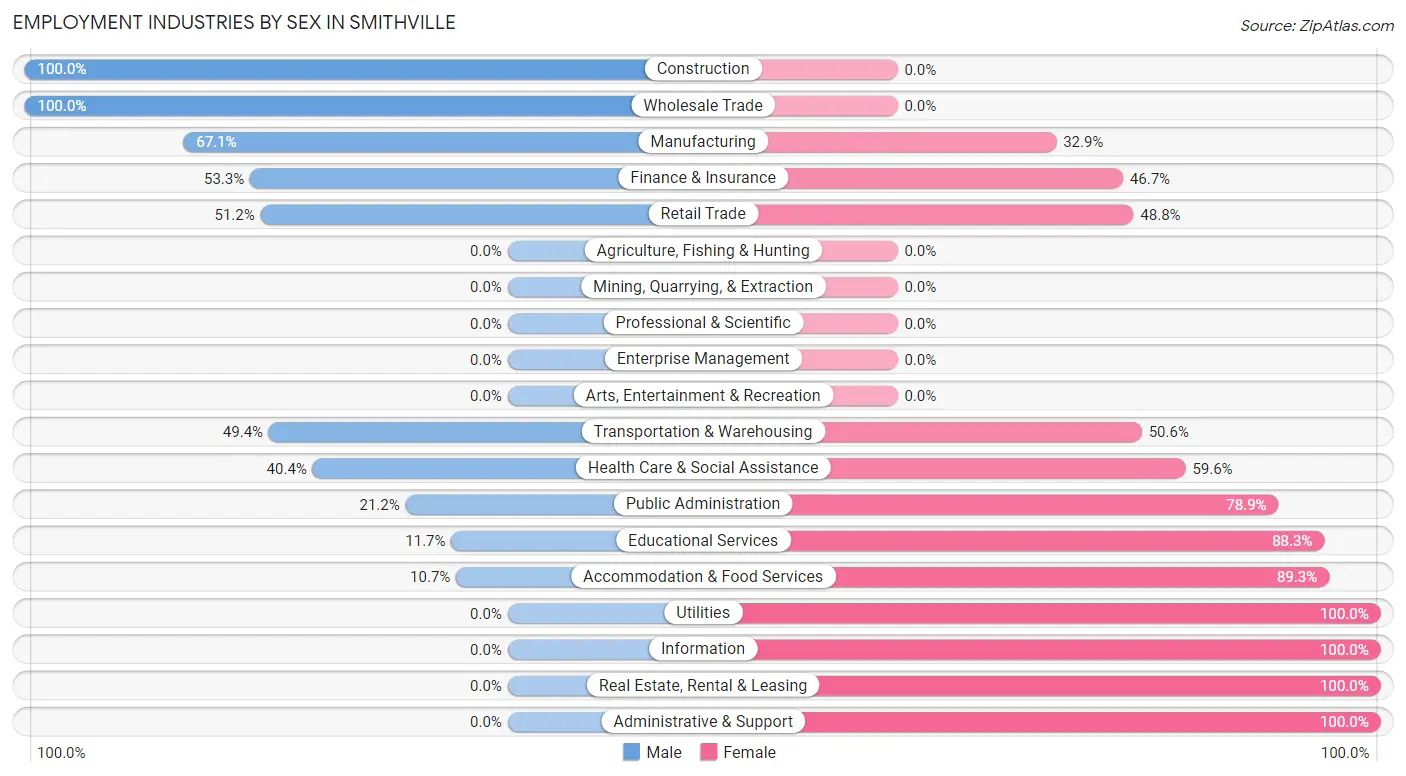
Employment Industries by Sex in Smithville
The Smithville industries that see more men than women are Construction (100.0%), Wholesale Trade (100.0%), and Manufacturing (67.1%), whereas the industries that tend to have a higher number of women are Utilities (100.0%), Information (100.0%), and Real Estate, Rental & Leasing (100.0%).
| Industry | Male | Female |
| Agriculture, Fishing & Hunting | 0 (0.0%) | 0 (0.0%) |
| Mining, Quarrying, & Extraction | 0 (0.0%) | 0 (0.0%) |
| Construction | 57 (100.0%) | 0 (0.0%) |
| Manufacturing | 190 (67.1%) | 93 (32.9%) |
| Wholesale Trade | 51 (100.0%) | 0 (0.0%) |
| Retail Trade | 88 (51.2%) | 84 (48.8%) |
| Transportation & Warehousing | 86 (49.4%) | 88 (50.6%) |
| Utilities | 0 (0.0%) | 15 (100.0%) |
| Information | 0 (0.0%) | 18 (100.0%) |
| Finance & Insurance | 16 (53.3%) | 14 (46.7%) |
| Real Estate, Rental & Leasing | 0 (0.0%) | 118 (100.0%) |
| Professional & Scientific | 0 (0.0%) | 0 (0.0%) |
| Enterprise Management | 0 (0.0%) | 0 (0.0%) |
| Administrative & Support | 0 (0.0%) | 75 (100.0%) |
| Educational Services | 14 (11.7%) | 106 (88.3%) |
| Health Care & Social Assistance | 63 (40.4%) | 93 (59.6%) |
| Arts, Entertainment & Recreation | 0 (0.0%) | 0 (0.0%) |
| Accommodation & Food Services | 8 (10.7%) | 67 (89.3%) |
| Public Administration | 11 (21.1%) | 41 (78.8%) |
| Total | 642 (44.2%) | 812 (55.8%) |
Education in Smithville
School Enrollment in Smithville
The most common levels of schooling among the 900 students in Smithville are middle school (316 | 35.1%), high school (276 | 30.7%), and elementary school (179 | 19.9%).
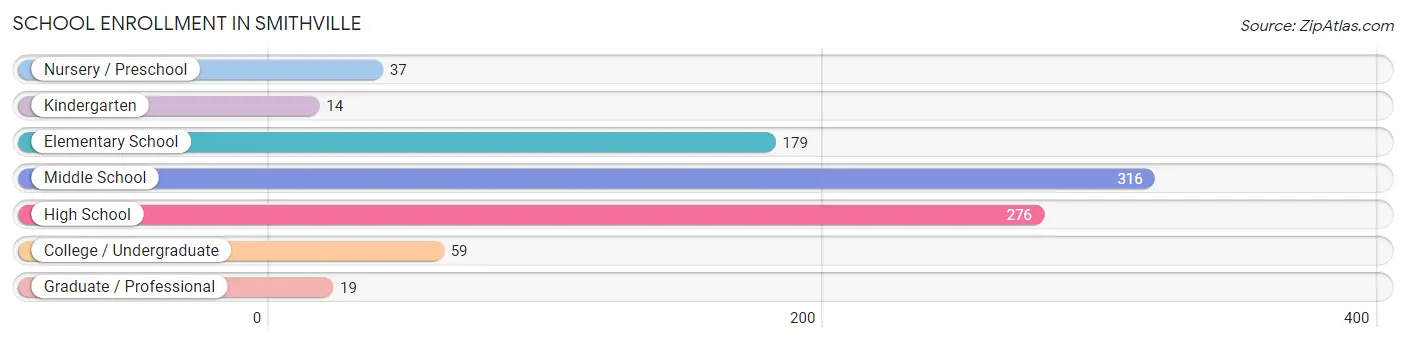
| School Level | # Students | % Students |
| Nursery / Preschool | 37 | 4.1% |
| Kindergarten | 14 | 1.6% |
| Elementary School | 179 | 19.9% |
| Middle School | 316 | 35.1% |
| High School | 276 | 30.7% |
| College / Undergraduate | 59 | 6.6% |
| Graduate / Professional | 19 | 2.1% |
| Total | 900 | 100.0% |
School Enrollment by Age by Funding Source in Smithville
Out of a total of 900 students who are enrolled in schools in Smithville, 61 (6.8%) attend a private institution, while the remaining 839 (93.2%) are enrolled in public schools. The age group of 35 years and over has the highest likelihood of being enrolled in private schools, with 36 (100.0% in the age bracket) enrolled. Conversely, the age group of 3 to 4 year olds has the lowest likelihood of being enrolled in a private school, with 30 (100.0% in the age bracket) attending a public institution.
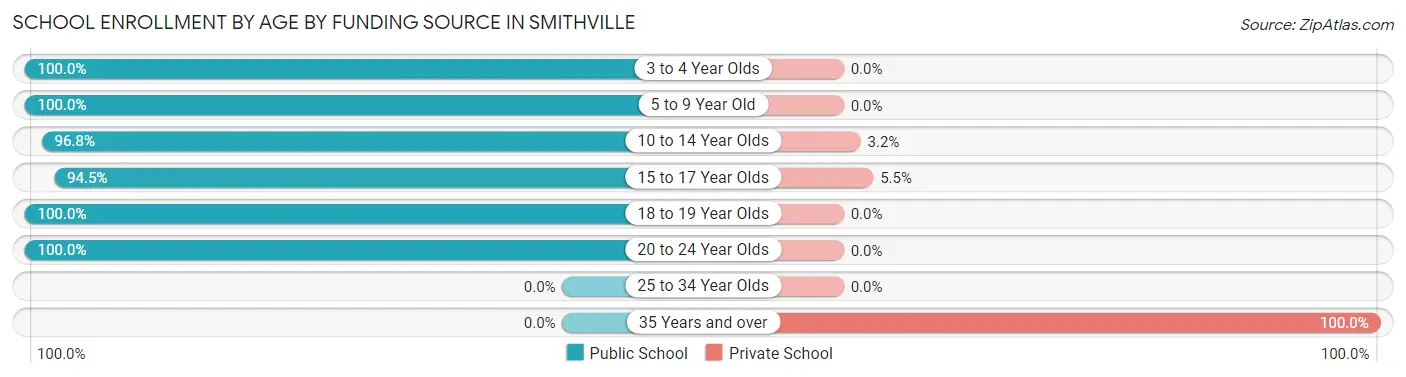
| Age Bracket | Public School | Private School |
| 3 to 4 Year Olds | 30 (100.0%) | 0 (0.0%) |
| 5 to 9 Year Old | 200 (100.0%) | 0 (0.0%) |
| 10 to 14 Year Olds | 306 (96.8%) | 10 (3.2%) |
| 15 to 17 Year Olds | 257 (94.5%) | 15 (5.5%) |
| 18 to 19 Year Olds | 37 (100.0%) | 0 (0.0%) |
| 20 to 24 Year Olds | 9 (100.0%) | 0 (0.0%) |
| 25 to 34 Year Olds | 0 (0.0%) | 0 (0.0%) |
| 35 Years and over | 0 (0.0%) | 36 (100.0%) |
| Total | 839 (93.2%) | 61 (6.8%) |
Educational Attainment by Field of Study in Smithville
Education (212 | 35.0%), science & technology (85 | 14.1%), literature & languages (75 | 12.4%), visual & performing arts (67 | 11.1%), and psychology (58 | 9.6%) are the most common fields of study among 605 individuals in Smithville who have obtained a bachelor's degree or higher.
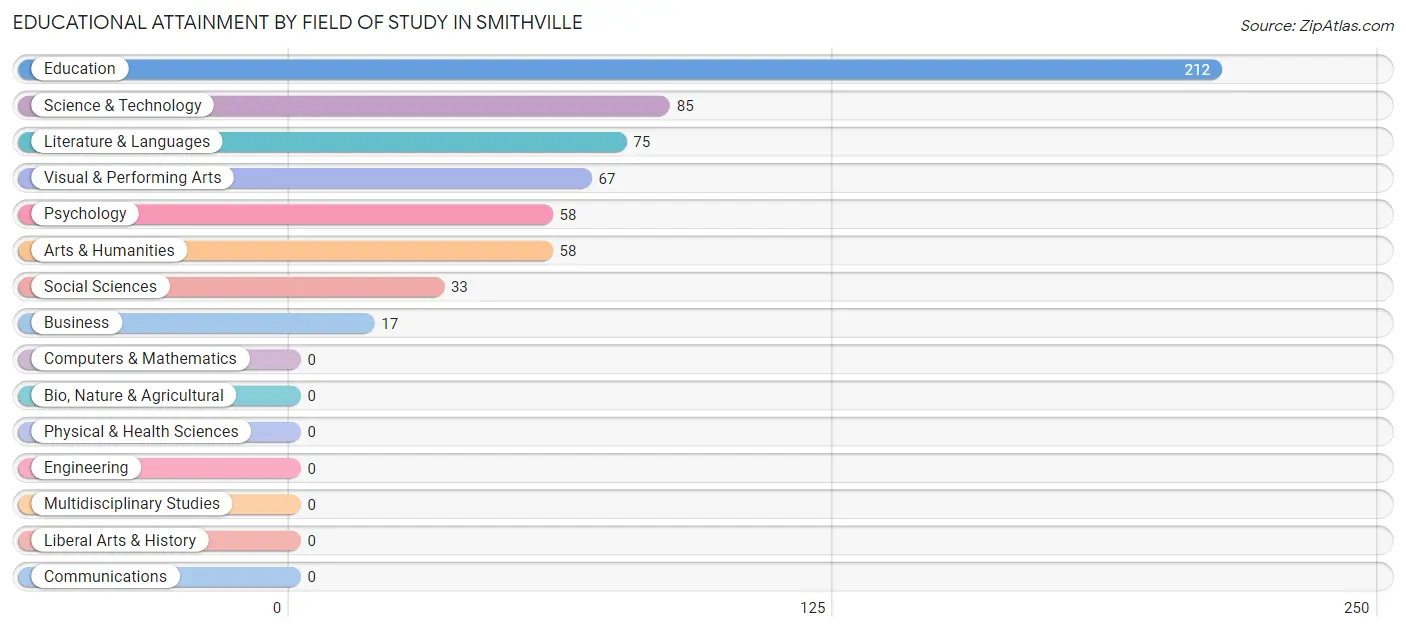
| Field of Study | # Graduates | % Graduates |
| Computers & Mathematics | 0 | 0.0% |
| Bio, Nature & Agricultural | 0 | 0.0% |
| Physical & Health Sciences | 0 | 0.0% |
| Psychology | 58 | 9.6% |
| Social Sciences | 33 | 5.4% |
| Engineering | 0 | 0.0% |
| Multidisciplinary Studies | 0 | 0.0% |
| Science & Technology | 85 | 14.1% |
| Business | 17 | 2.8% |
| Education | 212 | 35.0% |
| Literature & Languages | 75 | 12.4% |
| Liberal Arts & History | 0 | 0.0% |
| Visual & Performing Arts | 67 | 11.1% |
| Communications | 0 | 0.0% |
| Arts & Humanities | 58 | 9.6% |
| Total | 605 | 100.0% |
Transportation & Commute in Smithville
Vehicle Availability by Sex in Smithville
The most prevalent vehicle ownership categories in Smithville are males with 2 vehicles (224, accounting for 34.9%) and females with 2 vehicles (539, making up 27.6%).
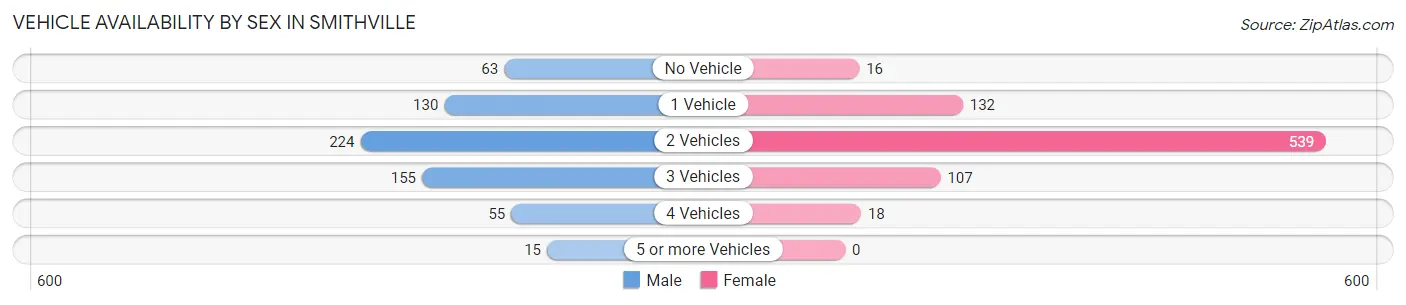
| Vehicles Available | Male | Female |
| No Vehicle | 63 (9.8%) | 16 (2.0%) |
| 1 Vehicle | 130 (20.3%) | 132 (16.3%) |
| 2 Vehicles | 224 (34.9%) | 539 (66.4%) |
| 3 Vehicles | 155 (24.1%) | 107 (13.2%) |
| 4 Vehicles | 55 (8.6%) | 18 (2.2%) |
| 5 or more Vehicles | 15 (2.3%) | 0 (0.0%) |
| Total | 642 (100.0%) | 812 (100.0%) |
Commute Time in Smithville
The most frequently occuring commute durations in Smithville are less than 5 minutes (413 commuters, 28.4%), 5 to 9 minutes (297 commuters, 20.4%), and 10 to 14 minutes (222 commuters, 15.3%).
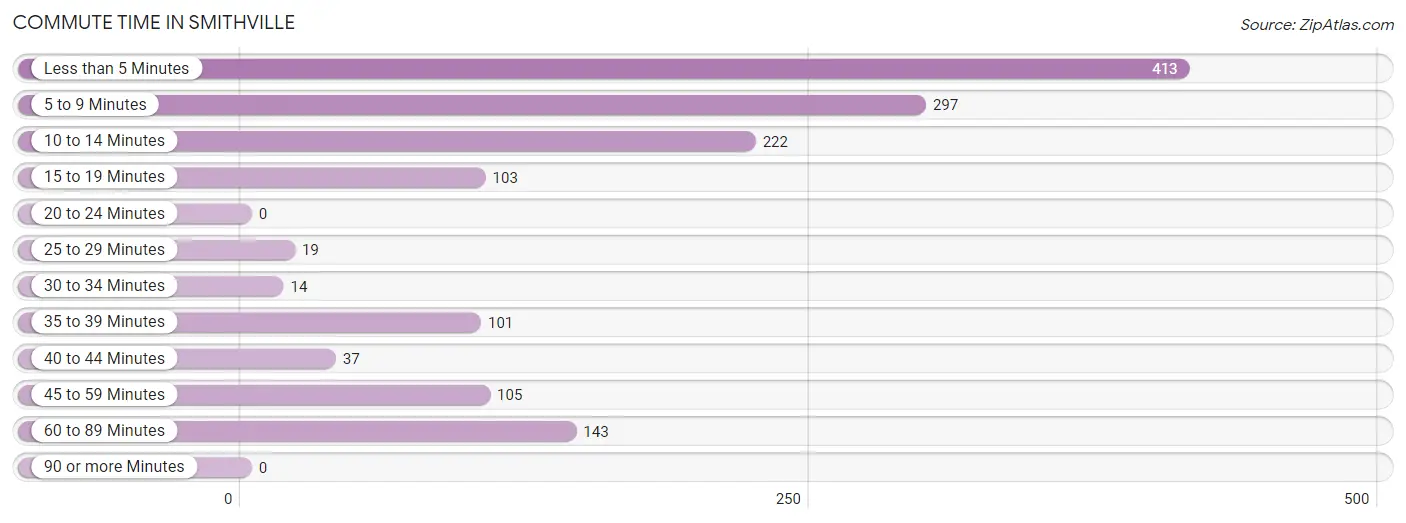
| Commute Time | # Commuters | % Commuters |
| Less than 5 Minutes | 413 | 28.4% |
| 5 to 9 Minutes | 297 | 20.4% |
| 10 to 14 Minutes | 222 | 15.3% |
| 15 to 19 Minutes | 103 | 7.1% |
| 20 to 24 Minutes | 0 | 0.0% |
| 25 to 29 Minutes | 19 | 1.3% |
| 30 to 34 Minutes | 14 | 1.0% |
| 35 to 39 Minutes | 101 | 7.0% |
| 40 to 44 Minutes | 37 | 2.5% |
| 45 to 59 Minutes | 105 | 7.2% |
| 60 to 89 Minutes | 143 | 9.8% |
| 90 or more Minutes | 0 | 0.0% |
Commute Time by Sex in Smithville
The most common commute times in Smithville are 10 to 14 minutes (139 commuters, 21.6%) for males and less than 5 minutes (341 commuters, 42.0%) for females.
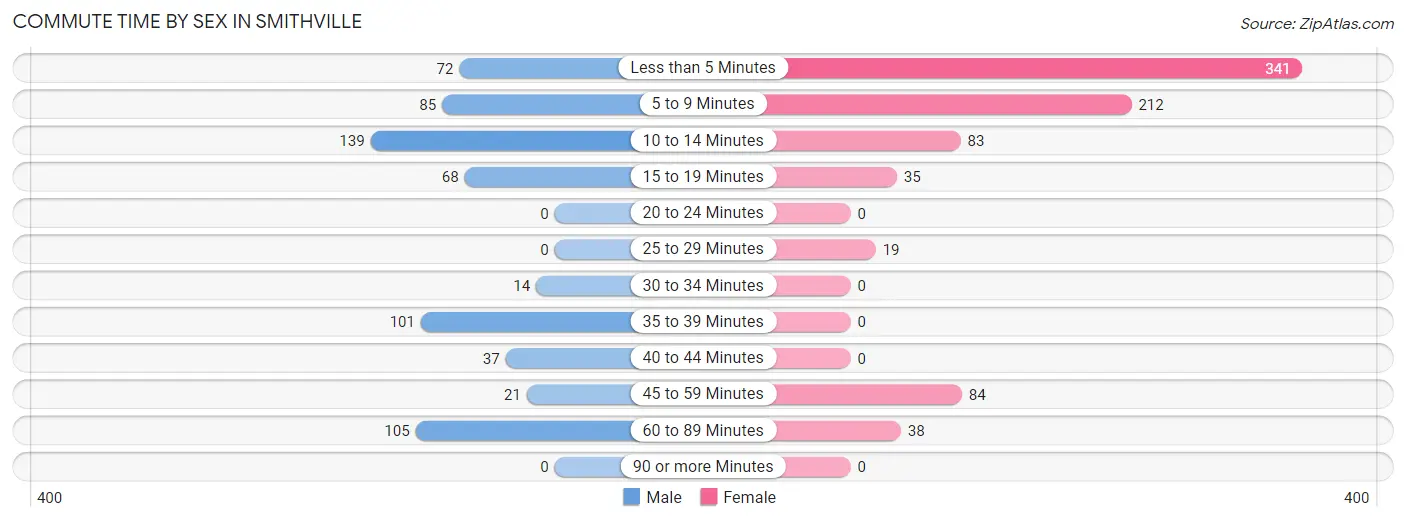
| Commute Time | Male | Female |
| Less than 5 Minutes | 72 (11.2%) | 341 (42.0%) |
| 5 to 9 Minutes | 85 (13.2%) | 212 (26.1%) |
| 10 to 14 Minutes | 139 (21.6%) | 83 (10.2%) |
| 15 to 19 Minutes | 68 (10.6%) | 35 (4.3%) |
| 20 to 24 Minutes | 0 (0.0%) | 0 (0.0%) |
| 25 to 29 Minutes | 0 (0.0%) | 19 (2.3%) |
| 30 to 34 Minutes | 14 (2.2%) | 0 (0.0%) |
| 35 to 39 Minutes | 101 (15.7%) | 0 (0.0%) |
| 40 to 44 Minutes | 37 (5.8%) | 0 (0.0%) |
| 45 to 59 Minutes | 21 (3.3%) | 84 (10.3%) |
| 60 to 89 Minutes | 105 (16.4%) | 38 (4.7%) |
| 90 or more Minutes | 0 (0.0%) | 0 (0.0%) |
Time of Departure to Work by Sex in Smithville
The most frequent times of departure to work in Smithville are 6:00 AM to 6:29 AM (129, 20.1%) for males and 7:30 AM to 7:59 AM (209, 25.7%) for females.
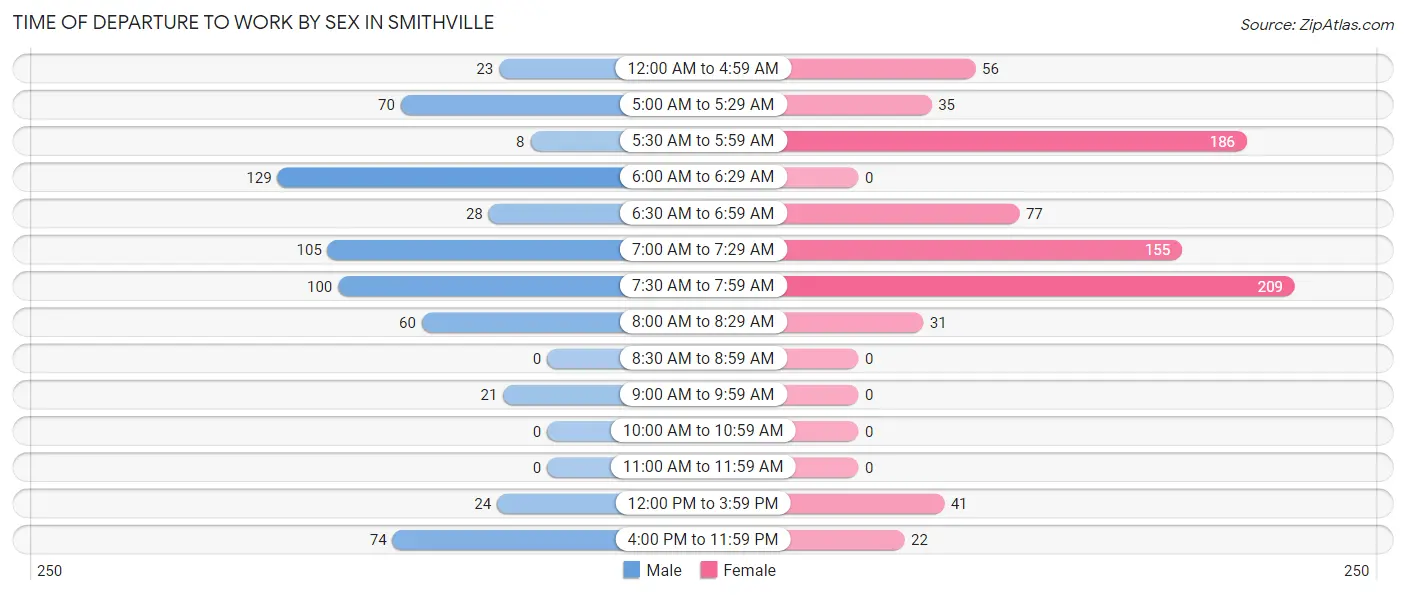
| Time of Departure | Male | Female |
| 12:00 AM to 4:59 AM | 23 (3.6%) | 56 (6.9%) |
| 5:00 AM to 5:29 AM | 70 (10.9%) | 35 (4.3%) |
| 5:30 AM to 5:59 AM | 8 (1.3%) | 186 (22.9%) |
| 6:00 AM to 6:29 AM | 129 (20.1%) | 0 (0.0%) |
| 6:30 AM to 6:59 AM | 28 (4.4%) | 77 (9.5%) |
| 7:00 AM to 7:29 AM | 105 (16.4%) | 155 (19.1%) |
| 7:30 AM to 7:59 AM | 100 (15.6%) | 209 (25.7%) |
| 8:00 AM to 8:29 AM | 60 (9.3%) | 31 (3.8%) |
| 8:30 AM to 8:59 AM | 0 (0.0%) | 0 (0.0%) |
| 9:00 AM to 9:59 AM | 21 (3.3%) | 0 (0.0%) |
| 10:00 AM to 10:59 AM | 0 (0.0%) | 0 (0.0%) |
| 11:00 AM to 11:59 AM | 0 (0.0%) | 0 (0.0%) |
| 12:00 PM to 3:59 PM | 24 (3.7%) | 41 (5.1%) |
| 4:00 PM to 11:59 PM | 74 (11.5%) | 22 (2.7%) |
| Total | 642 (100.0%) | 812 (100.0%) |
Housing Occupancy in Smithville
Occupancy by Ownership in Smithville
Of the total 2,047 dwellings in Smithville, owner-occupied units account for 947 (46.3%), while renter-occupied units make up 1,100 (53.7%).
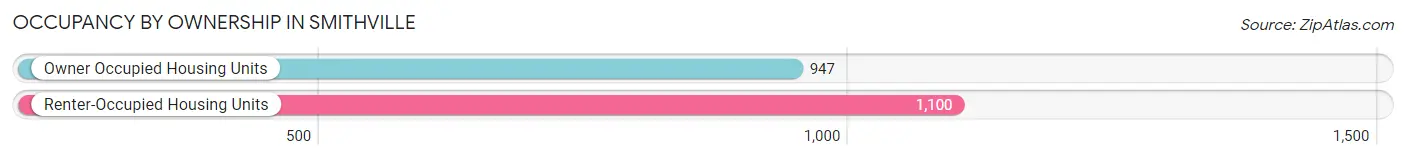
| Occupancy | # Housing Units | % Housing Units |
| Owner Occupied Housing Units | 947 | 46.3% |
| Renter-Occupied Housing Units | 1,100 | 53.7% |
| Total Occupied Housing Units | 2,047 | 100.0% |
Occupancy by Household Size in Smithville
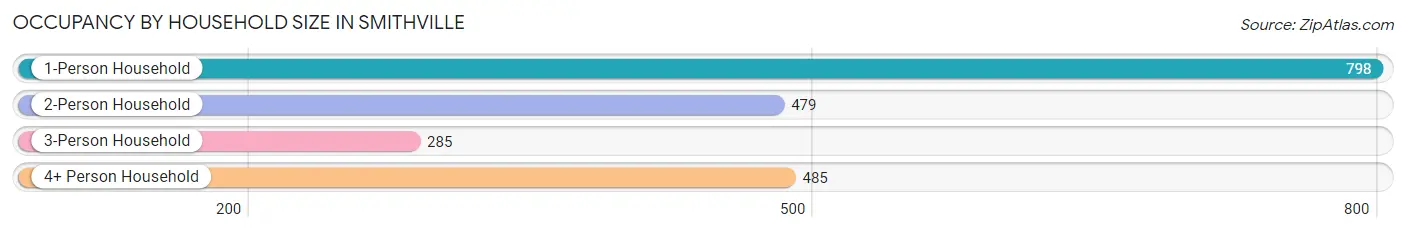
| Household Size | # Housing Units | % Housing Units |
| 1-Person Household | 798 | 39.0% |
| 2-Person Household | 479 | 23.4% |
| 3-Person Household | 285 | 13.9% |
| 4+ Person Household | 485 | 23.7% |
| Total Housing Units | 2,047 | 100.0% |
Occupancy by Ownership by Household Size in Smithville
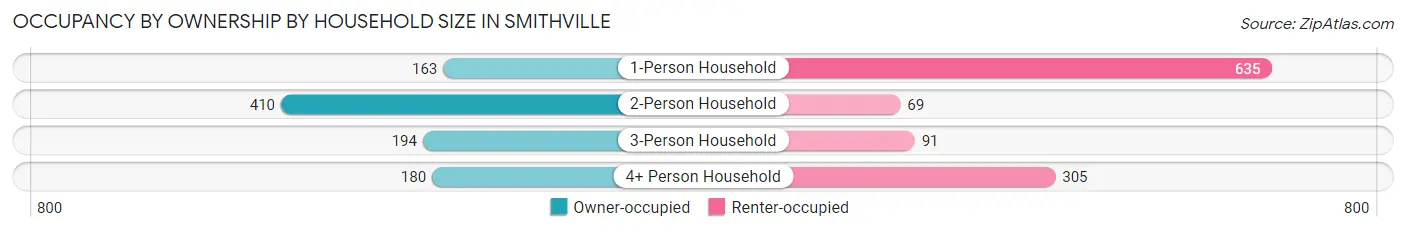
| Household Size | Owner-occupied | Renter-occupied |
| 1-Person Household | 163 (20.4%) | 635 (79.6%) |
| 2-Person Household | 410 (85.6%) | 69 (14.4%) |
| 3-Person Household | 194 (68.1%) | 91 (31.9%) |
| 4+ Person Household | 180 (37.1%) | 305 (62.9%) |
| Total Housing Units | 947 (46.3%) | 1,100 (53.7%) |
Occupancy by Educational Attainment in Smithville
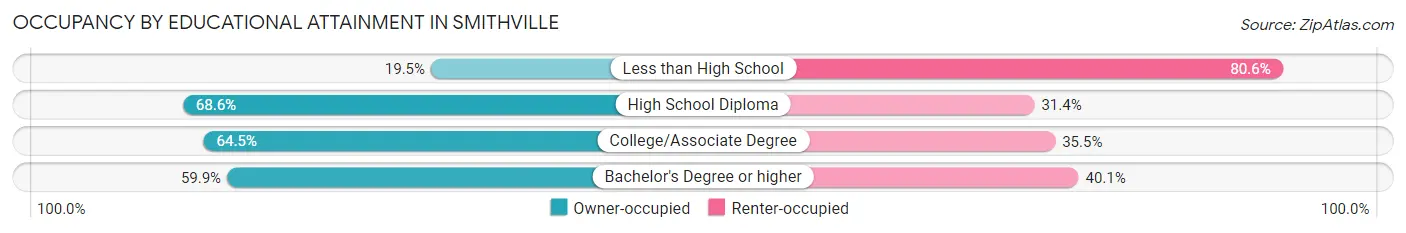
| Household Size | Owner-occupied | Renter-occupied |
| Less than High School | 164 (19.5%) | 679 (80.5%) |
| High School Diploma | 365 (68.6%) | 167 (31.4%) |
| College/Associate Degree | 218 (64.5%) | 120 (35.5%) |
| Bachelor's Degree or higher | 200 (59.9%) | 134 (40.1%) |
Occupancy by Age of Householder in Smithville
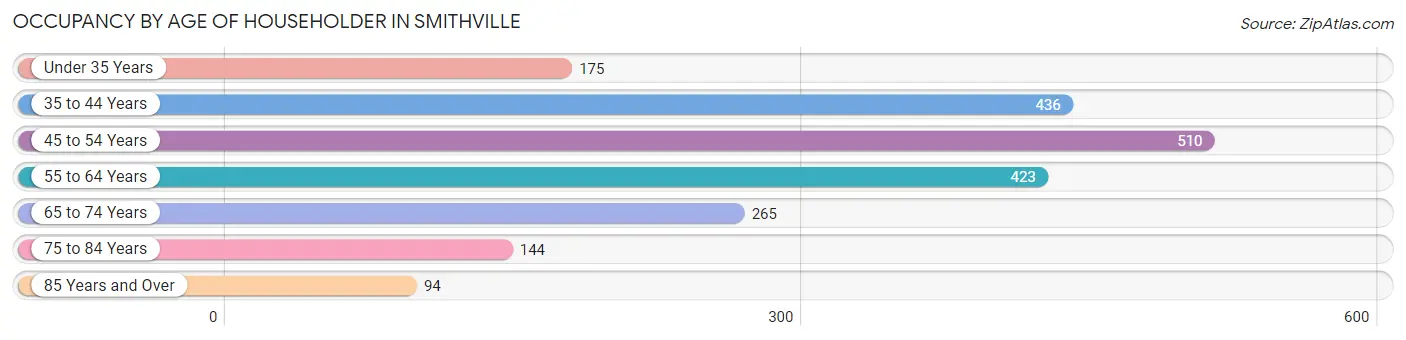
| Age Bracket | # Households | % Households |
| Under 35 Years | 175 | 8.6% |
| 35 to 44 Years | 436 | 21.3% |
| 45 to 54 Years | 510 | 24.9% |
| 55 to 64 Years | 423 | 20.7% |
| 65 to 74 Years | 265 | 13.0% |
| 75 to 84 Years | 144 | 7.0% |
| 85 Years and Over | 94 | 4.6% |
| Total | 2,047 | 100.0% |
Housing Finances in Smithville
Median Income by Occupancy in Smithville
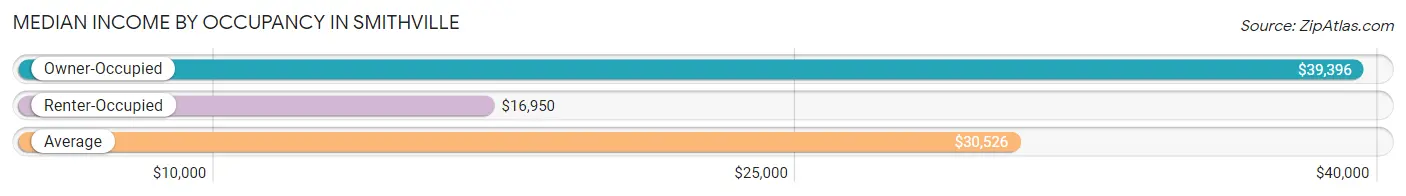
| Occupancy Type | # Households | Median Income |
| Owner-Occupied | 947 (46.3%) | $39,396 |
| Renter-Occupied | 1,100 (53.7%) | $16,950 |
| Average | 2,047 (100.0%) | $30,526 |
Occupancy by Householder Income Bracket in Smithville
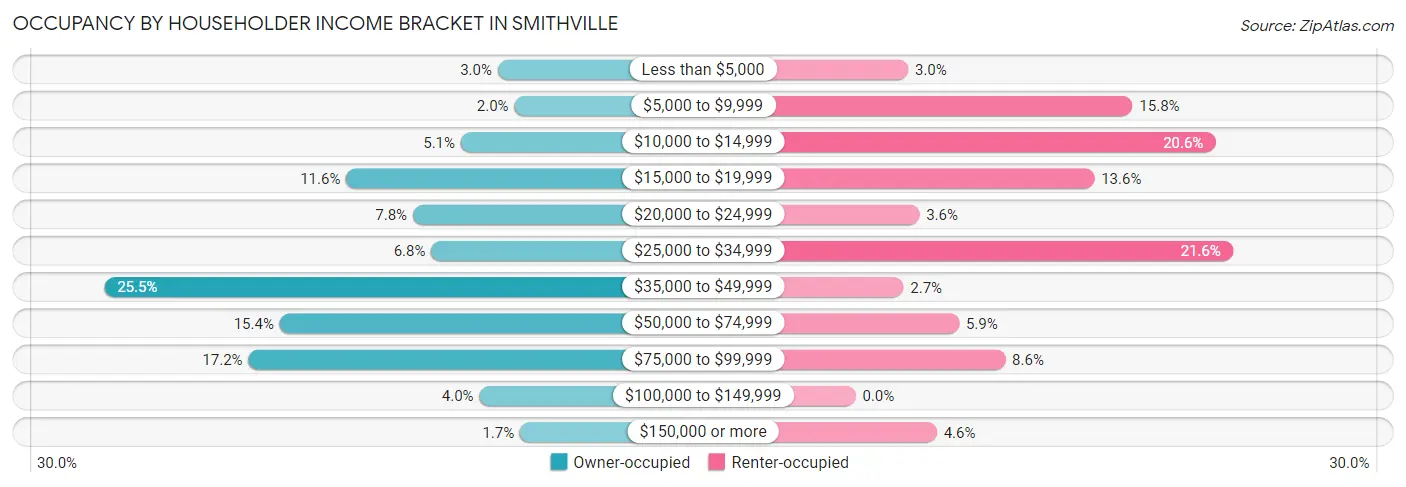
| Income Bracket | Owner-occupied | Renter-occupied |
| Less than $5,000 | 28 (3.0%) | 33 (3.0%) |
| $5,000 to $9,999 | 19 (2.0%) | 174 (15.8%) |
| $10,000 to $14,999 | 48 (5.1%) | 226 (20.5%) |
| $15,000 to $19,999 | 110 (11.6%) | 150 (13.6%) |
| $20,000 to $24,999 | 74 (7.8%) | 40 (3.6%) |
| $25,000 to $34,999 | 64 (6.8%) | 237 (21.5%) |
| $35,000 to $49,999 | 241 (25.5%) | 30 (2.7%) |
| $50,000 to $74,999 | 146 (15.4%) | 65 (5.9%) |
| $75,000 to $99,999 | 163 (17.2%) | 94 (8.6%) |
| $100,000 to $149,999 | 38 (4.0%) | 0 (0.0%) |
| $150,000 or more | 16 (1.7%) | 51 (4.6%) |
| Total | 947 (100.0%) | 1,100 (100.0%) |
Monthly Housing Cost Tiers in Smithville
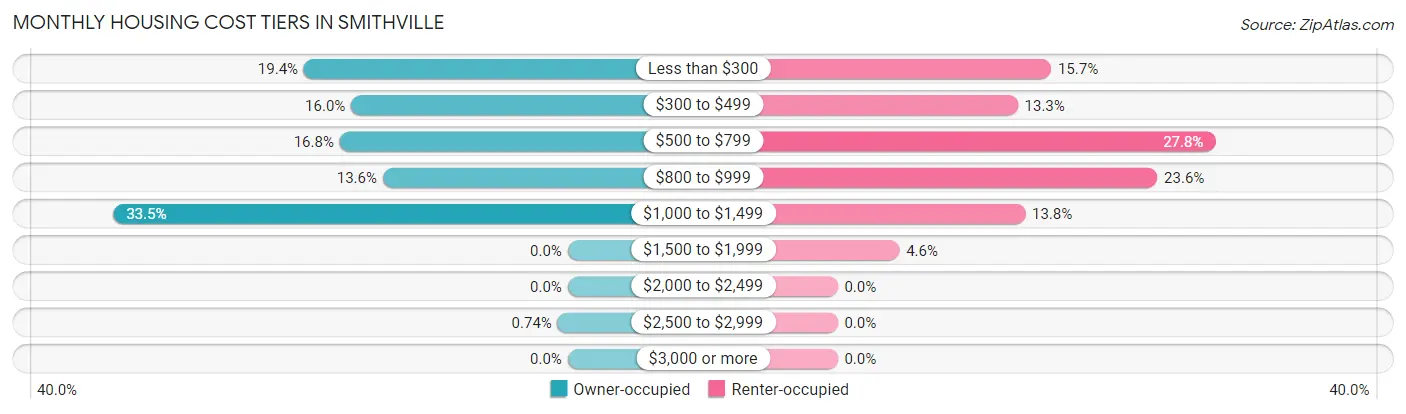
| Monthly Cost | Owner-occupied | Renter-occupied |
| Less than $300 | 184 (19.4%) | 173 (15.7%) |
| $300 to $499 | 151 (16.0%) | 146 (13.3%) |
| $500 to $799 | 159 (16.8%) | 306 (27.8%) |
| $800 to $999 | 129 (13.6%) | 259 (23.5%) |
| $1,000 to $1,499 | 317 (33.5%) | 152 (13.8%) |
| $1,500 to $1,999 | 0 (0.0%) | 50 (4.5%) |
| $2,000 to $2,499 | 0 (0.0%) | 0 (0.0%) |
| $2,500 to $2,999 | 7 (0.7%) | 0 (0.0%) |
| $3,000 or more | 0 (0.0%) | 0 (0.0%) |
| Total | 947 (100.0%) | 1,100 (100.0%) |
Physical Housing Characteristics in Smithville
Housing Structures in Smithville
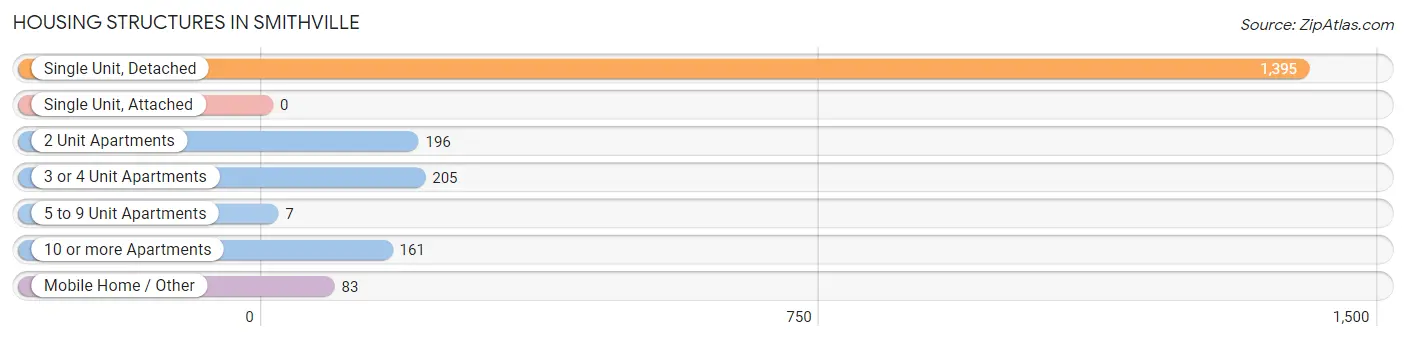
| Structure Type | # Housing Units | % Housing Units |
| Single Unit, Detached | 1,395 | 68.1% |
| Single Unit, Attached | 0 | 0.0% |
| 2 Unit Apartments | 196 | 9.6% |
| 3 or 4 Unit Apartments | 205 | 10.0% |
| 5 to 9 Unit Apartments | 7 | 0.3% |
| 10 or more Apartments | 161 | 7.9% |
| Mobile Home / Other | 83 | 4.1% |
| Total | 2,047 | 100.0% |
Housing Structures by Occupancy in Smithville
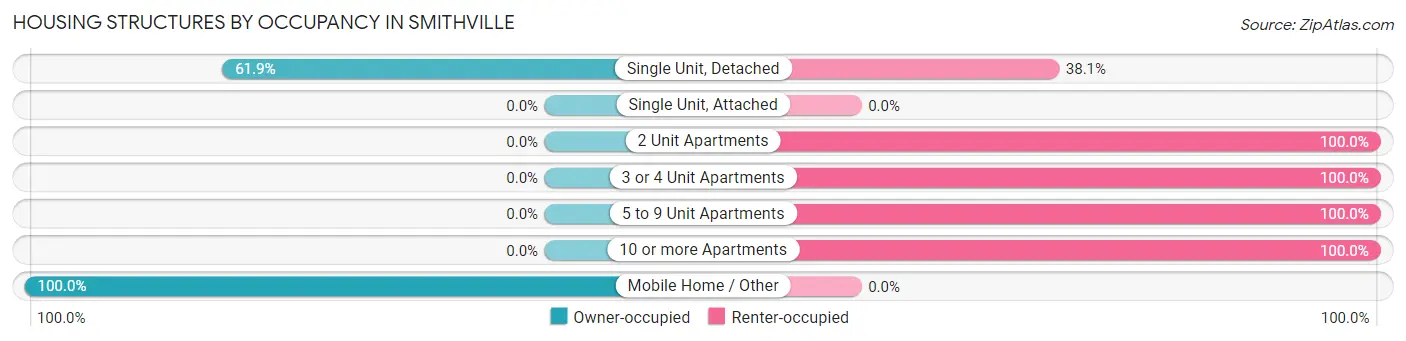
| Structure Type | Owner-occupied | Renter-occupied |
| Single Unit, Detached | 864 (61.9%) | 531 (38.1%) |
| Single Unit, Attached | 0 (0.0%) | 0 (0.0%) |
| 2 Unit Apartments | 0 (0.0%) | 196 (100.0%) |
| 3 or 4 Unit Apartments | 0 (0.0%) | 205 (100.0%) |
| 5 to 9 Unit Apartments | 0 (0.0%) | 7 (100.0%) |
| 10 or more Apartments | 0 (0.0%) | 161 (100.0%) |
| Mobile Home / Other | 83 (100.0%) | 0 (0.0%) |
| Total | 947 (46.3%) | 1,100 (53.7%) |
Housing Structures by Number of Rooms in Smithville
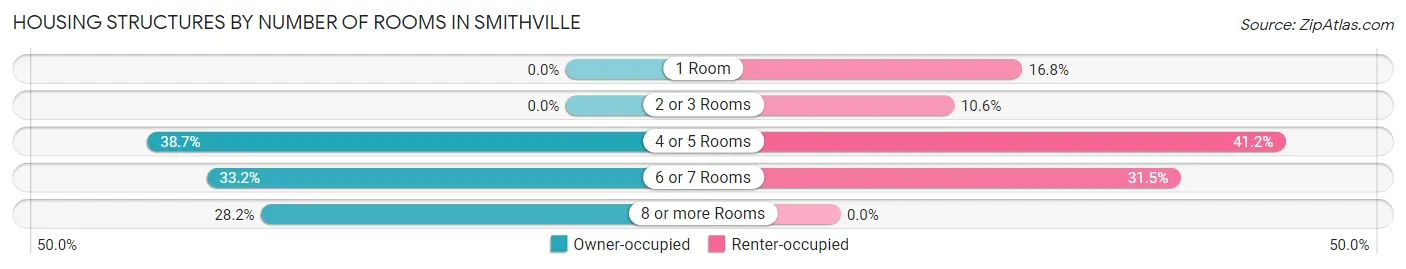
| Number of Rooms | Owner-occupied | Renter-occupied |
| 1 Room | 0 (0.0%) | 185 (16.8%) |
| 2 or 3 Rooms | 0 (0.0%) | 116 (10.5%) |
| 4 or 5 Rooms | 366 (38.7%) | 453 (41.2%) |
| 6 or 7 Rooms | 314 (33.2%) | 346 (31.5%) |
| 8 or more Rooms | 267 (28.2%) | 0 (0.0%) |
| Total | 947 (100.0%) | 1,100 (100.0%) |
Housing Structure by Heating Type in Smithville
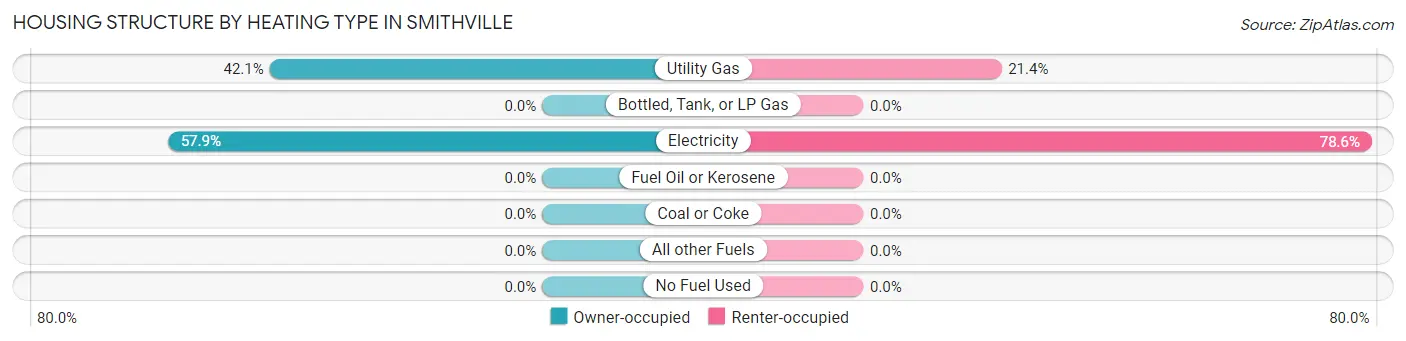
| Heating Type | Owner-occupied | Renter-occupied |
| Utility Gas | 399 (42.1%) | 235 (21.4%) |
| Bottled, Tank, or LP Gas | 0 (0.0%) | 0 (0.0%) |
| Electricity | 548 (57.9%) | 865 (78.6%) |
| Fuel Oil or Kerosene | 0 (0.0%) | 0 (0.0%) |
| Coal or Coke | 0 (0.0%) | 0 (0.0%) |
| All other Fuels | 0 (0.0%) | 0 (0.0%) |
| No Fuel Used | 0 (0.0%) | 0 (0.0%) |
| Total | 947 (100.0%) | 1,100 (100.0%) |
Household Vehicle Usage in Smithville
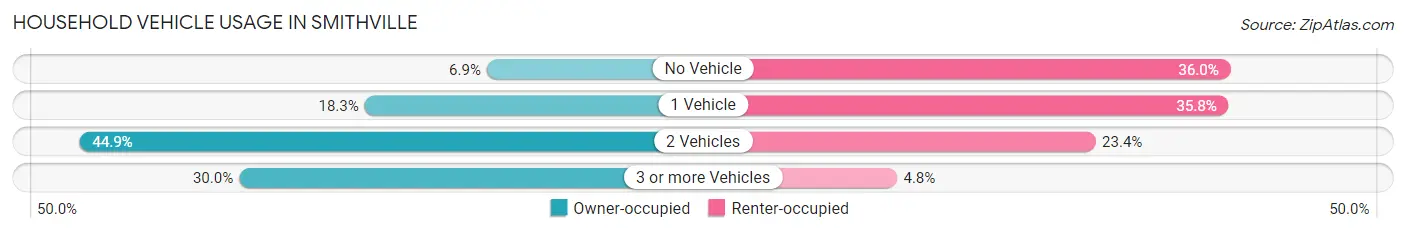
| Vehicles per Household | Owner-occupied | Renter-occupied |
| No Vehicle | 65 (6.9%) | 396 (36.0%) |
| 1 Vehicle | 173 (18.3%) | 394 (35.8%) |
| 2 Vehicles | 425 (44.9%) | 257 (23.4%) |
| 3 or more Vehicles | 284 (30.0%) | 53 (4.8%) |
| Total | 947 (100.0%) | 1,100 (100.0%) |
Real Estate & Mortgages in Smithville
Real Estate and Mortgage Overview in Smithville
| Characteristic | Without Mortgage | With Mortgage |
| Housing Units | 384 | 563 |
| Median Property Value | $151,300 | $139,600 |
| Median Household Income | $31,563 | $16 |
| Monthly Housing Costs | $305 | $0 |
| Real Estate Taxes | $718 | $0 |
Property Value by Mortgage Status in Smithville
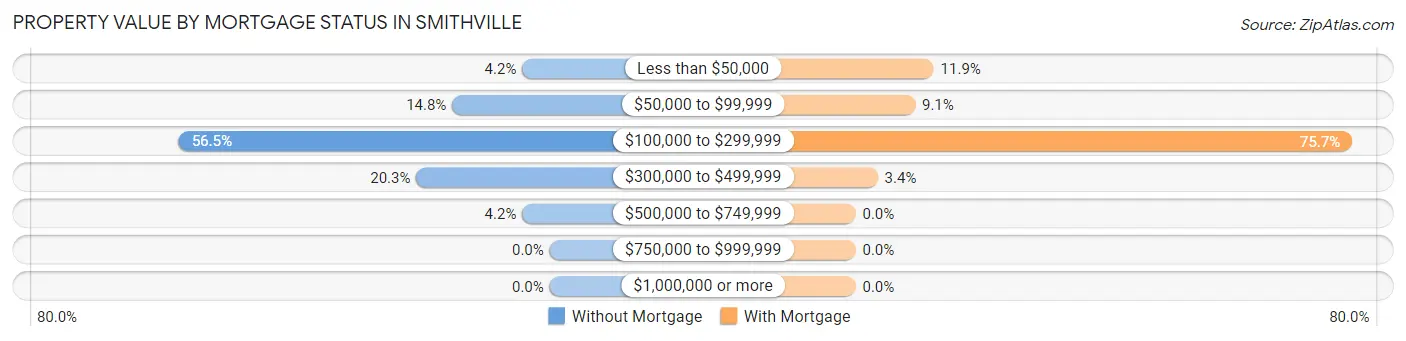
| Property Value | Without Mortgage | With Mortgage |
| Less than $50,000 | 16 (4.2%) | 67 (11.9%) |
| $50,000 to $99,999 | 57 (14.8%) | 51 (9.1%) |
| $100,000 to $299,999 | 217 (56.5%) | 426 (75.7%) |
| $300,000 to $499,999 | 78 (20.3%) | 19 (3.4%) |
| $500,000 to $749,999 | 16 (4.2%) | 0 (0.0%) |
| $750,000 to $999,999 | 0 (0.0%) | 0 (0.0%) |
| $1,000,000 or more | 0 (0.0%) | 0 (0.0%) |
| Total | 384 (100.0%) | 563 (100.0%) |
Household Income by Mortgage Status in Smithville
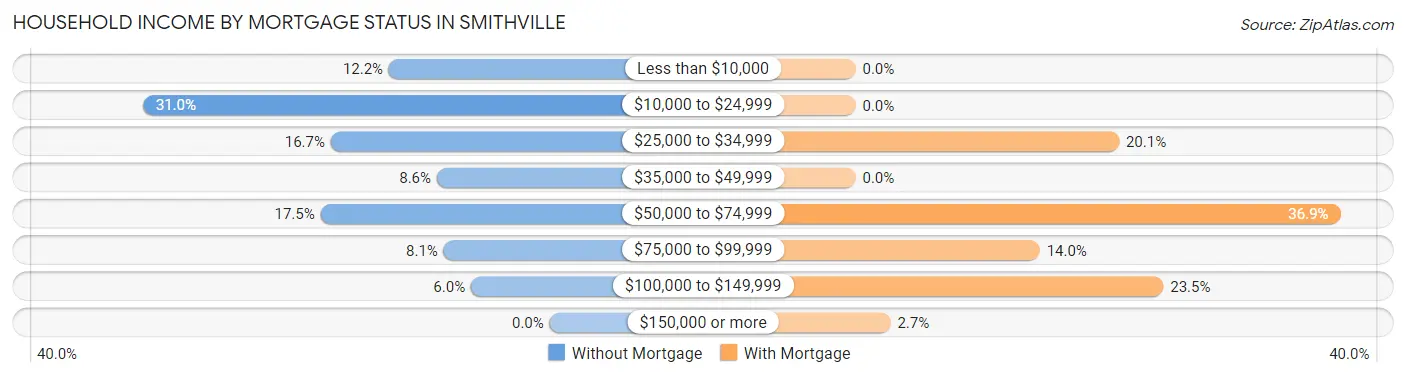
| Household Income | Without Mortgage | With Mortgage |
| Less than $10,000 | 47 (12.2%) | 0 (0.0%) |
| $10,000 to $24,999 | 119 (31.0%) | 0 (0.0%) |
| $25,000 to $34,999 | 64 (16.7%) | 113 (20.1%) |
| $35,000 to $49,999 | 33 (8.6%) | 0 (0.0%) |
| $50,000 to $74,999 | 67 (17.4%) | 208 (36.9%) |
| $75,000 to $99,999 | 31 (8.1%) | 79 (14.0%) |
| $100,000 to $149,999 | 23 (6.0%) | 132 (23.4%) |
| $150,000 or more | 0 (0.0%) | 15 (2.7%) |
| Total | 384 (100.0%) | 563 (100.0%) |
Property Value to Household Income Ratio in Smithville
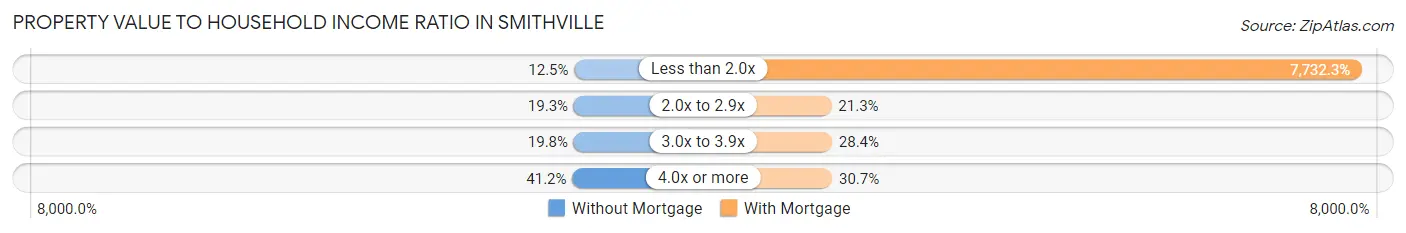
| Value-to-Income Ratio | Without Mortgage | With Mortgage |
| Less than 2.0x | 48 (12.5%) | 43,533 (7,732.3%) |
| 2.0x to 2.9x | 74 (19.3%) | 120 (21.3%) |
| 3.0x to 3.9x | 76 (19.8%) | 160 (28.4%) |
| 4.0x or more | 158 (41.1%) | 173 (30.7%) |
| Total | 384 (100.0%) | 563 (100.0%) |
Real Estate Taxes by Mortgage Status in Smithville
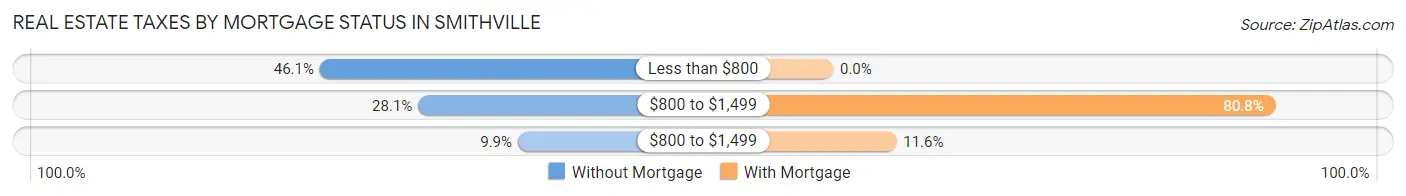
| Property Taxes | Without Mortgage | With Mortgage |
| Less than $800 | 177 (46.1%) | 0 (0.0%) |
| $800 to $1,499 | 108 (28.1%) | 455 (80.8%) |
| $800 to $1,499 | 38 (9.9%) | 65 (11.6%) |
| Total | 384 (100.0%) | 563 (100.0%) |
Health & Disability in Smithville
Health Insurance Coverage by Age in Smithville
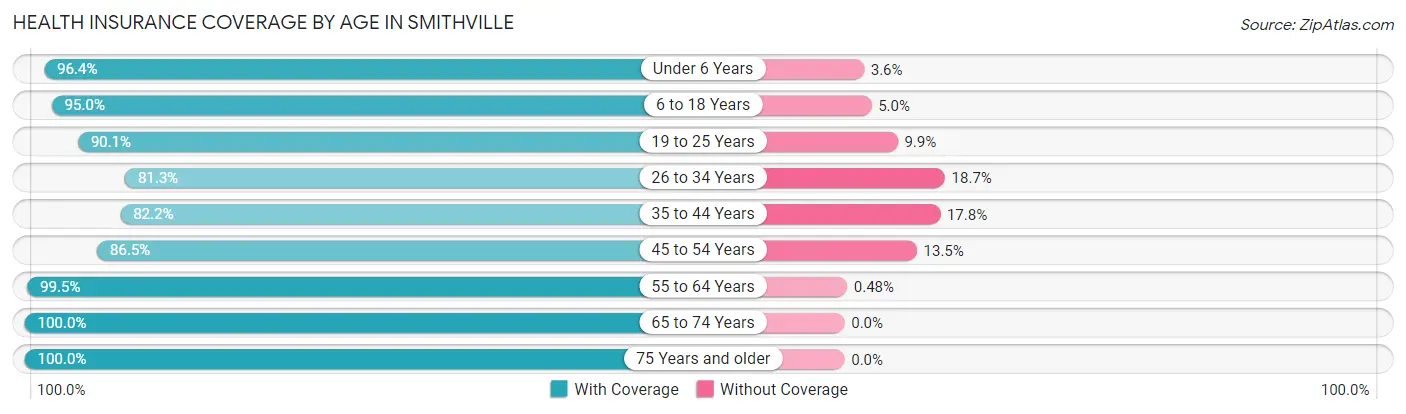
| Age Bracket | With Coverage | Without Coverage |
| Under 6 Years | 531 (96.4%) | 20 (3.6%) |
| 6 to 18 Years | 814 (95.0%) | 43 (5.0%) |
| 19 to 25 Years | 200 (90.1%) | 22 (9.9%) |
| 26 to 34 Years | 330 (81.3%) | 76 (18.7%) |
| 35 to 44 Years | 562 (82.2%) | 122 (17.8%) |
| 45 to 54 Years | 731 (86.5%) | 114 (13.5%) |
| 55 to 64 Years | 617 (99.5%) | 3 (0.5%) |
| 65 to 74 Years | 324 (100.0%) | 0 (0.0%) |
| 75 Years and older | 343 (100.0%) | 0 (0.0%) |
| Total | 4,452 (91.8%) | 400 (8.2%) |
Health Insurance Coverage by Citizenship Status in Smithville
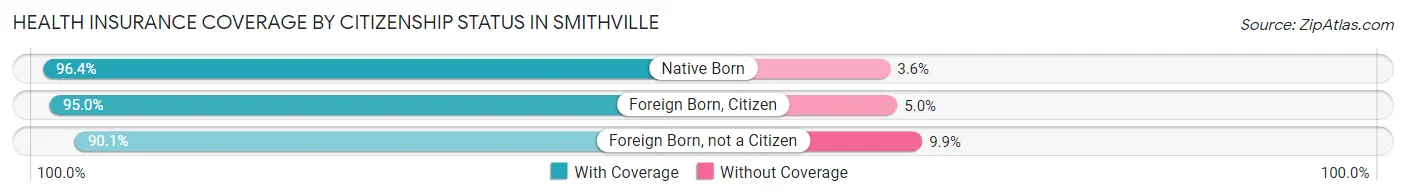
| Citizenship Status | With Coverage | Without Coverage |
| Native Born | 531 (96.4%) | 20 (3.6%) |
| Foreign Born, Citizen | 814 (95.0%) | 43 (5.0%) |
| Foreign Born, not a Citizen | 200 (90.1%) | 22 (9.9%) |
Health Insurance Coverage by Household Income in Smithville
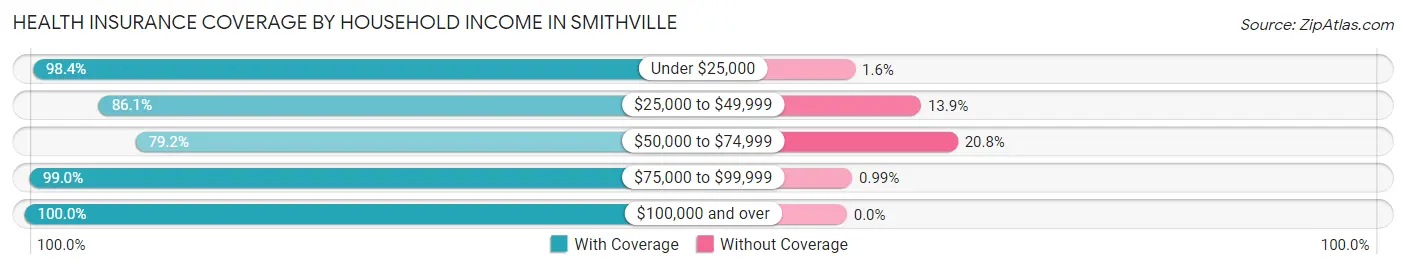
| Household Income | With Coverage | Without Coverage |
| Under $25,000 | 1,386 (98.4%) | 22 (1.6%) |
| $25,000 to $49,999 | 1,344 (86.1%) | 217 (13.9%) |
| $50,000 to $74,999 | 572 (79.2%) | 150 (20.8%) |
| $75,000 to $99,999 | 800 (99.0%) | 8 (1.0%) |
| $100,000 and over | 348 (100.0%) | 0 (0.0%) |
Public vs Private Health Insurance Coverage by Age in Smithville
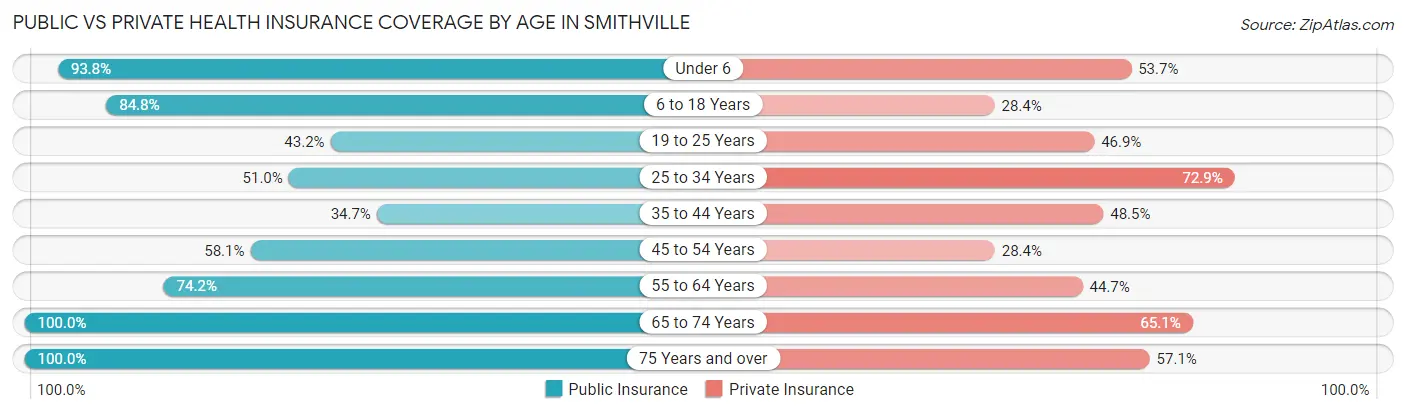
| Age Bracket | Public Insurance | Private Insurance |
| Under 6 | 517 (93.8%) | 296 (53.7%) |
| 6 to 18 Years | 727 (84.8%) | 243 (28.3%) |
| 19 to 25 Years | 96 (43.2%) | 104 (46.9%) |
| 25 to 34 Years | 207 (51.0%) | 296 (72.9%) |
| 35 to 44 Years | 237 (34.6%) | 332 (48.5%) |
| 45 to 54 Years | 491 (58.1%) | 240 (28.4%) |
| 55 to 64 Years | 460 (74.2%) | 277 (44.7%) |
| 65 to 74 Years | 324 (100.0%) | 211 (65.1%) |
| 75 Years and over | 343 (100.0%) | 196 (57.1%) |
| Total | 3,402 (70.1%) | 2,195 (45.2%) |
Disability Status by Sex by Age in Smithville
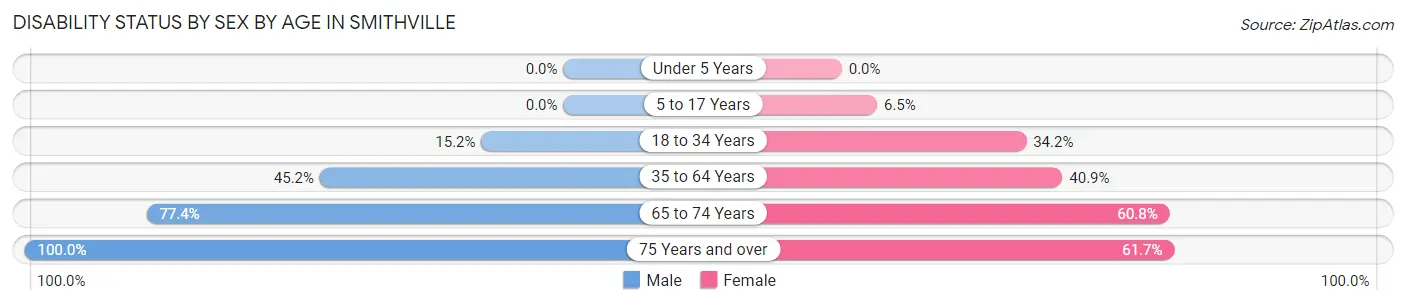
| Age Bracket | Male | Female |
| Under 5 Years | 0 (0.0%) | 0 (0.0%) |
| 5 to 17 Years | 0 (0.0%) | 30 (6.5%) |
| 18 to 34 Years | 49 (15.2%) | 115 (34.2%) |
| 35 to 64 Years | 395 (45.2%) | 522 (40.9%) |
| 65 to 74 Years | 65 (77.4%) | 146 (60.8%) |
| 75 Years and over | 121 (100.0%) | 137 (61.7%) |
Disability Class by Sex by Age in Smithville
Disability Class: Hearing Difficulty
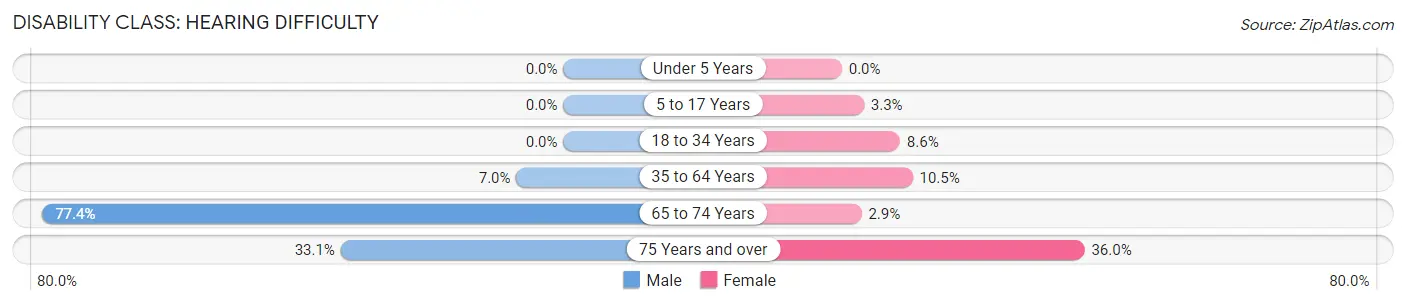
| Age Bracket | Male | Female |
| Under 5 Years | 0 (0.0%) | 0 (0.0%) |
| 5 to 17 Years | 0 (0.0%) | 15 (3.3%) |
| 18 to 34 Years | 0 (0.0%) | 29 (8.6%) |
| 35 to 64 Years | 61 (7.0%) | 134 (10.5%) |
| 65 to 74 Years | 65 (77.4%) | 7 (2.9%) |
| 75 Years and over | 40 (33.1%) | 80 (36.0%) |
Disability Class: Vision Difficulty
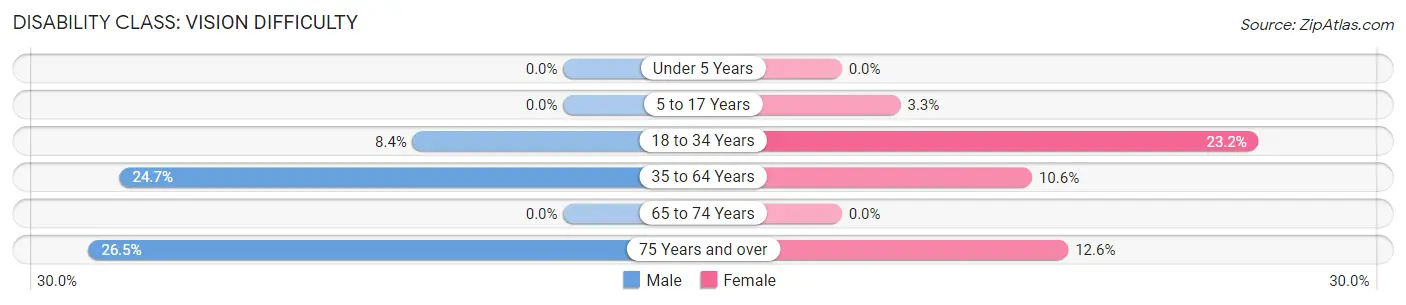
| Age Bracket | Male | Female |
| Under 5 Years | 0 (0.0%) | 0 (0.0%) |
| 5 to 17 Years | 0 (0.0%) | 15 (3.3%) |
| 18 to 34 Years | 27 (8.4%) | 78 (23.2%) |
| 35 to 64 Years | 216 (24.7%) | 135 (10.6%) |
| 65 to 74 Years | 0 (0.0%) | 0 (0.0%) |
| 75 Years and over | 32 (26.5%) | 28 (12.6%) |
Disability Class: Cognitive Difficulty
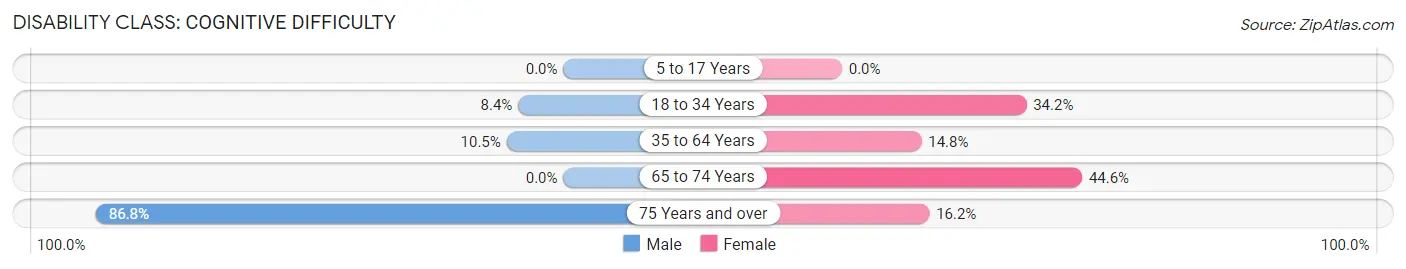
| Age Bracket | Male | Female |
| 5 to 17 Years | 0 (0.0%) | 0 (0.0%) |
| 18 to 34 Years | 27 (8.4%) | 115 (34.2%) |
| 35 to 64 Years | 92 (10.5%) | 188 (14.7%) |
| 65 to 74 Years | 0 (0.0%) | 107 (44.6%) |
| 75 Years and over | 105 (86.8%) | 36 (16.2%) |
Disability Class: Ambulatory Difficulty
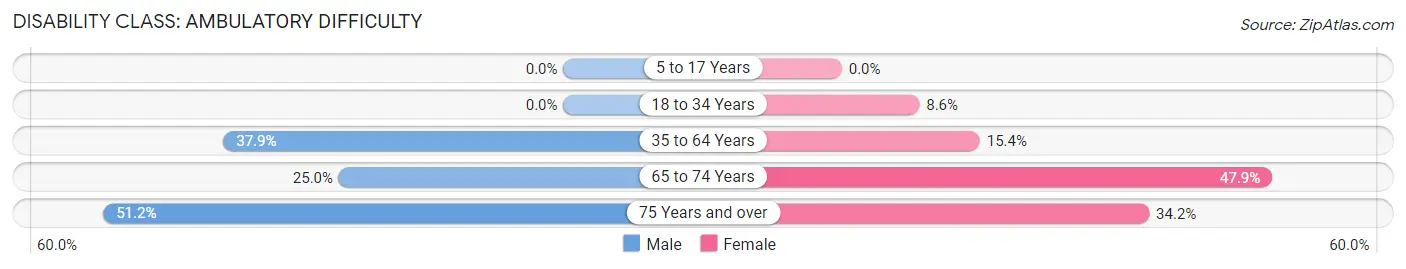
| Age Bracket | Male | Female |
| 5 to 17 Years | 0 (0.0%) | 0 (0.0%) |
| 18 to 34 Years | 0 (0.0%) | 29 (8.6%) |
| 35 to 64 Years | 331 (37.9%) | 196 (15.4%) |
| 65 to 74 Years | 21 (25.0%) | 115 (47.9%) |
| 75 Years and over | 62 (51.2%) | 76 (34.2%) |
Disability Class: Self-Care Difficulty
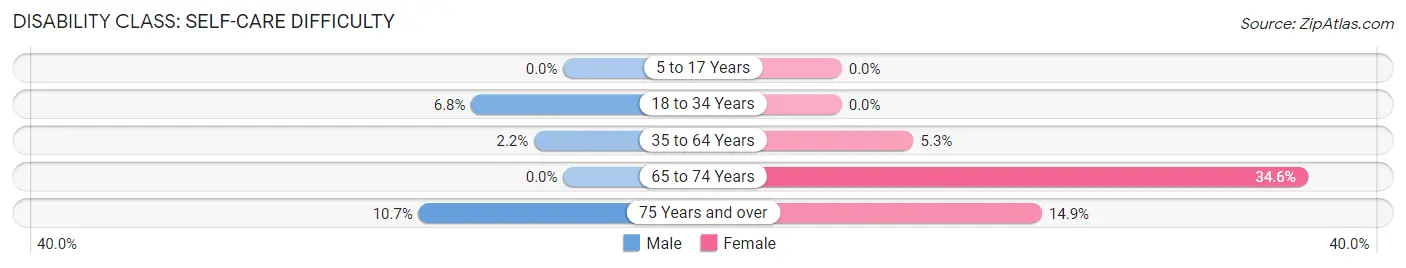
| Age Bracket | Male | Female |
| 5 to 17 Years | 0 (0.0%) | 0 (0.0%) |
| 18 to 34 Years | 22 (6.8%) | 0 (0.0%) |
| 35 to 64 Years | 19 (2.2%) | 68 (5.3%) |
| 65 to 74 Years | 0 (0.0%) | 83 (34.6%) |
| 75 Years and over | 13 (10.7%) | 33 (14.9%) |
Technology Access in Smithville
Computing Device Access in Smithville
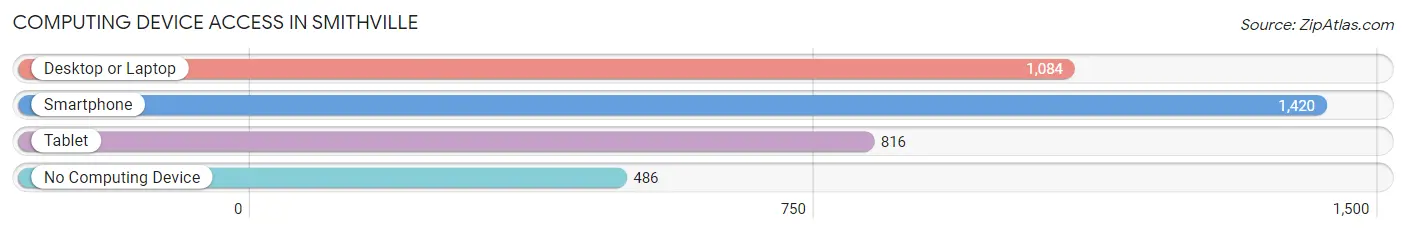
| Device Type | # Households | % Households |
| Desktop or Laptop | 1,084 | 53.0% |
| Smartphone | 1,420 | 69.4% |
| Tablet | 816 | 39.9% |
| No Computing Device | 486 | 23.7% |
| Total | 2,047 | 100.0% |
Internet Access in Smithville
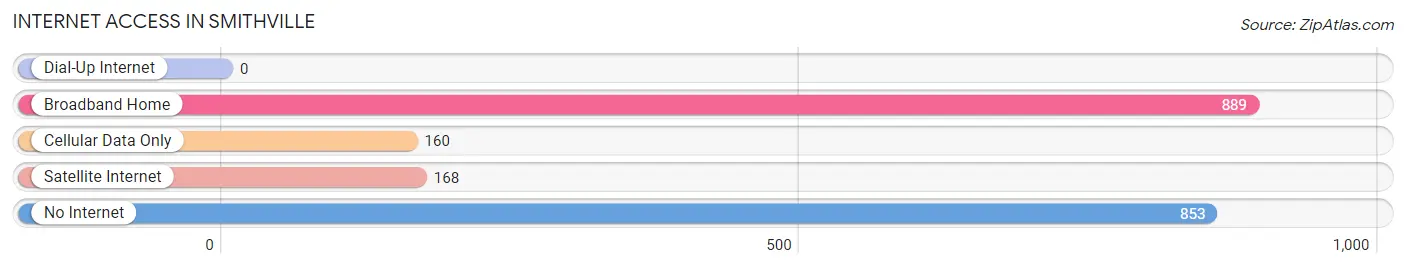
| Internet Type | # Households | % Households |
| Dial-Up Internet | 0 | 0.0% |
| Broadband Home | 889 | 43.4% |
| Cellular Data Only | 160 | 7.8% |
| Satellite Internet | 168 | 8.2% |
| No Internet | 853 | 41.7% |
| Total | 2,047 | 100.0% |
Smithville Summary
History
The town of Smithville, Tennessee is located in DeKalb County in the middle of the state. It is situated in the foothills of the Cumberland Plateau and is part of the Nashville metropolitan area. The town was founded in 1817 by William Smith, a Revolutionary War veteran, and was originally known as Smith’s Crossroads. The town was officially incorporated in 1825 and was named after its founder.
Smithville was an important stop on the stagecoach route between Nashville and Chattanooga. It was also a major stop on the Nashville and Knoxville Railroad, which was completed in 1854. The railroad brought increased economic activity to the town, and it soon became a center for trade and commerce.
The town was also an important stop on the Underground Railroad, which was used by escaped slaves to make their way to freedom in the North. Smithville was home to several prominent abolitionists, including the Reverend John Rankin, who was a leader in the movement.
Geography
Smithville is located in the middle of DeKalb County, in the foothills of the Cumberland Plateau. The town is situated at the intersection of State Route 56 and State Route 70. The town is located approximately 50 miles east of Nashville and approximately 70 miles west of Chattanooga.
The town is situated on the banks of the Smithville Reservoir, which is a man-made lake created in the 1950s. The lake is a popular destination for fishing, boating, and other recreational activities.
The town is surrounded by rolling hills and forests, and is home to several state parks and wildlife areas. The town is also located near several major highways, including Interstate 40 and U.S. Route 70.
Economy
Smithville’s economy is largely based on agriculture and tourism. The town is home to several large farms, which produce a variety of crops, including corn, soybeans, and hay. The town is also home to several small businesses, including restaurants, shops, and other services.
The town is also a popular tourist destination, due to its proximity to several state parks and recreational areas. The town is home to several bed and breakfasts, as well as several campgrounds and RV parks.
Demographics
As of the 2010 census, the population of Smithville was 4,530. The town is predominantly white, with approximately 90% of the population identifying as such. The town is also home to a small African American population, as well as a small Hispanic population.
The median household income in Smithville is $37,000, and the median home value is $117,000. The town has a low unemployment rate, and the cost of living is relatively low.
Conclusion
Smithville, Tennessee is a small town located in the middle of DeKalb County. The town was founded in 1817 and was an important stop on the stagecoach route between Nashville and Chattanooga. The town is also home to several state parks and recreational areas, and is a popular tourist destination. The town’s economy is largely based on agriculture and tourism, and the population is predominantly white. Smithville is a great place to live, work, and visit.
Common Questions
What is Per Capita Income in Smithville?
Per Capita income in Smithville is $18,158.
What is the Median Family Income in Smithville?
Median Family Income in Smithville is $43,311.
What is the Median Household income in Smithville?
Median Household Income in Smithville is $30,526.
What is Income or Wage Gap in Smithville?
Income or Wage Gap in Smithville is 17.9%.
Women in Smithville earn 82.1 cents for every dollar earned by a man.
What is Inequality or Gini Index in Smithville?
Inequality or Gini Index in Smithville is 0.48.
What is the Total Population of Smithville?
Total Population of Smithville is 5,059.
What is the Total Male Population of Smithville?
Total Male Population of Smithville is 2,239.
What is the Total Female Population of Smithville?
Total Female Population of Smithville is 2,820.
What is the Ratio of Males per 100 Females in Smithville?
There are 79.40 Males per 100 Females in Smithville.
What is the Ratio of Females per 100 Males in Smithville?
There are 125.95 Females per 100 Males in Smithville.
What is the Median Population Age in Smithville?
Median Population Age in Smithville is 43.0 Years.
What is the Average Family Size in Smithville
Average Family Size in Smithville is 3.4 People.
What is the Average Household Size in Smithville
Average Household Size in Smithville is 2.4 People.
How Large is the Labor Force in Smithville?
There are 1,542 People in the Labor Forcein in Smithville.
What is the Percentage of People in the Labor Force in Smithville?
40.5% of People are in the Labor Force in Smithville.
What is the Unemployment Rate in Smithville?
Unemployment Rate in Smithville is 5.6%.