Headland, AL Map & Demographics
Headland Map
Headland Overview
$34,451
PER CAPITA INCOME
$102,500
AVG FAMILY INCOME
$80,811
AVG HOUSEHOLD INCOME
31.2%
WAGE / INCOME GAP [ % ]
68.8¢/ $1
WAGE / INCOME GAP [ $ ]
0.38
INEQUALITY / GINI INDEX
5,027
TOTAL POPULATION
2,386
MALE POPULATION
2,641
FEMALE POPULATION
90.34
MALES / 100 FEMALES
110.69
FEMALES / 100 MALES
36.4
MEDIAN AGE
3.5
AVG FAMILY SIZE
2.8
AVG HOUSEHOLD SIZE
2,779
LABOR FORCE [ PEOPLE ]
73.7%
PERCENT IN LABOR FORCE
4.0%
UNEMPLOYMENT RATE
Headland Zip Codes
Headland Area Codes
Income in Headland
Income Overview in Headland
Per Capita Income in Headland is $34,451, while median incomes of families and households are $102,500 and $80,811 respectively.
| Characteristic | Number | Measure |
| Per Capita Income | 5,027 | $34,451 |
| Median Family Income | 1,194 | $102,500 |
| Mean Family Income | 1,194 | $111,258 |
| Median Household Income | 1,763 | $80,811 |
| Mean Household Income | 1,763 | $92,062 |
| Income Deficit | 1,194 | $0 |
| Wage / Income Gap (%) | 5,027 | 31.23% |
| Wage / Income Gap ($) | 5,027 | 68.77¢ per $1 |
| Gini / Inequality Index | 5,027 | 0.38 |
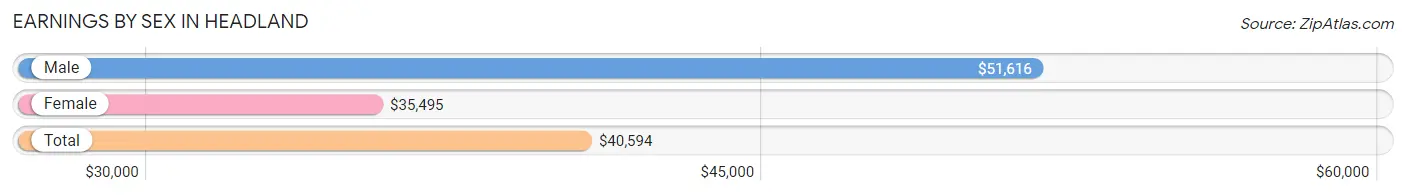
Earnings by Sex in Headland
Average Earnings in Headland are $40,594, $51,616 for men and $35,495 for women, a difference of 31.2%.
| Sex | Number | Average Earnings |
| Male | 1,422 (50.3%) | $51,616 |
| Female | 1,406 (49.7%) | $35,495 |
| Total | 2,828 (100.0%) | $40,594 |
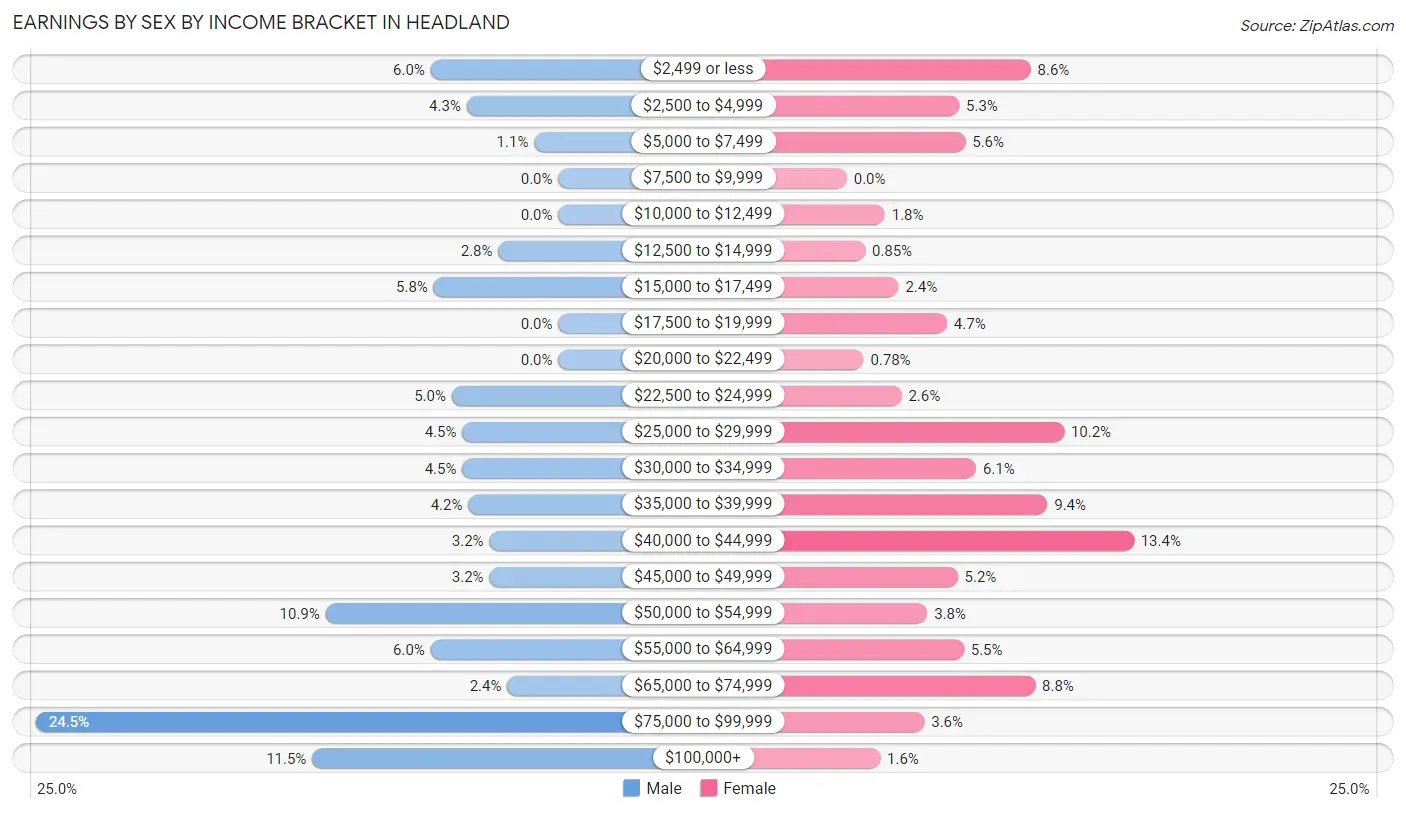
Earnings by Sex by Income Bracket in Headland
The most common earnings brackets in Headland are $75,000 to $99,999 for men (348 | 24.5%) and $40,000 to $44,999 for women (189 | 13.4%).
| Income | Male | Female |
| $2,499 or less | 85 (6.0%) | 121 (8.6%) |
| $2,500 to $4,999 | 61 (4.3%) | 74 (5.3%) |
| $5,000 to $7,499 | 16 (1.1%) | 78 (5.6%) |
| $7,500 to $9,999 | 0 (0.0%) | 0 (0.0%) |
| $10,000 to $12,499 | 0 (0.0%) | 25 (1.8%) |
| $12,500 to $14,999 | 40 (2.8%) | 12 (0.9%) |
| $15,000 to $17,499 | 83 (5.8%) | 34 (2.4%) |
| $17,500 to $19,999 | 0 (0.0%) | 66 (4.7%) |
| $20,000 to $22,499 | 0 (0.0%) | 11 (0.8%) |
| $22,500 to $24,999 | 71 (5.0%) | 36 (2.6%) |
| $25,000 to $29,999 | 64 (4.5%) | 143 (10.2%) |
| $30,000 to $34,999 | 64 (4.5%) | 85 (6.0%) |
| $35,000 to $39,999 | 60 (4.2%) | 132 (9.4%) |
| $40,000 to $44,999 | 46 (3.2%) | 189 (13.4%) |
| $45,000 to $49,999 | 46 (3.2%) | 73 (5.2%) |
| $50,000 to $54,999 | 155 (10.9%) | 53 (3.8%) |
| $55,000 to $64,999 | 85 (6.0%) | 77 (5.5%) |
| $65,000 to $74,999 | 34 (2.4%) | 124 (8.8%) |
| $75,000 to $99,999 | 348 (24.5%) | 51 (3.6%) |
| $100,000+ | 164 (11.5%) | 22 (1.6%) |
| Total | 1,422 (100.0%) | 1,406 (100.0%) |
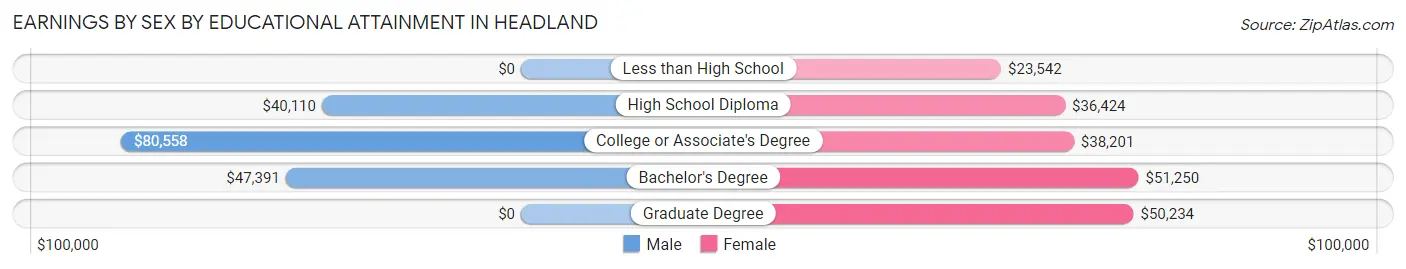
Earnings by Sex by Educational Attainment in Headland
Average earnings in Headland are $55,238 for men and $36,621 for women, a difference of 33.7%. Men with an educational attainment of college or associate's degree enjoy the highest average annual earnings of $80,558, while those with high school diploma education earn the least with $40,110. Women with an educational attainment of bachelor's degree earn the most with the average annual earnings of $51,250, while those with less than high school education have the smallest earnings of $23,542.
| Educational Attainment | Male Income | Female Income |
| Less than High School | - | - |
| High School Diploma | $40,110 | $36,424 |
| College or Associate's Degree | $80,558 | $38,201 |
| Bachelor's Degree | $47,391 | $51,250 |
| Graduate Degree | - | - |
| Total | $55,238 | $36,621 |
Family Income in Headland
Family Income Brackets in Headland
According to the Headland family income data, there are 405 families falling into the $100,000 to $149,999 income range, which is the most common income bracket and makes up 33.9% of all families. Conversely, the $10,000 to $14,999 income bracket is the least frequent group with only 18 families (1.5%) belonging to this category.
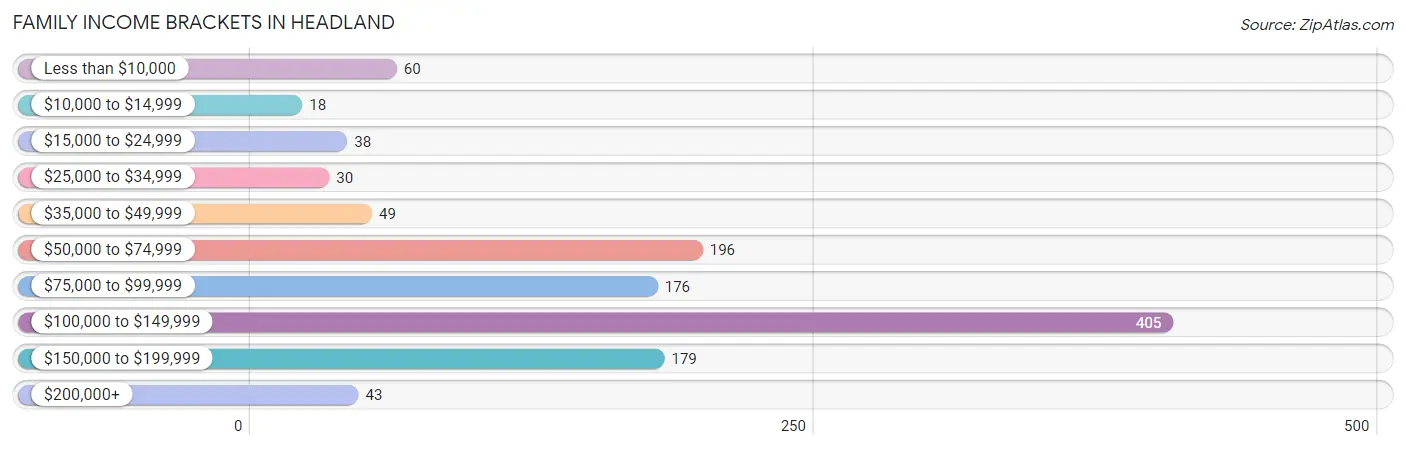
| Income Bracket | # Families | % Families |
| Less than $10,000 | 60 | 5.0% |
| $10,000 to $14,999 | 18 | 1.5% |
| $15,000 to $24,999 | 38 | 3.2% |
| $25,000 to $34,999 | 30 | 2.5% |
| $35,000 to $49,999 | 49 | 4.1% |
| $50,000 to $74,999 | 196 | 16.4% |
| $75,000 to $99,999 | 176 | 14.7% |
| $100,000 to $149,999 | 405 | 33.9% |
| $150,000 to $199,999 | 179 | 15.0% |
| $200,000+ | 43 | 3.6% |
Family Income by Famaliy Size in Headland
5-person families (114 | 9.6%) account for the highest median family income in Headland with $116,250 per family, while 2-person families (522 | 43.7%) have the highest median income of $52,500 per family member.
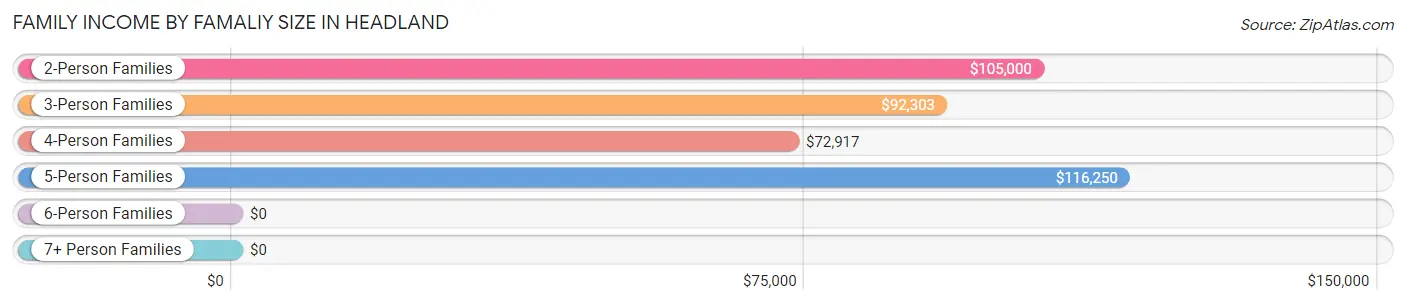
| Income Bracket | # Families | Median Income |
| 2-Person Families | 522 (43.7%) | $105,000 |
| 3-Person Families | 215 (18.0%) | $92,303 |
| 4-Person Families | 343 (28.7%) | $72,917 |
| 5-Person Families | 114 (9.6%) | $116,250 |
| 6-Person Families | 0 (0.0%) | $0 |
| 7+ Person Families | 0 (0.0%) | $0 |
| Total | 1,194 (100.0%) | $102,500 |
Family Income by Number of Earners in Headland
The median family income in Headland is $102,500, with families comprising 3+ earners (126) having the highest median family income of $132,768, while families with no earners (99) have the lowest median family income of $47,054, accounting for 10.5% and 8.3% of families, respectively.
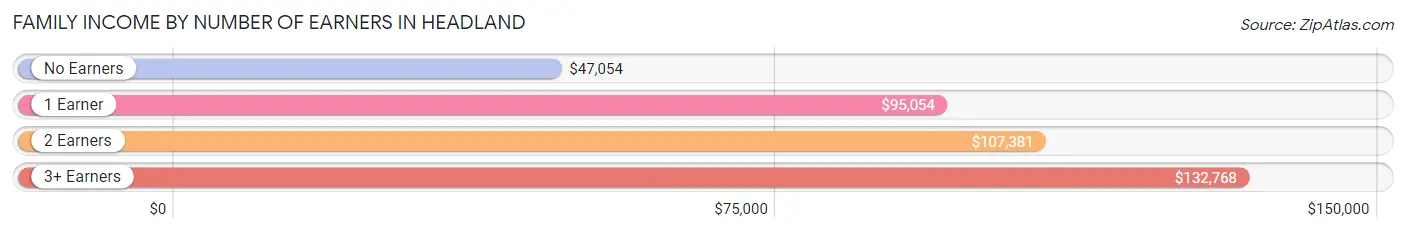
| Number of Earners | # Families | Median Income |
| No Earners | 99 (8.3%) | $47,054 |
| 1 Earner | 255 (21.4%) | $95,054 |
| 2 Earners | 714 (59.8%) | $107,381 |
| 3+ Earners | 126 (10.5%) | $132,768 |
| Total | 1,194 (100.0%) | $102,500 |
Household Income in Headland
Household Income Brackets in Headland
With 405 households falling in the category, the $100,000 to $149,999 income range is the most frequent in Headland, accounting for 23.0% of all households. In contrast, only 42 households (2.4%) fall into the $200,000+ income bracket, making it the least populous group.
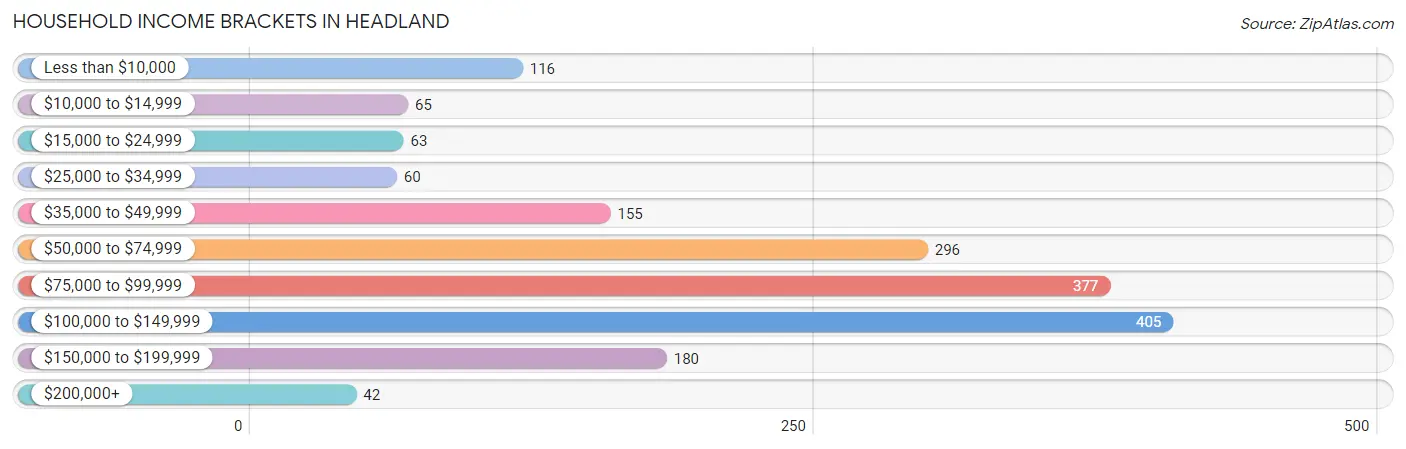
| Income Bracket | # Households | % Households |
| Less than $10,000 | 116 | 6.6% |
| $10,000 to $14,999 | 65 | 3.7% |
| $15,000 to $24,999 | 63 | 3.6% |
| $25,000 to $34,999 | 60 | 3.4% |
| $35,000 to $49,999 | 155 | 8.8% |
| $50,000 to $74,999 | 296 | 16.8% |
| $75,000 to $99,999 | 377 | 21.4% |
| $100,000 to $149,999 | 405 | 23.0% |
| $150,000 to $199,999 | 180 | 10.2% |
| $200,000+ | 42 | 2.4% |
Household Income by Householder Age in Headland
The median household income in Headland is $80,811, with the highest median household income of $91,757 found in the 45 to 64 years age bracket for the primary householder. A total of 666 households (37.8%) fall into this category. Meanwhile, the 65+ years age bracket for the primary householder has the lowest median household income of $44,392, with 480 households (27.2%) in this group.
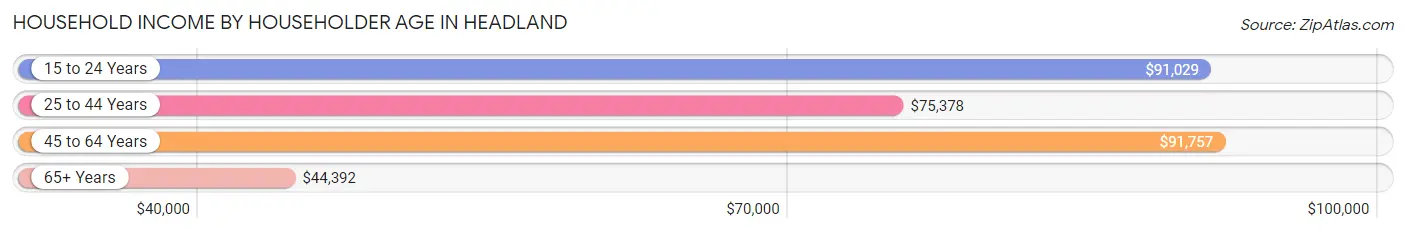
| Income Bracket | # Households | Median Income |
| 15 to 24 Years | 52 (2.9%) | $91,029 |
| 25 to 44 Years | 565 (32.1%) | $75,378 |
| 45 to 64 Years | 666 (37.8%) | $91,757 |
| 65+ Years | 480 (27.2%) | $44,392 |
| Total | 1,763 (100.0%) | $80,811 |
Poverty in Headland
Income Below Poverty by Sex and Age in Headland
With 4.4% poverty level for males and 12.1% for females among the residents of Headland, 16 and 17 year old males and 18 to 24 year old females are the most vulnerable to poverty, with 14 males (31.1%) and 72 females (50.0%) in their respective age groups living below the poverty level.
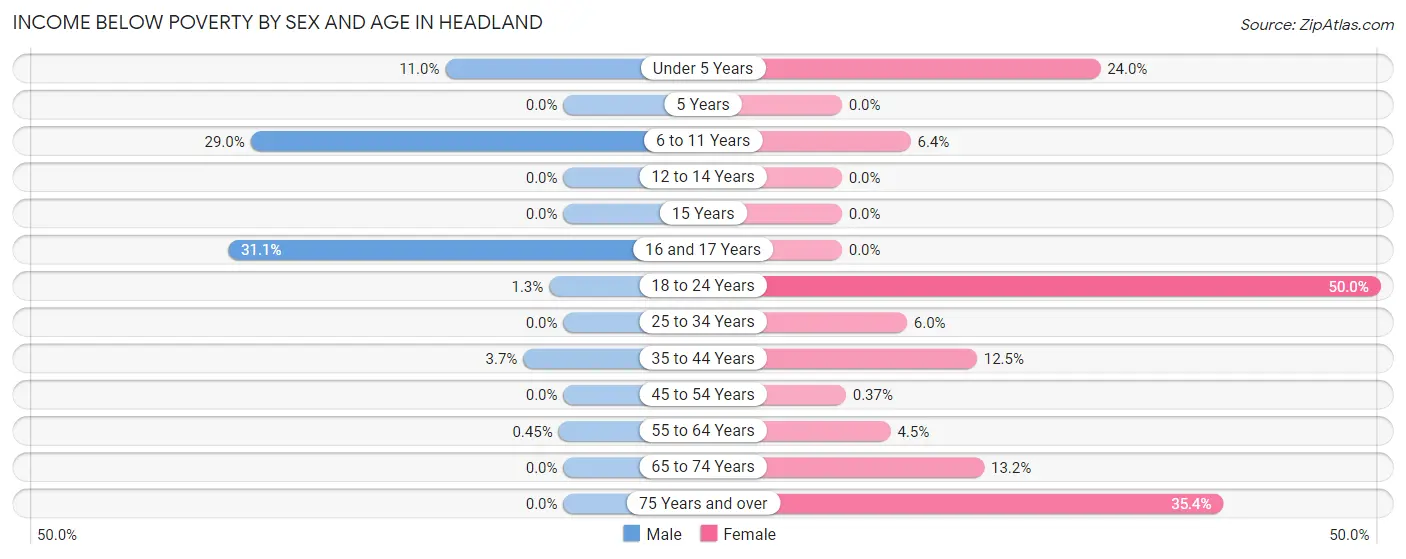
| Age Bracket | Male | Female |
| Under 5 Years | 16 (11.0%) | 47 (24.0%) |
| 5 Years | 0 (0.0%) | 0 (0.0%) |
| 6 to 11 Years | 54 (29.0%) | 18 (6.4%) |
| 12 to 14 Years | 0 (0.0%) | 0 (0.0%) |
| 15 Years | 0 (0.0%) | 0 (0.0%) |
| 16 and 17 Years | 14 (31.1%) | 0 (0.0%) |
| 18 to 24 Years | 2 (1.3%) | 72 (50.0%) |
| 25 to 34 Years | 0 (0.0%) | 18 (6.0%) |
| 35 to 44 Years | 11 (3.7%) | 50 (12.5%) |
| 45 to 54 Years | 0 (0.0%) | 1 (0.4%) |
| 55 to 64 Years | 1 (0.4%) | 14 (4.5%) |
| 65 to 74 Years | 0 (0.0%) | 33 (13.2%) |
| 75 Years and over | 0 (0.0%) | 57 (35.4%) |
| Total | 98 (4.4%) | 310 (12.1%) |
Income Above Poverty by Sex and Age in Headland
According to the poverty statistics in Headland, males aged 5 years and females aged 12 to 14 years are the age groups that are most secure financially, with 100.0% of males and 100.0% of females in these age groups living above the poverty line.
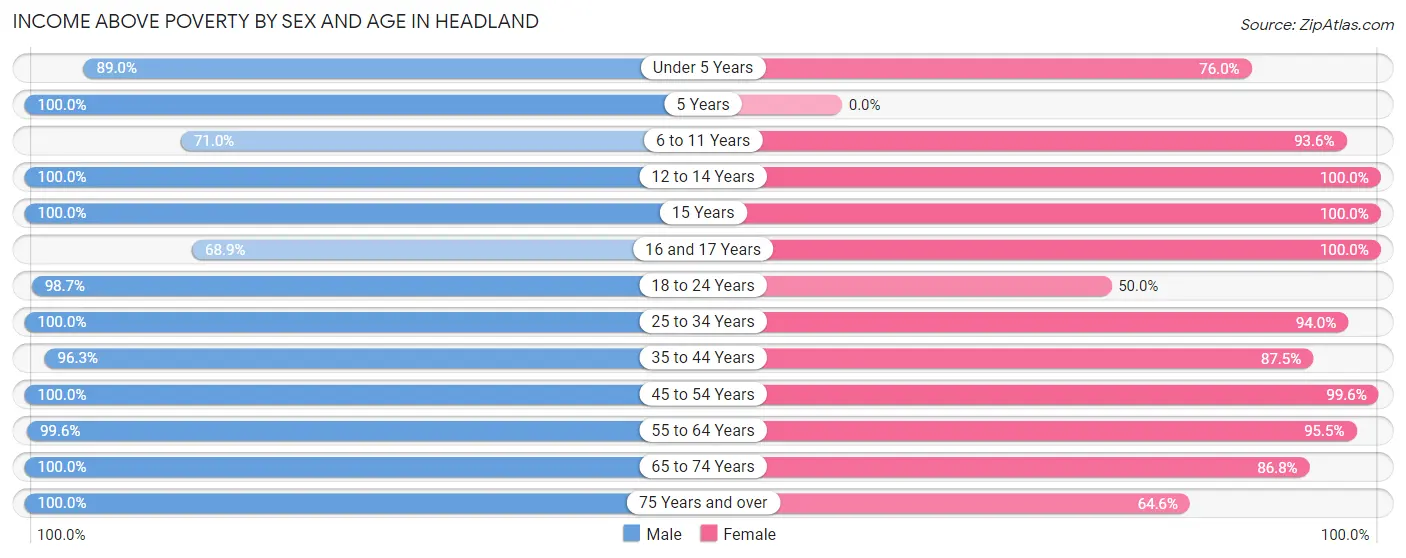
| Age Bracket | Male | Female |
| Under 5 Years | 130 (89.0%) | 149 (76.0%) |
| 5 Years | 30 (100.0%) | 0 (0.0%) |
| 6 to 11 Years | 132 (71.0%) | 264 (93.6%) |
| 12 to 14 Years | 56 (100.0%) | 148 (100.0%) |
| 15 Years | 46 (100.0%) | 16 (100.0%) |
| 16 and 17 Years | 31 (68.9%) | 82 (100.0%) |
| 18 to 24 Years | 150 (98.7%) | 72 (50.0%) |
| 25 to 34 Years | 432 (100.0%) | 280 (94.0%) |
| 35 to 44 Years | 284 (96.3%) | 349 (87.5%) |
| 45 to 54 Years | 311 (100.0%) | 268 (99.6%) |
| 55 to 64 Years | 222 (99.6%) | 296 (95.5%) |
| 65 to 74 Years | 217 (100.0%) | 217 (86.8%) |
| 75 Years and over | 79 (100.0%) | 104 (64.6%) |
| Total | 2,120 (95.6%) | 2,245 (87.9%) |
Income Below Poverty Among Married-Couple Families in Headland
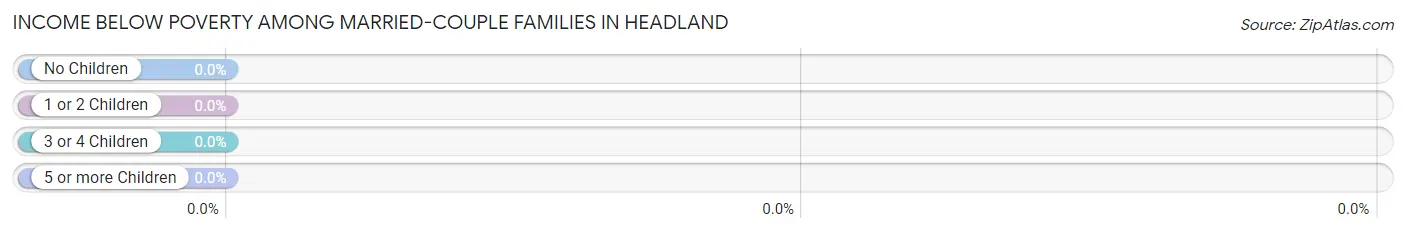
| Children | Above Poverty | Below Poverty |
| No Children | 573 (100.0%) | 0 (0.0%) |
| 1 or 2 Children | 340 (100.0%) | 0 (0.0%) |
| 3 or 4 Children | 80 (100.0%) | 0 (0.0%) |
| 5 or more Children | 0 (0.0%) | 0 (0.0%) |
| Total | 993 (100.0%) | 0 (0.0%) |
Income Below Poverty Among Single-Parent Households in Headland
According to the poverty data in Headland, 100.0% or 10 single-father households and 35.6% or 68 single-mother households are living below the poverty line. Among single-father households, those with 1 or 2 children have the highest poverty rate, with 10 households (100.0%) experiencing poverty. Likewise, among single-mother households, those with 1 or 2 children have the highest poverty rate, with 68 households (56.7%) falling below the poverty line.
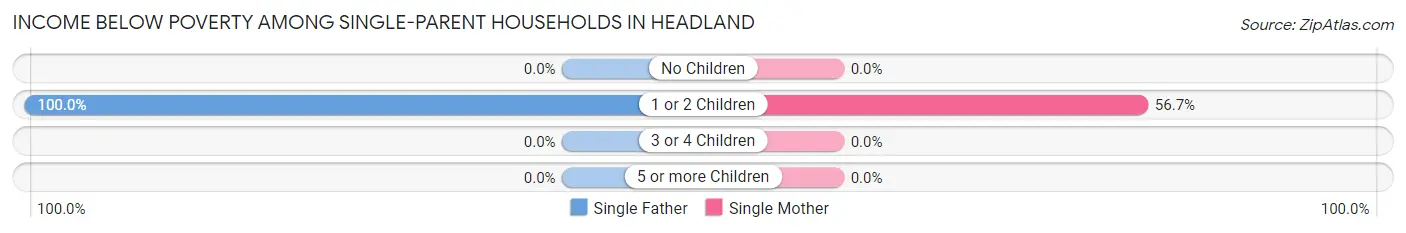
| Children | Single Father | Single Mother |
| No Children | 0 (0.0%) | 0 (0.0%) |
| 1 or 2 Children | 10 (100.0%) | 68 (56.7%) |
| 3 or 4 Children | 0 (0.0%) | 0 (0.0%) |
| 5 or more Children | 0 (0.0%) | 0 (0.0%) |
| Total | 10 (100.0%) | 68 (35.6%) |
Income Below Poverty Among Married-Couple vs Single-Parent Households in Headland
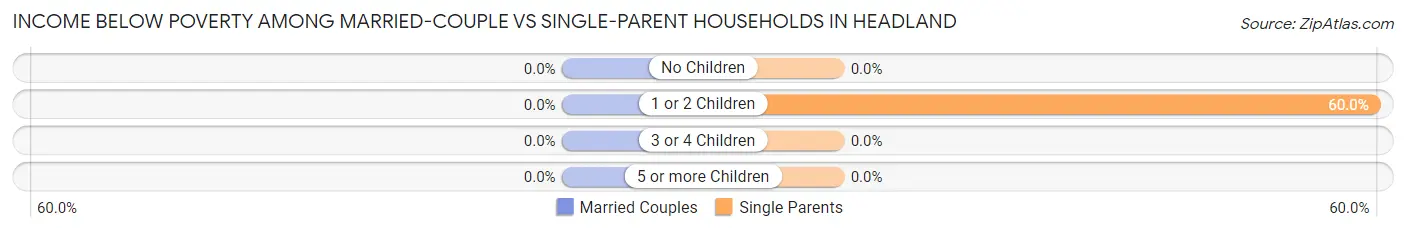
| Children | Married-Couple Families | Single-Parent Households |
| No Children | 0 (0.0%) | 0 (0.0%) |
| 1 or 2 Children | 0 (0.0%) | 78 (60.0%) |
| 3 or 4 Children | 0 (0.0%) | 0 (0.0%) |
| 5 or more Children | 0 (0.0%) | 0 (0.0%) |
| Total | 0 (0.0%) | 78 (38.8%) |
Race in Headland
The most populous races in Headland are White / Caucasian (3,856 | 76.7%), Black / African American (1,017 | 20.2%), and Two or more Races (110 | 2.2%).
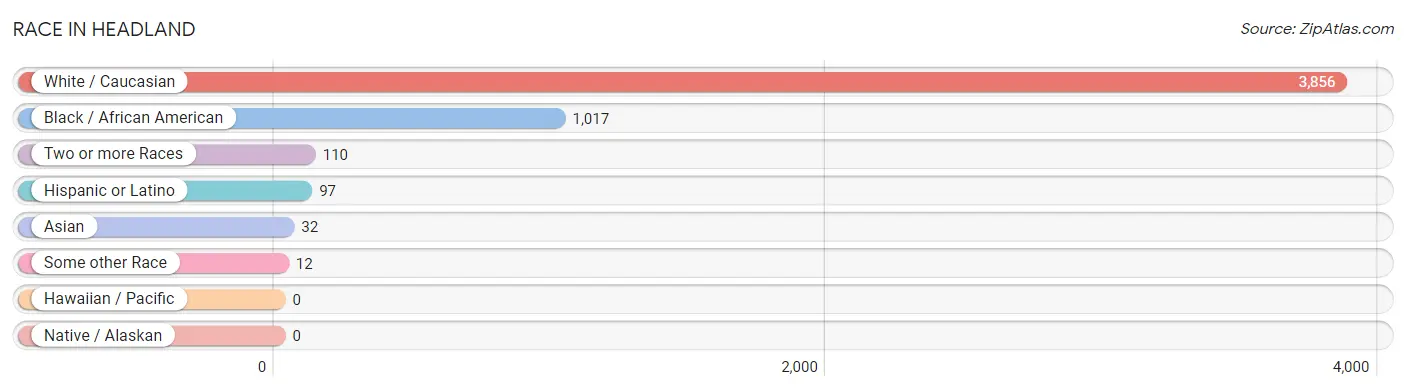
| Race | # Population | % Population |
| Asian | 32 | 0.6% |
| Black / African American | 1,017 | 20.2% |
| Hawaiian / Pacific | 0 | 0.0% |
| Hispanic or Latino | 97 | 1.9% |
| Native / Alaskan | 0 | 0.0% |
| White / Caucasian | 3,856 | 76.7% |
| Two or more Races | 110 | 2.2% |
| Some other Race | 12 | 0.2% |
| Total | 5,027 | 100.0% |
Ancestry in Headland
The most populous ancestries reported in Headland are American (1,151 | 22.9%), Irish (448 | 8.9%), English (337 | 6.7%), German (308 | 6.1%), and Scottish (125 | 2.5%), together accounting for 47.1% of all Headland residents.
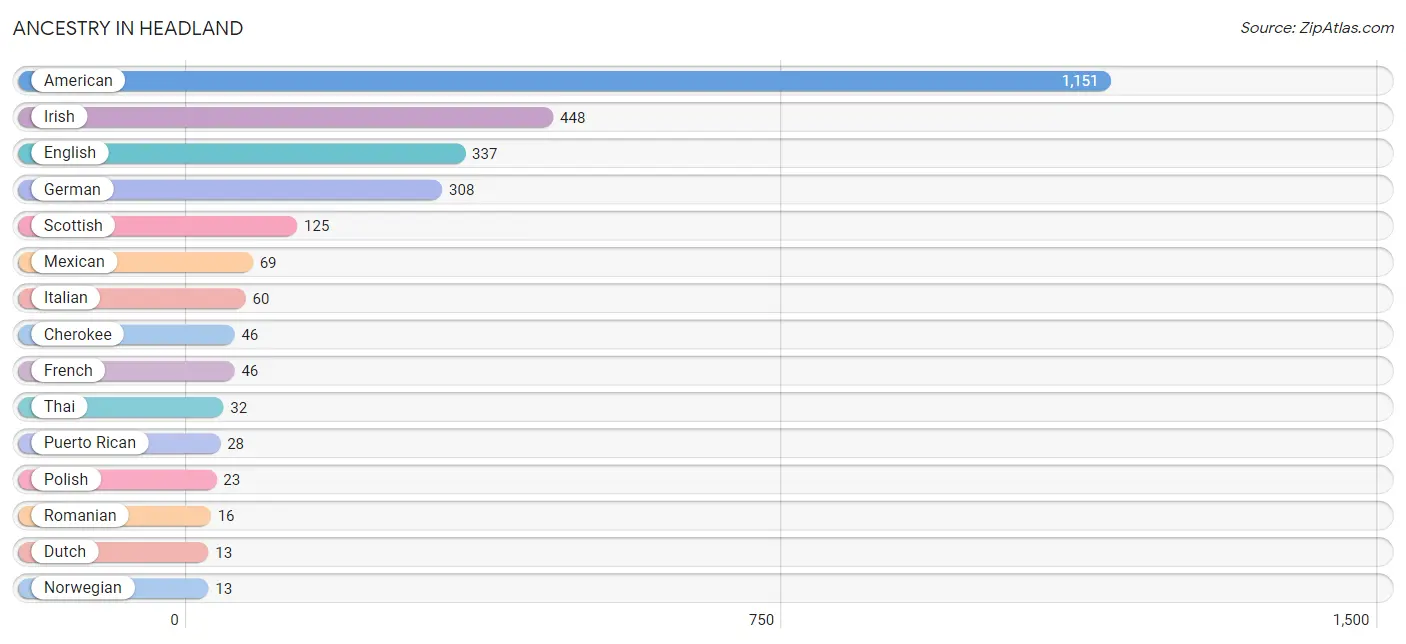
| Ancestry | # Population | % Population |
| American | 1,151 | 22.9% |
| Cherokee | 46 | 0.9% |
| Dutch | 13 | 0.3% |
| English | 337 | 6.7% |
| European | 11 | 0.2% |
| French | 46 | 0.9% |
| German | 308 | 6.1% |
| Irish | 448 | 8.9% |
| Italian | 60 | 1.2% |
| Mexican | 69 | 1.4% |
| Norwegian | 13 | 0.3% |
| Pakistani | 10 | 0.2% |
| Pennsylvania German | 11 | 0.2% |
| Polish | 23 | 0.5% |
| Puerto Rican | 28 | 0.6% |
| Romanian | 16 | 0.3% |
| Scotch-Irish | 12 | 0.2% |
| Scottish | 125 | 2.5% |
| Swedish | 10 | 0.2% |
| Thai | 32 | 0.6% |
| Welsh | 13 | 0.3% | View All 21 Rows |
Immigrants in Headland
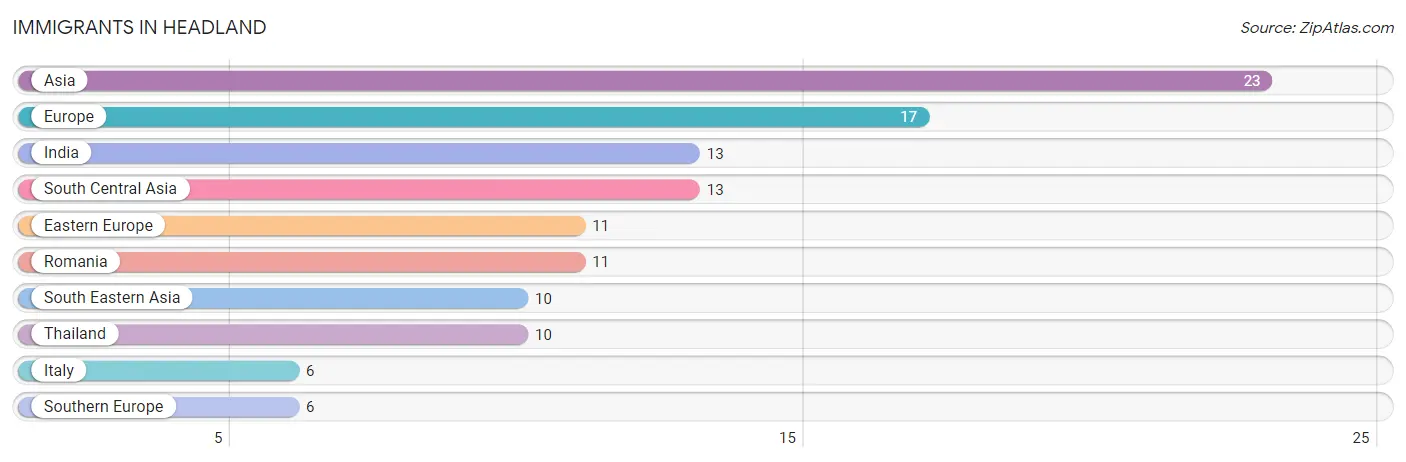
The most numerous immigrant groups reported in Headland came from Asia (23 | 0.5%), Europe (17 | 0.3%), India (13 | 0.3%), South Central Asia (13 | 0.3%), and Eastern Europe (11 | 0.2%), together accounting for 1.5% of all Headland residents.
| Immigration Origin | # Population | % Population |
| Asia | 23 | 0.5% |
| Eastern Europe | 11 | 0.2% |
| Europe | 17 | 0.3% |
| India | 13 | 0.3% |
| Italy | 6 | 0.1% |
| Romania | 11 | 0.2% |
| South Central Asia | 13 | 0.3% |
| South Eastern Asia | 10 | 0.2% |
| Southern Europe | 6 | 0.1% |
| Thailand | 10 | 0.2% | View All 10 Rows |
Sex and Age in Headland
Sex and Age in Headland
The most populous age groups in Headland are 25 to 29 Years (235 | 9.9%) for men and 5 to 9 Years (239 | 9.0%) for women.
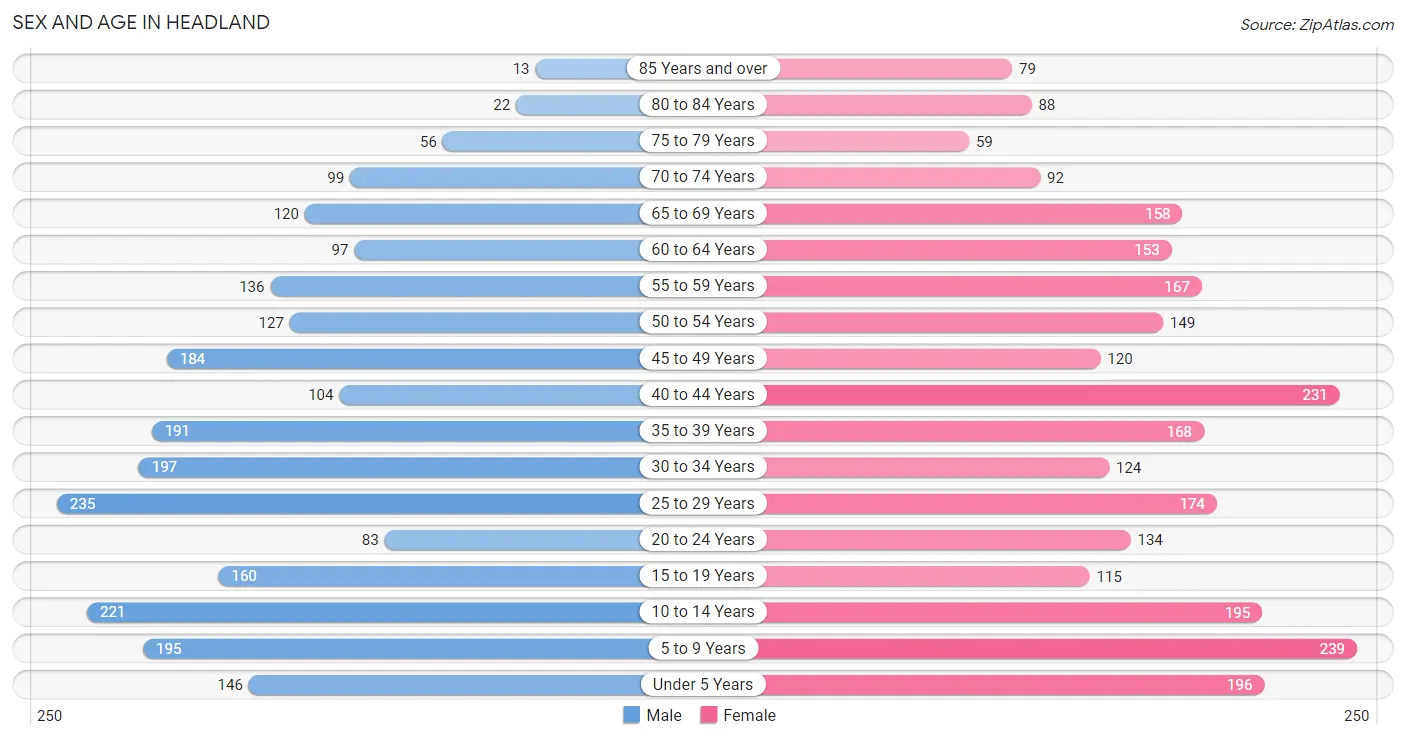
| Age Bracket | Male | Female |
| Under 5 Years | 146 (6.1%) | 196 (7.4%) |
| 5 to 9 Years | 195 (8.2%) | 239 (9.0%) |
| 10 to 14 Years | 221 (9.3%) | 195 (7.4%) |
| 15 to 19 Years | 160 (6.7%) | 115 (4.3%) |
| 20 to 24 Years | 83 (3.5%) | 134 (5.1%) |
| 25 to 29 Years | 235 (9.9%) | 174 (6.6%) |
| 30 to 34 Years | 197 (8.3%) | 124 (4.7%) |
| 35 to 39 Years | 191 (8.0%) | 168 (6.4%) |
| 40 to 44 Years | 104 (4.4%) | 231 (8.7%) |
| 45 to 49 Years | 184 (7.7%) | 120 (4.5%) |
| 50 to 54 Years | 127 (5.3%) | 149 (5.6%) |
| 55 to 59 Years | 136 (5.7%) | 167 (6.3%) |
| 60 to 64 Years | 97 (4.1%) | 153 (5.8%) |
| 65 to 69 Years | 120 (5.0%) | 158 (6.0%) |
| 70 to 74 Years | 99 (4.2%) | 92 (3.5%) |
| 75 to 79 Years | 56 (2.4%) | 59 (2.2%) |
| 80 to 84 Years | 22 (0.9%) | 88 (3.3%) |
| 85 Years and over | 13 (0.5%) | 79 (3.0%) |
| Total | 2,386 (100.0%) | 2,641 (100.0%) |
Families and Households in Headland
Median Family Size in Headland
The median family size in Headland is 3.46 persons per family, with single female/mother families (191 | 16.0%) accounting for the largest median family size of 4.4 persons per family. On the other hand, single male/father families (10 | 0.8%) represent the smallest median family size with 1.80 persons per family.
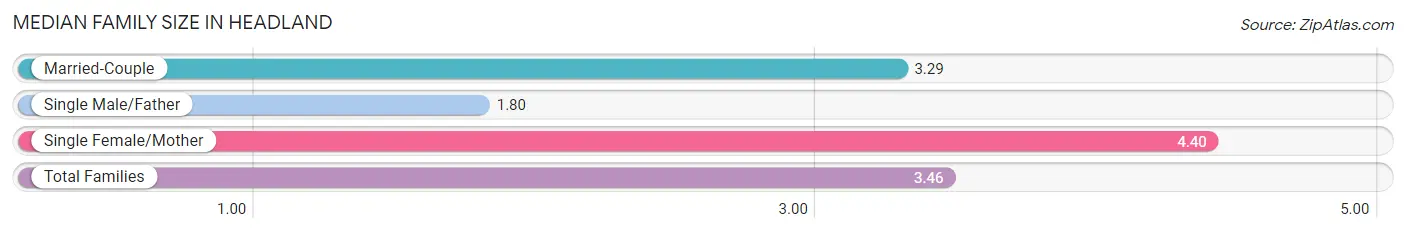
| Family Type | # Families | Family Size |
| Married-Couple | 993 (83.2%) | 3.29 |
| Single Male/Father | 10 (0.8%) | 1.80 |
| Single Female/Mother | 191 (16.0%) | 4.40 |
| Total Families | 1,194 (100.0%) | 3.46 |
Median Household Size in Headland
The median household size in Headland is 2.78 persons per household, with single female/mother households (191 | 10.8%) accounting for the largest median household size of 4.64 persons per household. non-family households (569 | 32.3%) represent the smallest median household size with 1.07 persons per household.
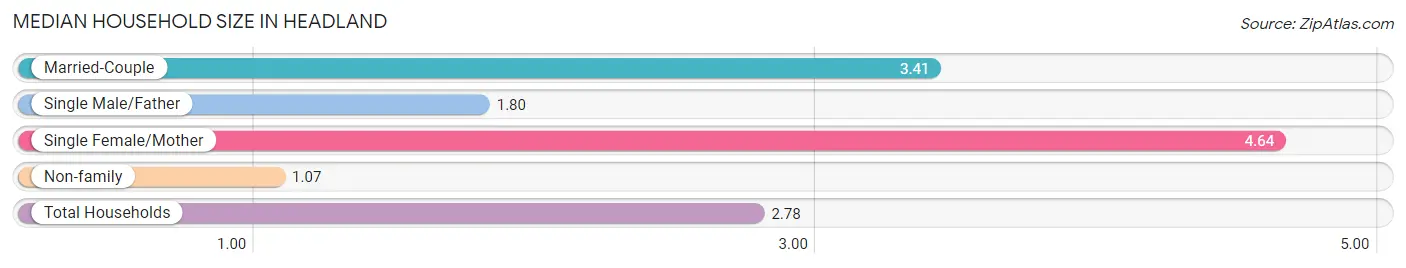
| Household Type | # Households | Household Size |
| Married-Couple | 993 (56.3%) | 3.41 |
| Single Male/Father | 10 (0.6%) | 1.80 |
| Single Female/Mother | 191 (10.8%) | 4.64 |
| Non-family | 569 (32.3%) | 1.07 |
| Total Households | 1,763 (100.0%) | 2.78 |
Household Size by Marriage Status in Headland
Out of a total of 1,763 households in Headland, 1,194 (67.7%) are family households, while 569 (32.3%) are nonfamily households. The most numerous type of family households are 2-person households, comprising 474, and the most common type of nonfamily households are 1-person households, comprising 526.
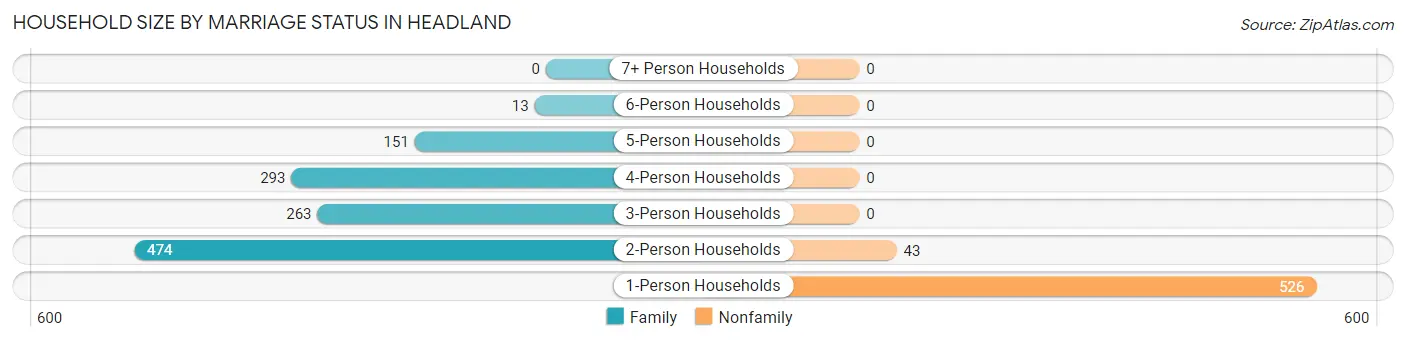
| Household Size | Family Households | Nonfamily Households |
| 1-Person Households | - | 526 (29.8%) |
| 2-Person Households | 474 (26.9%) | 43 (2.4%) |
| 3-Person Households | 263 (14.9%) | 0 (0.0%) |
| 4-Person Households | 293 (16.6%) | 0 (0.0%) |
| 5-Person Households | 151 (8.6%) | 0 (0.0%) |
| 6-Person Households | 13 (0.7%) | 0 (0.0%) |
| 7+ Person Households | 0 (0.0%) | 0 (0.0%) |
| Total | 1,194 (67.7%) | 569 (32.3%) |
Female Fertility in Headland
Fertility by Age in Headland
Average fertility rate in Headland is 114.0 births per 1,000 women. Women in the age bracket of 20 to 34 years have the highest fertility rate with 238.0 births per 1,000 women. Women in the age bracket of 20 to 34 years acount for 81.1% of all women with births.
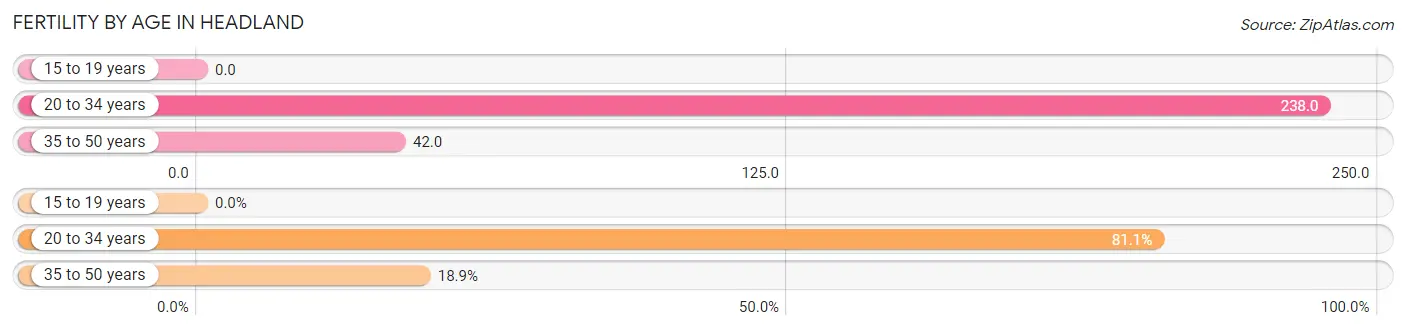
| Age Bracket | Women with Births | Births / 1,000 Women |
| 15 to 19 years | 0 (0.0%) | 0.0 |
| 20 to 34 years | 103 (81.1%) | 238.0 |
| 35 to 50 years | 24 (18.9%) | 42.0 |
| Total | 127 (100.0%) | 114.0 |
Fertility by Age by Marriage Status in Headland
55.9% of women with births (127) in Headland are married. The highest percentage of unmarried women with births falls into 20 to 34 years age bracket with 44.7% of them unmarried at the time of birth, while the lowest percentage of unmarried women with births belong to 35 to 50 years age bracket with 41.7% of them unmarried.
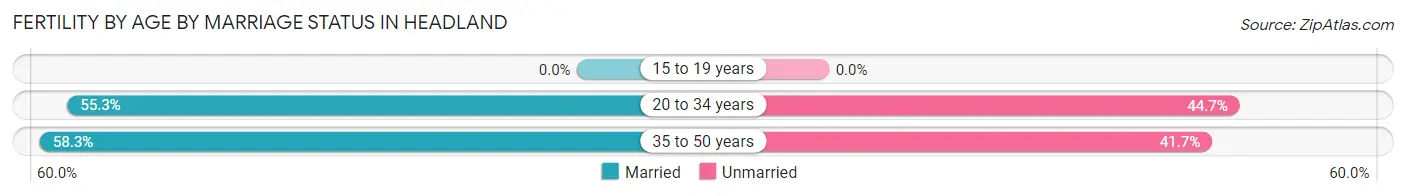
| Age Bracket | Married | Unmarried |
| 15 to 19 years | 0 (0.0%) | 0 (0.0%) |
| 20 to 34 years | 57 (55.3%) | 46 (44.7%) |
| 35 to 50 years | 14 (58.3%) | 10 (41.7%) |
| Total | 71 (55.9%) | 56 (44.1%) |
Fertility by Education in Headland
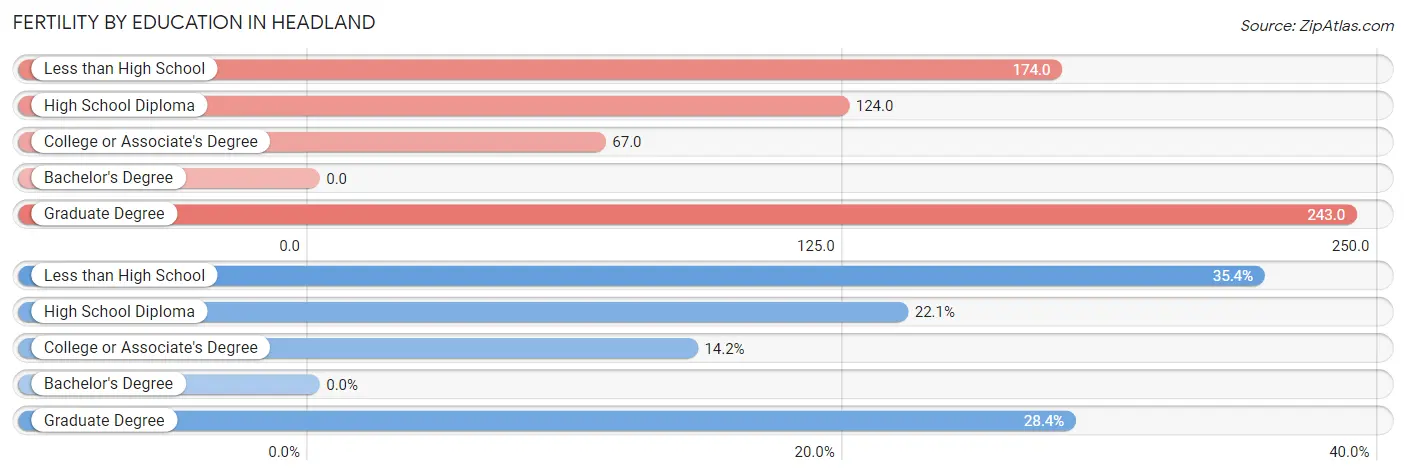
| Educational Attainment | Women with Births | Births / 1,000 Women |
| Less than High School | 45 (35.4%) | 174.0 |
| High School Diploma | 28 (22.1%) | 124.0 |
| College or Associate's Degree | 18 (14.2%) | 67.0 |
| Bachelor's Degree | 0 (0.0%) | 0.0 |
| Graduate Degree | 36 (28.3%) | 243.0 |
| Total | 127 (100.0%) | 114.0 |
Fertility by Education by Marriage Status in Headland
44.1% of women with births in Headland are unmarried. Women with the educational attainment of less than high school are most likely to be married with 100.0% of them married at childbirth, while women with the educational attainment of high school diploma are least likely to be married with 100.0% of them unmarried at childbirth.
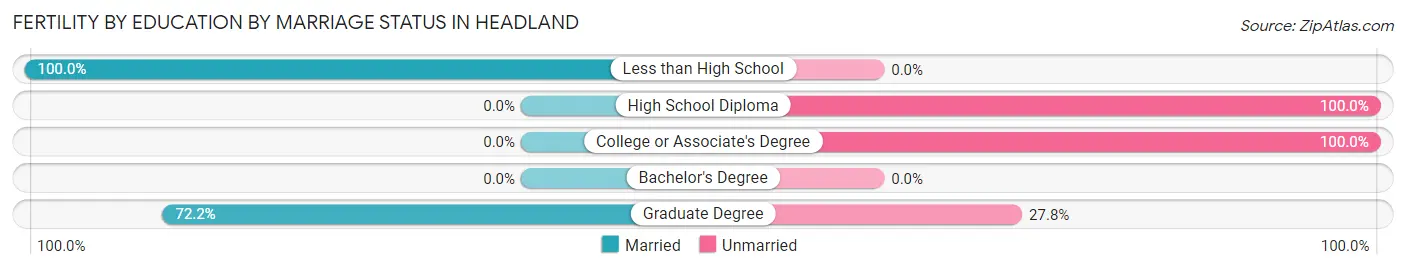
| Educational Attainment | Married | Unmarried |
| Less than High School | 45 (100.0%) | 0 (0.0%) |
| High School Diploma | 0 (0.0%) | 28 (100.0%) |
| College or Associate's Degree | 0 (0.0%) | 18 (100.0%) |
| Bachelor's Degree | 0 (0.0%) | 0 (0.0%) |
| Graduate Degree | 26 (72.2%) | 10 (27.8%) |
| Total | 71 (55.9%) | 56 (44.1%) |
Employment Characteristics in Headland
Employment by Class of Employer in Headland
Among the 2,636 employed individuals in Headland, private company employees (1,973 | 74.9%), local government employees (190 | 7.2%), and not-for-profit organizations (160 | 6.1%) make up the most common classes of employment.
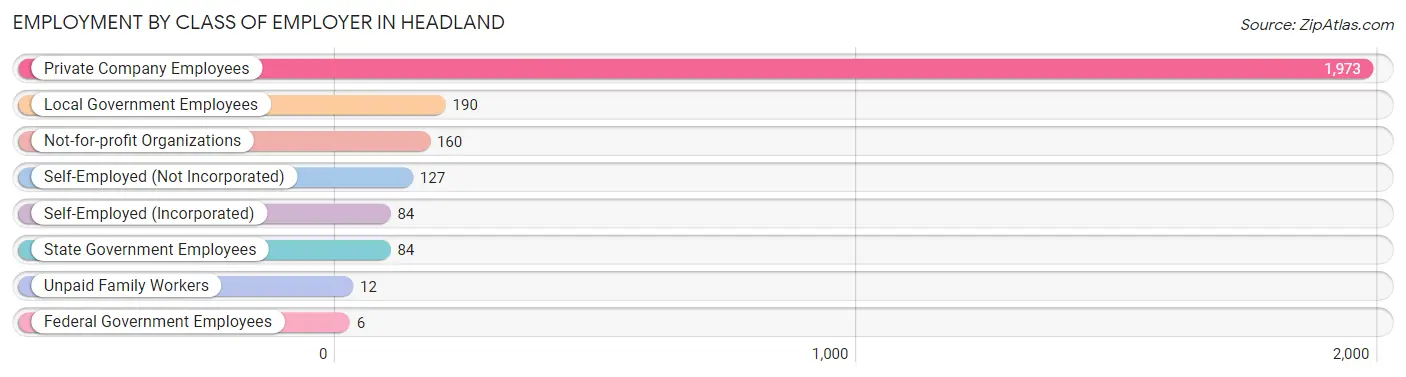
| Employer Class | # Employees | % Employees |
| Private Company Employees | 1,973 | 74.9% |
| Self-Employed (Incorporated) | 84 | 3.2% |
| Self-Employed (Not Incorporated) | 127 | 4.8% |
| Not-for-profit Organizations | 160 | 6.1% |
| Local Government Employees | 190 | 7.2% |
| State Government Employees | 84 | 3.2% |
| Federal Government Employees | 6 | 0.2% |
| Unpaid Family Workers | 12 | 0.5% |
| Total | 2,636 | 100.0% |
Employment Status by Age in Headland
According to the labor force statistics for Headland, out of the total population over 16 years of age (3,771), 73.7% or 2,779 individuals are in the labor force, with 4.0% or 111 of them unemployed. The age group with the highest labor force participation rate is 25 to 29 years, with 100.0% or 409 individuals in the labor force. Within the labor force, the 75 years and over age range has the highest percentage of unemployed individuals, with 100.0% or 10 of them being unemployed.
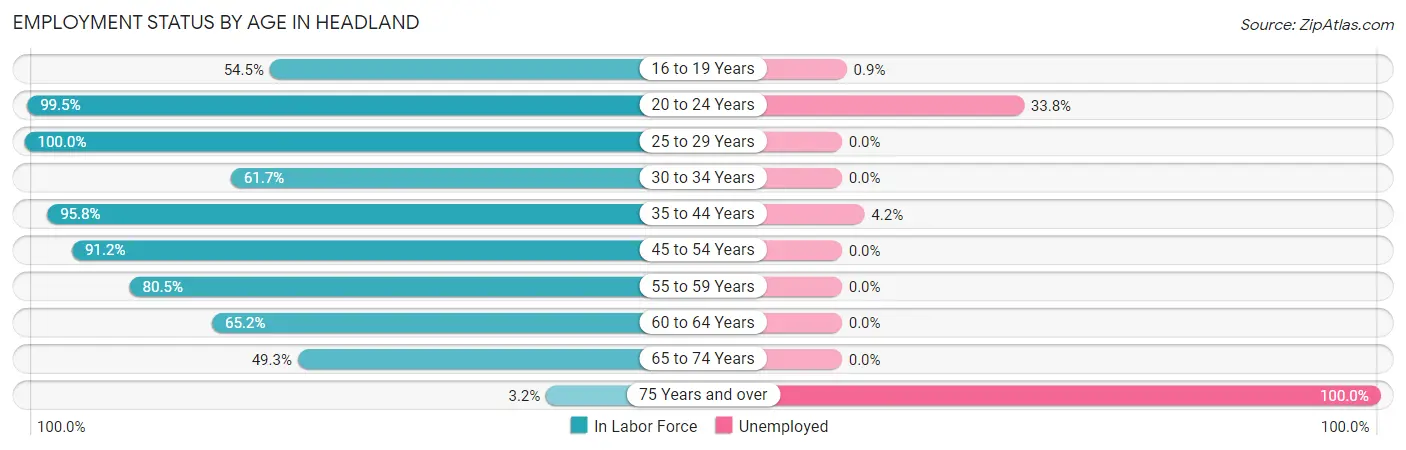
| Age Bracket | In Labor Force | Unemployed |
| 16 to 19 Years | 115 (54.5%) | 1 (0.9%) |
| 20 to 24 Years | 216 (99.5%) | 73 (33.8%) |
| 25 to 29 Years | 409 (100.0%) | 0 (0.0%) |
| 30 to 34 Years | 198 (61.7%) | 0 (0.0%) |
| 35 to 44 Years | 665 (95.8%) | 28 (4.2%) |
| 45 to 54 Years | 529 (91.2%) | 0 (0.0%) |
| 55 to 59 Years | 244 (80.5%) | 0 (0.0%) |
| 60 to 64 Years | 163 (65.2%) | 0 (0.0%) |
| 65 to 74 Years | 231 (49.3%) | 0 (0.0%) |
| 75 Years and over | 10 (3.2%) | 10 (100.0%) |
| Total | 2,779 (73.7%) | 111 (4.0%) |
Employment Status by Educational Attainment in Headland
According to labor force statistics for Headland, 86.4% of individuals (2,209) out of the total population between 25 and 64 years of age (2,557) are in the labor force, with 1.3% or 29 of them being unemployed. The group with the highest labor force participation rate are those with the educational attainment of college / associate degree, with 92.4% or 750 individuals in the labor force. Within the labor force, individuals with high school diploma education have the highest percentage of unemployment, with 5.8% or 28 of them being unemployed.
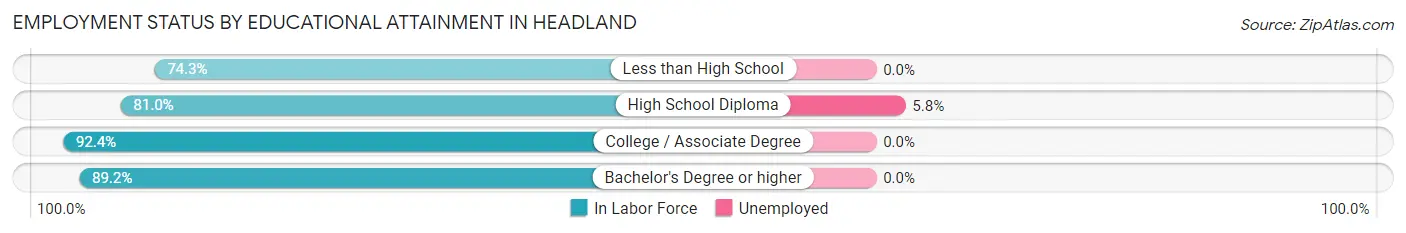
| Educational Attainment | In Labor Force | Unemployed |
| Less than High School | 248 (74.3%) | 0 (0.0%) |
| High School Diploma | 482 (81.0%) | 35 (5.8%) |
| College / Associate Degree | 750 (92.4%) | 0 (0.0%) |
| Bachelor's Degree or higher | 728 (89.2%) | 0 (0.0%) |
| Total | 2,209 (86.4%) | 33 (1.3%) |
Employment Occupations by Sex in Headland
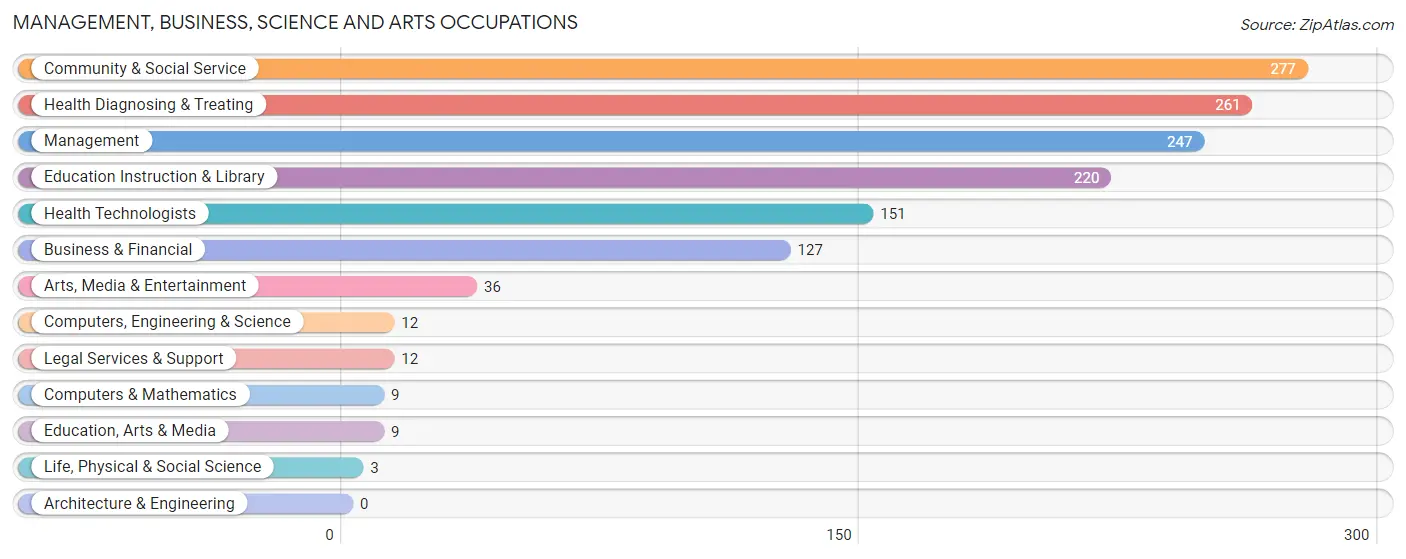
Management, Business, Science and Arts Occupations
The most common Management, Business, Science and Arts occupations in Headland are Community & Social Service (277 | 10.4%), Health Diagnosing & Treating (261 | 9.8%), Management (247 | 9.3%), Education Instruction & Library (220 | 8.3%), and Health Technologists (151 | 5.7%).
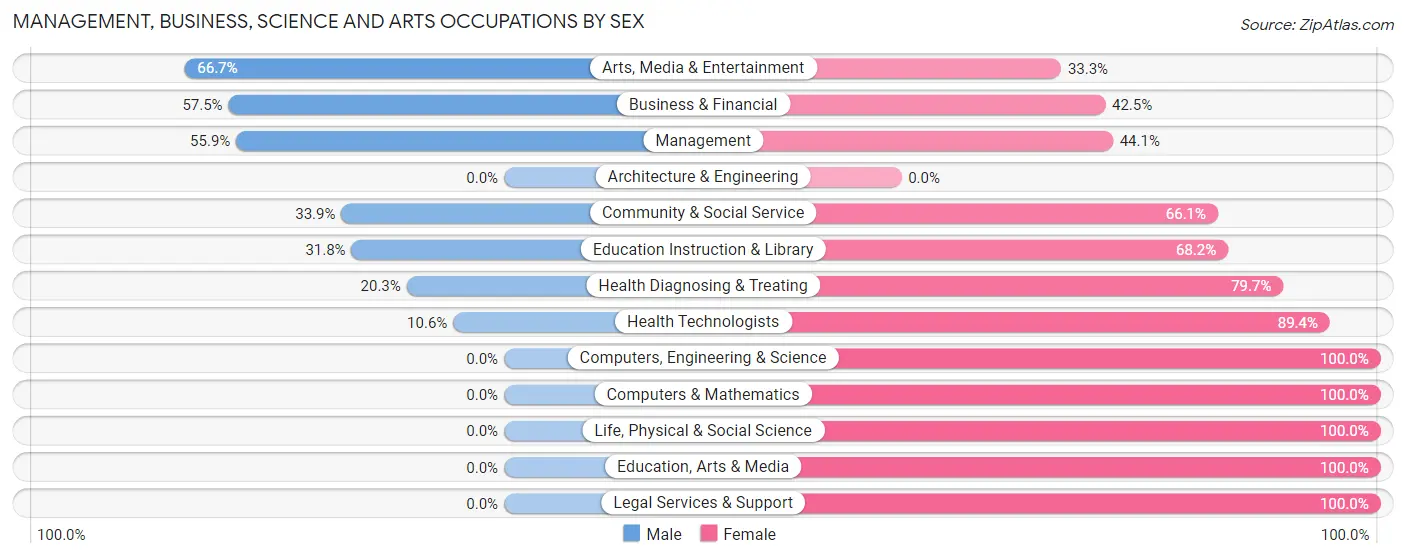
Management, Business, Science and Arts Occupations by Sex
Within the Management, Business, Science and Arts occupations in Headland, the most male-oriented occupations are Arts, Media & Entertainment (66.7%), Business & Financial (57.5%), and Management (55.9%), while the most female-oriented occupations are Computers, Engineering & Science (100.0%), Computers & Mathematics (100.0%), and Life, Physical & Social Science (100.0%).
| Occupation | Male | Female |
| Management | 138 (55.9%) | 109 (44.1%) |
| Business & Financial | 73 (57.5%) | 54 (42.5%) |
| Computers, Engineering & Science | 0 (0.0%) | 12 (100.0%) |
| Computers & Mathematics | 0 (0.0%) | 9 (100.0%) |
| Architecture & Engineering | 0 (0.0%) | 0 (0.0%) |
| Life, Physical & Social Science | 0 (0.0%) | 3 (100.0%) |
| Community & Social Service | 94 (33.9%) | 183 (66.1%) |
| Education, Arts & Media | 0 (0.0%) | 9 (100.0%) |
| Legal Services & Support | 0 (0.0%) | 12 (100.0%) |
| Education Instruction & Library | 70 (31.8%) | 150 (68.2%) |
| Arts, Media & Entertainment | 24 (66.7%) | 12 (33.3%) |
| Health Diagnosing & Treating | 53 (20.3%) | 208 (79.7%) |
| Health Technologists | 16 (10.6%) | 135 (89.4%) |
| Total (Category) | 358 (38.7%) | 566 (61.3%) |
| Total (Overall) | 1,332 (50.0%) | 1,332 (50.0%) |
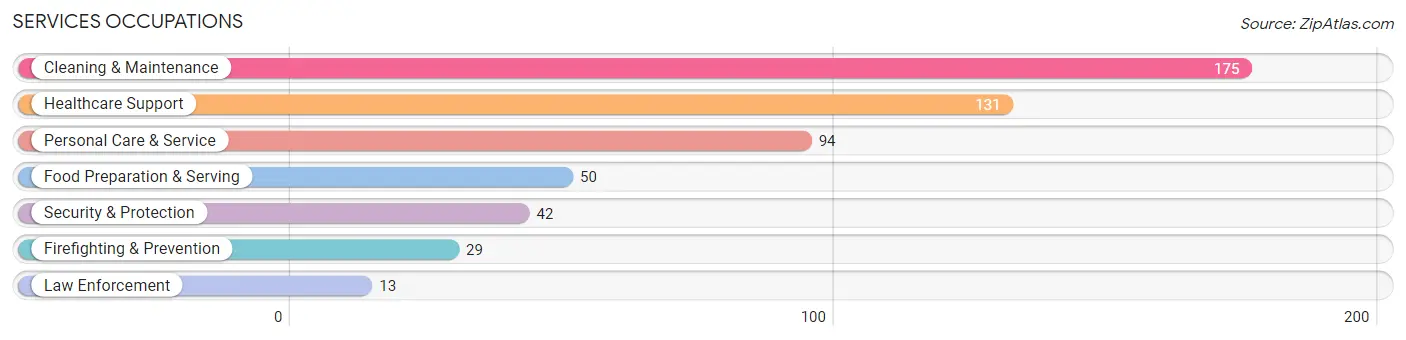
Services Occupations
The most common Services occupations in Headland are Cleaning & Maintenance (175 | 6.6%), Healthcare Support (131 | 4.9%), Personal Care & Service (94 | 3.5%), Food Preparation & Serving (50 | 1.9%), and Security & Protection (42 | 1.6%).
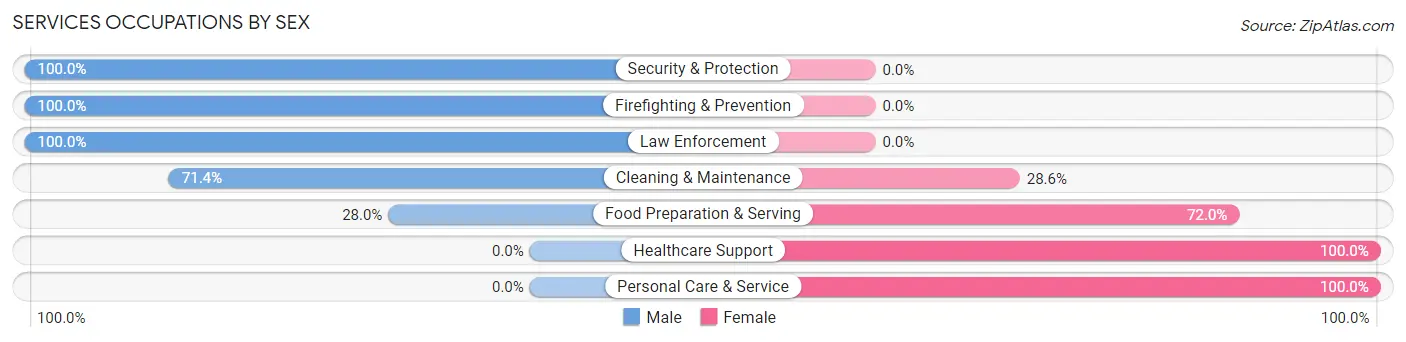
Services Occupations by Sex
Within the Services occupations in Headland, the most male-oriented occupations are Security & Protection (100.0%), Firefighting & Prevention (100.0%), and Law Enforcement (100.0%), while the most female-oriented occupations are Healthcare Support (100.0%), Personal Care & Service (100.0%), and Food Preparation & Serving (72.0%).
| Occupation | Male | Female |
| Healthcare Support | 0 (0.0%) | 131 (100.0%) |
| Security & Protection | 42 (100.0%) | 0 (0.0%) |
| Firefighting & Prevention | 29 (100.0%) | 0 (0.0%) |
| Law Enforcement | 13 (100.0%) | 0 (0.0%) |
| Food Preparation & Serving | 14 (28.0%) | 36 (72.0%) |
| Cleaning & Maintenance | 125 (71.4%) | 50 (28.6%) |
| Personal Care & Service | 0 (0.0%) | 94 (100.0%) |
| Total (Category) | 181 (36.8%) | 311 (63.2%) |
| Total (Overall) | 1,332 (50.0%) | 1,332 (50.0%) |
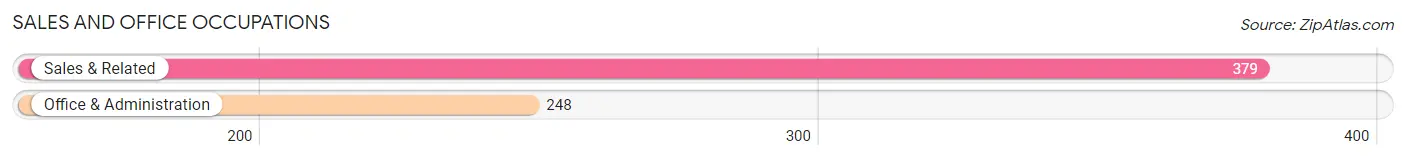
Sales and Office Occupations
The most common Sales and Office occupations in Headland are Sales & Related (379 | 14.2%), and Office & Administration (248 | 9.3%).
Sales and Office Occupations by Sex
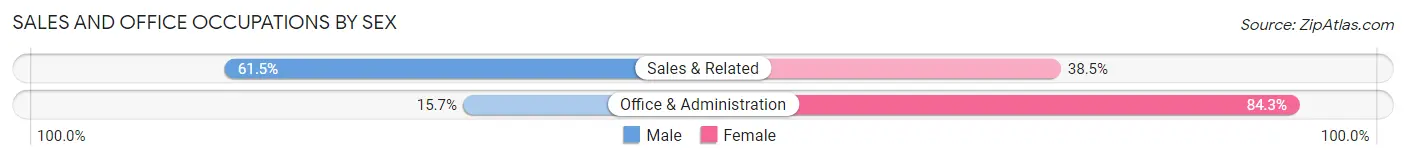
| Occupation | Male | Female |
| Sales & Related | 233 (61.5%) | 146 (38.5%) |
| Office & Administration | 39 (15.7%) | 209 (84.3%) |
| Total (Category) | 272 (43.4%) | 355 (56.6%) |
| Total (Overall) | 1,332 (50.0%) | 1,332 (50.0%) |
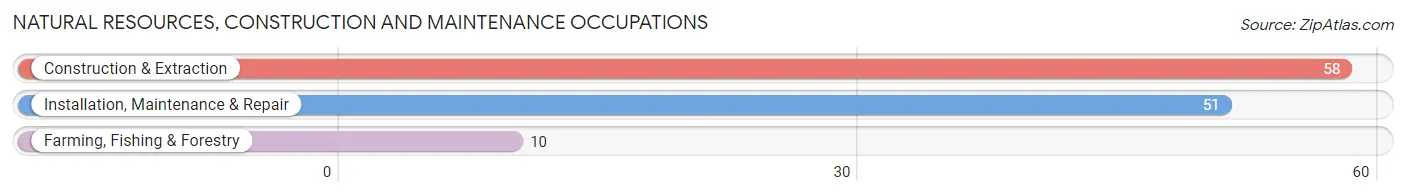
Natural Resources, Construction and Maintenance Occupations
The most common Natural Resources, Construction and Maintenance occupations in Headland are Construction & Extraction (58 | 2.2%), Installation, Maintenance & Repair (51 | 1.9%), and Farming, Fishing & Forestry (10 | 0.4%).
Natural Resources, Construction and Maintenance Occupations by Sex
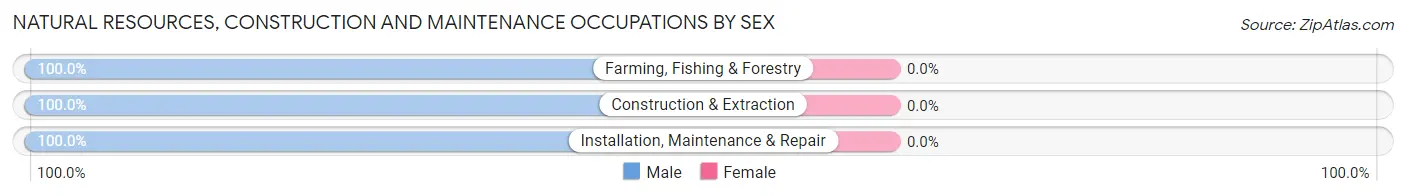
| Occupation | Male | Female |
| Farming, Fishing & Forestry | 10 (100.0%) | 0 (0.0%) |
| Construction & Extraction | 58 (100.0%) | 0 (0.0%) |
| Installation, Maintenance & Repair | 51 (100.0%) | 0 (0.0%) |
| Total (Category) | 119 (100.0%) | 0 (0.0%) |
| Total (Overall) | 1,332 (50.0%) | 1,332 (50.0%) |
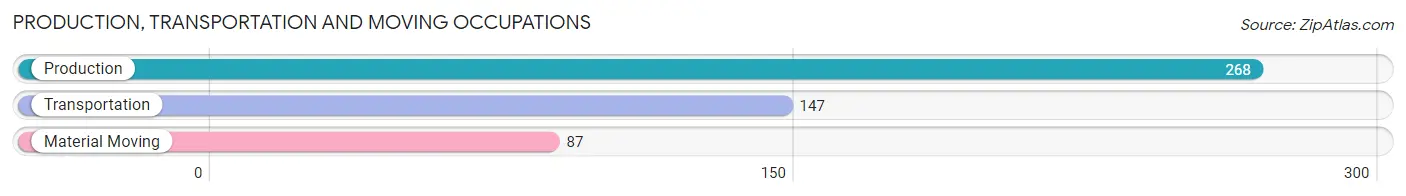
Production, Transportation and Moving Occupations
The most common Production, Transportation and Moving occupations in Headland are Production (268 | 10.1%), Transportation (147 | 5.5%), and Material Moving (87 | 3.3%).
Production, Transportation and Moving Occupations by Sex
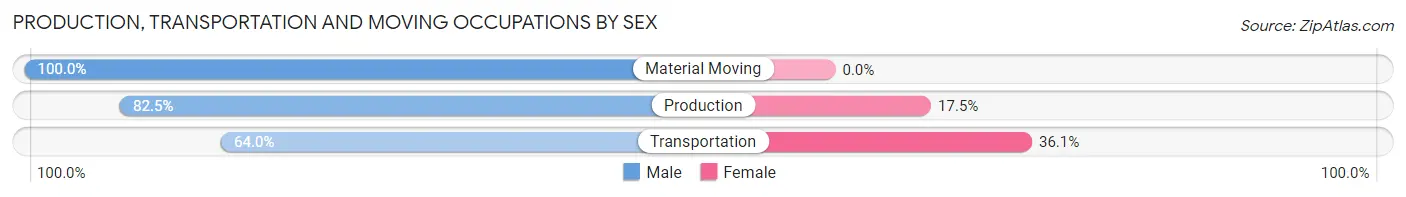
| Occupation | Male | Female |
| Production | 221 (82.5%) | 47 (17.5%) |
| Transportation | 94 (63.9%) | 53 (36.0%) |
| Material Moving | 87 (100.0%) | 0 (0.0%) |
| Total (Category) | 402 (80.1%) | 100 (19.9%) |
| Total (Overall) | 1,332 (50.0%) | 1,332 (50.0%) |
Employment Industries by Sex in Headland
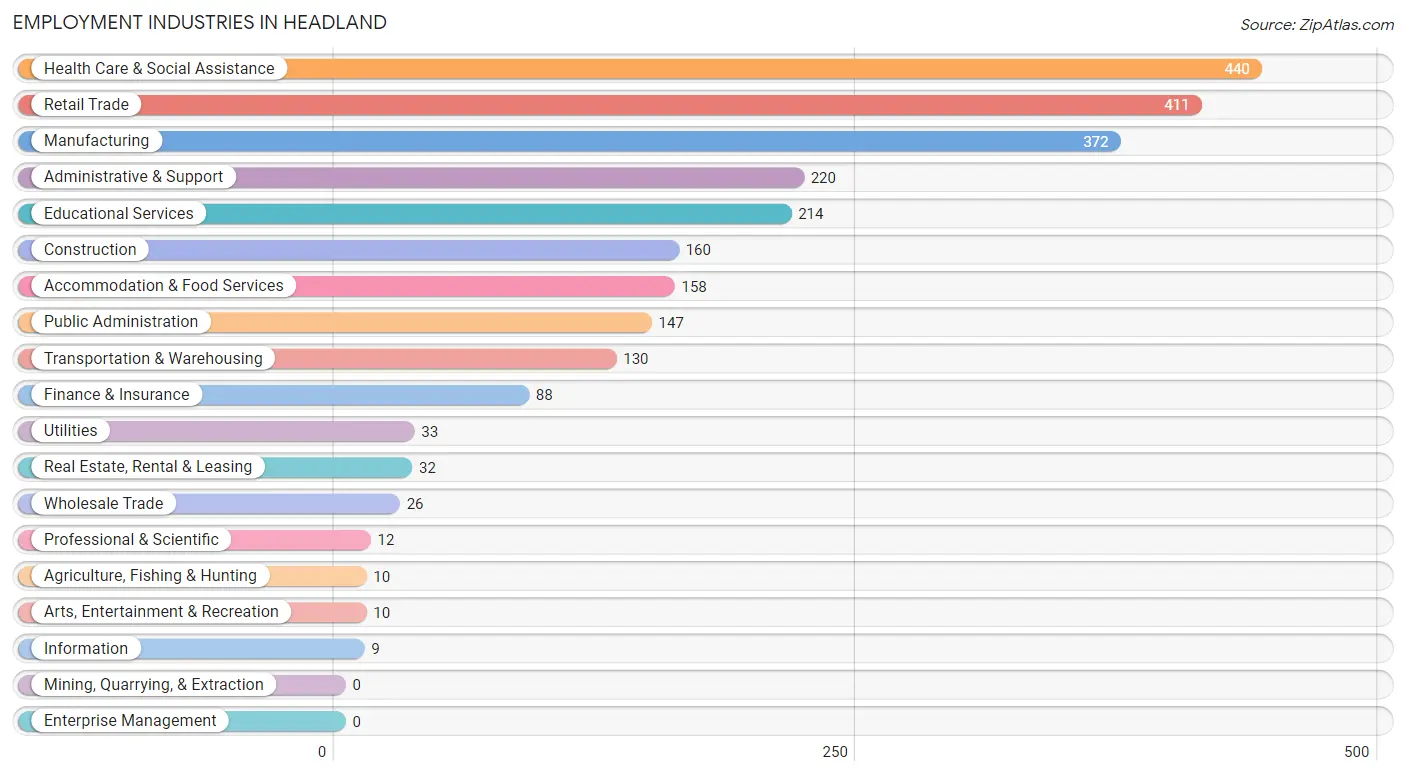
Employment Industries in Headland
The major employment industries in Headland include Health Care & Social Assistance (440 | 16.5%), Retail Trade (411 | 15.4%), Manufacturing (372 | 14.0%), Administrative & Support (220 | 8.3%), and Educational Services (214 | 8.0%).
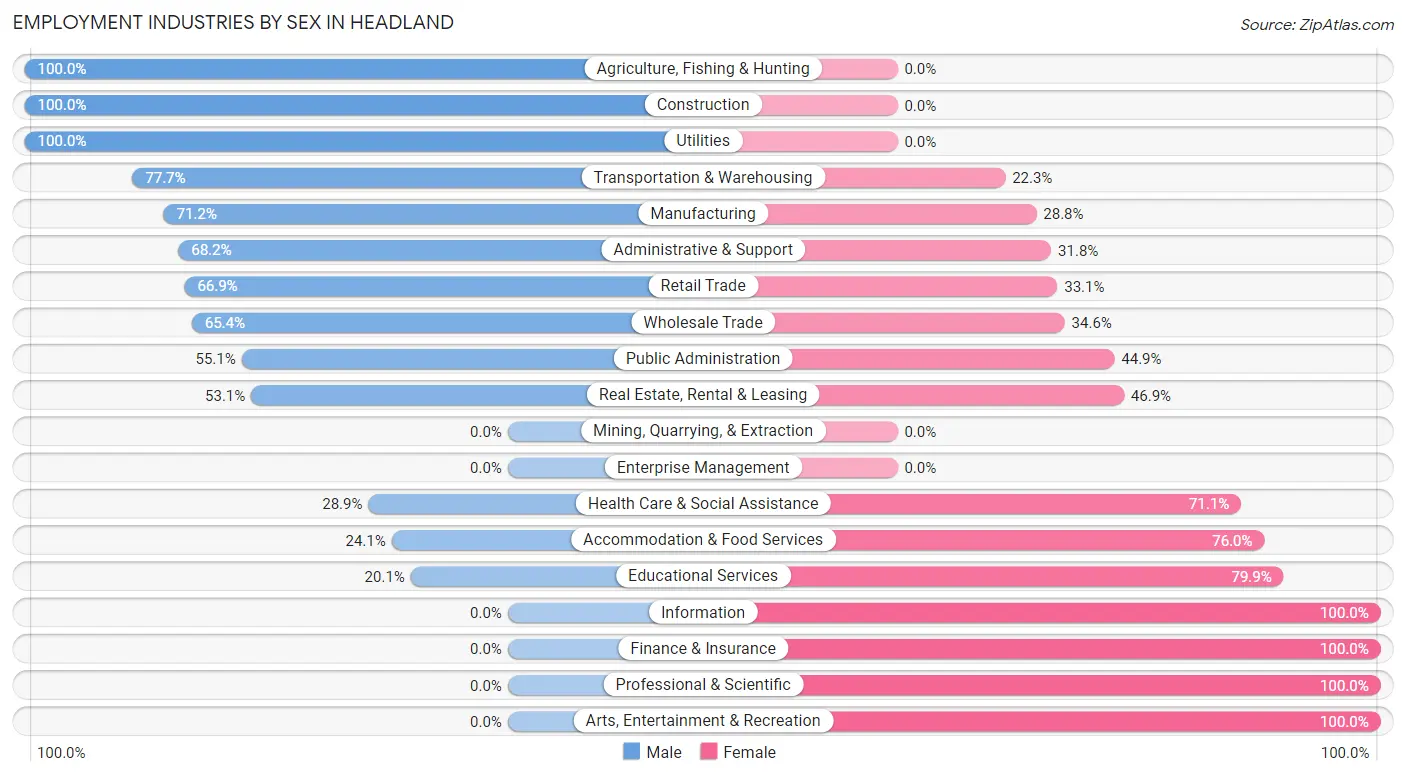
Employment Industries by Sex in Headland
The Headland industries that see more men than women are Agriculture, Fishing & Hunting (100.0%), Construction (100.0%), and Utilities (100.0%), whereas the industries that tend to have a higher number of women are Information (100.0%), Finance & Insurance (100.0%), and Professional & Scientific (100.0%).
| Industry | Male | Female |
| Agriculture, Fishing & Hunting | 10 (100.0%) | 0 (0.0%) |
| Mining, Quarrying, & Extraction | 0 (0.0%) | 0 (0.0%) |
| Construction | 160 (100.0%) | 0 (0.0%) |
| Manufacturing | 265 (71.2%) | 107 (28.8%) |
| Wholesale Trade | 17 (65.4%) | 9 (34.6%) |
| Retail Trade | 275 (66.9%) | 136 (33.1%) |
| Transportation & Warehousing | 101 (77.7%) | 29 (22.3%) |
| Utilities | 33 (100.0%) | 0 (0.0%) |
| Information | 0 (0.0%) | 9 (100.0%) |
| Finance & Insurance | 0 (0.0%) | 88 (100.0%) |
| Real Estate, Rental & Leasing | 17 (53.1%) | 15 (46.9%) |
| Professional & Scientific | 0 (0.0%) | 12 (100.0%) |
| Enterprise Management | 0 (0.0%) | 0 (0.0%) |
| Administrative & Support | 150 (68.2%) | 70 (31.8%) |
| Educational Services | 43 (20.1%) | 171 (79.9%) |
| Health Care & Social Assistance | 127 (28.9%) | 313 (71.1%) |
| Arts, Entertainment & Recreation | 0 (0.0%) | 10 (100.0%) |
| Accommodation & Food Services | 38 (24.0%) | 120 (75.9%) |
| Public Administration | 81 (55.1%) | 66 (44.9%) |
| Total | 1,332 (50.0%) | 1,332 (50.0%) |
Education in Headland
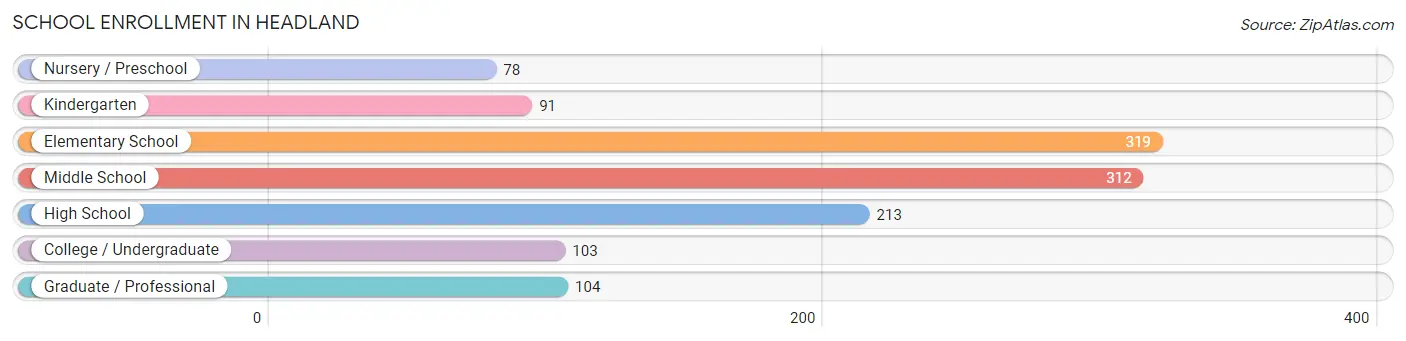
School Enrollment in Headland
The most common levels of schooling among the 1,220 students in Headland are elementary school (319 | 26.2%), middle school (312 | 25.6%), and high school (213 | 17.5%).
| School Level | # Students | % Students |
| Nursery / Preschool | 78 | 6.4% |
| Kindergarten | 91 | 7.5% |
| Elementary School | 319 | 26.2% |
| Middle School | 312 | 25.6% |
| High School | 213 | 17.5% |
| College / Undergraduate | 103 | 8.4% |
| Graduate / Professional | 104 | 8.5% |
| Total | 1,220 | 100.0% |
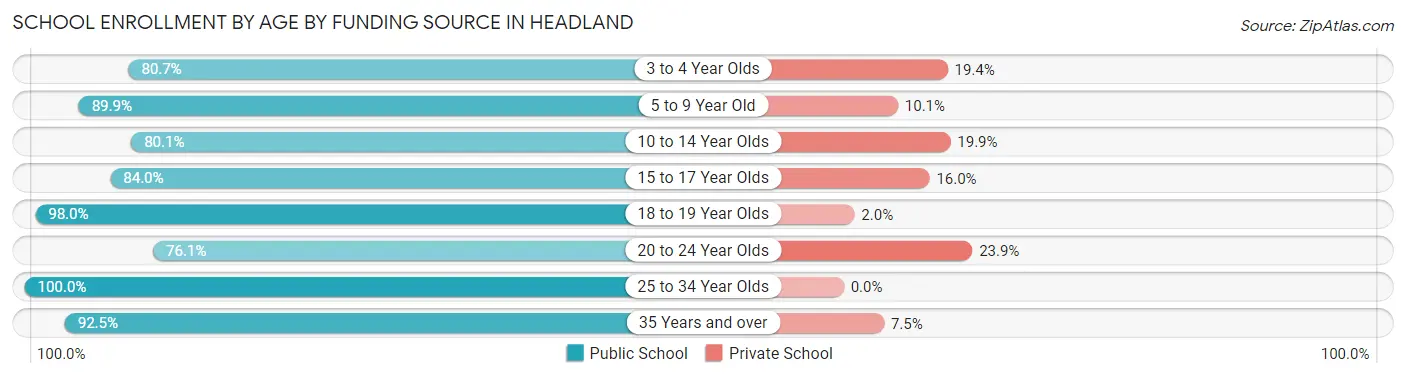
School Enrollment by Age by Funding Source in Headland
Out of a total of 1,220 students who are enrolled in schools in Headland, 170 (13.9%) attend a private institution, while the remaining 1,050 (86.1%) are enrolled in public schools. The age group of 20 to 24 year olds has the highest likelihood of being enrolled in private schools, with 17 (23.9% in the age bracket) enrolled. Conversely, the age group of 25 to 34 year olds has the lowest likelihood of being enrolled in a private school, with 40 (100.0% in the age bracket) attending a public institution.
| Age Bracket | Public School | Private School |
| 3 to 4 Year Olds | 50 (80.6%) | 12 (19.4%) |
| 5 to 9 Year Old | 383 (89.9%) | 43 (10.1%) |
| 10 to 14 Year Olds | 238 (80.1%) | 59 (19.9%) |
| 15 to 17 Year Olds | 163 (84.0%) | 31 (16.0%) |
| 18 to 19 Year Olds | 49 (98.0%) | 1 (2.0%) |
| 20 to 24 Year Olds | 54 (76.1%) | 17 (23.9%) |
| 25 to 34 Year Olds | 40 (100.0%) | 0 (0.0%) |
| 35 Years and over | 74 (92.5%) | 6 (7.5%) |
| Total | 1,050 (86.1%) | 170 (13.9%) |
Educational Attainment by Field of Study in Headland
Business (273 | 25.8%), education (190 | 17.9%), science & technology (176 | 16.6%), arts & humanities (85 | 8.0%), and visual & performing arts (69 | 6.5%) are the most common fields of study among 1,059 individuals in Headland who have obtained a bachelor's degree or higher.
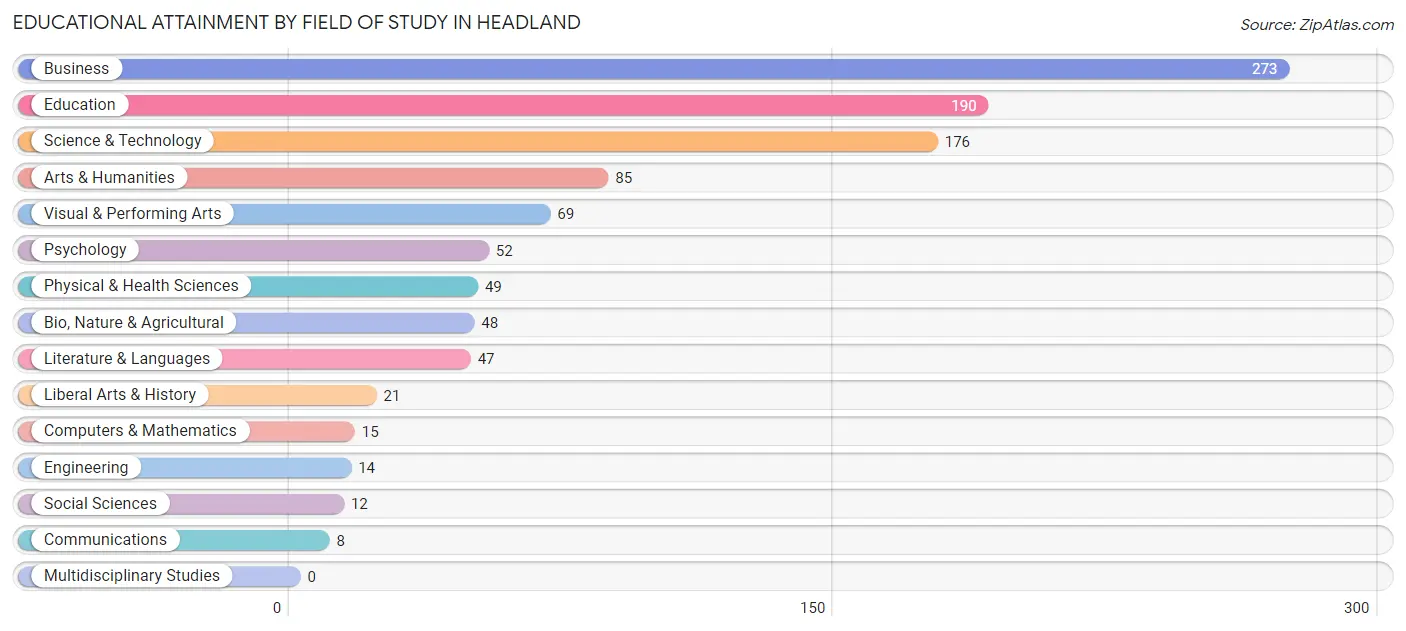
| Field of Study | # Graduates | % Graduates |
| Computers & Mathematics | 15 | 1.4% |
| Bio, Nature & Agricultural | 48 | 4.5% |
| Physical & Health Sciences | 49 | 4.6% |
| Psychology | 52 | 4.9% |
| Social Sciences | 12 | 1.1% |
| Engineering | 14 | 1.3% |
| Multidisciplinary Studies | 0 | 0.0% |
| Science & Technology | 176 | 16.6% |
| Business | 273 | 25.8% |
| Education | 190 | 17.9% |
| Literature & Languages | 47 | 4.4% |
| Liberal Arts & History | 21 | 2.0% |
| Visual & Performing Arts | 69 | 6.5% |
| Communications | 8 | 0.8% |
| Arts & Humanities | 85 | 8.0% |
| Total | 1,059 | 100.0% |
Transportation & Commute in Headland
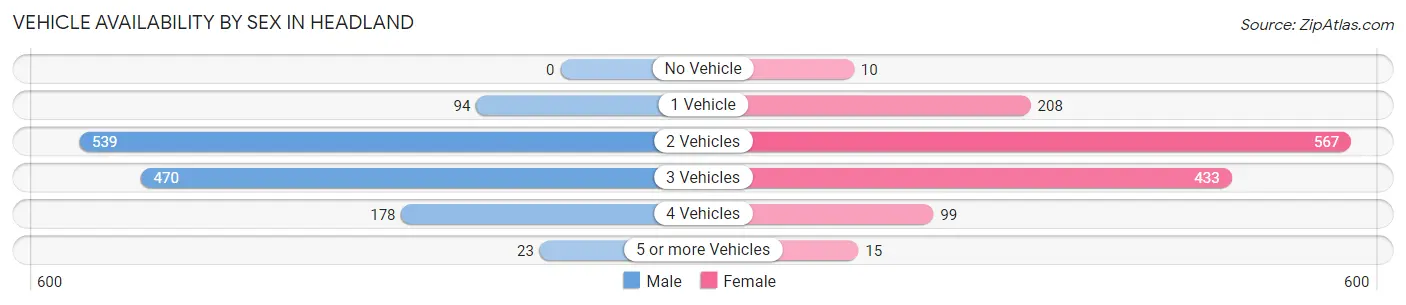
Vehicle Availability by Sex in Headland
The most prevalent vehicle ownership categories in Headland are males with 2 vehicles (539, accounting for 41.3%) and females with 2 vehicles (567, making up 40.5%).
| Vehicles Available | Male | Female |
| No Vehicle | 0 (0.0%) | 10 (0.7%) |
| 1 Vehicle | 94 (7.2%) | 208 (15.6%) |
| 2 Vehicles | 539 (41.3%) | 567 (42.6%) |
| 3 Vehicles | 470 (36.0%) | 433 (32.5%) |
| 4 Vehicles | 178 (13.7%) | 99 (7.4%) |
| 5 or more Vehicles | 23 (1.8%) | 15 (1.1%) |
| Total | 1,304 (100.0%) | 1,332 (100.0%) |
Commute Time in Headland
The most frequently occuring commute durations in Headland are 20 to 24 minutes (648 commuters, 25.4%), 15 to 19 minutes (569 commuters, 22.3%), and 30 to 34 minutes (302 commuters, 11.8%).
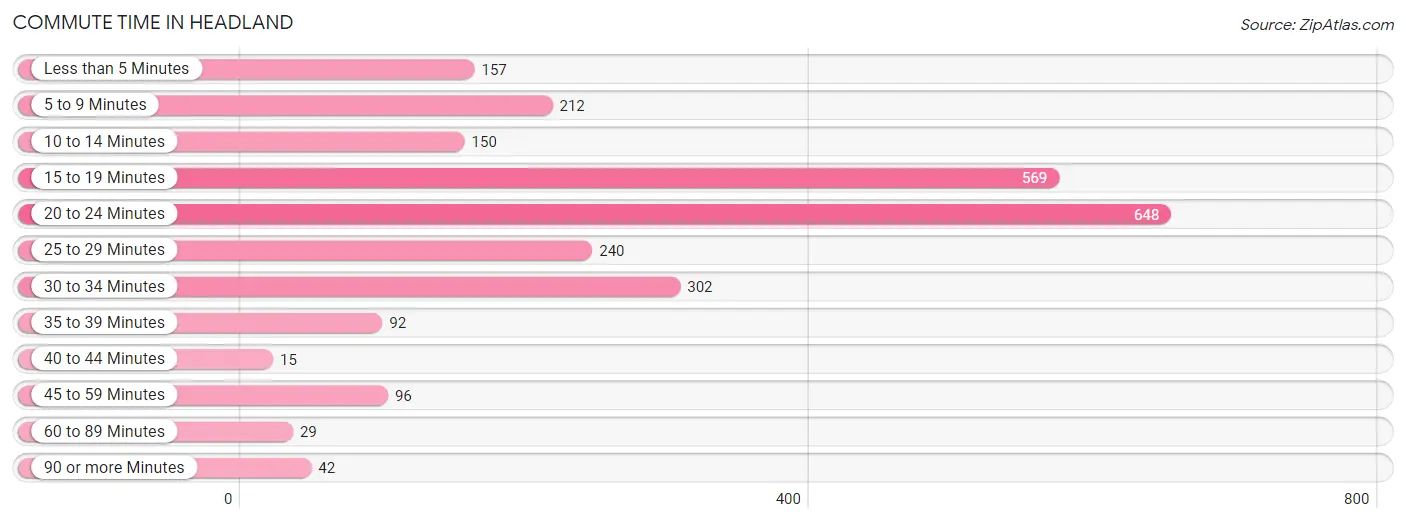
| Commute Time | # Commuters | % Commuters |
| Less than 5 Minutes | 157 | 6.1% |
| 5 to 9 Minutes | 212 | 8.3% |
| 10 to 14 Minutes | 150 | 5.9% |
| 15 to 19 Minutes | 569 | 22.3% |
| 20 to 24 Minutes | 648 | 25.4% |
| 25 to 29 Minutes | 240 | 9.4% |
| 30 to 34 Minutes | 302 | 11.8% |
| 35 to 39 Minutes | 92 | 3.6% |
| 40 to 44 Minutes | 15 | 0.6% |
| 45 to 59 Minutes | 96 | 3.8% |
| 60 to 89 Minutes | 29 | 1.1% |
| 90 or more Minutes | 42 | 1.7% |
Commute Time by Sex in Headland
The most common commute times in Headland are 15 to 19 minutes (277 commuters, 21.8%) for males and 20 to 24 minutes (389 commuters, 30.3%) for females.
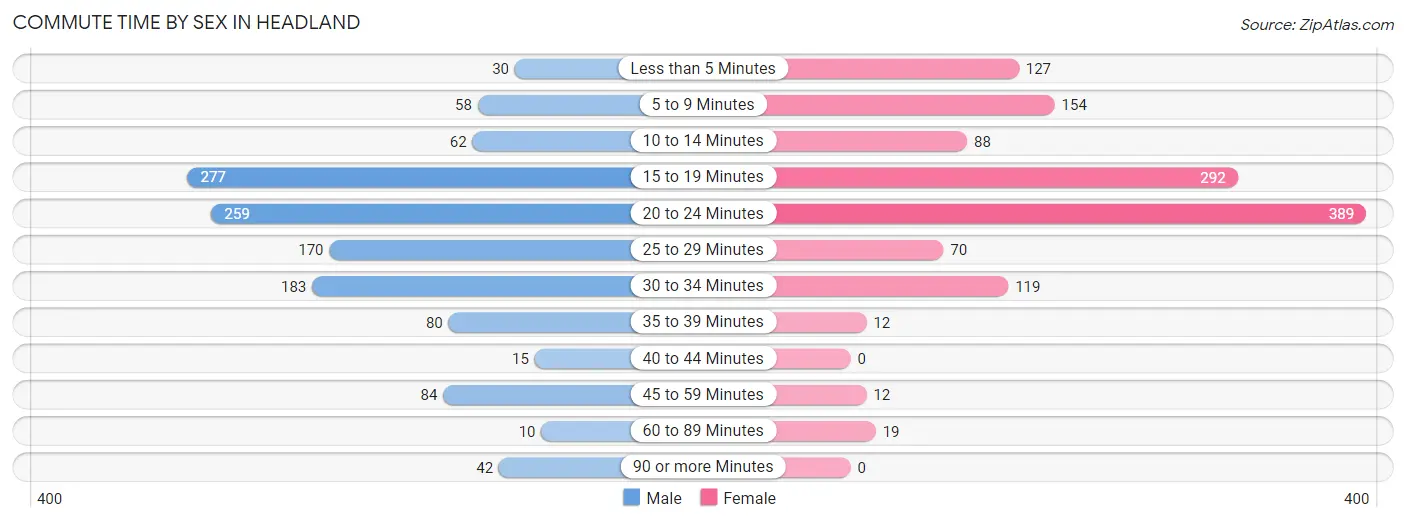
| Commute Time | Male | Female |
| Less than 5 Minutes | 30 (2.4%) | 127 (9.9%) |
| 5 to 9 Minutes | 58 (4.6%) | 154 (12.0%) |
| 10 to 14 Minutes | 62 (4.9%) | 88 (6.9%) |
| 15 to 19 Minutes | 277 (21.8%) | 292 (22.8%) |
| 20 to 24 Minutes | 259 (20.4%) | 389 (30.3%) |
| 25 to 29 Minutes | 170 (13.4%) | 70 (5.5%) |
| 30 to 34 Minutes | 183 (14.4%) | 119 (9.3%) |
| 35 to 39 Minutes | 80 (6.3%) | 12 (0.9%) |
| 40 to 44 Minutes | 15 (1.2%) | 0 (0.0%) |
| 45 to 59 Minutes | 84 (6.6%) | 12 (0.9%) |
| 60 to 89 Minutes | 10 (0.8%) | 19 (1.5%) |
| 90 or more Minutes | 42 (3.3%) | 0 (0.0%) |
Time of Departure to Work by Sex in Headland
The most frequent times of departure to work in Headland are 6:00 AM to 6:29 AM (284, 22.4%) for males and 7:30 AM to 7:59 AM (263, 20.5%) for females.
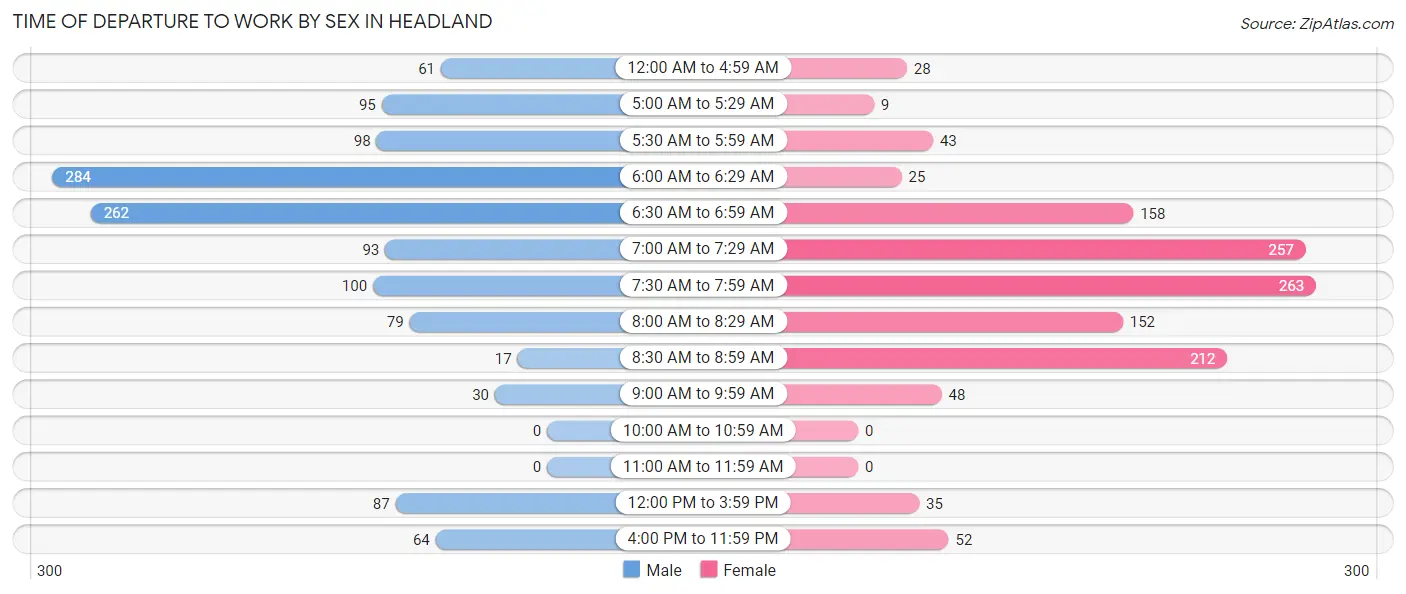
| Time of Departure | Male | Female |
| 12:00 AM to 4:59 AM | 61 (4.8%) | 28 (2.2%) |
| 5:00 AM to 5:29 AM | 95 (7.5%) | 9 (0.7%) |
| 5:30 AM to 5:59 AM | 98 (7.7%) | 43 (3.4%) |
| 6:00 AM to 6:29 AM | 284 (22.4%) | 25 (1.9%) |
| 6:30 AM to 6:59 AM | 262 (20.6%) | 158 (12.3%) |
| 7:00 AM to 7:29 AM | 93 (7.3%) | 257 (20.1%) |
| 7:30 AM to 7:59 AM | 100 (7.9%) | 263 (20.5%) |
| 8:00 AM to 8:29 AM | 79 (6.2%) | 152 (11.9%) |
| 8:30 AM to 8:59 AM | 17 (1.3%) | 212 (16.5%) |
| 9:00 AM to 9:59 AM | 30 (2.4%) | 48 (3.7%) |
| 10:00 AM to 10:59 AM | 0 (0.0%) | 0 (0.0%) |
| 11:00 AM to 11:59 AM | 0 (0.0%) | 0 (0.0%) |
| 12:00 PM to 3:59 PM | 87 (6.9%) | 35 (2.7%) |
| 4:00 PM to 11:59 PM | 64 (5.0%) | 52 (4.1%) |
| Total | 1,270 (100.0%) | 1,282 (100.0%) |
Housing Occupancy in Headland
Occupancy by Ownership in Headland
Of the total 1,763 dwellings in Headland, owner-occupied units account for 1,481 (84.0%), while renter-occupied units make up 282 (16.0%).
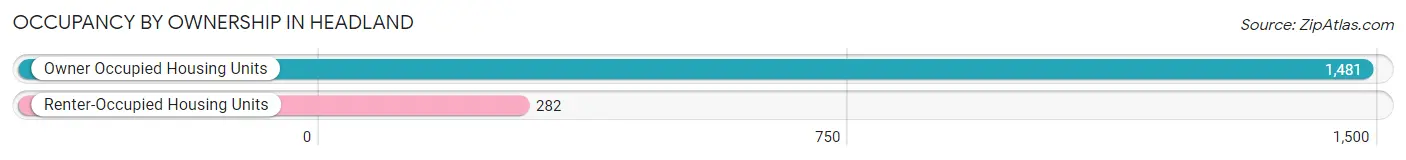
| Occupancy | # Housing Units | % Housing Units |
| Owner Occupied Housing Units | 1,481 | 84.0% |
| Renter-Occupied Housing Units | 282 | 16.0% |
| Total Occupied Housing Units | 1,763 | 100.0% |
Occupancy by Household Size in Headland
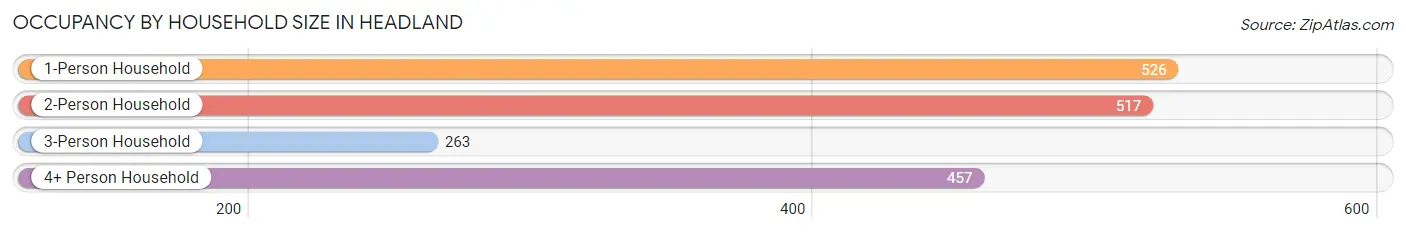
| Household Size | # Housing Units | % Housing Units |
| 1-Person Household | 526 | 29.8% |
| 2-Person Household | 517 | 29.3% |
| 3-Person Household | 263 | 14.9% |
| 4+ Person Household | 457 | 25.9% |
| Total Housing Units | 1,763 | 100.0% |
Occupancy by Ownership by Household Size in Headland
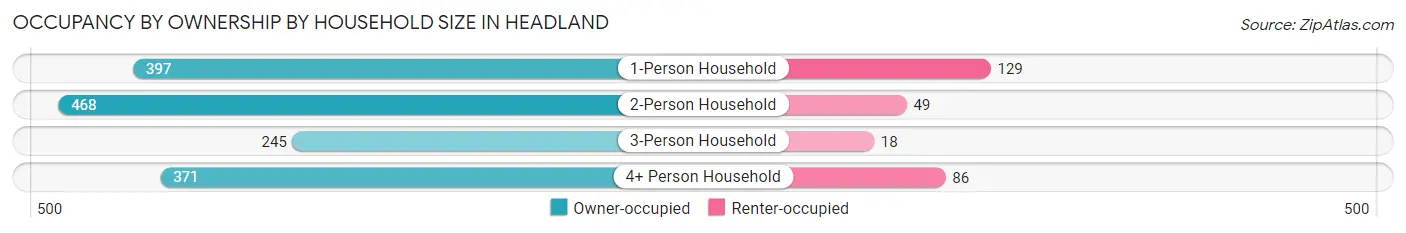
| Household Size | Owner-occupied | Renter-occupied |
| 1-Person Household | 397 (75.5%) | 129 (24.5%) |
| 2-Person Household | 468 (90.5%) | 49 (9.5%) |
| 3-Person Household | 245 (93.2%) | 18 (6.8%) |
| 4+ Person Household | 371 (81.2%) | 86 (18.8%) |
| Total Housing Units | 1,481 (84.0%) | 282 (16.0%) |
Occupancy by Educational Attainment in Headland
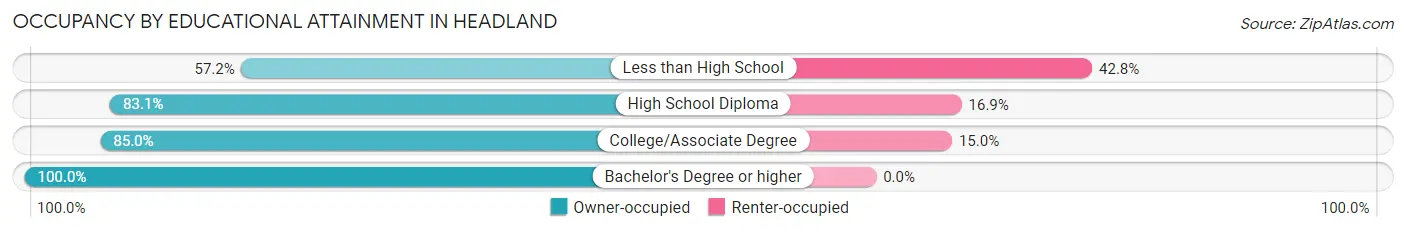
| Household Size | Owner-occupied | Renter-occupied |
| Less than High School | 183 (57.2%) | 137 (42.8%) |
| High School Diploma | 299 (83.1%) | 61 (16.9%) |
| College/Associate Degree | 475 (85.0%) | 84 (15.0%) |
| Bachelor's Degree or higher | 524 (100.0%) | 0 (0.0%) |
Occupancy by Age of Householder in Headland
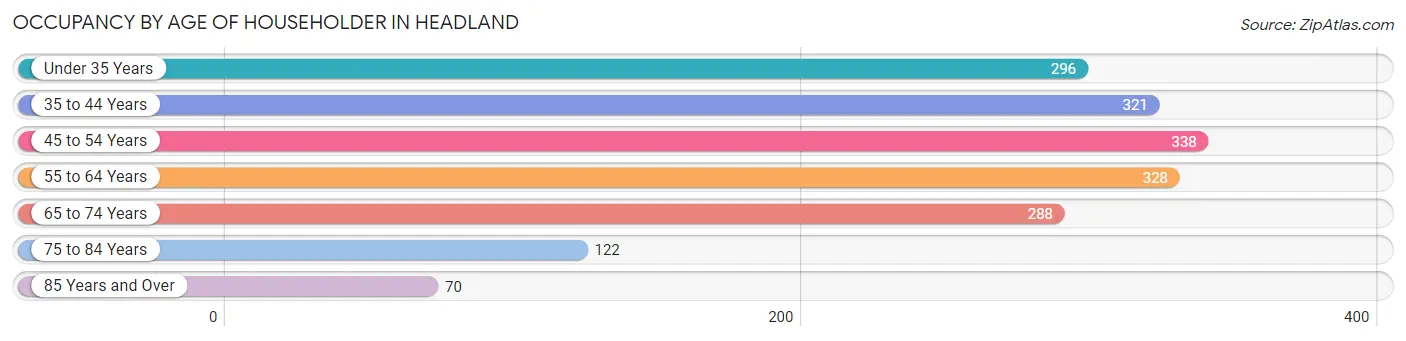
| Age Bracket | # Households | % Households |
| Under 35 Years | 296 | 16.8% |
| 35 to 44 Years | 321 | 18.2% |
| 45 to 54 Years | 338 | 19.2% |
| 55 to 64 Years | 328 | 18.6% |
| 65 to 74 Years | 288 | 16.3% |
| 75 to 84 Years | 122 | 6.9% |
| 85 Years and Over | 70 | 4.0% |
| Total | 1,763 | 100.0% |
Housing Finances in Headland
Median Income by Occupancy in Headland
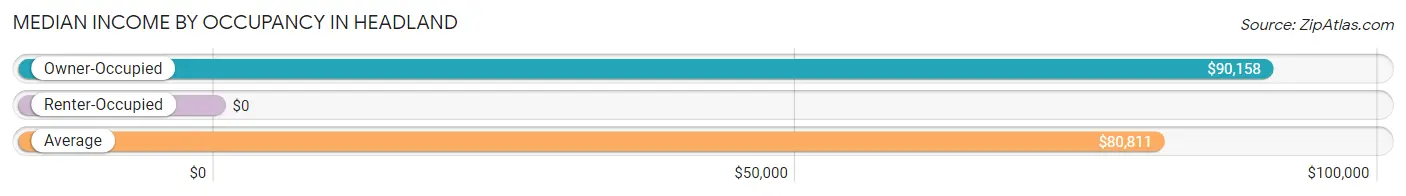
| Occupancy Type | # Households | Median Income |
| Owner-Occupied | 1,481 (84.0%) | $90,158 |
| Renter-Occupied | 282 (16.0%) | $0 |
| Average | 1,763 (100.0%) | $80,811 |
Occupancy by Householder Income Bracket in Headland
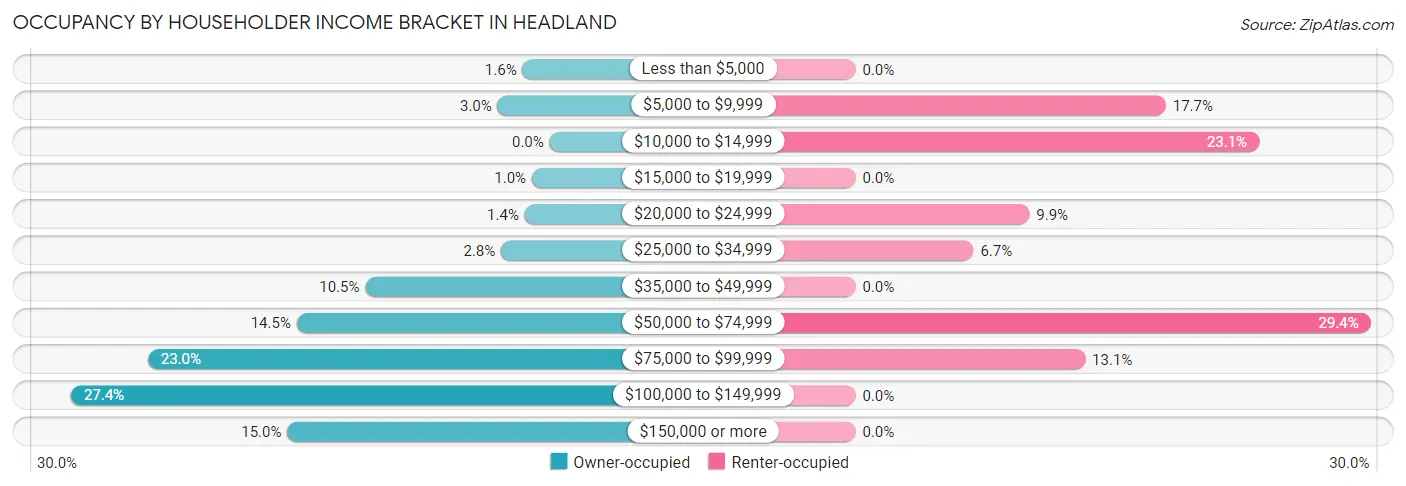
| Income Bracket | Owner-occupied | Renter-occupied |
| Less than $5,000 | 23 (1.5%) | 0 (0.0%) |
| $5,000 to $9,999 | 44 (3.0%) | 50 (17.7%) |
| $10,000 to $14,999 | 0 (0.0%) | 65 (23.1%) |
| $15,000 to $19,999 | 15 (1.0%) | 0 (0.0%) |
| $20,000 to $24,999 | 21 (1.4%) | 28 (9.9%) |
| $25,000 to $34,999 | 41 (2.8%) | 19 (6.7%) |
| $35,000 to $49,999 | 156 (10.5%) | 0 (0.0%) |
| $50,000 to $74,999 | 214 (14.4%) | 83 (29.4%) |
| $75,000 to $99,999 | 340 (23.0%) | 37 (13.1%) |
| $100,000 to $149,999 | 405 (27.4%) | 0 (0.0%) |
| $150,000 or more | 222 (15.0%) | 0 (0.0%) |
| Total | 1,481 (100.0%) | 282 (100.0%) |
Monthly Housing Cost Tiers in Headland
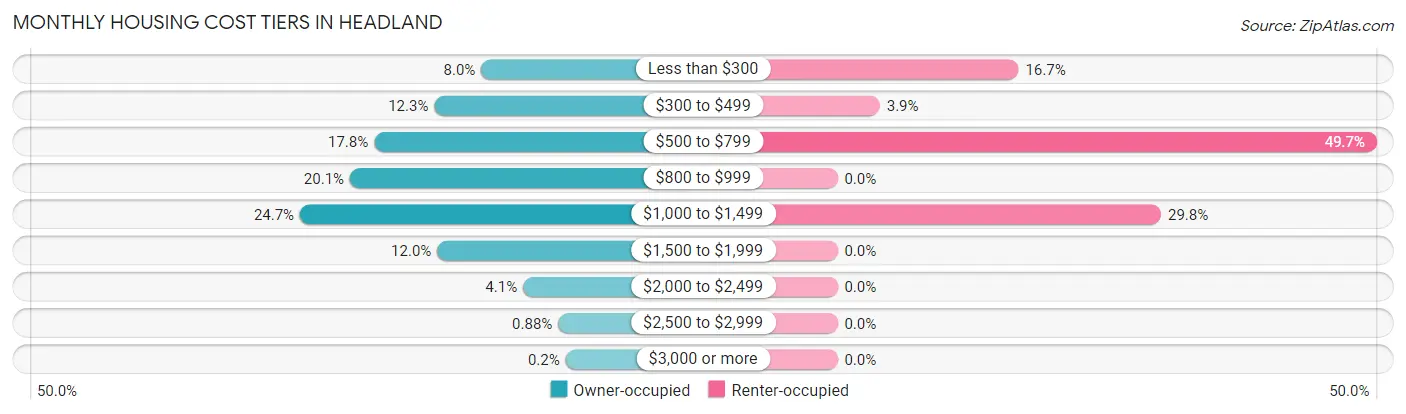
| Monthly Cost | Owner-occupied | Renter-occupied |
| Less than $300 | 118 (8.0%) | 47 (16.7%) |
| $300 to $499 | 182 (12.3%) | 11 (3.9%) |
| $500 to $799 | 264 (17.8%) | 140 (49.6%) |
| $800 to $999 | 297 (20.1%) | 0 (0.0%) |
| $1,000 to $1,499 | 365 (24.6%) | 84 (29.8%) |
| $1,500 to $1,999 | 178 (12.0%) | 0 (0.0%) |
| $2,000 to $2,499 | 61 (4.1%) | 0 (0.0%) |
| $2,500 to $2,999 | 13 (0.9%) | 0 (0.0%) |
| $3,000 or more | 3 (0.2%) | 0 (0.0%) |
| Total | 1,481 (100.0%) | 282 (100.0%) |
Physical Housing Characteristics in Headland
Housing Structures in Headland
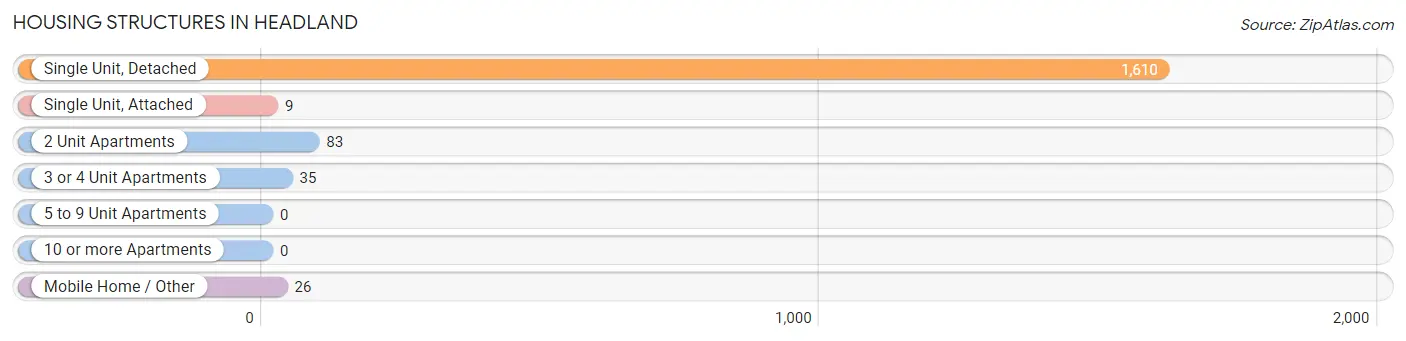
| Structure Type | # Housing Units | % Housing Units |
| Single Unit, Detached | 1,610 | 91.3% |
| Single Unit, Attached | 9 | 0.5% |
| 2 Unit Apartments | 83 | 4.7% |
| 3 or 4 Unit Apartments | 35 | 2.0% |
| 5 to 9 Unit Apartments | 0 | 0.0% |
| 10 or more Apartments | 0 | 0.0% |
| Mobile Home / Other | 26 | 1.5% |
| Total | 1,763 | 100.0% |
Housing Structures by Occupancy in Headland
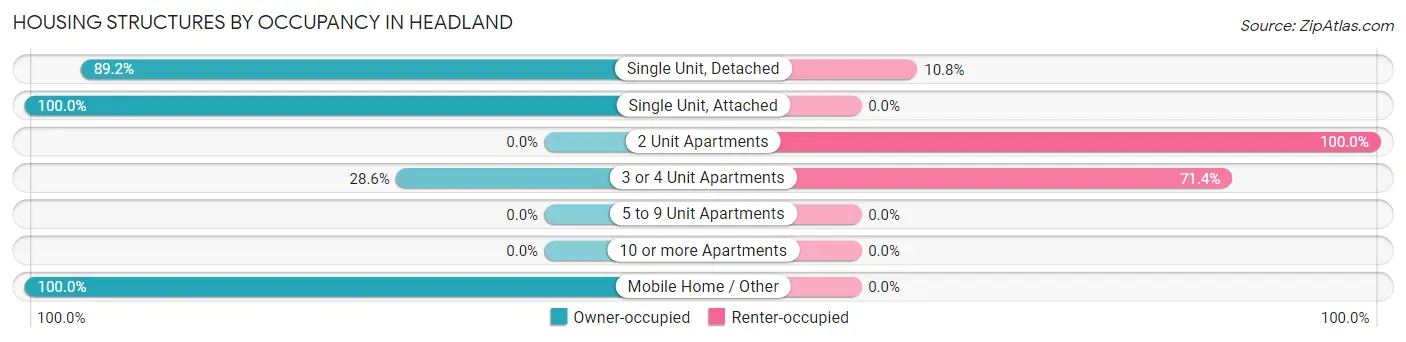
| Structure Type | Owner-occupied | Renter-occupied |
| Single Unit, Detached | 1,436 (89.2%) | 174 (10.8%) |
| Single Unit, Attached | 9 (100.0%) | 0 (0.0%) |
| 2 Unit Apartments | 0 (0.0%) | 83 (100.0%) |
| 3 or 4 Unit Apartments | 10 (28.6%) | 25 (71.4%) |
| 5 to 9 Unit Apartments | 0 (0.0%) | 0 (0.0%) |
| 10 or more Apartments | 0 (0.0%) | 0 (0.0%) |
| Mobile Home / Other | 26 (100.0%) | 0 (0.0%) |
| Total | 1,481 (84.0%) | 282 (16.0%) |
Housing Structures by Number of Rooms in Headland
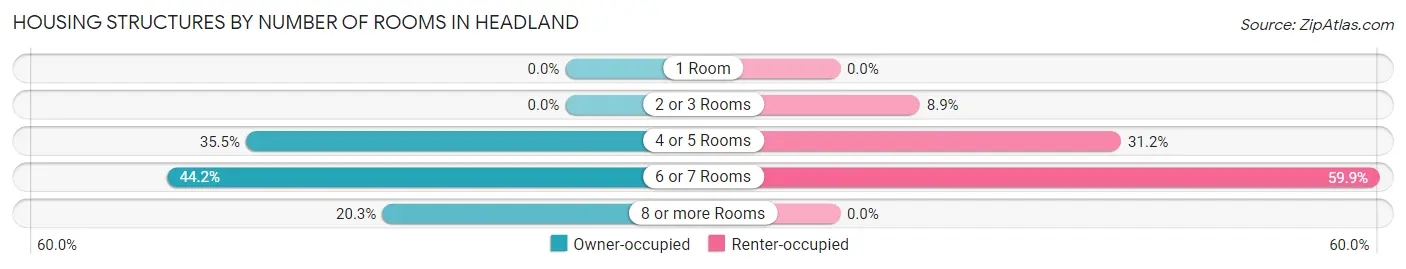
| Number of Rooms | Owner-occupied | Renter-occupied |
| 1 Room | 0 (0.0%) | 0 (0.0%) |
| 2 or 3 Rooms | 0 (0.0%) | 25 (8.9%) |
| 4 or 5 Rooms | 525 (35.4%) | 88 (31.2%) |
| 6 or 7 Rooms | 655 (44.2%) | 169 (59.9%) |
| 8 or more Rooms | 301 (20.3%) | 0 (0.0%) |
| Total | 1,481 (100.0%) | 282 (100.0%) |
Housing Structure by Heating Type in Headland
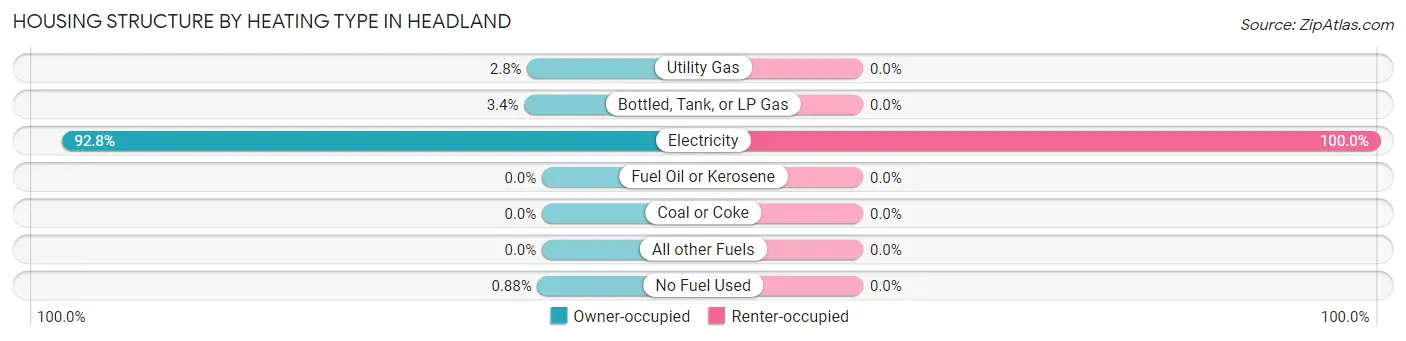
| Heating Type | Owner-occupied | Renter-occupied |
| Utility Gas | 42 (2.8%) | 0 (0.0%) |
| Bottled, Tank, or LP Gas | 51 (3.4%) | 0 (0.0%) |
| Electricity | 1,375 (92.8%) | 282 (100.0%) |
| Fuel Oil or Kerosene | 0 (0.0%) | 0 (0.0%) |
| Coal or Coke | 0 (0.0%) | 0 (0.0%) |
| All other Fuels | 0 (0.0%) | 0 (0.0%) |
| No Fuel Used | 13 (0.9%) | 0 (0.0%) |
| Total | 1,481 (100.0%) | 282 (100.0%) |
Household Vehicle Usage in Headland
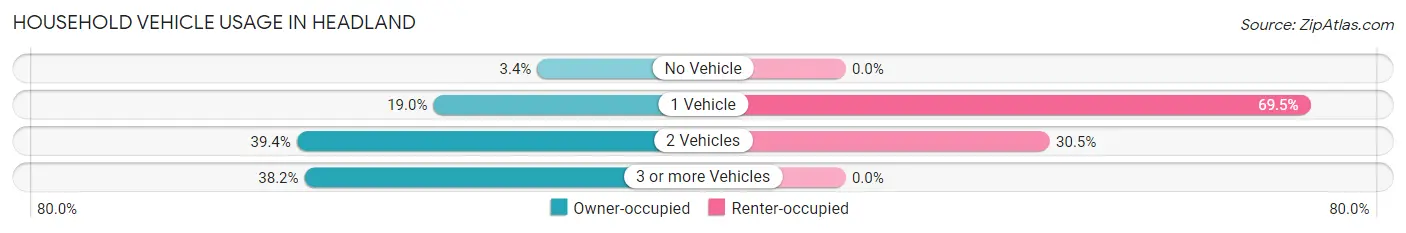
| Vehicles per Household | Owner-occupied | Renter-occupied |
| No Vehicle | 51 (3.4%) | 0 (0.0%) |
| 1 Vehicle | 281 (19.0%) | 196 (69.5%) |
| 2 Vehicles | 583 (39.4%) | 86 (30.5%) |
| 3 or more Vehicles | 566 (38.2%) | 0 (0.0%) |
| Total | 1,481 (100.0%) | 282 (100.0%) |
Real Estate & Mortgages in Headland
Real Estate and Mortgage Overview in Headland
| Characteristic | Without Mortgage | With Mortgage |
| Housing Units | 499 | 982 |
| Median Property Value | $154,300 | $181,500 |
| Median Household Income | $75,378 | $213 |
| Monthly Housing Costs | $455 | $3 |
| Real Estate Taxes | $535 | $31 |
Property Value by Mortgage Status in Headland
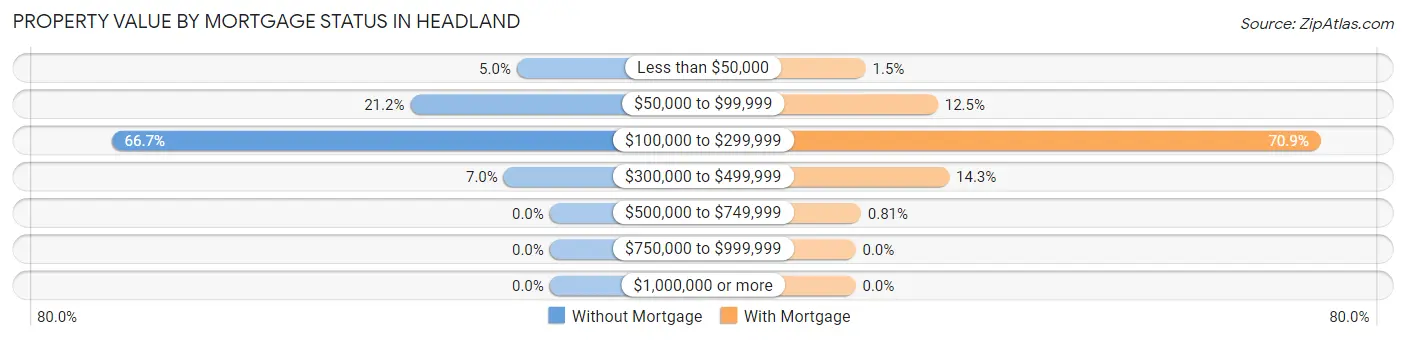
| Property Value | Without Mortgage | With Mortgage |
| Less than $50,000 | 25 (5.0%) | 15 (1.5%) |
| $50,000 to $99,999 | 106 (21.2%) | 123 (12.5%) |
| $100,000 to $299,999 | 333 (66.7%) | 696 (70.9%) |
| $300,000 to $499,999 | 35 (7.0%) | 140 (14.3%) |
| $500,000 to $749,999 | 0 (0.0%) | 8 (0.8%) |
| $750,000 to $999,999 | 0 (0.0%) | 0 (0.0%) |
| $1,000,000 or more | 0 (0.0%) | 0 (0.0%) |
| Total | 499 (100.0%) | 982 (100.0%) |
Household Income by Mortgage Status in Headland
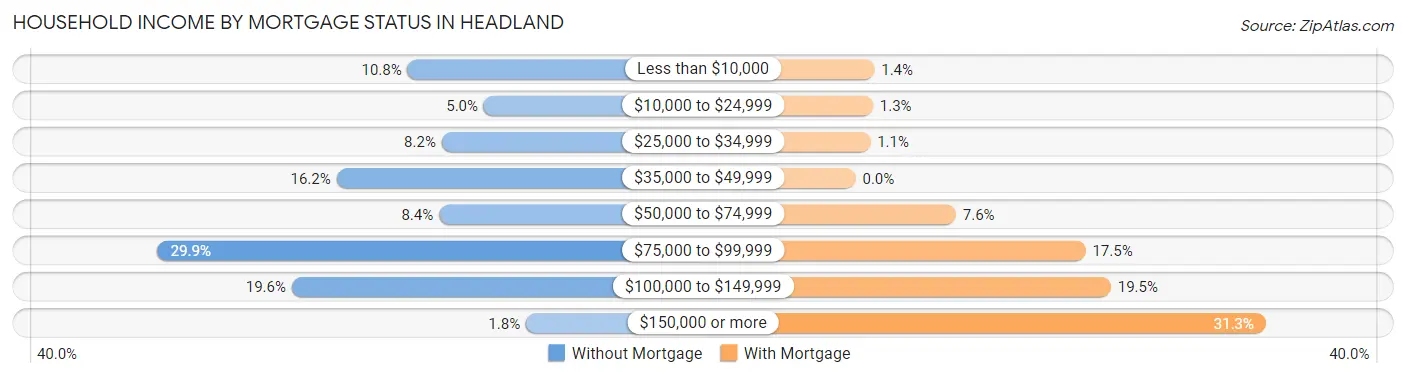
| Household Income | Without Mortgage | With Mortgage |
| Less than $10,000 | 54 (10.8%) | 14 (1.4%) |
| $10,000 to $24,999 | 25 (5.0%) | 13 (1.3%) |
| $25,000 to $34,999 | 41 (8.2%) | 11 (1.1%) |
| $35,000 to $49,999 | 81 (16.2%) | 0 (0.0%) |
| $50,000 to $74,999 | 42 (8.4%) | 75 (7.6%) |
| $75,000 to $99,999 | 149 (29.9%) | 172 (17.5%) |
| $100,000 to $149,999 | 98 (19.6%) | 191 (19.5%) |
| $150,000 or more | 9 (1.8%) | 307 (31.3%) |
| Total | 499 (100.0%) | 982 (100.0%) |
Property Value to Household Income Ratio in Headland
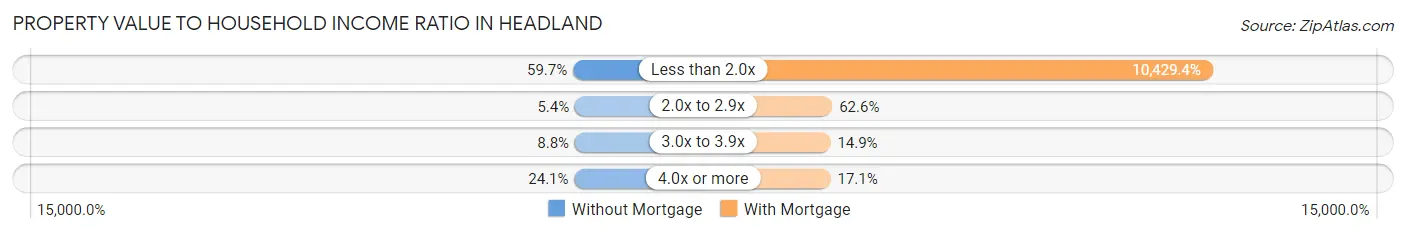
| Value-to-Income Ratio | Without Mortgage | With Mortgage |
| Less than 2.0x | 298 (59.7%) | 102,417 (10,429.4%) |
| 2.0x to 2.9x | 27 (5.4%) | 615 (62.6%) |
| 3.0x to 3.9x | 44 (8.8%) | 146 (14.9%) |
| 4.0x or more | 120 (24.0%) | 168 (17.1%) |
| Total | 499 (100.0%) | 982 (100.0%) |
Real Estate Taxes by Mortgage Status in Headland
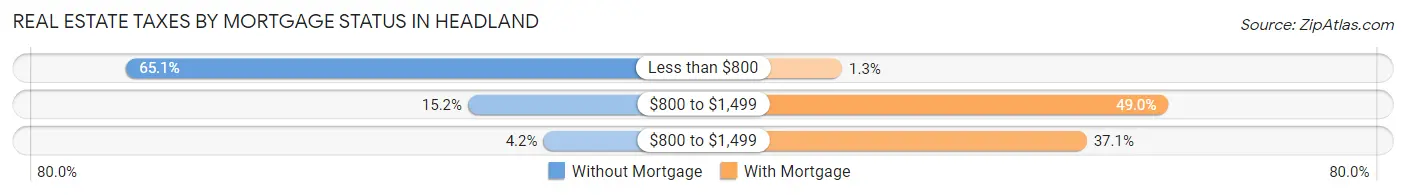
| Property Taxes | Without Mortgage | With Mortgage |
| Less than $800 | 325 (65.1%) | 13 (1.3%) |
| $800 to $1,499 | 76 (15.2%) | 481 (49.0%) |
| $800 to $1,499 | 21 (4.2%) | 364 (37.1%) |
| Total | 499 (100.0%) | 982 (100.0%) |
Health & Disability in Headland
Health Insurance Coverage by Age in Headland
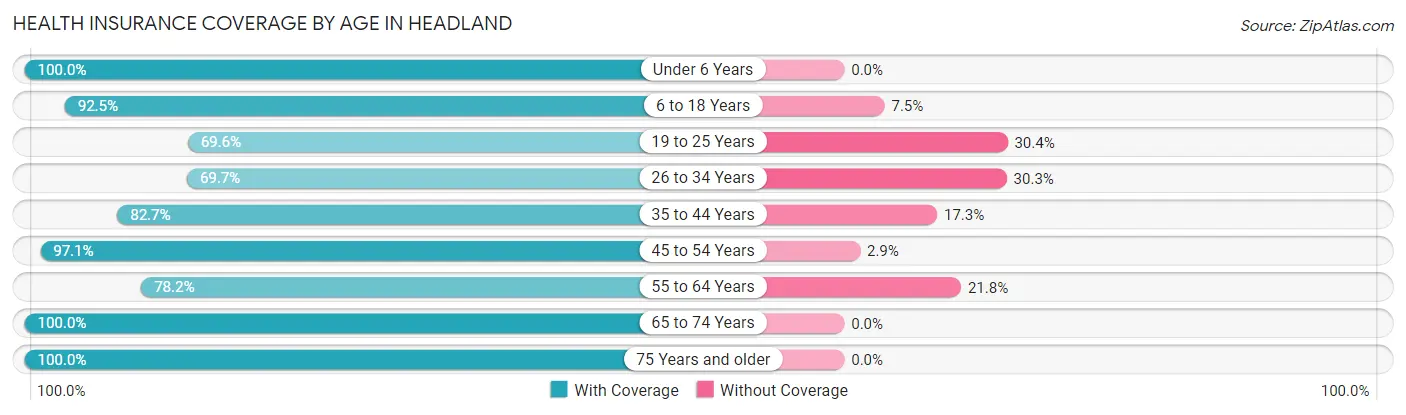
| Age Bracket | With Coverage | Without Coverage |
| Under 6 Years | 372 (100.0%) | 0 (0.0%) |
| 6 to 18 Years | 949 (92.5%) | 77 (7.5%) |
| 19 to 25 Years | 240 (69.6%) | 105 (30.4%) |
| 26 to 34 Years | 456 (69.7%) | 198 (30.3%) |
| 35 to 44 Years | 574 (82.7%) | 120 (17.3%) |
| 45 to 54 Years | 563 (97.1%) | 17 (2.9%) |
| 55 to 64 Years | 417 (78.2%) | 116 (21.8%) |
| 65 to 74 Years | 467 (100.0%) | 0 (0.0%) |
| 75 Years and older | 240 (100.0%) | 0 (0.0%) |
| Total | 4,278 (87.1%) | 633 (12.9%) |
Health Insurance Coverage by Citizenship Status in Headland
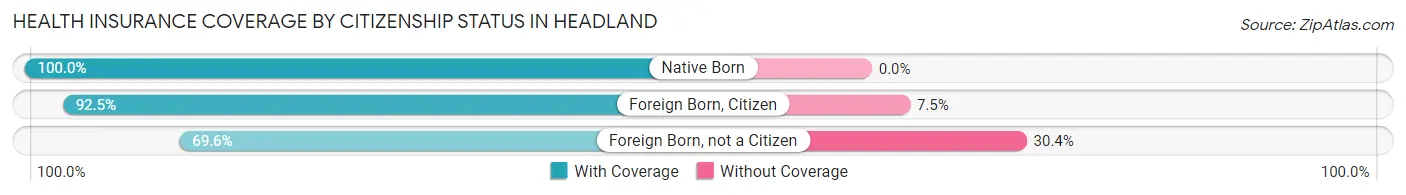
| Citizenship Status | With Coverage | Without Coverage |
| Native Born | 372 (100.0%) | 0 (0.0%) |
| Foreign Born, Citizen | 949 (92.5%) | 77 (7.5%) |
| Foreign Born, not a Citizen | 240 (69.6%) | 105 (30.4%) |
Health Insurance Coverage by Household Income in Headland
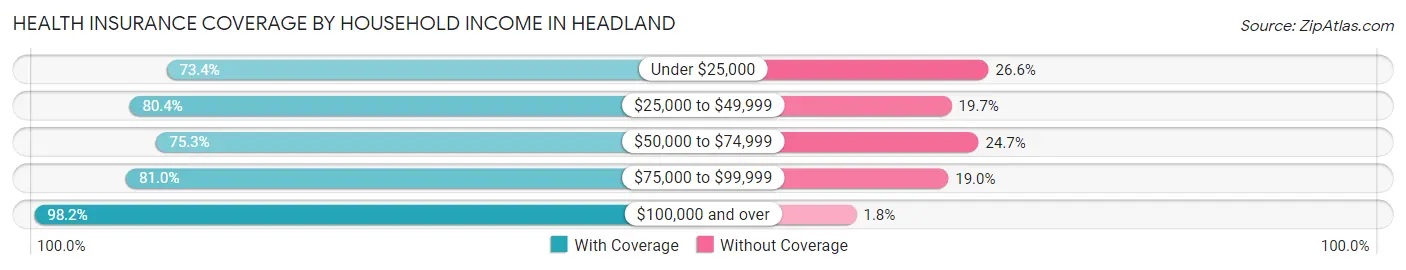
| Household Income | With Coverage | Without Coverage |
| Under $25,000 | 384 (73.4%) | 139 (26.6%) |
| $25,000 to $49,999 | 409 (80.3%) | 100 (19.7%) |
| $50,000 to $74,999 | 613 (75.3%) | 201 (24.7%) |
| $75,000 to $99,999 | 639 (81.0%) | 150 (19.0%) |
| $100,000 and over | 2,216 (98.2%) | 41 (1.8%) |
Public vs Private Health Insurance Coverage by Age in Headland
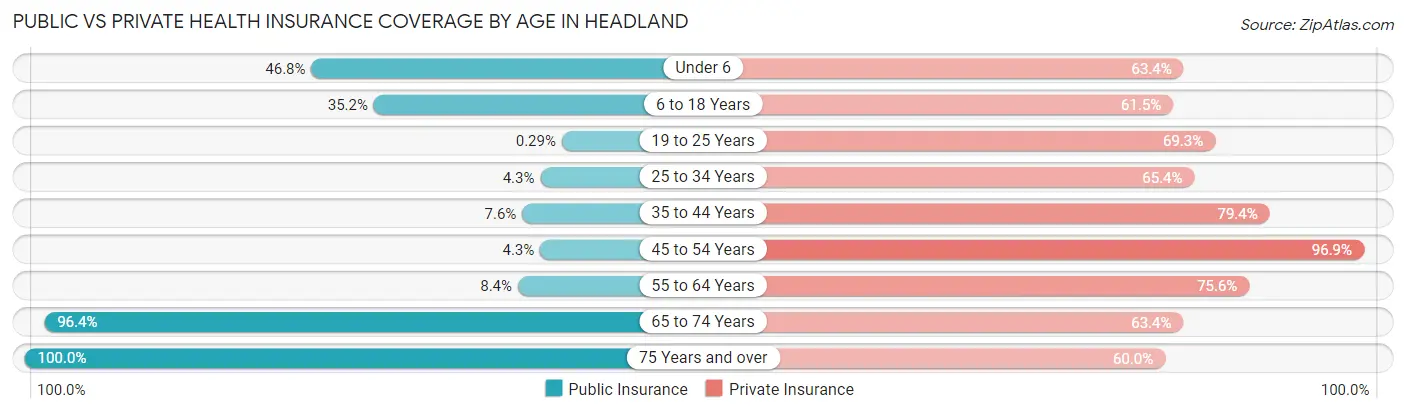
| Age Bracket | Public Insurance | Private Insurance |
| Under 6 | 174 (46.8%) | 236 (63.4%) |
| 6 to 18 Years | 361 (35.2%) | 631 (61.5%) |
| 19 to 25 Years | 1 (0.3%) | 239 (69.3%) |
| 25 to 34 Years | 28 (4.3%) | 428 (65.4%) |
| 35 to 44 Years | 53 (7.6%) | 551 (79.4%) |
| 45 to 54 Years | 25 (4.3%) | 562 (96.9%) |
| 55 to 64 Years | 45 (8.4%) | 403 (75.6%) |
| 65 to 74 Years | 450 (96.4%) | 296 (63.4%) |
| 75 Years and over | 240 (100.0%) | 144 (60.0%) |
| Total | 1,377 (28.0%) | 3,490 (71.1%) |
Disability Status by Sex by Age in Headland
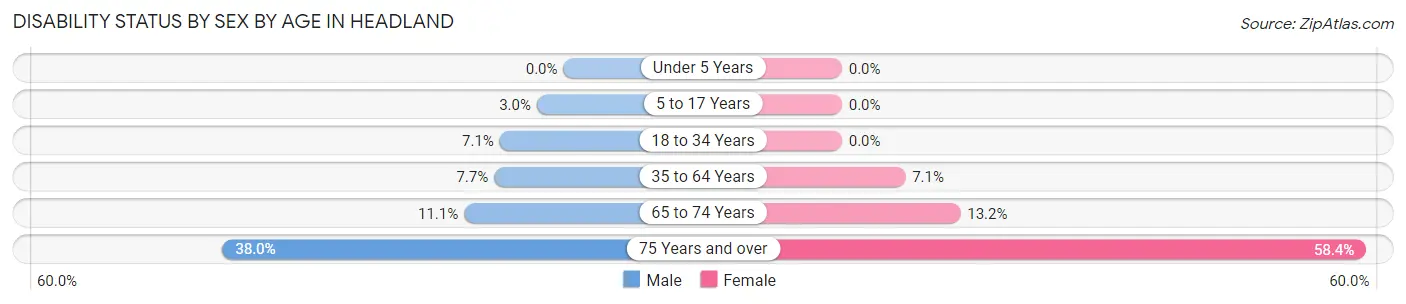
| Age Bracket | Male | Female |
| Under 5 Years | 0 (0.0%) | 0 (0.0%) |
| 5 to 17 Years | 15 (3.0%) | 0 (0.0%) |
| 18 to 34 Years | 41 (7.1%) | 0 (0.0%) |
| 35 to 64 Years | 64 (7.7%) | 69 (7.1%) |
| 65 to 74 Years | 24 (11.1%) | 33 (13.2%) |
| 75 Years and over | 30 (38.0%) | 94 (58.4%) |
Disability Class by Sex by Age in Headland
Disability Class: Hearing Difficulty
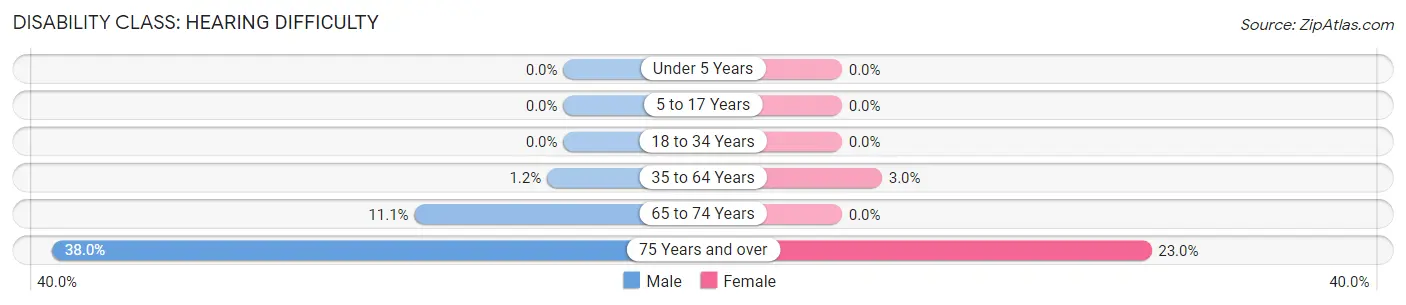
| Age Bracket | Male | Female |
| Under 5 Years | 0 (0.0%) | 0 (0.0%) |
| 5 to 17 Years | 0 (0.0%) | 0 (0.0%) |
| 18 to 34 Years | 0 (0.0%) | 0 (0.0%) |
| 35 to 64 Years | 10 (1.2%) | 29 (3.0%) |
| 65 to 74 Years | 24 (11.1%) | 0 (0.0%) |
| 75 Years and over | 30 (38.0%) | 37 (23.0%) |
Disability Class: Vision Difficulty
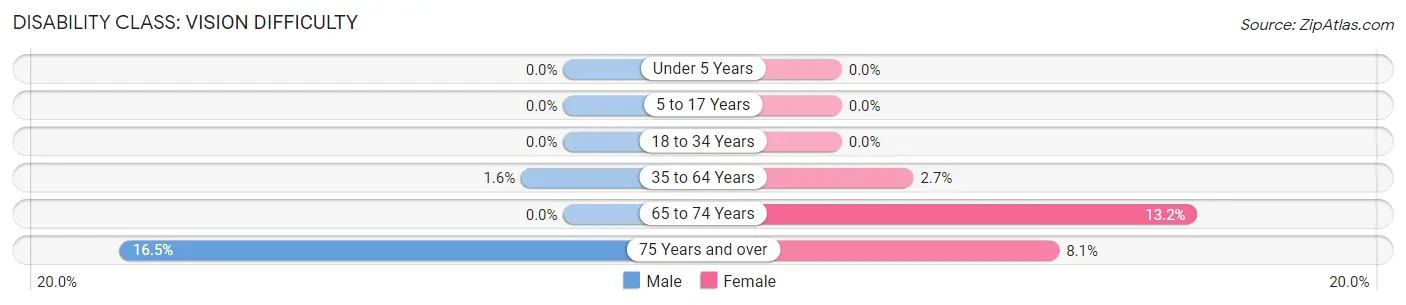
| Age Bracket | Male | Female |
| Under 5 Years | 0 (0.0%) | 0 (0.0%) |
| 5 to 17 Years | 0 (0.0%) | 0 (0.0%) |
| 18 to 34 Years | 0 (0.0%) | 0 (0.0%) |
| 35 to 64 Years | 13 (1.6%) | 26 (2.7%) |
| 65 to 74 Years | 0 (0.0%) | 33 (13.2%) |
| 75 Years and over | 13 (16.5%) | 13 (8.1%) |
Disability Class: Cognitive Difficulty
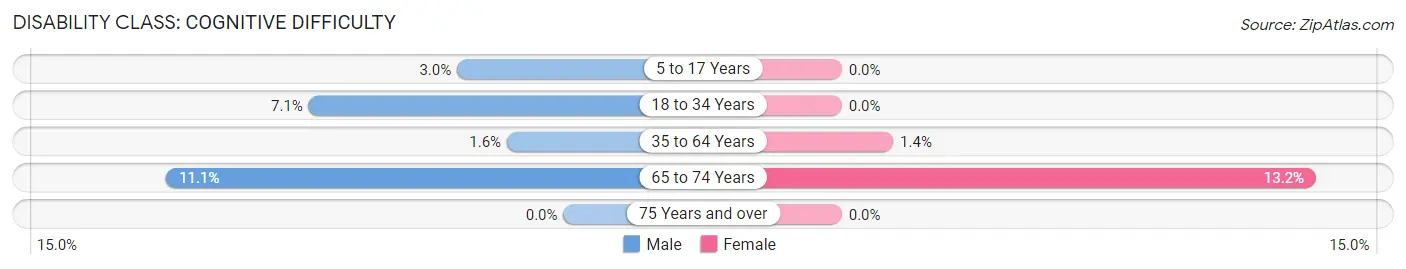
| Age Bracket | Male | Female |
| 5 to 17 Years | 15 (3.0%) | 0 (0.0%) |
| 18 to 34 Years | 41 (7.1%) | 0 (0.0%) |
| 35 to 64 Years | 13 (1.6%) | 14 (1.4%) |
| 65 to 74 Years | 24 (11.1%) | 33 (13.2%) |
| 75 Years and over | 0 (0.0%) | 0 (0.0%) |
Disability Class: Ambulatory Difficulty
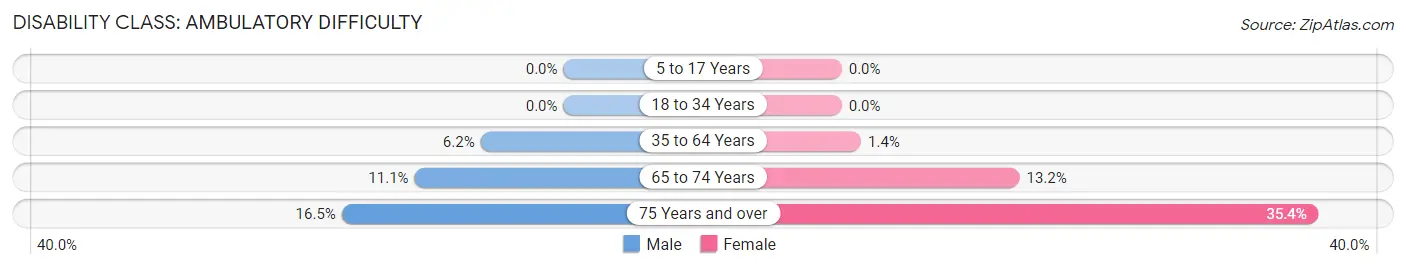
| Age Bracket | Male | Female |
| 5 to 17 Years | 0 (0.0%) | 0 (0.0%) |
| 18 to 34 Years | 0 (0.0%) | 0 (0.0%) |
| 35 to 64 Years | 51 (6.1%) | 14 (1.4%) |
| 65 to 74 Years | 24 (11.1%) | 33 (13.2%) |
| 75 Years and over | 13 (16.5%) | 57 (35.4%) |
Disability Class: Self-Care Difficulty
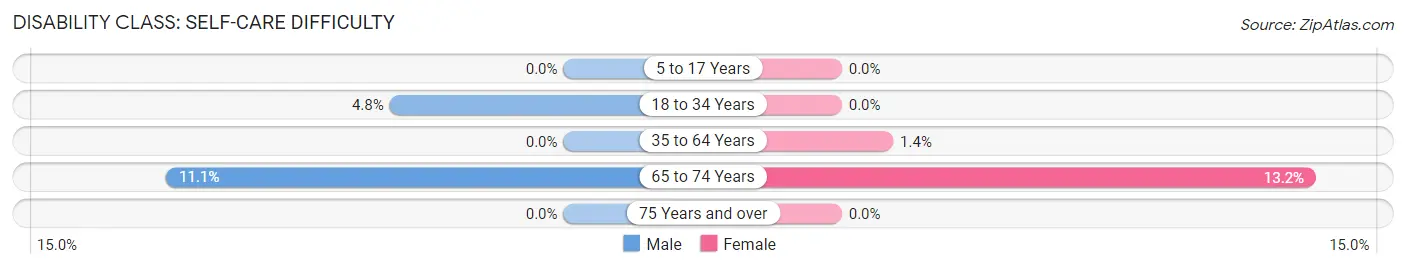
| Age Bracket | Male | Female |
| 5 to 17 Years | 0 (0.0%) | 0 (0.0%) |
| 18 to 34 Years | 28 (4.8%) | 0 (0.0%) |
| 35 to 64 Years | 0 (0.0%) | 14 (1.4%) |
| 65 to 74 Years | 24 (11.1%) | 33 (13.2%) |
| 75 Years and over | 0 (0.0%) | 0 (0.0%) |
Technology Access in Headland
Computing Device Access in Headland
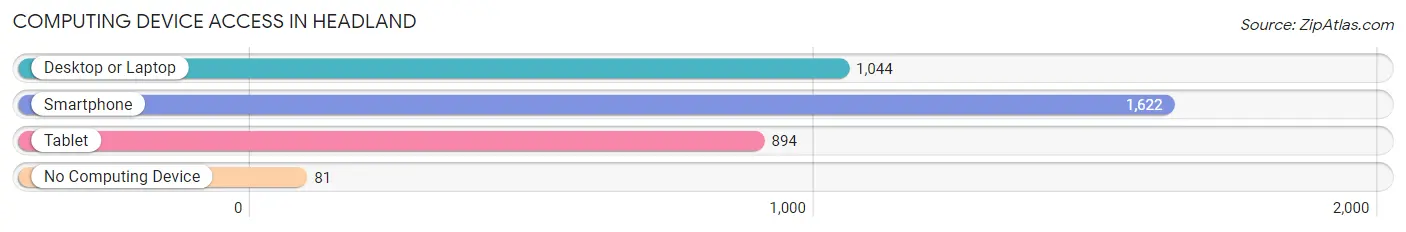
| Device Type | # Households | % Households |
| Desktop or Laptop | 1,044 | 59.2% |
| Smartphone | 1,622 | 92.0% |
| Tablet | 894 | 50.7% |
| No Computing Device | 81 | 4.6% |
| Total | 1,763 | 100.0% |
Internet Access in Headland
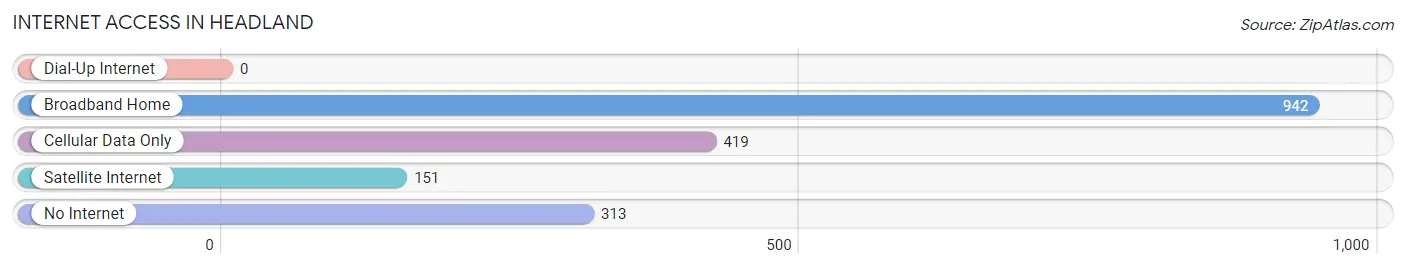
| Internet Type | # Households | % Households |
| Dial-Up Internet | 0 | 0.0% |
| Broadband Home | 942 | 53.4% |
| Cellular Data Only | 419 | 23.8% |
| Satellite Internet | 151 | 8.6% |
| No Internet | 313 | 17.7% |
| Total | 1,763 | 100.0% |
Headland Summary
Headland, Alabama is a small town located in Henry County, in the southeastern corner of the state. It is situated on the banks of the Pea River, and is approximately 20 miles from the state capital of Montgomery. The town has a population of approximately 4,000 people, and is part of the Dothan Metropolitan Statistical Area.
History
Headland was founded in 1872 by a group of settlers from Georgia. The town was named after the nearby headland of the Pea River, which was a prominent landmark in the area. The town was incorporated in 1887, and the first mayor was elected in 1888.
Headland experienced a period of growth in the late 19th and early 20th centuries, as the town became a center for cotton production and processing. The town was also home to several sawmills and other industries.
Geography
Headland is located in the southeastern corner of Henry County, in the southeastern corner of the state. The town is situated on the banks of the Pea River, and is approximately 20 miles from the state capital of Montgomery. The town is located in the Wiregrass region of Alabama, and is part of the Dothan Metropolitan Statistical Area.
The town has a total area of 4.2 square miles, all of which is land. The town is located at an elevation of approximately 200 feet above sea level.
Economy
Headland’s economy is largely based on agriculture and manufacturing. The town is home to several cotton gins, as well as a number of other industries. The town is also home to several retail stores and restaurants.
Demographics
As of the 2010 census, Headland had a population of 4,000 people. The racial makeup of the town was 79.2% White, 17.7% African American, 0.3% Native American, 0.7% Asian, 0.1% Pacific Islander, and 1.9% from other races. Hispanic or Latino of any race were 2.2% of the population.
The median income for a household in the town was $31,250, and the median income for a family was $37,500. The per capita income for the town was $15,945. About 17.2% of families and 20.2% of the population were below the poverty line, including 28.3% of those under age 18 and 15.2% of those age 65 or over.
Common Questions
What is Per Capita Income in Headland?
Per Capita income in Headland is $34,451.
What is the Median Family Income in Headland?
Median Family Income in Headland is $102,500.
What is the Median Household income in Headland?
Median Household Income in Headland is $80,811.
What is Income or Wage Gap in Headland?
Income or Wage Gap in Headland is 31.2%.
Women in Headland earn 68.8 cents for every dollar earned by a man.
What is Inequality or Gini Index in Headland?
Inequality or Gini Index in Headland is 0.38.
What is the Total Population of Headland?
Total Population of Headland is 5,027.
What is the Total Male Population of Headland?
Total Male Population of Headland is 2,386.
What is the Total Female Population of Headland?
Total Female Population of Headland is 2,641.
What is the Ratio of Males per 100 Females in Headland?
There are 90.34 Males per 100 Females in Headland.
What is the Ratio of Females per 100 Males in Headland?
There are 110.69 Females per 100 Males in Headland.
What is the Median Population Age in Headland?
Median Population Age in Headland is 36.4 Years.
What is the Average Family Size in Headland
Average Family Size in Headland is 3.5 People.
What is the Average Household Size in Headland
Average Household Size in Headland is 2.8 People.
How Large is the Labor Force in Headland?
There are 2,779 People in the Labor Forcein in Headland.
What is the Percentage of People in the Labor Force in Headland?
73.7% of People are in the Labor Force in Headland.
What is the Unemployment Rate in Headland?
Unemployment Rate in Headland is 4.0%.