Ruston, LA Map & Demographics
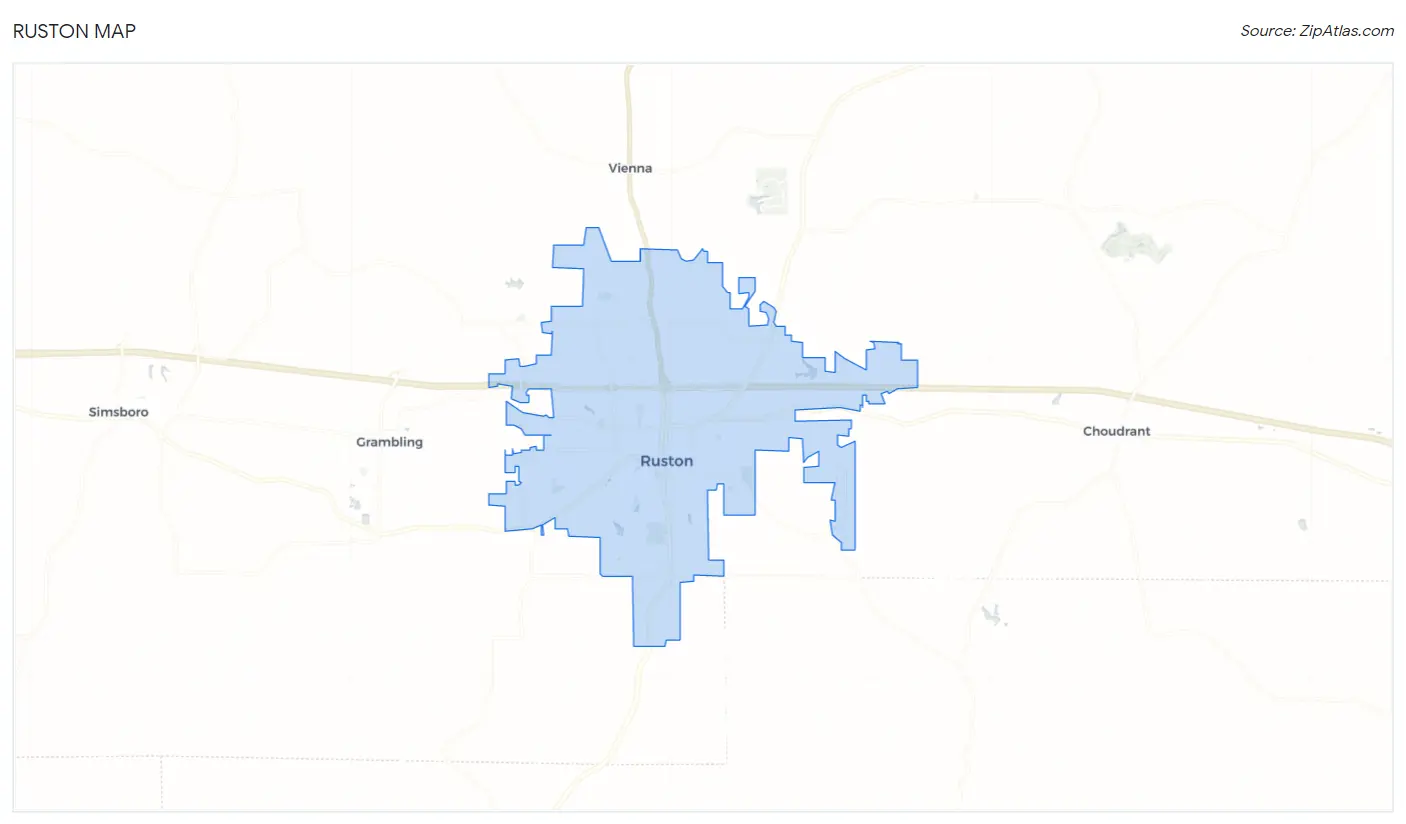
Ruston Map
Ruston Overview
$21,292
PER CAPITA INCOME
$49,738
AVG FAMILY INCOME
$32,877
AVG HOUSEHOLD INCOME
14.0%
WAGE / INCOME GAP [ % ]
86.0¢/ $1
WAGE / INCOME GAP [ $ ]
$10,406
FAMILY INCOME DEFICIT
0.54
INEQUALITY / GINI INDEX
22,282
TOTAL POPULATION
11,066
MALE POPULATION
11,216
FEMALE POPULATION
98.66
MALES / 100 FEMALES
101.36
FEMALES / 100 MALES
23.6
MEDIAN AGE
3.2
AVG FAMILY SIZE
2.4
AVG HOUSEHOLD SIZE
10,610
LABOR FORCE [ PEOPLE ]
55.3%
PERCENT IN LABOR FORCE
3.1%
UNEMPLOYMENT RATE
Ruston Area Codes
Income in Ruston
Income Overview in Ruston
Per Capita Income in Ruston is $21,292, while median incomes of families and households are $49,738 and $32,877 respectively.
| Characteristic | Number | Measure |
| Per Capita Income | 22,282 | $21,292 |
| Median Family Income | 3,876 | $49,738 |
| Mean Family Income | 3,876 | $77,967 |
| Median Household Income | 8,235 | $32,877 |
| Mean Household Income | 8,235 | $54,084 |
| Income Deficit | 3,876 | $10,406 |
| Wage / Income Gap (%) | 22,282 | 14.05% |
| Wage / Income Gap ($) | 22,282 | 85.95¢ per $1 |
| Gini / Inequality Index | 22,282 | 0.54 |
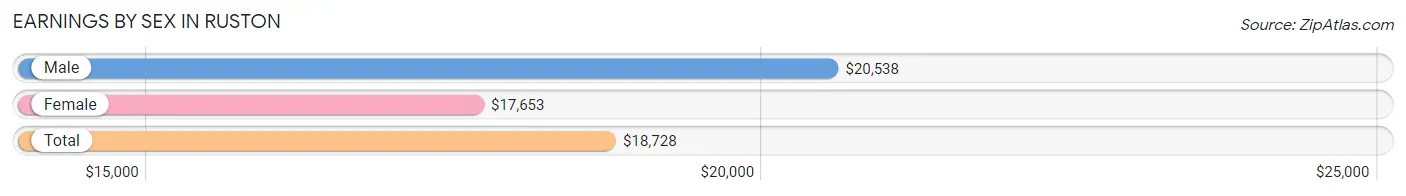
Earnings by Sex in Ruston
Average Earnings in Ruston are $18,728, $20,538 for men and $17,653 for women, a difference of 14.1%.
| Sex | Number | Average Earnings |
| Male | 5,878 (50.2%) | $20,538 |
| Female | 5,822 (49.8%) | $17,653 |
| Total | 11,700 (100.0%) | $18,728 |
Earnings by Sex by Income Bracket in Ruston
The most common earnings brackets in Ruston are $2,500 to $4,999 for men (504 | 8.6%) and $2,500 to $4,999 for women (676 | 11.6%).
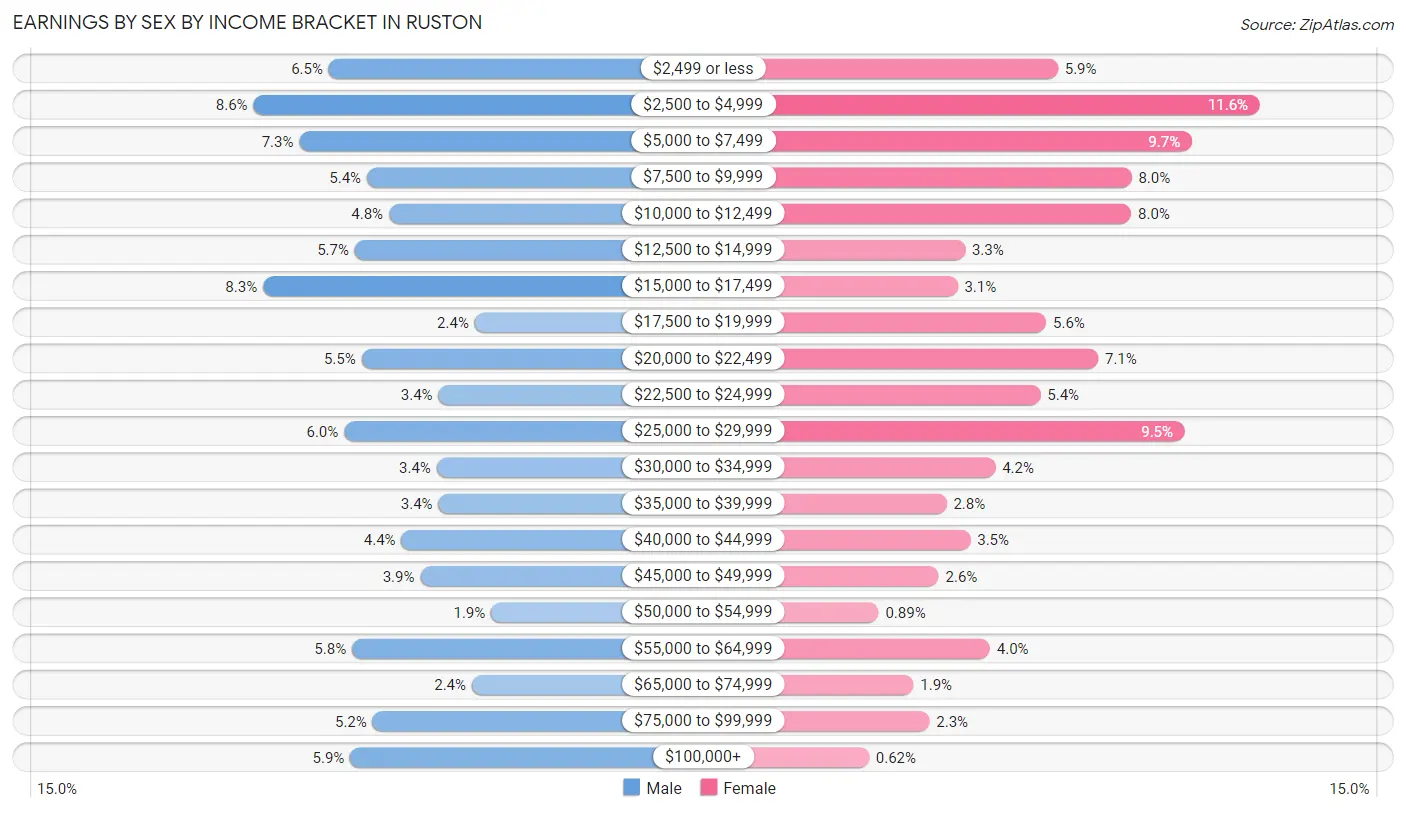
| Income | Male | Female |
| $2,499 or less | 379 (6.5%) | 345 (5.9%) |
| $2,500 to $4,999 | 504 (8.6%) | 676 (11.6%) |
| $5,000 to $7,499 | 428 (7.3%) | 565 (9.7%) |
| $7,500 to $9,999 | 316 (5.4%) | 466 (8.0%) |
| $10,000 to $12,499 | 280 (4.8%) | 465 (8.0%) |
| $12,500 to $14,999 | 336 (5.7%) | 193 (3.3%) |
| $15,000 to $17,499 | 488 (8.3%) | 181 (3.1%) |
| $17,500 to $19,999 | 138 (2.4%) | 326 (5.6%) |
| $20,000 to $22,499 | 325 (5.5%) | 411 (7.1%) |
| $22,500 to $24,999 | 198 (3.4%) | 317 (5.4%) |
| $25,000 to $29,999 | 354 (6.0%) | 553 (9.5%) |
| $30,000 to $34,999 | 201 (3.4%) | 243 (4.2%) |
| $35,000 to $39,999 | 198 (3.4%) | 163 (2.8%) |
| $40,000 to $44,999 | 259 (4.4%) | 202 (3.5%) |
| $45,000 to $49,999 | 228 (3.9%) | 150 (2.6%) |
| $50,000 to $54,999 | 111 (1.9%) | 52 (0.9%) |
| $55,000 to $64,999 | 341 (5.8%) | 234 (4.0%) |
| $65,000 to $74,999 | 143 (2.4%) | 109 (1.9%) |
| $75,000 to $99,999 | 307 (5.2%) | 135 (2.3%) |
| $100,000+ | 344 (5.9%) | 36 (0.6%) |
| Total | 5,878 (100.0%) | 5,822 (100.0%) |
Earnings by Sex by Educational Attainment in Ruston
Average earnings in Ruston are $42,560 for men and $26,119 for women, a difference of 38.6%. Men with an educational attainment of bachelor's degree enjoy the highest average annual earnings of $60,561, while those with college or associate's degree education earn the least with $25,255. Women with an educational attainment of graduate degree earn the most with the average annual earnings of $49,592, while those with college or associate's degree education have the smallest earnings of $19,250.
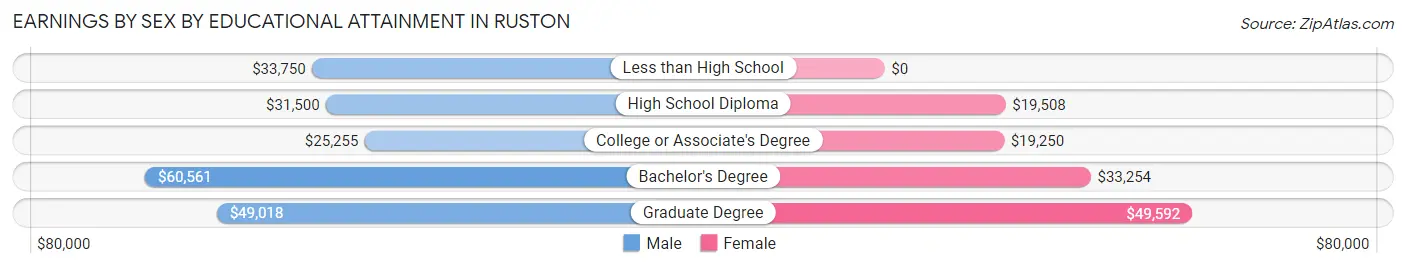
| Educational Attainment | Male Income | Female Income |
| Less than High School | $33,750 | $0 |
| High School Diploma | $31,500 | $19,508 |
| College or Associate's Degree | $25,255 | $19,250 |
| Bachelor's Degree | $60,561 | $33,254 |
| Graduate Degree | $49,018 | $49,592 |
| Total | $42,560 | $26,119 |
Family Income in Ruston
Family Income Brackets in Ruston
According to the Ruston family income data, there are 636 families falling into the $100,000 to $149,999 income range, which is the most common income bracket and makes up 16.4% of all families. Conversely, the $200,000+ income bracket is the least frequent group with only 174 families (4.5%) belonging to this category.
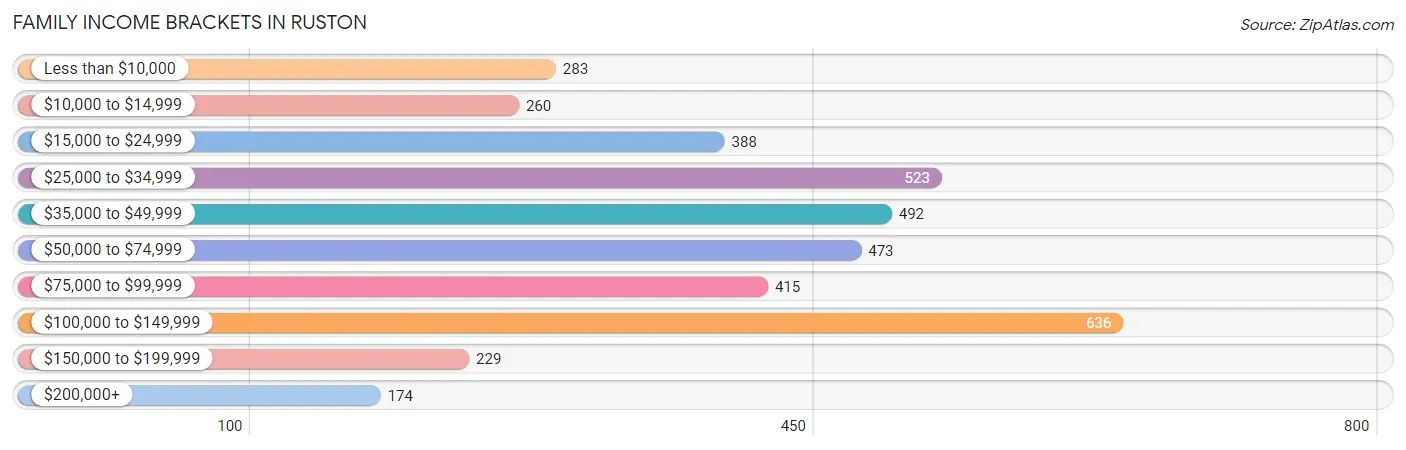
| Income Bracket | # Families | % Families |
| Less than $10,000 | 283 | 7.3% |
| $10,000 to $14,999 | 260 | 6.7% |
| $15,000 to $24,999 | 388 | 10.0% |
| $25,000 to $34,999 | 523 | 13.5% |
| $35,000 to $49,999 | 492 | 12.7% |
| $50,000 to $74,999 | 473 | 12.2% |
| $75,000 to $99,999 | 415 | 10.7% |
| $100,000 to $149,999 | 636 | 16.4% |
| $150,000 to $199,999 | 229 | 5.9% |
| $200,000+ | 174 | 4.5% |
Family Income by Famaliy Size in Ruston
7+ person families (32 | 0.8%) account for the highest median family income in Ruston with $99,091 per family, while 2-person families (2,064 | 53.2%) have the highest median income of $23,540 per family member.
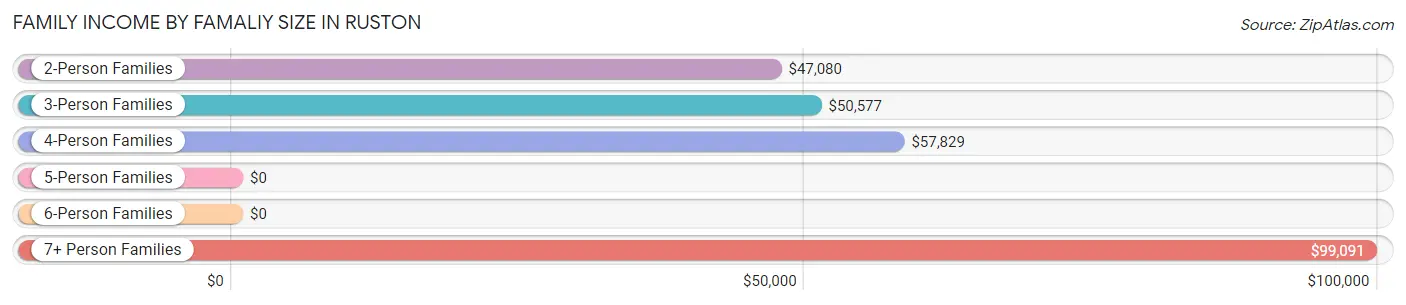
| Income Bracket | # Families | Median Income |
| 2-Person Families | 2,064 (53.2%) | $47,080 |
| 3-Person Families | 1,122 (28.9%) | $50,577 |
| 4-Person Families | 379 (9.8%) | $57,829 |
| 5-Person Families | 236 (6.1%) | $0 |
| 6-Person Families | 43 (1.1%) | $0 |
| 7+ Person Families | 32 (0.8%) | $99,091 |
| Total | 3,876 (100.0%) | $49,738 |
Family Income by Number of Earners in Ruston
The median family income in Ruston is $49,738, with families comprising 3+ earners (181) having the highest median family income of $205,545, while families with 1 earner (1,506) have the lowest median family income of $27,309, accounting for 4.7% and 38.9% of families, respectively.
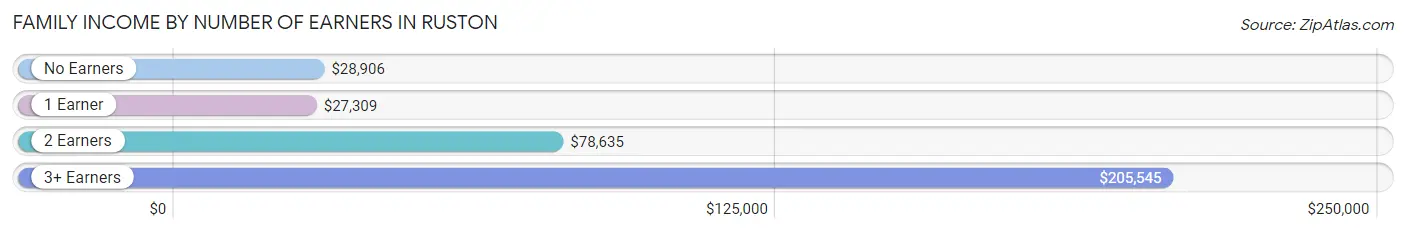
| Number of Earners | # Families | Median Income |
| No Earners | 716 (18.5%) | $28,906 |
| 1 Earner | 1,506 (38.9%) | $27,309 |
| 2 Earners | 1,473 (38.0%) | $78,635 |
| 3+ Earners | 181 (4.7%) | $205,545 |
| Total | 3,876 (100.0%) | $49,738 |
Household Income in Ruston
Household Income Brackets in Ruston
With 1,178 households falling in the category, the $35,000 to $49,999 income range is the most frequent in Ruston, accounting for 14.3% of all households. In contrast, only 198 households (2.4%) fall into the $200,000+ income bracket, making it the least populous group.
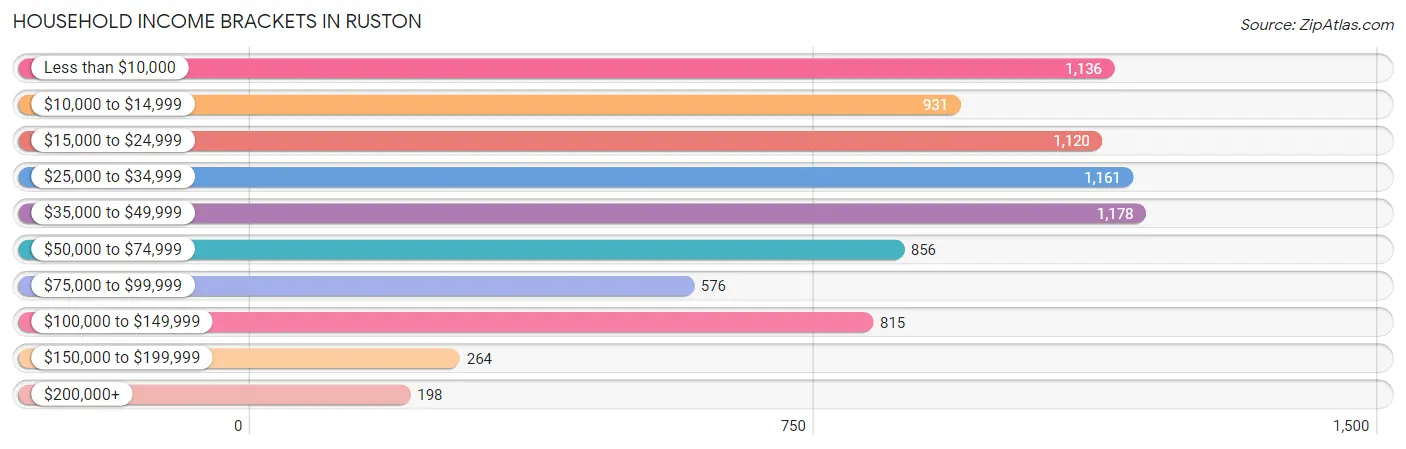
| Income Bracket | # Households | % Households |
| Less than $10,000 | 1,136 | 13.8% |
| $10,000 to $14,999 | 931 | 11.3% |
| $15,000 to $24,999 | 1,120 | 13.6% |
| $25,000 to $34,999 | 1,161 | 14.1% |
| $35,000 to $49,999 | 1,178 | 14.3% |
| $50,000 to $74,999 | 856 | 10.4% |
| $75,000 to $99,999 | 576 | 7.0% |
| $100,000 to $149,999 | 815 | 9.9% |
| $150,000 to $199,999 | 264 | 3.2% |
| $200,000+ | 198 | 2.4% |
Household Income by Householder Age in Ruston
The median household income in Ruston is $32,877, with the highest median household income of $52,950 found in the 45 to 64 years age bracket for the primary householder. A total of 1,772 households (21.5%) fall into this category. Meanwhile, the 15 to 24 years age bracket for the primary householder has the lowest median household income of $14,879, with 2,194 households (26.6%) in this group.
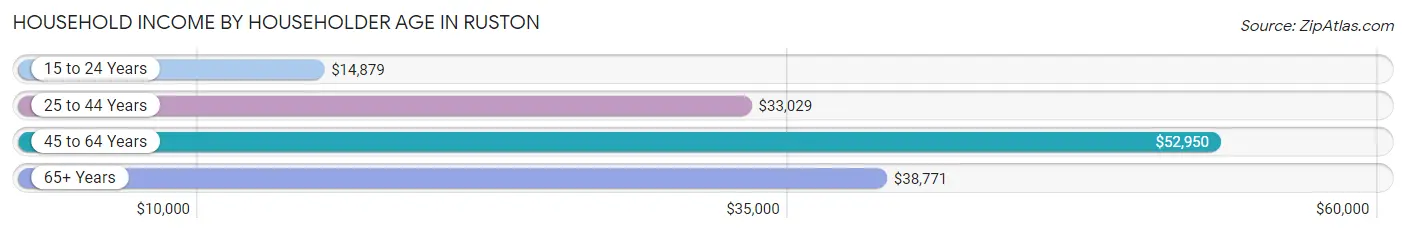
| Income Bracket | # Households | Median Income |
| 15 to 24 Years | 2,194 (26.6%) | $14,879 |
| 25 to 44 Years | 2,600 (31.6%) | $33,029 |
| 45 to 64 Years | 1,772 (21.5%) | $52,950 |
| 65+ Years | 1,669 (20.3%) | $38,771 |
| Total | 8,235 (100.0%) | $32,877 |
Poverty in Ruston
Income Below Poverty by Sex and Age in Ruston
With 36.4% poverty level for males and 35.9% for females among the residents of Ruston, 5 year old males and 15 year old females are the most vulnerable to poverty, with 134 males (68.0%) and 94 females (74.6%) in their respective age groups living below the poverty level.
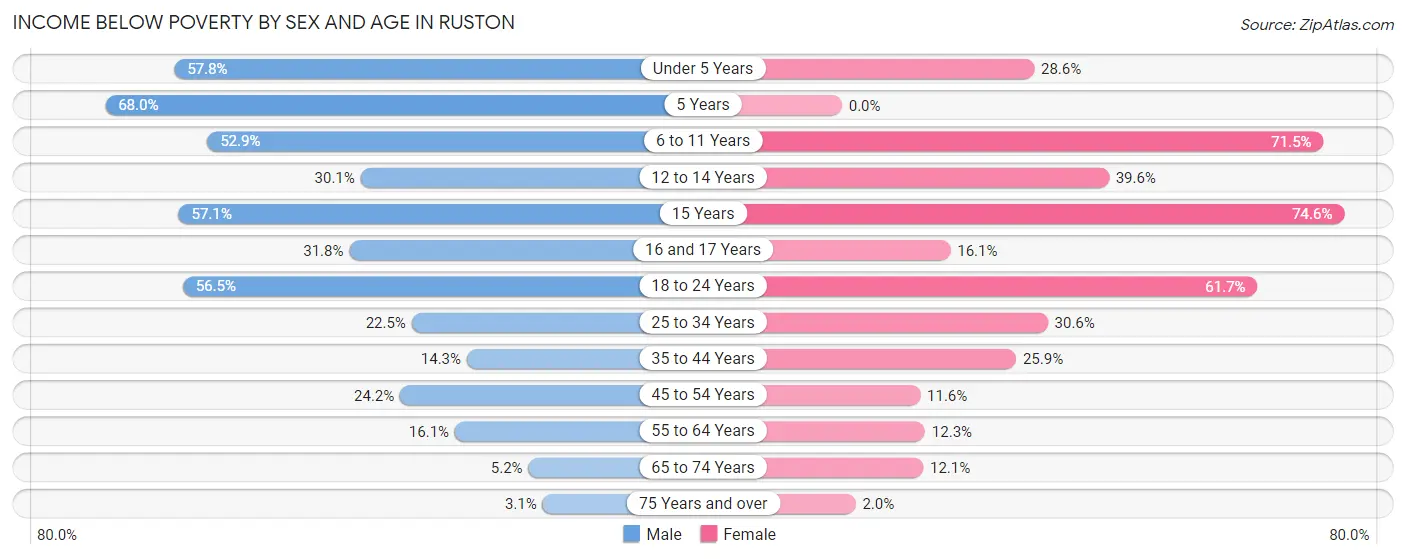
| Age Bracket | Male | Female |
| Under 5 Years | 416 (57.8%) | 159 (28.5%) |
| 5 Years | 134 (68.0%) | 0 (0.0%) |
| 6 to 11 Years | 303 (52.9%) | 256 (71.5%) |
| 12 to 14 Years | 56 (30.1%) | 107 (39.6%) |
| 15 Years | 8 (57.1%) | 94 (74.6%) |
| 16 and 17 Years | 55 (31.8%) | 24 (16.1%) |
| 18 to 24 Years | 1,790 (56.5%) | 2,095 (61.7%) |
| 25 to 34 Years | 324 (22.5%) | 415 (30.6%) |
| 35 to 44 Years | 147 (14.3%) | 224 (25.9%) |
| 45 to 54 Years | 144 (24.2%) | 95 (11.6%) |
| 55 to 64 Years | 108 (16.1%) | 113 (12.3%) |
| 65 to 74 Years | 33 (5.2%) | 87 (12.1%) |
| 75 Years and over | 9 (3.1%) | 13 (2.0%) |
| Total | 3,527 (36.4%) | 3,682 (35.9%) |
Income Above Poverty by Sex and Age in Ruston
According to the poverty statistics in Ruston, males aged 75 years and over and females aged 5 years are the age groups that are most secure financially, with 96.9% of males and 100.0% of females in these age groups living above the poverty line.
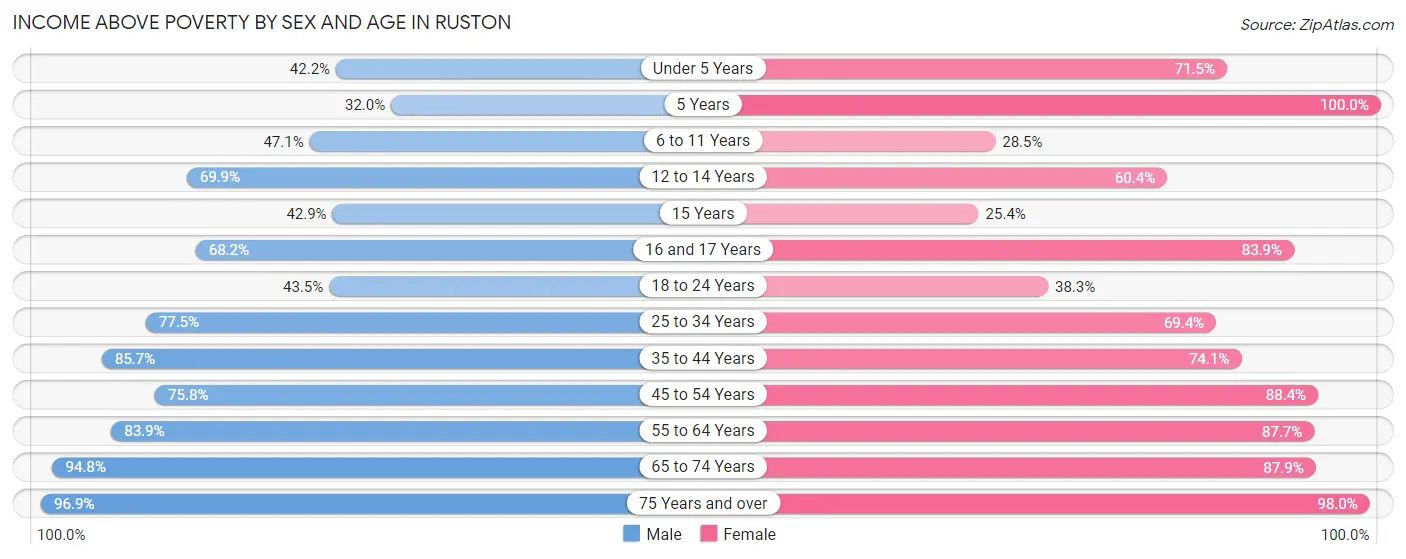
| Age Bracket | Male | Female |
| Under 5 Years | 304 (42.2%) | 398 (71.5%) |
| 5 Years | 63 (32.0%) | 70 (100.0%) |
| 6 to 11 Years | 270 (47.1%) | 102 (28.5%) |
| 12 to 14 Years | 130 (69.9%) | 163 (60.4%) |
| 15 Years | 6 (42.9%) | 32 (25.4%) |
| 16 and 17 Years | 118 (68.2%) | 125 (83.9%) |
| 18 to 24 Years | 1,377 (43.5%) | 1,300 (38.3%) |
| 25 to 34 Years | 1,115 (77.5%) | 943 (69.4%) |
| 35 to 44 Years | 879 (85.7%) | 642 (74.1%) |
| 45 to 54 Years | 450 (75.8%) | 722 (88.4%) |
| 55 to 64 Years | 563 (83.9%) | 803 (87.7%) |
| 65 to 74 Years | 603 (94.8%) | 634 (87.9%) |
| 75 Years and over | 283 (96.9%) | 626 (98.0%) |
| Total | 6,161 (63.6%) | 6,560 (64.0%) |
Income Below Poverty Among Married-Couple Families in Ruston
The poverty statistics for married-couple families in Ruston show that 3.0% or 63 of the total 2,076 families live below the poverty line. Families with 5 or more children have the highest poverty rate of 18.5%, comprising of 5 families. On the other hand, families with no children have the lowest poverty rate of 0.6%, which includes 9 families.
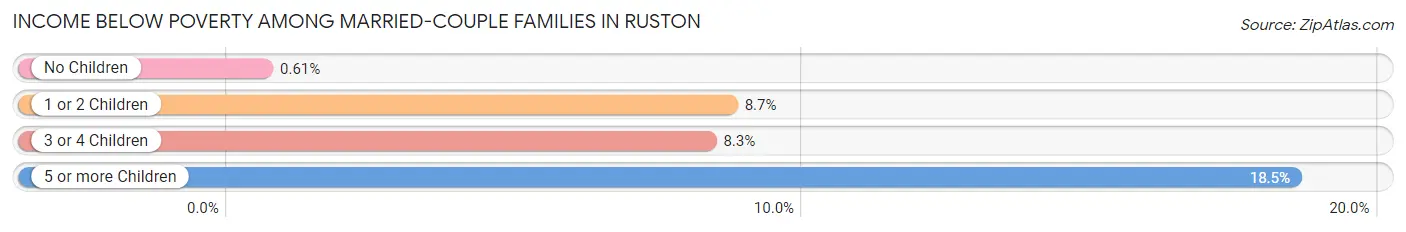
| Children | Above Poverty | Below Poverty |
| No Children | 1,473 (99.4%) | 9 (0.6%) |
| 1 or 2 Children | 430 (91.3%) | 41 (8.7%) |
| 3 or 4 Children | 88 (91.7%) | 8 (8.3%) |
| 5 or more Children | 22 (81.5%) | 5 (18.5%) |
| Total | 2,013 (97.0%) | 63 (3.0%) |
Income Below Poverty Among Single-Parent Households in Ruston
According to the poverty data in Ruston, 54.4% or 159 single-father households and 41.5% or 626 single-mother households are living below the poverty line. Among single-father households, those with 1 or 2 children have the highest poverty rate, with 110 households (100.0%) experiencing poverty. Likewise, among single-mother households, those with 3 or 4 children have the highest poverty rate, with 99 households (100.0%) falling below the poverty line.
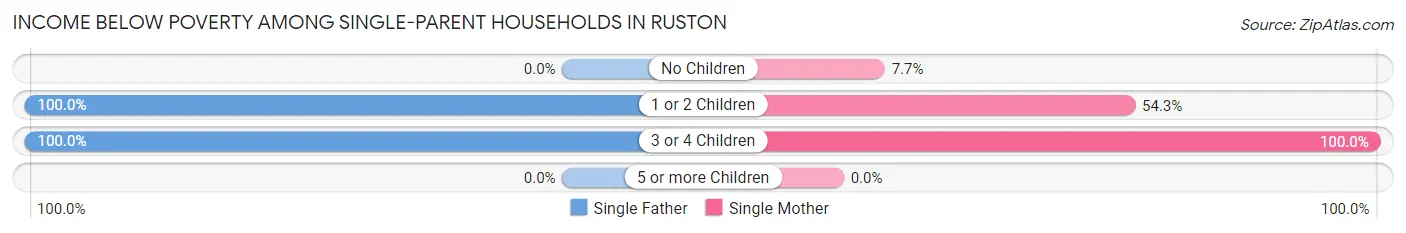
| Children | Single Father | Single Mother |
| No Children | 0 (0.0%) | 39 (7.6%) |
| 1 or 2 Children | 110 (100.0%) | 488 (54.3%) |
| 3 or 4 Children | 49 (100.0%) | 99 (100.0%) |
| 5 or more Children | 0 (0.0%) | 0 (0.0%) |
| Total | 159 (54.4%) | 626 (41.5%) |
Income Below Poverty Among Married-Couple vs Single-Parent Households in Ruston
The poverty data for Ruston shows that 63 of the married-couple family households (3.0%) and 785 of the single-parent households (43.6%) are living below the poverty level. Within the married-couple family households, those with 5 or more children have the highest poverty rate, with 5 households (18.5%) falling below the poverty line. Among the single-parent households, those with 3 or 4 children have the highest poverty rate, with 148 household (100.0%) living below poverty.
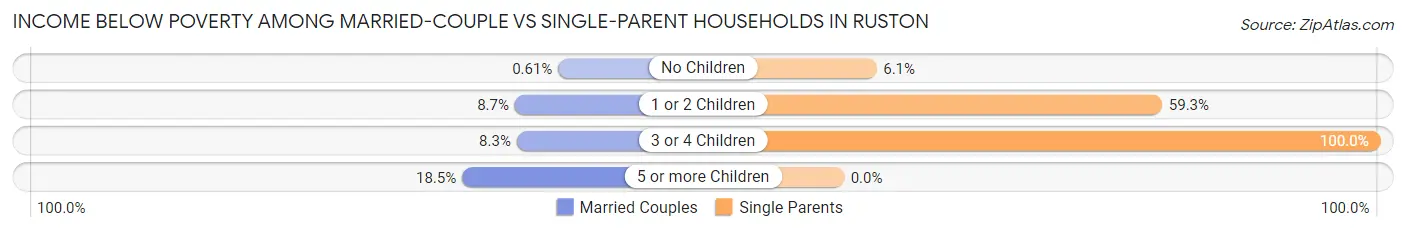
| Children | Married-Couple Families | Single-Parent Households |
| No Children | 9 (0.6%) | 39 (6.1%) |
| 1 or 2 Children | 41 (8.7%) | 598 (59.3%) |
| 3 or 4 Children | 8 (8.3%) | 148 (100.0%) |
| 5 or more Children | 5 (18.5%) | 0 (0.0%) |
| Total | 63 (3.0%) | 785 (43.6%) |
Race in Ruston
The most populous races in Ruston are White / Caucasian (10,839 | 48.6%), Black / African American (9,366 | 42.0%), and Two or more Races (903 | 4.1%).
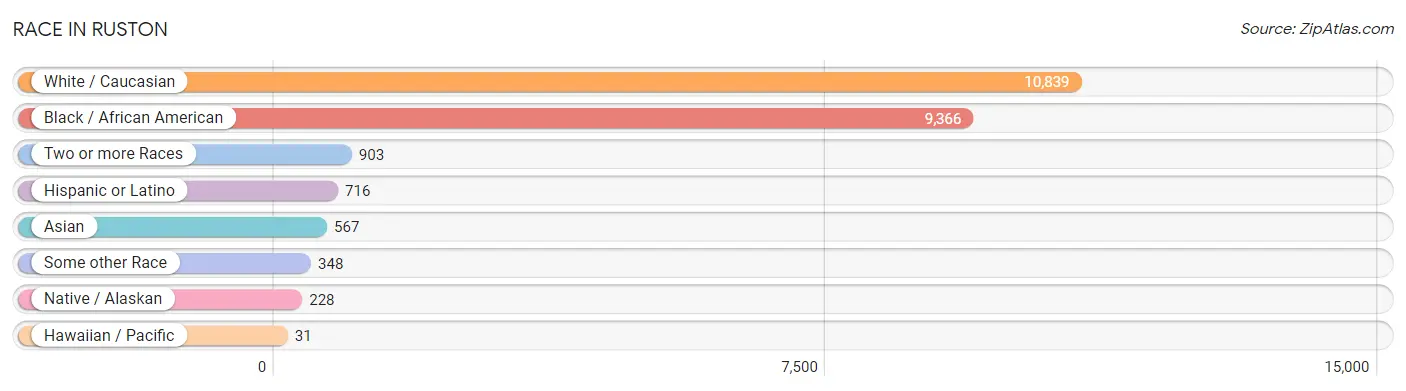
| Race | # Population | % Population |
| Asian | 567 | 2.5% |
| Black / African American | 9,366 | 42.0% |
| Hawaiian / Pacific | 31 | 0.1% |
| Hispanic or Latino | 716 | 3.2% |
| Native / Alaskan | 228 | 1.0% |
| White / Caucasian | 10,839 | 48.6% |
| Two or more Races | 903 | 4.1% |
| Some other Race | 348 | 1.6% |
| Total | 22,282 | 100.0% |
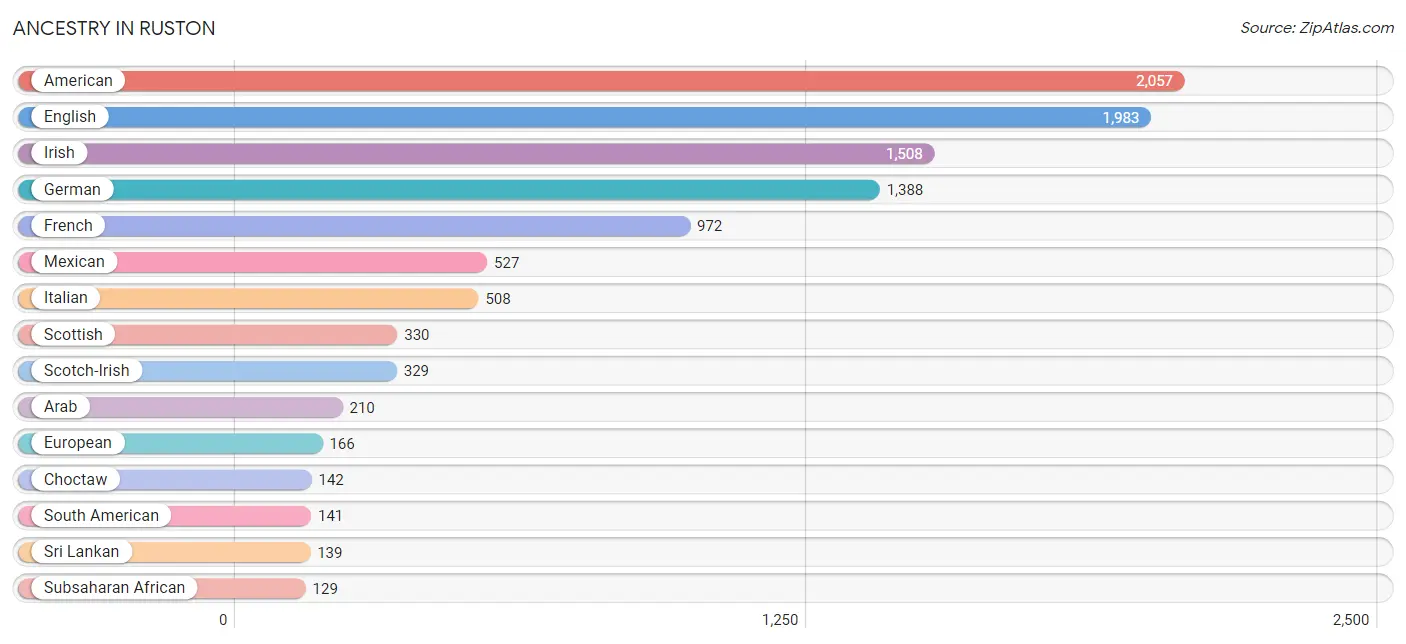
Ancestry in Ruston
The most populous ancestries reported in Ruston are American (2,057 | 9.2%), English (1,983 | 8.9%), Irish (1,508 | 6.8%), German (1,388 | 6.2%), and French (972 | 4.4%), together accounting for 35.5% of all Ruston residents.
| Ancestry | # Population | % Population |
| African | 82 | 0.4% |
| American | 2,057 | 9.2% |
| Arab | 210 | 0.9% |
| Argentinean | 17 | 0.1% |
| Australian | 16 | 0.1% |
| Austrian | 121 | 0.5% |
| Belgian | 42 | 0.2% |
| Bhutanese | 11 | 0.1% |
| British | 66 | 0.3% |
| Burmese | 62 | 0.3% |
| Canadian | 3 | 0.0% |
| Central American | 2 | 0.0% |
| Cherokee | 103 | 0.5% |
| Choctaw | 142 | 0.6% |
| Colombian | 107 | 0.5% |
| Creek | 37 | 0.2% |
| Croatian | 31 | 0.1% |
| Danish | 3 | 0.0% |
| Dutch | 116 | 0.5% |
| Eastern European | 37 | 0.2% |
| Egyptian | 17 | 0.1% |
| English | 1,983 | 8.9% |
| Ethiopian | 37 | 0.2% |
| European | 166 | 0.7% |
| French | 972 | 4.4% |
| French Canadian | 71 | 0.3% |
| German | 1,388 | 6.2% |
| Greek | 79 | 0.4% |
| Guatemalan | 2 | 0.0% |
| Houma | 70 | 0.3% |
| Indian (Asian) | 109 | 0.5% |
| Iranian | 38 | 0.2% |
| Irish | 1,508 | 6.8% |
| Italian | 508 | 2.3% |
| Korean | 87 | 0.4% |
| Lebanese | 13 | 0.1% |
| Mexican | 527 | 2.4% |
| Mongolian | 5 | 0.0% |
| Navajo | 34 | 0.2% |
| Northern European | 71 | 0.3% |
| Norwegian | 36 | 0.2% |
| Pakistani | 13 | 0.1% |
| Peruvian | 17 | 0.1% |
| Polish | 97 | 0.4% |
| Portuguese | 41 | 0.2% |
| Puerto Rican | 38 | 0.2% |
| Russian | 51 | 0.2% |
| Scandinavian | 17 | 0.1% |
| Scotch-Irish | 329 | 1.5% |
| Scottish | 330 | 1.5% |
| Seminole | 37 | 0.2% |
| South American | 141 | 0.6% |
| Spanish | 8 | 0.0% |
| Sri Lankan | 139 | 0.6% |
| Subsaharan African | 129 | 0.6% |
| Swedish | 72 | 0.3% |
| Thai | 20 | 0.1% |
| Vietnamese | 39 | 0.2% |
| Welsh | 33 | 0.2% | View All 59 Rows |
Immigrants in Ruston
The most numerous immigrant groups reported in Ruston came from Asia (650 | 2.9%), South Central Asia (240 | 1.1%), Western Asia (170 | 0.8%), South Eastern Asia (148 | 0.7%), and Latin America (135 | 0.6%), together accounting for 6.0% of all Ruston residents.
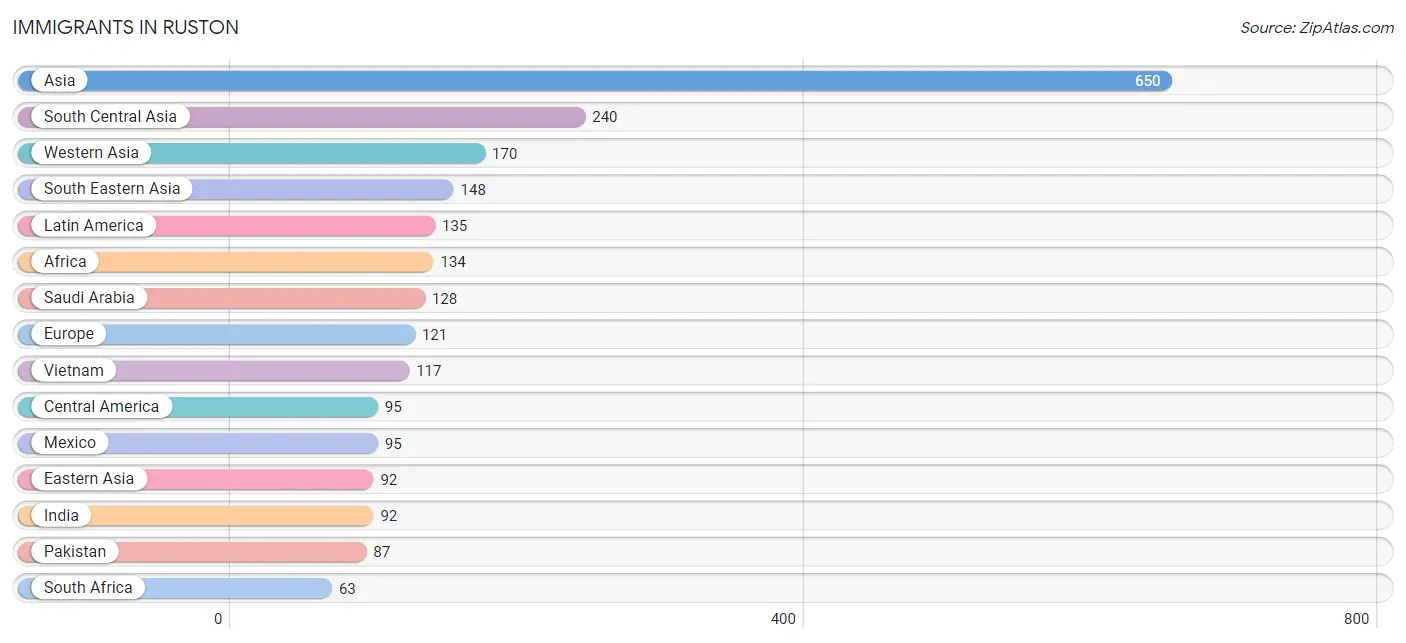
| Immigration Origin | # Population | % Population |
| Africa | 134 | 0.6% |
| Argentina | 17 | 0.1% |
| Asia | 650 | 2.9% |
| Azores | 5 | 0.0% |
| Bangladesh | 39 | 0.2% |
| Brazil | 6 | 0.0% |
| Canada | 3 | 0.0% |
| Central America | 95 | 0.4% |
| China | 56 | 0.3% |
| Croatia | 17 | 0.1% |
| Eastern Africa | 44 | 0.2% |
| Eastern Asia | 92 | 0.4% |
| Eastern Europe | 54 | 0.2% |
| Egypt | 17 | 0.1% |
| England | 20 | 0.1% |
| Ethiopia | 37 | 0.2% |
| Europe | 121 | 0.5% |
| Germany | 42 | 0.2% |
| India | 92 | 0.4% |
| Iran | 22 | 0.1% |
| Japan | 5 | 0.0% |
| Korea | 31 | 0.1% |
| Latin America | 135 | 0.6% |
| Mexico | 95 | 0.4% |
| Northern Africa | 17 | 0.1% |
| Northern Europe | 20 | 0.1% |
| Pakistan | 87 | 0.4% |
| Peru | 17 | 0.1% |
| Philippines | 31 | 0.1% |
| Portugal | 5 | 0.0% |
| Russia | 37 | 0.2% |
| Saudi Arabia | 128 | 0.6% |
| South Africa | 63 | 0.3% |
| South America | 40 | 0.2% |
| South Central Asia | 240 | 1.1% |
| South Eastern Asia | 148 | 0.7% |
| Southern Europe | 5 | 0.0% |
| Taiwan | 13 | 0.1% |
| Vietnam | 117 | 0.5% |
| Western Asia | 170 | 0.8% |
| Western Europe | 42 | 0.2% |
| Yemen | 42 | 0.2% | View All 42 Rows |
Sex and Age in Ruston
Sex and Age in Ruston
The most populous age groups in Ruston are 20 to 24 Years (3,292 | 29.7%) for men and 20 to 24 Years (3,217 | 28.7%) for women.
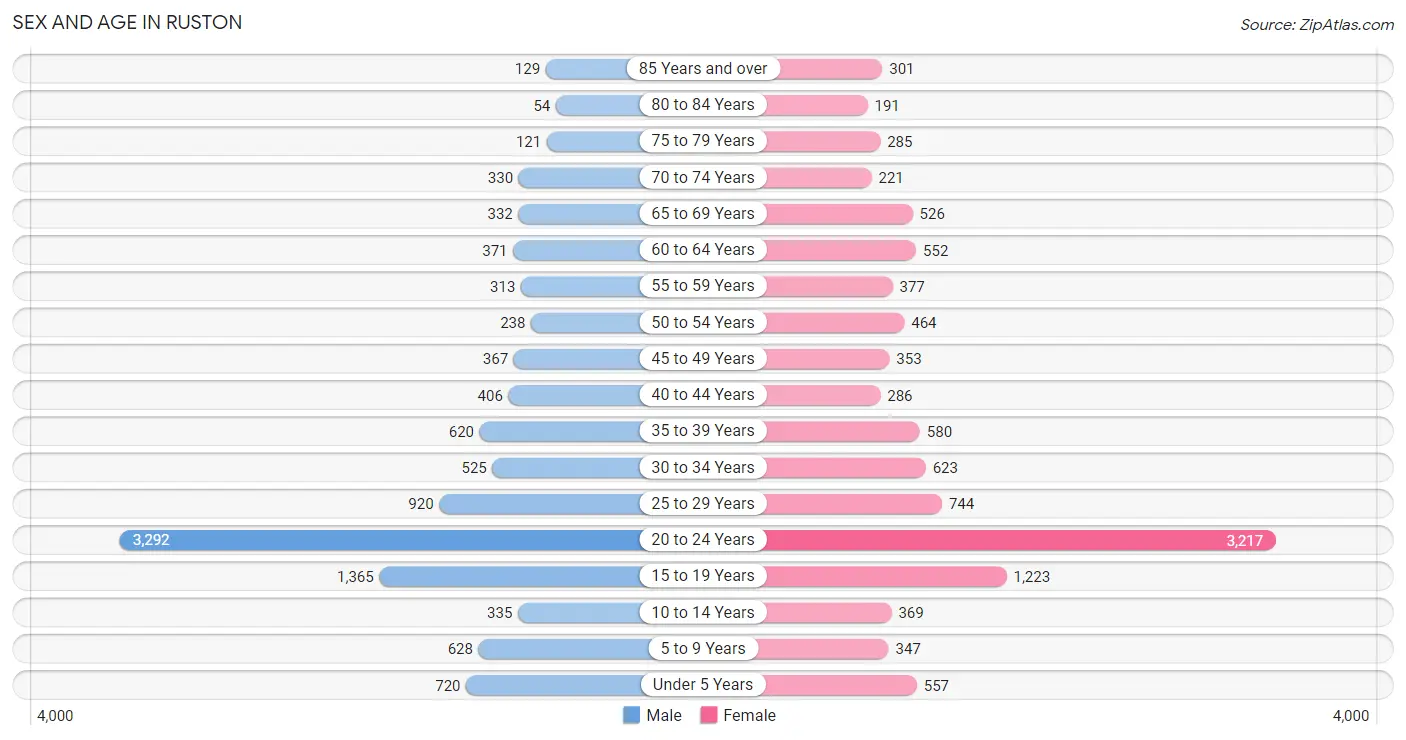
| Age Bracket | Male | Female |
| Under 5 Years | 720 (6.5%) | 557 (5.0%) |
| 5 to 9 Years | 628 (5.7%) | 347 (3.1%) |
| 10 to 14 Years | 335 (3.0%) | 369 (3.3%) |
| 15 to 19 Years | 1,365 (12.3%) | 1,223 (10.9%) |
| 20 to 24 Years | 3,292 (29.7%) | 3,217 (28.7%) |
| 25 to 29 Years | 920 (8.3%) | 744 (6.6%) |
| 30 to 34 Years | 525 (4.7%) | 623 (5.6%) |
| 35 to 39 Years | 620 (5.6%) | 580 (5.2%) |
| 40 to 44 Years | 406 (3.7%) | 286 (2.5%) |
| 45 to 49 Years | 367 (3.3%) | 353 (3.2%) |
| 50 to 54 Years | 238 (2.1%) | 464 (4.1%) |
| 55 to 59 Years | 313 (2.8%) | 377 (3.4%) |
| 60 to 64 Years | 371 (3.4%) | 552 (4.9%) |
| 65 to 69 Years | 332 (3.0%) | 526 (4.7%) |
| 70 to 74 Years | 330 (3.0%) | 221 (2.0%) |
| 75 to 79 Years | 121 (1.1%) | 285 (2.5%) |
| 80 to 84 Years | 54 (0.5%) | 191 (1.7%) |
| 85 Years and over | 129 (1.2%) | 301 (2.7%) |
| Total | 11,066 (100.0%) | 11,216 (100.0%) |
Families and Households in Ruston
Median Family Size in Ruston
The median family size in Ruston is 3.20 persons per family, with single female/mother families (1,508 | 38.9%) accounting for the largest median family size of 3.66 persons per family. On the other hand, single male/father families (292 | 7.5%) represent the smallest median family size with 2.43 persons per family.
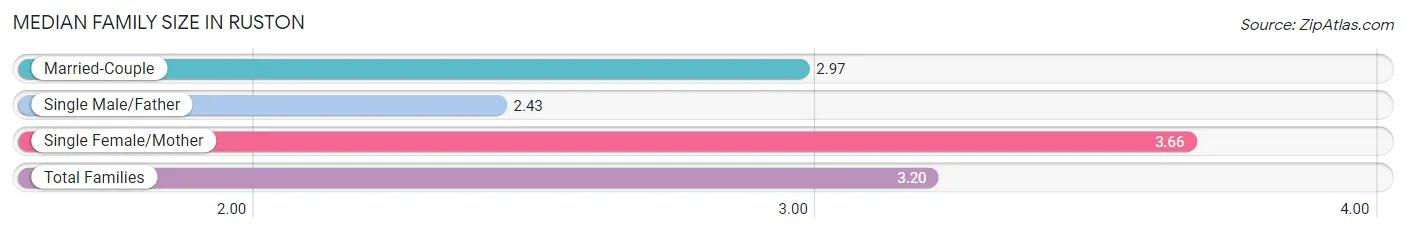
| Family Type | # Families | Family Size |
| Married-Couple | 2,076 (53.6%) | 2.97 |
| Single Male/Father | 292 (7.5%) | 2.43 |
| Single Female/Mother | 1,508 (38.9%) | 3.66 |
| Total Families | 3,876 (100.0%) | 3.20 |
Median Household Size in Ruston
The median household size in Ruston is 2.41 persons per household, with single female/mother households (1,508 | 18.3%) accounting for the largest median household size of 3.77 persons per household. non-family households (4,359 | 52.9%) represent the smallest median household size with 1.60 persons per household.
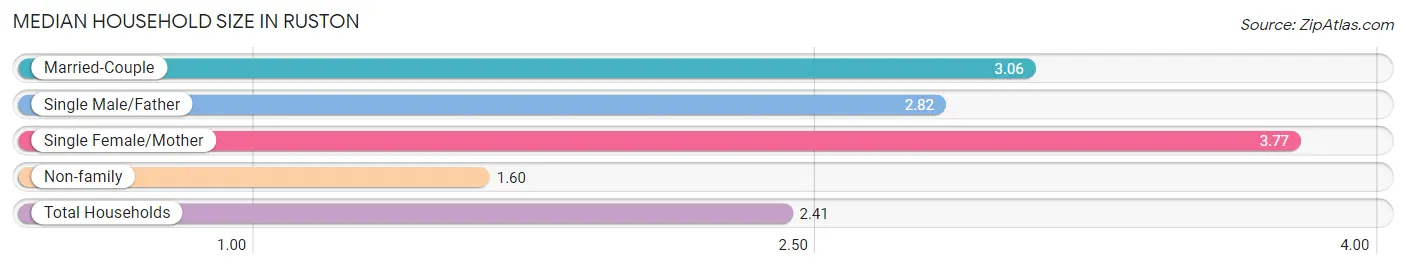
| Household Type | # Households | Household Size |
| Married-Couple | 2,076 (25.2%) | 3.06 |
| Single Male/Father | 292 (3.5%) | 2.82 |
| Single Female/Mother | 1,508 (18.3%) | 3.77 |
| Non-family | 4,359 (52.9%) | 1.60 |
| Total Households | 8,235 (100.0%) | 2.41 |
Household Size by Marriage Status in Ruston
Out of a total of 8,235 households in Ruston, 3,876 (47.1%) are family households, while 4,359 (52.9%) are nonfamily households. The most numerous type of family households are 2-person households, comprising 1,931, and the most common type of nonfamily households are 1-person households, comprising 2,608.
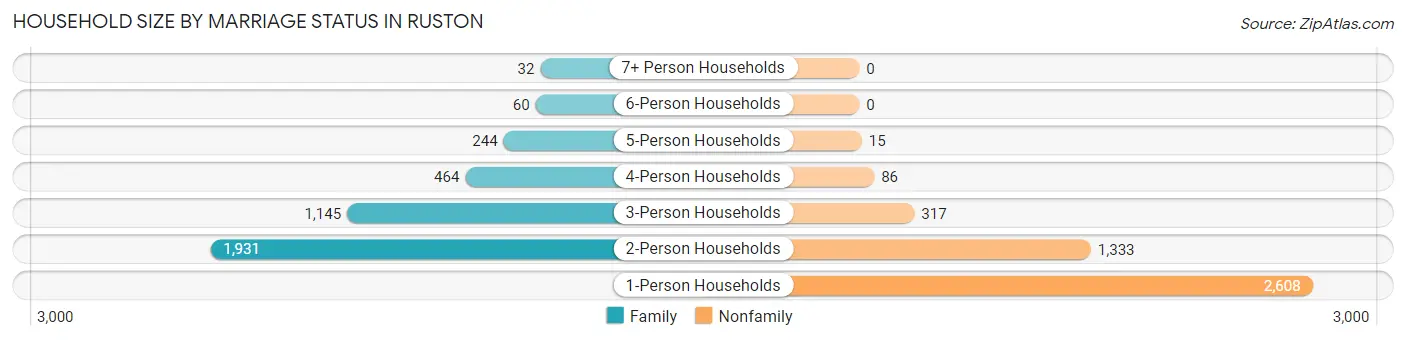
| Household Size | Family Households | Nonfamily Households |
| 1-Person Households | - | 2,608 (31.7%) |
| 2-Person Households | 1,931 (23.4%) | 1,333 (16.2%) |
| 3-Person Households | 1,145 (13.9%) | 317 (3.8%) |
| 4-Person Households | 464 (5.6%) | 86 (1.0%) |
| 5-Person Households | 244 (3.0%) | 15 (0.2%) |
| 6-Person Households | 60 (0.7%) | 0 (0.0%) |
| 7+ Person Households | 32 (0.4%) | 0 (0.0%) |
| Total | 3,876 (47.1%) | 4,359 (52.9%) |
Female Fertility in Ruston
Fertility by Age in Ruston
Average fertility rate in Ruston is 28.0 births per 1,000 women. Women in the age bracket of 35 to 50 years have the highest fertility rate with 59.0 births per 1,000 women. Women in the age bracket of 20 to 34 years acount for 60.2% of all women with births.
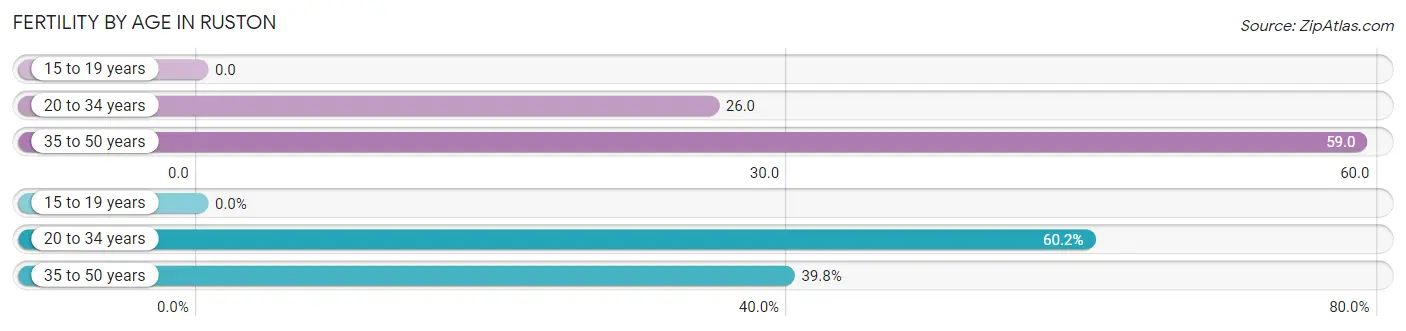
| Age Bracket | Women with Births | Births / 1,000 Women |
| 15 to 19 years | 0 (0.0%) | 0.0 |
| 20 to 34 years | 118 (60.2%) | 26.0 |
| 35 to 50 years | 78 (39.8%) | 59.0 |
| Total | 196 (100.0%) | 28.0 |
Fertility by Age by Marriage Status in Ruston
40.8% of women with births (196) in Ruston are married. The highest percentage of unmarried women with births falls into 20 to 34 years age bracket with 83.1% of them unmarried at the time of birth, while the lowest percentage of unmarried women with births belong to 35 to 50 years age bracket with 23.1% of them unmarried.
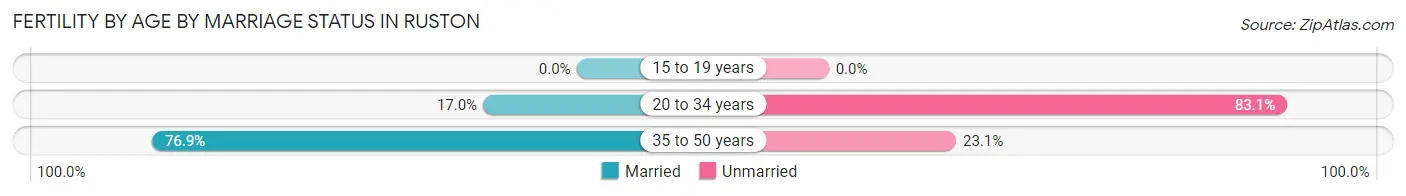
| Age Bracket | Married | Unmarried |
| 15 to 19 years | 0 (0.0%) | 0 (0.0%) |
| 20 to 34 years | 20 (17.0%) | 98 (83.1%) |
| 35 to 50 years | 60 (76.9%) | 18 (23.1%) |
| Total | 80 (40.8%) | 116 (59.2%) |
Fertility by Education in Ruston
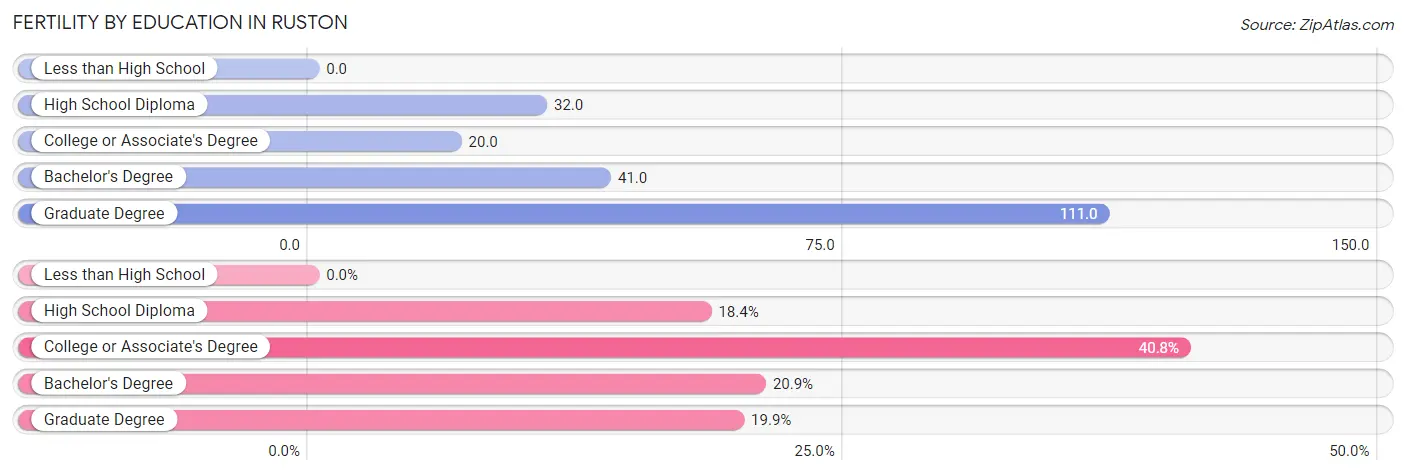
| Educational Attainment | Women with Births | Births / 1,000 Women |
| Less than High School | 0 (0.0%) | 0.0 |
| High School Diploma | 36 (18.4%) | 32.0 |
| College or Associate's Degree | 80 (40.8%) | 20.0 |
| Bachelor's Degree | 41 (20.9%) | 41.0 |
| Graduate Degree | 39 (19.9%) | 111.0 |
| Total | 196 (100.0%) | 28.0 |
Fertility by Education by Marriage Status in Ruston
59.2% of women with births in Ruston are unmarried. Women with the educational attainment of bachelor's degree are most likely to be married with 100.0% of them married at childbirth, while women with the educational attainment of high school diploma are least likely to be married with 100.0% of them unmarried at childbirth.
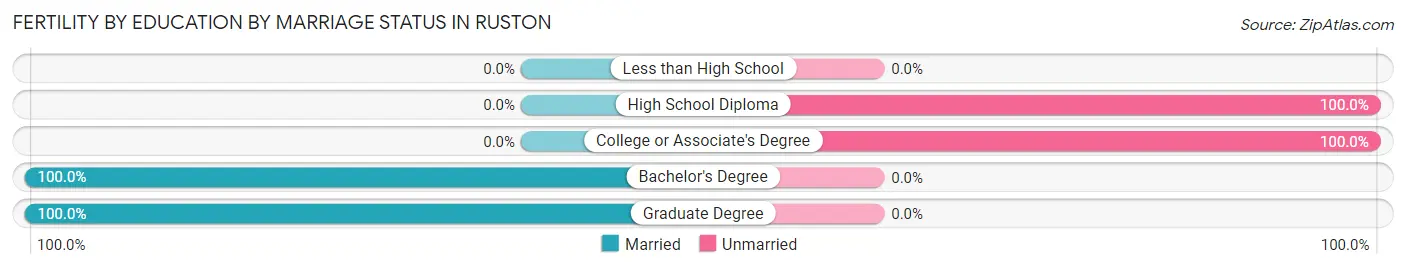
| Educational Attainment | Married | Unmarried |
| Less than High School | 0 (0.0%) | 0 (0.0%) |
| High School Diploma | 0 (0.0%) | 36 (100.0%) |
| College or Associate's Degree | 0 (0.0%) | 80 (100.0%) |
| Bachelor's Degree | 41 (100.0%) | 0 (0.0%) |
| Graduate Degree | 39 (100.0%) | 0 (0.0%) |
| Total | 80 (40.8%) | 116 (59.2%) |
Employment Characteristics in Ruston
Employment by Class of Employer in Ruston
Among the 10,101 employed individuals in Ruston, private company employees (6,022 | 59.6%), state government employees (1,976 | 19.6%), and self-employed (not incorporated) (600 | 5.9%) make up the most common classes of employment.
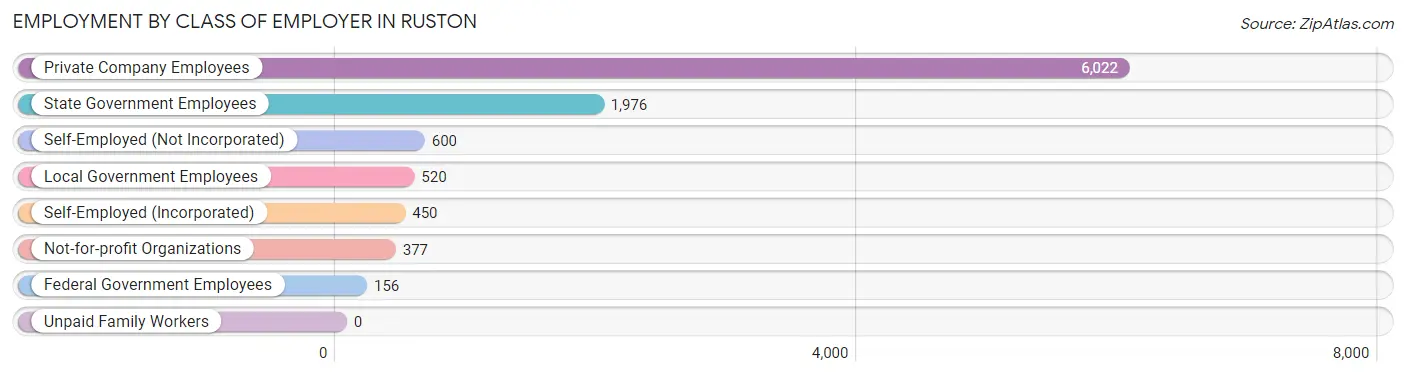
| Employer Class | # Employees | % Employees |
| Private Company Employees | 6,022 | 59.6% |
| Self-Employed (Incorporated) | 450 | 4.5% |
| Self-Employed (Not Incorporated) | 600 | 5.9% |
| Not-for-profit Organizations | 377 | 3.7% |
| Local Government Employees | 520 | 5.1% |
| State Government Employees | 1,976 | 19.6% |
| Federal Government Employees | 156 | 1.5% |
| Unpaid Family Workers | 0 | 0.0% |
| Total | 10,101 | 100.0% |
Employment Status by Age in Ruston
According to the labor force statistics for Ruston, out of the total population over 16 years of age (19,186), 55.3% or 10,610 individuals are in the labor force, with 3.1% or 329 of them unemployed. The age group with the highest labor force participation rate is 25 to 29 years, with 82.6% or 1,374 individuals in the labor force. Within the labor force, the 16 to 19 years age range has the highest percentage of unemployed individuals, with 9.3% or 69 of them being unemployed.
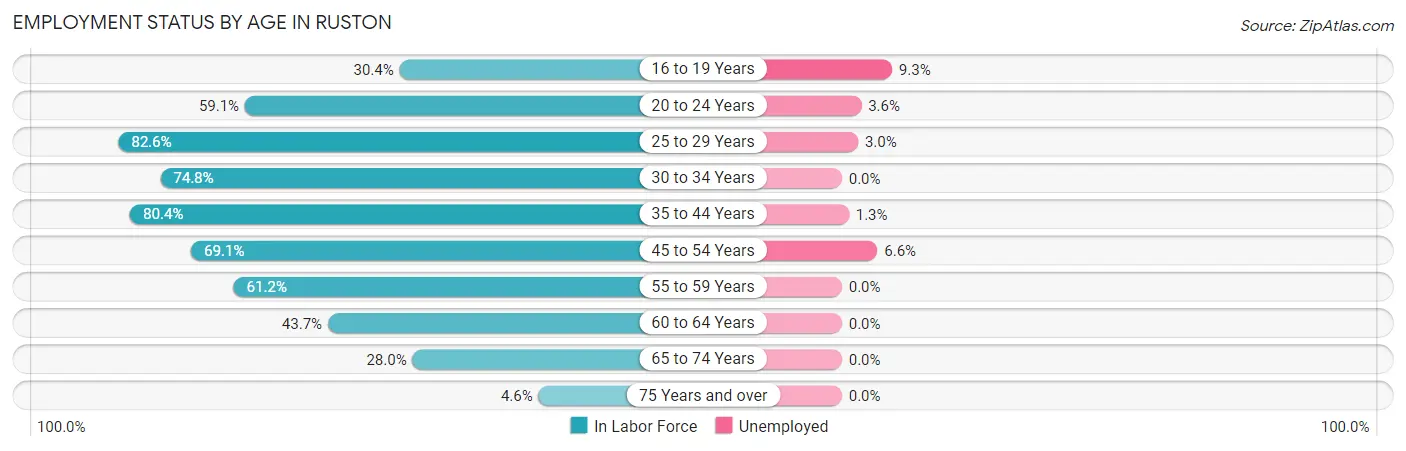
| Age Bracket | In Labor Force | Unemployed |
| 16 to 19 Years | 744 (30.4%) | 69 (9.3%) |
| 20 to 24 Years | 3,847 (59.1%) | 138 (3.6%) |
| 25 to 29 Years | 1,374 (82.6%) | 41 (3.0%) |
| 30 to 34 Years | 859 (74.8%) | 0 (0.0%) |
| 35 to 44 Years | 1,521 (80.4%) | 20 (1.3%) |
| 45 to 54 Years | 983 (69.1%) | 65 (6.6%) |
| 55 to 59 Years | 422 (61.2%) | 0 (0.0%) |
| 60 to 64 Years | 403 (43.7%) | 0 (0.0%) |
| 65 to 74 Years | 395 (28.0%) | 0 (0.0%) |
| 75 Years and over | 50 (4.6%) | 0 (0.0%) |
| Total | 10,610 (55.3%) | 329 (3.1%) |
Employment Status by Educational Attainment in Ruston
According to labor force statistics for Ruston, 71.9% of individuals (5,564) out of the total population between 25 and 64 years of age (7,739) are in the labor force, with 2.3% or 128 of them being unemployed. The group with the highest labor force participation rate are those with the educational attainment of bachelor's degree or higher, with 83.3% or 2,646 individuals in the labor force. Within the labor force, individuals with college / associate degree education have the highest percentage of unemployment, with 6.6% or 97 of them being unemployed.
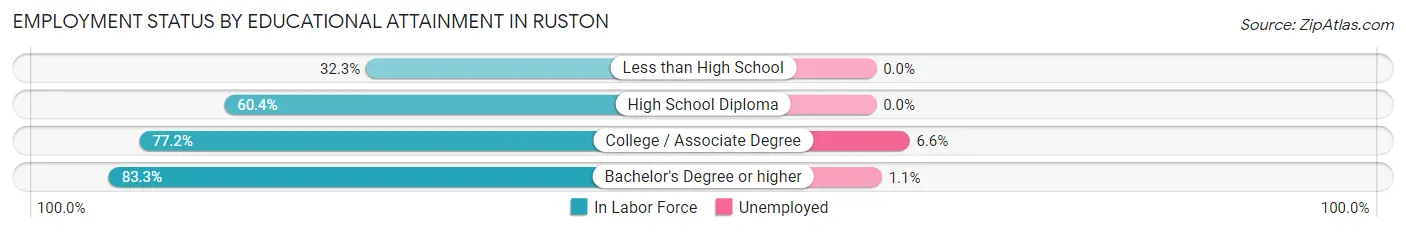
| Educational Attainment | In Labor Force | Unemployed |
| Less than High School | 186 (32.3%) | 0 (0.0%) |
| High School Diploma | 1,258 (60.4%) | 0 (0.0%) |
| College / Associate Degree | 1,470 (77.2%) | 126 (6.6%) |
| Bachelor's Degree or higher | 2,646 (83.3%) | 35 (1.1%) |
| Total | 5,564 (71.9%) | 178 (2.3%) |
Employment Occupations by Sex in Ruston
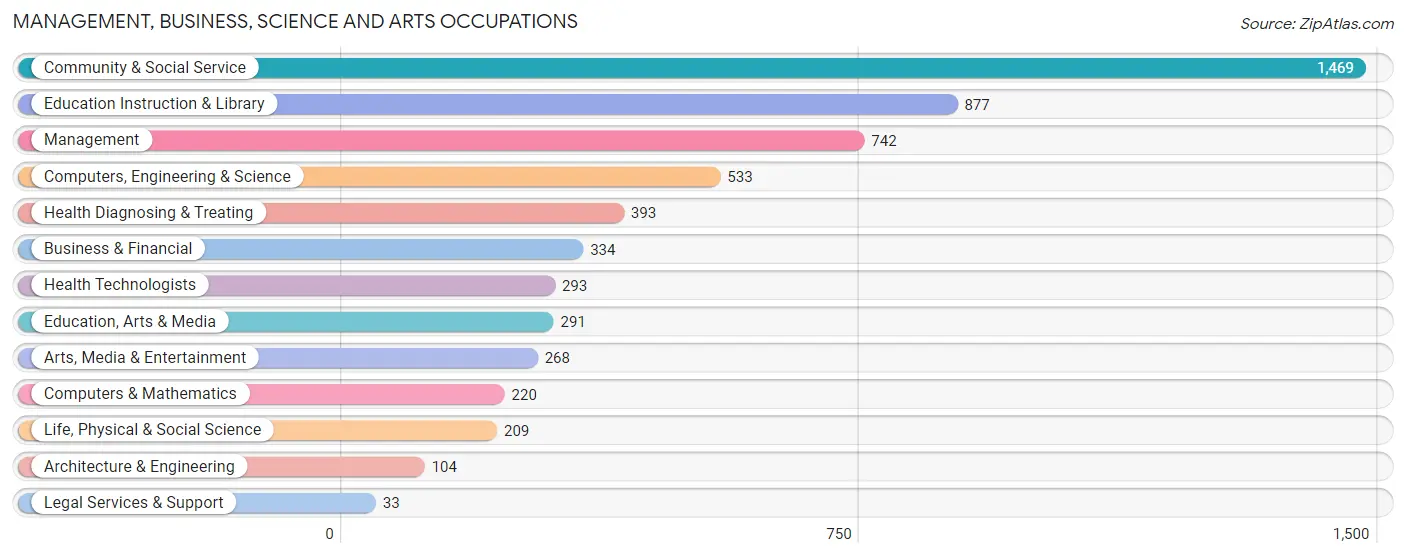
Management, Business, Science and Arts Occupations
The most common Management, Business, Science and Arts occupations in Ruston are Community & Social Service (1,469 | 14.4%), Education Instruction & Library (877 | 8.6%), Management (742 | 7.3%), Computers, Engineering & Science (533 | 5.2%), and Health Diagnosing & Treating (393 | 3.8%).
Management, Business, Science and Arts Occupations by Sex
Within the Management, Business, Science and Arts occupations in Ruston, the most male-oriented occupations are Architecture & Engineering (93.3%), Computers & Mathematics (92.7%), and Arts, Media & Entertainment (82.8%), while the most female-oriented occupations are Life, Physical & Social Science (89.9%), Education, Arts & Media (87.6%), and Legal Services & Support (81.8%).
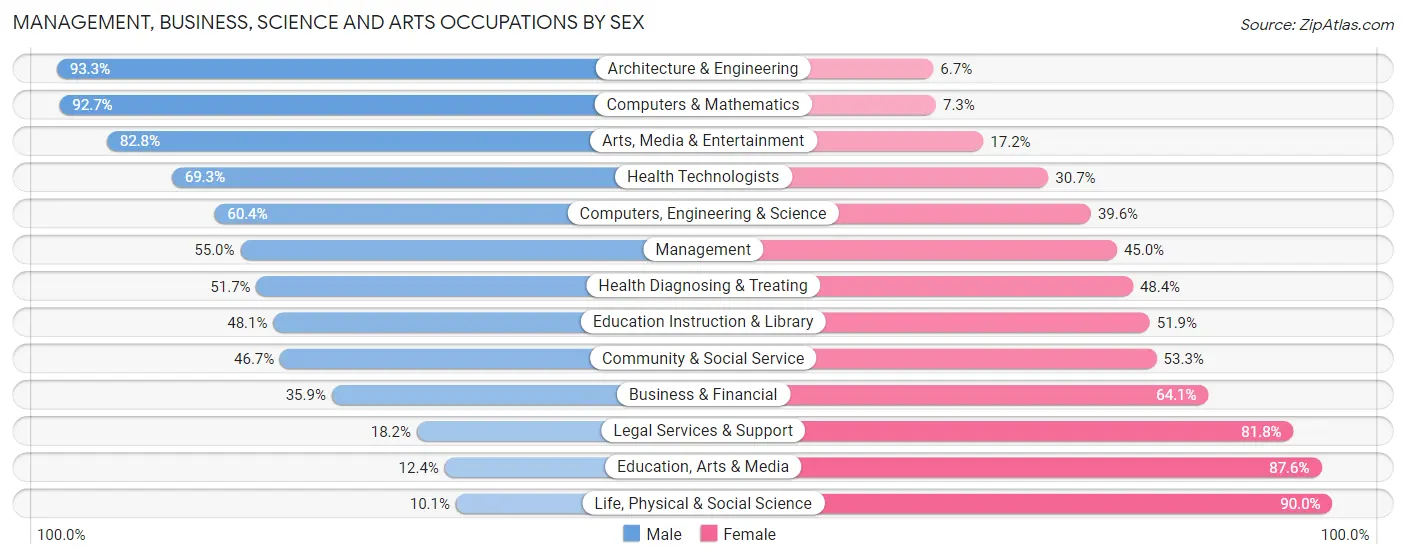
| Occupation | Male | Female |
| Management | 408 (55.0%) | 334 (45.0%) |
| Business & Financial | 120 (35.9%) | 214 (64.1%) |
| Computers, Engineering & Science | 322 (60.4%) | 211 (39.6%) |
| Computers & Mathematics | 204 (92.7%) | 16 (7.3%) |
| Architecture & Engineering | 97 (93.3%) | 7 (6.7%) |
| Life, Physical & Social Science | 21 (10.1%) | 188 (89.9%) |
| Community & Social Service | 686 (46.7%) | 783 (53.3%) |
| Education, Arts & Media | 36 (12.4%) | 255 (87.6%) |
| Legal Services & Support | 6 (18.2%) | 27 (81.8%) |
| Education Instruction & Library | 422 (48.1%) | 455 (51.9%) |
| Arts, Media & Entertainment | 222 (82.8%) | 46 (17.2%) |
| Health Diagnosing & Treating | 203 (51.6%) | 190 (48.3%) |
| Health Technologists | 203 (69.3%) | 90 (30.7%) |
| Total (Category) | 1,739 (50.1%) | 1,732 (49.9%) |
| Total (Overall) | 4,980 (48.7%) | 5,236 (51.2%) |
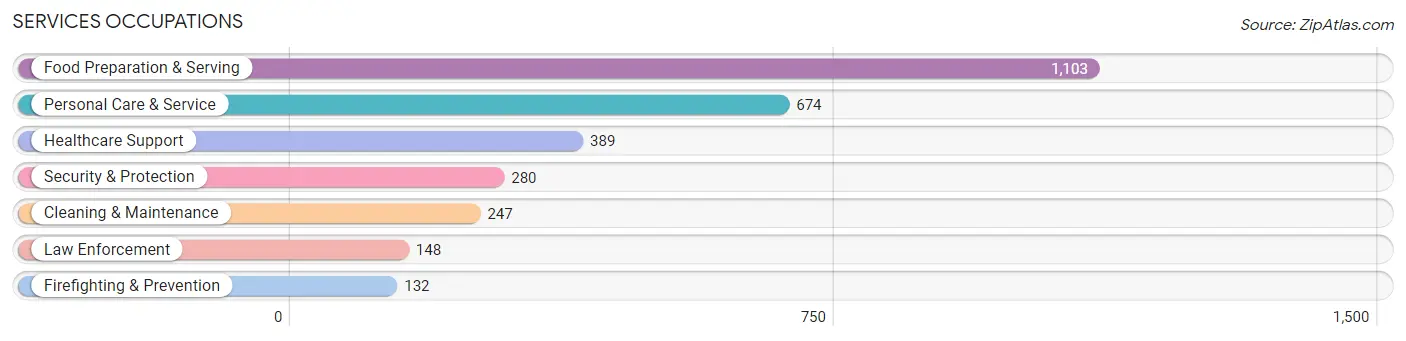
Services Occupations
The most common Services occupations in Ruston are Food Preparation & Serving (1,103 | 10.8%), Personal Care & Service (674 | 6.6%), Healthcare Support (389 | 3.8%), Security & Protection (280 | 2.7%), and Cleaning & Maintenance (247 | 2.4%).
Services Occupations by Sex
Within the Services occupations in Ruston, the most male-oriented occupations are Healthcare Support (60.4%), Cleaning & Maintenance (52.6%), and Food Preparation & Serving (52.2%), while the most female-oriented occupations are Firefighting & Prevention (72.0%), Personal Care & Service (65.4%), and Security & Protection (59.6%).
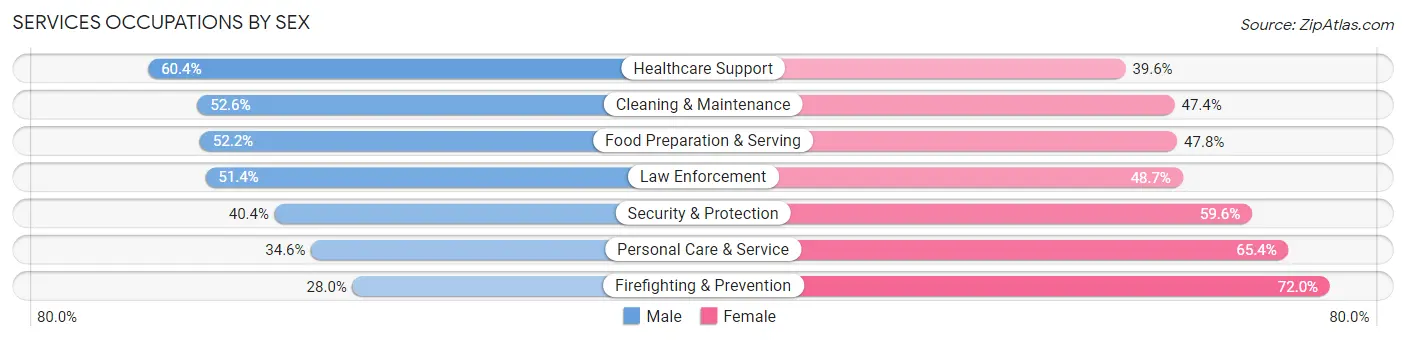
| Occupation | Male | Female |
| Healthcare Support | 235 (60.4%) | 154 (39.6%) |
| Security & Protection | 113 (40.4%) | 167 (59.6%) |
| Firefighting & Prevention | 37 (28.0%) | 95 (72.0%) |
| Law Enforcement | 76 (51.3%) | 72 (48.6%) |
| Food Preparation & Serving | 576 (52.2%) | 527 (47.8%) |
| Cleaning & Maintenance | 130 (52.6%) | 117 (47.4%) |
| Personal Care & Service | 233 (34.6%) | 441 (65.4%) |
| Total (Category) | 1,287 (47.8%) | 1,406 (52.2%) |
| Total (Overall) | 4,980 (48.7%) | 5,236 (51.2%) |
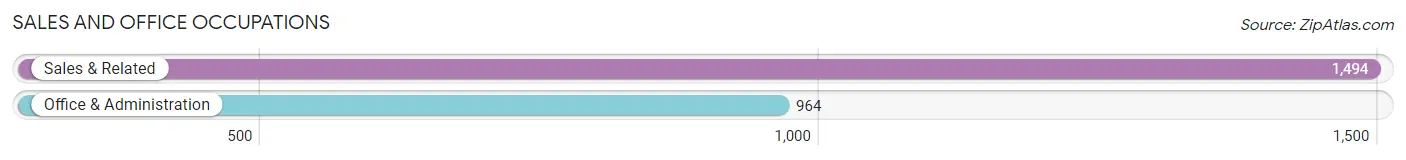
Sales and Office Occupations
The most common Sales and Office occupations in Ruston are Sales & Related (1,494 | 14.6%), and Office & Administration (964 | 9.4%).
Sales and Office Occupations by Sex
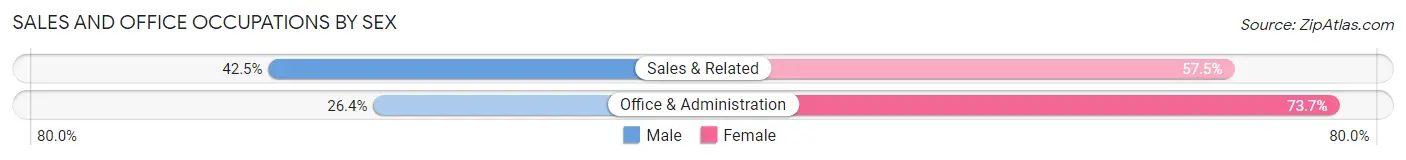
| Occupation | Male | Female |
| Sales & Related | 635 (42.5%) | 859 (57.5%) |
| Office & Administration | 254 (26.4%) | 710 (73.7%) |
| Total (Category) | 889 (36.2%) | 1,569 (63.8%) |
| Total (Overall) | 4,980 (48.7%) | 5,236 (51.2%) |
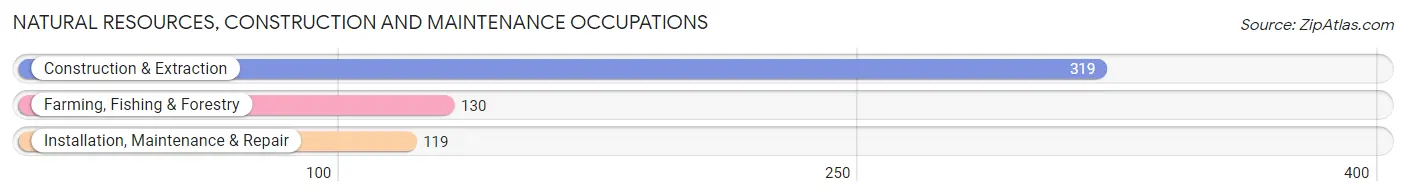
Natural Resources, Construction and Maintenance Occupations
The most common Natural Resources, Construction and Maintenance occupations in Ruston are Construction & Extraction (319 | 3.1%), Farming, Fishing & Forestry (130 | 1.3%), and Installation, Maintenance & Repair (119 | 1.2%).
Natural Resources, Construction and Maintenance Occupations by Sex
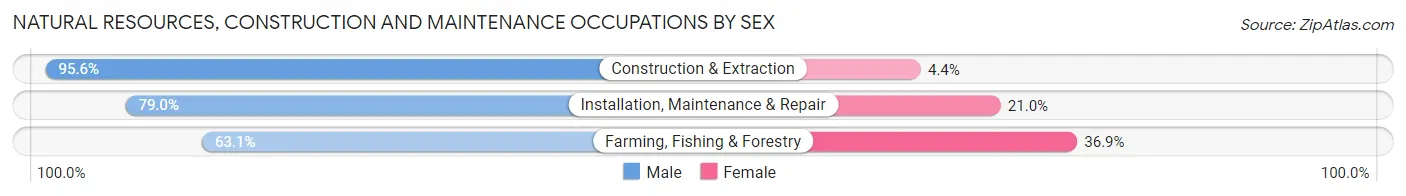
| Occupation | Male | Female |
| Farming, Fishing & Forestry | 82 (63.1%) | 48 (36.9%) |
| Construction & Extraction | 305 (95.6%) | 14 (4.4%) |
| Installation, Maintenance & Repair | 94 (79.0%) | 25 (21.0%) |
| Total (Category) | 481 (84.7%) | 87 (15.3%) |
| Total (Overall) | 4,980 (48.7%) | 5,236 (51.2%) |
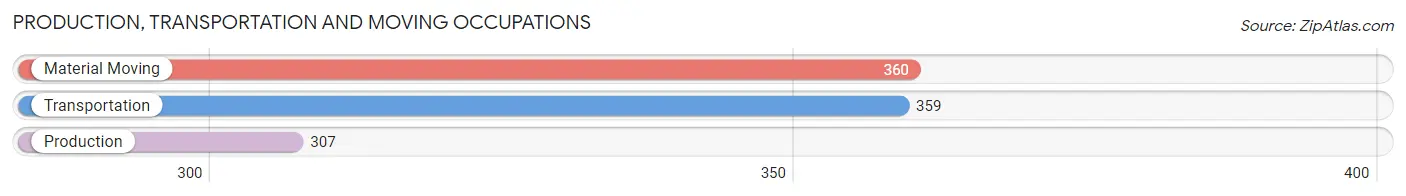
Production, Transportation and Moving Occupations
The most common Production, Transportation and Moving occupations in Ruston are Material Moving (360 | 3.5%), Transportation (359 | 3.5%), and Production (307 | 3.0%).
Production, Transportation and Moving Occupations by Sex
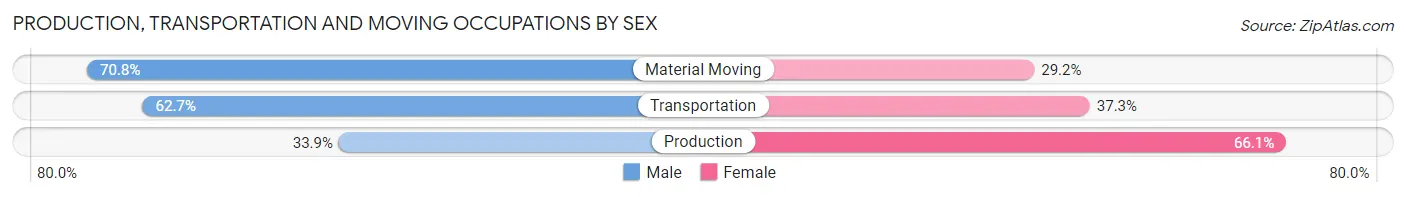
| Occupation | Male | Female |
| Production | 104 (33.9%) | 203 (66.1%) |
| Transportation | 225 (62.7%) | 134 (37.3%) |
| Material Moving | 255 (70.8%) | 105 (29.2%) |
| Total (Category) | 584 (56.9%) | 442 (43.1%) |
| Total (Overall) | 4,980 (48.7%) | 5,236 (51.2%) |
Employment Industries by Sex in Ruston
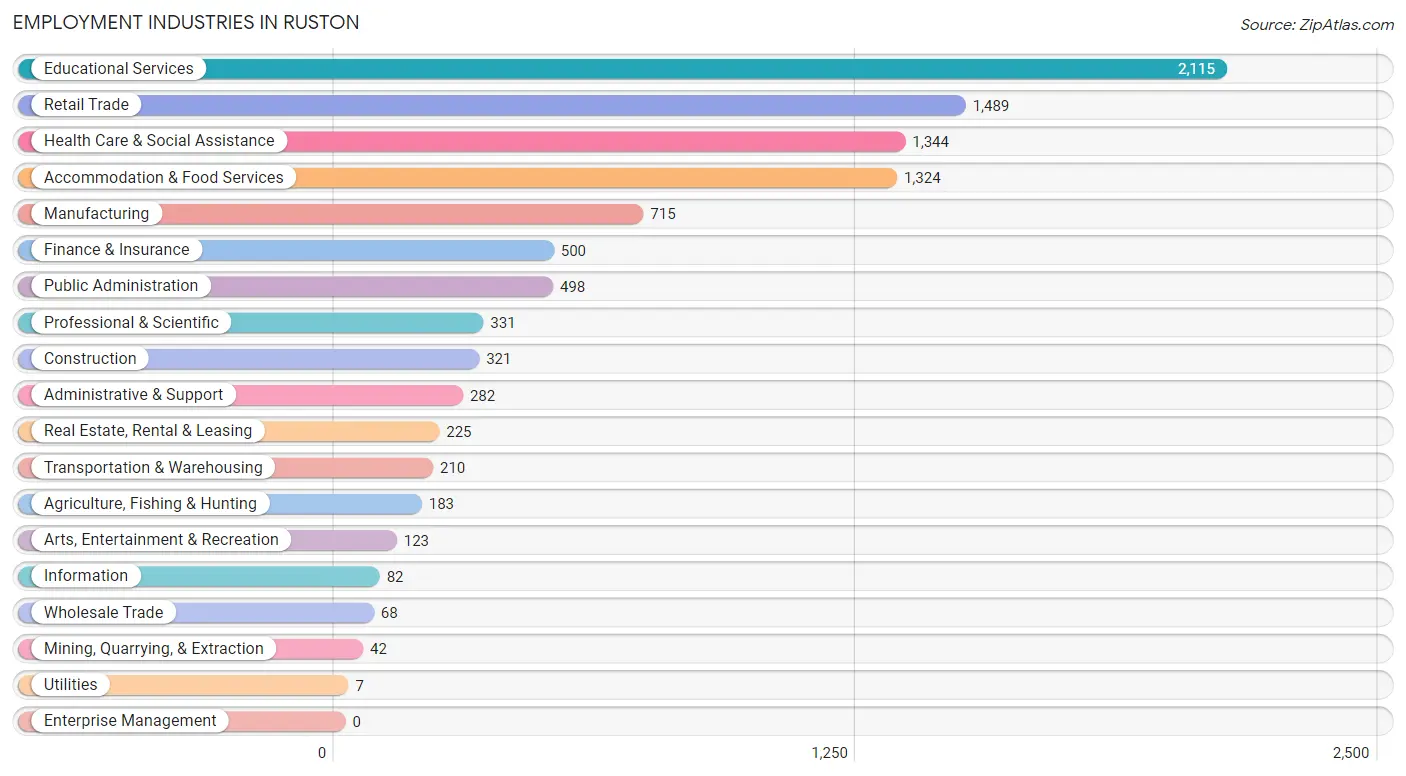
Employment Industries in Ruston
The major employment industries in Ruston include Educational Services (2,115 | 20.7%), Retail Trade (1,489 | 14.6%), Health Care & Social Assistance (1,344 | 13.2%), Accommodation & Food Services (1,324 | 13.0%), and Manufacturing (715 | 7.0%).
Employment Industries by Sex in Ruston
The Ruston industries that see more men than women are Mining, Quarrying, & Extraction (100.0%), Utilities (100.0%), and Transportation & Warehousing (86.7%), whereas the industries that tend to have a higher number of women are Finance & Insurance (71.4%), Manufacturing (66.3%), and Health Care & Social Assistance (64.3%).
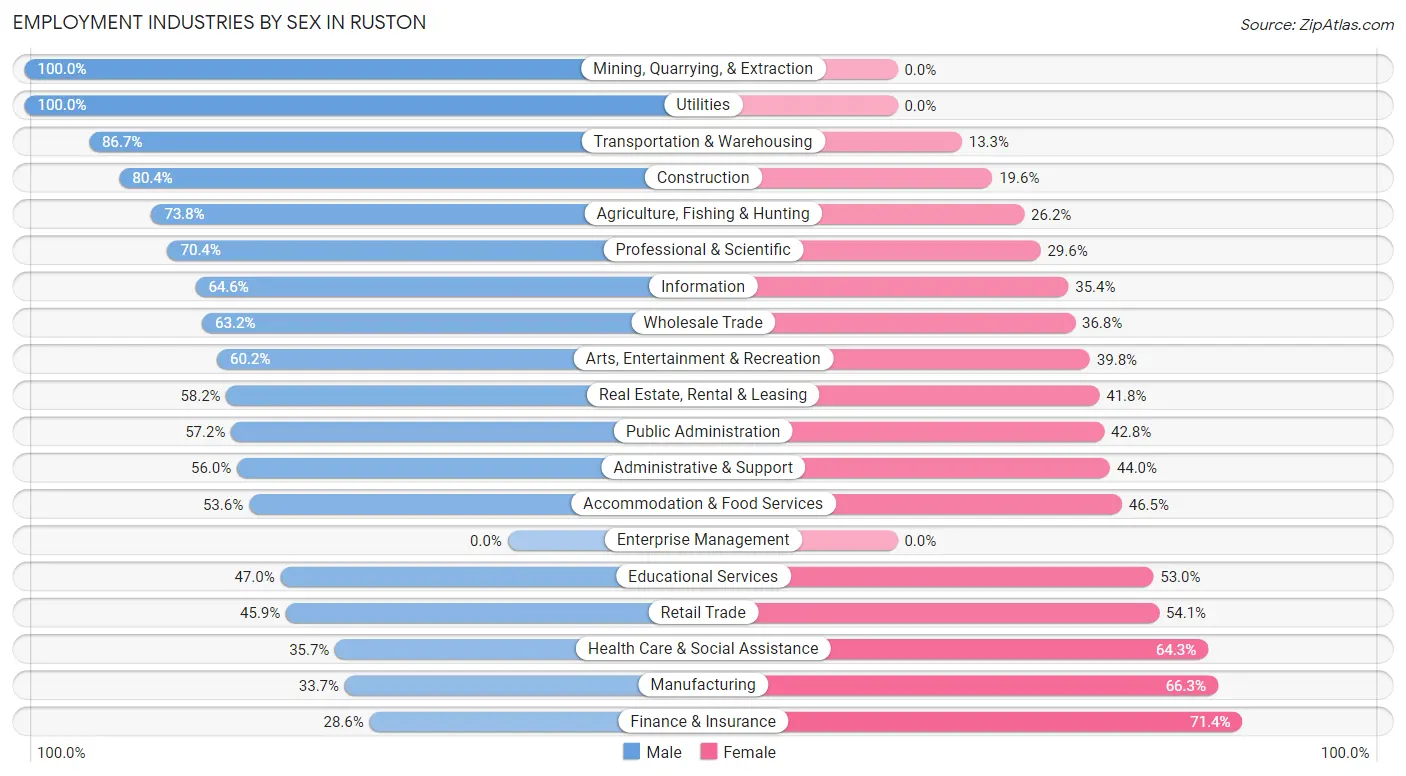
| Industry | Male | Female |
| Agriculture, Fishing & Hunting | 135 (73.8%) | 48 (26.2%) |
| Mining, Quarrying, & Extraction | 42 (100.0%) | 0 (0.0%) |
| Construction | 258 (80.4%) | 63 (19.6%) |
| Manufacturing | 241 (33.7%) | 474 (66.3%) |
| Wholesale Trade | 43 (63.2%) | 25 (36.8%) |
| Retail Trade | 683 (45.9%) | 806 (54.1%) |
| Transportation & Warehousing | 182 (86.7%) | 28 (13.3%) |
| Utilities | 7 (100.0%) | 0 (0.0%) |
| Information | 53 (64.6%) | 29 (35.4%) |
| Finance & Insurance | 143 (28.6%) | 357 (71.4%) |
| Real Estate, Rental & Leasing | 131 (58.2%) | 94 (41.8%) |
| Professional & Scientific | 233 (70.4%) | 98 (29.6%) |
| Enterprise Management | 0 (0.0%) | 0 (0.0%) |
| Administrative & Support | 158 (56.0%) | 124 (44.0%) |
| Educational Services | 995 (47.0%) | 1,120 (53.0%) |
| Health Care & Social Assistance | 480 (35.7%) | 864 (64.3%) |
| Arts, Entertainment & Recreation | 74 (60.2%) | 49 (39.8%) |
| Accommodation & Food Services | 709 (53.5%) | 615 (46.5%) |
| Public Administration | 285 (57.2%) | 213 (42.8%) |
| Total | 4,980 (48.7%) | 5,236 (51.2%) |
Education in Ruston
School Enrollment in Ruston
The most common levels of schooling among the 9,430 students in Ruston are college / undergraduate (6,365 | 67.5%), high school (719 | 7.6%), and elementary school (694 | 7.4%).
| School Level | # Students | % Students |
| Nursery / Preschool | 302 | 3.2% |
| Kindergarten | 251 | 2.7% |
| Elementary School | 694 | 7.4% |
| Middle School | 493 | 5.2% |
| High School | 719 | 7.6% |
| College / Undergraduate | 6,365 | 67.5% |
| Graduate / Professional | 606 | 6.4% |
| Total | 9,430 | 100.0% |
School Enrollment by Age by Funding Source in Ruston
Out of a total of 9,430 students who are enrolled in schools in Ruston, 481 (5.1%) attend a private institution, while the remaining 8,949 (94.9%) are enrolled in public schools. The age group of 15 to 17 year olds has the highest likelihood of being enrolled in private schools, with 77 (17.5% in the age bracket) enrolled. Conversely, the age group of 18 to 19 year olds has the lowest likelihood of being enrolled in a private school, with 1,993 (99.5% in the age bracket) attending a public institution.
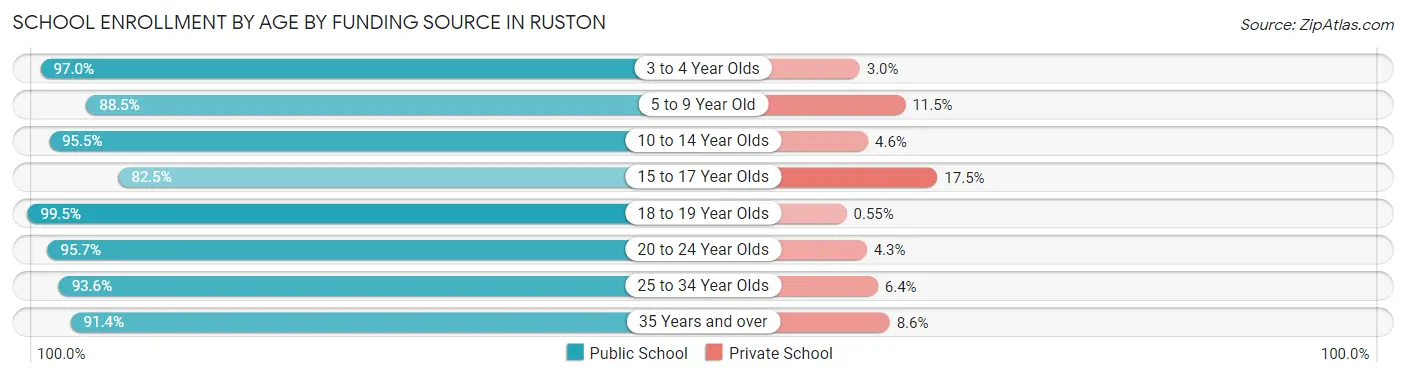
| Age Bracket | Public School | Private School |
| 3 to 4 Year Olds | 259 (97.0%) | 8 (3.0%) |
| 5 to 9 Year Old | 823 (88.5%) | 107 (11.5%) |
| 10 to 14 Year Olds | 672 (95.5%) | 32 (4.5%) |
| 15 to 17 Year Olds | 364 (82.5%) | 77 (17.5%) |
| 18 to 19 Year Olds | 1,993 (99.5%) | 11 (0.5%) |
| 20 to 24 Year Olds | 3,907 (95.7%) | 175 (4.3%) |
| 25 to 34 Year Olds | 589 (93.6%) | 40 (6.4%) |
| 35 Years and over | 341 (91.4%) | 32 (8.6%) |
| Total | 8,949 (94.9%) | 481 (5.1%) |
Educational Attainment by Field of Study in Ruston
Education (866 | 18.9%), business (689 | 15.0%), arts & humanities (670 | 14.6%), science & technology (400 | 8.7%), and liberal arts & history (304 | 6.6%) are the most common fields of study among 4,595 individuals in Ruston who have obtained a bachelor's degree or higher.
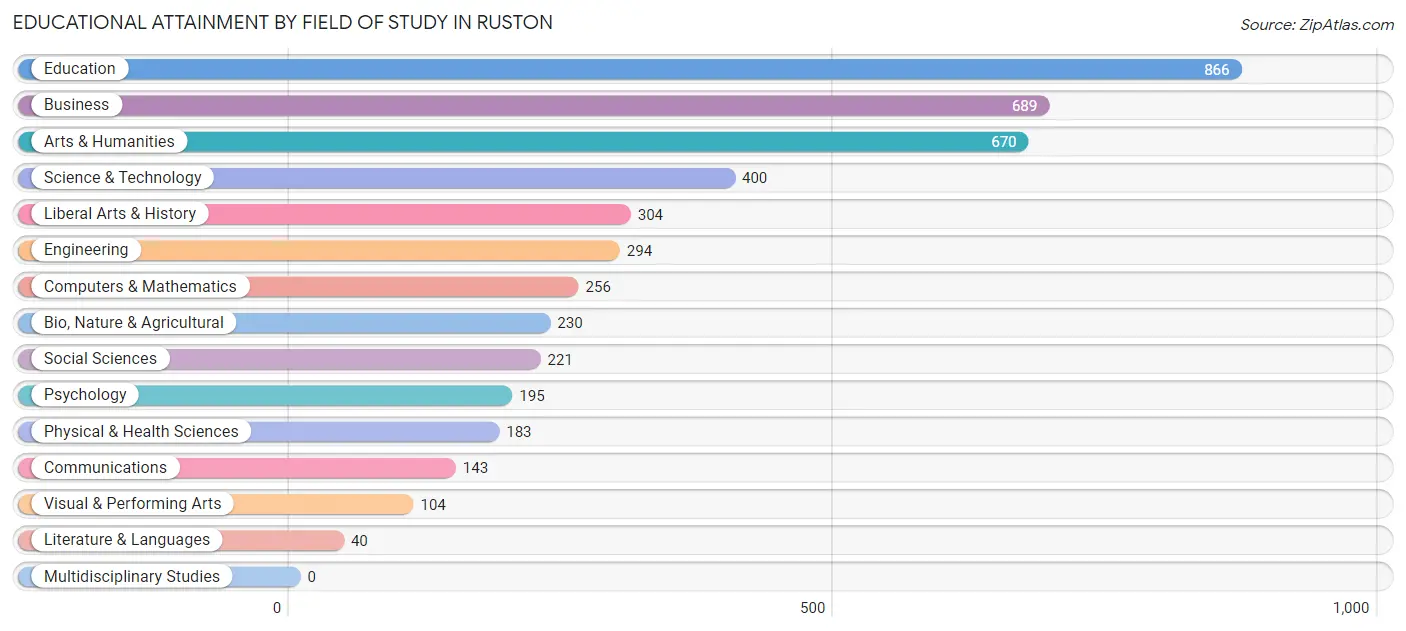
| Field of Study | # Graduates | % Graduates |
| Computers & Mathematics | 256 | 5.6% |
| Bio, Nature & Agricultural | 230 | 5.0% |
| Physical & Health Sciences | 183 | 4.0% |
| Psychology | 195 | 4.2% |
| Social Sciences | 221 | 4.8% |
| Engineering | 294 | 6.4% |
| Multidisciplinary Studies | 0 | 0.0% |
| Science & Technology | 400 | 8.7% |
| Business | 689 | 15.0% |
| Education | 866 | 18.9% |
| Literature & Languages | 40 | 0.9% |
| Liberal Arts & History | 304 | 6.6% |
| Visual & Performing Arts | 104 | 2.3% |
| Communications | 143 | 3.1% |
| Arts & Humanities | 670 | 14.6% |
| Total | 4,595 | 100.0% |
Transportation & Commute in Ruston
Vehicle Availability by Sex in Ruston
The most prevalent vehicle ownership categories in Ruston are males with 2 vehicles (1,740, accounting for 39.2%) and females with 2 vehicles (1,707, making up 36.8%).
| Vehicles Available | Male | Female |
| No Vehicle | 385 (8.7%) | 335 (7.1%) |
| 1 Vehicle | 1,073 (24.2%) | 1,198 (25.4%) |
| 2 Vehicles | 1,740 (39.2%) | 1,707 (36.1%) |
| 3 Vehicles | 821 (18.5%) | 1,085 (23.0%) |
| 4 Vehicles | 274 (6.2%) | 294 (6.2%) |
| 5 or more Vehicles | 149 (3.4%) | 103 (2.2%) |
| Total | 4,442 (100.0%) | 4,722 (100.0%) |
Commute Time in Ruston
The most frequently occuring commute durations in Ruston are 5 to 9 minutes (2,817 commuters, 31.8%), 10 to 14 minutes (2,447 commuters, 27.6%), and 15 to 19 minutes (1,264 commuters, 14.3%).
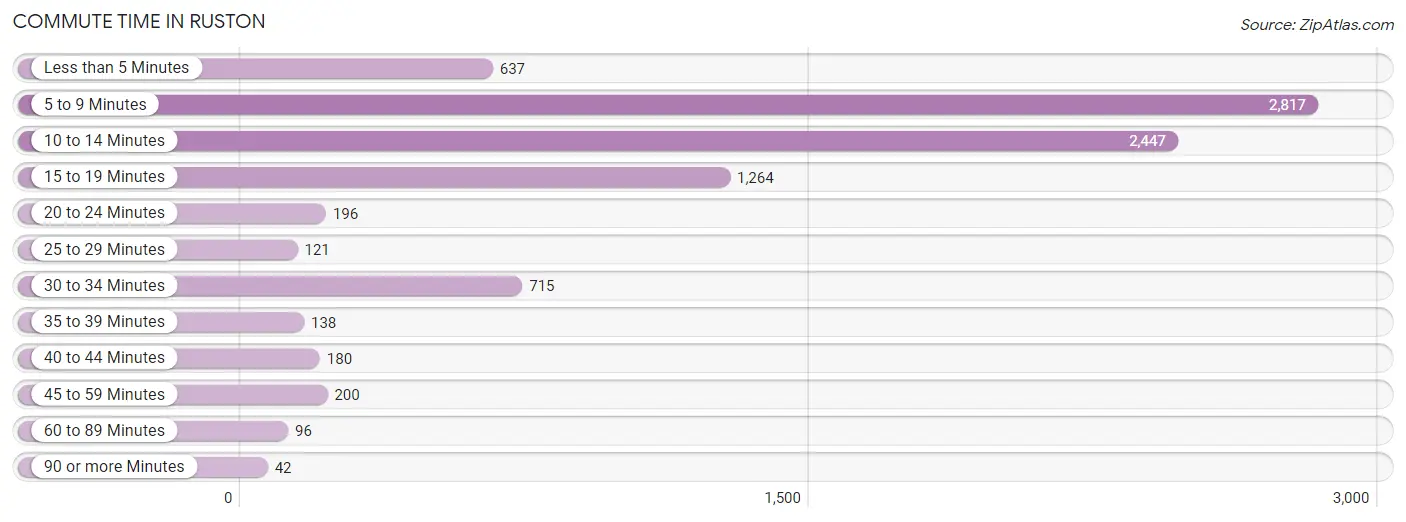
| Commute Time | # Commuters | % Commuters |
| Less than 5 Minutes | 637 | 7.2% |
| 5 to 9 Minutes | 2,817 | 31.8% |
| 10 to 14 Minutes | 2,447 | 27.6% |
| 15 to 19 Minutes | 1,264 | 14.3% |
| 20 to 24 Minutes | 196 | 2.2% |
| 25 to 29 Minutes | 121 | 1.4% |
| 30 to 34 Minutes | 715 | 8.1% |
| 35 to 39 Minutes | 138 | 1.6% |
| 40 to 44 Minutes | 180 | 2.0% |
| 45 to 59 Minutes | 200 | 2.3% |
| 60 to 89 Minutes | 96 | 1.1% |
| 90 or more Minutes | 42 | 0.5% |
Commute Time by Sex in Ruston
The most common commute times in Ruston are 10 to 14 minutes (1,388 commuters, 32.1%) for males and 5 to 9 minutes (1,579 commuters, 34.9%) for females.
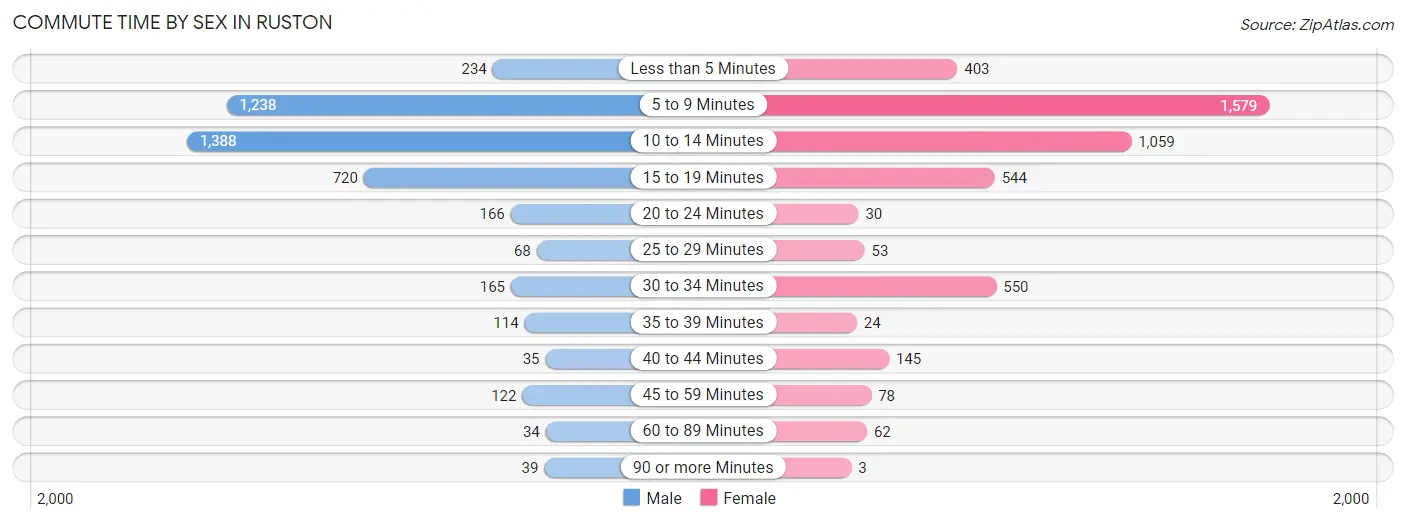
| Commute Time | Male | Female |
| Less than 5 Minutes | 234 (5.4%) | 403 (8.9%) |
| 5 to 9 Minutes | 1,238 (28.6%) | 1,579 (34.9%) |
| 10 to 14 Minutes | 1,388 (32.1%) | 1,059 (23.4%) |
| 15 to 19 Minutes | 720 (16.7%) | 544 (12.0%) |
| 20 to 24 Minutes | 166 (3.8%) | 30 (0.7%) |
| 25 to 29 Minutes | 68 (1.6%) | 53 (1.2%) |
| 30 to 34 Minutes | 165 (3.8%) | 550 (12.1%) |
| 35 to 39 Minutes | 114 (2.6%) | 24 (0.5%) |
| 40 to 44 Minutes | 35 (0.8%) | 145 (3.2%) |
| 45 to 59 Minutes | 122 (2.8%) | 78 (1.7%) |
| 60 to 89 Minutes | 34 (0.8%) | 62 (1.4%) |
| 90 or more Minutes | 39 (0.9%) | 3 (0.1%) |
Time of Departure to Work by Sex in Ruston
The most frequent times of departure to work in Ruston are 7:00 AM to 7:29 AM (655, 15.1%) for males and 4:00 PM to 11:59 PM (709, 15.7%) for females.
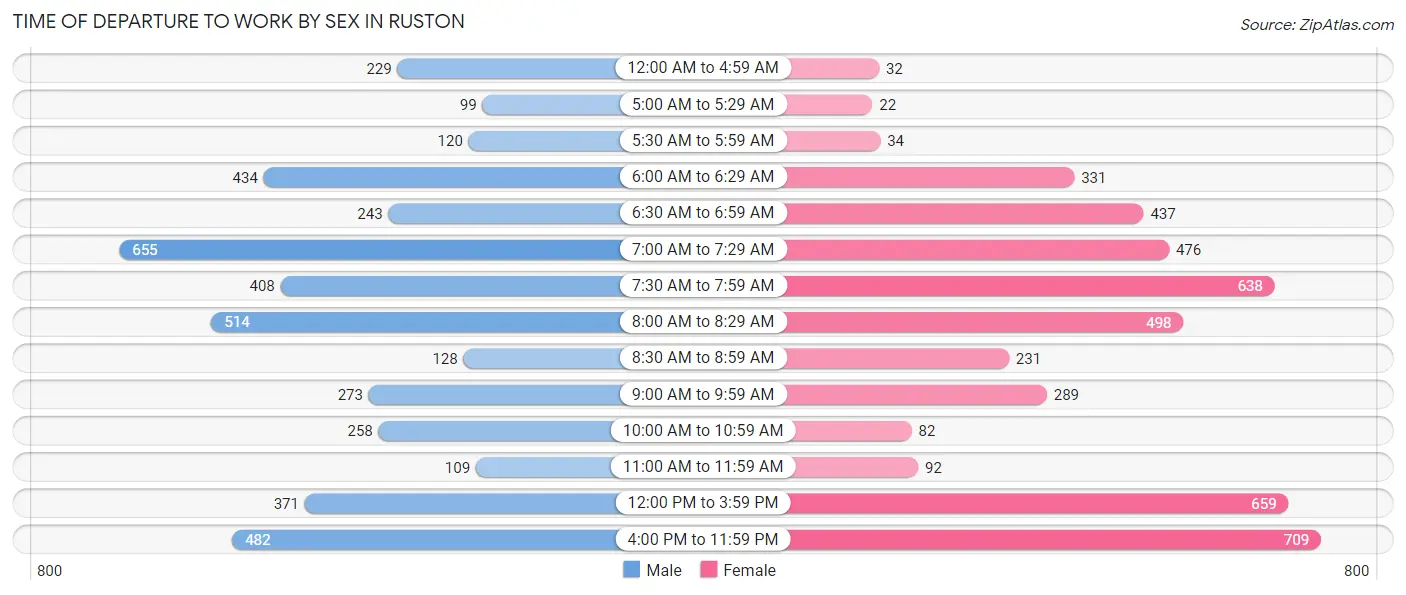
| Time of Departure | Male | Female |
| 12:00 AM to 4:59 AM | 229 (5.3%) | 32 (0.7%) |
| 5:00 AM to 5:29 AM | 99 (2.3%) | 22 (0.5%) |
| 5:30 AM to 5:59 AM | 120 (2.8%) | 34 (0.7%) |
| 6:00 AM to 6:29 AM | 434 (10.0%) | 331 (7.3%) |
| 6:30 AM to 6:59 AM | 243 (5.6%) | 437 (9.7%) |
| 7:00 AM to 7:29 AM | 655 (15.1%) | 476 (10.5%) |
| 7:30 AM to 7:59 AM | 408 (9.4%) | 638 (14.1%) |
| 8:00 AM to 8:29 AM | 514 (11.9%) | 498 (11.0%) |
| 8:30 AM to 8:59 AM | 128 (3.0%) | 231 (5.1%) |
| 9:00 AM to 9:59 AM | 273 (6.3%) | 289 (6.4%) |
| 10:00 AM to 10:59 AM | 258 (6.0%) | 82 (1.8%) |
| 11:00 AM to 11:59 AM | 109 (2.5%) | 92 (2.0%) |
| 12:00 PM to 3:59 PM | 371 (8.6%) | 659 (14.5%) |
| 4:00 PM to 11:59 PM | 482 (11.2%) | 709 (15.7%) |
| Total | 4,323 (100.0%) | 4,530 (100.0%) |
Housing Occupancy in Ruston
Occupancy by Ownership in Ruston
Of the total 8,235 dwellings in Ruston, owner-occupied units account for 2,812 (34.2%), while renter-occupied units make up 5,423 (65.8%).
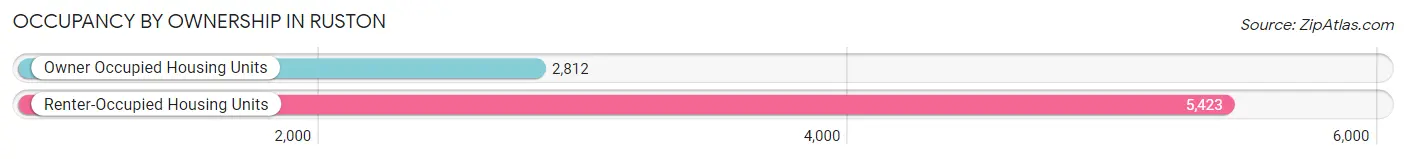
| Occupancy | # Housing Units | % Housing Units |
| Owner Occupied Housing Units | 2,812 | 34.2% |
| Renter-Occupied Housing Units | 5,423 | 65.8% |
| Total Occupied Housing Units | 8,235 | 100.0% |
Occupancy by Household Size in Ruston
| Household Size | # Housing Units | % Housing Units |
| 1-Person Household | 2,608 | 31.7% |
| 2-Person Household | 3,264 | 39.6% |
| 3-Person Household | 1,462 | 17.7% |
| 4+ Person Household | 901 | 10.9% |
| Total Housing Units | 8,235 | 100.0% |
Occupancy by Ownership by Household Size in Ruston
| Household Size | Owner-occupied | Renter-occupied |
| 1-Person Household | 646 (24.8%) | 1,962 (75.2%) |
| 2-Person Household | 1,200 (36.8%) | 2,064 (63.2%) |
| 3-Person Household | 566 (38.7%) | 896 (61.3%) |
| 4+ Person Household | 400 (44.4%) | 501 (55.6%) |
| Total Housing Units | 2,812 (34.2%) | 5,423 (65.8%) |
Occupancy by Educational Attainment in Ruston
| Household Size | Owner-occupied | Renter-occupied |
| Less than High School | 80 (19.2%) | 337 (80.8%) |
| High School Diploma | 576 (35.4%) | 1,052 (64.6%) |
| College/Associate Degree | 512 (15.8%) | 2,728 (84.2%) |
| Bachelor's Degree or higher | 1,644 (55.7%) | 1,306 (44.3%) |
Occupancy by Age of Householder in Ruston
| Age Bracket | # Households | % Households |
| Under 35 Years | 3,755 | 45.6% |
| 35 to 44 Years | 1,039 | 12.6% |
| 45 to 54 Years | 886 | 10.8% |
| 55 to 64 Years | 886 | 10.8% |
| 65 to 74 Years | 969 | 11.8% |
| 75 to 84 Years | 434 | 5.3% |
| 85 Years and Over | 266 | 3.2% |
| Total | 8,235 | 100.0% |
Housing Finances in Ruston
Median Income by Occupancy in Ruston
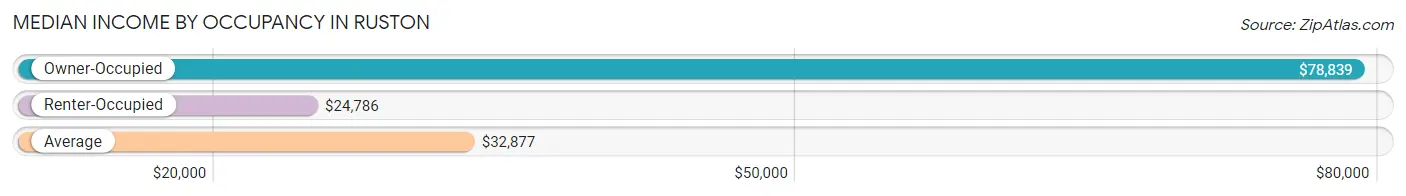
| Occupancy Type | # Households | Median Income |
| Owner-Occupied | 2,812 (34.2%) | $78,839 |
| Renter-Occupied | 5,423 (65.8%) | $24,786 |
| Average | 8,235 (100.0%) | $32,877 |
Occupancy by Householder Income Bracket in Ruston
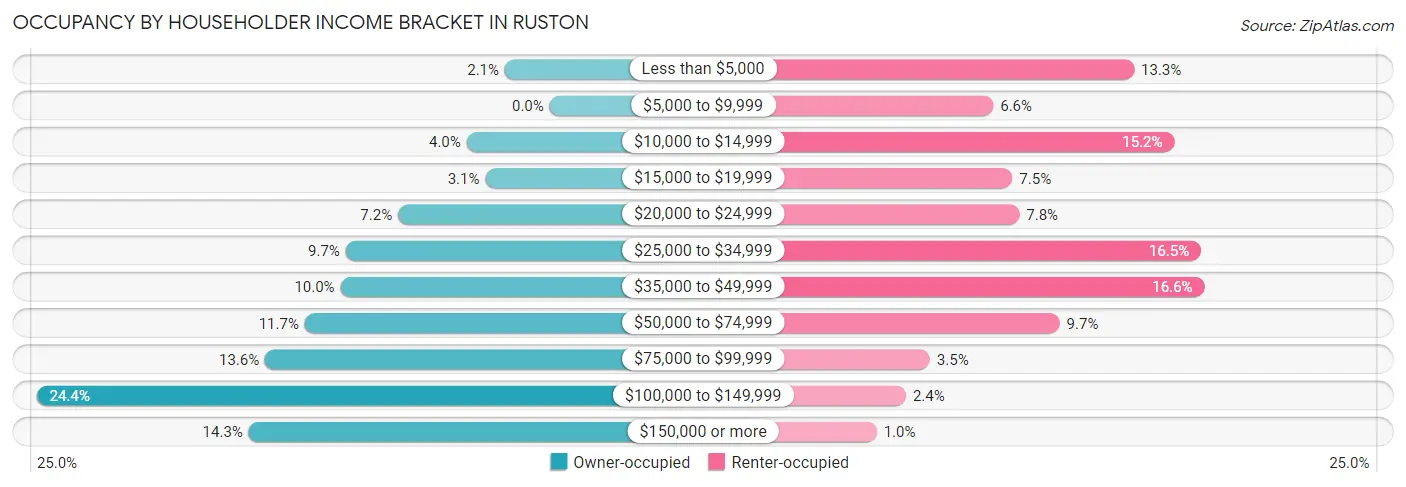
| Income Bracket | Owner-occupied | Renter-occupied |
| Less than $5,000 | 60 (2.1%) | 719 (13.3%) |
| $5,000 to $9,999 | 0 (0.0%) | 356 (6.6%) |
| $10,000 to $14,999 | 111 (4.0%) | 823 (15.2%) |
| $15,000 to $19,999 | 86 (3.1%) | 405 (7.5%) |
| $20,000 to $24,999 | 203 (7.2%) | 423 (7.8%) |
| $25,000 to $34,999 | 273 (9.7%) | 892 (16.5%) |
| $35,000 to $49,999 | 280 (10.0%) | 901 (16.6%) |
| $50,000 to $74,999 | 328 (11.7%) | 527 (9.7%) |
| $75,000 to $99,999 | 381 (13.6%) | 192 (3.5%) |
| $100,000 to $149,999 | 687 (24.4%) | 130 (2.4%) |
| $150,000 or more | 403 (14.3%) | 55 (1.0%) |
| Total | 2,812 (100.0%) | 5,423 (100.0%) |
Monthly Housing Cost Tiers in Ruston
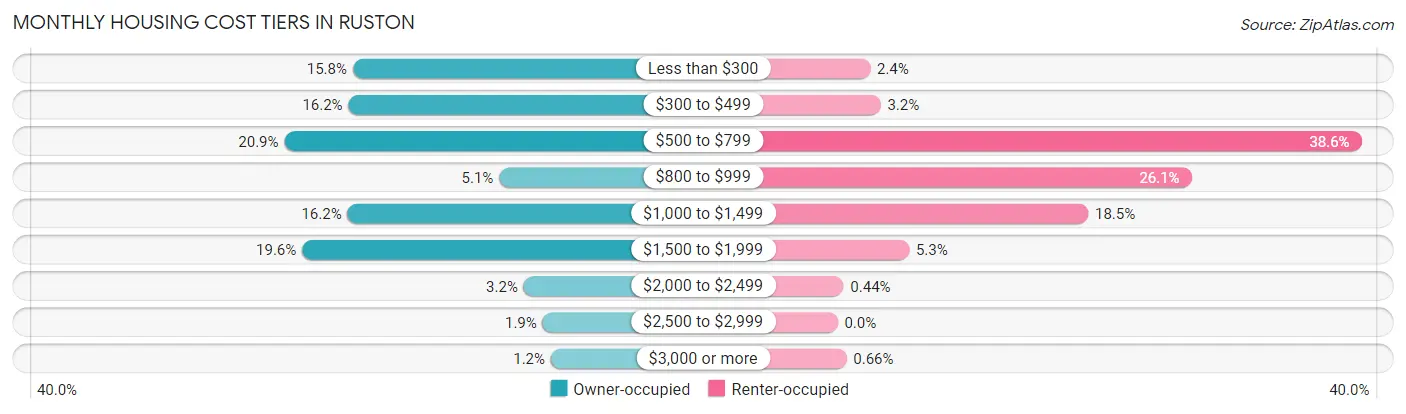
| Monthly Cost | Owner-occupied | Renter-occupied |
| Less than $300 | 445 (15.8%) | 130 (2.4%) |
| $300 to $499 | 454 (16.2%) | 172 (3.2%) |
| $500 to $799 | 587 (20.9%) | 2,093 (38.6%) |
| $800 to $999 | 142 (5.1%) | 1,414 (26.1%) |
| $1,000 to $1,499 | 456 (16.2%) | 1,001 (18.5%) |
| $1,500 to $1,999 | 550 (19.6%) | 286 (5.3%) |
| $2,000 to $2,499 | 91 (3.2%) | 24 (0.4%) |
| $2,500 to $2,999 | 52 (1.8%) | 0 (0.0%) |
| $3,000 or more | 35 (1.2%) | 36 (0.7%) |
| Total | 2,812 (100.0%) | 5,423 (100.0%) |
Physical Housing Characteristics in Ruston
Housing Structures in Ruston
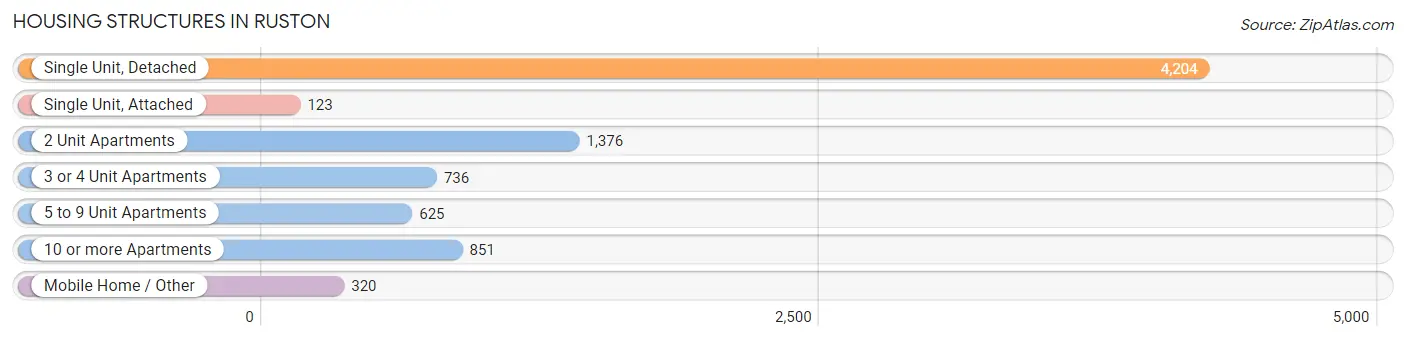
| Structure Type | # Housing Units | % Housing Units |
| Single Unit, Detached | 4,204 | 51.0% |
| Single Unit, Attached | 123 | 1.5% |
| 2 Unit Apartments | 1,376 | 16.7% |
| 3 or 4 Unit Apartments | 736 | 8.9% |
| 5 to 9 Unit Apartments | 625 | 7.6% |
| 10 or more Apartments | 851 | 10.3% |
| Mobile Home / Other | 320 | 3.9% |
| Total | 8,235 | 100.0% |
Housing Structures by Occupancy in Ruston
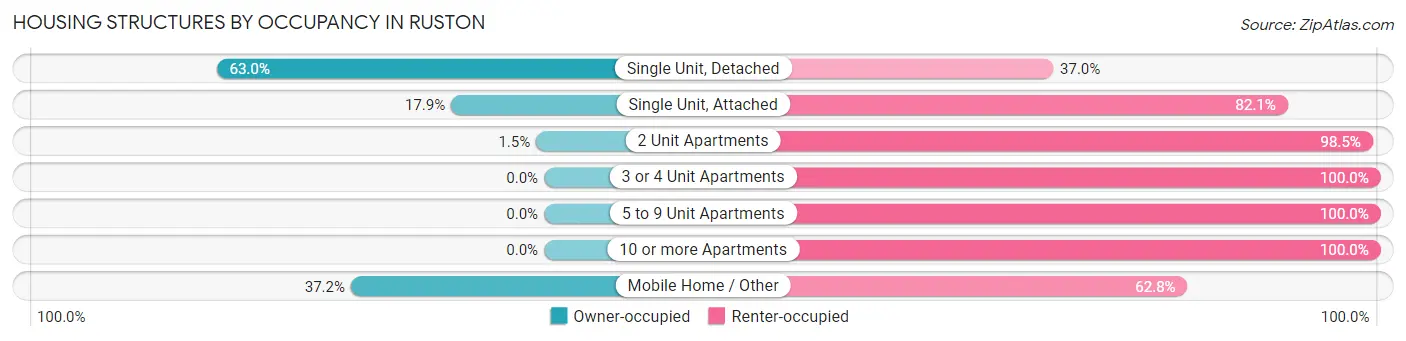
| Structure Type | Owner-occupied | Renter-occupied |
| Single Unit, Detached | 2,650 (63.0%) | 1,554 (37.0%) |
| Single Unit, Attached | 22 (17.9%) | 101 (82.1%) |
| 2 Unit Apartments | 21 (1.5%) | 1,355 (98.5%) |
| 3 or 4 Unit Apartments | 0 (0.0%) | 736 (100.0%) |
| 5 to 9 Unit Apartments | 0 (0.0%) | 625 (100.0%) |
| 10 or more Apartments | 0 (0.0%) | 851 (100.0%) |
| Mobile Home / Other | 119 (37.2%) | 201 (62.8%) |
| Total | 2,812 (34.2%) | 5,423 (65.8%) |
Housing Structures by Number of Rooms in Ruston
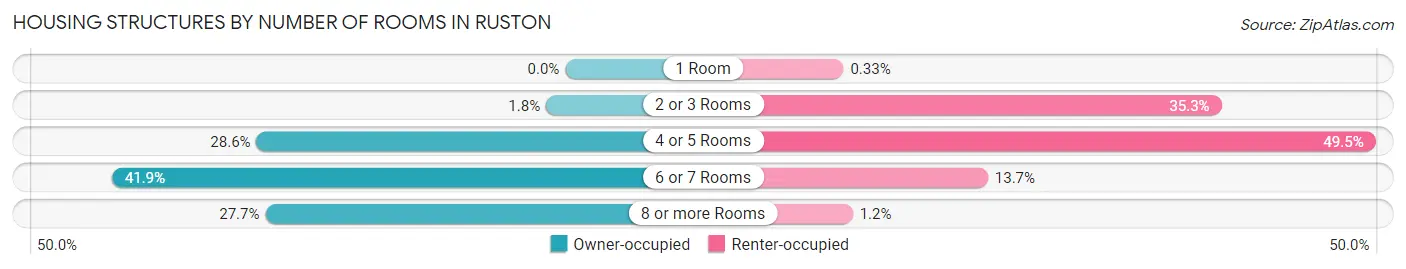
| Number of Rooms | Owner-occupied | Renter-occupied |
| 1 Room | 0 (0.0%) | 18 (0.3%) |
| 2 or 3 Rooms | 50 (1.8%) | 1,913 (35.3%) |
| 4 or 5 Rooms | 803 (28.6%) | 2,686 (49.5%) |
| 6 or 7 Rooms | 1,179 (41.9%) | 742 (13.7%) |
| 8 or more Rooms | 780 (27.7%) | 64 (1.2%) |
| Total | 2,812 (100.0%) | 5,423 (100.0%) |
Housing Structure by Heating Type in Ruston
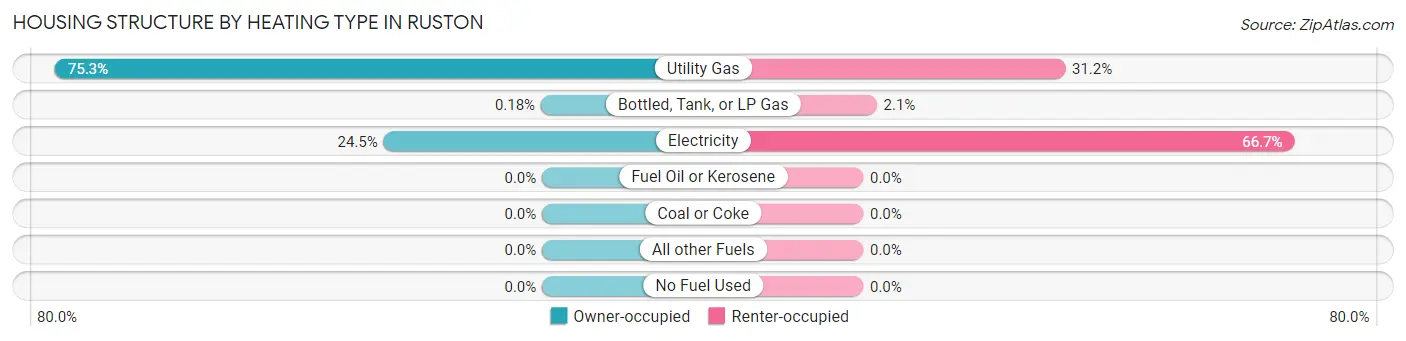
| Heating Type | Owner-occupied | Renter-occupied |
| Utility Gas | 2,118 (75.3%) | 1,693 (31.2%) |
| Bottled, Tank, or LP Gas | 5 (0.2%) | 114 (2.1%) |
| Electricity | 689 (24.5%) | 3,616 (66.7%) |
| Fuel Oil or Kerosene | 0 (0.0%) | 0 (0.0%) |
| Coal or Coke | 0 (0.0%) | 0 (0.0%) |
| All other Fuels | 0 (0.0%) | 0 (0.0%) |
| No Fuel Used | 0 (0.0%) | 0 (0.0%) |
| Total | 2,812 (100.0%) | 5,423 (100.0%) |
Household Vehicle Usage in Ruston
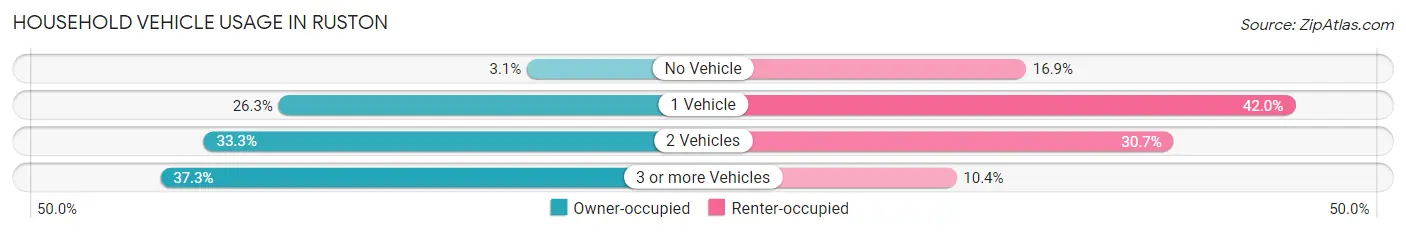
| Vehicles per Household | Owner-occupied | Renter-occupied |
| No Vehicle | 87 (3.1%) | 916 (16.9%) |
| 1 Vehicle | 739 (26.3%) | 2,279 (42.0%) |
| 2 Vehicles | 936 (33.3%) | 1,664 (30.7%) |
| 3 or more Vehicles | 1,050 (37.3%) | 564 (10.4%) |
| Total | 2,812 (100.0%) | 5,423 (100.0%) |
Real Estate & Mortgages in Ruston
Real Estate and Mortgage Overview in Ruston
| Characteristic | Without Mortgage | With Mortgage |
| Housing Units | 1,422 | 1,390 |
| Median Property Value | $192,200 | $238,300 |
| Median Household Income | $54,575 | $207 |
| Monthly Housing Costs | $388 | $35 |
| Real Estate Taxes | $934 | $87 |
Property Value by Mortgage Status in Ruston
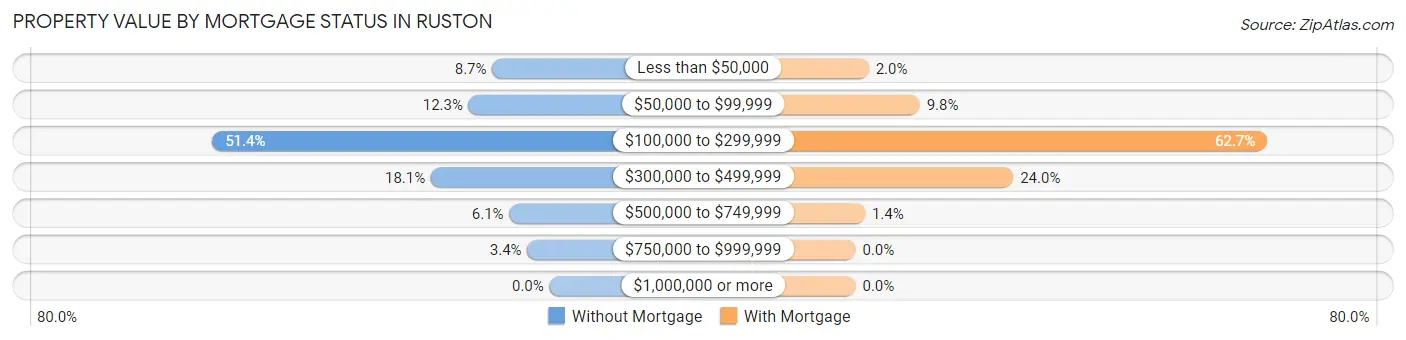
| Property Value | Without Mortgage | With Mortgage |
| Less than $50,000 | 124 (8.7%) | 28 (2.0%) |
| $50,000 to $99,999 | 175 (12.3%) | 136 (9.8%) |
| $100,000 to $299,999 | 731 (51.4%) | 872 (62.7%) |
| $300,000 to $499,999 | 257 (18.1%) | 334 (24.0%) |
| $500,000 to $749,999 | 87 (6.1%) | 20 (1.4%) |
| $750,000 to $999,999 | 48 (3.4%) | 0 (0.0%) |
| $1,000,000 or more | 0 (0.0%) | 0 (0.0%) |
| Total | 1,422 (100.0%) | 1,390 (100.0%) |
Household Income by Mortgage Status in Ruston
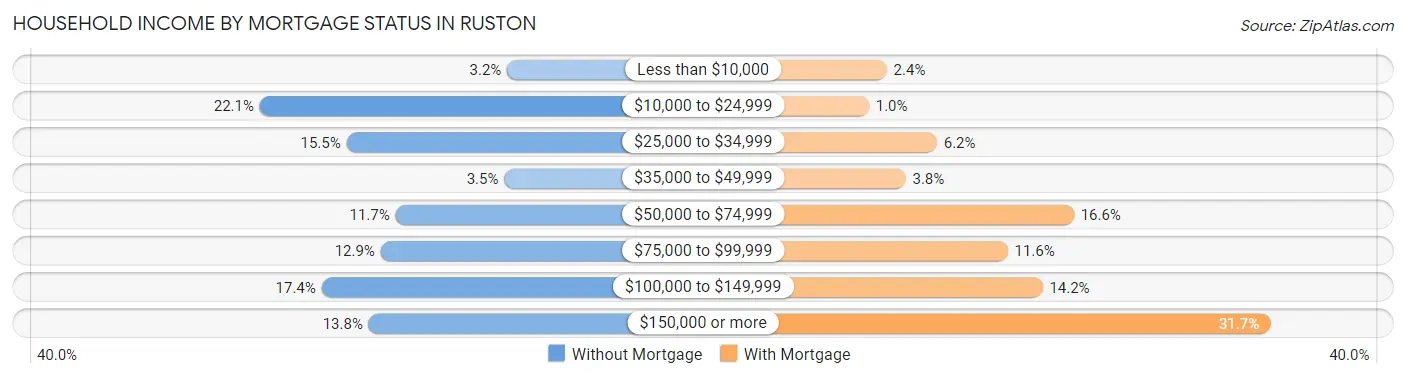
| Household Income | Without Mortgage | With Mortgage |
| Less than $10,000 | 46 (3.2%) | 33 (2.4%) |
| $10,000 to $24,999 | 314 (22.1%) | 14 (1.0%) |
| $25,000 to $34,999 | 220 (15.5%) | 86 (6.2%) |
| $35,000 to $49,999 | 49 (3.5%) | 53 (3.8%) |
| $50,000 to $74,999 | 167 (11.7%) | 231 (16.6%) |
| $75,000 to $99,999 | 183 (12.9%) | 161 (11.6%) |
| $100,000 to $149,999 | 247 (17.4%) | 198 (14.2%) |
| $150,000 or more | 196 (13.8%) | 440 (31.7%) |
| Total | 1,422 (100.0%) | 1,390 (100.0%) |
Property Value to Household Income Ratio in Ruston
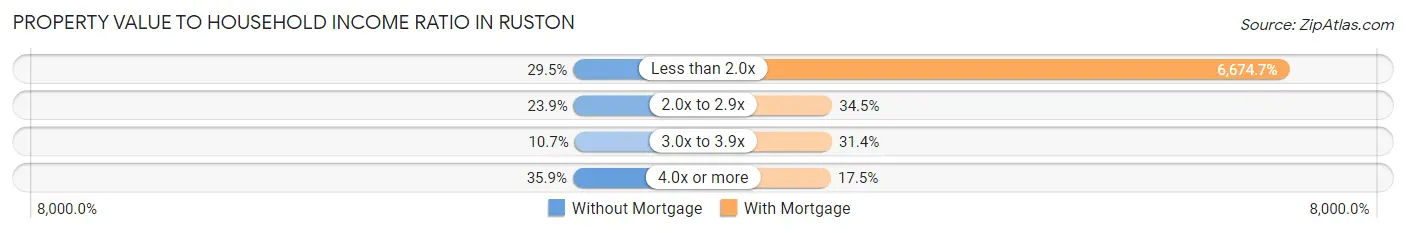
| Value-to-Income Ratio | Without Mortgage | With Mortgage |
| Less than 2.0x | 419 (29.5%) | 92,778 (6,674.7%) |
| 2.0x to 2.9x | 340 (23.9%) | 480 (34.5%) |
| 3.0x to 3.9x | 152 (10.7%) | 436 (31.4%) |
| 4.0x or more | 511 (35.9%) | 243 (17.5%) |
| Total | 1,422 (100.0%) | 1,390 (100.0%) |
Real Estate Taxes by Mortgage Status in Ruston
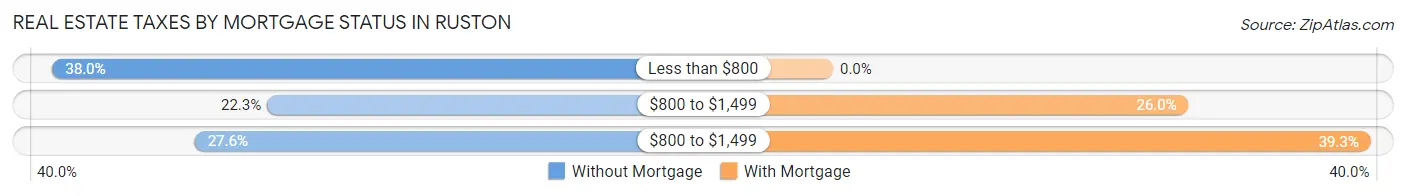
| Property Taxes | Without Mortgage | With Mortgage |
| Less than $800 | 540 (38.0%) | 0 (0.0%) |
| $800 to $1,499 | 317 (22.3%) | 361 (26.0%) |
| $800 to $1,499 | 392 (27.6%) | 546 (39.3%) |
| Total | 1,422 (100.0%) | 1,390 (100.0%) |
Health & Disability in Ruston
Health Insurance Coverage by Age in Ruston
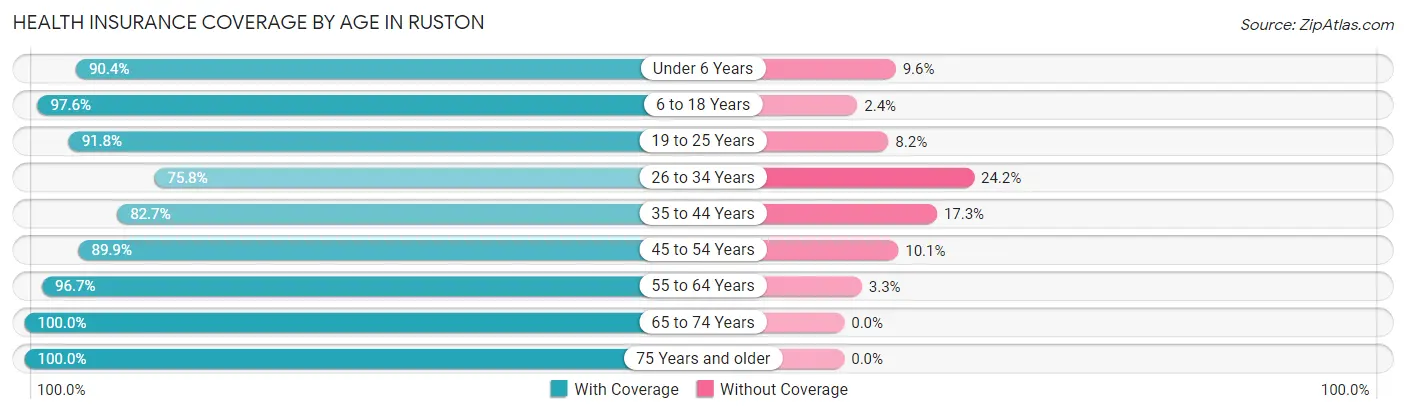
| Age Bracket | With Coverage | Without Coverage |
| Under 6 Years | 1,396 (90.4%) | 148 (9.6%) |
| 6 to 18 Years | 2,798 (97.6%) | 70 (2.4%) |
| 19 to 25 Years | 7,308 (91.8%) | 655 (8.2%) |
| 26 to 34 Years | 1,835 (75.8%) | 586 (24.2%) |
| 35 to 44 Years | 1,546 (82.7%) | 323 (17.3%) |
| 45 to 54 Years | 1,241 (89.9%) | 139 (10.1%) |
| 55 to 64 Years | 1,535 (96.7%) | 52 (3.3%) |
| 65 to 74 Years | 1,357 (100.0%) | 0 (0.0%) |
| 75 Years and older | 931 (100.0%) | 0 (0.0%) |
| Total | 19,947 (91.0%) | 1,973 (9.0%) |
Health Insurance Coverage by Citizenship Status in Ruston
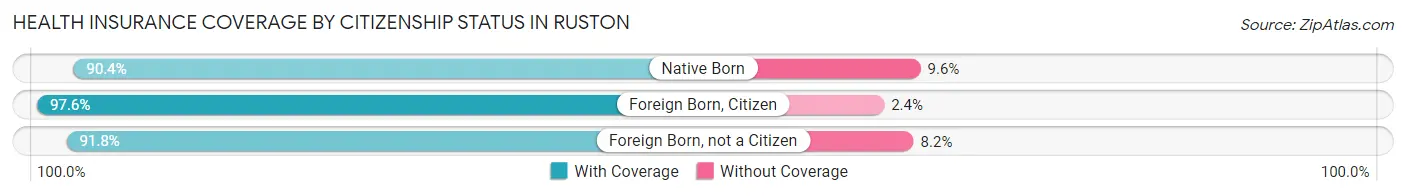
| Citizenship Status | With Coverage | Without Coverage |
| Native Born | 1,396 (90.4%) | 148 (9.6%) |
| Foreign Born, Citizen | 2,798 (97.6%) | 70 (2.4%) |
| Foreign Born, not a Citizen | 7,308 (91.8%) | 655 (8.2%) |
Health Insurance Coverage by Household Income in Ruston
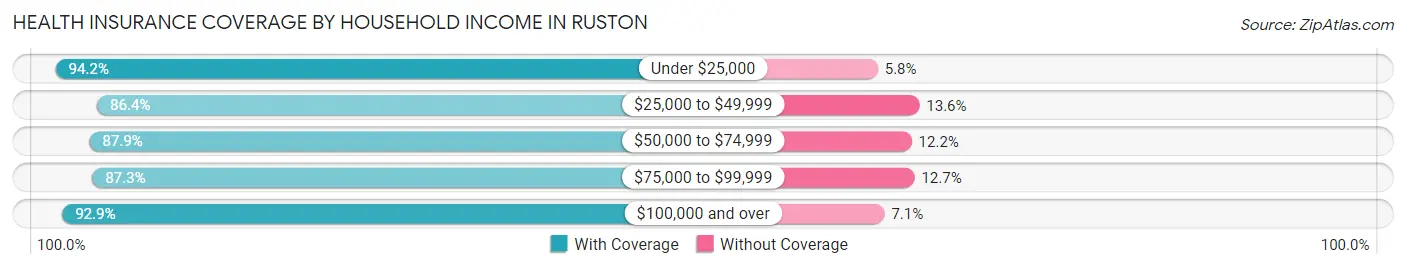
| Household Income | With Coverage | Without Coverage |
| Under $25,000 | 5,860 (94.2%) | 361 (5.8%) |
| $25,000 to $49,999 | 4,750 (86.4%) | 748 (13.6%) |
| $50,000 to $74,999 | 2,322 (87.8%) | 321 (12.1%) |
| $75,000 to $99,999 | 1,439 (87.3%) | 209 (12.7%) |
| $100,000 and over | 3,526 (92.9%) | 268 (7.1%) |
Public vs Private Health Insurance Coverage by Age in Ruston
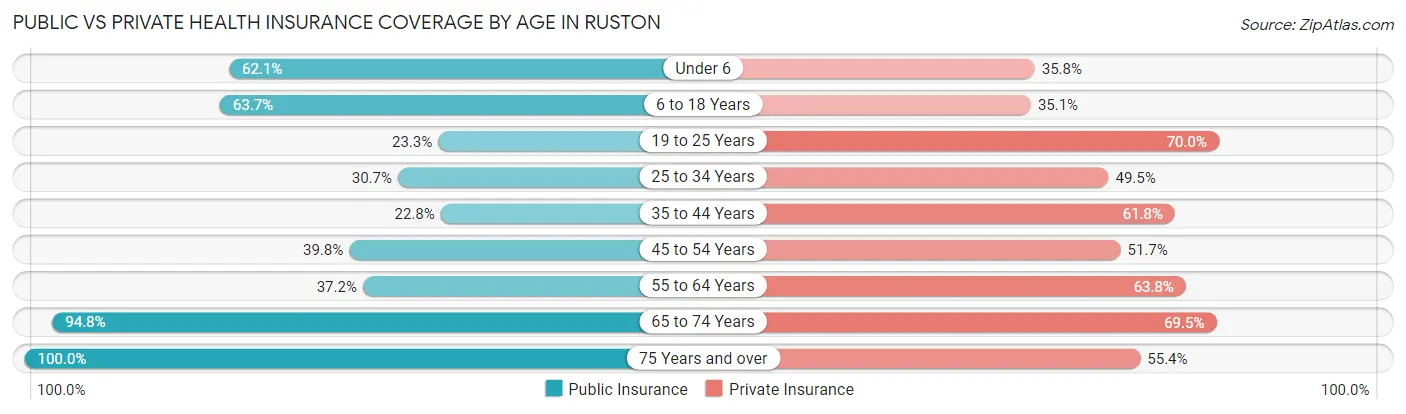
| Age Bracket | Public Insurance | Private Insurance |
| Under 6 | 958 (62.1%) | 553 (35.8%) |
| 6 to 18 Years | 1,828 (63.7%) | 1,007 (35.1%) |
| 19 to 25 Years | 1,852 (23.3%) | 5,571 (70.0%) |
| 25 to 34 Years | 744 (30.7%) | 1,199 (49.5%) |
| 35 to 44 Years | 426 (22.8%) | 1,155 (61.8%) |
| 45 to 54 Years | 549 (39.8%) | 714 (51.7%) |
| 55 to 64 Years | 591 (37.2%) | 1,013 (63.8%) |
| 65 to 74 Years | 1,287 (94.8%) | 943 (69.5%) |
| 75 Years and over | 931 (100.0%) | 516 (55.4%) |
| Total | 9,166 (41.8%) | 12,671 (57.8%) |
Disability Status by Sex by Age in Ruston
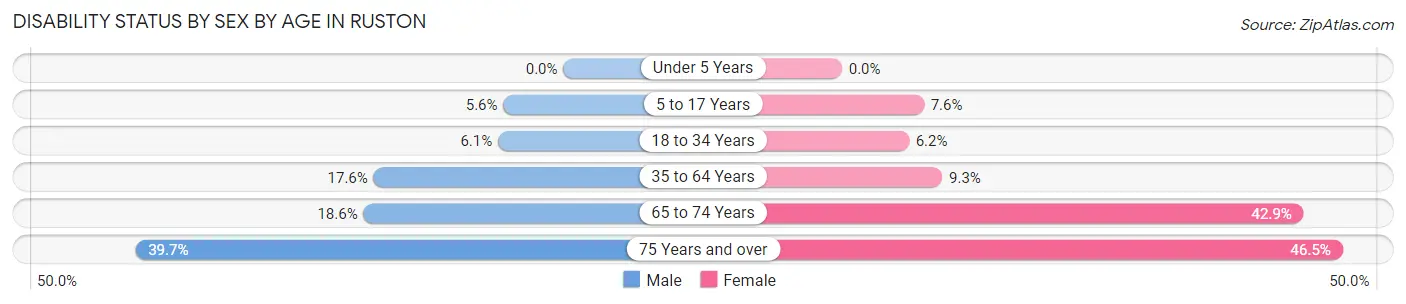
| Age Bracket | Male | Female |
| Under 5 Years | 0 (0.0%) | 0 (0.0%) |
| 5 to 17 Years | 64 (5.6%) | 75 (7.6%) |
| 18 to 34 Years | 355 (6.1%) | 343 (6.2%) |
| 35 to 64 Years | 394 (17.6%) | 242 (9.3%) |
| 65 to 74 Years | 118 (18.5%) | 309 (42.9%) |
| 75 Years and over | 116 (39.7%) | 297 (46.5%) |
Disability Class by Sex by Age in Ruston
Disability Class: Hearing Difficulty
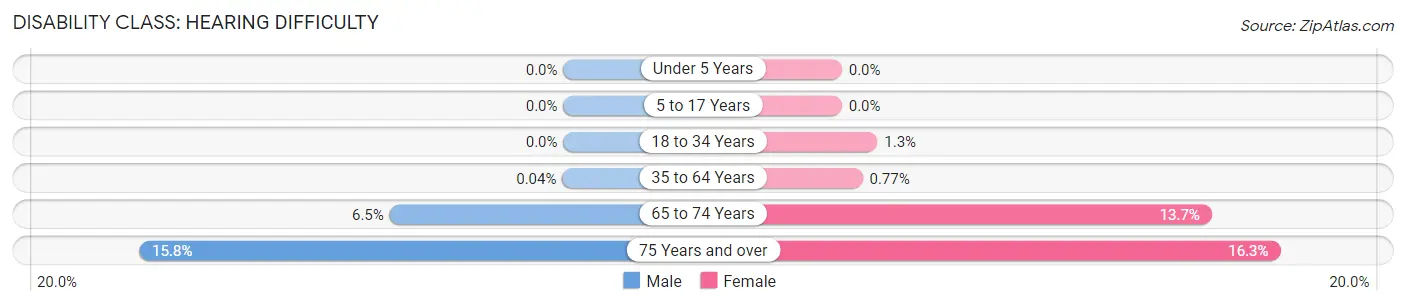
| Age Bracket | Male | Female |
| Under 5 Years | 0 (0.0%) | 0 (0.0%) |
| 5 to 17 Years | 0 (0.0%) | 0 (0.0%) |
| 18 to 34 Years | 0 (0.0%) | 73 (1.3%) |
| 35 to 64 Years | 1 (0.0%) | 20 (0.8%) |
| 65 to 74 Years | 41 (6.5%) | 99 (13.7%) |
| 75 Years and over | 46 (15.8%) | 104 (16.3%) |
Disability Class: Vision Difficulty
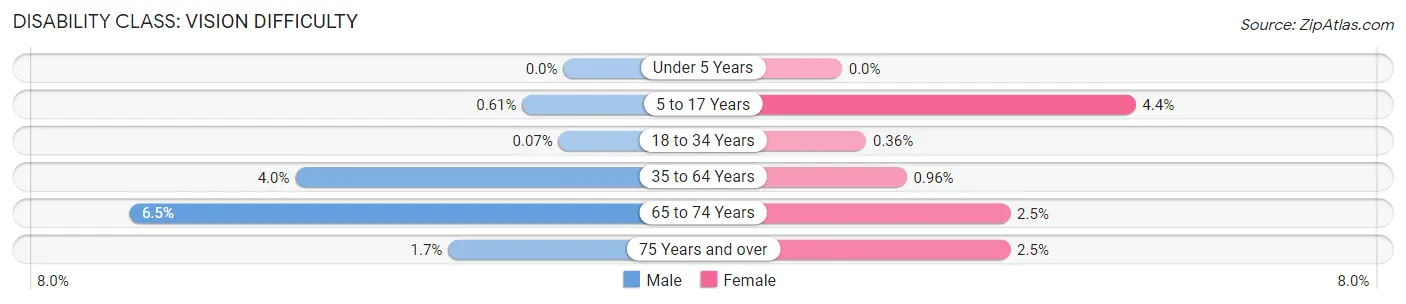
| Age Bracket | Male | Female |
| Under 5 Years | 0 (0.0%) | 0 (0.0%) |
| 5 to 17 Years | 7 (0.6%) | 43 (4.4%) |
| 18 to 34 Years | 4 (0.1%) | 20 (0.4%) |
| 35 to 64 Years | 89 (4.0%) | 25 (1.0%) |
| 65 to 74 Years | 41 (6.5%) | 18 (2.5%) |
| 75 Years and over | 5 (1.7%) | 16 (2.5%) |
Disability Class: Cognitive Difficulty
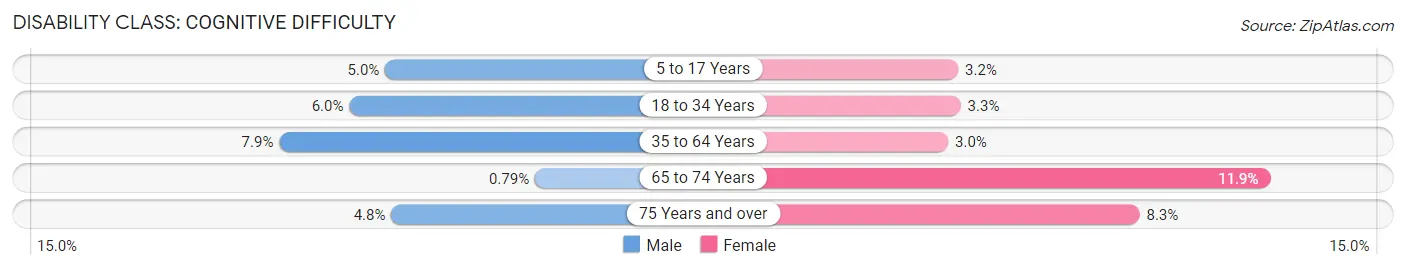
| Age Bracket | Male | Female |
| 5 to 17 Years | 57 (5.0%) | 32 (3.2%) |
| 18 to 34 Years | 349 (6.0%) | 183 (3.3%) |
| 35 to 64 Years | 177 (7.9%) | 77 (3.0%) |
| 65 to 74 Years | 5 (0.8%) | 86 (11.9%) |
| 75 Years and over | 14 (4.8%) | 53 (8.3%) |
Disability Class: Ambulatory Difficulty
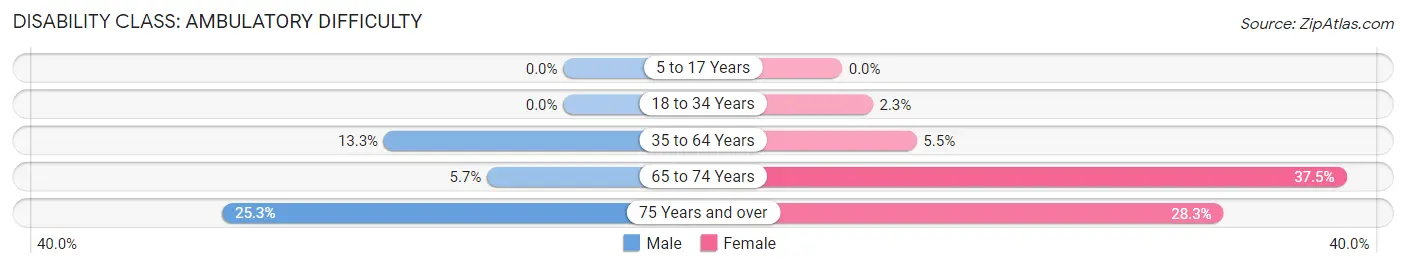
| Age Bracket | Male | Female |
| 5 to 17 Years | 0 (0.0%) | 0 (0.0%) |
| 18 to 34 Years | 0 (0.0%) | 126 (2.3%) |
| 35 to 64 Years | 298 (13.3%) | 144 (5.5%) |
| 65 to 74 Years | 36 (5.7%) | 270 (37.4%) |
| 75 Years and over | 74 (25.3%) | 181 (28.3%) |
Disability Class: Self-Care Difficulty
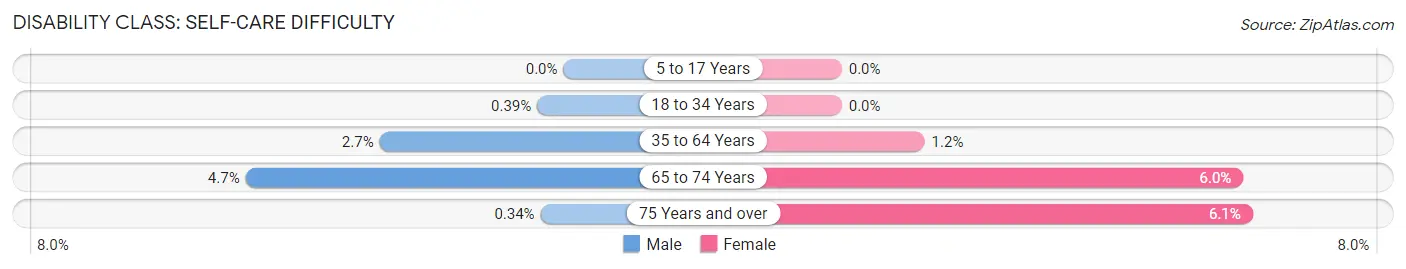
| Age Bracket | Male | Female |
| 5 to 17 Years | 0 (0.0%) | 0 (0.0%) |
| 18 to 34 Years | 23 (0.4%) | 0 (0.0%) |
| 35 to 64 Years | 61 (2.7%) | 32 (1.2%) |
| 65 to 74 Years | 30 (4.7%) | 43 (6.0%) |
| 75 Years and over | 1 (0.3%) | 39 (6.1%) |
Technology Access in Ruston
Computing Device Access in Ruston
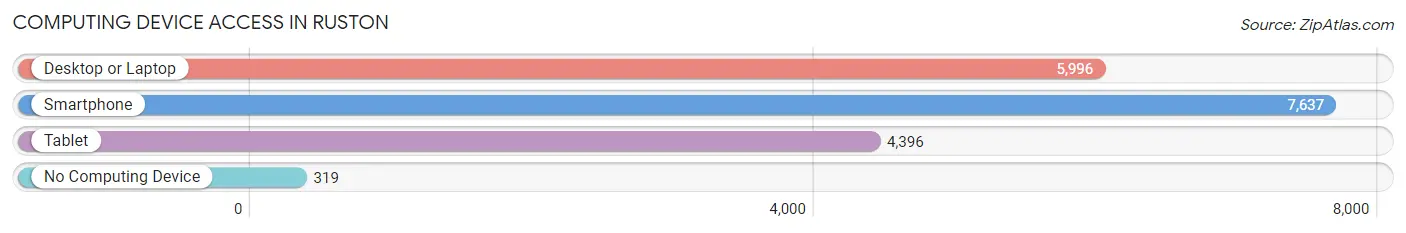
| Device Type | # Households | % Households |
| Desktop or Laptop | 5,996 | 72.8% |
| Smartphone | 7,637 | 92.7% |
| Tablet | 4,396 | 53.4% |
| No Computing Device | 319 | 3.9% |
| Total | 8,235 | 100.0% |
Internet Access in Ruston
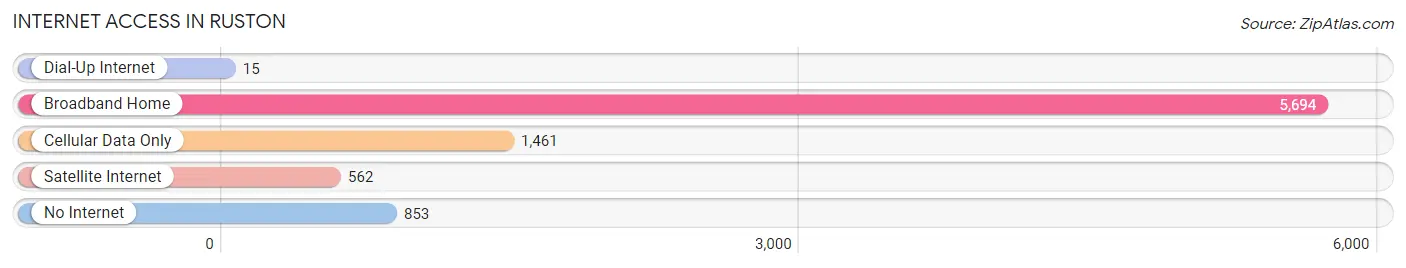
| Internet Type | # Households | % Households |
| Dial-Up Internet | 15 | 0.2% |
| Broadband Home | 5,694 | 69.1% |
| Cellular Data Only | 1,461 | 17.7% |
| Satellite Internet | 562 | 6.8% |
| No Internet | 853 | 10.4% |
| Total | 8,235 | 100.0% |
Ruston Summary
Introduction
The city of Ruston, Louisiana is located in the northern part of the state, in Lincoln Parish. It is the largest city in the parish and the principal city of the Ruston Micropolitan Statistical Area. The city has a rich history, diverse geography, a strong economy, and a unique demographic makeup. This paper will explore each of these aspects of Ruston in more detail.
History
The area that is now Ruston was first settled in the early 1800s by a group of settlers from Georgia. The town was originally called Rustonville, and it was incorporated in 1883. The town was named after Robert Rust, a local landowner.
In the late 1800s, the town began to grow rapidly due to the arrival of the railroad. The railroad brought new businesses and industries to the area, and the population of the town began to grow.
In the early 1900s, the town was home to several large industries, including a cotton mill, a lumber mill, and a brick factory. The town also had a thriving agricultural industry, and it was home to several large farms.
In the mid-1900s, the town began to experience a decline in its industrial base. This led to a decrease in the population of the town, and it was not until the late 1900s that the town began to experience a resurgence.
Today, Ruston is a thriving city with a population of over 21,000 people. The city is home to several large industries, including a paper mill, a steel mill, and a chemical plant. The city is also home to several educational institutions, including Louisiana Tech University and Grambling State University.
Geography
Ruston is located in the northern part of Louisiana, in Lincoln Parish. The city is situated on the banks of the Ouachita River, and it is surrounded by rolling hills and forests. The city is located about 30 miles south of Monroe, and it is about 100 miles north of Baton Rouge.
The city has a total area of 16.2 square miles, and it has an elevation of about 300 feet. The climate in Ruston is classified as humid subtropical, and the average temperature in the summer is around 80 degrees Fahrenheit.
Economy
The economy of Ruston is largely based on manufacturing and agriculture. The city is home to several large industries, including a paper mill, a steel mill, and a chemical plant. The city is also home to several educational institutions, including Louisiana Tech University and Grambling State University.
The city also has a thriving agricultural industry, and it is home to several large farms. The city is also home to several retail stores, restaurants, and other businesses.
Demographics
As of the 2010 census, the population of Ruston was 21,859. The racial makeup of the city was 63.3% White, 32.2% African American, 0.5% Native American, 1.2% Asian, 0.1% Pacific Islander, and 2.7% from other races. The median household income in Ruston was $35,945, and the median age was 33.
Conclusion
Ruston, Louisiana is a vibrant city with a rich history, diverse geography, a strong economy, and a unique demographic makeup. The city is home to several large industries, educational institutions, and agricultural businesses. The city is also home to a diverse population, with a median age of 33 and a median household income of $35,945. Ruston is a great place to live, work, and visit.
Common Questions
What is Per Capita Income in Ruston?
Per Capita income in Ruston is $21,292.
What is the Median Family Income in Ruston?
Median Family Income in Ruston is $49,738.
What is the Median Household income in Ruston?
Median Household Income in Ruston is $32,877.
What is Income or Wage Gap in Ruston?
Income or Wage Gap in Ruston is 14.0%.
Women in Ruston earn 86.0 cents for every dollar earned by a man.
What is Family Income Deficit in Ruston?
Family Income Deficit in Ruston is $10,406.
Families that are below poverty line in Ruston earn $10,406 less on average than the poverty threshold level.
What is Inequality or Gini Index in Ruston?
Inequality or Gini Index in Ruston is 0.54.
What is the Total Population of Ruston?
Total Population of Ruston is 22,282.
What is the Total Male Population of Ruston?
Total Male Population of Ruston is 11,066.
What is the Total Female Population of Ruston?
Total Female Population of Ruston is 11,216.
What is the Ratio of Males per 100 Females in Ruston?
There are 98.66 Males per 100 Females in Ruston.
What is the Ratio of Females per 100 Males in Ruston?
There are 101.36 Females per 100 Males in Ruston.
What is the Median Population Age in Ruston?
Median Population Age in Ruston is 23.6 Years.
What is the Average Family Size in Ruston
Average Family Size in Ruston is 3.2 People.
What is the Average Household Size in Ruston
Average Household Size in Ruston is 2.4 People.
How Large is the Labor Force in Ruston?
There are 10,610 People in the Labor Forcein in Ruston.
What is the Percentage of People in the Labor Force in Ruston?
55.3% of People are in the Labor Force in Ruston.
What is the Unemployment Rate in Ruston?
Unemployment Rate in Ruston is 3.1%.