Nashville, NC Map & Demographics
Nashville Map
Nashville Overview
$31,789
PER CAPITA INCOME
$65,057
AVG FAMILY INCOME
$61,513
AVG HOUSEHOLD INCOME
5.1%
WAGE / INCOME GAP [ % ]
94.9¢/ $1
WAGE / INCOME GAP [ $ ]
0.42
INEQUALITY / GINI INDEX
5,624
TOTAL POPULATION
2,349
MALE POPULATION
3,275
FEMALE POPULATION
71.73
MALES / 100 FEMALES
139.42
FEMALES / 100 MALES
40.7
MEDIAN AGE
2.8
AVG FAMILY SIZE
2.4
AVG HOUSEHOLD SIZE
3,031
LABOR FORCE [ PEOPLE ]
70.3%
PERCENT IN LABOR FORCE
11.5%
UNEMPLOYMENT RATE
Nashville Zip Codes
Nashville Area Codes
Income in Nashville
Income Overview in Nashville
Per Capita Income in Nashville is $31,789, while median incomes of families and households are $65,057 and $61,513 respectively.
| Characteristic | Number | Measure |
| Per Capita Income | 5,624 | $31,789 |
| Median Family Income | 1,578 | $65,057 |
| Mean Family Income | 1,578 | $77,978 |
| Median Household Income | 2,297 | $61,513 |
| Mean Household Income | 2,297 | $74,581 |
| Income Deficit | 1,578 | $0 |
| Wage / Income Gap (%) | 5,624 | 5.13% |
| Wage / Income Gap ($) | 5,624 | 94.87¢ per $1 |
| Gini / Inequality Index | 5,624 | 0.42 |
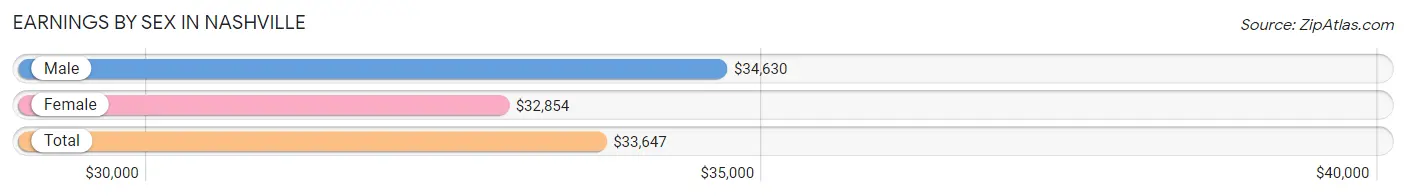
Earnings by Sex in Nashville
Average Earnings in Nashville are $33,647, $34,630 for men and $32,854 for women, a difference of 5.1%.
| Sex | Number | Average Earnings |
| Male | 1,368 (42.7%) | $34,630 |
| Female | 1,834 (57.3%) | $32,854 |
| Total | 3,202 (100.0%) | $33,647 |
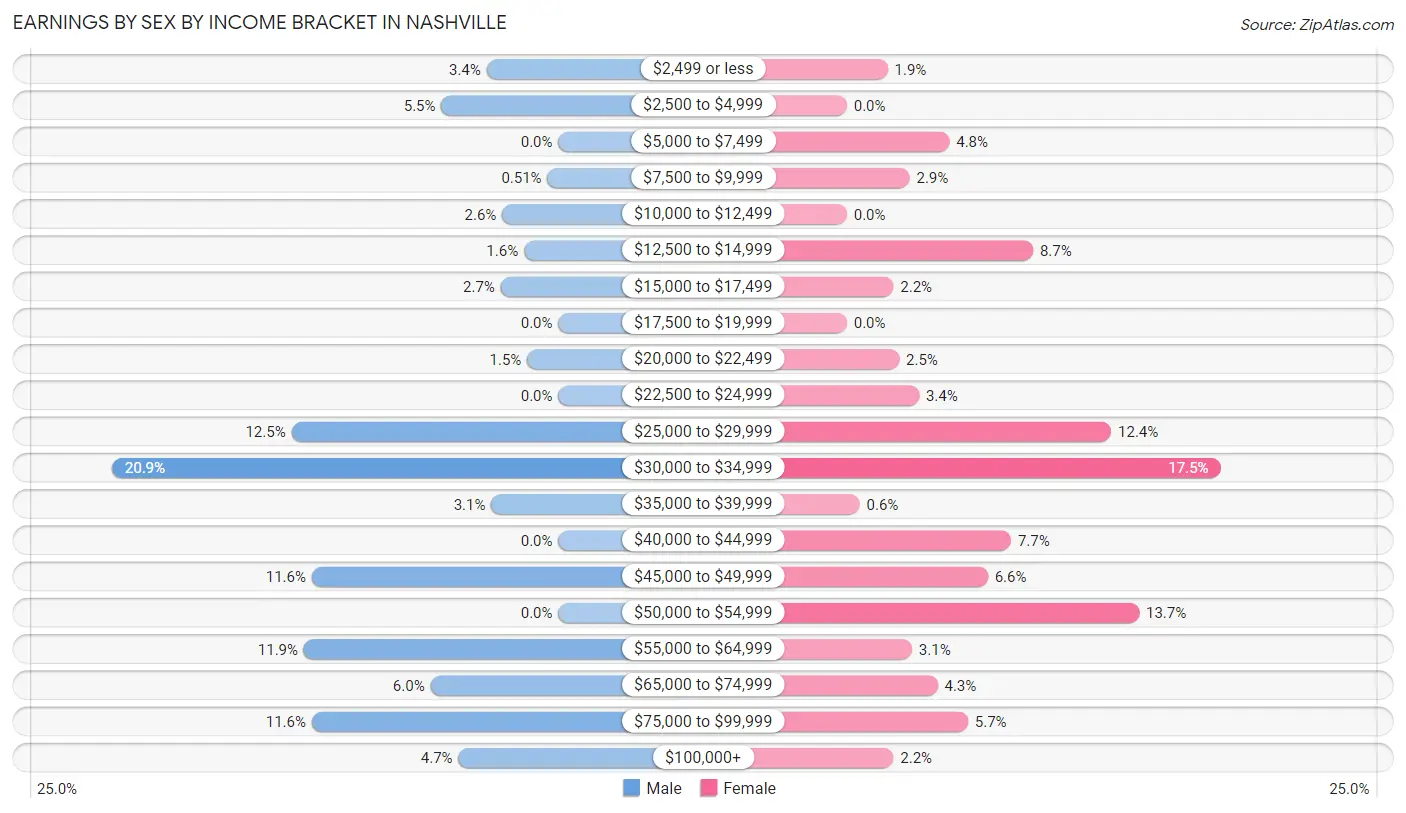
Earnings by Sex by Income Bracket in Nashville
The most common earnings brackets in Nashville are $30,000 to $34,999 for men (286 | 20.9%) and $30,000 to $34,999 for women (321 | 17.5%).
| Income | Male | Female |
| $2,499 or less | 46 (3.4%) | 35 (1.9%) |
| $2,500 to $4,999 | 75 (5.5%) | 0 (0.0%) |
| $5,000 to $7,499 | 0 (0.0%) | 88 (4.8%) |
| $7,500 to $9,999 | 7 (0.5%) | 54 (2.9%) |
| $10,000 to $12,499 | 36 (2.6%) | 0 (0.0%) |
| $12,500 to $14,999 | 22 (1.6%) | 160 (8.7%) |
| $15,000 to $17,499 | 37 (2.7%) | 40 (2.2%) |
| $17,500 to $19,999 | 0 (0.0%) | 0 (0.0%) |
| $20,000 to $22,499 | 20 (1.5%) | 45 (2.5%) |
| $22,500 to $24,999 | 0 (0.0%) | 62 (3.4%) |
| $25,000 to $29,999 | 171 (12.5%) | 227 (12.4%) |
| $30,000 to $34,999 | 286 (20.9%) | 321 (17.5%) |
| $35,000 to $39,999 | 43 (3.1%) | 11 (0.6%) |
| $40,000 to $44,999 | 0 (0.0%) | 141 (7.7%) |
| $45,000 to $49,999 | 158 (11.6%) | 121 (6.6%) |
| $50,000 to $54,999 | 0 (0.0%) | 251 (13.7%) |
| $55,000 to $64,999 | 163 (11.9%) | 56 (3.0%) |
| $65,000 to $74,999 | 82 (6.0%) | 78 (4.3%) |
| $75,000 to $99,999 | 158 (11.6%) | 104 (5.7%) |
| $100,000+ | 64 (4.7%) | 40 (2.2%) |
| Total | 1,368 (100.0%) | 1,834 (100.0%) |
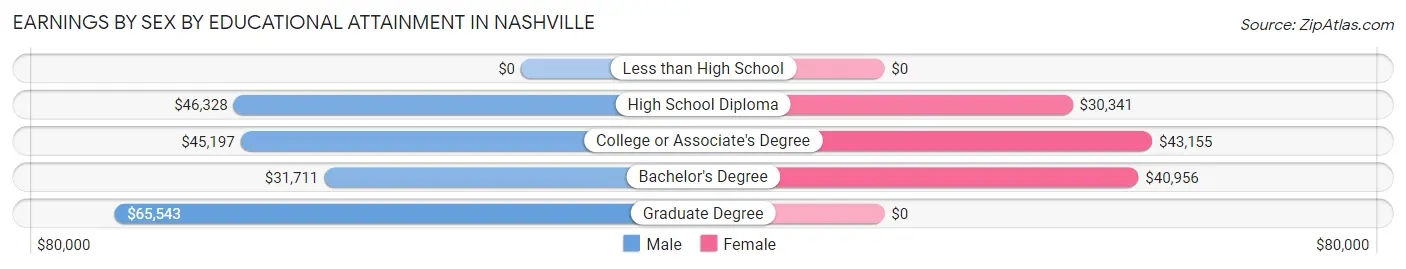
Earnings by Sex by Educational Attainment in Nashville
Average earnings in Nashville are $45,250 for men and $34,002 for women, a difference of 24.9%. Men with an educational attainment of graduate degree enjoy the highest average annual earnings of $65,543, while those with bachelor's degree education earn the least with $31,711. Women with an educational attainment of college or associate's degree earn the most with the average annual earnings of $43,155, while those with high school diploma education have the smallest earnings of $30,341.
| Educational Attainment | Male Income | Female Income |
| Less than High School | - | - |
| High School Diploma | $46,328 | $30,341 |
| College or Associate's Degree | $45,197 | $43,155 |
| Bachelor's Degree | $31,711 | $40,956 |
| Graduate Degree | $65,543 | $0 |
| Total | $45,250 | $34,002 |
Family Income in Nashville
Family Income Brackets in Nashville
According to the Nashville family income data, there are 450 families falling into the $50,000 to $74,999 income range, which is the most common income bracket and makes up 28.5% of all families. Conversely, the $25,000 to $34,999 income bracket is the least frequent group with only 14 families (0.9%) belonging to this category.
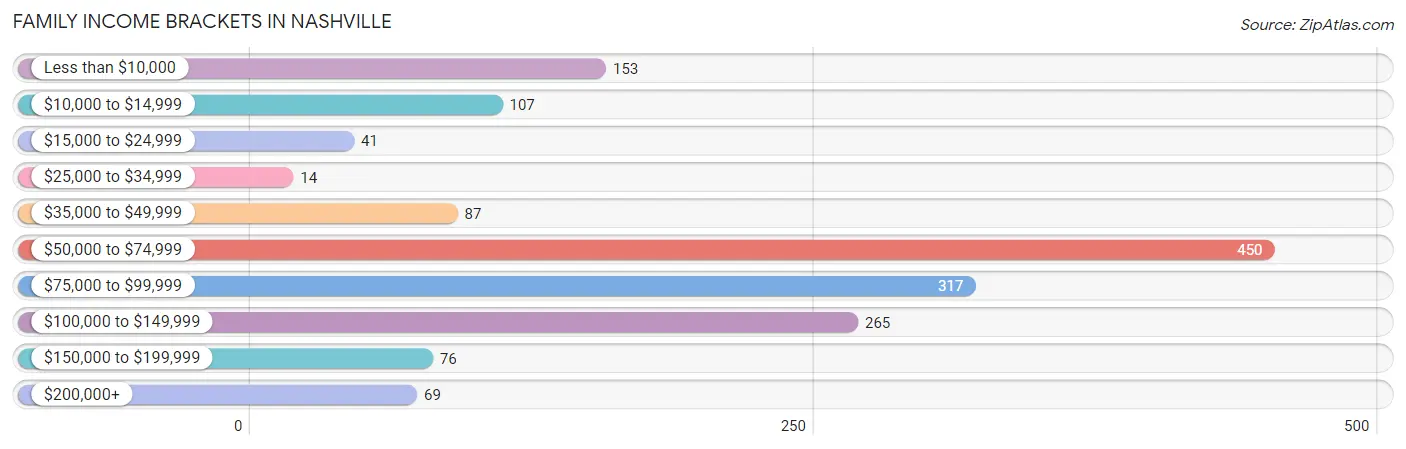
| Income Bracket | # Families | % Families |
| Less than $10,000 | 153 | 9.7% |
| $10,000 to $14,999 | 107 | 6.8% |
| $15,000 to $24,999 | 41 | 2.6% |
| $25,000 to $34,999 | 14 | 0.9% |
| $35,000 to $49,999 | 87 | 5.5% |
| $50,000 to $74,999 | 450 | 28.5% |
| $75,000 to $99,999 | 317 | 20.1% |
| $100,000 to $149,999 | 265 | 16.8% |
| $150,000 to $199,999 | 76 | 4.8% |
| $200,000+ | 69 | 4.4% |
Family Income by Famaliy Size in Nashville
4-person families (176 | 11.2%) account for the highest median family income in Nashville with $90,256 per family, while 2-person families (972 | 61.6%) have the highest median income of $40,526 per family member.
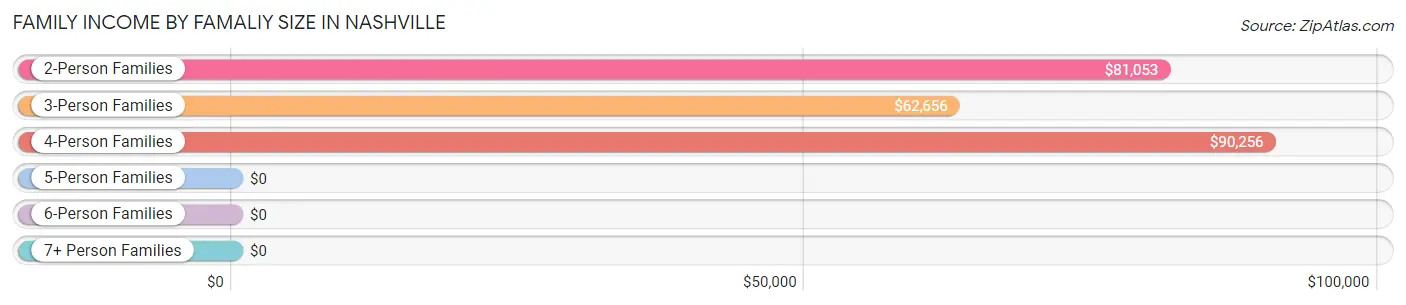
| Income Bracket | # Families | Median Income |
| 2-Person Families | 972 (61.6%) | $81,053 |
| 3-Person Families | 430 (27.3%) | $62,656 |
| 4-Person Families | 176 (11.2%) | $90,256 |
| 5-Person Families | 0 (0.0%) | $0 |
| 6-Person Families | 0 (0.0%) | $0 |
| 7+ Person Families | 0 (0.0%) | $0 |
| Total | 1,578 (100.0%) | $65,057 |
Family Income by Number of Earners in Nashville
The median family income in Nashville is $65,057, with families comprising 3+ earners (87) having the highest median family income of $91,891, while families with no earners (96) have the lowest median family income of $46,579, accounting for 5.5% and 6.1% of families, respectively.
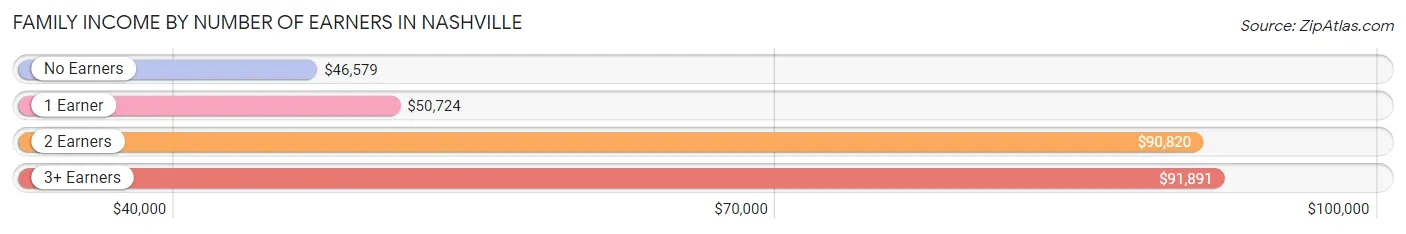
| Number of Earners | # Families | Median Income |
| No Earners | 96 (6.1%) | $46,579 |
| 1 Earner | 652 (41.3%) | $50,724 |
| 2 Earners | 743 (47.1%) | $90,820 |
| 3+ Earners | 87 (5.5%) | $91,891 |
| Total | 1,578 (100.0%) | $65,057 |
Household Income in Nashville
Household Income Brackets in Nashville
With 492 households falling in the category, the $50,000 to $74,999 income range is the most frequent in Nashville, accounting for 21.4% of all households. In contrast, only 9 households (0.4%) fall into the less than $10,000 income bracket, making it the least populous group.
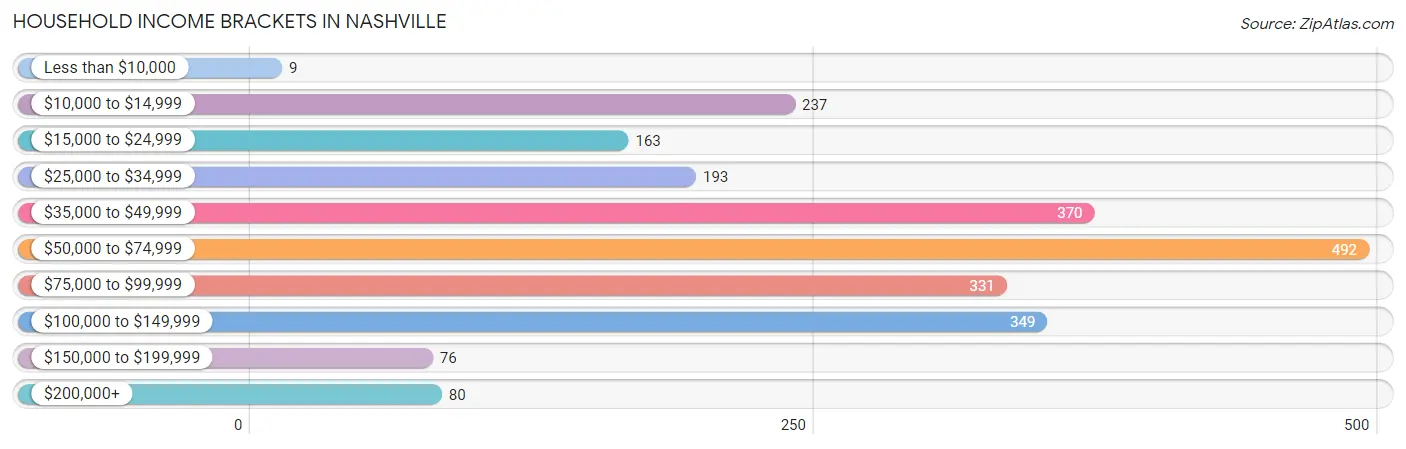
| Income Bracket | # Households | % Households |
| Less than $10,000 | 9 | 0.4% |
| $10,000 to $14,999 | 237 | 10.3% |
| $15,000 to $24,999 | 163 | 7.1% |
| $25,000 to $34,999 | 193 | 8.4% |
| $35,000 to $49,999 | 370 | 16.1% |
| $50,000 to $74,999 | 492 | 21.4% |
| $75,000 to $99,999 | 331 | 14.4% |
| $100,000 to $149,999 | 349 | 15.2% |
| $150,000 to $199,999 | 76 | 3.3% |
| $200,000+ | 80 | 3.5% |
Household Income by Householder Age in Nashville
The median household income in Nashville is $61,513, with the highest median household income of $64,867 found in the 45 to 64 years age bracket for the primary householder. A total of 956 households (41.6%) fall into this category. Meanwhile, the 15 to 24 years age bracket for the primary householder has the lowest median household income of $0, with 75 households (3.3%) in this group.
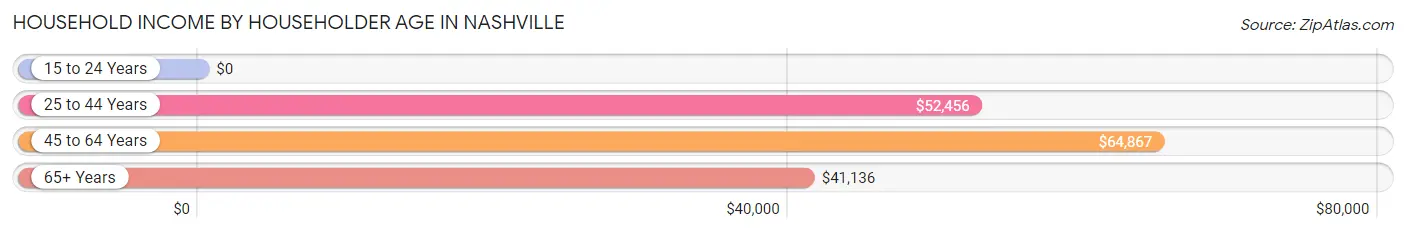
| Income Bracket | # Households | Median Income |
| 15 to 24 Years | 75 (3.3%) | $0 |
| 25 to 44 Years | 608 (26.5%) | $52,456 |
| 45 to 64 Years | 956 (41.6%) | $64,867 |
| 65+ Years | 658 (28.6%) | $41,136 |
| Total | 2,297 (100.0%) | $61,513 |
Poverty in Nashville
Income Below Poverty by Sex and Age in Nashville
With 21.0% poverty level for males and 22.5% for females among the residents of Nashville, 6 to 11 year old males and 12 to 14 year old females are the most vulnerable to poverty, with 161 males (59.9%) and 15 females (100.0%) in their respective age groups living below the poverty level.
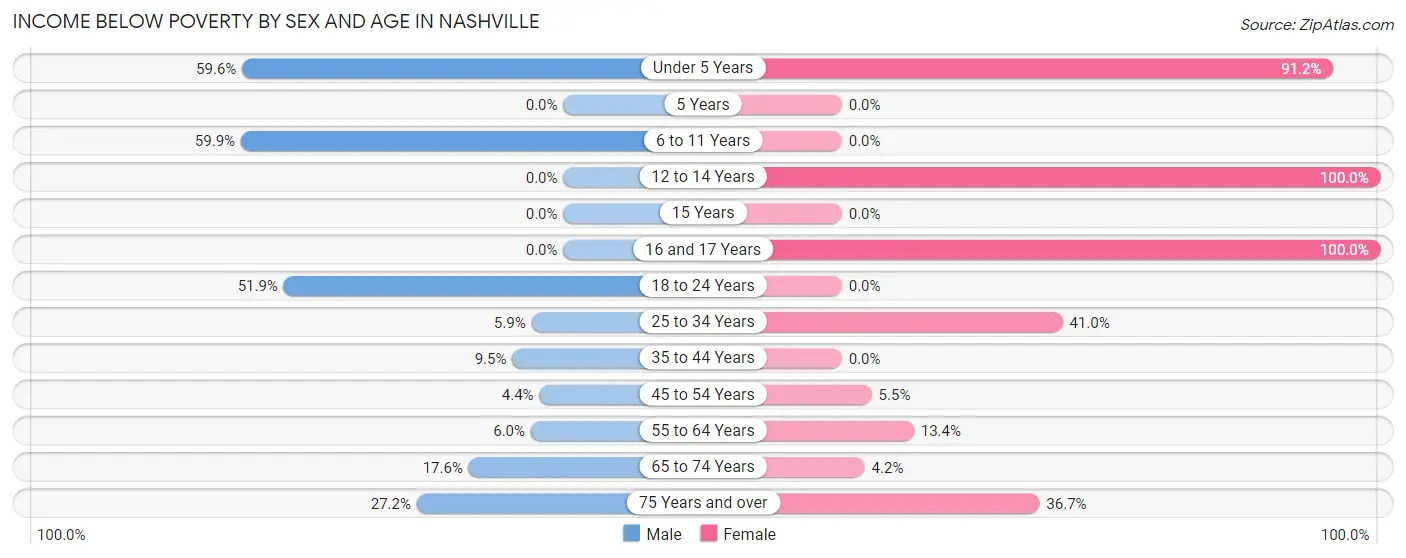
| Age Bracket | Male | Female |
| Under 5 Years | 62 (59.6%) | 343 (91.2%) |
| 5 Years | 0 (0.0%) | 0 (0.0%) |
| 6 to 11 Years | 161 (59.9%) | 0 (0.0%) |
| 12 to 14 Years | 0 (0.0%) | 15 (100.0%) |
| 15 Years | 0 (0.0%) | 0 (0.0%) |
| 16 and 17 Years | 0 (0.0%) | 25 (100.0%) |
| 18 to 24 Years | 95 (51.9%) | 0 (0.0%) |
| 25 to 34 Years | 23 (5.9%) | 152 (41.0%) |
| 35 to 44 Years | 25 (9.5%) | 0 (0.0%) |
| 45 to 54 Years | 11 (4.4%) | 24 (5.5%) |
| 55 to 64 Years | 19 (6.0%) | 67 (13.4%) |
| 65 to 74 Years | 49 (17.6%) | 16 (4.2%) |
| 75 Years and over | 34 (27.2%) | 84 (36.7%) |
| Total | 479 (21.0%) | 726 (22.5%) |
Income Above Poverty by Sex and Age in Nashville
According to the poverty statistics in Nashville, males aged 12 to 14 years and females aged 6 to 11 years are the age groups that are most secure financially, with 100.0% of males and 100.0% of females in these age groups living above the poverty line.
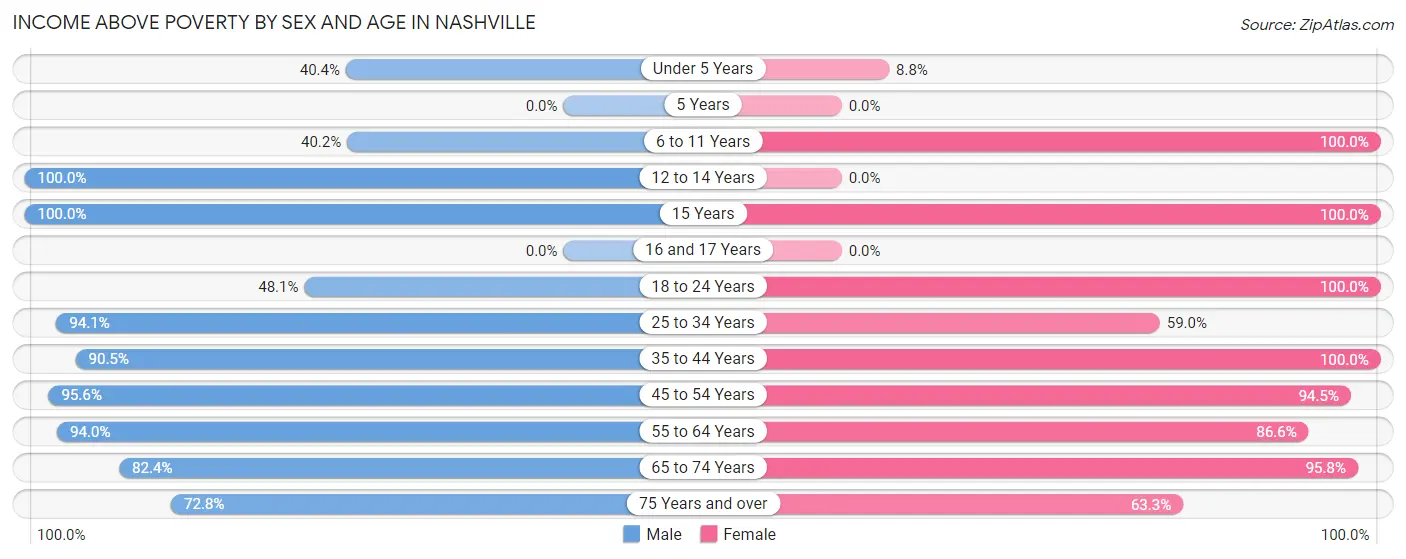
| Age Bracket | Male | Female |
| Under 5 Years | 42 (40.4%) | 33 (8.8%) |
| 5 Years | 0 (0.0%) | 0 (0.0%) |
| 6 to 11 Years | 108 (40.2%) | 356 (100.0%) |
| 12 to 14 Years | 45 (100.0%) | 0 (0.0%) |
| 15 Years | 63 (100.0%) | 64 (100.0%) |
| 16 and 17 Years | 0 (0.0%) | 0 (0.0%) |
| 18 to 24 Years | 88 (48.1%) | 172 (100.0%) |
| 25 to 34 Years | 366 (94.1%) | 219 (59.0%) |
| 35 to 44 Years | 239 (90.5%) | 306 (100.0%) |
| 45 to 54 Years | 237 (95.6%) | 409 (94.5%) |
| 55 to 64 Years | 296 (94.0%) | 434 (86.6%) |
| 65 to 74 Years | 230 (82.4%) | 361 (95.8%) |
| 75 Years and over | 91 (72.8%) | 145 (63.3%) |
| Total | 1,805 (79.0%) | 2,499 (77.5%) |
Income Below Poverty Among Married-Couple Families in Nashville
The poverty statistics for married-couple families in Nashville show that 7.4% or 62 of the total 834 families live below the poverty line. Families with no children have the highest poverty rate of 9.0%, comprising of 62 families. On the other hand, families with 1 or 2 children have the lowest poverty rate of 0.0%, which includes 0 families.
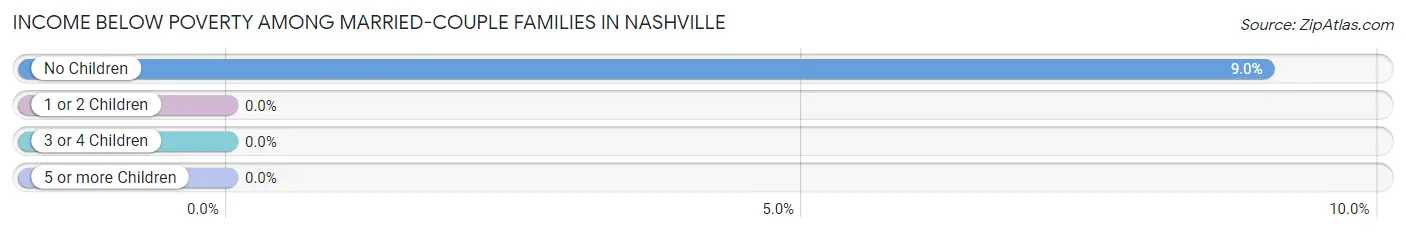
| Children | Above Poverty | Below Poverty |
| No Children | 625 (91.0%) | 62 (9.0%) |
| 1 or 2 Children | 147 (100.0%) | 0 (0.0%) |
| 3 or 4 Children | 0 (0.0%) | 0 (0.0%) |
| 5 or more Children | 0 (0.0%) | 0 (0.0%) |
| Total | 772 (92.6%) | 62 (7.4%) |
Income Below Poverty Among Single-Parent Households in Nashville
According to the poverty data in Nashville, 70.1% or 75 single-father households and 25.9% or 165 single-mother households are living below the poverty line. Among single-father households, those with 1 or 2 children have the highest poverty rate, with 75 households (100.0%) experiencing poverty. Likewise, among single-mother households, those with 1 or 2 children have the highest poverty rate, with 165 households (41.2%) falling below the poverty line.
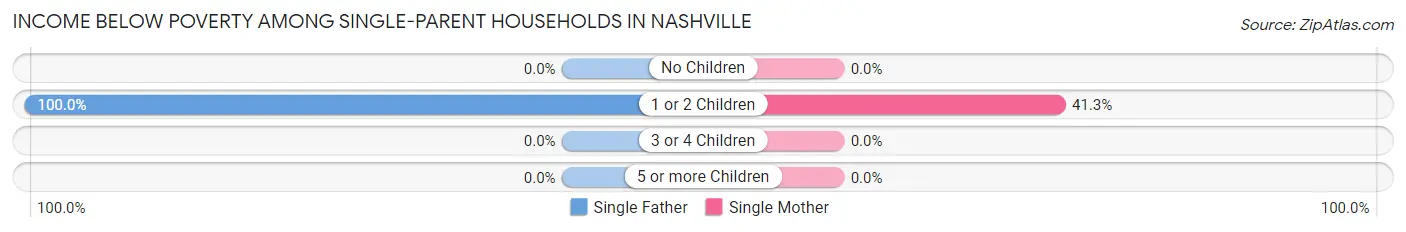
| Children | Single Father | Single Mother |
| No Children | 0 (0.0%) | 0 (0.0%) |
| 1 or 2 Children | 75 (100.0%) | 165 (41.2%) |
| 3 or 4 Children | 0 (0.0%) | 0 (0.0%) |
| 5 or more Children | 0 (0.0%) | 0 (0.0%) |
| Total | 75 (70.1%) | 165 (25.9%) |
Income Below Poverty Among Married-Couple vs Single-Parent Households in Nashville
The poverty data for Nashville shows that 62 of the married-couple family households (7.4%) and 240 of the single-parent households (32.3%) are living below the poverty level. Within the married-couple family households, those with no children have the highest poverty rate, with 62 households (9.0%) falling below the poverty line. Among the single-parent households, those with 1 or 2 children have the highest poverty rate, with 240 household (50.5%) living below poverty.
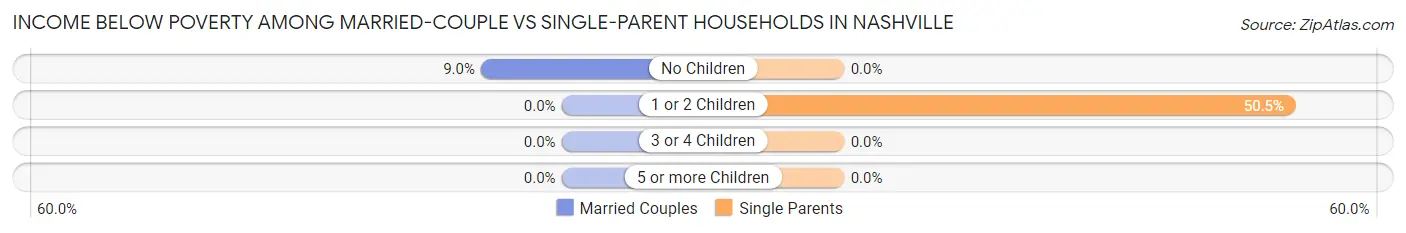
| Children | Married-Couple Families | Single-Parent Households |
| No Children | 62 (9.0%) | 0 (0.0%) |
| 1 or 2 Children | 0 (0.0%) | 240 (50.5%) |
| 3 or 4 Children | 0 (0.0%) | 0 (0.0%) |
| 5 or more Children | 0 (0.0%) | 0 (0.0%) |
| Total | 62 (7.4%) | 240 (32.3%) |
Race in Nashville
The most populous races in Nashville are Black / African American (3,470 | 61.7%), White / Caucasian (2,005 | 35.6%), and Two or more Races (111 | 2.0%).
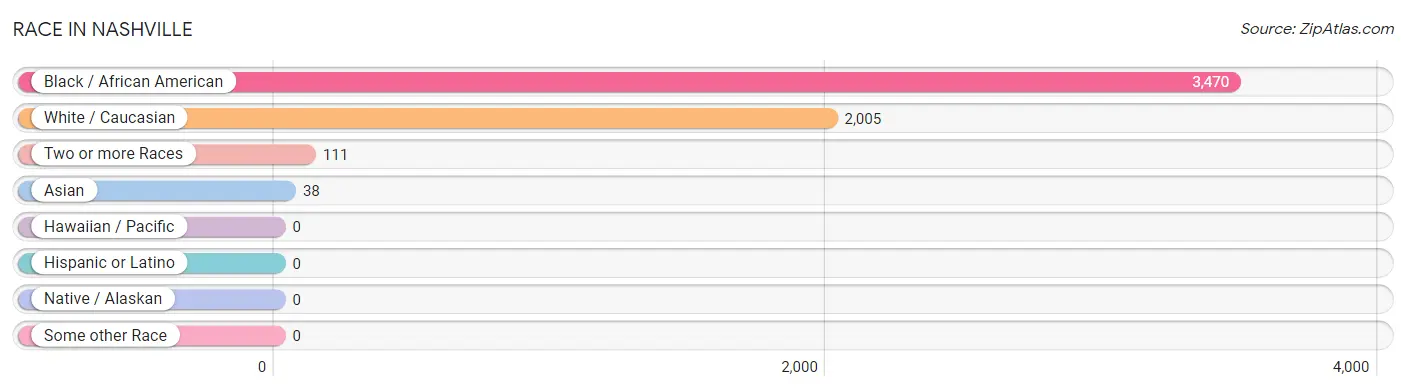
| Race | # Population | % Population |
| Asian | 38 | 0.7% |
| Black / African American | 3,470 | 61.7% |
| Hawaiian / Pacific | 0 | 0.0% |
| Hispanic or Latino | 0 | 0.0% |
| Native / Alaskan | 0 | 0.0% |
| White / Caucasian | 2,005 | 35.6% |
| Two or more Races | 111 | 2.0% |
| Some other Race | 0 | 0.0% |
| Total | 5,624 | 100.0% |
Ancestry in Nashville
The most populous ancestries reported in Nashville are English (532 | 9.5%), American (397 | 7.1%), Irish (237 | 4.2%), German (204 | 3.6%), and Scottish (97 | 1.7%), together accounting for 26.1% of all Nashville residents.
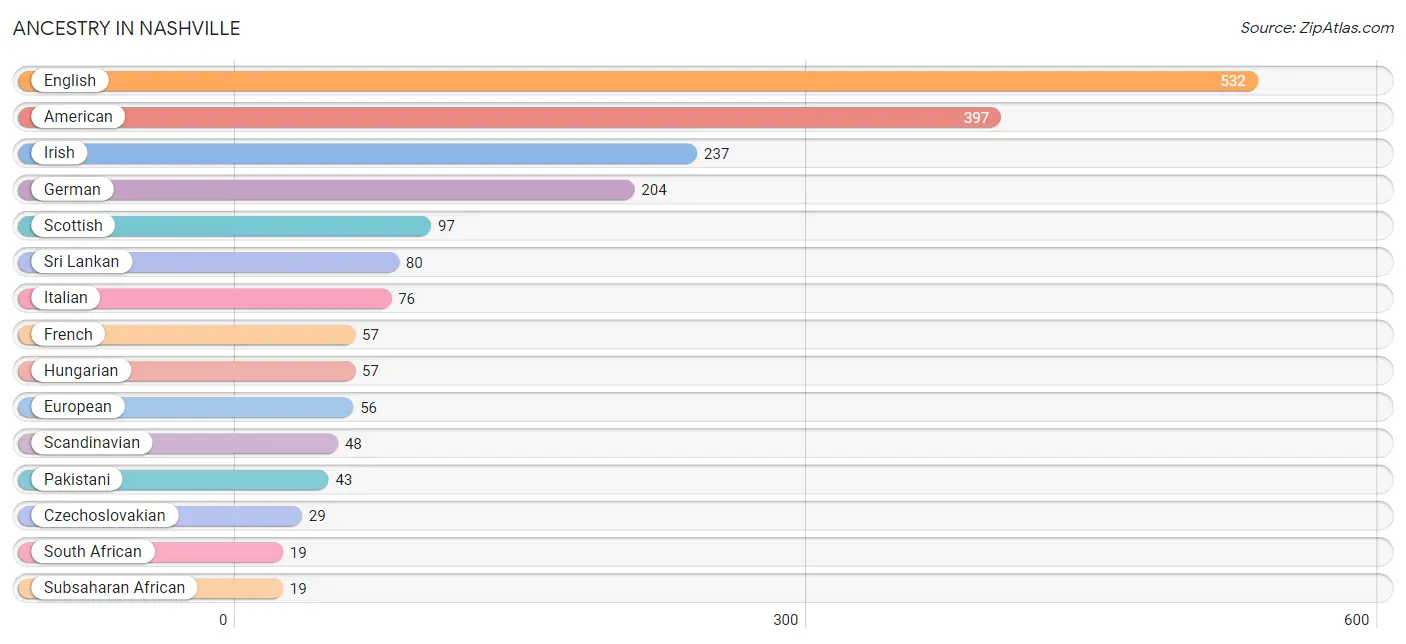
| Ancestry | # Population | % Population |
| American | 397 | 7.1% |
| Czechoslovakian | 29 | 0.5% |
| Dutch | 8 | 0.1% |
| English | 532 | 9.5% |
| European | 56 | 1.0% |
| French | 57 | 1.0% |
| German | 204 | 3.6% |
| Greek | 16 | 0.3% |
| Hungarian | 57 | 1.0% |
| Irish | 237 | 4.2% |
| Italian | 76 | 1.3% |
| Pakistani | 43 | 0.8% |
| Scandinavian | 48 | 0.9% |
| Scottish | 97 | 1.7% |
| South African | 19 | 0.3% |
| Sri Lankan | 80 | 1.4% |
| Subsaharan African | 19 | 0.3% |
| Ukrainian | 13 | 0.2% | View All 18 Rows |
Immigrants in Nashville
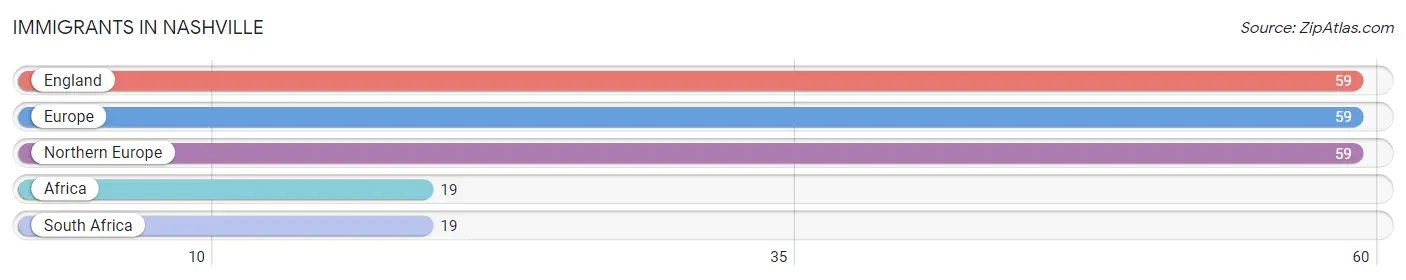
The most numerous immigrant groups reported in Nashville came from England (59 | 1.1%), Europe (59 | 1.1%), Northern Europe (59 | 1.1%), Africa (19 | 0.3%), and South Africa (19 | 0.3%), together accounting for 3.8% of all Nashville residents.
| Immigration Origin | # Population | % Population |
| Africa | 19 | 0.3% |
| England | 59 | 1.1% |
| Europe | 59 | 1.1% |
| Northern Europe | 59 | 1.1% |
| South Africa | 19 | 0.3% | View All 5 Rows |
Sex and Age in Nashville
Sex and Age in Nashville
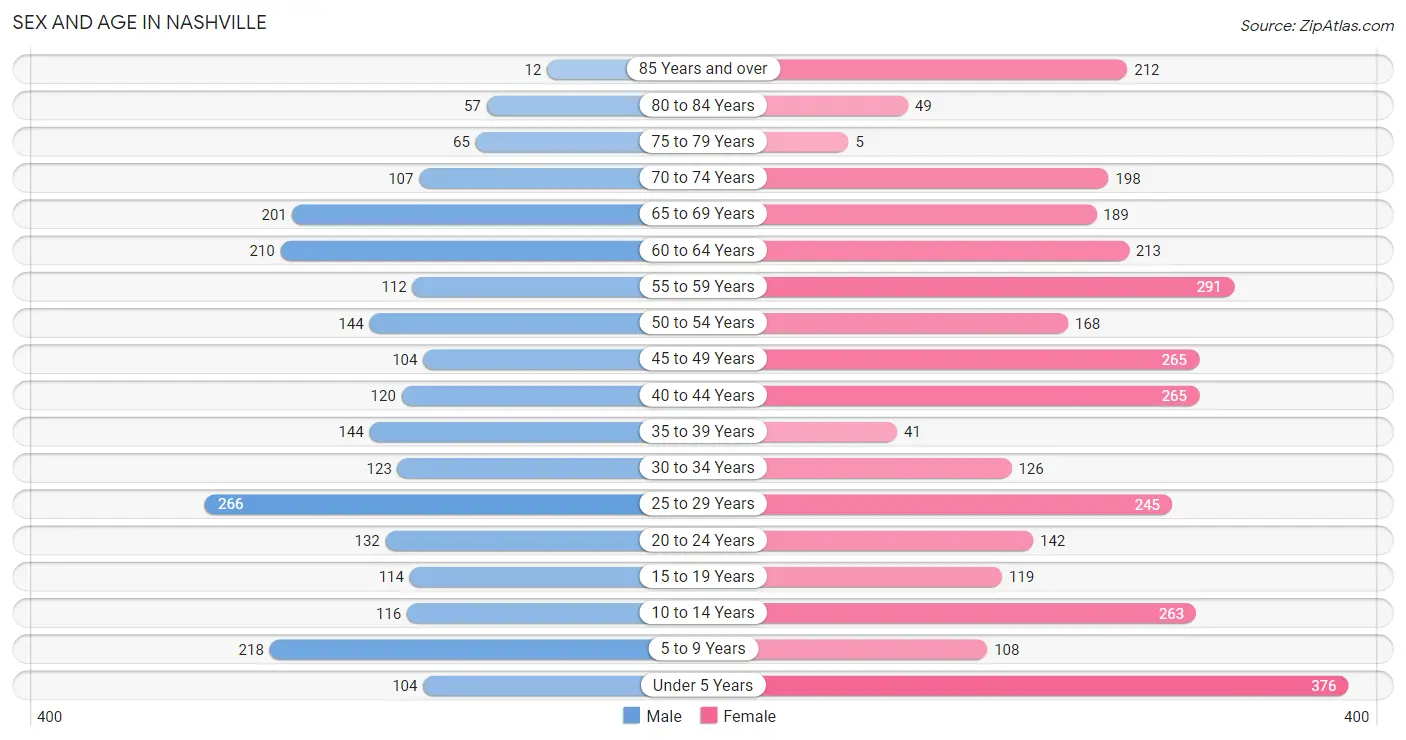
The most populous age groups in Nashville are 25 to 29 Years (266 | 11.3%) for men and Under 5 Years (376 | 11.5%) for women.
| Age Bracket | Male | Female |
| Under 5 Years | 104 (4.4%) | 376 (11.5%) |
| 5 to 9 Years | 218 (9.3%) | 108 (3.3%) |
| 10 to 14 Years | 116 (4.9%) | 263 (8.0%) |
| 15 to 19 Years | 114 (4.9%) | 119 (3.6%) |
| 20 to 24 Years | 132 (5.6%) | 142 (4.3%) |
| 25 to 29 Years | 266 (11.3%) | 245 (7.5%) |
| 30 to 34 Years | 123 (5.2%) | 126 (3.8%) |
| 35 to 39 Years | 144 (6.1%) | 41 (1.3%) |
| 40 to 44 Years | 120 (5.1%) | 265 (8.1%) |
| 45 to 49 Years | 104 (4.4%) | 265 (8.1%) |
| 50 to 54 Years | 144 (6.1%) | 168 (5.1%) |
| 55 to 59 Years | 112 (4.8%) | 291 (8.9%) |
| 60 to 64 Years | 210 (8.9%) | 213 (6.5%) |
| 65 to 69 Years | 201 (8.6%) | 189 (5.8%) |
| 70 to 74 Years | 107 (4.6%) | 198 (6.0%) |
| 75 to 79 Years | 65 (2.8%) | 5 (0.2%) |
| 80 to 84 Years | 57 (2.4%) | 49 (1.5%) |
| 85 Years and over | 12 (0.5%) | 212 (6.5%) |
| Total | 2,349 (100.0%) | 3,275 (100.0%) |
Families and Households in Nashville
Median Family Size in Nashville
The median family size in Nashville is 2.77 persons per family, with single male/father families (107 | 6.8%) accounting for the largest median family size of 3.1 persons per family. On the other hand, married-couple families (834 | 52.8%) represent the smallest median family size with 2.53 persons per family.
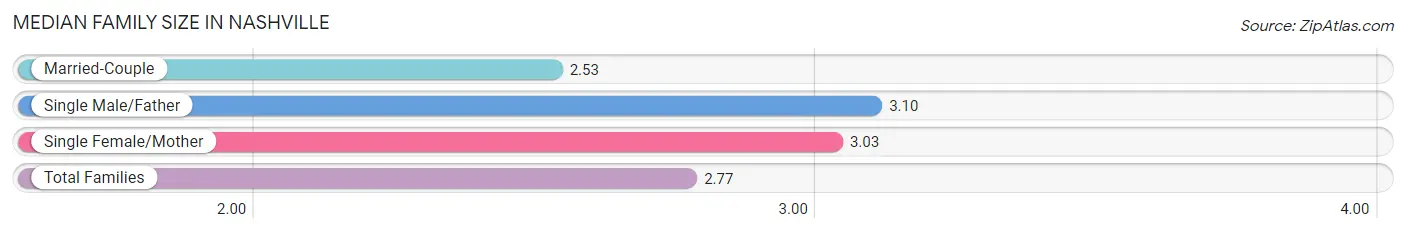
| Family Type | # Families | Family Size |
| Married-Couple | 834 (52.8%) | 2.53 |
| Single Male/Father | 107 (6.8%) | 3.10 |
| Single Female/Mother | 637 (40.4%) | 3.03 |
| Total Families | 1,578 (100.0%) | 2.77 |
Median Household Size in Nashville
The median household size in Nashville is 2.40 persons per household, with single male/father households (107 | 4.7%) accounting for the largest median household size of 3.5 persons per household. non-family households (719 | 31.3%) represent the smallest median household size with 1.30 persons per household.
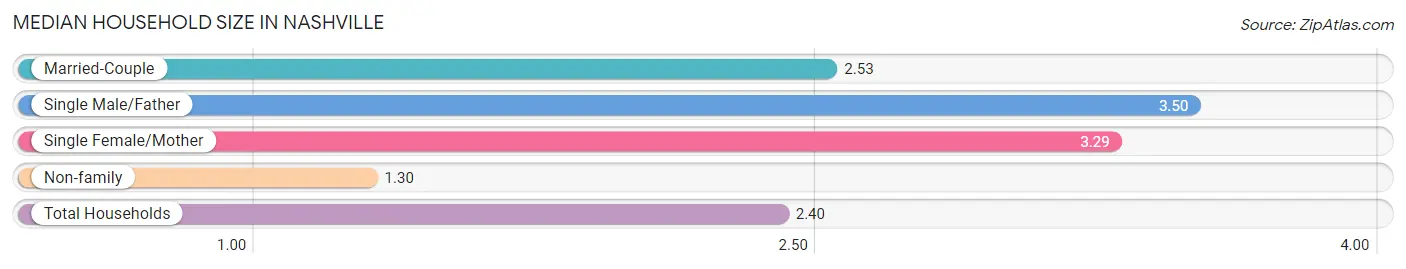
| Household Type | # Households | Household Size |
| Married-Couple | 834 (36.3%) | 2.53 |
| Single Male/Father | 107 (4.7%) | 3.50 |
| Single Female/Mother | 637 (27.7%) | 3.29 |
| Non-family | 719 (31.3%) | 1.30 |
| Total Households | 2,297 (100.0%) | 2.40 |
Household Size by Marriage Status in Nashville
Out of a total of 2,297 households in Nashville, 1,578 (68.7%) are family households, while 719 (31.3%) are nonfamily households. The most numerous type of family households are 2-person households, comprising 880, and the most common type of nonfamily households are 1-person households, comprising 615.
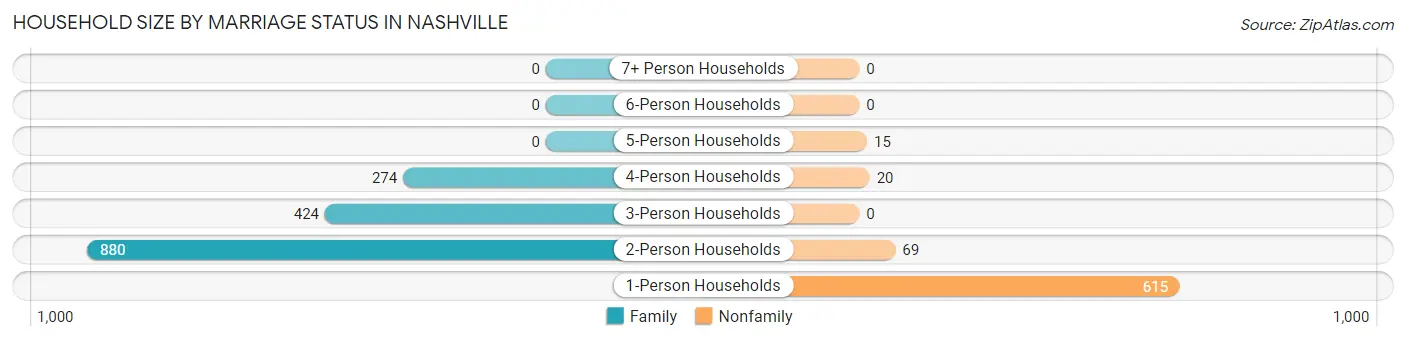
| Household Size | Family Households | Nonfamily Households |
| 1-Person Households | - | 615 (26.8%) |
| 2-Person Households | 880 (38.3%) | 69 (3.0%) |
| 3-Person Households | 424 (18.5%) | 0 (0.0%) |
| 4-Person Households | 274 (11.9%) | 20 (0.9%) |
| 5-Person Households | 0 (0.0%) | 15 (0.6%) |
| 6-Person Households | 0 (0.0%) | 0 (0.0%) |
| 7+ Person Households | 0 (0.0%) | 0 (0.0%) |
| Total | 1,578 (68.7%) | 719 (31.3%) |
Female Fertility in Nashville
Fertility by Age in Nashville
Average fertility rate in Nashville is 91.0 births per 1,000 women. Women in the age bracket of 20 to 34 years have the highest fertility rate with 181.0 births per 1,000 women. Women in the age bracket of 20 to 34 years acount for 81.6% of all women with births.
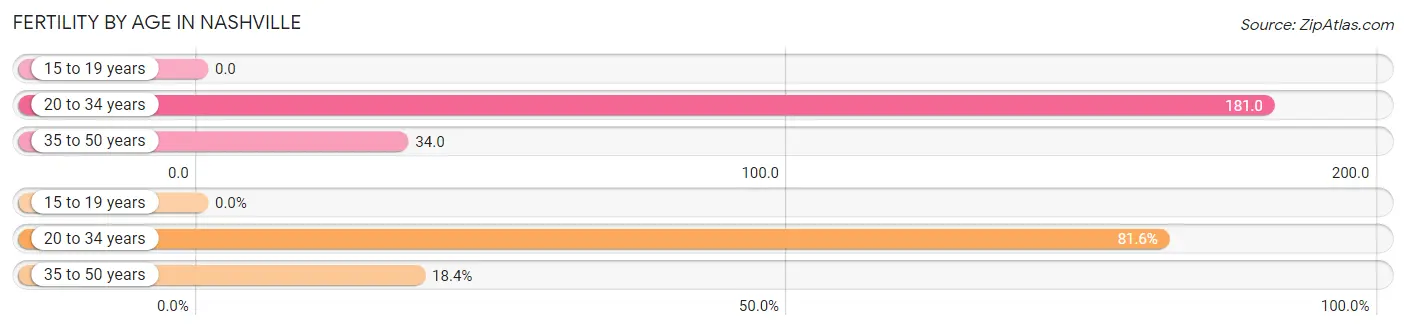
| Age Bracket | Women with Births | Births / 1,000 Women |
| 15 to 19 years | 0 (0.0%) | 0.0 |
| 20 to 34 years | 93 (81.6%) | 181.0 |
| 35 to 50 years | 21 (18.4%) | 34.0 |
| Total | 114 (100.0%) | 91.0 |
Fertility by Age by Marriage Status in Nashville
35.1% of women with births (114) in Nashville are married. The highest percentage of unmarried women with births falls into 20 to 34 years age bracket with 79.6% of them unmarried at the time of birth, while the lowest percentage of unmarried women with births belong to 35 to 50 years age bracket with 0.0% of them unmarried.
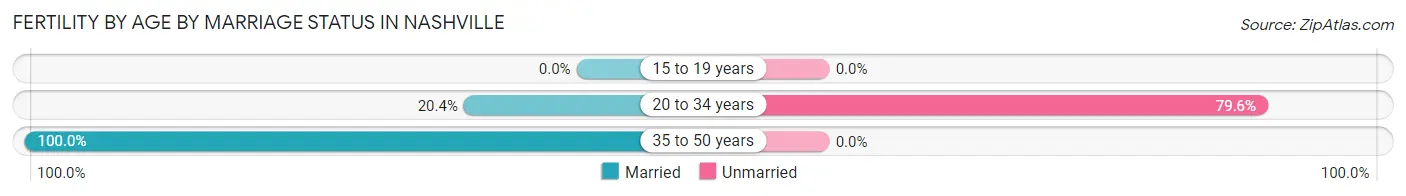
| Age Bracket | Married | Unmarried |
| 15 to 19 years | 0 (0.0%) | 0 (0.0%) |
| 20 to 34 years | 19 (20.4%) | 74 (79.6%) |
| 35 to 50 years | 21 (100.0%) | 0 (0.0%) |
| Total | 40 (35.1%) | 74 (64.9%) |
Fertility by Education in Nashville
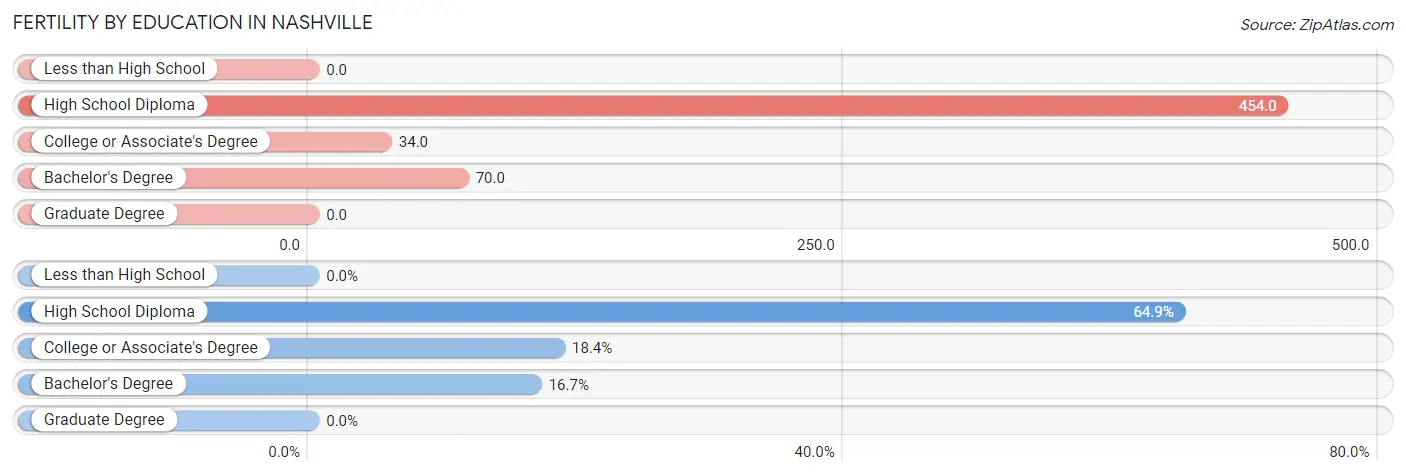
| Educational Attainment | Women with Births | Births / 1,000 Women |
| Less than High School | 0 (0.0%) | 0.0 |
| High School Diploma | 74 (64.9%) | 454.0 |
| College or Associate's Degree | 21 (18.4%) | 34.0 |
| Bachelor's Degree | 19 (16.7%) | 70.0 |
| Graduate Degree | 0 (0.0%) | 0.0 |
| Total | 114 (100.0%) | 91.0 |
Fertility by Education by Marriage Status in Nashville
64.9% of women with births in Nashville are unmarried. Women with the educational attainment of college or associate's degree are most likely to be married with 100.0% of them married at childbirth, while women with the educational attainment of high school diploma are least likely to be married with 100.0% of them unmarried at childbirth.
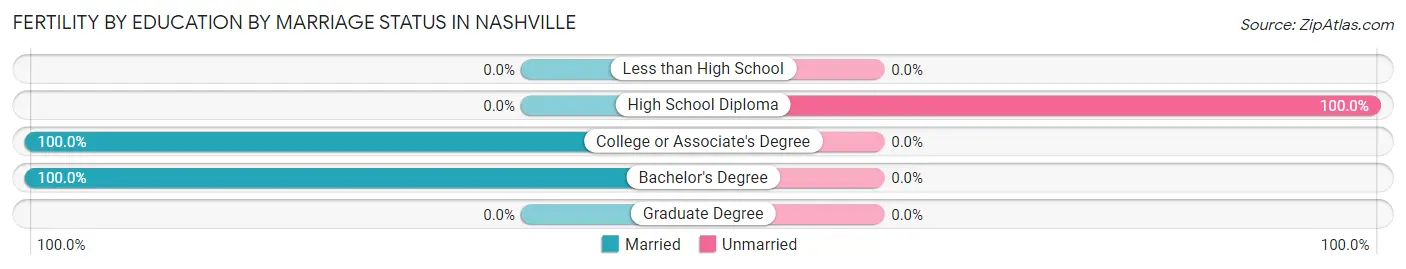
| Educational Attainment | Married | Unmarried |
| Less than High School | 0 (0.0%) | 0 (0.0%) |
| High School Diploma | 0 (0.0%) | 74 (100.0%) |
| College or Associate's Degree | 21 (100.0%) | 0 (0.0%) |
| Bachelor's Degree | 19 (100.0%) | 0 (0.0%) |
| Graduate Degree | 0 (0.0%) | 0 (0.0%) |
| Total | 40 (35.1%) | 74 (64.9%) |
Employment Characteristics in Nashville
Employment by Class of Employer in Nashville
Among the 2,608 employed individuals in Nashville, private company employees (1,796 | 68.9%), not-for-profit organizations (228 | 8.7%), and local government employees (196 | 7.5%) make up the most common classes of employment.
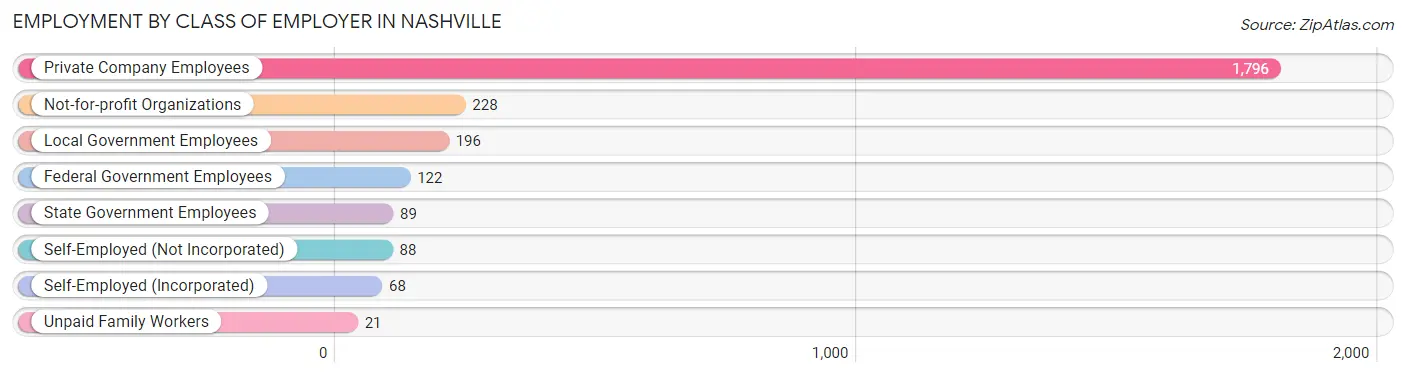
| Employer Class | # Employees | % Employees |
| Private Company Employees | 1,796 | 68.9% |
| Self-Employed (Incorporated) | 68 | 2.6% |
| Self-Employed (Not Incorporated) | 88 | 3.4% |
| Not-for-profit Organizations | 228 | 8.7% |
| Local Government Employees | 196 | 7.5% |
| State Government Employees | 89 | 3.4% |
| Federal Government Employees | 122 | 4.7% |
| Unpaid Family Workers | 21 | 0.8% |
| Total | 2,608 | 100.0% |
Employment Status by Age in Nashville
According to the labor force statistics for Nashville, out of the total population over 16 years of age (4,312), 70.3% or 3,031 individuals are in the labor force, with 11.5% or 349 of them unemployed. The age group with the highest labor force participation rate is 30 to 34 years, with 100.0% or 249 individuals in the labor force. Within the labor force, the 20 to 24 years age range has the highest percentage of unemployed individuals, with 30.7% or 75 of them being unemployed.
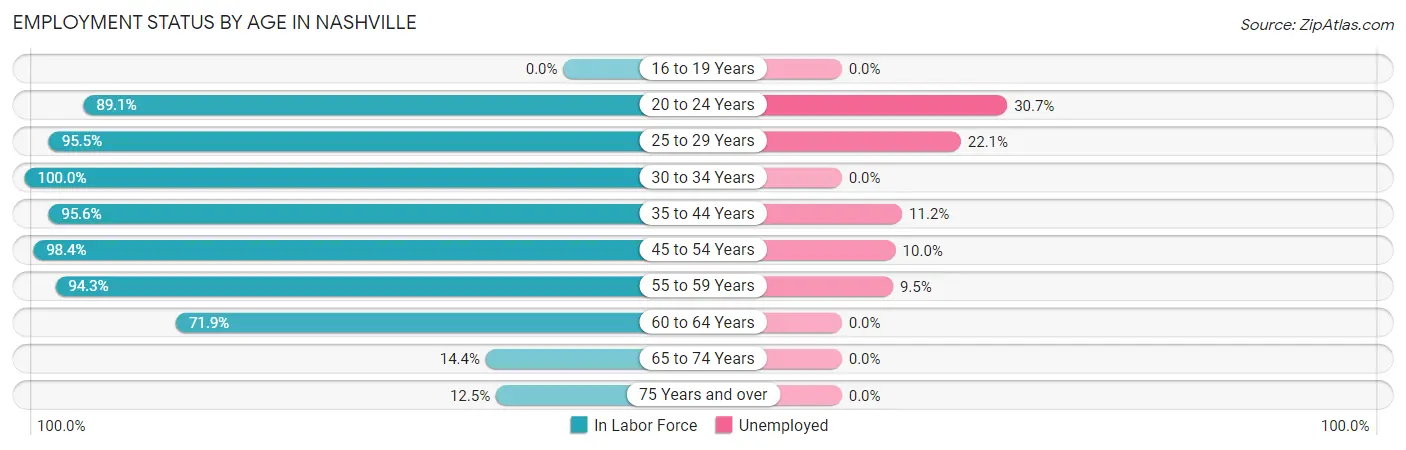
| Age Bracket | In Labor Force | Unemployed |
| 16 to 19 Years | 0 (0.0%) | 0 (0.0%) |
| 20 to 24 Years | 244 (89.1%) | 75 (30.7%) |
| 25 to 29 Years | 488 (95.5%) | 108 (22.1%) |
| 30 to 34 Years | 249 (100.0%) | 0 (0.0%) |
| 35 to 44 Years | 545 (95.6%) | 61 (11.2%) |
| 45 to 54 Years | 670 (98.4%) | 67 (10.0%) |
| 55 to 59 Years | 380 (94.3%) | 36 (9.5%) |
| 60 to 64 Years | 304 (71.9%) | 0 (0.0%) |
| 65 to 74 Years | 100 (14.4%) | 0 (0.0%) |
| 75 Years and over | 50 (12.5%) | 0 (0.0%) |
| Total | 3,031 (70.3%) | 349 (11.5%) |
Employment Status by Educational Attainment in Nashville
According to labor force statistics for Nashville, 92.9% of individuals (2,636) out of the total population between 25 and 64 years of age (2,837) are in the labor force, with 10.3% or 272 of them being unemployed. The group with the highest labor force participation rate are those with the educational attainment of bachelor's degree or higher, with 100.0% or 685 individuals in the labor force. Within the labor force, individuals with high school diploma education have the highest percentage of unemployment, with 28.5% or 165 of them being unemployed.
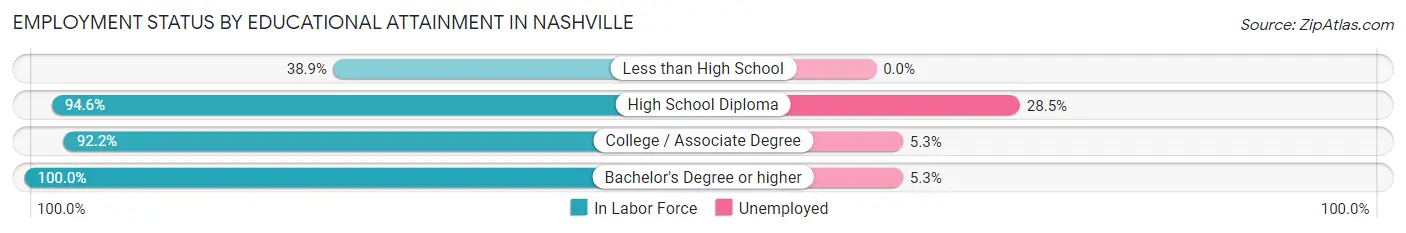
| Educational Attainment | In Labor Force | Unemployed |
| Less than High School | 35 (38.9%) | 0 (0.0%) |
| High School Diploma | 579 (94.6%) | 174 (28.5%) |
| College / Associate Degree | 1,337 (92.2%) | 77 (5.3%) |
| Bachelor's Degree or higher | 685 (100.0%) | 36 (5.3%) |
| Total | 2,636 (92.9%) | 292 (10.3%) |
Employment Occupations by Sex in Nashville
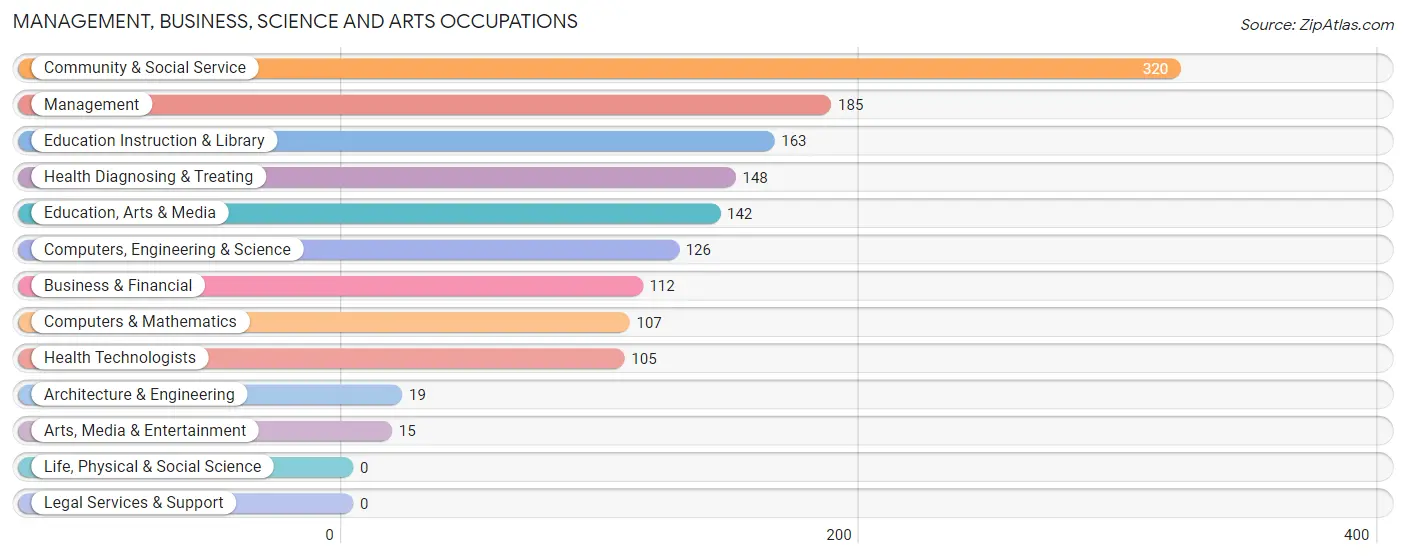
Management, Business, Science and Arts Occupations
The most common Management, Business, Science and Arts occupations in Nashville are Community & Social Service (320 | 11.9%), Management (185 | 6.9%), Education Instruction & Library (163 | 6.1%), Health Diagnosing & Treating (148 | 5.5%), and Education, Arts & Media (142 | 5.3%).
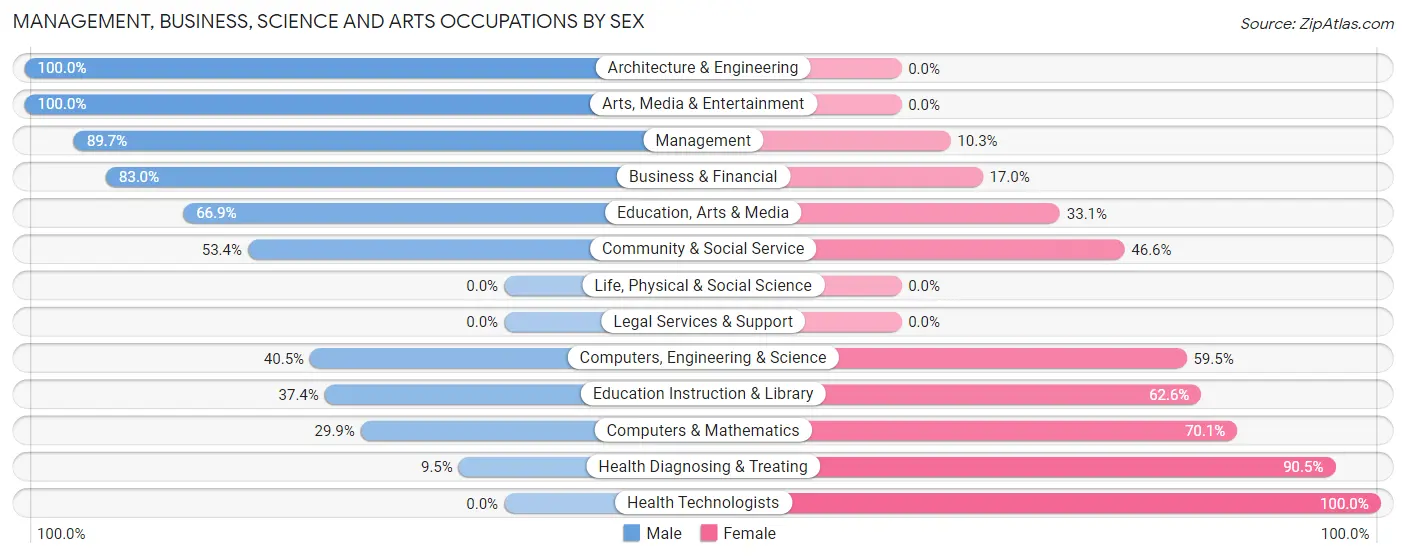
Management, Business, Science and Arts Occupations by Sex
Within the Management, Business, Science and Arts occupations in Nashville, the most male-oriented occupations are Architecture & Engineering (100.0%), Arts, Media & Entertainment (100.0%), and Management (89.7%), while the most female-oriented occupations are Health Technologists (100.0%), Health Diagnosing & Treating (90.5%), and Computers & Mathematics (70.1%).
| Occupation | Male | Female |
| Management | 166 (89.7%) | 19 (10.3%) |
| Business & Financial | 93 (83.0%) | 19 (17.0%) |
| Computers, Engineering & Science | 51 (40.5%) | 75 (59.5%) |
| Computers & Mathematics | 32 (29.9%) | 75 (70.1%) |
| Architecture & Engineering | 19 (100.0%) | 0 (0.0%) |
| Life, Physical & Social Science | 0 (0.0%) | 0 (0.0%) |
| Community & Social Service | 171 (53.4%) | 149 (46.6%) |
| Education, Arts & Media | 95 (66.9%) | 47 (33.1%) |
| Legal Services & Support | 0 (0.0%) | 0 (0.0%) |
| Education Instruction & Library | 61 (37.4%) | 102 (62.6%) |
| Arts, Media & Entertainment | 15 (100.0%) | 0 (0.0%) |
| Health Diagnosing & Treating | 14 (9.5%) | 134 (90.5%) |
| Health Technologists | 0 (0.0%) | 105 (100.0%) |
| Total (Category) | 495 (55.6%) | 396 (44.4%) |
| Total (Overall) | 1,128 (42.0%) | 1,555 (58.0%) |
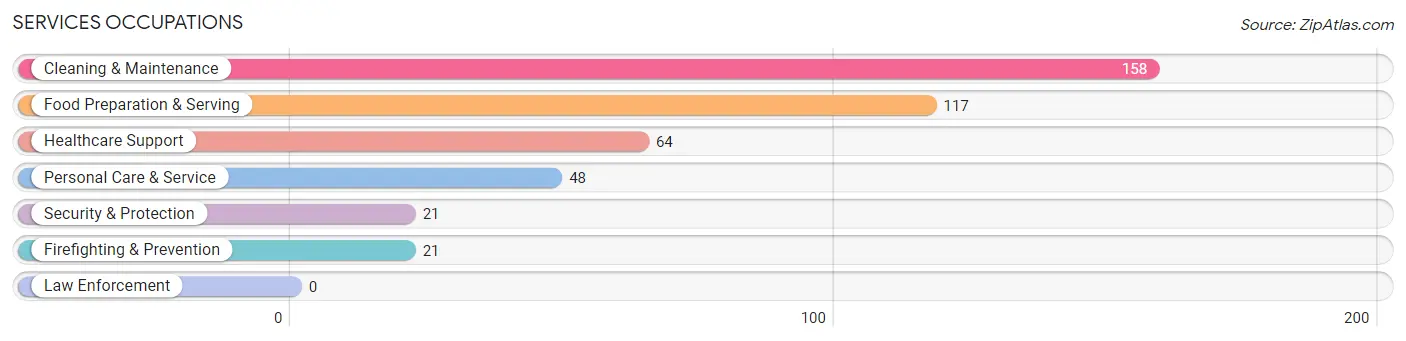
Services Occupations
The most common Services occupations in Nashville are Cleaning & Maintenance (158 | 5.9%), Food Preparation & Serving (117 | 4.4%), Healthcare Support (64 | 2.4%), Personal Care & Service (48 | 1.8%), and Security & Protection (21 | 0.8%).
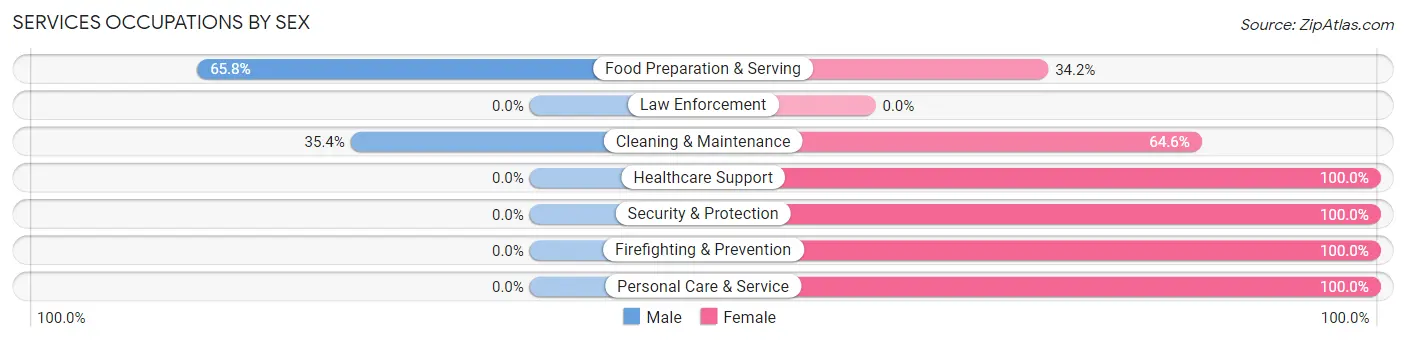
Services Occupations by Sex
Within the Services occupations in Nashville, the most male-oriented occupations are Food Preparation & Serving (65.8%), and Cleaning & Maintenance (35.4%), while the most female-oriented occupations are Healthcare Support (100.0%), Security & Protection (100.0%), and Firefighting & Prevention (100.0%).
| Occupation | Male | Female |
| Healthcare Support | 0 (0.0%) | 64 (100.0%) |
| Security & Protection | 0 (0.0%) | 21 (100.0%) |
| Firefighting & Prevention | 0 (0.0%) | 21 (100.0%) |
| Law Enforcement | 0 (0.0%) | 0 (0.0%) |
| Food Preparation & Serving | 77 (65.8%) | 40 (34.2%) |
| Cleaning & Maintenance | 56 (35.4%) | 102 (64.6%) |
| Personal Care & Service | 0 (0.0%) | 48 (100.0%) |
| Total (Category) | 133 (32.6%) | 275 (67.4%) |
| Total (Overall) | 1,128 (42.0%) | 1,555 (58.0%) |
Sales and Office Occupations
The most common Sales and Office occupations in Nashville are Office & Administration (375 | 14.0%), and Sales & Related (228 | 8.5%).

Sales and Office Occupations by Sex
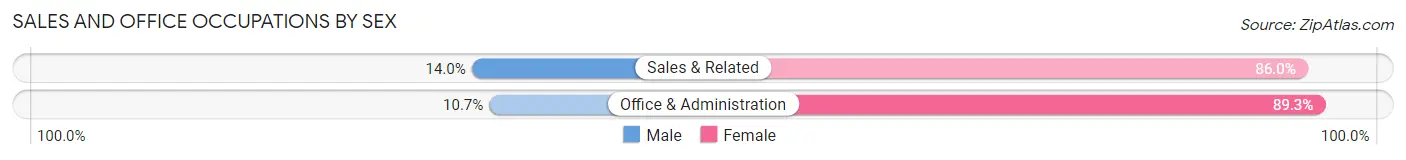
| Occupation | Male | Female |
| Sales & Related | 32 (14.0%) | 196 (86.0%) |
| Office & Administration | 40 (10.7%) | 335 (89.3%) |
| Total (Category) | 72 (11.9%) | 531 (88.1%) |
| Total (Overall) | 1,128 (42.0%) | 1,555 (58.0%) |
Natural Resources, Construction and Maintenance Occupations
The most common Natural Resources, Construction and Maintenance occupations in Nashville are Installation, Maintenance & Repair (110 | 4.1%), Construction & Extraction (48 | 1.8%), and Farming, Fishing & Forestry (43 | 1.6%).

Natural Resources, Construction and Maintenance Occupations by Sex
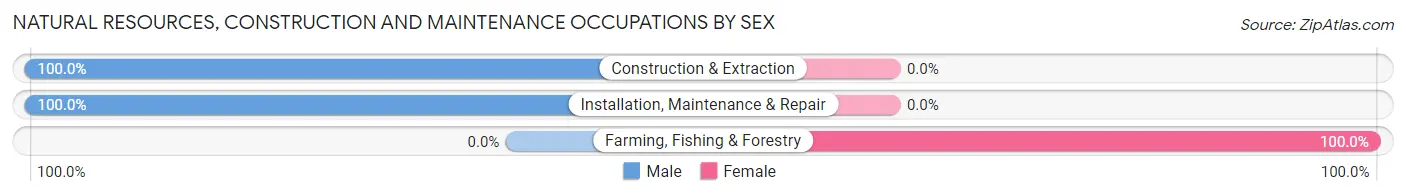
| Occupation | Male | Female |
| Farming, Fishing & Forestry | 0 (0.0%) | 43 (100.0%) |
| Construction & Extraction | 48 (100.0%) | 0 (0.0%) |
| Installation, Maintenance & Repair | 110 (100.0%) | 0 (0.0%) |
| Total (Category) | 158 (78.6%) | 43 (21.4%) |
| Total (Overall) | 1,128 (42.0%) | 1,555 (58.0%) |
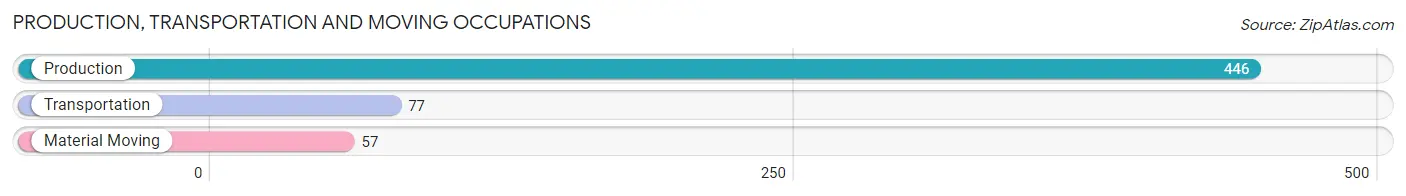
Production, Transportation and Moving Occupations
The most common Production, Transportation and Moving occupations in Nashville are Production (446 | 16.6%), Transportation (77 | 2.9%), and Material Moving (57 | 2.1%).
Production, Transportation and Moving Occupations by Sex
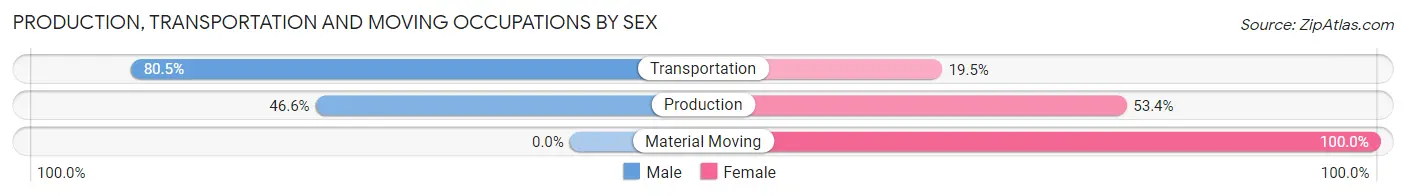
| Occupation | Male | Female |
| Production | 208 (46.6%) | 238 (53.4%) |
| Transportation | 62 (80.5%) | 15 (19.5%) |
| Material Moving | 0 (0.0%) | 57 (100.0%) |
| Total (Category) | 270 (46.6%) | 310 (53.4%) |
| Total (Overall) | 1,128 (42.0%) | 1,555 (58.0%) |
Employment Industries by Sex in Nashville
Employment Industries in Nashville
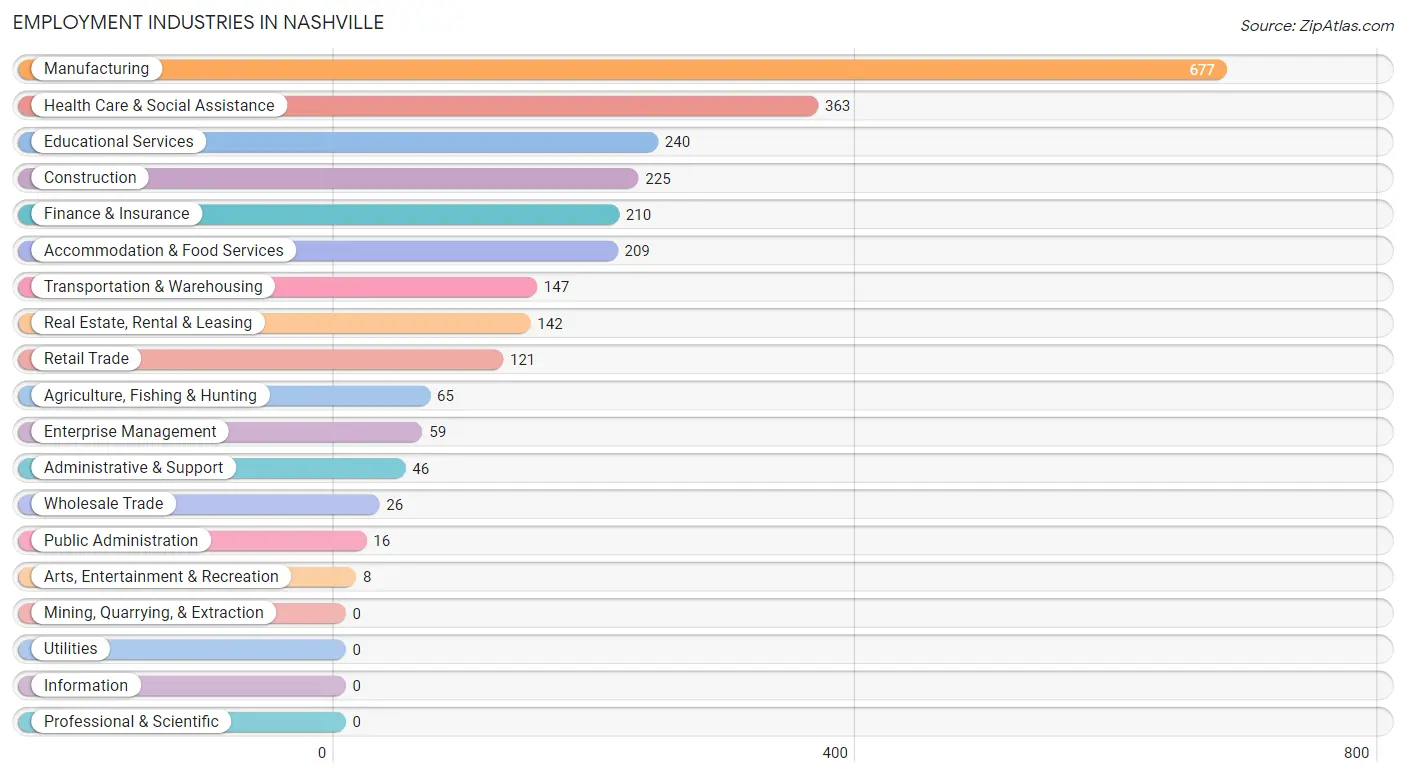
The major employment industries in Nashville include Manufacturing (677 | 25.2%), Health Care & Social Assistance (363 | 13.5%), Educational Services (240 | 8.9%), Construction (225 | 8.4%), and Finance & Insurance (210 | 7.8%).
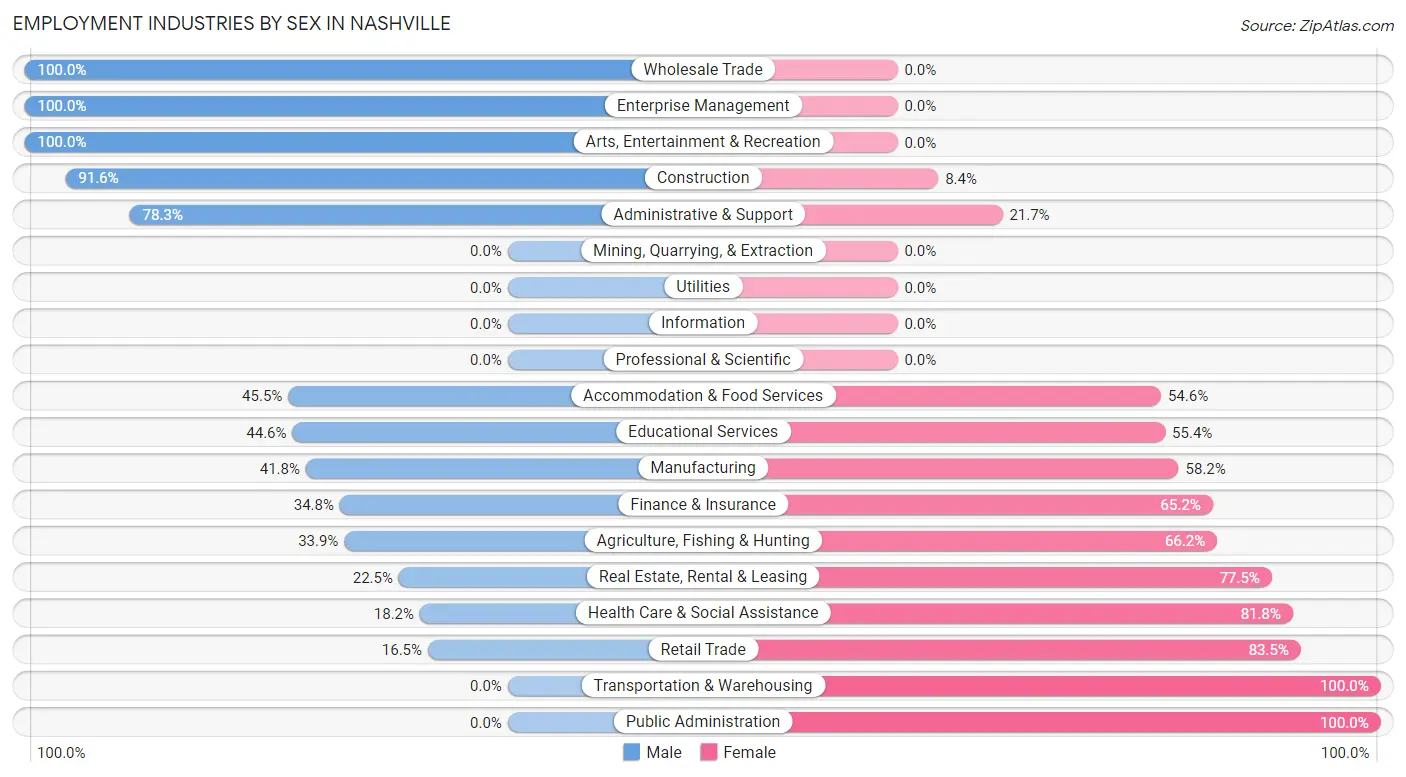
Employment Industries by Sex in Nashville
The Nashville industries that see more men than women are Wholesale Trade (100.0%), Enterprise Management (100.0%), and Arts, Entertainment & Recreation (100.0%), whereas the industries that tend to have a higher number of women are Transportation & Warehousing (100.0%), Public Administration (100.0%), and Retail Trade (83.5%).
| Industry | Male | Female |
| Agriculture, Fishing & Hunting | 22 (33.9%) | 43 (66.1%) |
| Mining, Quarrying, & Extraction | 0 (0.0%) | 0 (0.0%) |
| Construction | 206 (91.6%) | 19 (8.4%) |
| Manufacturing | 283 (41.8%) | 394 (58.2%) |
| Wholesale Trade | 26 (100.0%) | 0 (0.0%) |
| Retail Trade | 20 (16.5%) | 101 (83.5%) |
| Transportation & Warehousing | 0 (0.0%) | 147 (100.0%) |
| Utilities | 0 (0.0%) | 0 (0.0%) |
| Information | 0 (0.0%) | 0 (0.0%) |
| Finance & Insurance | 73 (34.8%) | 137 (65.2%) |
| Real Estate, Rental & Leasing | 32 (22.5%) | 110 (77.5%) |
| Professional & Scientific | 0 (0.0%) | 0 (0.0%) |
| Enterprise Management | 59 (100.0%) | 0 (0.0%) |
| Administrative & Support | 36 (78.3%) | 10 (21.7%) |
| Educational Services | 107 (44.6%) | 133 (55.4%) |
| Health Care & Social Assistance | 66 (18.2%) | 297 (81.8%) |
| Arts, Entertainment & Recreation | 8 (100.0%) | 0 (0.0%) |
| Accommodation & Food Services | 95 (45.5%) | 114 (54.5%) |
| Public Administration | 0 (0.0%) | 16 (100.0%) |
| Total | 1,128 (42.0%) | 1,555 (58.0%) |
Education in Nashville
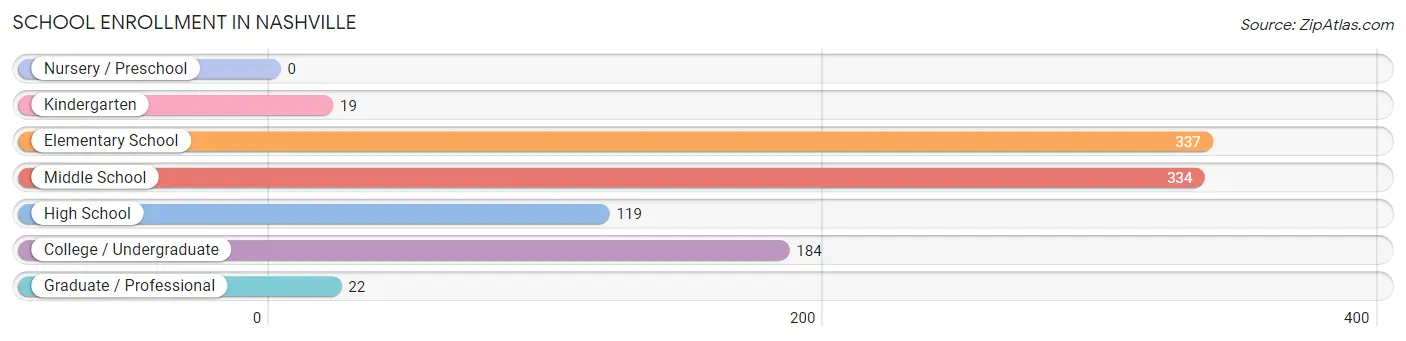
School Enrollment in Nashville
The most common levels of schooling among the 1,015 students in Nashville are elementary school (337 | 33.2%), middle school (334 | 32.9%), and college / undergraduate (184 | 18.1%).
| School Level | # Students | % Students |
| Nursery / Preschool | 0 | 0.0% |
| Kindergarten | 19 | 1.9% |
| Elementary School | 337 | 33.2% |
| Middle School | 334 | 32.9% |
| High School | 119 | 11.7% |
| College / Undergraduate | 184 | 18.1% |
| Graduate / Professional | 22 | 2.2% |
| Total | 1,015 | 100.0% |
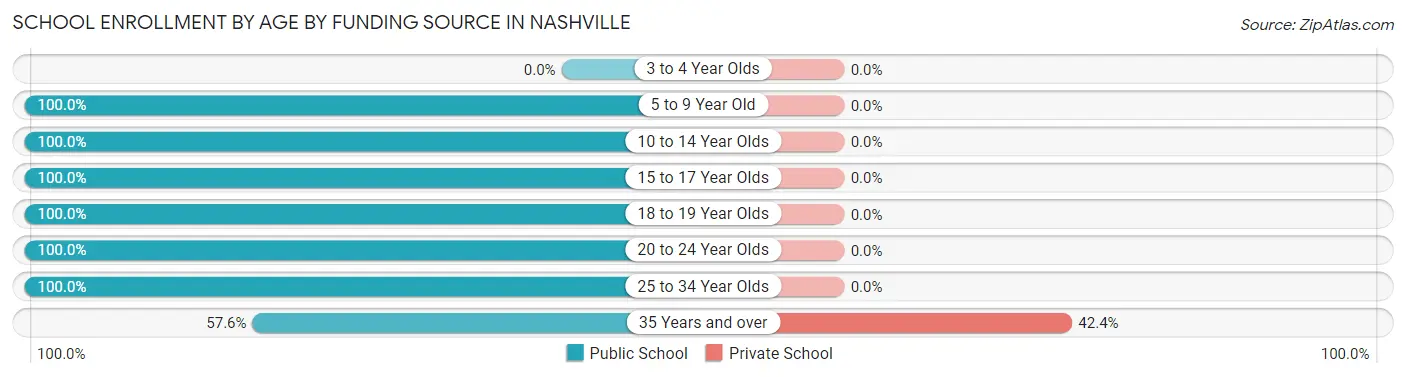
School Enrollment by Age by Funding Source in Nashville
Out of a total of 1,015 students who are enrolled in schools in Nashville, 28 (2.8%) attend a private institution, while the remaining 987 (97.2%) are enrolled in public schools. The age group of 35 years and over has the highest likelihood of being enrolled in private schools, with 28 (42.4% in the age bracket) enrolled. Conversely, the age group of 5 to 9 year old has the lowest likelihood of being enrolled in a private school, with 326 (100.0% in the age bracket) attending a public institution.
| Age Bracket | Public School | Private School |
| 3 to 4 Year Olds | 0 (0.0%) | 0 (0.0%) |
| 5 to 9 Year Old | 326 (100.0%) | 0 (0.0%) |
| 10 to 14 Year Olds | 364 (100.0%) | 0 (0.0%) |
| 15 to 17 Year Olds | 89 (100.0%) | 0 (0.0%) |
| 18 to 19 Year Olds | 30 (100.0%) | 0 (0.0%) |
| 20 to 24 Year Olds | 95 (100.0%) | 0 (0.0%) |
| 25 to 34 Year Olds | 45 (100.0%) | 0 (0.0%) |
| 35 Years and over | 38 (57.6%) | 28 (42.4%) |
| Total | 987 (97.2%) | 28 (2.8%) |
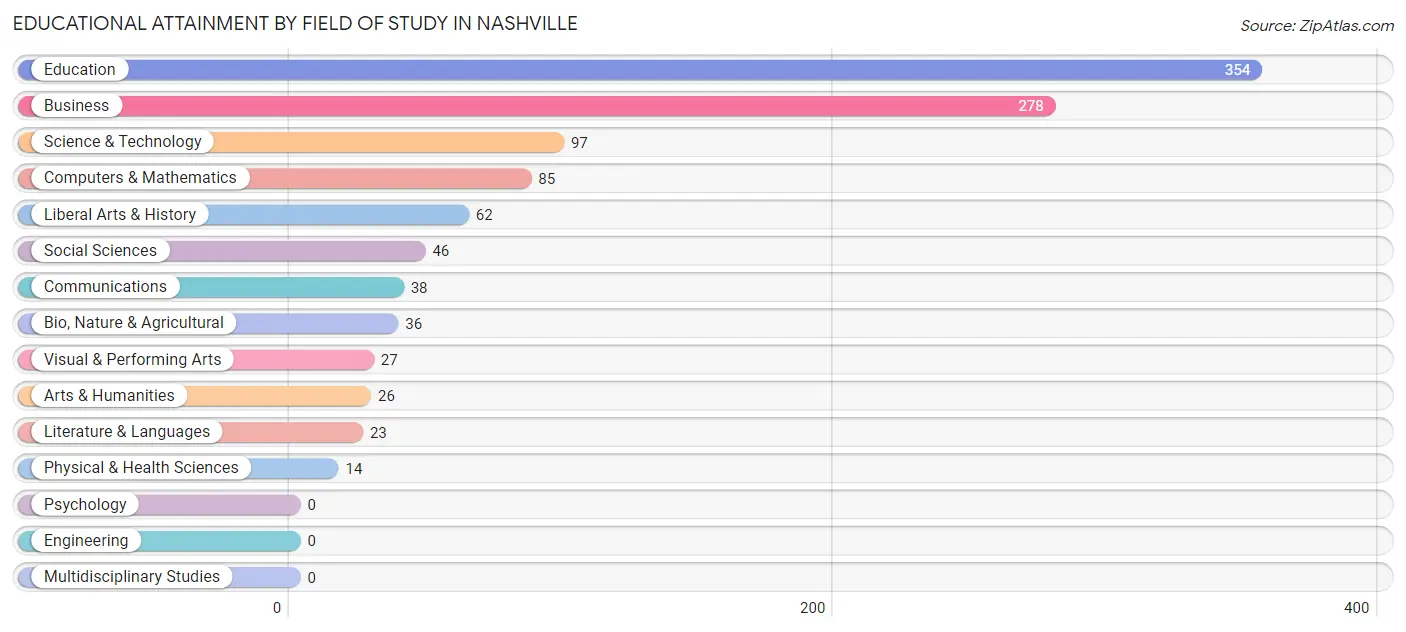
Educational Attainment by Field of Study in Nashville
Education (354 | 32.6%), business (278 | 25.6%), science & technology (97 | 8.9%), computers & mathematics (85 | 7.8%), and liberal arts & history (62 | 5.7%) are the most common fields of study among 1,086 individuals in Nashville who have obtained a bachelor's degree or higher.
| Field of Study | # Graduates | % Graduates |
| Computers & Mathematics | 85 | 7.8% |
| Bio, Nature & Agricultural | 36 | 3.3% |
| Physical & Health Sciences | 14 | 1.3% |
| Psychology | 0 | 0.0% |
| Social Sciences | 46 | 4.2% |
| Engineering | 0 | 0.0% |
| Multidisciplinary Studies | 0 | 0.0% |
| Science & Technology | 97 | 8.9% |
| Business | 278 | 25.6% |
| Education | 354 | 32.6% |
| Literature & Languages | 23 | 2.1% |
| Liberal Arts & History | 62 | 5.7% |
| Visual & Performing Arts | 27 | 2.5% |
| Communications | 38 | 3.5% |
| Arts & Humanities | 26 | 2.4% |
| Total | 1,086 | 100.0% |
Transportation & Commute in Nashville
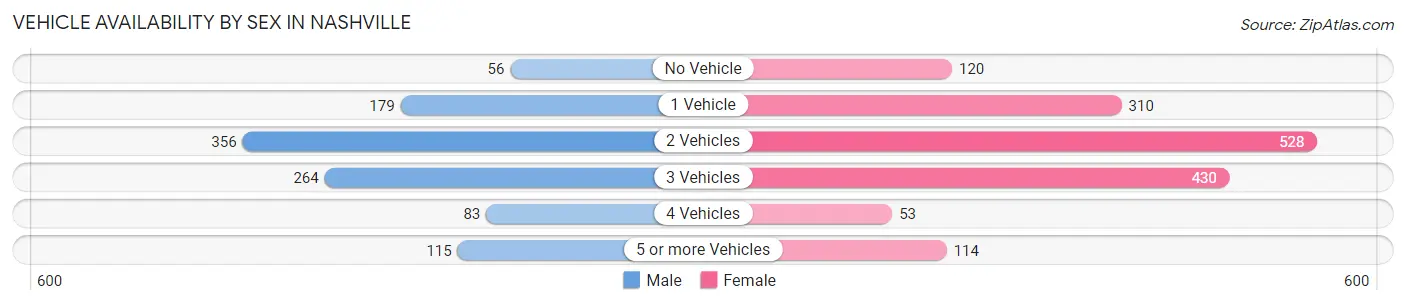
Vehicle Availability by Sex in Nashville
The most prevalent vehicle ownership categories in Nashville are males with 2 vehicles (356, accounting for 33.8%) and females with 2 vehicles (528, making up 22.9%).
| Vehicles Available | Male | Female |
| No Vehicle | 56 (5.3%) | 120 (7.7%) |
| 1 Vehicle | 179 (17.0%) | 310 (19.9%) |
| 2 Vehicles | 356 (33.8%) | 528 (34.0%) |
| 3 Vehicles | 264 (25.1%) | 430 (27.7%) |
| 4 Vehicles | 83 (7.9%) | 53 (3.4%) |
| 5 or more Vehicles | 115 (10.9%) | 114 (7.3%) |
| Total | 1,053 (100.0%) | 1,555 (100.0%) |
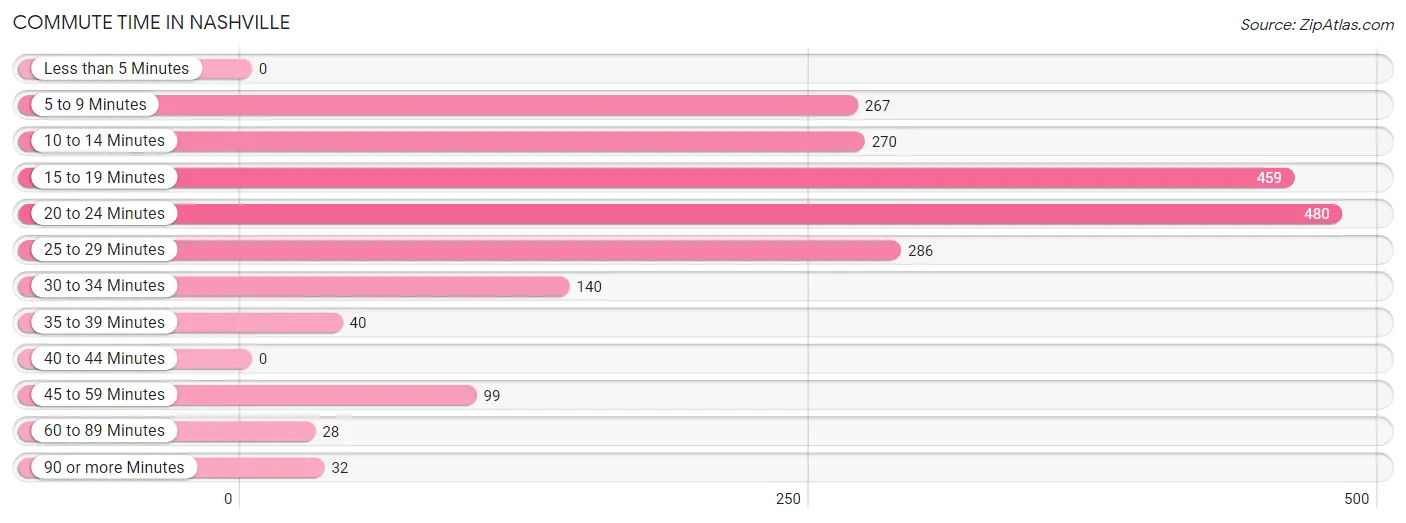
Commute Time in Nashville
The most frequently occuring commute durations in Nashville are 20 to 24 minutes (480 commuters, 22.9%), 15 to 19 minutes (459 commuters, 21.8%), and 25 to 29 minutes (286 commuters, 13.6%).
| Commute Time | # Commuters | % Commuters |
| Less than 5 Minutes | 0 | 0.0% |
| 5 to 9 Minutes | 267 | 12.7% |
| 10 to 14 Minutes | 270 | 12.9% |
| 15 to 19 Minutes | 459 | 21.8% |
| 20 to 24 Minutes | 480 | 22.9% |
| 25 to 29 Minutes | 286 | 13.6% |
| 30 to 34 Minutes | 140 | 6.7% |
| 35 to 39 Minutes | 40 | 1.9% |
| 40 to 44 Minutes | 0 | 0.0% |
| 45 to 59 Minutes | 99 | 4.7% |
| 60 to 89 Minutes | 28 | 1.3% |
| 90 or more Minutes | 32 | 1.5% |
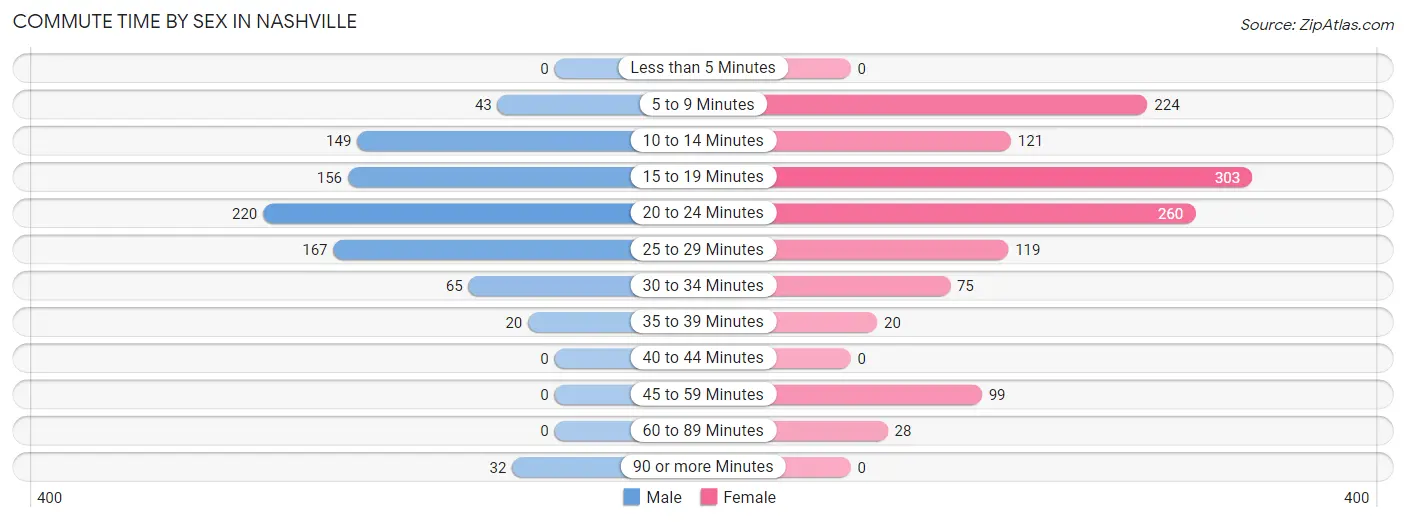
Commute Time by Sex in Nashville
The most common commute times in Nashville are 20 to 24 minutes (220 commuters, 25.8%) for males and 15 to 19 minutes (303 commuters, 24.3%) for females.
| Commute Time | Male | Female |
| Less than 5 Minutes | 0 (0.0%) | 0 (0.0%) |
| 5 to 9 Minutes | 43 (5.1%) | 224 (17.9%) |
| 10 to 14 Minutes | 149 (17.5%) | 121 (9.7%) |
| 15 to 19 Minutes | 156 (18.3%) | 303 (24.3%) |
| 20 to 24 Minutes | 220 (25.8%) | 260 (20.8%) |
| 25 to 29 Minutes | 167 (19.6%) | 119 (9.5%) |
| 30 to 34 Minutes | 65 (7.6%) | 75 (6.0%) |
| 35 to 39 Minutes | 20 (2.4%) | 20 (1.6%) |
| 40 to 44 Minutes | 0 (0.0%) | 0 (0.0%) |
| 45 to 59 Minutes | 0 (0.0%) | 99 (7.9%) |
| 60 to 89 Minutes | 0 (0.0%) | 28 (2.2%) |
| 90 or more Minutes | 32 (3.8%) | 0 (0.0%) |
Time of Departure to Work by Sex in Nashville
The most frequent times of departure to work in Nashville are 4:00 PM to 11:59 PM (233, 27.4%) for males and 7:30 AM to 7:59 AM (298, 23.9%) for females.
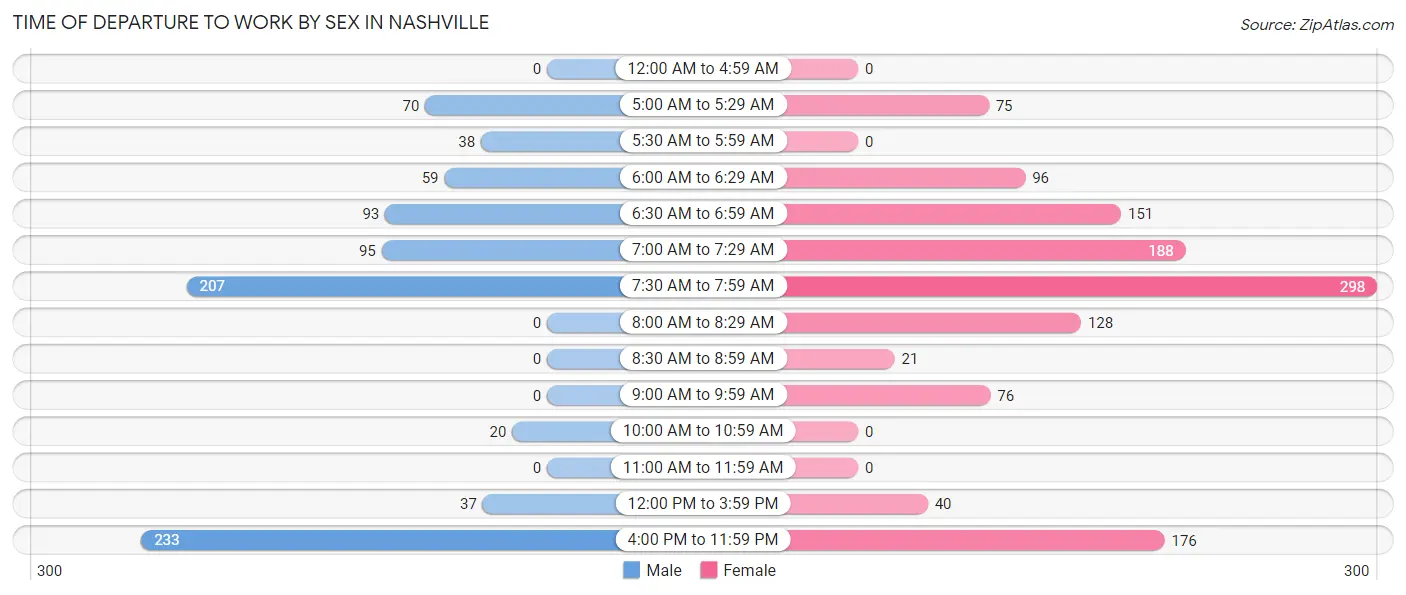
| Time of Departure | Male | Female |
| 12:00 AM to 4:59 AM | 0 (0.0%) | 0 (0.0%) |
| 5:00 AM to 5:29 AM | 70 (8.2%) | 75 (6.0%) |
| 5:30 AM to 5:59 AM | 38 (4.5%) | 0 (0.0%) |
| 6:00 AM to 6:29 AM | 59 (6.9%) | 96 (7.7%) |
| 6:30 AM to 6:59 AM | 93 (10.9%) | 151 (12.1%) |
| 7:00 AM to 7:29 AM | 95 (11.2%) | 188 (15.0%) |
| 7:30 AM to 7:59 AM | 207 (24.3%) | 298 (23.9%) |
| 8:00 AM to 8:29 AM | 0 (0.0%) | 128 (10.2%) |
| 8:30 AM to 8:59 AM | 0 (0.0%) | 21 (1.7%) |
| 9:00 AM to 9:59 AM | 0 (0.0%) | 76 (6.1%) |
| 10:00 AM to 10:59 AM | 20 (2.4%) | 0 (0.0%) |
| 11:00 AM to 11:59 AM | 0 (0.0%) | 0 (0.0%) |
| 12:00 PM to 3:59 PM | 37 (4.3%) | 40 (3.2%) |
| 4:00 PM to 11:59 PM | 233 (27.4%) | 176 (14.1%) |
| Total | 852 (100.0%) | 1,249 (100.0%) |
Housing Occupancy in Nashville
Occupancy by Ownership in Nashville
Of the total 2,297 dwellings in Nashville, owner-occupied units account for 1,306 (56.9%), while renter-occupied units make up 991 (43.1%).
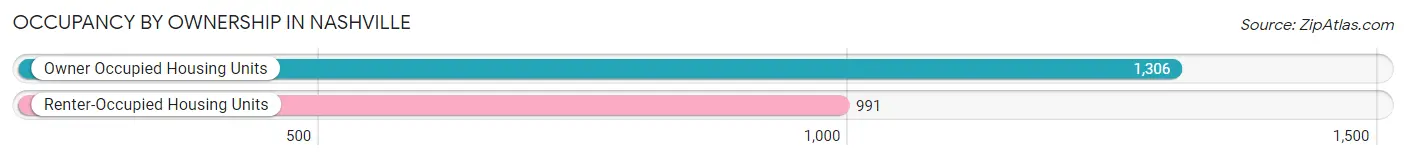
| Occupancy | # Housing Units | % Housing Units |
| Owner Occupied Housing Units | 1,306 | 56.9% |
| Renter-Occupied Housing Units | 991 | 43.1% |
| Total Occupied Housing Units | 2,297 | 100.0% |
Occupancy by Household Size in Nashville
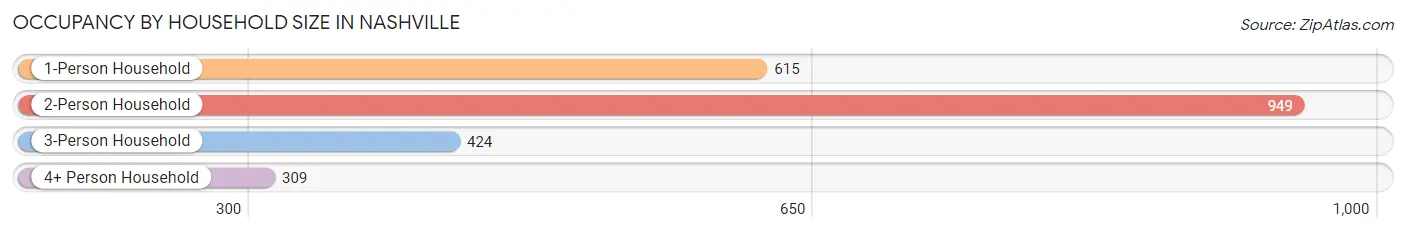
| Household Size | # Housing Units | % Housing Units |
| 1-Person Household | 615 | 26.8% |
| 2-Person Household | 949 | 41.3% |
| 3-Person Household | 424 | 18.5% |
| 4+ Person Household | 309 | 13.5% |
| Total Housing Units | 2,297 | 100.0% |
Occupancy by Ownership by Household Size in Nashville
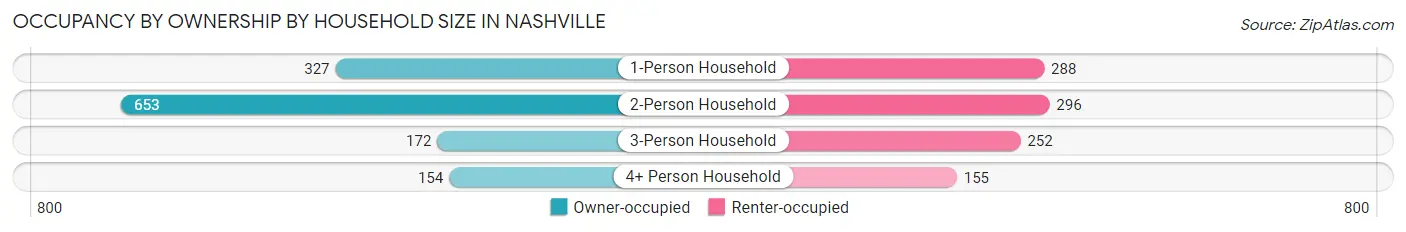
| Household Size | Owner-occupied | Renter-occupied |
| 1-Person Household | 327 (53.2%) | 288 (46.8%) |
| 2-Person Household | 653 (68.8%) | 296 (31.2%) |
| 3-Person Household | 172 (40.6%) | 252 (59.4%) |
| 4+ Person Household | 154 (49.8%) | 155 (50.2%) |
| Total Housing Units | 1,306 (56.9%) | 991 (43.1%) |
Occupancy by Educational Attainment in Nashville
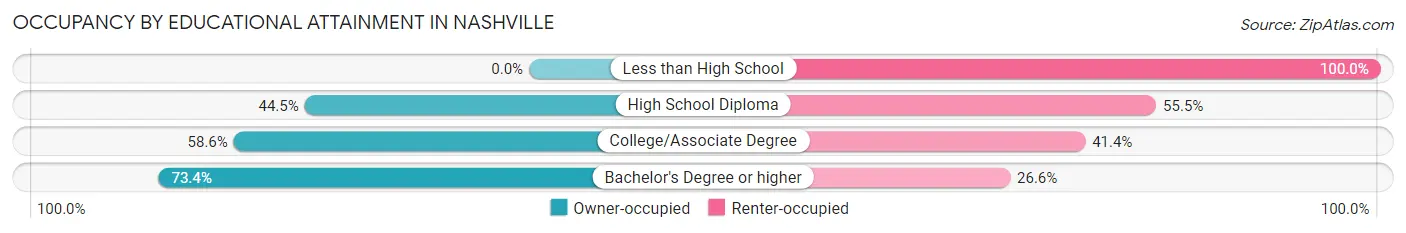
| Household Size | Owner-occupied | Renter-occupied |
| Less than High School | 0 (0.0%) | 104 (100.0%) |
| High School Diploma | 202 (44.5%) | 252 (55.5%) |
| College/Associate Degree | 681 (58.6%) | 482 (41.4%) |
| Bachelor's Degree or higher | 423 (73.4%) | 153 (26.6%) |
Occupancy by Age of Householder in Nashville
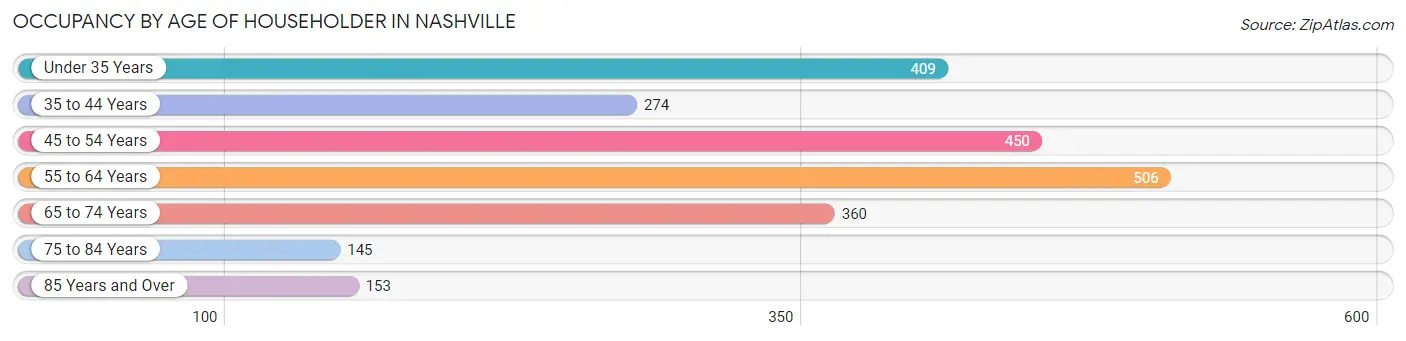
| Age Bracket | # Households | % Households |
| Under 35 Years | 409 | 17.8% |
| 35 to 44 Years | 274 | 11.9% |
| 45 to 54 Years | 450 | 19.6% |
| 55 to 64 Years | 506 | 22.0% |
| 65 to 74 Years | 360 | 15.7% |
| 75 to 84 Years | 145 | 6.3% |
| 85 Years and Over | 153 | 6.7% |
| Total | 2,297 | 100.0% |
Housing Finances in Nashville
Median Income by Occupancy in Nashville
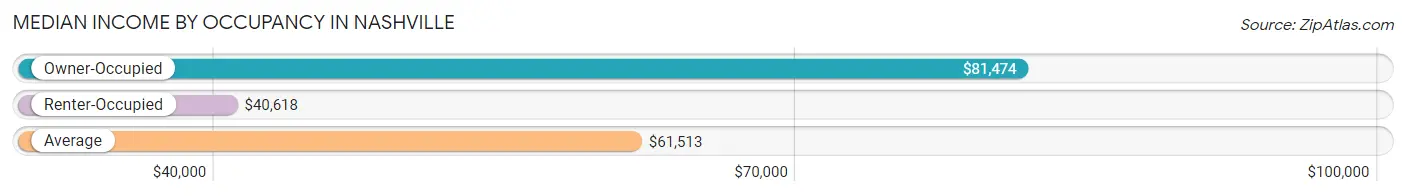
| Occupancy Type | # Households | Median Income |
| Owner-Occupied | 1,306 (56.9%) | $81,474 |
| Renter-Occupied | 991 (43.1%) | $40,618 |
| Average | 2,297 (100.0%) | $61,513 |
Occupancy by Householder Income Bracket in Nashville
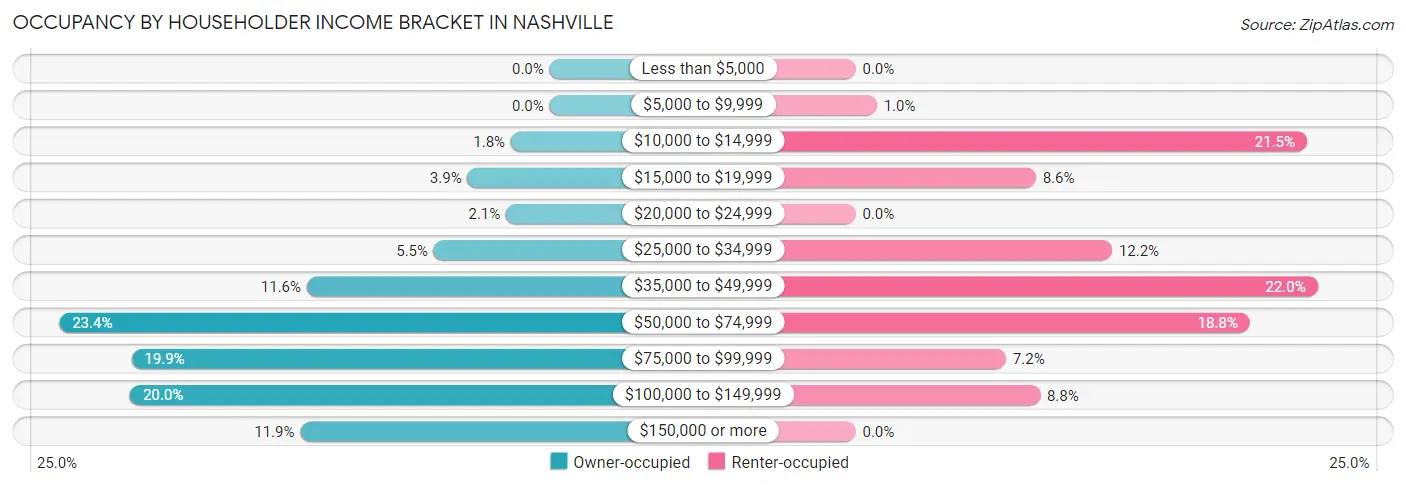
| Income Bracket | Owner-occupied | Renter-occupied |
| Less than $5,000 | 0 (0.0%) | 0 (0.0%) |
| $5,000 to $9,999 | 0 (0.0%) | 10 (1.0%) |
| $10,000 to $14,999 | 24 (1.8%) | 213 (21.5%) |
| $15,000 to $19,999 | 51 (3.9%) | 85 (8.6%) |
| $20,000 to $24,999 | 27 (2.1%) | 0 (0.0%) |
| $25,000 to $34,999 | 72 (5.5%) | 121 (12.2%) |
| $35,000 to $49,999 | 151 (11.6%) | 218 (22.0%) |
| $50,000 to $74,999 | 305 (23.4%) | 186 (18.8%) |
| $75,000 to $99,999 | 260 (19.9%) | 71 (7.2%) |
| $100,000 to $149,999 | 261 (20.0%) | 87 (8.8%) |
| $150,000 or more | 155 (11.9%) | 0 (0.0%) |
| Total | 1,306 (100.0%) | 991 (100.0%) |
Monthly Housing Cost Tiers in Nashville
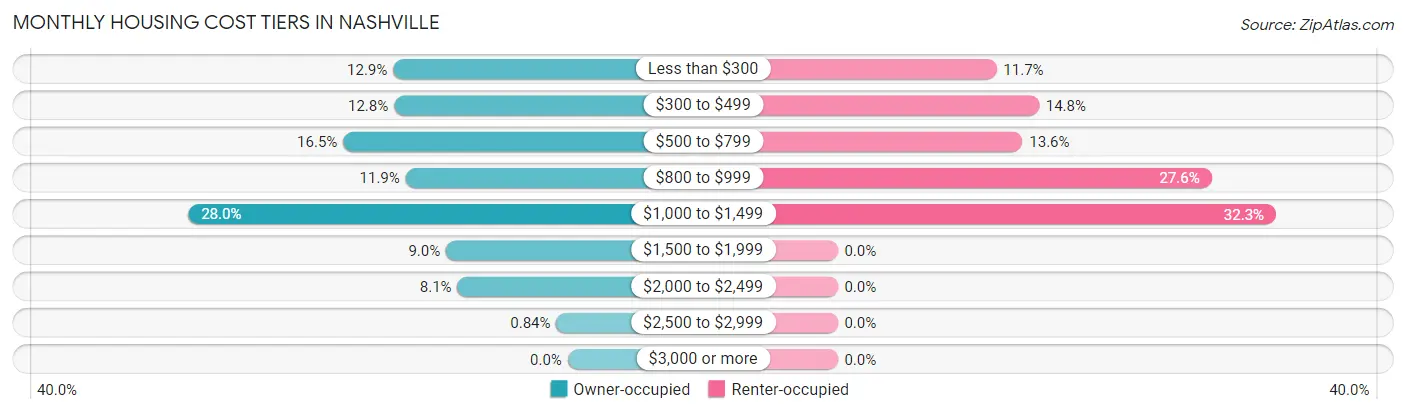
| Monthly Cost | Owner-occupied | Renter-occupied |
| Less than $300 | 168 (12.9%) | 116 (11.7%) |
| $300 to $499 | 167 (12.8%) | 147 (14.8%) |
| $500 to $799 | 216 (16.5%) | 135 (13.6%) |
| $800 to $999 | 156 (11.9%) | 273 (27.6%) |
| $1,000 to $1,499 | 365 (28.0%) | 320 (32.3%) |
| $1,500 to $1,999 | 117 (9.0%) | 0 (0.0%) |
| $2,000 to $2,499 | 106 (8.1%) | 0 (0.0%) |
| $2,500 to $2,999 | 11 (0.8%) | 0 (0.0%) |
| $3,000 or more | 0 (0.0%) | 0 (0.0%) |
| Total | 1,306 (100.0%) | 991 (100.0%) |
Physical Housing Characteristics in Nashville
Housing Structures in Nashville
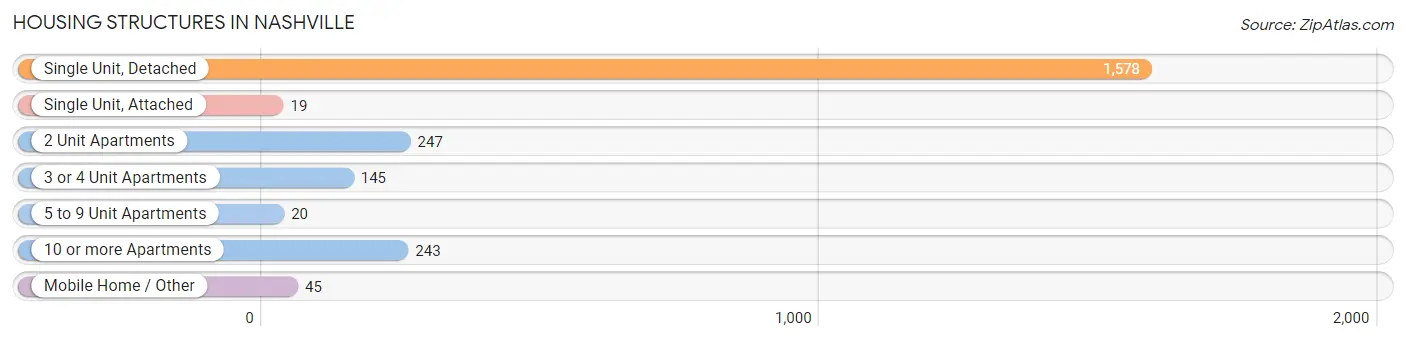
| Structure Type | # Housing Units | % Housing Units |
| Single Unit, Detached | 1,578 | 68.7% |
| Single Unit, Attached | 19 | 0.8% |
| 2 Unit Apartments | 247 | 10.7% |
| 3 or 4 Unit Apartments | 145 | 6.3% |
| 5 to 9 Unit Apartments | 20 | 0.9% |
| 10 or more Apartments | 243 | 10.6% |
| Mobile Home / Other | 45 | 2.0% |
| Total | 2,297 | 100.0% |
Housing Structures by Occupancy in Nashville
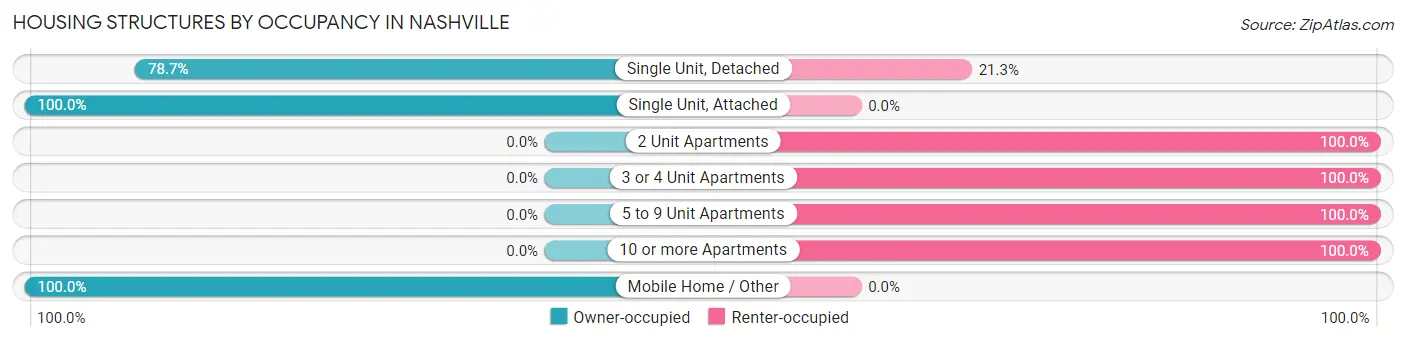
| Structure Type | Owner-occupied | Renter-occupied |
| Single Unit, Detached | 1,242 (78.7%) | 336 (21.3%) |
| Single Unit, Attached | 19 (100.0%) | 0 (0.0%) |
| 2 Unit Apartments | 0 (0.0%) | 247 (100.0%) |
| 3 or 4 Unit Apartments | 0 (0.0%) | 145 (100.0%) |
| 5 to 9 Unit Apartments | 0 (0.0%) | 20 (100.0%) |
| 10 or more Apartments | 0 (0.0%) | 243 (100.0%) |
| Mobile Home / Other | 45 (100.0%) | 0 (0.0%) |
| Total | 1,306 (56.9%) | 991 (43.1%) |
Housing Structures by Number of Rooms in Nashville
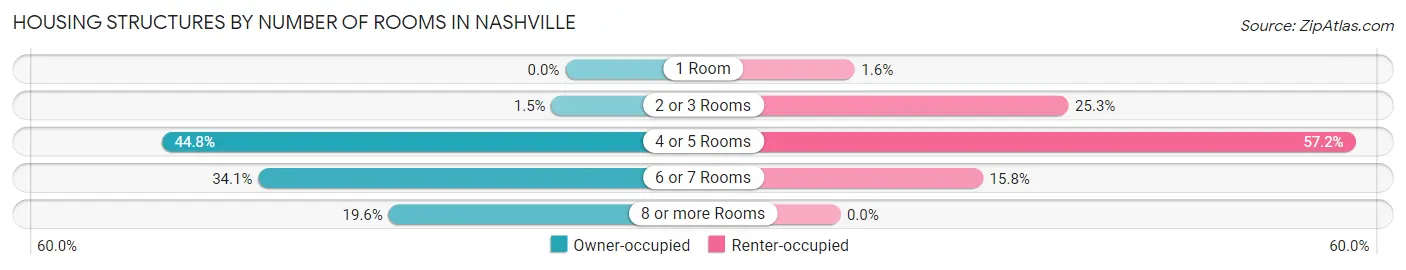
| Number of Rooms | Owner-occupied | Renter-occupied |
| 1 Room | 0 (0.0%) | 16 (1.6%) |
| 2 or 3 Rooms | 20 (1.5%) | 251 (25.3%) |
| 4 or 5 Rooms | 585 (44.8%) | 567 (57.2%) |
| 6 or 7 Rooms | 445 (34.1%) | 157 (15.8%) |
| 8 or more Rooms | 256 (19.6%) | 0 (0.0%) |
| Total | 1,306 (100.0%) | 991 (100.0%) |
Housing Structure by Heating Type in Nashville
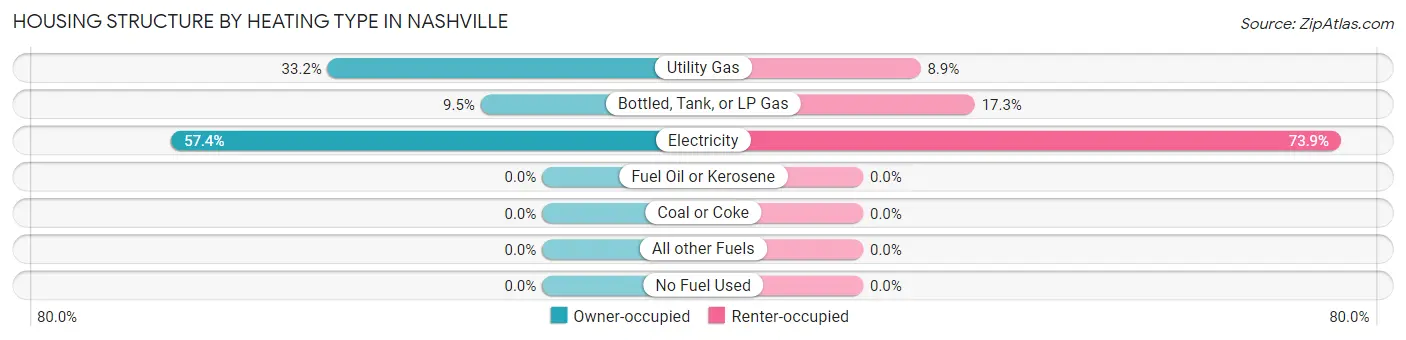
| Heating Type | Owner-occupied | Renter-occupied |
| Utility Gas | 433 (33.2%) | 88 (8.9%) |
| Bottled, Tank, or LP Gas | 124 (9.5%) | 171 (17.3%) |
| Electricity | 749 (57.4%) | 732 (73.9%) |
| Fuel Oil or Kerosene | 0 (0.0%) | 0 (0.0%) |
| Coal or Coke | 0 (0.0%) | 0 (0.0%) |
| All other Fuels | 0 (0.0%) | 0 (0.0%) |
| No Fuel Used | 0 (0.0%) | 0 (0.0%) |
| Total | 1,306 (100.0%) | 991 (100.0%) |
Household Vehicle Usage in Nashville
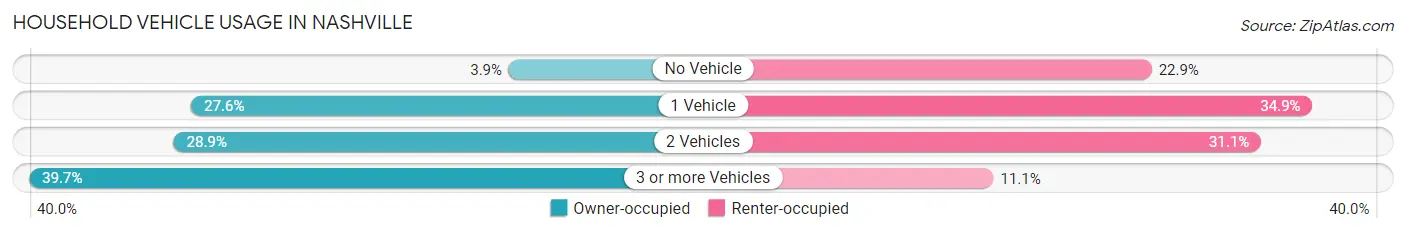
| Vehicles per Household | Owner-occupied | Renter-occupied |
| No Vehicle | 51 (3.9%) | 227 (22.9%) |
| 1 Vehicle | 360 (27.6%) | 346 (34.9%) |
| 2 Vehicles | 377 (28.9%) | 308 (31.1%) |
| 3 or more Vehicles | 518 (39.7%) | 110 (11.1%) |
| Total | 1,306 (100.0%) | 991 (100.0%) |
Real Estate & Mortgages in Nashville
Real Estate and Mortgage Overview in Nashville
| Characteristic | Without Mortgage | With Mortgage |
| Housing Units | 544 | 762 |
| Median Property Value | $177,200 | $181,700 |
| Median Household Income | $82,115 | $49 |
| Monthly Housing Costs | $413 | $0 |
| Real Estate Taxes | $755 | $0 |
Property Value by Mortgage Status in Nashville
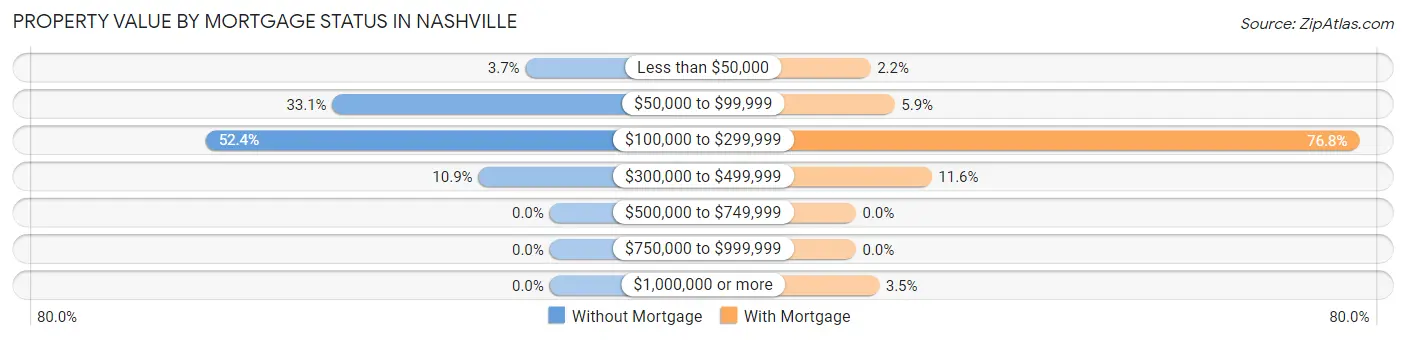
| Property Value | Without Mortgage | With Mortgage |
| Less than $50,000 | 20 (3.7%) | 17 (2.2%) |
| $50,000 to $99,999 | 180 (33.1%) | 45 (5.9%) |
| $100,000 to $299,999 | 285 (52.4%) | 585 (76.8%) |
| $300,000 to $499,999 | 59 (10.8%) | 88 (11.6%) |
| $500,000 to $749,999 | 0 (0.0%) | 0 (0.0%) |
| $750,000 to $999,999 | 0 (0.0%) | 0 (0.0%) |
| $1,000,000 or more | 0 (0.0%) | 27 (3.5%) |
| Total | 544 (100.0%) | 762 (100.0%) |
Household Income by Mortgage Status in Nashville
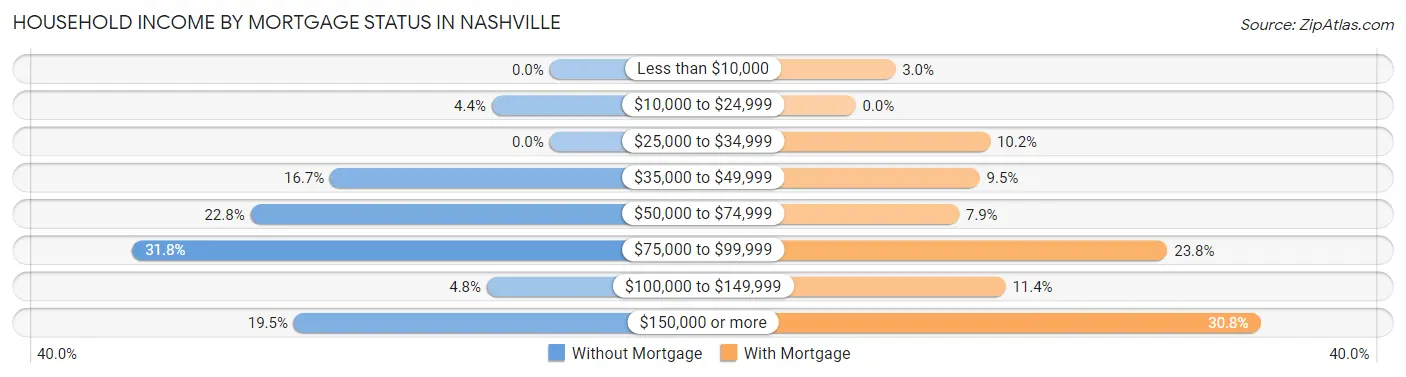
| Household Income | Without Mortgage | With Mortgage |
| Less than $10,000 | 0 (0.0%) | 23 (3.0%) |
| $10,000 to $24,999 | 24 (4.4%) | 0 (0.0%) |
| $25,000 to $34,999 | 0 (0.0%) | 78 (10.2%) |
| $35,000 to $49,999 | 91 (16.7%) | 72 (9.5%) |
| $50,000 to $74,999 | 124 (22.8%) | 60 (7.9%) |
| $75,000 to $99,999 | 173 (31.8%) | 181 (23.7%) |
| $100,000 to $149,999 | 26 (4.8%) | 87 (11.4%) |
| $150,000 or more | 106 (19.5%) | 235 (30.8%) |
| Total | 544 (100.0%) | 762 (100.0%) |
Property Value to Household Income Ratio in Nashville
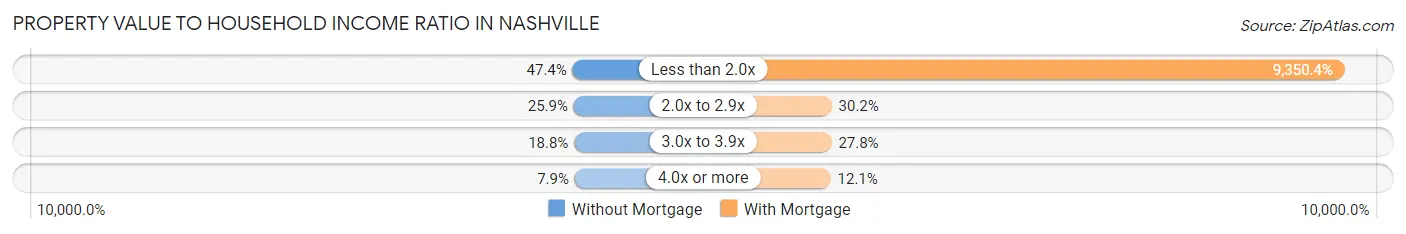
| Value-to-Income Ratio | Without Mortgage | With Mortgage |
| Less than 2.0x | 258 (47.4%) | 71,250 (9,350.4%) |
| 2.0x to 2.9x | 141 (25.9%) | 230 (30.2%) |
| 3.0x to 3.9x | 102 (18.8%) | 212 (27.8%) |
| 4.0x or more | 43 (7.9%) | 92 (12.1%) |
| Total | 544 (100.0%) | 762 (100.0%) |
Real Estate Taxes by Mortgage Status in Nashville
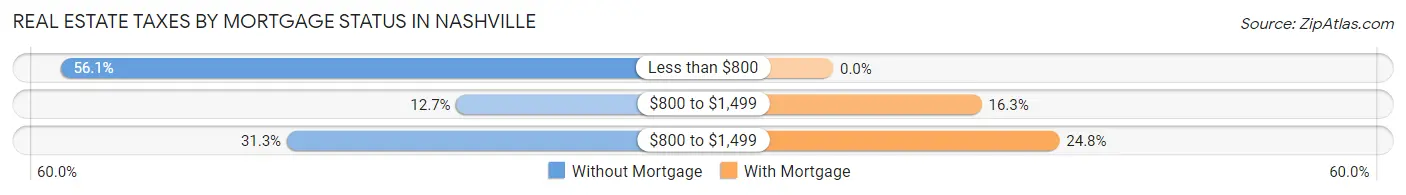
| Property Taxes | Without Mortgage | With Mortgage |
| Less than $800 | 305 (56.1%) | 0 (0.0%) |
| $800 to $1,499 | 69 (12.7%) | 124 (16.3%) |
| $800 to $1,499 | 170 (31.2%) | 189 (24.8%) |
| Total | 544 (100.0%) | 762 (100.0%) |
Health & Disability in Nashville
Health Insurance Coverage by Age in Nashville
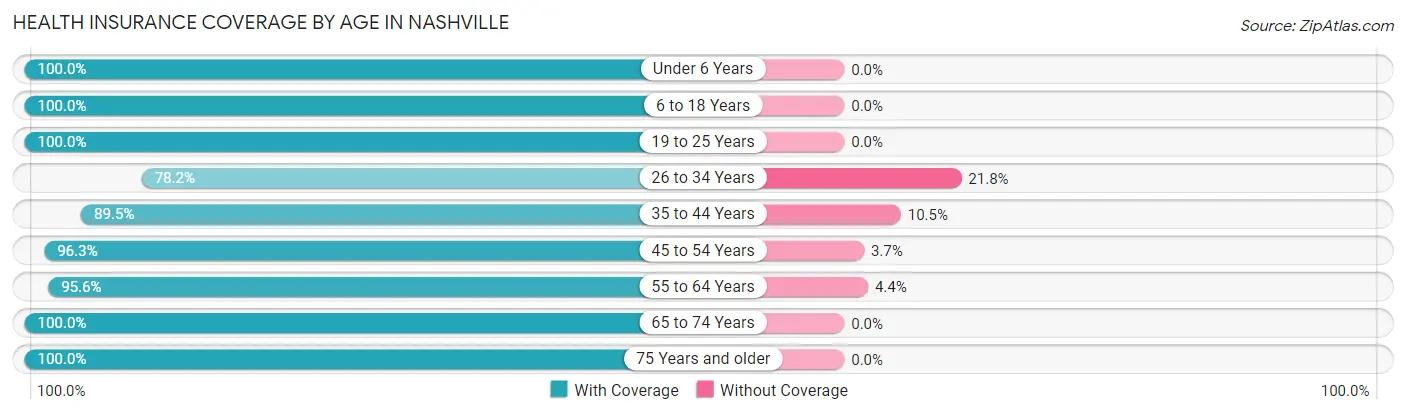
| Age Bracket | With Coverage | Without Coverage |
| Under 6 Years | 480 (100.0%) | 0 (0.0%) |
| 6 to 18 Years | 887 (100.0%) | 0 (0.0%) |
| 19 to 25 Years | 499 (100.0%) | 0 (0.0%) |
| 26 to 34 Years | 458 (78.2%) | 128 (21.8%) |
| 35 to 44 Years | 510 (89.5%) | 60 (10.5%) |
| 45 to 54 Years | 656 (96.3%) | 25 (3.7%) |
| 55 to 64 Years | 780 (95.6%) | 36 (4.4%) |
| 65 to 74 Years | 656 (100.0%) | 0 (0.0%) |
| 75 Years and older | 354 (100.0%) | 0 (0.0%) |
| Total | 5,280 (95.5%) | 249 (4.5%) |
Health Insurance Coverage by Citizenship Status in Nashville
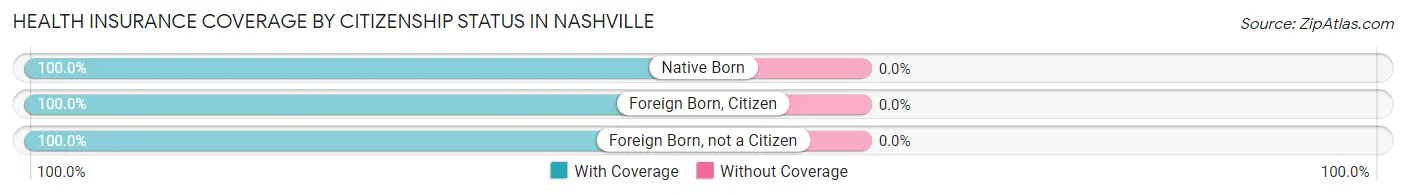
| Citizenship Status | With Coverage | Without Coverage |
| Native Born | 480 (100.0%) | 0 (0.0%) |
| Foreign Born, Citizen | 887 (100.0%) | 0 (0.0%) |
| Foreign Born, not a Citizen | 499 (100.0%) | 0 (0.0%) |
Health Insurance Coverage by Household Income in Nashville
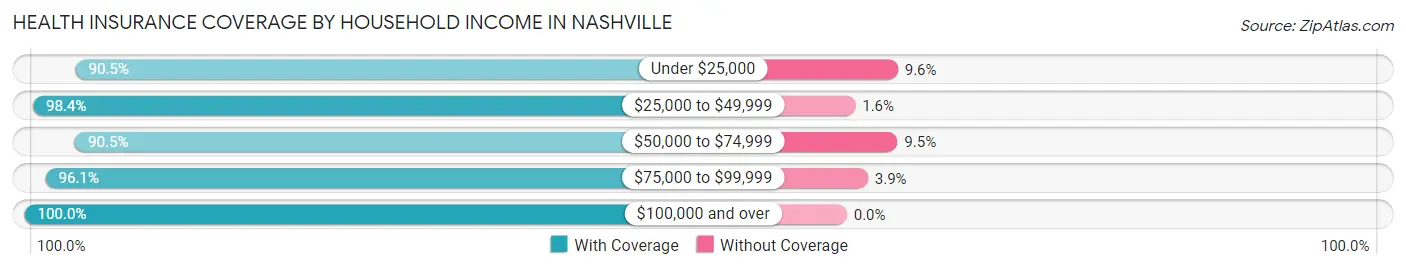
| Household Income | With Coverage | Without Coverage |
| Under $25,000 | 691 (90.4%) | 73 (9.6%) |
| $25,000 to $49,999 | 1,238 (98.4%) | 20 (1.6%) |
| $50,000 to $74,999 | 1,155 (90.5%) | 121 (9.5%) |
| $75,000 to $99,999 | 854 (96.1%) | 35 (3.9%) |
| $100,000 and over | 1,329 (100.0%) | 0 (0.0%) |
Public vs Private Health Insurance Coverage by Age in Nashville
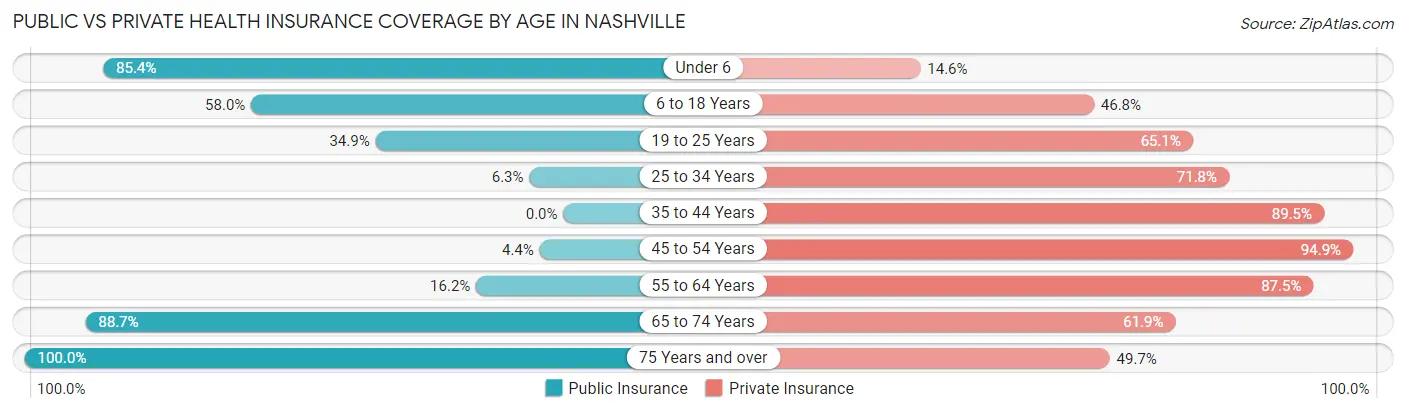
| Age Bracket | Public Insurance | Private Insurance |
| Under 6 | 410 (85.4%) | 70 (14.6%) |
| 6 to 18 Years | 514 (58.0%) | 415 (46.8%) |
| 19 to 25 Years | 174 (34.9%) | 325 (65.1%) |
| 25 to 34 Years | 37 (6.3%) | 421 (71.8%) |
| 35 to 44 Years | 0 (0.0%) | 510 (89.5%) |
| 45 to 54 Years | 30 (4.4%) | 646 (94.9%) |
| 55 to 64 Years | 132 (16.2%) | 714 (87.5%) |
| 65 to 74 Years | 582 (88.7%) | 406 (61.9%) |
| 75 Years and over | 354 (100.0%) | 176 (49.7%) |
| Total | 2,233 (40.4%) | 3,683 (66.6%) |
Disability Status by Sex by Age in Nashville
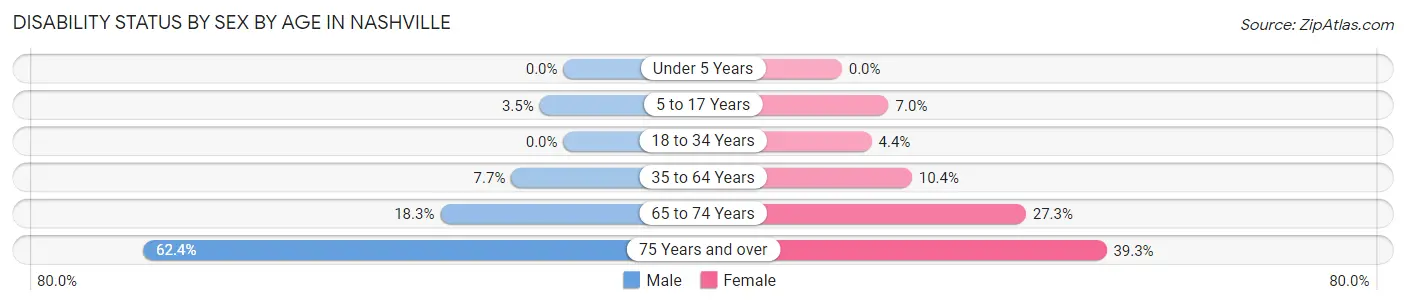
| Age Bracket | Male | Female |
| Under 5 Years | 0 (0.0%) | 0 (0.0%) |
| 5 to 17 Years | 14 (3.5%) | 32 (7.0%) |
| 18 to 34 Years | 0 (0.0%) | 24 (4.4%) |
| 35 to 64 Years | 64 (7.7%) | 129 (10.4%) |
| 65 to 74 Years | 51 (18.3%) | 103 (27.3%) |
| 75 Years and over | 78 (62.4%) | 90 (39.3%) |
Disability Class by Sex by Age in Nashville
Disability Class: Hearing Difficulty
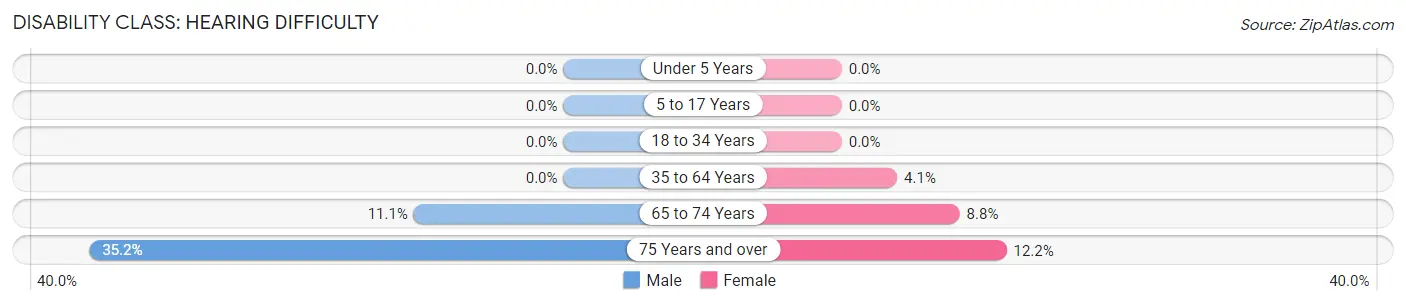
| Age Bracket | Male | Female |
| Under 5 Years | 0 (0.0%) | 0 (0.0%) |
| 5 to 17 Years | 0 (0.0%) | 0 (0.0%) |
| 18 to 34 Years | 0 (0.0%) | 0 (0.0%) |
| 35 to 64 Years | 0 (0.0%) | 51 (4.1%) |
| 65 to 74 Years | 31 (11.1%) | 33 (8.7%) |
| 75 Years and over | 44 (35.2%) | 28 (12.2%) |
Disability Class: Vision Difficulty
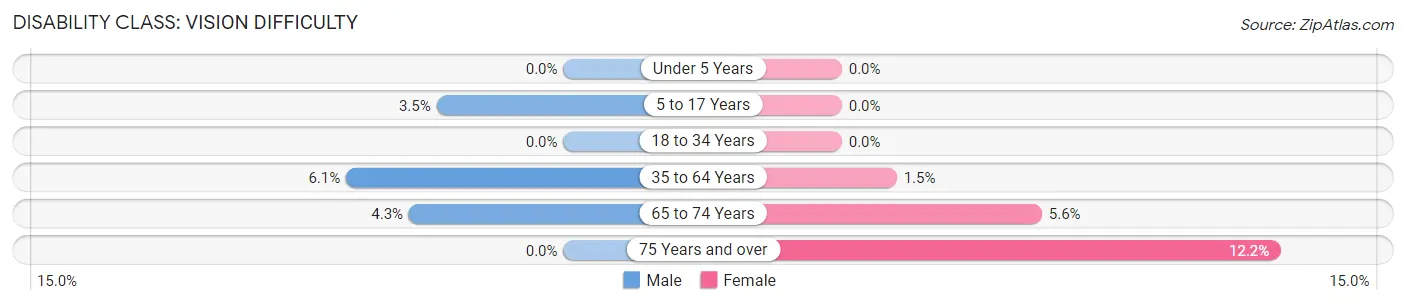
| Age Bracket | Male | Female |
| Under 5 Years | 0 (0.0%) | 0 (0.0%) |
| 5 to 17 Years | 14 (3.5%) | 0 (0.0%) |
| 18 to 34 Years | 0 (0.0%) | 0 (0.0%) |
| 35 to 64 Years | 50 (6.0%) | 19 (1.5%) |
| 65 to 74 Years | 12 (4.3%) | 21 (5.6%) |
| 75 Years and over | 0 (0.0%) | 28 (12.2%) |
Disability Class: Cognitive Difficulty
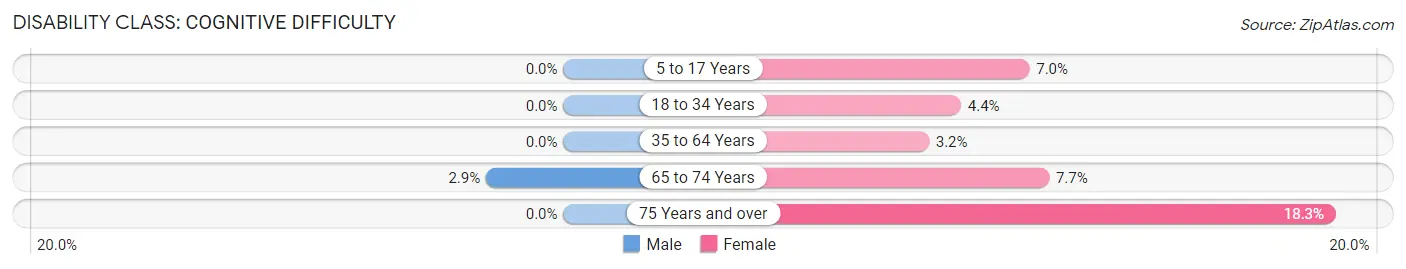
| Age Bracket | Male | Female |
| 5 to 17 Years | 0 (0.0%) | 32 (7.0%) |
| 18 to 34 Years | 0 (0.0%) | 24 (4.4%) |
| 35 to 64 Years | 0 (0.0%) | 40 (3.2%) |
| 65 to 74 Years | 8 (2.9%) | 29 (7.7%) |
| 75 Years and over | 0 (0.0%) | 42 (18.3%) |
Disability Class: Ambulatory Difficulty
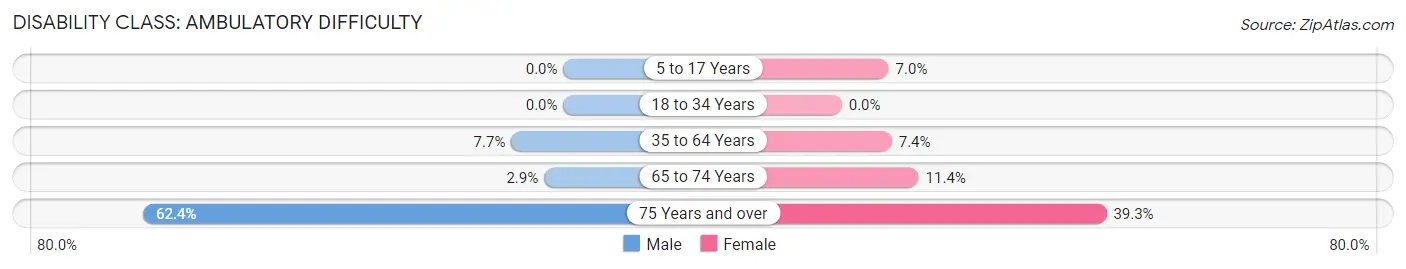
| Age Bracket | Male | Female |
| 5 to 17 Years | 0 (0.0%) | 32 (7.0%) |
| 18 to 34 Years | 0 (0.0%) | 0 (0.0%) |
| 35 to 64 Years | 64 (7.7%) | 92 (7.4%) |
| 65 to 74 Years | 8 (2.9%) | 43 (11.4%) |
| 75 Years and over | 78 (62.4%) | 90 (39.3%) |
Disability Class: Self-Care Difficulty
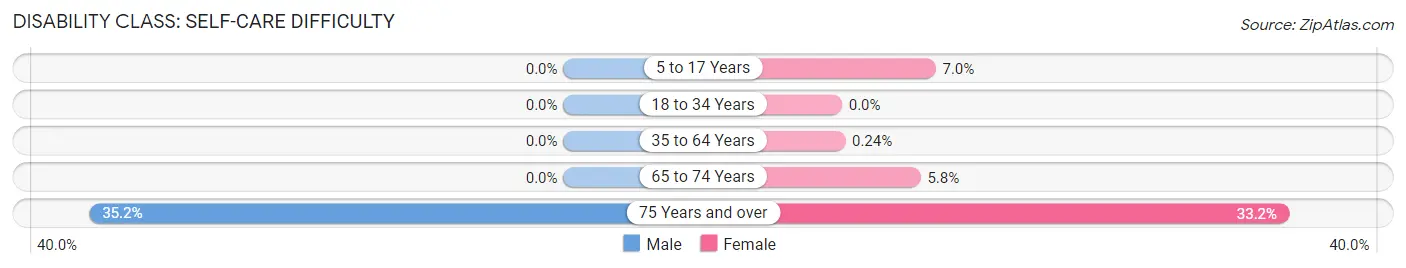
| Age Bracket | Male | Female |
| 5 to 17 Years | 0 (0.0%) | 32 (7.0%) |
| 18 to 34 Years | 0 (0.0%) | 0 (0.0%) |
| 35 to 64 Years | 0 (0.0%) | 3 (0.2%) |
| 65 to 74 Years | 0 (0.0%) | 22 (5.8%) |
| 75 Years and over | 44 (35.2%) | 76 (33.2%) |
Technology Access in Nashville
Computing Device Access in Nashville
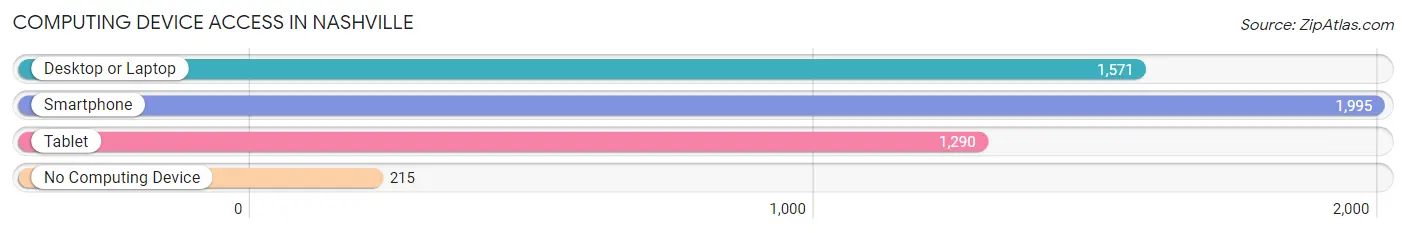
| Device Type | # Households | % Households |
| Desktop or Laptop | 1,571 | 68.4% |
| Smartphone | 1,995 | 86.9% |
| Tablet | 1,290 | 56.2% |
| No Computing Device | 215 | 9.4% |
| Total | 2,297 | 100.0% |
Internet Access in Nashville
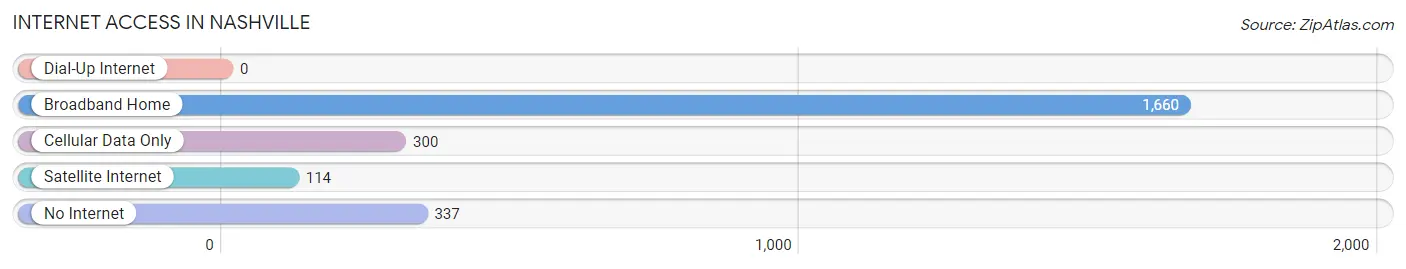
| Internet Type | # Households | % Households |
| Dial-Up Internet | 0 | 0.0% |
| Broadband Home | 1,660 | 72.3% |
| Cellular Data Only | 300 | 13.1% |
| Satellite Internet | 114 | 5.0% |
| No Internet | 337 | 14.7% |
| Total | 2,297 | 100.0% |
Nashville Summary
Nashville, North Carolina is a small town located in Nash County, North Carolina. It is situated in the heart of the state, just south of Raleigh and east of Rocky Mount. The town is home to a population of approximately 4,000 people, and is the county seat of Nash County.
Geography
Nashville is located in the Coastal Plain region of North Carolina, and is situated on the banks of the Tar River. The town is surrounded by rolling hills and farmland, and is located approximately 30 miles east of Raleigh and 40 miles south of Rocky Mount. The town is located at an elevation of approximately 200 feet above sea level.
History
Nashville was founded in 1780 by a group of settlers from Virginia. The town was named after General Francis Nash, a Revolutionary War hero who was killed in the Battle of Germantown. The town was incorporated in 1819, and was the county seat of Nash County.
In the late 19th century, Nashville was a thriving agricultural center, with cotton, tobacco, and corn being the main crops. The town was also home to several mills, including a cotton mill, a grist mill, and a sawmill.
In the early 20th century, Nashville experienced a period of growth and prosperity. The town was home to several businesses, including a bank, a hotel, a movie theater, and a variety of stores. The town also had a thriving music scene, with several local bands playing in the area.
Economy
Nashville’s economy is largely based on agriculture, with corn, cotton, and tobacco being the main crops. The town is also home to several manufacturing companies, including a furniture factory, a textile mill, and a plastics plant.
The town is also home to several retail stores, including a grocery store, a hardware store, and a variety of specialty shops. The town also has several restaurants, including a pizza parlor, a Mexican restaurant, and a seafood restaurant.
Demographics
As of the 2010 census, the population of Nashville was 4,039. The racial makeup of the town was 79.3% White, 17.2% African American, 0.3% Native American, 0.7% Asian, 0.1% Pacific Islander, and 2.4% from other races. The median household income was $31,919, and the median family income was $41,919.
Conclusion
Nashville, North Carolina is a small town located in Nash County, North Carolina. It is situated in the heart of the state, just south of Raleigh and east of Rocky Mount. The town is home to a population of approximately 4,000 people, and is the county seat of Nash County. The town’s economy is largely based on agriculture, with corn, cotton, and tobacco being the main crops. The town is also home to several manufacturing companies, retail stores, and restaurants. The racial makeup of the town is 79.3% White, 17.2% African American, 0.3% Native American, 0.7% Asian, 0.1% Pacific Islander, and 2.4% from other races. The median household income was $31,919, and the median family income was $41,919.
Common Questions
What is Per Capita Income in Nashville?
Per Capita income in Nashville is $31,789.
What is the Median Family Income in Nashville?
Median Family Income in Nashville is $65,057.
What is the Median Household income in Nashville?
Median Household Income in Nashville is $61,513.
What is Income or Wage Gap in Nashville?
Income or Wage Gap in Nashville is 5.1%.
Women in Nashville earn 94.9 cents for every dollar earned by a man.
What is Inequality or Gini Index in Nashville?
Inequality or Gini Index in Nashville is 0.42.
What is the Total Population of Nashville?
Total Population of Nashville is 5,624.
What is the Total Male Population of Nashville?
Total Male Population of Nashville is 2,349.
What is the Total Female Population of Nashville?
Total Female Population of Nashville is 3,275.
What is the Ratio of Males per 100 Females in Nashville?
There are 71.73 Males per 100 Females in Nashville.
What is the Ratio of Females per 100 Males in Nashville?
There are 139.42 Females per 100 Males in Nashville.
What is the Median Population Age in Nashville?
Median Population Age in Nashville is 40.7 Years.
What is the Average Family Size in Nashville
Average Family Size in Nashville is 2.8 People.
What is the Average Household Size in Nashville
Average Household Size in Nashville is 2.4 People.
How Large is the Labor Force in Nashville?
There are 3,031 People in the Labor Forcein in Nashville.
What is the Percentage of People in the Labor Force in Nashville?
70.3% of People are in the Labor Force in Nashville.
What is the Unemployment Rate in Nashville?
Unemployment Rate in Nashville is 11.5%.