Camp Swift, TX Map & Demographics
Camp Swift Map
Camp Swift Overview
$22,875
PER CAPITA INCOME
$68,750
AVG FAMILY INCOME
$61,586
AVG HOUSEHOLD INCOME
14.0%
WAGE / INCOME GAP [ % ]
86.0¢/ $1
WAGE / INCOME GAP [ $ ]
0.39
INEQUALITY / GINI INDEX
6,908
TOTAL POPULATION
4,458
MALE POPULATION
2,450
FEMALE POPULATION
181.96
MALES / 100 FEMALES
54.96
FEMALES / 100 MALES
35.1
MEDIAN AGE
3.7
AVG FAMILY SIZE
3.0
AVG HOUSEHOLD SIZE
2,846
LABOR FORCE [ PEOPLE ]
53.0%
PERCENT IN LABOR FORCE
1.4%
UNEMPLOYMENT RATE
Income in Camp Swift
Income Overview in Camp Swift
Per Capita Income in Camp Swift is $22,875, while median incomes of families and households are $68,750 and $61,586 respectively.
| Characteristic | Number | Measure |
| Per Capita Income | 6,908 | $22,875 |
| Median Family Income | 1,300 | $68,750 |
| Mean Family Income | 1,300 | $88,561 |
| Median Household Income | 1,841 | $61,586 |
| Mean Household Income | 1,841 | $79,126 |
| Income Deficit | 1,300 | $0 |
| Wage / Income Gap (%) | 6,908 | 14.04% |
| Wage / Income Gap ($) | 6,908 | 85.96¢ per $1 |
| Gini / Inequality Index | 6,908 | 0.39 |
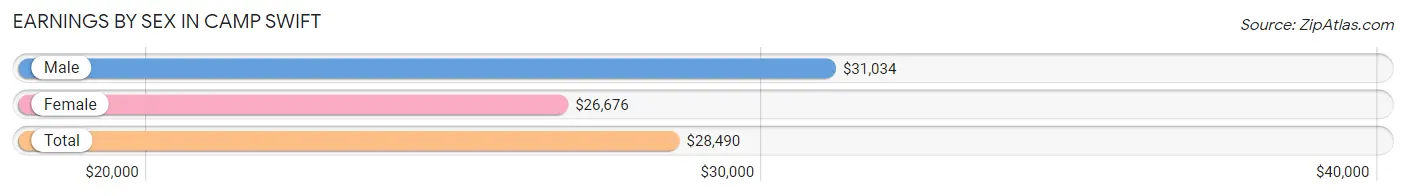
Earnings by Sex in Camp Swift
Average Earnings in Camp Swift are $28,490, $31,034 for men and $26,676 for women, a difference of 14.0%.
| Sex | Number | Average Earnings |
| Male | 1,996 (59.8%) | $31,034 |
| Female | 1,342 (40.2%) | $26,676 |
| Total | 3,338 (100.0%) | $28,490 |
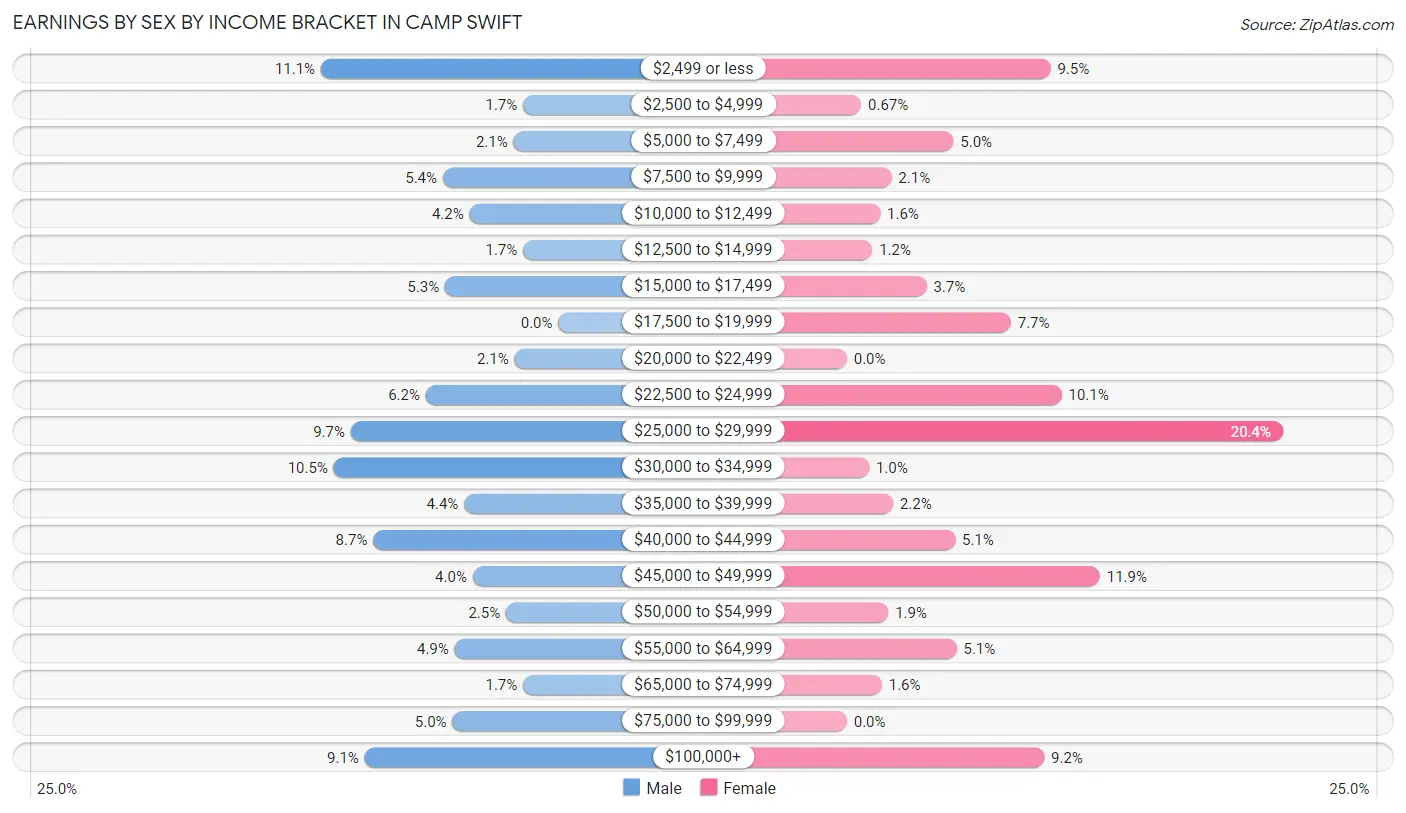
Earnings by Sex by Income Bracket in Camp Swift
The most common earnings brackets in Camp Swift are $2,499 or less for men (222 | 11.1%) and $25,000 to $29,999 for women (274 | 20.4%).
| Income | Male | Female |
| $2,499 or less | 222 (11.1%) | 128 (9.5%) |
| $2,500 to $4,999 | 33 (1.7%) | 9 (0.7%) |
| $5,000 to $7,499 | 42 (2.1%) | 67 (5.0%) |
| $7,500 to $9,999 | 108 (5.4%) | 28 (2.1%) |
| $10,000 to $12,499 | 83 (4.2%) | 21 (1.6%) |
| $12,500 to $14,999 | 33 (1.7%) | 16 (1.2%) |
| $15,000 to $17,499 | 106 (5.3%) | 50 (3.7%) |
| $17,500 to $19,999 | 0 (0.0%) | 103 (7.7%) |
| $20,000 to $22,499 | 41 (2.1%) | 0 (0.0%) |
| $22,500 to $24,999 | 124 (6.2%) | 135 (10.1%) |
| $25,000 to $29,999 | 194 (9.7%) | 274 (20.4%) |
| $30,000 to $34,999 | 210 (10.5%) | 14 (1.0%) |
| $35,000 to $39,999 | 88 (4.4%) | 29 (2.2%) |
| $40,000 to $44,999 | 173 (8.7%) | 68 (5.1%) |
| $45,000 to $49,999 | 80 (4.0%) | 159 (11.8%) |
| $50,000 to $54,999 | 49 (2.5%) | 26 (1.9%) |
| $55,000 to $64,999 | 97 (4.9%) | 69 (5.1%) |
| $65,000 to $74,999 | 33 (1.7%) | 22 (1.6%) |
| $75,000 to $99,999 | 99 (5.0%) | 0 (0.0%) |
| $100,000+ | 181 (9.1%) | 124 (9.2%) |
| Total | 1,996 (100.0%) | 1,342 (100.0%) |
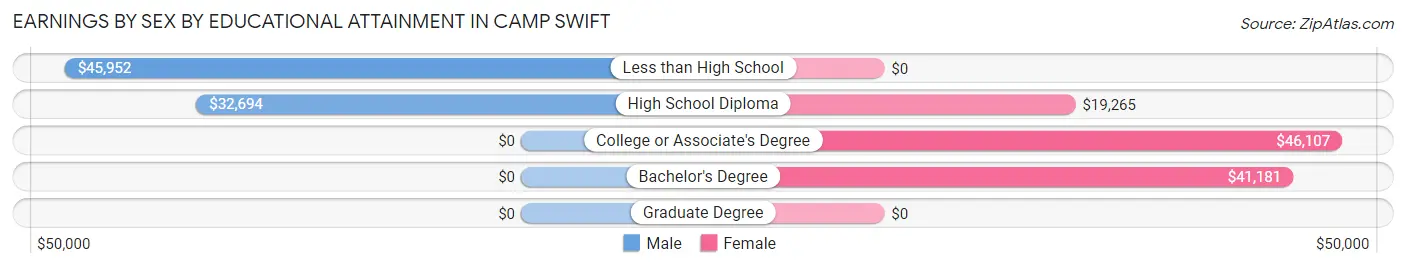
Earnings by Sex by Educational Attainment in Camp Swift
Average earnings in Camp Swift are $33,391 for men and $29,819 for women, a difference of 10.7%. Men with an educational attainment of less than high school enjoy the highest average annual earnings of $45,952, while those with high school diploma education earn the least with $32,694. Women with an educational attainment of college or associate's degree earn the most with the average annual earnings of $46,107, while those with high school diploma education have the smallest earnings of $19,265.
| Educational Attainment | Male Income | Female Income |
| Less than High School | $45,952 | $0 |
| High School Diploma | $32,694 | $19,265 |
| College or Associate's Degree | - | - |
| Bachelor's Degree | - | - |
| Graduate Degree | - | - |
| Total | $33,391 | $29,819 |
Family Income in Camp Swift
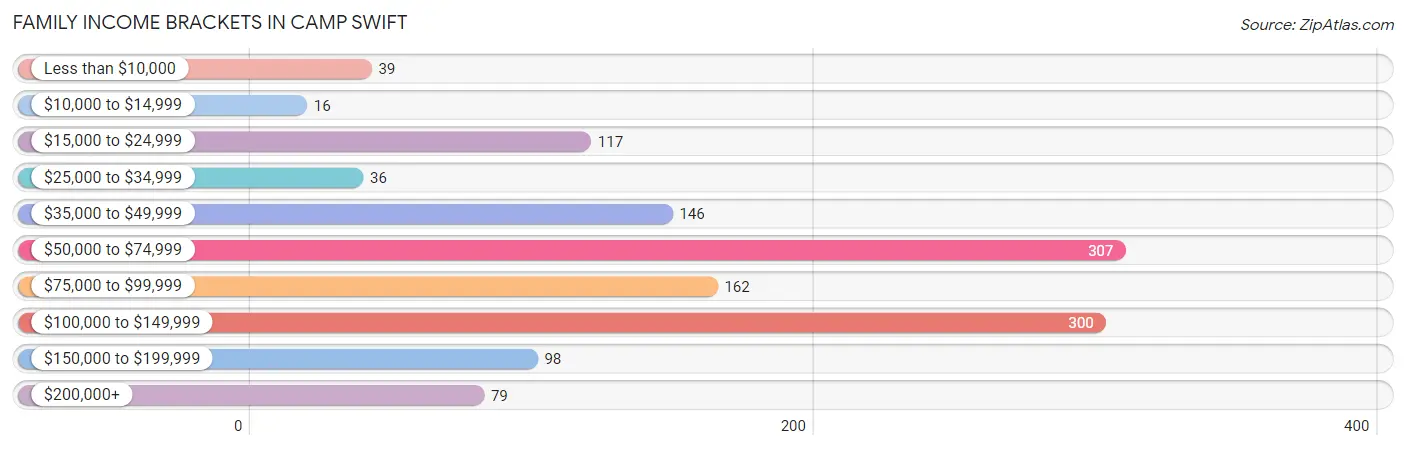
Family Income Brackets in Camp Swift
According to the Camp Swift family income data, there are 307 families falling into the $50,000 to $74,999 income range, which is the most common income bracket and makes up 23.6% of all families. Conversely, the $10,000 to $14,999 income bracket is the least frequent group with only 16 families (1.2%) belonging to this category.
| Income Bracket | # Families | % Families |
| Less than $10,000 | 39 | 3.0% |
| $10,000 to $14,999 | 16 | 1.2% |
| $15,000 to $24,999 | 117 | 9.0% |
| $25,000 to $34,999 | 36 | 2.8% |
| $35,000 to $49,999 | 146 | 11.2% |
| $50,000 to $74,999 | 307 | 23.6% |
| $75,000 to $99,999 | 162 | 12.5% |
| $100,000 to $149,999 | 300 | 23.1% |
| $150,000 to $199,999 | 98 | 7.5% |
| $200,000+ | 79 | 6.1% |
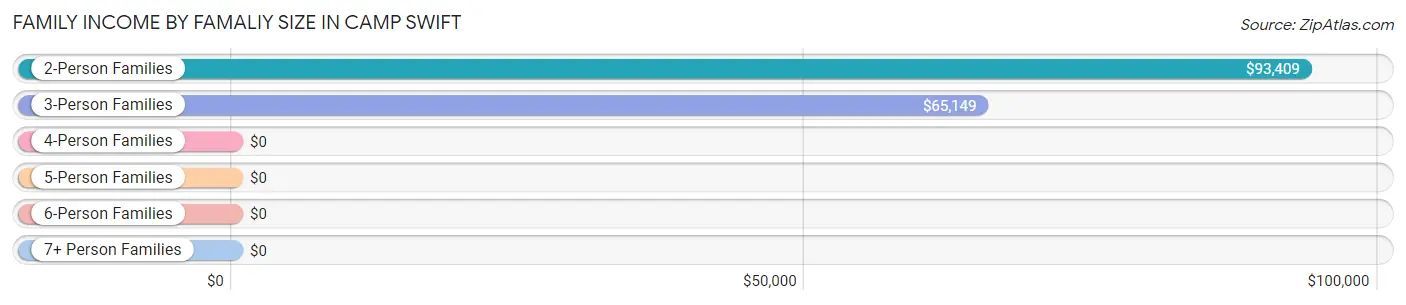
Family Income by Famaliy Size in Camp Swift
2-person families (474 | 36.5%) account for the highest median family income in Camp Swift with $93,409 per family, while 2-person families (474 | 36.5%) have the highest median income of $46,704 per family member.
| Income Bracket | # Families | Median Income |
| 2-Person Families | 474 (36.5%) | $93,409 |
| 3-Person Families | 295 (22.7%) | $65,149 |
| 4-Person Families | 248 (19.1%) | $0 |
| 5-Person Families | 202 (15.5%) | $0 |
| 6-Person Families | 49 (3.8%) | $0 |
| 7+ Person Families | 32 (2.5%) | $0 |
| Total | 1,300 (100.0%) | $68,750 |
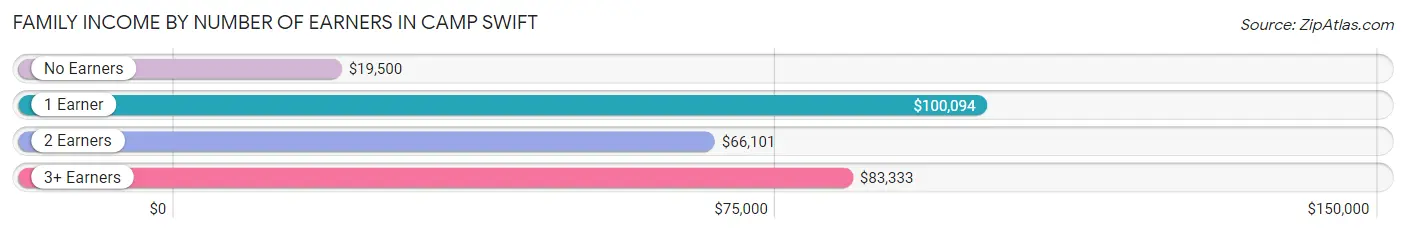
Family Income by Number of Earners in Camp Swift
The median family income in Camp Swift is $68,750, with families comprising 1 earner (501) having the highest median family income of $100,094, while families with no earners (98) have the lowest median family income of $19,500, accounting for 38.5% and 7.5% of families, respectively.
| Number of Earners | # Families | Median Income |
| No Earners | 98 (7.5%) | $19,500 |
| 1 Earner | 501 (38.5%) | $100,094 |
| 2 Earners | 441 (33.9%) | $66,101 |
| 3+ Earners | 260 (20.0%) | $83,333 |
| Total | 1,300 (100.0%) | $68,750 |
Household Income in Camp Swift
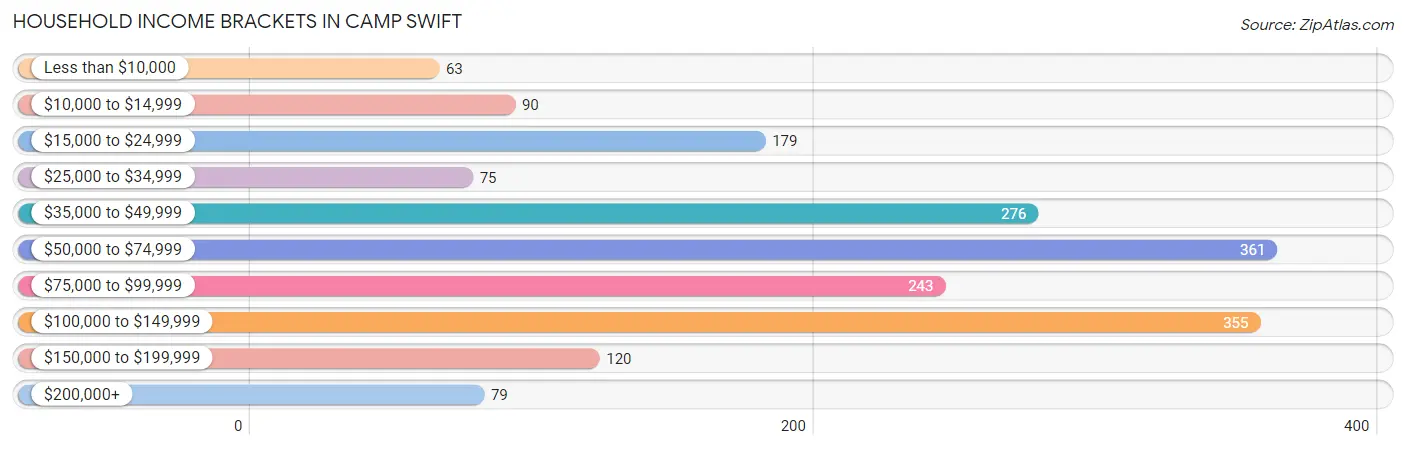
Household Income Brackets in Camp Swift
With 361 households falling in the category, the $50,000 to $74,999 income range is the most frequent in Camp Swift, accounting for 19.6% of all households. In contrast, only 63 households (3.4%) fall into the less than $10,000 income bracket, making it the least populous group.
| Income Bracket | # Households | % Households |
| Less than $10,000 | 63 | 3.4% |
| $10,000 to $14,999 | 90 | 4.9% |
| $15,000 to $24,999 | 179 | 9.7% |
| $25,000 to $34,999 | 75 | 4.1% |
| $35,000 to $49,999 | 276 | 15.0% |
| $50,000 to $74,999 | 361 | 19.6% |
| $75,000 to $99,999 | 243 | 13.2% |
| $100,000 to $149,999 | 355 | 19.3% |
| $150,000 to $199,999 | 120 | 6.5% |
| $200,000+ | 79 | 4.3% |
Household Income by Householder Age in Camp Swift
The median household income in Camp Swift is $61,586, with the highest median household income of $90,278 found in the 25 to 44 years age bracket for the primary householder. A total of 634 households (34.4%) fall into this category. Meanwhile, the 15 to 24 years age bracket for the primary householder has the lowest median household income of $41,875, with 102 households (5.5%) in this group.
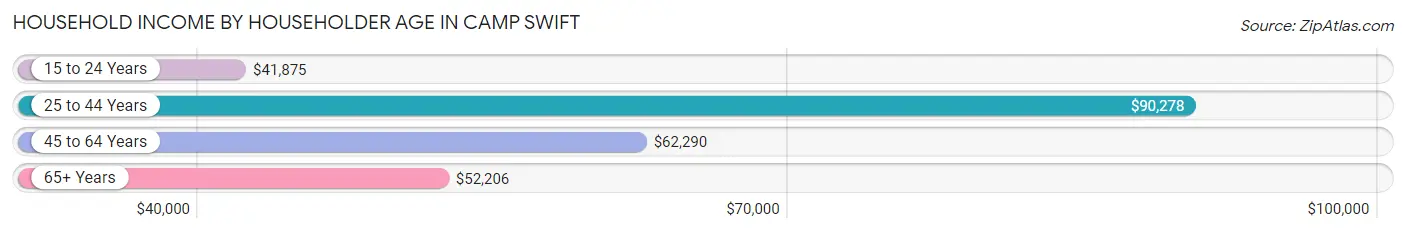
| Income Bracket | # Households | Median Income |
| 15 to 24 Years | 102 (5.5%) | $41,875 |
| 25 to 44 Years | 634 (34.4%) | $90,278 |
| 45 to 64 Years | 585 (31.8%) | $62,290 |
| 65+ Years | 520 (28.2%) | $52,206 |
| Total | 1,841 (100.0%) | $61,586 |
Poverty in Camp Swift
Income Below Poverty by Sex and Age in Camp Swift
With 15.1% poverty level for males and 14.8% for females among the residents of Camp Swift, 12 to 14 year old males and 12 to 14 year old females are the most vulnerable to poverty, with 172 males (80.7%) and 106 females (73.1%) in their respective age groups living below the poverty level.
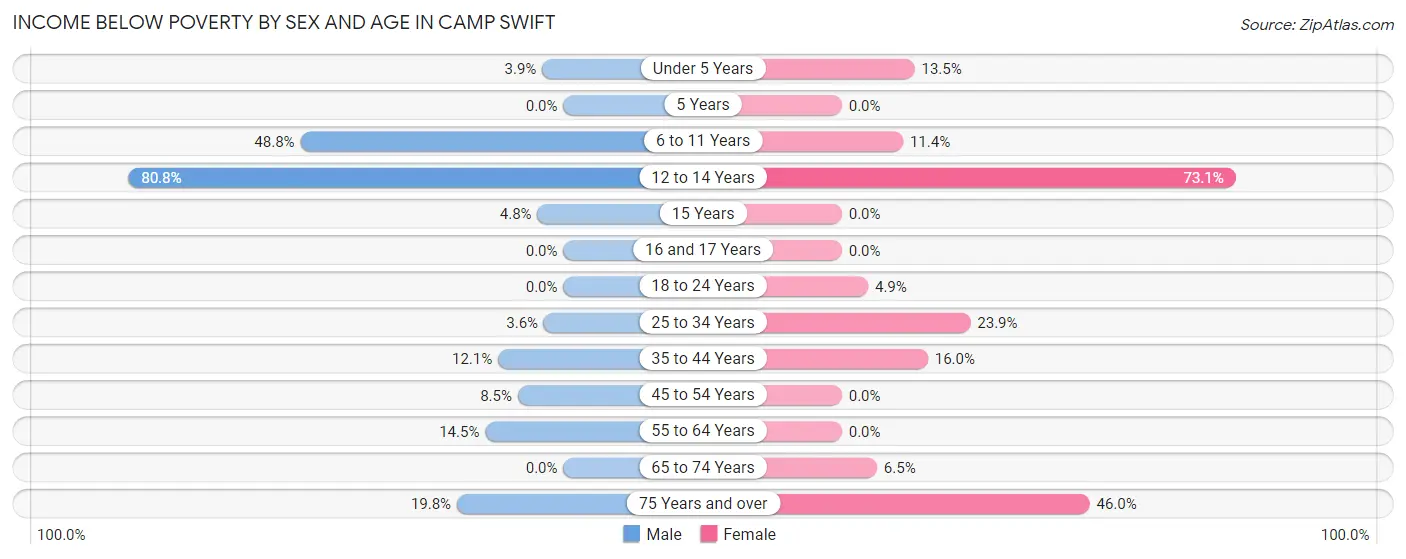
| Age Bracket | Male | Female |
| Under 5 Years | 15 (3.9%) | 15 (13.5%) |
| 5 Years | 0 (0.0%) | 0 (0.0%) |
| 6 to 11 Years | 143 (48.8%) | 30 (11.4%) |
| 12 to 14 Years | 172 (80.7%) | 106 (73.1%) |
| 15 Years | 5 (4.8%) | 0 (0.0%) |
| 16 and 17 Years | 0 (0.0%) | 0 (0.0%) |
| 18 to 24 Years | 0 (0.0%) | 22 (4.9%) |
| 25 to 34 Years | 19 (3.6%) | 42 (23.9%) |
| 35 to 44 Years | 36 (12.1%) | 45 (16.0%) |
| 45 to 54 Years | 23 (8.5%) | 0 (0.0%) |
| 55 to 64 Years | 48 (14.5%) | 0 (0.0%) |
| 65 to 74 Years | 0 (0.0%) | 15 (6.5%) |
| 75 Years and over | 16 (19.8%) | 86 (46.0%) |
| Total | 477 (15.1%) | 361 (14.8%) |
Income Above Poverty by Sex and Age in Camp Swift
According to the poverty statistics in Camp Swift, males aged 5 years and females aged 16 and 17 years are the age groups that are most secure financially, with 100.0% of males and 100.0% of females in these age groups living above the poverty line.
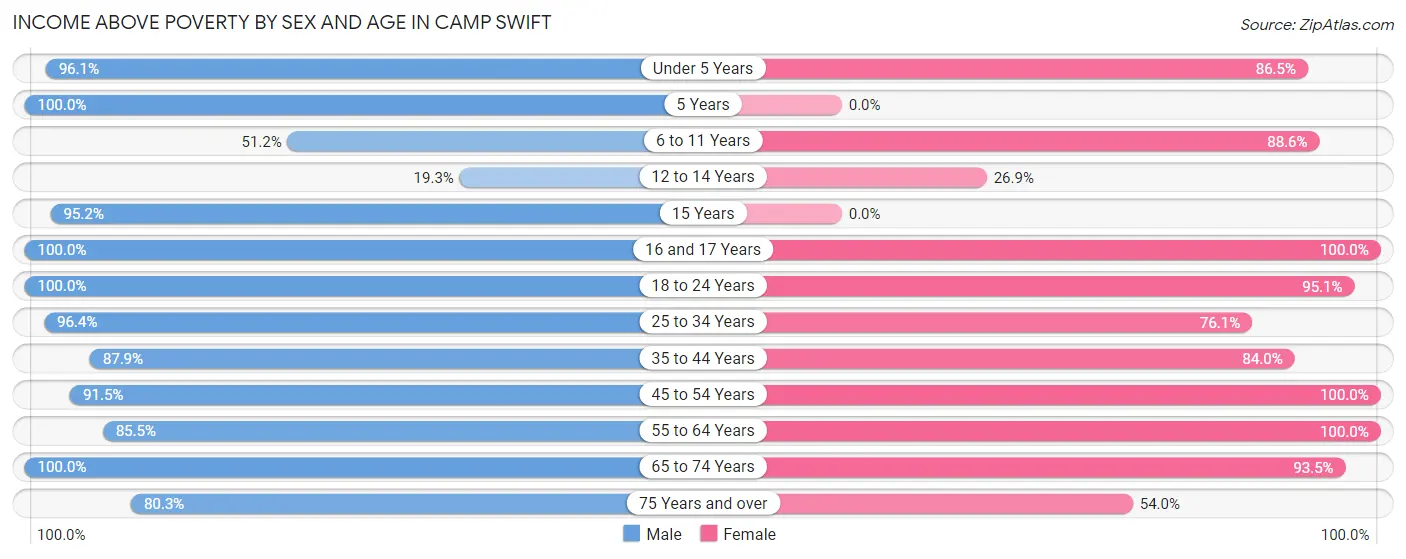
| Age Bracket | Male | Female |
| Under 5 Years | 367 (96.1%) | 96 (86.5%) |
| 5 Years | 13 (100.0%) | 0 (0.0%) |
| 6 to 11 Years | 150 (51.2%) | 234 (88.6%) |
| 12 to 14 Years | 41 (19.3%) | 39 (26.9%) |
| 15 Years | 99 (95.2%) | 0 (0.0%) |
| 16 and 17 Years | 26 (100.0%) | 8 (100.0%) |
| 18 to 24 Years | 343 (100.0%) | 430 (95.1%) |
| 25 to 34 Years | 507 (96.4%) | 134 (76.1%) |
| 35 to 44 Years | 261 (87.9%) | 237 (84.0%) |
| 45 to 54 Years | 249 (91.5%) | 341 (100.0%) |
| 55 to 64 Years | 283 (85.5%) | 240 (100.0%) |
| 65 to 74 Years | 276 (100.0%) | 215 (93.5%) |
| 75 Years and over | 65 (80.2%) | 101 (54.0%) |
| Total | 2,680 (84.9%) | 2,075 (85.2%) |
Income Below Poverty Among Married-Couple Families in Camp Swift
The poverty statistics for married-couple families in Camp Swift show that 4.3% or 41 of the total 950 families live below the poverty line. Families with 3 or 4 children have the highest poverty rate of 21.0%, comprising of 25 families. On the other hand, families with 1 or 2 children have the lowest poverty rate of 0.0%, which includes 0 families.
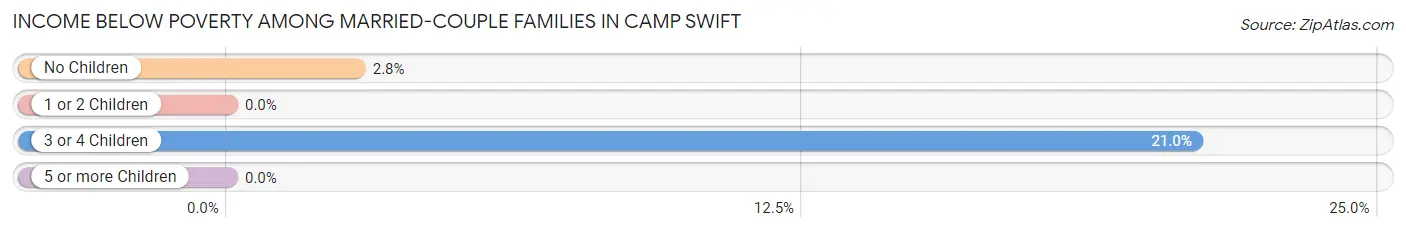
| Children | Above Poverty | Below Poverty |
| No Children | 560 (97.2%) | 16 (2.8%) |
| 1 or 2 Children | 255 (100.0%) | 0 (0.0%) |
| 3 or 4 Children | 94 (79.0%) | 25 (21.0%) |
| 5 or more Children | 0 (0.0%) | 0 (0.0%) |
| Total | 909 (95.7%) | 41 (4.3%) |
Income Below Poverty Among Single-Parent Households in Camp Swift
According to the poverty data in Camp Swift, 48.5% or 32 single-father households and 29.6% or 84 single-mother households are living below the poverty line. Among single-father households, those with 1 or 2 children have the highest poverty rate, with 32 households (100.0%) experiencing poverty. Likewise, among single-mother households, those with 1 or 2 children have the highest poverty rate, with 84 households (33.9%) falling below the poverty line.
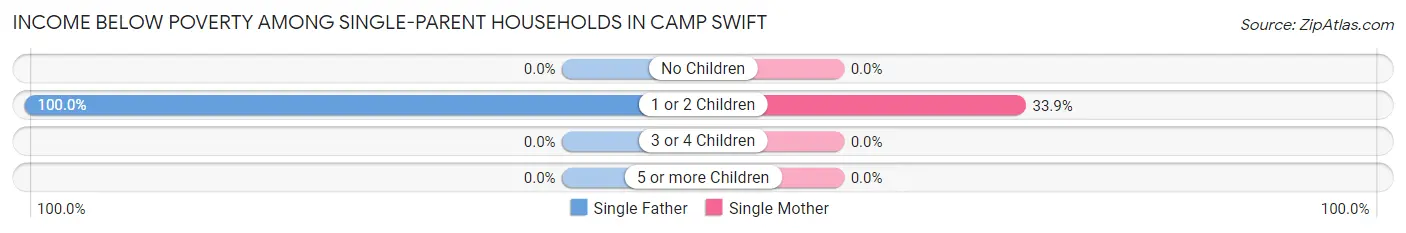
| Children | Single Father | Single Mother |
| No Children | 0 (0.0%) | 0 (0.0%) |
| 1 or 2 Children | 32 (100.0%) | 84 (33.9%) |
| 3 or 4 Children | 0 (0.0%) | 0 (0.0%) |
| 5 or more Children | 0 (0.0%) | 0 (0.0%) |
| Total | 32 (48.5%) | 84 (29.6%) |
Income Below Poverty Among Married-Couple vs Single-Parent Households in Camp Swift
The poverty data for Camp Swift shows that 41 of the married-couple family households (4.3%) and 116 of the single-parent households (33.1%) are living below the poverty level. Within the married-couple family households, those with 3 or 4 children have the highest poverty rate, with 25 households (21.0%) falling below the poverty line. Among the single-parent households, those with 1 or 2 children have the highest poverty rate, with 116 household (41.4%) living below poverty.
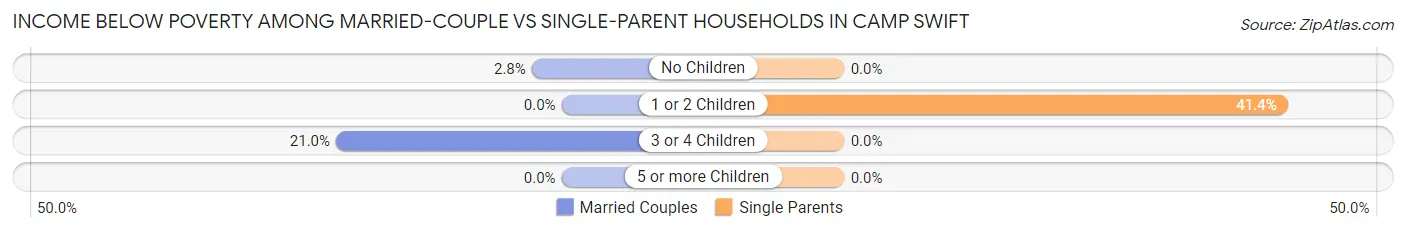
| Children | Married-Couple Families | Single-Parent Households |
| No Children | 16 (2.8%) | 0 (0.0%) |
| 1 or 2 Children | 0 (0.0%) | 116 (41.4%) |
| 3 or 4 Children | 25 (21.0%) | 0 (0.0%) |
| 5 or more Children | 0 (0.0%) | 0 (0.0%) |
| Total | 41 (4.3%) | 116 (33.1%) |
Race in Camp Swift
The most populous races in Camp Swift are Hispanic or Latino (3,952 | 57.2%), White / Caucasian (3,881 | 56.2%), and Some other Race (1,417 | 20.5%).
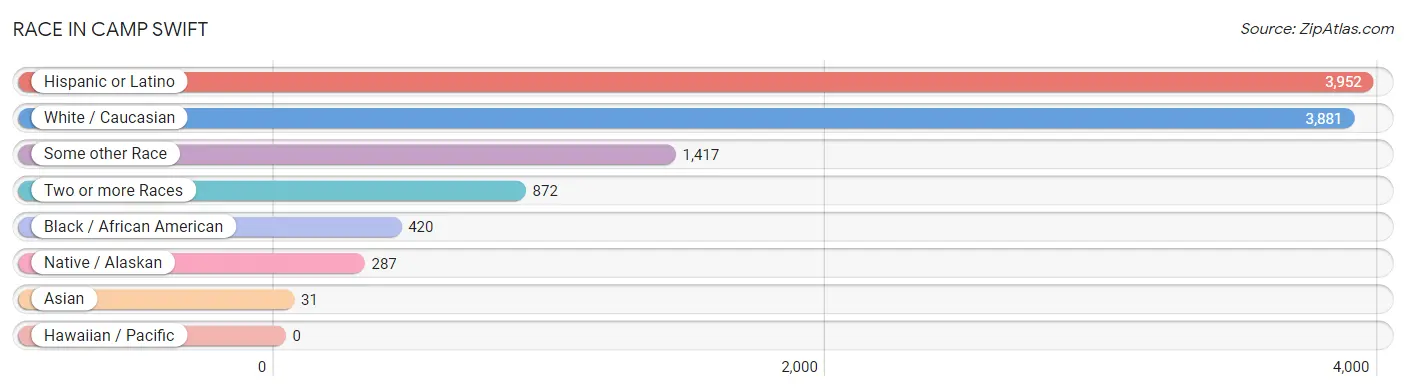
| Race | # Population | % Population |
| Asian | 31 | 0.4% |
| Black / African American | 420 | 6.1% |
| Hawaiian / Pacific | 0 | 0.0% |
| Hispanic or Latino | 3,952 | 57.2% |
| Native / Alaskan | 287 | 4.2% |
| White / Caucasian | 3,881 | 56.2% |
| Two or more Races | 872 | 12.6% |
| Some other Race | 1,417 | 20.5% |
| Total | 6,908 | 100.0% |
Ancestry in Camp Swift
The most populous ancestries reported in Camp Swift are Mexican (3,088 | 44.7%), German (654 | 9.5%), English (575 | 8.3%), Irish (394 | 5.7%), and Belgian (246 | 3.6%), together accounting for 71.8% of all Camp Swift residents.
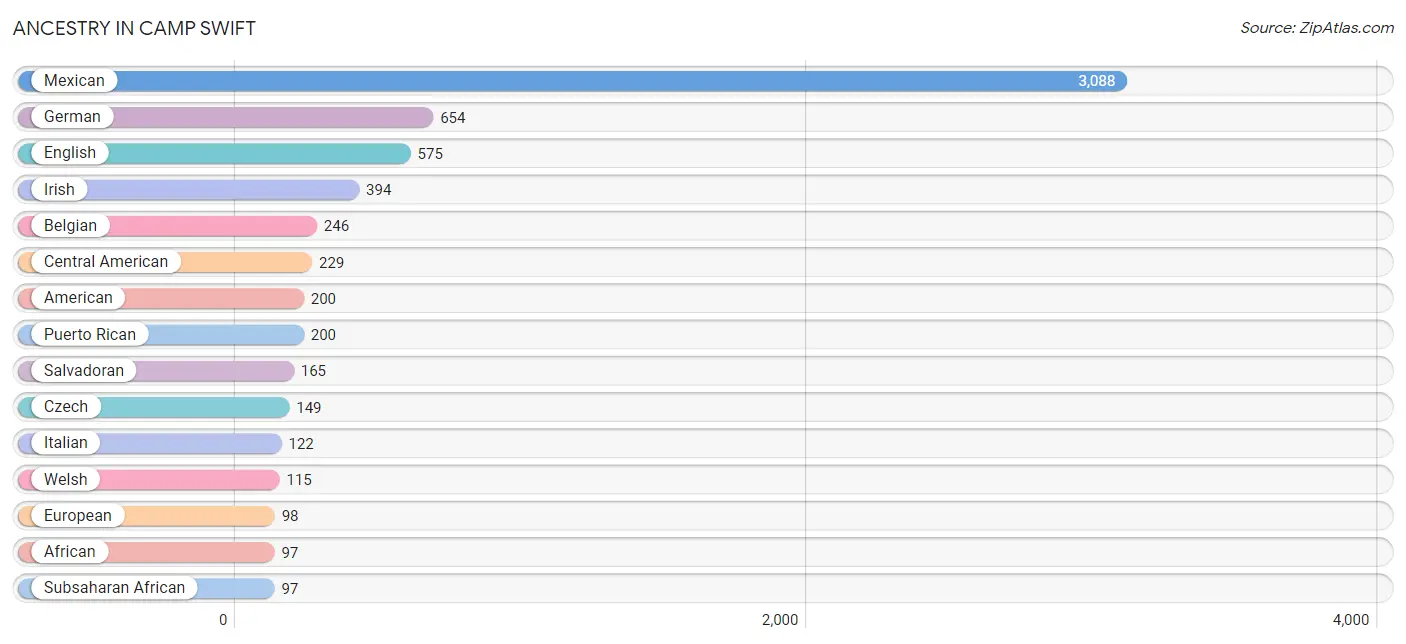
| Ancestry | # Population | % Population |
| African | 97 | 1.4% |
| American | 200 | 2.9% |
| Belgian | 246 | 3.6% |
| Blackfeet | 38 | 0.5% |
| Burmese | 10 | 0.1% |
| Canadian | 3 | 0.0% |
| Central American | 229 | 3.3% |
| Cherokee | 70 | 1.0% |
| Czech | 149 | 2.2% |
| Dominican | 12 | 0.2% |
| Dutch | 48 | 0.7% |
| English | 575 | 8.3% |
| European | 98 | 1.4% |
| French | 61 | 0.9% |
| French Canadian | 65 | 0.9% |
| German | 654 | 9.5% |
| Honduran | 31 | 0.4% |
| Irish | 394 | 5.7% |
| Italian | 122 | 1.8% |
| Mexican | 3,088 | 44.7% |
| Mexican American Indian | 40 | 0.6% |
| Nicaraguan | 33 | 0.5% |
| Norwegian | 21 | 0.3% |
| Polish | 11 | 0.2% |
| Puerto Rican | 200 | 2.9% |
| Russian | 11 | 0.2% |
| Salvadoran | 165 | 2.4% |
| Scandinavian | 12 | 0.2% |
| Scotch-Irish | 17 | 0.3% |
| Scottish | 9 | 0.1% |
| Sioux | 44 | 0.6% |
| Subsaharan African | 97 | 1.4% |
| Swedish | 11 | 0.2% |
| Thai | 10 | 0.1% |
| Welsh | 115 | 1.7% | View All 35 Rows |
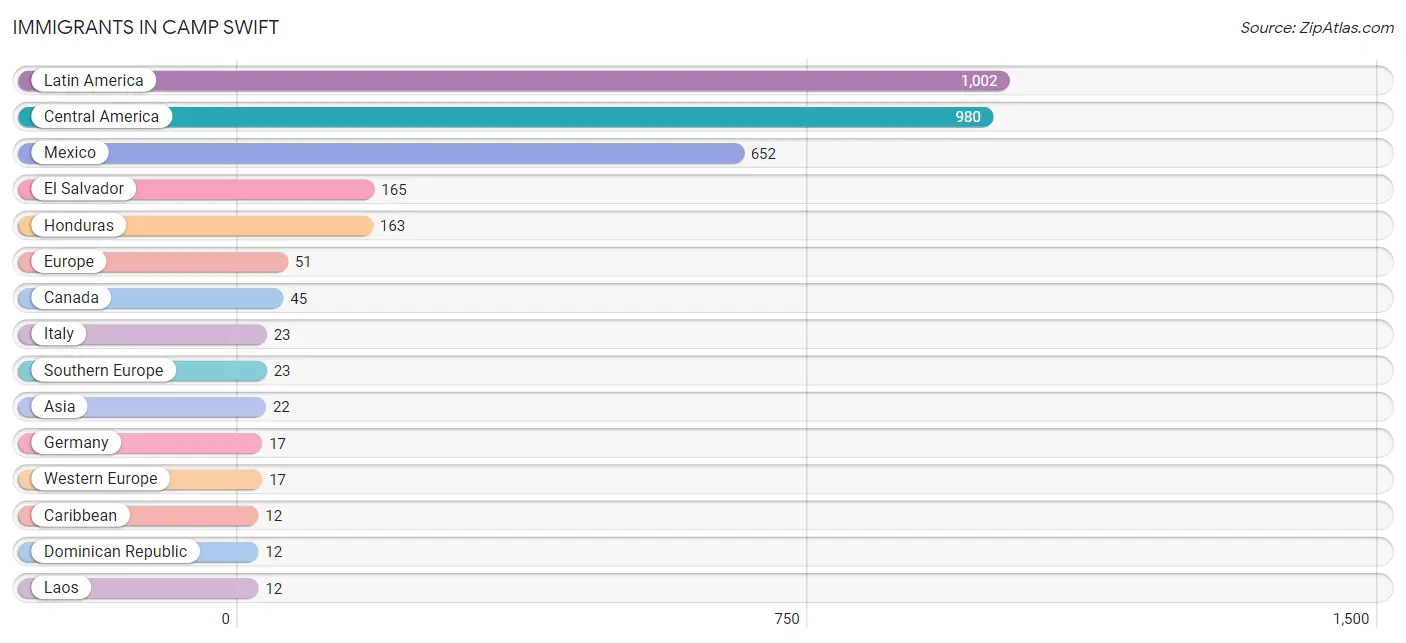
Immigrants in Camp Swift
The most numerous immigrant groups reported in Camp Swift came from Latin America (1,002 | 14.5%), Central America (980 | 14.2%), Mexico (652 | 9.4%), El Salvador (165 | 2.4%), and Honduras (163 | 2.4%), together accounting for 42.9% of all Camp Swift residents.
| Immigration Origin | # Population | % Population |
| Asia | 22 | 0.3% |
| Canada | 45 | 0.6% |
| Caribbean | 12 | 0.2% |
| Central America | 980 | 14.2% |
| Colombia | 10 | 0.1% |
| Dominican Republic | 12 | 0.2% |
| El Salvador | 165 | 2.4% |
| England | 11 | 0.2% |
| Europe | 51 | 0.7% |
| Germany | 17 | 0.3% |
| Honduras | 163 | 2.4% |
| India | 10 | 0.1% |
| Italy | 23 | 0.3% |
| Laos | 12 | 0.2% |
| Latin America | 1,002 | 14.5% |
| Mexico | 652 | 9.4% |
| Northern Europe | 11 | 0.2% |
| South America | 10 | 0.1% |
| South Central Asia | 10 | 0.1% |
| South Eastern Asia | 12 | 0.2% |
| Southern Europe | 23 | 0.3% |
| Western Europe | 17 | 0.3% | View All 22 Rows |
Sex and Age in Camp Swift
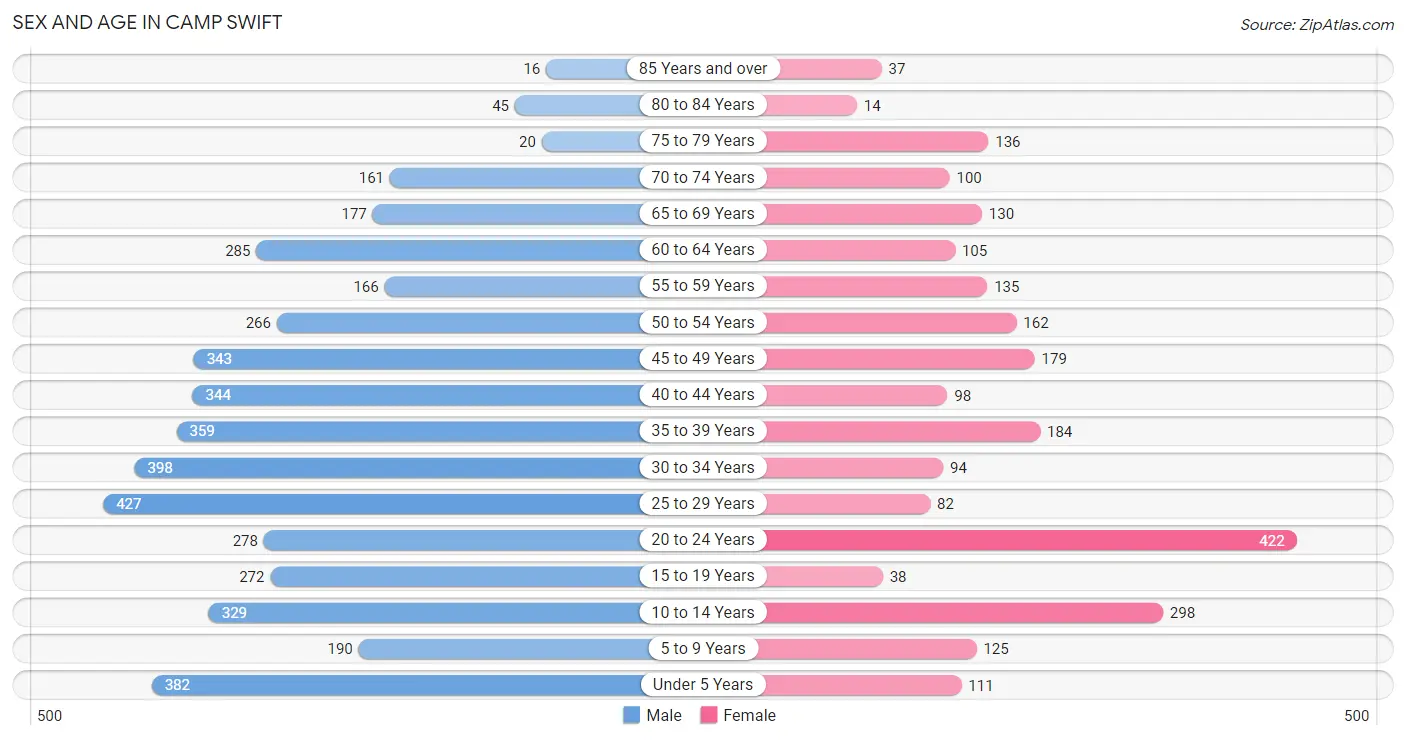
Sex and Age in Camp Swift
The most populous age groups in Camp Swift are 25 to 29 Years (427 | 9.6%) for men and 20 to 24 Years (422 | 17.2%) for women.
| Age Bracket | Male | Female |
| Under 5 Years | 382 (8.6%) | 111 (4.5%) |
| 5 to 9 Years | 190 (4.3%) | 125 (5.1%) |
| 10 to 14 Years | 329 (7.4%) | 298 (12.2%) |
| 15 to 19 Years | 272 (6.1%) | 38 (1.5%) |
| 20 to 24 Years | 278 (6.2%) | 422 (17.2%) |
| 25 to 29 Years | 427 (9.6%) | 82 (3.4%) |
| 30 to 34 Years | 398 (8.9%) | 94 (3.8%) |
| 35 to 39 Years | 359 (8.1%) | 184 (7.5%) |
| 40 to 44 Years | 344 (7.7%) | 98 (4.0%) |
| 45 to 49 Years | 343 (7.7%) | 179 (7.3%) |
| 50 to 54 Years | 266 (6.0%) | 162 (6.6%) |
| 55 to 59 Years | 166 (3.7%) | 135 (5.5%) |
| 60 to 64 Years | 285 (6.4%) | 105 (4.3%) |
| 65 to 69 Years | 177 (4.0%) | 130 (5.3%) |
| 70 to 74 Years | 161 (3.6%) | 100 (4.1%) |
| 75 to 79 Years | 20 (0.4%) | 136 (5.6%) |
| 80 to 84 Years | 45 (1.0%) | 14 (0.6%) |
| 85 Years and over | 16 (0.4%) | 37 (1.5%) |
| Total | 4,458 (100.0%) | 2,450 (100.0%) |
Families and Households in Camp Swift
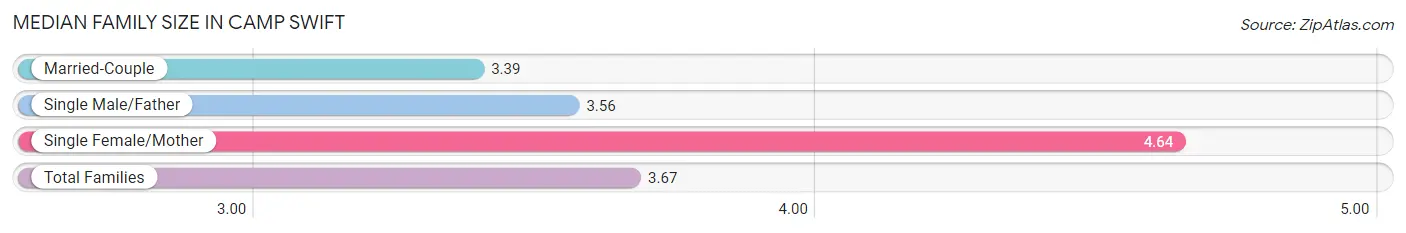
Median Family Size in Camp Swift
The median family size in Camp Swift is 3.67 persons per family, with single female/mother families (284 | 21.8%) accounting for the largest median family size of 4.64 persons per family. On the other hand, married-couple families (950 | 73.1%) represent the smallest median family size with 3.39 persons per family.
| Family Type | # Families | Family Size |
| Married-Couple | 950 (73.1%) | 3.39 |
| Single Male/Father | 66 (5.1%) | 3.56 |
| Single Female/Mother | 284 (21.8%) | 4.64 |
| Total Families | 1,300 (100.0%) | 3.67 |
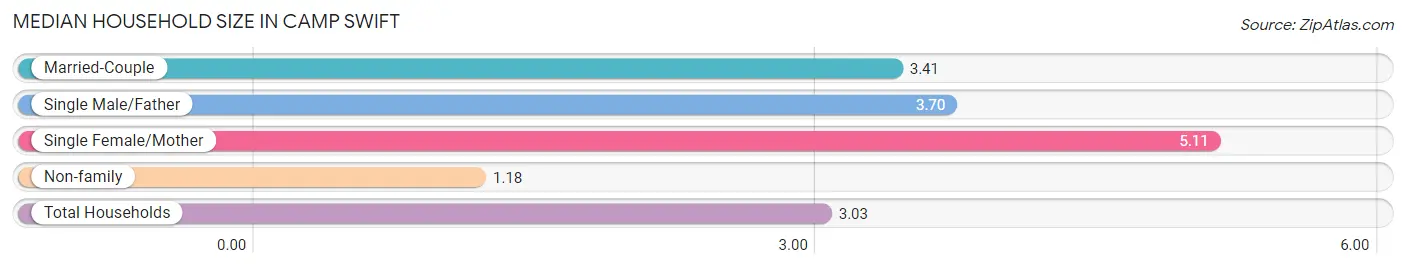
Median Household Size in Camp Swift
The median household size in Camp Swift is 3.03 persons per household, with single female/mother households (284 | 15.4%) accounting for the largest median household size of 5.11 persons per household. non-family households (541 | 29.4%) represent the smallest median household size with 1.18 persons per household.
| Household Type | # Households | Household Size |
| Married-Couple | 950 (51.6%) | 3.41 |
| Single Male/Father | 66 (3.6%) | 3.70 |
| Single Female/Mother | 284 (15.4%) | 5.11 |
| Non-family | 541 (29.4%) | 1.18 |
| Total Households | 1,841 (100.0%) | 3.03 |
Household Size by Marriage Status in Camp Swift
Out of a total of 1,841 households in Camp Swift, 1,300 (70.6%) are family households, while 541 (29.4%) are nonfamily households. The most numerous type of family households are 2-person households, comprising 443, and the most common type of nonfamily households are 1-person households, comprising 492.
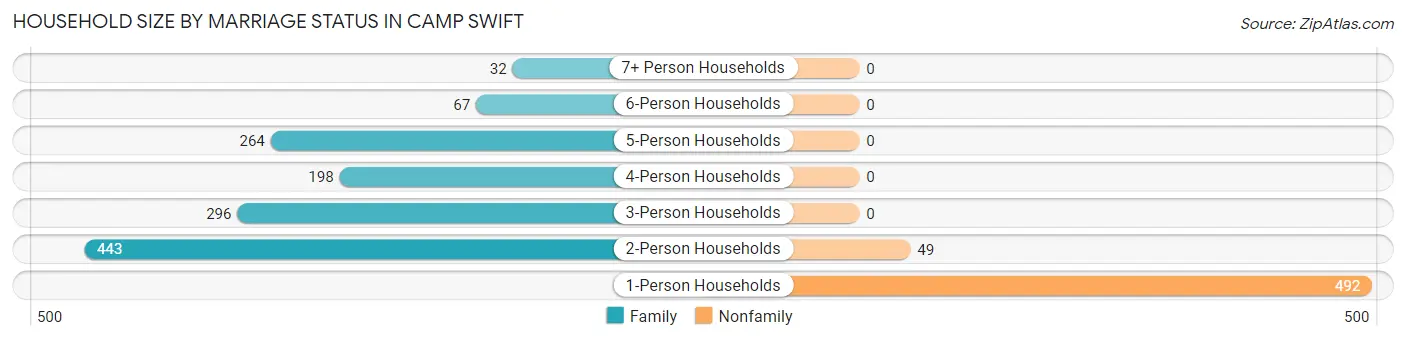
| Household Size | Family Households | Nonfamily Households |
| 1-Person Households | - | 492 (26.7%) |
| 2-Person Households | 443 (24.1%) | 49 (2.7%) |
| 3-Person Households | 296 (16.1%) | 0 (0.0%) |
| 4-Person Households | 198 (10.8%) | 0 (0.0%) |
| 5-Person Households | 264 (14.3%) | 0 (0.0%) |
| 6-Person Households | 67 (3.6%) | 0 (0.0%) |
| 7+ Person Households | 32 (1.7%) | 0 (0.0%) |
| Total | 1,300 (70.6%) | 541 (29.4%) |
Female Fertility in Camp Swift
Fertility by Age in Camp Swift
Average fertility rate in Camp Swift is 50.0 births per 1,000 women. Women in the age bracket of 20 to 34 years have the highest fertility rate with 85.0 births per 1,000 women. Women in the age bracket of 20 to 34 years acount for 91.1% of all women with births.
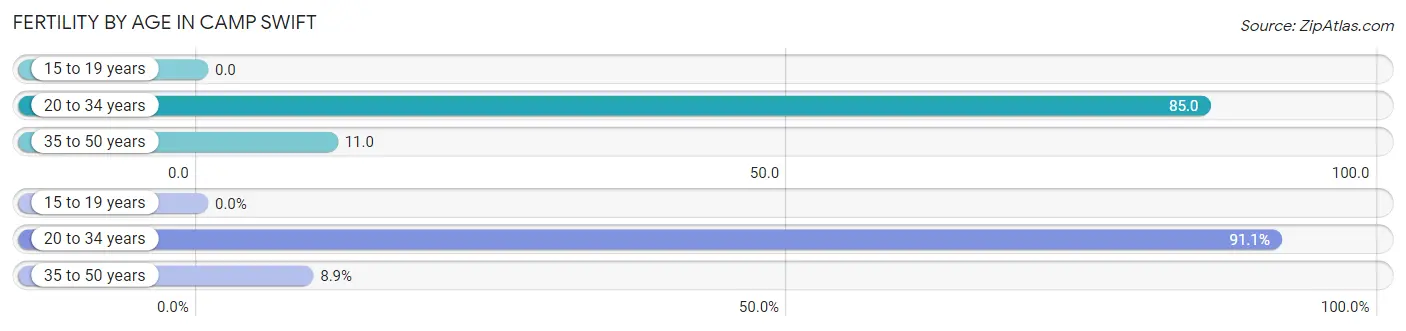
| Age Bracket | Women with Births | Births / 1,000 Women |
| 15 to 19 years | 0 (0.0%) | 0.0 |
| 20 to 34 years | 51 (91.1%) | 85.0 |
| 35 to 50 years | 5 (8.9%) | 11.0 |
| Total | 56 (100.0%) | 50.0 |
Fertility by Age by Marriage Status in Camp Swift
23.2% of women with births (56) in Camp Swift are married. The highest percentage of unmarried women with births falls into 35 to 50 years age bracket with 100.0% of them unmarried at the time of birth, while the lowest percentage of unmarried women with births belong to 20 to 34 years age bracket with 74.5% of them unmarried.
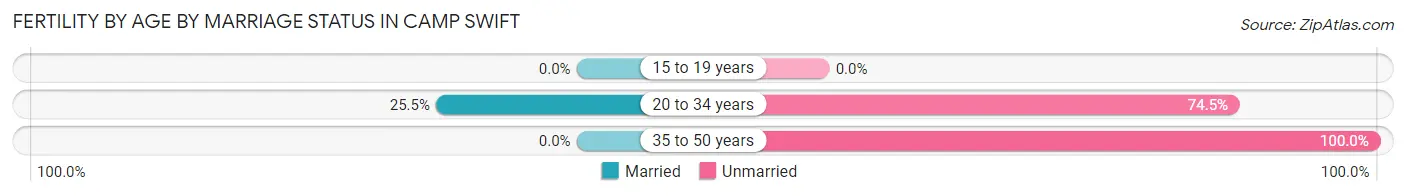
| Age Bracket | Married | Unmarried |
| 15 to 19 years | 0 (0.0%) | 0 (0.0%) |
| 20 to 34 years | 13 (25.5%) | 38 (74.5%) |
| 35 to 50 years | 0 (0.0%) | 5 (100.0%) |
| Total | 13 (23.2%) | 43 (76.8%) |
Fertility by Education in Camp Swift
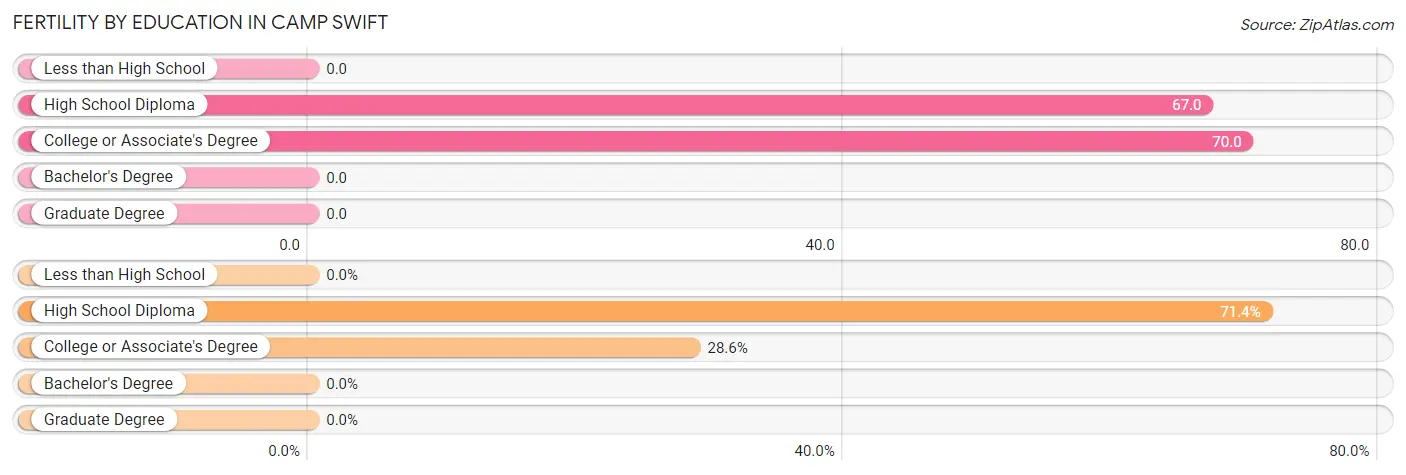
| Educational Attainment | Women with Births | Births / 1,000 Women |
| Less than High School | 0 (0.0%) | 0.0 |
| High School Diploma | 40 (71.4%) | 67.0 |
| College or Associate's Degree | 16 (28.6%) | 70.0 |
| Bachelor's Degree | 0 (0.0%) | 0.0 |
| Graduate Degree | 0 (0.0%) | 0.0 |
| Total | 56 (100.0%) | 50.0 |
Fertility by Education by Marriage Status in Camp Swift
76.8% of women with births in Camp Swift are unmarried. Women with the educational attainment of high school diploma are most likely to be married with 32.5% of them married at childbirth, while women with the educational attainment of college or associate's degree are least likely to be married with 100.0% of them unmarried at childbirth.
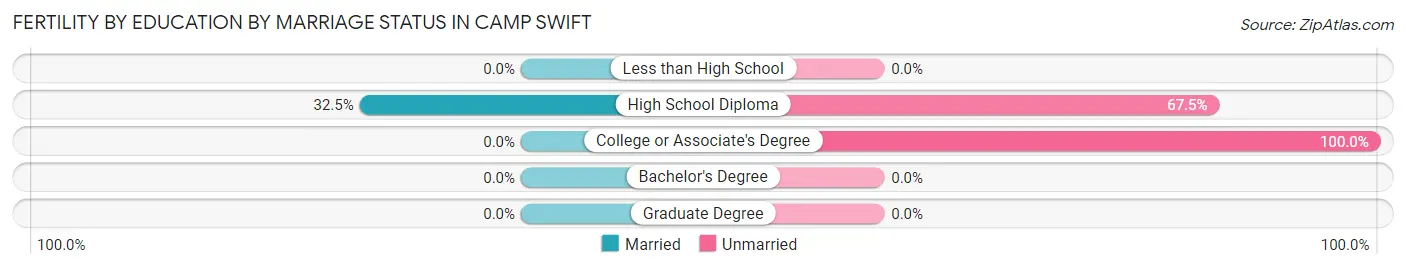
| Educational Attainment | Married | Unmarried |
| Less than High School | 0 (0.0%) | 0 (0.0%) |
| High School Diploma | 13 (32.5%) | 27 (67.5%) |
| College or Associate's Degree | 0 (0.0%) | 16 (100.0%) |
| Bachelor's Degree | 0 (0.0%) | 0 (0.0%) |
| Graduate Degree | 0 (0.0%) | 0 (0.0%) |
| Total | 13 (23.2%) | 43 (76.8%) |
Employment Characteristics in Camp Swift
Employment by Class of Employer in Camp Swift
Among the 2,803 employed individuals in Camp Swift, private company employees (2,044 | 72.9%), self-employed (not incorporated) (183 | 6.5%), and local government employees (148 | 5.3%) make up the most common classes of employment.
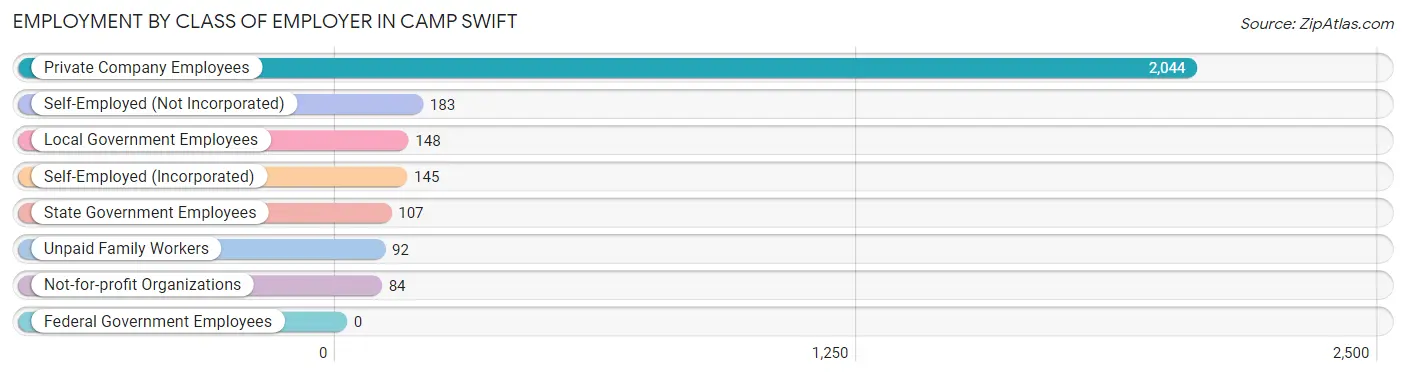
| Employer Class | # Employees | % Employees |
| Private Company Employees | 2,044 | 72.9% |
| Self-Employed (Incorporated) | 145 | 5.2% |
| Self-Employed (Not Incorporated) | 183 | 6.5% |
| Not-for-profit Organizations | 84 | 3.0% |
| Local Government Employees | 148 | 5.3% |
| State Government Employees | 107 | 3.8% |
| Federal Government Employees | 0 | 0.0% |
| Unpaid Family Workers | 92 | 3.3% |
| Total | 2,803 | 100.0% |
Employment Status by Age in Camp Swift
According to the labor force statistics for Camp Swift, out of the total population over 16 years of age (5,369), 53.0% or 2,846 individuals are in the labor force, with 1.4% or 40 of them unemployed. The age group with the highest labor force participation rate is 25 to 29 years, with 68.4% or 348 individuals in the labor force. Within the labor force, the 16 to 19 years age range has the highest percentage of unemployed individuals, with 22.3% or 31 of them being unemployed.
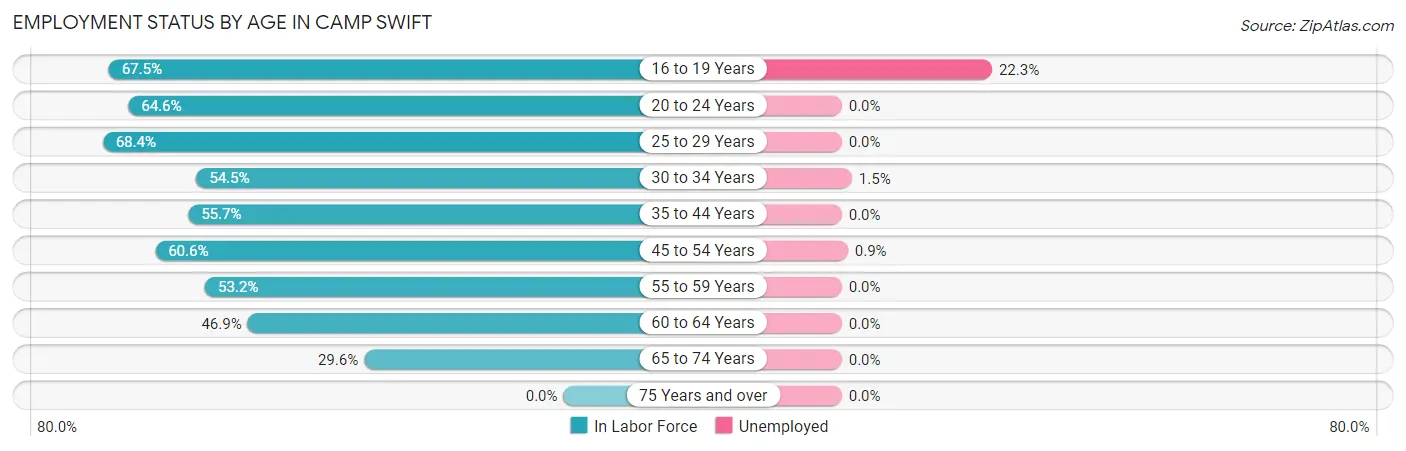
| Age Bracket | In Labor Force | Unemployed |
| 16 to 19 Years | 139 (67.5%) | 31 (22.3%) |
| 20 to 24 Years | 452 (64.6%) | 0 (0.0%) |
| 25 to 29 Years | 348 (68.4%) | 0 (0.0%) |
| 30 to 34 Years | 268 (54.5%) | 4 (1.5%) |
| 35 to 44 Years | 549 (55.7%) | 0 (0.0%) |
| 45 to 54 Years | 576 (60.6%) | 5 (0.9%) |
| 55 to 59 Years | 160 (53.2%) | 0 (0.0%) |
| 60 to 64 Years | 183 (46.9%) | 0 (0.0%) |
| 65 to 74 Years | 168 (29.6%) | 0 (0.0%) |
| 75 Years and over | 0 (0.0%) | 0 (0.0%) |
| Total | 2,846 (53.0%) | 40 (1.4%) |
Employment Status by Educational Attainment in Camp Swift
According to labor force statistics for Camp Swift, 57.5% of individuals (2,086) out of the total population between 25 and 64 years of age (3,627) are in the labor force, with 0.4% or 8 of them being unemployed. The group with the highest labor force participation rate are those with the educational attainment of bachelor's degree or higher, with 75.2% or 354 individuals in the labor force. Within the labor force, individuals with college / associate degree education have the highest percentage of unemployment, with 1.1% or 4 of them being unemployed.
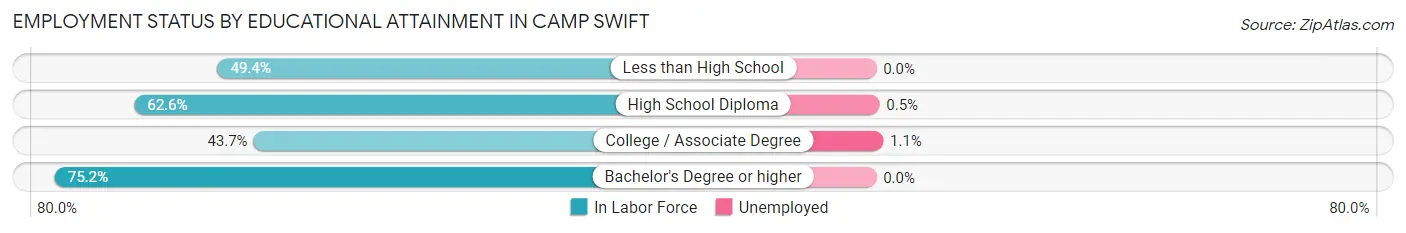
| Educational Attainment | In Labor Force | Unemployed |
| Less than High School | 308 (49.4%) | 0 (0.0%) |
| High School Diploma | 1,046 (62.6%) | 8 (0.5%) |
| College / Associate Degree | 376 (43.7%) | 9 (1.1%) |
| Bachelor's Degree or higher | 354 (75.2%) | 0 (0.0%) |
| Total | 2,086 (57.5%) | 15 (0.4%) |
Employment Occupations by Sex in Camp Swift
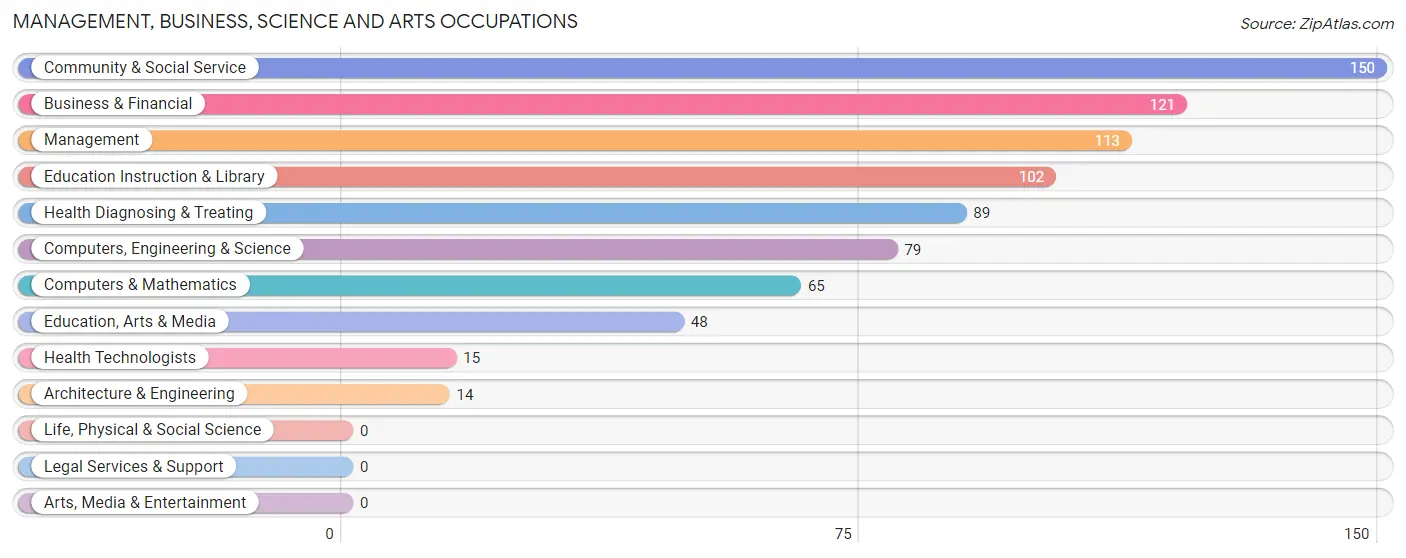
Management, Business, Science and Arts Occupations
The most common Management, Business, Science and Arts occupations in Camp Swift are Community & Social Service (150 | 5.3%), Business & Financial (121 | 4.3%), Management (113 | 4.0%), Education Instruction & Library (102 | 3.6%), and Health Diagnosing & Treating (89 | 3.2%).
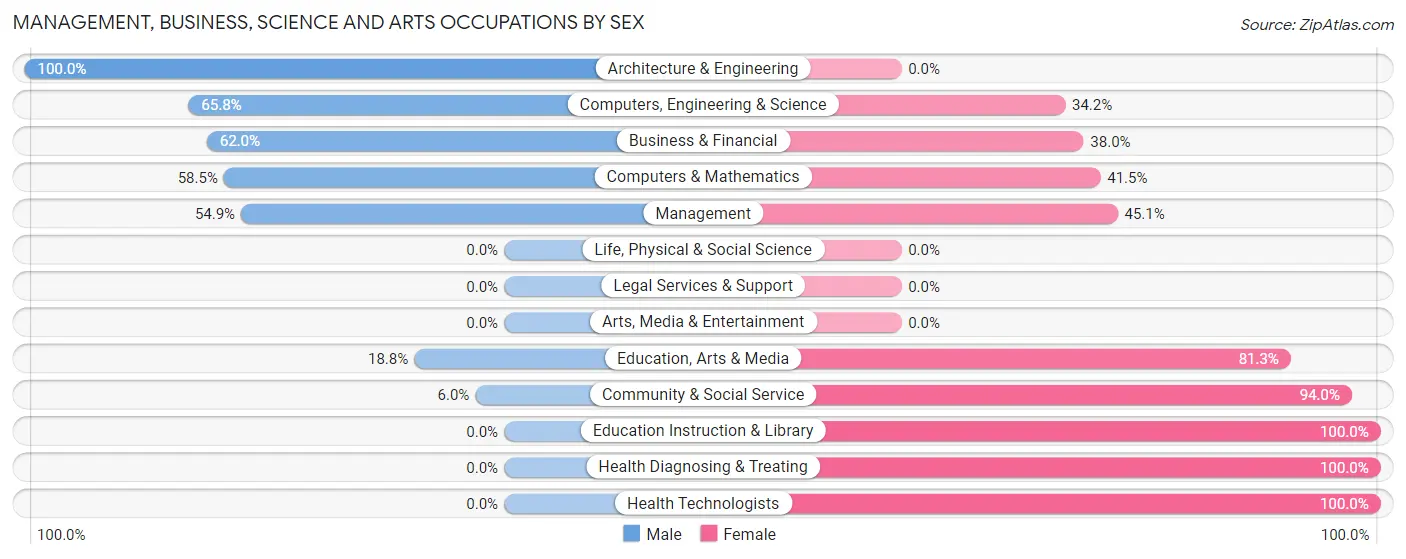
Management, Business, Science and Arts Occupations by Sex
Within the Management, Business, Science and Arts occupations in Camp Swift, the most male-oriented occupations are Architecture & Engineering (100.0%), Computers, Engineering & Science (65.8%), and Business & Financial (62.0%), while the most female-oriented occupations are Education Instruction & Library (100.0%), Health Diagnosing & Treating (100.0%), and Health Technologists (100.0%).
| Occupation | Male | Female |
| Management | 62 (54.9%) | 51 (45.1%) |
| Business & Financial | 75 (62.0%) | 46 (38.0%) |
| Computers, Engineering & Science | 52 (65.8%) | 27 (34.2%) |
| Computers & Mathematics | 38 (58.5%) | 27 (41.5%) |
| Architecture & Engineering | 14 (100.0%) | 0 (0.0%) |
| Life, Physical & Social Science | 0 (0.0%) | 0 (0.0%) |
| Community & Social Service | 9 (6.0%) | 141 (94.0%) |
| Education, Arts & Media | 9 (18.8%) | 39 (81.2%) |
| Legal Services & Support | 0 (0.0%) | 0 (0.0%) |
| Education Instruction & Library | 0 (0.0%) | 102 (100.0%) |
| Arts, Media & Entertainment | 0 (0.0%) | 0 (0.0%) |
| Health Diagnosing & Treating | 0 (0.0%) | 89 (100.0%) |
| Health Technologists | 0 (0.0%) | 15 (100.0%) |
| Total (Category) | 198 (35.9%) | 354 (64.1%) |
| Total (Overall) | 1,539 (54.9%) | 1,264 (45.1%) |
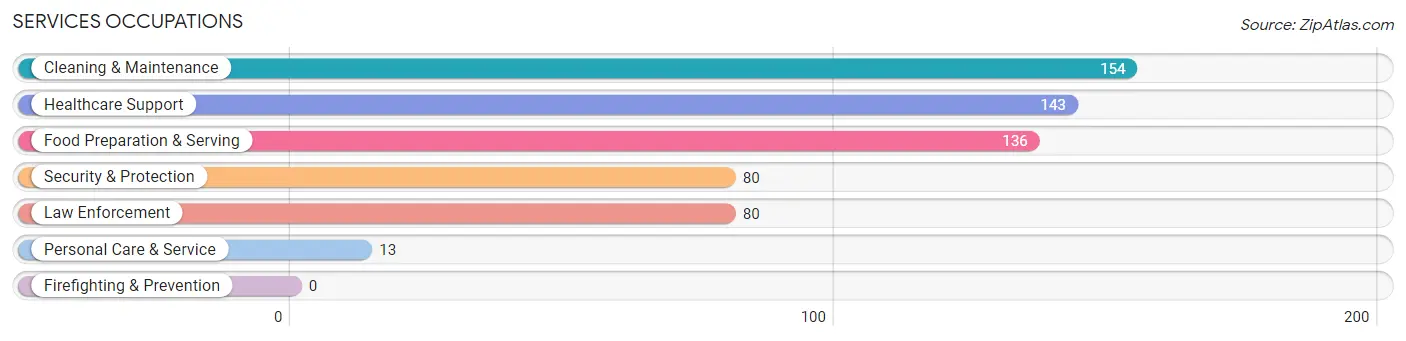
Services Occupations
The most common Services occupations in Camp Swift are Cleaning & Maintenance (154 | 5.5%), Healthcare Support (143 | 5.1%), Food Preparation & Serving (136 | 4.9%), Security & Protection (80 | 2.9%), and Law Enforcement (80 | 2.9%).
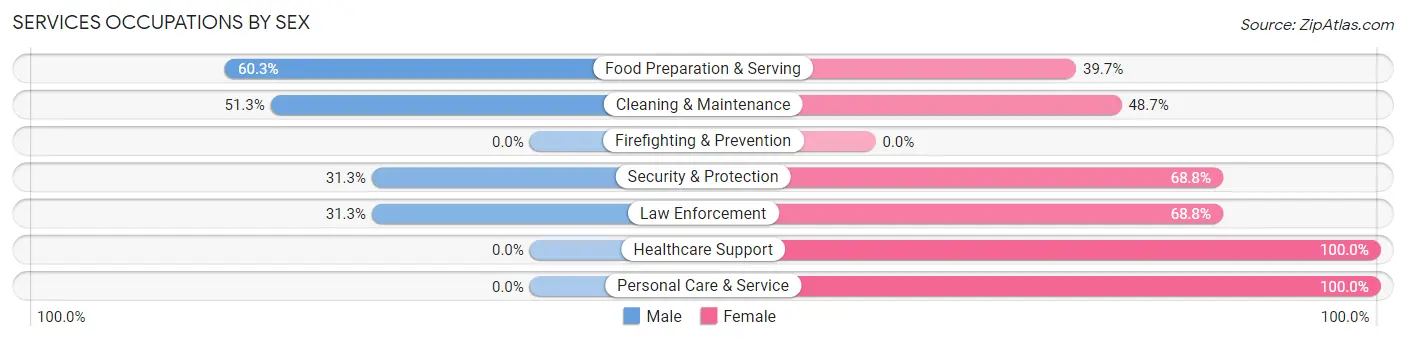
Services Occupations by Sex
Within the Services occupations in Camp Swift, the most male-oriented occupations are Food Preparation & Serving (60.3%), Cleaning & Maintenance (51.3%), and Security & Protection (31.2%), while the most female-oriented occupations are Healthcare Support (100.0%), Personal Care & Service (100.0%), and Security & Protection (68.8%).
| Occupation | Male | Female |
| Healthcare Support | 0 (0.0%) | 143 (100.0%) |
| Security & Protection | 25 (31.2%) | 55 (68.8%) |
| Firefighting & Prevention | 0 (0.0%) | 0 (0.0%) |
| Law Enforcement | 25 (31.2%) | 55 (68.8%) |
| Food Preparation & Serving | 82 (60.3%) | 54 (39.7%) |
| Cleaning & Maintenance | 79 (51.3%) | 75 (48.7%) |
| Personal Care & Service | 0 (0.0%) | 13 (100.0%) |
| Total (Category) | 186 (35.4%) | 340 (64.6%) |
| Total (Overall) | 1,539 (54.9%) | 1,264 (45.1%) |
Sales and Office Occupations
The most common Sales and Office occupations in Camp Swift are Office & Administration (447 | 16.0%), and Sales & Related (155 | 5.5%).
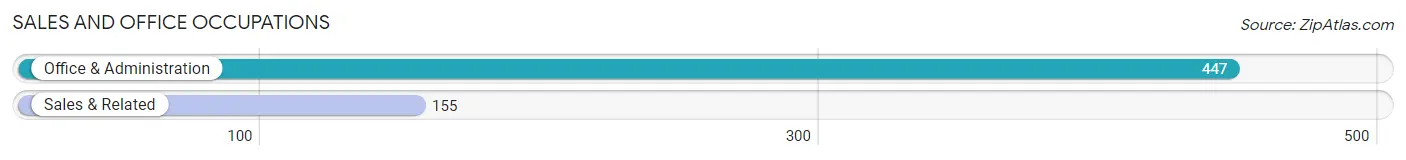
Sales and Office Occupations by Sex
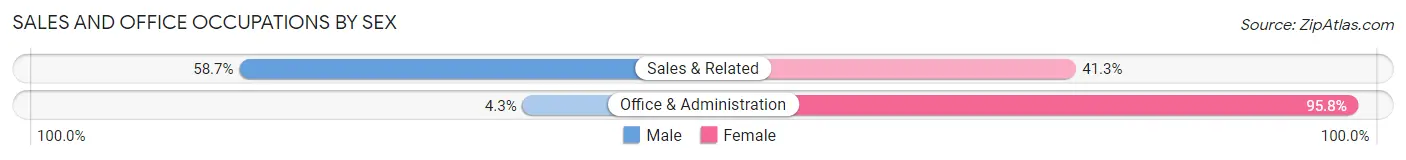
| Occupation | Male | Female |
| Sales & Related | 91 (58.7%) | 64 (41.3%) |
| Office & Administration | 19 (4.3%) | 428 (95.8%) |
| Total (Category) | 110 (18.3%) | 492 (81.7%) |
| Total (Overall) | 1,539 (54.9%) | 1,264 (45.1%) |
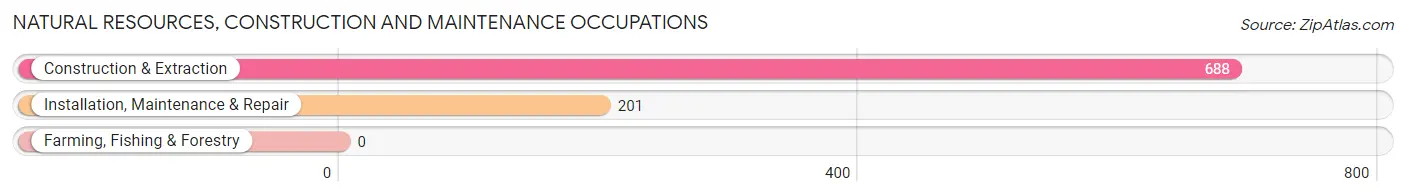
Natural Resources, Construction and Maintenance Occupations
The most common Natural Resources, Construction and Maintenance occupations in Camp Swift are Construction & Extraction (688 | 24.5%), and Installation, Maintenance & Repair (201 | 7.2%).
Natural Resources, Construction and Maintenance Occupations by Sex
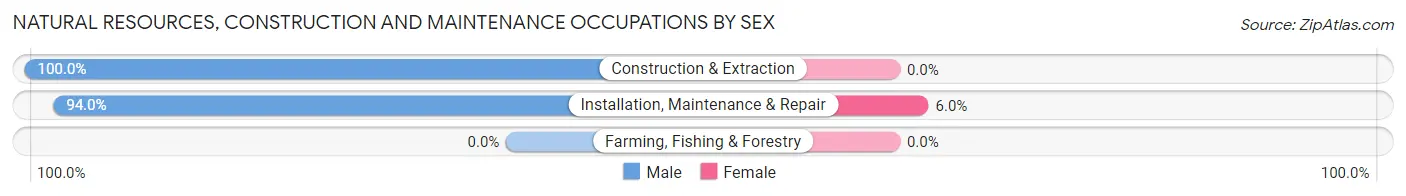
| Occupation | Male | Female |
| Farming, Fishing & Forestry | 0 (0.0%) | 0 (0.0%) |
| Construction & Extraction | 688 (100.0%) | 0 (0.0%) |
| Installation, Maintenance & Repair | 189 (94.0%) | 12 (6.0%) |
| Total (Category) | 877 (98.7%) | 12 (1.3%) |
| Total (Overall) | 1,539 (54.9%) | 1,264 (45.1%) |
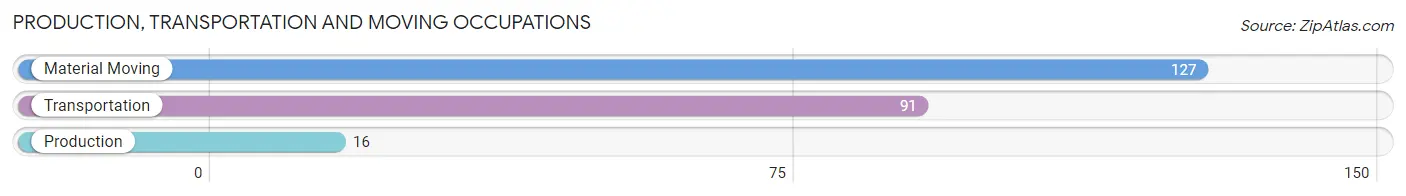
Production, Transportation and Moving Occupations
The most common Production, Transportation and Moving occupations in Camp Swift are Material Moving (127 | 4.5%), Transportation (91 | 3.3%), and Production (16 | 0.6%).
Production, Transportation and Moving Occupations by Sex
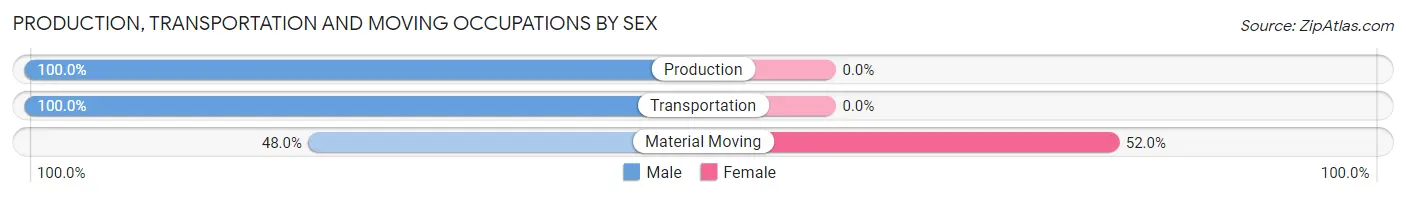
| Occupation | Male | Female |
| Production | 16 (100.0%) | 0 (0.0%) |
| Transportation | 91 (100.0%) | 0 (0.0%) |
| Material Moving | 61 (48.0%) | 66 (52.0%) |
| Total (Category) | 168 (71.8%) | 66 (28.2%) |
| Total (Overall) | 1,539 (54.9%) | 1,264 (45.1%) |
Employment Industries by Sex in Camp Swift
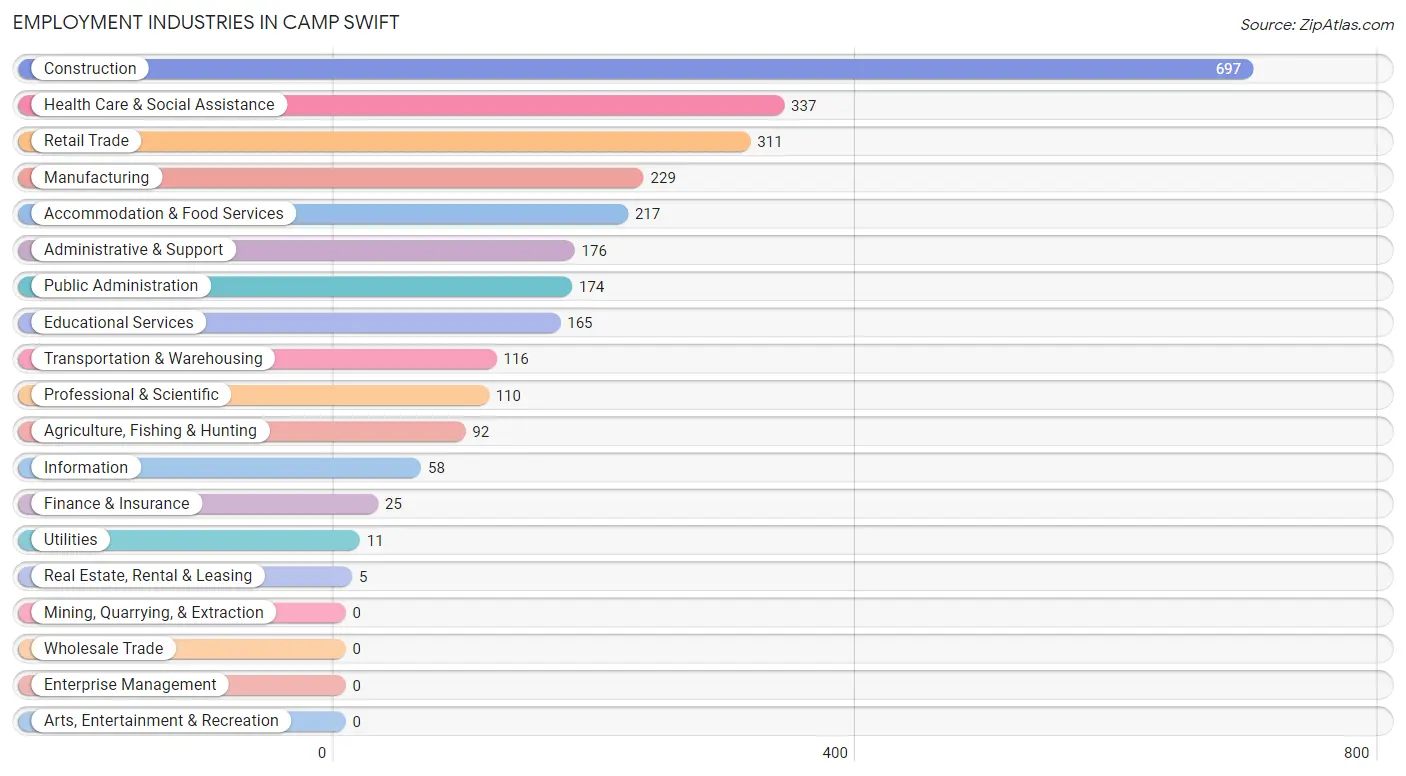
Employment Industries in Camp Swift
The major employment industries in Camp Swift include Construction (697 | 24.9%), Health Care & Social Assistance (337 | 12.0%), Retail Trade (311 | 11.1%), Manufacturing (229 | 8.2%), and Accommodation & Food Services (217 | 7.7%).
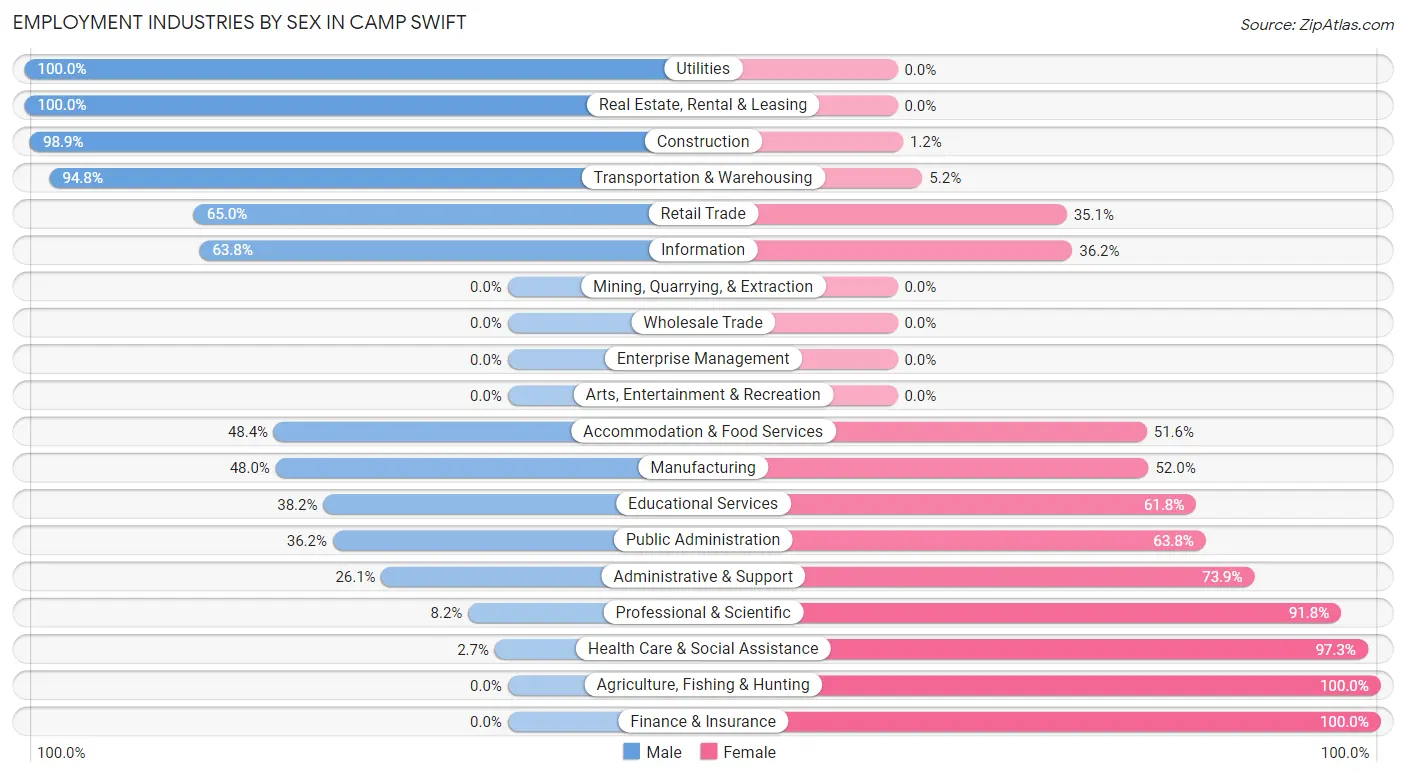
Employment Industries by Sex in Camp Swift
The Camp Swift industries that see more men than women are Utilities (100.0%), Real Estate, Rental & Leasing (100.0%), and Construction (98.9%), whereas the industries that tend to have a higher number of women are Agriculture, Fishing & Hunting (100.0%), Finance & Insurance (100.0%), and Health Care & Social Assistance (97.3%).
| Industry | Male | Female |
| Agriculture, Fishing & Hunting | 0 (0.0%) | 92 (100.0%) |
| Mining, Quarrying, & Extraction | 0 (0.0%) | 0 (0.0%) |
| Construction | 689 (98.9%) | 8 (1.1%) |
| Manufacturing | 110 (48.0%) | 119 (52.0%) |
| Wholesale Trade | 0 (0.0%) | 0 (0.0%) |
| Retail Trade | 202 (64.9%) | 109 (35.0%) |
| Transportation & Warehousing | 110 (94.8%) | 6 (5.2%) |
| Utilities | 11 (100.0%) | 0 (0.0%) |
| Information | 37 (63.8%) | 21 (36.2%) |
| Finance & Insurance | 0 (0.0%) | 25 (100.0%) |
| Real Estate, Rental & Leasing | 5 (100.0%) | 0 (0.0%) |
| Professional & Scientific | 9 (8.2%) | 101 (91.8%) |
| Enterprise Management | 0 (0.0%) | 0 (0.0%) |
| Administrative & Support | 46 (26.1%) | 130 (73.9%) |
| Educational Services | 63 (38.2%) | 102 (61.8%) |
| Health Care & Social Assistance | 9 (2.7%) | 328 (97.3%) |
| Arts, Entertainment & Recreation | 0 (0.0%) | 0 (0.0%) |
| Accommodation & Food Services | 105 (48.4%) | 112 (51.6%) |
| Public Administration | 63 (36.2%) | 111 (63.8%) |
| Total | 1,539 (54.9%) | 1,264 (45.1%) |
Education in Camp Swift
School Enrollment in Camp Swift
The most common levels of schooling among the 1,373 students in Camp Swift are middle school (476 | 34.7%), elementary school (379 | 27.6%), and high school (288 | 21.0%).
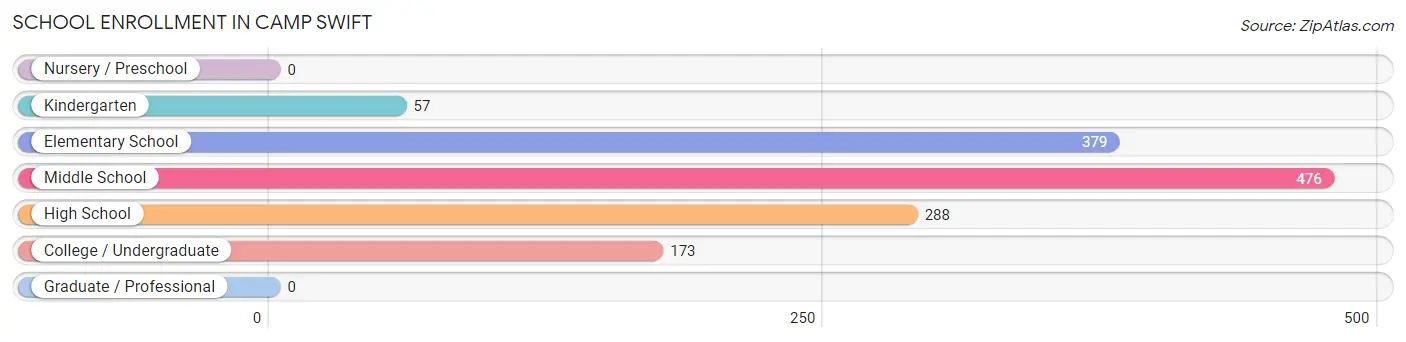
| School Level | # Students | % Students |
| Nursery / Preschool | 0 | 0.0% |
| Kindergarten | 57 | 4.2% |
| Elementary School | 379 | 27.6% |
| Middle School | 476 | 34.7% |
| High School | 288 | 21.0% |
| College / Undergraduate | 173 | 12.6% |
| Graduate / Professional | 0 | 0.0% |
| Total | 1,373 | 100.0% |
School Enrollment by Age by Funding Source in Camp Swift
Out of a total of 1,373 students who are enrolled in schools in Camp Swift, 59 (4.3%) attend a private institution, while the remaining 1,314 (95.7%) are enrolled in public schools. The age group of 35 years and over has the highest likelihood of being enrolled in private schools, with 44 (33.6% in the age bracket) enrolled. Conversely, the age group of 5 to 9 year old has the lowest likelihood of being enrolled in a private school, with 315 (100.0% in the age bracket) attending a public institution.
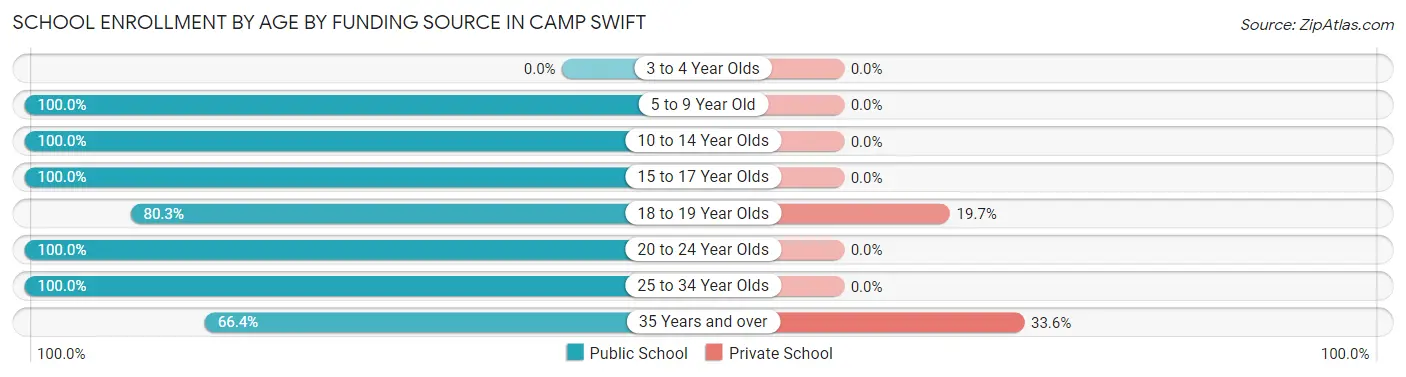
| Age Bracket | Public School | Private School |
| 3 to 4 Year Olds | 0 (0.0%) | 0 (0.0%) |
| 5 to 9 Year Old | 315 (100.0%) | 0 (0.0%) |
| 10 to 14 Year Olds | 627 (100.0%) | 0 (0.0%) |
| 15 to 17 Year Olds | 140 (100.0%) | 0 (0.0%) |
| 18 to 19 Year Olds | 61 (80.3%) | 15 (19.7%) |
| 20 to 24 Year Olds | 73 (100.0%) | 0 (0.0%) |
| 25 to 34 Year Olds | 11 (100.0%) | 0 (0.0%) |
| 35 Years and over | 87 (66.4%) | 44 (33.6%) |
| Total | 1,314 (95.7%) | 59 (4.3%) |
Educational Attainment by Field of Study in Camp Swift
Engineering (91 | 16.1%), liberal arts & history (88 | 15.6%), computers & mathematics (75 | 13.3%), social sciences (74 | 13.1%), and education (61 | 10.8%) are the most common fields of study among 565 individuals in Camp Swift who have obtained a bachelor's degree or higher.
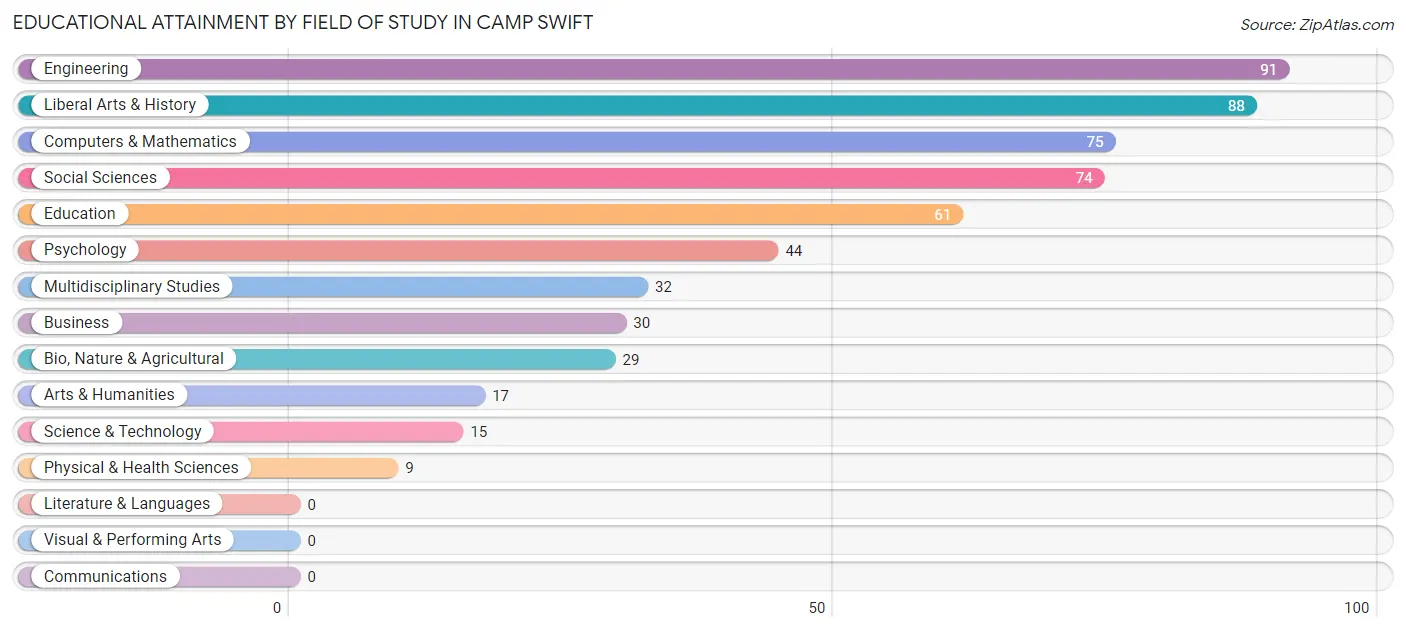
| Field of Study | # Graduates | % Graduates |
| Computers & Mathematics | 75 | 13.3% |
| Bio, Nature & Agricultural | 29 | 5.1% |
| Physical & Health Sciences | 9 | 1.6% |
| Psychology | 44 | 7.8% |
| Social Sciences | 74 | 13.1% |
| Engineering | 91 | 16.1% |
| Multidisciplinary Studies | 32 | 5.7% |
| Science & Technology | 15 | 2.6% |
| Business | 30 | 5.3% |
| Education | 61 | 10.8% |
| Literature & Languages | 0 | 0.0% |
| Liberal Arts & History | 88 | 15.6% |
| Visual & Performing Arts | 0 | 0.0% |
| Communications | 0 | 0.0% |
| Arts & Humanities | 17 | 3.0% |
| Total | 565 | 100.0% |
Transportation & Commute in Camp Swift
Vehicle Availability by Sex in Camp Swift
The most prevalent vehicle ownership categories in Camp Swift are males with 3 vehicles (460, accounting for 29.9%) and females with 3 vehicles (501, making up 36.4%).
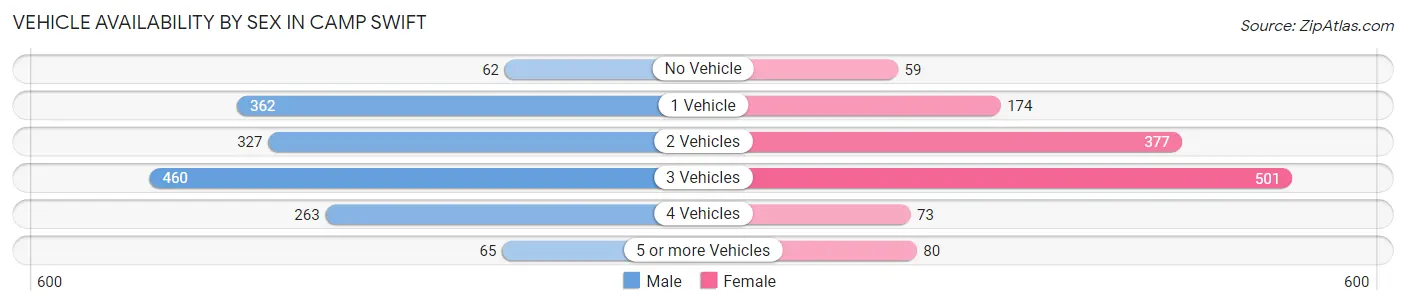
| Vehicles Available | Male | Female |
| No Vehicle | 62 (4.0%) | 59 (4.7%) |
| 1 Vehicle | 362 (23.5%) | 174 (13.8%) |
| 2 Vehicles | 327 (21.2%) | 377 (29.8%) |
| 3 Vehicles | 460 (29.9%) | 501 (39.6%) |
| 4 Vehicles | 263 (17.1%) | 73 (5.8%) |
| 5 or more Vehicles | 65 (4.2%) | 80 (6.3%) |
| Total | 1,539 (100.0%) | 1,264 (100.0%) |
Commute Time in Camp Swift
The most frequently occuring commute durations in Camp Swift are 60 to 89 minutes (551 commuters, 20.6%), 15 to 19 minutes (456 commuters, 17.0%), and 30 to 34 minutes (444 commuters, 16.6%).
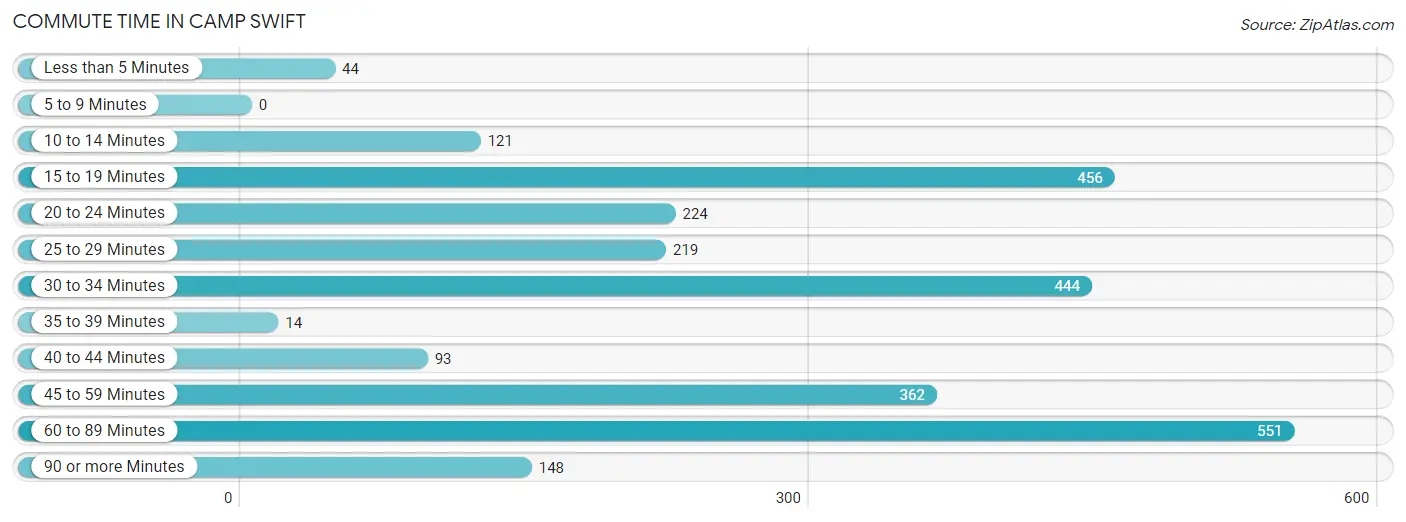
| Commute Time | # Commuters | % Commuters |
| Less than 5 Minutes | 44 | 1.6% |
| 5 to 9 Minutes | 0 | 0.0% |
| 10 to 14 Minutes | 121 | 4.5% |
| 15 to 19 Minutes | 456 | 17.0% |
| 20 to 24 Minutes | 224 | 8.4% |
| 25 to 29 Minutes | 219 | 8.2% |
| 30 to 34 Minutes | 444 | 16.6% |
| 35 to 39 Minutes | 14 | 0.5% |
| 40 to 44 Minutes | 93 | 3.5% |
| 45 to 59 Minutes | 362 | 13.5% |
| 60 to 89 Minutes | 551 | 20.6% |
| 90 or more Minutes | 148 | 5.5% |
Commute Time by Sex in Camp Swift
The most common commute times in Camp Swift are 30 to 34 minutes (350 commuters, 23.7%) for males and 60 to 89 minutes (256 commuters, 21.4%) for females.
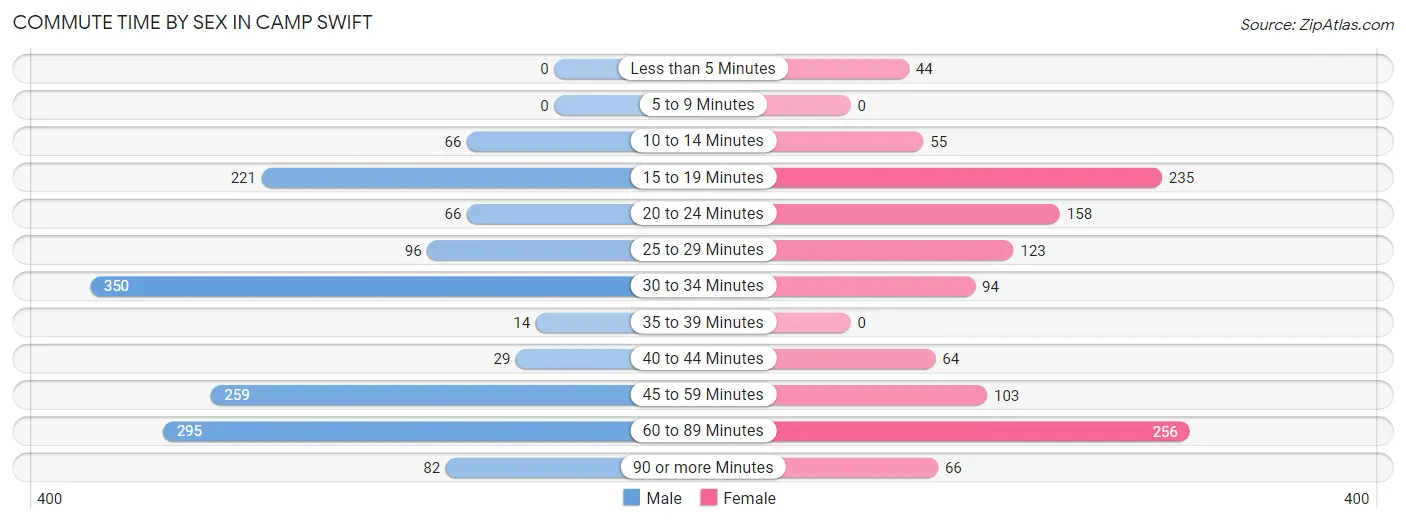
| Commute Time | Male | Female |
| Less than 5 Minutes | 0 (0.0%) | 44 (3.7%) |
| 5 to 9 Minutes | 0 (0.0%) | 0 (0.0%) |
| 10 to 14 Minutes | 66 (4.5%) | 55 (4.6%) |
| 15 to 19 Minutes | 221 (14.9%) | 235 (19.6%) |
| 20 to 24 Minutes | 66 (4.5%) | 158 (13.2%) |
| 25 to 29 Minutes | 96 (6.5%) | 123 (10.3%) |
| 30 to 34 Minutes | 350 (23.7%) | 94 (7.9%) |
| 35 to 39 Minutes | 14 (0.9%) | 0 (0.0%) |
| 40 to 44 Minutes | 29 (2.0%) | 64 (5.3%) |
| 45 to 59 Minutes | 259 (17.5%) | 103 (8.6%) |
| 60 to 89 Minutes | 295 (20.0%) | 256 (21.4%) |
| 90 or more Minutes | 82 (5.6%) | 66 (5.5%) |
Time of Departure to Work by Sex in Camp Swift
The most frequent times of departure to work in Camp Swift are 6:30 AM to 6:59 AM (375, 25.4%) for males and 6:30 AM to 6:59 AM (353, 29.5%) for females.
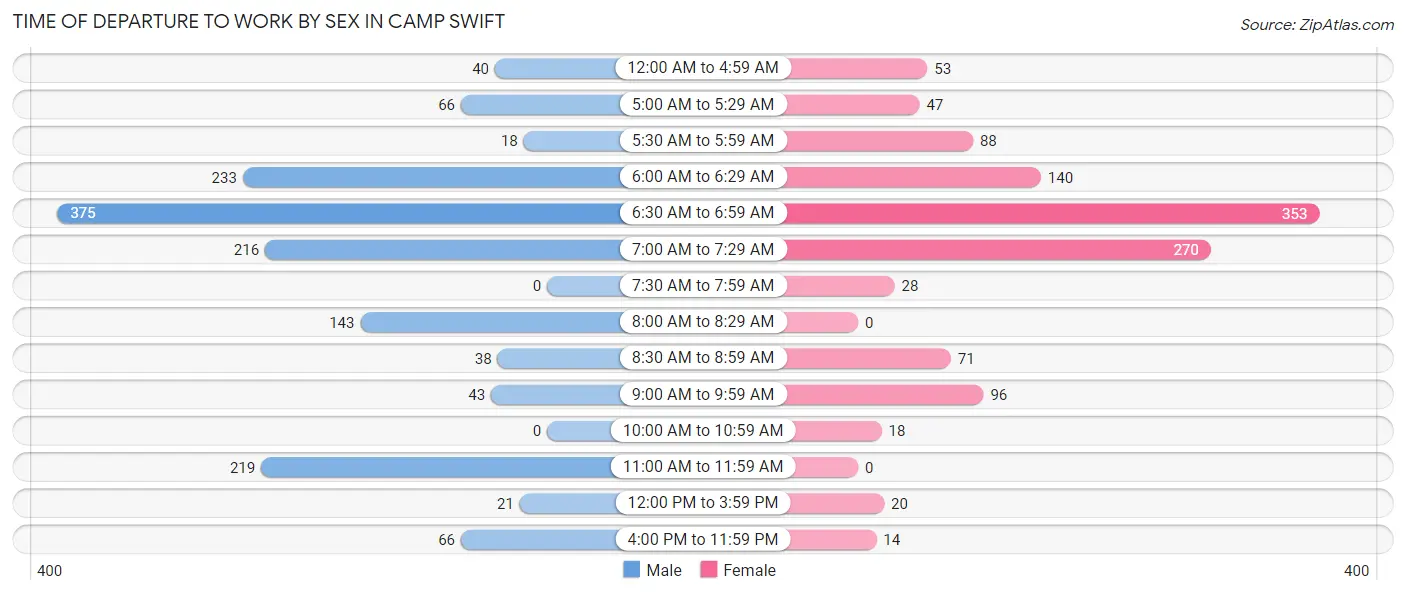
| Time of Departure | Male | Female |
| 12:00 AM to 4:59 AM | 40 (2.7%) | 53 (4.4%) |
| 5:00 AM to 5:29 AM | 66 (4.5%) | 47 (3.9%) |
| 5:30 AM to 5:59 AM | 18 (1.2%) | 88 (7.3%) |
| 6:00 AM to 6:29 AM | 233 (15.8%) | 140 (11.7%) |
| 6:30 AM to 6:59 AM | 375 (25.4%) | 353 (29.5%) |
| 7:00 AM to 7:29 AM | 216 (14.6%) | 270 (22.5%) |
| 7:30 AM to 7:59 AM | 0 (0.0%) | 28 (2.3%) |
| 8:00 AM to 8:29 AM | 143 (9.7%) | 0 (0.0%) |
| 8:30 AM to 8:59 AM | 38 (2.6%) | 71 (5.9%) |
| 9:00 AM to 9:59 AM | 43 (2.9%) | 96 (8.0%) |
| 10:00 AM to 10:59 AM | 0 (0.0%) | 18 (1.5%) |
| 11:00 AM to 11:59 AM | 219 (14.8%) | 0 (0.0%) |
| 12:00 PM to 3:59 PM | 21 (1.4%) | 20 (1.7%) |
| 4:00 PM to 11:59 PM | 66 (4.5%) | 14 (1.2%) |
| Total | 1,478 (100.0%) | 1,198 (100.0%) |
Housing Occupancy in Camp Swift
Occupancy by Ownership in Camp Swift
Of the total 1,841 dwellings in Camp Swift, owner-occupied units account for 1,475 (80.1%), while renter-occupied units make up 366 (19.9%).
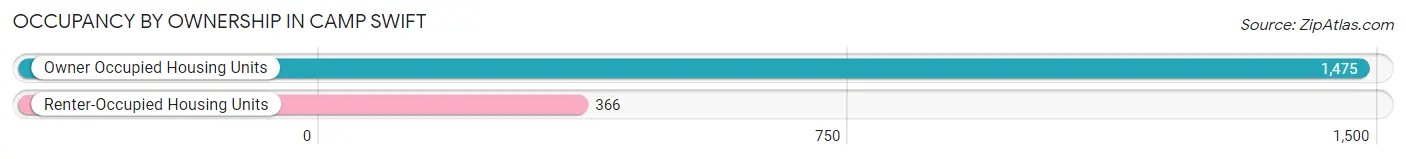
| Occupancy | # Housing Units | % Housing Units |
| Owner Occupied Housing Units | 1,475 | 80.1% |
| Renter-Occupied Housing Units | 366 | 19.9% |
| Total Occupied Housing Units | 1,841 | 100.0% |
Occupancy by Household Size in Camp Swift
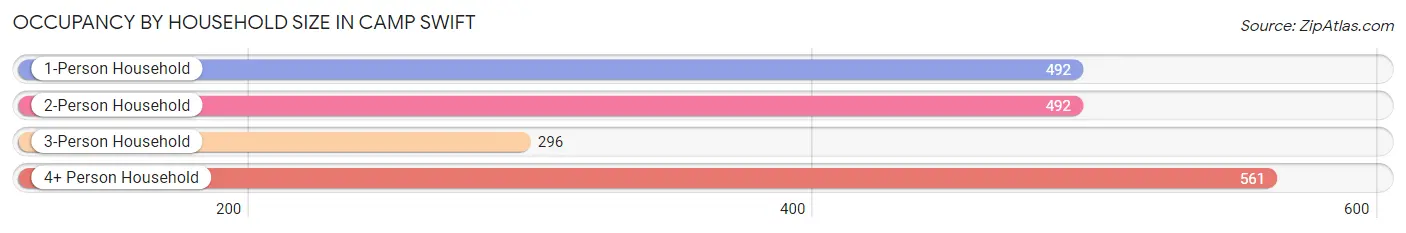
| Household Size | # Housing Units | % Housing Units |
| 1-Person Household | 492 | 26.7% |
| 2-Person Household | 492 | 26.7% |
| 3-Person Household | 296 | 16.1% |
| 4+ Person Household | 561 | 30.5% |
| Total Housing Units | 1,841 | 100.0% |
Occupancy by Ownership by Household Size in Camp Swift
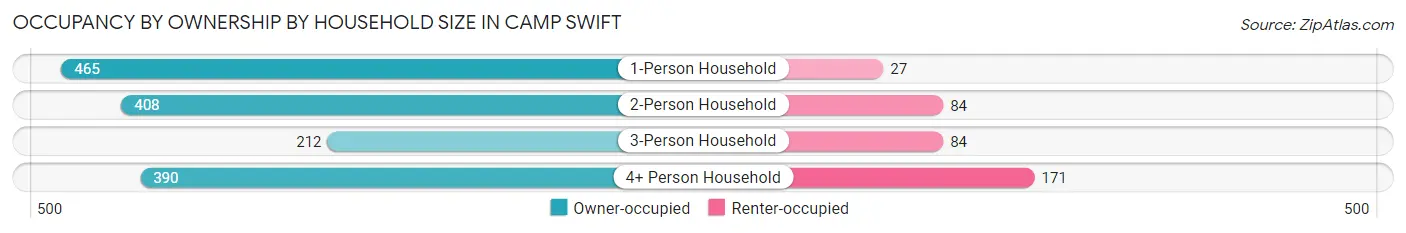
| Household Size | Owner-occupied | Renter-occupied |
| 1-Person Household | 465 (94.5%) | 27 (5.5%) |
| 2-Person Household | 408 (82.9%) | 84 (17.1%) |
| 3-Person Household | 212 (71.6%) | 84 (28.4%) |
| 4+ Person Household | 390 (69.5%) | 171 (30.5%) |
| Total Housing Units | 1,475 (80.1%) | 366 (19.9%) |
Occupancy by Educational Attainment in Camp Swift
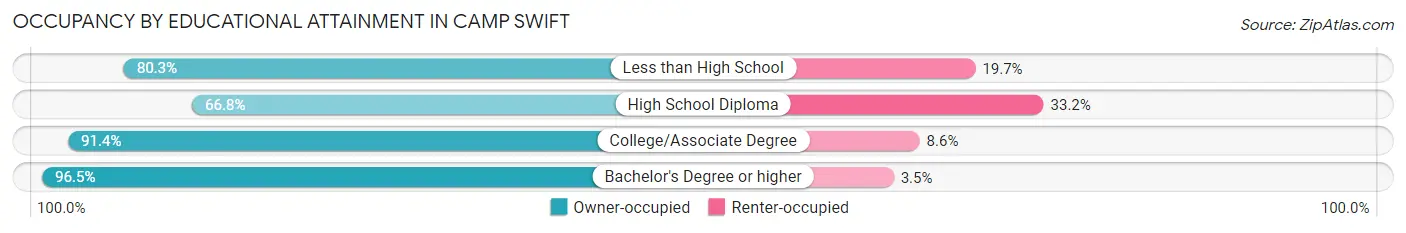
| Household Size | Owner-occupied | Renter-occupied |
| Less than High School | 253 (80.3%) | 62 (19.7%) |
| High School Diploma | 517 (66.8%) | 257 (33.2%) |
| College/Associate Degree | 371 (91.4%) | 35 (8.6%) |
| Bachelor's Degree or higher | 334 (96.5%) | 12 (3.5%) |
Occupancy by Age of Householder in Camp Swift
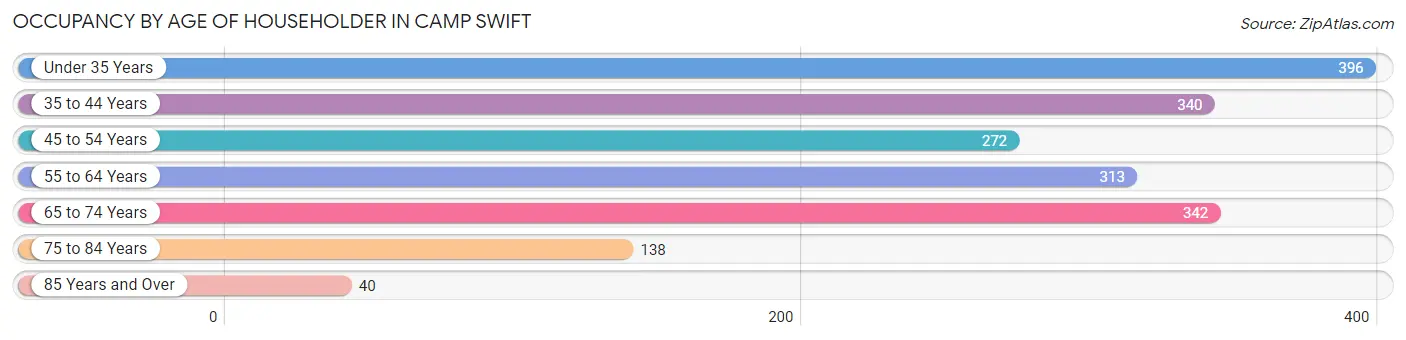
| Age Bracket | # Households | % Households |
| Under 35 Years | 396 | 21.5% |
| 35 to 44 Years | 340 | 18.5% |
| 45 to 54 Years | 272 | 14.8% |
| 55 to 64 Years | 313 | 17.0% |
| 65 to 74 Years | 342 | 18.6% |
| 75 to 84 Years | 138 | 7.5% |
| 85 Years and Over | 40 | 2.2% |
| Total | 1,841 | 100.0% |
Housing Finances in Camp Swift
Median Income by Occupancy in Camp Swift
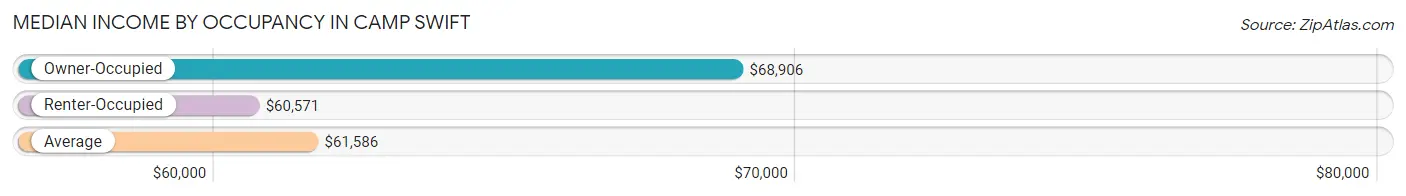
| Occupancy Type | # Households | Median Income |
| Owner-Occupied | 1,475 (80.1%) | $68,906 |
| Renter-Occupied | 366 (19.9%) | $60,571 |
| Average | 1,841 (100.0%) | $61,586 |
Occupancy by Householder Income Bracket in Camp Swift
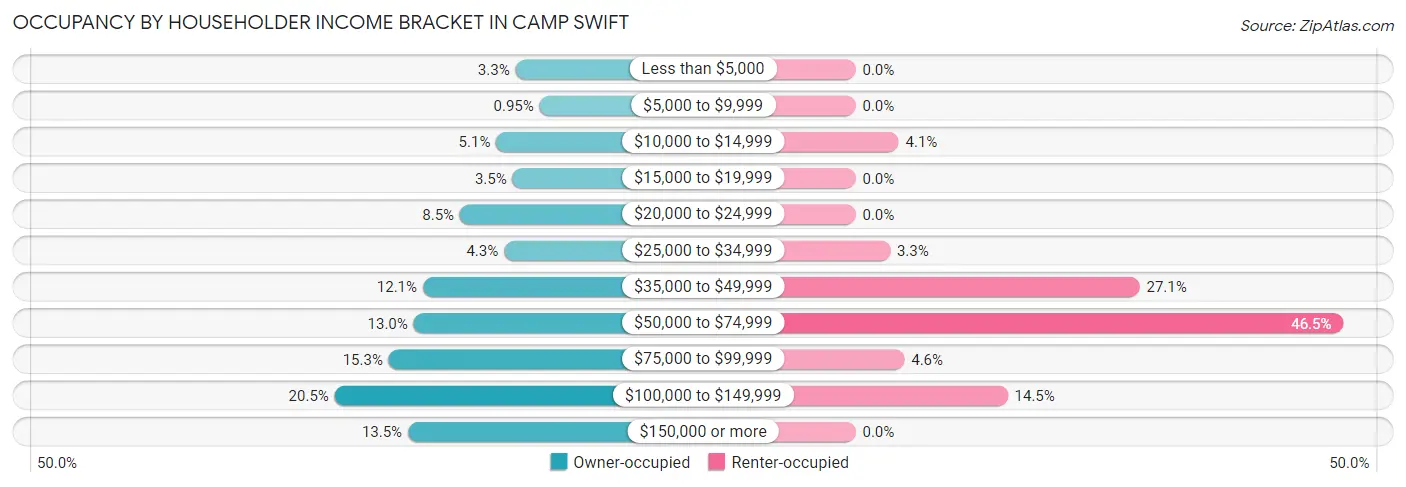
| Income Bracket | Owner-occupied | Renter-occupied |
| Less than $5,000 | 48 (3.3%) | 0 (0.0%) |
| $5,000 to $9,999 | 14 (0.9%) | 0 (0.0%) |
| $10,000 to $14,999 | 75 (5.1%) | 15 (4.1%) |
| $15,000 to $19,999 | 52 (3.5%) | 0 (0.0%) |
| $20,000 to $24,999 | 126 (8.5%) | 0 (0.0%) |
| $25,000 to $34,999 | 64 (4.3%) | 12 (3.3%) |
| $35,000 to $49,999 | 178 (12.1%) | 99 (27.1%) |
| $50,000 to $74,999 | 191 (13.0%) | 170 (46.5%) |
| $75,000 to $99,999 | 226 (15.3%) | 17 (4.6%) |
| $100,000 to $149,999 | 302 (20.5%) | 53 (14.5%) |
| $150,000 or more | 199 (13.5%) | 0 (0.0%) |
| Total | 1,475 (100.0%) | 366 (100.0%) |
Monthly Housing Cost Tiers in Camp Swift
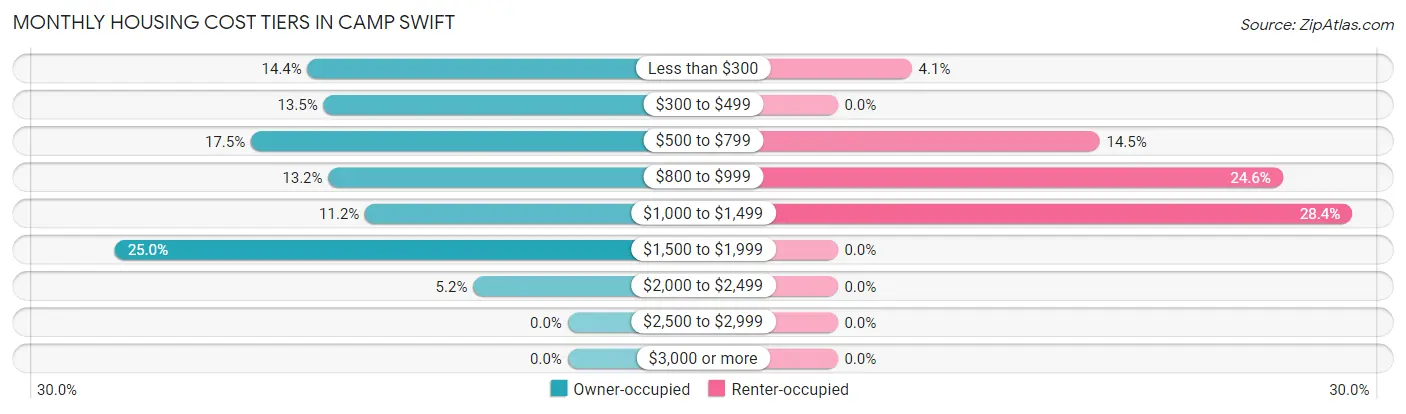
| Monthly Cost | Owner-occupied | Renter-occupied |
| Less than $300 | 212 (14.4%) | 15 (4.1%) |
| $300 to $499 | 199 (13.5%) | 0 (0.0%) |
| $500 to $799 | 258 (17.5%) | 53 (14.5%) |
| $800 to $999 | 195 (13.2%) | 90 (24.6%) |
| $1,000 to $1,499 | 165 (11.2%) | 104 (28.4%) |
| $1,500 to $1,999 | 369 (25.0%) | 0 (0.0%) |
| $2,000 to $2,499 | 77 (5.2%) | 0 (0.0%) |
| $2,500 to $2,999 | 0 (0.0%) | 0 (0.0%) |
| $3,000 or more | 0 (0.0%) | 0 (0.0%) |
| Total | 1,475 (100.0%) | 366 (100.0%) |
Physical Housing Characteristics in Camp Swift
Housing Structures in Camp Swift
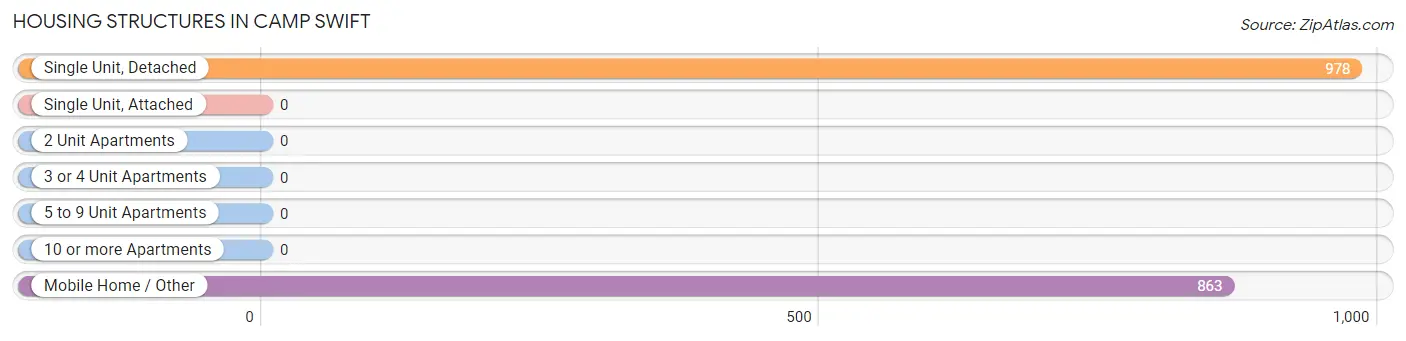
| Structure Type | # Housing Units | % Housing Units |
| Single Unit, Detached | 978 | 53.1% |
| Single Unit, Attached | 0 | 0.0% |
| 2 Unit Apartments | 0 | 0.0% |
| 3 or 4 Unit Apartments | 0 | 0.0% |
| 5 to 9 Unit Apartments | 0 | 0.0% |
| 10 or more Apartments | 0 | 0.0% |
| Mobile Home / Other | 863 | 46.9% |
| Total | 1,841 | 100.0% |
Housing Structures by Occupancy in Camp Swift
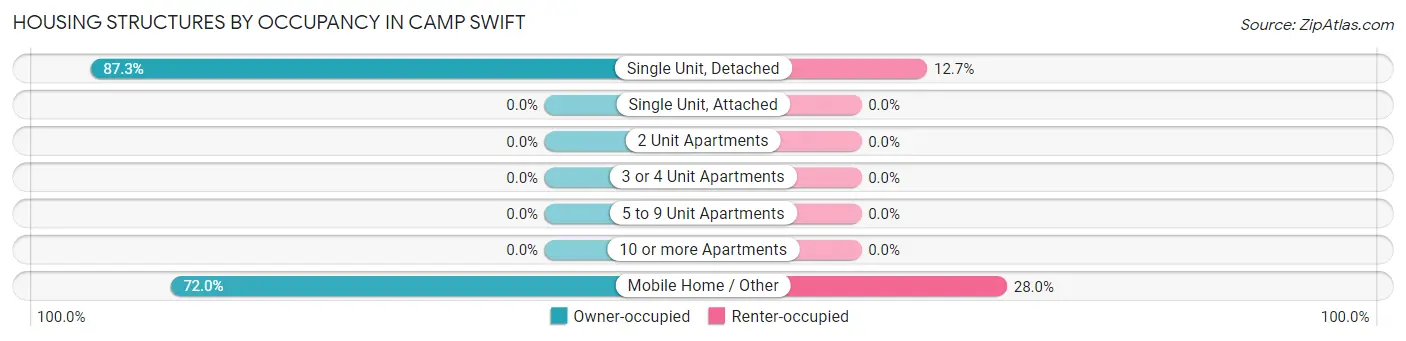
| Structure Type | Owner-occupied | Renter-occupied |
| Single Unit, Detached | 854 (87.3%) | 124 (12.7%) |
| Single Unit, Attached | 0 (0.0%) | 0 (0.0%) |
| 2 Unit Apartments | 0 (0.0%) | 0 (0.0%) |
| 3 or 4 Unit Apartments | 0 (0.0%) | 0 (0.0%) |
| 5 to 9 Unit Apartments | 0 (0.0%) | 0 (0.0%) |
| 10 or more Apartments | 0 (0.0%) | 0 (0.0%) |
| Mobile Home / Other | 621 (72.0%) | 242 (28.0%) |
| Total | 1,475 (80.1%) | 366 (19.9%) |
Housing Structures by Number of Rooms in Camp Swift
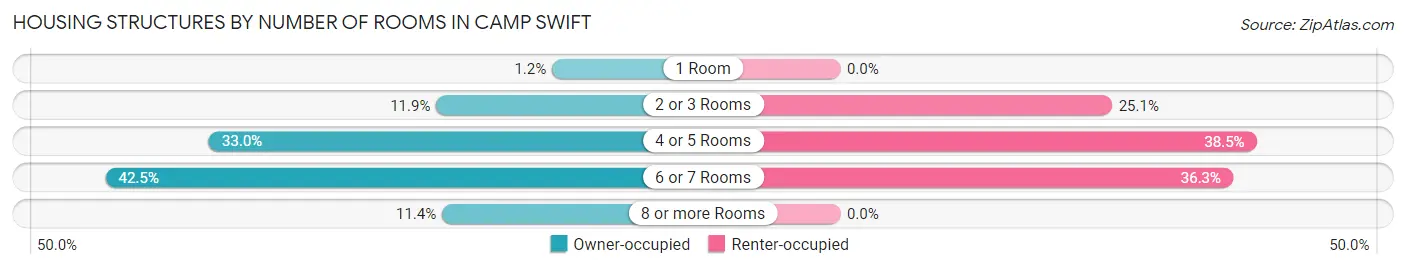
| Number of Rooms | Owner-occupied | Renter-occupied |
| 1 Room | 18 (1.2%) | 0 (0.0%) |
| 2 or 3 Rooms | 176 (11.9%) | 92 (25.1%) |
| 4 or 5 Rooms | 486 (33.0%) | 141 (38.5%) |
| 6 or 7 Rooms | 627 (42.5%) | 133 (36.3%) |
| 8 or more Rooms | 168 (11.4%) | 0 (0.0%) |
| Total | 1,475 (100.0%) | 366 (100.0%) |
Housing Structure by Heating Type in Camp Swift
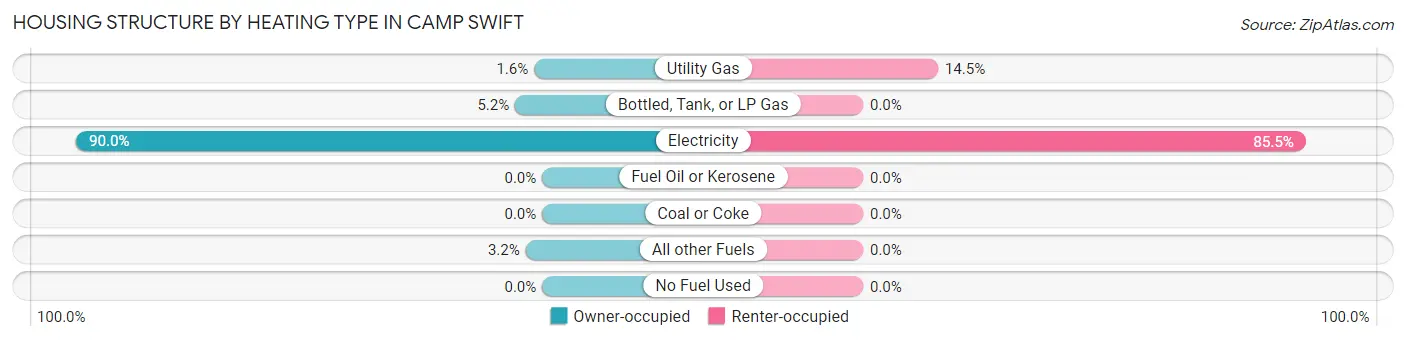
| Heating Type | Owner-occupied | Renter-occupied |
| Utility Gas | 23 (1.6%) | 53 (14.5%) |
| Bottled, Tank, or LP Gas | 77 (5.2%) | 0 (0.0%) |
| Electricity | 1,328 (90.0%) | 313 (85.5%) |
| Fuel Oil or Kerosene | 0 (0.0%) | 0 (0.0%) |
| Coal or Coke | 0 (0.0%) | 0 (0.0%) |
| All other Fuels | 47 (3.2%) | 0 (0.0%) |
| No Fuel Used | 0 (0.0%) | 0 (0.0%) |
| Total | 1,475 (100.0%) | 366 (100.0%) |
Household Vehicle Usage in Camp Swift
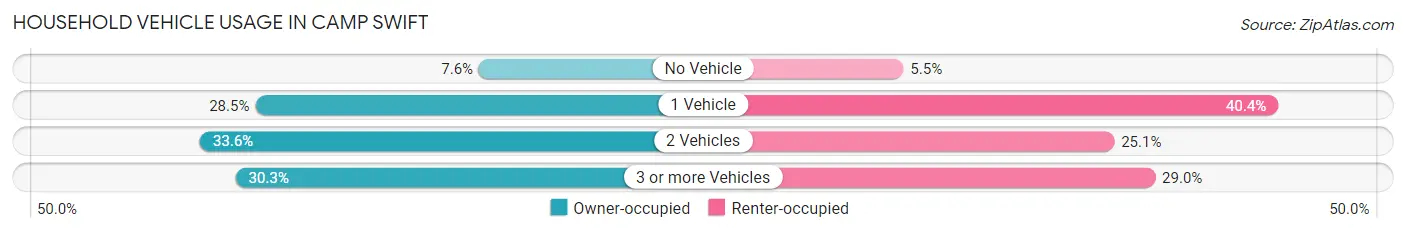
| Vehicles per Household | Owner-occupied | Renter-occupied |
| No Vehicle | 112 (7.6%) | 20 (5.5%) |
| 1 Vehicle | 420 (28.5%) | 148 (40.4%) |
| 2 Vehicles | 496 (33.6%) | 92 (25.1%) |
| 3 or more Vehicles | 447 (30.3%) | 106 (29.0%) |
| Total | 1,475 (100.0%) | 366 (100.0%) |
Real Estate & Mortgages in Camp Swift
Real Estate and Mortgage Overview in Camp Swift
| Characteristic | Without Mortgage | With Mortgage |
| Housing Units | 710 | 765 |
| Median Property Value | $93,800 | $191,800 |
| Median Household Income | $42,258 | $128 |
| Monthly Housing Costs | $416 | $0 |
| Real Estate Taxes | $1,559 | $56 |
Property Value by Mortgage Status in Camp Swift
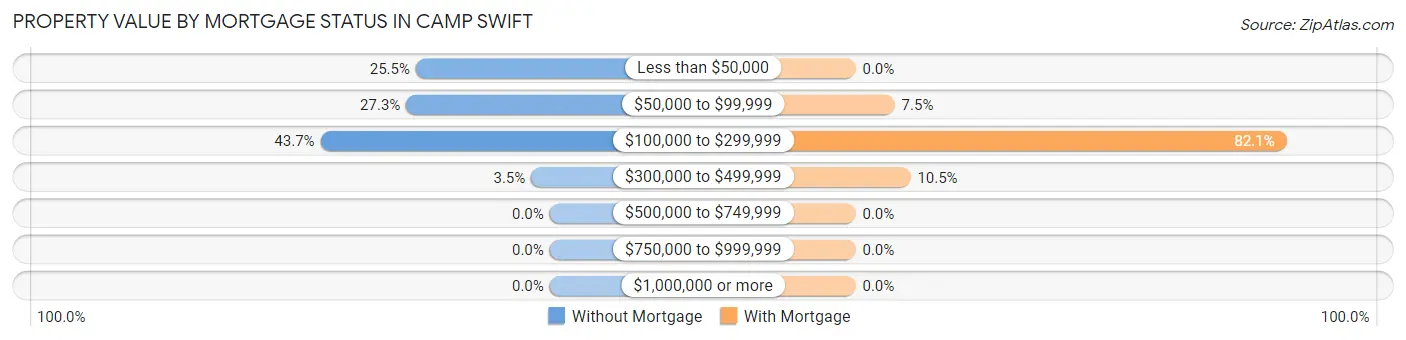
| Property Value | Without Mortgage | With Mortgage |
| Less than $50,000 | 181 (25.5%) | 0 (0.0%) |
| $50,000 to $99,999 | 194 (27.3%) | 57 (7.4%) |
| $100,000 to $299,999 | 310 (43.7%) | 628 (82.1%) |
| $300,000 to $499,999 | 25 (3.5%) | 80 (10.5%) |
| $500,000 to $749,999 | 0 (0.0%) | 0 (0.0%) |
| $750,000 to $999,999 | 0 (0.0%) | 0 (0.0%) |
| $1,000,000 or more | 0 (0.0%) | 0 (0.0%) |
| Total | 710 (100.0%) | 765 (100.0%) |
Household Income by Mortgage Status in Camp Swift
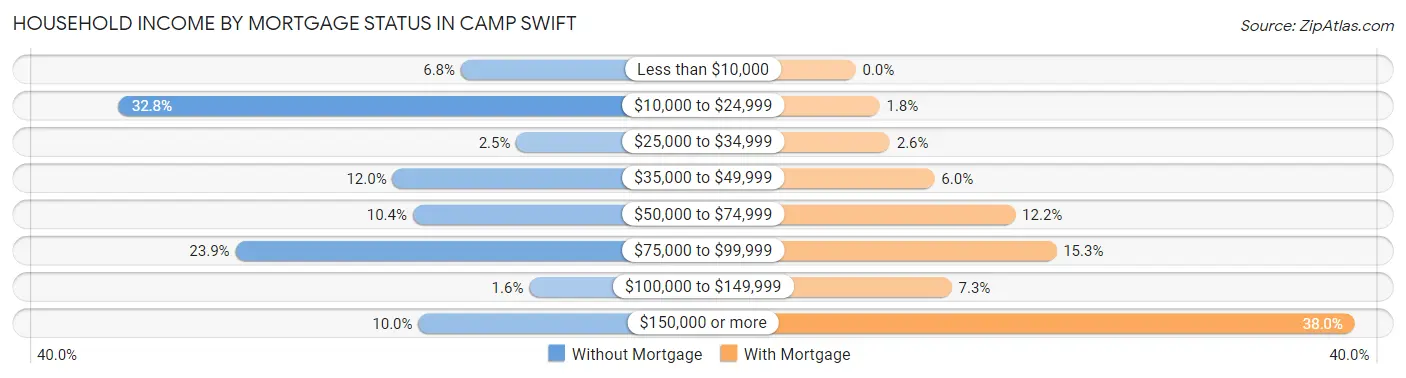
| Household Income | Without Mortgage | With Mortgage |
| Less than $10,000 | 48 (6.8%) | 0 (0.0%) |
| $10,000 to $24,999 | 233 (32.8%) | 14 (1.8%) |
| $25,000 to $34,999 | 18 (2.5%) | 20 (2.6%) |
| $35,000 to $49,999 | 85 (12.0%) | 46 (6.0%) |
| $50,000 to $74,999 | 74 (10.4%) | 93 (12.2%) |
| $75,000 to $99,999 | 170 (23.9%) | 117 (15.3%) |
| $100,000 to $149,999 | 11 (1.5%) | 56 (7.3%) |
| $150,000 or more | 71 (10.0%) | 291 (38.0%) |
| Total | 710 (100.0%) | 765 (100.0%) |
Property Value to Household Income Ratio in Camp Swift
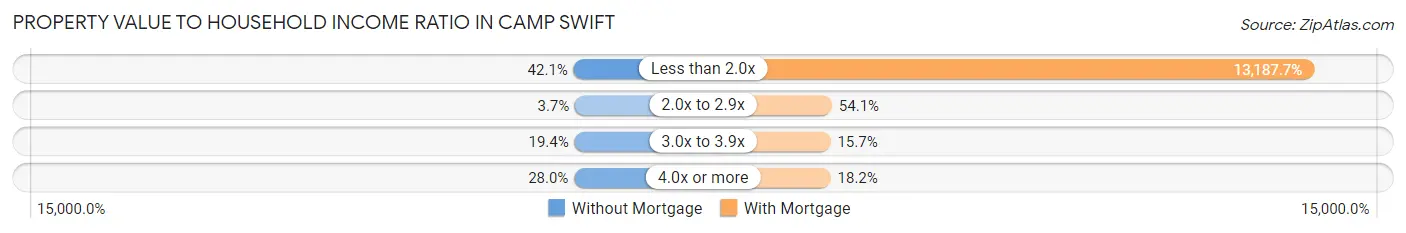
| Value-to-Income Ratio | Without Mortgage | With Mortgage |
| Less than 2.0x | 299 (42.1%) | 100,886 (13,187.7%) |
| 2.0x to 2.9x | 26 (3.7%) | 414 (54.1%) |
| 3.0x to 3.9x | 138 (19.4%) | 120 (15.7%) |
| 4.0x or more | 199 (28.0%) | 139 (18.2%) |
| Total | 710 (100.0%) | 765 (100.0%) |
Real Estate Taxes by Mortgage Status in Camp Swift
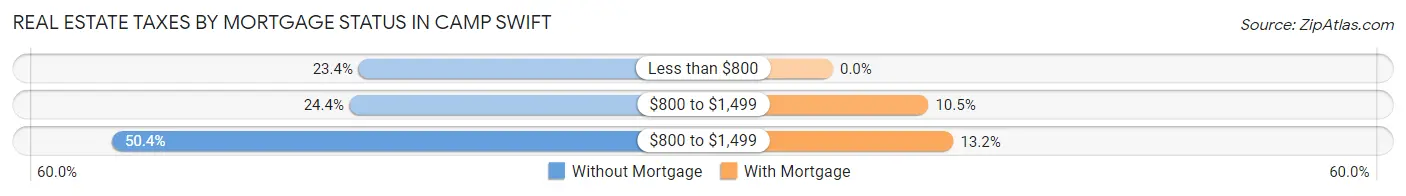
| Property Taxes | Without Mortgage | With Mortgage |
| Less than $800 | 166 (23.4%) | 0 (0.0%) |
| $800 to $1,499 | 173 (24.4%) | 80 (10.5%) |
| $800 to $1,499 | 358 (50.4%) | 101 (13.2%) |
| Total | 710 (100.0%) | 765 (100.0%) |
Health & Disability in Camp Swift
Health Insurance Coverage by Age in Camp Swift
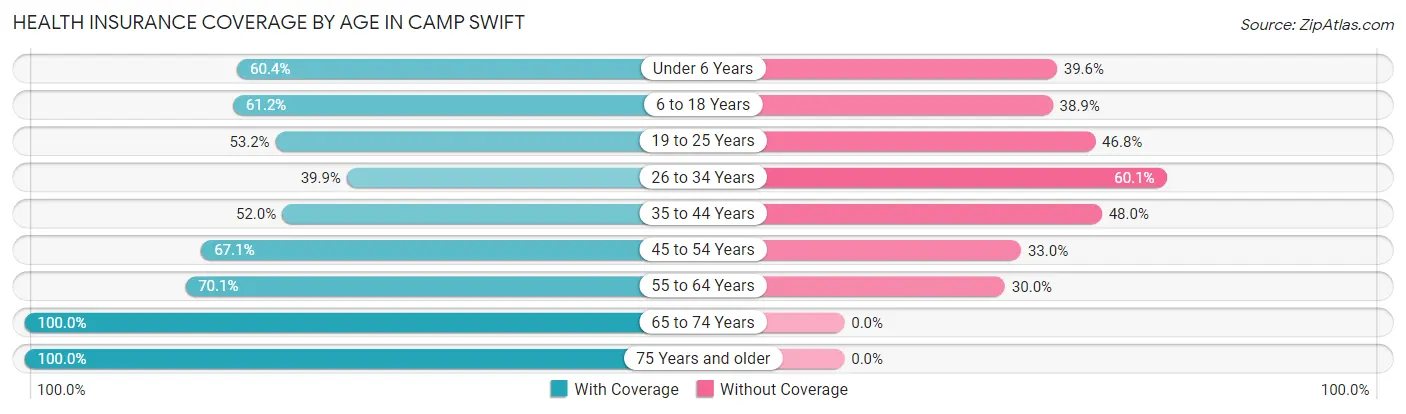
| Age Bracket | With Coverage | Without Coverage |
| Under 6 Years | 314 (60.4%) | 206 (39.6%) |
| 6 to 18 Years | 691 (61.2%) | 439 (38.9%) |
| 19 to 25 Years | 388 (53.2%) | 341 (46.8%) |
| 26 to 34 Years | 276 (39.9%) | 415 (60.1%) |
| 35 to 44 Years | 301 (52.0%) | 278 (48.0%) |
| 45 to 54 Years | 411 (67.0%) | 202 (33.0%) |
| 55 to 64 Years | 400 (70.1%) | 171 (29.9%) |
| 65 to 74 Years | 506 (100.0%) | 0 (0.0%) |
| 75 Years and older | 268 (100.0%) | 0 (0.0%) |
| Total | 3,555 (63.4%) | 2,052 (36.6%) |
Health Insurance Coverage by Citizenship Status in Camp Swift
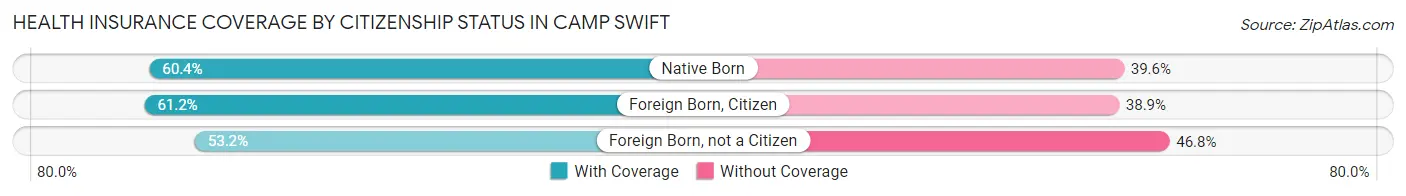
| Citizenship Status | With Coverage | Without Coverage |
| Native Born | 314 (60.4%) | 206 (39.6%) |
| Foreign Born, Citizen | 691 (61.2%) | 439 (38.9%) |
| Foreign Born, not a Citizen | 388 (53.2%) | 341 (46.8%) |
Health Insurance Coverage by Household Income in Camp Swift
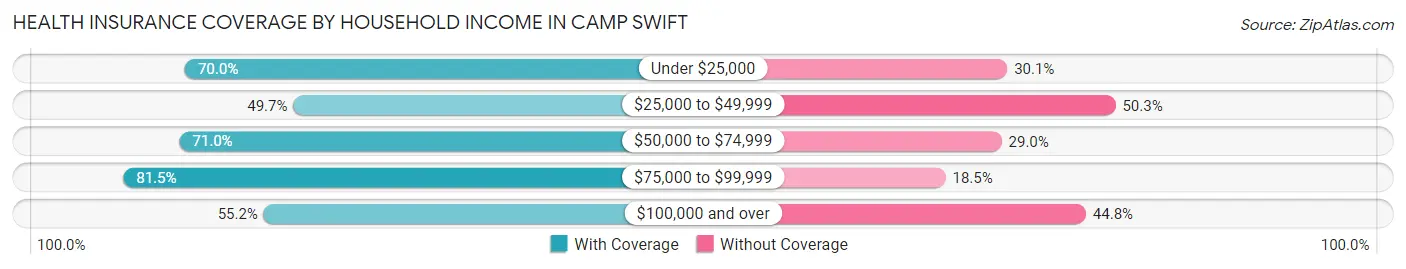
| Household Income | With Coverage | Without Coverage |
| Under $25,000 | 461 (70.0%) | 198 (30.0%) |
| $25,000 to $49,999 | 437 (49.7%) | 443 (50.3%) |
| $50,000 to $74,999 | 849 (71.0%) | 347 (29.0%) |
| $75,000 to $99,999 | 643 (81.5%) | 146 (18.5%) |
| $100,000 and over | 1,131 (55.2%) | 918 (44.8%) |
Public vs Private Health Insurance Coverage by Age in Camp Swift
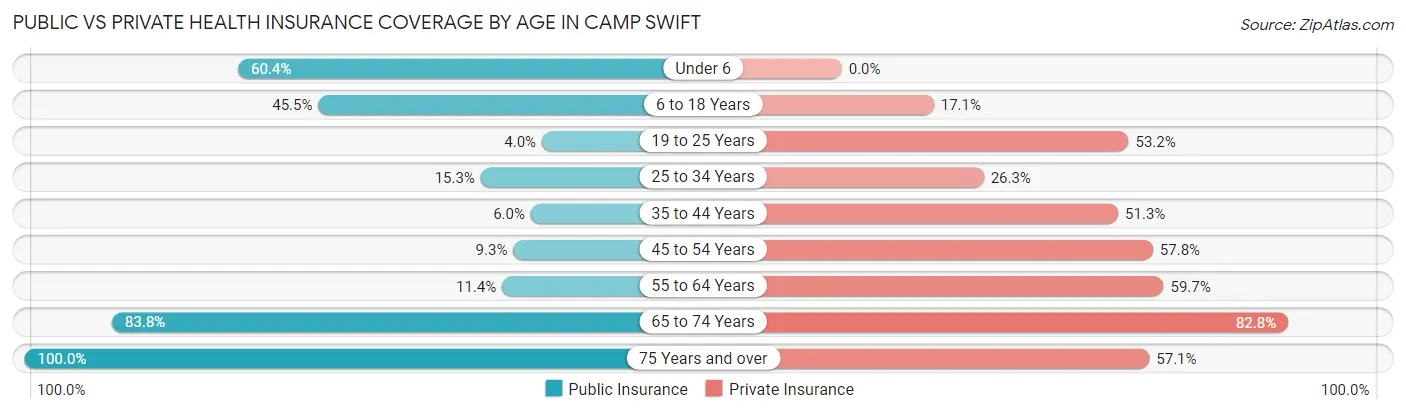
| Age Bracket | Public Insurance | Private Insurance |
| Under 6 | 314 (60.4%) | 0 (0.0%) |
| 6 to 18 Years | 514 (45.5%) | 193 (17.1%) |
| 19 to 25 Years | 29 (4.0%) | 388 (53.2%) |
| 25 to 34 Years | 106 (15.3%) | 182 (26.3%) |
| 35 to 44 Years | 35 (6.0%) | 297 (51.3%) |
| 45 to 54 Years | 57 (9.3%) | 354 (57.8%) |
| 55 to 64 Years | 65 (11.4%) | 341 (59.7%) |
| 65 to 74 Years | 424 (83.8%) | 419 (82.8%) |
| 75 Years and over | 268 (100.0%) | 153 (57.1%) |
| Total | 1,812 (32.3%) | 2,327 (41.5%) |
Disability Status by Sex by Age in Camp Swift
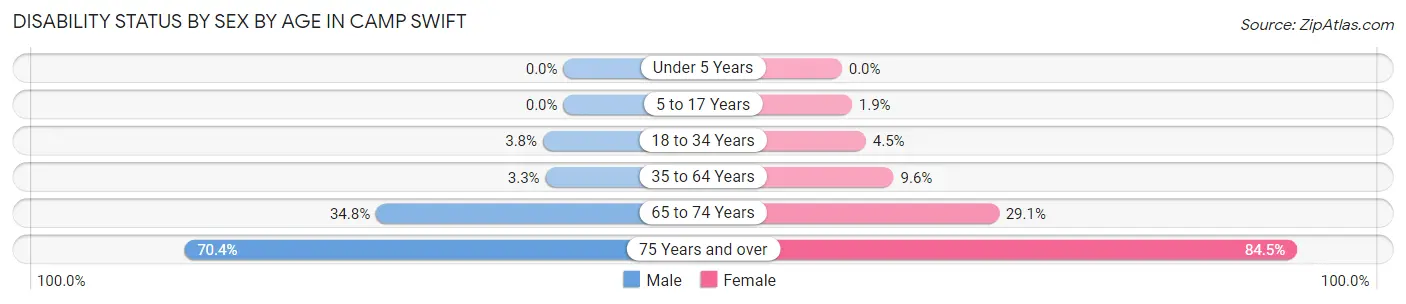
| Age Bracket | Male | Female |
| Under 5 Years | 0 (0.0%) | 0 (0.0%) |
| 5 to 17 Years | 0 (0.0%) | 8 (1.9%) |
| 18 to 34 Years | 33 (3.8%) | 28 (4.5%) |
| 35 to 64 Years | 30 (3.3%) | 83 (9.6%) |
| 65 to 74 Years | 96 (34.8%) | 67 (29.1%) |
| 75 Years and over | 57 (70.4%) | 158 (84.5%) |
Disability Class by Sex by Age in Camp Swift
Disability Class: Hearing Difficulty
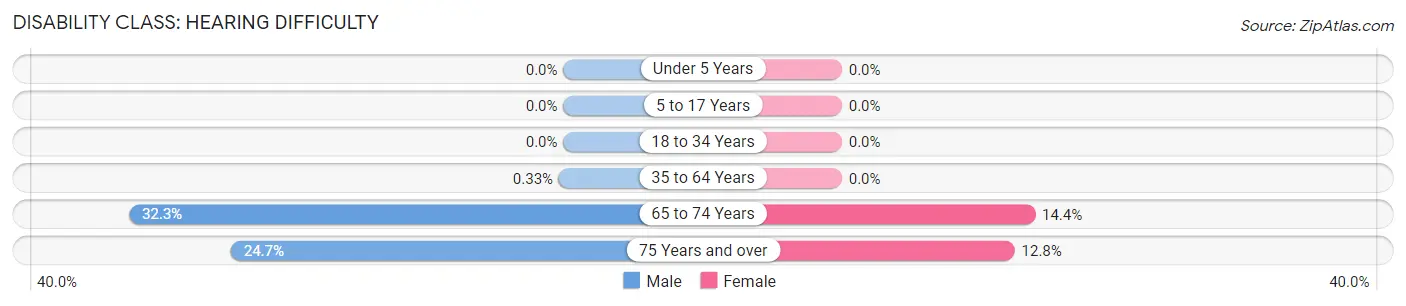
| Age Bracket | Male | Female |
| Under 5 Years | 0 (0.0%) | 0 (0.0%) |
| 5 to 17 Years | 0 (0.0%) | 0 (0.0%) |
| 18 to 34 Years | 0 (0.0%) | 0 (0.0%) |
| 35 to 64 Years | 3 (0.3%) | 0 (0.0%) |
| 65 to 74 Years | 89 (32.3%) | 33 (14.3%) |
| 75 Years and over | 20 (24.7%) | 24 (12.8%) |
Disability Class: Vision Difficulty
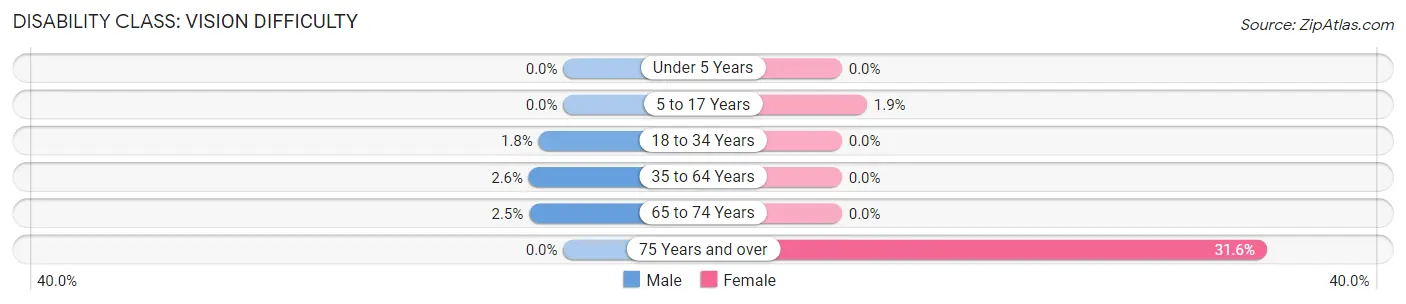
| Age Bracket | Male | Female |
| Under 5 Years | 0 (0.0%) | 0 (0.0%) |
| 5 to 17 Years | 0 (0.0%) | 8 (1.9%) |
| 18 to 34 Years | 16 (1.8%) | 0 (0.0%) |
| 35 to 64 Years | 23 (2.6%) | 0 (0.0%) |
| 65 to 74 Years | 7 (2.5%) | 0 (0.0%) |
| 75 Years and over | 0 (0.0%) | 59 (31.6%) |
Disability Class: Cognitive Difficulty
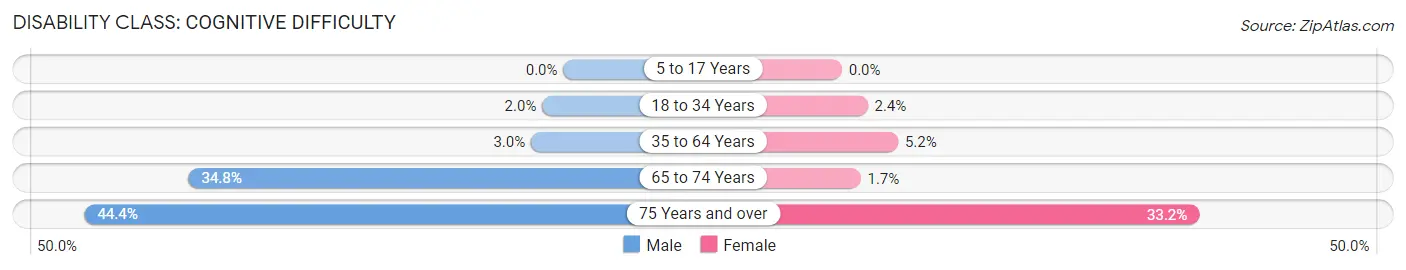
| Age Bracket | Male | Female |
| 5 to 17 Years | 0 (0.0%) | 0 (0.0%) |
| 18 to 34 Years | 17 (2.0%) | 15 (2.4%) |
| 35 to 64 Years | 27 (3.0%) | 45 (5.2%) |
| 65 to 74 Years | 96 (34.8%) | 4 (1.7%) |
| 75 Years and over | 36 (44.4%) | 62 (33.2%) |
Disability Class: Ambulatory Difficulty
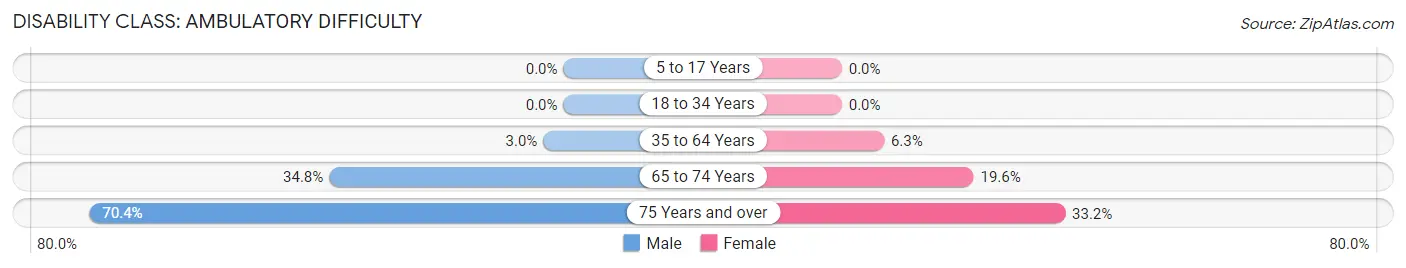
| Age Bracket | Male | Female |
| 5 to 17 Years | 0 (0.0%) | 0 (0.0%) |
| 18 to 34 Years | 0 (0.0%) | 0 (0.0%) |
| 35 to 64 Years | 27 (3.0%) | 54 (6.3%) |
| 65 to 74 Years | 96 (34.8%) | 45 (19.6%) |
| 75 Years and over | 57 (70.4%) | 62 (33.2%) |
Disability Class: Self-Care Difficulty
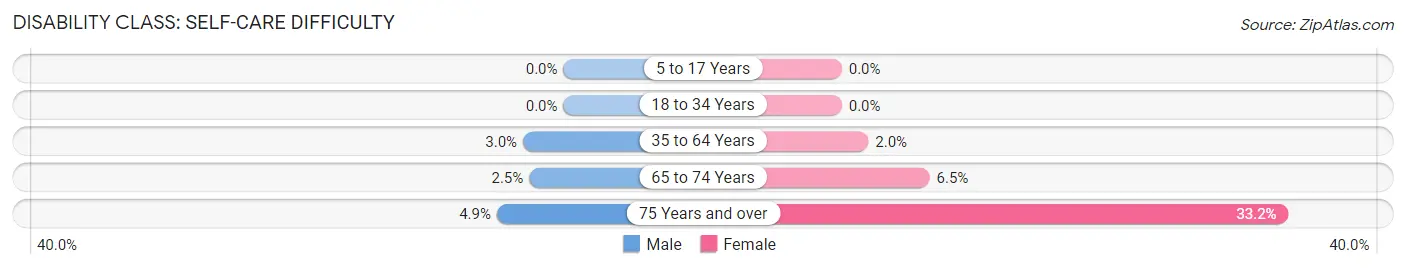
| Age Bracket | Male | Female |
| 5 to 17 Years | 0 (0.0%) | 0 (0.0%) |
| 18 to 34 Years | 0 (0.0%) | 0 (0.0%) |
| 35 to 64 Years | 27 (3.0%) | 17 (2.0%) |
| 65 to 74 Years | 7 (2.5%) | 15 (6.5%) |
| 75 Years and over | 4 (4.9%) | 62 (33.2%) |
Technology Access in Camp Swift
Computing Device Access in Camp Swift
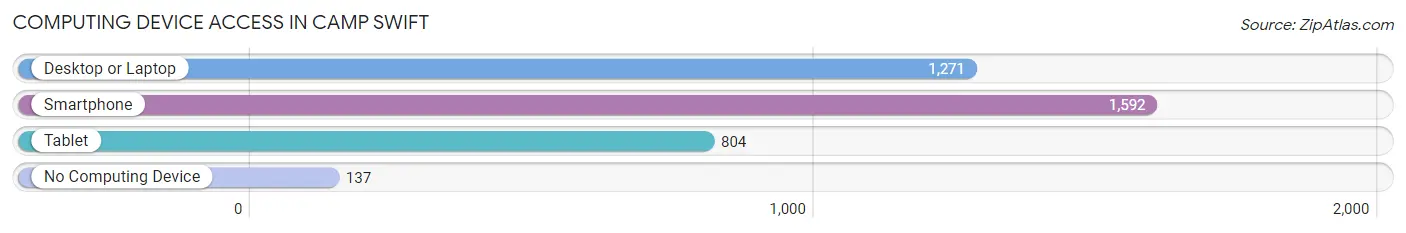
| Device Type | # Households | % Households |
| Desktop or Laptop | 1,271 | 69.0% |
| Smartphone | 1,592 | 86.5% |
| Tablet | 804 | 43.7% |
| No Computing Device | 137 | 7.4% |
| Total | 1,841 | 100.0% |
Internet Access in Camp Swift
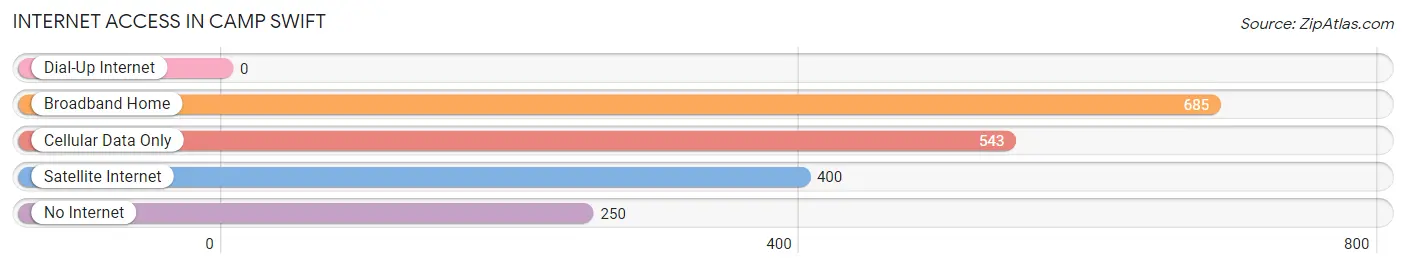
| Internet Type | # Households | % Households |
| Dial-Up Internet | 0 | 0.0% |
| Broadband Home | 685 | 37.2% |
| Cellular Data Only | 543 | 29.5% |
| Satellite Internet | 400 | 21.7% |
| No Internet | 250 | 13.6% |
| Total | 1,841 | 100.0% |
Camp Swift Summary
History
Camp Swift is a census-designated place (CDP) located in Bastrop County, Texas, United States. It is located approximately 25 miles east of Austin and is part of the Greater Austin metropolitan area. The area was originally part of the Stephen F. Austin land grant and was settled in the early 1800s. The area was known as “Swift’s Crossing” after the family that owned the land. In 1942, the United States Army purchased the land to build a training camp for the 36th Infantry Division. The camp was named Camp Swift in honor of Major General Eben Swift, who was the commander of the 36th Infantry Division during World War I.
The camp was used to train soldiers for World War II and the Korean War. After the Korean War, the camp was used as a training center for the Texas National Guard. In the late 1950s, the camp was closed and the land was sold to private owners. In the early 2000s, the land was purchased by developers and the area was rezoned for residential and commercial use.
Geography
Camp Swift is located in Bastrop County, Texas, approximately 25 miles east of Austin. The area is part of the Greater Austin metropolitan area. The terrain is mostly flat with some rolling hills. The area is mostly rural with some residential and commercial development. The climate is hot and humid in the summer and mild in the winter.
Economy
The economy of Camp Swift is largely based on the service industry. The area is home to several businesses, including restaurants, retail stores, and medical offices. The area is also home to several industrial parks, which provide employment opportunities for local residents. The area is also home to several educational institutions, including the University of Texas at Austin and Austin Community College.
Demographics
As of the 2010 census, the population of Camp Swift was 1,845. The population is mostly white (83.3%) with a small Hispanic population (14.2%). The median household income is $50,000 and the median home value is $150,000. The area is mostly rural with some residential and commercial development. The area is served by the Bastrop Independent School District.
Common Questions
What is Per Capita Income in Camp Swift?
Per Capita income in Camp Swift is $22,875.
What is the Median Family Income in Camp Swift?
Median Family Income in Camp Swift is $68,750.
What is the Median Household income in Camp Swift?
Median Household Income in Camp Swift is $61,586.
What is Income or Wage Gap in Camp Swift?
Income or Wage Gap in Camp Swift is 14.0%.
Women in Camp Swift earn 86.0 cents for every dollar earned by a man.
What is Inequality or Gini Index in Camp Swift?
Inequality or Gini Index in Camp Swift is 0.39.
What is the Total Population of Camp Swift?
Total Population of Camp Swift is 6,908.
What is the Total Male Population of Camp Swift?
Total Male Population of Camp Swift is 4,458.
What is the Total Female Population of Camp Swift?
Total Female Population of Camp Swift is 2,450.
What is the Ratio of Males per 100 Females in Camp Swift?
There are 181.96 Males per 100 Females in Camp Swift.
What is the Ratio of Females per 100 Males in Camp Swift?
There are 54.96 Females per 100 Males in Camp Swift.
What is the Median Population Age in Camp Swift?
Median Population Age in Camp Swift is 35.1 Years.
What is the Average Family Size in Camp Swift
Average Family Size in Camp Swift is 3.7 People.
What is the Average Household Size in Camp Swift
Average Household Size in Camp Swift is 3.0 People.
How Large is the Labor Force in Camp Swift?
There are 2,846 People in the Labor Forcein in Camp Swift.
What is the Percentage of People in the Labor Force in Camp Swift?
53.0% of People are in the Labor Force in Camp Swift.
What is the Unemployment Rate in Camp Swift?
Unemployment Rate in Camp Swift is 1.4%.