Helena West Helena, AR Map & Demographics
Helena West Helena Map
Helena West Helena Overview
$18,463
PER CAPITA INCOME
$42,719
AVG FAMILY INCOME
$31,118
AVG HOUSEHOLD INCOME
41.5%
WAGE / INCOME GAP [ % ]
58.5¢/ $1
WAGE / INCOME GAP [ $ ]
$14,196
FAMILY INCOME DEFICIT
0.46
INEQUALITY / GINI INDEX
9,470
TOTAL POPULATION
4,325
MALE POPULATION
5,145
FEMALE POPULATION
84.06
MALES / 100 FEMALES
118.96
FEMALES / 100 MALES
38.4
MEDIAN AGE
3.7
AVG FAMILY SIZE
2.6
AVG HOUSEHOLD SIZE
3,626
LABOR FORCE [ PEOPLE ]
51.3%
PERCENT IN LABOR FORCE
16.4%
UNEMPLOYMENT RATE
Income in Helena West Helena
Income Overview in Helena West Helena
Per Capita Income in Helena West Helena is $18,463, while median incomes of families and households are $42,719 and $31,118 respectively.
| Characteristic | Number | Measure |
| Per Capita Income | 9,470 | $18,463 |
| Median Family Income | 1,877 | $42,719 |
| Mean Family Income | 1,877 | $52,757 |
| Median Household Income | 3,595 | $31,118 |
| Mean Household Income | 3,595 | $43,280 |
| Income Deficit | 1,877 | $14,196 |
| Wage / Income Gap (%) | 9,470 | 41.45% |
| Wage / Income Gap ($) | 9,470 | 58.55¢ per $1 |
| Gini / Inequality Index | 9,470 | 0.46 |
Earnings by Sex in Helena West Helena
Average Earnings in Helena West Helena are $30,335, $38,063 for men and $22,285 for women, a difference of 41.4%.

| Sex | Number | Average Earnings |
| Male | 1,557 (42.9%) | $38,063 |
| Female | 2,071 (57.1%) | $22,285 |
| Total | 3,628 (100.0%) | $30,335 |
Earnings by Sex by Income Bracket in Helena West Helena
The most common earnings brackets in Helena West Helena are $35,000 to $39,999 for men (292 | 18.8%) and $55,000 to $64,999 for women (338 | 16.3%).

| Income | Male | Female |
| $2,499 or less | 68 (4.4%) | 176 (8.5%) |
| $2,500 to $4,999 | 156 (10.0%) | 126 (6.1%) |
| $5,000 to $7,499 | 25 (1.6%) | 113 (5.5%) |
| $7,500 to $9,999 | 45 (2.9%) | 30 (1.5%) |
| $10,000 to $12,499 | 20 (1.3%) | 139 (6.7%) |
| $12,500 to $14,999 | 92 (5.9%) | 91 (4.4%) |
| $15,000 to $17,499 | 20 (1.3%) | 202 (9.8%) |
| $17,500 to $19,999 | 17 (1.1%) | 68 (3.3%) |
| $20,000 to $22,499 | 27 (1.7%) | 99 (4.8%) |
| $22,500 to $24,999 | 40 (2.6%) | 87 (4.2%) |
| $25,000 to $29,999 | 53 (3.4%) | 107 (5.2%) |
| $30,000 to $34,999 | 56 (3.6%) | 103 (5.0%) |
| $35,000 to $39,999 | 292 (18.8%) | 80 (3.9%) |
| $40,000 to $44,999 | 65 (4.2%) | 36 (1.7%) |
| $45,000 to $49,999 | 118 (7.6%) | 146 (7.0%) |
| $50,000 to $54,999 | 90 (5.8%) | 28 (1.3%) |
| $55,000 to $64,999 | 128 (8.2%) | 338 (16.3%) |
| $65,000 to $74,999 | 75 (4.8%) | 66 (3.2%) |
| $75,000 to $99,999 | 144 (9.2%) | 36 (1.7%) |
| $100,000+ | 26 (1.7%) | 0 (0.0%) |
| Total | 1,557 (100.0%) | 2,071 (100.0%) |
Earnings by Sex by Educational Attainment in Helena West Helena
Average earnings in Helena West Helena are $39,044 for men and $23,966 for women, a difference of 38.6%. Men with an educational attainment of graduate degree enjoy the highest average annual earnings of $74,750, while those with less than high school education earn the least with $28,000. Women with an educational attainment of graduate degree earn the most with the average annual earnings of $46,473, while those with high school diploma education have the smallest earnings of $20,442.

| Educational Attainment | Male Income | Female Income |
| Less than High School | $28,000 | $0 |
| High School Diploma | $38,455 | $20,442 |
| College or Associate's Degree | $39,944 | $23,174 |
| Bachelor's Degree | $67,955 | $46,320 |
| Graduate Degree | $74,750 | $46,473 |
| Total | $39,044 | $23,966 |
Family Income in Helena West Helena
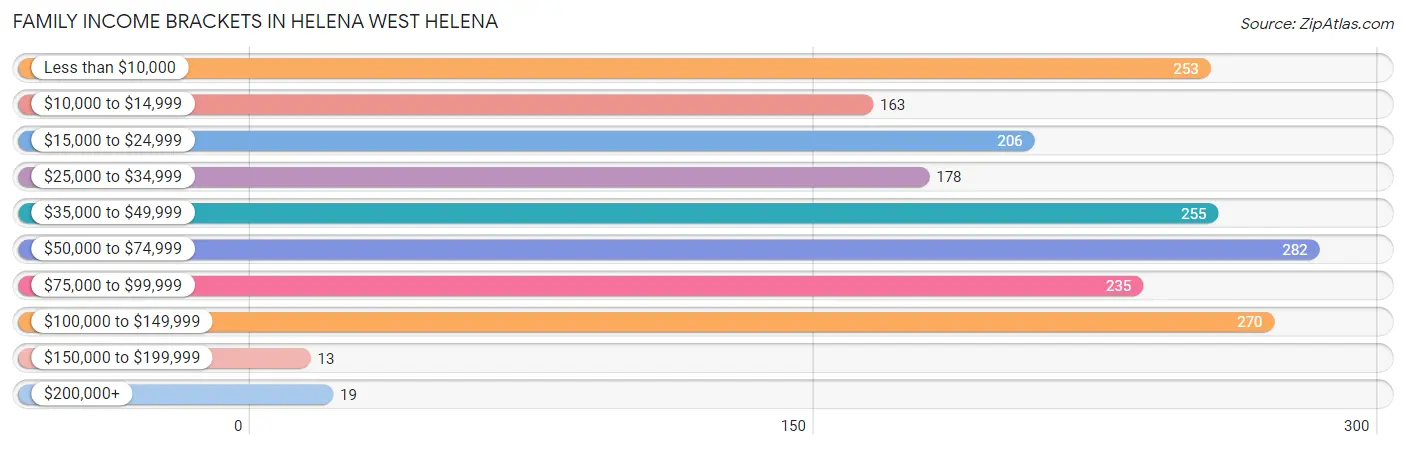
Family Income Brackets in Helena West Helena
According to the Helena West Helena family income data, there are 282 families falling into the $50,000 to $74,999 income range, which is the most common income bracket and makes up 15.0% of all families. Conversely, the $150,000 to $199,999 income bracket is the least frequent group with only 13 families (0.7%) belonging to this category.
| Income Bracket | # Families | % Families |
| Less than $10,000 | 253 | 13.5% |
| $10,000 to $14,999 | 163 | 8.7% |
| $15,000 to $24,999 | 206 | 11.0% |
| $25,000 to $34,999 | 178 | 9.5% |
| $35,000 to $49,999 | 255 | 13.6% |
| $50,000 to $74,999 | 282 | 15.0% |
| $75,000 to $99,999 | 235 | 12.5% |
| $100,000 to $149,999 | 270 | 14.4% |
| $150,000 to $199,999 | 13 | 0.7% |
| $200,000+ | 19 | 1.0% |
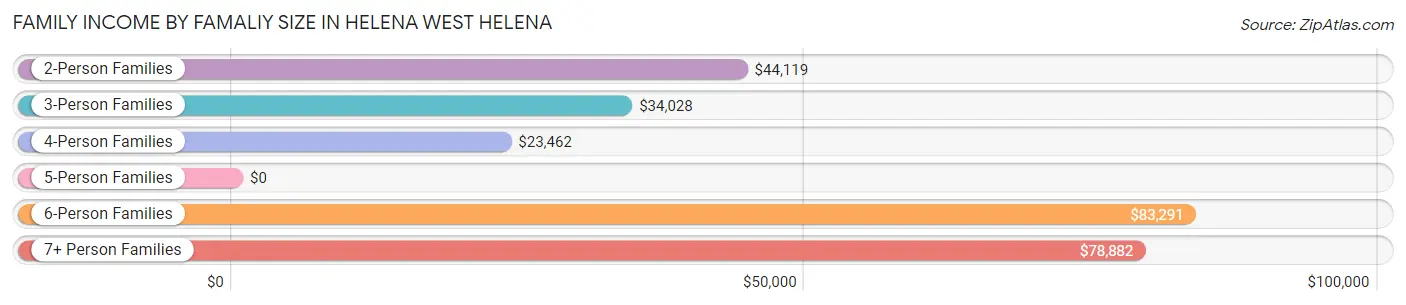
Family Income by Famaliy Size in Helena West Helena
6-person families (83 | 4.4%) account for the highest median family income in Helena West Helena with $83,291 per family, while 2-person families (942 | 50.2%) have the highest median income of $22,060 per family member.
| Income Bracket | # Families | Median Income |
| 2-Person Families | 942 (50.2%) | $44,119 |
| 3-Person Families | 351 (18.7%) | $34,028 |
| 4-Person Families | 404 (21.5%) | $23,462 |
| 5-Person Families | 58 (3.1%) | $0 |
| 6-Person Families | 83 (4.4%) | $83,291 |
| 7+ Person Families | 39 (2.1%) | $78,882 |
| Total | 1,877 (100.0%) | $42,719 |
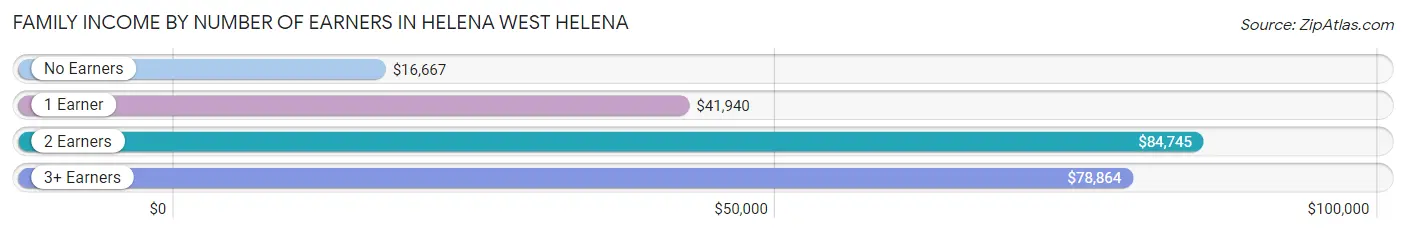
Family Income by Number of Earners in Helena West Helena
The median family income in Helena West Helena is $42,719, with families comprising 2 earners (570) having the highest median family income of $84,745, while families with no earners (648) have the lowest median family income of $16,667, accounting for 30.4% and 34.5% of families, respectively.
| Number of Earners | # Families | Median Income |
| No Earners | 648 (34.5%) | $16,667 |
| 1 Earner | 611 (32.6%) | $41,940 |
| 2 Earners | 570 (30.4%) | $84,745 |
| 3+ Earners | 48 (2.6%) | $78,864 |
| Total | 1,877 (100.0%) | $42,719 |
Household Income in Helena West Helena
Household Income Brackets in Helena West Helena
With 705 households falling in the category, the $15,000 to $24,999 income range is the most frequent in Helena West Helena, accounting for 19.6% of all households. In contrast, only 14 households (0.4%) fall into the $150,000 to $199,999 income bracket, making it the least populous group.

| Income Bracket | # Households | % Households |
| Less than $10,000 | 352 | 9.8% |
| $10,000 to $14,999 | 514 | 14.3% |
| $15,000 to $24,999 | 705 | 19.6% |
| $25,000 to $34,999 | 342 | 9.5% |
| $35,000 to $49,999 | 536 | 14.9% |
| $50,000 to $74,999 | 500 | 13.9% |
| $75,000 to $99,999 | 291 | 8.1% |
| $100,000 to $149,999 | 327 | 9.1% |
| $150,000 to $199,999 | 14 | 0.4% |
| $200,000+ | 18 | 0.5% |
Household Income by Householder Age in Helena West Helena
The median household income in Helena West Helena is $31,118, with the highest median household income of $61,089 found in the 15 to 24 years age bracket for the primary householder. A total of 57 households (1.6%) fall into this category. Meanwhile, the 25 to 44 years age bracket for the primary householder has the lowest median household income of $27,857, with 1,120 households (31.1%) in this group.

| Income Bracket | # Households | Median Income |
| 15 to 24 Years | 57 (1.6%) | $61,089 |
| 25 to 44 Years | 1,120 (31.1%) | $27,857 |
| 45 to 64 Years | 1,354 (37.7%) | $30,969 |
| 65+ Years | 1,064 (29.6%) | $32,768 |
| Total | 3,595 (100.0%) | $31,118 |
Poverty in Helena West Helena
Income Below Poverty by Sex and Age in Helena West Helena
With 38.0% poverty level for males and 30.6% for females among the residents of Helena West Helena, 5 year old males and 6 to 11 year old females are the most vulnerable to poverty, with 35 males (100.0%) and 191 females (59.5%) in their respective age groups living below the poverty level.

| Age Bracket | Male | Female |
| Under 5 Years | 359 (96.0%) | 73 (37.1%) |
| 5 Years | 35 (100.0%) | 17 (36.2%) |
| 6 to 11 Years | 385 (56.6%) | 191 (59.5%) |
| 12 to 14 Years | 28 (14.2%) | 200 (48.2%) |
| 15 Years | 15 (31.9%) | 0 (0.0%) |
| 16 and 17 Years | 32 (28.6%) | 44 (31.9%) |
| 18 to 24 Years | 150 (40.6%) | 85 (24.0%) |
| 25 to 34 Years | 78 (21.0%) | 374 (58.8%) |
| 35 to 44 Years | 159 (31.6%) | 157 (26.2%) |
| 45 to 54 Years | 162 (40.5%) | 143 (26.2%) |
| 55 to 64 Years | 108 (19.5%) | 174 (24.4%) |
| 65 to 74 Years | 75 (21.1%) | 72 (11.9%) |
| 75 Years and over | 18 (8.0%) | 36 (7.8%) |
| Total | 1,604 (38.0%) | 1,566 (30.6%) |
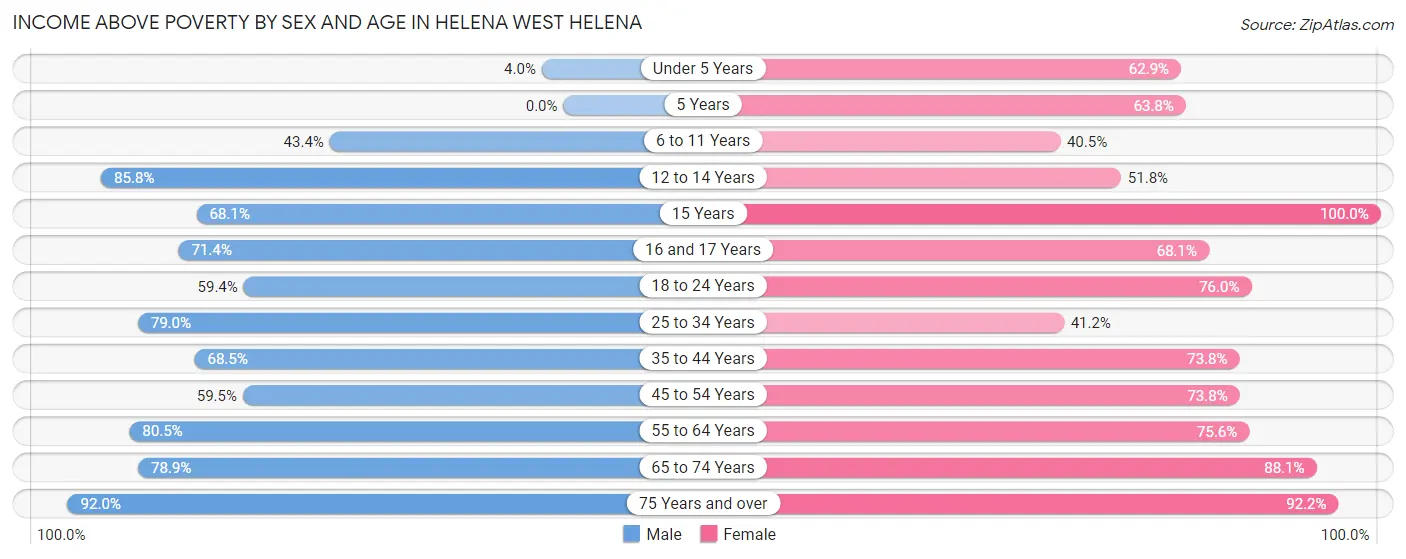
Income Above Poverty by Sex and Age in Helena West Helena
According to the poverty statistics in Helena West Helena, males aged 75 years and over and females aged 15 years are the age groups that are most secure financially, with 92.0% of males and 100.0% of females in these age groups living above the poverty line.
| Age Bracket | Male | Female |
| Under 5 Years | 15 (4.0%) | 124 (62.9%) |
| 5 Years | 0 (0.0%) | 30 (63.8%) |
| 6 to 11 Years | 295 (43.4%) | 130 (40.5%) |
| 12 to 14 Years | 169 (85.8%) | 215 (51.8%) |
| 15 Years | 32 (68.1%) | 88 (100.0%) |
| 16 and 17 Years | 80 (71.4%) | 94 (68.1%) |
| 18 to 24 Years | 219 (59.4%) | 269 (76.0%) |
| 25 to 34 Years | 293 (79.0%) | 262 (41.2%) |
| 35 to 44 Years | 345 (68.4%) | 442 (73.8%) |
| 45 to 54 Years | 238 (59.5%) | 403 (73.8%) |
| 55 to 64 Years | 447 (80.5%) | 539 (75.6%) |
| 65 to 74 Years | 281 (78.9%) | 532 (88.1%) |
| 75 Years and over | 207 (92.0%) | 423 (92.2%) |
| Total | 2,621 (62.0%) | 3,551 (69.4%) |
Income Below Poverty Among Married-Couple Families in Helena West Helena
The poverty statistics for married-couple families in Helena West Helena show that 2.8% or 24 of the total 861 families live below the poverty line. Families with 3 or 4 children have the highest poverty rate of 20.0%, comprising of 8 families. On the other hand, families with 5 or more children have the lowest poverty rate of 0.0%, which includes 0 families.

| Children | Above Poverty | Below Poverty |
| No Children | 636 (98.9%) | 7 (1.1%) |
| 1 or 2 Children | 151 (94.4%) | 9 (5.6%) |
| 3 or 4 Children | 32 (80.0%) | 8 (20.0%) |
| 5 or more Children | 18 (100.0%) | 0 (0.0%) |
| Total | 837 (97.2%) | 24 (2.8%) |
Income Below Poverty Among Single-Parent Households in Helena West Helena
According to the poverty data in Helena West Helena, 36.7% or 33 single-father households and 58.1% or 538 single-mother households are living below the poverty line. Among single-father households, those with 1 or 2 children have the highest poverty rate, with 3 households (100.0%) experiencing poverty. Likewise, among single-mother households, those with 3 or 4 children have the highest poverty rate, with 253 households (82.1%) falling below the poverty line.

| Children | Single Father | Single Mother |
| No Children | 30 (34.5%) | 119 (42.2%) |
| 1 or 2 Children | 3 (100.0%) | 166 (52.5%) |
| 3 or 4 Children | 0 (0.0%) | 253 (82.1%) |
| 5 or more Children | 0 (0.0%) | 0 (0.0%) |
| Total | 33 (36.7%) | 538 (58.1%) |
Income Below Poverty Among Married-Couple vs Single-Parent Households in Helena West Helena
The poverty data for Helena West Helena shows that 24 of the married-couple family households (2.8%) and 571 of the single-parent households (56.2%) are living below the poverty level. Within the married-couple family households, those with 3 or 4 children have the highest poverty rate, with 8 households (20.0%) falling below the poverty line. Among the single-parent households, those with 3 or 4 children have the highest poverty rate, with 253 household (82.1%) living below poverty.

| Children | Married-Couple Families | Single-Parent Households |
| No Children | 7 (1.1%) | 149 (40.4%) |
| 1 or 2 Children | 9 (5.6%) | 169 (53.0%) |
| 3 or 4 Children | 8 (20.0%) | 253 (82.1%) |
| 5 or more Children | 0 (0.0%) | 0 (0.0%) |
| Total | 24 (2.8%) | 571 (56.2%) |
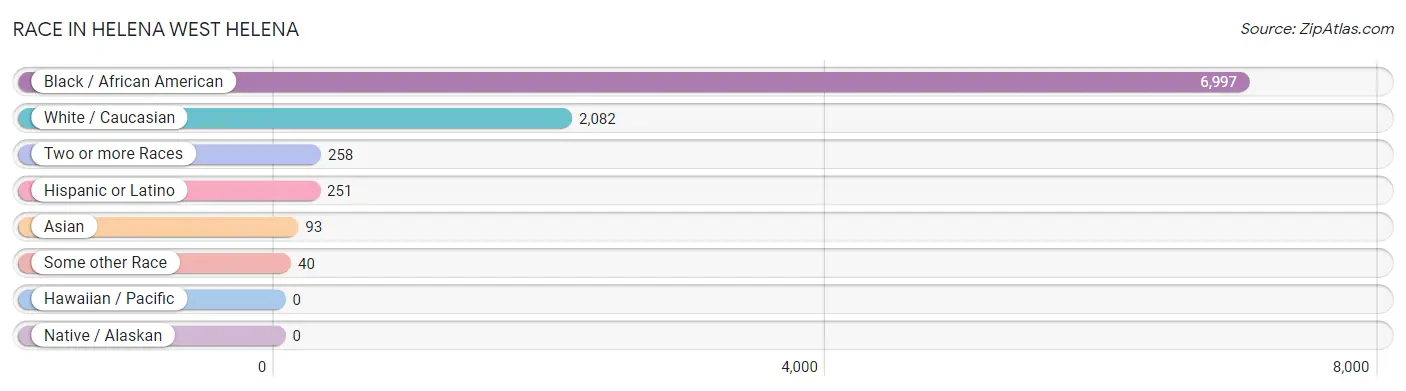
Race in Helena West Helena
The most populous races in Helena West Helena are Black / African American (6,997 | 73.9%), White / Caucasian (2,082 | 22.0%), and Two or more Races (258 | 2.7%).
| Race | # Population | % Population |
| Asian | 93 | 1.0% |
| Black / African American | 6,997 | 73.9% |
| Hawaiian / Pacific | 0 | 0.0% |
| Hispanic or Latino | 251 | 2.6% |
| Native / Alaskan | 0 | 0.0% |
| White / Caucasian | 2,082 | 22.0% |
| Two or more Races | 258 | 2.7% |
| Some other Race | 40 | 0.4% |
| Total | 9,470 | 100.0% |
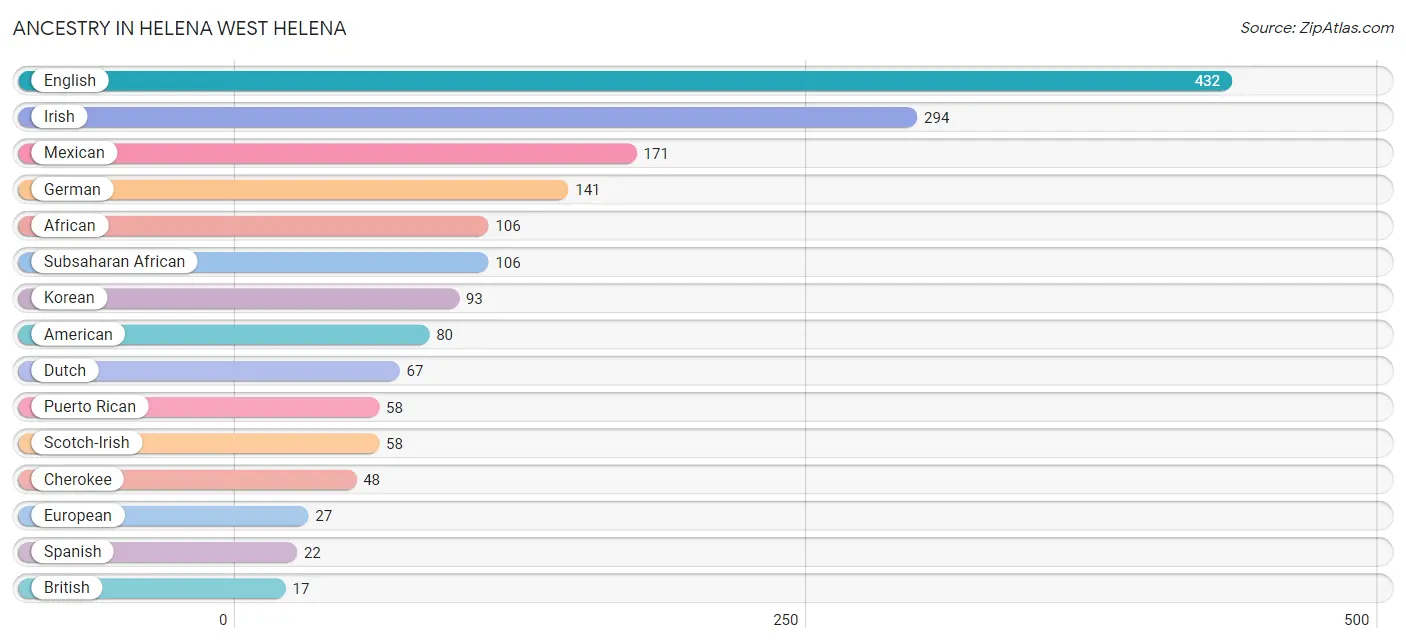
Ancestry in Helena West Helena
The most populous ancestries reported in Helena West Helena are English (432 | 4.6%), Irish (294 | 3.1%), Mexican (171 | 1.8%), German (141 | 1.5%), and African (106 | 1.1%), together accounting for 12.1% of all Helena West Helena residents.
| Ancestry | # Population | % Population |
| African | 106 | 1.1% |
| American | 80 | 0.8% |
| Brazilian | 10 | 0.1% |
| British | 17 | 0.2% |
| Cherokee | 48 | 0.5% |
| Danish | 9 | 0.1% |
| Dutch | 67 | 0.7% |
| English | 432 | 4.6% |
| European | 27 | 0.3% |
| French | 13 | 0.1% |
| German | 141 | 1.5% |
| Irish | 294 | 3.1% |
| Italian | 7 | 0.1% |
| Korean | 93 | 1.0% |
| Mexican | 171 | 1.8% |
| Northern European | 3 | 0.0% |
| Norwegian | 9 | 0.1% |
| Polish | 16 | 0.2% |
| Puerto Rican | 58 | 0.6% |
| Scandinavian | 9 | 0.1% |
| Scotch-Irish | 58 | 0.6% |
| Spanish | 22 | 0.2% |
| Subsaharan African | 106 | 1.1% | View All 23 Rows |
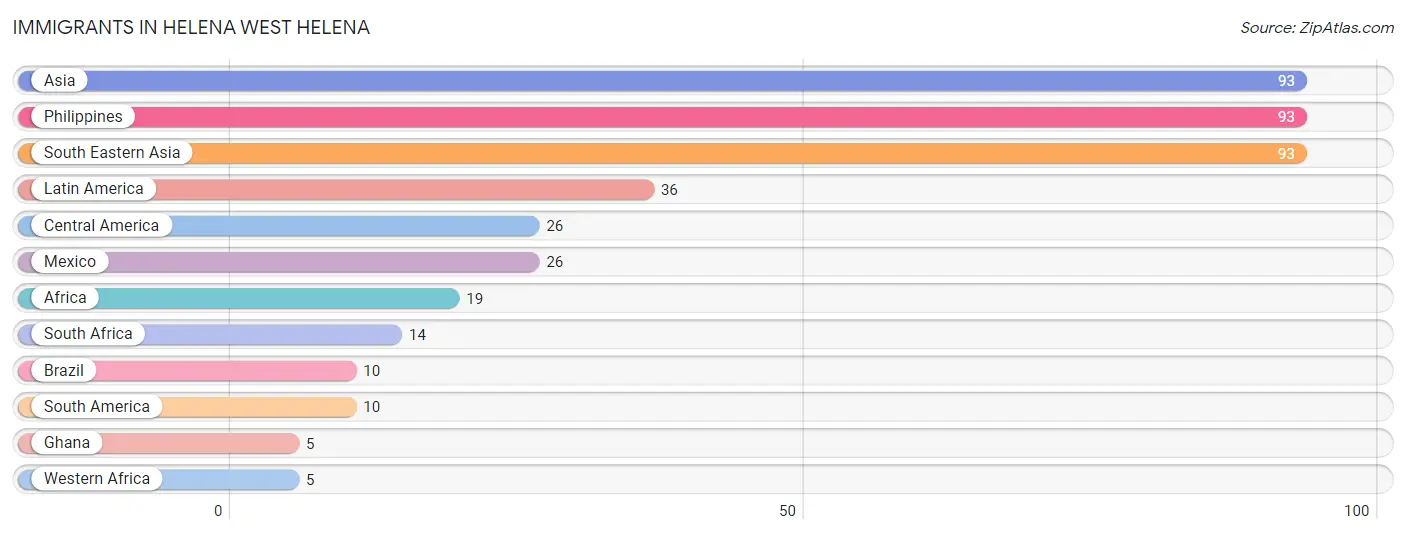
Immigrants in Helena West Helena
The most numerous immigrant groups reported in Helena West Helena came from Asia (93 | 1.0%), Philippines (93 | 1.0%), South Eastern Asia (93 | 1.0%), Latin America (36 | 0.4%), and Central America (26 | 0.3%), together accounting for 3.6% of all Helena West Helena residents.
| Immigration Origin | # Population | % Population |
| Africa | 19 | 0.2% |
| Asia | 93 | 1.0% |
| Brazil | 10 | 0.1% |
| Central America | 26 | 0.3% |
| Ghana | 5 | 0.1% |
| Latin America | 36 | 0.4% |
| Mexico | 26 | 0.3% |
| Philippines | 93 | 1.0% |
| South Africa | 14 | 0.2% |
| South America | 10 | 0.1% |
| South Eastern Asia | 93 | 1.0% |
| Western Africa | 5 | 0.1% | View All 12 Rows |
Sex and Age in Helena West Helena
Sex and Age in Helena West Helena
The most populous age groups in Helena West Helena are 10 to 14 Years (546 | 12.6%) for men and 10 to 14 Years (461 | 9.0%) for women.

| Age Bracket | Male | Female |
| Under 5 Years | 374 (8.6%) | 197 (3.8%) |
| 5 to 9 Years | 366 (8.5%) | 322 (6.3%) |
| 10 to 14 Years | 546 (12.6%) | 461 (9.0%) |
| 15 to 19 Years | 288 (6.7%) | 384 (7.5%) |
| 20 to 24 Years | 240 (5.6%) | 196 (3.8%) |
| 25 to 29 Years | 266 (6.1%) | 342 (6.7%) |
| 30 to 34 Years | 120 (2.8%) | 294 (5.7%) |
| 35 to 39 Years | 240 (5.6%) | 324 (6.3%) |
| 40 to 44 Years | 286 (6.6%) | 275 (5.3%) |
| 45 to 49 Years | 197 (4.5%) | 254 (4.9%) |
| 50 to 54 Years | 211 (4.9%) | 292 (5.7%) |
| 55 to 59 Years | 285 (6.6%) | 350 (6.8%) |
| 60 to 64 Years | 270 (6.2%) | 363 (7.1%) |
| 65 to 69 Years | 173 (4.0%) | 318 (6.2%) |
| 70 to 74 Years | 201 (4.6%) | 290 (5.6%) |
| 75 to 79 Years | 128 (3.0%) | 145 (2.8%) |
| 80 to 84 Years | 89 (2.1%) | 160 (3.1%) |
| 85 Years and over | 45 (1.0%) | 178 (3.5%) |
| Total | 4,325 (100.0%) | 5,145 (100.0%) |
Families and Households in Helena West Helena
Median Family Size in Helena West Helena
The median family size in Helena West Helena is 3.73 persons per family, with single female/mother families (926 | 49.3%) accounting for the largest median family size of 4.32 persons per family. On the other hand, married-couple families (861 | 45.9%) represent the smallest median family size with 3.12 persons per family.
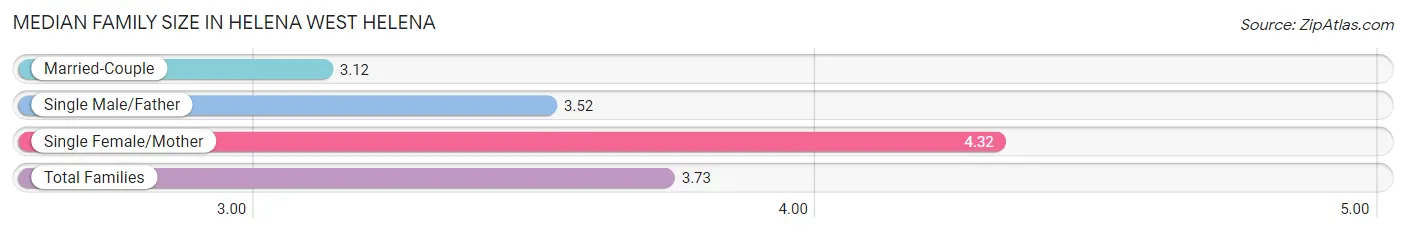
| Family Type | # Families | Family Size |
| Married-Couple | 861 (45.9%) | 3.12 |
| Single Male/Father | 90 (4.8%) | 3.52 |
| Single Female/Mother | 926 (49.3%) | 4.32 |
| Total Families | 1,877 (100.0%) | 3.73 |
Median Household Size in Helena West Helena
The median household size in Helena West Helena is 2.58 persons per household, with single female/mother households (926 | 25.8%) accounting for the largest median household size of 4.49 persons per household. non-family households (1,718 | 47.8%) represent the smallest median household size with 1.21 persons per household.
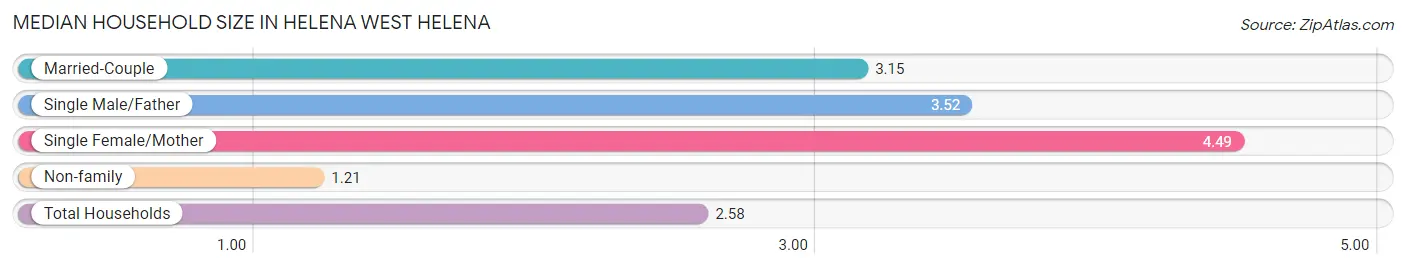
| Household Type | # Households | Household Size |
| Married-Couple | 861 (23.9%) | 3.15 |
| Single Male/Father | 90 (2.5%) | 3.52 |
| Single Female/Mother | 926 (25.8%) | 4.49 |
| Non-family | 1,718 (47.8%) | 1.21 |
| Total Households | 3,595 (100.0%) | 2.58 |
Household Size by Marriage Status in Helena West Helena
Out of a total of 3,595 households in Helena West Helena, 1,877 (52.2%) are family households, while 1,718 (47.8%) are nonfamily households. The most numerous type of family households are 2-person households, comprising 919, and the most common type of nonfamily households are 1-person households, comprising 1,563.
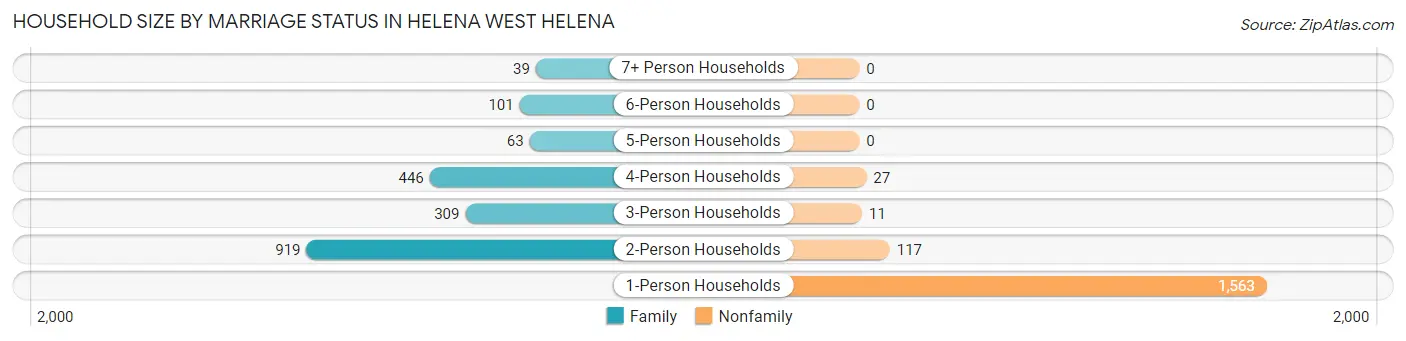
| Household Size | Family Households | Nonfamily Households |
| 1-Person Households | - | 1,563 (43.5%) |
| 2-Person Households | 919 (25.6%) | 117 (3.3%) |
| 3-Person Households | 309 (8.6%) | 11 (0.3%) |
| 4-Person Households | 446 (12.4%) | 27 (0.7%) |
| 5-Person Households | 63 (1.8%) | 0 (0.0%) |
| 6-Person Households | 101 (2.8%) | 0 (0.0%) |
| 7+ Person Households | 39 (1.1%) | 0 (0.0%) |
| Total | 1,877 (52.2%) | 1,718 (47.8%) |
Female Fertility in Helena West Helena
Fertility by Age in Helena West Helena
Average fertility rate in Helena West Helena is 76.0 births per 1,000 women. Women in the age bracket of 20 to 34 years have the highest fertility rate with 184.0 births per 1,000 women. Women in the age bracket of 20 to 34 years acount for 91.1% of all women with births.
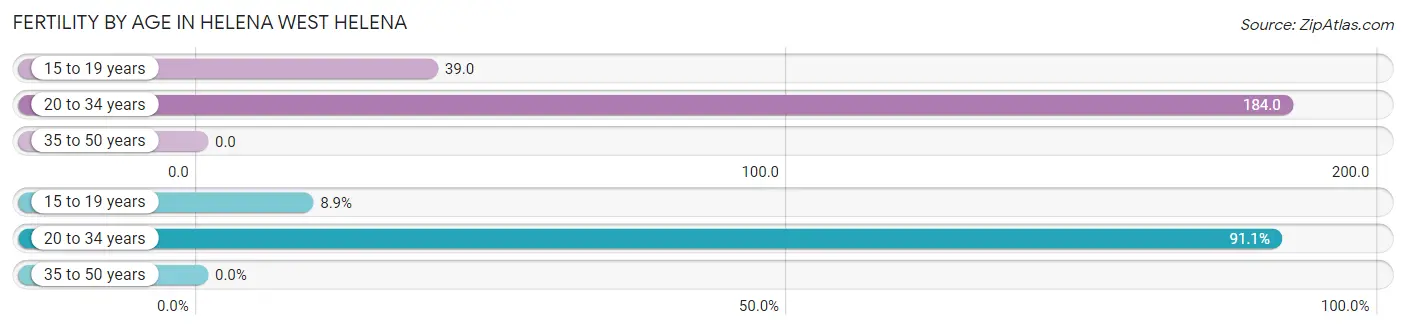
| Age Bracket | Women with Births | Births / 1,000 Women |
| 15 to 19 years | 15 (8.9%) | 39.0 |
| 20 to 34 years | 153 (91.1%) | 184.0 |
| 35 to 50 years | 0 (0.0%) | 0.0 |
| Total | 168 (100.0%) | 76.0 |
Fertility by Age by Marriage Status in Helena West Helena

| Age Bracket | Married | Unmarried |
| 15 to 19 years | 0 (0.0%) | 15 (100.0%) |
| 20 to 34 years | 0 (0.0%) | 153 (100.0%) |
| 35 to 50 years | 0 (0.0%) | 0 (0.0%) |
| Total | 0 (0.0%) | 168 (100.0%) |
Fertility by Education in Helena West Helena
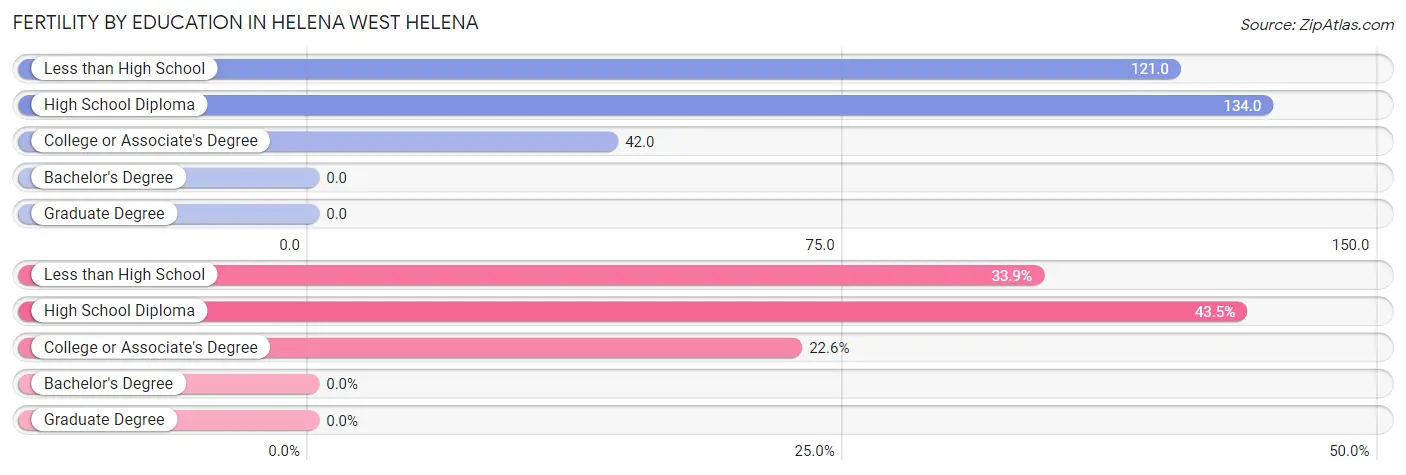
| Educational Attainment | Women with Births | Births / 1,000 Women |
| Less than High School | 57 (33.9%) | 121.0 |
| High School Diploma | 73 (43.4%) | 134.0 |
| College or Associate's Degree | 38 (22.6%) | 42.0 |
| Bachelor's Degree | 0 (0.0%) | 0.0 |
| Graduate Degree | 0 (0.0%) | 0.0 |
| Total | 168 (100.0%) | 76.0 |
Fertility by Education by Marriage Status in Helena West Helena
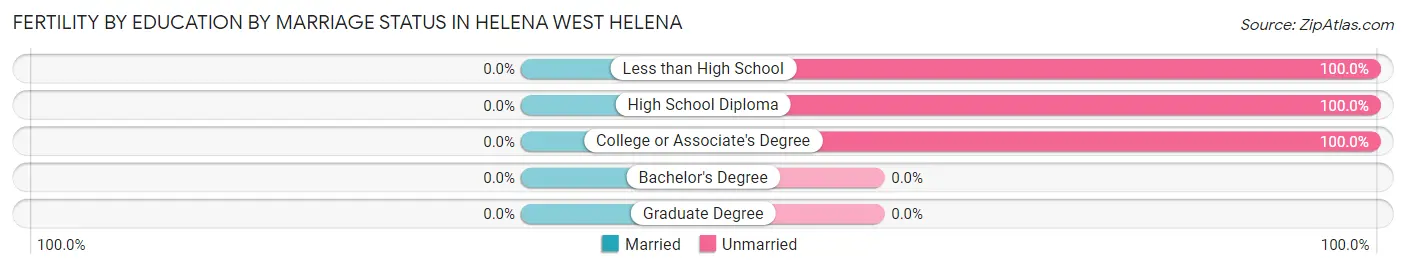
| Educational Attainment | Married | Unmarried |
| Less than High School | 0 (0.0%) | 57 (100.0%) |
| High School Diploma | 0 (0.0%) | 73 (100.0%) |
| College or Associate's Degree | 0 (0.0%) | 38 (100.0%) |
| Bachelor's Degree | 0 (0.0%) | 0 (0.0%) |
| Graduate Degree | 0 (0.0%) | 0 (0.0%) |
| Total | 0 (0.0%) | 168 (100.0%) |
Employment Characteristics in Helena West Helena
Employment by Class of Employer in Helena West Helena
Among the 2,936 employed individuals in Helena West Helena, private company employees (1,927 | 65.6%), local government employees (321 | 10.9%), and state government employees (314 | 10.7%) make up the most common classes of employment.
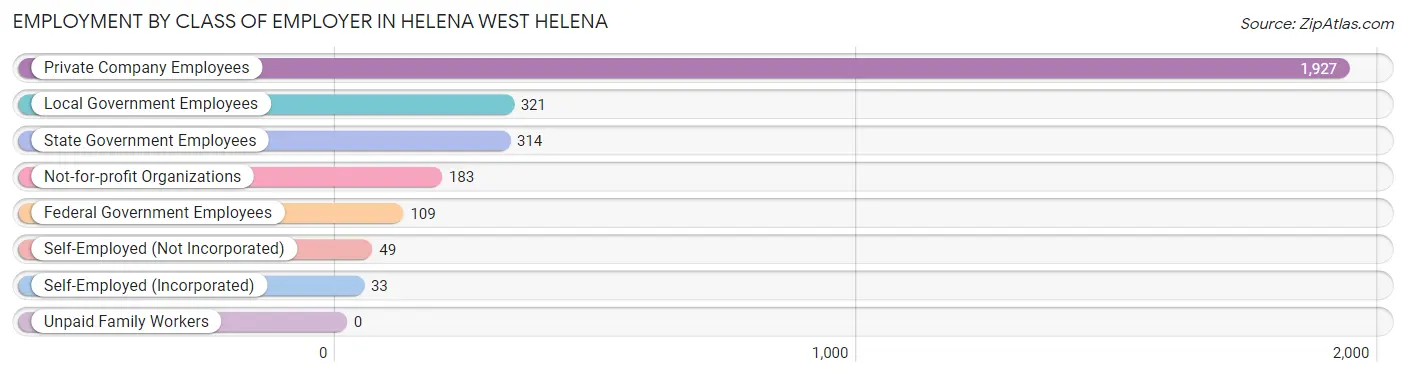
| Employer Class | # Employees | % Employees |
| Private Company Employees | 1,927 | 65.6% |
| Self-Employed (Incorporated) | 33 | 1.1% |
| Self-Employed (Not Incorporated) | 49 | 1.7% |
| Not-for-profit Organizations | 183 | 6.2% |
| Local Government Employees | 321 | 10.9% |
| State Government Employees | 314 | 10.7% |
| Federal Government Employees | 109 | 3.7% |
| Unpaid Family Workers | 0 | 0.0% |
| Total | 2,936 | 100.0% |
Employment Status by Age in Helena West Helena
According to the labor force statistics for Helena West Helena, out of the total population over 16 years of age (7,069), 51.3% or 3,626 individuals are in the labor force, with 16.4% or 595 of them unemployed. The age group with the highest labor force participation rate is 25 to 29 years, with 82.7% or 503 individuals in the labor force. Within the labor force, the 30 to 34 years age range has the highest percentage of unemployed individuals, with 42.1% or 114 of them being unemployed.
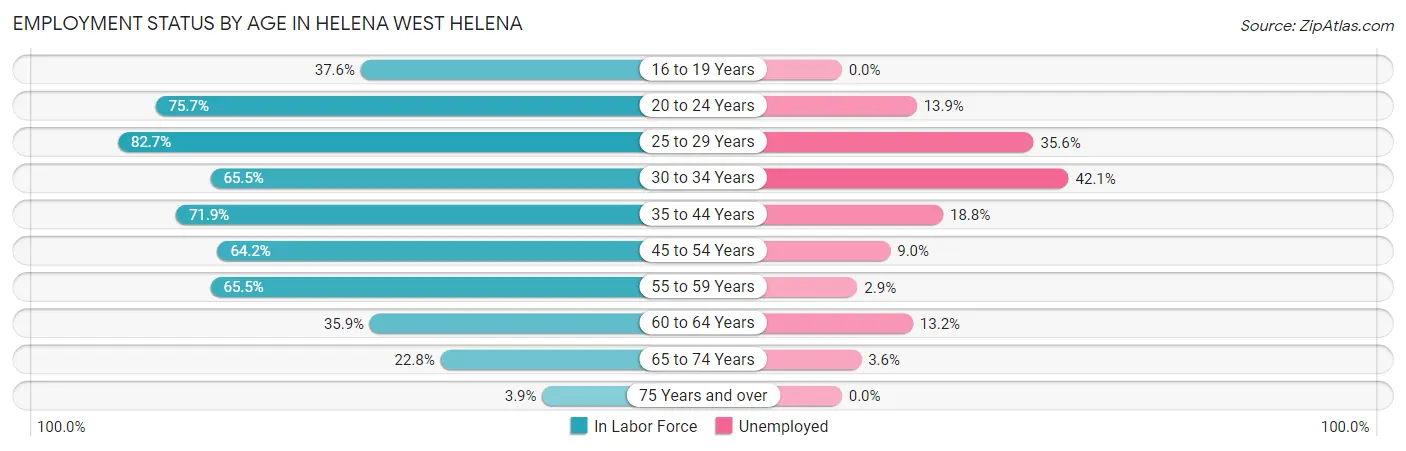
| Age Bracket | In Labor Force | Unemployed |
| 16 to 19 Years | 202 (37.6%) | 0 (0.0%) |
| 20 to 24 Years | 330 (75.7%) | 46 (13.9%) |
| 25 to 29 Years | 503 (82.7%) | 179 (35.6%) |
| 30 to 34 Years | 271 (65.5%) | 114 (42.1%) |
| 35 to 44 Years | 809 (71.9%) | 152 (18.8%) |
| 45 to 54 Years | 612 (64.2%) | 55 (9.0%) |
| 55 to 59 Years | 416 (65.5%) | 12 (2.9%) |
| 60 to 64 Years | 227 (35.9%) | 30 (13.2%) |
| 65 to 74 Years | 224 (22.8%) | 8 (3.6%) |
| 75 Years and over | 29 (3.9%) | 0 (0.0%) |
| Total | 3,626 (51.3%) | 595 (16.4%) |
Employment Status by Educational Attainment in Helena West Helena
According to labor force statistics for Helena West Helena, 65.0% of individuals (2,840) out of the total population between 25 and 64 years of age (4,369) are in the labor force, with 19.1% or 542 of them being unemployed. The group with the highest labor force participation rate are those with the educational attainment of college / associate degree, with 67.6% or 1,135 individuals in the labor force. Within the labor force, individuals with high school diploma education have the highest percentage of unemployment, with 35.1% or 324 of them being unemployed.

| Educational Attainment | In Labor Force | Unemployed |
| Less than High School | 347 (57.5%) | 57 (9.5%) |
| High School Diploma | 924 (65.6%) | 494 (35.1%) |
| College / Associate Degree | 1,135 (67.6%) | 205 (12.2%) |
| Bachelor's Degree or higher | 432 (63.6%) | 67 (9.9%) |
| Total | 2,840 (65.0%) | 834 (19.1%) |
Employment Occupations by Sex in Helena West Helena
Management, Business, Science and Arts Occupations
The most common Management, Business, Science and Arts occupations in Helena West Helena are Community & Social Service (437 | 14.6%), Education Instruction & Library (376 | 12.6%), Management (198 | 6.6%), Business & Financial (178 | 6.0%), and Computers, Engineering & Science (105 | 3.5%).

Management, Business, Science and Arts Occupations by Sex
Within the Management, Business, Science and Arts occupations in Helena West Helena, the most male-oriented occupations are Life, Physical & Social Science (100.0%), Management (54.5%), and Education, Arts & Media (41.7%), while the most female-oriented occupations are Legal Services & Support (100.0%), Arts, Media & Entertainment (100.0%), and Health Diagnosing & Treating (100.0%).

| Occupation | Male | Female |
| Management | 108 (54.5%) | 90 (45.5%) |
| Business & Financial | 10 (5.6%) | 168 (94.4%) |
| Computers, Engineering & Science | 40 (38.1%) | 65 (61.9%) |
| Computers & Mathematics | 0 (0.0%) | 0 (0.0%) |
| Architecture & Engineering | 13 (16.7%) | 65 (83.3%) |
| Life, Physical & Social Science | 27 (100.0%) | 0 (0.0%) |
| Community & Social Service | 151 (34.5%) | 286 (65.4%) |
| Education, Arts & Media | 20 (41.7%) | 28 (58.3%) |
| Legal Services & Support | 0 (0.0%) | 9 (100.0%) |
| Education Instruction & Library | 131 (34.8%) | 245 (65.2%) |
| Arts, Media & Entertainment | 0 (0.0%) | 4 (100.0%) |
| Health Diagnosing & Treating | 0 (0.0%) | 94 (100.0%) |
| Health Technologists | 0 (0.0%) | 18 (100.0%) |
| Total (Category) | 309 (30.5%) | 703 (69.5%) |
| Total (Overall) | 1,289 (43.1%) | 1,700 (56.9%) |
Services Occupations
The most common Services occupations in Helena West Helena are Food Preparation & Serving (171 | 5.7%), Healthcare Support (139 | 4.6%), Personal Care & Service (105 | 3.5%), Cleaning & Maintenance (72 | 2.4%), and Security & Protection (68 | 2.3%).

Services Occupations by Sex
Within the Services occupations in Helena West Helena, the most male-oriented occupations are Security & Protection (100.0%), Firefighting & Prevention (100.0%), and Law Enforcement (100.0%), while the most female-oriented occupations are Healthcare Support (100.0%), Cleaning & Maintenance (100.0%), and Food Preparation & Serving (86.6%).
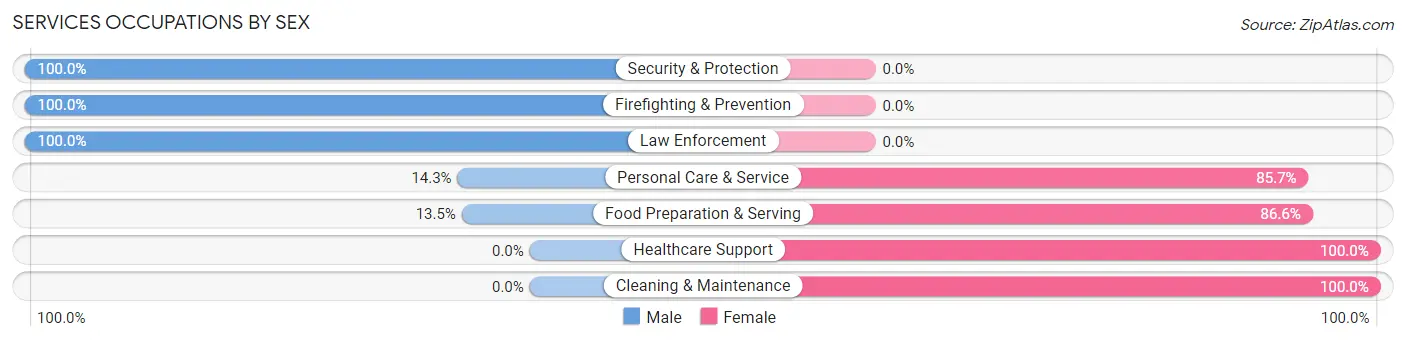
| Occupation | Male | Female |
| Healthcare Support | 0 (0.0%) | 139 (100.0%) |
| Security & Protection | 68 (100.0%) | 0 (0.0%) |
| Firefighting & Prevention | 35 (100.0%) | 0 (0.0%) |
| Law Enforcement | 33 (100.0%) | 0 (0.0%) |
| Food Preparation & Serving | 23 (13.5%) | 148 (86.6%) |
| Cleaning & Maintenance | 0 (0.0%) | 72 (100.0%) |
| Personal Care & Service | 15 (14.3%) | 90 (85.7%) |
| Total (Category) | 106 (19.1%) | 449 (80.9%) |
| Total (Overall) | 1,289 (43.1%) | 1,700 (56.9%) |
Sales and Office Occupations
The most common Sales and Office occupations in Helena West Helena are Sales & Related (382 | 12.8%), and Office & Administration (339 | 11.3%).
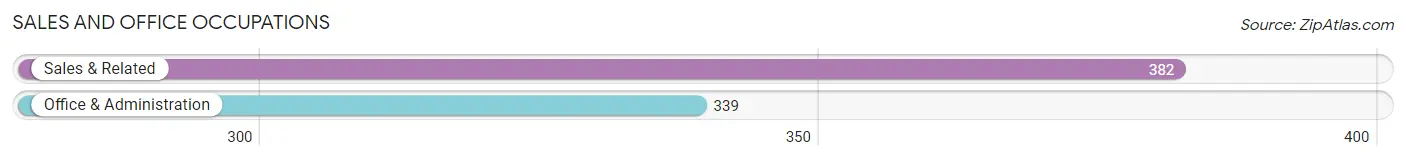
Sales and Office Occupations by Sex

| Occupation | Male | Female |
| Sales & Related | 193 (50.5%) | 189 (49.5%) |
| Office & Administration | 43 (12.7%) | 296 (87.3%) |
| Total (Category) | 236 (32.7%) | 485 (67.3%) |
| Total (Overall) | 1,289 (43.1%) | 1,700 (56.9%) |
Natural Resources, Construction and Maintenance Occupations
The most common Natural Resources, Construction and Maintenance occupations in Helena West Helena are Installation, Maintenance & Repair (81 | 2.7%), and Construction & Extraction (68 | 2.3%).
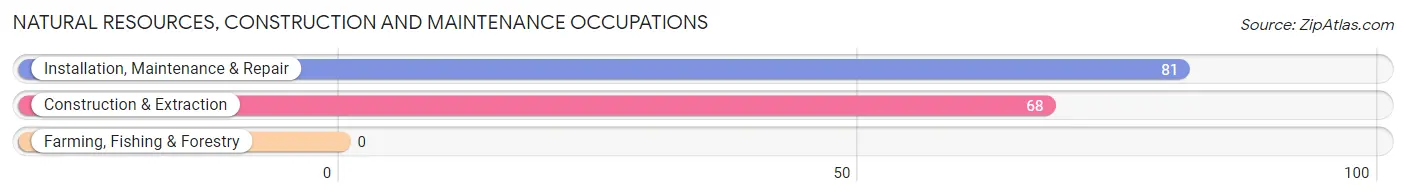
Natural Resources, Construction and Maintenance Occupations by Sex
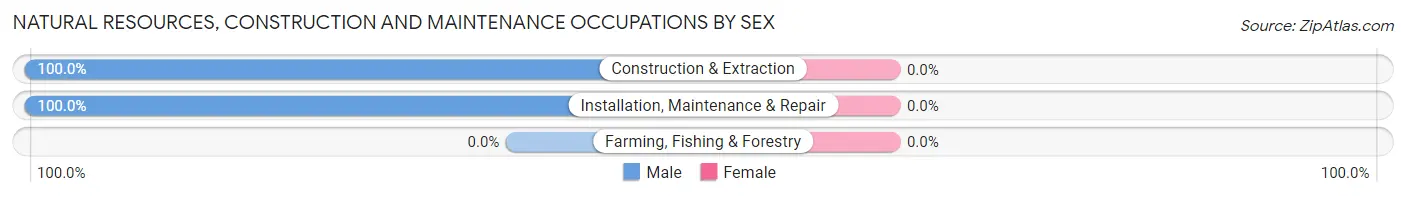
| Occupation | Male | Female |
| Farming, Fishing & Forestry | 0 (0.0%) | 0 (0.0%) |
| Construction & Extraction | 68 (100.0%) | 0 (0.0%) |
| Installation, Maintenance & Repair | 81 (100.0%) | 0 (0.0%) |
| Total (Category) | 149 (100.0%) | 0 (0.0%) |
| Total (Overall) | 1,289 (43.1%) | 1,700 (56.9%) |
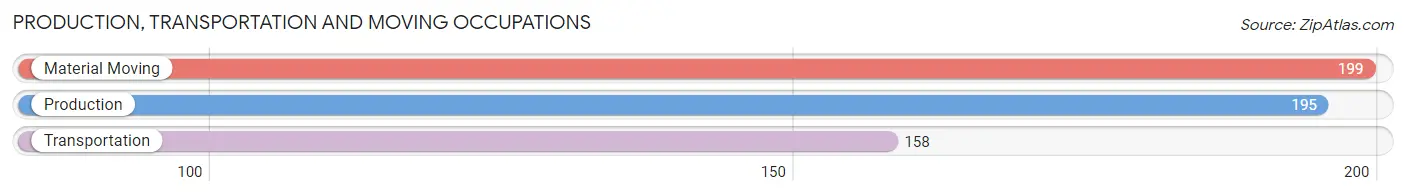
Production, Transportation and Moving Occupations
The most common Production, Transportation and Moving occupations in Helena West Helena are Material Moving (199 | 6.7%), Production (195 | 6.5%), and Transportation (158 | 5.3%).
Production, Transportation and Moving Occupations by Sex
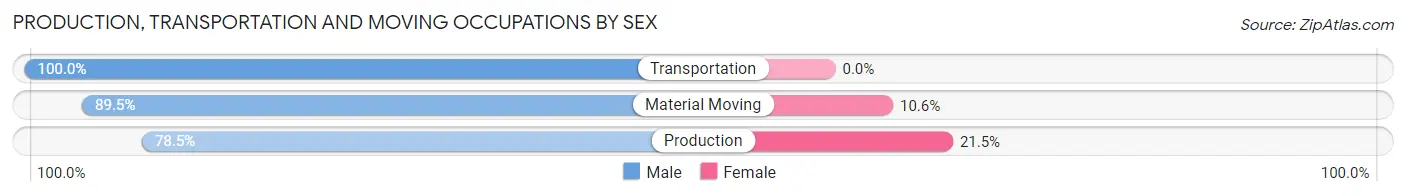
| Occupation | Male | Female |
| Production | 153 (78.5%) | 42 (21.5%) |
| Transportation | 158 (100.0%) | 0 (0.0%) |
| Material Moving | 178 (89.4%) | 21 (10.5%) |
| Total (Category) | 489 (88.6%) | 63 (11.4%) |
| Total (Overall) | 1,289 (43.1%) | 1,700 (56.9%) |
Employment Industries by Sex in Helena West Helena
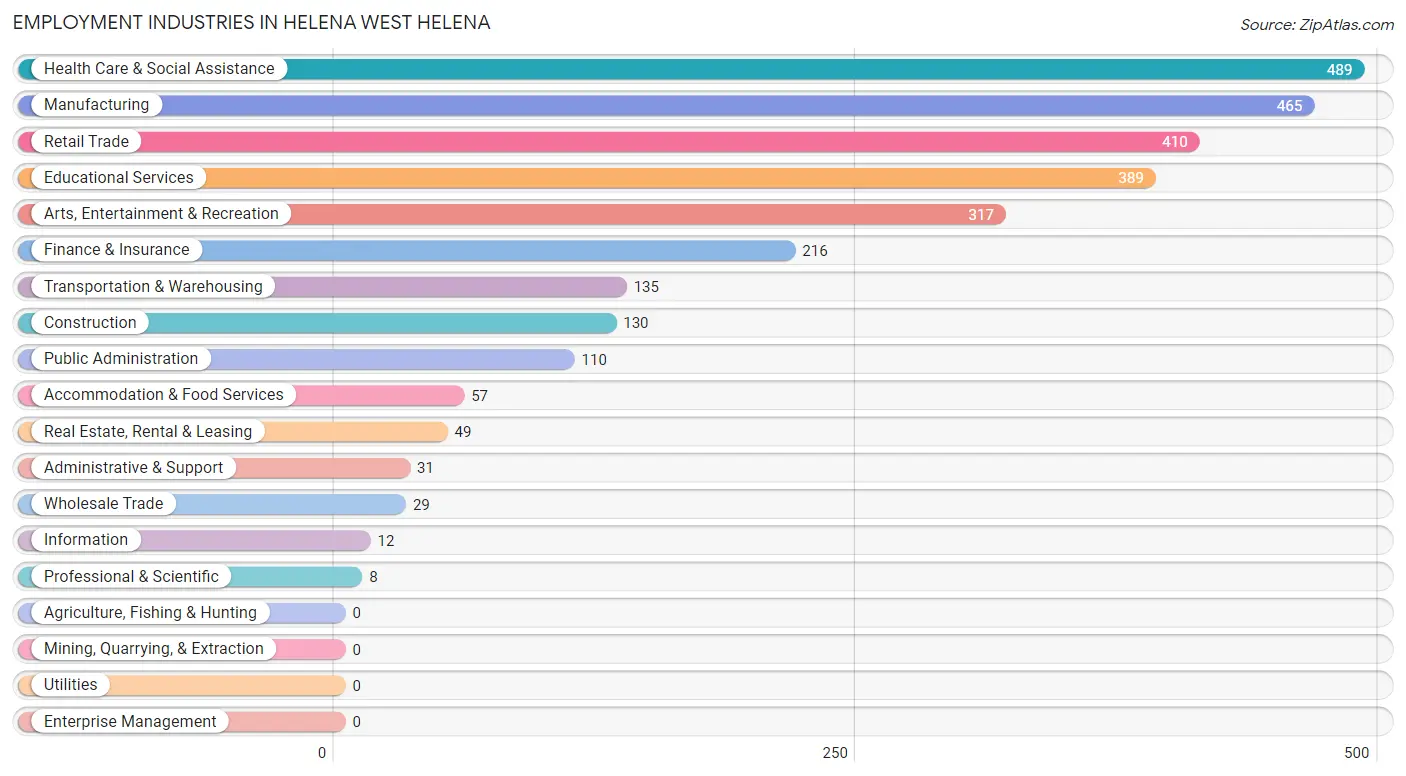
Employment Industries in Helena West Helena
The major employment industries in Helena West Helena include Health Care & Social Assistance (489 | 16.4%), Manufacturing (465 | 15.6%), Retail Trade (410 | 13.7%), Educational Services (389 | 13.0%), and Arts, Entertainment & Recreation (317 | 10.6%).
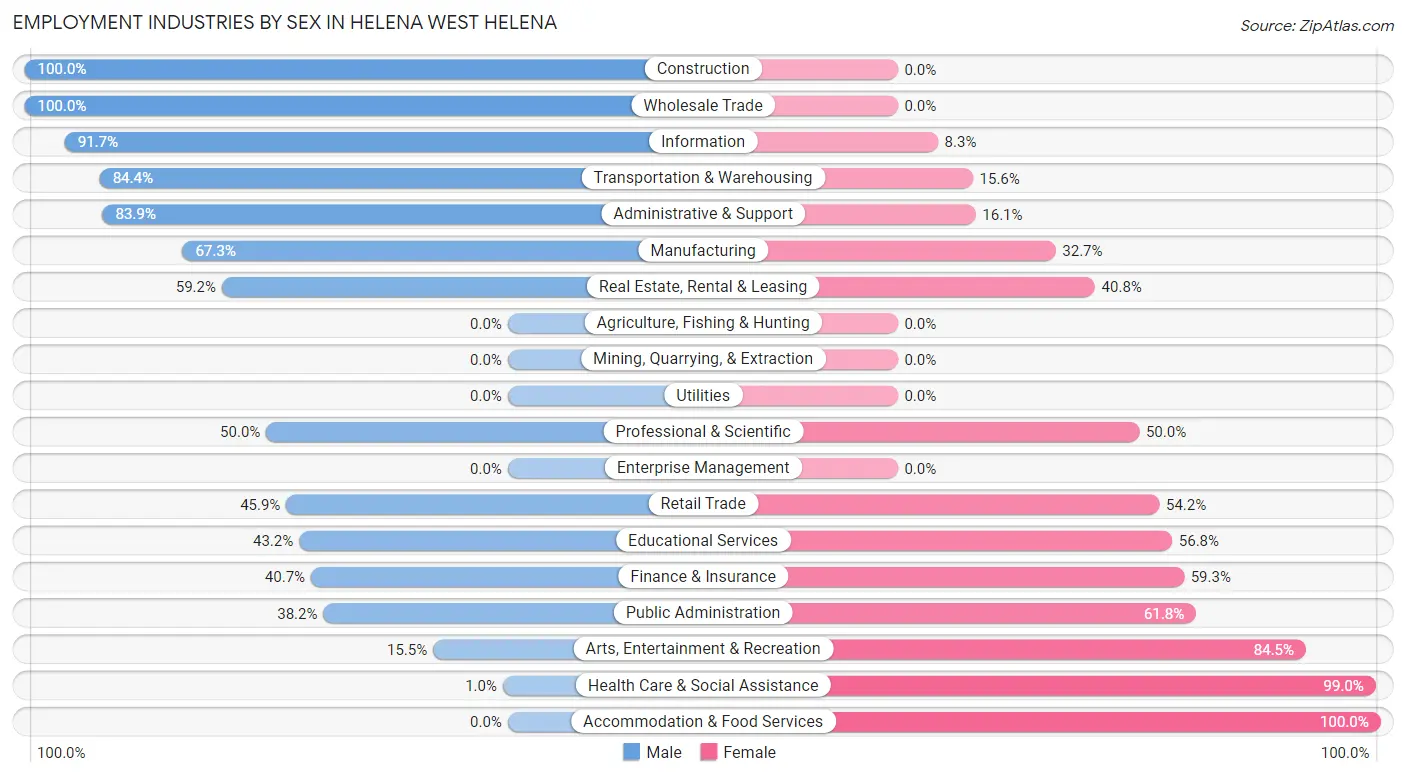
Employment Industries by Sex in Helena West Helena
The Helena West Helena industries that see more men than women are Construction (100.0%), Wholesale Trade (100.0%), and Information (91.7%), whereas the industries that tend to have a higher number of women are Accommodation & Food Services (100.0%), Health Care & Social Assistance (99.0%), and Arts, Entertainment & Recreation (84.5%).
| Industry | Male | Female |
| Agriculture, Fishing & Hunting | 0 (0.0%) | 0 (0.0%) |
| Mining, Quarrying, & Extraction | 0 (0.0%) | 0 (0.0%) |
| Construction | 130 (100.0%) | 0 (0.0%) |
| Manufacturing | 313 (67.3%) | 152 (32.7%) |
| Wholesale Trade | 29 (100.0%) | 0 (0.0%) |
| Retail Trade | 188 (45.9%) | 222 (54.1%) |
| Transportation & Warehousing | 114 (84.4%) | 21 (15.6%) |
| Utilities | 0 (0.0%) | 0 (0.0%) |
| Information | 11 (91.7%) | 1 (8.3%) |
| Finance & Insurance | 88 (40.7%) | 128 (59.3%) |
| Real Estate, Rental & Leasing | 29 (59.2%) | 20 (40.8%) |
| Professional & Scientific | 4 (50.0%) | 4 (50.0%) |
| Enterprise Management | 0 (0.0%) | 0 (0.0%) |
| Administrative & Support | 26 (83.9%) | 5 (16.1%) |
| Educational Services | 168 (43.2%) | 221 (56.8%) |
| Health Care & Social Assistance | 5 (1.0%) | 484 (99.0%) |
| Arts, Entertainment & Recreation | 49 (15.5%) | 268 (84.5%) |
| Accommodation & Food Services | 0 (0.0%) | 57 (100.0%) |
| Public Administration | 42 (38.2%) | 68 (61.8%) |
| Total | 1,289 (43.1%) | 1,700 (56.9%) |
Education in Helena West Helena
School Enrollment in Helena West Helena
The most common levels of schooling among the 2,698 students in Helena West Helena are middle school (816 | 30.2%), high school (717 | 26.6%), and elementary school (563 | 20.9%).
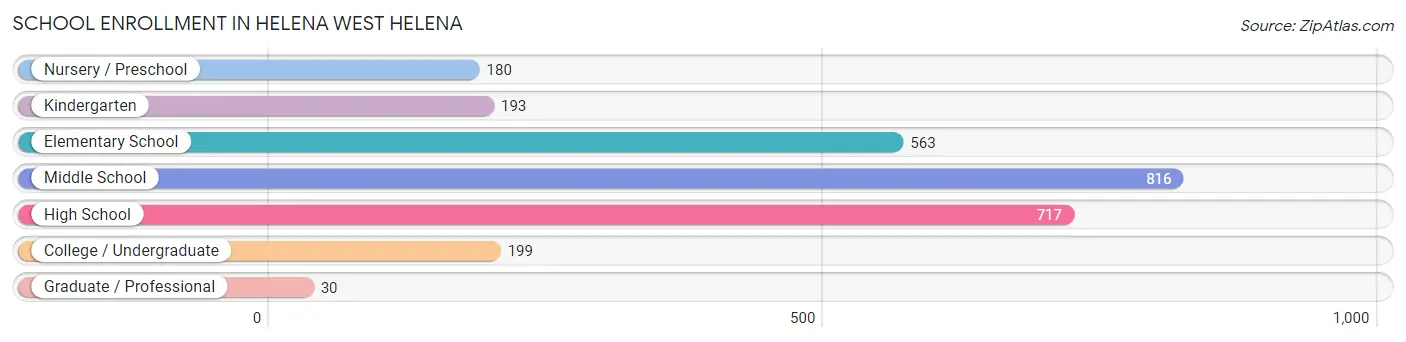
| School Level | # Students | % Students |
| Nursery / Preschool | 180 | 6.7% |
| Kindergarten | 193 | 7.1% |
| Elementary School | 563 | 20.9% |
| Middle School | 816 | 30.2% |
| High School | 717 | 26.6% |
| College / Undergraduate | 199 | 7.4% |
| Graduate / Professional | 30 | 1.1% |
| Total | 2,698 | 100.0% |
School Enrollment by Age by Funding Source in Helena West Helena
Out of a total of 2,698 students who are enrolled in schools in Helena West Helena, 40 (1.5%) attend a private institution, while the remaining 2,658 (98.5%) are enrolled in public schools. The age group of 25 to 34 year olds has the highest likelihood of being enrolled in private schools, with 8 (29.6% in the age bracket) enrolled. Conversely, the age group of 3 to 4 year olds has the lowest likelihood of being enrolled in a private school, with 145 (100.0% in the age bracket) attending a public institution.
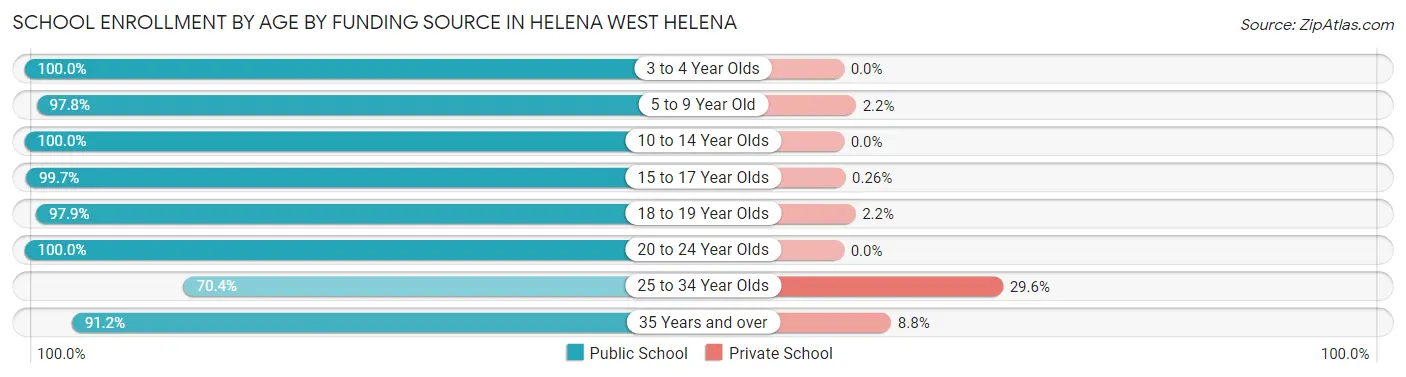
| Age Bracket | Public School | Private School |
| 3 to 4 Year Olds | 145 (100.0%) | 0 (0.0%) |
| 5 to 9 Year Old | 656 (97.8%) | 15 (2.2%) |
| 10 to 14 Year Olds | 1,007 (100.0%) | 0 (0.0%) |
| 15 to 17 Year Olds | 384 (99.7%) | 1 (0.3%) |
| 18 to 19 Year Olds | 228 (97.9%) | 5 (2.1%) |
| 20 to 24 Year Olds | 105 (100.0%) | 0 (0.0%) |
| 25 to 34 Year Olds | 19 (70.4%) | 8 (29.6%) |
| 35 Years and over | 114 (91.2%) | 11 (8.8%) |
| Total | 2,658 (98.5%) | 40 (1.5%) |
Educational Attainment by Field of Study in Helena West Helena
Education (301 | 33.7%), business (98 | 11.0%), physical & health sciences (95 | 10.6%), literature & languages (67 | 7.5%), and social sciences (64 | 7.2%) are the most common fields of study among 892 individuals in Helena West Helena who have obtained a bachelor's degree or higher.

| Field of Study | # Graduates | % Graduates |
| Computers & Mathematics | 41 | 4.6% |
| Bio, Nature & Agricultural | 56 | 6.3% |
| Physical & Health Sciences | 95 | 10.6% |
| Psychology | 3 | 0.3% |
| Social Sciences | 64 | 7.2% |
| Engineering | 10 | 1.1% |
| Multidisciplinary Studies | 9 | 1.0% |
| Science & Technology | 62 | 7.0% |
| Business | 98 | 11.0% |
| Education | 301 | 33.7% |
| Literature & Languages | 67 | 7.5% |
| Liberal Arts & History | 27 | 3.0% |
| Visual & Performing Arts | 0 | 0.0% |
| Communications | 32 | 3.6% |
| Arts & Humanities | 27 | 3.0% |
| Total | 892 | 100.0% |
Transportation & Commute in Helena West Helena
Vehicle Availability by Sex in Helena West Helena
The most prevalent vehicle ownership categories in Helena West Helena are males with 1 vehicle (548, accounting for 43.3%) and females with 1 vehicle (761, making up 32.8%).
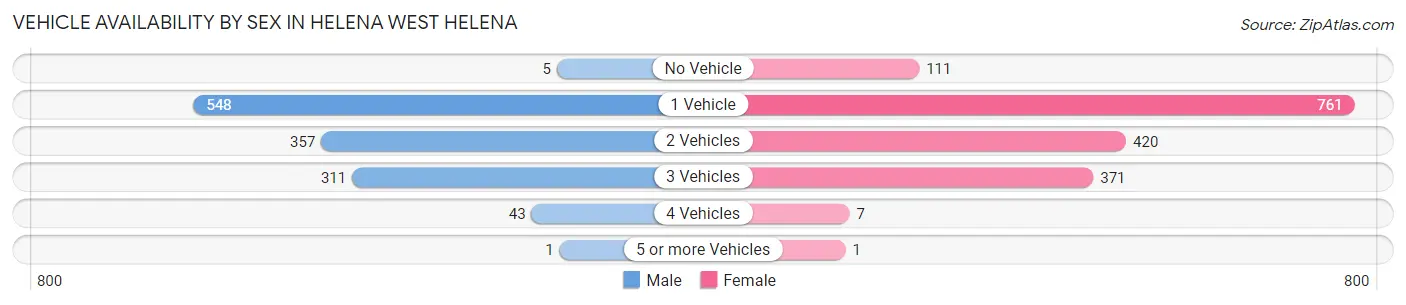
| Vehicles Available | Male | Female |
| No Vehicle | 5 (0.4%) | 111 (6.6%) |
| 1 Vehicle | 548 (43.3%) | 761 (45.5%) |
| 2 Vehicles | 357 (28.2%) | 420 (25.1%) |
| 3 Vehicles | 311 (24.6%) | 371 (22.2%) |
| 4 Vehicles | 43 (3.4%) | 7 (0.4%) |
| 5 or more Vehicles | 1 (0.1%) | 1 (0.1%) |
| Total | 1,265 (100.0%) | 1,671 (100.0%) |
Commute Time in Helena West Helena
The most frequently occuring commute durations in Helena West Helena are 10 to 14 minutes (746 commuters, 26.5%), 5 to 9 minutes (699 commuters, 24.8%), and 15 to 19 minutes (446 commuters, 15.8%).
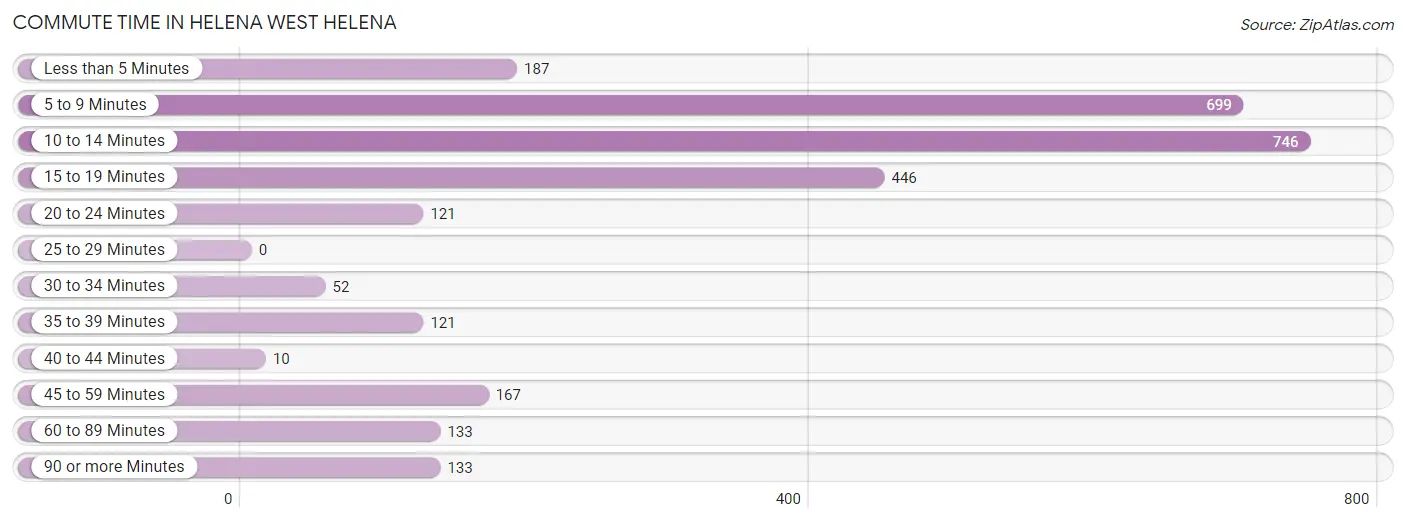
| Commute Time | # Commuters | % Commuters |
| Less than 5 Minutes | 187 | 6.6% |
| 5 to 9 Minutes | 699 | 24.8% |
| 10 to 14 Minutes | 746 | 26.5% |
| 15 to 19 Minutes | 446 | 15.8% |
| 20 to 24 Minutes | 121 | 4.3% |
| 25 to 29 Minutes | 0 | 0.0% |
| 30 to 34 Minutes | 52 | 1.8% |
| 35 to 39 Minutes | 121 | 4.3% |
| 40 to 44 Minutes | 10 | 0.4% |
| 45 to 59 Minutes | 167 | 5.9% |
| 60 to 89 Minutes | 133 | 4.7% |
| 90 or more Minutes | 133 | 4.7% |
Commute Time by Sex in Helena West Helena
The most common commute times in Helena West Helena are 10 to 14 minutes (347 commuters, 28.3%) for males and 5 to 9 minutes (399 commuters, 25.1%) for females.

| Commute Time | Male | Female |
| Less than 5 Minutes | 121 (9.9%) | 66 (4.2%) |
| 5 to 9 Minutes | 300 (24.5%) | 399 (25.1%) |
| 10 to 14 Minutes | 347 (28.3%) | 399 (25.1%) |
| 15 to 19 Minutes | 111 (9.0%) | 335 (21.1%) |
| 20 to 24 Minutes | 35 (2.9%) | 86 (5.4%) |
| 25 to 29 Minutes | 0 (0.0%) | 0 (0.0%) |
| 30 to 34 Minutes | 23 (1.9%) | 29 (1.8%) |
| 35 to 39 Minutes | 23 (1.9%) | 98 (6.2%) |
| 40 to 44 Minutes | 0 (0.0%) | 10 (0.6%) |
| 45 to 59 Minutes | 151 (12.3%) | 16 (1.0%) |
| 60 to 89 Minutes | 78 (6.4%) | 55 (3.5%) |
| 90 or more Minutes | 37 (3.0%) | 96 (6.0%) |
Time of Departure to Work by Sex in Helena West Helena
The most frequent times of departure to work in Helena West Helena are 7:00 AM to 7:29 AM (239, 19.5%) for males and 7:00 AM to 7:29 AM (321, 20.2%) for females.
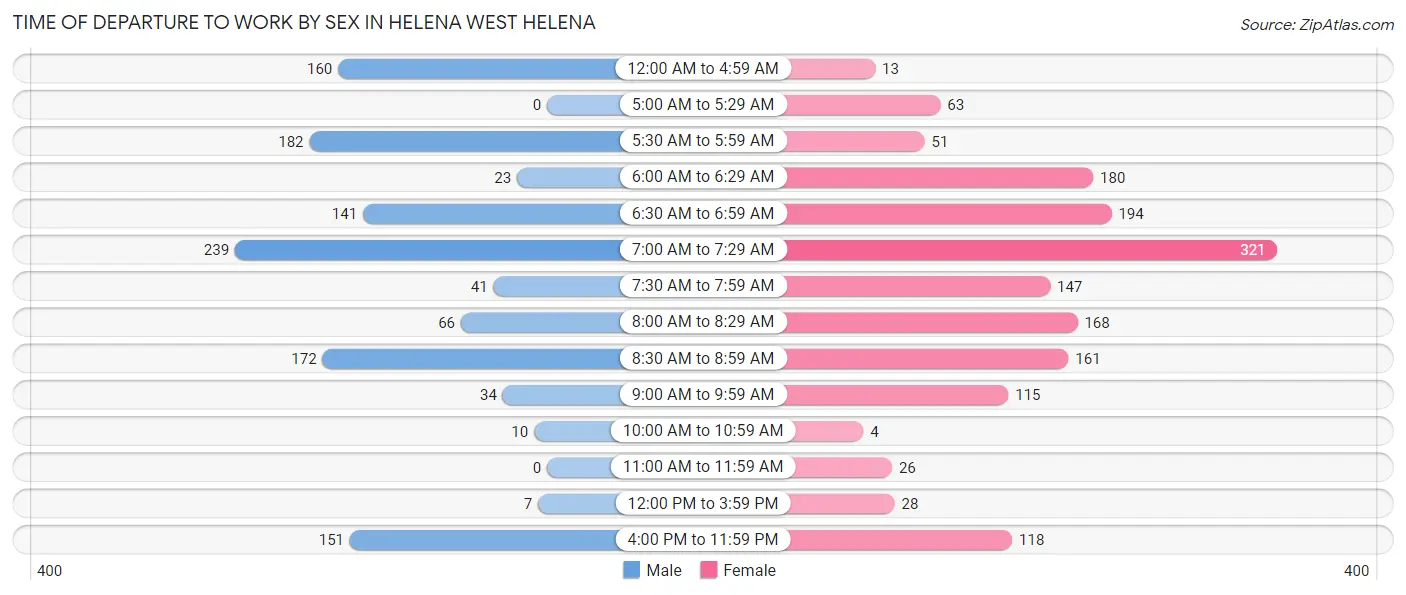
| Time of Departure | Male | Female |
| 12:00 AM to 4:59 AM | 160 (13.1%) | 13 (0.8%) |
| 5:00 AM to 5:29 AM | 0 (0.0%) | 63 (4.0%) |
| 5:30 AM to 5:59 AM | 182 (14.8%) | 51 (3.2%) |
| 6:00 AM to 6:29 AM | 23 (1.9%) | 180 (11.3%) |
| 6:30 AM to 6:59 AM | 141 (11.5%) | 194 (12.2%) |
| 7:00 AM to 7:29 AM | 239 (19.5%) | 321 (20.2%) |
| 7:30 AM to 7:59 AM | 41 (3.3%) | 147 (9.2%) |
| 8:00 AM to 8:29 AM | 66 (5.4%) | 168 (10.6%) |
| 8:30 AM to 8:59 AM | 172 (14.0%) | 161 (10.1%) |
| 9:00 AM to 9:59 AM | 34 (2.8%) | 115 (7.2%) |
| 10:00 AM to 10:59 AM | 10 (0.8%) | 4 (0.3%) |
| 11:00 AM to 11:59 AM | 0 (0.0%) | 26 (1.6%) |
| 12:00 PM to 3:59 PM | 7 (0.6%) | 28 (1.8%) |
| 4:00 PM to 11:59 PM | 151 (12.3%) | 118 (7.4%) |
| Total | 1,226 (100.0%) | 1,589 (100.0%) |
Housing Occupancy in Helena West Helena
Occupancy by Ownership in Helena West Helena
Of the total 3,595 dwellings in Helena West Helena, owner-occupied units account for 1,680 (46.7%), while renter-occupied units make up 1,915 (53.3%).
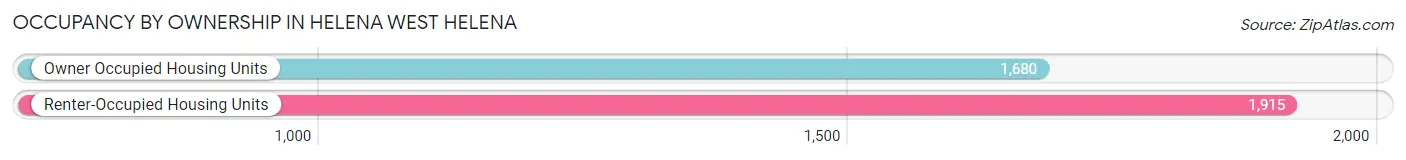
| Occupancy | # Housing Units | % Housing Units |
| Owner Occupied Housing Units | 1,680 | 46.7% |
| Renter-Occupied Housing Units | 1,915 | 53.3% |
| Total Occupied Housing Units | 3,595 | 100.0% |
Occupancy by Household Size in Helena West Helena
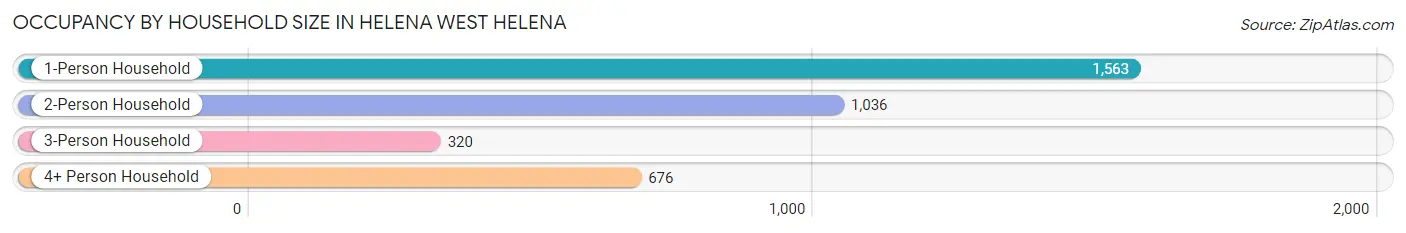
| Household Size | # Housing Units | % Housing Units |
| 1-Person Household | 1,563 | 43.5% |
| 2-Person Household | 1,036 | 28.8% |
| 3-Person Household | 320 | 8.9% |
| 4+ Person Household | 676 | 18.8% |
| Total Housing Units | 3,595 | 100.0% |
Occupancy by Ownership by Household Size in Helena West Helena

| Household Size | Owner-occupied | Renter-occupied |
| 1-Person Household | 634 (40.6%) | 929 (59.4%) |
| 2-Person Household | 704 (67.9%) | 332 (32.1%) |
| 3-Person Household | 143 (44.7%) | 177 (55.3%) |
| 4+ Person Household | 199 (29.4%) | 477 (70.6%) |
| Total Housing Units | 1,680 (46.7%) | 1,915 (53.3%) |
Occupancy by Educational Attainment in Helena West Helena
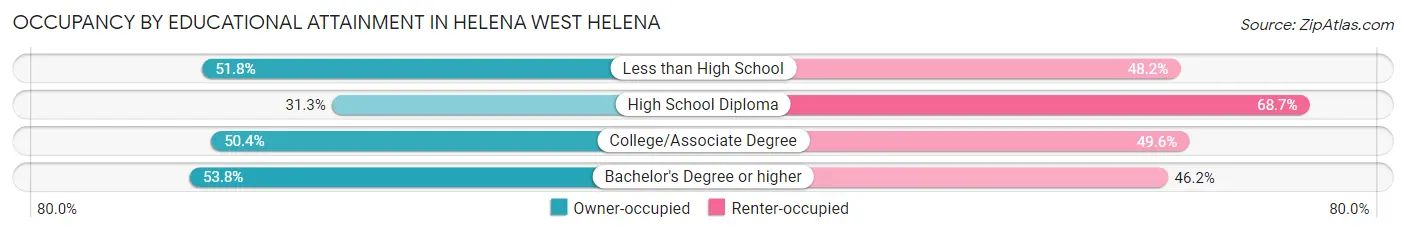
| Household Size | Owner-occupied | Renter-occupied |
| Less than High School | 342 (51.8%) | 318 (48.2%) |
| High School Diploma | 263 (31.3%) | 577 (68.7%) |
| College/Associate Degree | 768 (50.4%) | 756 (49.6%) |
| Bachelor's Degree or higher | 307 (53.8%) | 264 (46.2%) |
Occupancy by Age of Householder in Helena West Helena
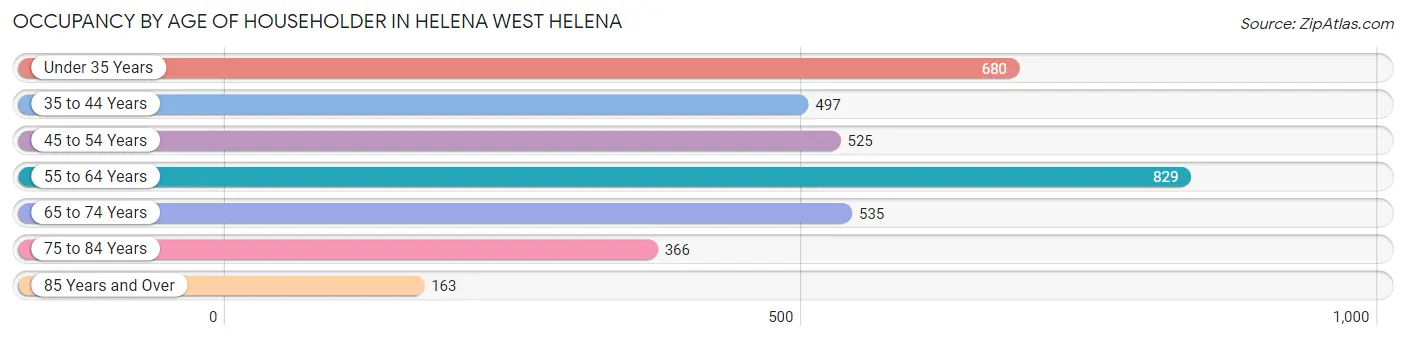
| Age Bracket | # Households | % Households |
| Under 35 Years | 680 | 18.9% |
| 35 to 44 Years | 497 | 13.8% |
| 45 to 54 Years | 525 | 14.6% |
| 55 to 64 Years | 829 | 23.1% |
| 65 to 74 Years | 535 | 14.9% |
| 75 to 84 Years | 366 | 10.2% |
| 85 Years and Over | 163 | 4.5% |
| Total | 3,595 | 100.0% |
Housing Finances in Helena West Helena
Median Income by Occupancy in Helena West Helena

| Occupancy Type | # Households | Median Income |
| Owner-Occupied | 1,680 (46.7%) | $44,858 |
| Renter-Occupied | 1,915 (53.3%) | $20,551 |
| Average | 3,595 (100.0%) | $31,118 |
Occupancy by Householder Income Bracket in Helena West Helena
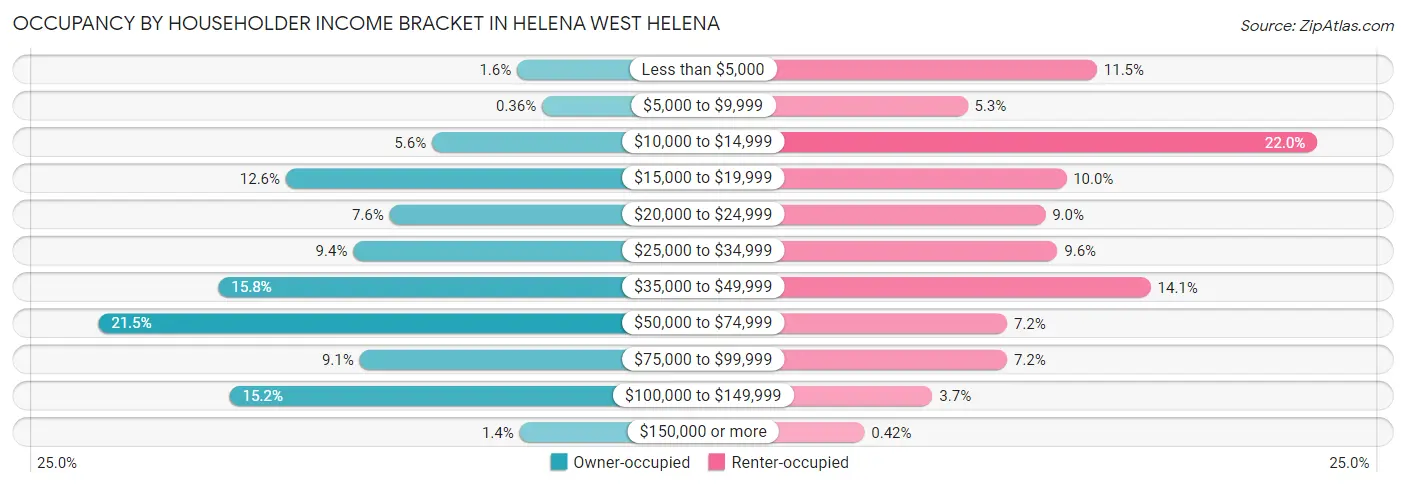
| Income Bracket | Owner-occupied | Renter-occupied |
| Less than $5,000 | 26 (1.5%) | 220 (11.5%) |
| $5,000 to $9,999 | 6 (0.4%) | 102 (5.3%) |
| $10,000 to $14,999 | 94 (5.6%) | 421 (22.0%) |
| $15,000 to $19,999 | 211 (12.6%) | 192 (10.0%) |
| $20,000 to $24,999 | 128 (7.6%) | 173 (9.0%) |
| $25,000 to $34,999 | 157 (9.3%) | 184 (9.6%) |
| $35,000 to $49,999 | 265 (15.8%) | 269 (14.1%) |
| $50,000 to $74,999 | 361 (21.5%) | 138 (7.2%) |
| $75,000 to $99,999 | 152 (9.0%) | 138 (7.2%) |
| $100,000 to $149,999 | 256 (15.2%) | 70 (3.7%) |
| $150,000 or more | 24 (1.4%) | 8 (0.4%) |
| Total | 1,680 (100.0%) | 1,915 (100.0%) |
Monthly Housing Cost Tiers in Helena West Helena

| Monthly Cost | Owner-occupied | Renter-occupied |
| Less than $300 | 370 (22.0%) | 99 (5.2%) |
| $300 to $499 | 504 (30.0%) | 392 (20.5%) |
| $500 to $799 | 343 (20.4%) | 538 (28.1%) |
| $800 to $999 | 59 (3.5%) | 344 (18.0%) |
| $1,000 to $1,499 | 311 (18.5%) | 434 (22.7%) |
| $1,500 to $1,999 | 83 (4.9%) | 33 (1.7%) |
| $2,000 to $2,499 | 0 (0.0%) | 0 (0.0%) |
| $2,500 to $2,999 | 10 (0.6%) | 0 (0.0%) |
| $3,000 or more | 0 (0.0%) | 0 (0.0%) |
| Total | 1,680 (100.0%) | 1,915 (100.0%) |
Physical Housing Characteristics in Helena West Helena
Housing Structures in Helena West Helena
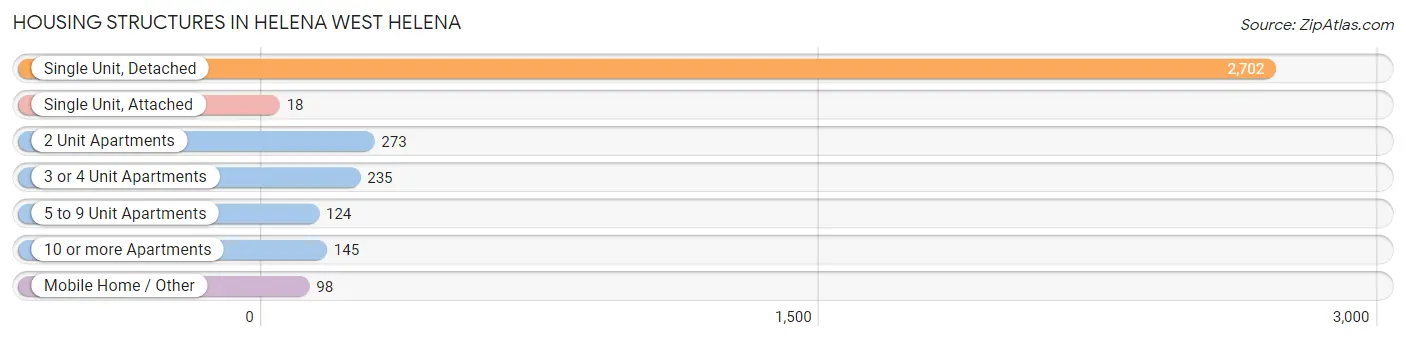
| Structure Type | # Housing Units | % Housing Units |
| Single Unit, Detached | 2,702 | 75.2% |
| Single Unit, Attached | 18 | 0.5% |
| 2 Unit Apartments | 273 | 7.6% |
| 3 or 4 Unit Apartments | 235 | 6.5% |
| 5 to 9 Unit Apartments | 124 | 3.5% |
| 10 or more Apartments | 145 | 4.0% |
| Mobile Home / Other | 98 | 2.7% |
| Total | 3,595 | 100.0% |
Housing Structures by Occupancy in Helena West Helena
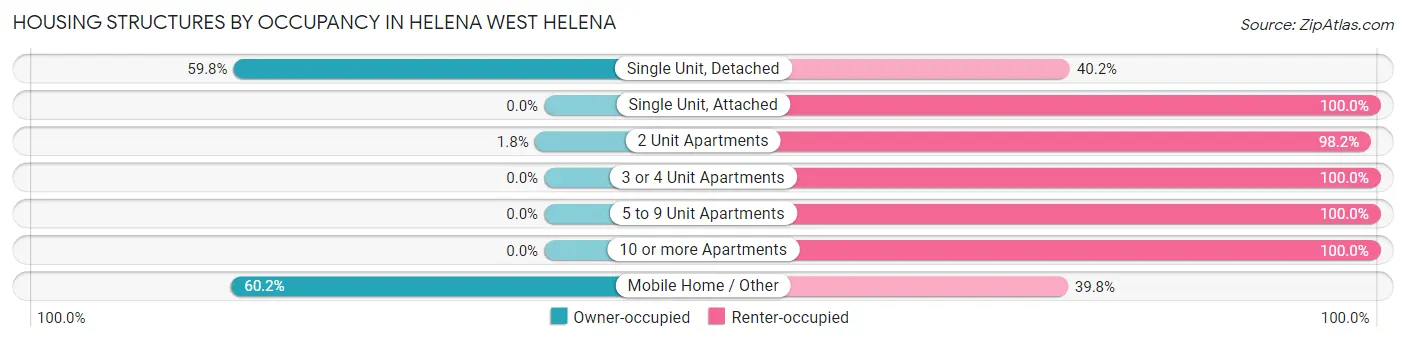
| Structure Type | Owner-occupied | Renter-occupied |
| Single Unit, Detached | 1,616 (59.8%) | 1,086 (40.2%) |
| Single Unit, Attached | 0 (0.0%) | 18 (100.0%) |
| 2 Unit Apartments | 5 (1.8%) | 268 (98.2%) |
| 3 or 4 Unit Apartments | 0 (0.0%) | 235 (100.0%) |
| 5 to 9 Unit Apartments | 0 (0.0%) | 124 (100.0%) |
| 10 or more Apartments | 0 (0.0%) | 145 (100.0%) |
| Mobile Home / Other | 59 (60.2%) | 39 (39.8%) |
| Total | 1,680 (46.7%) | 1,915 (53.3%) |
Housing Structures by Number of Rooms in Helena West Helena
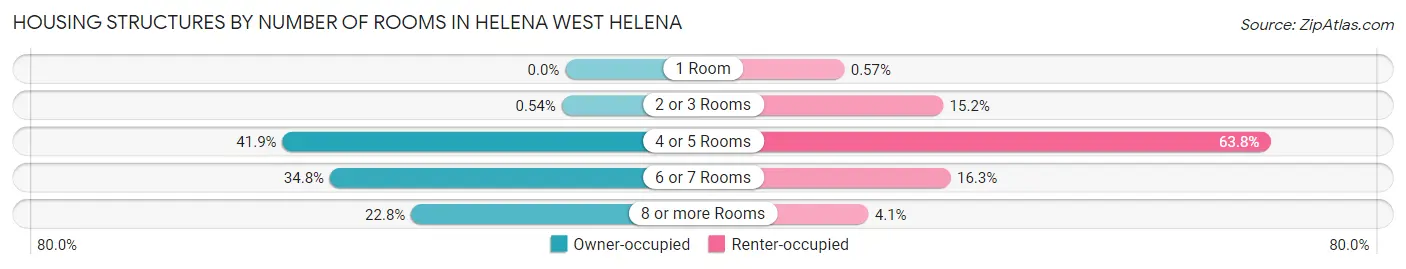
| Number of Rooms | Owner-occupied | Renter-occupied |
| 1 Room | 0 (0.0%) | 11 (0.6%) |
| 2 or 3 Rooms | 9 (0.5%) | 291 (15.2%) |
| 4 or 5 Rooms | 703 (41.8%) | 1,222 (63.8%) |
| 6 or 7 Rooms | 585 (34.8%) | 312 (16.3%) |
| 8 or more Rooms | 383 (22.8%) | 79 (4.1%) |
| Total | 1,680 (100.0%) | 1,915 (100.0%) |
Housing Structure by Heating Type in Helena West Helena
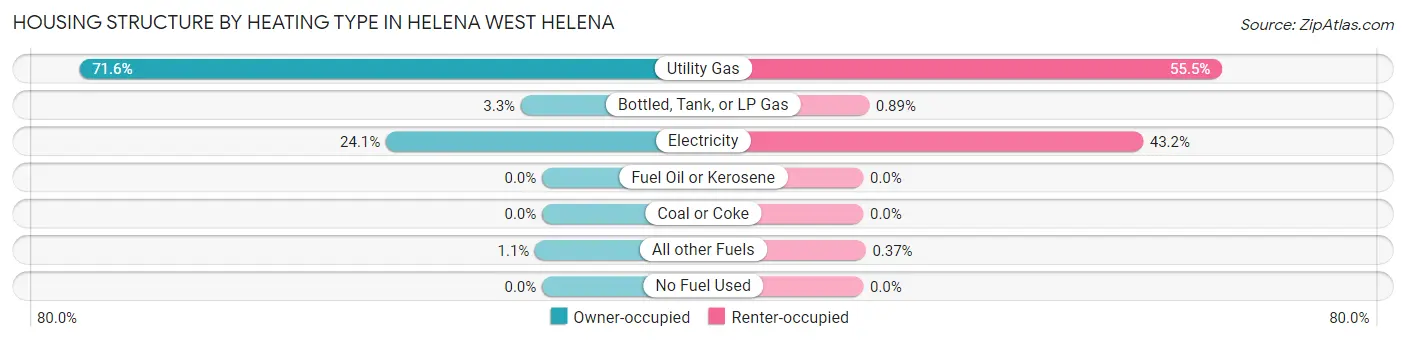
| Heating Type | Owner-occupied | Renter-occupied |
| Utility Gas | 1,202 (71.6%) | 1,063 (55.5%) |
| Bottled, Tank, or LP Gas | 55 (3.3%) | 17 (0.9%) |
| Electricity | 405 (24.1%) | 828 (43.2%) |
| Fuel Oil or Kerosene | 0 (0.0%) | 0 (0.0%) |
| Coal or Coke | 0 (0.0%) | 0 (0.0%) |
| All other Fuels | 18 (1.1%) | 7 (0.4%) |
| No Fuel Used | 0 (0.0%) | 0 (0.0%) |
| Total | 1,680 (100.0%) | 1,915 (100.0%) |
Household Vehicle Usage in Helena West Helena

| Vehicles per Household | Owner-occupied | Renter-occupied |
| No Vehicle | 31 (1.8%) | 557 (29.1%) |
| 1 Vehicle | 703 (41.8%) | 981 (51.2%) |
| 2 Vehicles | 675 (40.2%) | 231 (12.1%) |
| 3 or more Vehicles | 271 (16.1%) | 146 (7.6%) |
| Total | 1,680 (100.0%) | 1,915 (100.0%) |
Real Estate & Mortgages in Helena West Helena
Real Estate and Mortgage Overview in Helena West Helena
| Characteristic | Without Mortgage | With Mortgage |
| Housing Units | 1,074 | 606 |
| Median Property Value | $54,900 | $112,500 |
| Median Household Income | $32,850 | $23 |
| Monthly Housing Costs | $364 | $0 |
| Real Estate Taxes | $275 | $39 |
Property Value by Mortgage Status in Helena West Helena
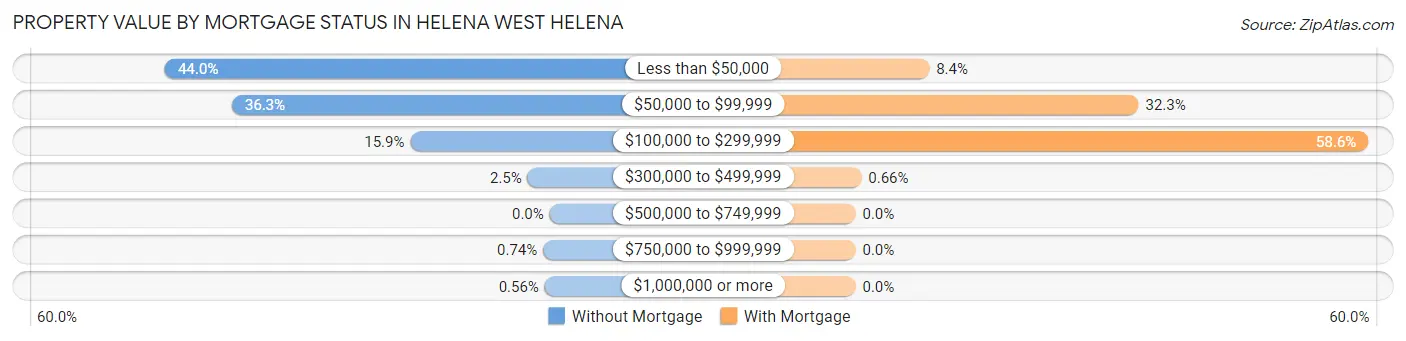
| Property Value | Without Mortgage | With Mortgage |
| Less than $50,000 | 472 (44.0%) | 51 (8.4%) |
| $50,000 to $99,999 | 390 (36.3%) | 196 (32.3%) |
| $100,000 to $299,999 | 171 (15.9%) | 355 (58.6%) |
| $300,000 to $499,999 | 27 (2.5%) | 4 (0.7%) |
| $500,000 to $749,999 | 0 (0.0%) | 0 (0.0%) |
| $750,000 to $999,999 | 8 (0.7%) | 0 (0.0%) |
| $1,000,000 or more | 6 (0.6%) | 0 (0.0%) |
| Total | 1,074 (100.0%) | 606 (100.0%) |
Household Income by Mortgage Status in Helena West Helena
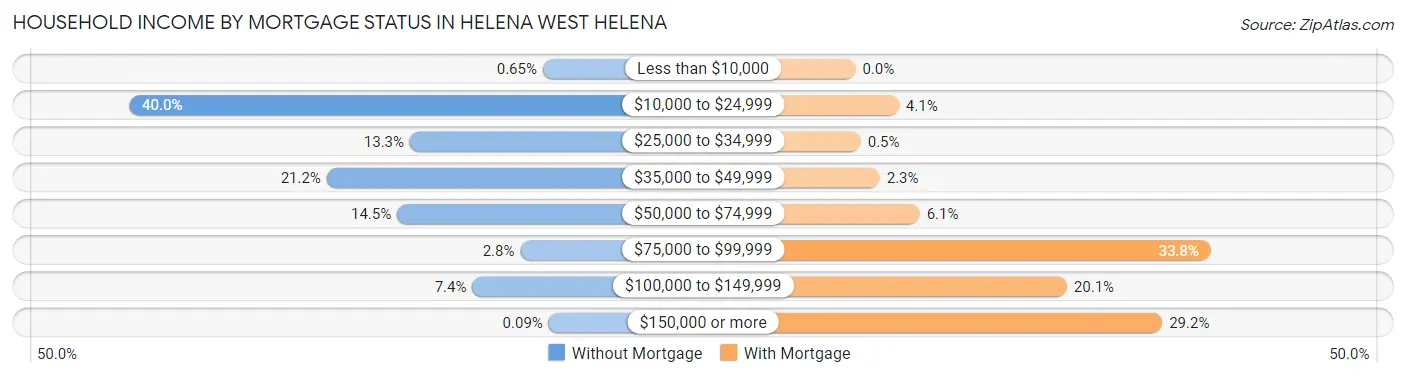
| Household Income | Without Mortgage | With Mortgage |
| Less than $10,000 | 7 (0.6%) | 0 (0.0%) |
| $10,000 to $24,999 | 430 (40.0%) | 25 (4.1%) |
| $25,000 to $34,999 | 143 (13.3%) | 3 (0.5%) |
| $35,000 to $49,999 | 228 (21.2%) | 14 (2.3%) |
| $50,000 to $74,999 | 156 (14.5%) | 37 (6.1%) |
| $75,000 to $99,999 | 30 (2.8%) | 205 (33.8%) |
| $100,000 to $149,999 | 79 (7.4%) | 122 (20.1%) |
| $150,000 or more | 1 (0.1%) | 177 (29.2%) |
| Total | 1,074 (100.0%) | 606 (100.0%) |
Property Value to Household Income Ratio in Helena West Helena
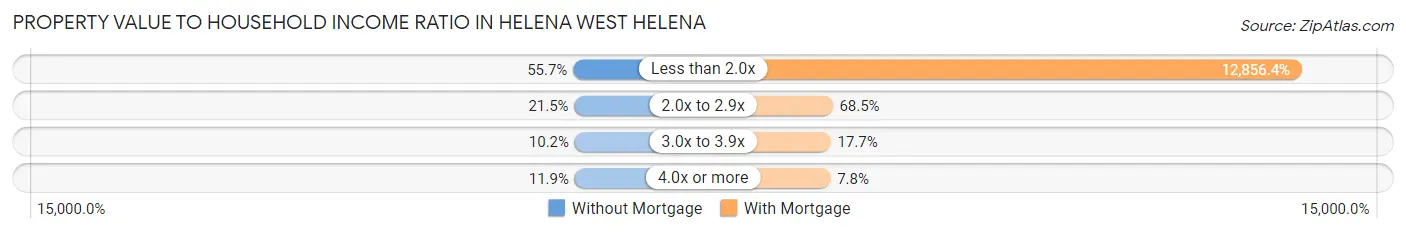
| Value-to-Income Ratio | Without Mortgage | With Mortgage |
| Less than 2.0x | 598 (55.7%) | 77,910 (12,856.4%) |
| 2.0x to 2.9x | 231 (21.5%) | 415 (68.5%) |
| 3.0x to 3.9x | 110 (10.2%) | 107 (17.7%) |
| 4.0x or more | 128 (11.9%) | 47 (7.8%) |
| Total | 1,074 (100.0%) | 606 (100.0%) |
Real Estate Taxes by Mortgage Status in Helena West Helena
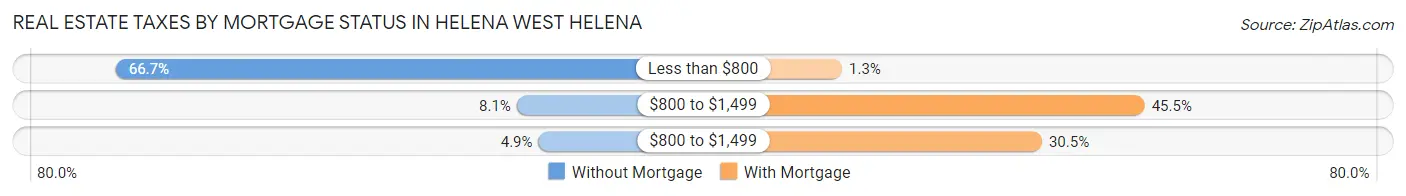
| Property Taxes | Without Mortgage | With Mortgage |
| Less than $800 | 716 (66.7%) | 8 (1.3%) |
| $800 to $1,499 | 87 (8.1%) | 276 (45.5%) |
| $800 to $1,499 | 53 (4.9%) | 185 (30.5%) |
| Total | 1,074 (100.0%) | 606 (100.0%) |
Health & Disability in Helena West Helena
Health Insurance Coverage by Age in Helena West Helena
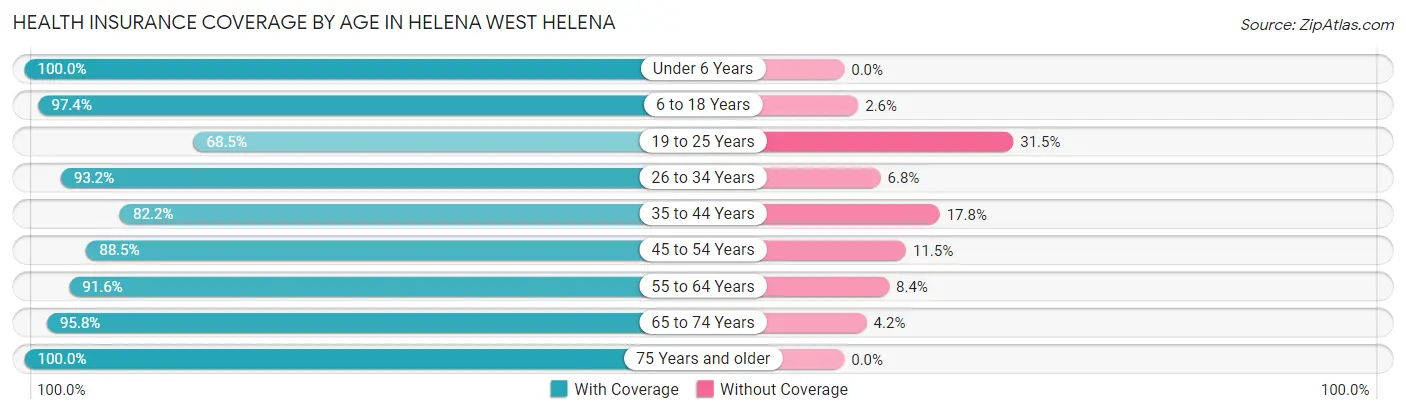
| Age Bracket | With Coverage | Without Coverage |
| Under 6 Years | 653 (100.0%) | 0 (0.0%) |
| 6 to 18 Years | 2,162 (97.4%) | 58 (2.6%) |
| 19 to 25 Years | 365 (68.5%) | 168 (31.5%) |
| 26 to 34 Years | 909 (93.2%) | 66 (6.8%) |
| 35 to 44 Years | 868 (82.2%) | 188 (17.8%) |
| 45 to 54 Years | 837 (88.5%) | 109 (11.5%) |
| 55 to 64 Years | 1,162 (91.6%) | 106 (8.4%) |
| 65 to 74 Years | 920 (95.8%) | 40 (4.2%) |
| 75 Years and older | 684 (100.0%) | 0 (0.0%) |
| Total | 8,560 (92.1%) | 735 (7.9%) |
Health Insurance Coverage by Citizenship Status in Helena West Helena

| Citizenship Status | With Coverage | Without Coverage |
| Native Born | 653 (100.0%) | 0 (0.0%) |
| Foreign Born, Citizen | 2,162 (97.4%) | 58 (2.6%) |
| Foreign Born, not a Citizen | 365 (68.5%) | 168 (31.5%) |
Health Insurance Coverage by Household Income in Helena West Helena
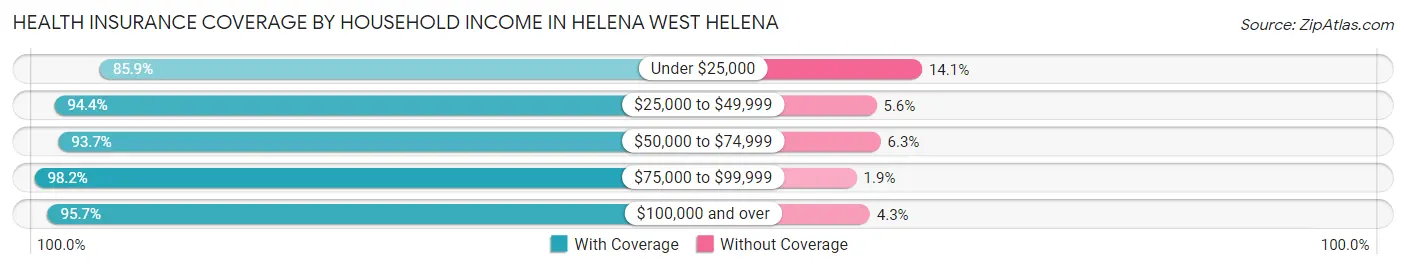
| Household Income | With Coverage | Without Coverage |
| Under $25,000 | 2,744 (85.9%) | 450 (14.1%) |
| $25,000 to $49,999 | 2,016 (94.4%) | 119 (5.6%) |
| $50,000 to $74,999 | 1,330 (93.7%) | 90 (6.3%) |
| $75,000 to $99,999 | 1,219 (98.2%) | 23 (1.8%) |
| $100,000 and over | 1,175 (95.7%) | 53 (4.3%) |
Public vs Private Health Insurance Coverage by Age in Helena West Helena
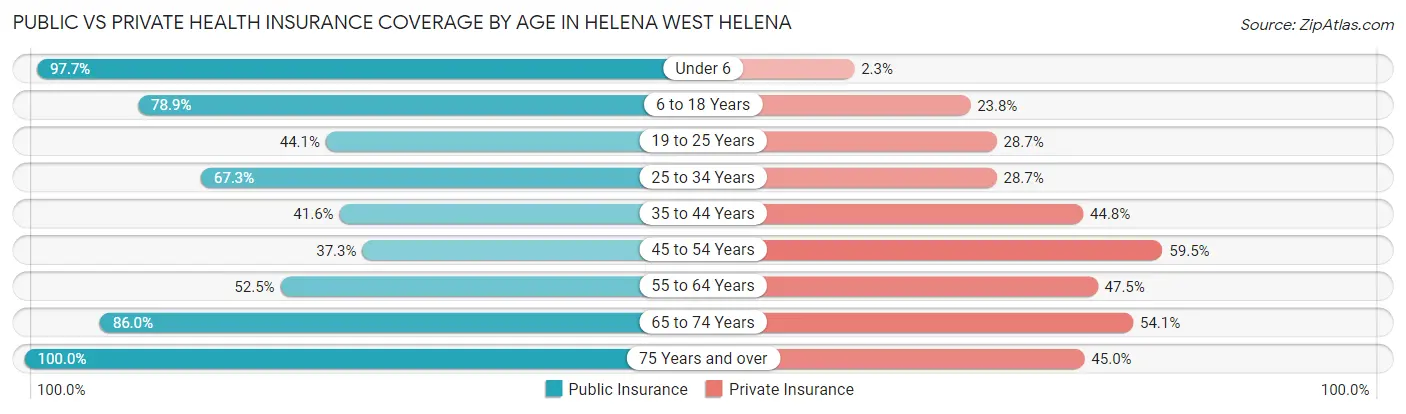
| Age Bracket | Public Insurance | Private Insurance |
| Under 6 | 638 (97.7%) | 15 (2.3%) |
| 6 to 18 Years | 1,752 (78.9%) | 529 (23.8%) |
| 19 to 25 Years | 235 (44.1%) | 153 (28.7%) |
| 25 to 34 Years | 656 (67.3%) | 280 (28.7%) |
| 35 to 44 Years | 439 (41.6%) | 473 (44.8%) |
| 45 to 54 Years | 353 (37.3%) | 563 (59.5%) |
| 55 to 64 Years | 666 (52.5%) | 602 (47.5%) |
| 65 to 74 Years | 826 (86.0%) | 519 (54.1%) |
| 75 Years and over | 684 (100.0%) | 308 (45.0%) |
| Total | 6,249 (67.2%) | 3,442 (37.0%) |
Disability Status by Sex by Age in Helena West Helena
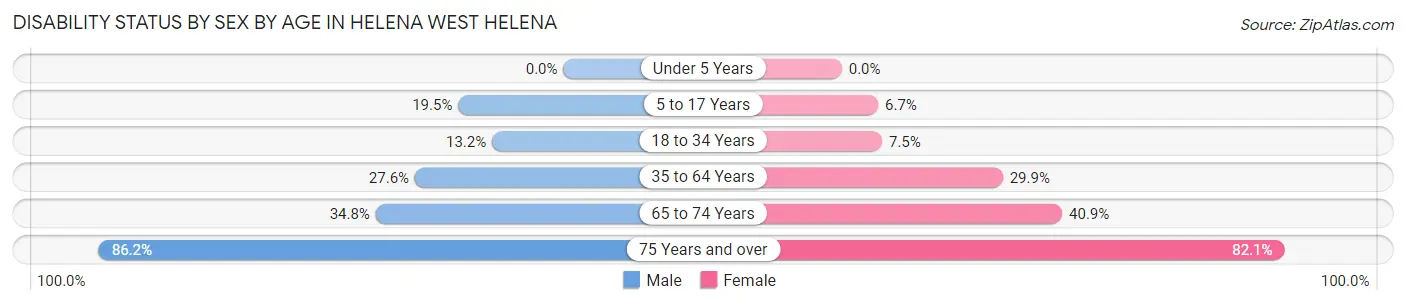
| Age Bracket | Male | Female |
| Under 5 Years | 0 (0.0%) | 0 (0.0%) |
| 5 to 17 Years | 209 (19.5%) | 68 (6.7%) |
| 18 to 34 Years | 98 (13.2%) | 74 (7.5%) |
| 35 to 64 Years | 389 (27.6%) | 555 (29.9%) |
| 65 to 74 Years | 124 (34.8%) | 247 (40.9%) |
| 75 Years and over | 194 (86.2%) | 377 (82.1%) |
Disability Class by Sex by Age in Helena West Helena
Disability Class: Hearing Difficulty

| Age Bracket | Male | Female |
| Under 5 Years | 0 (0.0%) | 0 (0.0%) |
| 5 to 17 Years | 0 (0.0%) | 68 (6.7%) |
| 18 to 34 Years | 0 (0.0%) | 0 (0.0%) |
| 35 to 64 Years | 30 (2.1%) | 43 (2.3%) |
| 65 to 74 Years | 33 (9.3%) | 46 (7.6%) |
| 75 Years and over | 128 (56.9%) | 100 (21.8%) |
Disability Class: Vision Difficulty

| Age Bracket | Male | Female |
| Under 5 Years | 0 (0.0%) | 0 (0.0%) |
| 5 to 17 Years | 7 (0.6%) | 0 (0.0%) |
| 18 to 34 Years | 9 (1.2%) | 41 (4.1%) |
| 35 to 64 Years | 76 (5.4%) | 102 (5.5%) |
| 65 to 74 Years | 14 (3.9%) | 0 (0.0%) |
| 75 Years and over | 18 (8.0%) | 135 (29.4%) |
Disability Class: Cognitive Difficulty

| Age Bracket | Male | Female |
| 5 to 17 Years | 112 (10.5%) | 0 (0.0%) |
| 18 to 34 Years | 98 (13.2%) | 4 (0.4%) |
| 35 to 64 Years | 134 (9.5%) | 174 (9.4%) |
| 65 to 74 Years | 73 (20.5%) | 47 (7.8%) |
| 75 Years and over | 9 (4.0%) | 106 (23.1%) |
Disability Class: Ambulatory Difficulty
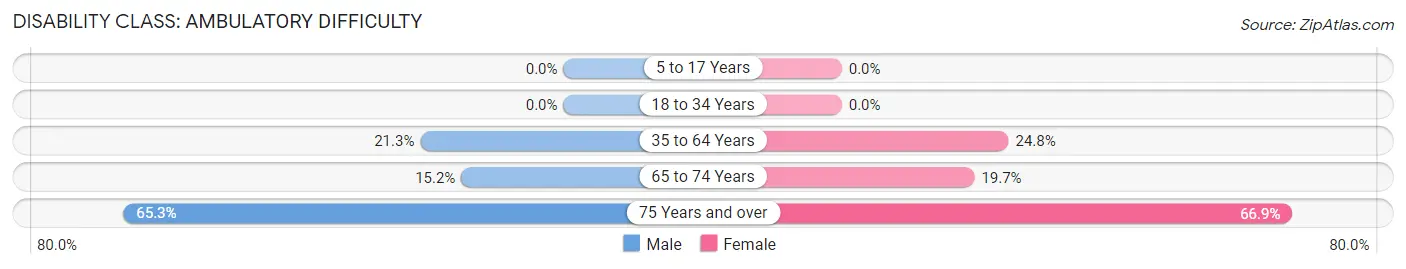
| Age Bracket | Male | Female |
| 5 to 17 Years | 0 (0.0%) | 0 (0.0%) |
| 18 to 34 Years | 0 (0.0%) | 0 (0.0%) |
| 35 to 64 Years | 300 (21.2%) | 460 (24.8%) |
| 65 to 74 Years | 54 (15.2%) | 119 (19.7%) |
| 75 Years and over | 147 (65.3%) | 307 (66.9%) |
Disability Class: Self-Care Difficulty

| Age Bracket | Male | Female |
| 5 to 17 Years | 90 (8.4%) | 0 (0.0%) |
| 18 to 34 Years | 37 (5.0%) | 0 (0.0%) |
| 35 to 64 Years | 133 (9.4%) | 132 (7.1%) |
| 65 to 74 Years | 8 (2.2%) | 30 (5.0%) |
| 75 Years and over | 52 (23.1%) | 105 (22.9%) |
Technology Access in Helena West Helena
Computing Device Access in Helena West Helena
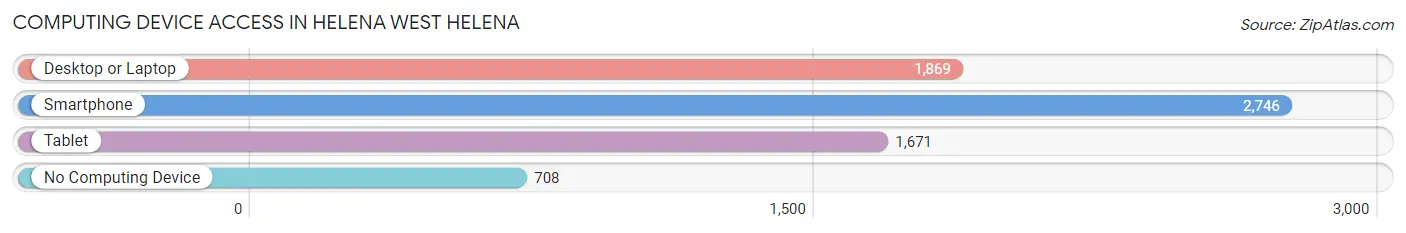
| Device Type | # Households | % Households |
| Desktop or Laptop | 1,869 | 52.0% |
| Smartphone | 2,746 | 76.4% |
| Tablet | 1,671 | 46.5% |
| No Computing Device | 708 | 19.7% |
| Total | 3,595 | 100.0% |
Internet Access in Helena West Helena
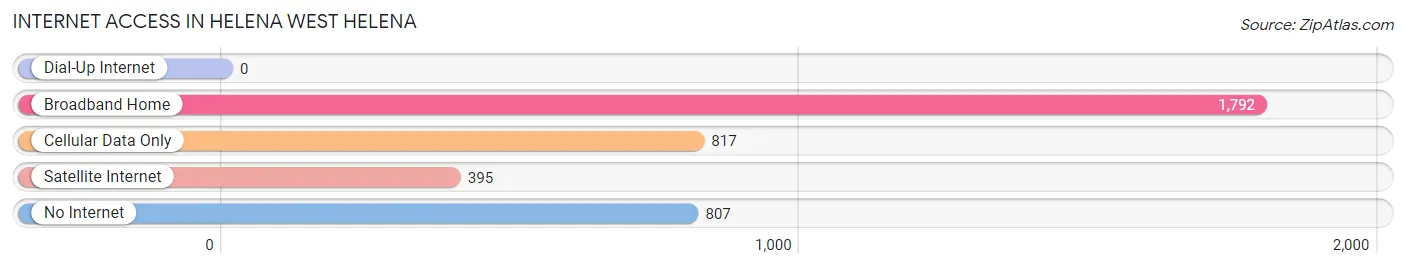
| Internet Type | # Households | % Households |
| Dial-Up Internet | 0 | 0.0% |
| Broadband Home | 1,792 | 49.8% |
| Cellular Data Only | 817 | 22.7% |
| Satellite Internet | 395 | 11.0% |
| No Internet | 807 | 22.5% |
| Total | 3,595 | 100.0% |
Helena West Helena Summary
Helena West Helena is a city located in Phillips County, Arkansas. It is situated on the Mississippi River, and is the county seat of Phillips County. The city is a part of the Helena-West Helena Micropolitan Statistical Area, and is the largest city in the area. As of the 2010 census, the city had a population of 12,282.
History
Helena West Helena was originally two separate towns, Helena and West Helena. Helena was founded in 1833, and West Helena was founded in 1883. The two towns were combined in 2006, and the combined city was named Helena West Helena.
The city was a major center of the cotton industry in the 19th century, and was a major port on the Mississippi River. During the Civil War, the city was the site of several battles, including the Battle of Helena.
Geography
Helena West Helena is located at 34°31'25" North, 90°35'45" West (34.523607, -90.595890). The city is situated on the Mississippi River, and is bordered by the St. Francis National Forest to the east.
The city has a total area of 16.2 square miles, of which 15.9 square miles is land and 0.3 square miles is water.
Economy
The economy of Helena West Helena is largely based on agriculture and manufacturing. The city is home to several manufacturing plants, including a Tyson Foods poultry processing plant, a Georgia-Pacific lumber mill, and a Georgia-Pacific paper mill.
Agriculture is also an important part of the local economy. The city is home to several large farms, and is a major producer of cotton, soybeans, and rice.
Demographics
As of the 2010 census, there were 12,282 people, 4,845 households, and 3,092 families residing in the city. The population density was 772.3 people per square mile. The racial makeup of the city was 57.2% African American, 37.3% White, 0.5% Native American, 0.3% Asian, 0.1% Pacific Islander, 2.2% from other races, and 2.5% from two or more races. Hispanic or Latino of any race were 4.2% of the population.
The median income for a household in the city was $25,944, and the median income for a family was $31,944. The per capita income for the city was $14,845. About 24.2% of the population was below the poverty line.
Common Questions
What is Per Capita Income in Helena West Helena?
Per Capita income in Helena West Helena is $18,463.
What is the Median Family Income in Helena West Helena?
Median Family Income in Helena West Helena is $42,719.
What is the Median Household income in Helena West Helena?
Median Household Income in Helena West Helena is $31,118.
What is Income or Wage Gap in Helena West Helena?
Income or Wage Gap in Helena West Helena is 41.5%.
Women in Helena West Helena earn 58.5 cents for every dollar earned by a man.
What is Family Income Deficit in Helena West Helena?
Family Income Deficit in Helena West Helena is $14,196.
Families that are below poverty line in Helena West Helena earn $14,196 less on average than the poverty threshold level.
What is Inequality or Gini Index in Helena West Helena?
Inequality or Gini Index in Helena West Helena is 0.46.
What is the Total Population of Helena West Helena?
Total Population of Helena West Helena is 9,470.
What is the Total Male Population of Helena West Helena?
Total Male Population of Helena West Helena is 4,325.
What is the Total Female Population of Helena West Helena?
Total Female Population of Helena West Helena is 5,145.
What is the Ratio of Males per 100 Females in Helena West Helena?
There are 84.06 Males per 100 Females in Helena West Helena.
What is the Ratio of Females per 100 Males in Helena West Helena?
There are 118.96 Females per 100 Males in Helena West Helena.
What is the Median Population Age in Helena West Helena?
Median Population Age in Helena West Helena is 38.4 Years.
What is the Average Family Size in Helena West Helena
Average Family Size in Helena West Helena is 3.7 People.
What is the Average Household Size in Helena West Helena
Average Household Size in Helena West Helena is 2.6 People.
How Large is the Labor Force in Helena West Helena?
There are 3,626 People in the Labor Forcein in Helena West Helena.
What is the Percentage of People in the Labor Force in Helena West Helena?
51.3% of People are in the Labor Force in Helena West Helena.
What is the Unemployment Rate in Helena West Helena?
Unemployment Rate in Helena West Helena is 16.4%.