Lajas, PR Map & Demographics
Lajas Map
Lajas Overview
$11,939
PER CAPITA INCOME
$23,979
AVG FAMILY INCOME
$21,630
AVG HOUSEHOLD INCOME
17.2%
WAGE / INCOME GAP [ % ]
82.8¢/ $1
WAGE / INCOME GAP [ $ ]
$12,916
FAMILY INCOME DEFICIT
0.50
INEQUALITY / GINI INDEX
4,518
TOTAL POPULATION
1,997
MALE POPULATION
2,521
FEMALE POPULATION
79.21
MALES / 100 FEMALES
126.24
FEMALES / 100 MALES
51.1
MEDIAN AGE
3.4
AVG FAMILY SIZE
2.6
AVG HOUSEHOLD SIZE
1,785
LABOR FORCE [ PEOPLE ]
45.5%
PERCENT IN LABOR FORCE
19.5%
UNEMPLOYMENT RATE
Lajas Zip Codes
Income in Lajas
Income Overview in Lajas
Per Capita Income in Lajas is $11,939, while median incomes of families and households are $23,979 and $21,630 respectively.
| Characteristic | Number | Measure |
| Per Capita Income | 4,518 | $11,939 |
| Median Family Income | 1,021 | $23,979 |
| Mean Family Income | 1,021 | $29,618 |
| Median Household Income | 1,712 | $21,630 |
| Mean Household Income | 1,712 | $26,823 |
| Income Deficit | 1,021 | $12,916 |
| Wage / Income Gap (%) | 4,518 | 17.25% |
| Wage / Income Gap ($) | 4,518 | 82.75¢ per $1 |
| Gini / Inequality Index | 4,518 | 0.50 |
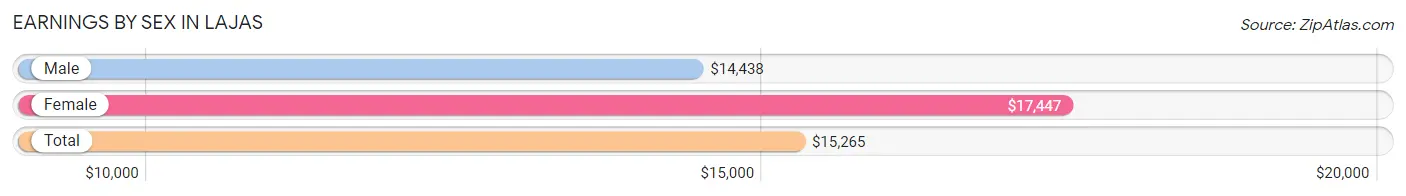
Earnings by Sex in Lajas
Average Earnings in Lajas are $15,265, $14,438 for men and $17,447 for women, a difference of 17.2%.
| Sex | Number | Average Earnings |
| Male | 779 (49.7%) | $14,438 |
| Female | 788 (50.3%) | $17,447 |
| Total | 1,567 (100.0%) | $15,265 |
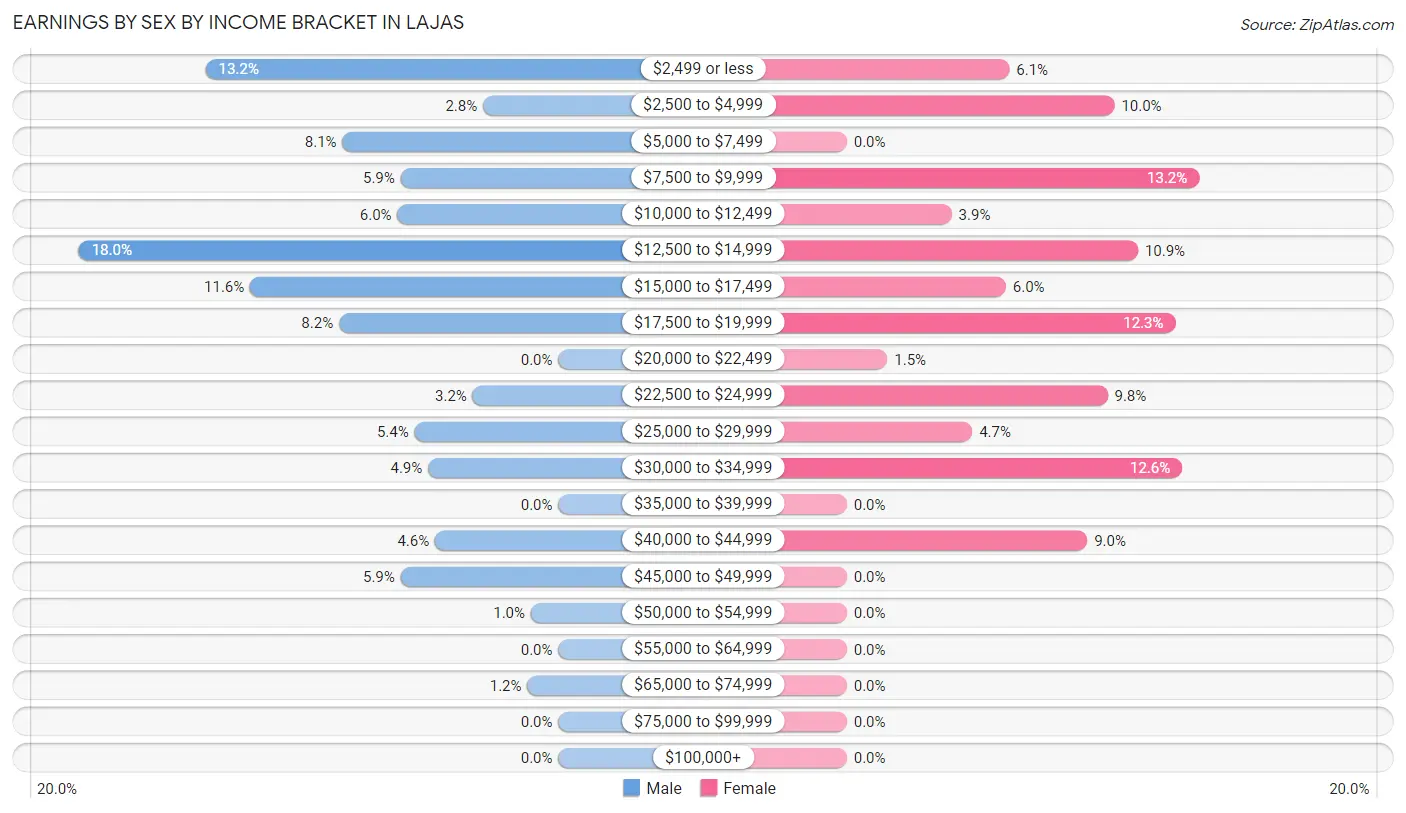
Earnings by Sex by Income Bracket in Lajas
The most common earnings brackets in Lajas are $12,500 to $14,999 for men (140 | 18.0%) and $7,500 to $9,999 for women (104 | 13.2%).
| Income | Male | Female |
| $2,499 or less | 103 (13.2%) | 48 (6.1%) |
| $2,500 to $4,999 | 22 (2.8%) | 79 (10.0%) |
| $5,000 to $7,499 | 63 (8.1%) | 0 (0.0%) |
| $7,500 to $9,999 | 46 (5.9%) | 104 (13.2%) |
| $10,000 to $12,499 | 47 (6.0%) | 31 (3.9%) |
| $12,500 to $14,999 | 140 (18.0%) | 86 (10.9%) |
| $15,000 to $17,499 | 90 (11.6%) | 47 (6.0%) |
| $17,500 to $19,999 | 64 (8.2%) | 97 (12.3%) |
| $20,000 to $22,499 | 0 (0.0%) | 12 (1.5%) |
| $22,500 to $24,999 | 25 (3.2%) | 77 (9.8%) |
| $25,000 to $29,999 | 42 (5.4%) | 37 (4.7%) |
| $30,000 to $34,999 | 38 (4.9%) | 99 (12.6%) |
| $35,000 to $39,999 | 0 (0.0%) | 0 (0.0%) |
| $40,000 to $44,999 | 36 (4.6%) | 71 (9.0%) |
| $45,000 to $49,999 | 46 (5.9%) | 0 (0.0%) |
| $50,000 to $54,999 | 8 (1.0%) | 0 (0.0%) |
| $55,000 to $64,999 | 0 (0.0%) | 0 (0.0%) |
| $65,000 to $74,999 | 9 (1.2%) | 0 (0.0%) |
| $75,000 to $99,999 | 0 (0.0%) | 0 (0.0%) |
| $100,000+ | 0 (0.0%) | 0 (0.0%) |
| Total | 779 (100.0%) | 788 (100.0%) |
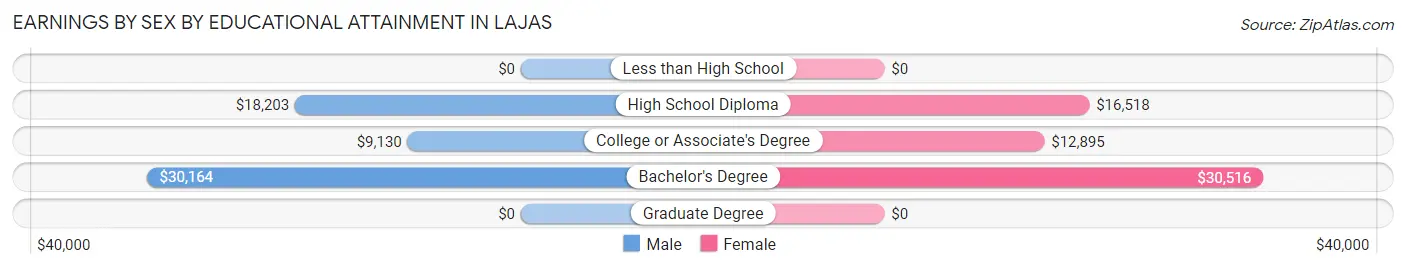
Earnings by Sex by Educational Attainment in Lajas
Average earnings in Lajas are $14,929 for men and $18,131 for women, a difference of 17.7%. Men with an educational attainment of bachelor's degree enjoy the highest average annual earnings of $30,164, while those with college or associate's degree education earn the least with $9,130. Women with an educational attainment of bachelor's degree earn the most with the average annual earnings of $30,516, while those with college or associate's degree education have the smallest earnings of $12,895.
| Educational Attainment | Male Income | Female Income |
| Less than High School | - | - |
| High School Diploma | $18,203 | $16,518 |
| College or Associate's Degree | $9,130 | $12,895 |
| Bachelor's Degree | $30,164 | $30,516 |
| Graduate Degree | - | - |
| Total | $14,929 | $18,131 |
Family Income in Lajas
Family Income Brackets in Lajas
According to the Lajas family income data, there are 247 families falling into the less than $10,000 income range, which is the most common income bracket and makes up 24.2% of all families.
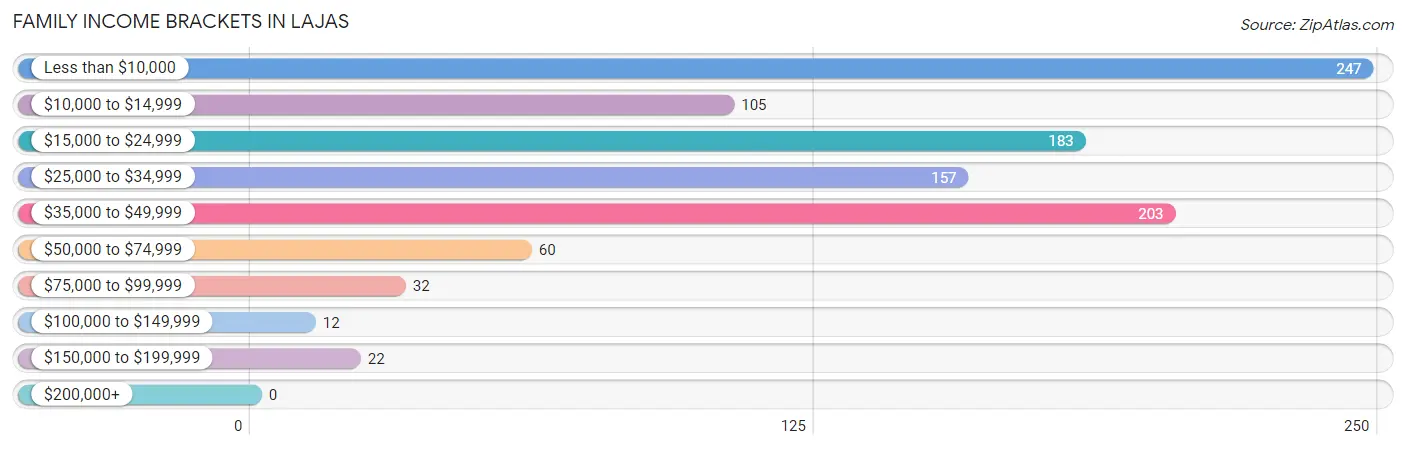
| Income Bracket | # Families | % Families |
| Less than $10,000 | 247 | 24.2% |
| $10,000 to $14,999 | 105 | 10.3% |
| $15,000 to $24,999 | 183 | 17.9% |
| $25,000 to $34,999 | 157 | 15.4% |
| $35,000 to $49,999 | 203 | 19.9% |
| $50,000 to $74,999 | 60 | 5.9% |
| $75,000 to $99,999 | 32 | 3.1% |
| $100,000 to $149,999 | 12 | 1.2% |
| $150,000 to $199,999 | 22 | 2.2% |
| $200,000+ | 0 | 0.0% |
Family Income by Famaliy Size in Lajas
4-person families (220 | 21.5%) account for the highest median family income in Lajas with $40,431 per family, while 2-person families (597 | 58.5%) have the highest median income of $12,218 per family member.
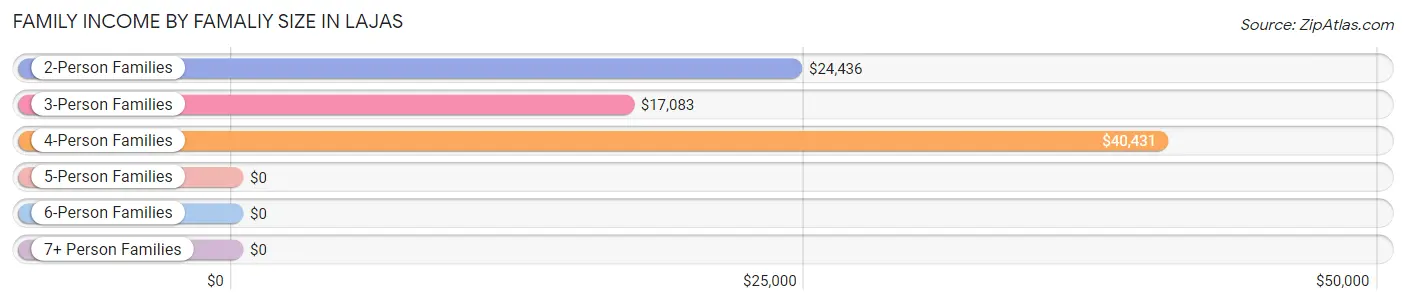
| Income Bracket | # Families | Median Income |
| 2-Person Families | 597 (58.5%) | $24,436 |
| 3-Person Families | 177 (17.3%) | $17,083 |
| 4-Person Families | 220 (21.5%) | $40,431 |
| 5-Person Families | 27 (2.6%) | $0 |
| 6-Person Families | 0 (0.0%) | $0 |
| 7+ Person Families | 0 (0.0%) | $0 |
| Total | 1,021 (100.0%) | $23,979 |
Family Income by Number of Earners in Lajas
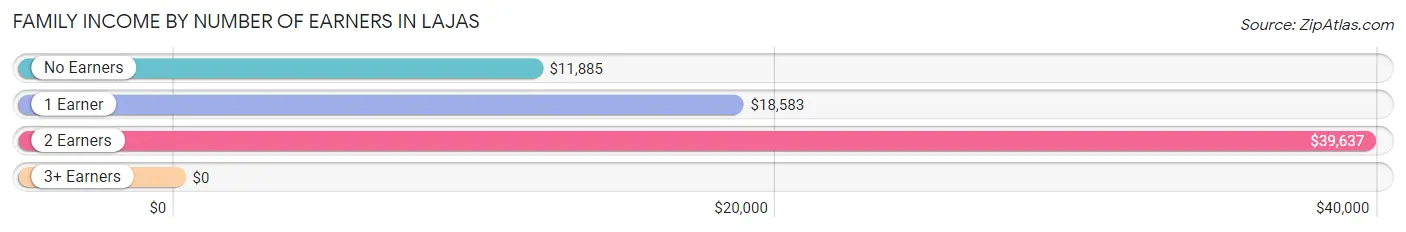
| Number of Earners | # Families | Median Income |
| No Earners | 450 (44.1%) | $11,885 |
| 1 Earner | 320 (31.3%) | $18,583 |
| 2 Earners | 227 (22.2%) | $39,637 |
| 3+ Earners | 24 (2.4%) | $0 |
| Total | 1,021 (100.0%) | $23,979 |
Household Income in Lajas
Household Income Brackets in Lajas
With 500 households falling in the category, the less than $10,000 income range is the most frequent in Lajas, accounting for 29.2% of all households.
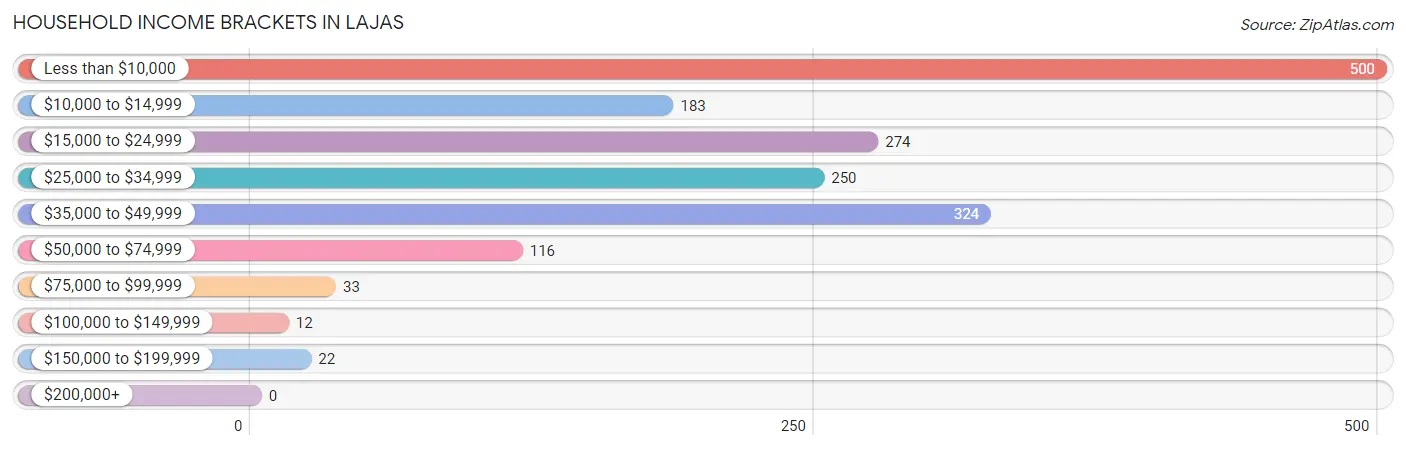
| Income Bracket | # Households | % Households |
| Less than $10,000 | 500 | 29.2% |
| $10,000 to $14,999 | 183 | 10.7% |
| $15,000 to $24,999 | 274 | 16.0% |
| $25,000 to $34,999 | 250 | 14.6% |
| $35,000 to $49,999 | 324 | 18.9% |
| $50,000 to $74,999 | 116 | 6.8% |
| $75,000 to $99,999 | 33 | 1.9% |
| $100,000 to $149,999 | 12 | 0.7% |
| $150,000 to $199,999 | 22 | 1.3% |
| $200,000+ | 0 | 0.0% |
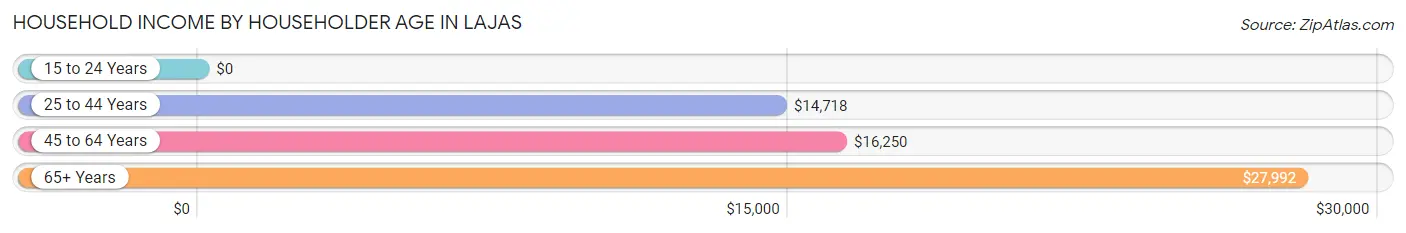
Household Income by Householder Age in Lajas
The median household income in Lajas is $21,630, with the highest median household income of $27,992 found in the 65+ years age bracket for the primary householder. A total of 750 households (43.8%) fall into this category.
| Income Bracket | # Households | Median Income |
| 15 to 24 Years | 0 (0.0%) | $0 |
| 25 to 44 Years | 335 (19.6%) | $14,718 |
| 45 to 64 Years | 627 (36.6%) | $16,250 |
| 65+ Years | 750 (43.8%) | $27,992 |
| Total | 1,712 (100.0%) | $21,630 |
Poverty in Lajas
Income Below Poverty by Sex and Age in Lajas
With 41.1% poverty level for males and 47.9% for females among the residents of Lajas, 16 and 17 year old males and under 5 year old females are the most vulnerable to poverty, with 16 males (100.0%) and 75 females (100.0%) in their respective age groups living below the poverty level.
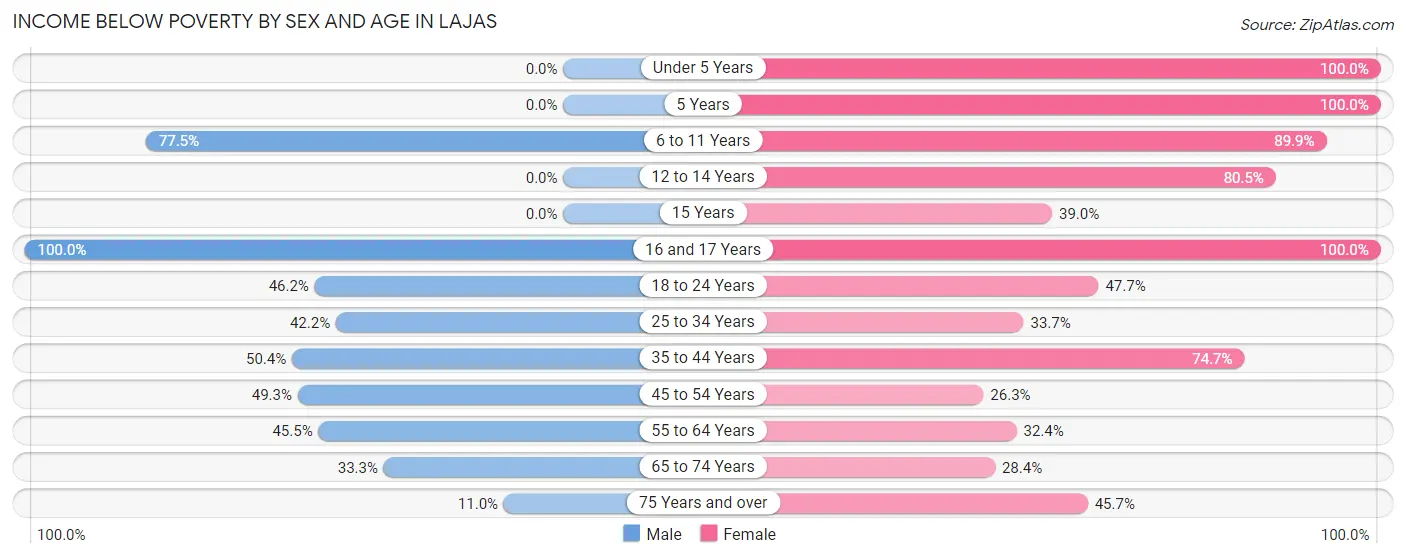
| Age Bracket | Male | Female |
| Under 5 Years | 0 (0.0%) | 75 (100.0%) |
| 5 Years | 0 (0.0%) | 14 (100.0%) |
| 6 to 11 Years | 148 (77.5%) | 125 (89.9%) |
| 12 to 14 Years | 0 (0.0%) | 91 (80.5%) |
| 15 Years | 0 (0.0%) | 16 (39.0%) |
| 16 and 17 Years | 16 (100.0%) | 15 (100.0%) |
| 18 to 24 Years | 78 (46.2%) | 132 (47.6%) |
| 25 to 34 Years | 92 (42.2%) | 57 (33.7%) |
| 35 to 44 Years | 69 (50.4%) | 192 (74.7%) |
| 45 to 54 Years | 174 (49.3%) | 107 (26.3%) |
| 55 to 64 Years | 145 (45.5%) | 109 (32.4%) |
| 65 to 74 Years | 51 (33.3%) | 56 (28.4%) |
| 75 Years and over | 46 (11.0%) | 215 (45.7%) |
| Total | 819 (41.1%) | 1,204 (47.9%) |
Income Above Poverty by Sex and Age in Lajas
According to the poverty statistics in Lajas, males aged under 5 years and females aged 45 to 54 years are the age groups that are most secure financially, with 100.0% of males and 73.7% of females in these age groups living above the poverty line.
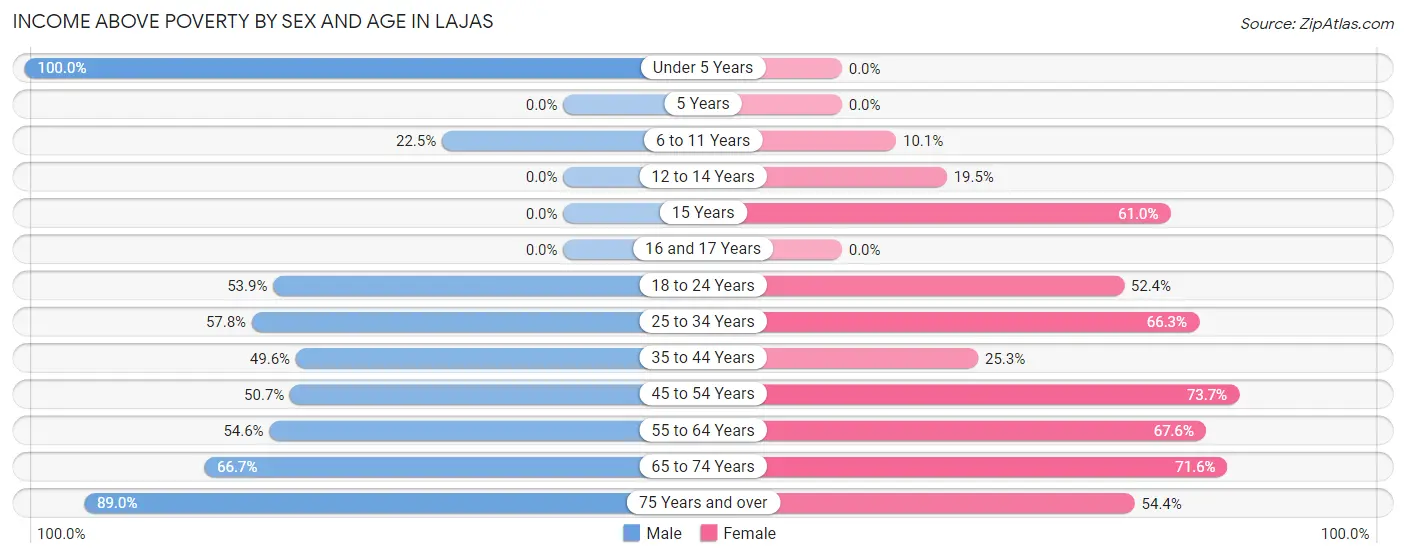
| Age Bracket | Male | Female |
| Under 5 Years | 21 (100.0%) | 0 (0.0%) |
| 5 Years | 0 (0.0%) | 0 (0.0%) |
| 6 to 11 Years | 43 (22.5%) | 14 (10.1%) |
| 12 to 14 Years | 0 (0.0%) | 22 (19.5%) |
| 15 Years | 0 (0.0%) | 25 (61.0%) |
| 16 and 17 Years | 0 (0.0%) | 0 (0.0%) |
| 18 to 24 Years | 91 (53.8%) | 145 (52.3%) |
| 25 to 34 Years | 126 (57.8%) | 112 (66.3%) |
| 35 to 44 Years | 68 (49.6%) | 65 (25.3%) |
| 45 to 54 Years | 179 (50.7%) | 300 (73.7%) |
| 55 to 64 Years | 174 (54.5%) | 227 (67.6%) |
| 65 to 74 Years | 102 (66.7%) | 141 (71.6%) |
| 75 Years and over | 371 (89.0%) | 256 (54.3%) |
| Total | 1,175 (58.9%) | 1,307 (52.0%) |
Income Below Poverty Among Married-Couple Families in Lajas
The poverty statistics for married-couple families in Lajas show that 27.8% or 140 of the total 503 families live below the poverty line. Families with 1 or 2 children have the highest poverty rate of 43.1%, comprising of 53 families. On the other hand, families with no children have the lowest poverty rate of 22.9%, which includes 87 families.
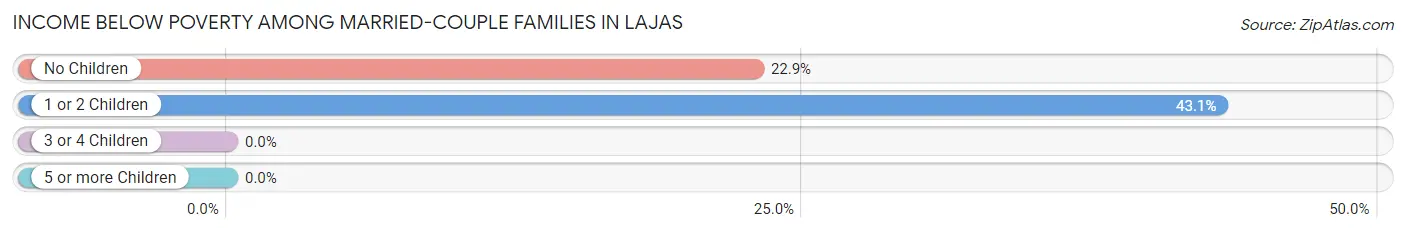
| Children | Above Poverty | Below Poverty |
| No Children | 293 (77.1%) | 87 (22.9%) |
| 1 or 2 Children | 70 (56.9%) | 53 (43.1%) |
| 3 or 4 Children | 0 (0.0%) | 0 (0.0%) |
| 5 or more Children | 0 (0.0%) | 0 (0.0%) |
| Total | 363 (72.2%) | 140 (27.8%) |
Income Below Poverty Among Single-Parent Households in Lajas
According to the poverty data in Lajas, 72.0% or 131 single-father households and 56.6% or 190 single-mother households are living below the poverty line. Among single-father households, those with 1 or 2 children have the highest poverty rate, with 60 households (100.0%) experiencing poverty. Likewise, among single-mother households, those with 1 or 2 children have the highest poverty rate, with 102 households (100.0%) falling below the poverty line.
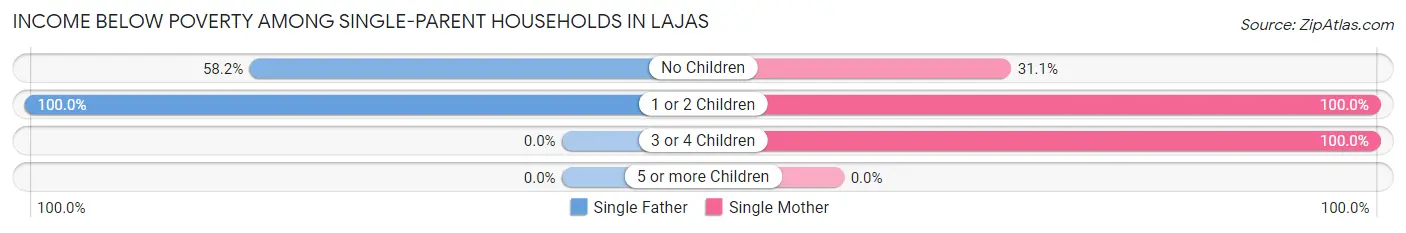
| Children | Single Father | Single Mother |
| No Children | 71 (58.2%) | 66 (31.1%) |
| 1 or 2 Children | 60 (100.0%) | 102 (100.0%) |
| 3 or 4 Children | 0 (0.0%) | 22 (100.0%) |
| 5 or more Children | 0 (0.0%) | 0 (0.0%) |
| Total | 131 (72.0%) | 190 (56.6%) |
Income Below Poverty Among Married-Couple vs Single-Parent Households in Lajas
The poverty data for Lajas shows that 140 of the married-couple family households (27.8%) and 321 of the single-parent households (62.0%) are living below the poverty level. Within the married-couple family households, those with 1 or 2 children have the highest poverty rate, with 53 households (43.1%) falling below the poverty line. Among the single-parent households, those with 1 or 2 children have the highest poverty rate, with 162 household (100.0%) living below poverty.
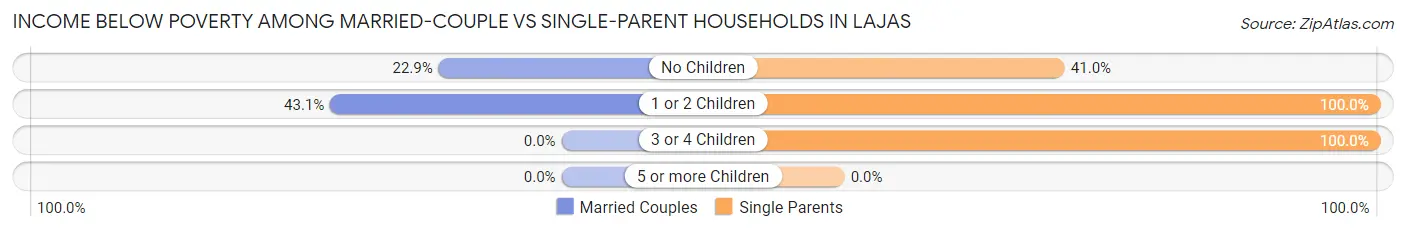
| Children | Married-Couple Families | Single-Parent Households |
| No Children | 87 (22.9%) | 137 (41.0%) |
| 1 or 2 Children | 53 (43.1%) | 162 (100.0%) |
| 3 or 4 Children | 0 (0.0%) | 22 (100.0%) |
| 5 or more Children | 0 (0.0%) | 0 (0.0%) |
| Total | 140 (27.8%) | 321 (62.0%) |
Race in Lajas
The most populous races in Lajas are Hispanic or Latino (4,510 | 99.8%), White / Caucasian (2,179 | 48.2%), and Some other Race (1,534 | 34.0%).
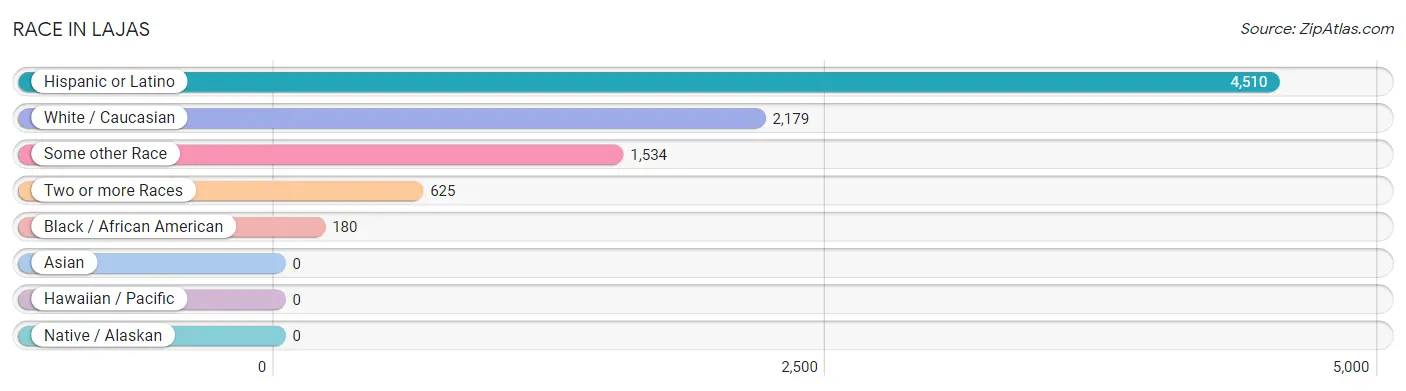
| Race | # Population | % Population |
| Asian | 0 | 0.0% |
| Black / African American | 180 | 4.0% |
| Hawaiian / Pacific | 0 | 0.0% |
| Hispanic or Latino | 4,510 | 99.8% |
| Native / Alaskan | 0 | 0.0% |
| White / Caucasian | 2,179 | 48.2% |
| Two or more Races | 625 | 13.8% |
| Some other Race | 1,534 | 34.0% |
| Total | 4,518 | 100.0% |
Ancestry in Lajas
The most populous ancestries reported in Lajas are Puerto Rican (4,417 | 97.8%), Spaniard (63 | 1.4%), American (39 | 0.9%), Argentinean (15 | 0.3%), and Cuban (15 | 0.3%), together accounting for 100.7% of all Lajas residents.
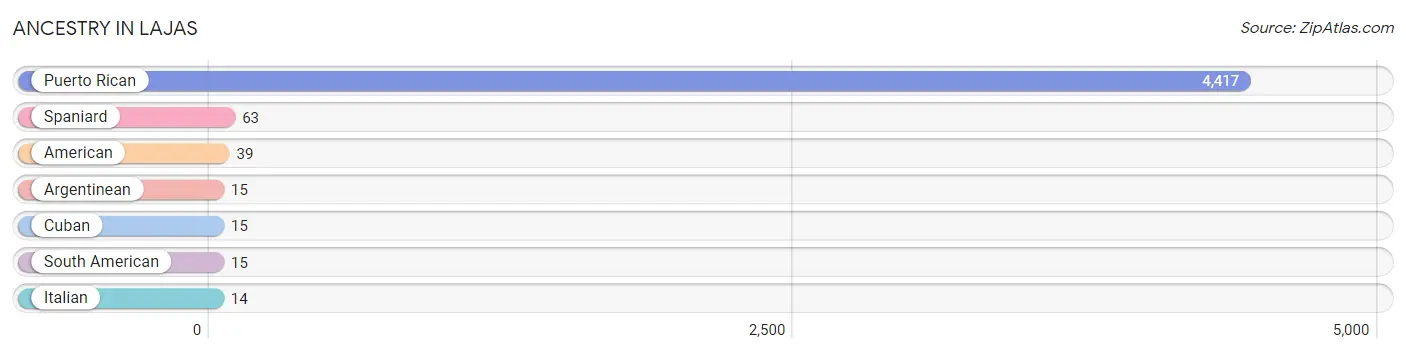
| Ancestry | # Population | % Population |
| American | 39 | 0.9% |
| Argentinean | 15 | 0.3% |
| Cuban | 15 | 0.3% |
| Italian | 14 | 0.3% |
| Puerto Rican | 4,417 | 97.8% |
| South American | 15 | 0.3% |
| Spaniard | 63 | 1.4% | View All 7 Rows |
Immigrants in Lajas

| Immigration Origin | # Population | % Population | View All 0 Rows |
Sex and Age in Lajas
Sex and Age in Lajas
The most populous age groups in Lajas are 55 to 59 Years (276 | 13.8%) for men and 50 to 54 Years (235 | 9.3%) for women.
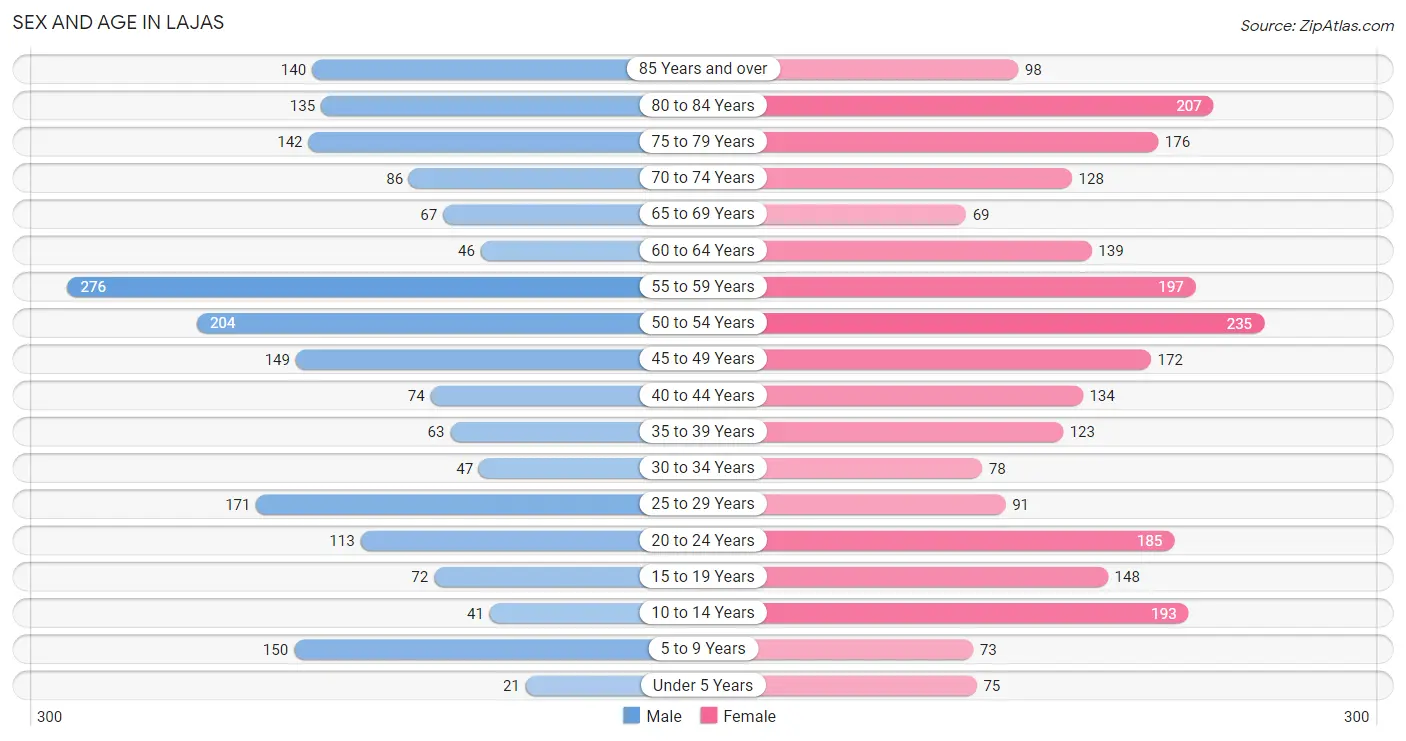
| Age Bracket | Male | Female |
| Under 5 Years | 21 (1.1%) | 75 (3.0%) |
| 5 to 9 Years | 150 (7.5%) | 73 (2.9%) |
| 10 to 14 Years | 41 (2.1%) | 193 (7.7%) |
| 15 to 19 Years | 72 (3.6%) | 148 (5.9%) |
| 20 to 24 Years | 113 (5.7%) | 185 (7.3%) |
| 25 to 29 Years | 171 (8.6%) | 91 (3.6%) |
| 30 to 34 Years | 47 (2.4%) | 78 (3.1%) |
| 35 to 39 Years | 63 (3.2%) | 123 (4.9%) |
| 40 to 44 Years | 74 (3.7%) | 134 (5.3%) |
| 45 to 49 Years | 149 (7.5%) | 172 (6.8%) |
| 50 to 54 Years | 204 (10.2%) | 235 (9.3%) |
| 55 to 59 Years | 276 (13.8%) | 197 (7.8%) |
| 60 to 64 Years | 46 (2.3%) | 139 (5.5%) |
| 65 to 69 Years | 67 (3.4%) | 69 (2.7%) |
| 70 to 74 Years | 86 (4.3%) | 128 (5.1%) |
| 75 to 79 Years | 142 (7.1%) | 176 (7.0%) |
| 80 to 84 Years | 135 (6.8%) | 207 (8.2%) |
| 85 Years and over | 140 (7.0%) | 98 (3.9%) |
| Total | 1,997 (100.0%) | 2,521 (100.0%) |
Families and Households in Lajas
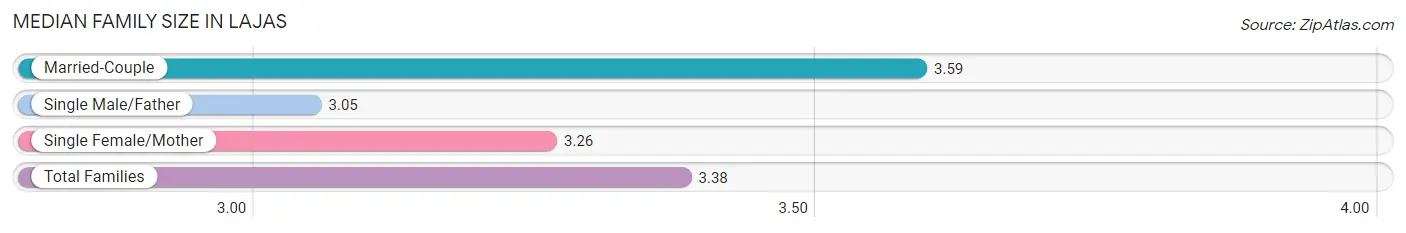
Median Family Size in Lajas
The median family size in Lajas is 3.38 persons per family, with married-couple families (503 | 49.3%) accounting for the largest median family size of 3.59 persons per family. On the other hand, single male/father families (182 | 17.8%) represent the smallest median family size with 3.05 persons per family.
| Family Type | # Families | Family Size |
| Married-Couple | 503 (49.3%) | 3.59 |
| Single Male/Father | 182 (17.8%) | 3.05 |
| Single Female/Mother | 336 (32.9%) | 3.26 |
| Total Families | 1,021 (100.0%) | 3.38 |
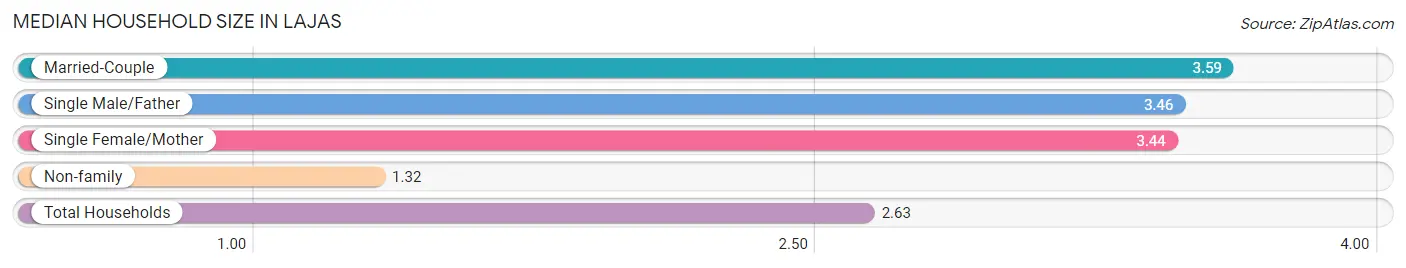
Median Household Size in Lajas
The median household size in Lajas is 2.63 persons per household, with married-couple households (503 | 29.4%) accounting for the largest median household size of 3.59 persons per household. non-family households (691 | 40.4%) represent the smallest median household size with 1.32 persons per household.
| Household Type | # Households | Household Size |
| Married-Couple | 503 (29.4%) | 3.59 |
| Single Male/Father | 182 (10.6%) | 3.46 |
| Single Female/Mother | 336 (19.6%) | 3.44 |
| Non-family | 691 (40.4%) | 1.32 |
| Total Households | 1,712 (100.0%) | 2.63 |
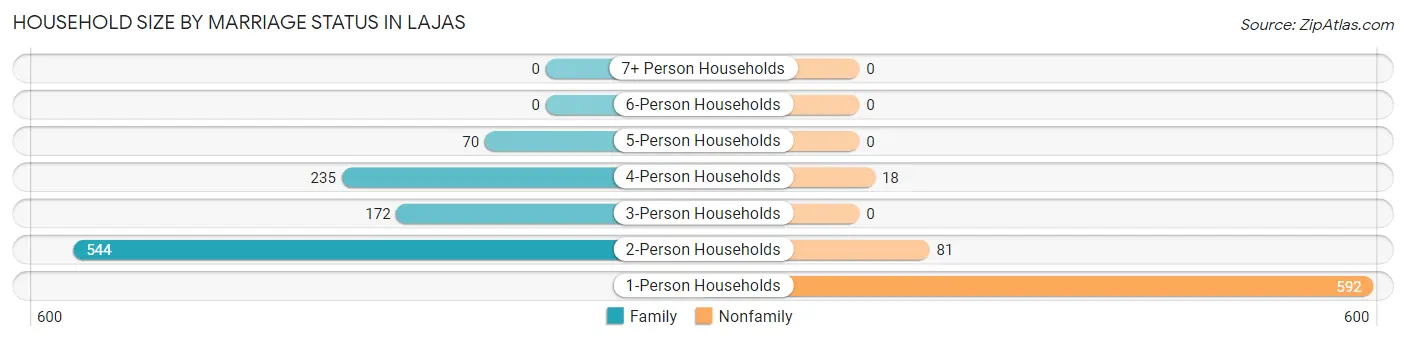
Household Size by Marriage Status in Lajas
Out of a total of 1,712 households in Lajas, 1,021 (59.6%) are family households, while 691 (40.4%) are nonfamily households. The most numerous type of family households are 2-person households, comprising 544, and the most common type of nonfamily households are 1-person households, comprising 592.
| Household Size | Family Households | Nonfamily Households |
| 1-Person Households | - | 592 (34.6%) |
| 2-Person Households | 544 (31.8%) | 81 (4.7%) |
| 3-Person Households | 172 (10.1%) | 0 (0.0%) |
| 4-Person Households | 235 (13.7%) | 18 (1.1%) |
| 5-Person Households | 70 (4.1%) | 0 (0.0%) |
| 6-Person Households | 0 (0.0%) | 0 (0.0%) |
| 7+ Person Households | 0 (0.0%) | 0 (0.0%) |
| Total | 1,021 (59.6%) | 691 (40.4%) |
Female Fertility in Lajas
Fertility by Age in Lajas
Average fertility rate in Lajas is 68.0 births per 1,000 women. Women in the age bracket of 20 to 34 years have the highest fertility rate with 189.0 births per 1,000 women. Women in the age bracket of 20 to 34 years acount for 100.0% of all women with births.
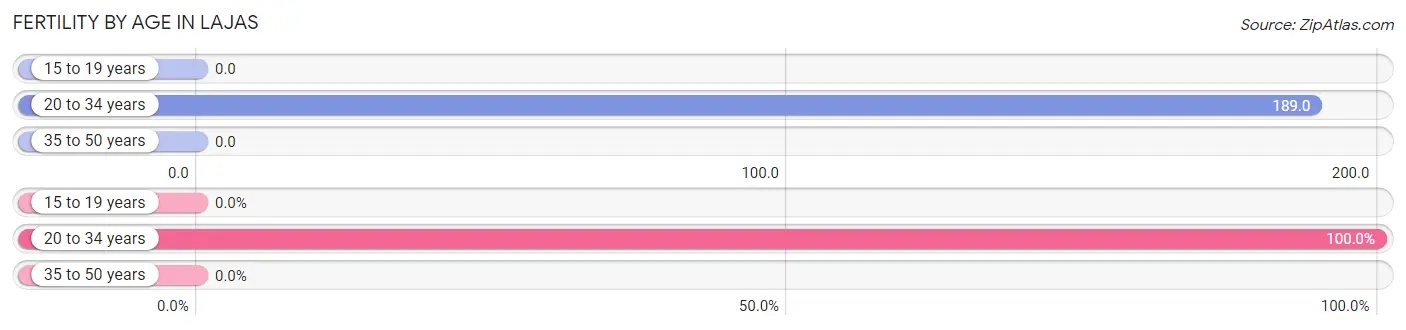
| Age Bracket | Women with Births | Births / 1,000 Women |
| 15 to 19 years | 0 (0.0%) | 0.0 |
| 20 to 34 years | 67 (100.0%) | 189.0 |
| 35 to 50 years | 0 (0.0%) | 0.0 |
| Total | 67 (100.0%) | 68.0 |
Fertility by Age by Marriage Status in Lajas
46.3% of women with births (67) in Lajas are married. The highest percentage of unmarried women with births falls into 20 to 34 years age bracket with 53.7% of them unmarried at the time of birth, while the lowest percentage of unmarried women with births belong to 20 to 34 years age bracket with 53.7% of them unmarried.
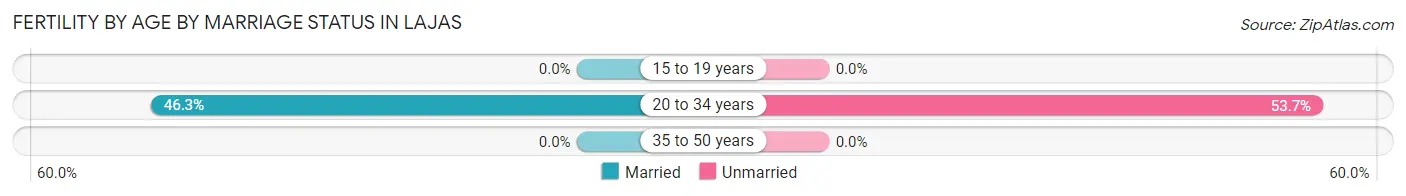
| Age Bracket | Married | Unmarried |
| 15 to 19 years | 0 (0.0%) | 0 (0.0%) |
| 20 to 34 years | 31 (46.3%) | 36 (53.7%) |
| 35 to 50 years | 0 (0.0%) | 0 (0.0%) |
| Total | 31 (46.3%) | 36 (53.7%) |
Fertility by Education in Lajas
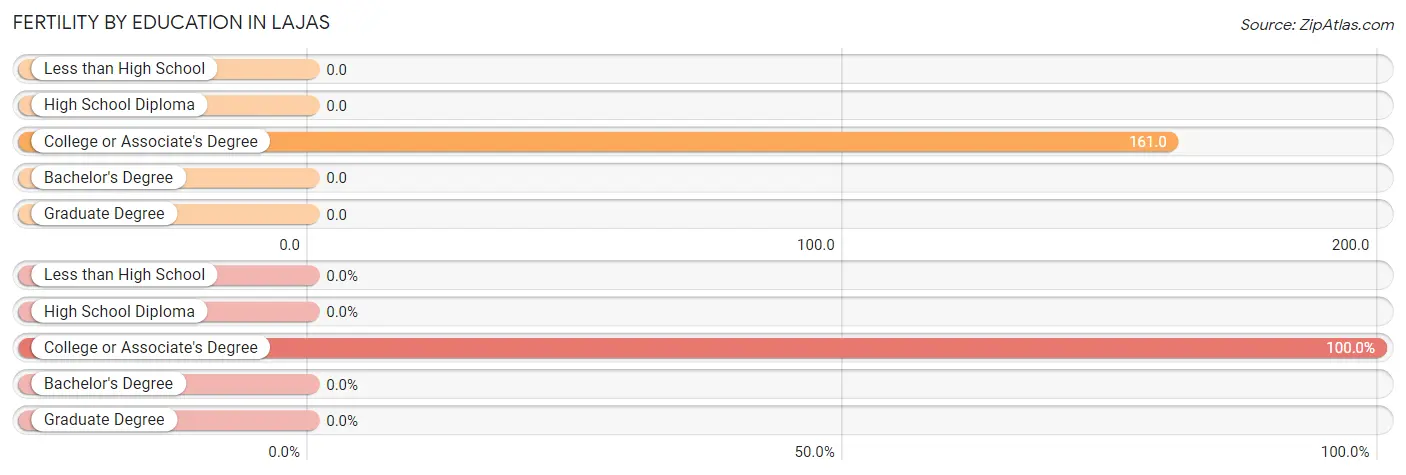
| Educational Attainment | Women with Births | Births / 1,000 Women |
| Less than High School | 0 (0.0%) | 0.0 |
| High School Diploma | 0 (0.0%) | 0.0 |
| College or Associate's Degree | 67 (100.0%) | 161.0 |
| Bachelor's Degree | 0 (0.0%) | 0.0 |
| Graduate Degree | 0 (0.0%) | 0.0 |
| Total | 67 (100.0%) | 68.0 |
Fertility by Education by Marriage Status in Lajas
53.7% of women with births in Lajas are unmarried. Women with the educational attainment of college or associate's degree are most likely to be married with 46.3% of them married at childbirth, while women with the educational attainment of college or associate's degree are least likely to be married with 53.7% of them unmarried at childbirth.
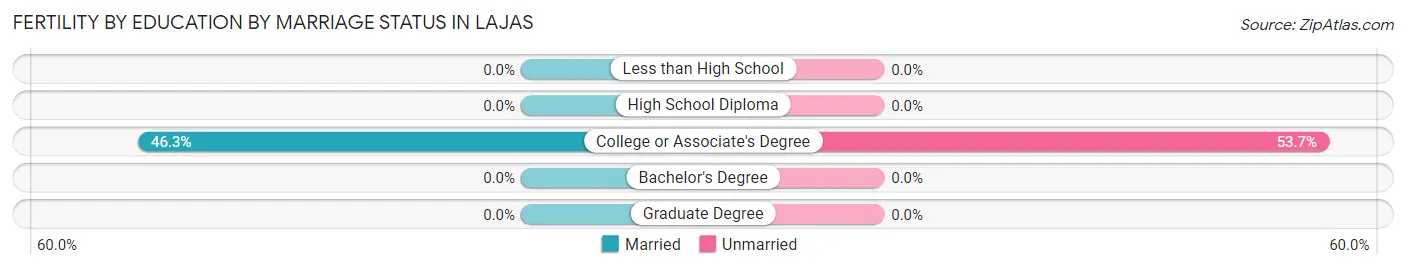
| Educational Attainment | Married | Unmarried |
| Less than High School | 0 (0.0%) | 0 (0.0%) |
| High School Diploma | 0 (0.0%) | 0 (0.0%) |
| College or Associate's Degree | 31 (46.3%) | 36 (53.7%) |
| Bachelor's Degree | 0 (0.0%) | 0 (0.0%) |
| Graduate Degree | 0 (0.0%) | 0 (0.0%) |
| Total | 31 (46.3%) | 36 (53.7%) |
Employment Characteristics in Lajas
Employment by Class of Employer in Lajas
Among the 1,402 employed individuals in Lajas, private company employees (721 | 51.4%), local government employees (222 | 15.8%), and state government employees (193 | 13.8%) make up the most common classes of employment.
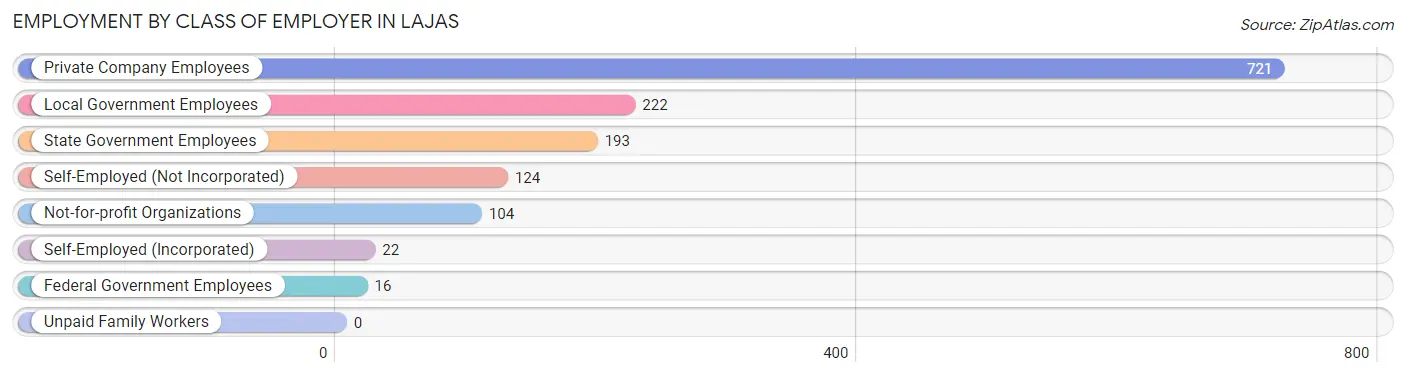
| Employer Class | # Employees | % Employees |
| Private Company Employees | 721 | 51.4% |
| Self-Employed (Incorporated) | 22 | 1.6% |
| Self-Employed (Not Incorporated) | 124 | 8.8% |
| Not-for-profit Organizations | 104 | 7.4% |
| Local Government Employees | 222 | 15.8% |
| State Government Employees | 193 | 13.8% |
| Federal Government Employees | 16 | 1.1% |
| Unpaid Family Workers | 0 | 0.0% |
| Total | 1,402 | 100.0% |
Employment Status by Age in Lajas
According to the labor force statistics for Lajas, out of the total population over 16 years of age (3,924), 45.5% or 1,785 individuals are in the labor force, with 19.5% or 348 of them unemployed. The age group with the highest labor force participation rate is 25 to 29 years, with 93.1% or 244 individuals in the labor force. Within the labor force, the 16 to 19 years age range has the highest percentage of unemployed individuals, with 100.0% or 16 of them being unemployed.
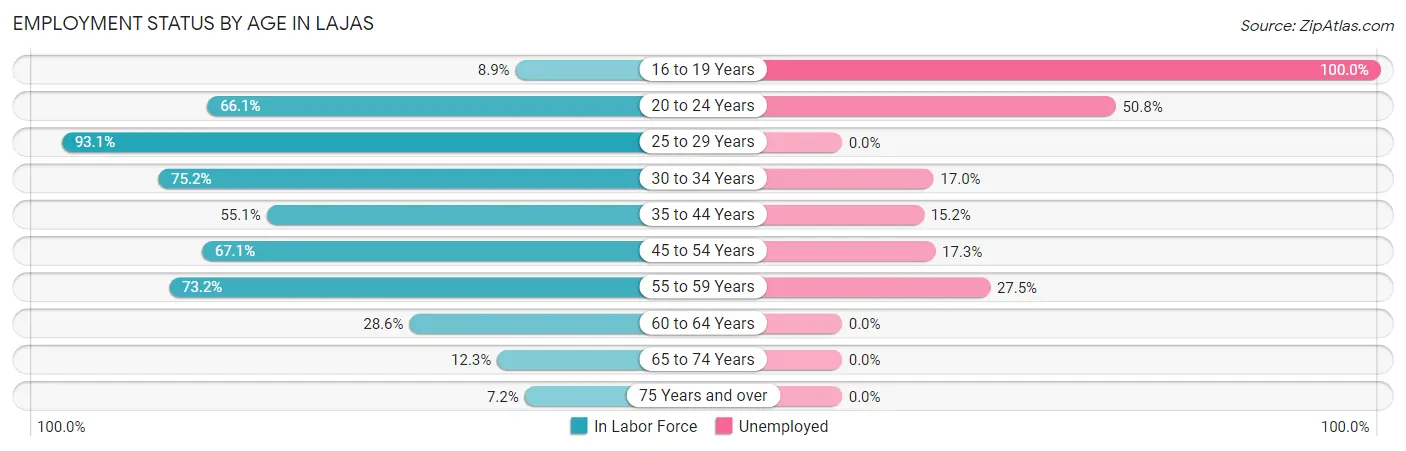
| Age Bracket | In Labor Force | Unemployed |
| 16 to 19 Years | 16 (8.9%) | 16 (100.0%) |
| 20 to 24 Years | 197 (66.1%) | 100 (50.8%) |
| 25 to 29 Years | 244 (93.1%) | 0 (0.0%) |
| 30 to 34 Years | 94 (75.2%) | 16 (17.0%) |
| 35 to 44 Years | 217 (55.1%) | 33 (15.2%) |
| 45 to 54 Years | 510 (67.1%) | 88 (17.3%) |
| 55 to 59 Years | 346 (73.2%) | 95 (27.5%) |
| 60 to 64 Years | 53 (28.6%) | 0 (0.0%) |
| 65 to 74 Years | 43 (12.3%) | 0 (0.0%) |
| 75 Years and over | 65 (7.2%) | 0 (0.0%) |
| Total | 1,785 (45.5%) | 348 (19.5%) |
Employment Status by Educational Attainment in Lajas
According to labor force statistics for Lajas, 66.6% of individuals (1,465) out of the total population between 25 and 64 years of age (2,199) are in the labor force, with 15.8% or 231 of them being unemployed. The group with the highest labor force participation rate are those with the educational attainment of bachelor's degree or higher, with 84.4% or 475 individuals in the labor force. Within the labor force, individuals with college / associate degree education have the highest percentage of unemployment, with 25.6% or 140 of them being unemployed.
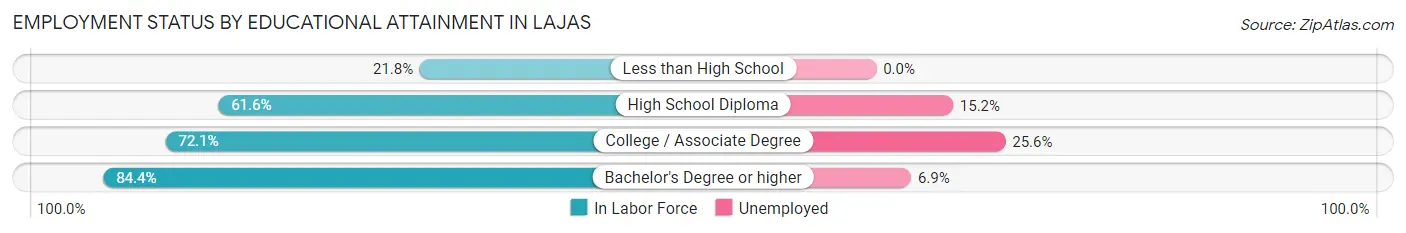
| Educational Attainment | In Labor Force | Unemployed |
| Less than High School | 54 (21.8%) | 0 (0.0%) |
| High School Diploma | 389 (61.6%) | 96 (15.2%) |
| College / Associate Degree | 546 (72.1%) | 194 (25.6%) |
| Bachelor's Degree or higher | 475 (84.4%) | 39 (6.9%) |
| Total | 1,465 (66.6%) | 347 (15.8%) |
Employment Occupations by Sex in Lajas
Management, Business, Science and Arts Occupations
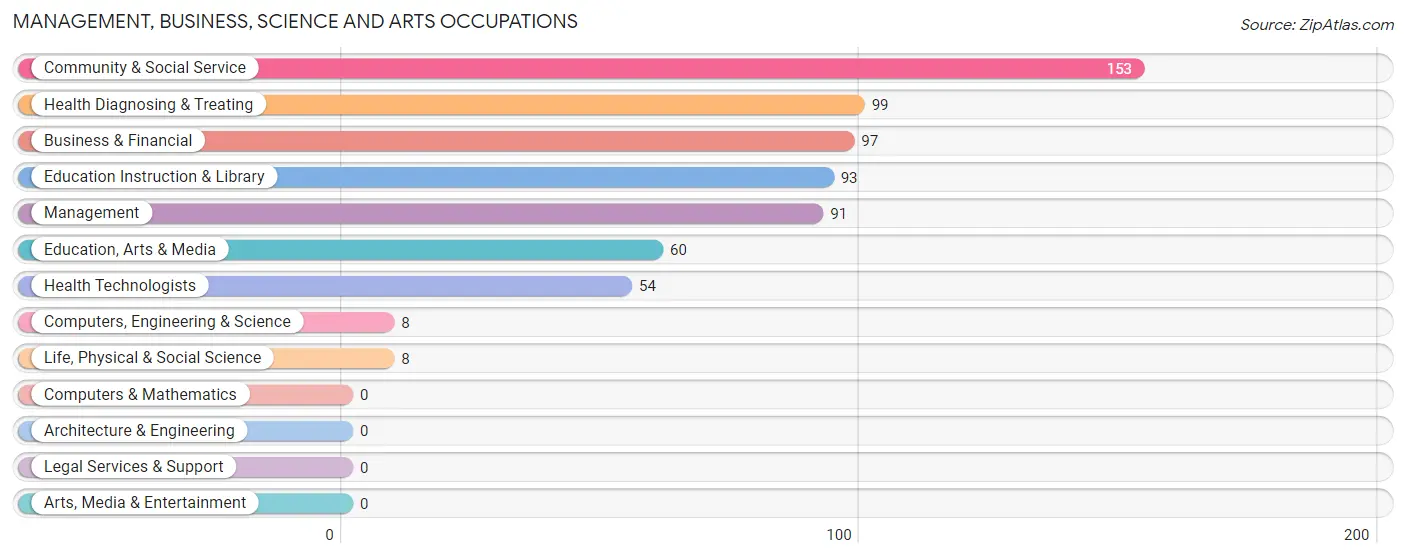
The most common Management, Business, Science and Arts occupations in Lajas are Community & Social Service (153 | 10.6%), Health Diagnosing & Treating (99 | 6.9%), Business & Financial (97 | 6.8%), Education Instruction & Library (93 | 6.5%), and Management (91 | 6.3%).
Management, Business, Science and Arts Occupations by Sex
Within the Management, Business, Science and Arts occupations in Lajas, the most male-oriented occupations are Computers, Engineering & Science (100.0%), Life, Physical & Social Science (100.0%), and Education, Arts & Media (100.0%), while the most female-oriented occupations are Health Technologists (100.0%), Business & Financial (87.6%), and Health Diagnosing & Treating (85.9%).
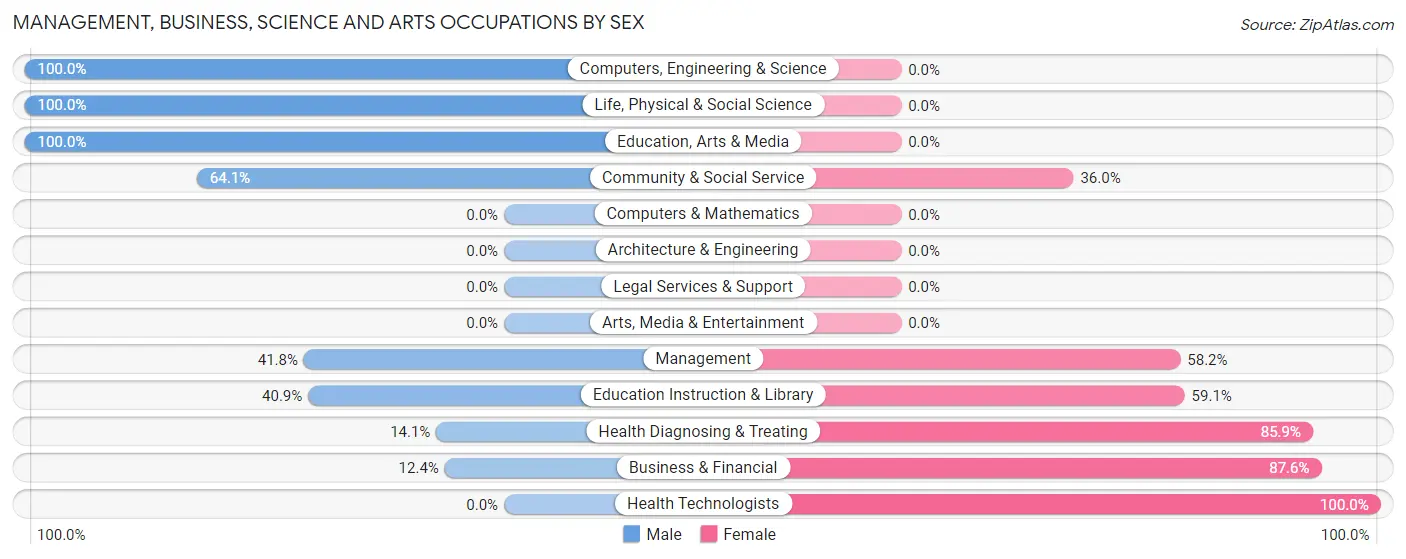
| Occupation | Male | Female |
| Management | 38 (41.8%) | 53 (58.2%) |
| Business & Financial | 12 (12.4%) | 85 (87.6%) |
| Computers, Engineering & Science | 8 (100.0%) | 0 (0.0%) |
| Computers & Mathematics | 0 (0.0%) | 0 (0.0%) |
| Architecture & Engineering | 0 (0.0%) | 0 (0.0%) |
| Life, Physical & Social Science | 8 (100.0%) | 0 (0.0%) |
| Community & Social Service | 98 (64.0%) | 55 (35.9%) |
| Education, Arts & Media | 60 (100.0%) | 0 (0.0%) |
| Legal Services & Support | 0 (0.0%) | 0 (0.0%) |
| Education Instruction & Library | 38 (40.9%) | 55 (59.1%) |
| Arts, Media & Entertainment | 0 (0.0%) | 0 (0.0%) |
| Health Diagnosing & Treating | 14 (14.1%) | 85 (85.9%) |
| Health Technologists | 0 (0.0%) | 54 (100.0%) |
| Total (Category) | 170 (38.0%) | 278 (62.1%) |
| Total (Overall) | 724 (50.4%) | 713 (49.6%) |
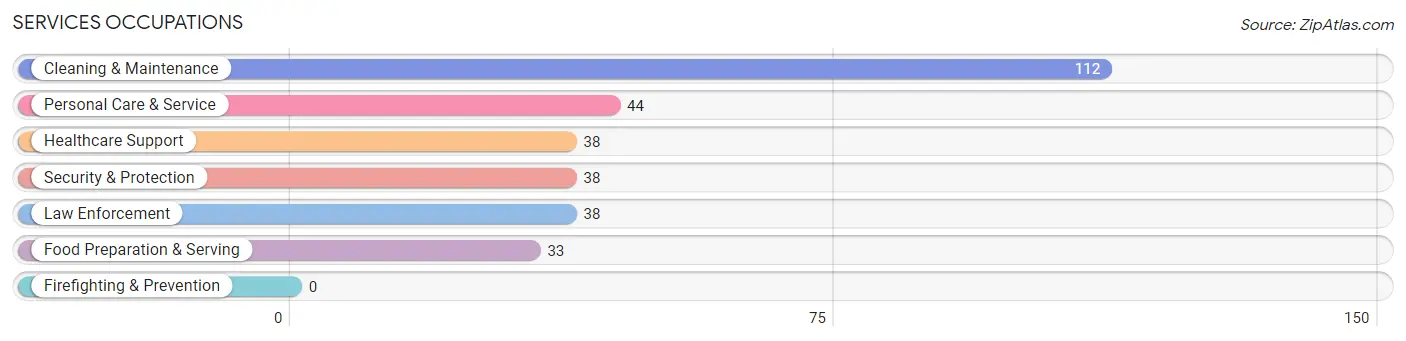
Services Occupations
The most common Services occupations in Lajas are Cleaning & Maintenance (112 | 7.8%), Personal Care & Service (44 | 3.1%), Healthcare Support (38 | 2.6%), Security & Protection (38 | 2.6%), and Law Enforcement (38 | 2.6%).
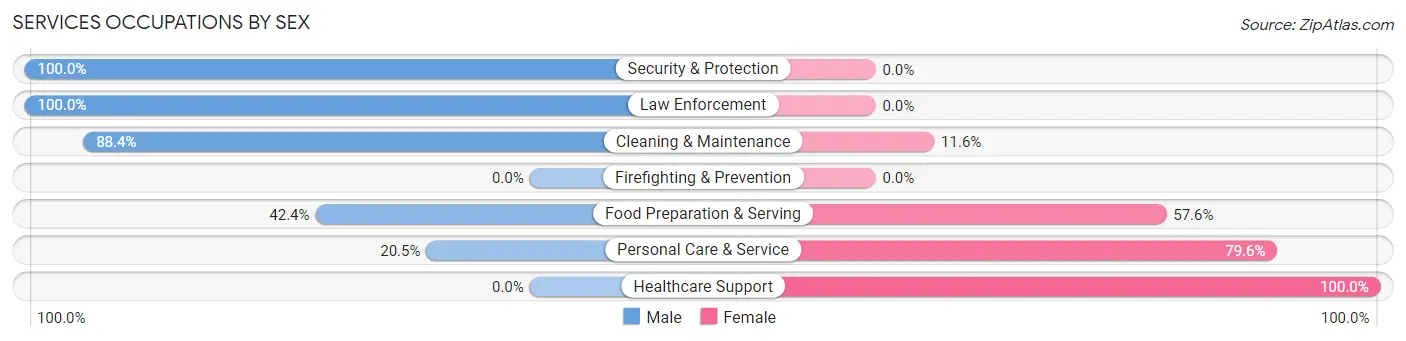
Services Occupations by Sex
Within the Services occupations in Lajas, the most male-oriented occupations are Security & Protection (100.0%), Law Enforcement (100.0%), and Cleaning & Maintenance (88.4%), while the most female-oriented occupations are Healthcare Support (100.0%), Personal Care & Service (79.5%), and Food Preparation & Serving (57.6%).
| Occupation | Male | Female |
| Healthcare Support | 0 (0.0%) | 38 (100.0%) |
| Security & Protection | 38 (100.0%) | 0 (0.0%) |
| Firefighting & Prevention | 0 (0.0%) | 0 (0.0%) |
| Law Enforcement | 38 (100.0%) | 0 (0.0%) |
| Food Preparation & Serving | 14 (42.4%) | 19 (57.6%) |
| Cleaning & Maintenance | 99 (88.4%) | 13 (11.6%) |
| Personal Care & Service | 9 (20.4%) | 35 (79.5%) |
| Total (Category) | 160 (60.4%) | 105 (39.6%) |
| Total (Overall) | 724 (50.4%) | 713 (49.6%) |
Sales and Office Occupations
The most common Sales and Office occupations in Lajas are Office & Administration (302 | 21.0%), and Sales & Related (192 | 13.4%).

Sales and Office Occupations by Sex

| Occupation | Male | Female |
| Sales & Related | 116 (60.4%) | 76 (39.6%) |
| Office & Administration | 112 (37.1%) | 190 (62.9%) |
| Total (Category) | 228 (46.2%) | 266 (53.8%) |
| Total (Overall) | 724 (50.4%) | 713 (49.6%) |
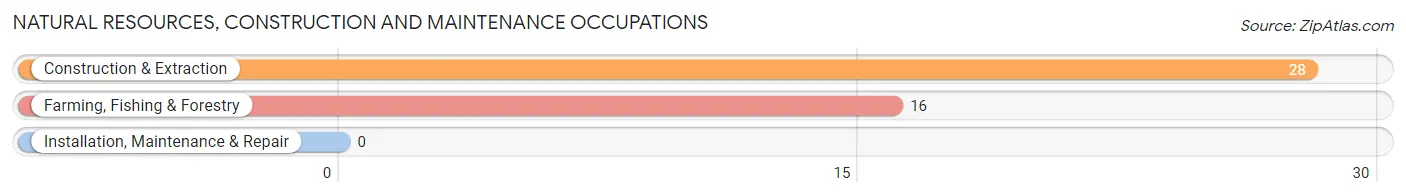
Natural Resources, Construction and Maintenance Occupations
The most common Natural Resources, Construction and Maintenance occupations in Lajas are Construction & Extraction (28 | 1.9%), and Farming, Fishing & Forestry (16 | 1.1%).
Natural Resources, Construction and Maintenance Occupations by Sex

| Occupation | Male | Female |
| Farming, Fishing & Forestry | 16 (100.0%) | 0 (0.0%) |
| Construction & Extraction | 28 (100.0%) | 0 (0.0%) |
| Installation, Maintenance & Repair | 0 (0.0%) | 0 (0.0%) |
| Total (Category) | 44 (100.0%) | 0 (0.0%) |
| Total (Overall) | 724 (50.4%) | 713 (49.6%) |
Production, Transportation and Moving Occupations
The most common Production, Transportation and Moving occupations in Lajas are Production (149 | 10.4%), Transportation (28 | 1.9%), and Material Moving (9 | 0.6%).

Production, Transportation and Moving Occupations by Sex
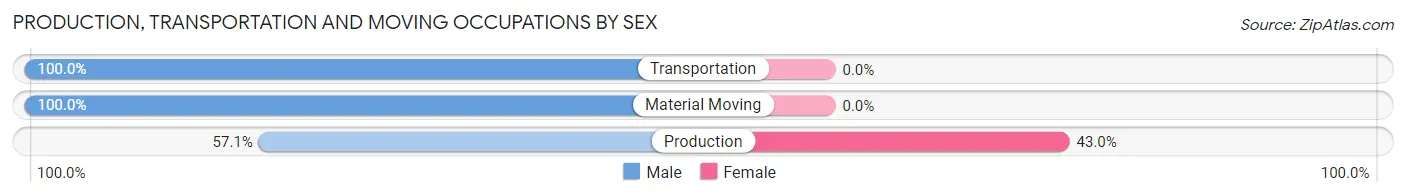
| Occupation | Male | Female |
| Production | 85 (57.1%) | 64 (42.9%) |
| Transportation | 28 (100.0%) | 0 (0.0%) |
| Material Moving | 9 (100.0%) | 0 (0.0%) |
| Total (Category) | 122 (65.6%) | 64 (34.4%) |
| Total (Overall) | 724 (50.4%) | 713 (49.6%) |
Employment Industries by Sex in Lajas
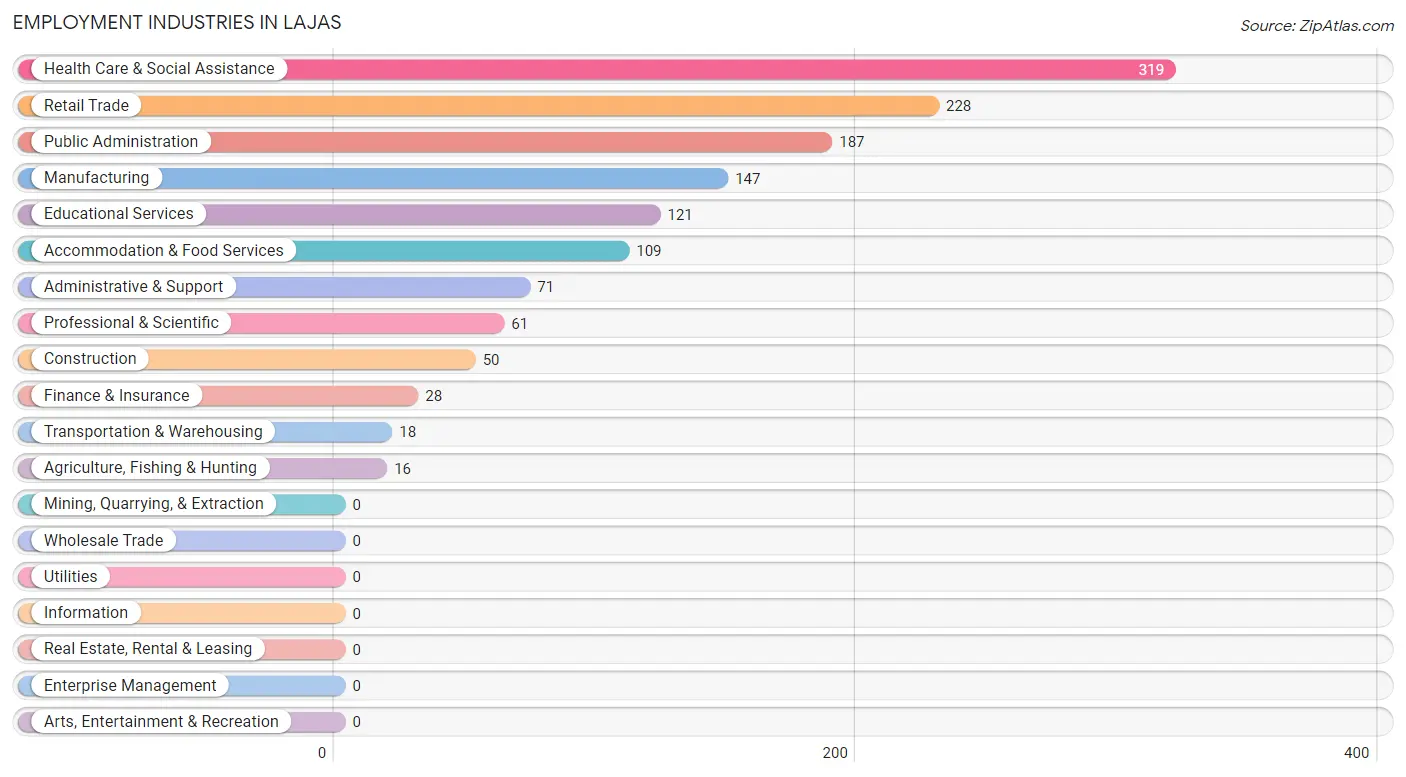
Employment Industries in Lajas
The major employment industries in Lajas include Health Care & Social Assistance (319 | 22.2%), Retail Trade (228 | 15.9%), Public Administration (187 | 13.0%), Manufacturing (147 | 10.2%), and Educational Services (121 | 8.4%).
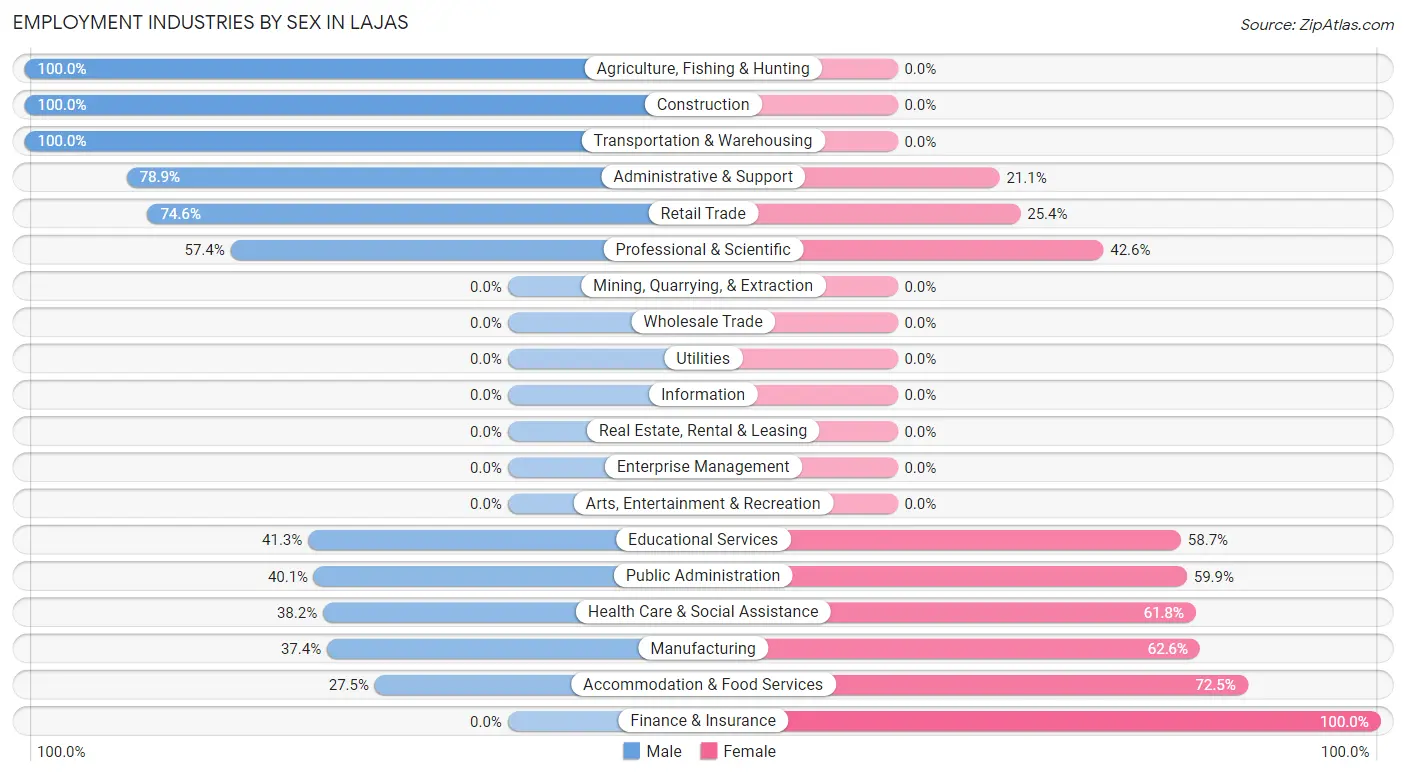
Employment Industries by Sex in Lajas
The Lajas industries that see more men than women are Agriculture, Fishing & Hunting (100.0%), Construction (100.0%), and Transportation & Warehousing (100.0%), whereas the industries that tend to have a higher number of women are Finance & Insurance (100.0%), Accommodation & Food Services (72.5%), and Manufacturing (62.6%).
| Industry | Male | Female |
| Agriculture, Fishing & Hunting | 16 (100.0%) | 0 (0.0%) |
| Mining, Quarrying, & Extraction | 0 (0.0%) | 0 (0.0%) |
| Construction | 50 (100.0%) | 0 (0.0%) |
| Manufacturing | 55 (37.4%) | 92 (62.6%) |
| Wholesale Trade | 0 (0.0%) | 0 (0.0%) |
| Retail Trade | 170 (74.6%) | 58 (25.4%) |
| Transportation & Warehousing | 18 (100.0%) | 0 (0.0%) |
| Utilities | 0 (0.0%) | 0 (0.0%) |
| Information | 0 (0.0%) | 0 (0.0%) |
| Finance & Insurance | 0 (0.0%) | 28 (100.0%) |
| Real Estate, Rental & Leasing | 0 (0.0%) | 0 (0.0%) |
| Professional & Scientific | 35 (57.4%) | 26 (42.6%) |
| Enterprise Management | 0 (0.0%) | 0 (0.0%) |
| Administrative & Support | 56 (78.9%) | 15 (21.1%) |
| Educational Services | 50 (41.3%) | 71 (58.7%) |
| Health Care & Social Assistance | 122 (38.2%) | 197 (61.8%) |
| Arts, Entertainment & Recreation | 0 (0.0%) | 0 (0.0%) |
| Accommodation & Food Services | 30 (27.5%) | 79 (72.5%) |
| Public Administration | 75 (40.1%) | 112 (59.9%) |
| Total | 724 (50.4%) | 713 (49.6%) |
Education in Lajas
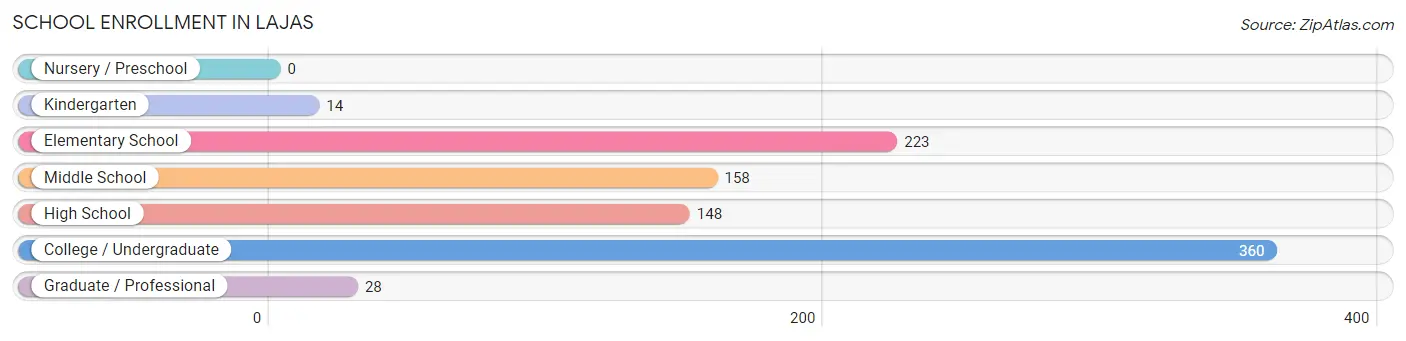
School Enrollment in Lajas
The most common levels of schooling among the 931 students in Lajas are college / undergraduate (360 | 38.7%), elementary school (223 | 23.9%), and middle school (158 | 17.0%).
| School Level | # Students | % Students |
| Nursery / Preschool | 0 | 0.0% |
| Kindergarten | 14 | 1.5% |
| Elementary School | 223 | 23.9% |
| Middle School | 158 | 17.0% |
| High School | 148 | 15.9% |
| College / Undergraduate | 360 | 38.7% |
| Graduate / Professional | 28 | 3.0% |
| Total | 931 | 100.0% |
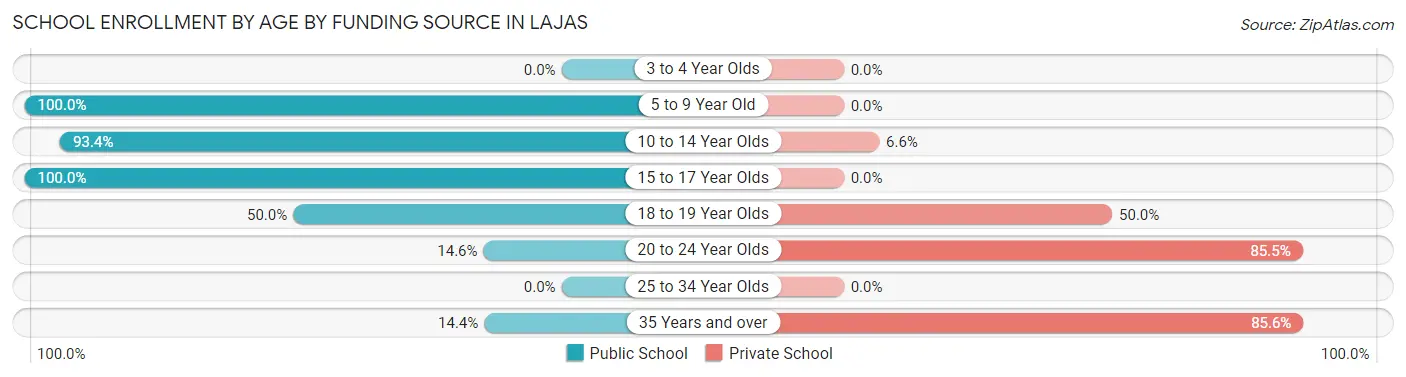
School Enrollment by Age by Funding Source in Lajas
Out of a total of 931 students who are enrolled in schools in Lajas, 324 (34.8%) attend a private institution, while the remaining 607 (65.2%) are enrolled in public schools. The age group of 35 years and over has the highest likelihood of being enrolled in private schools, with 95 (85.6% in the age bracket) enrolled. Conversely, the age group of 5 to 9 year old has the lowest likelihood of being enrolled in a private school, with 223 (100.0% in the age bracket) attending a public institution.
| Age Bracket | Public School | Private School |
| 3 to 4 Year Olds | 0 (0.0%) | 0 (0.0%) |
| 5 to 9 Year Old | 223 (100.0%) | 0 (0.0%) |
| 10 to 14 Year Olds | 198 (93.4%) | 14 (6.6%) |
| 15 to 17 Year Olds | 72 (100.0%) | 0 (0.0%) |
| 18 to 19 Year Olds | 74 (50.0%) | 74 (50.0%) |
| 20 to 24 Year Olds | 24 (14.5%) | 141 (85.5%) |
| 25 to 34 Year Olds | 0 (0.0%) | 0 (0.0%) |
| 35 Years and over | 16 (14.4%) | 95 (85.6%) |
| Total | 607 (65.2%) | 324 (34.8%) |
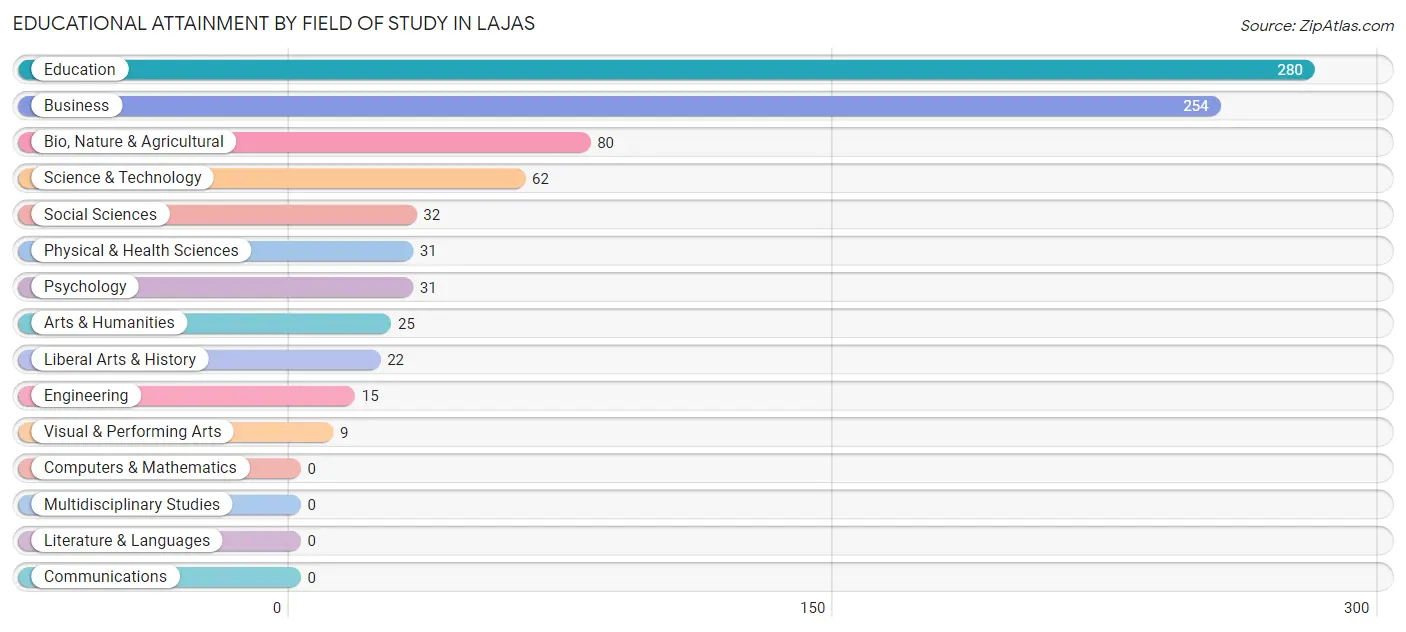
Educational Attainment by Field of Study in Lajas
Education (280 | 33.3%), business (254 | 30.2%), bio, nature & agricultural (80 | 9.5%), science & technology (62 | 7.4%), and social sciences (32 | 3.8%) are the most common fields of study among 841 individuals in Lajas who have obtained a bachelor's degree or higher.
| Field of Study | # Graduates | % Graduates |
| Computers & Mathematics | 0 | 0.0% |
| Bio, Nature & Agricultural | 80 | 9.5% |
| Physical & Health Sciences | 31 | 3.7% |
| Psychology | 31 | 3.7% |
| Social Sciences | 32 | 3.8% |
| Engineering | 15 | 1.8% |
| Multidisciplinary Studies | 0 | 0.0% |
| Science & Technology | 62 | 7.4% |
| Business | 254 | 30.2% |
| Education | 280 | 33.3% |
| Literature & Languages | 0 | 0.0% |
| Liberal Arts & History | 22 | 2.6% |
| Visual & Performing Arts | 9 | 1.1% |
| Communications | 0 | 0.0% |
| Arts & Humanities | 25 | 3.0% |
| Total | 841 | 100.0% |
Transportation & Commute in Lajas
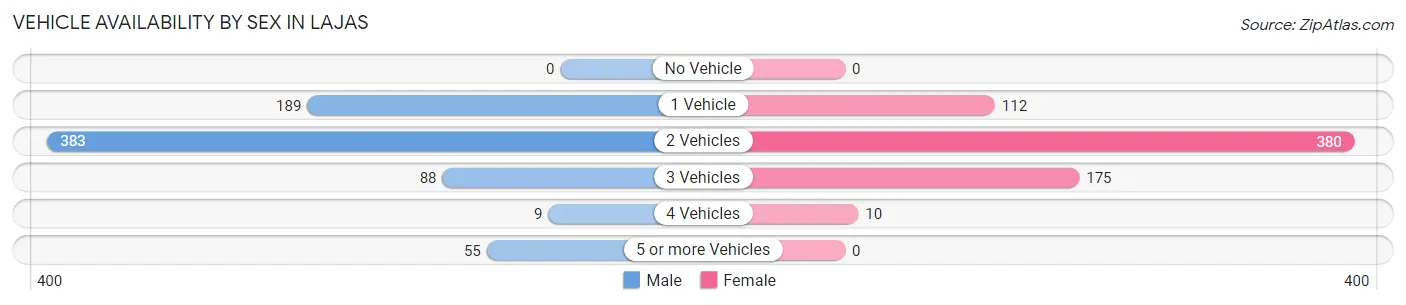
Vehicle Availability by Sex in Lajas
The most prevalent vehicle ownership categories in Lajas are males with 2 vehicles (383, accounting for 52.9%) and females with 2 vehicles (380, making up 56.6%).
| Vehicles Available | Male | Female |
| No Vehicle | 0 (0.0%) | 0 (0.0%) |
| 1 Vehicle | 189 (26.1%) | 112 (16.5%) |
| 2 Vehicles | 383 (52.9%) | 380 (56.1%) |
| 3 Vehicles | 88 (12.1%) | 175 (25.9%) |
| 4 Vehicles | 9 (1.2%) | 10 (1.5%) |
| 5 or more Vehicles | 55 (7.6%) | 0 (0.0%) |
| Total | 724 (100.0%) | 677 (100.0%) |
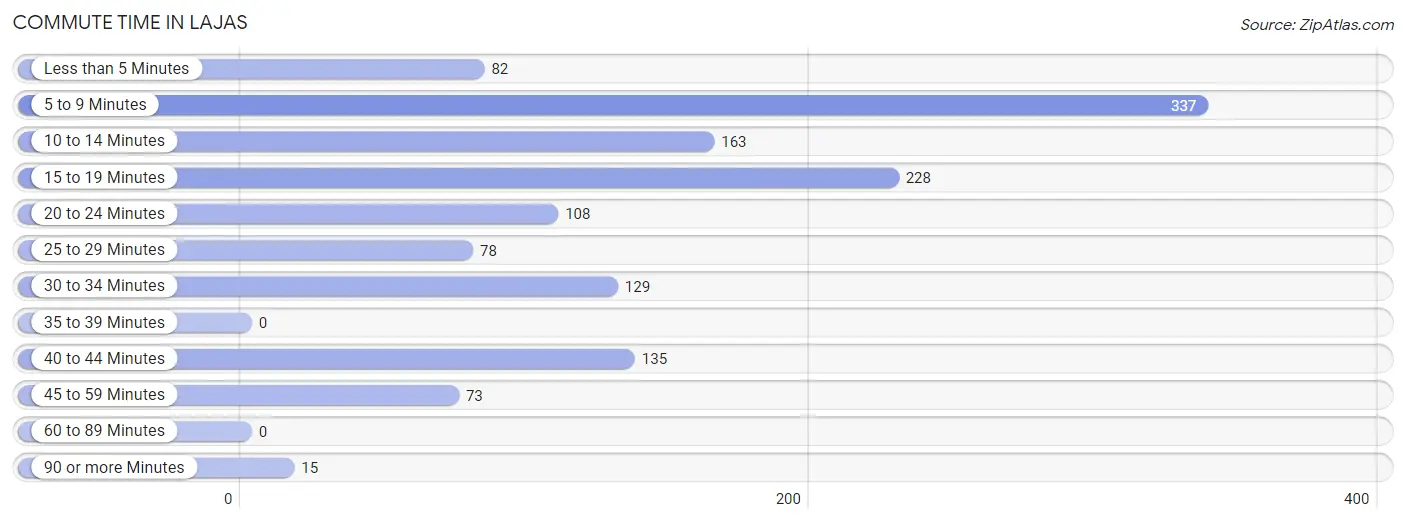
Commute Time in Lajas
The most frequently occuring commute durations in Lajas are 5 to 9 minutes (337 commuters, 25.0%), 15 to 19 minutes (228 commuters, 16.9%), and 10 to 14 minutes (163 commuters, 12.1%).
| Commute Time | # Commuters | % Commuters |
| Less than 5 Minutes | 82 | 6.1% |
| 5 to 9 Minutes | 337 | 25.0% |
| 10 to 14 Minutes | 163 | 12.1% |
| 15 to 19 Minutes | 228 | 16.9% |
| 20 to 24 Minutes | 108 | 8.0% |
| 25 to 29 Minutes | 78 | 5.8% |
| 30 to 34 Minutes | 129 | 9.6% |
| 35 to 39 Minutes | 0 | 0.0% |
| 40 to 44 Minutes | 135 | 10.0% |
| 45 to 59 Minutes | 73 | 5.4% |
| 60 to 89 Minutes | 0 | 0.0% |
| 90 or more Minutes | 15 | 1.1% |
Commute Time by Sex in Lajas
The most common commute times in Lajas are 5 to 9 minutes (250 commuters, 36.8%) for males and 10 to 14 minutes (163 commuters, 24.4%) for females.
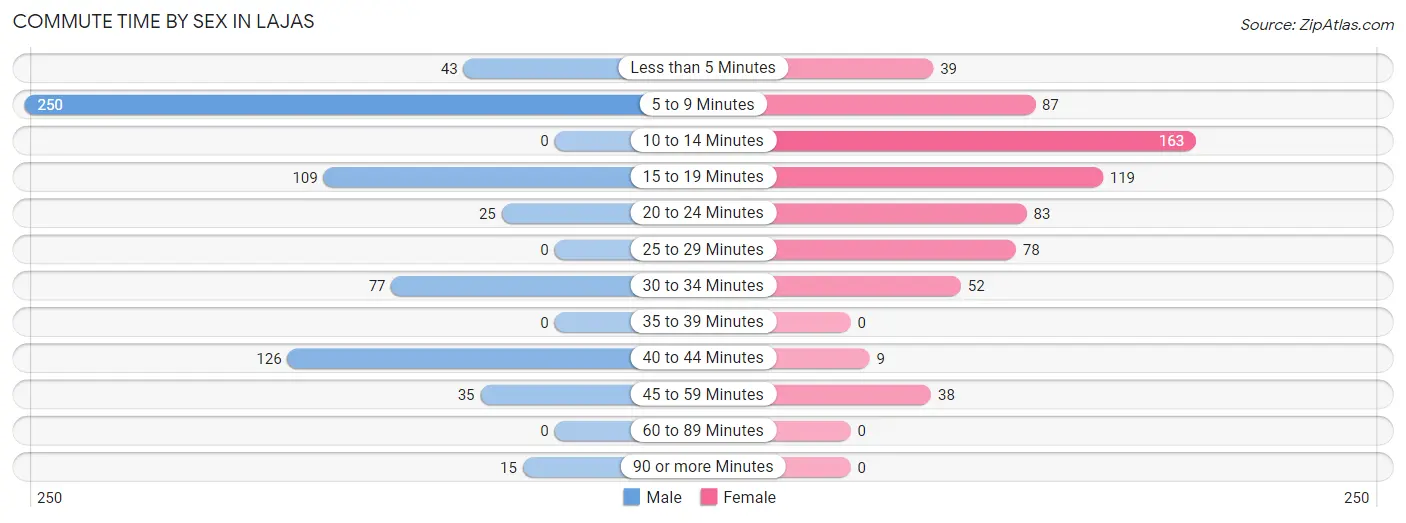
| Commute Time | Male | Female |
| Less than 5 Minutes | 43 (6.3%) | 39 (5.8%) |
| 5 to 9 Minutes | 250 (36.8%) | 87 (13.0%) |
| 10 to 14 Minutes | 0 (0.0%) | 163 (24.4%) |
| 15 to 19 Minutes | 109 (16.0%) | 119 (17.8%) |
| 20 to 24 Minutes | 25 (3.7%) | 83 (12.4%) |
| 25 to 29 Minutes | 0 (0.0%) | 78 (11.7%) |
| 30 to 34 Minutes | 77 (11.3%) | 52 (7.8%) |
| 35 to 39 Minutes | 0 (0.0%) | 0 (0.0%) |
| 40 to 44 Minutes | 126 (18.5%) | 9 (1.3%) |
| 45 to 59 Minutes | 35 (5.1%) | 38 (5.7%) |
| 60 to 89 Minutes | 0 (0.0%) | 0 (0.0%) |
| 90 or more Minutes | 15 (2.2%) | 0 (0.0%) |
Time of Departure to Work by Sex in Lajas
The most frequent times of departure to work in Lajas are 6:00 AM to 6:29 AM (188, 27.7%) for males and 9:00 AM to 9:59 AM (173, 25.9%) for females.
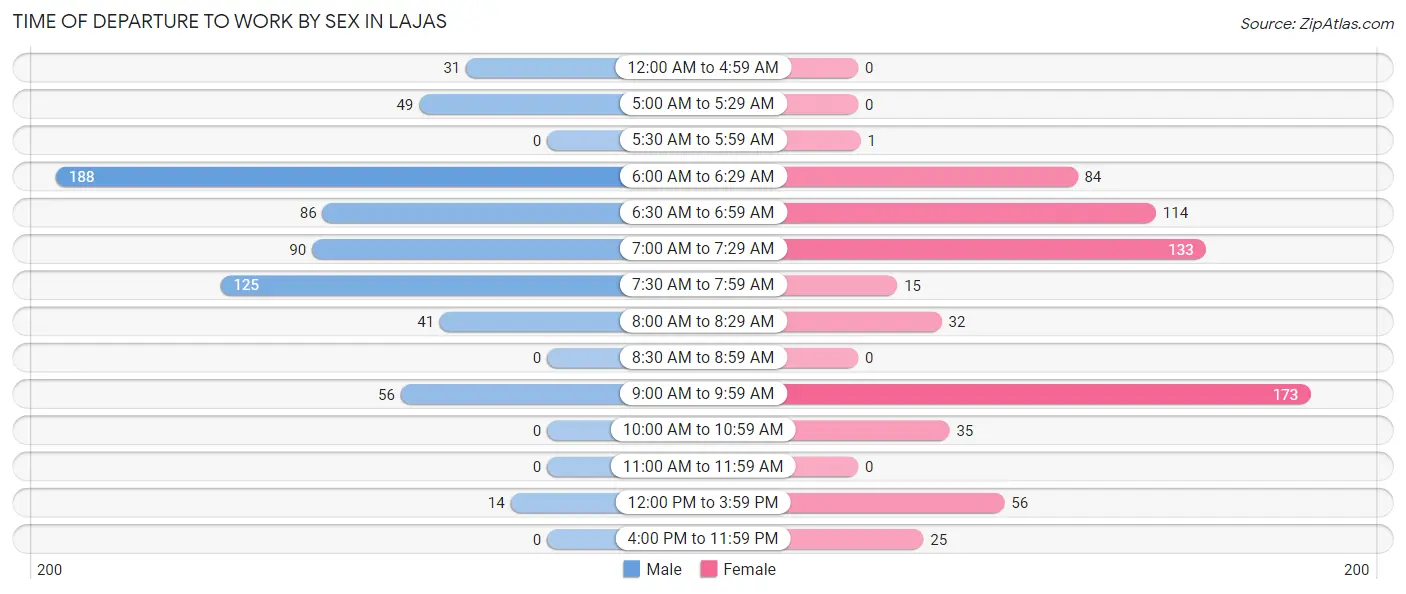
| Time of Departure | Male | Female |
| 12:00 AM to 4:59 AM | 31 (4.6%) | 0 (0.0%) |
| 5:00 AM to 5:29 AM | 49 (7.2%) | 0 (0.0%) |
| 5:30 AM to 5:59 AM | 0 (0.0%) | 1 (0.2%) |
| 6:00 AM to 6:29 AM | 188 (27.7%) | 84 (12.6%) |
| 6:30 AM to 6:59 AM | 86 (12.7%) | 114 (17.1%) |
| 7:00 AM to 7:29 AM | 90 (13.2%) | 133 (19.9%) |
| 7:30 AM to 7:59 AM | 125 (18.4%) | 15 (2.2%) |
| 8:00 AM to 8:29 AM | 41 (6.0%) | 32 (4.8%) |
| 8:30 AM to 8:59 AM | 0 (0.0%) | 0 (0.0%) |
| 9:00 AM to 9:59 AM | 56 (8.2%) | 173 (25.9%) |
| 10:00 AM to 10:59 AM | 0 (0.0%) | 35 (5.2%) |
| 11:00 AM to 11:59 AM | 0 (0.0%) | 0 (0.0%) |
| 12:00 PM to 3:59 PM | 14 (2.1%) | 56 (8.4%) |
| 4:00 PM to 11:59 PM | 0 (0.0%) | 25 (3.7%) |
| Total | 680 (100.0%) | 668 (100.0%) |
Housing Occupancy in Lajas
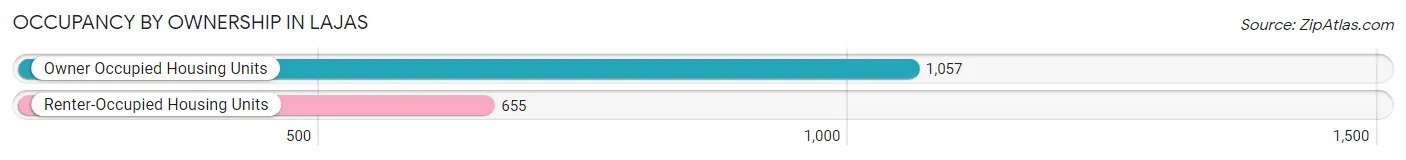
Occupancy by Ownership in Lajas
Of the total 1,712 dwellings in Lajas, owner-occupied units account for 1,057 (61.7%), while renter-occupied units make up 655 (38.3%).
| Occupancy | # Housing Units | % Housing Units |
| Owner Occupied Housing Units | 1,057 | 61.7% |
| Renter-Occupied Housing Units | 655 | 38.3% |
| Total Occupied Housing Units | 1,712 | 100.0% |
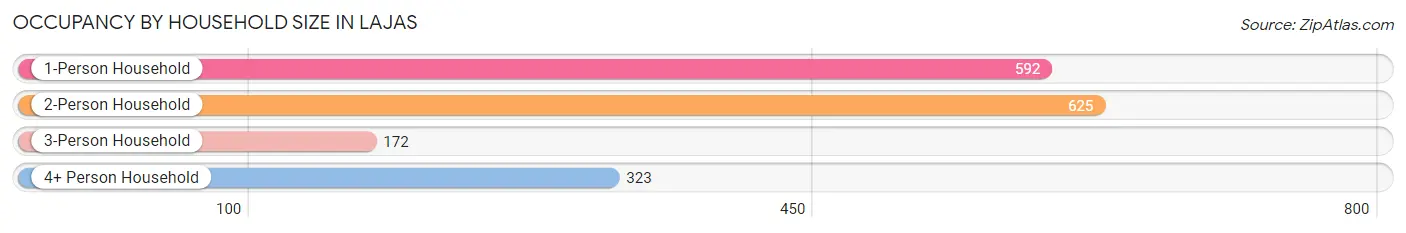
Occupancy by Household Size in Lajas
| Household Size | # Housing Units | % Housing Units |
| 1-Person Household | 592 | 34.6% |
| 2-Person Household | 625 | 36.5% |
| 3-Person Household | 172 | 10.1% |
| 4+ Person Household | 323 | 18.9% |
| Total Housing Units | 1,712 | 100.0% |
Occupancy by Ownership by Household Size in Lajas
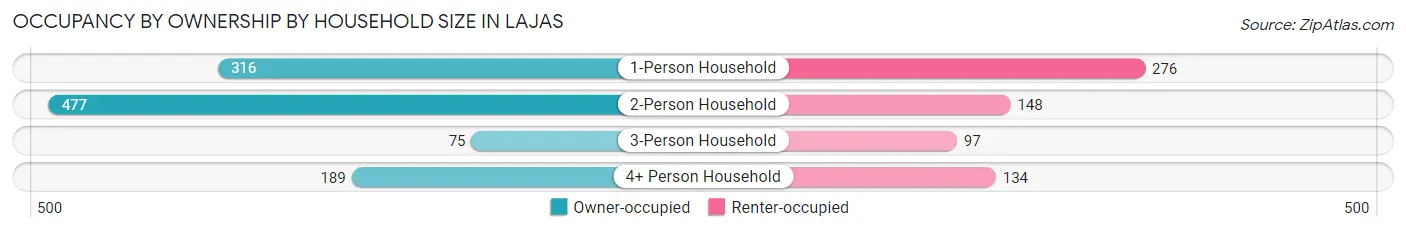
| Household Size | Owner-occupied | Renter-occupied |
| 1-Person Household | 316 (53.4%) | 276 (46.6%) |
| 2-Person Household | 477 (76.3%) | 148 (23.7%) |
| 3-Person Household | 75 (43.6%) | 97 (56.4%) |
| 4+ Person Household | 189 (58.5%) | 134 (41.5%) |
| Total Housing Units | 1,057 (61.7%) | 655 (38.3%) |
Occupancy by Educational Attainment in Lajas
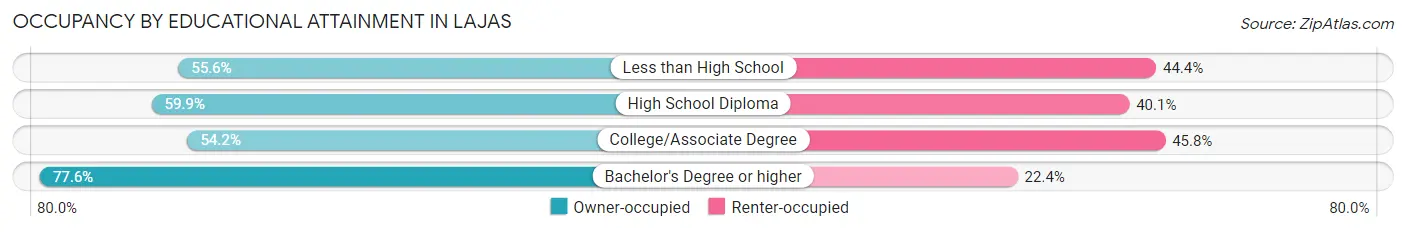
| Household Size | Owner-occupied | Renter-occupied |
| Less than High School | 104 (55.6%) | 83 (44.4%) |
| High School Diploma | 349 (59.9%) | 234 (40.1%) |
| College/Associate Degree | 293 (54.2%) | 248 (45.8%) |
| Bachelor's Degree or higher | 311 (77.6%) | 90 (22.4%) |
Occupancy by Age of Householder in Lajas
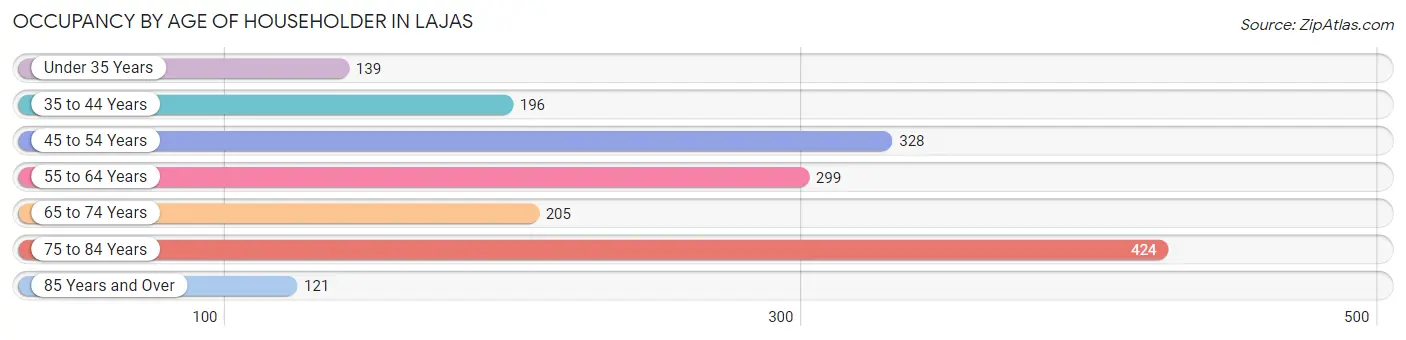
| Age Bracket | # Households | % Households |
| Under 35 Years | 139 | 8.1% |
| 35 to 44 Years | 196 | 11.5% |
| 45 to 54 Years | 328 | 19.2% |
| 55 to 64 Years | 299 | 17.5% |
| 65 to 74 Years | 205 | 12.0% |
| 75 to 84 Years | 424 | 24.8% |
| 85 Years and Over | 121 | 7.1% |
| Total | 1,712 | 100.0% |
Housing Finances in Lajas
Median Income by Occupancy in Lajas
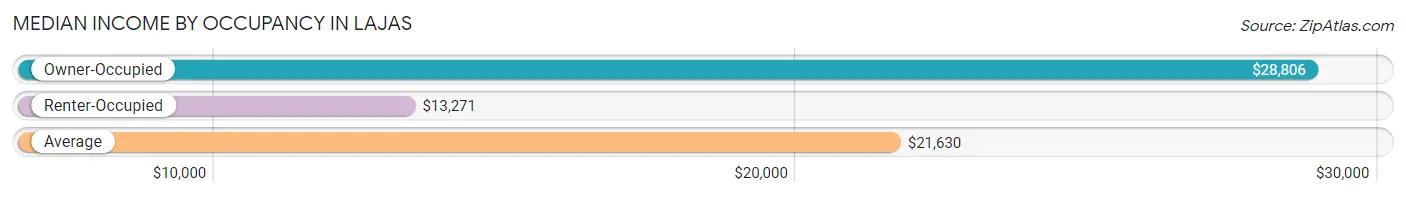
| Occupancy Type | # Households | Median Income |
| Owner-Occupied | 1,057 (61.7%) | $28,806 |
| Renter-Occupied | 655 (38.3%) | $13,271 |
| Average | 1,712 (100.0%) | $21,630 |
Occupancy by Householder Income Bracket in Lajas
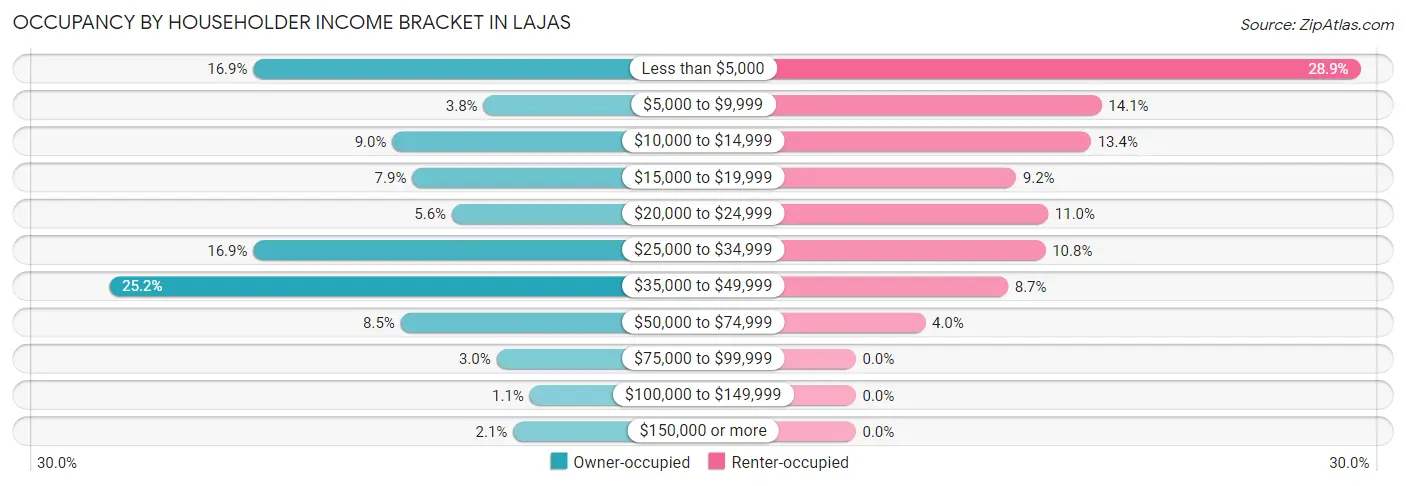
| Income Bracket | Owner-occupied | Renter-occupied |
| Less than $5,000 | 179 (16.9%) | 189 (28.8%) |
| $5,000 to $9,999 | 40 (3.8%) | 92 (14.1%) |
| $10,000 to $14,999 | 95 (9.0%) | 88 (13.4%) |
| $15,000 to $19,999 | 83 (7.9%) | 60 (9.2%) |
| $20,000 to $24,999 | 59 (5.6%) | 72 (11.0%) |
| $25,000 to $34,999 | 179 (16.9%) | 71 (10.8%) |
| $35,000 to $49,999 | 266 (25.2%) | 57 (8.7%) |
| $50,000 to $74,999 | 90 (8.5%) | 26 (4.0%) |
| $75,000 to $99,999 | 32 (3.0%) | 0 (0.0%) |
| $100,000 to $149,999 | 12 (1.1%) | 0 (0.0%) |
| $150,000 or more | 22 (2.1%) | 0 (0.0%) |
| Total | 1,057 (100.0%) | 655 (100.0%) |
Monthly Housing Cost Tiers in Lajas
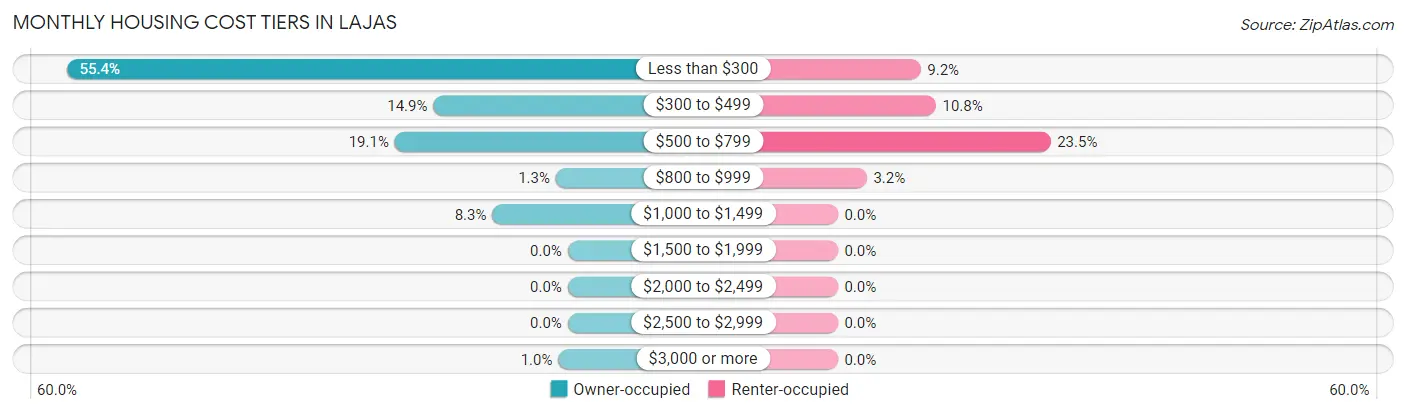
| Monthly Cost | Owner-occupied | Renter-occupied |
| Less than $300 | 585 (55.3%) | 60 (9.2%) |
| $300 to $499 | 157 (14.8%) | 71 (10.8%) |
| $500 to $799 | 202 (19.1%) | 154 (23.5%) |
| $800 to $999 | 14 (1.3%) | 21 (3.2%) |
| $1,000 to $1,499 | 88 (8.3%) | 0 (0.0%) |
| $1,500 to $1,999 | 0 (0.0%) | 0 (0.0%) |
| $2,000 to $2,499 | 0 (0.0%) | 0 (0.0%) |
| $2,500 to $2,999 | 0 (0.0%) | 0 (0.0%) |
| $3,000 or more | 11 (1.0%) | 0 (0.0%) |
| Total | 1,057 (100.0%) | 655 (100.0%) |
Physical Housing Characteristics in Lajas
Housing Structures in Lajas
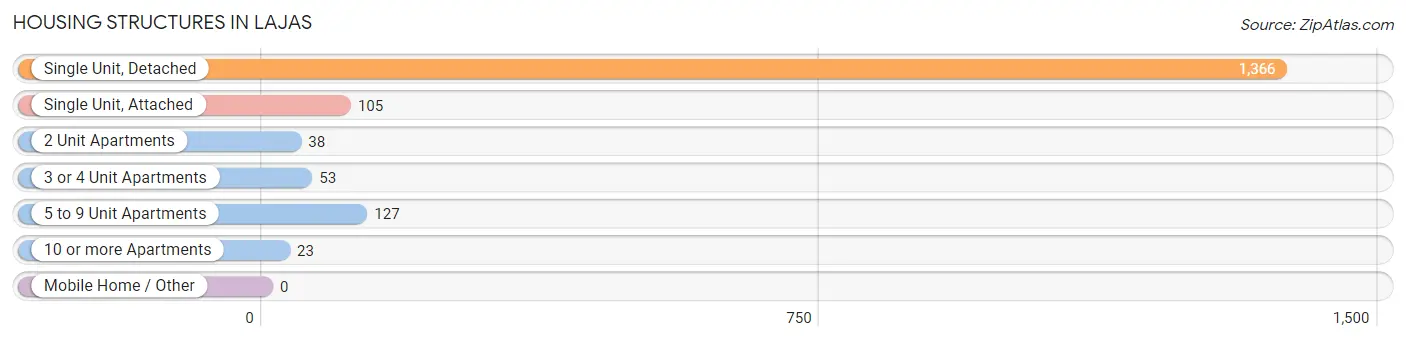
| Structure Type | # Housing Units | % Housing Units |
| Single Unit, Detached | 1,366 | 79.8% |
| Single Unit, Attached | 105 | 6.1% |
| 2 Unit Apartments | 38 | 2.2% |
| 3 or 4 Unit Apartments | 53 | 3.1% |
| 5 to 9 Unit Apartments | 127 | 7.4% |
| 10 or more Apartments | 23 | 1.3% |
| Mobile Home / Other | 0 | 0.0% |
| Total | 1,712 | 100.0% |
Housing Structures by Occupancy in Lajas
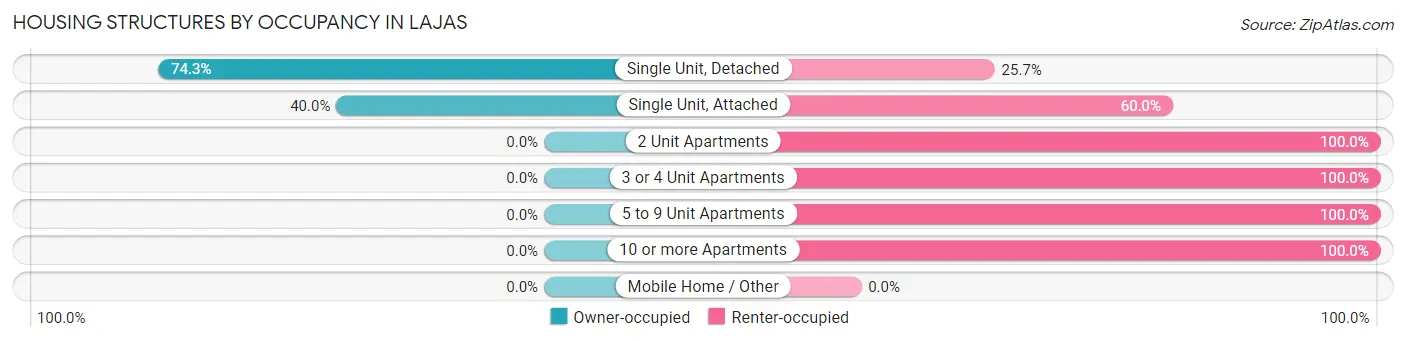
| Structure Type | Owner-occupied | Renter-occupied |
| Single Unit, Detached | 1,015 (74.3%) | 351 (25.7%) |
| Single Unit, Attached | 42 (40.0%) | 63 (60.0%) |
| 2 Unit Apartments | 0 (0.0%) | 38 (100.0%) |
| 3 or 4 Unit Apartments | 0 (0.0%) | 53 (100.0%) |
| 5 to 9 Unit Apartments | 0 (0.0%) | 127 (100.0%) |
| 10 or more Apartments | 0 (0.0%) | 23 (100.0%) |
| Mobile Home / Other | 0 (0.0%) | 0 (0.0%) |
| Total | 1,057 (61.7%) | 655 (38.3%) |
Housing Structures by Number of Rooms in Lajas
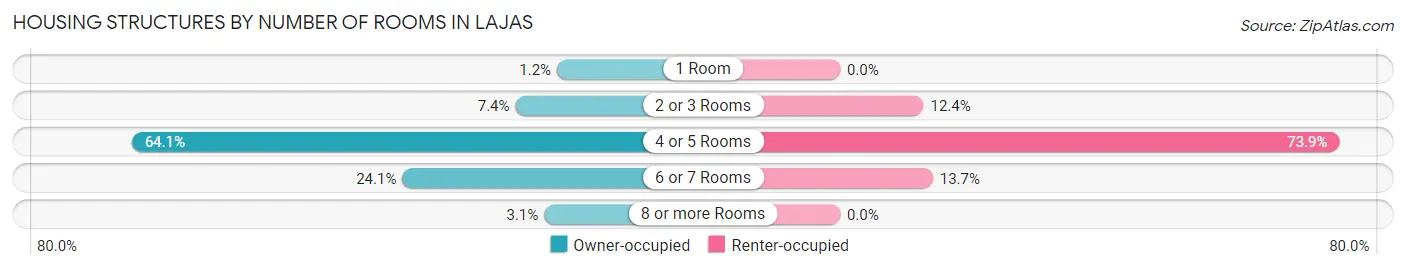
| Number of Rooms | Owner-occupied | Renter-occupied |
| 1 Room | 13 (1.2%) | 0 (0.0%) |
| 2 or 3 Rooms | 78 (7.4%) | 81 (12.4%) |
| 4 or 5 Rooms | 678 (64.1%) | 484 (73.9%) |
| 6 or 7 Rooms | 255 (24.1%) | 90 (13.7%) |
| 8 or more Rooms | 33 (3.1%) | 0 (0.0%) |
| Total | 1,057 (100.0%) | 655 (100.0%) |
Housing Structure by Heating Type in Lajas
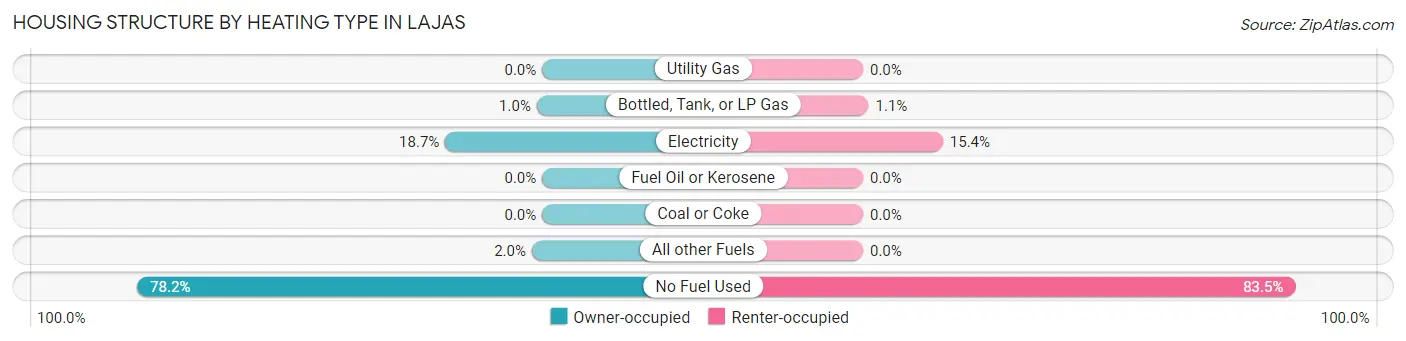
| Heating Type | Owner-occupied | Renter-occupied |
| Utility Gas | 0 (0.0%) | 0 (0.0%) |
| Bottled, Tank, or LP Gas | 11 (1.0%) | 7 (1.1%) |
| Electricity | 198 (18.7%) | 101 (15.4%) |
| Fuel Oil or Kerosene | 0 (0.0%) | 0 (0.0%) |
| Coal or Coke | 0 (0.0%) | 0 (0.0%) |
| All other Fuels | 21 (2.0%) | 0 (0.0%) |
| No Fuel Used | 827 (78.2%) | 547 (83.5%) |
| Total | 1,057 (100.0%) | 655 (100.0%) |
Household Vehicle Usage in Lajas
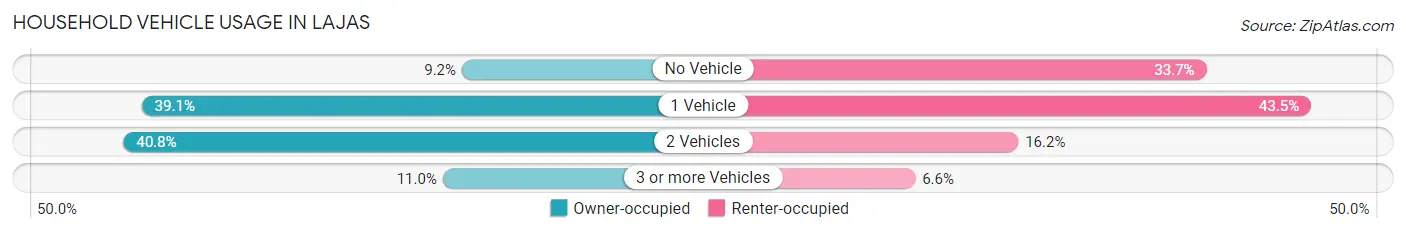
| Vehicles per Household | Owner-occupied | Renter-occupied |
| No Vehicle | 97 (9.2%) | 221 (33.7%) |
| 1 Vehicle | 413 (39.1%) | 285 (43.5%) |
| 2 Vehicles | 431 (40.8%) | 106 (16.2%) |
| 3 or more Vehicles | 116 (11.0%) | 43 (6.6%) |
| Total | 1,057 (100.0%) | 655 (100.0%) |
Real Estate & Mortgages in Lajas
Real Estate and Mortgage Overview in Lajas
| Characteristic | Without Mortgage | With Mortgage |
| Housing Units | 729 | 328 |
| Median Property Value | $109,500 | $115,000 |
| Median Household Income | $25,144 | $0 |
| Monthly Housing Costs | $146 | $0 |
| Real Estate Taxes | $1,000 | $308 |
Property Value by Mortgage Status in Lajas
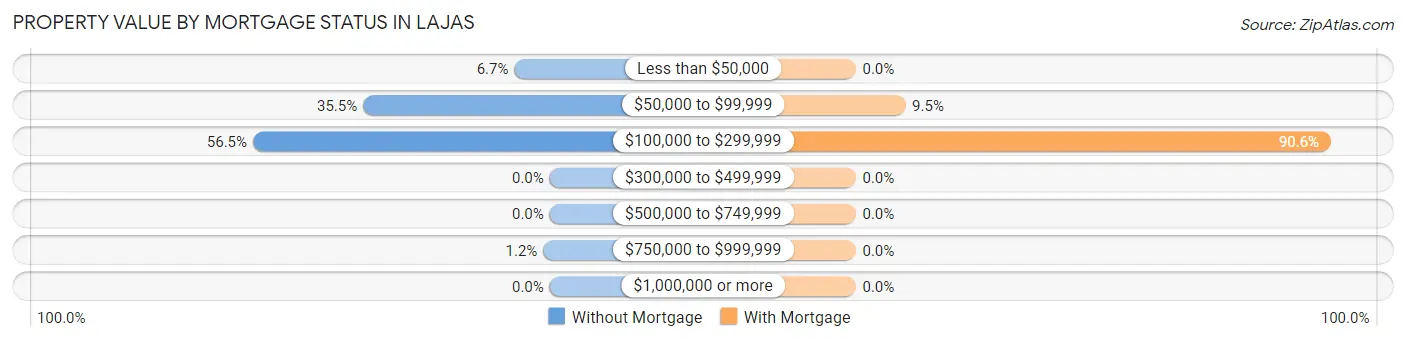
| Property Value | Without Mortgage | With Mortgage |
| Less than $50,000 | 49 (6.7%) | 0 (0.0%) |
| $50,000 to $99,999 | 259 (35.5%) | 31 (9.5%) |
| $100,000 to $299,999 | 412 (56.5%) | 297 (90.5%) |
| $300,000 to $499,999 | 0 (0.0%) | 0 (0.0%) |
| $500,000 to $749,999 | 0 (0.0%) | 0 (0.0%) |
| $750,000 to $999,999 | 9 (1.2%) | 0 (0.0%) |
| $1,000,000 or more | 0 (0.0%) | 0 (0.0%) |
| Total | 729 (100.0%) | 328 (100.0%) |
Household Income by Mortgage Status in Lajas
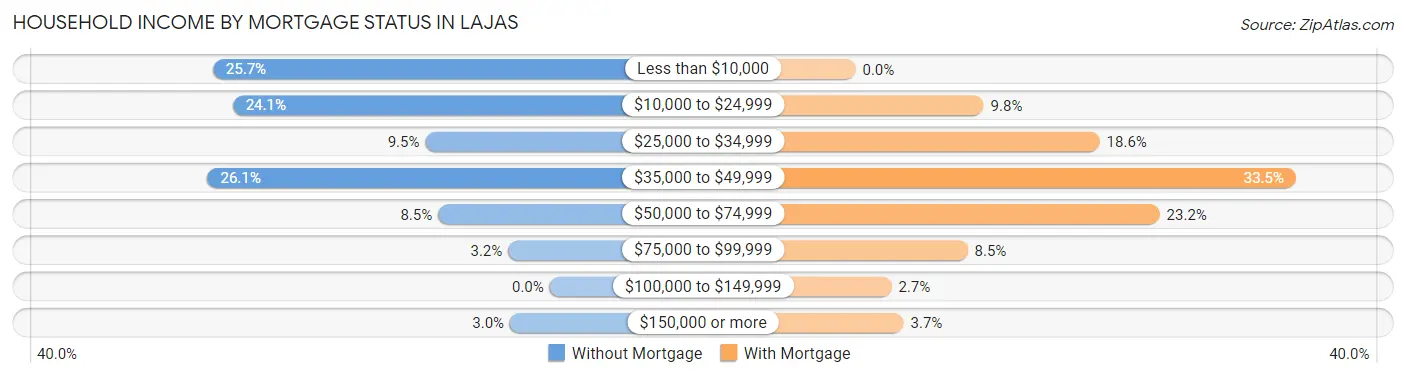
| Household Income | Without Mortgage | With Mortgage |
| Less than $10,000 | 187 (25.7%) | 0 (0.0%) |
| $10,000 to $24,999 | 176 (24.1%) | 32 (9.8%) |
| $25,000 to $34,999 | 69 (9.5%) | 61 (18.6%) |
| $35,000 to $49,999 | 190 (26.1%) | 110 (33.5%) |
| $50,000 to $74,999 | 62 (8.5%) | 76 (23.2%) |
| $75,000 to $99,999 | 23 (3.2%) | 28 (8.5%) |
| $100,000 to $149,999 | 0 (0.0%) | 9 (2.7%) |
| $150,000 or more | 22 (3.0%) | 12 (3.7%) |
| Total | 729 (100.0%) | 328 (100.0%) |
Property Value to Household Income Ratio in Lajas
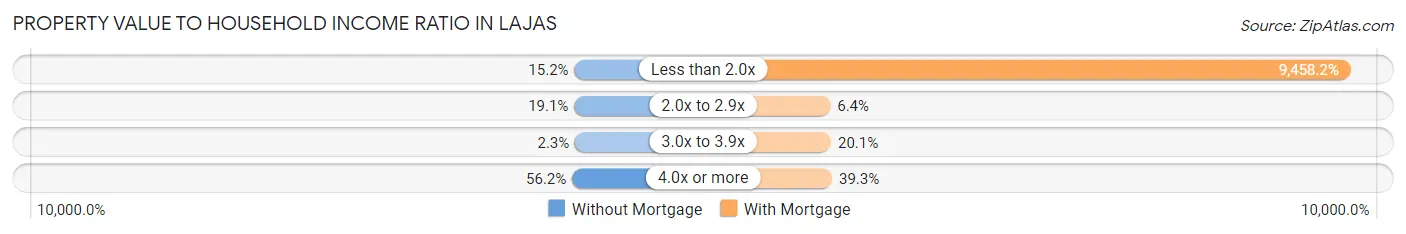
| Value-to-Income Ratio | Without Mortgage | With Mortgage |
| Less than 2.0x | 111 (15.2%) | 31,023 (9,458.2%) |
| 2.0x to 2.9x | 139 (19.1%) | 21 (6.4%) |
| 3.0x to 3.9x | 17 (2.3%) | 66 (20.1%) |
| 4.0x or more | 410 (56.2%) | 129 (39.3%) |
| Total | 729 (100.0%) | 328 (100.0%) |
Real Estate Taxes by Mortgage Status in Lajas
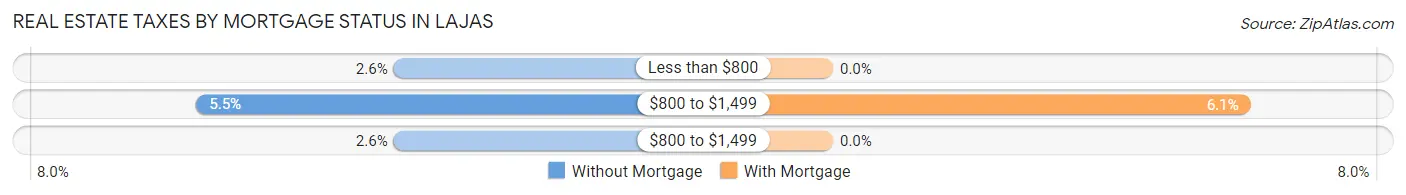
| Property Taxes | Without Mortgage | With Mortgage |
| Less than $800 | 19 (2.6%) | 0 (0.0%) |
| $800 to $1,499 | 40 (5.5%) | 20 (6.1%) |
| $800 to $1,499 | 19 (2.6%) | 0 (0.0%) |
| Total | 729 (100.0%) | 328 (100.0%) |
Health & Disability in Lajas
Health Insurance Coverage by Age in Lajas
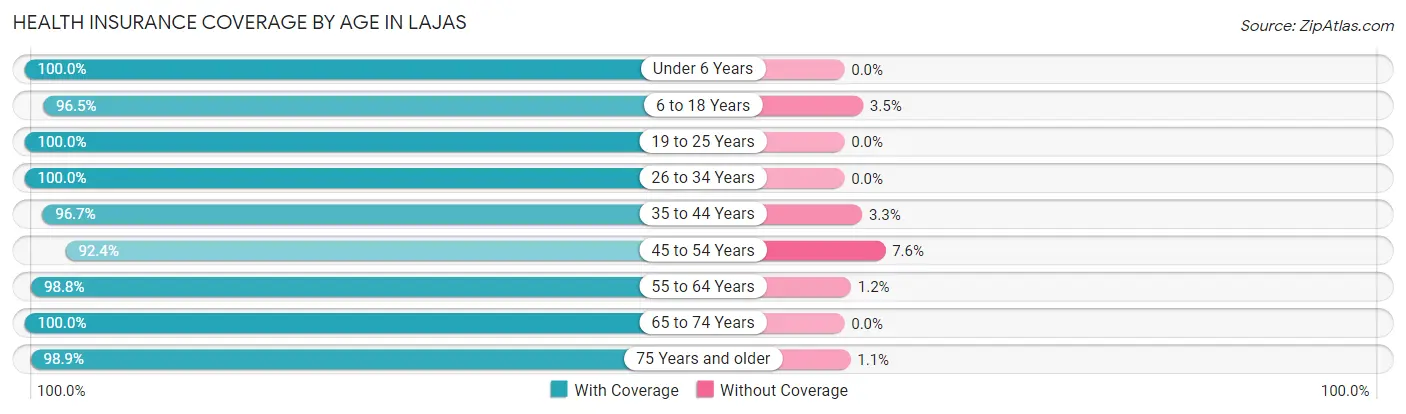
| Age Bracket | With Coverage | Without Coverage |
| Under 6 Years | 110 (100.0%) | 0 (0.0%) |
| 6 to 18 Years | 585 (96.5%) | 21 (3.5%) |
| 19 to 25 Years | 401 (100.0%) | 0 (0.0%) |
| 26 to 34 Years | 341 (100.0%) | 0 (0.0%) |
| 35 to 44 Years | 381 (96.7%) | 13 (3.3%) |
| 45 to 54 Years | 702 (92.4%) | 58 (7.6%) |
| 55 to 64 Years | 647 (98.8%) | 8 (1.2%) |
| 65 to 74 Years | 350 (100.0%) | 0 (0.0%) |
| 75 Years and older | 878 (98.9%) | 10 (1.1%) |
| Total | 4,395 (97.6%) | 110 (2.4%) |
Health Insurance Coverage by Citizenship Status in Lajas
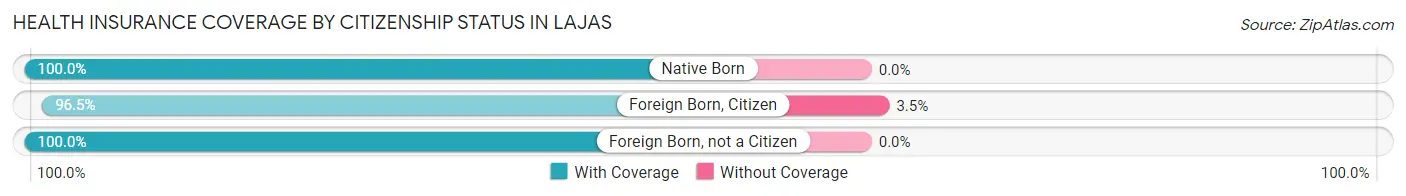
| Citizenship Status | With Coverage | Without Coverage |
| Native Born | 110 (100.0%) | 0 (0.0%) |
| Foreign Born, Citizen | 585 (96.5%) | 21 (3.5%) |
| Foreign Born, not a Citizen | 401 (100.0%) | 0 (0.0%) |
Health Insurance Coverage by Household Income in Lajas
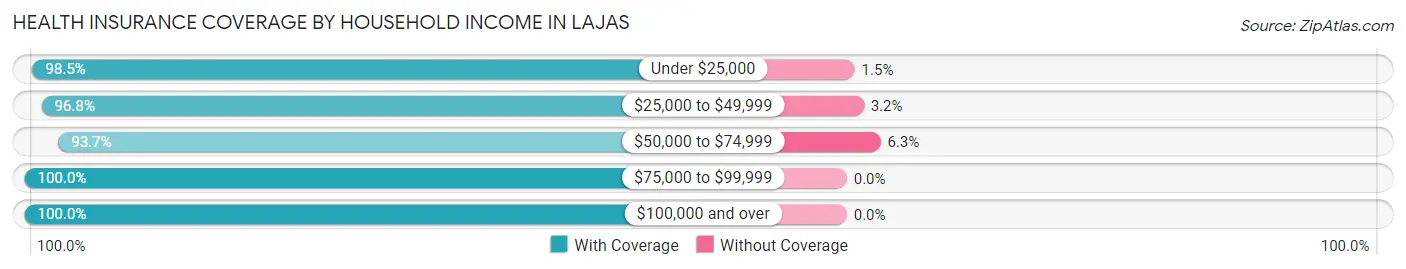
| Household Income | With Coverage | Without Coverage |
| Under $25,000 | 2,077 (98.5%) | 31 (1.5%) |
| $25,000 to $49,999 | 1,498 (96.8%) | 49 (3.2%) |
| $50,000 to $74,999 | 445 (93.7%) | 30 (6.3%) |
| $75,000 to $99,999 | 202 (100.0%) | 0 (0.0%) |
| $100,000 and over | 172 (100.0%) | 0 (0.0%) |
Public vs Private Health Insurance Coverage by Age in Lajas
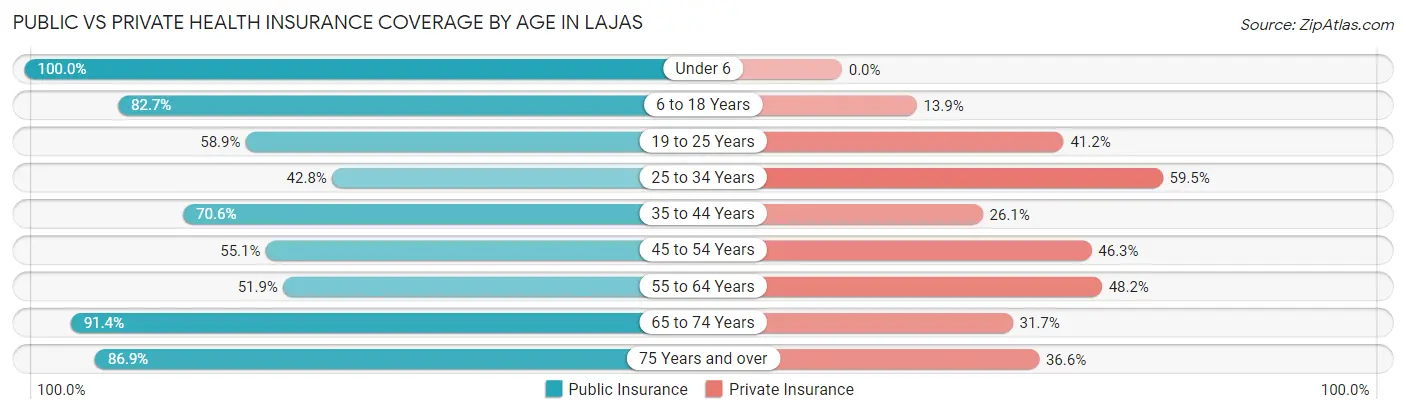
| Age Bracket | Public Insurance | Private Insurance |
| Under 6 | 110 (100.0%) | 0 (0.0%) |
| 6 to 18 Years | 501 (82.7%) | 84 (13.9%) |
| 19 to 25 Years | 236 (58.9%) | 165 (41.1%) |
| 25 to 34 Years | 146 (42.8%) | 203 (59.5%) |
| 35 to 44 Years | 278 (70.6%) | 103 (26.1%) |
| 45 to 54 Years | 419 (55.1%) | 352 (46.3%) |
| 55 to 64 Years | 340 (51.9%) | 316 (48.2%) |
| 65 to 74 Years | 320 (91.4%) | 111 (31.7%) |
| 75 Years and over | 772 (86.9%) | 325 (36.6%) |
| Total | 3,122 (69.3%) | 1,659 (36.8%) |
Disability Status by Sex by Age in Lajas
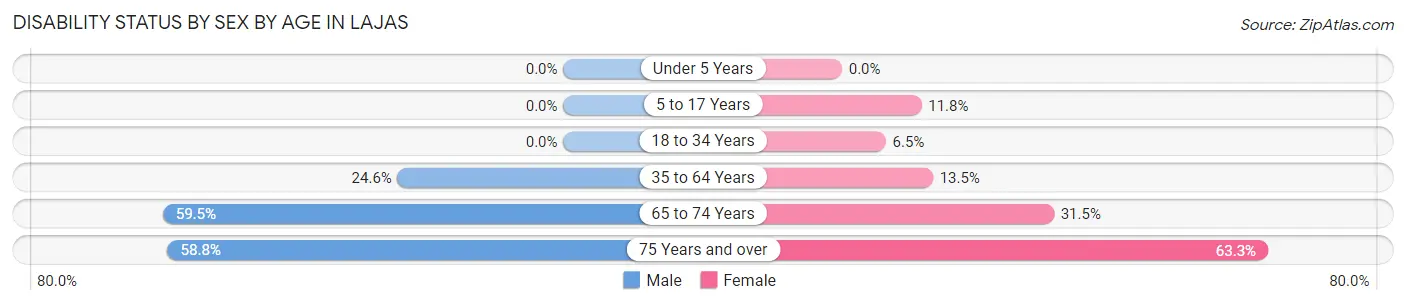
| Age Bracket | Male | Female |
| Under 5 Years | 0 (0.0%) | 0 (0.0%) |
| 5 to 17 Years | 0 (0.0%) | 38 (11.8%) |
| 18 to 34 Years | 0 (0.0%) | 29 (6.5%) |
| 35 to 64 Years | 199 (24.6%) | 135 (13.5%) |
| 65 to 74 Years | 91 (59.5%) | 62 (31.5%) |
| 75 Years and over | 245 (58.8%) | 298 (63.3%) |
Disability Class by Sex by Age in Lajas
Disability Class: Hearing Difficulty
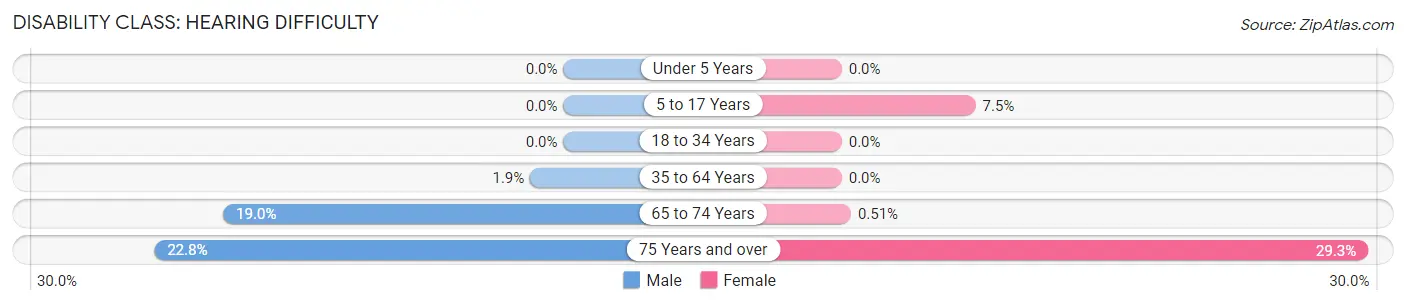
| Age Bracket | Male | Female |
| Under 5 Years | 0 (0.0%) | 0 (0.0%) |
| 5 to 17 Years | 0 (0.0%) | 24 (7.4%) |
| 18 to 34 Years | 0 (0.0%) | 0 (0.0%) |
| 35 to 64 Years | 15 (1.8%) | 0 (0.0%) |
| 65 to 74 Years | 29 (19.0%) | 1 (0.5%) |
| 75 Years and over | 95 (22.8%) | 138 (29.3%) |
Disability Class: Vision Difficulty
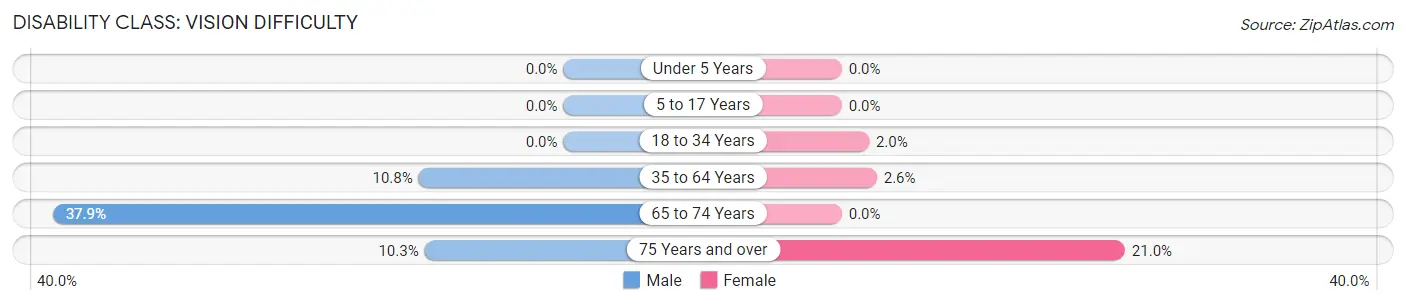
| Age Bracket | Male | Female |
| Under 5 Years | 0 (0.0%) | 0 (0.0%) |
| 5 to 17 Years | 0 (0.0%) | 0 (0.0%) |
| 18 to 34 Years | 0 (0.0%) | 9 (2.0%) |
| 35 to 64 Years | 87 (10.7%) | 26 (2.6%) |
| 65 to 74 Years | 58 (37.9%) | 0 (0.0%) |
| 75 Years and over | 43 (10.3%) | 99 (21.0%) |
Disability Class: Cognitive Difficulty
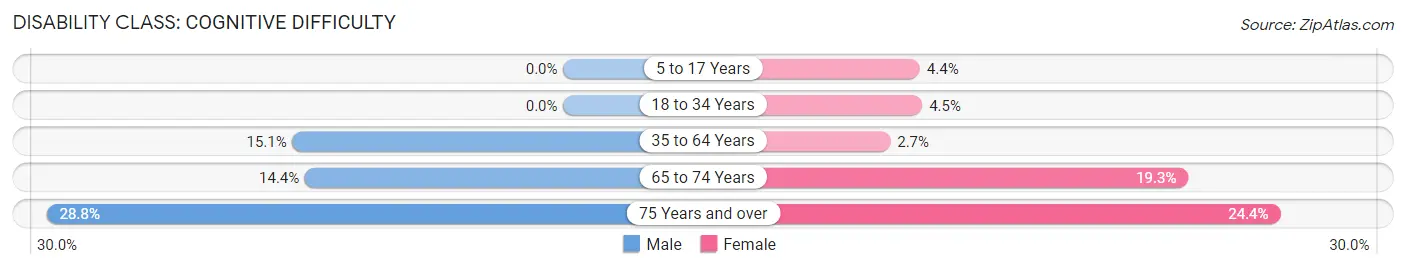
| Age Bracket | Male | Female |
| 5 to 17 Years | 0 (0.0%) | 14 (4.3%) |
| 18 to 34 Years | 0 (0.0%) | 20 (4.5%) |
| 35 to 64 Years | 122 (15.1%) | 27 (2.7%) |
| 65 to 74 Years | 22 (14.4%) | 38 (19.3%) |
| 75 Years and over | 120 (28.8%) | 115 (24.4%) |
Disability Class: Ambulatory Difficulty
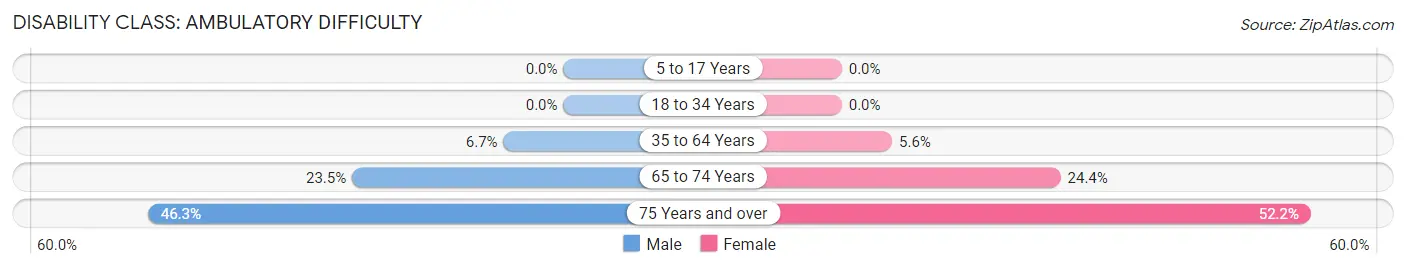
| Age Bracket | Male | Female |
| 5 to 17 Years | 0 (0.0%) | 0 (0.0%) |
| 18 to 34 Years | 0 (0.0%) | 0 (0.0%) |
| 35 to 64 Years | 54 (6.7%) | 56 (5.6%) |
| 65 to 74 Years | 36 (23.5%) | 48 (24.4%) |
| 75 Years and over | 193 (46.3%) | 246 (52.2%) |
Disability Class: Self-Care Difficulty
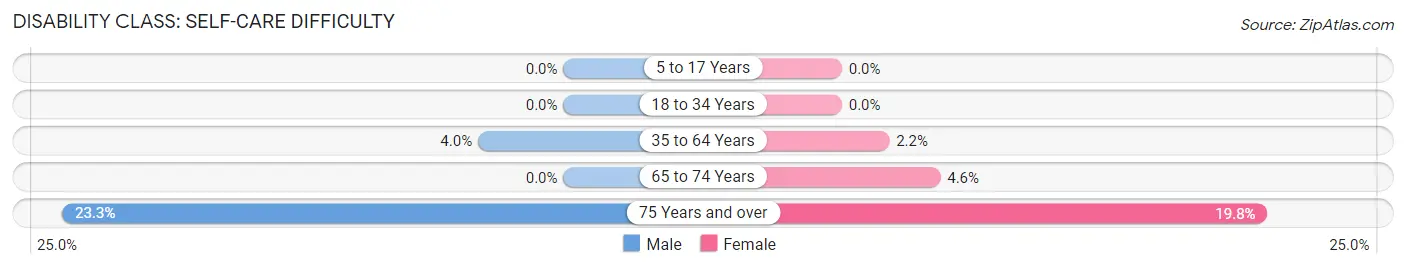
| Age Bracket | Male | Female |
| 5 to 17 Years | 0 (0.0%) | 0 (0.0%) |
| 18 to 34 Years | 0 (0.0%) | 0 (0.0%) |
| 35 to 64 Years | 32 (4.0%) | 22 (2.2%) |
| 65 to 74 Years | 0 (0.0%) | 9 (4.6%) |
| 75 Years and over | 97 (23.3%) | 93 (19.8%) |
Technology Access in Lajas
Computing Device Access in Lajas
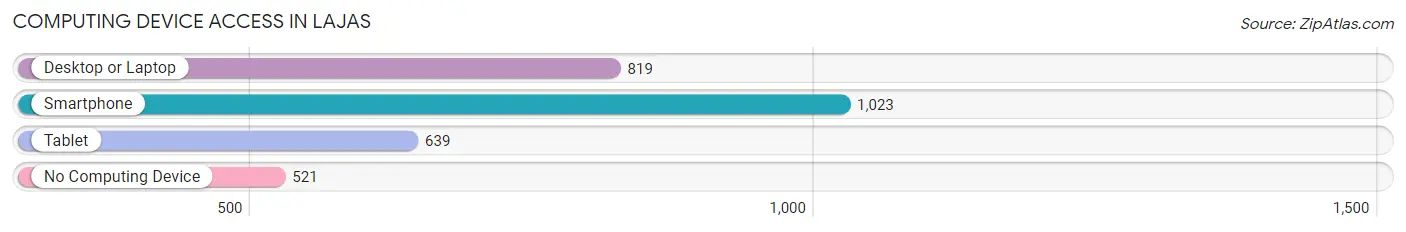
| Device Type | # Households | % Households |
| Desktop or Laptop | 819 | 47.8% |
| Smartphone | 1,023 | 59.8% |
| Tablet | 639 | 37.3% |
| No Computing Device | 521 | 30.4% |
| Total | 1,712 | 100.0% |
Internet Access in Lajas
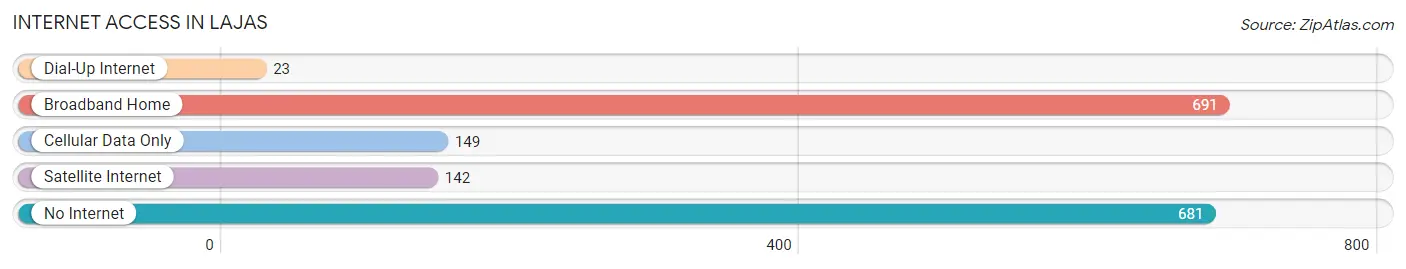
| Internet Type | # Households | % Households |
| Dial-Up Internet | 23 | 1.3% |
| Broadband Home | 691 | 40.4% |
| Cellular Data Only | 149 | 8.7% |
| Satellite Internet | 142 | 8.3% |
| No Internet | 681 | 39.8% |
| Total | 1,712 | 100.0% |
Lajas Summary
Lajas is a municipality located in the southwestern region of Puerto Rico. It is bordered by the municipalities of Cabo Rojo, San Germán, Sabana Grande, and Guánica. The municipality is spread over an area of approximately 97 square miles and is home to a population of approximately 33,000 people.
History
The area that is now known as Lajas was originally inhabited by the indigenous Taíno people. The Taíno people were the first inhabitants of Puerto Rico and were known for their agricultural practices and fishing. The Taíno people were eventually displaced by the Spanish who arrived in the 16th century. The Spanish established a settlement in the area and named it Lajas after the abundance of lajas (flat stones) found in the area.
The area was then used for cattle ranching and agriculture. In the 19th century, the area was divided into two municipalities, Lajas and Cabo Rojo. In 1878, the two municipalities were merged to form the current municipality of Lajas.
Geography
Lajas is located in the southwestern region of Puerto Rico. It is bordered by the municipalities of Cabo Rojo, San Germán, Sabana Grande, and Guánica. The municipality is spread over an area of approximately 97 square miles and is home to a population of approximately 33,000 people.
The terrain of Lajas is mostly flat with some rolling hills. The municipality is located in a tropical climate and is known for its warm temperatures and abundant rainfall. The area is also known for its lush vegetation and diverse wildlife.
Economy
The economy of Lajas is largely based on agriculture and tourism. The municipality is home to several farms that produce a variety of crops such as coffee, sugarcane, and bananas. The area is also known for its fishing industry, which produces a variety of seafood such as shrimp, lobster, and conch.
Tourism is also an important part of the economy of Lajas. The municipality is home to several beaches, such as Playa Santa, which is known for its white sand and crystal clear waters. The area is also known for its historical sites, such as the ruins of the old Spanish fort, El Castillo de San Cristobal.
Demographics
As of the 2010 census, the population of Lajas was 33,038. The population is mostly of Puerto Rican descent, with a small percentage of other ethnicities. The majority of the population is Roman Catholic, with a small percentage of other religions. The median household income in Lajas is $17,845, which is lower than the national average. The unemployment rate in Lajas is also higher than the national average.
Conclusion
Lajas is a municipality located in the southwestern region of Puerto Rico. It is bordered by the municipalities of Cabo Rojo, San Germán, Sabana Grande, and Guánica. The municipality is spread over an area of approximately 97 square miles and is home to a population of approximately 33,000 people. The economy of Lajas is largely based on agriculture and tourism, and the population is mostly of Puerto Rican descent. The area is known for its warm temperatures and abundant rainfall, as well as its lush vegetation and diverse wildlife.
Common Questions
What is Per Capita Income in Lajas?
Per Capita income in Lajas is $11,939.
What is the Median Family Income in Lajas?
Median Family Income in Lajas is $23,979.
What is the Median Household income in Lajas?
Median Household Income in Lajas is $21,630.
What is Income or Wage Gap in Lajas?
Income or Wage Gap in Lajas is 17.2%.
Women in Lajas earn 82.8 cents for every dollar earned by a man.
What is Family Income Deficit in Lajas?
Family Income Deficit in Lajas is $12,916.
Families that are below poverty line in Lajas earn $12,916 less on average than the poverty threshold level.
What is Inequality or Gini Index in Lajas?
Inequality or Gini Index in Lajas is 0.50.
What is the Total Population of Lajas?
Total Population of Lajas is 4,518.
What is the Total Male Population of Lajas?
Total Male Population of Lajas is 1,997.
What is the Total Female Population of Lajas?
Total Female Population of Lajas is 2,521.
What is the Ratio of Males per 100 Females in Lajas?
There are 79.21 Males per 100 Females in Lajas.
What is the Ratio of Females per 100 Males in Lajas?
There are 126.24 Females per 100 Males in Lajas.
What is the Median Population Age in Lajas?
Median Population Age in Lajas is 51.1 Years.
What is the Average Family Size in Lajas
Average Family Size in Lajas is 3.4 People.
What is the Average Household Size in Lajas
Average Household Size in Lajas is 2.6 People.
How Large is the Labor Force in Lajas?
There are 1,785 People in the Labor Forcein in Lajas.
What is the Percentage of People in the Labor Force in Lajas?
45.5% of People are in the Labor Force in Lajas.
What is the Unemployment Rate in Lajas?
Unemployment Rate in Lajas is 19.5%.