Shady Hollow, TX Map & Demographics
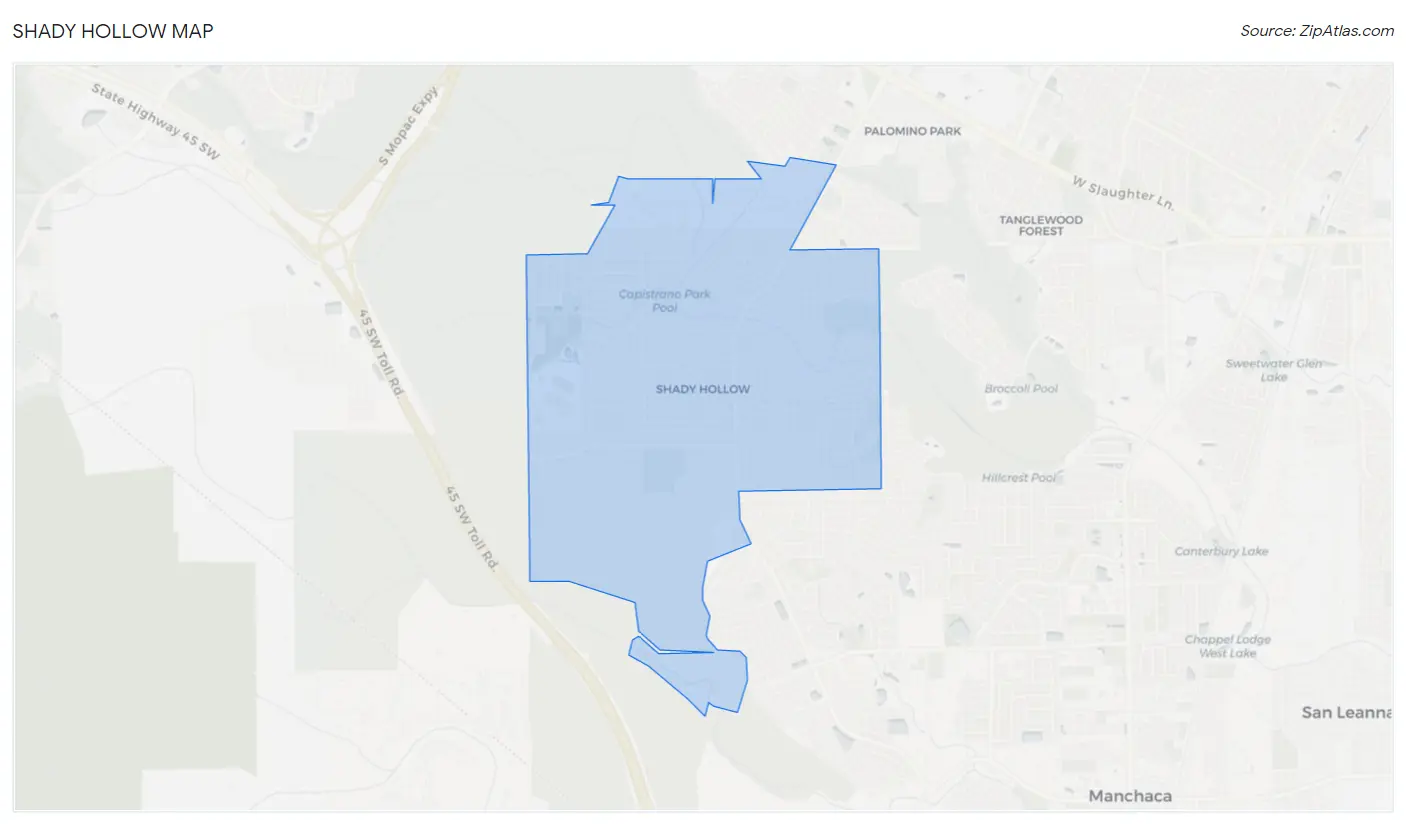
Shady Hollow Map
Shady Hollow Overview
$70,371
PER CAPITA INCOME
$169,350
AVG FAMILY INCOME
$159,904
AVG HOUSEHOLD INCOME
49.2%
WAGE / INCOME GAP [ % ]
50.8¢/ $1
WAGE / INCOME GAP [ $ ]
0.43
INEQUALITY / GINI INDEX
5,300
TOTAL POPULATION
2,708
MALE POPULATION
2,592
FEMALE POPULATION
104.48
MALES / 100 FEMALES
95.72
FEMALES / 100 MALES
49.3
MEDIAN AGE
3.0
AVG FAMILY SIZE
2.8
AVG HOUSEHOLD SIZE
2,342
LABOR FORCE [ PEOPLE ]
56.0%
PERCENT IN LABOR FORCE
Income in Shady Hollow
Income Overview in Shady Hollow
Per Capita Income in Shady Hollow is $70,371, while median incomes of families and households are $169,350 and $159,904 respectively.
| Characteristic | Number | Measure |
| Per Capita Income | 5,300 | $70,371 |
| Median Family Income | 1,571 | $169,350 |
| Mean Family Income | 1,571 | $214,939 |
| Median Household Income | 1,896 | $159,904 |
| Mean Household Income | 1,896 | $197,057 |
| Income Deficit | 1,571 | $0 |
| Wage / Income Gap (%) | 5,300 | 49.20% |
| Wage / Income Gap ($) | 5,300 | 50.80¢ per $1 |
| Gini / Inequality Index | 5,300 | 0.43 |
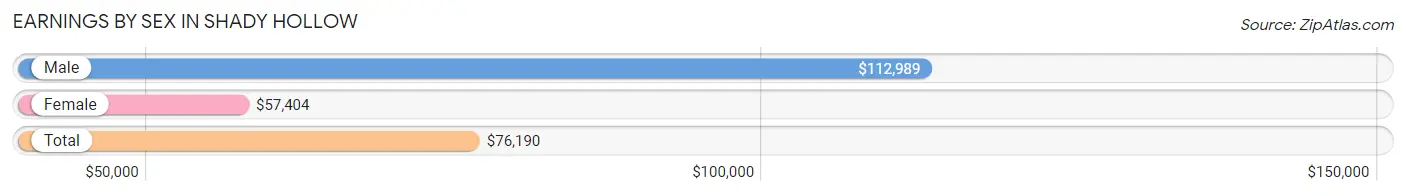
Earnings by Sex in Shady Hollow
Average Earnings in Shady Hollow are $76,190, $112,989 for men and $57,404 for women, a difference of 49.2%.
| Sex | Number | Average Earnings |
| Male | 1,482 (57.2%) | $112,989 |
| Female | 1,111 (42.8%) | $57,404 |
| Total | 2,593 (100.0%) | $76,190 |
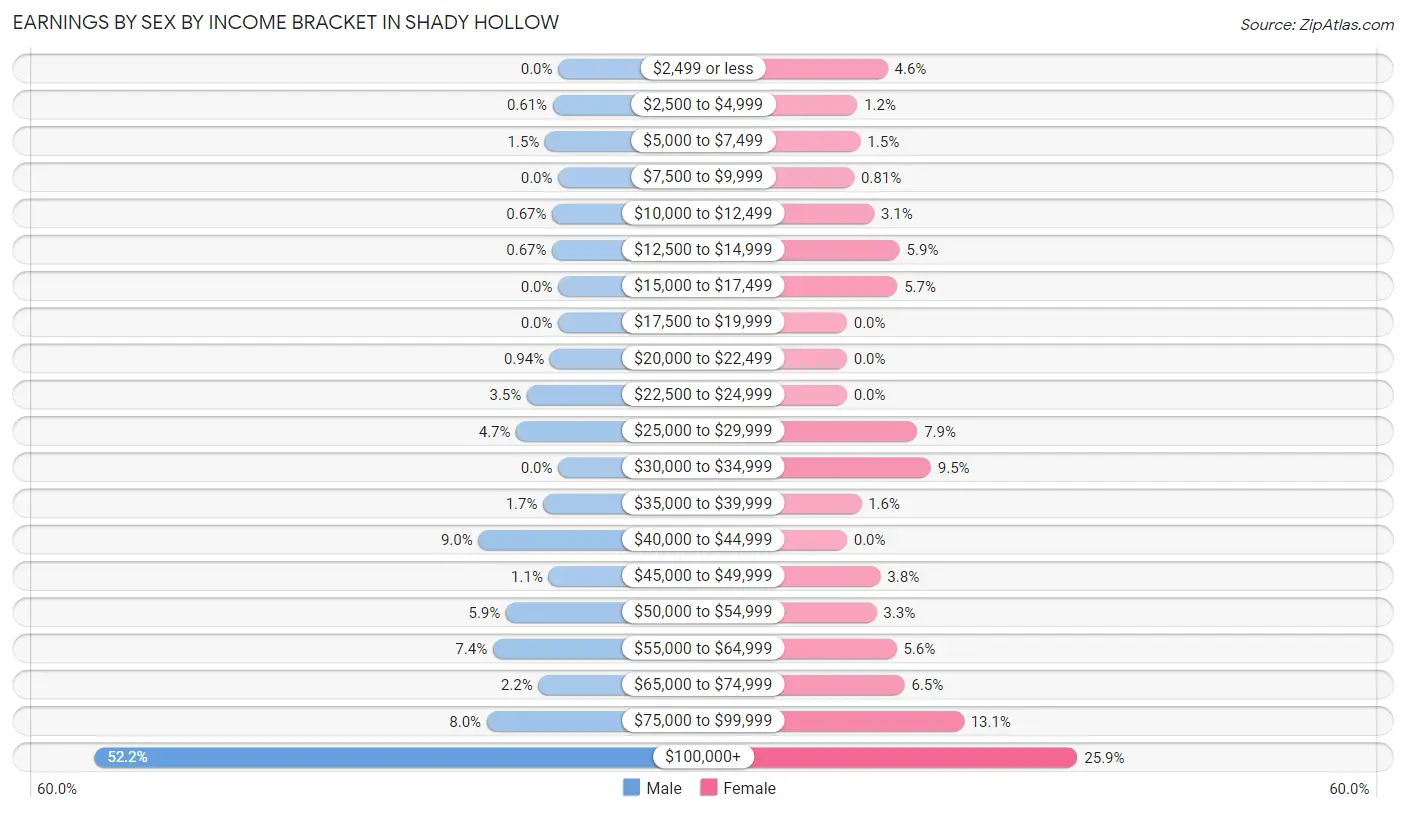
Earnings by Sex by Income Bracket in Shady Hollow
The most common earnings brackets in Shady Hollow are $100,000+ for men (773 | 52.2%) and $100,000+ for women (288 | 25.9%).
| Income | Male | Female |
| $2,499 or less | 0 (0.0%) | 51 (4.6%) |
| $2,500 to $4,999 | 9 (0.6%) | 13 (1.2%) |
| $5,000 to $7,499 | 22 (1.5%) | 17 (1.5%) |
| $7,500 to $9,999 | 0 (0.0%) | 9 (0.8%) |
| $10,000 to $12,499 | 10 (0.7%) | 34 (3.1%) |
| $12,500 to $14,999 | 10 (0.7%) | 66 (5.9%) |
| $15,000 to $17,499 | 0 (0.0%) | 63 (5.7%) |
| $17,500 to $19,999 | 0 (0.0%) | 0 (0.0%) |
| $20,000 to $22,499 | 14 (0.9%) | 0 (0.0%) |
| $22,500 to $24,999 | 52 (3.5%) | 0 (0.0%) |
| $25,000 to $29,999 | 70 (4.7%) | 88 (7.9%) |
| $30,000 to $34,999 | 0 (0.0%) | 105 (9.5%) |
| $35,000 to $39,999 | 25 (1.7%) | 18 (1.6%) |
| $40,000 to $44,999 | 133 (9.0%) | 0 (0.0%) |
| $45,000 to $49,999 | 16 (1.1%) | 42 (3.8%) |
| $50,000 to $54,999 | 87 (5.9%) | 37 (3.3%) |
| $55,000 to $64,999 | 109 (7.3%) | 62 (5.6%) |
| $65,000 to $74,999 | 33 (2.2%) | 72 (6.5%) |
| $75,000 to $99,999 | 119 (8.0%) | 146 (13.1%) |
| $100,000+ | 773 (52.2%) | 288 (25.9%) |
| Total | 1,482 (100.0%) | 1,111 (100.0%) |
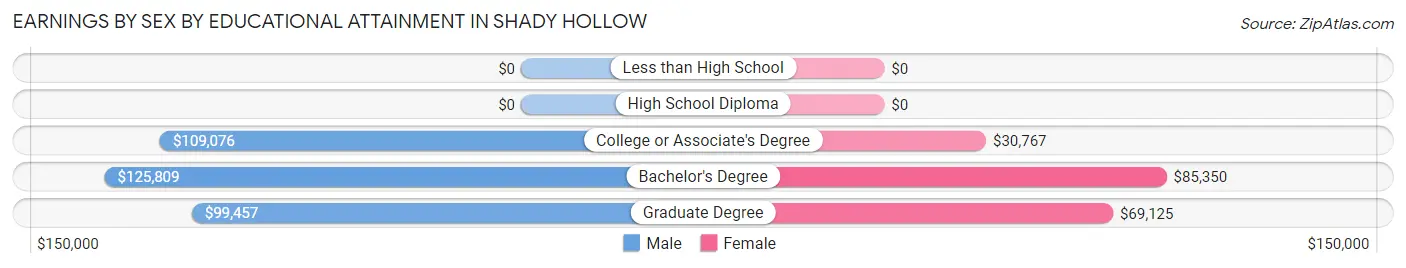
Earnings by Sex by Educational Attainment in Shady Hollow
Average earnings in Shady Hollow are $117,530 for men and $59,536 for women, a difference of 49.3%. Men with an educational attainment of bachelor's degree enjoy the highest average annual earnings of $125,809, while those with graduate degree education earn the least with $99,457. Women with an educational attainment of bachelor's degree earn the most with the average annual earnings of $85,350, while those with college or associate's degree education have the smallest earnings of $30,767.
| Educational Attainment | Male Income | Female Income |
| Less than High School | - | - |
| High School Diploma | - | - |
| College or Associate's Degree | $109,076 | $30,767 |
| Bachelor's Degree | $125,809 | $85,350 |
| Graduate Degree | $99,457 | $69,125 |
| Total | $117,530 | $59,536 |
Family Income in Shady Hollow
Family Income Brackets in Shady Hollow
According to the Shady Hollow family income data, there are 594 families falling into the $200,000+ income range, which is the most common income bracket and makes up 37.8% of all families.
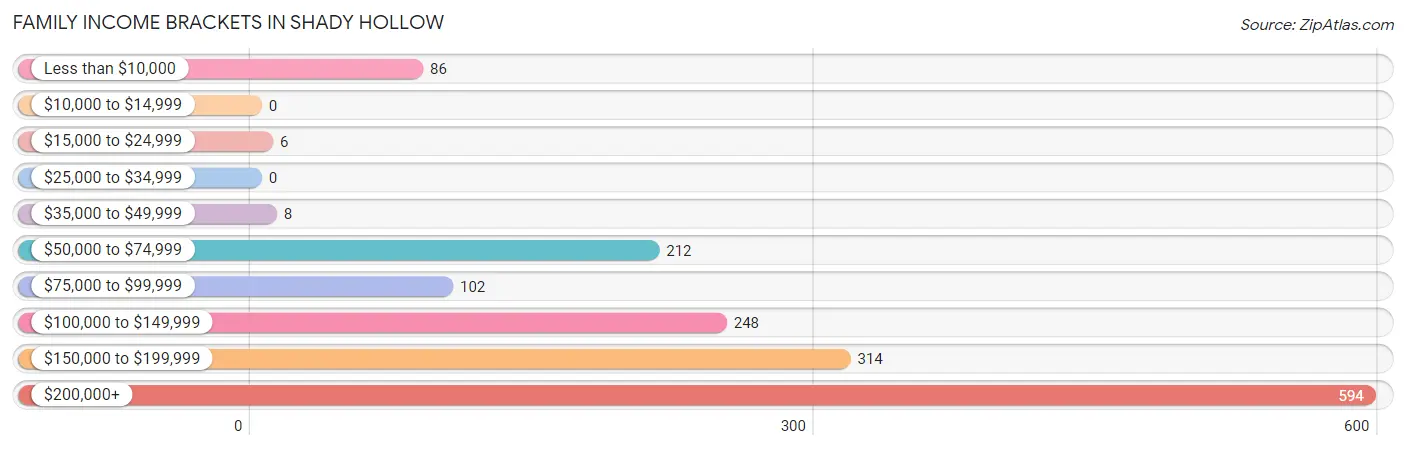
| Income Bracket | # Families | % Families |
| Less than $10,000 | 86 | 5.5% |
| $10,000 to $14,999 | 0 | 0.0% |
| $15,000 to $24,999 | 6 | 0.4% |
| $25,000 to $34,999 | 0 | 0.0% |
| $35,000 to $49,999 | 8 | 0.5% |
| $50,000 to $74,999 | 212 | 13.5% |
| $75,000 to $99,999 | 102 | 6.5% |
| $100,000 to $149,999 | 248 | 15.8% |
| $150,000 to $199,999 | 314 | 20.0% |
| $200,000+ | 594 | 37.8% |
Family Income by Famaliy Size in Shady Hollow
4-person families (315 | 20.1%) account for the highest median family income in Shady Hollow with $227,305 per family, while 2-person families (705 | 44.9%) have the highest median income of $79,495 per family member.
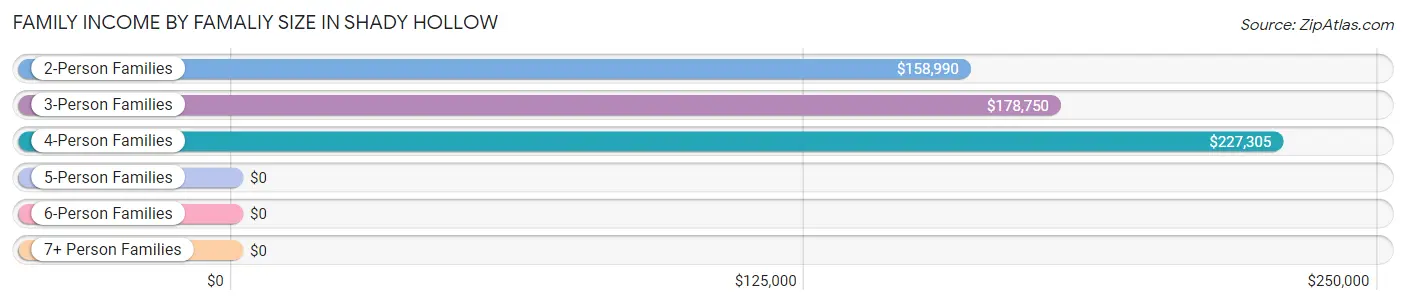
| Income Bracket | # Families | Median Income |
| 2-Person Families | 705 (44.9%) | $158,990 |
| 3-Person Families | 337 (21.4%) | $178,750 |
| 4-Person Families | 315 (20.1%) | $227,305 |
| 5-Person Families | 146 (9.3%) | $0 |
| 6-Person Families | 56 (3.6%) | $0 |
| 7+ Person Families | 12 (0.8%) | $0 |
| Total | 1,571 (100.0%) | $169,350 |
Family Income by Number of Earners in Shady Hollow
The median family income in Shady Hollow is $169,350, with families comprising 3+ earners (141) having the highest median family income of $204,792, while families with no earners (315) have the lowest median family income of $63,575, accounting for 9.0% and 20.1% of families, respectively.
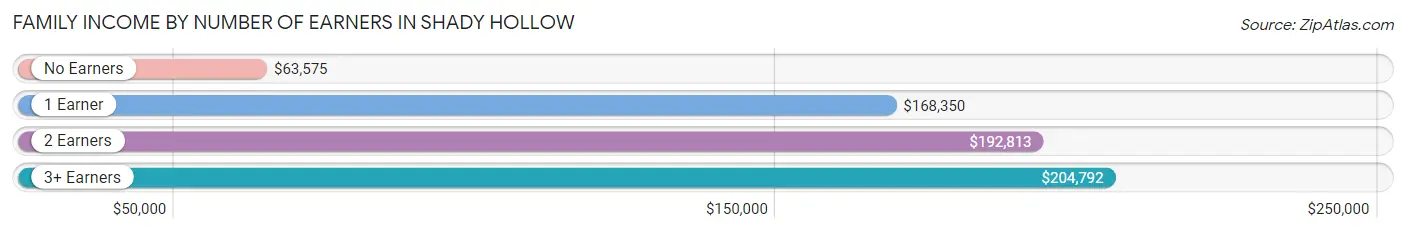
| Number of Earners | # Families | Median Income |
| No Earners | 315 (20.1%) | $63,575 |
| 1 Earner | 415 (26.4%) | $168,350 |
| 2 Earners | 700 (44.6%) | $192,813 |
| 3+ Earners | 141 (9.0%) | $204,792 |
| Total | 1,571 (100.0%) | $169,350 |
Household Income in Shady Hollow
Household Income Brackets in Shady Hollow
With 662 households falling in the category, the $200,000+ income range is the most frequent in Shady Hollow, accounting for 34.9% of all households.
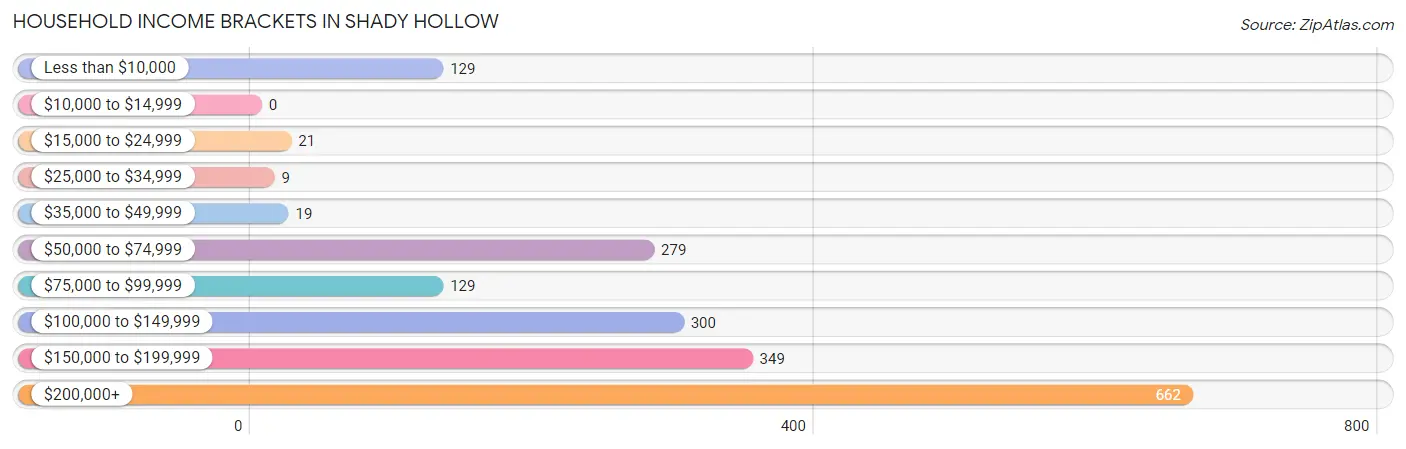
| Income Bracket | # Households | % Households |
| Less than $10,000 | 129 | 6.8% |
| $10,000 to $14,999 | 0 | 0.0% |
| $15,000 to $24,999 | 21 | 1.1% |
| $25,000 to $34,999 | 9 | 0.5% |
| $35,000 to $49,999 | 19 | 1.0% |
| $50,000 to $74,999 | 279 | 14.7% |
| $75,000 to $99,999 | 129 | 6.8% |
| $100,000 to $149,999 | 300 | 15.8% |
| $150,000 to $199,999 | 349 | 18.4% |
| $200,000+ | 662 | 34.9% |
Household Income by Householder Age in Shady Hollow
The median household income in Shady Hollow is $159,904, with the highest median household income of $214,107 found in the 45 to 64 years age bracket for the primary householder. A total of 866 households (45.7%) fall into this category.
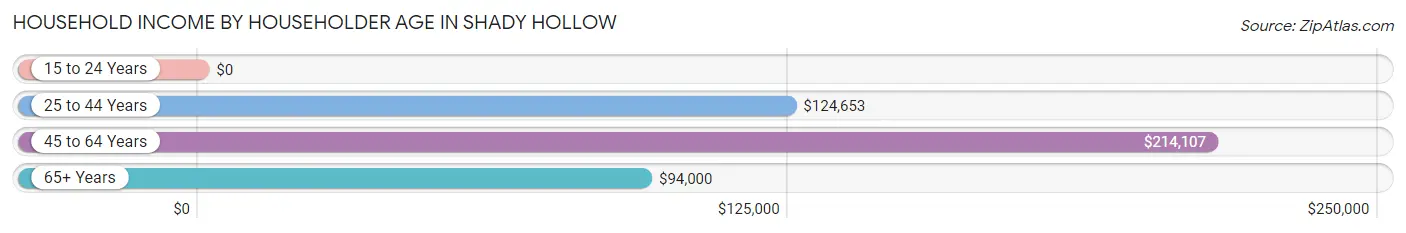
| Income Bracket | # Households | Median Income |
| 15 to 24 Years | 0 (0.0%) | $0 |
| 25 to 44 Years | 382 (20.2%) | $124,653 |
| 45 to 64 Years | 866 (45.7%) | $214,107 |
| 65+ Years | 648 (34.2%) | $94,000 |
| Total | 1,896 (100.0%) | $159,904 |
Poverty in Shady Hollow
Income Below Poverty by Sex and Age in Shady Hollow
With 9.9% poverty level for males and 5.6% for females among the residents of Shady Hollow, 6 to 11 year old males and 15 year old females are the most vulnerable to poverty, with 64 males (33.2%) and 5 females (27.8%) in their respective age groups living below the poverty level.
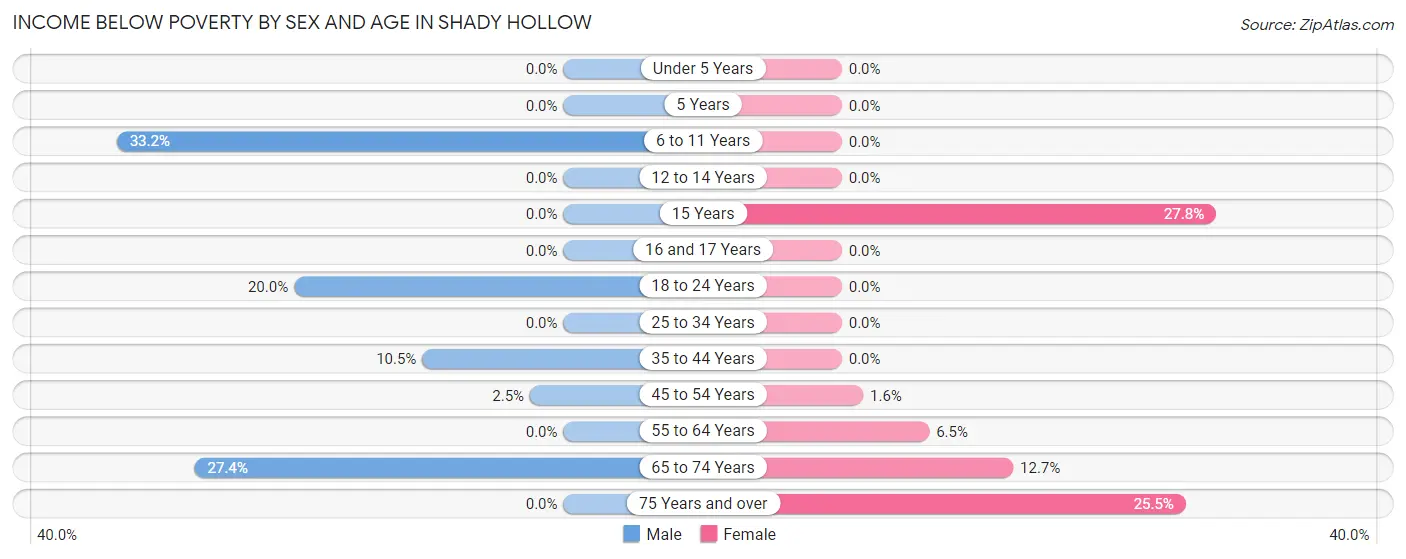
| Age Bracket | Male | Female |
| Under 5 Years | 0 (0.0%) | 0 (0.0%) |
| 5 Years | 0 (0.0%) | 0 (0.0%) |
| 6 to 11 Years | 64 (33.2%) | 0 (0.0%) |
| 12 to 14 Years | 0 (0.0%) | 0 (0.0%) |
| 15 Years | 0 (0.0%) | 5 (27.8%) |
| 16 and 17 Years | 0 (0.0%) | 0 (0.0%) |
| 18 to 24 Years | 19 (20.0%) | 0 (0.0%) |
| 25 to 34 Years | 0 (0.0%) | 0 (0.0%) |
| 35 to 44 Years | 39 (10.5%) | 0 (0.0%) |
| 45 to 54 Years | 7 (2.5%) | 5 (1.6%) |
| 55 to 64 Years | 0 (0.0%) | 36 (6.5%) |
| 65 to 74 Years | 138 (27.4%) | 50 (12.7%) |
| 75 Years and over | 0 (0.0%) | 48 (25.5%) |
| Total | 267 (9.9%) | 144 (5.6%) |
Income Above Poverty by Sex and Age in Shady Hollow
According to the poverty statistics in Shady Hollow, males aged under 5 years and females aged under 5 years are the age groups that are most secure financially, with 100.0% of males and 100.0% of females in these age groups living above the poverty line.
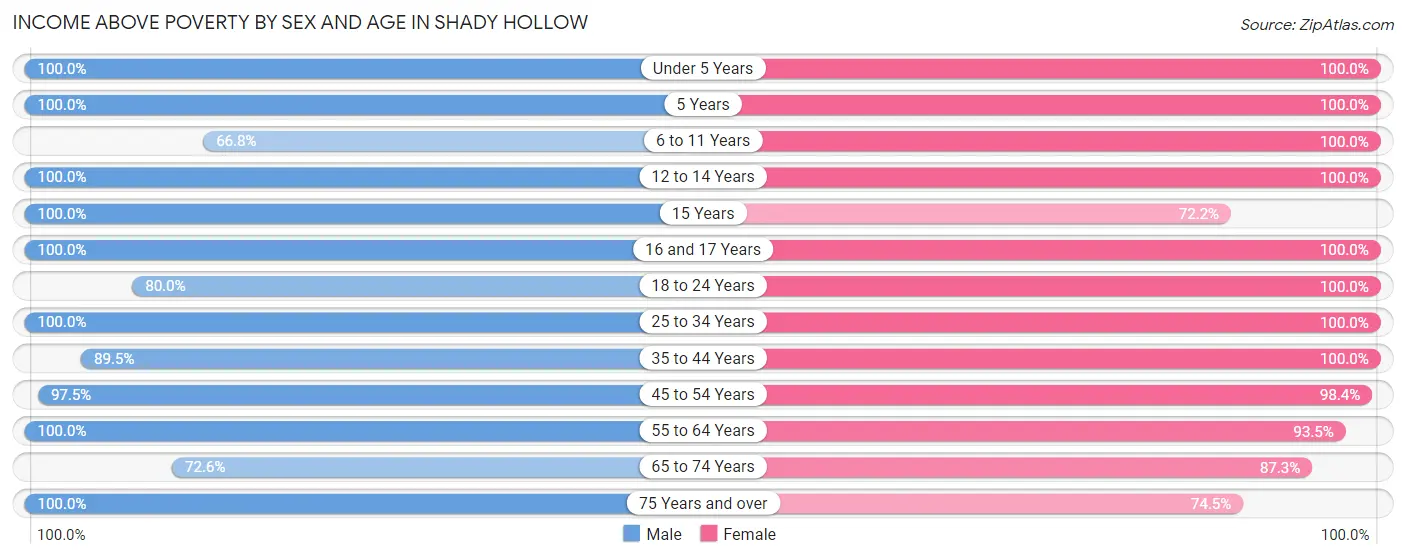
| Age Bracket | Male | Female |
| Under 5 Years | 134 (100.0%) | 97 (100.0%) |
| 5 Years | 62 (100.0%) | 163 (100.0%) |
| 6 to 11 Years | 129 (66.8%) | 200 (100.0%) |
| 12 to 14 Years | 139 (100.0%) | 50 (100.0%) |
| 15 Years | 62 (100.0%) | 13 (72.2%) |
| 16 and 17 Years | 32 (100.0%) | 169 (100.0%) |
| 18 to 24 Years | 76 (80.0%) | 20 (100.0%) |
| 25 to 34 Years | 124 (100.0%) | 102 (100.0%) |
| 35 to 44 Years | 333 (89.5%) | 320 (100.0%) |
| 45 to 54 Years | 275 (97.5%) | 312 (98.4%) |
| 55 to 64 Years | 587 (100.0%) | 519 (93.5%) |
| 65 to 74 Years | 366 (72.6%) | 343 (87.3%) |
| 75 Years and over | 122 (100.0%) | 140 (74.5%) |
| Total | 2,441 (90.1%) | 2,448 (94.4%) |
Income Below Poverty Among Married-Couple Families in Shady Hollow
The poverty statistics for married-couple families in Shady Hollow show that 2.5% or 36 of the total 1,442 families live below the poverty line. Families with no children have the highest poverty rate of 3.4%, comprising of 29 families. On the other hand, families with 3 or 4 children have the lowest poverty rate of 0.0%, which includes 0 families.
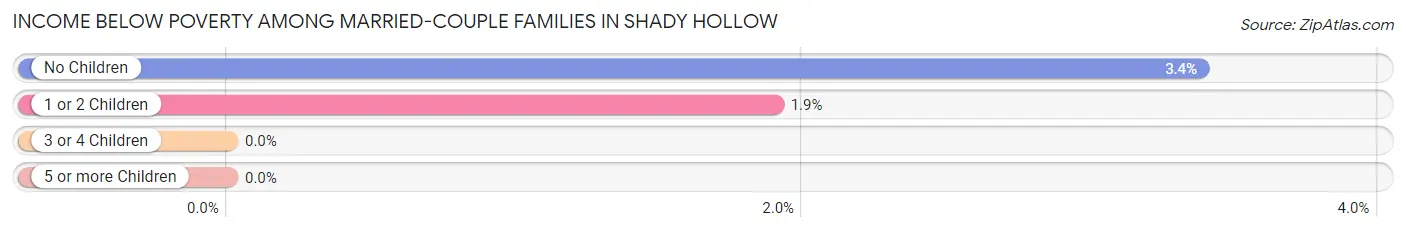
| Children | Above Poverty | Below Poverty |
| No Children | 830 (96.6%) | 29 (3.4%) |
| 1 or 2 Children | 362 (98.1%) | 7 (1.9%) |
| 3 or 4 Children | 202 (100.0%) | 0 (0.0%) |
| 5 or more Children | 12 (100.0%) | 0 (0.0%) |
| Total | 1,406 (97.5%) | 36 (2.5%) |
Income Below Poverty Among Single-Parent Households in Shady Hollow
According to the poverty data in Shady Hollow, 100.0% or 36 single-father households and 22.6% or 21 single-mother households are living below the poverty line. Among single-father households, those with 1 or 2 children have the highest poverty rate, with 36 households (100.0%) experiencing poverty. Likewise, among single-mother households, those with no children have the highest poverty rate, with 21 households (31.3%) falling below the poverty line.
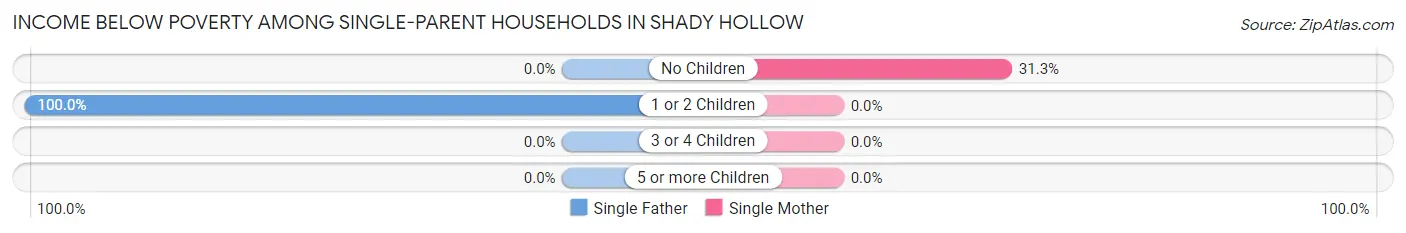
| Children | Single Father | Single Mother |
| No Children | 0 (0.0%) | 21 (31.3%) |
| 1 or 2 Children | 36 (100.0%) | 0 (0.0%) |
| 3 or 4 Children | 0 (0.0%) | 0 (0.0%) |
| 5 or more Children | 0 (0.0%) | 0 (0.0%) |
| Total | 36 (100.0%) | 21 (22.6%) |
Income Below Poverty Among Married-Couple vs Single-Parent Households in Shady Hollow
The poverty data for Shady Hollow shows that 36 of the married-couple family households (2.5%) and 57 of the single-parent households (44.2%) are living below the poverty level. Within the married-couple family households, those with no children have the highest poverty rate, with 29 households (3.4%) falling below the poverty line. Among the single-parent households, those with 1 or 2 children have the highest poverty rate, with 36 household (58.1%) living below poverty.
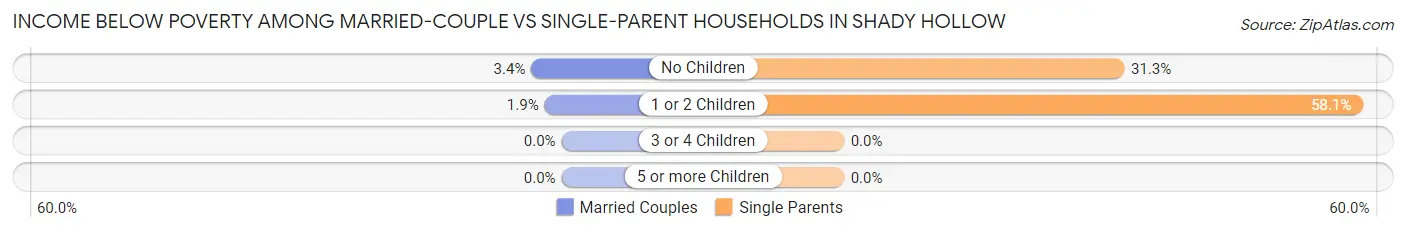
| Children | Married-Couple Families | Single-Parent Households |
| No Children | 29 (3.4%) | 21 (31.3%) |
| 1 or 2 Children | 7 (1.9%) | 36 (58.1%) |
| 3 or 4 Children | 0 (0.0%) | 0 (0.0%) |
| 5 or more Children | 0 (0.0%) | 0 (0.0%) |
| Total | 36 (2.5%) | 57 (44.2%) |
Race in Shady Hollow
The most populous races in Shady Hollow are White / Caucasian (3,748 | 70.7%), Hispanic or Latino (1,214 | 22.9%), and Two or more Races (784 | 14.8%).
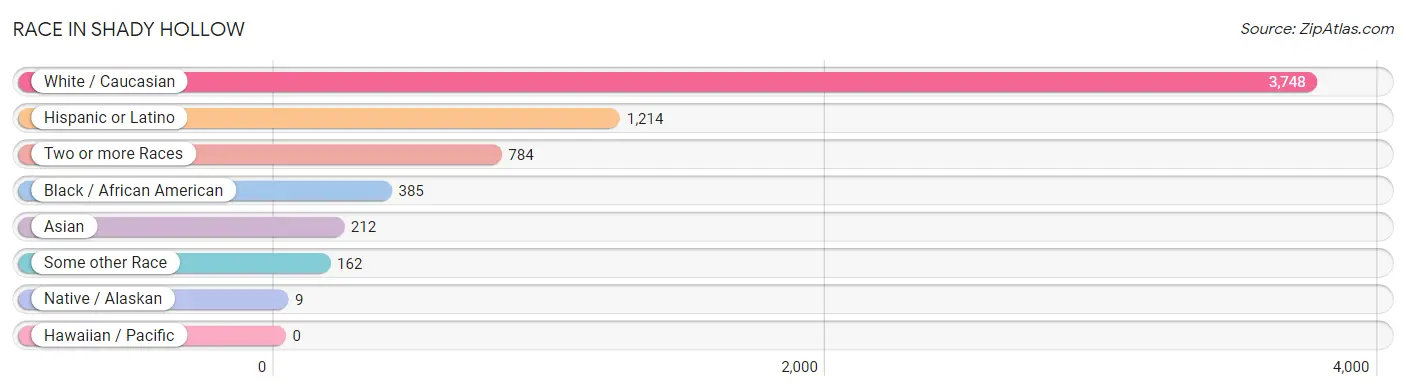
| Race | # Population | % Population |
| Asian | 212 | 4.0% |
| Black / African American | 385 | 7.3% |
| Hawaiian / Pacific | 0 | 0.0% |
| Hispanic or Latino | 1,214 | 22.9% |
| Native / Alaskan | 9 | 0.2% |
| White / Caucasian | 3,748 | 70.7% |
| Two or more Races | 784 | 14.8% |
| Some other Race | 162 | 3.1% |
| Total | 5,300 | 100.0% |
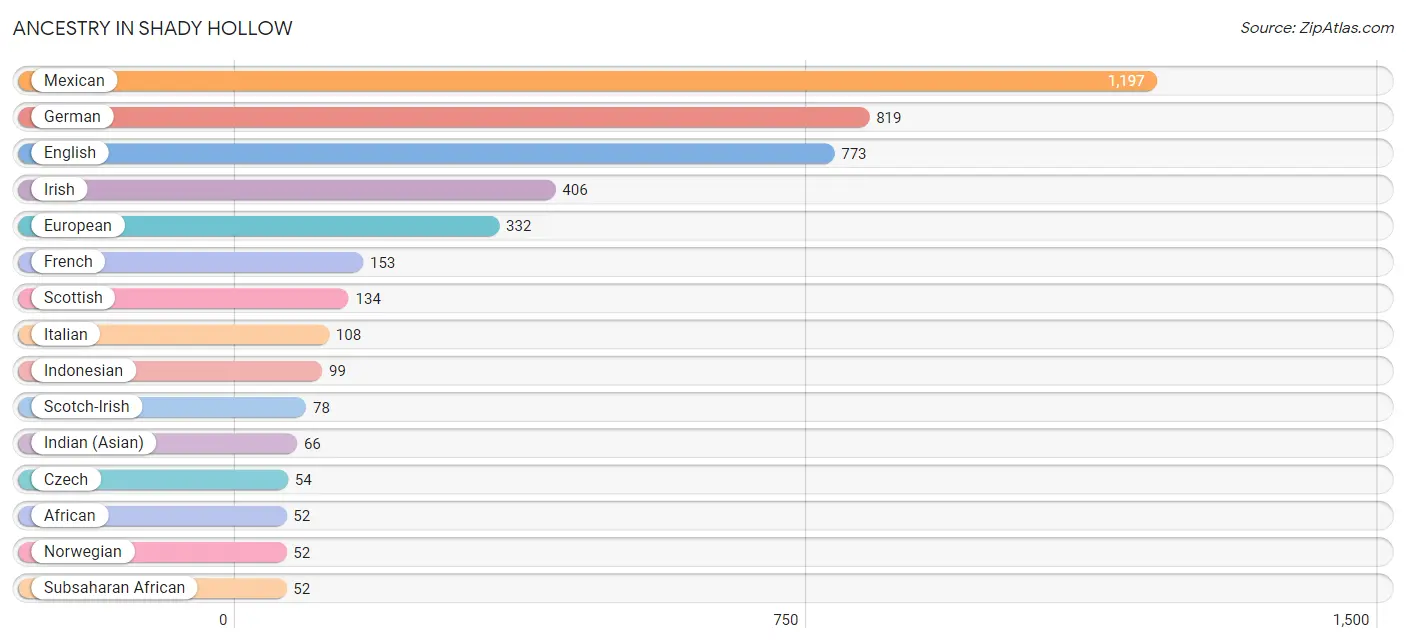
Ancestry in Shady Hollow
The most populous ancestries reported in Shady Hollow are Mexican (1,197 | 22.6%), German (819 | 15.4%), English (773 | 14.6%), Irish (406 | 7.7%), and European (332 | 6.3%), together accounting for 66.5% of all Shady Hollow residents.
| Ancestry | # Population | % Population |
| African | 52 | 1.0% |
| American | 43 | 0.8% |
| Arab | 15 | 0.3% |
| Basque | 32 | 0.6% |
| Bhutanese | 21 | 0.4% |
| Brazilian | 4 | 0.1% |
| British | 48 | 0.9% |
| Colombian | 17 | 0.3% |
| Czech | 54 | 1.0% |
| Dutch | 12 | 0.2% |
| Egyptian | 15 | 0.3% |
| English | 773 | 14.6% |
| European | 332 | 6.3% |
| Finnish | 9 | 0.2% |
| French | 153 | 2.9% |
| French Canadian | 46 | 0.9% |
| German | 819 | 15.4% |
| Indian (Asian) | 66 | 1.3% |
| Indonesian | 99 | 1.9% |
| Irish | 406 | 7.7% |
| Italian | 108 | 2.0% |
| Korean | 13 | 0.3% |
| Mexican | 1,197 | 22.6% |
| Mexican American Indian | 9 | 0.2% |
| Norwegian | 52 | 1.0% |
| Polish | 20 | 0.4% |
| Portuguese | 19 | 0.4% |
| Russian | 42 | 0.8% |
| Scandinavian | 5 | 0.1% |
| Scotch-Irish | 78 | 1.5% |
| Scottish | 134 | 2.5% |
| South American | 17 | 0.3% |
| Subsaharan African | 52 | 1.0% |
| Swedish | 31 | 0.6% |
| Swiss | 14 | 0.3% |
| Thai | 34 | 0.6% |
| Trinidadian and Tobagonian | 14 | 0.3% |
| Welsh | 37 | 0.7% | View All 38 Rows |
Immigrants in Shady Hollow
The most numerous immigrant groups reported in Shady Hollow came from Asia (149 | 2.8%), Eastern Asia (74 | 1.4%), Europe (60 | 1.1%), Western Europe (60 | 1.1%), and South Eastern Asia (57 | 1.1%), together accounting for 7.5% of all Shady Hollow residents.
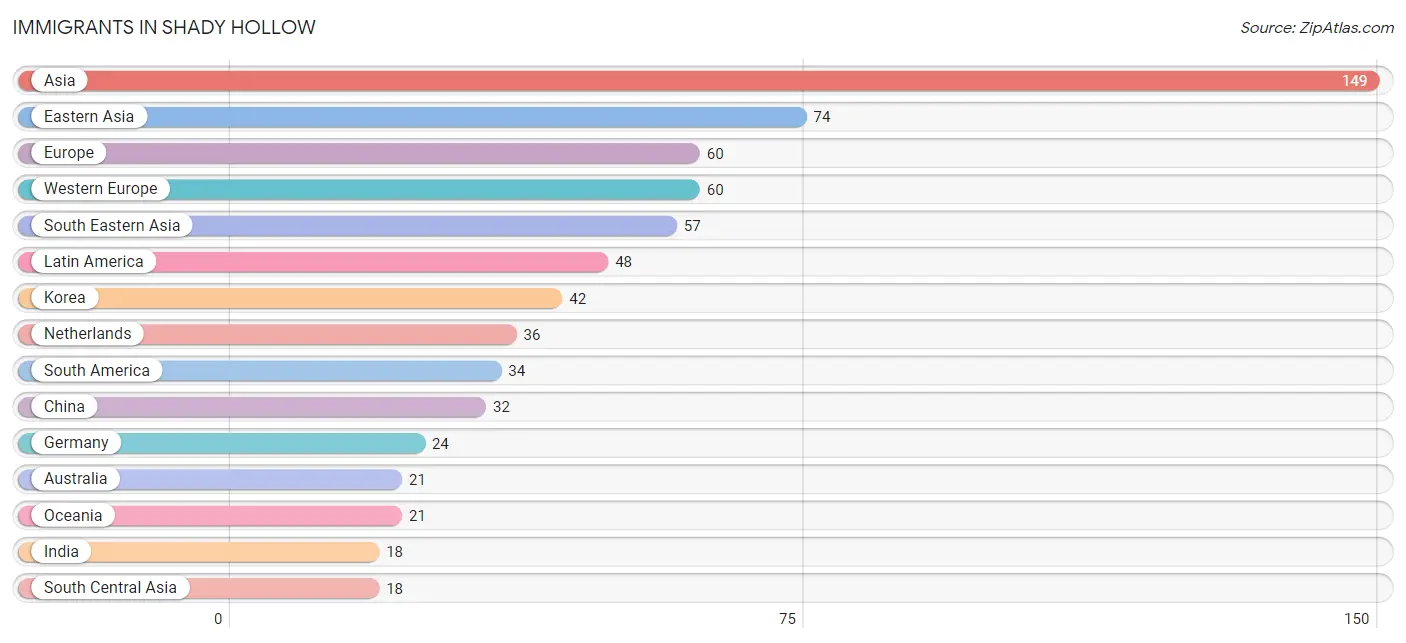
| Immigration Origin | # Population | % Population |
| Africa | 15 | 0.3% |
| Asia | 149 | 2.8% |
| Australia | 21 | 0.4% |
| Brazil | 17 | 0.3% |
| Canada | 4 | 0.1% |
| Caribbean | 14 | 0.3% |
| China | 32 | 0.6% |
| Colombia | 17 | 0.3% |
| Eastern Asia | 74 | 1.4% |
| Egypt | 15 | 0.3% |
| Europe | 60 | 1.1% |
| Germany | 24 | 0.4% |
| India | 18 | 0.3% |
| Korea | 42 | 0.8% |
| Latin America | 48 | 0.9% |
| Netherlands | 36 | 0.7% |
| Northern Africa | 15 | 0.3% |
| Oceania | 21 | 0.4% |
| South America | 34 | 0.6% |
| South Central Asia | 18 | 0.3% |
| South Eastern Asia | 57 | 1.1% |
| Trinidad and Tobago | 14 | 0.3% |
| Western Europe | 60 | 1.1% | View All 23 Rows |
Sex and Age in Shady Hollow
Sex and Age in Shady Hollow
The most populous age groups in Shady Hollow are 55 to 59 Years (326 | 12.0%) for men and 5 to 9 Years (307 | 11.8%) for women.
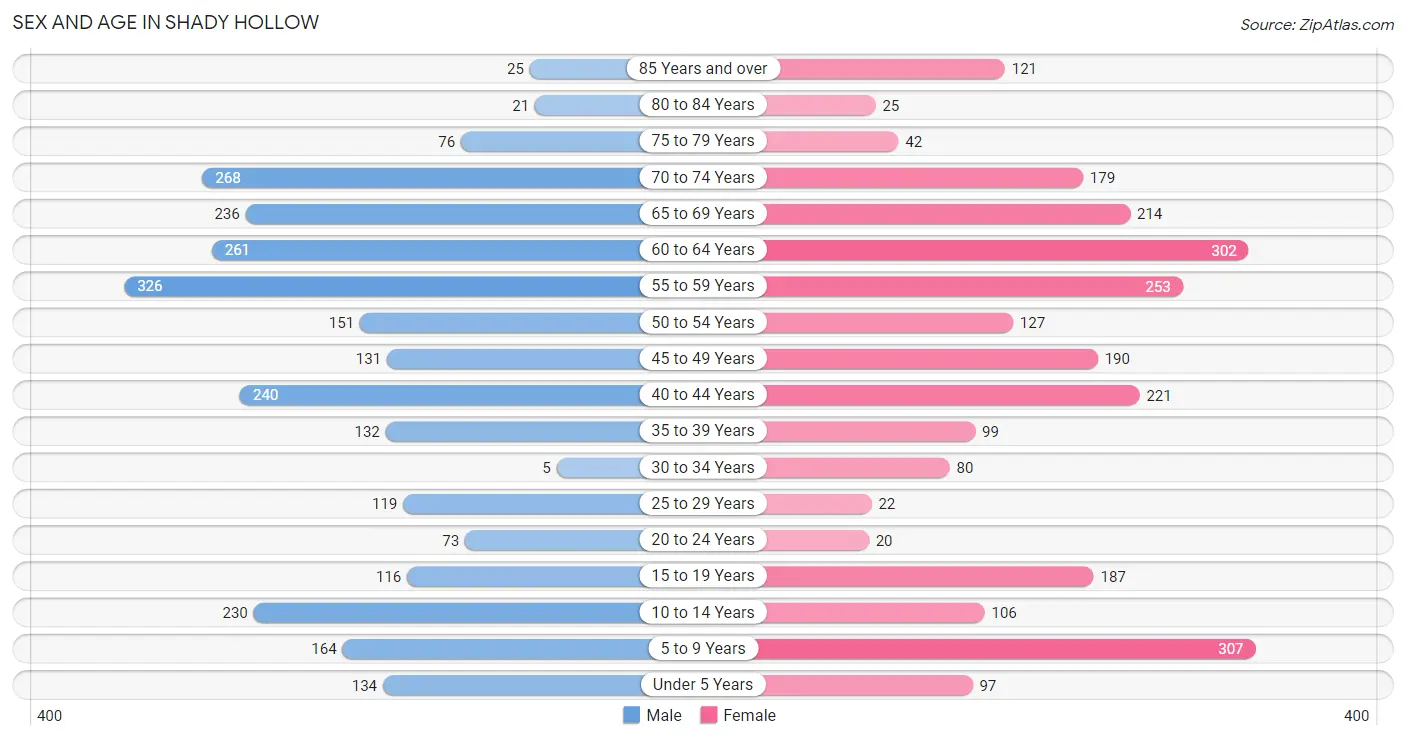
| Age Bracket | Male | Female |
| Under 5 Years | 134 (5.0%) | 97 (3.7%) |
| 5 to 9 Years | 164 (6.1%) | 307 (11.8%) |
| 10 to 14 Years | 230 (8.5%) | 106 (4.1%) |
| 15 to 19 Years | 116 (4.3%) | 187 (7.2%) |
| 20 to 24 Years | 73 (2.7%) | 20 (0.8%) |
| 25 to 29 Years | 119 (4.4%) | 22 (0.9%) |
| 30 to 34 Years | 5 (0.2%) | 80 (3.1%) |
| 35 to 39 Years | 132 (4.9%) | 99 (3.8%) |
| 40 to 44 Years | 240 (8.9%) | 221 (8.5%) |
| 45 to 49 Years | 131 (4.8%) | 190 (7.3%) |
| 50 to 54 Years | 151 (5.6%) | 127 (4.9%) |
| 55 to 59 Years | 326 (12.0%) | 253 (9.8%) |
| 60 to 64 Years | 261 (9.6%) | 302 (11.7%) |
| 65 to 69 Years | 236 (8.7%) | 214 (8.3%) |
| 70 to 74 Years | 268 (9.9%) | 179 (6.9%) |
| 75 to 79 Years | 76 (2.8%) | 42 (1.6%) |
| 80 to 84 Years | 21 (0.8%) | 25 (1.0%) |
| 85 Years and over | 25 (0.9%) | 121 (4.7%) |
| Total | 2,708 (100.0%) | 2,592 (100.0%) |
Families and Households in Shady Hollow
Median Family Size in Shady Hollow
The median family size in Shady Hollow is 3.00 persons per family, with married-couple families (1,442 | 91.8%) accounting for the largest median family size of 3.06 persons per family. On the other hand, single female/mother families (93 | 5.9%) represent the smallest median family size with 2.17 persons per family.
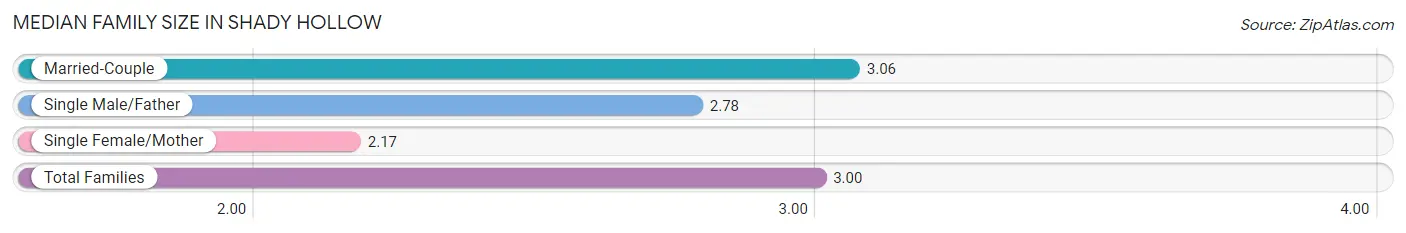
| Family Type | # Families | Family Size |
| Married-Couple | 1,442 (91.8%) | 3.06 |
| Single Male/Father | 36 (2.3%) | 2.78 |
| Single Female/Mother | 93 (5.9%) | 2.17 |
| Total Families | 1,571 (100.0%) | 3.00 |
Median Household Size in Shady Hollow
The median household size in Shady Hollow is 2.78 persons per household, with single male/father households (36 | 1.9%) accounting for the largest median household size of 3.86 persons per household. non-family households (325 | 17.1%) represent the smallest median household size with 1.45 persons per household.
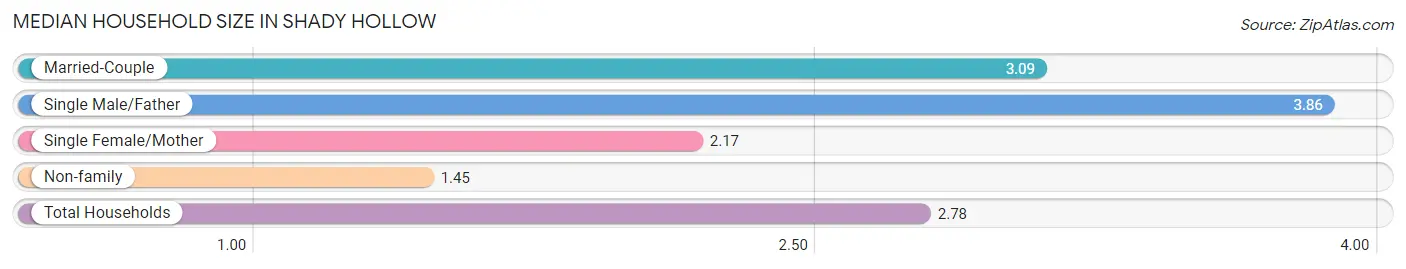
| Household Type | # Households | Household Size |
| Married-Couple | 1,442 (76.0%) | 3.09 |
| Single Male/Father | 36 (1.9%) | 3.86 |
| Single Female/Mother | 93 (4.9%) | 2.17 |
| Non-family | 325 (17.1%) | 1.45 |
| Total Households | 1,896 (100.0%) | 2.78 |
Household Size by Marriage Status in Shady Hollow
Out of a total of 1,896 households in Shady Hollow, 1,571 (82.9%) are family households, while 325 (17.1%) are nonfamily households. The most numerous type of family households are 2-person households, comprising 691, and the most common type of nonfamily households are 1-person households, comprising 255.
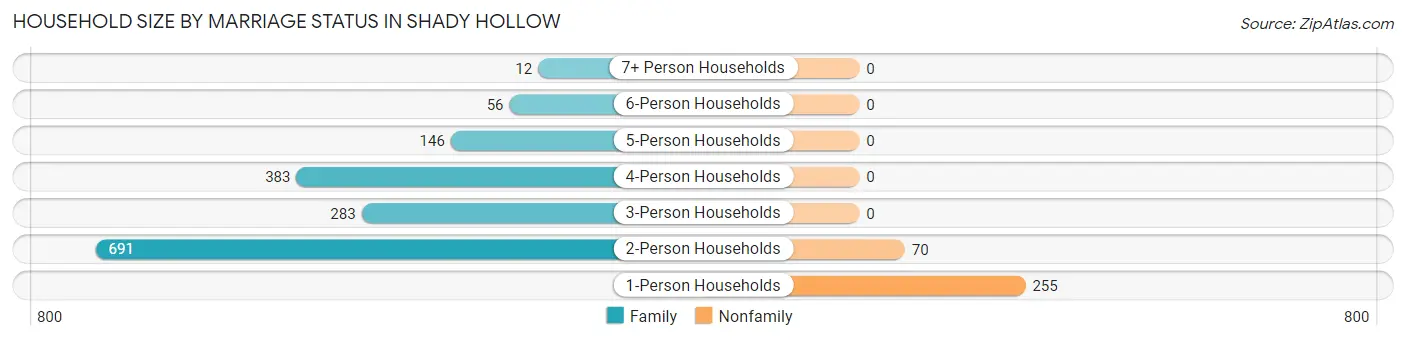
| Household Size | Family Households | Nonfamily Households |
| 1-Person Households | - | 255 (13.5%) |
| 2-Person Households | 691 (36.4%) | 70 (3.7%) |
| 3-Person Households | 283 (14.9%) | 0 (0.0%) |
| 4-Person Households | 383 (20.2%) | 0 (0.0%) |
| 5-Person Households | 146 (7.7%) | 0 (0.0%) |
| 6-Person Households | 56 (2.9%) | 0 (0.0%) |
| 7+ Person Households | 12 (0.6%) | 0 (0.0%) |
| Total | 1,571 (82.9%) | 325 (17.1%) |
Female Fertility in Shady Hollow
Fertility by Age in Shady Hollow
| Age Bracket | Women with Births | Births / 1,000 Women |
| 15 to 19 years | 0 (0.0%) | 0.0 |
| 20 to 34 years | 0 (0.0%) | 0.0 |
| 35 to 50 years | 0 (0.0%) | 0.0 |
| Total | 0 (0.0%) | 0.0 |
Fertility by Age by Marriage Status in Shady Hollow
| Age Bracket | Married | Unmarried |
| 15 to 19 years | 0 (0.0%) | 0 (0.0%) |
| 20 to 34 years | 0 (0.0%) | 0 (0.0%) |
| 35 to 50 years | 0 (0.0%) | 0 (0.0%) |
| Total | 0 (0.0%) | 0 (0.0%) |
Fertility by Education in Shady Hollow
| Educational Attainment | Women with Births | Births / 1,000 Women |
| Less than High School | 0 (0.0%) | 0.0 |
| High School Diploma | 0 (0.0%) | 0.0 |
| College or Associate's Degree | 0 (0.0%) | 0.0 |
| Bachelor's Degree | 0 (0.0%) | 0.0 |
| Graduate Degree | 0 (0.0%) | 0.0 |
| Total | 0 (0.0%) | 0.0 |
Fertility by Education by Marriage Status in Shady Hollow
| Educational Attainment | Married | Unmarried |
| Less than High School | 0 (0.0%) | 0 (0.0%) |
| High School Diploma | 0 (0.0%) | 0 (0.0%) |
| College or Associate's Degree | 0 (0.0%) | 0 (0.0%) |
| Bachelor's Degree | 0 (0.0%) | 0 (0.0%) |
| Graduate Degree | 0 (0.0%) | 0 (0.0%) |
| Total | 0 (0.0%) | 0 (0.0%) |
Employment Characteristics in Shady Hollow
Employment by Class of Employer in Shady Hollow
Among the 2,271 employed individuals in Shady Hollow, private company employees (1,375 | 60.6%), not-for-profit organizations (220 | 9.7%), and self-employed (not incorporated) (172 | 7.6%) make up the most common classes of employment.
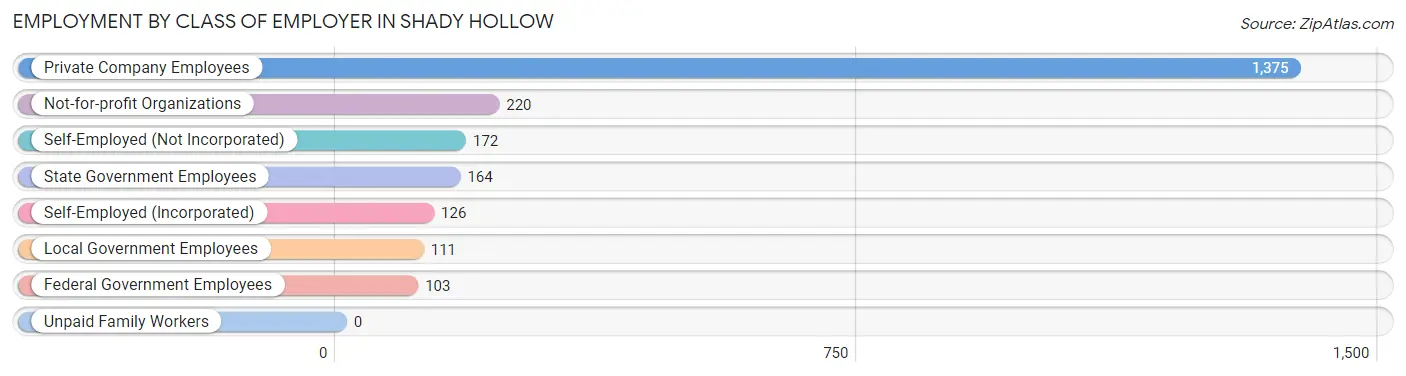
| Employer Class | # Employees | % Employees |
| Private Company Employees | 1,375 | 60.6% |
| Self-Employed (Incorporated) | 126 | 5.6% |
| Self-Employed (Not Incorporated) | 172 | 7.6% |
| Not-for-profit Organizations | 220 | 9.7% |
| Local Government Employees | 111 | 4.9% |
| State Government Employees | 164 | 7.2% |
| Federal Government Employees | 103 | 4.5% |
| Unpaid Family Workers | 0 | 0.0% |
| Total | 2,271 | 100.0% |
Employment Status by Age in Shady Hollow
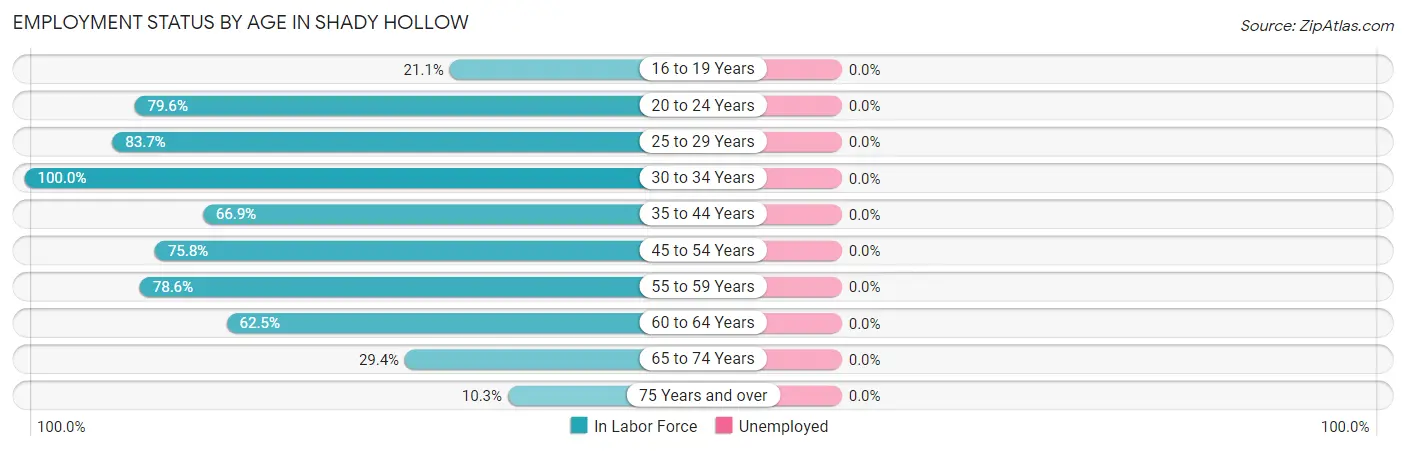
| Age Bracket | In Labor Force | Unemployed |
| 16 to 19 Years | 47 (21.1%) | 0 (0.0%) |
| 20 to 24 Years | 74 (79.6%) | 0 (0.0%) |
| 25 to 29 Years | 118 (83.7%) | 0 (0.0%) |
| 30 to 34 Years | 85 (100.0%) | 0 (0.0%) |
| 35 to 44 Years | 463 (66.9%) | 0 (0.0%) |
| 45 to 54 Years | 454 (75.8%) | 0 (0.0%) |
| 55 to 59 Years | 455 (78.6%) | 0 (0.0%) |
| 60 to 64 Years | 352 (62.5%) | 0 (0.0%) |
| 65 to 74 Years | 264 (29.4%) | 0 (0.0%) |
| 75 Years and over | 32 (10.3%) | 0 (0.0%) |
| Total | 2,342 (56.0%) | 0 (0.0%) |
Employment Status by Educational Attainment in Shady Hollow
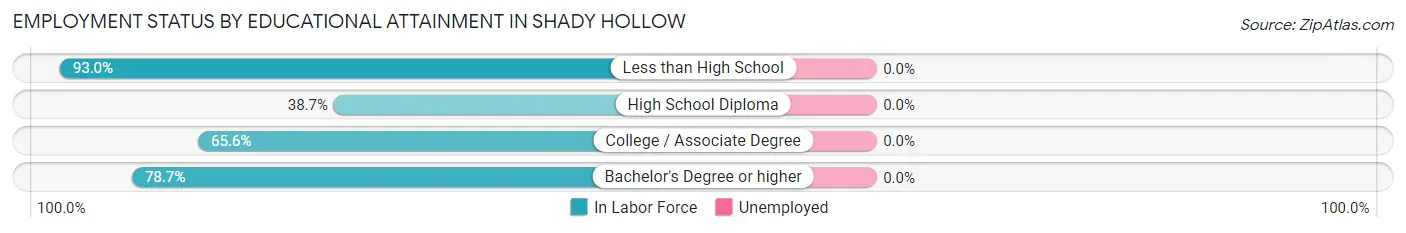
| Educational Attainment | In Labor Force | Unemployed |
| Less than High School | 40 (93.0%) | 0 (0.0%) |
| High School Diploma | 60 (38.7%) | 0 (0.0%) |
| College / Associate Degree | 548 (65.6%) | 0 (0.0%) |
| Bachelor's Degree or higher | 1,280 (78.7%) | 0 (0.0%) |
| Total | 1,928 (72.5%) | 0 (0.0%) |
Employment Occupations by Sex in Shady Hollow
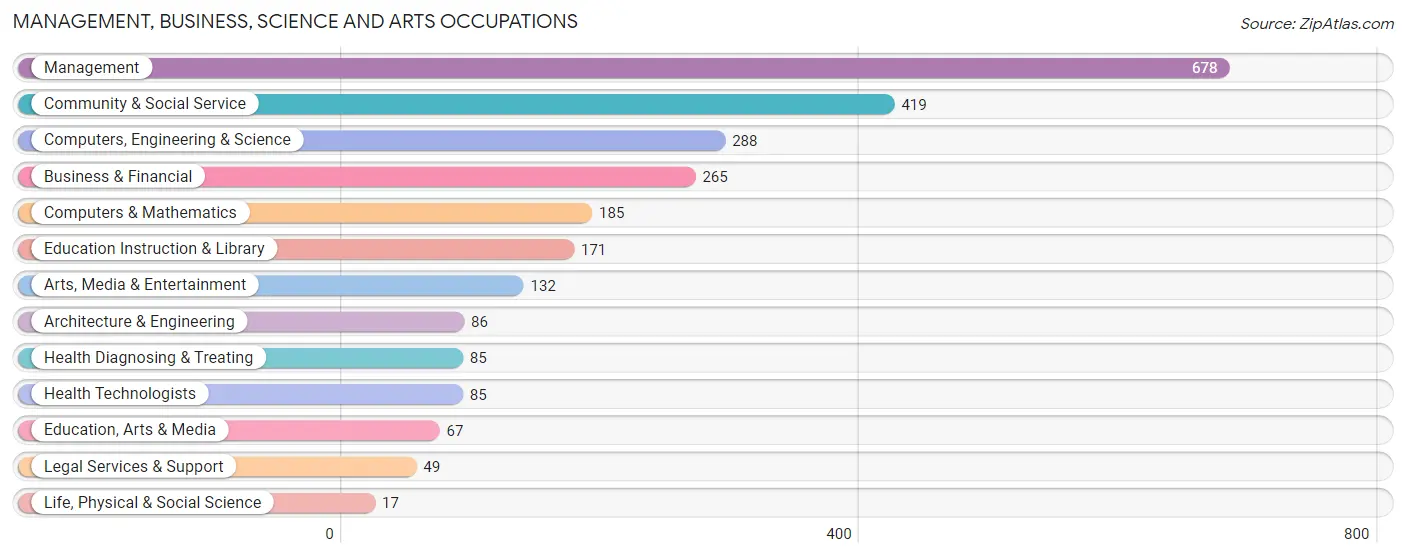
Management, Business, Science and Arts Occupations
The most common Management, Business, Science and Arts occupations in Shady Hollow are Management (678 | 28.9%), Community & Social Service (419 | 17.9%), Computers, Engineering & Science (288 | 12.3%), Business & Financial (265 | 11.3%), and Computers & Mathematics (185 | 7.9%).
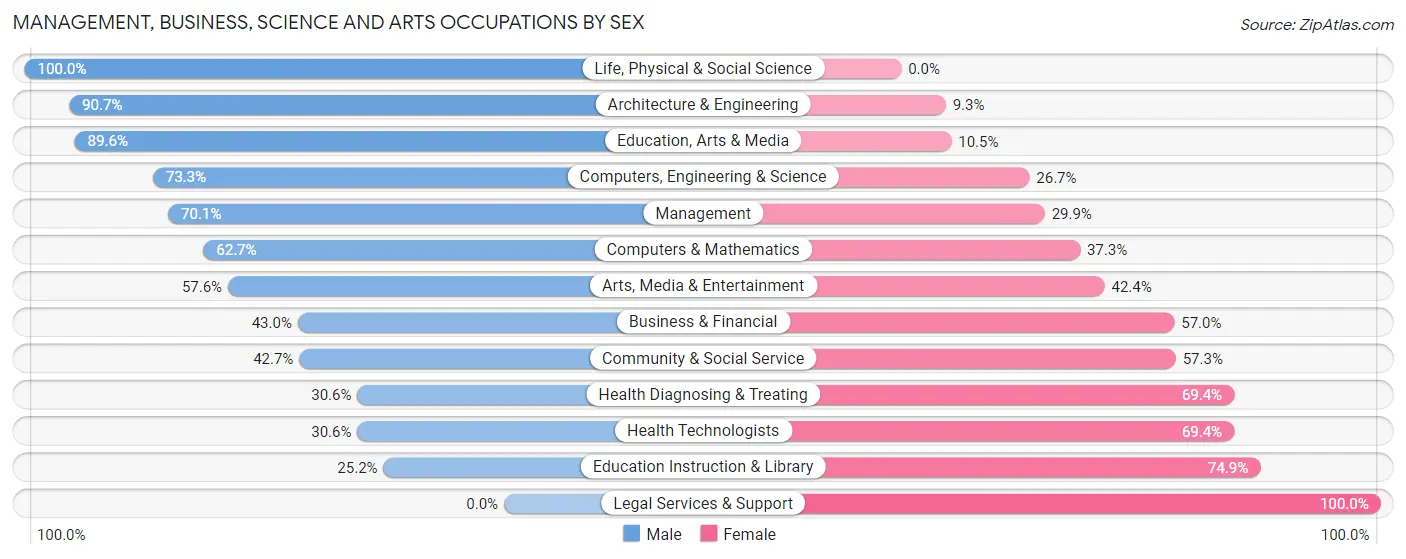
Management, Business, Science and Arts Occupations by Sex
Within the Management, Business, Science and Arts occupations in Shady Hollow, the most male-oriented occupations are Life, Physical & Social Science (100.0%), Architecture & Engineering (90.7%), and Education, Arts & Media (89.5%), while the most female-oriented occupations are Legal Services & Support (100.0%), Education Instruction & Library (74.9%), and Health Diagnosing & Treating (69.4%).
| Occupation | Male | Female |
| Management | 475 (70.1%) | 203 (29.9%) |
| Business & Financial | 114 (43.0%) | 151 (57.0%) |
| Computers, Engineering & Science | 211 (73.3%) | 77 (26.7%) |
| Computers & Mathematics | 116 (62.7%) | 69 (37.3%) |
| Architecture & Engineering | 78 (90.7%) | 8 (9.3%) |
| Life, Physical & Social Science | 17 (100.0%) | 0 (0.0%) |
| Community & Social Service | 179 (42.7%) | 240 (57.3%) |
| Education, Arts & Media | 60 (89.5%) | 7 (10.4%) |
| Legal Services & Support | 0 (0.0%) | 49 (100.0%) |
| Education Instruction & Library | 43 (25.2%) | 128 (74.9%) |
| Arts, Media & Entertainment | 76 (57.6%) | 56 (42.4%) |
| Health Diagnosing & Treating | 26 (30.6%) | 59 (69.4%) |
| Health Technologists | 26 (30.6%) | 59 (69.4%) |
| Total (Category) | 1,005 (57.9%) | 730 (42.1%) |
| Total (Overall) | 1,345 (57.4%) | 999 (42.6%) |
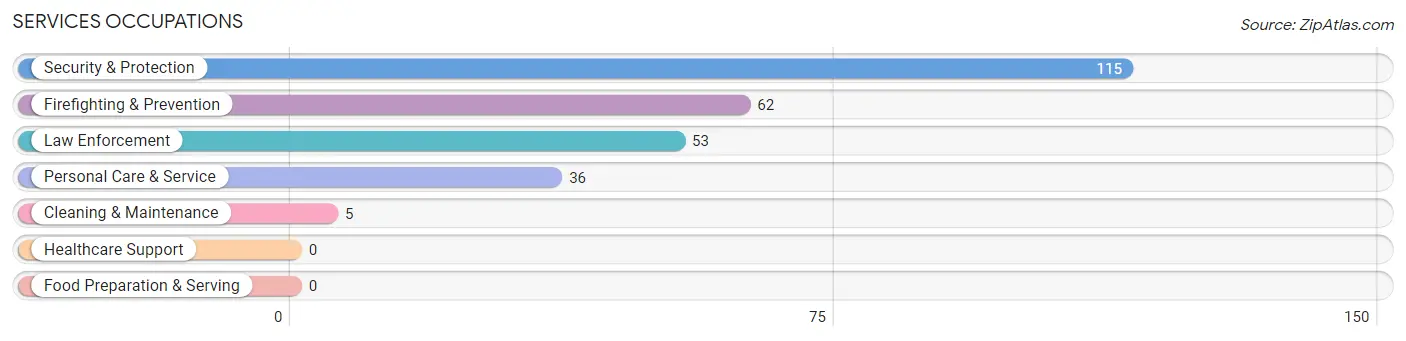
Services Occupations
The most common Services occupations in Shady Hollow are Security & Protection (115 | 4.9%), Firefighting & Prevention (62 | 2.6%), Law Enforcement (53 | 2.3%), Personal Care & Service (36 | 1.5%), and Cleaning & Maintenance (5 | 0.2%).
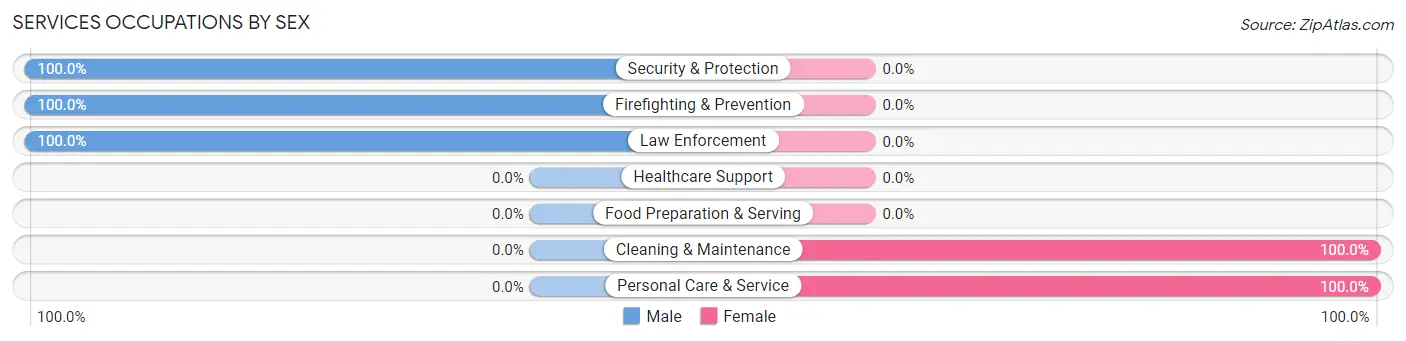
Services Occupations by Sex
Within the Services occupations in Shady Hollow, the most male-oriented occupations are Security & Protection (100.0%), Firefighting & Prevention (100.0%), and Law Enforcement (100.0%), while the most female-oriented occupations are Cleaning & Maintenance (100.0%), and Personal Care & Service (100.0%).
| Occupation | Male | Female |
| Healthcare Support | 0 (0.0%) | 0 (0.0%) |
| Security & Protection | 115 (100.0%) | 0 (0.0%) |
| Firefighting & Prevention | 62 (100.0%) | 0 (0.0%) |
| Law Enforcement | 53 (100.0%) | 0 (0.0%) |
| Food Preparation & Serving | 0 (0.0%) | 0 (0.0%) |
| Cleaning & Maintenance | 0 (0.0%) | 5 (100.0%) |
| Personal Care & Service | 0 (0.0%) | 36 (100.0%) |
| Total (Category) | 115 (73.7%) | 41 (26.3%) |
| Total (Overall) | 1,345 (57.4%) | 999 (42.6%) |
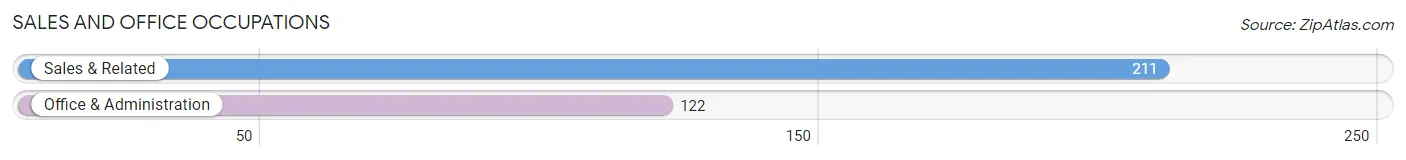
Sales and Office Occupations
The most common Sales and Office occupations in Shady Hollow are Sales & Related (211 | 9.0%), and Office & Administration (122 | 5.2%).
Sales and Office Occupations by Sex
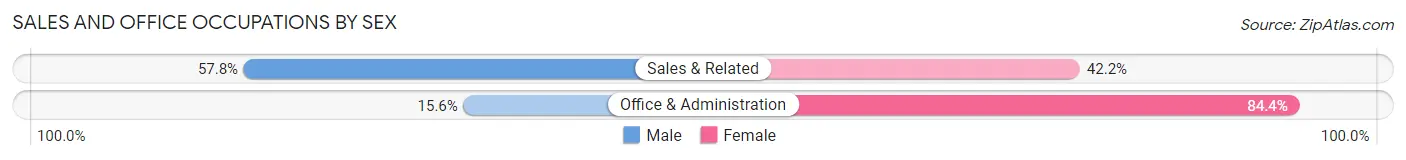
| Occupation | Male | Female |
| Sales & Related | 122 (57.8%) | 89 (42.2%) |
| Office & Administration | 19 (15.6%) | 103 (84.4%) |
| Total (Category) | 141 (42.3%) | 192 (57.7%) |
| Total (Overall) | 1,345 (57.4%) | 999 (42.6%) |
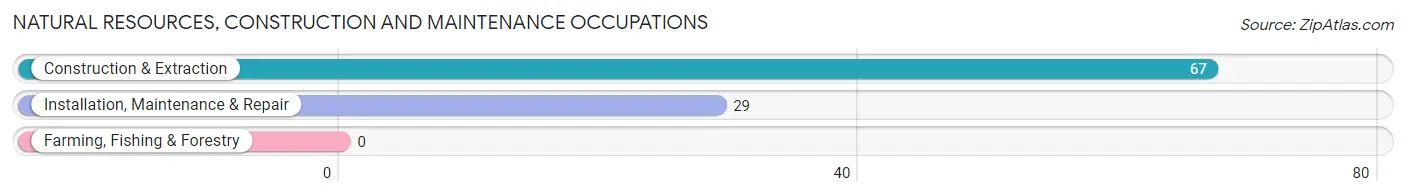
Natural Resources, Construction and Maintenance Occupations
The most common Natural Resources, Construction and Maintenance occupations in Shady Hollow are Construction & Extraction (67 | 2.9%), and Installation, Maintenance & Repair (29 | 1.2%).
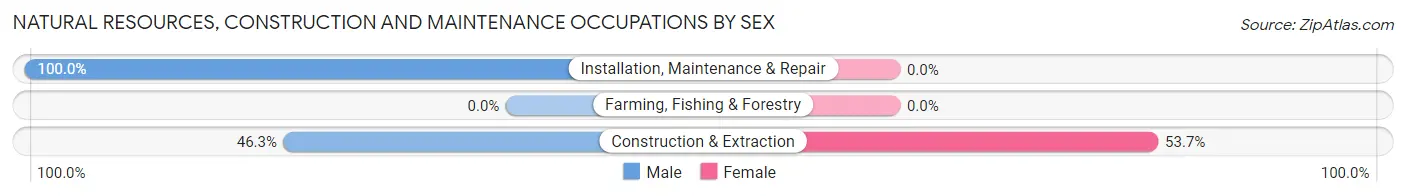
Natural Resources, Construction and Maintenance Occupations by Sex
| Occupation | Male | Female |
| Farming, Fishing & Forestry | 0 (0.0%) | 0 (0.0%) |
| Construction & Extraction | 31 (46.3%) | 36 (53.7%) |
| Installation, Maintenance & Repair | 29 (100.0%) | 0 (0.0%) |
| Total (Category) | 60 (62.5%) | 36 (37.5%) |
| Total (Overall) | 1,345 (57.4%) | 999 (42.6%) |
Production, Transportation and Moving Occupations
The most common Production, Transportation and Moving occupations in Shady Hollow are , and Transportation (24 | 1.0%).
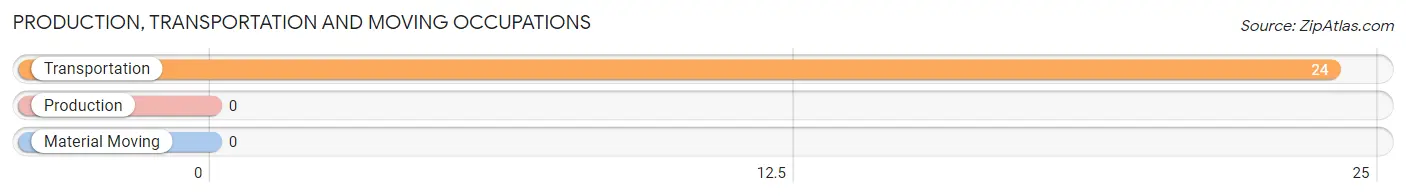
Production, Transportation and Moving Occupations by Sex
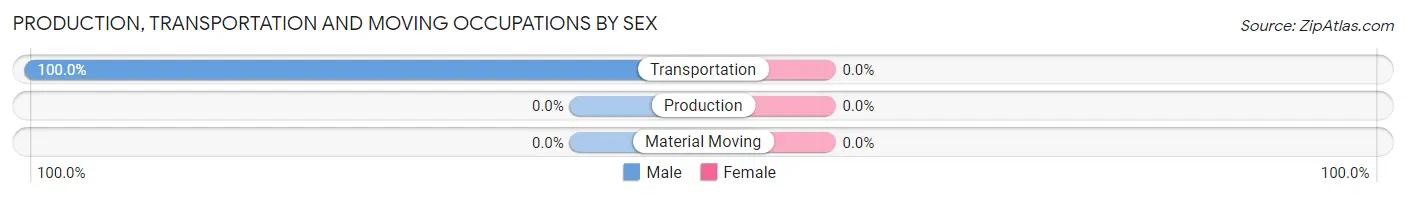
| Occupation | Male | Female |
| Production | 0 (0.0%) | 0 (0.0%) |
| Transportation | 24 (100.0%) | 0 (0.0%) |
| Material Moving | 0 (0.0%) | 0 (0.0%) |
| Total (Category) | 24 (100.0%) | 0 (0.0%) |
| Total (Overall) | 1,345 (57.4%) | 999 (42.6%) |
Employment Industries by Sex in Shady Hollow
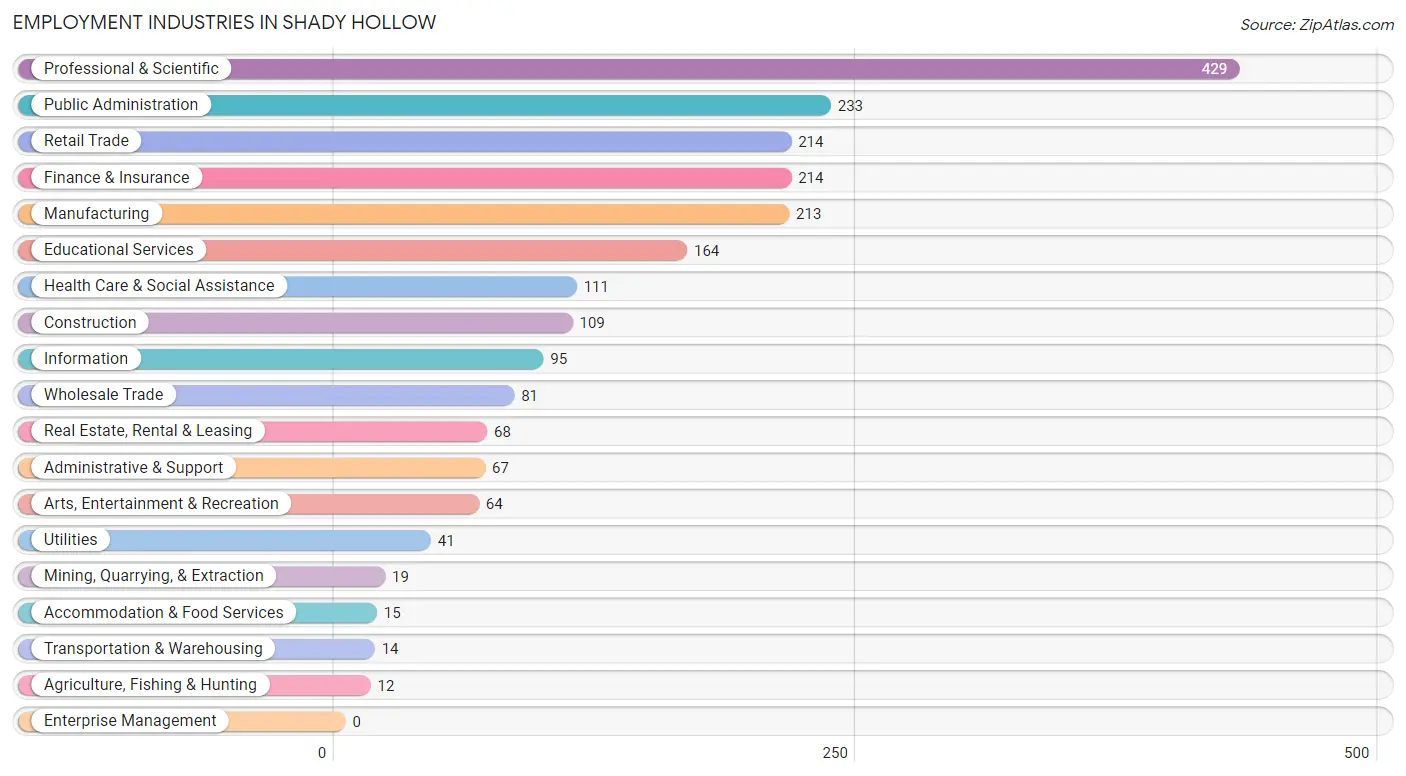
Employment Industries in Shady Hollow
The major employment industries in Shady Hollow include Professional & Scientific (429 | 18.3%), Public Administration (233 | 9.9%), Retail Trade (214 | 9.1%), Finance & Insurance (214 | 9.1%), and Manufacturing (213 | 9.1%).
Employment Industries by Sex in Shady Hollow
The Shady Hollow industries that see more men than women are Agriculture, Fishing & Hunting (100.0%), Mining, Quarrying, & Extraction (100.0%), and Real Estate, Rental & Leasing (100.0%), whereas the industries that tend to have a higher number of women are Transportation & Warehousing (100.0%), Accommodation & Food Services (100.0%), and Finance & Insurance (66.8%).
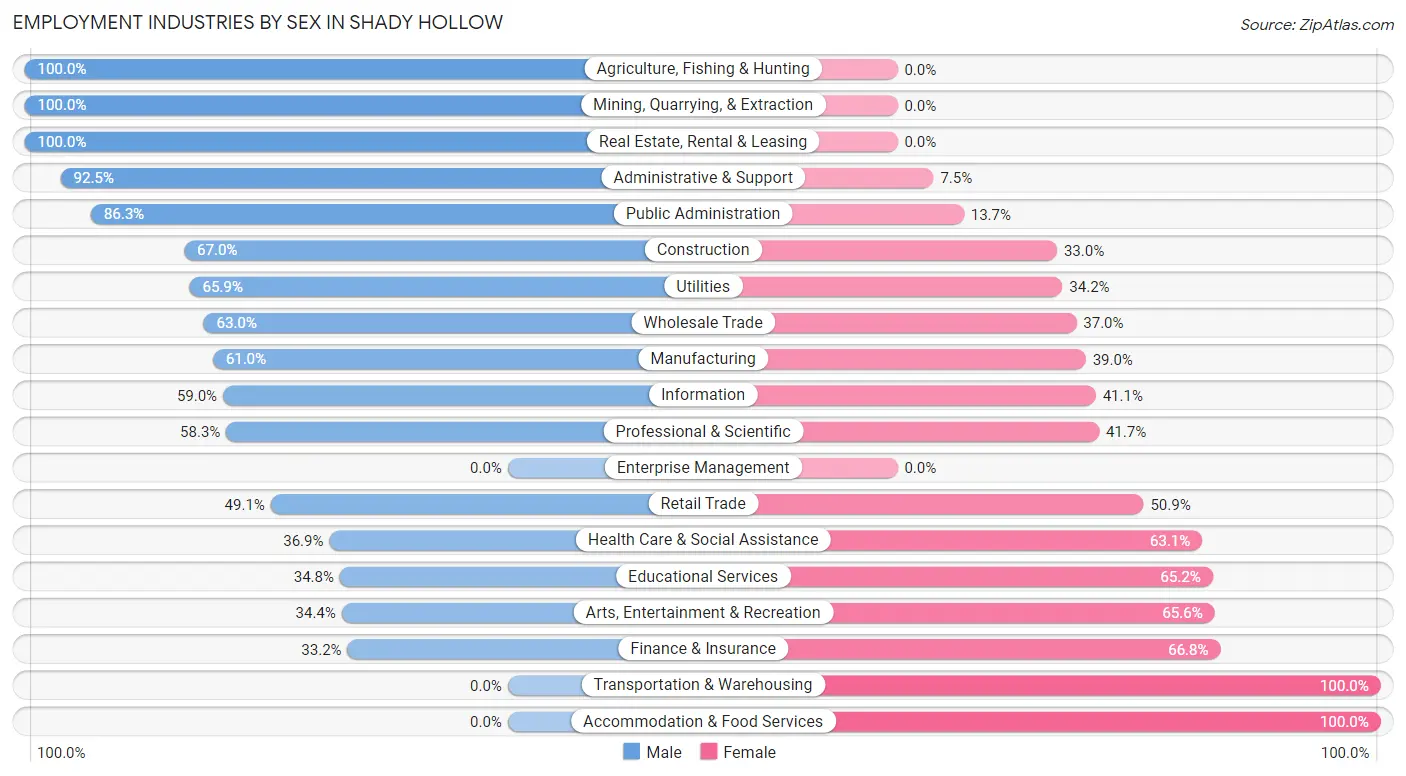
| Industry | Male | Female |
| Agriculture, Fishing & Hunting | 12 (100.0%) | 0 (0.0%) |
| Mining, Quarrying, & Extraction | 19 (100.0%) | 0 (0.0%) |
| Construction | 73 (67.0%) | 36 (33.0%) |
| Manufacturing | 130 (61.0%) | 83 (39.0%) |
| Wholesale Trade | 51 (63.0%) | 30 (37.0%) |
| Retail Trade | 105 (49.1%) | 109 (50.9%) |
| Transportation & Warehousing | 0 (0.0%) | 14 (100.0%) |
| Utilities | 27 (65.8%) | 14 (34.2%) |
| Information | 56 (59.0%) | 39 (41.0%) |
| Finance & Insurance | 71 (33.2%) | 143 (66.8%) |
| Real Estate, Rental & Leasing | 68 (100.0%) | 0 (0.0%) |
| Professional & Scientific | 250 (58.3%) | 179 (41.7%) |
| Enterprise Management | 0 (0.0%) | 0 (0.0%) |
| Administrative & Support | 62 (92.5%) | 5 (7.5%) |
| Educational Services | 57 (34.8%) | 107 (65.2%) |
| Health Care & Social Assistance | 41 (36.9%) | 70 (63.1%) |
| Arts, Entertainment & Recreation | 22 (34.4%) | 42 (65.6%) |
| Accommodation & Food Services | 0 (0.0%) | 15 (100.0%) |
| Public Administration | 201 (86.3%) | 32 (13.7%) |
| Total | 1,345 (57.4%) | 999 (42.6%) |
Education in Shady Hollow
School Enrollment in Shady Hollow
The most common levels of schooling among the 1,222 students in Shady Hollow are high school (293 | 24.0%), middle school (279 | 22.8%), and elementary school (257 | 21.0%).
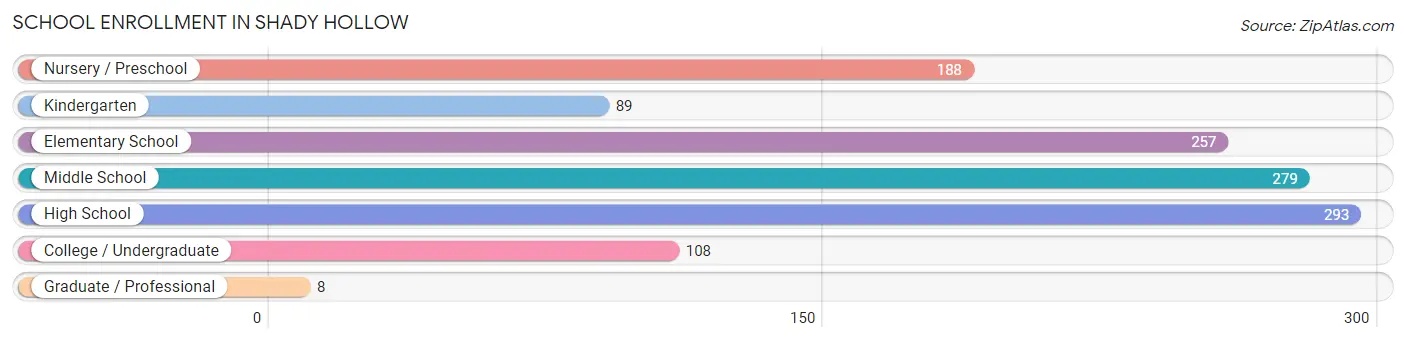
| School Level | # Students | % Students |
| Nursery / Preschool | 188 | 15.4% |
| Kindergarten | 89 | 7.3% |
| Elementary School | 257 | 21.0% |
| Middle School | 279 | 22.8% |
| High School | 293 | 24.0% |
| College / Undergraduate | 108 | 8.8% |
| Graduate / Professional | 8 | 0.6% |
| Total | 1,222 | 100.0% |
School Enrollment by Age by Funding Source in Shady Hollow
Out of a total of 1,222 students who are enrolled in schools in Shady Hollow, 430 (35.2%) attend a private institution, while the remaining 792 (64.8%) are enrolled in public schools. The age group of 5 to 9 year old has the highest likelihood of being enrolled in private schools, with 242 (52.8% in the age bracket) enrolled. Conversely, the age group of 3 to 4 year olds has the lowest likelihood of being enrolled in a private school, with 44 (100.0% in the age bracket) attending a public institution.
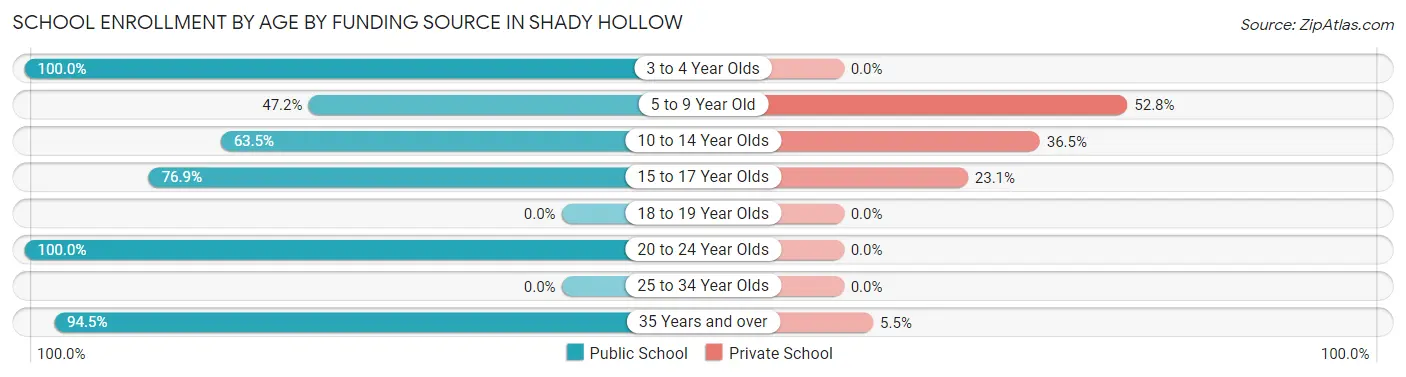
| Age Bracket | Public School | Private School |
| 3 to 4 Year Olds | 44 (100.0%) | 0 (0.0%) |
| 5 to 9 Year Old | 216 (47.2%) | 242 (52.8%) |
| 10 to 14 Year Olds | 205 (63.5%) | 118 (36.5%) |
| 15 to 17 Year Olds | 216 (76.9%) | 65 (23.1%) |
| 18 to 19 Year Olds | 0 (0.0%) | 0 (0.0%) |
| 20 to 24 Year Olds | 25 (100.0%) | 0 (0.0%) |
| 25 to 34 Year Olds | 0 (0.0%) | 0 (0.0%) |
| 35 Years and over | 86 (94.5%) | 5 (5.5%) |
| Total | 792 (64.8%) | 430 (35.2%) |
Educational Attainment by Field of Study in Shady Hollow
Business (676 | 26.1%), social sciences (243 | 9.4%), engineering (227 | 8.8%), visual & performing arts (179 | 6.9%), and literature & languages (177 | 6.8%) are the most common fields of study among 2,589 individuals in Shady Hollow who have obtained a bachelor's degree or higher.
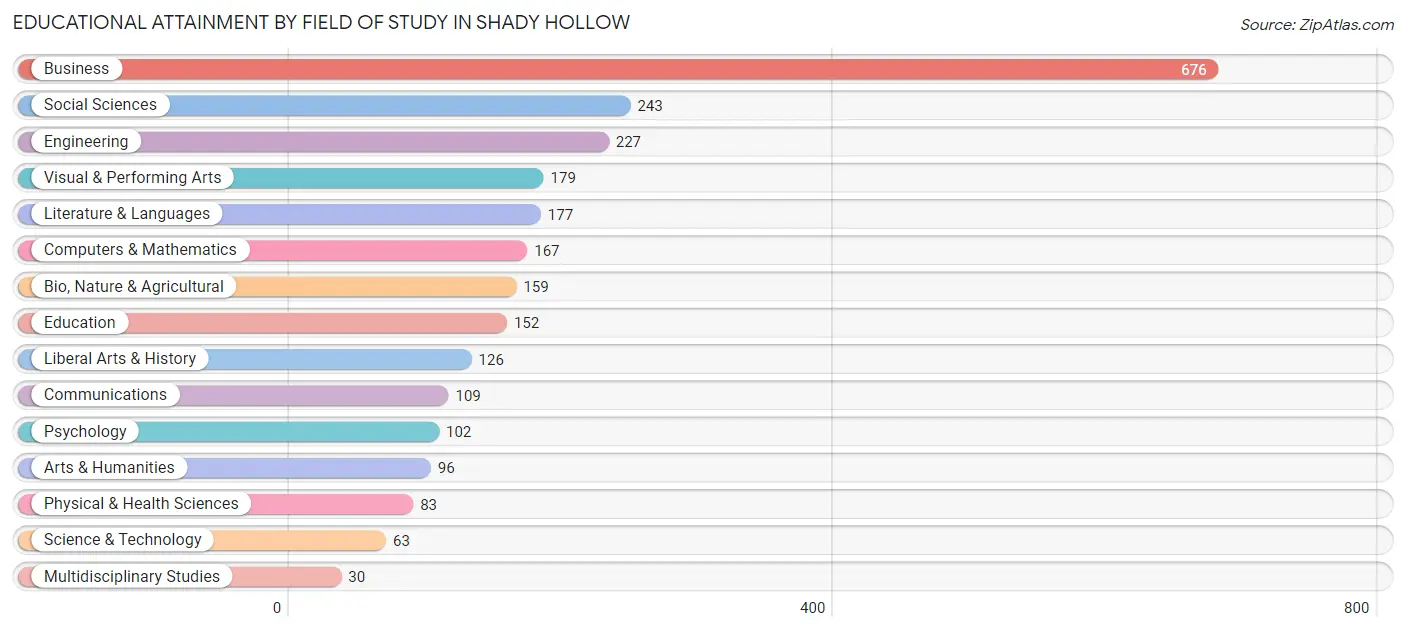
| Field of Study | # Graduates | % Graduates |
| Computers & Mathematics | 167 | 6.5% |
| Bio, Nature & Agricultural | 159 | 6.1% |
| Physical & Health Sciences | 83 | 3.2% |
| Psychology | 102 | 3.9% |
| Social Sciences | 243 | 9.4% |
| Engineering | 227 | 8.8% |
| Multidisciplinary Studies | 30 | 1.2% |
| Science & Technology | 63 | 2.4% |
| Business | 676 | 26.1% |
| Education | 152 | 5.9% |
| Literature & Languages | 177 | 6.8% |
| Liberal Arts & History | 126 | 4.9% |
| Visual & Performing Arts | 179 | 6.9% |
| Communications | 109 | 4.2% |
| Arts & Humanities | 96 | 3.7% |
| Total | 2,589 | 100.0% |
Transportation & Commute in Shady Hollow
Vehicle Availability by Sex in Shady Hollow
The most prevalent vehicle ownership categories in Shady Hollow are males with 2 vehicles (524, accounting for 40.8%) and females with 2 vehicles (394, making up 53.3%).
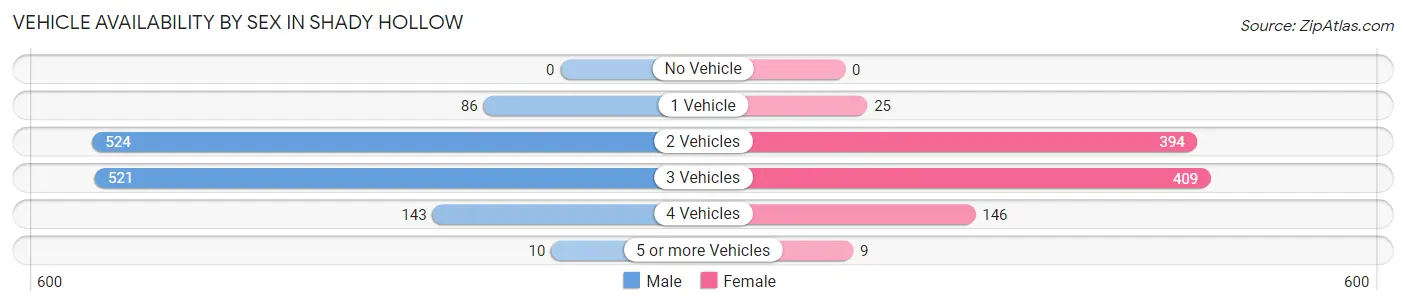
| Vehicles Available | Male | Female |
| No Vehicle | 0 (0.0%) | 0 (0.0%) |
| 1 Vehicle | 86 (6.7%) | 25 (2.5%) |
| 2 Vehicles | 524 (40.8%) | 394 (40.1%) |
| 3 Vehicles | 521 (40.6%) | 409 (41.6%) |
| 4 Vehicles | 143 (11.1%) | 146 (14.8%) |
| 5 or more Vehicles | 10 (0.8%) | 9 (0.9%) |
| Total | 1,284 (100.0%) | 983 (100.0%) |
Commute Time in Shady Hollow
The most frequently occuring commute durations in Shady Hollow are 30 to 34 minutes (283 commuters, 20.0%), 10 to 14 minutes (244 commuters, 17.3%), and 20 to 24 minutes (198 commuters, 14.0%).
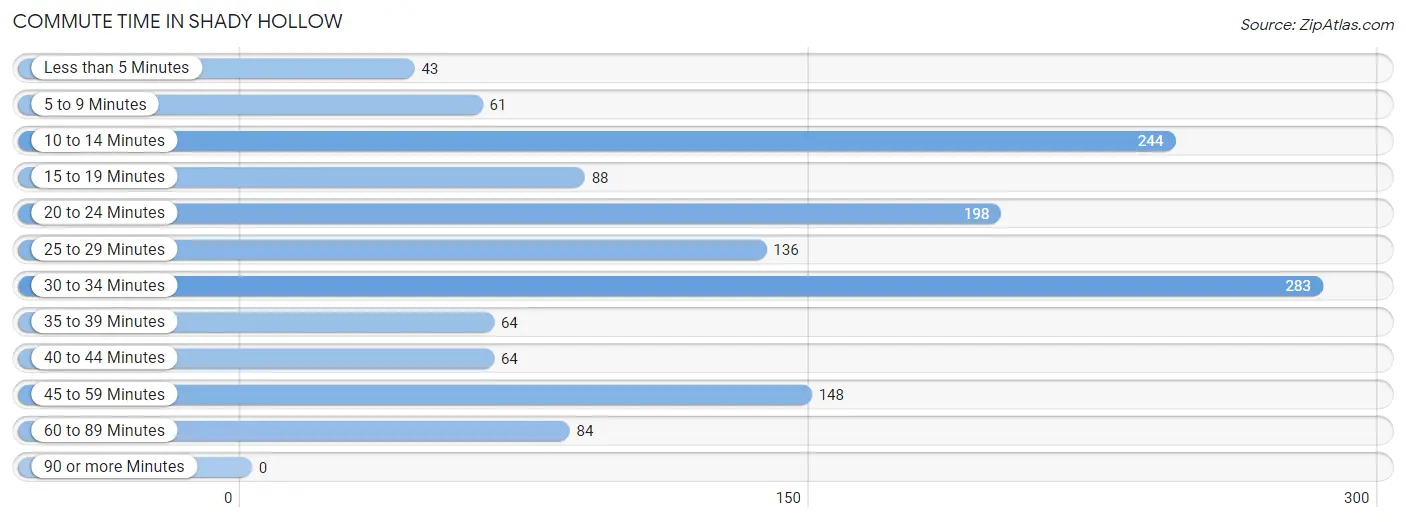
| Commute Time | # Commuters | % Commuters |
| Less than 5 Minutes | 43 | 3.0% |
| 5 to 9 Minutes | 61 | 4.3% |
| 10 to 14 Minutes | 244 | 17.3% |
| 15 to 19 Minutes | 88 | 6.2% |
| 20 to 24 Minutes | 198 | 14.0% |
| 25 to 29 Minutes | 136 | 9.6% |
| 30 to 34 Minutes | 283 | 20.0% |
| 35 to 39 Minutes | 64 | 4.5% |
| 40 to 44 Minutes | 64 | 4.5% |
| 45 to 59 Minutes | 148 | 10.5% |
| 60 to 89 Minutes | 84 | 5.9% |
| 90 or more Minutes | 0 | 0.0% |
Commute Time by Sex in Shady Hollow
The most common commute times in Shady Hollow are 10 to 14 minutes (187 commuters, 23.7%) for males and 30 to 34 minutes (136 commuters, 21.8%) for females.
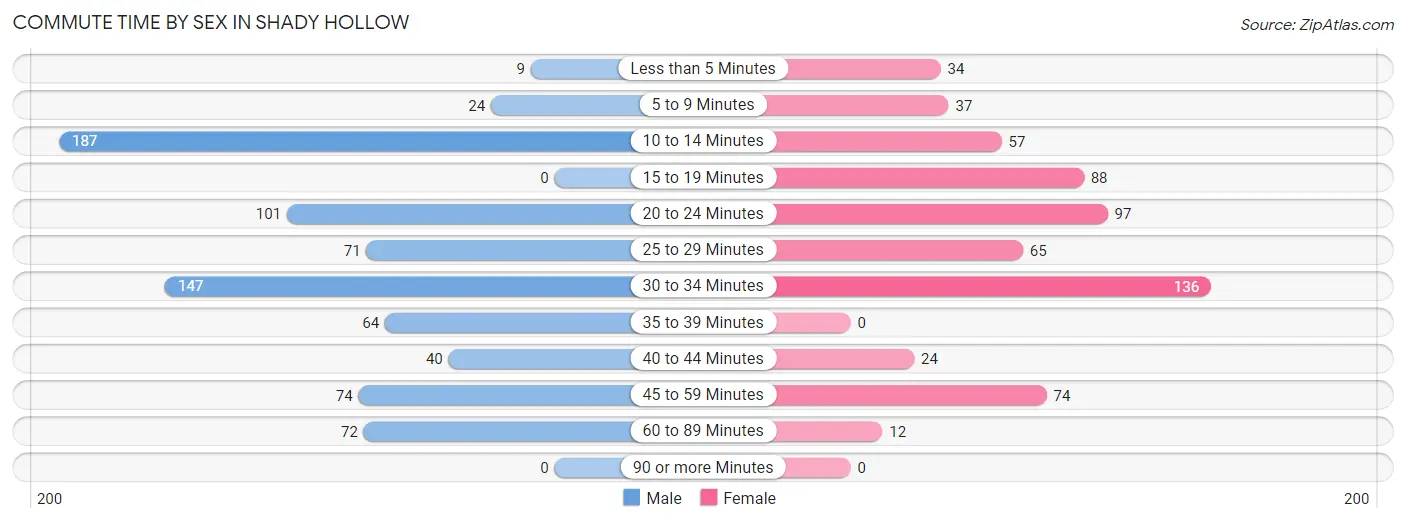
| Commute Time | Male | Female |
| Less than 5 Minutes | 9 (1.1%) | 34 (5.4%) |
| 5 to 9 Minutes | 24 (3.0%) | 37 (5.9%) |
| 10 to 14 Minutes | 187 (23.7%) | 57 (9.1%) |
| 15 to 19 Minutes | 0 (0.0%) | 88 (14.1%) |
| 20 to 24 Minutes | 101 (12.8%) | 97 (15.5%) |
| 25 to 29 Minutes | 71 (9.0%) | 65 (10.4%) |
| 30 to 34 Minutes | 147 (18.6%) | 136 (21.8%) |
| 35 to 39 Minutes | 64 (8.1%) | 0 (0.0%) |
| 40 to 44 Minutes | 40 (5.1%) | 24 (3.8%) |
| 45 to 59 Minutes | 74 (9.4%) | 74 (11.9%) |
| 60 to 89 Minutes | 72 (9.1%) | 12 (1.9%) |
| 90 or more Minutes | 0 (0.0%) | 0 (0.0%) |
Time of Departure to Work by Sex in Shady Hollow
The most frequent times of departure to work in Shady Hollow are 7:00 AM to 7:29 AM (244, 30.9%) for males and 7:30 AM to 7:59 AM (101, 16.2%) for females.
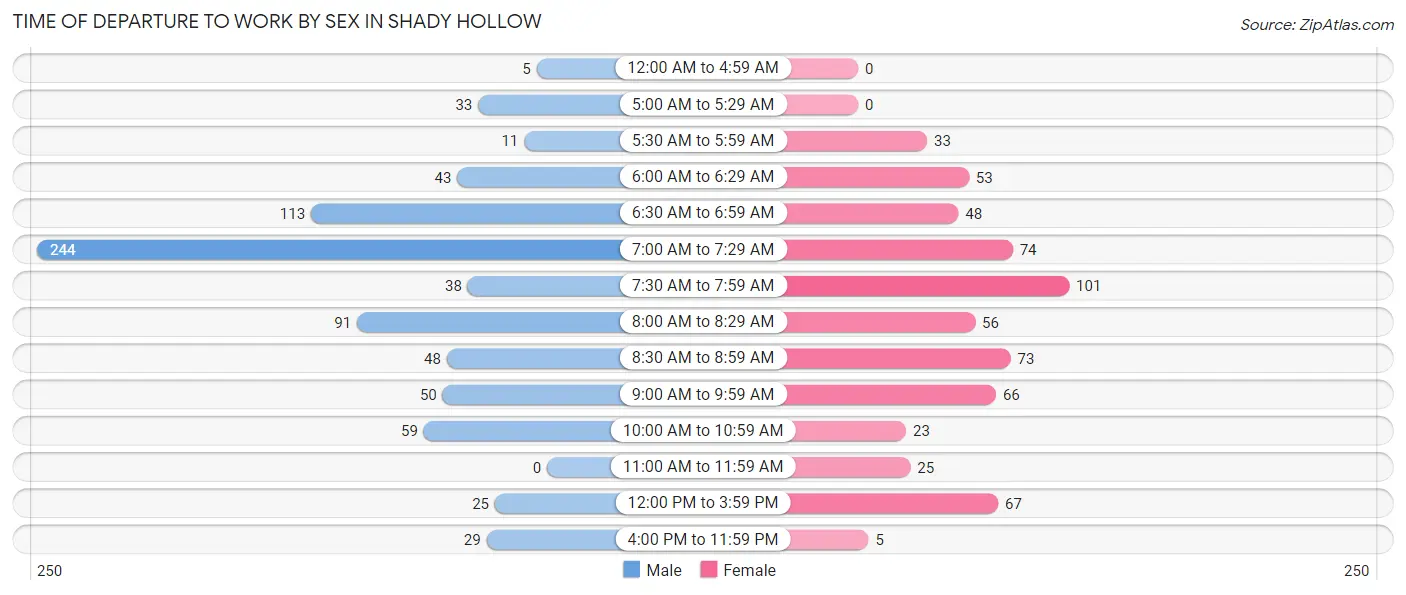
| Time of Departure | Male | Female |
| 12:00 AM to 4:59 AM | 5 (0.6%) | 0 (0.0%) |
| 5:00 AM to 5:29 AM | 33 (4.2%) | 0 (0.0%) |
| 5:30 AM to 5:59 AM | 11 (1.4%) | 33 (5.3%) |
| 6:00 AM to 6:29 AM | 43 (5.4%) | 53 (8.5%) |
| 6:30 AM to 6:59 AM | 113 (14.3%) | 48 (7.7%) |
| 7:00 AM to 7:29 AM | 244 (30.9%) | 74 (11.9%) |
| 7:30 AM to 7:59 AM | 38 (4.8%) | 101 (16.2%) |
| 8:00 AM to 8:29 AM | 91 (11.5%) | 56 (9.0%) |
| 8:30 AM to 8:59 AM | 48 (6.1%) | 73 (11.7%) |
| 9:00 AM to 9:59 AM | 50 (6.3%) | 66 (10.6%) |
| 10:00 AM to 10:59 AM | 59 (7.5%) | 23 (3.7%) |
| 11:00 AM to 11:59 AM | 0 (0.0%) | 25 (4.0%) |
| 12:00 PM to 3:59 PM | 25 (3.2%) | 67 (10.7%) |
| 4:00 PM to 11:59 PM | 29 (3.7%) | 5 (0.8%) |
| Total | 789 (100.0%) | 624 (100.0%) |
Housing Occupancy in Shady Hollow
Occupancy by Ownership in Shady Hollow
Of the total 1,896 dwellings in Shady Hollow, owner-occupied units account for 1,719 (90.7%), while renter-occupied units make up 177 (9.3%).
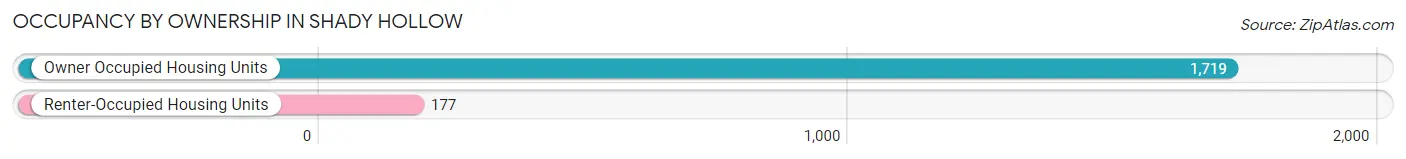
| Occupancy | # Housing Units | % Housing Units |
| Owner Occupied Housing Units | 1,719 | 90.7% |
| Renter-Occupied Housing Units | 177 | 9.3% |
| Total Occupied Housing Units | 1,896 | 100.0% |
Occupancy by Household Size in Shady Hollow
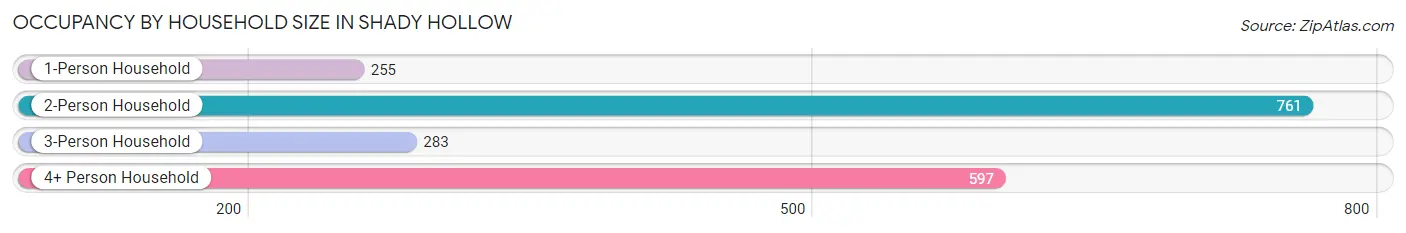
| Household Size | # Housing Units | % Housing Units |
| 1-Person Household | 255 | 13.5% |
| 2-Person Household | 761 | 40.1% |
| 3-Person Household | 283 | 14.9% |
| 4+ Person Household | 597 | 31.5% |
| Total Housing Units | 1,896 | 100.0% |
Occupancy by Ownership by Household Size in Shady Hollow
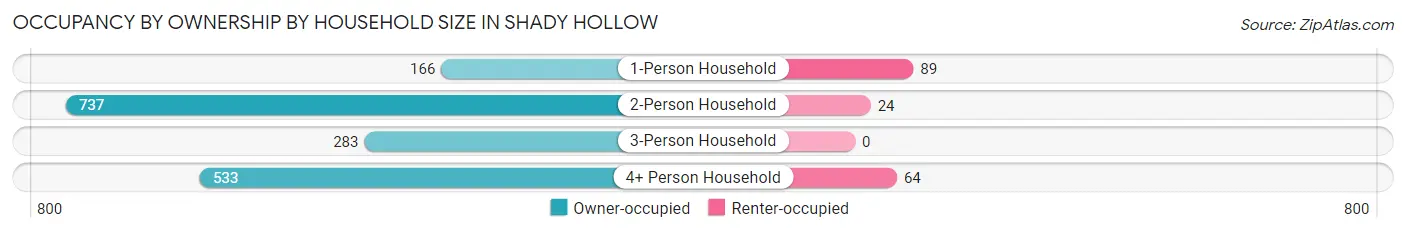
| Household Size | Owner-occupied | Renter-occupied |
| 1-Person Household | 166 (65.1%) | 89 (34.9%) |
| 2-Person Household | 737 (96.9%) | 24 (3.2%) |
| 3-Person Household | 283 (100.0%) | 0 (0.0%) |
| 4+ Person Household | 533 (89.3%) | 64 (10.7%) |
| Total Housing Units | 1,719 (90.7%) | 177 (9.3%) |
Occupancy by Educational Attainment in Shady Hollow
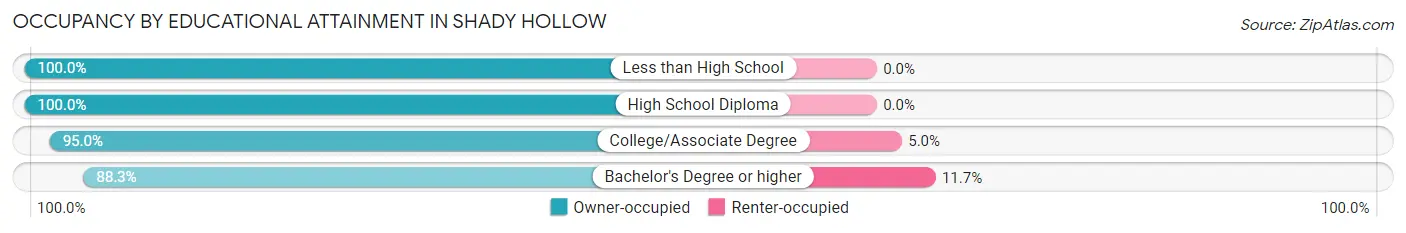
| Household Size | Owner-occupied | Renter-occupied |
| Less than High School | 11 (100.0%) | 0 (0.0%) |
| High School Diploma | 91 (100.0%) | 0 (0.0%) |
| College/Associate Degree | 458 (95.0%) | 24 (5.0%) |
| Bachelor's Degree or higher | 1,159 (88.3%) | 153 (11.7%) |
Occupancy by Age of Householder in Shady Hollow
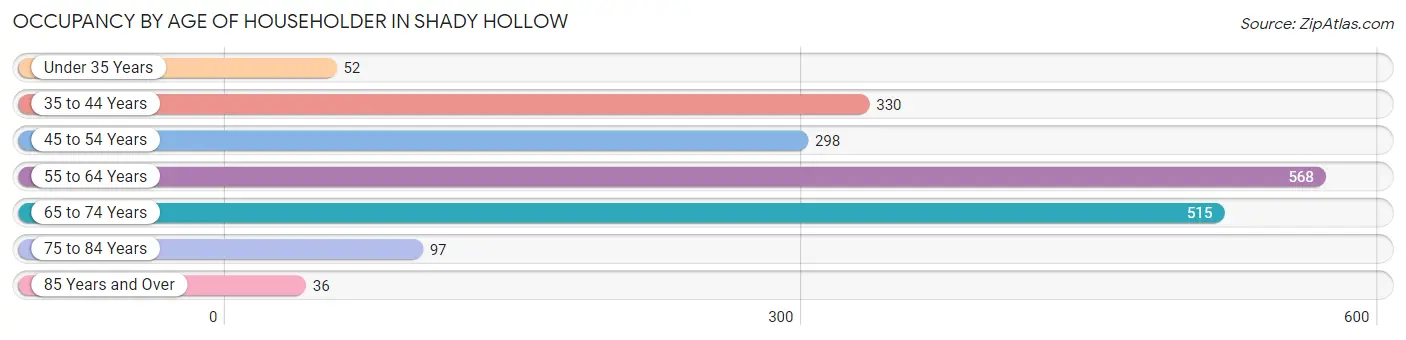
| Age Bracket | # Households | % Households |
| Under 35 Years | 52 | 2.7% |
| 35 to 44 Years | 330 | 17.4% |
| 45 to 54 Years | 298 | 15.7% |
| 55 to 64 Years | 568 | 30.0% |
| 65 to 74 Years | 515 | 27.2% |
| 75 to 84 Years | 97 | 5.1% |
| 85 Years and Over | 36 | 1.9% |
| Total | 1,896 | 100.0% |
Housing Finances in Shady Hollow
Median Income by Occupancy in Shady Hollow
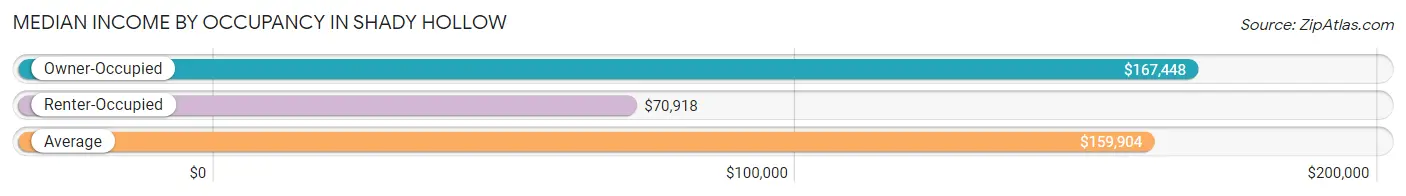
| Occupancy Type | # Households | Median Income |
| Owner-Occupied | 1,719 (90.7%) | $167,448 |
| Renter-Occupied | 177 (9.3%) | $70,918 |
| Average | 1,896 (100.0%) | $159,904 |
Occupancy by Householder Income Bracket in Shady Hollow
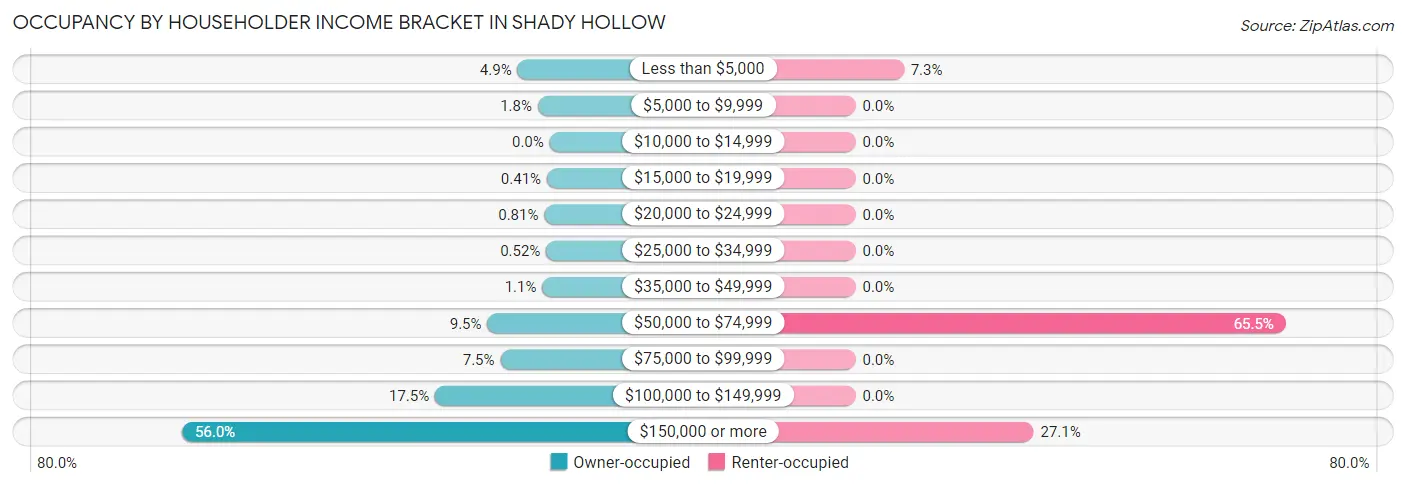
| Income Bracket | Owner-occupied | Renter-occupied |
| Less than $5,000 | 84 (4.9%) | 13 (7.3%) |
| $5,000 to $9,999 | 31 (1.8%) | 0 (0.0%) |
| $10,000 to $14,999 | 0 (0.0%) | 0 (0.0%) |
| $15,000 to $19,999 | 7 (0.4%) | 0 (0.0%) |
| $20,000 to $24,999 | 14 (0.8%) | 0 (0.0%) |
| $25,000 to $34,999 | 9 (0.5%) | 0 (0.0%) |
| $35,000 to $49,999 | 19 (1.1%) | 0 (0.0%) |
| $50,000 to $74,999 | 163 (9.5%) | 116 (65.5%) |
| $75,000 to $99,999 | 129 (7.5%) | 0 (0.0%) |
| $100,000 to $149,999 | 300 (17.4%) | 0 (0.0%) |
| $150,000 or more | 963 (56.0%) | 48 (27.1%) |
| Total | 1,719 (100.0%) | 177 (100.0%) |
Monthly Housing Cost Tiers in Shady Hollow
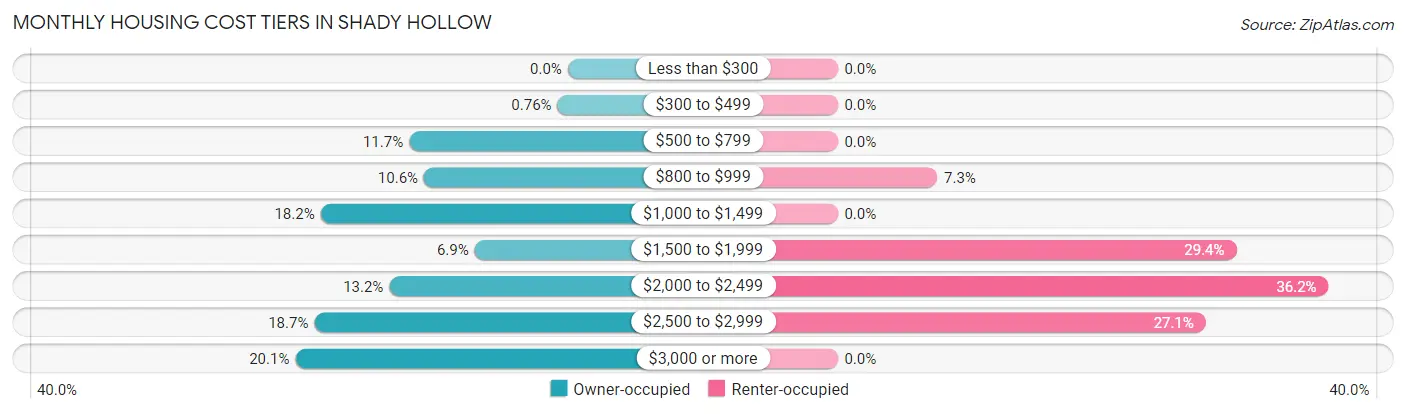
| Monthly Cost | Owner-occupied | Renter-occupied |
| Less than $300 | 0 (0.0%) | 0 (0.0%) |
| $300 to $499 | 13 (0.8%) | 0 (0.0%) |
| $500 to $799 | 201 (11.7%) | 0 (0.0%) |
| $800 to $999 | 182 (10.6%) | 13 (7.3%) |
| $1,000 to $1,499 | 313 (18.2%) | 0 (0.0%) |
| $1,500 to $1,999 | 118 (6.9%) | 52 (29.4%) |
| $2,000 to $2,499 | 226 (13.2%) | 64 (36.2%) |
| $2,500 to $2,999 | 321 (18.7%) | 48 (27.1%) |
| $3,000 or more | 345 (20.1%) | 0 (0.0%) |
| Total | 1,719 (100.0%) | 177 (100.0%) |
Physical Housing Characteristics in Shady Hollow
Housing Structures in Shady Hollow
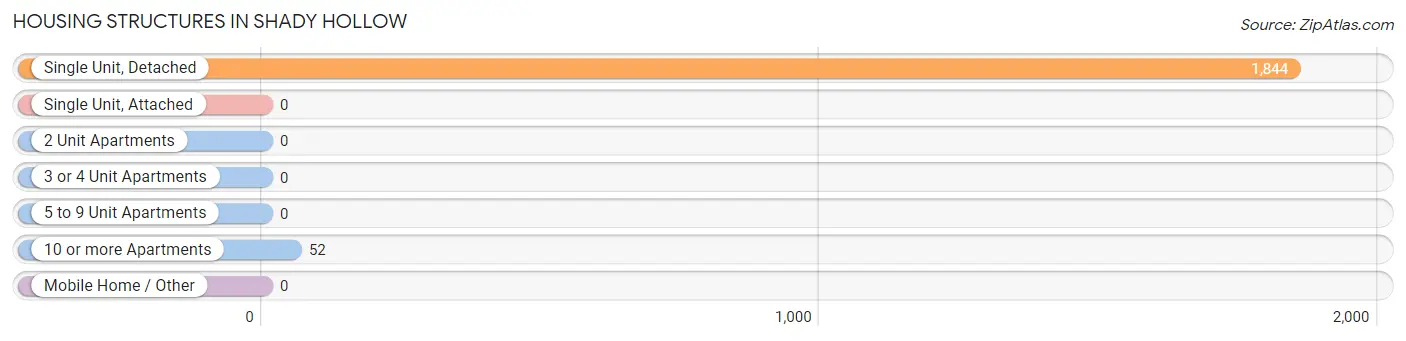
| Structure Type | # Housing Units | % Housing Units |
| Single Unit, Detached | 1,844 | 97.3% |
| Single Unit, Attached | 0 | 0.0% |
| 2 Unit Apartments | 0 | 0.0% |
| 3 or 4 Unit Apartments | 0 | 0.0% |
| 5 to 9 Unit Apartments | 0 | 0.0% |
| 10 or more Apartments | 52 | 2.7% |
| Mobile Home / Other | 0 | 0.0% |
| Total | 1,896 | 100.0% |
Housing Structures by Occupancy in Shady Hollow
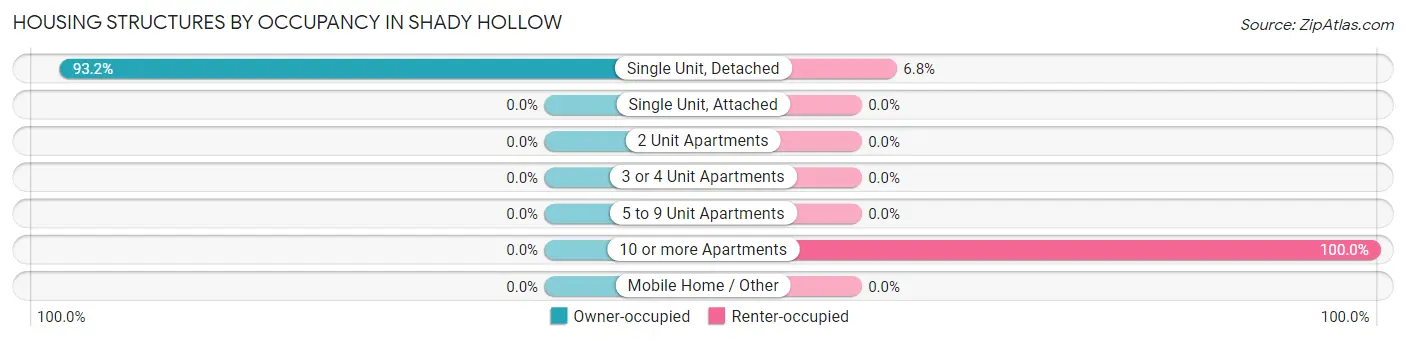
| Structure Type | Owner-occupied | Renter-occupied |
| Single Unit, Detached | 1,719 (93.2%) | 125 (6.8%) |
| Single Unit, Attached | 0 (0.0%) | 0 (0.0%) |
| 2 Unit Apartments | 0 (0.0%) | 0 (0.0%) |
| 3 or 4 Unit Apartments | 0 (0.0%) | 0 (0.0%) |
| 5 to 9 Unit Apartments | 0 (0.0%) | 0 (0.0%) |
| 10 or more Apartments | 0 (0.0%) | 52 (100.0%) |
| Mobile Home / Other | 0 (0.0%) | 0 (0.0%) |
| Total | 1,719 (90.7%) | 177 (9.3%) |
Housing Structures by Number of Rooms in Shady Hollow
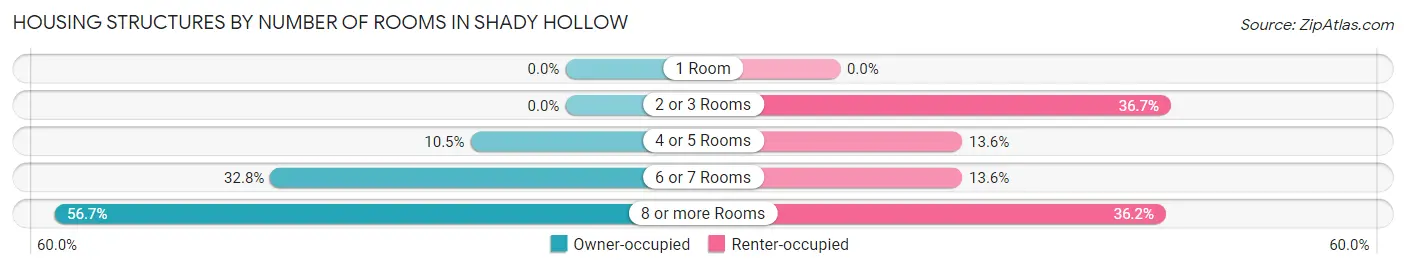
| Number of Rooms | Owner-occupied | Renter-occupied |
| 1 Room | 0 (0.0%) | 0 (0.0%) |
| 2 or 3 Rooms | 0 (0.0%) | 65 (36.7%) |
| 4 or 5 Rooms | 181 (10.5%) | 24 (13.6%) |
| 6 or 7 Rooms | 563 (32.8%) | 24 (13.6%) |
| 8 or more Rooms | 975 (56.7%) | 64 (36.2%) |
| Total | 1,719 (100.0%) | 177 (100.0%) |
Housing Structure by Heating Type in Shady Hollow
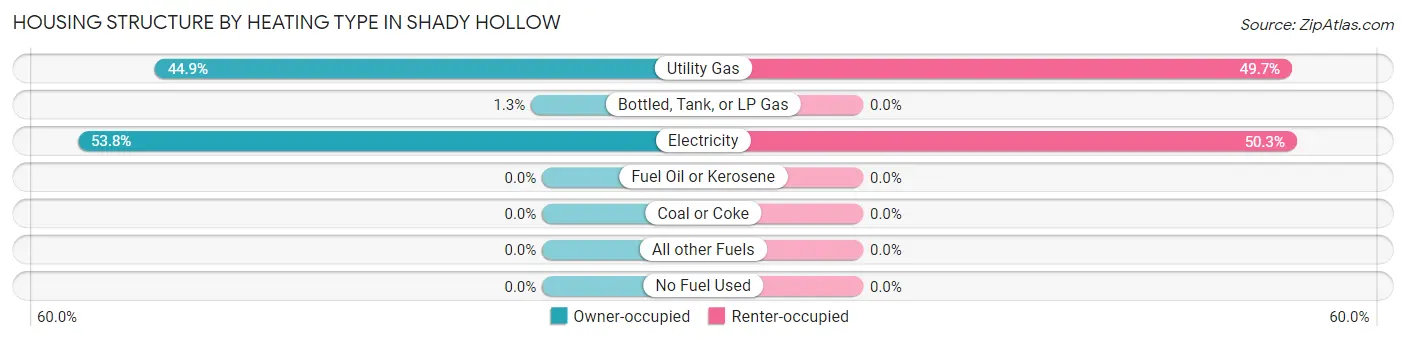
| Heating Type | Owner-occupied | Renter-occupied |
| Utility Gas | 772 (44.9%) | 88 (49.7%) |
| Bottled, Tank, or LP Gas | 22 (1.3%) | 0 (0.0%) |
| Electricity | 925 (53.8%) | 89 (50.3%) |
| Fuel Oil or Kerosene | 0 (0.0%) | 0 (0.0%) |
| Coal or Coke | 0 (0.0%) | 0 (0.0%) |
| All other Fuels | 0 (0.0%) | 0 (0.0%) |
| No Fuel Used | 0 (0.0%) | 0 (0.0%) |
| Total | 1,719 (100.0%) | 177 (100.0%) |
Household Vehicle Usage in Shady Hollow
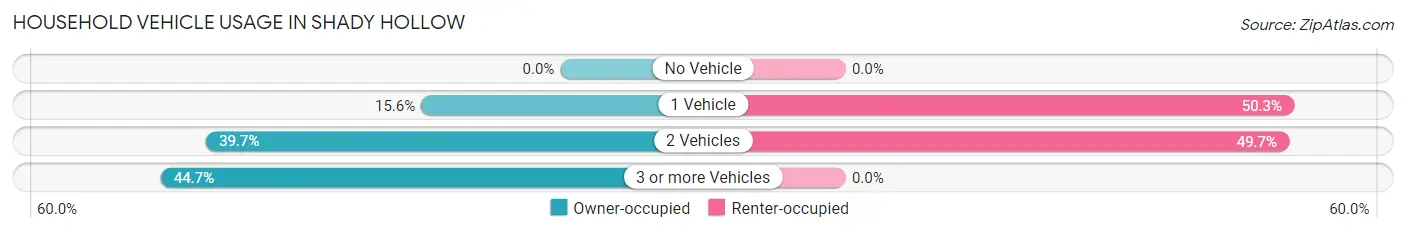
| Vehicles per Household | Owner-occupied | Renter-occupied |
| No Vehicle | 0 (0.0%) | 0 (0.0%) |
| 1 Vehicle | 268 (15.6%) | 89 (50.3%) |
| 2 Vehicles | 682 (39.7%) | 88 (49.7%) |
| 3 or more Vehicles | 769 (44.7%) | 0 (0.0%) |
| Total | 1,719 (100.0%) | 177 (100.0%) |
Real Estate & Mortgages in Shady Hollow
Real Estate and Mortgage Overview in Shady Hollow
| Characteristic | Without Mortgage | With Mortgage |
| Housing Units | 701 | 1,018 |
| Median Property Value | $477,500 | $595,500 |
| Median Household Income | $149,732 | $614 |
| Monthly Housing Costs | $923 | $345 |
| Real Estate Taxes | $6,148 | $29 |
Property Value by Mortgage Status in Shady Hollow
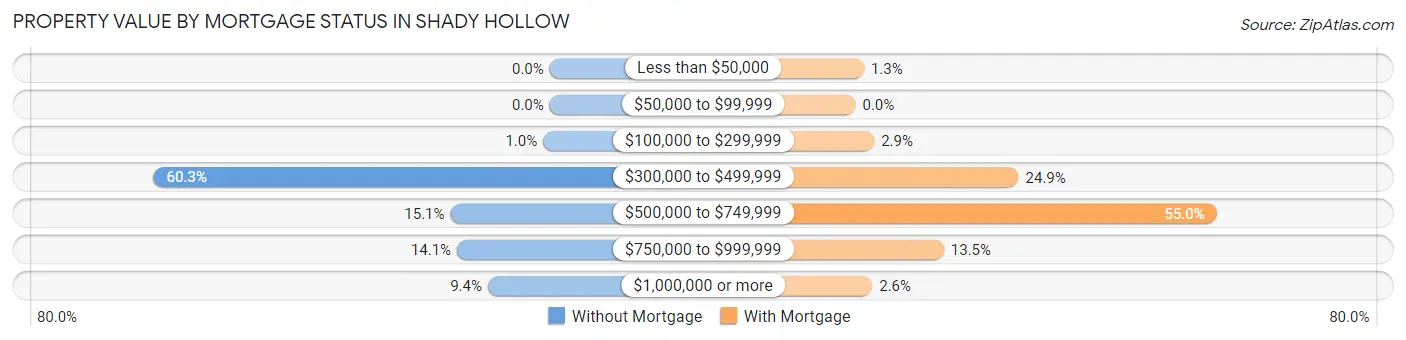
| Property Value | Without Mortgage | With Mortgage |
| Less than $50,000 | 0 (0.0%) | 13 (1.3%) |
| $50,000 to $99,999 | 0 (0.0%) | 0 (0.0%) |
| $100,000 to $299,999 | 7 (1.0%) | 29 (2.9%) |
| $300,000 to $499,999 | 423 (60.3%) | 253 (24.8%) |
| $500,000 to $749,999 | 106 (15.1%) | 560 (55.0%) |
| $750,000 to $999,999 | 99 (14.1%) | 137 (13.5%) |
| $1,000,000 or more | 66 (9.4%) | 26 (2.5%) |
| Total | 701 (100.0%) | 1,018 (100.0%) |
Household Income by Mortgage Status in Shady Hollow
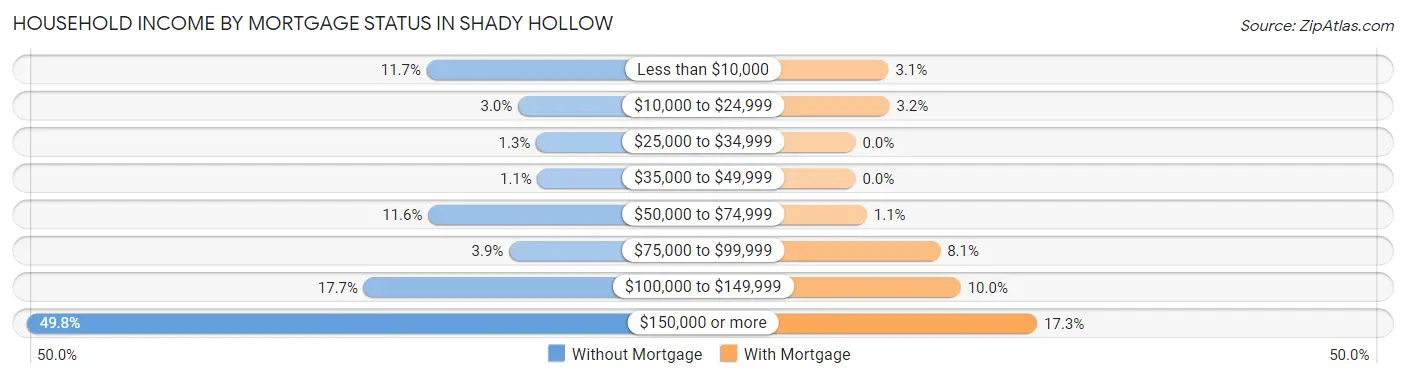
| Household Income | Without Mortgage | With Mortgage |
| Less than $10,000 | 82 (11.7%) | 32 (3.1%) |
| $10,000 to $24,999 | 21 (3.0%) | 33 (3.2%) |
| $25,000 to $34,999 | 9 (1.3%) | 0 (0.0%) |
| $35,000 to $49,999 | 8 (1.1%) | 0 (0.0%) |
| $50,000 to $74,999 | 81 (11.6%) | 11 (1.1%) |
| $75,000 to $99,999 | 27 (3.8%) | 82 (8.1%) |
| $100,000 to $149,999 | 124 (17.7%) | 102 (10.0%) |
| $150,000 or more | 349 (49.8%) | 176 (17.3%) |
| Total | 701 (100.0%) | 1,018 (100.0%) |
Property Value to Household Income Ratio in Shady Hollow
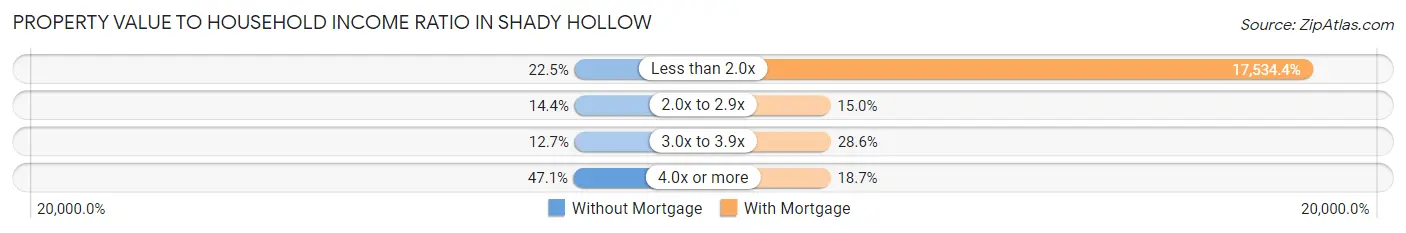
| Value-to-Income Ratio | Without Mortgage | With Mortgage |
| Less than 2.0x | 158 (22.5%) | 178,500 (17,534.4%) |
| 2.0x to 2.9x | 101 (14.4%) | 153 (15.0%) |
| 3.0x to 3.9x | 89 (12.7%) | 291 (28.6%) |
| 4.0x or more | 330 (47.1%) | 190 (18.7%) |
| Total | 701 (100.0%) | 1,018 (100.0%) |
Real Estate Taxes by Mortgage Status in Shady Hollow
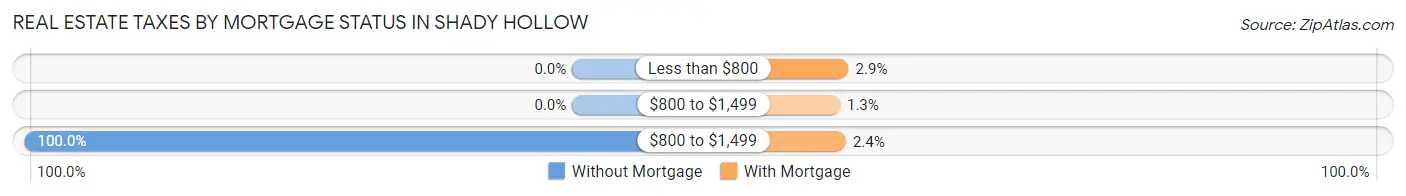
| Property Taxes | Without Mortgage | With Mortgage |
| Less than $800 | 0 (0.0%) | 29 (2.9%) |
| $800 to $1,499 | 0 (0.0%) | 13 (1.3%) |
| $800 to $1,499 | 701 (100.0%) | 24 (2.4%) |
| Total | 701 (100.0%) | 1,018 (100.0%) |
Health & Disability in Shady Hollow
Health Insurance Coverage by Age in Shady Hollow
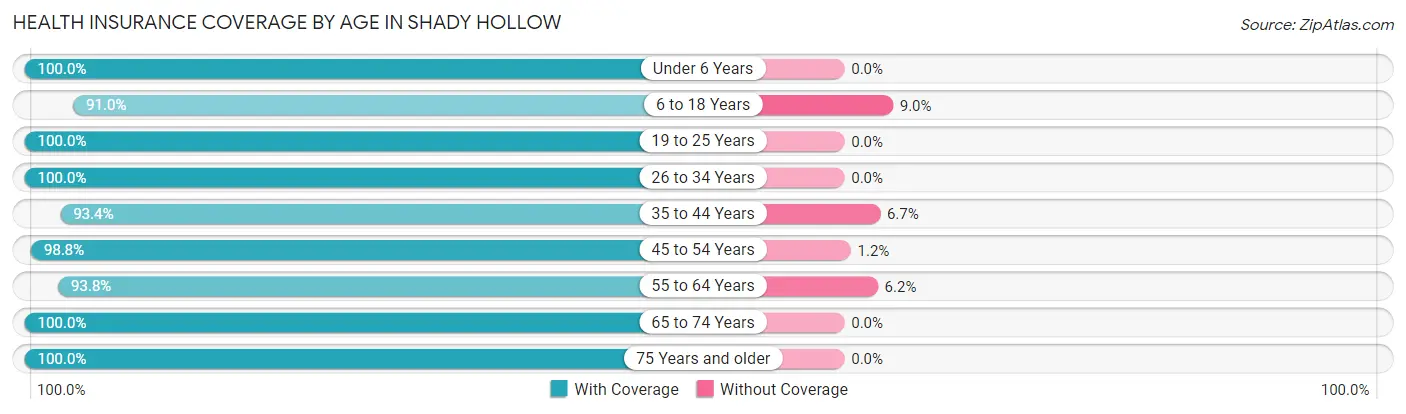
| Age Bracket | With Coverage | Without Coverage |
| Under 6 Years | 456 (100.0%) | 0 (0.0%) |
| 6 to 18 Years | 785 (91.0%) | 78 (9.0%) |
| 19 to 25 Years | 204 (100.0%) | 0 (0.0%) |
| 26 to 34 Years | 137 (100.0%) | 0 (0.0%) |
| 35 to 44 Years | 646 (93.3%) | 46 (6.7%) |
| 45 to 54 Years | 592 (98.8%) | 7 (1.2%) |
| 55 to 64 Years | 1,071 (93.8%) | 71 (6.2%) |
| 65 to 74 Years | 897 (100.0%) | 0 (0.0%) |
| 75 Years and older | 310 (100.0%) | 0 (0.0%) |
| Total | 5,098 (96.2%) | 202 (3.8%) |
Health Insurance Coverage by Citizenship Status in Shady Hollow
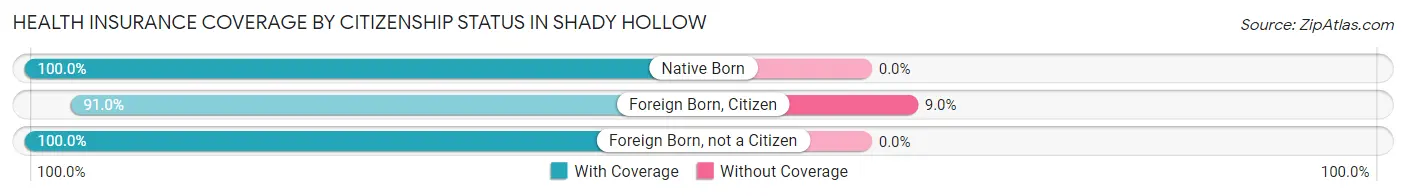
| Citizenship Status | With Coverage | Without Coverage |
| Native Born | 456 (100.0%) | 0 (0.0%) |
| Foreign Born, Citizen | 785 (91.0%) | 78 (9.0%) |
| Foreign Born, not a Citizen | 204 (100.0%) | 0 (0.0%) |
Health Insurance Coverage by Household Income in Shady Hollow
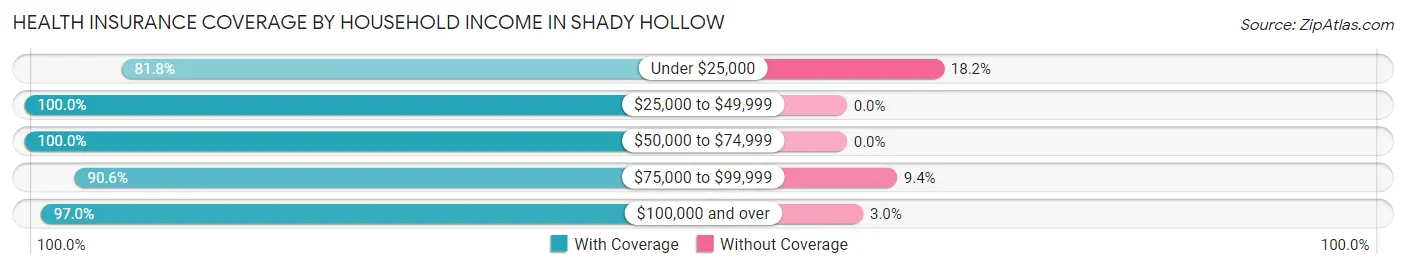
| Household Income | With Coverage | Without Coverage |
| Under $25,000 | 198 (81.8%) | 44 (18.2%) |
| $25,000 to $49,999 | 37 (100.0%) | 0 (0.0%) |
| $50,000 to $74,999 | 702 (100.0%) | 0 (0.0%) |
| $75,000 to $99,999 | 396 (90.6%) | 41 (9.4%) |
| $100,000 and over | 3,732 (97.0%) | 117 (3.0%) |
Public vs Private Health Insurance Coverage by Age in Shady Hollow
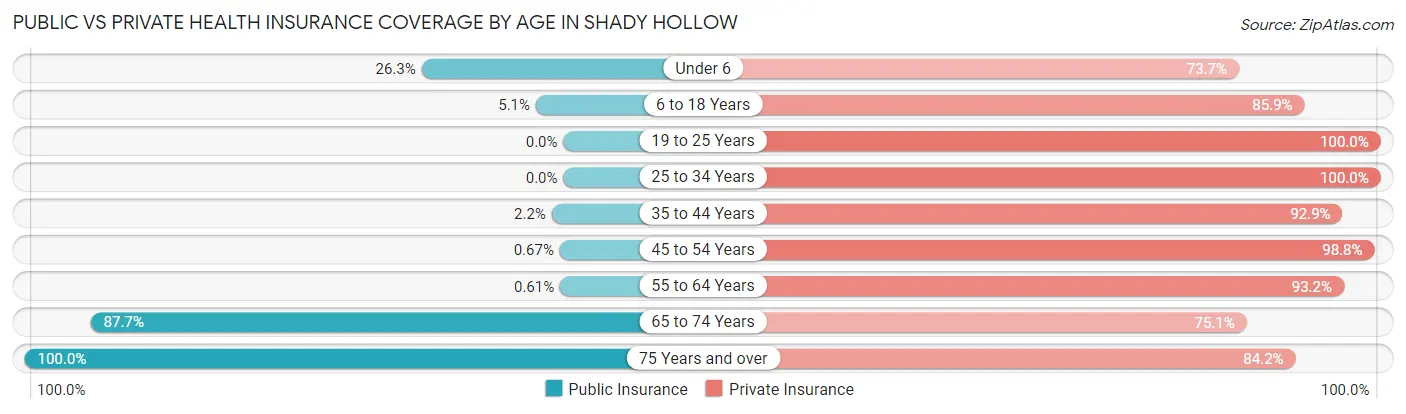
| Age Bracket | Public Insurance | Private Insurance |
| Under 6 | 120 (26.3%) | 336 (73.7%) |
| 6 to 18 Years | 44 (5.1%) | 741 (85.9%) |
| 19 to 25 Years | 0 (0.0%) | 204 (100.0%) |
| 25 to 34 Years | 0 (0.0%) | 137 (100.0%) |
| 35 to 44 Years | 15 (2.2%) | 643 (92.9%) |
| 45 to 54 Years | 4 (0.7%) | 592 (98.8%) |
| 55 to 64 Years | 7 (0.6%) | 1,064 (93.2%) |
| 65 to 74 Years | 787 (87.7%) | 674 (75.1%) |
| 75 Years and over | 310 (100.0%) | 261 (84.2%) |
| Total | 1,287 (24.3%) | 4,652 (87.8%) |
Disability Status by Sex by Age in Shady Hollow
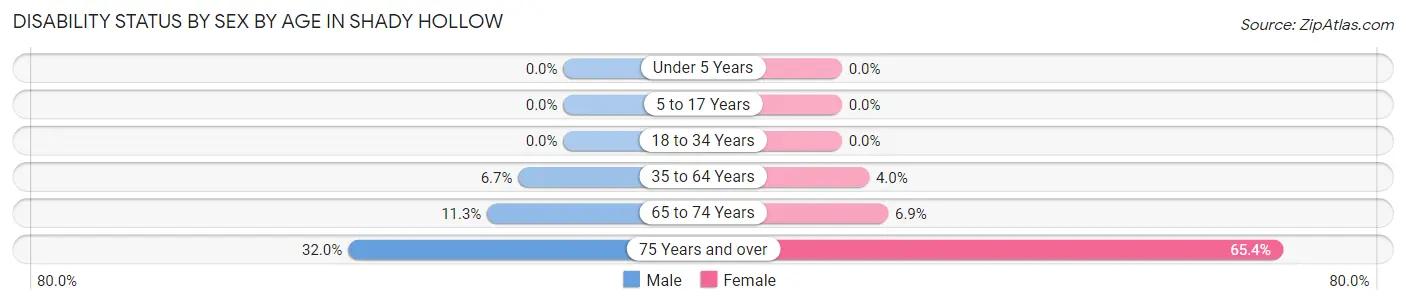
| Age Bracket | Male | Female |
| Under 5 Years | 0 (0.0%) | 0 (0.0%) |
| 5 to 17 Years | 0 (0.0%) | 0 (0.0%) |
| 18 to 34 Years | 0 (0.0%) | 0 (0.0%) |
| 35 to 64 Years | 83 (6.7%) | 48 (4.0%) |
| 65 to 74 Years | 57 (11.3%) | 27 (6.9%) |
| 75 Years and over | 39 (32.0%) | 123 (65.4%) |
Disability Class by Sex by Age in Shady Hollow
Disability Class: Hearing Difficulty
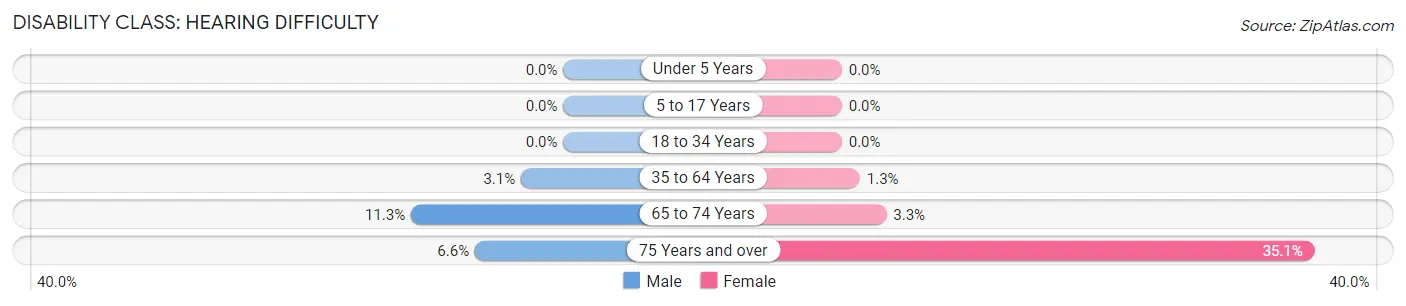
| Age Bracket | Male | Female |
| Under 5 Years | 0 (0.0%) | 0 (0.0%) |
| 5 to 17 Years | 0 (0.0%) | 0 (0.0%) |
| 18 to 34 Years | 0 (0.0%) | 0 (0.0%) |
| 35 to 64 Years | 39 (3.1%) | 16 (1.3%) |
| 65 to 74 Years | 57 (11.3%) | 13 (3.3%) |
| 75 Years and over | 8 (6.6%) | 66 (35.1%) |
Disability Class: Vision Difficulty
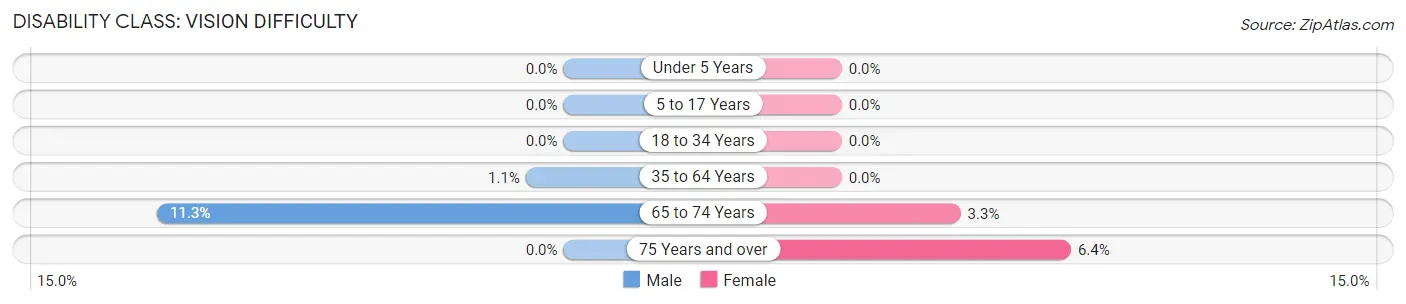
| Age Bracket | Male | Female |
| Under 5 Years | 0 (0.0%) | 0 (0.0%) |
| 5 to 17 Years | 0 (0.0%) | 0 (0.0%) |
| 18 to 34 Years | 0 (0.0%) | 0 (0.0%) |
| 35 to 64 Years | 13 (1.1%) | 0 (0.0%) |
| 65 to 74 Years | 57 (11.3%) | 13 (3.3%) |
| 75 Years and over | 0 (0.0%) | 12 (6.4%) |
Disability Class: Cognitive Difficulty
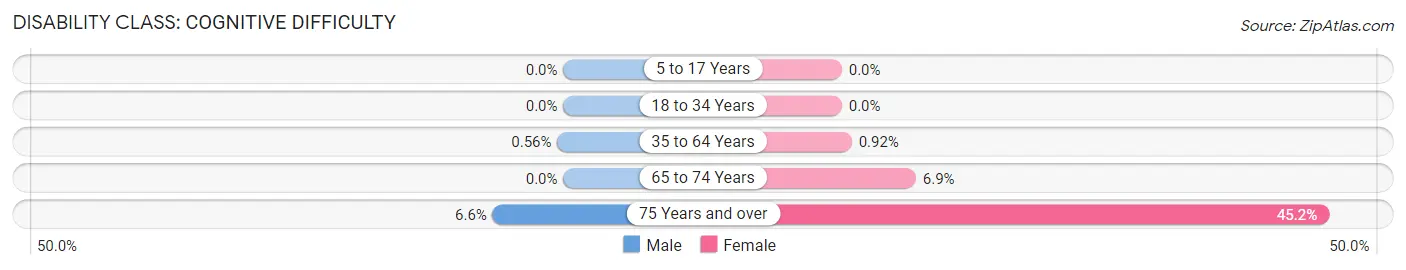
| Age Bracket | Male | Female |
| 5 to 17 Years | 0 (0.0%) | 0 (0.0%) |
| 18 to 34 Years | 0 (0.0%) | 0 (0.0%) |
| 35 to 64 Years | 7 (0.6%) | 11 (0.9%) |
| 65 to 74 Years | 0 (0.0%) | 27 (6.9%) |
| 75 Years and over | 8 (6.6%) | 85 (45.2%) |
Disability Class: Ambulatory Difficulty
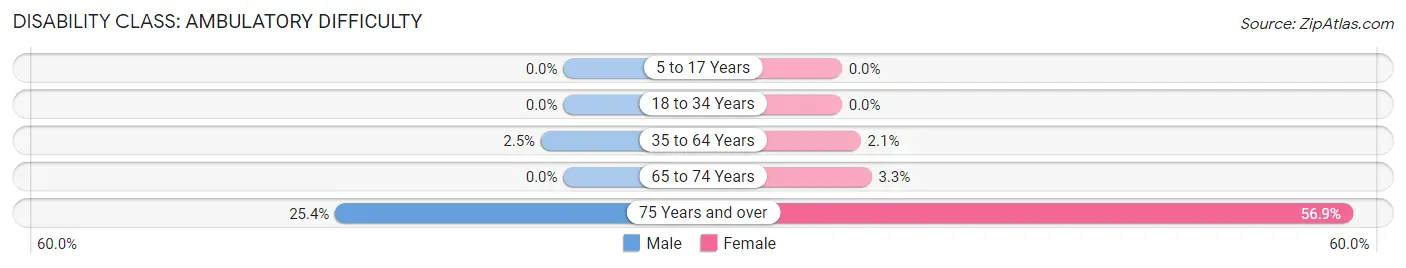
| Age Bracket | Male | Female |
| 5 to 17 Years | 0 (0.0%) | 0 (0.0%) |
| 18 to 34 Years | 0 (0.0%) | 0 (0.0%) |
| 35 to 64 Years | 31 (2.5%) | 25 (2.1%) |
| 65 to 74 Years | 0 (0.0%) | 13 (3.3%) |
| 75 Years and over | 31 (25.4%) | 107 (56.9%) |
Disability Class: Self-Care Difficulty
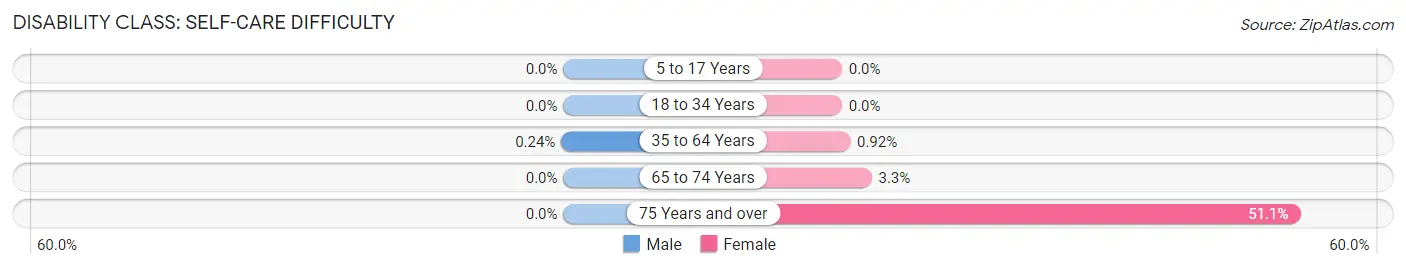
| Age Bracket | Male | Female |
| 5 to 17 Years | 0 (0.0%) | 0 (0.0%) |
| 18 to 34 Years | 0 (0.0%) | 0 (0.0%) |
| 35 to 64 Years | 3 (0.2%) | 11 (0.9%) |
| 65 to 74 Years | 0 (0.0%) | 13 (3.3%) |
| 75 Years and over | 0 (0.0%) | 96 (51.1%) |
Technology Access in Shady Hollow
Computing Device Access in Shady Hollow
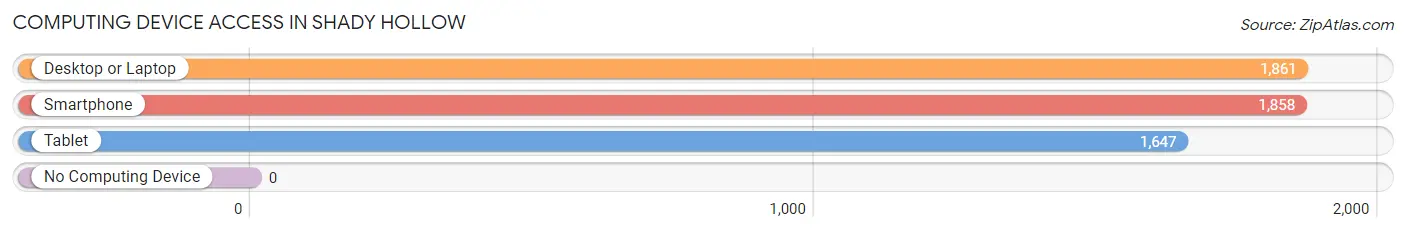
| Device Type | # Households | % Households |
| Desktop or Laptop | 1,861 | 98.2% |
| Smartphone | 1,858 | 98.0% |
| Tablet | 1,647 | 86.9% |
| No Computing Device | 0 | 0.0% |
| Total | 1,896 | 100.0% |
Internet Access in Shady Hollow
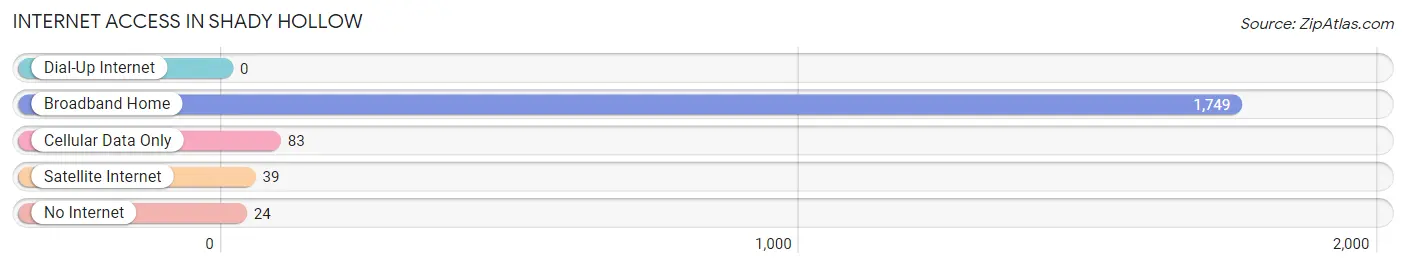
| Internet Type | # Households | % Households |
| Dial-Up Internet | 0 | 0.0% |
| Broadband Home | 1,749 | 92.2% |
| Cellular Data Only | 83 | 4.4% |
| Satellite Internet | 39 | 2.1% |
| No Internet | 24 | 1.3% |
| Total | 1,896 | 100.0% |
Shady Hollow Summary
Shady Hollow is a census-designated place (CDP) located in Travis County, Texas, United States. It is a suburb of Austin, the state capital. The population was 4,722 at the 2010 census.
Geography
Shady Hollow is located at 30°11'25" North, 97°51'17" West (30.1903, -97.8548). It is situated in the southwestern part of Travis County, approximately 12 miles southwest of downtown Austin. The CDP has a total area of 2.3 square miles, all of which is land.
History
Shady Hollow was first settled in the late 1800s by German immigrants. The area was originally known as “Schattental”, which translates to “shady valley” in English. The name was eventually shortened to Shady Hollow.
The area remained largely rural until the 1970s, when the population began to grow rapidly due to the influx of people moving to Austin for work. The population of Shady Hollow increased from 1,000 in 1970 to 4,722 in 2010.
Economy
Shady Hollow is primarily a residential community, with most of its residents commuting to Austin for work. The median household income in Shady Hollow is $90,000, which is significantly higher than the median household income for Travis County ($63,000).
The largest employers in Shady Hollow are the Austin Independent School District, the City of Austin, and the University of Texas at Austin. Other major employers include Dell, IBM, and Apple.
Demographics
As of the 2010 census, there were 4,722 people, 1,717 households, and 1,323 families residing in Shady Hollow. The population density was 2,039.2 people per square mile. The racial makeup of the CDP was 79.2% White, 8.2% African American, 0.3% Native American, 5.2% Asian, 0.1% Pacific Islander, 4.3% from other races, and 2.7% from two or more races. Hispanic or Latino of any race were 11.3% of the population.
There were 1,717 households, out of which 39.2% had children under the age of 18 living with them, 63.2% were married couples living together, 8.2% had a female householder with no husband present, and 24.2% were non-families. 19.2% of all households were made up of individuals, and 5.2% had someone living alone who was 65 years of age or older. The average household size was 2.75 and the average family size was 3.17.
In Shady Hollow, the population was spread out, with 28.2% under the age of 18, 6.2% from 18 to 24, 33.2% from 25 to 44, 24.2% from 45 to 64, and 8.2% who were 65 years of age or older. The median age was 36 years. For every 100 females, there were 97.2 males. For every 100 females age 18 and over, there were 94.2 males.
The median income for a household in Shady Hollow was $90,000, and the median income for a family was $97,000. Males had a median income of $60,000 versus $45,000 for females. The per capita income for the CDP was $35,000. About 4.2% of families and 5.2% of the population were below the poverty line, including 6.2% of those under age 18 and none of those age 65 or over.
Common Questions
What is Per Capita Income in Shady Hollow?
Per Capita income in Shady Hollow is $70,371.
What is the Median Family Income in Shady Hollow?
Median Family Income in Shady Hollow is $169,350.
What is the Median Household income in Shady Hollow?
Median Household Income in Shady Hollow is $159,904.
What is Income or Wage Gap in Shady Hollow?
Income or Wage Gap in Shady Hollow is 49.2%.
Women in Shady Hollow earn 50.8 cents for every dollar earned by a man.
What is Inequality or Gini Index in Shady Hollow?
Inequality or Gini Index in Shady Hollow is 0.43.
What is the Total Population of Shady Hollow?
Total Population of Shady Hollow is 5,300.
What is the Total Male Population of Shady Hollow?
Total Male Population of Shady Hollow is 2,708.
What is the Total Female Population of Shady Hollow?
Total Female Population of Shady Hollow is 2,592.
What is the Ratio of Males per 100 Females in Shady Hollow?
There are 104.48 Males per 100 Females in Shady Hollow.
What is the Ratio of Females per 100 Males in Shady Hollow?
There are 95.72 Females per 100 Males in Shady Hollow.
What is the Median Population Age in Shady Hollow?
Median Population Age in Shady Hollow is 49.3 Years.
What is the Average Family Size in Shady Hollow
Average Family Size in Shady Hollow is 3.0 People.
What is the Average Household Size in Shady Hollow
Average Household Size in Shady Hollow is 2.8 People.
How Large is the Labor Force in Shady Hollow?
There are 2,342 People in the Labor Forcein in Shady Hollow.
What is the Percentage of People in the Labor Force in Shady Hollow?
56.0% of People are in the Labor Force in Shady Hollow.