Heathrow, FL Map & Demographics
Heathrow Map
Heathrow Overview
$64,402
PER CAPITA INCOME
$131,408
AVG FAMILY INCOME
$119,762
AVG HOUSEHOLD INCOME
47.8%
WAGE / INCOME GAP [ % ]
52.2¢/ $1
WAGE / INCOME GAP [ $ ]
0.44
INEQUALITY / GINI INDEX
7,084
TOTAL POPULATION
3,399
MALE POPULATION
3,685
FEMALE POPULATION
92.24
MALES / 100 FEMALES
108.41
FEMALES / 100 MALES
45.0
MEDIAN AGE
2.7
AVG FAMILY SIZE
2.3
AVG HOUSEHOLD SIZE
3,565
LABOR FORCE [ PEOPLE ]
60.0%
PERCENT IN LABOR FORCE
4.9%
UNEMPLOYMENT RATE
Heathrow Area Codes
Income in Heathrow
Income Overview in Heathrow
Per Capita Income in Heathrow is $64,402, while median incomes of families and households are $131,408 and $119,762 respectively.
| Characteristic | Number | Measure |
| Per Capita Income | 7,084 | $64,402 |
| Median Family Income | 2,189 | $131,408 |
| Mean Family Income | 2,189 | $175,044 |
| Median Household Income | 3,044 | $119,762 |
| Mean Household Income | 3,044 | $150,795 |
| Income Deficit | 2,189 | $0 |
| Wage / Income Gap (%) | 7,084 | 47.77% |
| Wage / Income Gap ($) | 7,084 | 52.23¢ per $1 |
| Gini / Inequality Index | 7,084 | 0.44 |
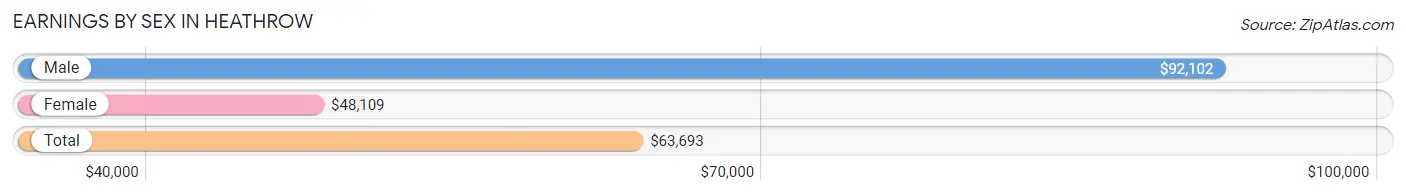
Earnings by Sex in Heathrow
Average Earnings in Heathrow are $63,693, $92,102 for men and $48,109 for women, a difference of 47.8%.
| Sex | Number | Average Earnings |
| Male | 2,083 (56.0%) | $92,102 |
| Female | 1,634 (44.0%) | $48,109 |
| Total | 3,717 (100.0%) | $63,693 |
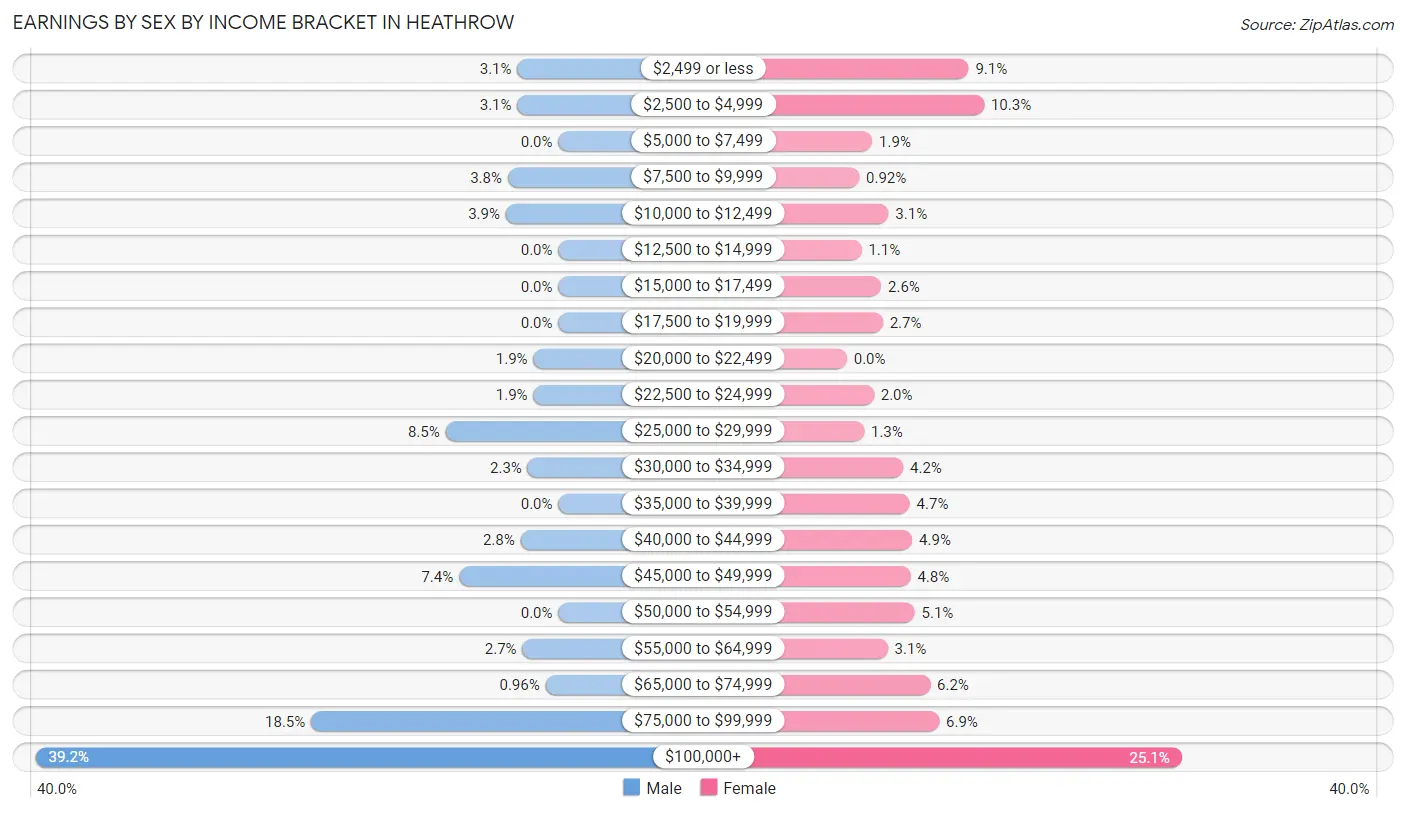
Earnings by Sex by Income Bracket in Heathrow
The most common earnings brackets in Heathrow are $100,000+ for men (816 | 39.2%) and $100,000+ for women (410 | 25.1%).
| Income | Male | Female |
| $2,499 or less | 64 (3.1%) | 149 (9.1%) |
| $2,500 to $4,999 | 64 (3.1%) | 168 (10.3%) |
| $5,000 to $7,499 | 0 (0.0%) | 31 (1.9%) |
| $7,500 to $9,999 | 79 (3.8%) | 15 (0.9%) |
| $10,000 to $12,499 | 82 (3.9%) | 51 (3.1%) |
| $12,500 to $14,999 | 0 (0.0%) | 18 (1.1%) |
| $15,000 to $17,499 | 0 (0.0%) | 42 (2.6%) |
| $17,500 to $19,999 | 0 (0.0%) | 44 (2.7%) |
| $20,000 to $22,499 | 39 (1.9%) | 0 (0.0%) |
| $22,500 to $24,999 | 39 (1.9%) | 33 (2.0%) |
| $25,000 to $29,999 | 176 (8.5%) | 21 (1.3%) |
| $30,000 to $34,999 | 48 (2.3%) | 69 (4.2%) |
| $35,000 to $39,999 | 0 (0.0%) | 77 (4.7%) |
| $40,000 to $44,999 | 59 (2.8%) | 80 (4.9%) |
| $45,000 to $49,999 | 155 (7.4%) | 78 (4.8%) |
| $50,000 to $54,999 | 0 (0.0%) | 83 (5.1%) |
| $55,000 to $64,999 | 56 (2.7%) | 50 (3.1%) |
| $65,000 to $74,999 | 20 (1.0%) | 102 (6.2%) |
| $75,000 to $99,999 | 386 (18.5%) | 113 (6.9%) |
| $100,000+ | 816 (39.2%) | 410 (25.1%) |
| Total | 2,083 (100.0%) | 1,634 (100.0%) |
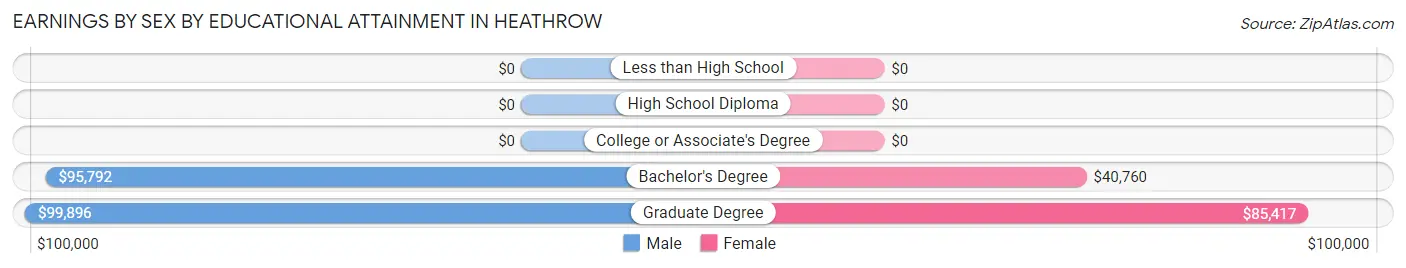
Earnings by Sex by Educational Attainment in Heathrow
Average earnings in Heathrow are $96,213 for men and $49,439 for women, a difference of 48.6%. Men with an educational attainment of graduate degree enjoy the highest average annual earnings of $99,896, while those with bachelor's degree education earn the least with $95,792. Women with an educational attainment of graduate degree earn the most with the average annual earnings of $85,417, while those with bachelor's degree education have the smallest earnings of $40,760.
| Educational Attainment | Male Income | Female Income |
| Less than High School | - | - |
| High School Diploma | - | - |
| College or Associate's Degree | - | - |
| Bachelor's Degree | $95,792 | $40,760 |
| Graduate Degree | $99,896 | $85,417 |
| Total | $96,213 | $49,439 |
Family Income in Heathrow
Family Income Brackets in Heathrow
According to the Heathrow family income data, there are 619 families falling into the $200,000+ income range, which is the most common income bracket and makes up 28.3% of all families.
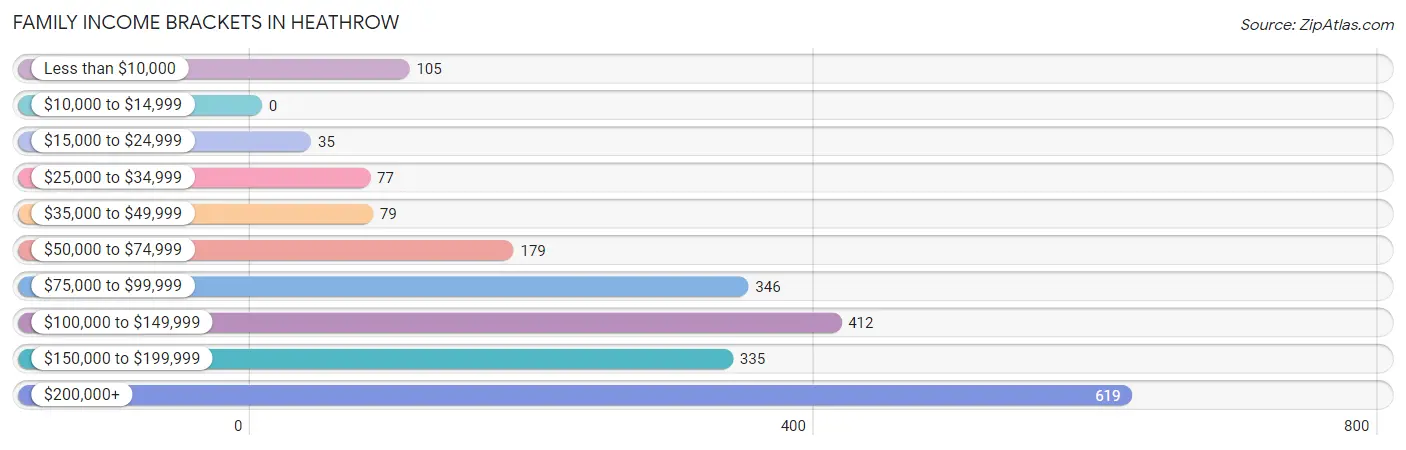
| Income Bracket | # Families | % Families |
| Less than $10,000 | 105 | 4.8% |
| $10,000 to $14,999 | 0 | 0.0% |
| $15,000 to $24,999 | 35 | 1.6% |
| $25,000 to $34,999 | 77 | 3.5% |
| $35,000 to $49,999 | 79 | 3.6% |
| $50,000 to $74,999 | 179 | 8.2% |
| $75,000 to $99,999 | 346 | 15.8% |
| $100,000 to $149,999 | 412 | 18.8% |
| $150,000 to $199,999 | 335 | 15.3% |
| $200,000+ | 619 | 28.3% |
Family Income by Famaliy Size in Heathrow
5-person families (95 | 4.3%) account for the highest median family income in Heathrow with $238,087 per family, while 2-person families (1,223 | 55.9%) have the highest median income of $53,221 per family member.
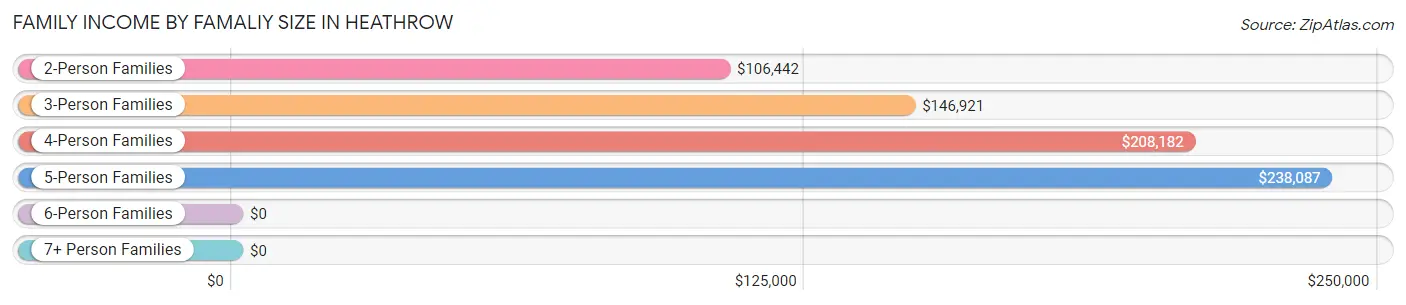
| Income Bracket | # Families | Median Income |
| 2-Person Families | 1,223 (55.9%) | $106,442 |
| 3-Person Families | 451 (20.6%) | $146,921 |
| 4-Person Families | 406 (18.5%) | $208,182 |
| 5-Person Families | 95 (4.3%) | $238,087 |
| 6-Person Families | 14 (0.6%) | $0 |
| 7+ Person Families | 0 (0.0%) | $0 |
| Total | 2,189 (100.0%) | $131,408 |
Family Income by Number of Earners in Heathrow
The median family income in Heathrow is $131,408, with families comprising 3+ earners (131) having the highest median family income of $208,920, while families with no earners (410) have the lowest median family income of $100,536, accounting for 6.0% and 18.7% of families, respectively.
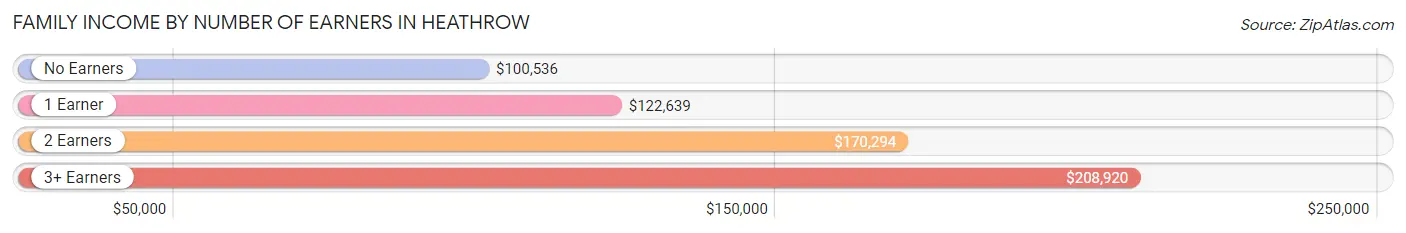
| Number of Earners | # Families | Median Income |
| No Earners | 410 (18.7%) | $100,536 |
| 1 Earner | 836 (38.2%) | $122,639 |
| 2 Earners | 812 (37.1%) | $170,294 |
| 3+ Earners | 131 (6.0%) | $208,920 |
| Total | 2,189 (100.0%) | $131,408 |
Household Income in Heathrow
Household Income Brackets in Heathrow
With 667 households falling in the category, the $200,000+ income range is the most frequent in Heathrow, accounting for 21.9% of all households.
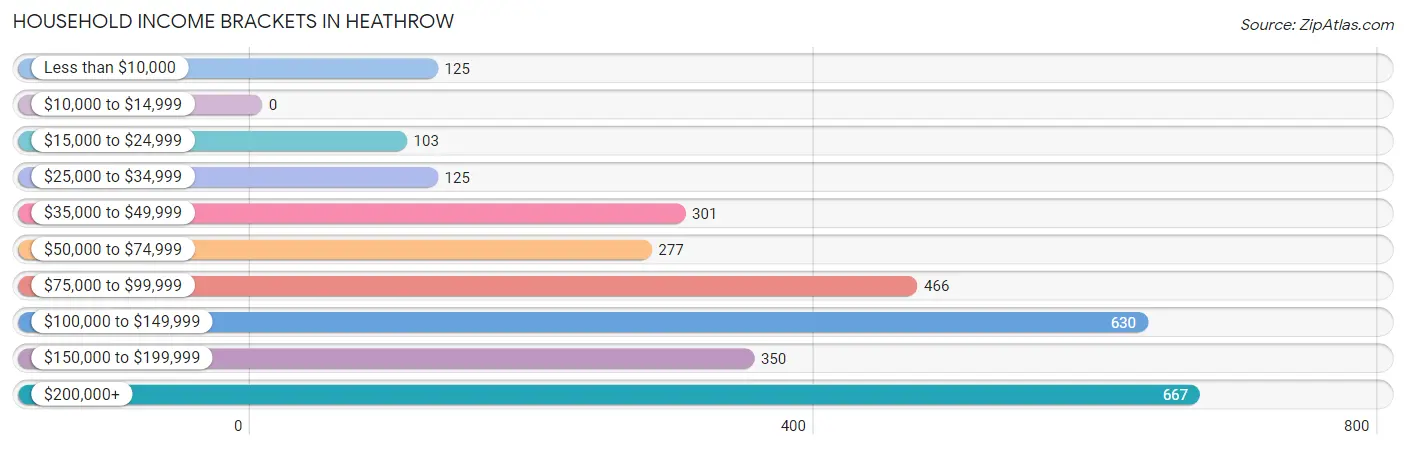
| Income Bracket | # Households | % Households |
| Less than $10,000 | 125 | 4.1% |
| $10,000 to $14,999 | 0 | 0.0% |
| $15,000 to $24,999 | 103 | 3.4% |
| $25,000 to $34,999 | 125 | 4.1% |
| $35,000 to $49,999 | 301 | 9.9% |
| $50,000 to $74,999 | 277 | 9.1% |
| $75,000 to $99,999 | 466 | 15.3% |
| $100,000 to $149,999 | 630 | 20.7% |
| $150,000 to $199,999 | 350 | 11.5% |
| $200,000+ | 667 | 21.9% |
Household Income by Householder Age in Heathrow
The median household income in Heathrow is $119,762, with the highest median household income of $150,789 found in the 45 to 64 years age bracket for the primary householder. A total of 1,266 households (41.6%) fall into this category. Meanwhile, the 15 to 24 years age bracket for the primary householder has the lowest median household income of $98,152, with 100 households (3.3%) in this group.
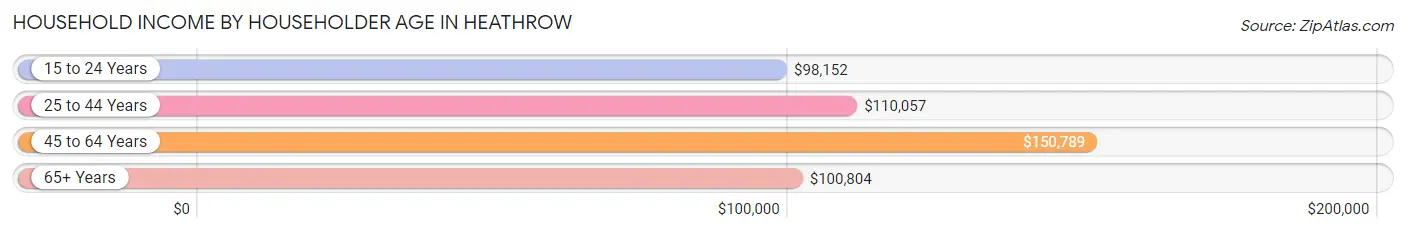
| Income Bracket | # Households | Median Income |
| 15 to 24 Years | 100 (3.3%) | $98,152 |
| 25 to 44 Years | 937 (30.8%) | $110,057 |
| 45 to 64 Years | 1,266 (41.6%) | $150,789 |
| 65+ Years | 741 (24.3%) | $100,804 |
| Total | 3,044 (100.0%) | $119,762 |
Poverty in Heathrow
Income Below Poverty by Sex and Age in Heathrow
With 7.6% poverty level for males and 6.0% for females among the residents of Heathrow, 16 and 17 year old males and 6 to 11 year old females are the most vulnerable to poverty, with 59 males (68.6%) and 119 females (42.8%) in their respective age groups living below the poverty level.
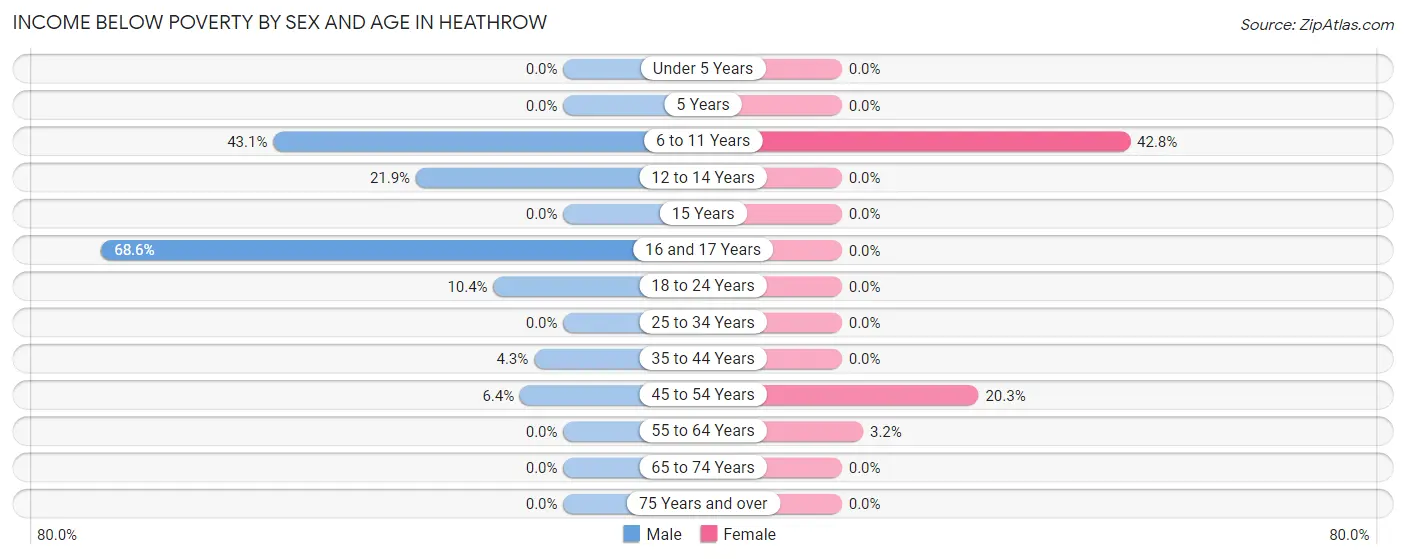
| Age Bracket | Male | Female |
| Under 5 Years | 0 (0.0%) | 0 (0.0%) |
| 5 Years | 0 (0.0%) | 0 (0.0%) |
| 6 to 11 Years | 84 (43.1%) | 119 (42.8%) |
| 12 to 14 Years | 44 (21.9%) | 0 (0.0%) |
| 15 Years | 0 (0.0%) | 0 (0.0%) |
| 16 and 17 Years | 59 (68.6%) | 0 (0.0%) |
| 18 to 24 Years | 27 (10.4%) | 0 (0.0%) |
| 25 to 34 Years | 0 (0.0%) | 0 (0.0%) |
| 35 to 44 Years | 23 (4.3%) | 0 (0.0%) |
| 45 to 54 Years | 22 (6.4%) | 82 (20.3%) |
| 55 to 64 Years | 0 (0.0%) | 22 (3.2%) |
| 65 to 74 Years | 0 (0.0%) | 0 (0.0%) |
| 75 Years and over | 0 (0.0%) | 0 (0.0%) |
| Total | 259 (7.6%) | 223 (6.0%) |
Income Above Poverty by Sex and Age in Heathrow
According to the poverty statistics in Heathrow, males aged under 5 years and females aged under 5 years are the age groups that are most secure financially, with 100.0% of males and 100.0% of females in these age groups living above the poverty line.
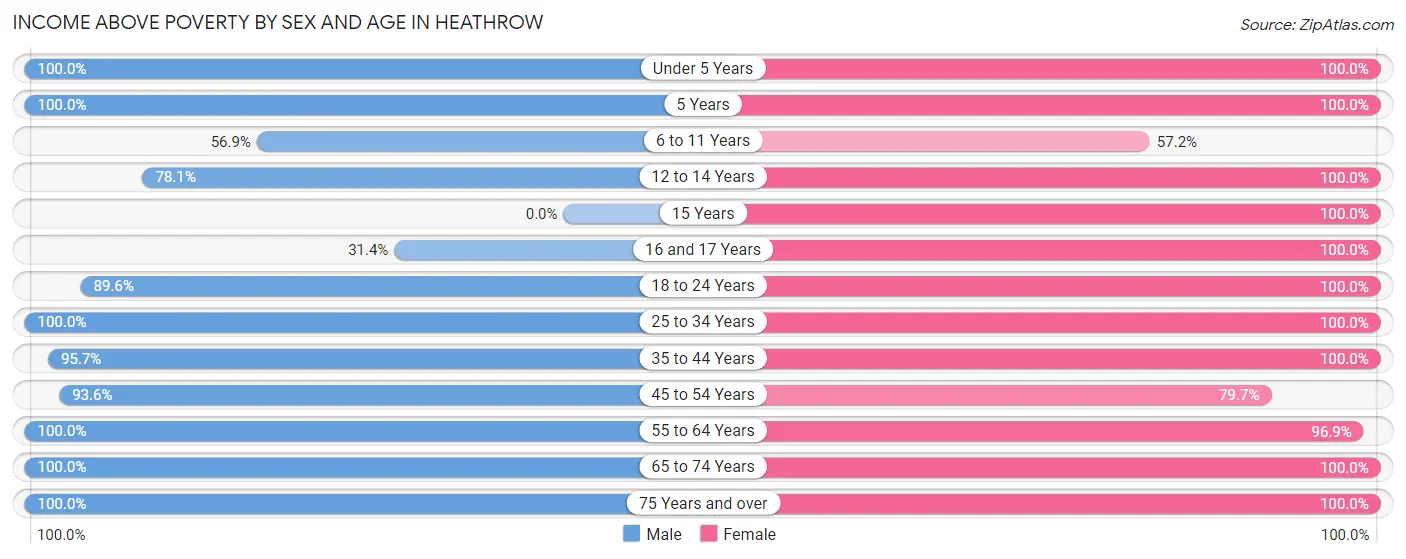
| Age Bracket | Male | Female |
| Under 5 Years | 79 (100.0%) | 168 (100.0%) |
| 5 Years | 77 (100.0%) | 30 (100.0%) |
| 6 to 11 Years | 111 (56.9%) | 159 (57.2%) |
| 12 to 14 Years | 157 (78.1%) | 50 (100.0%) |
| 15 Years | 0 (0.0%) | 65 (100.0%) |
| 16 and 17 Years | 27 (31.4%) | 30 (100.0%) |
| 18 to 24 Years | 233 (89.6%) | 218 (100.0%) |
| 25 to 34 Years | 314 (100.0%) | 444 (100.0%) |
| 35 to 44 Years | 507 (95.7%) | 514 (100.0%) |
| 45 to 54 Years | 320 (93.6%) | 322 (79.7%) |
| 55 to 64 Years | 695 (100.0%) | 677 (96.9%) |
| 65 to 74 Years | 386 (100.0%) | 409 (100.0%) |
| 75 Years and over | 234 (100.0%) | 376 (100.0%) |
| Total | 3,140 (92.4%) | 3,462 (94.0%) |
Income Below Poverty Among Married-Couple Families in Heathrow
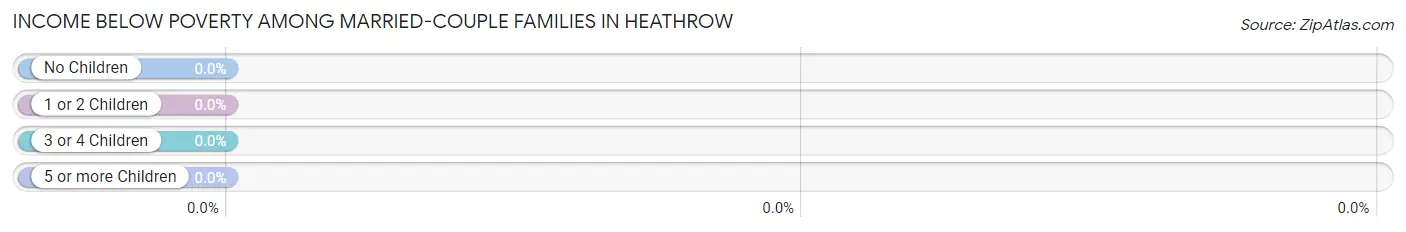
| Children | Above Poverty | Below Poverty |
| No Children | 1,255 (100.0%) | 0 (0.0%) |
| 1 or 2 Children | 560 (100.0%) | 0 (0.0%) |
| 3 or 4 Children | 46 (100.0%) | 0 (0.0%) |
| 5 or more Children | 0 (0.0%) | 0 (0.0%) |
| Total | 1,861 (100.0%) | 0 (0.0%) |
Income Below Poverty Among Single-Parent Households in Heathrow
According to the poverty data in Heathrow, 16.1% or 23 single-father households and 56.2% or 104 single-mother households are living below the poverty line. Among single-father households, those with 1 or 2 children have the highest poverty rate, with 23 households (100.0%) experiencing poverty. Likewise, among single-mother households, those with 3 or 4 children have the highest poverty rate, with 82 households (100.0%) falling below the poverty line.
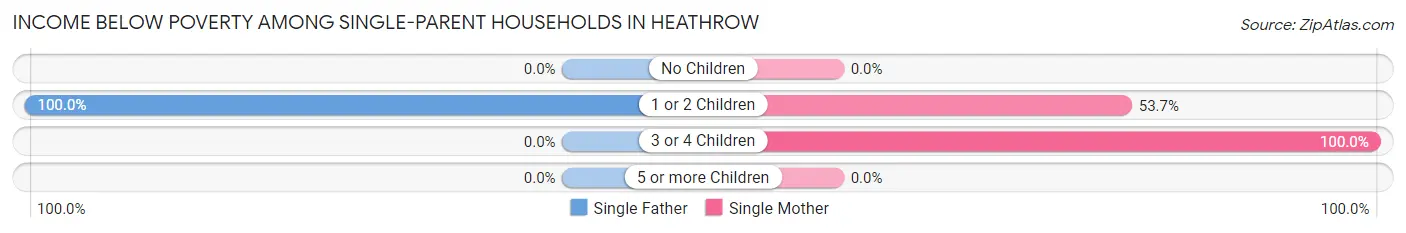
| Children | Single Father | Single Mother |
| No Children | 0 (0.0%) | 0 (0.0%) |
| 1 or 2 Children | 23 (100.0%) | 22 (53.7%) |
| 3 or 4 Children | 0 (0.0%) | 82 (100.0%) |
| 5 or more Children | 0 (0.0%) | 0 (0.0%) |
| Total | 23 (16.1%) | 104 (56.2%) |
Income Below Poverty Among Married-Couple vs Single-Parent Households in Heathrow
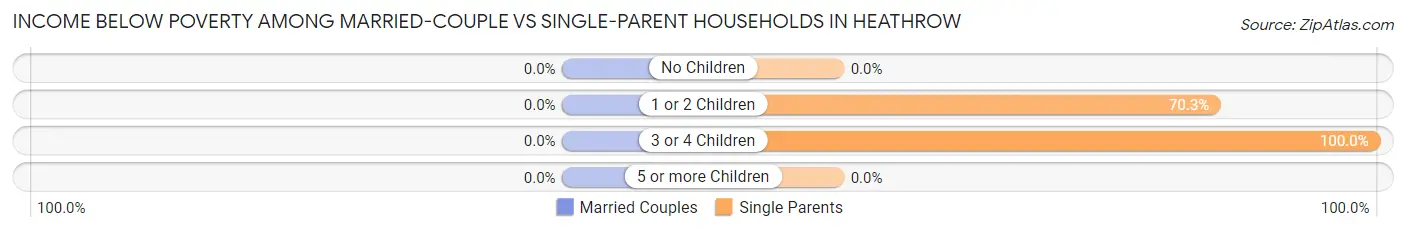
| Children | Married-Couple Families | Single-Parent Households |
| No Children | 0 (0.0%) | 0 (0.0%) |
| 1 or 2 Children | 0 (0.0%) | 45 (70.3%) |
| 3 or 4 Children | 0 (0.0%) | 82 (100.0%) |
| 5 or more Children | 0 (0.0%) | 0 (0.0%) |
| Total | 0 (0.0%) | 127 (38.7%) |
Race in Heathrow
The most populous races in Heathrow are White / Caucasian (5,161 | 72.9%), Asian (1,270 | 17.9%), and Hispanic or Latino (710 | 10.0%).
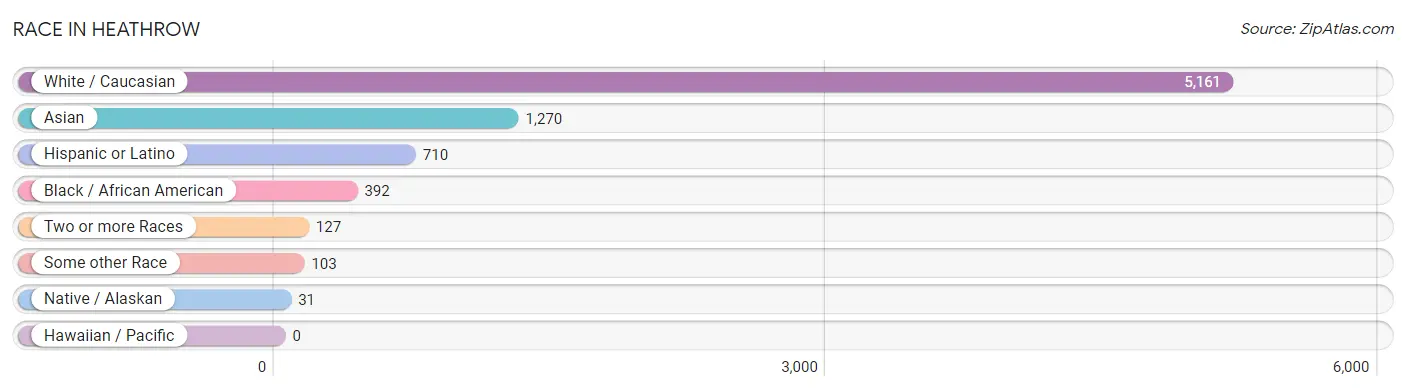
| Race | # Population | % Population |
| Asian | 1,270 | 17.9% |
| Black / African American | 392 | 5.5% |
| Hawaiian / Pacific | 0 | 0.0% |
| Hispanic or Latino | 710 | 10.0% |
| Native / Alaskan | 31 | 0.4% |
| White / Caucasian | 5,161 | 72.9% |
| Two or more Races | 127 | 1.8% |
| Some other Race | 103 | 1.5% |
| Total | 7,084 | 100.0% |
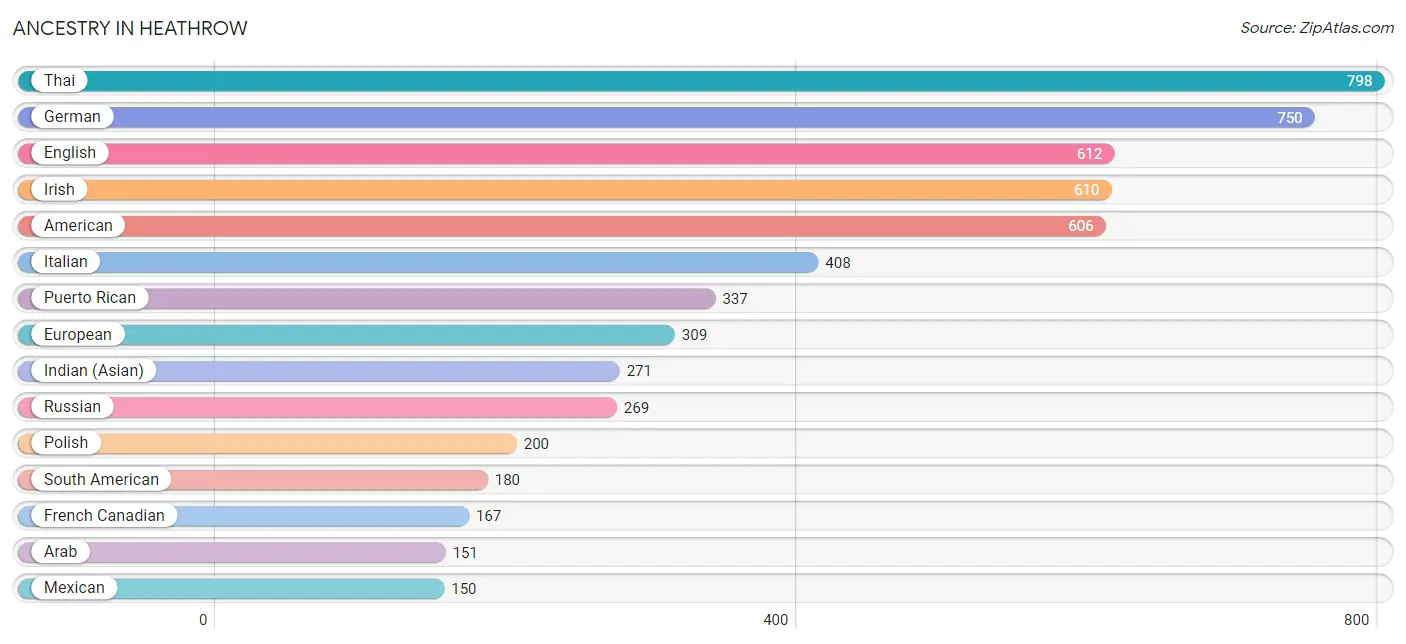
Ancestry in Heathrow
The most populous ancestries reported in Heathrow are Thai (798 | 11.3%), German (750 | 10.6%), English (612 | 8.6%), Irish (610 | 8.6%), and American (606 | 8.6%), together accounting for 47.7% of all Heathrow residents.
| Ancestry | # Population | % Population |
| Alsatian | 18 | 0.3% |
| American | 606 | 8.6% |
| Apache | 16 | 0.2% |
| Arab | 151 | 2.1% |
| Barbadian | 14 | 0.2% |
| Bhutanese | 77 | 1.1% |
| Brazilian | 25 | 0.4% |
| British | 74 | 1.0% |
| Burmese | 42 | 0.6% |
| Canadian | 86 | 1.2% |
| Chilean | 21 | 0.3% |
| Colombian | 37 | 0.5% |
| Croatian | 13 | 0.2% |
| Dutch | 55 | 0.8% |
| Eastern European | 21 | 0.3% |
| Ecuadorian | 65 | 0.9% |
| English | 612 | 8.6% |
| European | 309 | 4.4% |
| Filipino | 27 | 0.4% |
| Finnish | 14 | 0.2% |
| French | 81 | 1.1% |
| French Canadian | 167 | 2.4% |
| German | 750 | 10.6% |
| Haitian | 87 | 1.2% |
| Indian (Asian) | 271 | 3.8% |
| Irish | 610 | 8.6% |
| Italian | 408 | 5.8% |
| Jamaican | 85 | 1.2% |
| Lebanese | 42 | 0.6% |
| Lithuanian | 21 | 0.3% |
| Mexican | 150 | 2.1% |
| Norwegian | 26 | 0.4% |
| Palestinian | 109 | 1.5% |
| Peruvian | 27 | 0.4% |
| Polish | 200 | 2.8% |
| Portuguese | 13 | 0.2% |
| Puerto Rican | 337 | 4.8% |
| Russian | 269 | 3.8% |
| Scotch-Irish | 17 | 0.2% |
| Scottish | 103 | 1.5% |
| Slovak | 12 | 0.2% |
| Slovene | 12 | 0.2% |
| South American | 180 | 2.5% |
| Spaniard | 26 | 0.4% |
| Spanish | 17 | 0.2% |
| Sri Lankan | 39 | 0.5% |
| Swedish | 33 | 0.5% |
| Swiss | 11 | 0.2% |
| Thai | 798 | 11.3% |
| Trinidadian and Tobagonian | 15 | 0.2% |
| Ukrainian | 20 | 0.3% |
| Venezuelan | 30 | 0.4% |
| Welsh | 25 | 0.4% | View All 53 Rows |
Immigrants in Heathrow
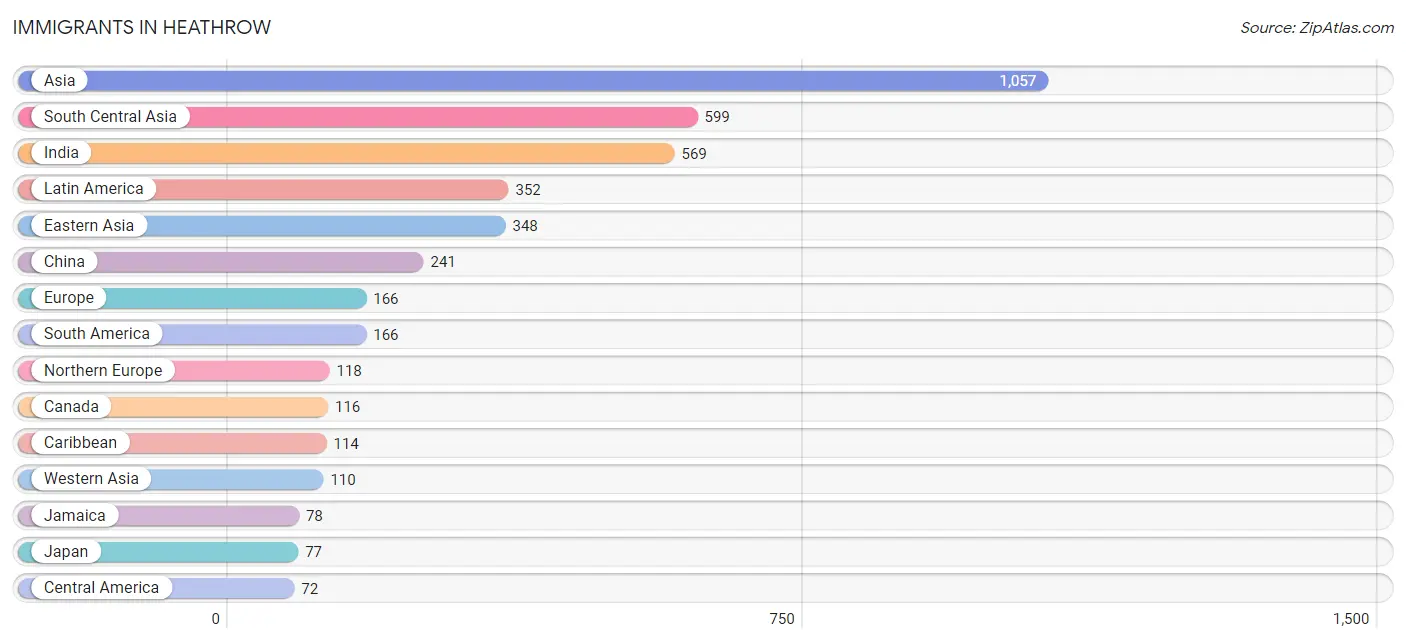
The most numerous immigrant groups reported in Heathrow came from Asia (1,057 | 14.9%), South Central Asia (599 | 8.5%), India (569 | 8.0%), Latin America (352 | 5.0%), and Eastern Asia (348 | 4.9%), together accounting for 41.3% of all Heathrow residents.
| Immigration Origin | # Population | % Population |
| Africa | 29 | 0.4% |
| Asia | 1,057 | 14.9% |
| Barbados | 14 | 0.2% |
| Brazil | 25 | 0.4% |
| Canada | 116 | 1.6% |
| Caribbean | 114 | 1.6% |
| Central America | 72 | 1.0% |
| Chile | 21 | 0.3% |
| China | 241 | 3.4% |
| Colombia | 21 | 0.3% |
| Eastern Africa | 17 | 0.2% |
| Eastern Asia | 348 | 4.9% |
| Eastern Europe | 29 | 0.4% |
| Ecuador | 57 | 0.8% |
| England | 10 | 0.1% |
| Europe | 166 | 2.3% |
| Germany | 19 | 0.3% |
| Haiti | 22 | 0.3% |
| Hungary | 10 | 0.1% |
| India | 569 | 8.0% |
| Ireland | 69 | 1.0% |
| Jamaica | 78 | 1.1% |
| Japan | 77 | 1.1% |
| Korea | 30 | 0.4% |
| Kuwait | 54 | 0.8% |
| Latin America | 352 | 5.0% |
| Lebanon | 42 | 0.6% |
| Northern Europe | 118 | 1.7% |
| Pakistan | 30 | 0.4% |
| Panama | 72 | 1.0% |
| Peru | 27 | 0.4% |
| Poland | 19 | 0.3% |
| South America | 166 | 2.3% |
| South Central Asia | 599 | 8.5% |
| Taiwan | 30 | 0.4% |
| Venezuela | 15 | 0.2% |
| Western Asia | 110 | 1.5% |
| Western Europe | 19 | 0.3% | View All 38 Rows |
Sex and Age in Heathrow
Sex and Age in Heathrow
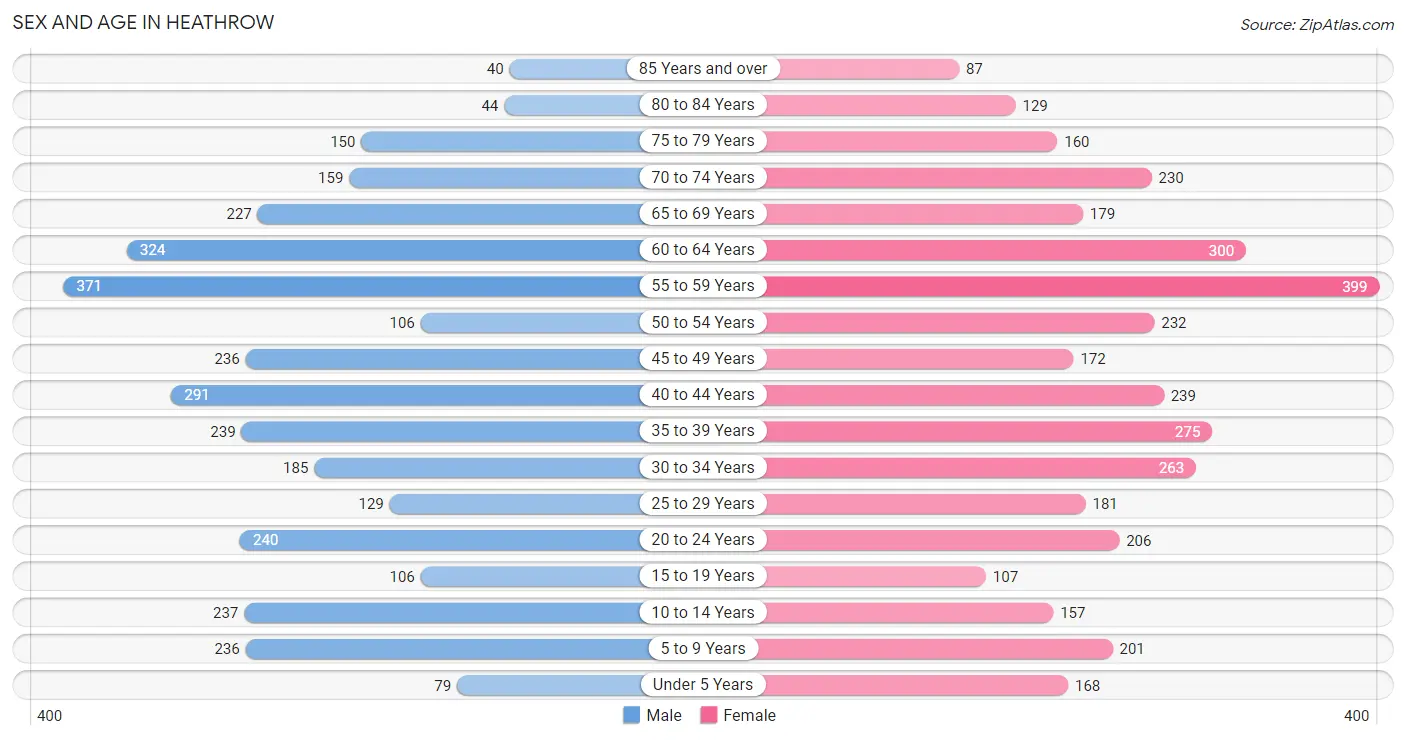
The most populous age groups in Heathrow are 55 to 59 Years (371 | 10.9%) for men and 55 to 59 Years (399 | 10.8%) for women.
| Age Bracket | Male | Female |
| Under 5 Years | 79 (2.3%) | 168 (4.6%) |
| 5 to 9 Years | 236 (6.9%) | 201 (5.4%) |
| 10 to 14 Years | 237 (7.0%) | 157 (4.3%) |
| 15 to 19 Years | 106 (3.1%) | 107 (2.9%) |
| 20 to 24 Years | 240 (7.1%) | 206 (5.6%) |
| 25 to 29 Years | 129 (3.8%) | 181 (4.9%) |
| 30 to 34 Years | 185 (5.4%) | 263 (7.1%) |
| 35 to 39 Years | 239 (7.0%) | 275 (7.5%) |
| 40 to 44 Years | 291 (8.6%) | 239 (6.5%) |
| 45 to 49 Years | 236 (6.9%) | 172 (4.7%) |
| 50 to 54 Years | 106 (3.1%) | 232 (6.3%) |
| 55 to 59 Years | 371 (10.9%) | 399 (10.8%) |
| 60 to 64 Years | 324 (9.5%) | 300 (8.1%) |
| 65 to 69 Years | 227 (6.7%) | 179 (4.9%) |
| 70 to 74 Years | 159 (4.7%) | 230 (6.2%) |
| 75 to 79 Years | 150 (4.4%) | 160 (4.3%) |
| 80 to 84 Years | 44 (1.3%) | 129 (3.5%) |
| 85 Years and over | 40 (1.2%) | 87 (2.4%) |
| Total | 3,399 (100.0%) | 3,685 (100.0%) |
Families and Households in Heathrow
Median Family Size in Heathrow
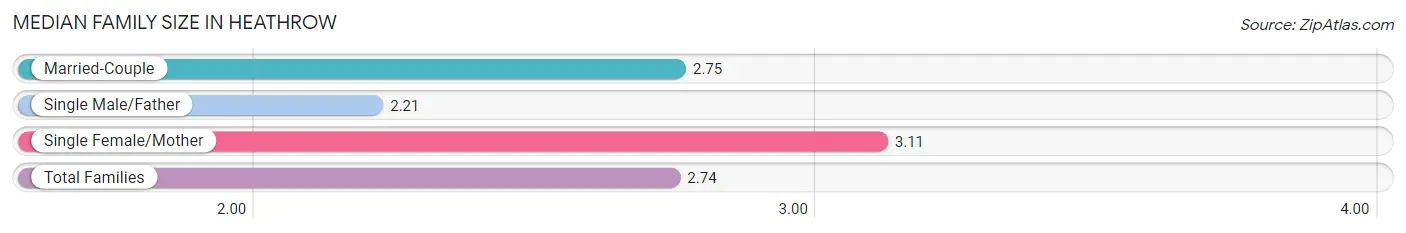
The median family size in Heathrow is 2.74 persons per family, with single female/mother families (185 | 8.5%) accounting for the largest median family size of 3.11 persons per family. On the other hand, single male/father families (143 | 6.5%) represent the smallest median family size with 2.21 persons per family.
| Family Type | # Families | Family Size |
| Married-Couple | 1,861 (85.0%) | 2.75 |
| Single Male/Father | 143 (6.5%) | 2.21 |
| Single Female/Mother | 185 (8.5%) | 3.11 |
| Total Families | 2,189 (100.0%) | 2.74 |
Median Household Size in Heathrow
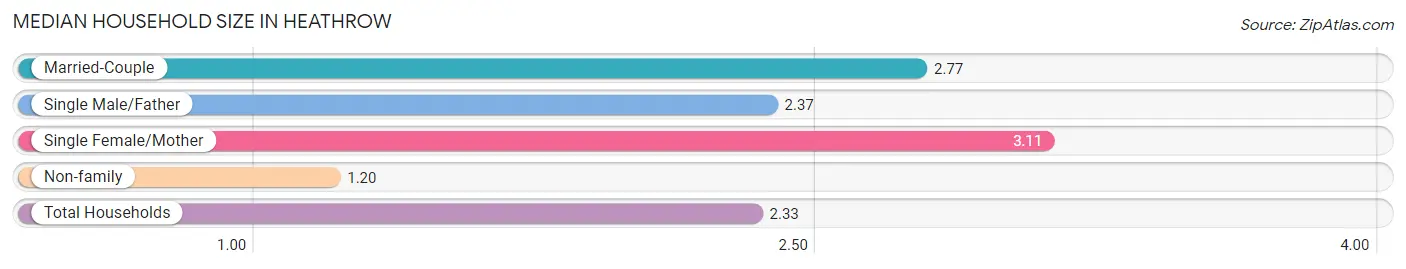
The median household size in Heathrow is 2.33 persons per household, with single female/mother households (185 | 6.1%) accounting for the largest median household size of 3.11 persons per household. non-family households (855 | 28.1%) represent the smallest median household size with 1.20 persons per household.
| Household Type | # Households | Household Size |
| Married-Couple | 1,861 (61.1%) | 2.77 |
| Single Male/Father | 143 (4.7%) | 2.37 |
| Single Female/Mother | 185 (6.1%) | 3.11 |
| Non-family | 855 (28.1%) | 1.20 |
| Total Households | 3,044 (100.0%) | 2.33 |
Household Size by Marriage Status in Heathrow
Out of a total of 3,044 households in Heathrow, 2,189 (71.9%) are family households, while 855 (28.1%) are nonfamily households. The most numerous type of family households are 2-person households, comprising 1,209, and the most common type of nonfamily households are 1-person households, comprising 707.
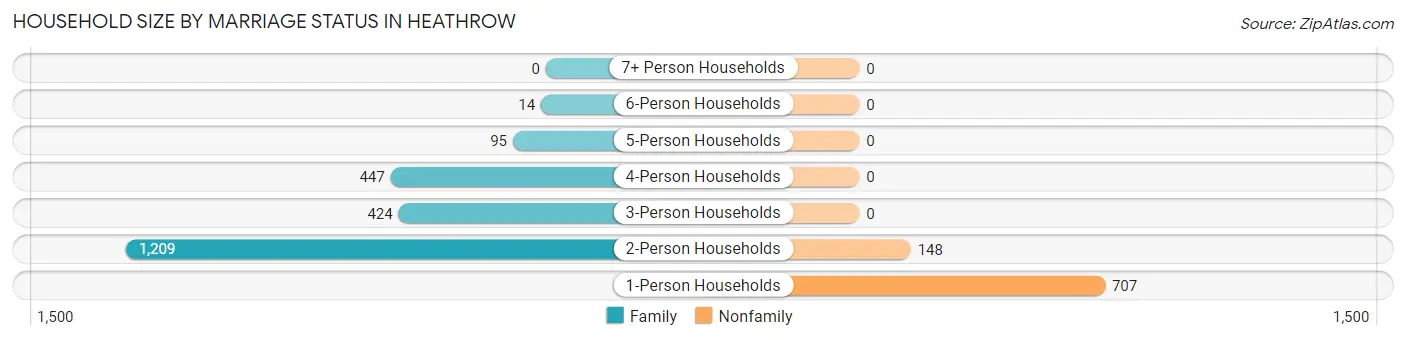
| Household Size | Family Households | Nonfamily Households |
| 1-Person Households | - | 707 (23.2%) |
| 2-Person Households | 1,209 (39.7%) | 148 (4.9%) |
| 3-Person Households | 424 (13.9%) | 0 (0.0%) |
| 4-Person Households | 447 (14.7%) | 0 (0.0%) |
| 5-Person Households | 95 (3.1%) | 0 (0.0%) |
| 6-Person Households | 14 (0.5%) | 0 (0.0%) |
| 7+ Person Households | 0 (0.0%) | 0 (0.0%) |
| Total | 2,189 (71.9%) | 855 (28.1%) |
Female Fertility in Heathrow
Fertility by Age in Heathrow
Average fertility rate in Heathrow is 11.0 births per 1,000 women. Women in the age bracket of 35 to 50 years have the highest fertility rate with 22.0 births per 1,000 women. Women in the age bracket of 35 to 50 years acount for 100.0% of all women with births.
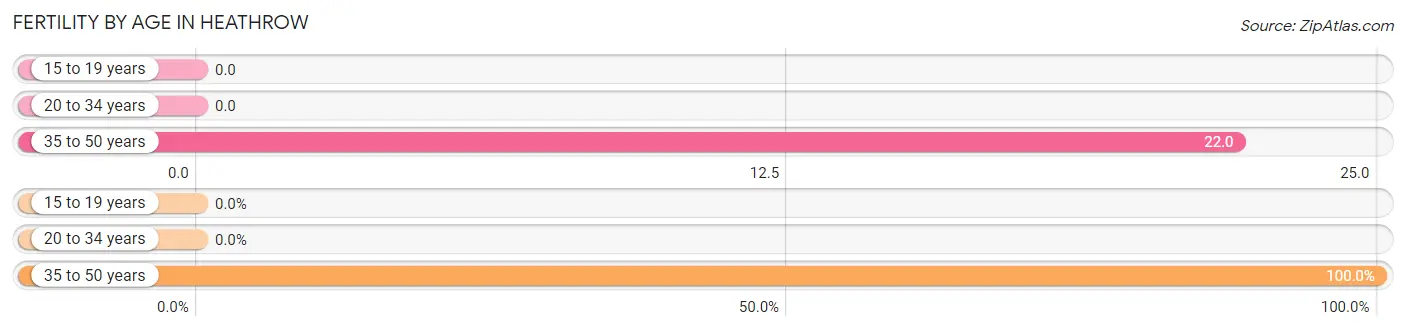
| Age Bracket | Women with Births | Births / 1,000 Women |
| 15 to 19 years | 0 (0.0%) | 0.0 |
| 20 to 34 years | 0 (0.0%) | 0.0 |
| 35 to 50 years | 17 (100.0%) | 22.0 |
| Total | 17 (100.0%) | 11.0 |
Fertility by Age by Marriage Status in Heathrow
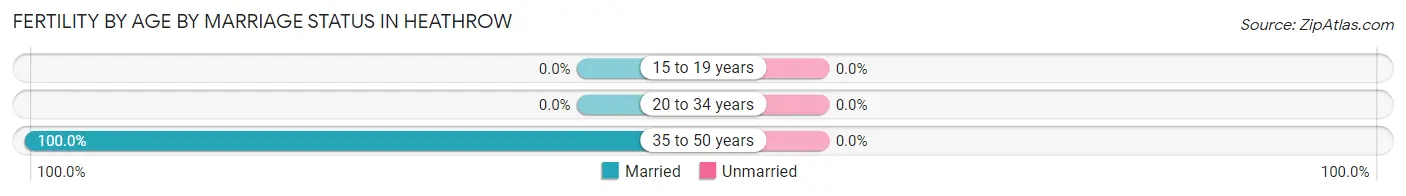
| Age Bracket | Married | Unmarried |
| 15 to 19 years | 0 (0.0%) | 0 (0.0%) |
| 20 to 34 years | 0 (0.0%) | 0 (0.0%) |
| 35 to 50 years | 17 (100.0%) | 0 (0.0%) |
| Total | 17 (100.0%) | 0 (0.0%) |
Fertility by Education in Heathrow
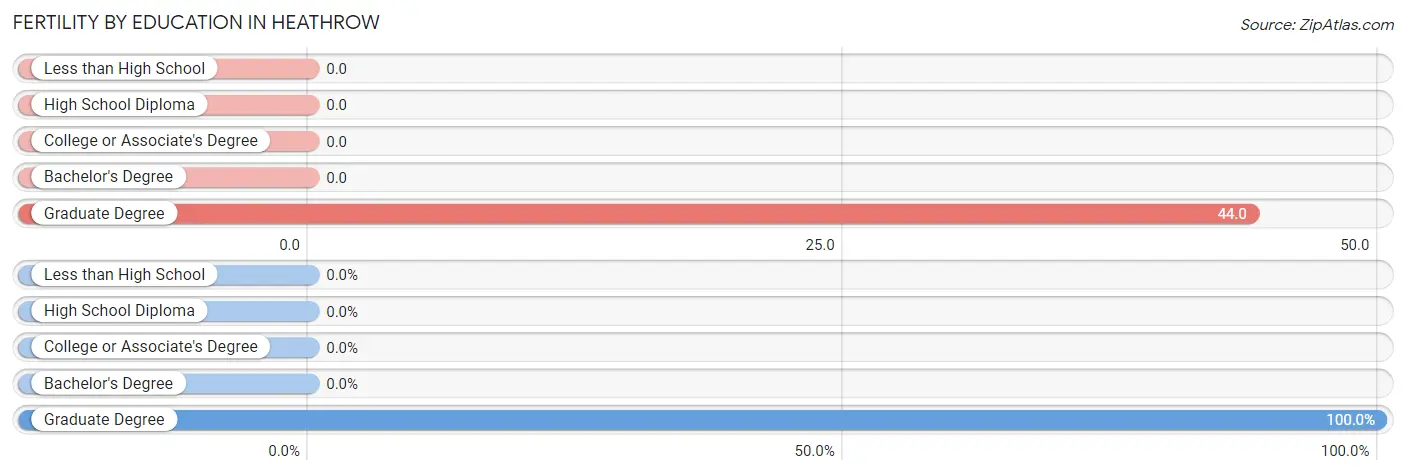
| Educational Attainment | Women with Births | Births / 1,000 Women |
| Less than High School | 0 (0.0%) | 0.0 |
| High School Diploma | 0 (0.0%) | 0.0 |
| College or Associate's Degree | 0 (0.0%) | 0.0 |
| Bachelor's Degree | 0 (0.0%) | 0.0 |
| Graduate Degree | 17 (100.0%) | 44.0 |
| Total | 17 (100.0%) | 11.0 |
Fertility by Education by Marriage Status in Heathrow
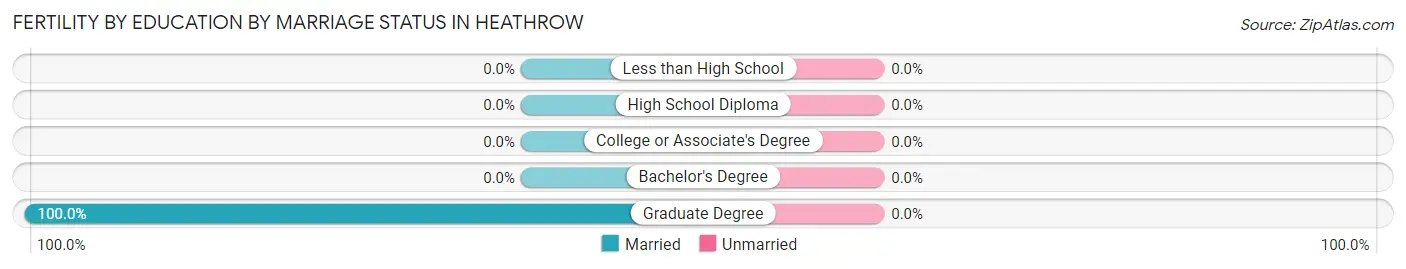
| Educational Attainment | Married | Unmarried |
| Less than High School | 0 (0.0%) | 0 (0.0%) |
| High School Diploma | 0 (0.0%) | 0 (0.0%) |
| College or Associate's Degree | 0 (0.0%) | 0 (0.0%) |
| Bachelor's Degree | 0 (0.0%) | 0 (0.0%) |
| Graduate Degree | 17 (100.0%) | 0 (0.0%) |
| Total | 17 (100.0%) | 0 (0.0%) |
Employment Characteristics in Heathrow
Employment by Class of Employer in Heathrow
Among the 3,285 employed individuals in Heathrow, private company employees (2,327 | 70.8%), local government employees (328 | 10.0%), and not-for-profit organizations (274 | 8.3%) make up the most common classes of employment.
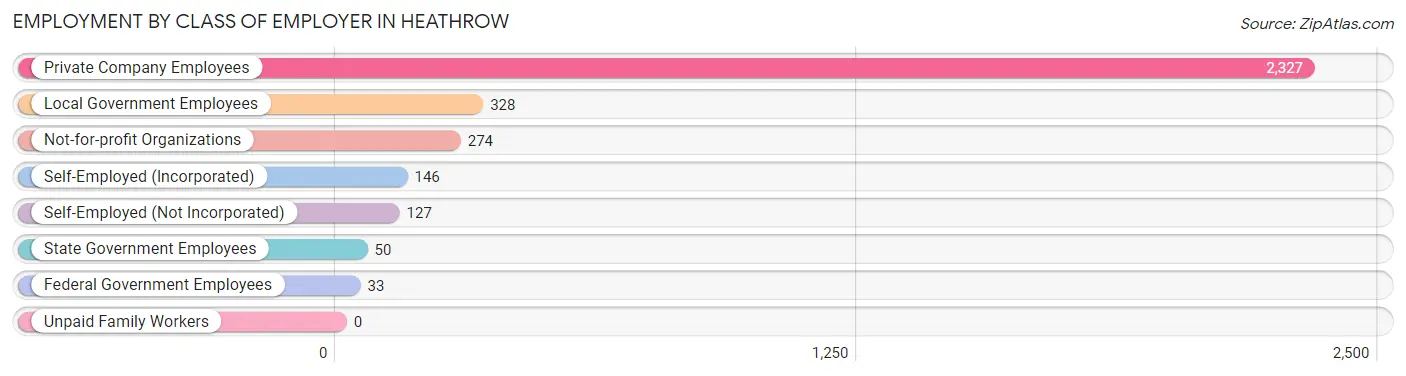
| Employer Class | # Employees | % Employees |
| Private Company Employees | 2,327 | 70.8% |
| Self-Employed (Incorporated) | 146 | 4.4% |
| Self-Employed (Not Incorporated) | 127 | 3.9% |
| Not-for-profit Organizations | 274 | 8.3% |
| Local Government Employees | 328 | 10.0% |
| State Government Employees | 50 | 1.5% |
| Federal Government Employees | 33 | 1.0% |
| Unpaid Family Workers | 0 | 0.0% |
| Total | 3,285 | 100.0% |
Employment Status by Age in Heathrow
According to the labor force statistics for Heathrow, out of the total population over 16 years of age (5,941), 60.0% or 3,565 individuals are in the labor force, with 4.9% or 175 of them unemployed. The age group with the highest labor force participation rate is 25 to 29 years, with 91.3% or 283 individuals in the labor force. Within the labor force, the 16 to 19 years age range has the highest percentage of unemployed individuals, with 100.0% or 37 of them being unemployed.
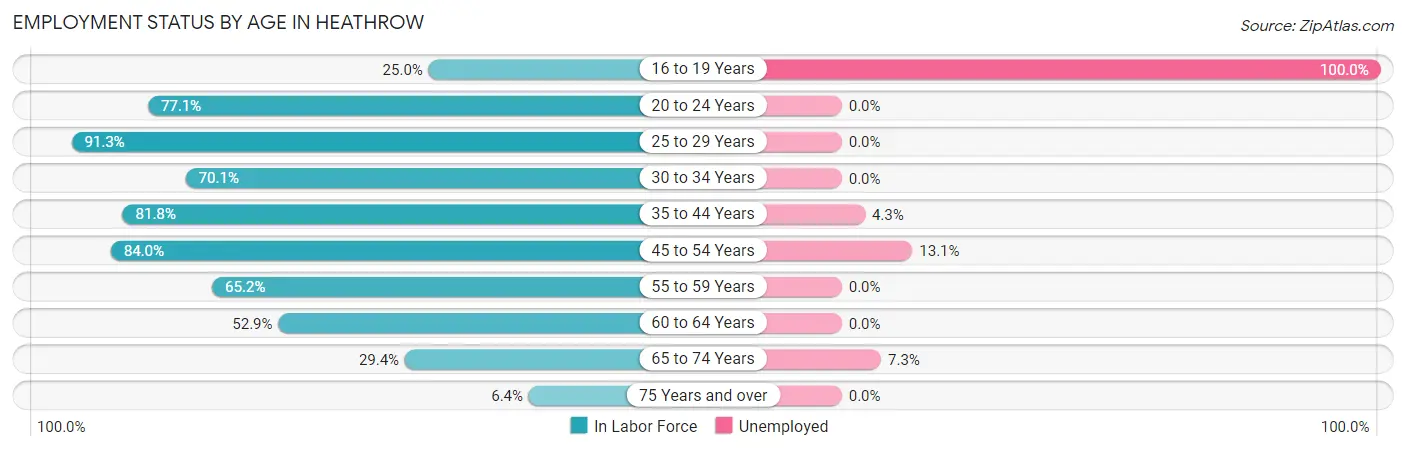
| Age Bracket | In Labor Force | Unemployed |
| 16 to 19 Years | 37 (25.0%) | 37 (100.0%) |
| 20 to 24 Years | 344 (77.1%) | 0 (0.0%) |
| 25 to 29 Years | 283 (91.3%) | 0 (0.0%) |
| 30 to 34 Years | 314 (70.1%) | 0 (0.0%) |
| 35 to 44 Years | 854 (81.8%) | 37 (4.3%) |
| 45 to 54 Years | 627 (84.0%) | 82 (13.1%) |
| 55 to 59 Years | 502 (65.2%) | 0 (0.0%) |
| 60 to 64 Years | 330 (52.9%) | 0 (0.0%) |
| 65 to 74 Years | 234 (29.4%) | 17 (7.3%) |
| 75 Years and over | 39 (6.4%) | 0 (0.0%) |
| Total | 3,565 (60.0%) | 175 (4.9%) |
Employment Status by Educational Attainment in Heathrow
According to labor force statistics for Heathrow, 73.8% of individuals (2,909) out of the total population between 25 and 64 years of age (3,942) are in the labor force, with 4.1% or 119 of them being unemployed. The group with the highest labor force participation rate are those with the educational attainment of high school diploma, with 80.0% or 184 individuals in the labor force. Within the labor force, individuals with college / associate degree education have the highest percentage of unemployment, with 12.0% or 37 of them being unemployed.
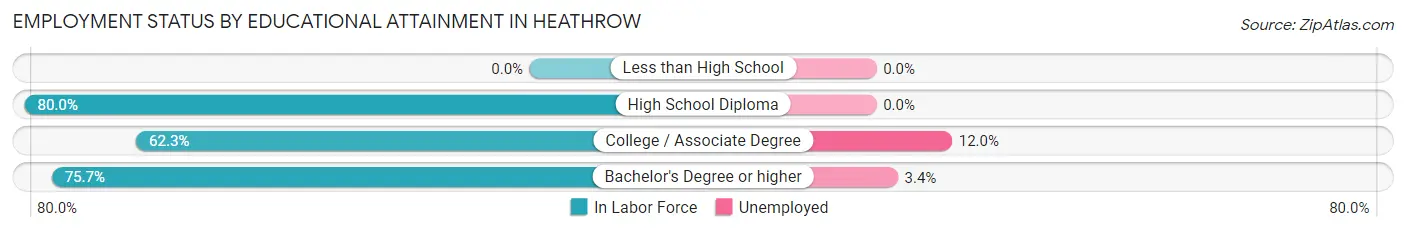
| Educational Attainment | In Labor Force | Unemployed |
| Less than High School | 0 (0.0%) | 0 (0.0%) |
| High School Diploma | 184 (80.0%) | 0 (0.0%) |
| College / Associate Degree | 308 (62.3%) | 59 (12.0%) |
| Bachelor's Degree or higher | 2,419 (75.7%) | 109 (3.4%) |
| Total | 2,909 (73.8%) | 162 (4.1%) |
Employment Occupations by Sex in Heathrow
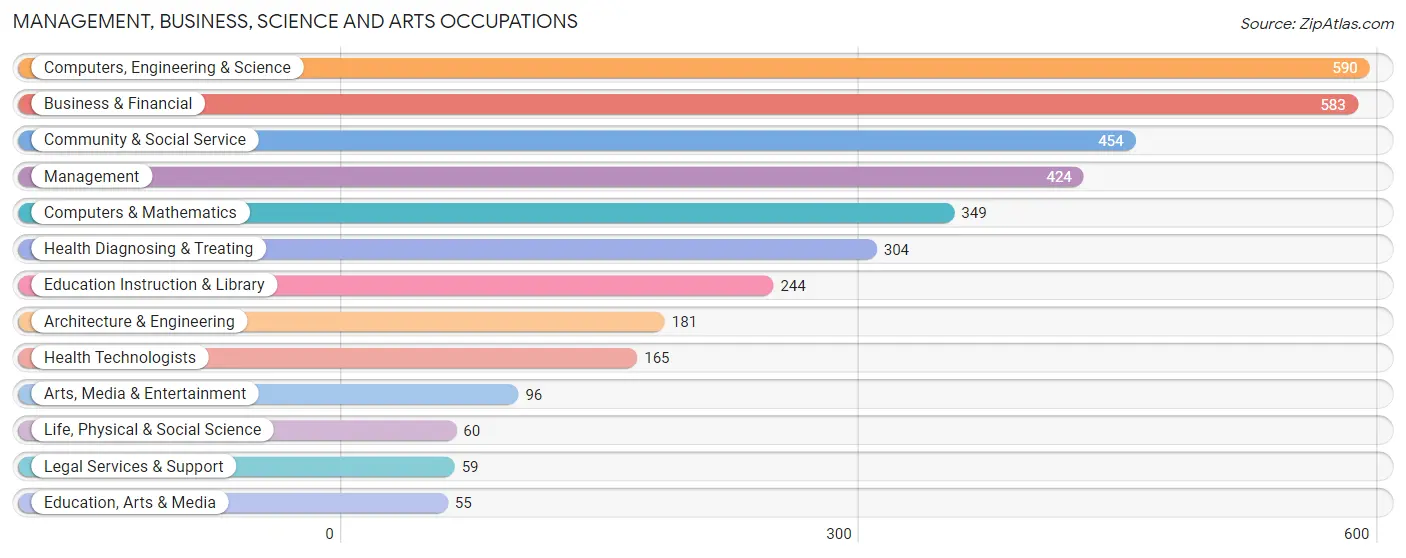
Management, Business, Science and Arts Occupations
The most common Management, Business, Science and Arts occupations in Heathrow are Computers, Engineering & Science (590 | 17.4%), Business & Financial (583 | 17.2%), Community & Social Service (454 | 13.4%), Management (424 | 12.5%), and Computers & Mathematics (349 | 10.3%).
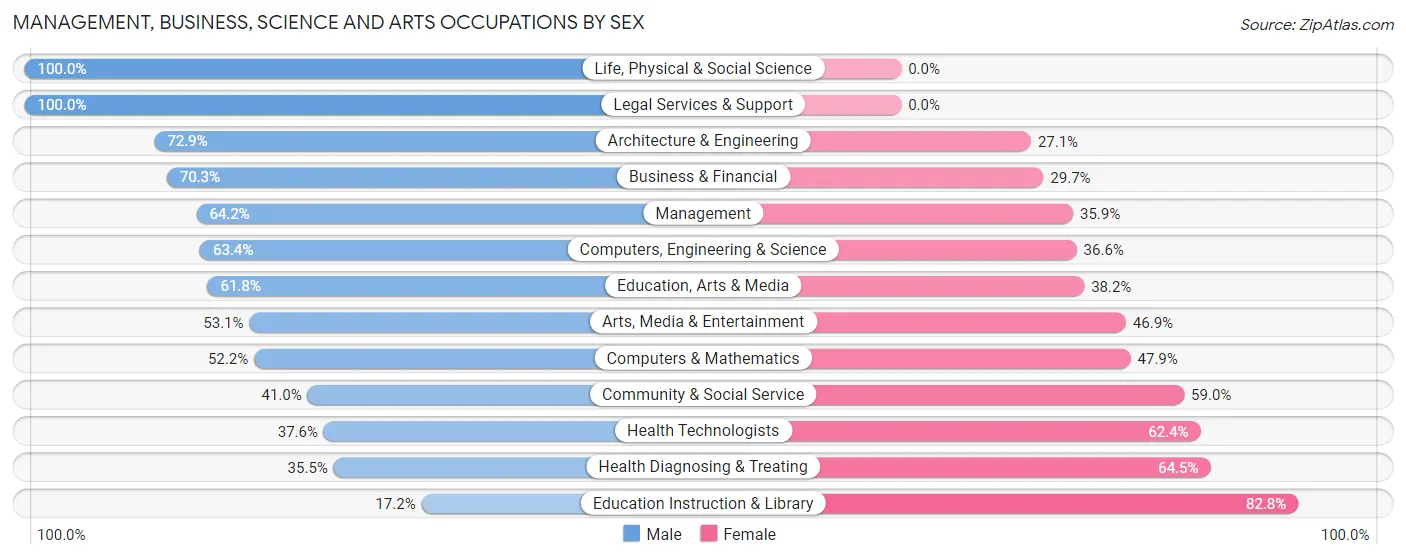
Management, Business, Science and Arts Occupations by Sex
Within the Management, Business, Science and Arts occupations in Heathrow, the most male-oriented occupations are Life, Physical & Social Science (100.0%), Legal Services & Support (100.0%), and Architecture & Engineering (72.9%), while the most female-oriented occupations are Education Instruction & Library (82.8%), Health Diagnosing & Treating (64.5%), and Health Technologists (62.4%).
| Occupation | Male | Female |
| Management | 272 (64.1%) | 152 (35.8%) |
| Business & Financial | 410 (70.3%) | 173 (29.7%) |
| Computers, Engineering & Science | 374 (63.4%) | 216 (36.6%) |
| Computers & Mathematics | 182 (52.1%) | 167 (47.8%) |
| Architecture & Engineering | 132 (72.9%) | 49 (27.1%) |
| Life, Physical & Social Science | 60 (100.0%) | 0 (0.0%) |
| Community & Social Service | 186 (41.0%) | 268 (59.0%) |
| Education, Arts & Media | 34 (61.8%) | 21 (38.2%) |
| Legal Services & Support | 59 (100.0%) | 0 (0.0%) |
| Education Instruction & Library | 42 (17.2%) | 202 (82.8%) |
| Arts, Media & Entertainment | 51 (53.1%) | 45 (46.9%) |
| Health Diagnosing & Treating | 108 (35.5%) | 196 (64.5%) |
| Health Technologists | 62 (37.6%) | 103 (62.4%) |
| Total (Category) | 1,350 (57.3%) | 1,005 (42.7%) |
| Total (Overall) | 1,929 (56.9%) | 1,462 (43.1%) |
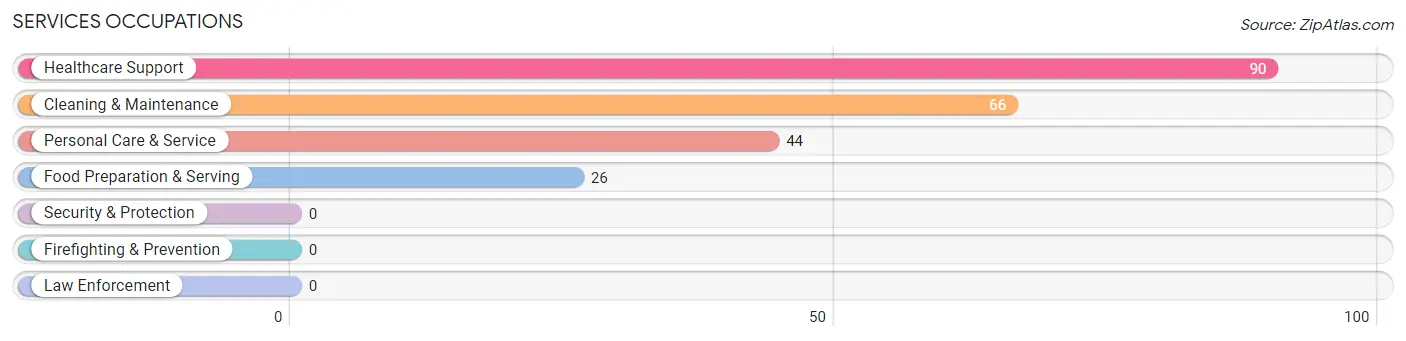
Services Occupations
The most common Services occupations in Heathrow are Healthcare Support (90 | 2.6%), Cleaning & Maintenance (66 | 1.9%), Personal Care & Service (44 | 1.3%), and Food Preparation & Serving (26 | 0.8%).
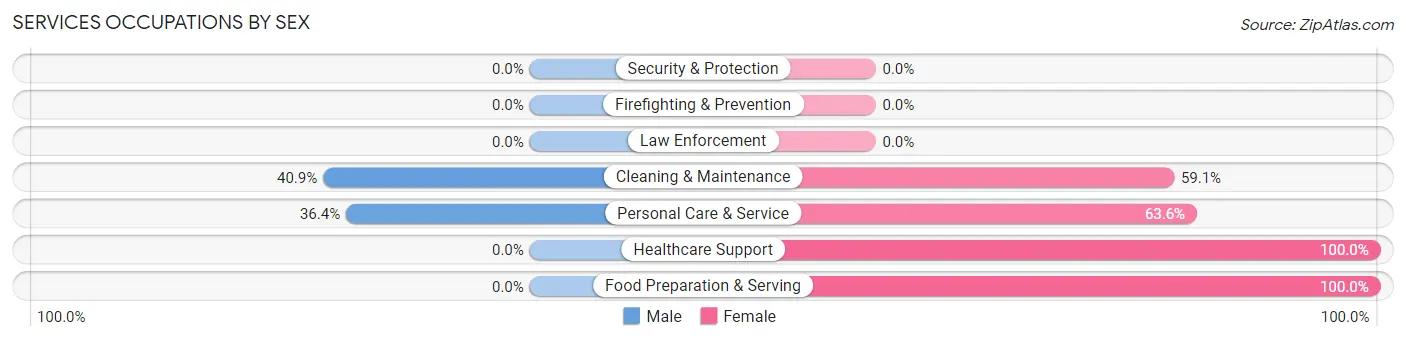
Services Occupations by Sex
Within the Services occupations in Heathrow, the most male-oriented occupations are Cleaning & Maintenance (40.9%), and Personal Care & Service (36.4%), while the most female-oriented occupations are Healthcare Support (100.0%), Food Preparation & Serving (100.0%), and Personal Care & Service (63.6%).
| Occupation | Male | Female |
| Healthcare Support | 0 (0.0%) | 90 (100.0%) |
| Security & Protection | 0 (0.0%) | 0 (0.0%) |
| Firefighting & Prevention | 0 (0.0%) | 0 (0.0%) |
| Law Enforcement | 0 (0.0%) | 0 (0.0%) |
| Food Preparation & Serving | 0 (0.0%) | 26 (100.0%) |
| Cleaning & Maintenance | 27 (40.9%) | 39 (59.1%) |
| Personal Care & Service | 16 (36.4%) | 28 (63.6%) |
| Total (Category) | 43 (19.0%) | 183 (81.0%) |
| Total (Overall) | 1,929 (56.9%) | 1,462 (43.1%) |
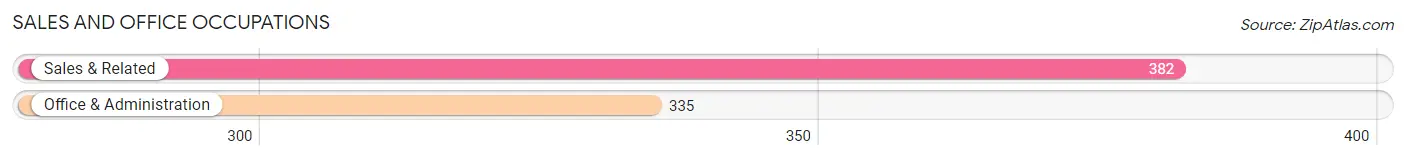
Sales and Office Occupations
The most common Sales and Office occupations in Heathrow are Sales & Related (382 | 11.3%), and Office & Administration (335 | 9.9%).
Sales and Office Occupations by Sex
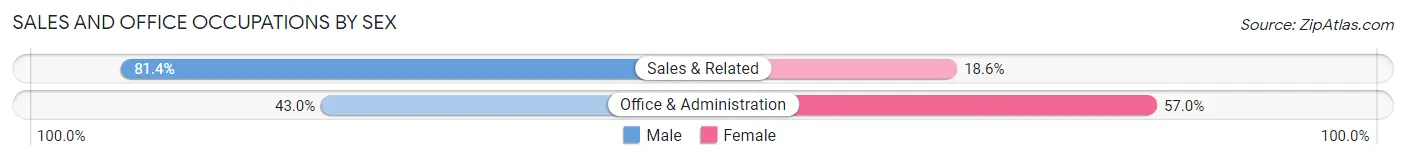
| Occupation | Male | Female |
| Sales & Related | 311 (81.4%) | 71 (18.6%) |
| Office & Administration | 144 (43.0%) | 191 (57.0%) |
| Total (Category) | 455 (63.5%) | 262 (36.5%) |
| Total (Overall) | 1,929 (56.9%) | 1,462 (43.1%) |
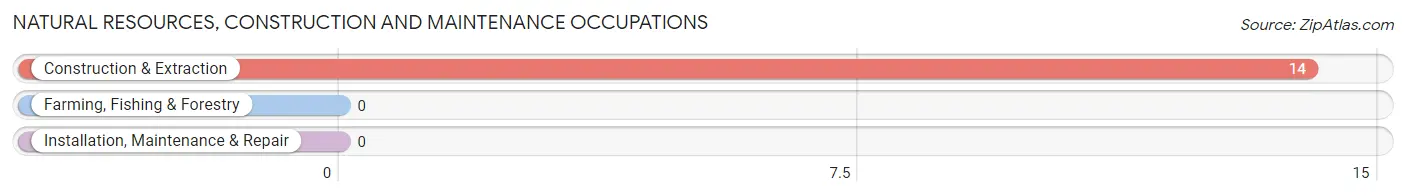
Natural Resources, Construction and Maintenance Occupations
The most common Natural Resources, Construction and Maintenance occupations in Heathrow are , and Construction & Extraction (14 | 0.4%).
Natural Resources, Construction and Maintenance Occupations by Sex
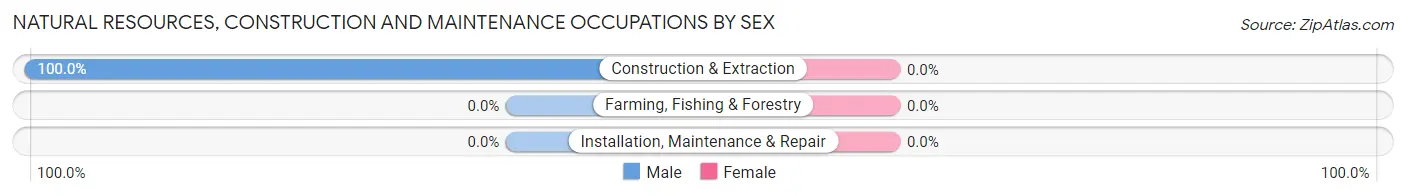
| Occupation | Male | Female |
| Farming, Fishing & Forestry | 0 (0.0%) | 0 (0.0%) |
| Construction & Extraction | 14 (100.0%) | 0 (0.0%) |
| Installation, Maintenance & Repair | 0 (0.0%) | 0 (0.0%) |
| Total (Category) | 14 (100.0%) | 0 (0.0%) |
| Total (Overall) | 1,929 (56.9%) | 1,462 (43.1%) |
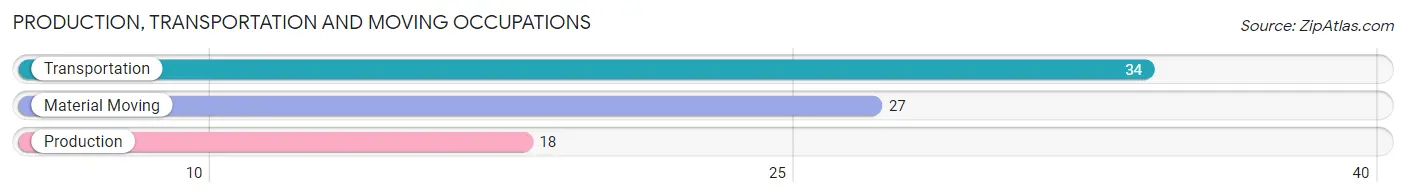
Production, Transportation and Moving Occupations
The most common Production, Transportation and Moving occupations in Heathrow are Transportation (34 | 1.0%), Material Moving (27 | 0.8%), and Production (18 | 0.5%).
Production, Transportation and Moving Occupations by Sex
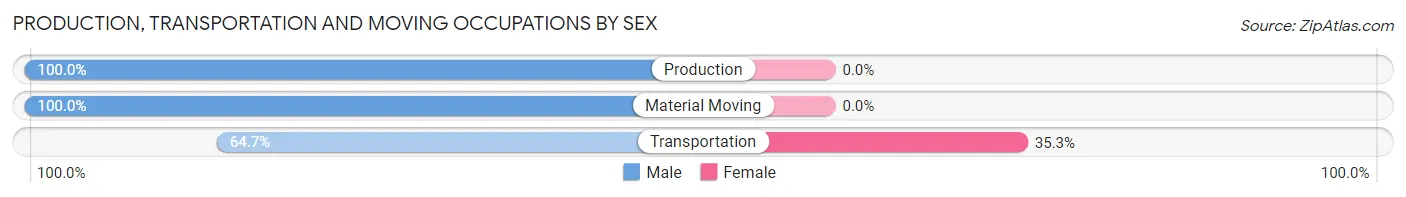
| Occupation | Male | Female |
| Production | 18 (100.0%) | 0 (0.0%) |
| Transportation | 22 (64.7%) | 12 (35.3%) |
| Material Moving | 27 (100.0%) | 0 (0.0%) |
| Total (Category) | 67 (84.8%) | 12 (15.2%) |
| Total (Overall) | 1,929 (56.9%) | 1,462 (43.1%) |
Employment Industries by Sex in Heathrow
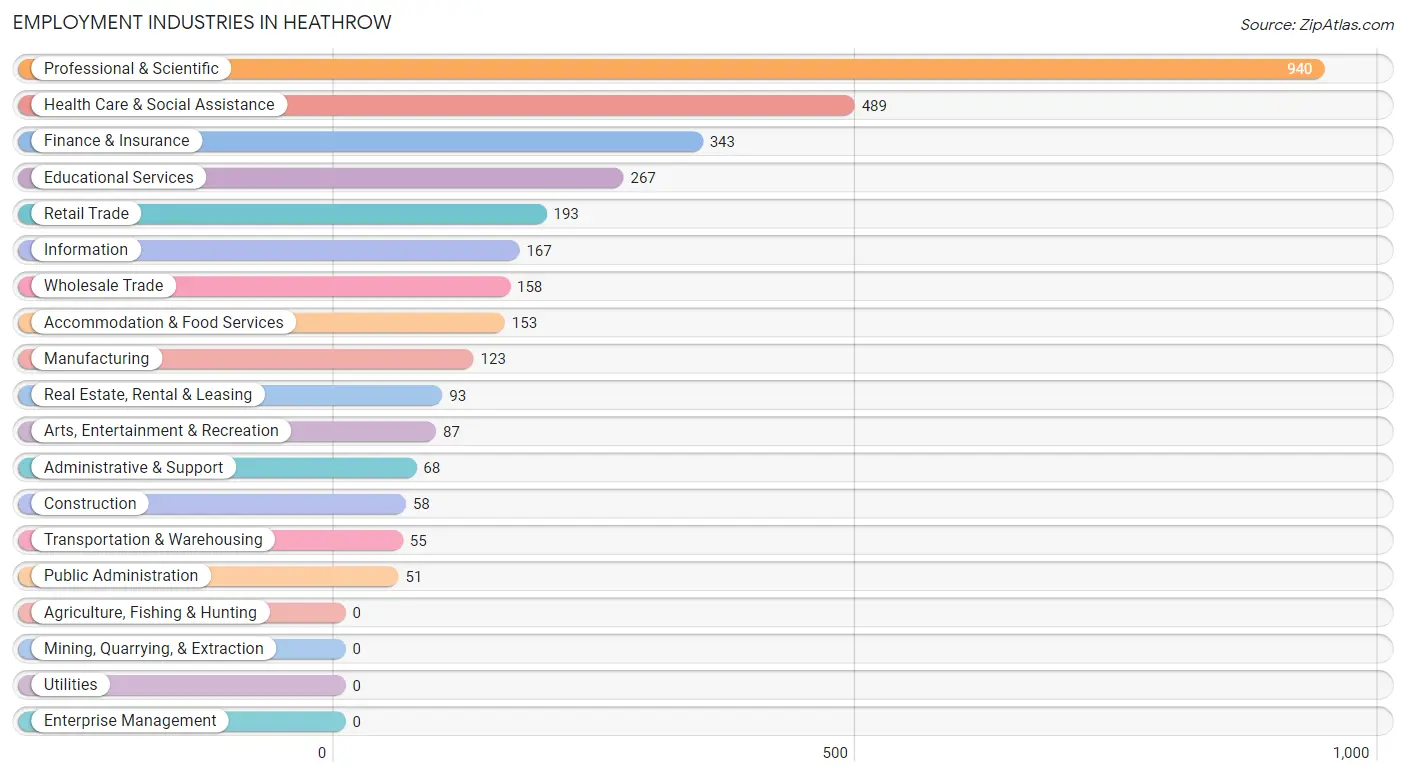
Employment Industries in Heathrow
The major employment industries in Heathrow include Professional & Scientific (940 | 27.7%), Health Care & Social Assistance (489 | 14.4%), Finance & Insurance (343 | 10.1%), Educational Services (267 | 7.9%), and Retail Trade (193 | 5.7%).
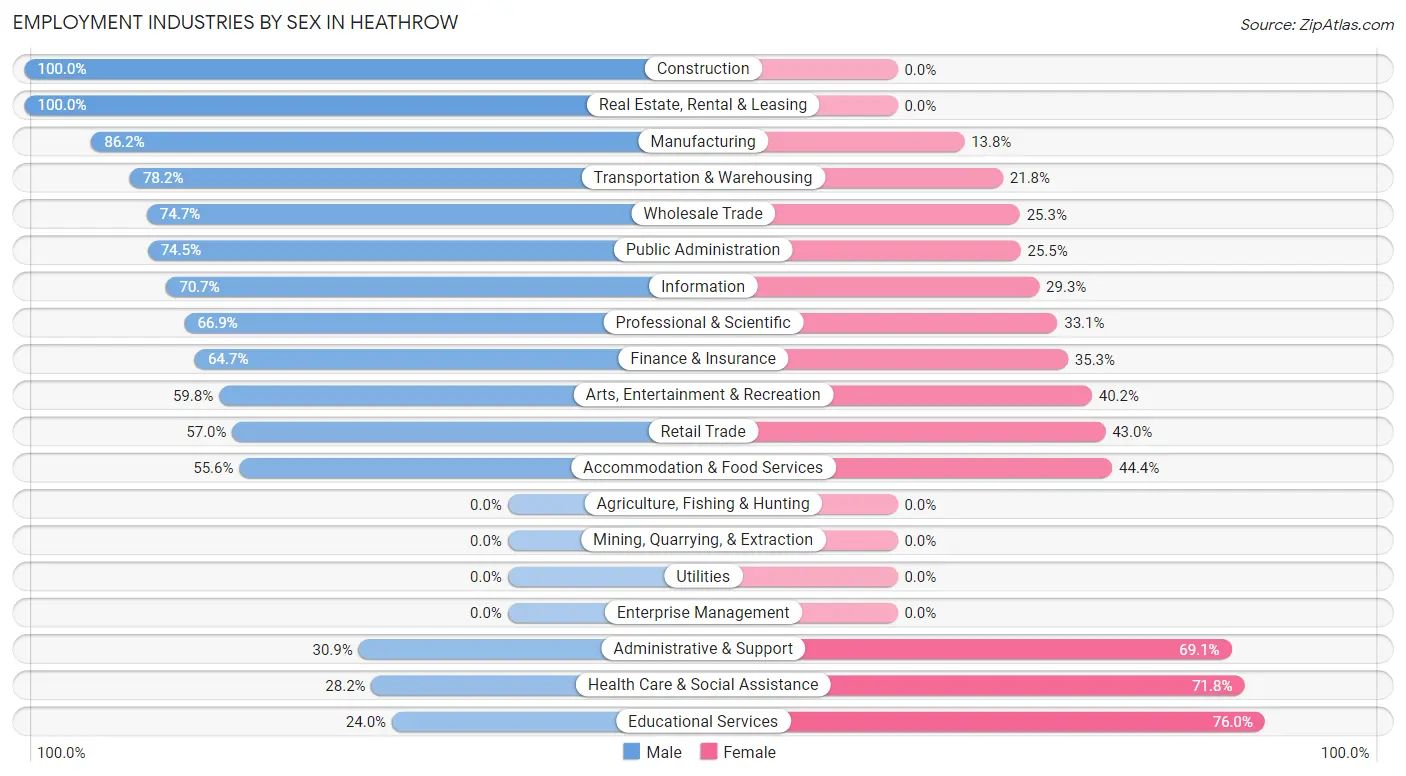
Employment Industries by Sex in Heathrow
The Heathrow industries that see more men than women are Construction (100.0%), Real Estate, Rental & Leasing (100.0%), and Manufacturing (86.2%), whereas the industries that tend to have a higher number of women are Educational Services (76.0%), Health Care & Social Assistance (71.8%), and Administrative & Support (69.1%).
| Industry | Male | Female |
| Agriculture, Fishing & Hunting | 0 (0.0%) | 0 (0.0%) |
| Mining, Quarrying, & Extraction | 0 (0.0%) | 0 (0.0%) |
| Construction | 58 (100.0%) | 0 (0.0%) |
| Manufacturing | 106 (86.2%) | 17 (13.8%) |
| Wholesale Trade | 118 (74.7%) | 40 (25.3%) |
| Retail Trade | 110 (57.0%) | 83 (43.0%) |
| Transportation & Warehousing | 43 (78.2%) | 12 (21.8%) |
| Utilities | 0 (0.0%) | 0 (0.0%) |
| Information | 118 (70.7%) | 49 (29.3%) |
| Finance & Insurance | 222 (64.7%) | 121 (35.3%) |
| Real Estate, Rental & Leasing | 93 (100.0%) | 0 (0.0%) |
| Professional & Scientific | 629 (66.9%) | 311 (33.1%) |
| Enterprise Management | 0 (0.0%) | 0 (0.0%) |
| Administrative & Support | 21 (30.9%) | 47 (69.1%) |
| Educational Services | 64 (24.0%) | 203 (76.0%) |
| Health Care & Social Assistance | 138 (28.2%) | 351 (71.8%) |
| Arts, Entertainment & Recreation | 52 (59.8%) | 35 (40.2%) |
| Accommodation & Food Services | 85 (55.6%) | 68 (44.4%) |
| Public Administration | 38 (74.5%) | 13 (25.5%) |
| Total | 1,929 (56.9%) | 1,462 (43.1%) |
Education in Heathrow
School Enrollment in Heathrow
The most common levels of schooling among the 1,528 students in Heathrow are middle school (394 | 25.8%), college / undergraduate (351 | 23.0%), and elementary school (303 | 19.8%).
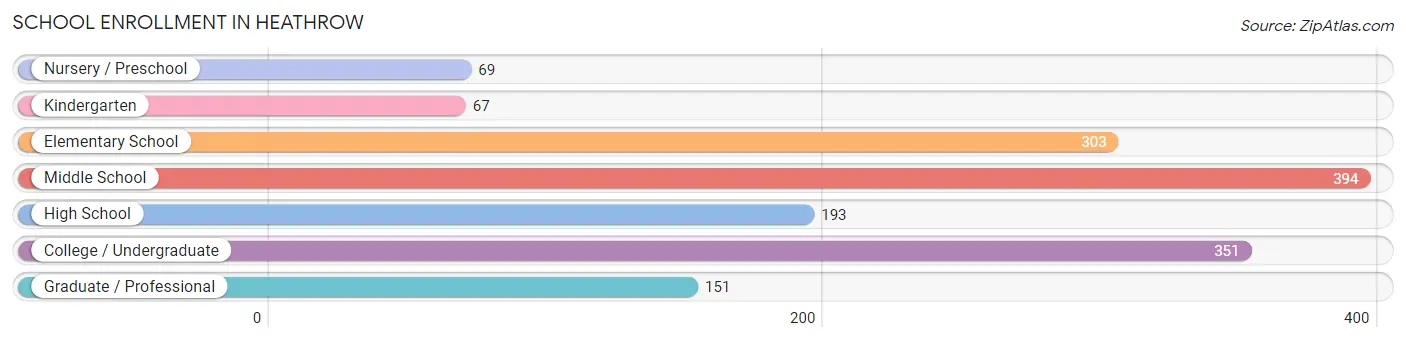
| School Level | # Students | % Students |
| Nursery / Preschool | 69 | 4.5% |
| Kindergarten | 67 | 4.4% |
| Elementary School | 303 | 19.8% |
| Middle School | 394 | 25.8% |
| High School | 193 | 12.6% |
| College / Undergraduate | 351 | 23.0% |
| Graduate / Professional | 151 | 9.9% |
| Total | 1,528 | 100.0% |
School Enrollment by Age by Funding Source in Heathrow
Out of a total of 1,528 students who are enrolled in schools in Heathrow, 435 (28.5%) attend a private institution, while the remaining 1,093 (71.5%) are enrolled in public schools. The age group of 3 to 4 year olds has the highest likelihood of being enrolled in private schools, with 12 (100.0% in the age bracket) enrolled. Conversely, the age group of 25 to 34 year olds has the lowest likelihood of being enrolled in a private school, with 24 (100.0% in the age bracket) attending a public institution.
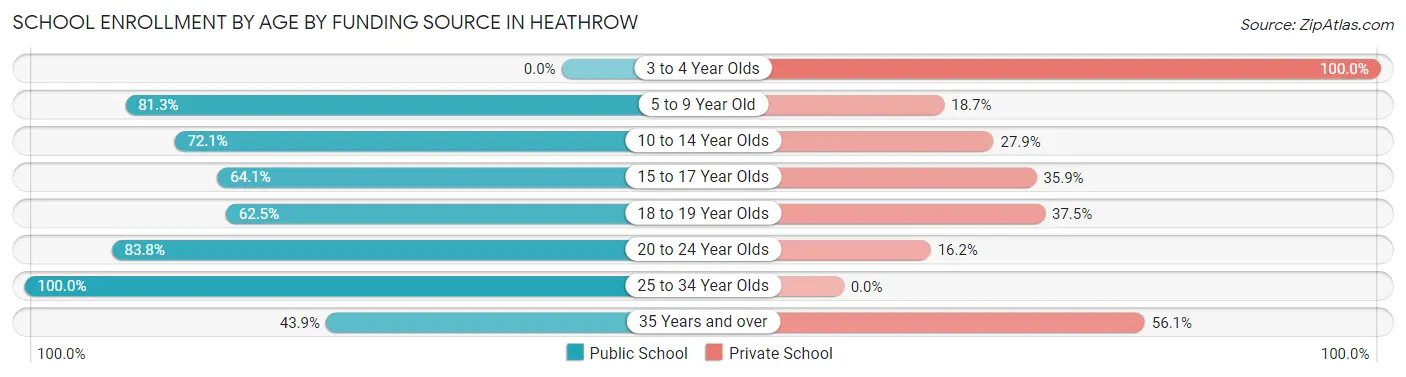
| Age Bracket | Public School | Private School |
| 3 to 4 Year Olds | 0 (0.0%) | 12 (100.0%) |
| 5 to 9 Year Old | 347 (81.3%) | 80 (18.7%) |
| 10 to 14 Year Olds | 284 (72.1%) | 110 (27.9%) |
| 15 to 17 Year Olds | 116 (64.1%) | 65 (35.9%) |
| 18 to 19 Year Olds | 20 (62.5%) | 12 (37.5%) |
| 20 to 24 Year Olds | 212 (83.8%) | 41 (16.2%) |
| 25 to 34 Year Olds | 24 (100.0%) | 0 (0.0%) |
| 35 Years and over | 90 (43.9%) | 115 (56.1%) |
| Total | 1,093 (71.5%) | 435 (28.5%) |
Educational Attainment by Field of Study in Heathrow
Business (1,517 | 35.1%), education (389 | 9.0%), social sciences (383 | 8.9%), engineering (342 | 7.9%), and computers & mathematics (293 | 6.8%) are the most common fields of study among 4,324 individuals in Heathrow who have obtained a bachelor's degree or higher.
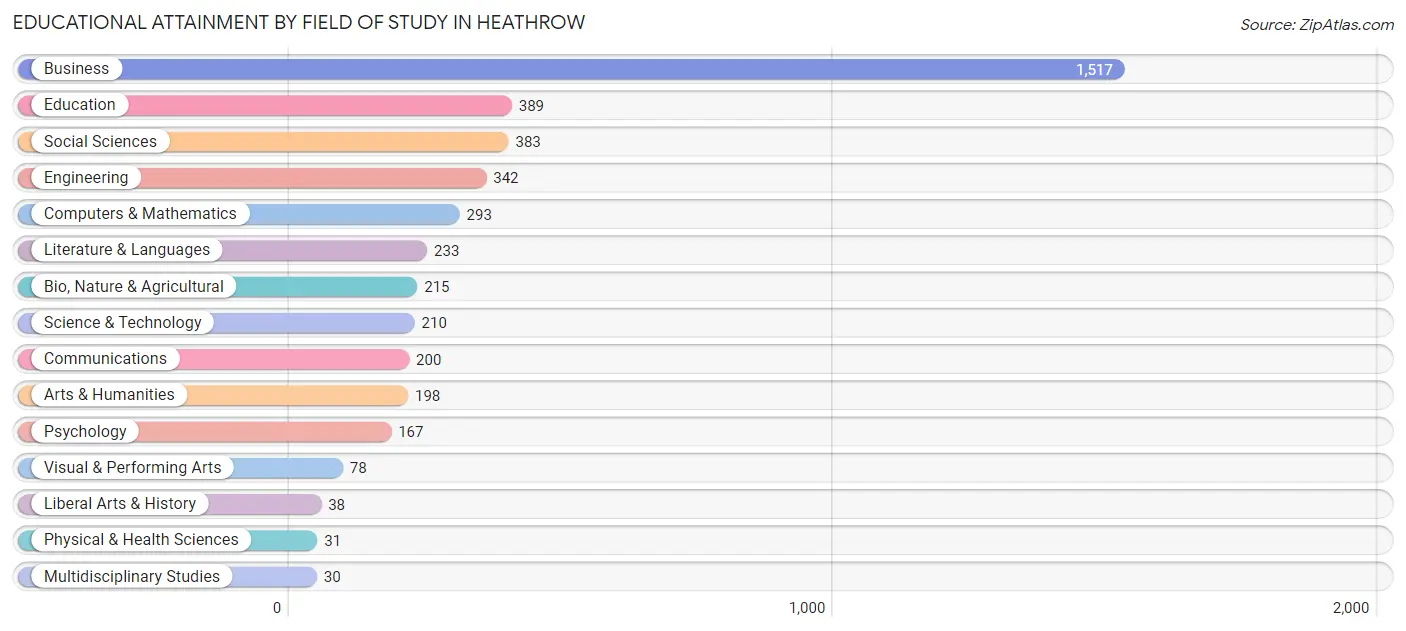
| Field of Study | # Graduates | % Graduates |
| Computers & Mathematics | 293 | 6.8% |
| Bio, Nature & Agricultural | 215 | 5.0% |
| Physical & Health Sciences | 31 | 0.7% |
| Psychology | 167 | 3.9% |
| Social Sciences | 383 | 8.9% |
| Engineering | 342 | 7.9% |
| Multidisciplinary Studies | 30 | 0.7% |
| Science & Technology | 210 | 4.9% |
| Business | 1,517 | 35.1% |
| Education | 389 | 9.0% |
| Literature & Languages | 233 | 5.4% |
| Liberal Arts & History | 38 | 0.9% |
| Visual & Performing Arts | 78 | 1.8% |
| Communications | 200 | 4.6% |
| Arts & Humanities | 198 | 4.6% |
| Total | 4,324 | 100.0% |
Transportation & Commute in Heathrow
Vehicle Availability by Sex in Heathrow
The most prevalent vehicle ownership categories in Heathrow are males with 2 vehicles (1,002, accounting for 53.6%) and females with 2 vehicles (838, making up 70.7%).
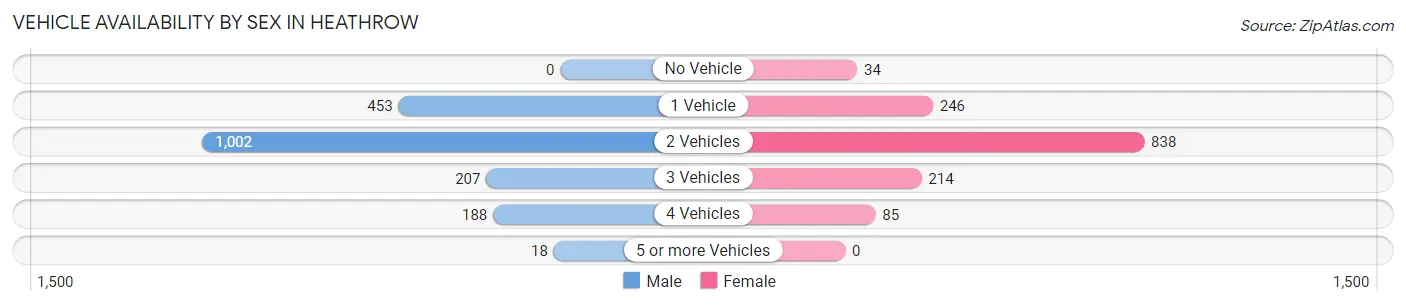
| Vehicles Available | Male | Female |
| No Vehicle | 0 (0.0%) | 34 (2.4%) |
| 1 Vehicle | 453 (24.2%) | 246 (17.4%) |
| 2 Vehicles | 1,002 (53.6%) | 838 (59.1%) |
| 3 Vehicles | 207 (11.1%) | 214 (15.1%) |
| 4 Vehicles | 188 (10.1%) | 85 (6.0%) |
| 5 or more Vehicles | 18 (1.0%) | 0 (0.0%) |
| Total | 1,868 (100.0%) | 1,417 (100.0%) |
Commute Time in Heathrow
The most frequently occuring commute durations in Heathrow are 10 to 14 minutes (443 commuters, 19.2%), 15 to 19 minutes (312 commuters, 13.6%), and 30 to 34 minutes (273 commuters, 11.8%).
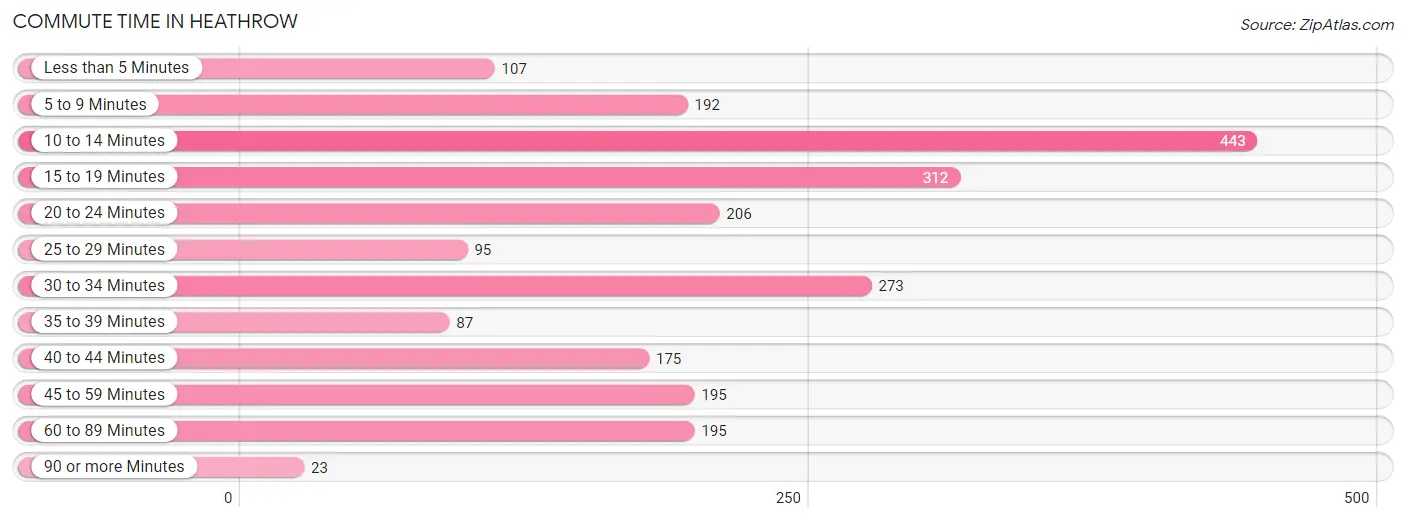
| Commute Time | # Commuters | % Commuters |
| Less than 5 Minutes | 107 | 4.6% |
| 5 to 9 Minutes | 192 | 8.3% |
| 10 to 14 Minutes | 443 | 19.2% |
| 15 to 19 Minutes | 312 | 13.6% |
| 20 to 24 Minutes | 206 | 8.9% |
| 25 to 29 Minutes | 95 | 4.1% |
| 30 to 34 Minutes | 273 | 11.8% |
| 35 to 39 Minutes | 87 | 3.8% |
| 40 to 44 Minutes | 175 | 7.6% |
| 45 to 59 Minutes | 195 | 8.5% |
| 60 to 89 Minutes | 195 | 8.5% |
| 90 or more Minutes | 23 | 1.0% |
Commute Time by Sex in Heathrow
The most common commute times in Heathrow are 10 to 14 minutes (317 commuters, 22.1%) for males and 60 to 89 minutes (157 commuters, 18.1%) for females.
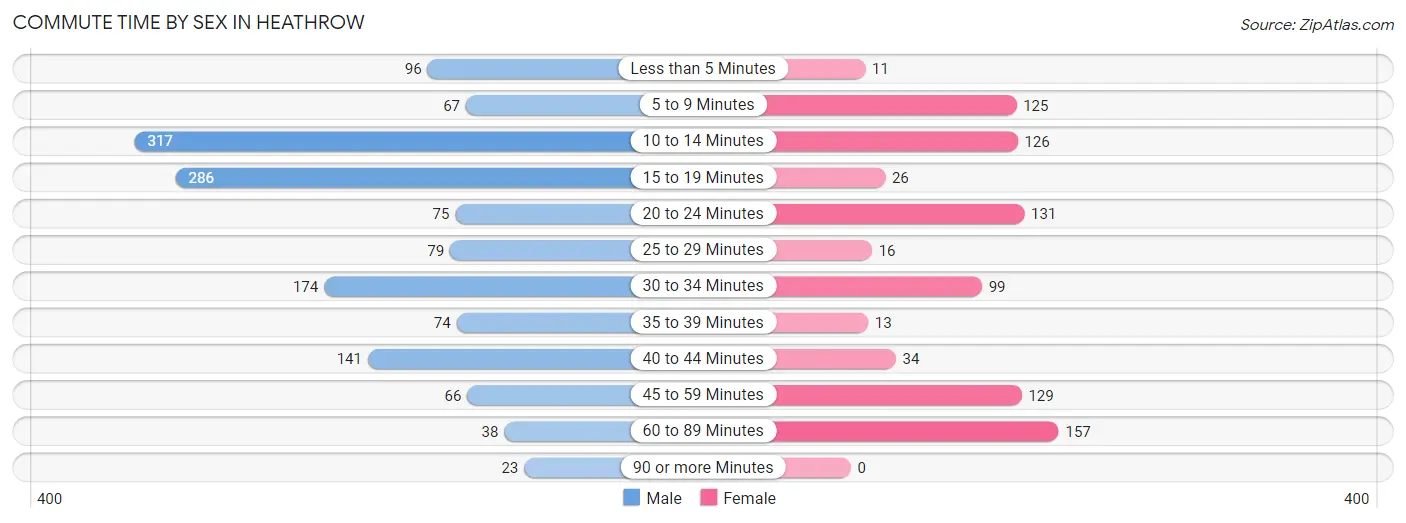
| Commute Time | Male | Female |
| Less than 5 Minutes | 96 (6.7%) | 11 (1.3%) |
| 5 to 9 Minutes | 67 (4.7%) | 125 (14.4%) |
| 10 to 14 Minutes | 317 (22.1%) | 126 (14.5%) |
| 15 to 19 Minutes | 286 (19.9%) | 26 (3.0%) |
| 20 to 24 Minutes | 75 (5.2%) | 131 (15.1%) |
| 25 to 29 Minutes | 79 (5.5%) | 16 (1.8%) |
| 30 to 34 Minutes | 174 (12.1%) | 99 (11.4%) |
| 35 to 39 Minutes | 74 (5.1%) | 13 (1.5%) |
| 40 to 44 Minutes | 141 (9.8%) | 34 (3.9%) |
| 45 to 59 Minutes | 66 (4.6%) | 129 (14.9%) |
| 60 to 89 Minutes | 38 (2.6%) | 157 (18.1%) |
| 90 or more Minutes | 23 (1.6%) | 0 (0.0%) |
Time of Departure to Work by Sex in Heathrow
The most frequent times of departure to work in Heathrow are 7:30 AM to 7:59 AM (324, 22.6%) for males and 9:00 AM to 9:59 AM (202, 23.3%) for females.
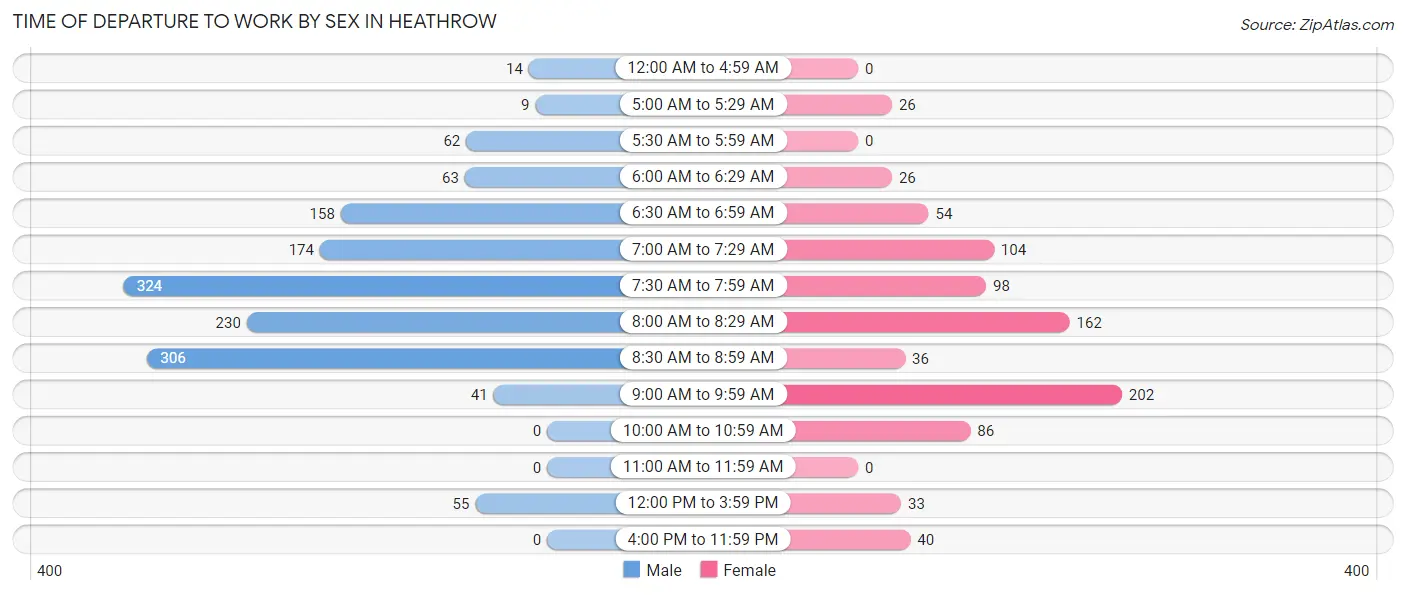
| Time of Departure | Male | Female |
| 12:00 AM to 4:59 AM | 14 (1.0%) | 0 (0.0%) |
| 5:00 AM to 5:29 AM | 9 (0.6%) | 26 (3.0%) |
| 5:30 AM to 5:59 AM | 62 (4.3%) | 0 (0.0%) |
| 6:00 AM to 6:29 AM | 63 (4.4%) | 26 (3.0%) |
| 6:30 AM to 6:59 AM | 158 (11.0%) | 54 (6.2%) |
| 7:00 AM to 7:29 AM | 174 (12.1%) | 104 (12.0%) |
| 7:30 AM to 7:59 AM | 324 (22.6%) | 98 (11.3%) |
| 8:00 AM to 8:29 AM | 230 (16.0%) | 162 (18.7%) |
| 8:30 AM to 8:59 AM | 306 (21.3%) | 36 (4.2%) |
| 9:00 AM to 9:59 AM | 41 (2.9%) | 202 (23.3%) |
| 10:00 AM to 10:59 AM | 0 (0.0%) | 86 (9.9%) |
| 11:00 AM to 11:59 AM | 0 (0.0%) | 0 (0.0%) |
| 12:00 PM to 3:59 PM | 55 (3.8%) | 33 (3.8%) |
| 4:00 PM to 11:59 PM | 0 (0.0%) | 40 (4.6%) |
| Total | 1,436 (100.0%) | 867 (100.0%) |
Housing Occupancy in Heathrow
Occupancy by Ownership in Heathrow
Of the total 3,044 dwellings in Heathrow, owner-occupied units account for 2,058 (67.6%), while renter-occupied units make up 986 (32.4%).
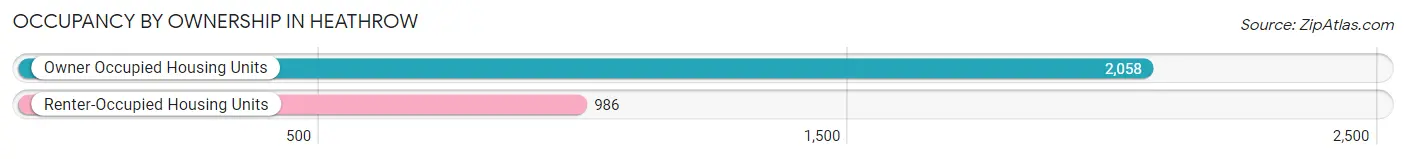
| Occupancy | # Housing Units | % Housing Units |
| Owner Occupied Housing Units | 2,058 | 67.6% |
| Renter-Occupied Housing Units | 986 | 32.4% |
| Total Occupied Housing Units | 3,044 | 100.0% |
Occupancy by Household Size in Heathrow
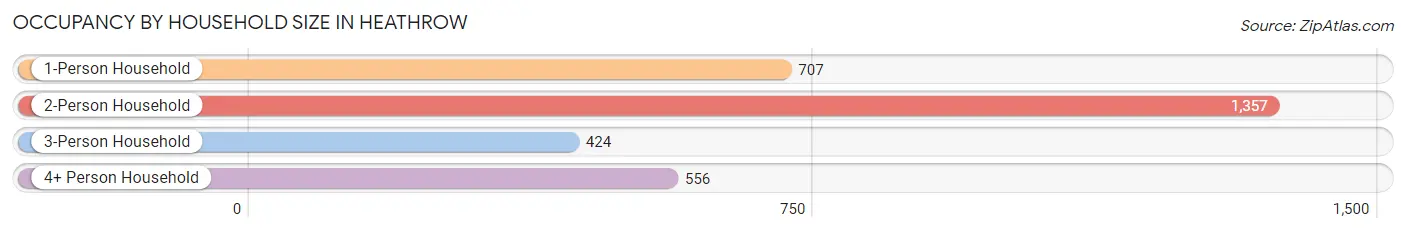
| Household Size | # Housing Units | % Housing Units |
| 1-Person Household | 707 | 23.2% |
| 2-Person Household | 1,357 | 44.6% |
| 3-Person Household | 424 | 13.9% |
| 4+ Person Household | 556 | 18.3% |
| Total Housing Units | 3,044 | 100.0% |
Occupancy by Ownership by Household Size in Heathrow
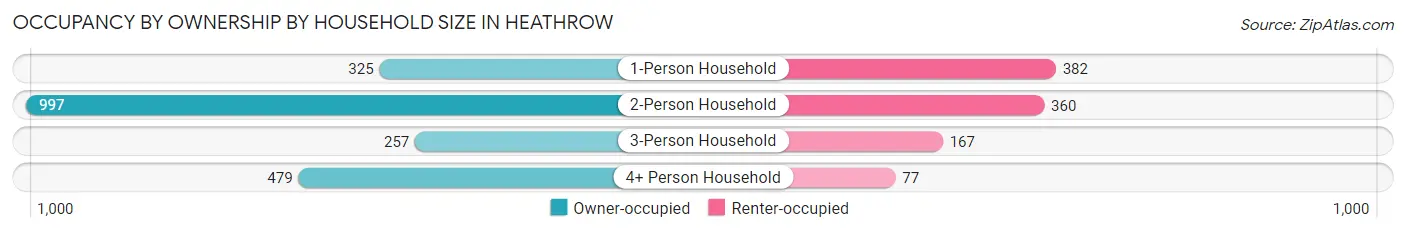
| Household Size | Owner-occupied | Renter-occupied |
| 1-Person Household | 325 (46.0%) | 382 (54.0%) |
| 2-Person Household | 997 (73.5%) | 360 (26.5%) |
| 3-Person Household | 257 (60.6%) | 167 (39.4%) |
| 4+ Person Household | 479 (86.2%) | 77 (13.9%) |
| Total Housing Units | 2,058 (67.6%) | 986 (32.4%) |
Occupancy by Educational Attainment in Heathrow
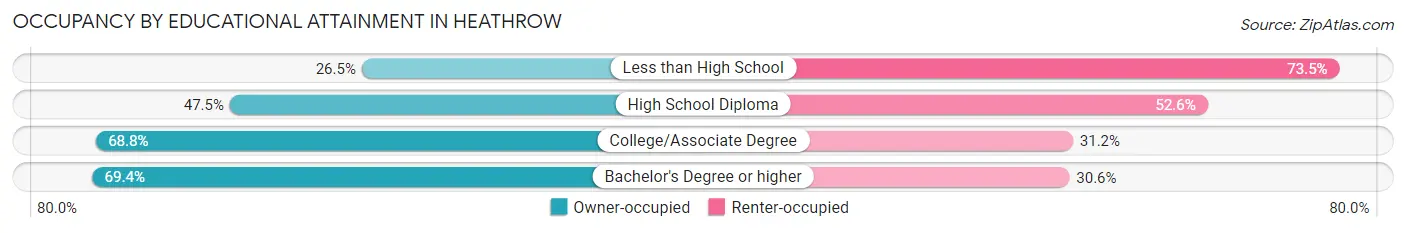
| Household Size | Owner-occupied | Renter-occupied |
| Less than High School | 13 (26.5%) | 36 (73.5%) |
| High School Diploma | 65 (47.4%) | 72 (52.5%) |
| College/Associate Degree | 269 (68.8%) | 122 (31.2%) |
| Bachelor's Degree or higher | 1,711 (69.4%) | 756 (30.6%) |
Occupancy by Age of Householder in Heathrow
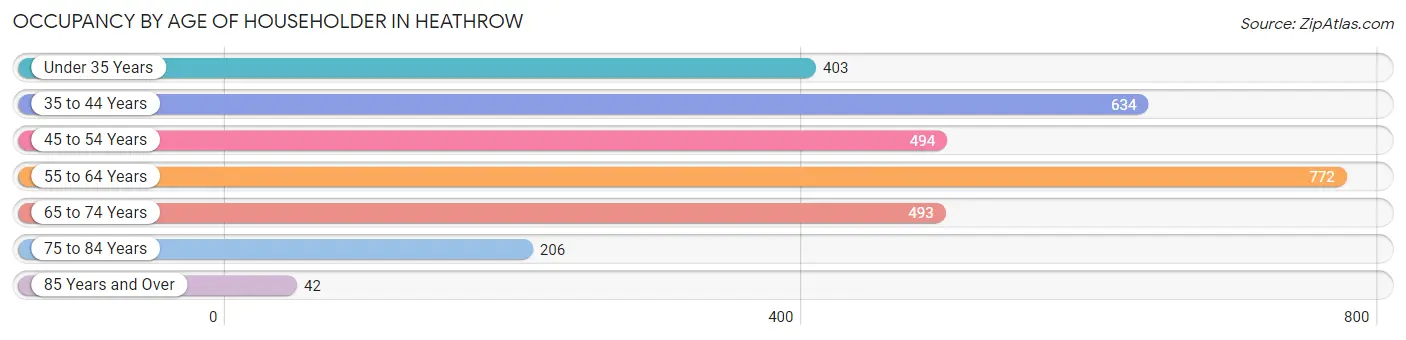
| Age Bracket | # Households | % Households |
| Under 35 Years | 403 | 13.2% |
| 35 to 44 Years | 634 | 20.8% |
| 45 to 54 Years | 494 | 16.2% |
| 55 to 64 Years | 772 | 25.4% |
| 65 to 74 Years | 493 | 16.2% |
| 75 to 84 Years | 206 | 6.8% |
| 85 Years and Over | 42 | 1.4% |
| Total | 3,044 | 100.0% |
Housing Finances in Heathrow
Median Income by Occupancy in Heathrow
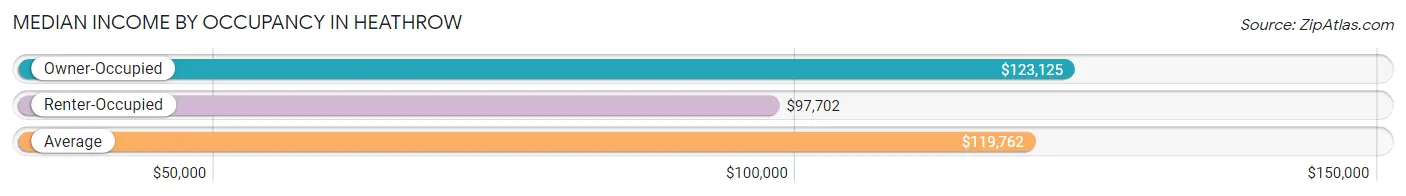
| Occupancy Type | # Households | Median Income |
| Owner-Occupied | 2,058 (67.6%) | $123,125 |
| Renter-Occupied | 986 (32.4%) | $97,702 |
| Average | 3,044 (100.0%) | $119,762 |
Occupancy by Householder Income Bracket in Heathrow
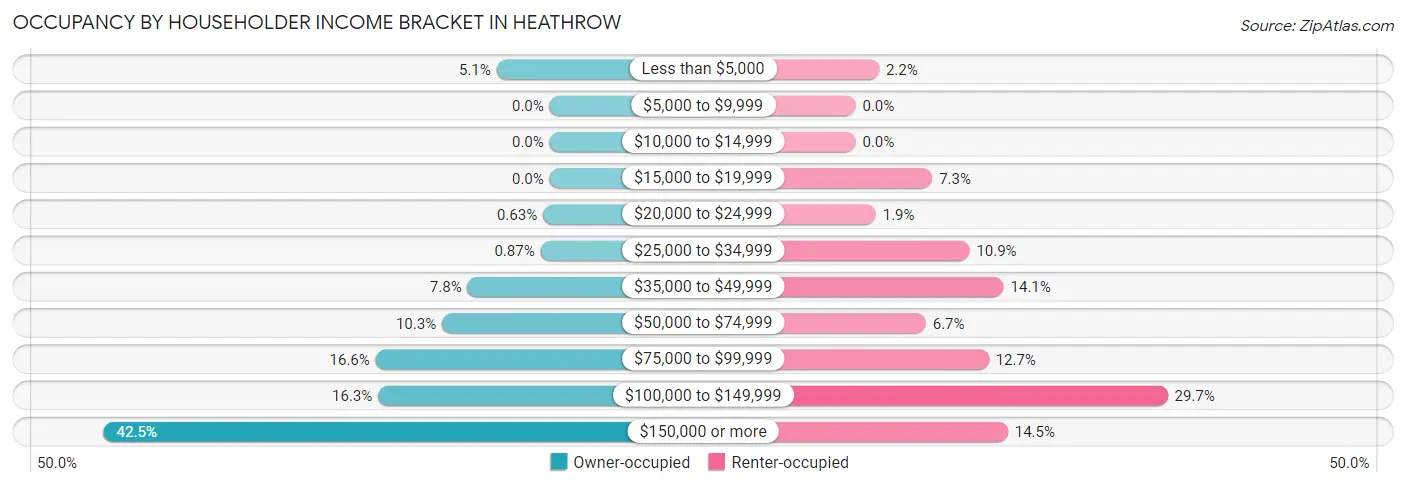
| Income Bracket | Owner-occupied | Renter-occupied |
| Less than $5,000 | 104 (5.1%) | 22 (2.2%) |
| $5,000 to $9,999 | 0 (0.0%) | 0 (0.0%) |
| $10,000 to $14,999 | 0 (0.0%) | 0 (0.0%) |
| $15,000 to $19,999 | 0 (0.0%) | 72 (7.3%) |
| $20,000 to $24,999 | 13 (0.6%) | 19 (1.9%) |
| $25,000 to $34,999 | 18 (0.9%) | 107 (10.8%) |
| $35,000 to $49,999 | 161 (7.8%) | 139 (14.1%) |
| $50,000 to $74,999 | 211 (10.2%) | 66 (6.7%) |
| $75,000 to $99,999 | 341 (16.6%) | 125 (12.7%) |
| $100,000 to $149,999 | 336 (16.3%) | 293 (29.7%) |
| $150,000 or more | 874 (42.5%) | 143 (14.5%) |
| Total | 2,058 (100.0%) | 986 (100.0%) |
Monthly Housing Cost Tiers in Heathrow
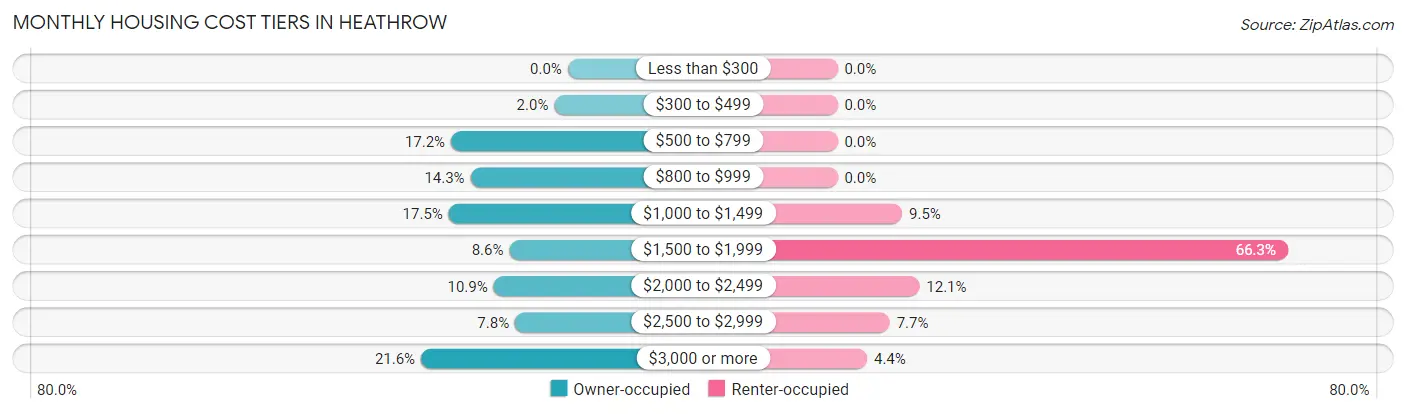
| Monthly Cost | Owner-occupied | Renter-occupied |
| Less than $300 | 0 (0.0%) | 0 (0.0%) |
| $300 to $499 | 41 (2.0%) | 0 (0.0%) |
| $500 to $799 | 354 (17.2%) | 0 (0.0%) |
| $800 to $999 | 295 (14.3%) | 0 (0.0%) |
| $1,000 to $1,499 | 361 (17.5%) | 94 (9.5%) |
| $1,500 to $1,999 | 177 (8.6%) | 654 (66.3%) |
| $2,000 to $2,499 | 225 (10.9%) | 119 (12.1%) |
| $2,500 to $2,999 | 160 (7.8%) | 76 (7.7%) |
| $3,000 or more | 445 (21.6%) | 43 (4.4%) |
| Total | 2,058 (100.0%) | 986 (100.0%) |
Physical Housing Characteristics in Heathrow
Housing Structures in Heathrow
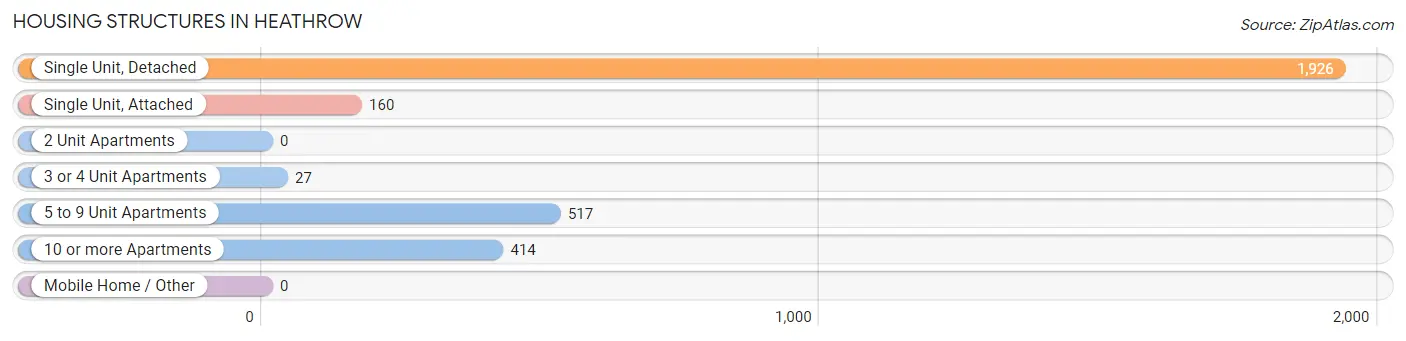
| Structure Type | # Housing Units | % Housing Units |
| Single Unit, Detached | 1,926 | 63.3% |
| Single Unit, Attached | 160 | 5.3% |
| 2 Unit Apartments | 0 | 0.0% |
| 3 or 4 Unit Apartments | 27 | 0.9% |
| 5 to 9 Unit Apartments | 517 | 17.0% |
| 10 or more Apartments | 414 | 13.6% |
| Mobile Home / Other | 0 | 0.0% |
| Total | 3,044 | 100.0% |
Housing Structures by Occupancy in Heathrow
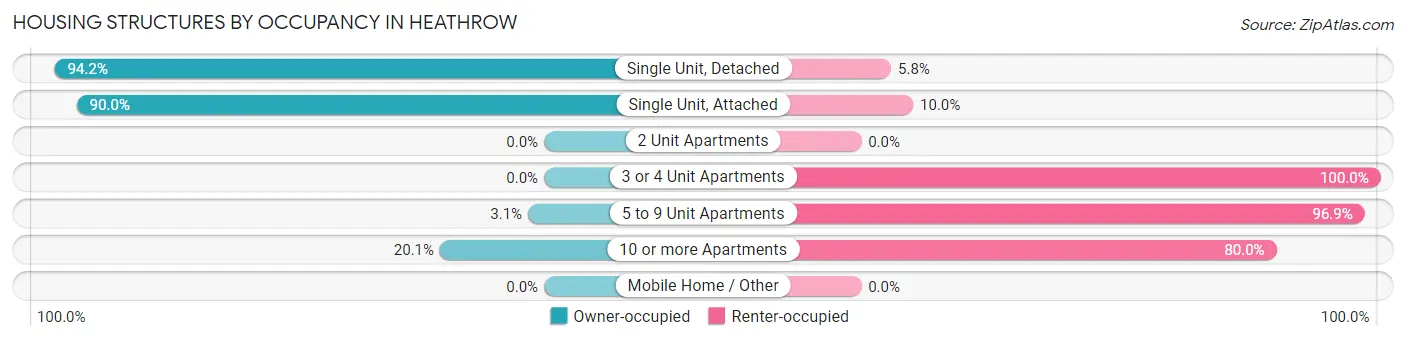
| Structure Type | Owner-occupied | Renter-occupied |
| Single Unit, Detached | 1,815 (94.2%) | 111 (5.8%) |
| Single Unit, Attached | 144 (90.0%) | 16 (10.0%) |
| 2 Unit Apartments | 0 (0.0%) | 0 (0.0%) |
| 3 or 4 Unit Apartments | 0 (0.0%) | 27 (100.0%) |
| 5 to 9 Unit Apartments | 16 (3.1%) | 501 (96.9%) |
| 10 or more Apartments | 83 (20.1%) | 331 (79.9%) |
| Mobile Home / Other | 0 (0.0%) | 0 (0.0%) |
| Total | 2,058 (67.6%) | 986 (32.4%) |
Housing Structures by Number of Rooms in Heathrow
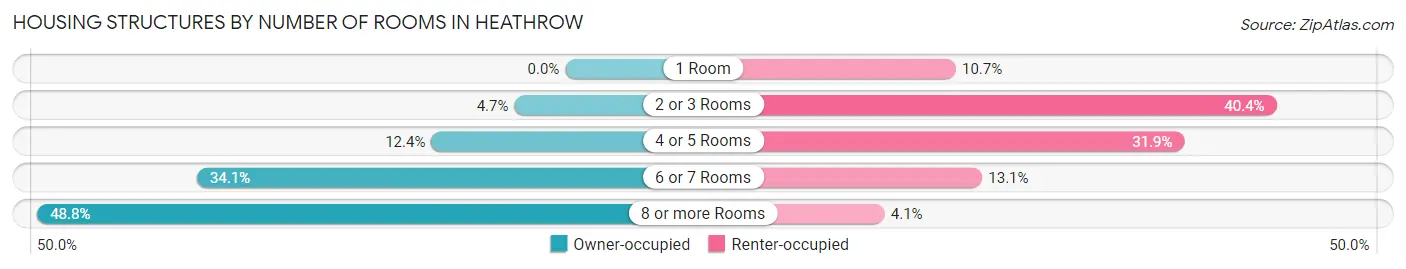
| Number of Rooms | Owner-occupied | Renter-occupied |
| 1 Room | 0 (0.0%) | 105 (10.6%) |
| 2 or 3 Rooms | 97 (4.7%) | 398 (40.4%) |
| 4 or 5 Rooms | 255 (12.4%) | 314 (31.9%) |
| 6 or 7 Rooms | 701 (34.1%) | 129 (13.1%) |
| 8 or more Rooms | 1,005 (48.8%) | 40 (4.1%) |
| Total | 2,058 (100.0%) | 986 (100.0%) |
Housing Structure by Heating Type in Heathrow
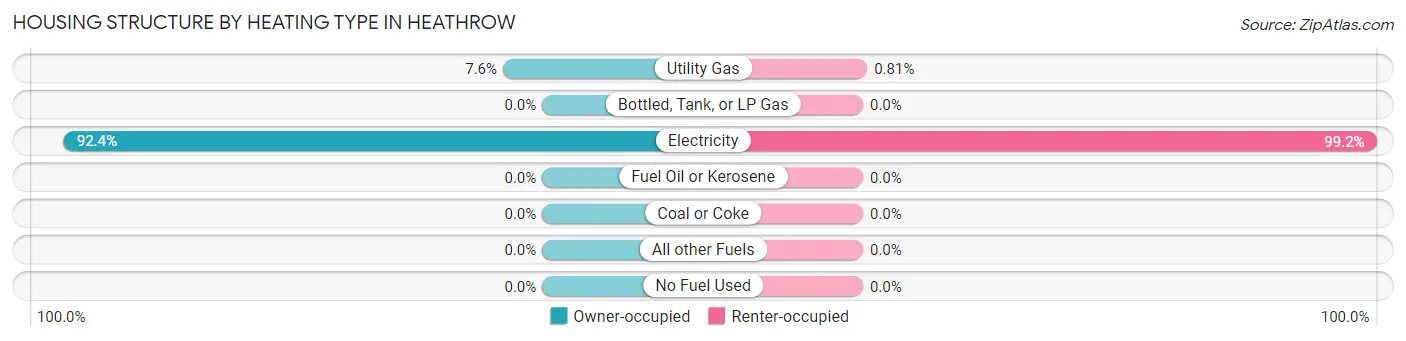
| Heating Type | Owner-occupied | Renter-occupied |
| Utility Gas | 156 (7.6%) | 8 (0.8%) |
| Bottled, Tank, or LP Gas | 0 (0.0%) | 0 (0.0%) |
| Electricity | 1,902 (92.4%) | 978 (99.2%) |
| Fuel Oil or Kerosene | 0 (0.0%) | 0 (0.0%) |
| Coal or Coke | 0 (0.0%) | 0 (0.0%) |
| All other Fuels | 0 (0.0%) | 0 (0.0%) |
| No Fuel Used | 0 (0.0%) | 0 (0.0%) |
| Total | 2,058 (100.0%) | 986 (100.0%) |
Household Vehicle Usage in Heathrow
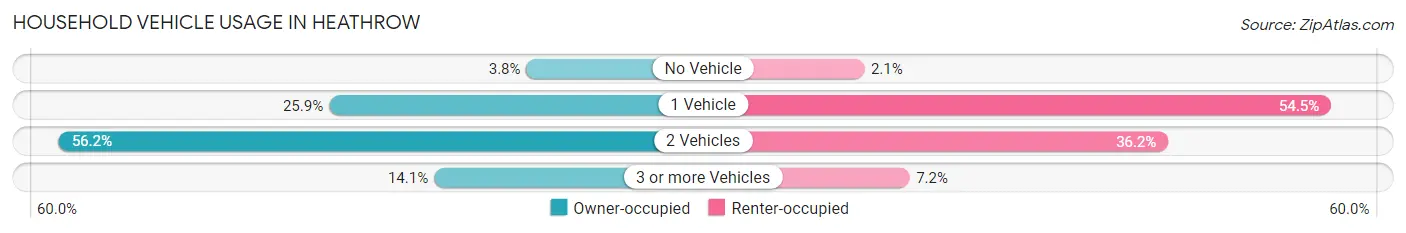
| Vehicles per Household | Owner-occupied | Renter-occupied |
| No Vehicle | 78 (3.8%) | 21 (2.1%) |
| 1 Vehicle | 533 (25.9%) | 537 (54.5%) |
| 2 Vehicles | 1,156 (56.2%) | 357 (36.2%) |
| 3 or more Vehicles | 291 (14.1%) | 71 (7.2%) |
| Total | 2,058 (100.0%) | 986 (100.0%) |
Real Estate & Mortgages in Heathrow
Real Estate and Mortgage Overview in Heathrow
| Characteristic | Without Mortgage | With Mortgage |
| Housing Units | 1,005 | 1,053 |
| Median Property Value | $446,300 | $581,300 |
| Median Household Income | $105,673 | $559 |
| Monthly Housing Costs | $856 | $445 |
| Real Estate Taxes | $4,013 | $0 |
Property Value by Mortgage Status in Heathrow

| Property Value | Without Mortgage | With Mortgage |
| Less than $50,000 | 0 (0.0%) | 0 (0.0%) |
| $50,000 to $99,999 | 0 (0.0%) | 18 (1.7%) |
| $100,000 to $299,999 | 106 (10.5%) | 95 (9.0%) |
| $300,000 to $499,999 | 526 (52.3%) | 262 (24.9%) |
| $500,000 to $749,999 | 129 (12.8%) | 466 (44.3%) |
| $750,000 to $999,999 | 223 (22.2%) | 171 (16.2%) |
| $1,000,000 or more | 21 (2.1%) | 41 (3.9%) |
| Total | 1,005 (100.0%) | 1,053 (100.0%) |
Household Income by Mortgage Status in Heathrow
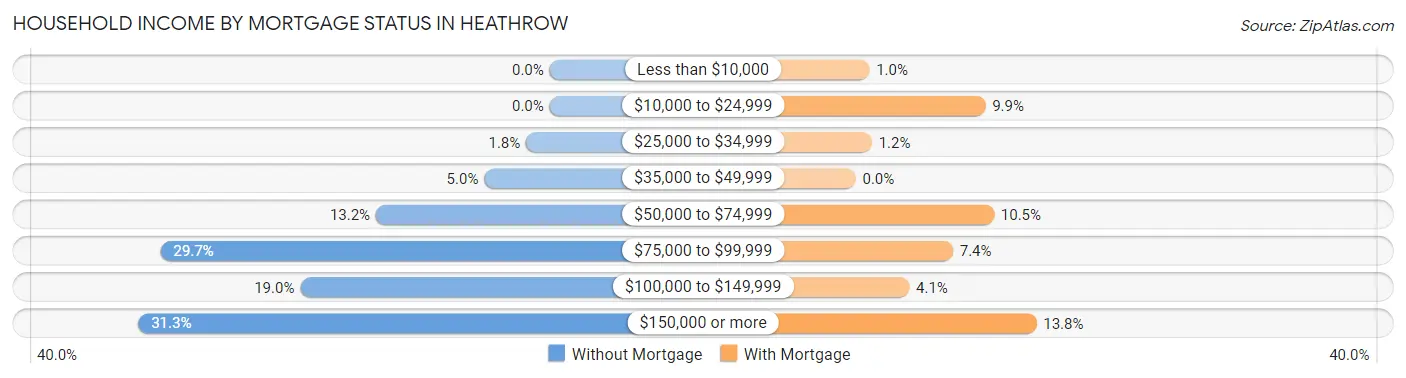
| Household Income | Without Mortgage | With Mortgage |
| Less than $10,000 | 0 (0.0%) | 11 (1.0%) |
| $10,000 to $24,999 | 0 (0.0%) | 104 (9.9%) |
| $25,000 to $34,999 | 18 (1.8%) | 13 (1.2%) |
| $35,000 to $49,999 | 50 (5.0%) | 0 (0.0%) |
| $50,000 to $74,999 | 133 (13.2%) | 111 (10.5%) |
| $75,000 to $99,999 | 298 (29.6%) | 78 (7.4%) |
| $100,000 to $149,999 | 191 (19.0%) | 43 (4.1%) |
| $150,000 or more | 315 (31.3%) | 145 (13.8%) |
| Total | 1,005 (100.0%) | 1,053 (100.0%) |
Property Value to Household Income Ratio in Heathrow
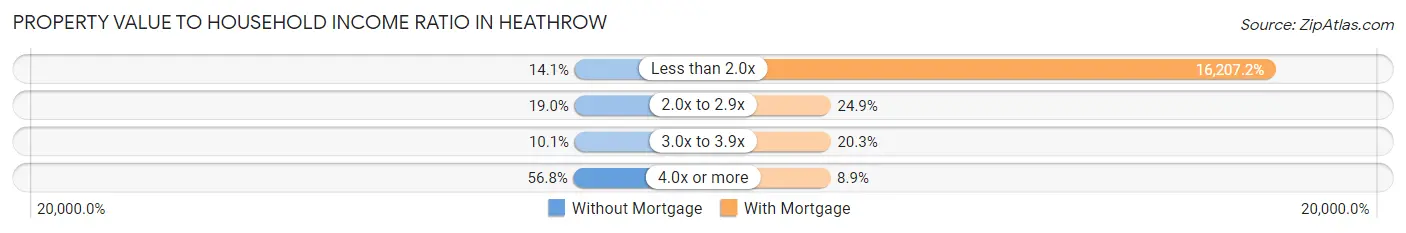
| Value-to-Income Ratio | Without Mortgage | With Mortgage |
| Less than 2.0x | 142 (14.1%) | 170,662 (16,207.2%) |
| 2.0x to 2.9x | 191 (19.0%) | 262 (24.9%) |
| 3.0x to 3.9x | 101 (10.1%) | 214 (20.3%) |
| 4.0x or more | 571 (56.8%) | 94 (8.9%) |
| Total | 1,005 (100.0%) | 1,053 (100.0%) |
Real Estate Taxes by Mortgage Status in Heathrow
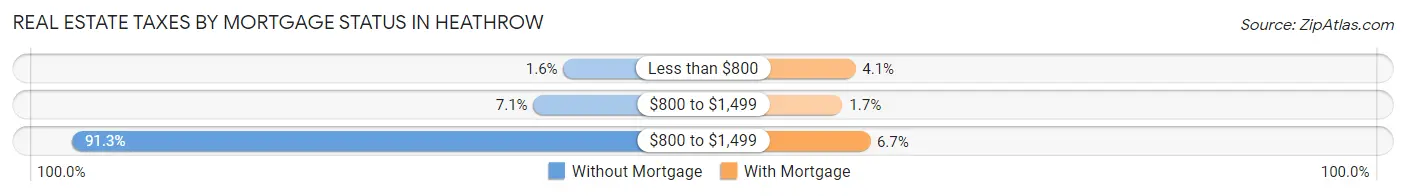
| Property Taxes | Without Mortgage | With Mortgage |
| Less than $800 | 16 (1.6%) | 43 (4.1%) |
| $800 to $1,499 | 71 (7.1%) | 18 (1.7%) |
| $800 to $1,499 | 918 (91.3%) | 71 (6.7%) |
| Total | 1,005 (100.0%) | 1,053 (100.0%) |
Health & Disability in Heathrow
Health Insurance Coverage by Age in Heathrow
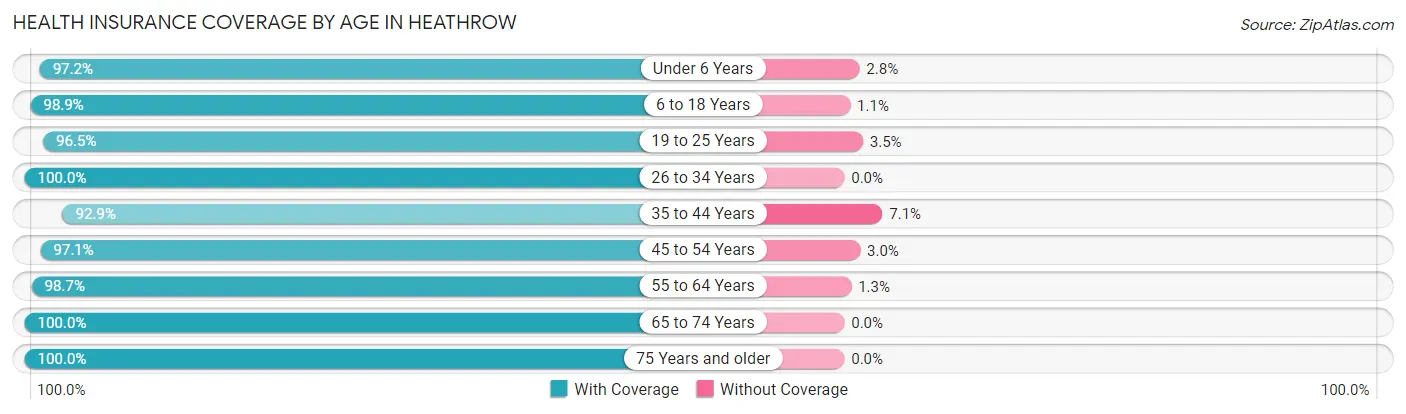
| Age Bracket | With Coverage | Without Coverage |
| Under 6 Years | 344 (97.2%) | 10 (2.8%) |
| 6 to 18 Years | 907 (98.9%) | 10 (1.1%) |
| 19 to 25 Years | 502 (96.5%) | 18 (3.5%) |
| 26 to 34 Years | 704 (100.0%) | 0 (0.0%) |
| 35 to 44 Years | 970 (92.9%) | 74 (7.1%) |
| 45 to 54 Years | 724 (97.1%) | 22 (2.9%) |
| 55 to 64 Years | 1,376 (98.7%) | 18 (1.3%) |
| 65 to 74 Years | 795 (100.0%) | 0 (0.0%) |
| 75 Years and older | 610 (100.0%) | 0 (0.0%) |
| Total | 6,932 (97.9%) | 152 (2.1%) |
Health Insurance Coverage by Citizenship Status in Heathrow
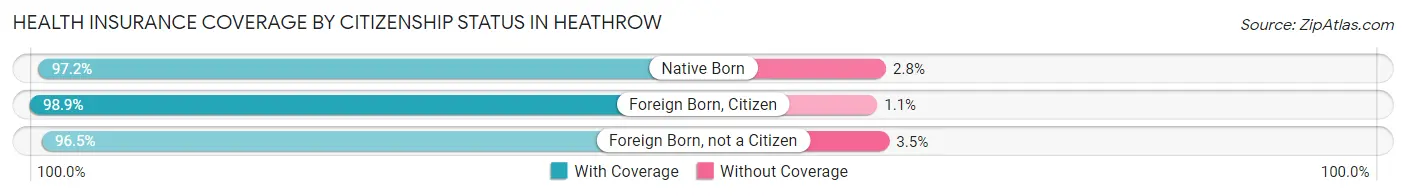
| Citizenship Status | With Coverage | Without Coverage |
| Native Born | 344 (97.2%) | 10 (2.8%) |
| Foreign Born, Citizen | 907 (98.9%) | 10 (1.1%) |
| Foreign Born, not a Citizen | 502 (96.5%) | 18 (3.5%) |
Health Insurance Coverage by Household Income in Heathrow
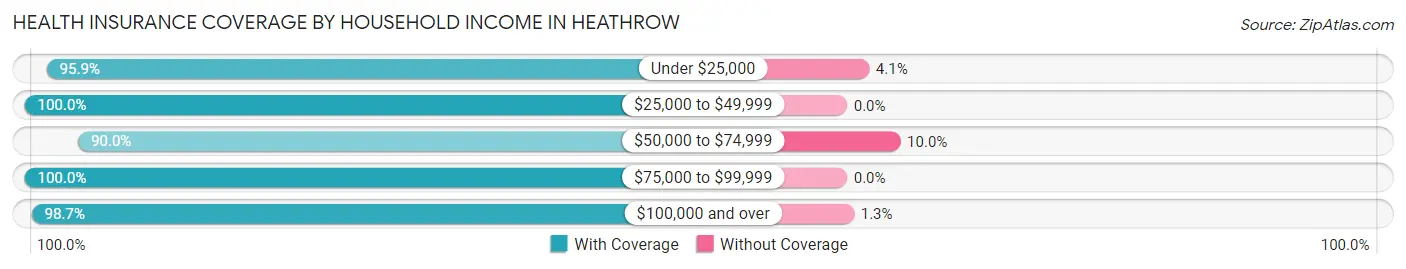
| Household Income | With Coverage | Without Coverage |
| Under $25,000 | 509 (95.9%) | 22 (4.1%) |
| $25,000 to $49,999 | 580 (100.0%) | 0 (0.0%) |
| $50,000 to $74,999 | 639 (90.0%) | 71 (10.0%) |
| $75,000 to $99,999 | 760 (100.0%) | 0 (0.0%) |
| $100,000 and over | 4,444 (98.7%) | 59 (1.3%) |
Public vs Private Health Insurance Coverage by Age in Heathrow
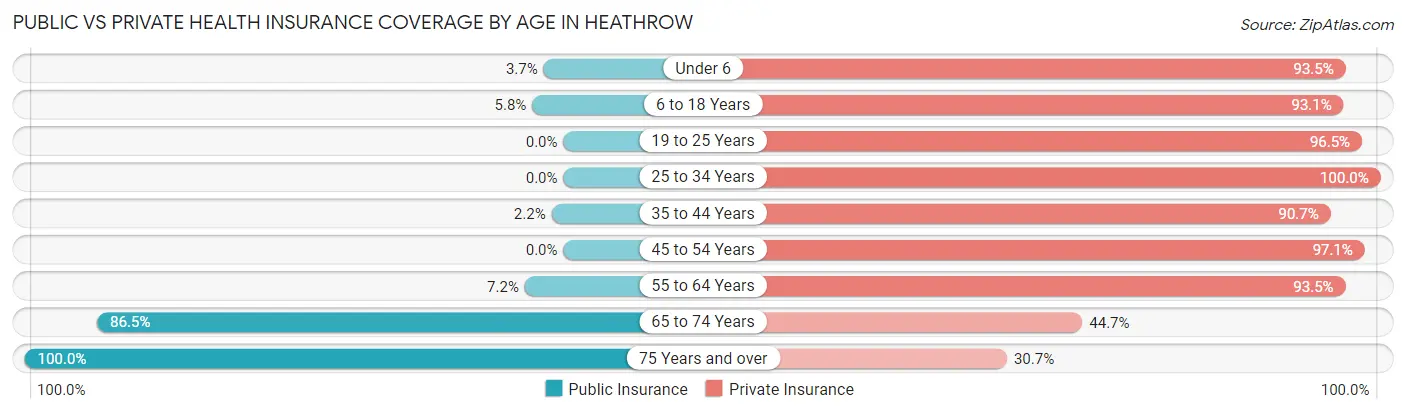
| Age Bracket | Public Insurance | Private Insurance |
| Under 6 | 13 (3.7%) | 331 (93.5%) |
| 6 to 18 Years | 53 (5.8%) | 854 (93.1%) |
| 19 to 25 Years | 0 (0.0%) | 502 (96.5%) |
| 25 to 34 Years | 0 (0.0%) | 704 (100.0%) |
| 35 to 44 Years | 23 (2.2%) | 947 (90.7%) |
| 45 to 54 Years | 0 (0.0%) | 724 (97.1%) |
| 55 to 64 Years | 100 (7.2%) | 1,303 (93.5%) |
| 65 to 74 Years | 688 (86.5%) | 355 (44.7%) |
| 75 Years and over | 610 (100.0%) | 187 (30.7%) |
| Total | 1,487 (21.0%) | 5,907 (83.4%) |
Disability Status by Sex by Age in Heathrow
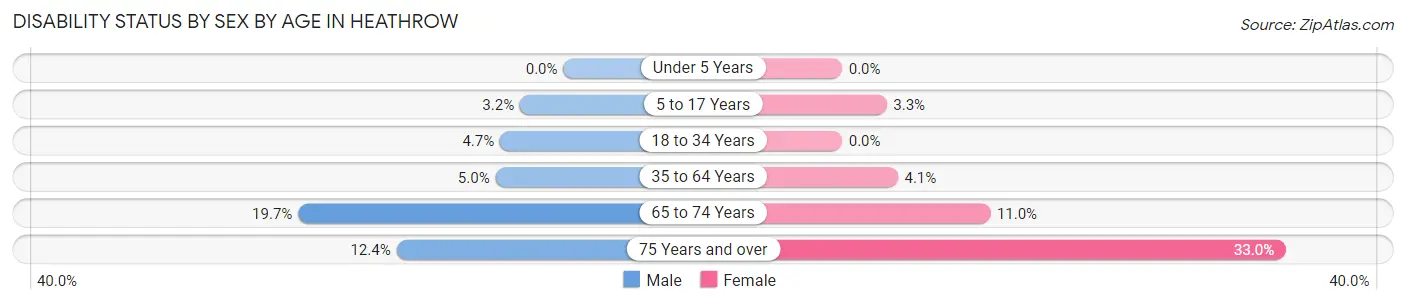
| Age Bracket | Male | Female |
| Under 5 Years | 0 (0.0%) | 0 (0.0%) |
| 5 to 17 Years | 18 (3.2%) | 15 (3.3%) |
| 18 to 34 Years | 27 (4.7%) | 0 (0.0%) |
| 35 to 64 Years | 79 (5.0%) | 67 (4.1%) |
| 65 to 74 Years | 76 (19.7%) | 45 (11.0%) |
| 75 Years and over | 29 (12.4%) | 124 (33.0%) |
Disability Class by Sex by Age in Heathrow
Disability Class: Hearing Difficulty
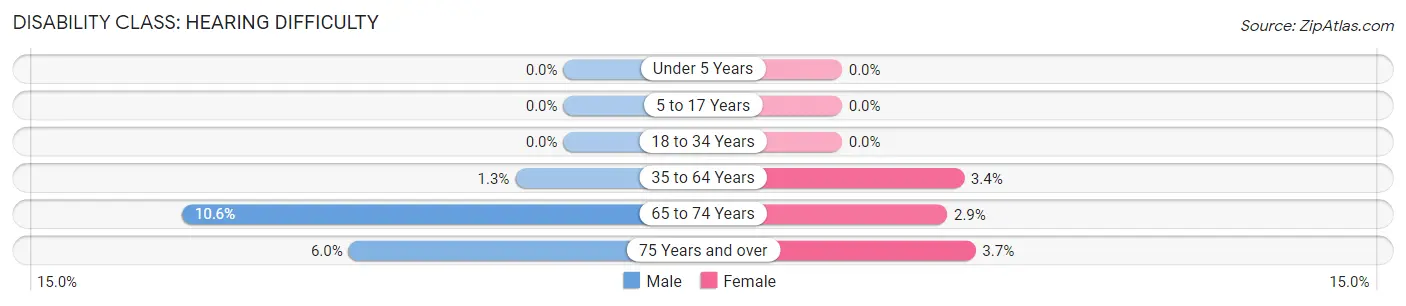
| Age Bracket | Male | Female |
| Under 5 Years | 0 (0.0%) | 0 (0.0%) |
| 5 to 17 Years | 0 (0.0%) | 0 (0.0%) |
| 18 to 34 Years | 0 (0.0%) | 0 (0.0%) |
| 35 to 64 Years | 21 (1.3%) | 55 (3.4%) |
| 65 to 74 Years | 41 (10.6%) | 12 (2.9%) |
| 75 Years and over | 14 (6.0%) | 14 (3.7%) |
Disability Class: Vision Difficulty
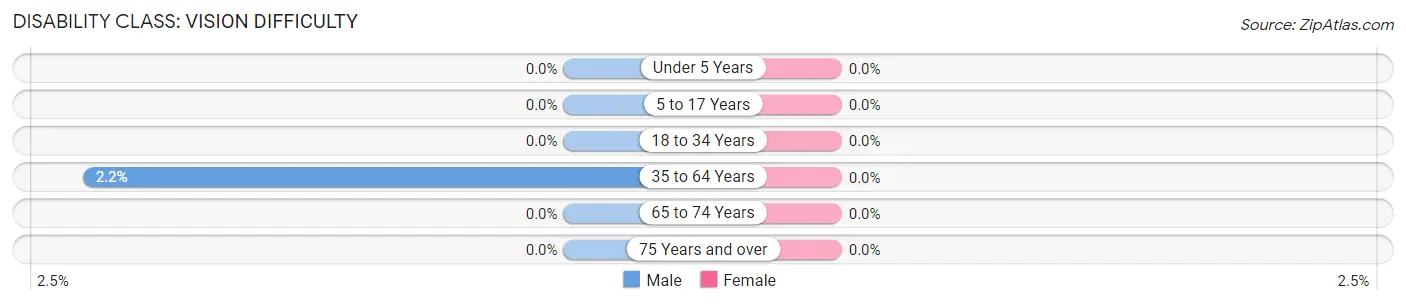
| Age Bracket | Male | Female |
| Under 5 Years | 0 (0.0%) | 0 (0.0%) |
| 5 to 17 Years | 0 (0.0%) | 0 (0.0%) |
| 18 to 34 Years | 0 (0.0%) | 0 (0.0%) |
| 35 to 64 Years | 35 (2.2%) | 0 (0.0%) |
| 65 to 74 Years | 0 (0.0%) | 0 (0.0%) |
| 75 Years and over | 0 (0.0%) | 0 (0.0%) |
Disability Class: Cognitive Difficulty
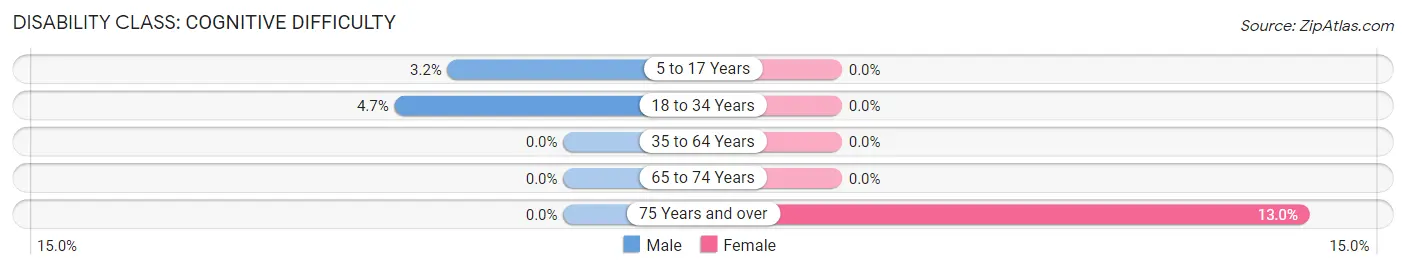
| Age Bracket | Male | Female |
| 5 to 17 Years | 18 (3.2%) | 0 (0.0%) |
| 18 to 34 Years | 27 (4.7%) | 0 (0.0%) |
| 35 to 64 Years | 0 (0.0%) | 0 (0.0%) |
| 65 to 74 Years | 0 (0.0%) | 0 (0.0%) |
| 75 Years and over | 0 (0.0%) | 49 (13.0%) |
Disability Class: Ambulatory Difficulty
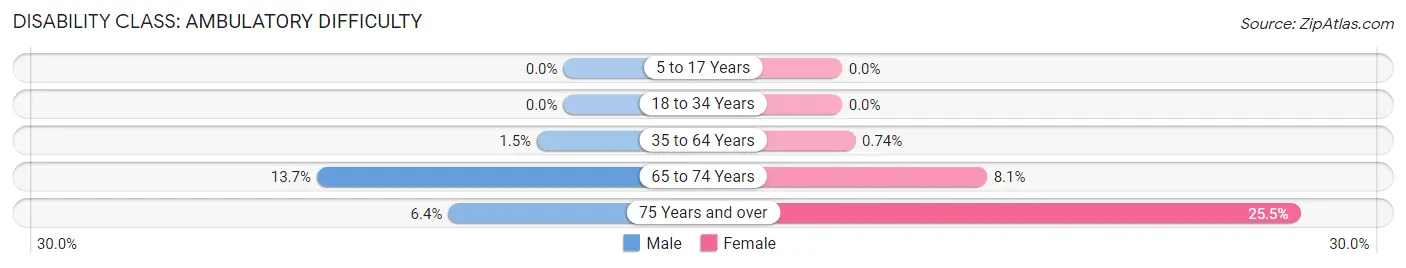
| Age Bracket | Male | Female |
| 5 to 17 Years | 0 (0.0%) | 0 (0.0%) |
| 18 to 34 Years | 0 (0.0%) | 0 (0.0%) |
| 35 to 64 Years | 23 (1.5%) | 12 (0.7%) |
| 65 to 74 Years | 53 (13.7%) | 33 (8.1%) |
| 75 Years and over | 15 (6.4%) | 96 (25.5%) |
Disability Class: Self-Care Difficulty
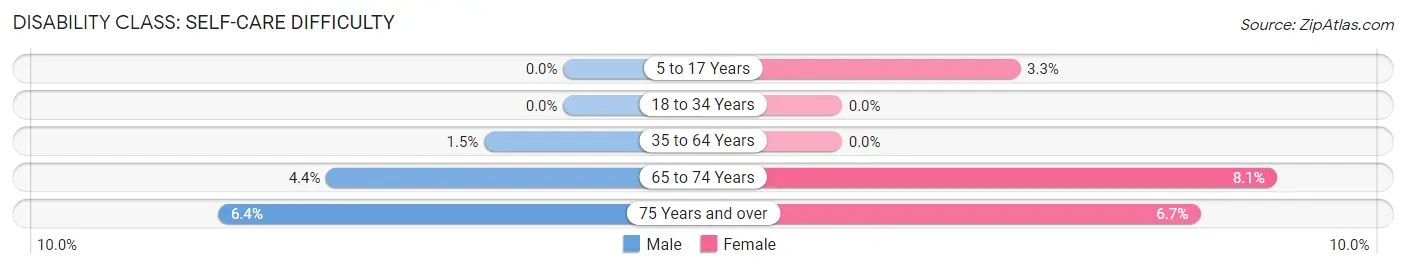
| Age Bracket | Male | Female |
| 5 to 17 Years | 0 (0.0%) | 15 (3.3%) |
| 18 to 34 Years | 0 (0.0%) | 0 (0.0%) |
| 35 to 64 Years | 23 (1.5%) | 0 (0.0%) |
| 65 to 74 Years | 17 (4.4%) | 33 (8.1%) |
| 75 Years and over | 15 (6.4%) | 25 (6.7%) |
Technology Access in Heathrow
Computing Device Access in Heathrow
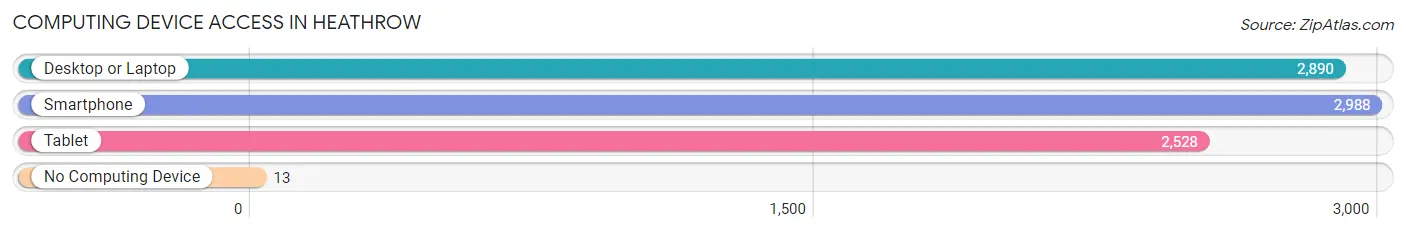
| Device Type | # Households | % Households |
| Desktop or Laptop | 2,890 | 94.9% |
| Smartphone | 2,988 | 98.2% |
| Tablet | 2,528 | 83.1% |
| No Computing Device | 13 | 0.4% |
| Total | 3,044 | 100.0% |
Internet Access in Heathrow
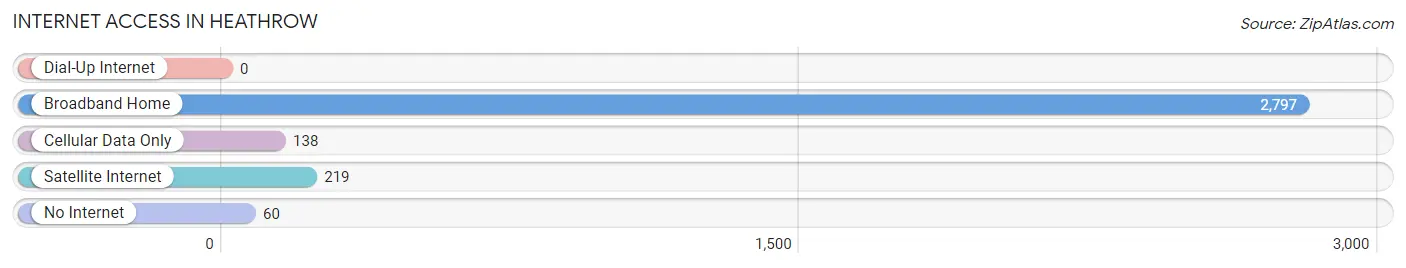
| Internet Type | # Households | % Households |
| Dial-Up Internet | 0 | 0.0% |
| Broadband Home | 2,797 | 91.9% |
| Cellular Data Only | 138 | 4.5% |
| Satellite Internet | 219 | 7.2% |
| No Internet | 60 | 2.0% |
| Total | 3,044 | 100.0% |
Heathrow Summary
Heathrow, Florida is a small, unincorporated community located in Seminole County, Florida. It is situated approximately 20 miles north of Orlando and is part of the Orlando-Kissimmee-Sanford Metropolitan Statistical Area. The population of Heathrow was estimated to be 1,845 in 2019.
History
Heathrow was founded in the late 1970s by developer Jeno Paulucci, who named the community after his son, Heath. The community was originally planned as a residential and commercial development, but the plans were never fully realized. In the early 1980s, the area was annexed by Seminole County and the community was incorporated as a census-designated place (CDP).
Geography
Heathrow is located in central Florida, approximately 20 miles north of Orlando. It is situated in Seminole County, near the intersection of Interstate 4 and State Road 417. The community is bordered by Lake Mary to the north, Sanford to the east, Longwood to the south, and Altamonte Springs to the west.
The terrain of Heathrow is mostly flat, with some rolling hills. The area is mostly wooded, with some open fields and wetlands. The climate is subtropical, with hot, humid summers and mild winters.
Economy
Heathrow is primarily a residential community, but it is also home to a number of businesses. The largest employer in the area is the Seminole County Public Schools, which employs over 1,000 people. Other major employers include the Seminole County Sheriff's Office, the Seminole County Fire Department, and the Seminole County Tax Collector's Office.
The community is also home to a number of retail establishments, including a Walmart Supercenter, a Publix supermarket, and a variety of restaurants and shops. There are also several office parks in the area, as well as a number of medical and professional services.
Demographics
As of the 2010 census, the population of Heathrow was 1,845. The racial makeup of the community was 79.3% White, 11.2% African American, 4.2% Hispanic or Latino, and 5.3% other. The median household income was $76,945, and the median age was 43.
Heathrow is a relatively affluent community, with a median home value of $323,000. The majority of residents are homeowners, and the community has a low crime rate. The area is served by the Seminole County Public Schools, which includes several elementary, middle, and high schools.
Conclusion
Heathrow, Florida is a small, unincorporated community located in Seminole County, Florida. It is situated approximately 20 miles north of Orlando and is part of the Orlando-Kissimmee-Sanford Metropolitan Statistical Area. The population of Heathrow was estimated to be 1,845 in 2019. The community was founded in the late 1970s and is primarily a residential area, but it is also home to a number of businesses. The racial makeup of the community is mostly White, with a median household income of $76,945. The area is served by the Seminole County Public Schools, and the median home value is $323,000.
Common Questions
What is Per Capita Income in Heathrow?
Per Capita income in Heathrow is $64,402.
What is the Median Family Income in Heathrow?
Median Family Income in Heathrow is $131,408.
What is the Median Household income in Heathrow?
Median Household Income in Heathrow is $119,762.
What is Income or Wage Gap in Heathrow?
Income or Wage Gap in Heathrow is 47.8%.
Women in Heathrow earn 52.2 cents for every dollar earned by a man.
What is Inequality or Gini Index in Heathrow?
Inequality or Gini Index in Heathrow is 0.44.
What is the Total Population of Heathrow?
Total Population of Heathrow is 7,084.
What is the Total Male Population of Heathrow?
Total Male Population of Heathrow is 3,399.
What is the Total Female Population of Heathrow?
Total Female Population of Heathrow is 3,685.
What is the Ratio of Males per 100 Females in Heathrow?
There are 92.24 Males per 100 Females in Heathrow.
What is the Ratio of Females per 100 Males in Heathrow?
There are 108.41 Females per 100 Males in Heathrow.
What is the Median Population Age in Heathrow?
Median Population Age in Heathrow is 45.0 Years.
What is the Average Family Size in Heathrow
Average Family Size in Heathrow is 2.7 People.
What is the Average Household Size in Heathrow
Average Household Size in Heathrow is 2.3 People.
How Large is the Labor Force in Heathrow?
There are 3,565 People in the Labor Forcein in Heathrow.
What is the Percentage of People in the Labor Force in Heathrow?
60.0% of People are in the Labor Force in Heathrow.
What is the Unemployment Rate in Heathrow?
Unemployment Rate in Heathrow is 4.9%.