Grovetown, GA Map & Demographics
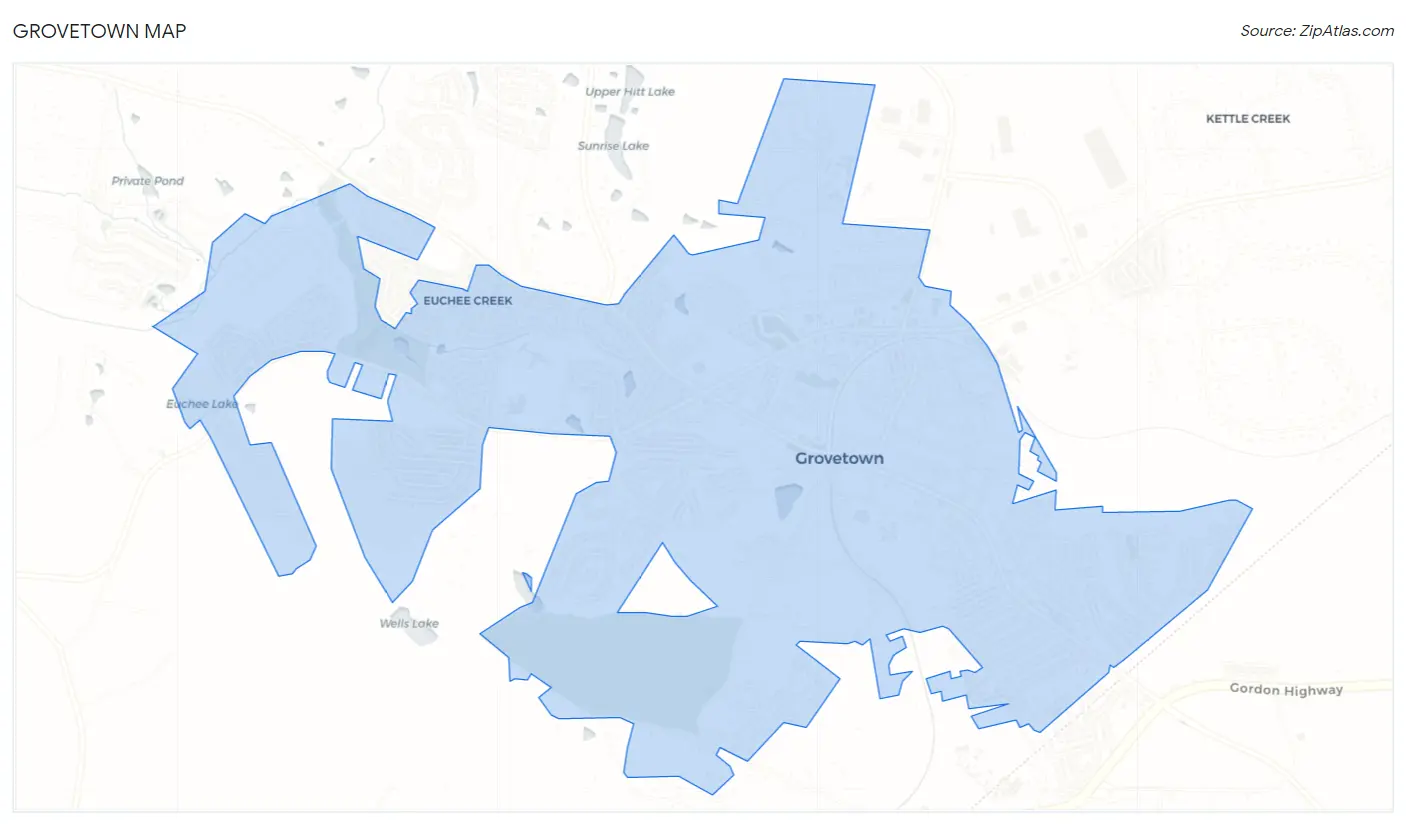
Grovetown Map
Grovetown Overview
$30,984
PER CAPITA INCOME
$78,185
AVG FAMILY INCOME
$67,222
AVG HOUSEHOLD INCOME
7.6%
WAGE / INCOME GAP [ % ]
92.4¢/ $1
WAGE / INCOME GAP [ $ ]
0.36
INEQUALITY / GINI INDEX
16,049
TOTAL POPULATION
7,647
MALE POPULATION
8,402
FEMALE POPULATION
91.01
MALES / 100 FEMALES
109.87
FEMALES / 100 MALES
33.0
MEDIAN AGE
4.1
AVG FAMILY SIZE
3.4
AVG HOUSEHOLD SIZE
9,208
LABOR FORCE [ PEOPLE ]
72.4%
PERCENT IN LABOR FORCE
0.9%
UNEMPLOYMENT RATE
Grovetown Zip Codes
Grovetown Area Codes
Income in Grovetown
Income Overview in Grovetown
Per Capita Income in Grovetown is $30,984, while median incomes of families and households are $78,185 and $67,222 respectively.
| Characteristic | Number | Measure |
| Per Capita Income | 16,049 | $30,984 |
| Median Family Income | 3,288 | $78,185 |
| Mean Family Income | 3,288 | $93,203 |
| Median Household Income | 4,670 | $67,222 |
| Mean Household Income | 4,670 | $85,030 |
| Income Deficit | 3,288 | $0 |
| Wage / Income Gap (%) | 16,049 | 7.58% |
| Wage / Income Gap ($) | 16,049 | 92.42¢ per $1 |
| Gini / Inequality Index | 16,049 | 0.36 |
Earnings by Sex in Grovetown
Average Earnings in Grovetown are $36,707, $38,290 for men and $35,386 for women, a difference of 7.6%.
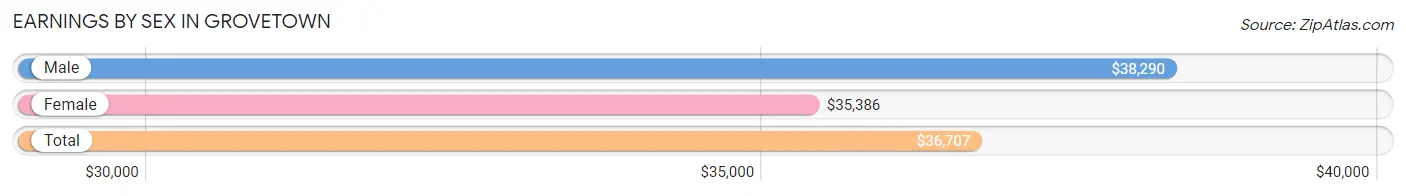
| Sex | Number | Average Earnings |
| Male | 5,117 (53.1%) | $38,290 |
| Female | 4,525 (46.9%) | $35,386 |
| Total | 9,642 (100.0%) | $36,707 |
Earnings by Sex by Income Bracket in Grovetown
The most common earnings brackets in Grovetown are $55,000 to $64,999 for men (663 | 13.0%) and $55,000 to $64,999 for women (819 | 18.1%).
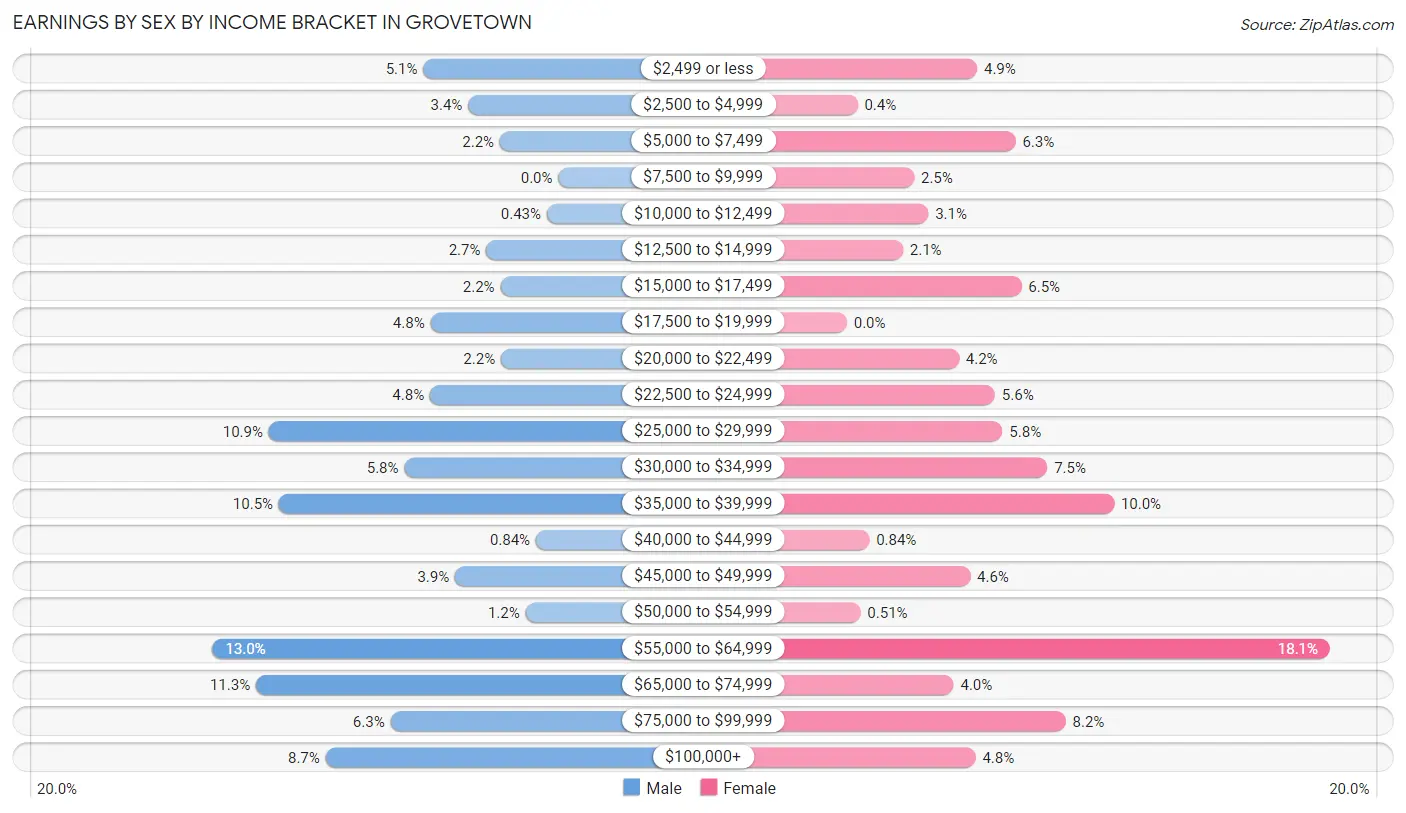
| Income | Male | Female |
| $2,499 or less | 259 (5.1%) | 221 (4.9%) |
| $2,500 to $4,999 | 173 (3.4%) | 18 (0.4%) |
| $5,000 to $7,499 | 112 (2.2%) | 286 (6.3%) |
| $7,500 to $9,999 | 0 (0.0%) | 114 (2.5%) |
| $10,000 to $12,499 | 22 (0.4%) | 138 (3.0%) |
| $12,500 to $14,999 | 138 (2.7%) | 95 (2.1%) |
| $15,000 to $17,499 | 111 (2.2%) | 296 (6.5%) |
| $17,500 to $19,999 | 245 (4.8%) | 0 (0.0%) |
| $20,000 to $22,499 | 110 (2.1%) | 190 (4.2%) |
| $22,500 to $24,999 | 246 (4.8%) | 251 (5.6%) |
| $25,000 to $29,999 | 555 (10.8%) | 264 (5.8%) |
| $30,000 to $34,999 | 295 (5.8%) | 340 (7.5%) |
| $35,000 to $39,999 | 536 (10.5%) | 453 (10.0%) |
| $40,000 to $44,999 | 43 (0.8%) | 38 (0.8%) |
| $45,000 to $49,999 | 198 (3.9%) | 209 (4.6%) |
| $50,000 to $54,999 | 63 (1.2%) | 23 (0.5%) |
| $55,000 to $64,999 | 663 (13.0%) | 819 (18.1%) |
| $65,000 to $74,999 | 580 (11.3%) | 181 (4.0%) |
| $75,000 to $99,999 | 322 (6.3%) | 371 (8.2%) |
| $100,000+ | 446 (8.7%) | 218 (4.8%) |
| Total | 5,117 (100.0%) | 4,525 (100.0%) |
Earnings by Sex by Educational Attainment in Grovetown
Average earnings in Grovetown are $47,452 for men and $39,877 for women, a difference of 16.0%. Men with an educational attainment of graduate degree enjoy the highest average annual earnings of $70,179, while those with less than high school education earn the least with $33,444. Women with an educational attainment of graduate degree earn the most with the average annual earnings of $71,972, while those with less than high school education have the smallest earnings of $13,267.
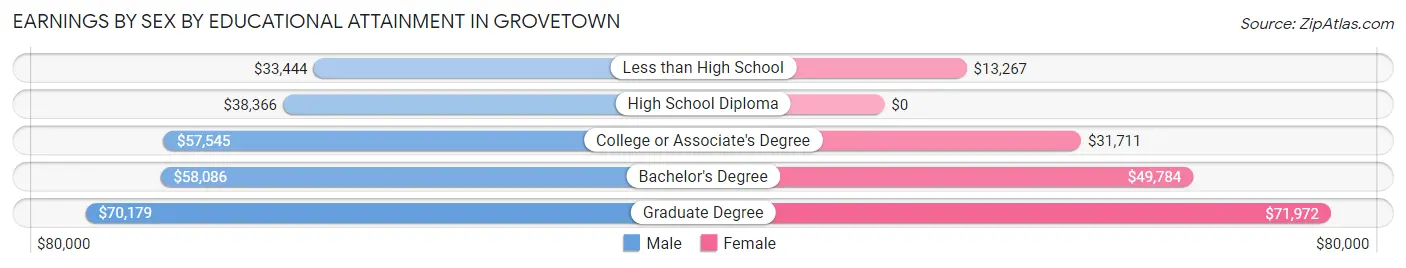
| Educational Attainment | Male Income | Female Income |
| Less than High School | $33,444 | $13,267 |
| High School Diploma | $38,366 | $0 |
| College or Associate's Degree | $57,545 | $31,711 |
| Bachelor's Degree | $58,086 | $49,784 |
| Graduate Degree | $70,179 | $71,972 |
| Total | $47,452 | $39,877 |
Family Income in Grovetown
Family Income Brackets in Grovetown
According to the Grovetown family income data, there are 1,023 families falling into the $50,000 to $74,999 income range, which is the most common income bracket and makes up 31.1% of all families.
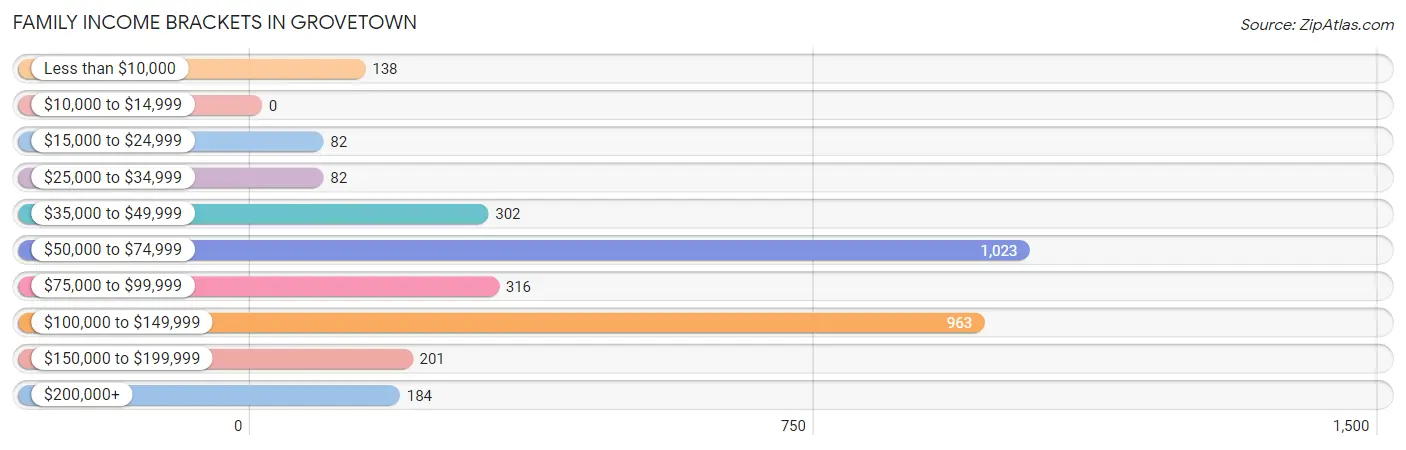
| Income Bracket | # Families | % Families |
| Less than $10,000 | 138 | 4.2% |
| $10,000 to $14,999 | 0 | 0.0% |
| $15,000 to $24,999 | 82 | 2.5% |
| $25,000 to $34,999 | 82 | 2.5% |
| $35,000 to $49,999 | 302 | 9.2% |
| $50,000 to $74,999 | 1,023 | 31.1% |
| $75,000 to $99,999 | 316 | 9.6% |
| $100,000 to $149,999 | 963 | 29.3% |
| $150,000 to $199,999 | 201 | 6.1% |
| $200,000+ | 184 | 5.6% |
Family Income by Famaliy Size in Grovetown
5-person families (399 | 12.1%) account for the highest median family income in Grovetown with $113,169 per family, while 2-person families (1,389 | 42.2%) have the highest median income of $45,113 per family member.
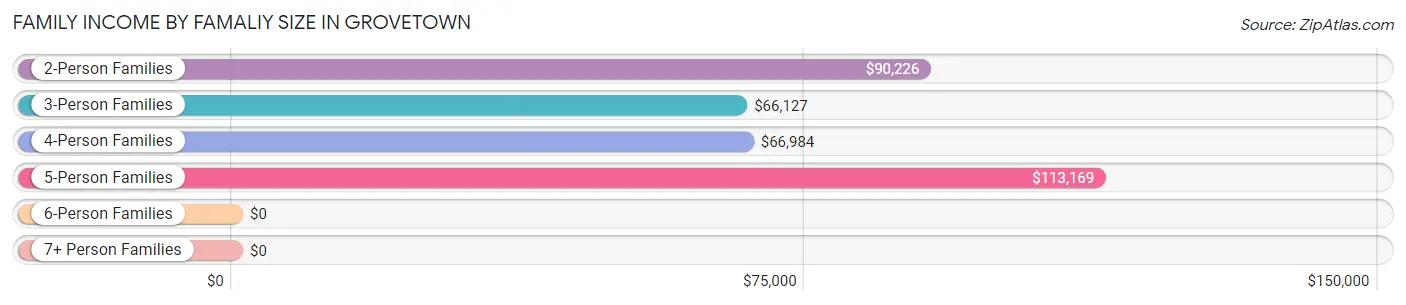
| Income Bracket | # Families | Median Income |
| 2-Person Families | 1,389 (42.2%) | $90,226 |
| 3-Person Families | 625 (19.0%) | $66,127 |
| 4-Person Families | 716 (21.8%) | $66,984 |
| 5-Person Families | 399 (12.1%) | $113,169 |
| 6-Person Families | 159 (4.8%) | $0 |
| 7+ Person Families | 0 (0.0%) | $0 |
| Total | 3,288 (100.0%) | $78,185 |
Family Income by Number of Earners in Grovetown
The median family income in Grovetown is $78,185, with families comprising 3+ earners (422) having the highest median family income of $136,524, while families with no earners (426) have the lowest median family income of $43,870, accounting for 12.8% and 13.0% of families, respectively.
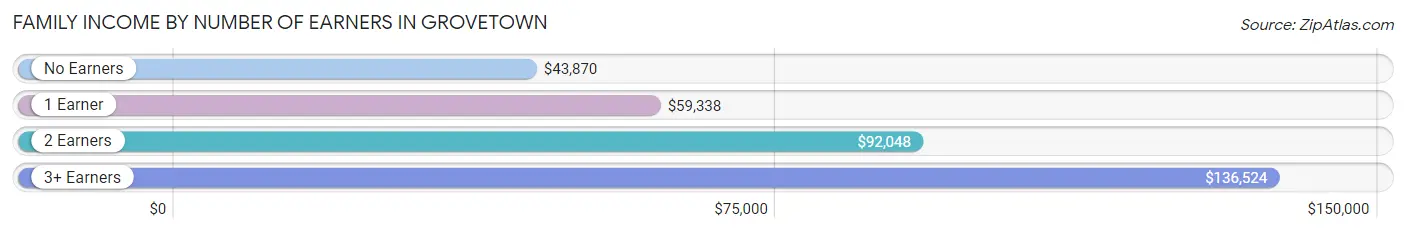
| Number of Earners | # Families | Median Income |
| No Earners | 426 (13.0%) | $43,870 |
| 1 Earner | 672 (20.4%) | $59,338 |
| 2 Earners | 1,768 (53.8%) | $92,048 |
| 3+ Earners | 422 (12.8%) | $136,524 |
| Total | 3,288 (100.0%) | $78,185 |
Household Income in Grovetown
Household Income Brackets in Grovetown
With 1,275 households falling in the category, the $50,000 to $74,999 income range is the most frequent in Grovetown, accounting for 27.3% of all households. In contrast, only 98 households (2.1%) fall into the $10,000 to $14,999 income bracket, making it the least populous group.
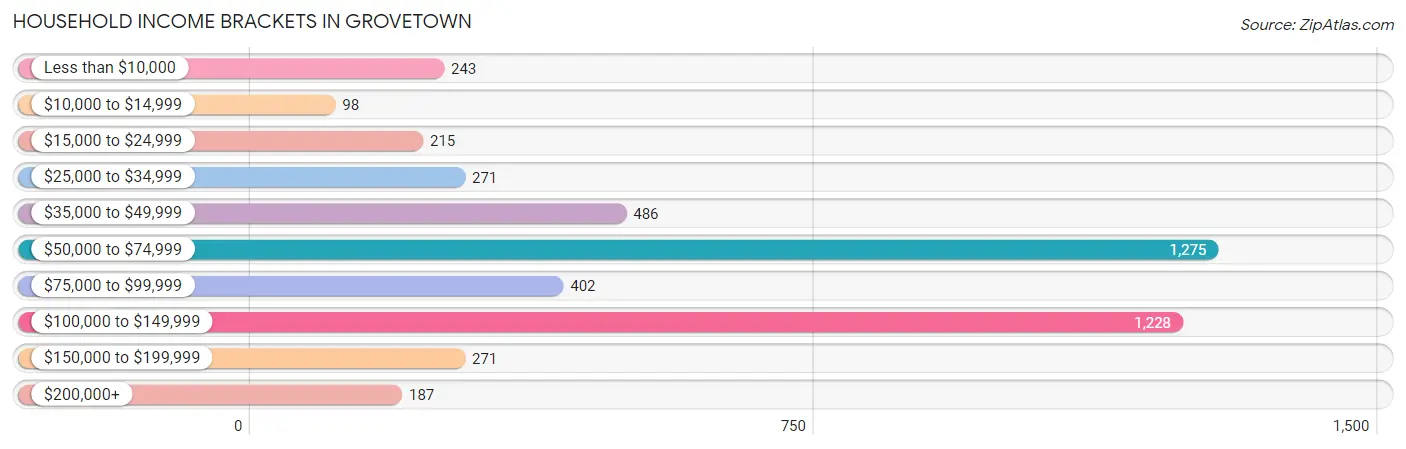
| Income Bracket | # Households | % Households |
| Less than $10,000 | 243 | 5.2% |
| $10,000 to $14,999 | 98 | 2.1% |
| $15,000 to $24,999 | 215 | 4.6% |
| $25,000 to $34,999 | 271 | 5.8% |
| $35,000 to $49,999 | 486 | 10.4% |
| $50,000 to $74,999 | 1,275 | 27.3% |
| $75,000 to $99,999 | 402 | 8.6% |
| $100,000 to $149,999 | 1,228 | 26.3% |
| $150,000 to $199,999 | 271 | 5.8% |
| $200,000+ | 187 | 4.0% |
Household Income by Householder Age in Grovetown
The median household income in Grovetown is $67,222, with the highest median household income of $82,563 found in the 15 to 24 years age bracket for the primary householder. A total of 205 households (4.4%) fall into this category. Meanwhile, the 65+ years age bracket for the primary householder has the lowest median household income of $42,722, with 906 households (19.4%) in this group.
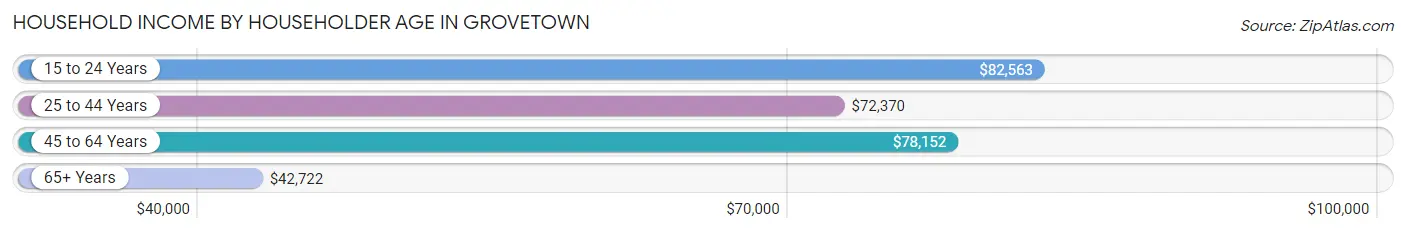
| Income Bracket | # Households | Median Income |
| 15 to 24 Years | 205 (4.4%) | $82,563 |
| 25 to 44 Years | 2,449 (52.4%) | $72,370 |
| 45 to 64 Years | 1,110 (23.8%) | $78,152 |
| 65+ Years | 906 (19.4%) | $42,722 |
| Total | 4,670 (100.0%) | $67,222 |
Poverty in Grovetown
Income Below Poverty by Sex and Age in Grovetown
With 5.3% poverty level for males and 11.9% for females among the residents of Grovetown, 12 to 14 year old males and 16 and 17 year old females are the most vulnerable to poverty, with 24 males (30.8%) and 79 females (62.2%) in their respective age groups living below the poverty level.
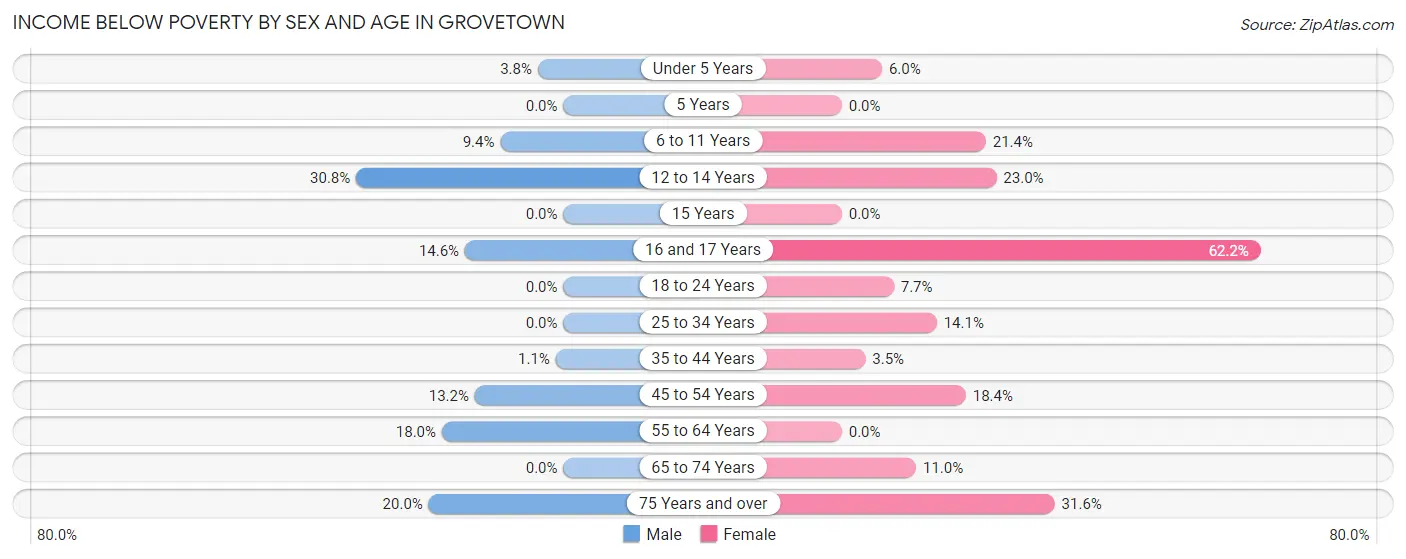
| Age Bracket | Male | Female |
| Under 5 Years | 27 (3.8%) | 32 (6.0%) |
| 5 Years | 0 (0.0%) | 0 (0.0%) |
| 6 to 11 Years | 64 (9.4%) | 96 (21.4%) |
| 12 to 14 Years | 24 (30.8%) | 93 (23.0%) |
| 15 Years | 0 (0.0%) | 0 (0.0%) |
| 16 and 17 Years | 45 (14.6%) | 79 (62.2%) |
| 18 to 24 Years | 0 (0.0%) | 86 (7.7%) |
| 25 to 34 Years | 0 (0.0%) | 175 (14.1%) |
| 35 to 44 Years | 21 (1.1%) | 48 (3.5%) |
| 45 to 54 Years | 113 (13.2%) | 204 (18.4%) |
| 55 to 64 Years | 94 (18.0%) | 0 (0.0%) |
| 65 to 74 Years | 0 (0.0%) | 87 (11.0%) |
| 75 Years and over | 18 (20.0%) | 98 (31.6%) |
| Total | 406 (5.3%) | 998 (11.9%) |
Income Above Poverty by Sex and Age in Grovetown
According to the poverty statistics in Grovetown, males aged 5 years and females aged 5 years are the age groups that are most secure financially, with 100.0% of males and 100.0% of females in these age groups living above the poverty line.
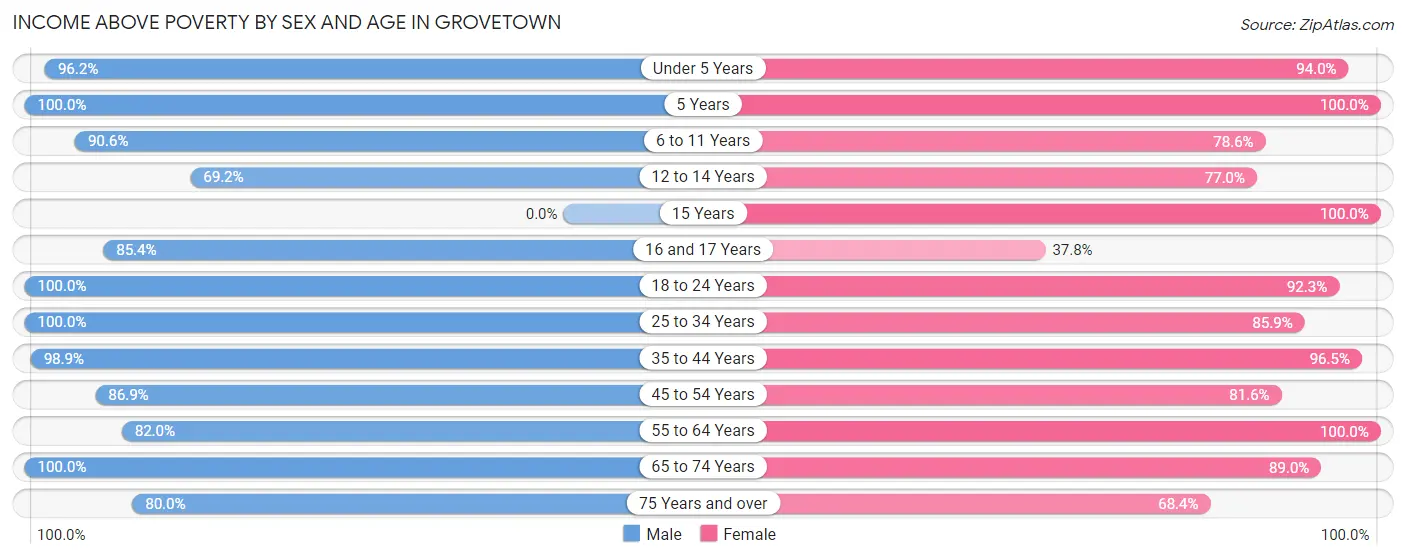
| Age Bracket | Male | Female |
| Under 5 Years | 686 (96.2%) | 504 (94.0%) |
| 5 Years | 34 (100.0%) | 238 (100.0%) |
| 6 to 11 Years | 620 (90.6%) | 353 (78.6%) |
| 12 to 14 Years | 54 (69.2%) | 312 (77.0%) |
| 15 Years | 0 (0.0%) | 194 (100.0%) |
| 16 and 17 Years | 263 (85.4%) | 48 (37.8%) |
| 18 to 24 Years | 819 (100.0%) | 1,028 (92.3%) |
| 25 to 34 Years | 1,398 (100.0%) | 1,066 (85.9%) |
| 35 to 44 Years | 1,823 (98.9%) | 1,324 (96.5%) |
| 45 to 54 Years | 746 (86.9%) | 904 (81.6%) |
| 55 to 64 Years | 427 (82.0%) | 519 (100.0%) |
| 65 to 74 Years | 299 (100.0%) | 702 (89.0%) |
| 75 Years and over | 72 (80.0%) | 212 (68.4%) |
| Total | 7,241 (94.7%) | 7,404 (88.1%) |
Income Below Poverty Among Married-Couple Families in Grovetown
The poverty statistics for married-couple families in Grovetown show that 2.1% or 49 of the total 2,280 families live below the poverty line. Families with 1 or 2 children have the highest poverty rate of 4.4%, comprising of 49 families. On the other hand, families with no children have the lowest poverty rate of 0.0%, which includes 0 families.
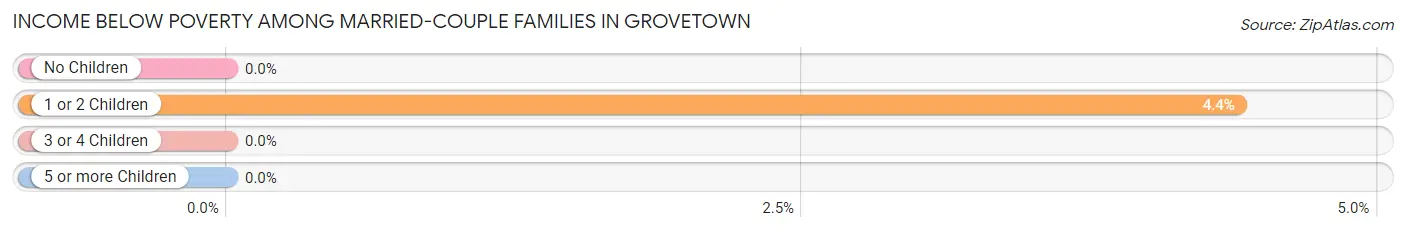
| Children | Above Poverty | Below Poverty |
| No Children | 944 (100.0%) | 0 (0.0%) |
| 1 or 2 Children | 1,067 (95.6%) | 49 (4.4%) |
| 3 or 4 Children | 220 (100.0%) | 0 (0.0%) |
| 5 or more Children | 0 (0.0%) | 0 (0.0%) |
| Total | 2,231 (97.9%) | 49 (2.1%) |
Income Below Poverty Among Single-Parent Households in Grovetown
According to the poverty data in Grovetown, 32.0% or 48 single-father households and 10.4% or 89 single-mother households are living below the poverty line. Among single-father households, those with 1 or 2 children have the highest poverty rate, with 48 households (100.0%) experiencing poverty. Likewise, among single-mother households, those with 3 or 4 children have the highest poverty rate, with 35 households (100.0%) falling below the poverty line.
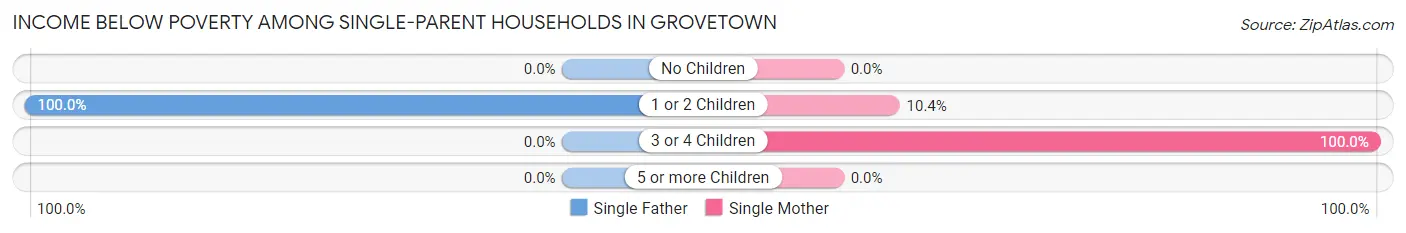
| Children | Single Father | Single Mother |
| No Children | 0 (0.0%) | 0 (0.0%) |
| 1 or 2 Children | 48 (100.0%) | 54 (10.4%) |
| 3 or 4 Children | 0 (0.0%) | 35 (100.0%) |
| 5 or more Children | 0 (0.0%) | 0 (0.0%) |
| Total | 48 (32.0%) | 89 (10.4%) |
Income Below Poverty Among Married-Couple vs Single-Parent Households in Grovetown
The poverty data for Grovetown shows that 49 of the married-couple family households (2.1%) and 137 of the single-parent households (13.6%) are living below the poverty level. Within the married-couple family households, those with 1 or 2 children have the highest poverty rate, with 49 households (4.4%) falling below the poverty line. Among the single-parent households, those with 3 or 4 children have the highest poverty rate, with 35 household (100.0%) living below poverty.
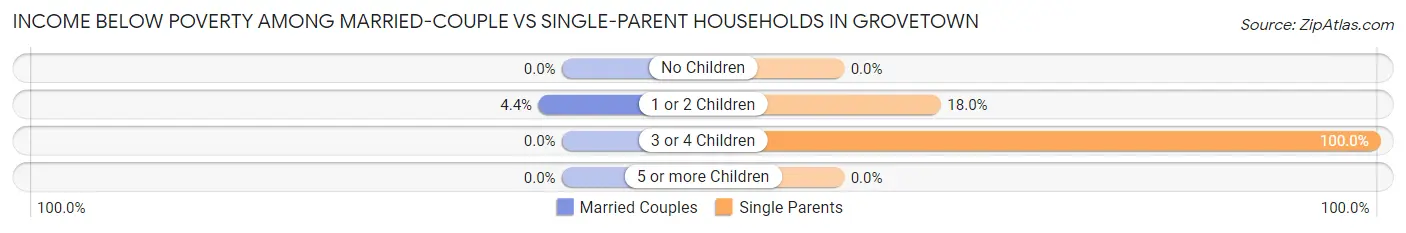
| Children | Married-Couple Families | Single-Parent Households |
| No Children | 0 (0.0%) | 0 (0.0%) |
| 1 or 2 Children | 49 (4.4%) | 102 (18.0%) |
| 3 or 4 Children | 0 (0.0%) | 35 (100.0%) |
| 5 or more Children | 0 (0.0%) | 0 (0.0%) |
| Total | 49 (2.1%) | 137 (13.6%) |
Race in Grovetown
The most populous races in Grovetown are White / Caucasian (8,178 | 51.0%), Black / African American (5,182 | 32.3%), and Hispanic or Latino (2,645 | 16.5%).
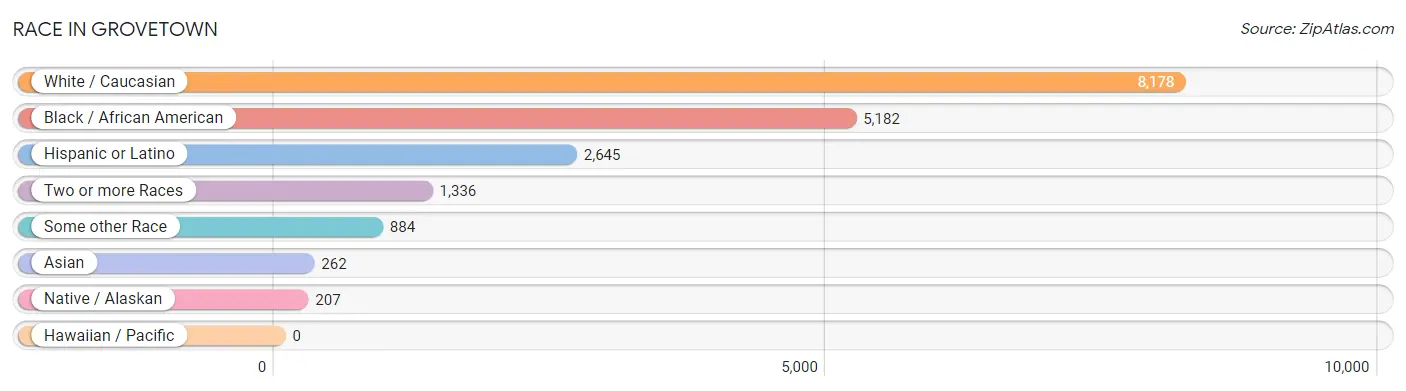
| Race | # Population | % Population |
| Asian | 262 | 1.6% |
| Black / African American | 5,182 | 32.3% |
| Hawaiian / Pacific | 0 | 0.0% |
| Hispanic or Latino | 2,645 | 16.5% |
| Native / Alaskan | 207 | 1.3% |
| White / Caucasian | 8,178 | 51.0% |
| Two or more Races | 1,336 | 8.3% |
| Some other Race | 884 | 5.5% |
| Total | 16,049 | 100.0% |
Ancestry in Grovetown
The most populous ancestries reported in Grovetown are Mexican (1,578 | 9.8%), Irish (800 | 5.0%), English (793 | 4.9%), German (737 | 4.6%), and American (685 | 4.3%), together accounting for 28.6% of all Grovetown residents.
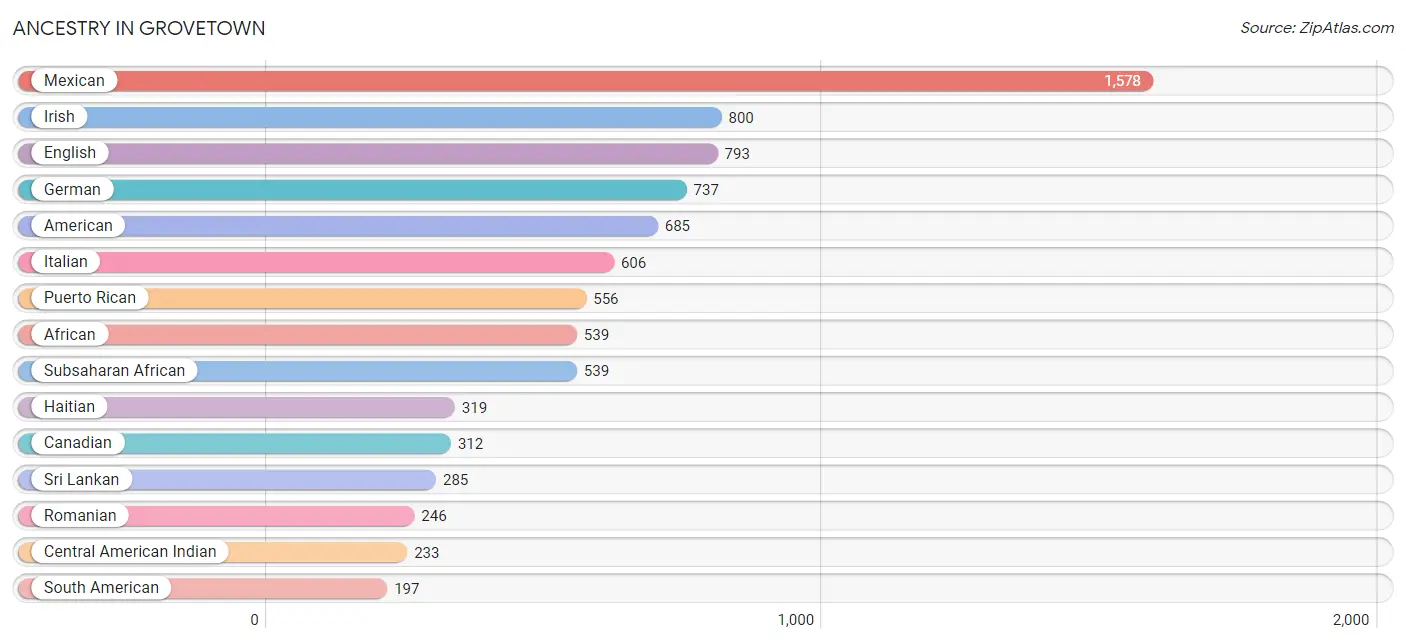
| Ancestry | # Population | % Population |
| African | 539 | 3.4% |
| American | 685 | 4.3% |
| Bhutanese | 139 | 0.9% |
| British | 130 | 0.8% |
| Burmese | 74 | 0.5% |
| Canadian | 312 | 1.9% |
| Central American | 167 | 1.0% |
| Central American Indian | 233 | 1.5% |
| Chippewa | 90 | 0.6% |
| Colombian | 116 | 0.7% |
| Cuban | 125 | 0.8% |
| Dutch | 12 | 0.1% |
| Ecuadorian | 81 | 0.5% |
| English | 793 | 4.9% |
| French | 62 | 0.4% |
| German | 737 | 4.6% |
| Haitian | 319 | 2.0% |
| Honduran | 152 | 0.9% |
| Indian (Asian) | 47 | 0.3% |
| Irish | 800 | 5.0% |
| Israeli | 1 | 0.0% |
| Italian | 606 | 3.8% |
| Korean | 61 | 0.4% |
| Mexican | 1,578 | 9.8% |
| Native Hawaiian | 27 | 0.2% |
| Norwegian | 22 | 0.1% |
| Panamanian | 15 | 0.1% |
| Polish | 63 | 0.4% |
| Portuguese | 135 | 0.8% |
| Puerto Rican | 556 | 3.5% |
| Romanian | 246 | 1.5% |
| Samoan | 27 | 0.2% |
| Scotch-Irish | 181 | 1.1% |
| Scottish | 19 | 0.1% |
| South American | 197 | 1.2% |
| South American Indian | 26 | 0.2% |
| Spanish | 22 | 0.1% |
| Sri Lankan | 285 | 1.8% |
| Subsaharan African | 539 | 3.4% |
| Swedish | 22 | 0.1% |
| Thai | 27 | 0.2% |
| Trinidadian and Tobagonian | 31 | 0.2% |
| Ukrainian | 50 | 0.3% | View All 43 Rows |
Immigrants in Grovetown
The most numerous immigrant groups reported in Grovetown came from Latin America (934 | 5.8%), Central America (561 | 3.5%), Mexico (394 | 2.5%), Caribbean (292 | 1.8%), and Europe (281 | 1.8%), together accounting for 15.3% of all Grovetown residents.
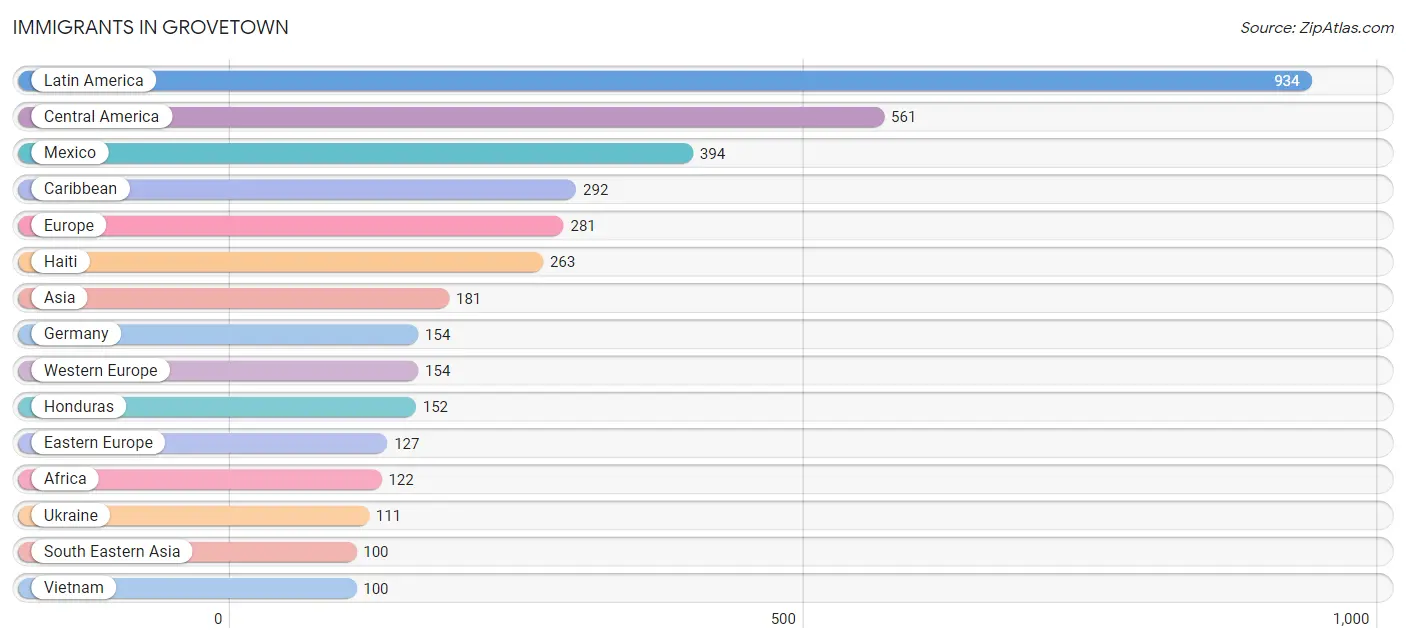
| Immigration Origin | # Population | % Population |
| Africa | 122 | 0.8% |
| Asia | 181 | 1.1% |
| Canada | 77 | 0.5% |
| Caribbean | 292 | 1.8% |
| Central America | 561 | 3.5% |
| Eastern Asia | 81 | 0.5% |
| Eastern Europe | 127 | 0.8% |
| Ecuador | 81 | 0.5% |
| Europe | 281 | 1.8% |
| Germany | 154 | 1.0% |
| Ghana | 66 | 0.4% |
| Haiti | 263 | 1.6% |
| Honduras | 152 | 0.9% |
| Japan | 73 | 0.4% |
| Korea | 8 | 0.1% |
| Latin America | 934 | 5.8% |
| Mexico | 394 | 2.5% |
| Middle Africa | 56 | 0.4% |
| Panama | 15 | 0.1% |
| Russia | 16 | 0.1% |
| South America | 81 | 0.5% |
| South Eastern Asia | 100 | 0.6% |
| Ukraine | 111 | 0.7% |
| Vietnam | 100 | 0.6% |
| West Indies | 29 | 0.2% |
| Western Africa | 66 | 0.4% |
| Western Europe | 154 | 1.0% |
| Zaire | 56 | 0.4% | View All 28 Rows |
Sex and Age in Grovetown
Sex and Age in Grovetown
The most populous age groups in Grovetown are 35 to 39 Years (954 | 12.5%) for men and 40 to 44 Years (1,049 | 12.5%) for women.
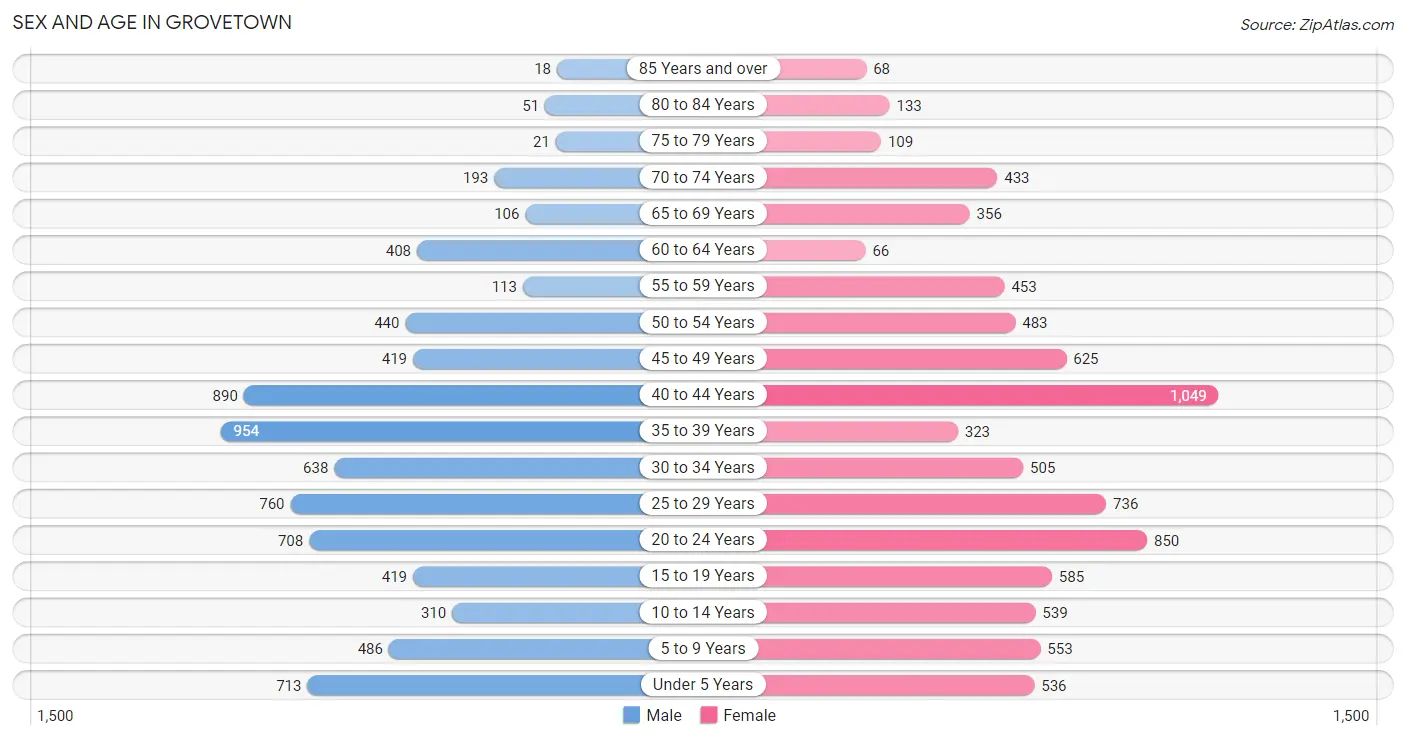
| Age Bracket | Male | Female |
| Under 5 Years | 713 (9.3%) | 536 (6.4%) |
| 5 to 9 Years | 486 (6.4%) | 553 (6.6%) |
| 10 to 14 Years | 310 (4.1%) | 539 (6.4%) |
| 15 to 19 Years | 419 (5.5%) | 585 (7.0%) |
| 20 to 24 Years | 708 (9.3%) | 850 (10.1%) |
| 25 to 29 Years | 760 (9.9%) | 736 (8.8%) |
| 30 to 34 Years | 638 (8.3%) | 505 (6.0%) |
| 35 to 39 Years | 954 (12.5%) | 323 (3.8%) |
| 40 to 44 Years | 890 (11.6%) | 1,049 (12.5%) |
| 45 to 49 Years | 419 (5.5%) | 625 (7.4%) |
| 50 to 54 Years | 440 (5.8%) | 483 (5.8%) |
| 55 to 59 Years | 113 (1.5%) | 453 (5.4%) |
| 60 to 64 Years | 408 (5.3%) | 66 (0.8%) |
| 65 to 69 Years | 106 (1.4%) | 356 (4.2%) |
| 70 to 74 Years | 193 (2.5%) | 433 (5.1%) |
| 75 to 79 Years | 21 (0.3%) | 109 (1.3%) |
| 80 to 84 Years | 51 (0.7%) | 133 (1.6%) |
| 85 Years and over | 18 (0.2%) | 68 (0.8%) |
| Total | 7,647 (100.0%) | 8,402 (100.0%) |
Families and Households in Grovetown
Median Family Size in Grovetown
The median family size in Grovetown is 4.13 persons per family, with single male/father families (150 | 4.6%) accounting for the largest median family size of 4.87 persons per family. On the other hand, married-couple families (2,280 | 69.3%) represent the smallest median family size with 3.83 persons per family.
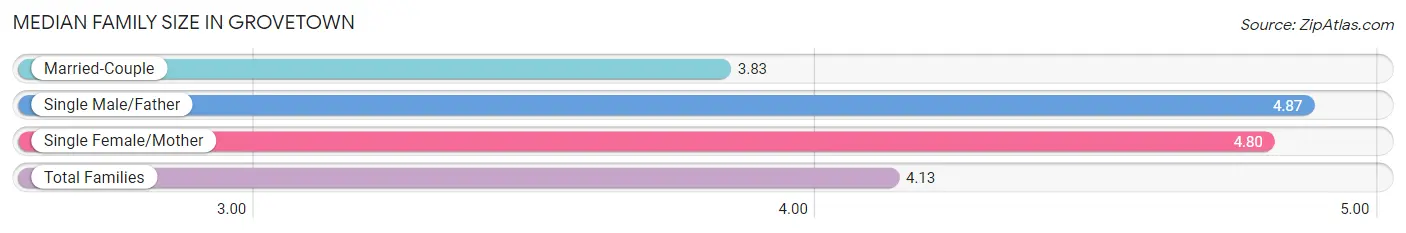
| Family Type | # Families | Family Size |
| Married-Couple | 2,280 (69.3%) | 3.83 |
| Single Male/Father | 150 (4.6%) | 4.87 |
| Single Female/Mother | 858 (26.1%) | 4.80 |
| Total Families | 3,288 (100.0%) | 4.13 |
Median Household Size in Grovetown
The median household size in Grovetown is 3.44 persons per household, with single female/mother households (858 | 18.4%) accounting for the largest median household size of 5.15 persons per household. non-family households (1,382 | 29.6%) represent the smallest median household size with 1.52 persons per household.
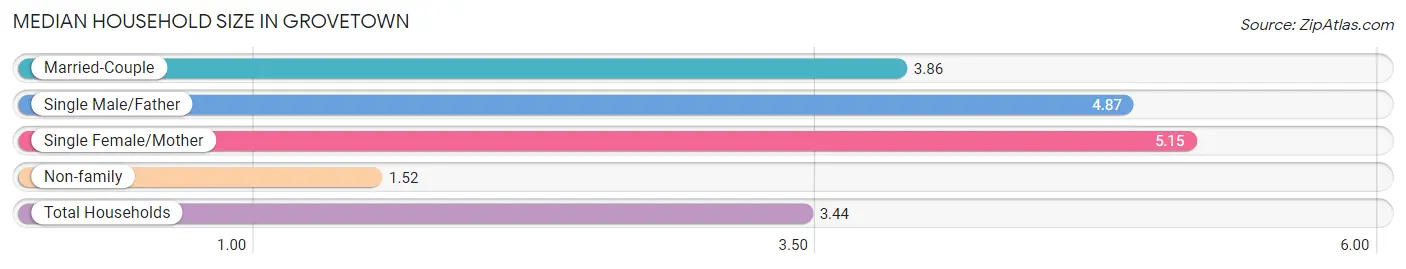
| Household Type | # Households | Household Size |
| Married-Couple | 2,280 (48.8%) | 3.86 |
| Single Male/Father | 150 (3.2%) | 4.87 |
| Single Female/Mother | 858 (18.4%) | 5.15 |
| Non-family | 1,382 (29.6%) | 1.52 |
| Total Households | 4,670 (100.0%) | 3.44 |
Household Size by Marriage Status in Grovetown
Out of a total of 4,670 households in Grovetown, 3,288 (70.4%) are family households, while 1,382 (29.6%) are nonfamily households. The most numerous type of family households are 2-person households, comprising 1,226, and the most common type of nonfamily households are 1-person households, comprising 973.
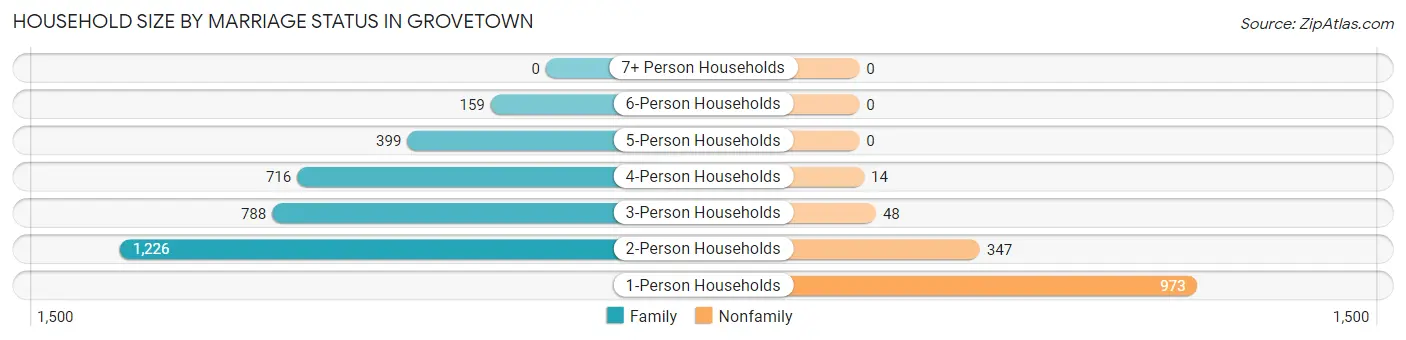
| Household Size | Family Households | Nonfamily Households |
| 1-Person Households | - | 973 (20.8%) |
| 2-Person Households | 1,226 (26.3%) | 347 (7.4%) |
| 3-Person Households | 788 (16.9%) | 48 (1.0%) |
| 4-Person Households | 716 (15.3%) | 14 (0.3%) |
| 5-Person Households | 399 (8.5%) | 0 (0.0%) |
| 6-Person Households | 159 (3.4%) | 0 (0.0%) |
| 7+ Person Households | 0 (0.0%) | 0 (0.0%) |
| Total | 3,288 (70.4%) | 1,382 (29.6%) |
Female Fertility in Grovetown
Fertility by Age in Grovetown
Average fertility rate in Grovetown is 33.0 births per 1,000 women. Women in the age bracket of 20 to 34 years have the highest fertility rate with 67.0 births per 1,000 women. Women in the age bracket of 20 to 34 years acount for 89.2% of all women with births.

| Age Bracket | Women with Births | Births / 1,000 Women |
| 15 to 19 years | 0 (0.0%) | 0.0 |
| 20 to 34 years | 141 (89.2%) | 67.0 |
| 35 to 50 years | 17 (10.8%) | 8.0 |
| Total | 158 (100.0%) | 33.0 |
Fertility by Age by Marriage Status in Grovetown
62.7% of women with births (158) in Grovetown are married. The highest percentage of unmarried women with births falls into 20 to 34 years age bracket with 41.8% of them unmarried at the time of birth, while the lowest percentage of unmarried women with births belong to 35 to 50 years age bracket with 0.0% of them unmarried.
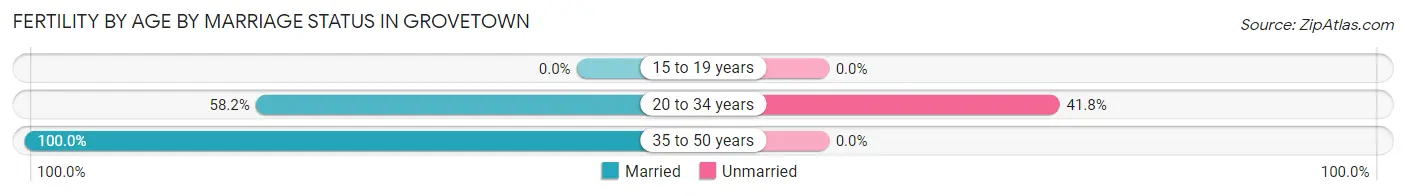
| Age Bracket | Married | Unmarried |
| 15 to 19 years | 0 (0.0%) | 0 (0.0%) |
| 20 to 34 years | 82 (58.2%) | 59 (41.8%) |
| 35 to 50 years | 17 (100.0%) | 0 (0.0%) |
| Total | 99 (62.7%) | 59 (37.3%) |
Fertility by Education in Grovetown
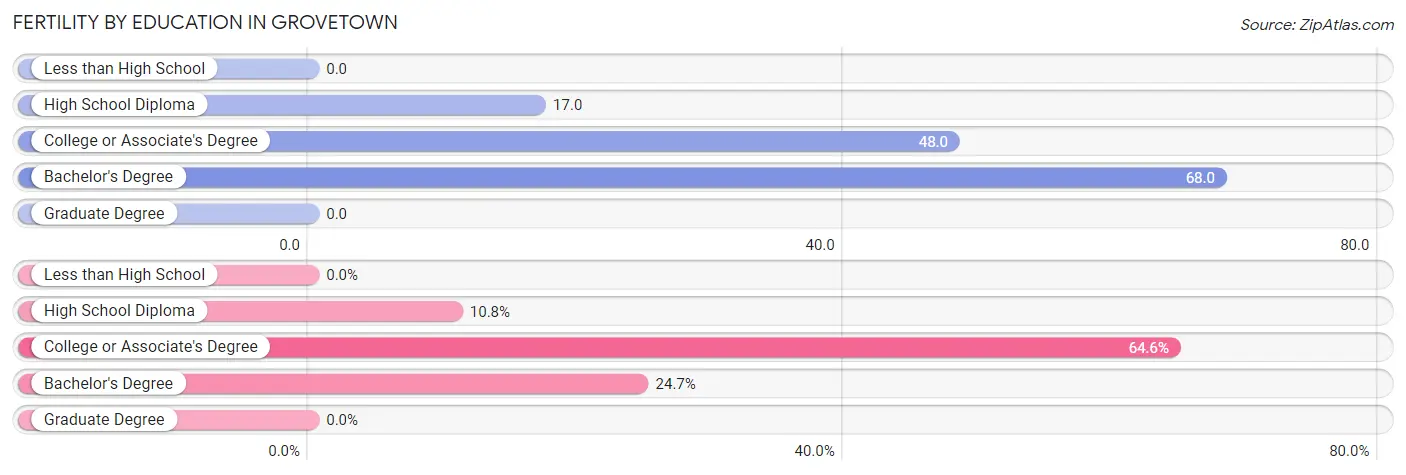
| Educational Attainment | Women with Births | Births / 1,000 Women |
| Less than High School | 0 (0.0%) | 0.0 |
| High School Diploma | 17 (10.8%) | 17.0 |
| College or Associate's Degree | 102 (64.6%) | 48.0 |
| Bachelor's Degree | 39 (24.7%) | 68.0 |
| Graduate Degree | 0 (0.0%) | 0.0 |
| Total | 158 (100.0%) | 33.0 |
Fertility by Education by Marriage Status in Grovetown
37.3% of women with births in Grovetown are unmarried. Women with the educational attainment of high school diploma are most likely to be married with 100.0% of them married at childbirth, while women with the educational attainment of bachelor's degree are least likely to be married with 100.0% of them unmarried at childbirth.
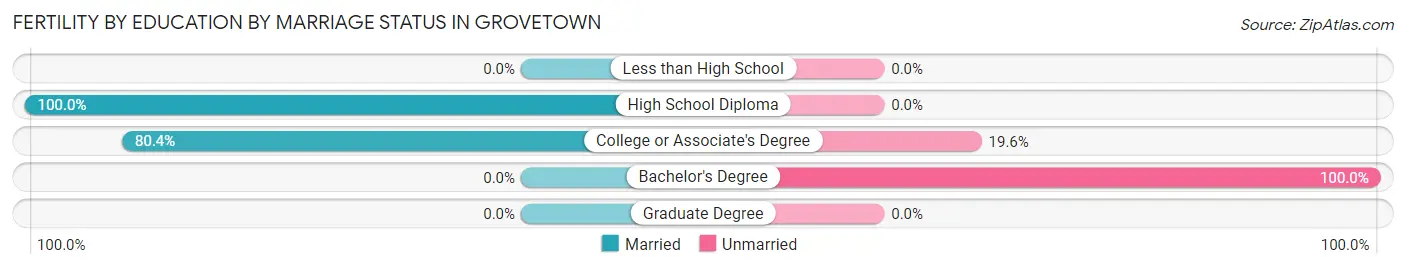
| Educational Attainment | Married | Unmarried |
| Less than High School | 0 (0.0%) | 0 (0.0%) |
| High School Diploma | 17 (100.0%) | 0 (0.0%) |
| College or Associate's Degree | 82 (80.4%) | 20 (19.6%) |
| Bachelor's Degree | 0 (0.0%) | 39 (100.0%) |
| Graduate Degree | 0 (0.0%) | 0 (0.0%) |
| Total | 99 (62.7%) | 59 (37.3%) |
Employment Characteristics in Grovetown
Employment by Class of Employer in Grovetown
Among the 9,114 employed individuals in Grovetown, private company employees (6,195 | 68.0%), federal government employees (1,501 | 16.5%), and self-employed (incorporated) (570 | 6.2%) make up the most common classes of employment.
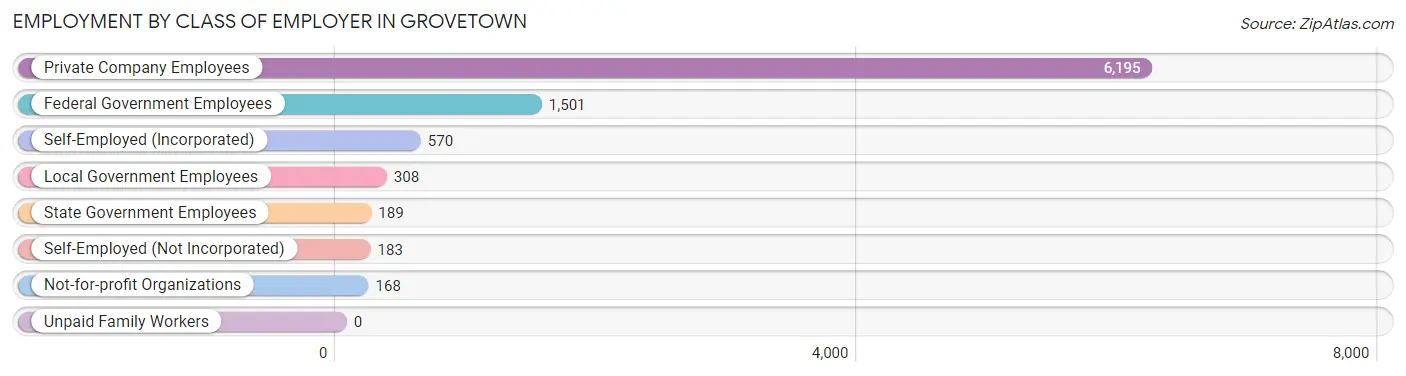
| Employer Class | # Employees | % Employees |
| Private Company Employees | 6,195 | 68.0% |
| Self-Employed (Incorporated) | 570 | 6.2% |
| Self-Employed (Not Incorporated) | 183 | 2.0% |
| Not-for-profit Organizations | 168 | 1.8% |
| Local Government Employees | 308 | 3.4% |
| State Government Employees | 189 | 2.1% |
| Federal Government Employees | 1,501 | 16.5% |
| Unpaid Family Workers | 0 | 0.0% |
| Total | 9,114 | 100.0% |
Employment Status by Age in Grovetown
According to the labor force statistics for Grovetown, out of the total population over 16 years of age (12,718), 72.4% or 9,208 individuals are in the labor force, with 0.9% or 83 of them unemployed. The age group with the highest labor force participation rate is 30 to 34 years, with 96.0% or 1,097 individuals in the labor force. Within the labor force, the 16 to 19 years age range has the highest percentage of unemployed individuals, with 13.0% or 31 of them being unemployed.
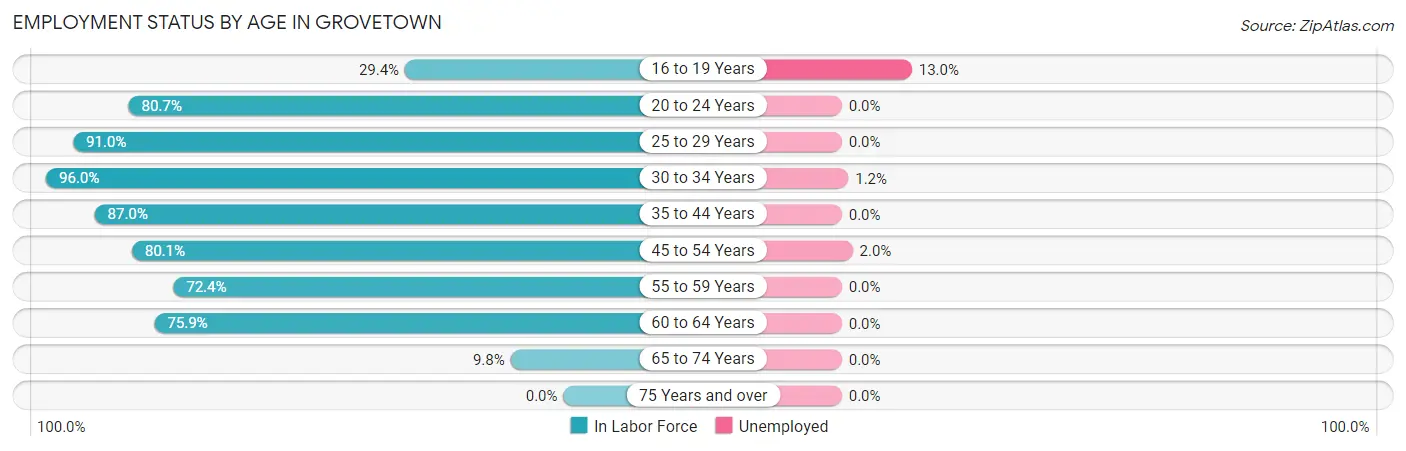
| Age Bracket | In Labor Force | Unemployed |
| 16 to 19 Years | 238 (29.4%) | 31 (13.0%) |
| 20 to 24 Years | 1,257 (80.7%) | 0 (0.0%) |
| 25 to 29 Years | 1,361 (91.0%) | 0 (0.0%) |
| 30 to 34 Years | 1,097 (96.0%) | 13 (1.2%) |
| 35 to 44 Years | 2,798 (87.0%) | 0 (0.0%) |
| 45 to 54 Years | 1,576 (80.1%) | 32 (2.0%) |
| 55 to 59 Years | 410 (72.4%) | 0 (0.0%) |
| 60 to 64 Years | 360 (75.9%) | 0 (0.0%) |
| 65 to 74 Years | 107 (9.8%) | 0 (0.0%) |
| 75 Years and over | 0 (0.0%) | 0 (0.0%) |
| Total | 9,208 (72.4%) | 83 (0.9%) |
Employment Status by Educational Attainment in Grovetown
According to labor force statistics for Grovetown, 85.8% of individuals (7,604) out of the total population between 25 and 64 years of age (8,862) are in the labor force, with 0.6% or 46 of them being unemployed. The group with the highest labor force participation rate are those with the educational attainment of less than high school, with 87.9% or 622 individuals in the labor force. Within the labor force, individuals with college / associate degree education have the highest percentage of unemployment, with 1.1% or 35 of them being unemployed.
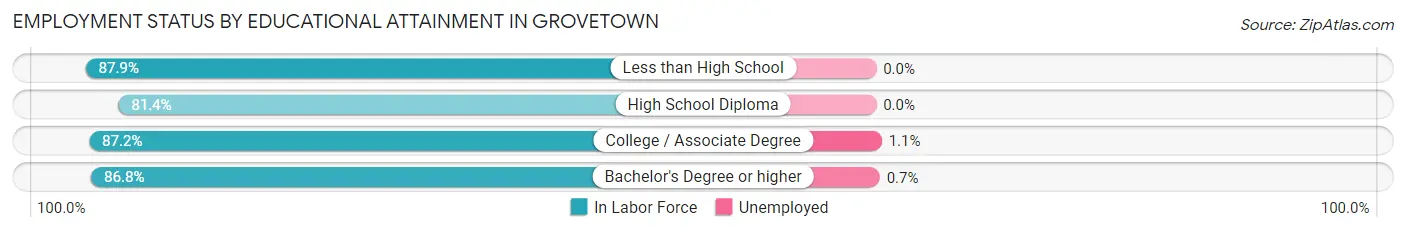
| Educational Attainment | In Labor Force | Unemployed |
| Less than High School | 622 (87.9%) | 0 (0.0%) |
| High School Diploma | 1,744 (81.4%) | 0 (0.0%) |
| College / Associate Degree | 3,178 (87.2%) | 40 (1.1%) |
| Bachelor's Degree or higher | 2,055 (86.8%) | 17 (0.7%) |
| Total | 7,604 (85.8%) | 53 (0.6%) |
Employment Occupations by Sex in Grovetown
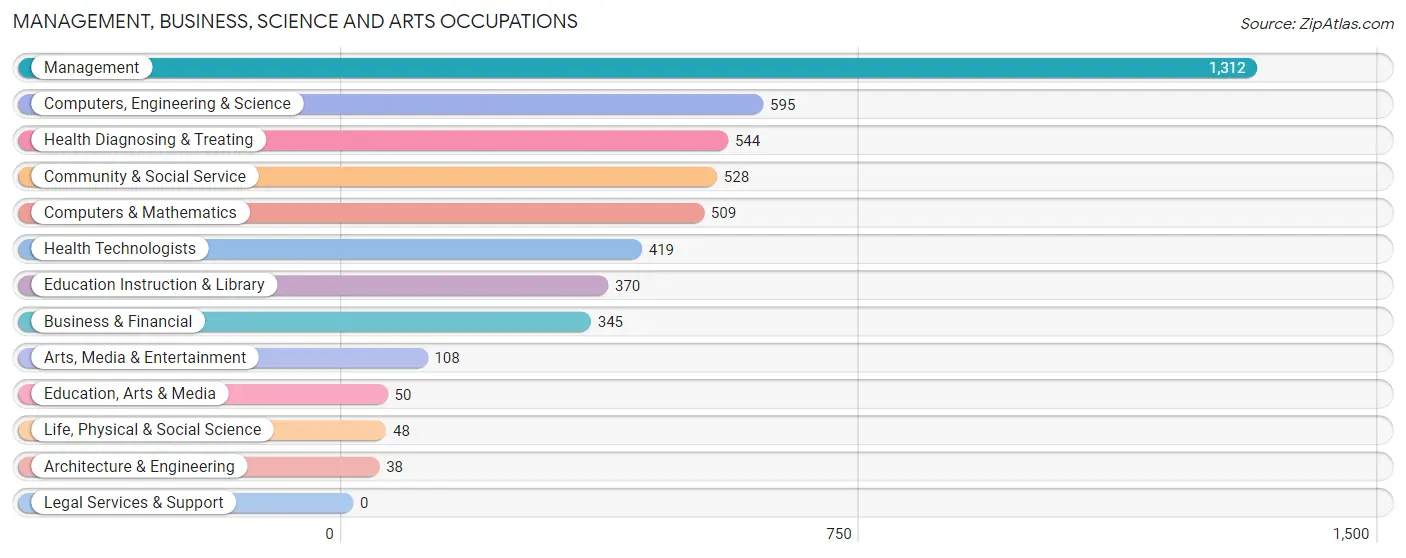
Management, Business, Science and Arts Occupations
The most common Management, Business, Science and Arts occupations in Grovetown are Management (1,312 | 15.5%), Computers, Engineering & Science (595 | 7.0%), Health Diagnosing & Treating (544 | 6.4%), Community & Social Service (528 | 6.3%), and Computers & Mathematics (509 | 6.0%).
Management, Business, Science and Arts Occupations by Sex
Within the Management, Business, Science and Arts occupations in Grovetown, the most male-oriented occupations are Education Instruction & Library (71.6%), Computers & Mathematics (59.3%), and Computers, Engineering & Science (52.9%), while the most female-oriented occupations are Life, Physical & Social Science (100.0%), Education, Arts & Media (100.0%), and Health Diagnosing & Treating (100.0%).
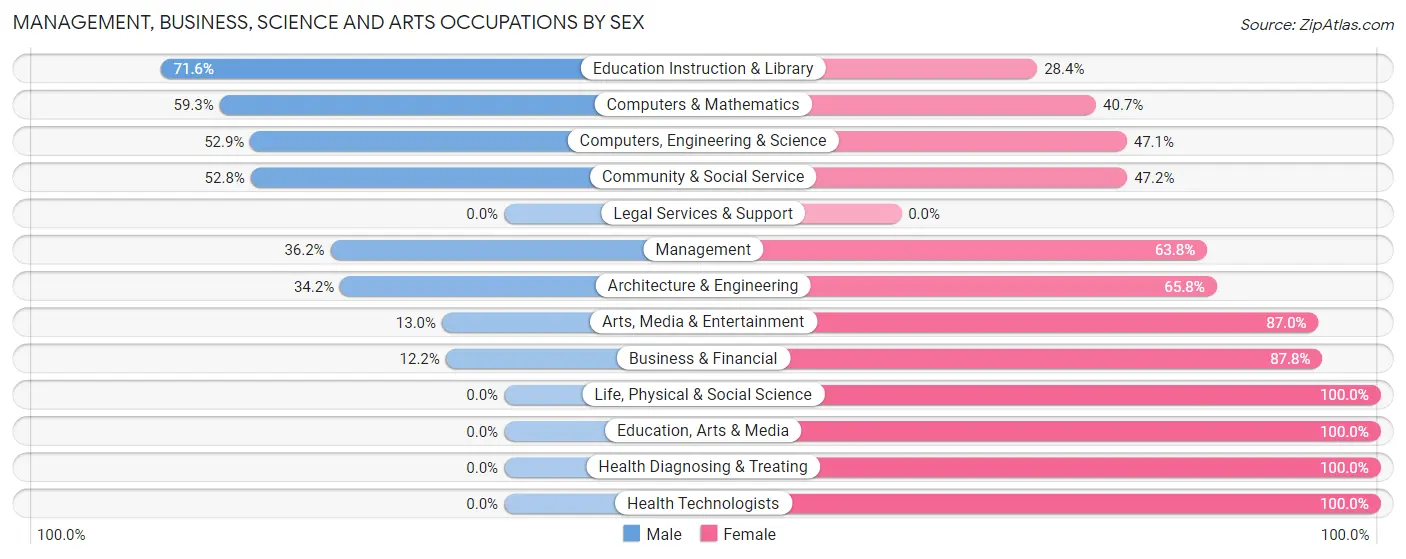
| Occupation | Male | Female |
| Management | 475 (36.2%) | 837 (63.8%) |
| Business & Financial | 42 (12.2%) | 303 (87.8%) |
| Computers, Engineering & Science | 315 (52.9%) | 280 (47.1%) |
| Computers & Mathematics | 302 (59.3%) | 207 (40.7%) |
| Architecture & Engineering | 13 (34.2%) | 25 (65.8%) |
| Life, Physical & Social Science | 0 (0.0%) | 48 (100.0%) |
| Community & Social Service | 279 (52.8%) | 249 (47.2%) |
| Education, Arts & Media | 0 (0.0%) | 50 (100.0%) |
| Legal Services & Support | 0 (0.0%) | 0 (0.0%) |
| Education Instruction & Library | 265 (71.6%) | 105 (28.4%) |
| Arts, Media & Entertainment | 14 (13.0%) | 94 (87.0%) |
| Health Diagnosing & Treating | 0 (0.0%) | 544 (100.0%) |
| Health Technologists | 0 (0.0%) | 419 (100.0%) |
| Total (Category) | 1,111 (33.4%) | 2,213 (66.6%) |
| Total (Overall) | 4,387 (52.0%) | 4,054 (48.0%) |
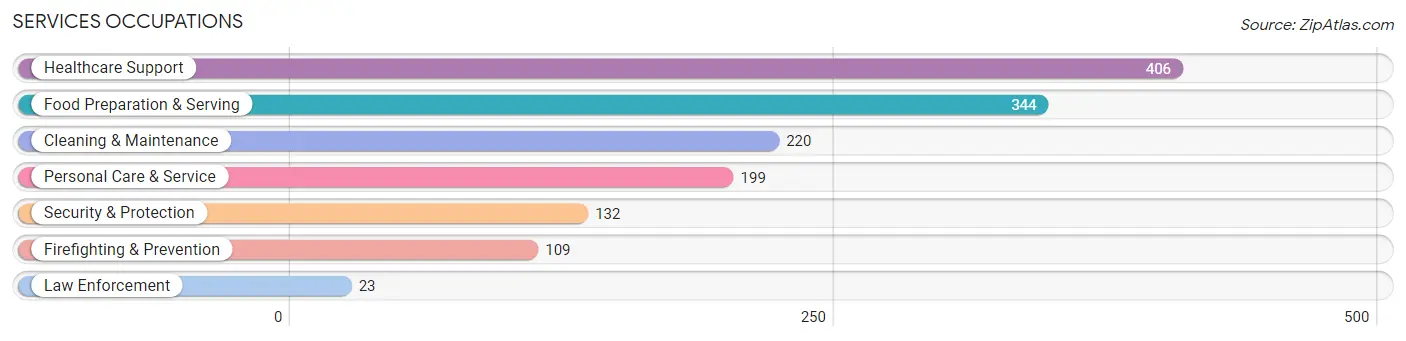
Services Occupations
The most common Services occupations in Grovetown are Healthcare Support (406 | 4.8%), Food Preparation & Serving (344 | 4.1%), Cleaning & Maintenance (220 | 2.6%), Personal Care & Service (199 | 2.4%), and Security & Protection (132 | 1.6%).
Services Occupations by Sex
Within the Services occupations in Grovetown, the most male-oriented occupations are Law Enforcement (100.0%), Food Preparation & Serving (62.8%), and Healthcare Support (62.6%), while the most female-oriented occupations are Cleaning & Maintenance (62.3%), Personal Care & Service (51.8%), and Firefighting & Prevention (45.9%).
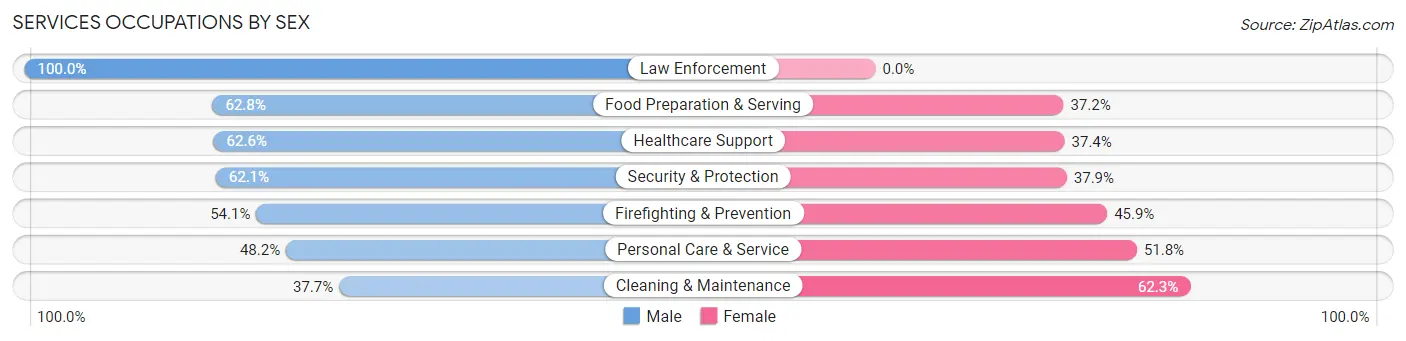
| Occupation | Male | Female |
| Healthcare Support | 254 (62.6%) | 152 (37.4%) |
| Security & Protection | 82 (62.1%) | 50 (37.9%) |
| Firefighting & Prevention | 59 (54.1%) | 50 (45.9%) |
| Law Enforcement | 23 (100.0%) | 0 (0.0%) |
| Food Preparation & Serving | 216 (62.8%) | 128 (37.2%) |
| Cleaning & Maintenance | 83 (37.7%) | 137 (62.3%) |
| Personal Care & Service | 96 (48.2%) | 103 (51.8%) |
| Total (Category) | 731 (56.2%) | 570 (43.8%) |
| Total (Overall) | 4,387 (52.0%) | 4,054 (48.0%) |
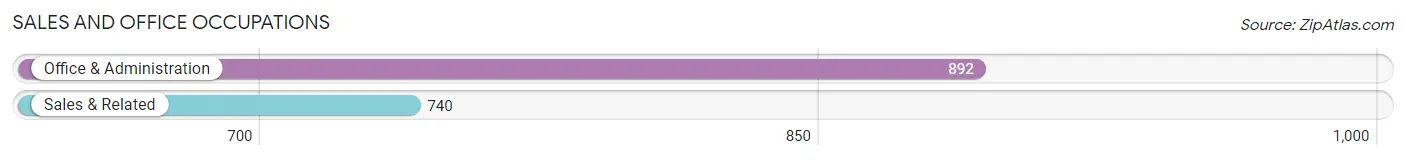
Sales and Office Occupations
The most common Sales and Office occupations in Grovetown are Office & Administration (892 | 10.6%), and Sales & Related (740 | 8.8%).
Sales and Office Occupations by Sex
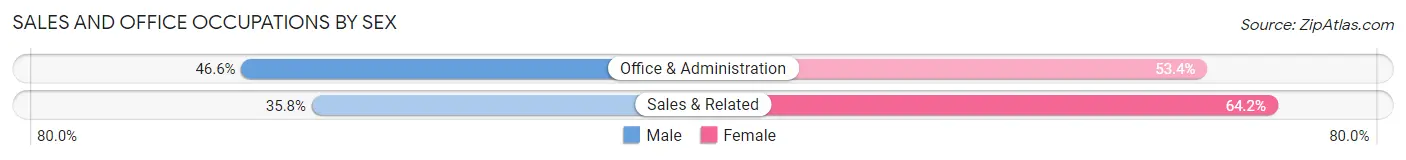
| Occupation | Male | Female |
| Sales & Related | 265 (35.8%) | 475 (64.2%) |
| Office & Administration | 416 (46.6%) | 476 (53.4%) |
| Total (Category) | 681 (41.7%) | 951 (58.3%) |
| Total (Overall) | 4,387 (52.0%) | 4,054 (48.0%) |
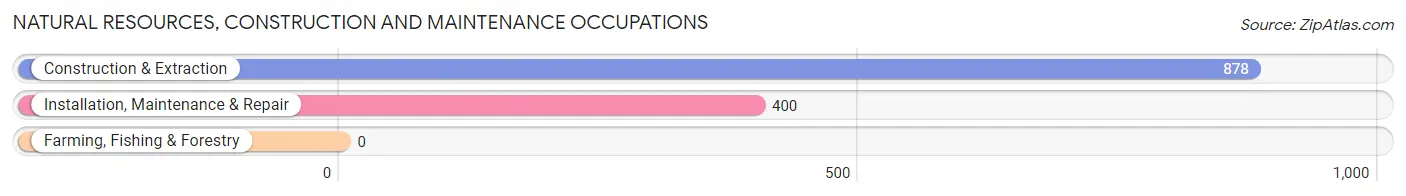
Natural Resources, Construction and Maintenance Occupations
The most common Natural Resources, Construction and Maintenance occupations in Grovetown are Construction & Extraction (878 | 10.4%), and Installation, Maintenance & Repair (400 | 4.7%).
Natural Resources, Construction and Maintenance Occupations by Sex
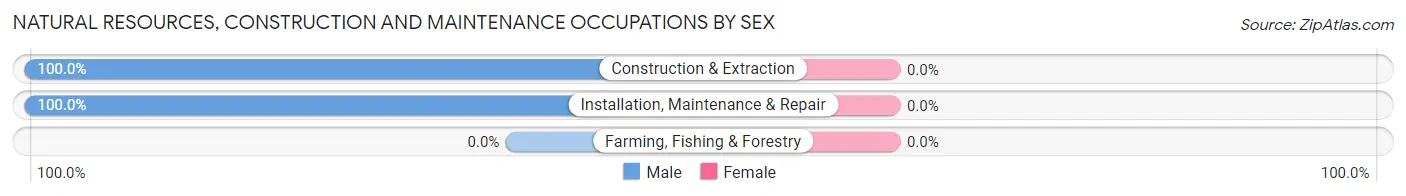
| Occupation | Male | Female |
| Farming, Fishing & Forestry | 0 (0.0%) | 0 (0.0%) |
| Construction & Extraction | 878 (100.0%) | 0 (0.0%) |
| Installation, Maintenance & Repair | 400 (100.0%) | 0 (0.0%) |
| Total (Category) | 1,278 (100.0%) | 0 (0.0%) |
| Total (Overall) | 4,387 (52.0%) | 4,054 (48.0%) |
Production, Transportation and Moving Occupations
The most common Production, Transportation and Moving occupations in Grovetown are Material Moving (351 | 4.2%), Transportation (307 | 3.6%), and Production (248 | 2.9%).
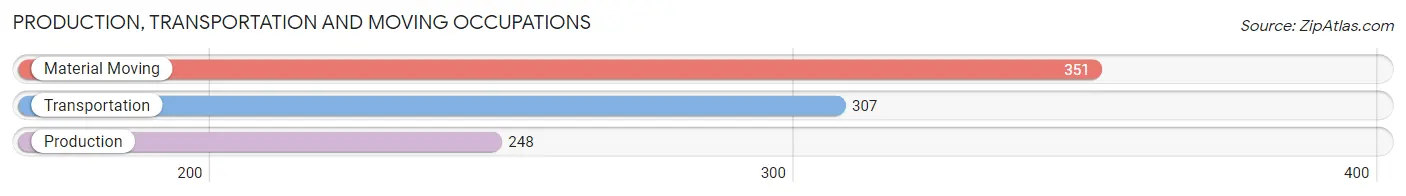
Production, Transportation and Moving Occupations by Sex
| Occupation | Male | Female |
| Production | 151 (60.9%) | 97 (39.1%) |
| Transportation | 239 (77.8%) | 68 (22.2%) |
| Material Moving | 196 (55.8%) | 155 (44.2%) |
| Total (Category) | 586 (64.7%) | 320 (35.3%) |
| Total (Overall) | 4,387 (52.0%) | 4,054 (48.0%) |
Employment Industries by Sex in Grovetown
Employment Industries in Grovetown
The major employment industries in Grovetown include Health Care & Social Assistance (1,644 | 19.5%), Accommodation & Food Services (866 | 10.3%), Manufacturing (859 | 10.2%), Construction (855 | 10.1%), and Retail Trade (817 | 9.7%).
Employment Industries by Sex in Grovetown
The Grovetown industries that see more men than women are Agriculture, Fishing & Hunting (100.0%), Construction (100.0%), and Wholesale Trade (100.0%), whereas the industries that tend to have a higher number of women are Utilities (100.0%), Real Estate, Rental & Leasing (80.0%), and Manufacturing (79.6%).
| Industry | Male | Female |
| Agriculture, Fishing & Hunting | 64 (100.0%) | 0 (0.0%) |
| Mining, Quarrying, & Extraction | 0 (0.0%) | 0 (0.0%) |
| Construction | 855 (100.0%) | 0 (0.0%) |
| Manufacturing | 175 (20.4%) | 684 (79.6%) |
| Wholesale Trade | 48 (100.0%) | 0 (0.0%) |
| Retail Trade | 409 (50.1%) | 408 (49.9%) |
| Transportation & Warehousing | 285 (71.8%) | 112 (28.2%) |
| Utilities | 0 (0.0%) | 5 (100.0%) |
| Information | 308 (75.3%) | 101 (24.7%) |
| Finance & Insurance | 208 (73.5%) | 75 (26.5%) |
| Real Estate, Rental & Leasing | 20 (20.0%) | 80 (80.0%) |
| Professional & Scientific | 433 (62.0%) | 266 (38.1%) |
| Enterprise Management | 0 (0.0%) | 0 (0.0%) |
| Administrative & Support | 272 (77.7%) | 78 (22.3%) |
| Educational Services | 305 (59.2%) | 210 (40.8%) |
| Health Care & Social Assistance | 431 (26.2%) | 1,213 (73.8%) |
| Arts, Entertainment & Recreation | 62 (100.0%) | 0 (0.0%) |
| Accommodation & Food Services | 347 (40.1%) | 519 (59.9%) |
| Public Administration | 117 (35.4%) | 213 (64.5%) |
| Total | 4,387 (52.0%) | 4,054 (48.0%) |
Education in Grovetown
School Enrollment in Grovetown
The most common levels of schooling among the 4,282 students in Grovetown are college / undergraduate (1,138 | 26.6%), high school (942 | 22.0%), and middle school (754 | 17.6%).
| School Level | # Students | % Students |
| Nursery / Preschool | 450 | 10.5% |
| Kindergarten | 76 | 1.8% |
| Elementary School | 641 | 15.0% |
| Middle School | 754 | 17.6% |
| High School | 942 | 22.0% |
| College / Undergraduate | 1,138 | 26.6% |
| Graduate / Professional | 281 | 6.6% |
| Total | 4,282 | 100.0% |
School Enrollment by Age by Funding Source in Grovetown
Out of a total of 4,282 students who are enrolled in schools in Grovetown, 295 (6.9%) attend a private institution, while the remaining 3,987 (93.1%) are enrolled in public schools. The age group of 35 years and over has the highest likelihood of being enrolled in private schools, with 149 (24.5% in the age bracket) enrolled. Conversely, the age group of 15 to 17 year olds has the lowest likelihood of being enrolled in a private school, with 581 (100.0% in the age bracket) attending a public institution.
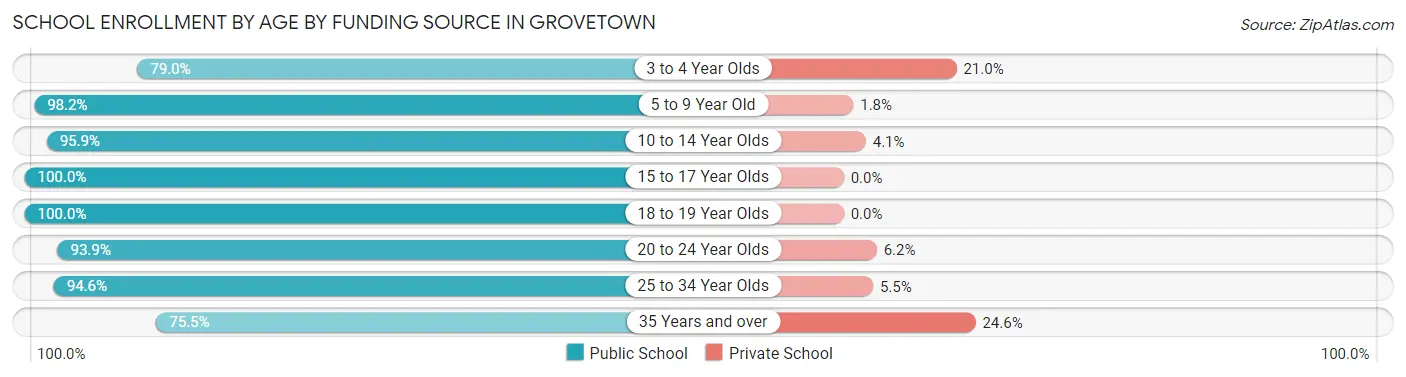
| Age Bracket | Public School | Private School |
| 3 to 4 Year Olds | 188 (79.0%) | 50 (21.0%) |
| 5 to 9 Year Old | 876 (98.2%) | 16 (1.8%) |
| 10 to 14 Year Olds | 814 (95.9%) | 35 (4.1%) |
| 15 to 17 Year Olds | 581 (100.0%) | 0 (0.0%) |
| 18 to 19 Year Olds | 348 (100.0%) | 0 (0.0%) |
| 20 to 24 Year Olds | 427 (93.9%) | 28 (6.1%) |
| 25 to 34 Year Olds | 295 (94.6%) | 17 (5.4%) |
| 35 Years and over | 458 (75.4%) | 149 (24.5%) |
| Total | 3,987 (93.1%) | 295 (6.9%) |
Educational Attainment by Field of Study in Grovetown
Business (604 | 21.9%), arts & humanities (362 | 13.1%), communications (320 | 11.6%), bio, nature & agricultural (234 | 8.5%), and science & technology (217 | 7.9%) are the most common fields of study among 2,757 individuals in Grovetown who have obtained a bachelor's degree or higher.
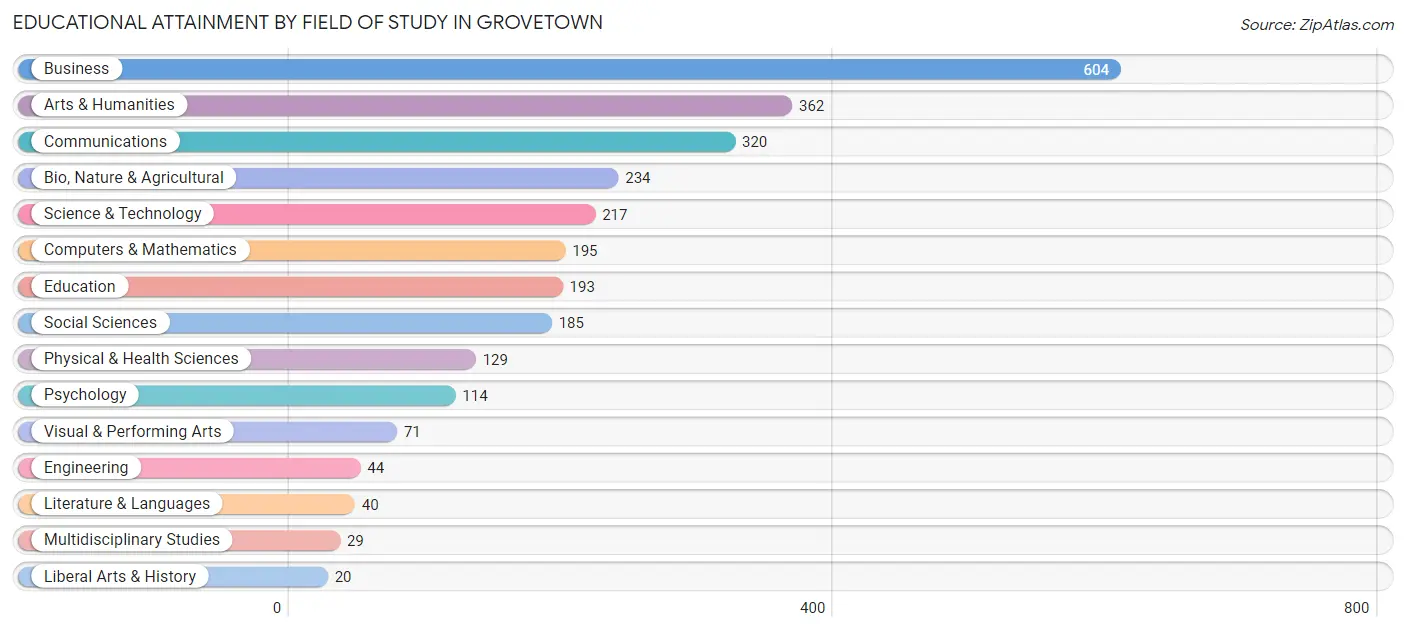
| Field of Study | # Graduates | % Graduates |
| Computers & Mathematics | 195 | 7.1% |
| Bio, Nature & Agricultural | 234 | 8.5% |
| Physical & Health Sciences | 129 | 4.7% |
| Psychology | 114 | 4.1% |
| Social Sciences | 185 | 6.7% |
| Engineering | 44 | 1.6% |
| Multidisciplinary Studies | 29 | 1.1% |
| Science & Technology | 217 | 7.9% |
| Business | 604 | 21.9% |
| Education | 193 | 7.0% |
| Literature & Languages | 40 | 1.5% |
| Liberal Arts & History | 20 | 0.7% |
| Visual & Performing Arts | 71 | 2.6% |
| Communications | 320 | 11.6% |
| Arts & Humanities | 362 | 13.1% |
| Total | 2,757 | 100.0% |
Transportation & Commute in Grovetown
Vehicle Availability by Sex in Grovetown
The most prevalent vehicle ownership categories in Grovetown are males with 2 vehicles (2,529, accounting for 51.2%) and females with 2 vehicles (1,642, making up 60.5%).
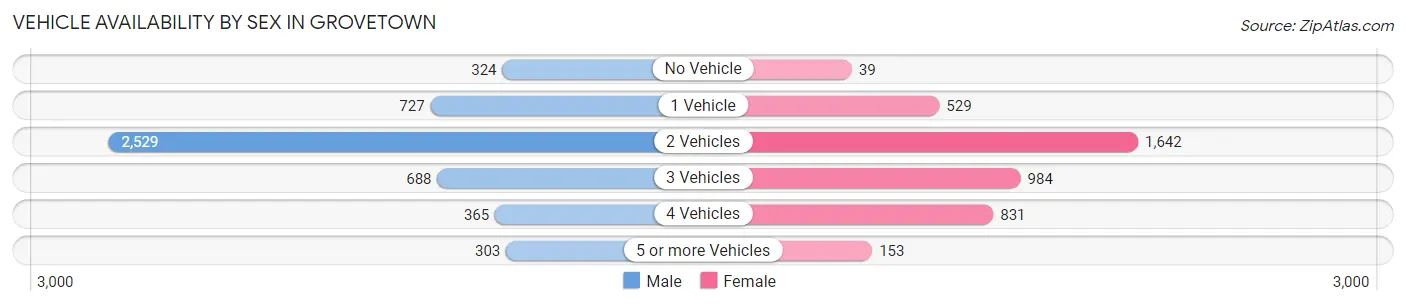
| Vehicles Available | Male | Female |
| No Vehicle | 324 (6.6%) | 39 (0.9%) |
| 1 Vehicle | 727 (14.7%) | 529 (12.7%) |
| 2 Vehicles | 2,529 (51.2%) | 1,642 (39.3%) |
| 3 Vehicles | 688 (13.9%) | 984 (23.5%) |
| 4 Vehicles | 365 (7.4%) | 831 (19.9%) |
| 5 or more Vehicles | 303 (6.1%) | 153 (3.7%) |
| Total | 4,936 (100.0%) | 4,178 (100.0%) |
Commute Time in Grovetown
The most frequently occuring commute durations in Grovetown are 30 to 34 minutes (1,529 commuters, 17.8%), 15 to 19 minutes (1,468 commuters, 17.1%), and 25 to 29 minutes (1,389 commuters, 16.2%).
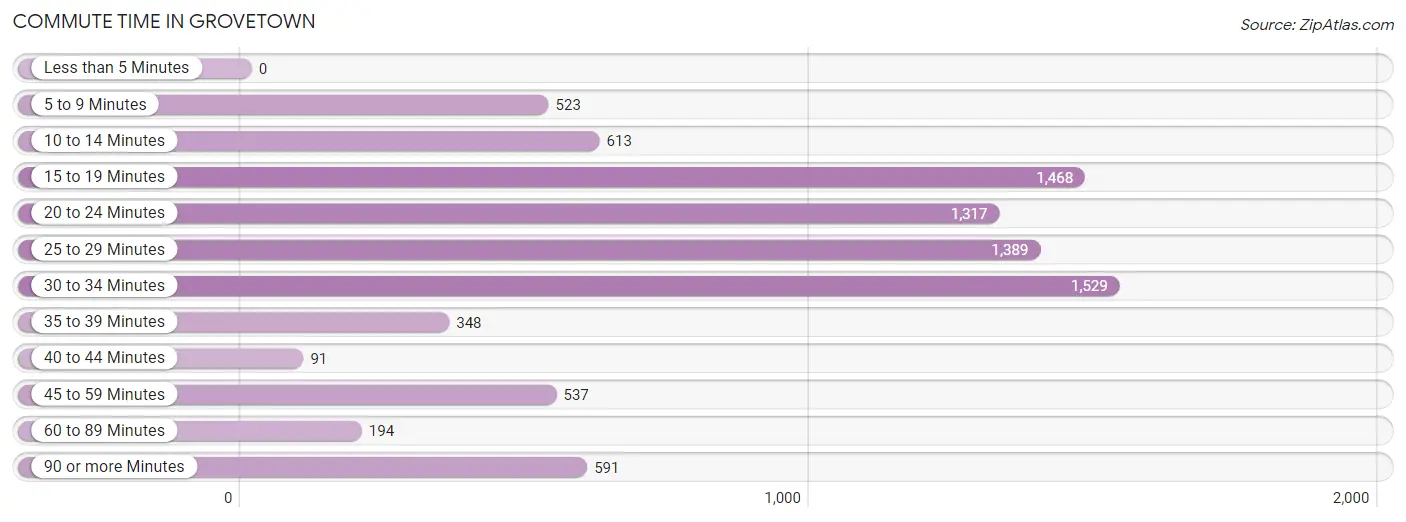
| Commute Time | # Commuters | % Commuters |
| Less than 5 Minutes | 0 | 0.0% |
| 5 to 9 Minutes | 523 | 6.1% |
| 10 to 14 Minutes | 613 | 7.1% |
| 15 to 19 Minutes | 1,468 | 17.1% |
| 20 to 24 Minutes | 1,317 | 15.3% |
| 25 to 29 Minutes | 1,389 | 16.2% |
| 30 to 34 Minutes | 1,529 | 17.8% |
| 35 to 39 Minutes | 348 | 4.1% |
| 40 to 44 Minutes | 91 | 1.1% |
| 45 to 59 Minutes | 537 | 6.2% |
| 60 to 89 Minutes | 194 | 2.3% |
| 90 or more Minutes | 591 | 6.9% |
Commute Time by Sex in Grovetown
The most common commute times in Grovetown are 25 to 29 minutes (1,017 commuters, 21.8%) for males and 15 to 19 minutes (801 commuters, 20.4%) for females.
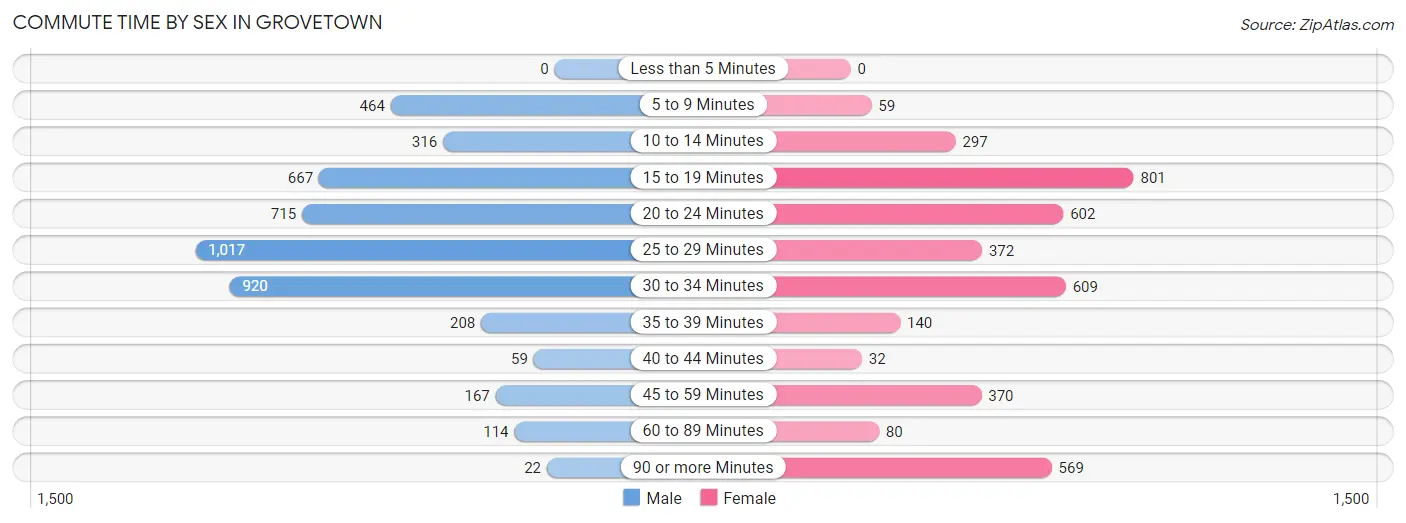
| Commute Time | Male | Female |
| Less than 5 Minutes | 0 (0.0%) | 0 (0.0%) |
| 5 to 9 Minutes | 464 (9.9%) | 59 (1.5%) |
| 10 to 14 Minutes | 316 (6.8%) | 297 (7.6%) |
| 15 to 19 Minutes | 667 (14.3%) | 801 (20.4%) |
| 20 to 24 Minutes | 715 (15.3%) | 602 (15.3%) |
| 25 to 29 Minutes | 1,017 (21.8%) | 372 (9.5%) |
| 30 to 34 Minutes | 920 (19.7%) | 609 (15.5%) |
| 35 to 39 Minutes | 208 (4.4%) | 140 (3.6%) |
| 40 to 44 Minutes | 59 (1.3%) | 32 (0.8%) |
| 45 to 59 Minutes | 167 (3.6%) | 370 (9.4%) |
| 60 to 89 Minutes | 114 (2.4%) | 80 (2.0%) |
| 90 or more Minutes | 22 (0.5%) | 569 (14.5%) |
Time of Departure to Work by Sex in Grovetown
The most frequent times of departure to work in Grovetown are 6:00 AM to 6:29 AM (1,151, 24.6%) for males and 7:00 AM to 7:29 AM (557, 14.2%) for females.
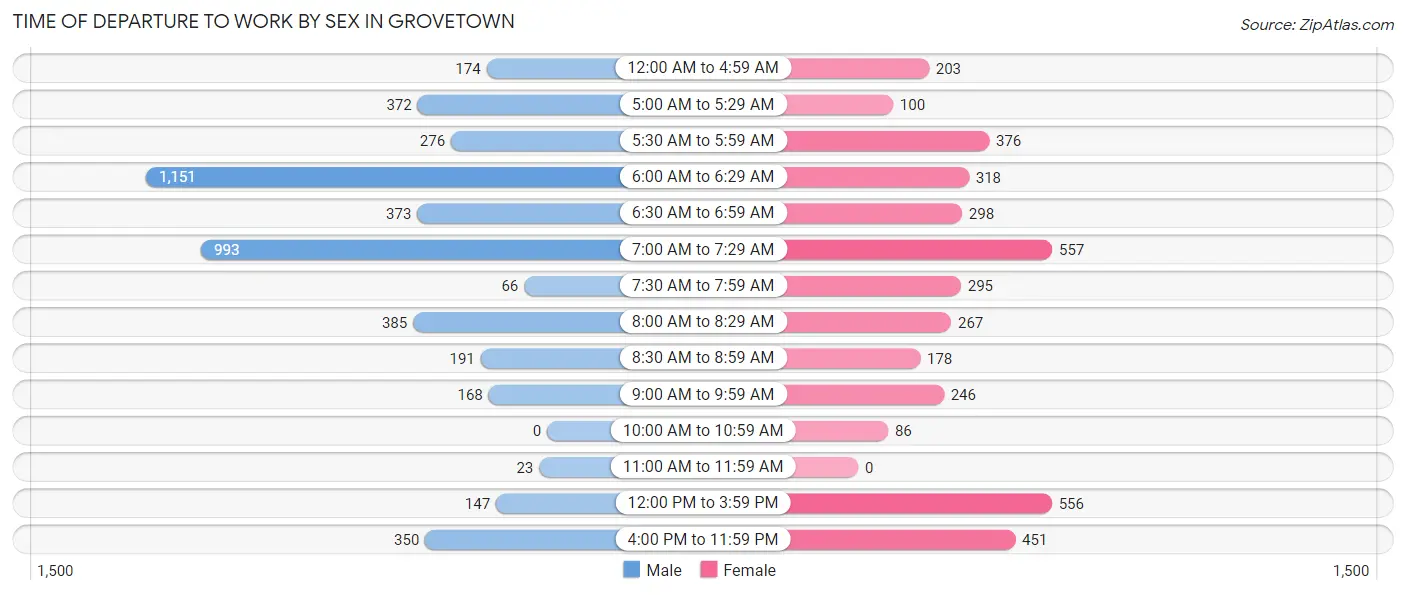
| Time of Departure | Male | Female |
| 12:00 AM to 4:59 AM | 174 (3.7%) | 203 (5.2%) |
| 5:00 AM to 5:29 AM | 372 (8.0%) | 100 (2.5%) |
| 5:30 AM to 5:59 AM | 276 (5.9%) | 376 (9.6%) |
| 6:00 AM to 6:29 AM | 1,151 (24.6%) | 318 (8.1%) |
| 6:30 AM to 6:59 AM | 373 (8.0%) | 298 (7.6%) |
| 7:00 AM to 7:29 AM | 993 (21.3%) | 557 (14.2%) |
| 7:30 AM to 7:59 AM | 66 (1.4%) | 295 (7.5%) |
| 8:00 AM to 8:29 AM | 385 (8.3%) | 267 (6.8%) |
| 8:30 AM to 8:59 AM | 191 (4.1%) | 178 (4.5%) |
| 9:00 AM to 9:59 AM | 168 (3.6%) | 246 (6.3%) |
| 10:00 AM to 10:59 AM | 0 (0.0%) | 86 (2.2%) |
| 11:00 AM to 11:59 AM | 23 (0.5%) | 0 (0.0%) |
| 12:00 PM to 3:59 PM | 147 (3.2%) | 556 (14.1%) |
| 4:00 PM to 11:59 PM | 350 (7.5%) | 451 (11.5%) |
| Total | 4,669 (100.0%) | 3,931 (100.0%) |
Housing Occupancy in Grovetown
Occupancy by Ownership in Grovetown
Of the total 4,670 dwellings in Grovetown, owner-occupied units account for 2,782 (59.6%), while renter-occupied units make up 1,888 (40.4%).
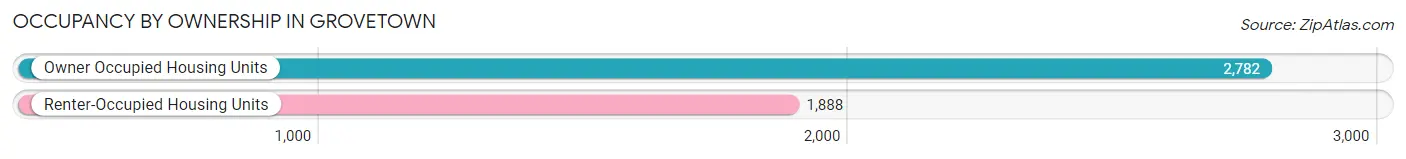
| Occupancy | # Housing Units | % Housing Units |
| Owner Occupied Housing Units | 2,782 | 59.6% |
| Renter-Occupied Housing Units | 1,888 | 40.4% |
| Total Occupied Housing Units | 4,670 | 100.0% |
Occupancy by Household Size in Grovetown
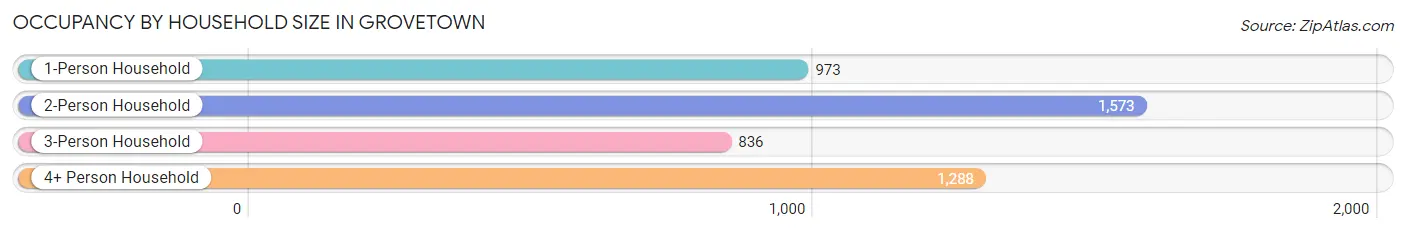
| Household Size | # Housing Units | % Housing Units |
| 1-Person Household | 973 | 20.8% |
| 2-Person Household | 1,573 | 33.7% |
| 3-Person Household | 836 | 17.9% |
| 4+ Person Household | 1,288 | 27.6% |
| Total Housing Units | 4,670 | 100.0% |
Occupancy by Ownership by Household Size in Grovetown
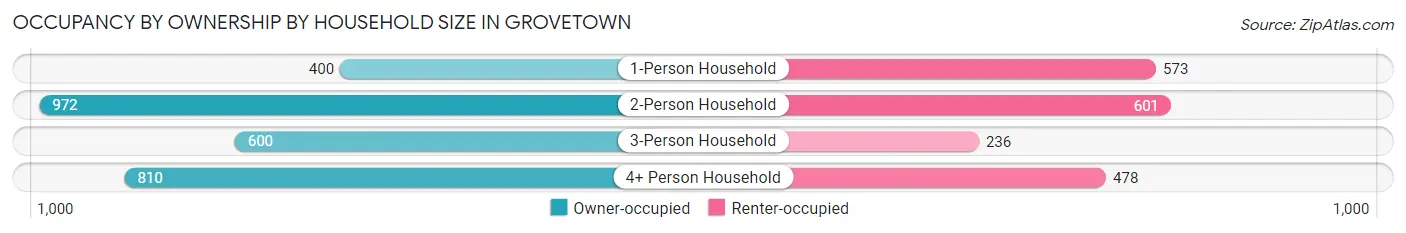
| Household Size | Owner-occupied | Renter-occupied |
| 1-Person Household | 400 (41.1%) | 573 (58.9%) |
| 2-Person Household | 972 (61.8%) | 601 (38.2%) |
| 3-Person Household | 600 (71.8%) | 236 (28.2%) |
| 4+ Person Household | 810 (62.9%) | 478 (37.1%) |
| Total Housing Units | 2,782 (59.6%) | 1,888 (40.4%) |
Occupancy by Educational Attainment in Grovetown
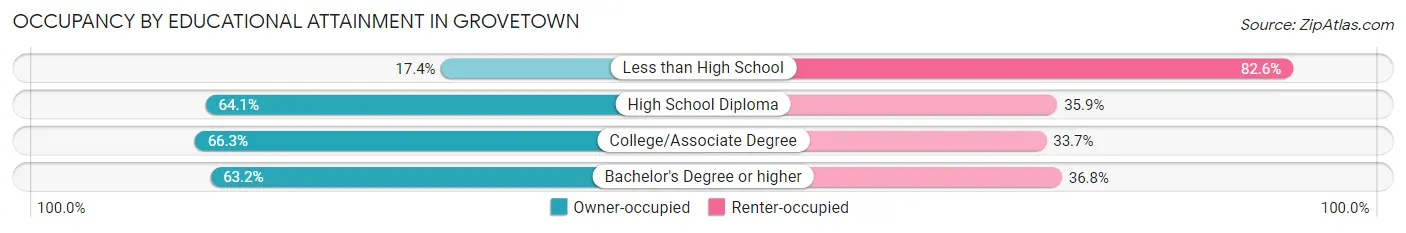
| Household Size | Owner-occupied | Renter-occupied |
| Less than High School | 88 (17.4%) | 419 (82.6%) |
| High School Diploma | 452 (64.1%) | 253 (35.9%) |
| College/Associate Degree | 1,224 (66.3%) | 623 (33.7%) |
| Bachelor's Degree or higher | 1,018 (63.2%) | 593 (36.8%) |
Occupancy by Age of Householder in Grovetown
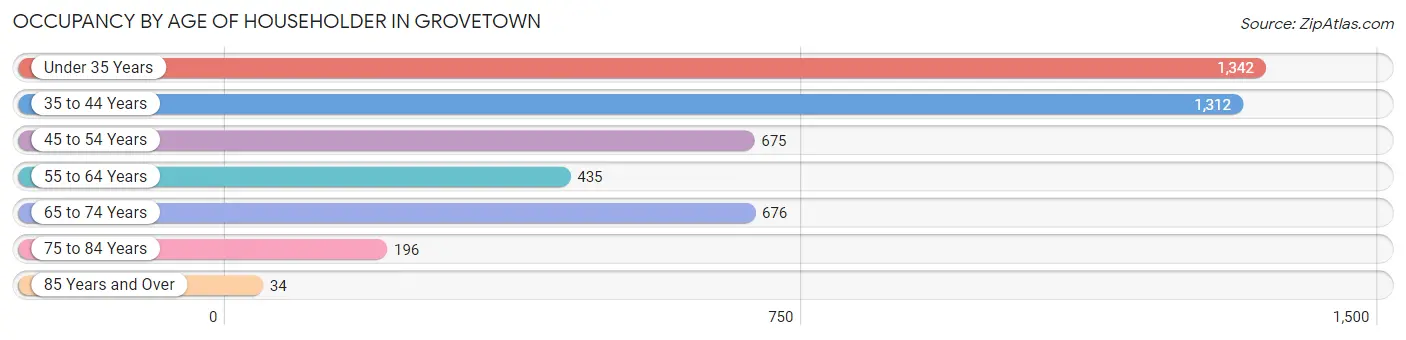
| Age Bracket | # Households | % Households |
| Under 35 Years | 1,342 | 28.7% |
| 35 to 44 Years | 1,312 | 28.1% |
| 45 to 54 Years | 675 | 14.4% |
| 55 to 64 Years | 435 | 9.3% |
| 65 to 74 Years | 676 | 14.5% |
| 75 to 84 Years | 196 | 4.2% |
| 85 Years and Over | 34 | 0.7% |
| Total | 4,670 | 100.0% |
Housing Finances in Grovetown
Median Income by Occupancy in Grovetown
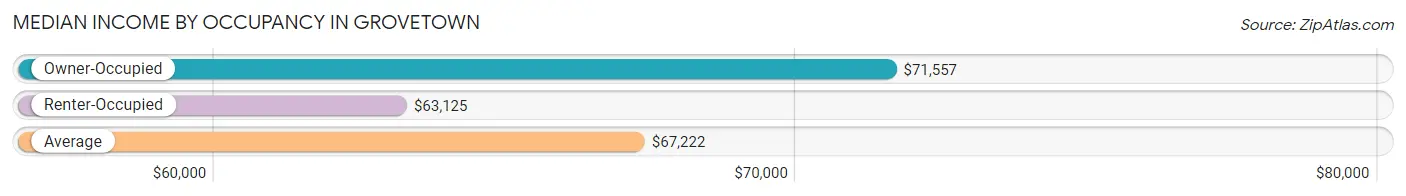
| Occupancy Type | # Households | Median Income |
| Owner-Occupied | 2,782 (59.6%) | $71,557 |
| Renter-Occupied | 1,888 (40.4%) | $63,125 |
| Average | 4,670 (100.0%) | $67,222 |
Occupancy by Householder Income Bracket in Grovetown
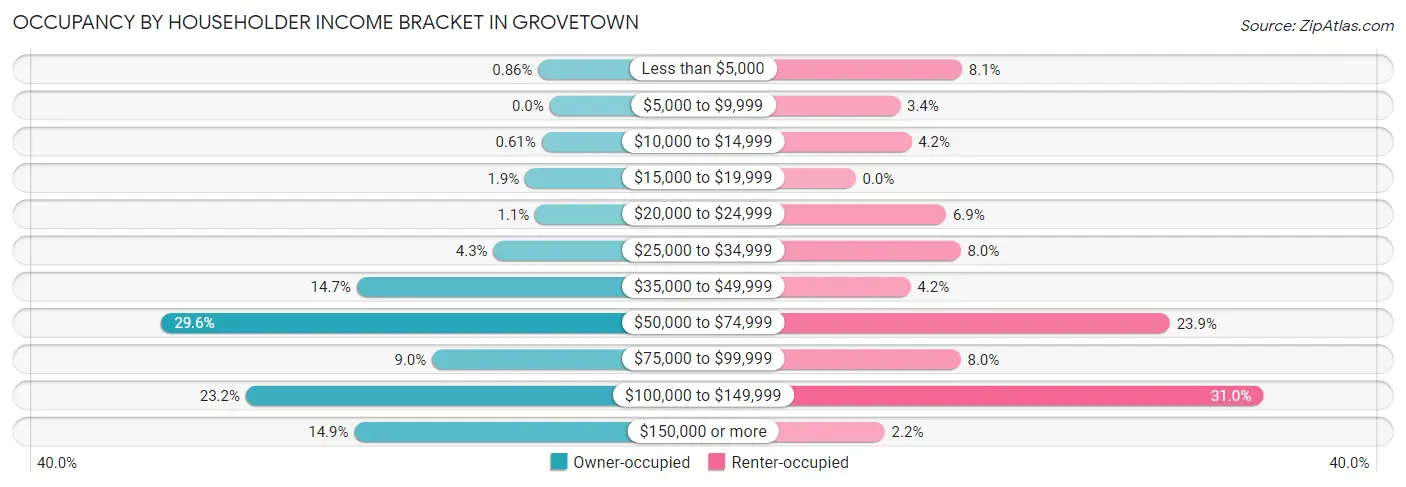
| Income Bracket | Owner-occupied | Renter-occupied |
| Less than $5,000 | 24 (0.9%) | 153 (8.1%) |
| $5,000 to $9,999 | 0 (0.0%) | 64 (3.4%) |
| $10,000 to $14,999 | 17 (0.6%) | 80 (4.2%) |
| $15,000 to $19,999 | 52 (1.9%) | 0 (0.0%) |
| $20,000 to $24,999 | 31 (1.1%) | 130 (6.9%) |
| $25,000 to $34,999 | 119 (4.3%) | 151 (8.0%) |
| $35,000 to $49,999 | 409 (14.7%) | 79 (4.2%) |
| $50,000 to $74,999 | 823 (29.6%) | 452 (23.9%) |
| $75,000 to $99,999 | 249 (8.9%) | 151 (8.0%) |
| $100,000 to $149,999 | 644 (23.2%) | 586 (31.0%) |
| $150,000 or more | 414 (14.9%) | 42 (2.2%) |
| Total | 2,782 (100.0%) | 1,888 (100.0%) |
Monthly Housing Cost Tiers in Grovetown
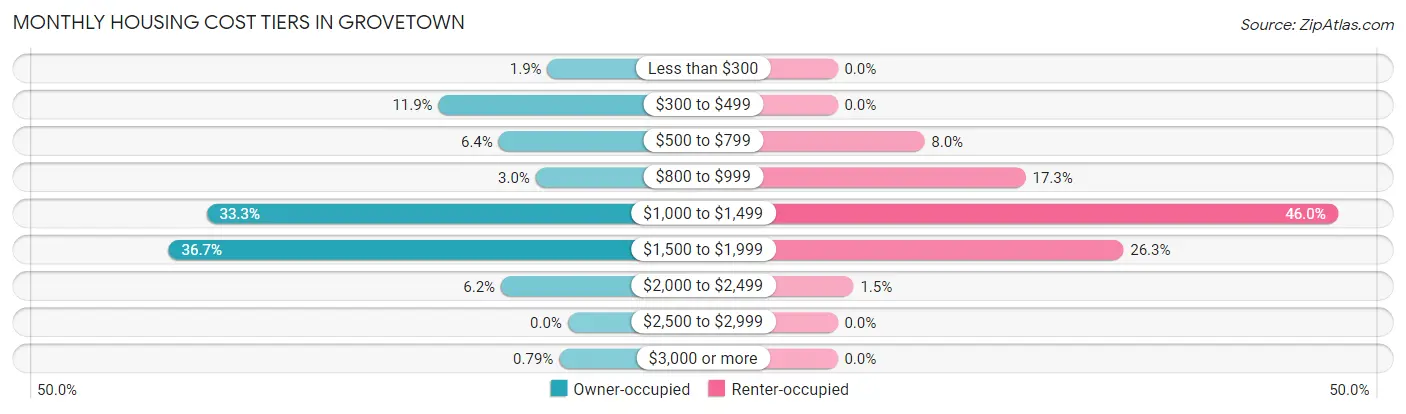
| Monthly Cost | Owner-occupied | Renter-occupied |
| Less than $300 | 52 (1.9%) | 0 (0.0%) |
| $300 to $499 | 331 (11.9%) | 0 (0.0%) |
| $500 to $799 | 177 (6.4%) | 151 (8.0%) |
| $800 to $999 | 82 (2.9%) | 327 (17.3%) |
| $1,000 to $1,499 | 925 (33.3%) | 869 (46.0%) |
| $1,500 to $1,999 | 1,022 (36.7%) | 497 (26.3%) |
| $2,000 to $2,499 | 171 (6.1%) | 28 (1.5%) |
| $2,500 to $2,999 | 0 (0.0%) | 0 (0.0%) |
| $3,000 or more | 22 (0.8%) | 0 (0.0%) |
| Total | 2,782 (100.0%) | 1,888 (100.0%) |
Physical Housing Characteristics in Grovetown
Housing Structures in Grovetown
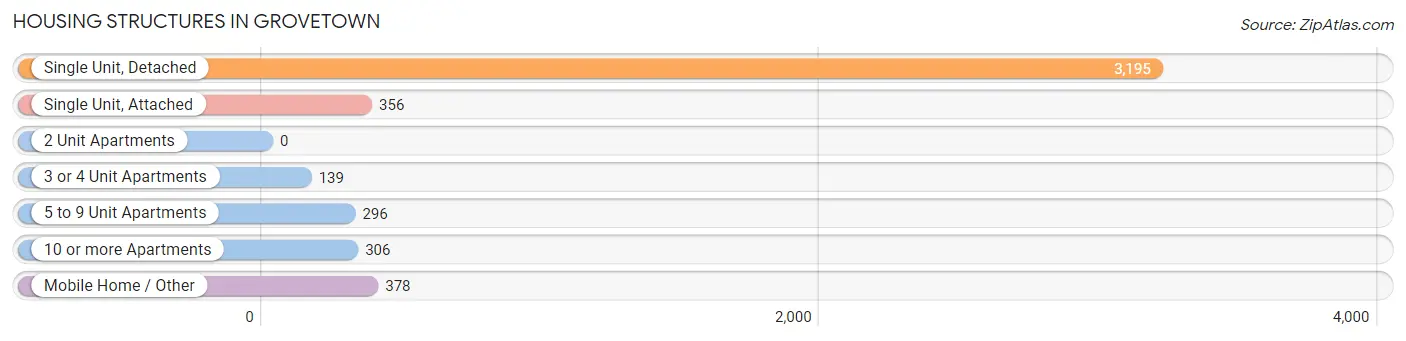
| Structure Type | # Housing Units | % Housing Units |
| Single Unit, Detached | 3,195 | 68.4% |
| Single Unit, Attached | 356 | 7.6% |
| 2 Unit Apartments | 0 | 0.0% |
| 3 or 4 Unit Apartments | 139 | 3.0% |
| 5 to 9 Unit Apartments | 296 | 6.3% |
| 10 or more Apartments | 306 | 6.6% |
| Mobile Home / Other | 378 | 8.1% |
| Total | 4,670 | 100.0% |
Housing Structures by Occupancy in Grovetown
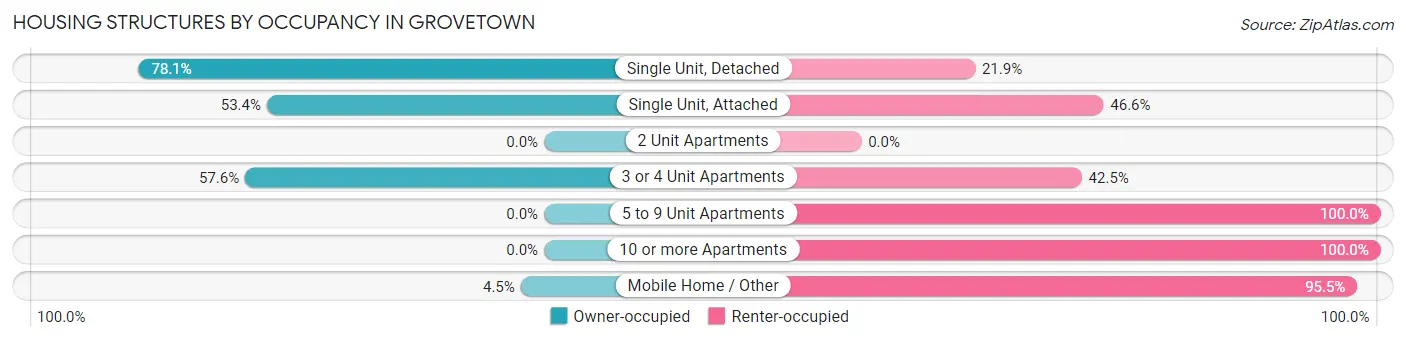
| Structure Type | Owner-occupied | Renter-occupied |
| Single Unit, Detached | 2,495 (78.1%) | 700 (21.9%) |
| Single Unit, Attached | 190 (53.4%) | 166 (46.6%) |
| 2 Unit Apartments | 0 (0.0%) | 0 (0.0%) |
| 3 or 4 Unit Apartments | 80 (57.6%) | 59 (42.4%) |
| 5 to 9 Unit Apartments | 0 (0.0%) | 296 (100.0%) |
| 10 or more Apartments | 0 (0.0%) | 306 (100.0%) |
| Mobile Home / Other | 17 (4.5%) | 361 (95.5%) |
| Total | 2,782 (59.6%) | 1,888 (40.4%) |
Housing Structures by Number of Rooms in Grovetown
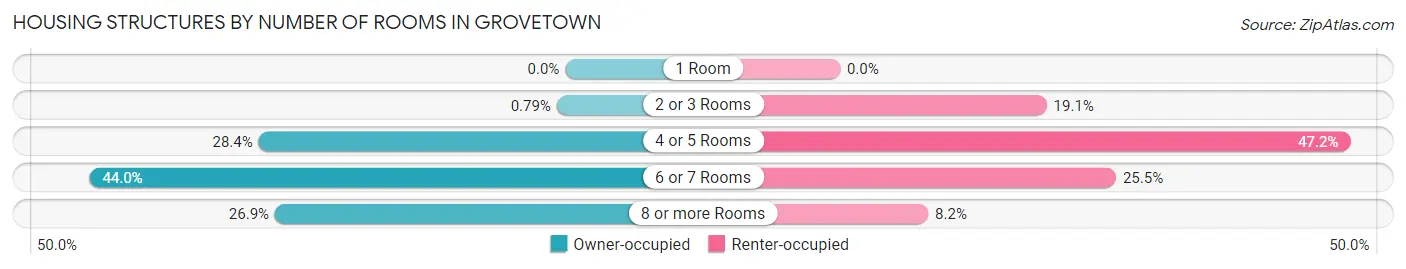
| Number of Rooms | Owner-occupied | Renter-occupied |
| 1 Room | 0 (0.0%) | 0 (0.0%) |
| 2 or 3 Rooms | 22 (0.8%) | 361 (19.1%) |
| 4 or 5 Rooms | 789 (28.4%) | 891 (47.2%) |
| 6 or 7 Rooms | 1,224 (44.0%) | 482 (25.5%) |
| 8 or more Rooms | 747 (26.9%) | 154 (8.2%) |
| Total | 2,782 (100.0%) | 1,888 (100.0%) |
Housing Structure by Heating Type in Grovetown
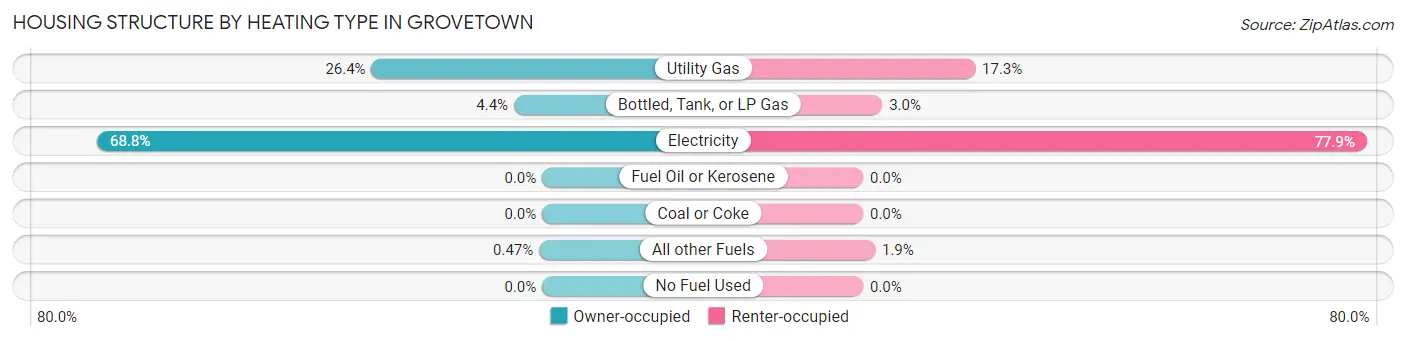
| Heating Type | Owner-occupied | Renter-occupied |
| Utility Gas | 734 (26.4%) | 327 (17.3%) |
| Bottled, Tank, or LP Gas | 121 (4.3%) | 56 (3.0%) |
| Electricity | 1,914 (68.8%) | 1,470 (77.9%) |
| Fuel Oil or Kerosene | 0 (0.0%) | 0 (0.0%) |
| Coal or Coke | 0 (0.0%) | 0 (0.0%) |
| All other Fuels | 13 (0.5%) | 35 (1.8%) |
| No Fuel Used | 0 (0.0%) | 0 (0.0%) |
| Total | 2,782 (100.0%) | 1,888 (100.0%) |
Household Vehicle Usage in Grovetown
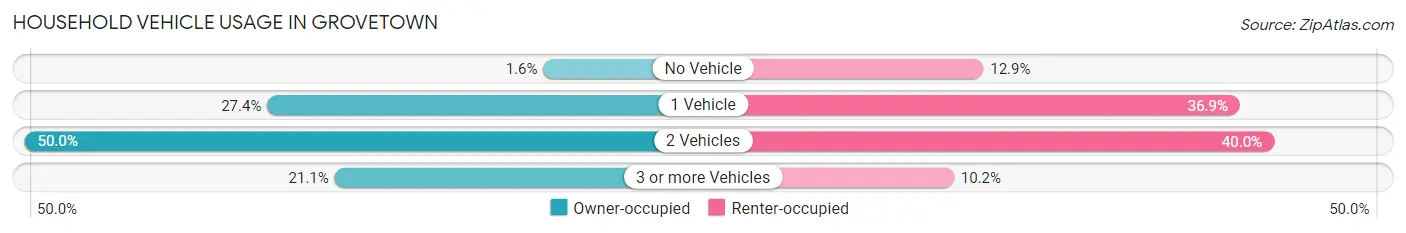
| Vehicles per Household | Owner-occupied | Renter-occupied |
| No Vehicle | 44 (1.6%) | 244 (12.9%) |
| 1 Vehicle | 761 (27.4%) | 696 (36.9%) |
| 2 Vehicles | 1,391 (50.0%) | 756 (40.0%) |
| 3 or more Vehicles | 586 (21.1%) | 192 (10.2%) |
| Total | 2,782 (100.0%) | 1,888 (100.0%) |
Real Estate & Mortgages in Grovetown
Real Estate and Mortgage Overview in Grovetown
| Characteristic | Without Mortgage | With Mortgage |
| Housing Units | 575 | 2,207 |
| Median Property Value | $183,200 | $211,000 |
| Median Household Income | $44,742 | $362 |
| Monthly Housing Costs | $398 | $22 |
| Real Estate Taxes | $1,309 | $102 |
Property Value by Mortgage Status in Grovetown
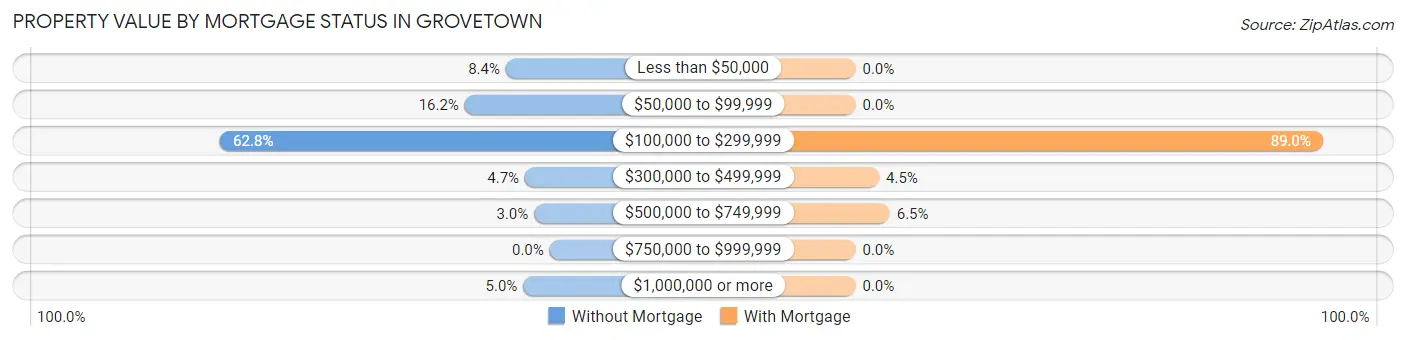
| Property Value | Without Mortgage | With Mortgage |
| Less than $50,000 | 48 (8.4%) | 0 (0.0%) |
| $50,000 to $99,999 | 93 (16.2%) | 0 (0.0%) |
| $100,000 to $299,999 | 361 (62.8%) | 1,964 (89.0%) |
| $300,000 to $499,999 | 27 (4.7%) | 99 (4.5%) |
| $500,000 to $749,999 | 17 (3.0%) | 144 (6.5%) |
| $750,000 to $999,999 | 0 (0.0%) | 0 (0.0%) |
| $1,000,000 or more | 29 (5.0%) | 0 (0.0%) |
| Total | 575 (100.0%) | 2,207 (100.0%) |
Household Income by Mortgage Status in Grovetown
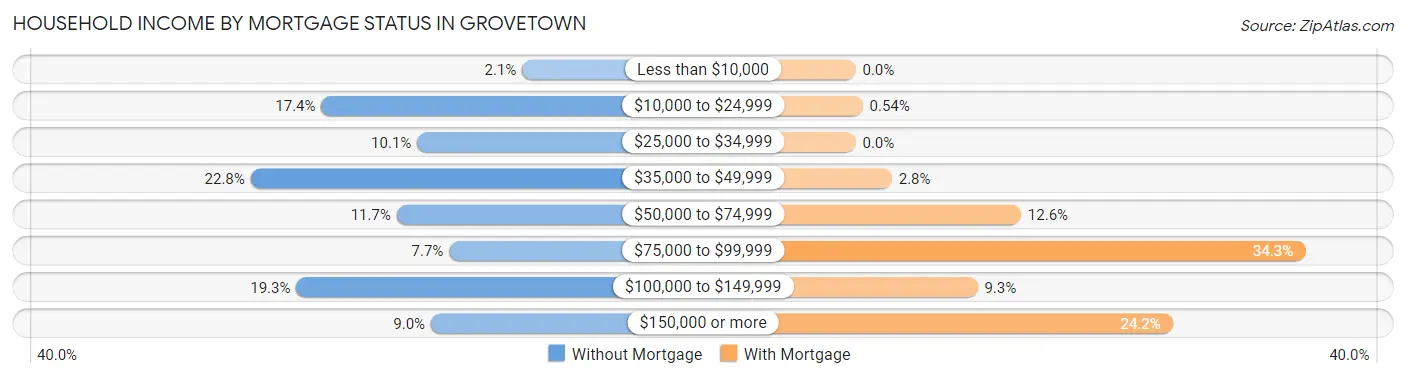
| Household Income | Without Mortgage | With Mortgage |
| Less than $10,000 | 12 (2.1%) | 0 (0.0%) |
| $10,000 to $24,999 | 100 (17.4%) | 12 (0.5%) |
| $25,000 to $34,999 | 58 (10.1%) | 0 (0.0%) |
| $35,000 to $49,999 | 131 (22.8%) | 61 (2.8%) |
| $50,000 to $74,999 | 67 (11.7%) | 278 (12.6%) |
| $75,000 to $99,999 | 44 (7.6%) | 756 (34.3%) |
| $100,000 to $149,999 | 111 (19.3%) | 205 (9.3%) |
| $150,000 or more | 52 (9.0%) | 533 (24.1%) |
| Total | 575 (100.0%) | 2,207 (100.0%) |
Property Value to Household Income Ratio in Grovetown
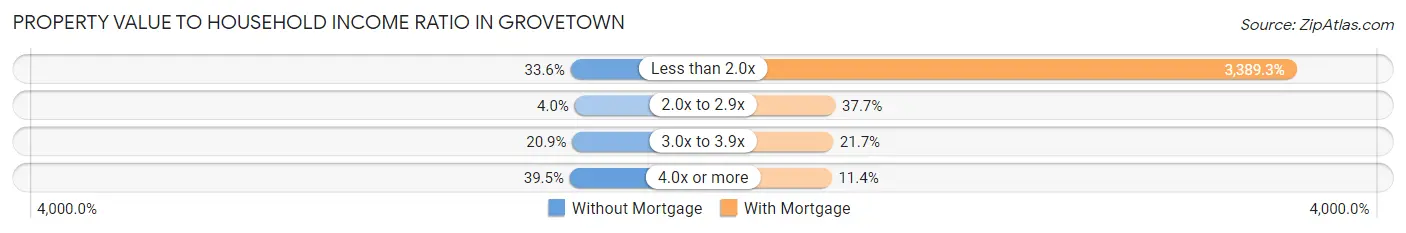
| Value-to-Income Ratio | Without Mortgage | With Mortgage |
| Less than 2.0x | 193 (33.6%) | 74,801 (3,389.3%) |
| 2.0x to 2.9x | 23 (4.0%) | 832 (37.7%) |
| 3.0x to 3.9x | 120 (20.9%) | 479 (21.7%) |
| 4.0x or more | 227 (39.5%) | 251 (11.4%) |
| Total | 575 (100.0%) | 2,207 (100.0%) |
Real Estate Taxes by Mortgage Status in Grovetown
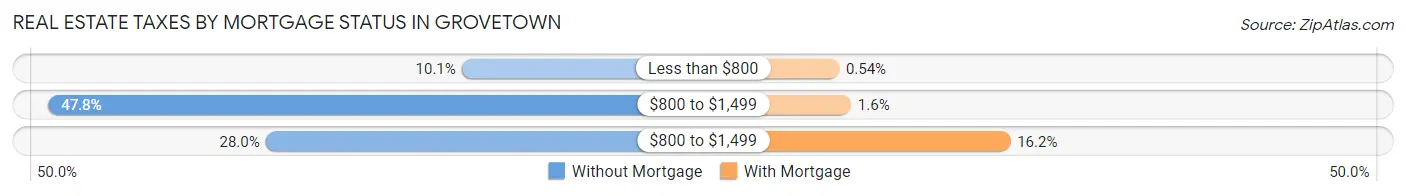
| Property Taxes | Without Mortgage | With Mortgage |
| Less than $800 | 58 (10.1%) | 12 (0.5%) |
| $800 to $1,499 | 275 (47.8%) | 36 (1.6%) |
| $800 to $1,499 | 161 (28.0%) | 357 (16.2%) |
| Total | 575 (100.0%) | 2,207 (100.0%) |
Health & Disability in Grovetown
Health Insurance Coverage by Age in Grovetown
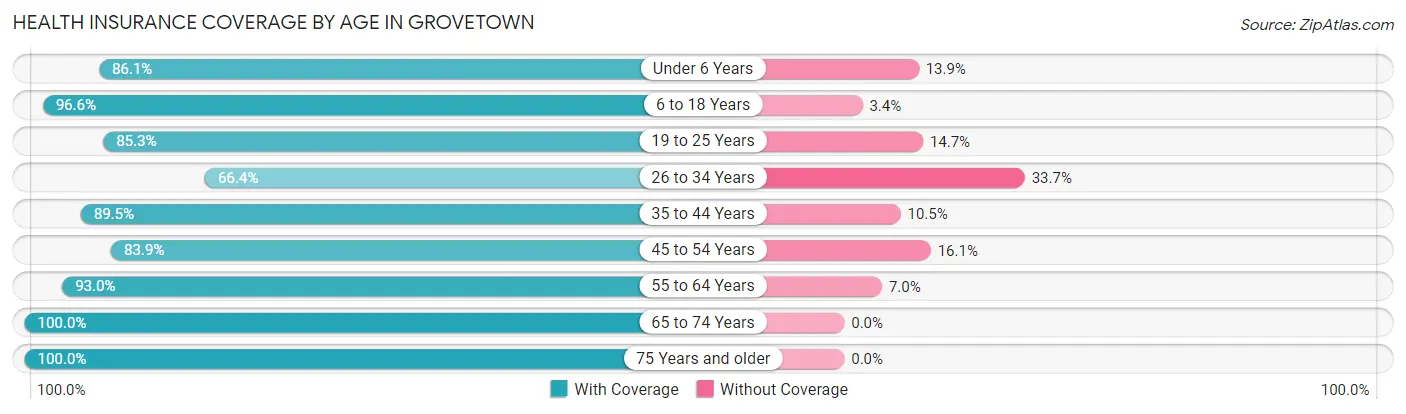
| Age Bracket | With Coverage | Without Coverage |
| Under 6 Years | 1,310 (86.1%) | 211 (13.9%) |
| 6 to 18 Years | 2,397 (96.6%) | 84 (3.4%) |
| 19 to 25 Years | 1,565 (85.3%) | 269 (14.7%) |
| 26 to 34 Years | 1,532 (66.3%) | 777 (33.7%) |
| 35 to 44 Years | 2,448 (89.5%) | 287 (10.5%) |
| 45 to 54 Years | 1,639 (83.9%) | 315 (16.1%) |
| 55 to 64 Years | 967 (93.0%) | 73 (7.0%) |
| 65 to 74 Years | 1,088 (100.0%) | 0 (0.0%) |
| 75 Years and older | 400 (100.0%) | 0 (0.0%) |
| Total | 13,346 (86.9%) | 2,016 (13.1%) |
Health Insurance Coverage by Citizenship Status in Grovetown
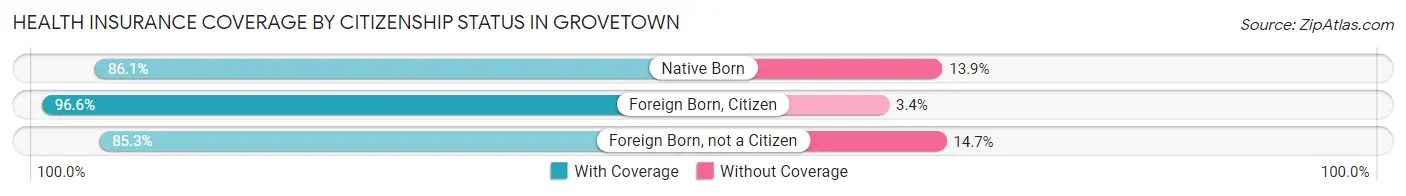
| Citizenship Status | With Coverage | Without Coverage |
| Native Born | 1,310 (86.1%) | 211 (13.9%) |
| Foreign Born, Citizen | 2,397 (96.6%) | 84 (3.4%) |
| Foreign Born, not a Citizen | 1,565 (85.3%) | 269 (14.7%) |
Health Insurance Coverage by Household Income in Grovetown
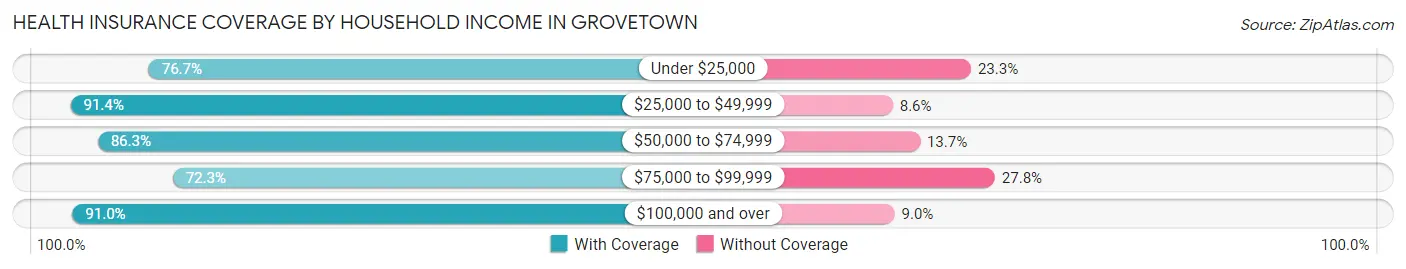
| Household Income | With Coverage | Without Coverage |
| Under $25,000 | 943 (76.7%) | 286 (23.3%) |
| $25,000 to $49,999 | 1,558 (91.4%) | 147 (8.6%) |
| $50,000 to $74,999 | 3,620 (86.3%) | 575 (13.7%) |
| $75,000 to $99,999 | 1,039 (72.3%) | 399 (27.8%) |
| $100,000 and over | 6,186 (91.0%) | 609 (9.0%) |
Public vs Private Health Insurance Coverage by Age in Grovetown
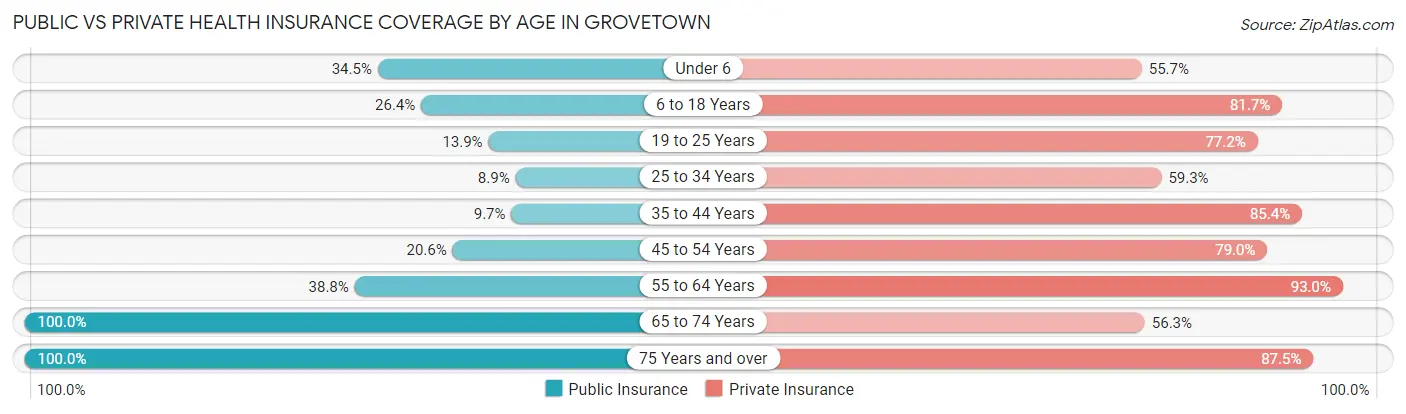
| Age Bracket | Public Insurance | Private Insurance |
| Under 6 | 524 (34.4%) | 847 (55.7%) |
| 6 to 18 Years | 655 (26.4%) | 2,027 (81.7%) |
| 19 to 25 Years | 255 (13.9%) | 1,415 (77.1%) |
| 25 to 34 Years | 205 (8.9%) | 1,370 (59.3%) |
| 35 to 44 Years | 264 (9.7%) | 2,336 (85.4%) |
| 45 to 54 Years | 402 (20.6%) | 1,543 (79.0%) |
| 55 to 64 Years | 403 (38.8%) | 967 (93.0%) |
| 65 to 74 Years | 1,088 (100.0%) | 612 (56.2%) |
| 75 Years and over | 400 (100.0%) | 350 (87.5%) |
| Total | 4,196 (27.3%) | 11,467 (74.7%) |
Disability Status by Sex by Age in Grovetown
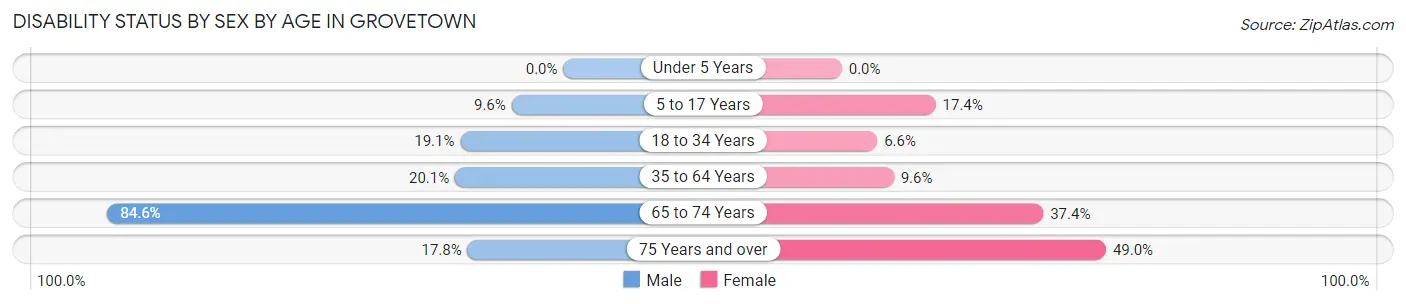
| Age Bracket | Male | Female |
| Under 5 Years | 0 (0.0%) | 0 (0.0%) |
| 5 to 17 Years | 106 (9.6%) | 246 (17.4%) |
| 18 to 34 Years | 401 (19.1%) | 150 (6.6%) |
| 35 to 64 Years | 559 (20.1%) | 284 (9.6%) |
| 65 to 74 Years | 253 (84.6%) | 295 (37.4%) |
| 75 Years and over | 16 (17.8%) | 152 (49.0%) |
Disability Class by Sex by Age in Grovetown
Disability Class: Hearing Difficulty
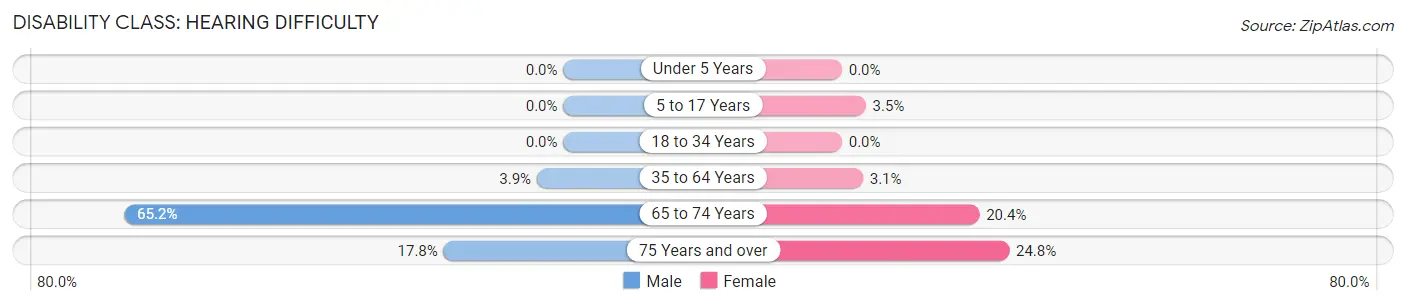
| Age Bracket | Male | Female |
| Under 5 Years | 0 (0.0%) | 0 (0.0%) |
| 5 to 17 Years | 0 (0.0%) | 50 (3.5%) |
| 18 to 34 Years | 0 (0.0%) | 0 (0.0%) |
| 35 to 64 Years | 109 (3.9%) | 92 (3.1%) |
| 65 to 74 Years | 195 (65.2%) | 161 (20.4%) |
| 75 Years and over | 16 (17.8%) | 77 (24.8%) |
Disability Class: Vision Difficulty
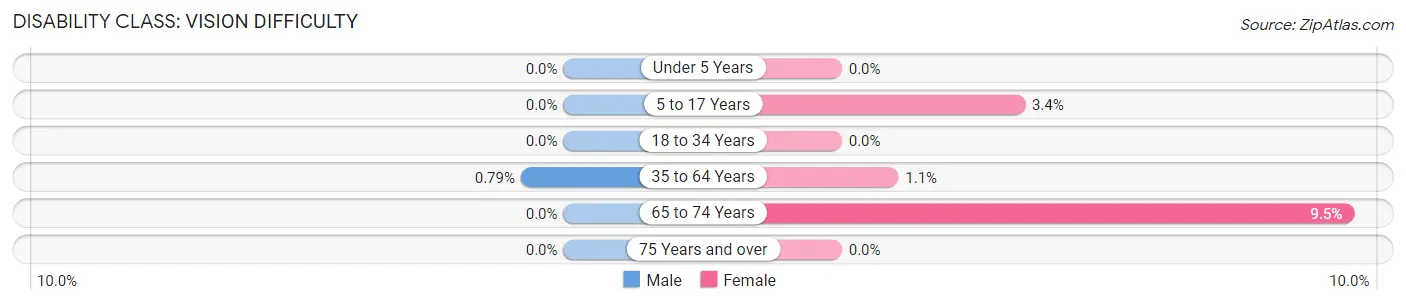
| Age Bracket | Male | Female |
| Under 5 Years | 0 (0.0%) | 0 (0.0%) |
| 5 to 17 Years | 0 (0.0%) | 48 (3.4%) |
| 18 to 34 Years | 0 (0.0%) | 0 (0.0%) |
| 35 to 64 Years | 22 (0.8%) | 31 (1.1%) |
| 65 to 74 Years | 0 (0.0%) | 75 (9.5%) |
| 75 Years and over | 0 (0.0%) | 0 (0.0%) |
Disability Class: Cognitive Difficulty
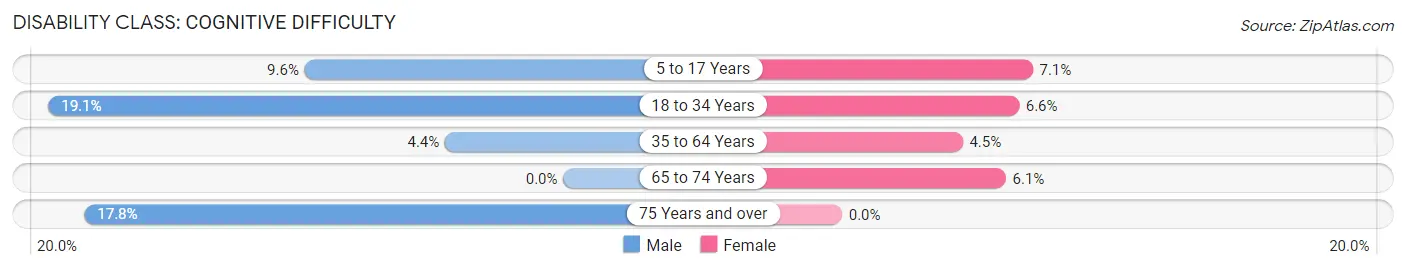
| Age Bracket | Male | Female |
| 5 to 17 Years | 106 (9.6%) | 100 (7.1%) |
| 18 to 34 Years | 401 (19.1%) | 150 (6.6%) |
| 35 to 64 Years | 122 (4.4%) | 132 (4.5%) |
| 65 to 74 Years | 0 (0.0%) | 48 (6.1%) |
| 75 Years and over | 16 (17.8%) | 0 (0.0%) |
Disability Class: Ambulatory Difficulty
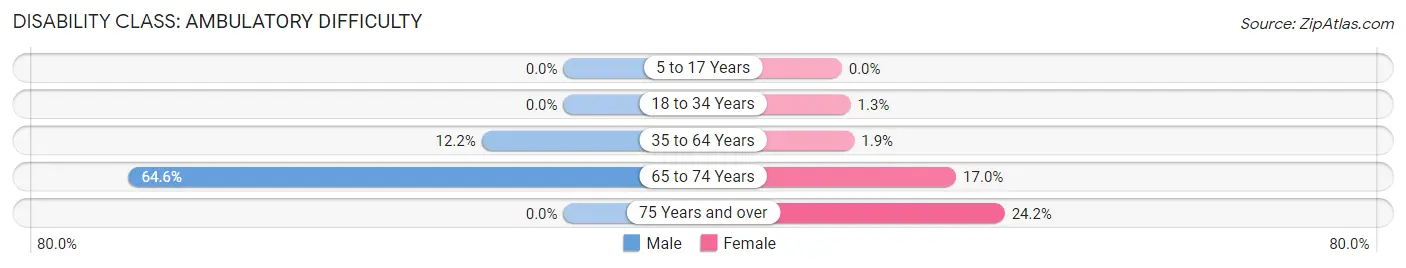
| Age Bracket | Male | Female |
| 5 to 17 Years | 0 (0.0%) | 0 (0.0%) |
| 18 to 34 Years | 0 (0.0%) | 30 (1.3%) |
| 35 to 64 Years | 338 (12.1%) | 55 (1.9%) |
| 65 to 74 Years | 193 (64.5%) | 134 (17.0%) |
| 75 Years and over | 0 (0.0%) | 75 (24.2%) |
Disability Class: Self-Care Difficulty
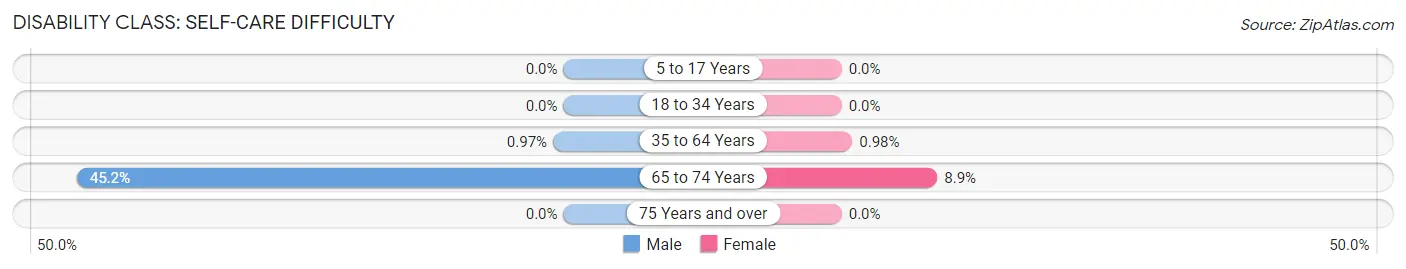
| Age Bracket | Male | Female |
| 5 to 17 Years | 0 (0.0%) | 0 (0.0%) |
| 18 to 34 Years | 0 (0.0%) | 0 (0.0%) |
| 35 to 64 Years | 27 (1.0%) | 29 (1.0%) |
| 65 to 74 Years | 135 (45.2%) | 70 (8.9%) |
| 75 Years and over | 0 (0.0%) | 0 (0.0%) |
Technology Access in Grovetown
Computing Device Access in Grovetown
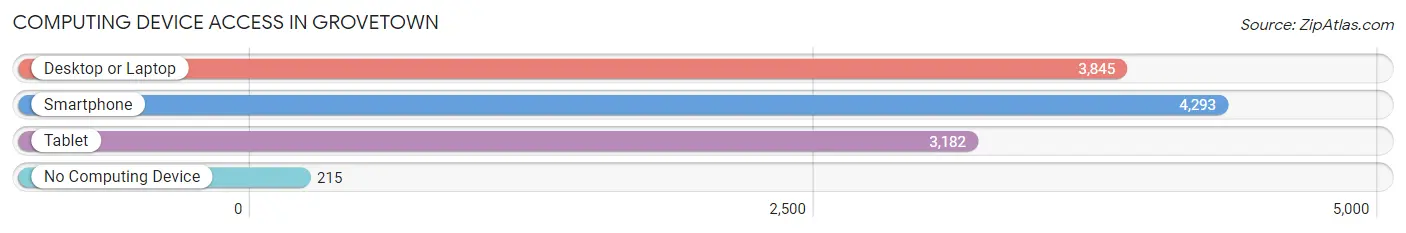
| Device Type | # Households | % Households |
| Desktop or Laptop | 3,845 | 82.3% |
| Smartphone | 4,293 | 91.9% |
| Tablet | 3,182 | 68.1% |
| No Computing Device | 215 | 4.6% |
| Total | 4,670 | 100.0% |
Internet Access in Grovetown
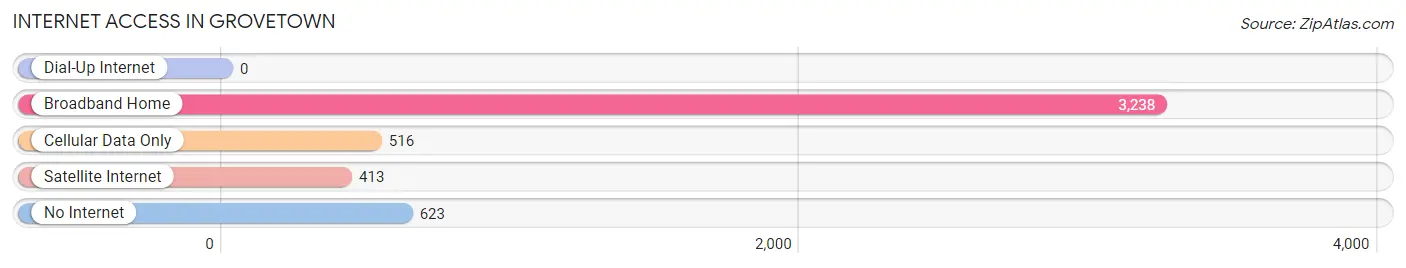
| Internet Type | # Households | % Households |
| Dial-Up Internet | 0 | 0.0% |
| Broadband Home | 3,238 | 69.3% |
| Cellular Data Only | 516 | 11.1% |
| Satellite Internet | 413 | 8.8% |
| No Internet | 623 | 13.3% |
| Total | 4,670 | 100.0% |
Grovetown Summary
Grovetown is a city located in Columbia County, Georgia, United States. It is part of the Augusta-Richmond County Metropolitan Statistical Area. As of the 2010 census, the city had a population of 11,216.
History
The area that is now Grovetown was first settled in the early 1800s. The city was originally known as “Grovetown Station” and was a stop on the Georgia Railroad. The city was officially incorporated in 1892 and was named after the grove of trees that surrounded the railroad station.
In the early 1900s, Grovetown was a small farming community. The city began to grow in the 1950s when the Fort Gordon military base was established nearby. The city experienced a population boom in the 1970s and 1980s as the military base continued to expand.
Geography
Grovetown is located in central Columbia County at 33°27'25" North, 82°14'45" West (33.4569, -82.2458). It is bordered to the north by the city of Harlem, to the east by Fort Gordon, to the south by Appling, and to the west by Evans.
The city is located in the Piedmont region of Georgia and is situated on the Savannah River. The city has a total area of 11.2 square miles, of which 11.1 square miles is land and 0.1 square miles is water.
Economy
The economy of Grovetown is largely driven by the military base at Fort Gordon. The base is home to the U.S. Army Cyber Center of Excellence and the U.S. Army Signal Corps. The base also provides a large number of jobs in the area.
In addition to the military base, Grovetown is home to a number of businesses and industries. The city is home to several manufacturing companies, including a paper mill, a plastics plant, and a food processing plant. The city is also home to a number of retail stores, restaurants, and other businesses.
Demographics
As of the 2010 census, there were 11,216 people, 3,845 households, and 2,945 families residing in the city. The population density was 1,011.2 people per square mile. The racial makeup of the city was 68.2% White, 24.2% African American, 0.5% Native American, 2.2% Asian, 0.1% Pacific Islander, 2.2% from other races, and 2.7% from two or more races. Hispanic or Latino of any race were 5.2% of the population.
The median income for a household in the city was $50,945, and the median income for a family was $58,945. The per capita income for the city was $22,945. About 8.2% of families and 10.2% of the population were below the poverty line, including 14.2% of those under age 18 and 8.2% of those age 65 or over.
Common Questions
What is Per Capita Income in Grovetown?
Per Capita income in Grovetown is $30,984.
What is the Median Family Income in Grovetown?
Median Family Income in Grovetown is $78,185.
What is the Median Household income in Grovetown?
Median Household Income in Grovetown is $67,222.
What is Income or Wage Gap in Grovetown?
Income or Wage Gap in Grovetown is 7.6%.
Women in Grovetown earn 92.4 cents for every dollar earned by a man.
What is Inequality or Gini Index in Grovetown?
Inequality or Gini Index in Grovetown is 0.36.
What is the Total Population of Grovetown?
Total Population of Grovetown is 16,049.
What is the Total Male Population of Grovetown?
Total Male Population of Grovetown is 7,647.
What is the Total Female Population of Grovetown?
Total Female Population of Grovetown is 8,402.
What is the Ratio of Males per 100 Females in Grovetown?
There are 91.01 Males per 100 Females in Grovetown.
What is the Ratio of Females per 100 Males in Grovetown?
There are 109.87 Females per 100 Males in Grovetown.
What is the Median Population Age in Grovetown?
Median Population Age in Grovetown is 33.0 Years.
What is the Average Family Size in Grovetown
Average Family Size in Grovetown is 4.1 People.
What is the Average Household Size in Grovetown
Average Household Size in Grovetown is 3.4 People.
How Large is the Labor Force in Grovetown?
There are 9,208 People in the Labor Forcein in Grovetown.
What is the Percentage of People in the Labor Force in Grovetown?
72.4% of People are in the Labor Force in Grovetown.
What is the Unemployment Rate in Grovetown?
Unemployment Rate in Grovetown is 0.9%.