Kennedale, TX Map & Demographics
Kennedale Map
Kennedale Overview
$44,483
PER CAPITA INCOME
$119,141
AVG FAMILY INCOME
$112,646
AVG HOUSEHOLD INCOME
40.3%
WAGE / INCOME GAP [ % ]
59.7¢/ $1
WAGE / INCOME GAP [ $ ]
0.41
INEQUALITY / GINI INDEX
8,590
TOTAL POPULATION
4,597
MALE POPULATION
3,993
FEMALE POPULATION
115.13
MALES / 100 FEMALES
86.86
FEMALES / 100 MALES
42.7
MEDIAN AGE
3.4
AVG FAMILY SIZE
2.9
AVG HOUSEHOLD SIZE
4,953
LABOR FORCE [ PEOPLE ]
71.6%
PERCENT IN LABOR FORCE
4.7%
UNEMPLOYMENT RATE
Kennedale Zip Codes
Income in Kennedale
Income Overview in Kennedale
Per Capita Income in Kennedale is $44,483, while median incomes of families and households are $119,141 and $112,646 respectively.
| Characteristic | Number | Measure |
| Per Capita Income | 8,590 | $44,483 |
| Median Family Income | 2,267 | $119,141 |
| Mean Family Income | 2,267 | $143,053 |
| Median Household Income | 2,896 | $112,646 |
| Mean Household Income | 2,896 | $127,940 |
| Income Deficit | 2,267 | $0 |
| Wage / Income Gap (%) | 8,590 | 40.34% |
| Wage / Income Gap ($) | 8,590 | 59.66¢ per $1 |
| Gini / Inequality Index | 8,590 | 0.41 |
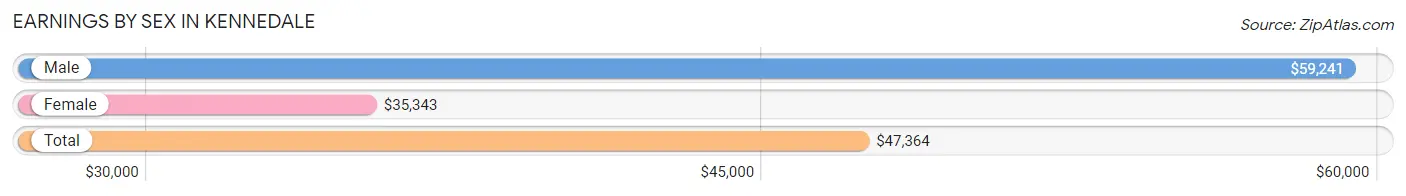
Earnings by Sex in Kennedale
Average Earnings in Kennedale are $47,364, $59,241 for men and $35,343 for women, a difference of 40.3%.
| Sex | Number | Average Earnings |
| Male | 2,934 (56.6%) | $59,241 |
| Female | 2,251 (43.4%) | $35,343 |
| Total | 5,185 (100.0%) | $47,364 |
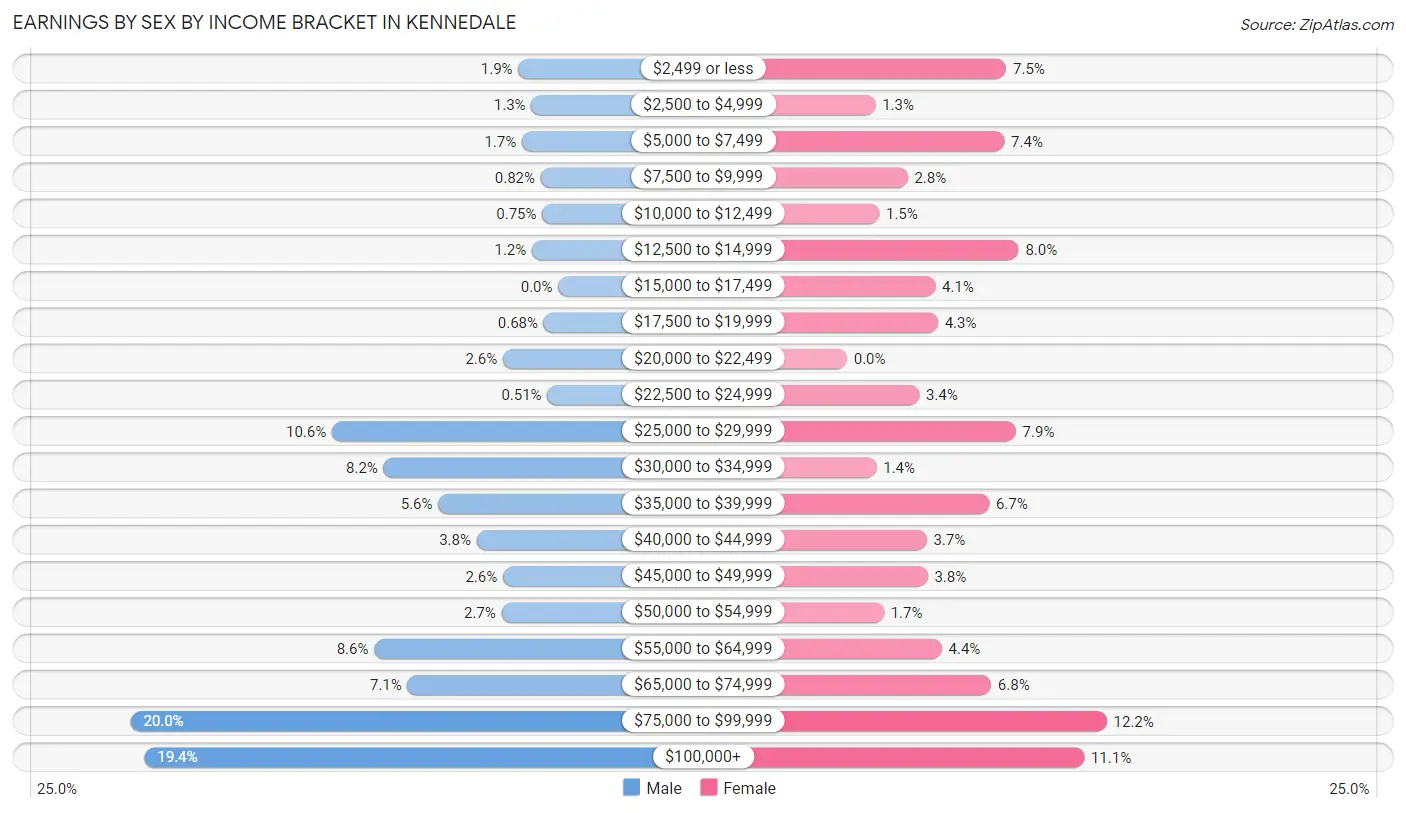
Earnings by Sex by Income Bracket in Kennedale
The most common earnings brackets in Kennedale are $75,000 to $99,999 for men (588 | 20.0%) and $75,000 to $99,999 for women (274 | 12.2%).
| Income | Male | Female |
| $2,499 or less | 55 (1.9%) | 168 (7.5%) |
| $2,500 to $4,999 | 37 (1.3%) | 30 (1.3%) |
| $5,000 to $7,499 | 50 (1.7%) | 166 (7.4%) |
| $7,500 to $9,999 | 24 (0.8%) | 64 (2.8%) |
| $10,000 to $12,499 | 22 (0.7%) | 34 (1.5%) |
| $12,500 to $14,999 | 36 (1.2%) | 181 (8.0%) |
| $15,000 to $17,499 | 0 (0.0%) | 93 (4.1%) |
| $17,500 to $19,999 | 20 (0.7%) | 96 (4.3%) |
| $20,000 to $22,499 | 76 (2.6%) | 0 (0.0%) |
| $22,500 to $24,999 | 15 (0.5%) | 76 (3.4%) |
| $25,000 to $29,999 | 311 (10.6%) | 178 (7.9%) |
| $30,000 to $34,999 | 240 (8.2%) | 31 (1.4%) |
| $35,000 to $39,999 | 165 (5.6%) | 150 (6.7%) |
| $40,000 to $44,999 | 112 (3.8%) | 84 (3.7%) |
| $45,000 to $49,999 | 76 (2.6%) | 85 (3.8%) |
| $50,000 to $54,999 | 78 (2.7%) | 39 (1.7%) |
| $55,000 to $64,999 | 253 (8.6%) | 100 (4.4%) |
| $65,000 to $74,999 | 207 (7.1%) | 152 (6.8%) |
| $75,000 to $99,999 | 588 (20.0%) | 274 (12.2%) |
| $100,000+ | 569 (19.4%) | 250 (11.1%) |
| Total | 2,934 (100.0%) | 2,251 (100.0%) |
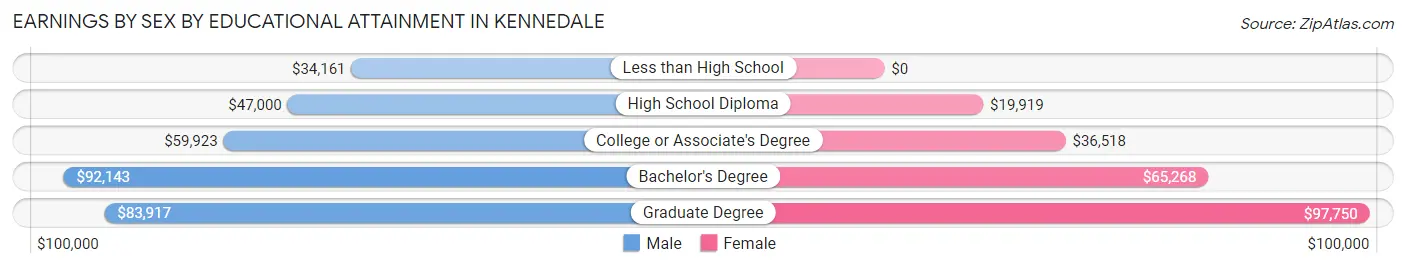
Earnings by Sex by Educational Attainment in Kennedale
Average earnings in Kennedale are $67,686 for men and $38,651 for women, a difference of 42.9%. Men with an educational attainment of bachelor's degree enjoy the highest average annual earnings of $92,143, while those with less than high school education earn the least with $34,161. Women with an educational attainment of graduate degree earn the most with the average annual earnings of $97,750, while those with high school diploma education have the smallest earnings of $19,919.
| Educational Attainment | Male Income | Female Income |
| Less than High School | $34,161 | $0 |
| High School Diploma | $47,000 | $19,919 |
| College or Associate's Degree | $59,923 | $36,518 |
| Bachelor's Degree | $92,143 | $65,268 |
| Graduate Degree | $83,917 | $97,750 |
| Total | $67,686 | $38,651 |
Family Income in Kennedale
Family Income Brackets in Kennedale
According to the Kennedale family income data, there are 655 families falling into the $100,000 to $149,999 income range, which is the most common income bracket and makes up 28.9% of all families.
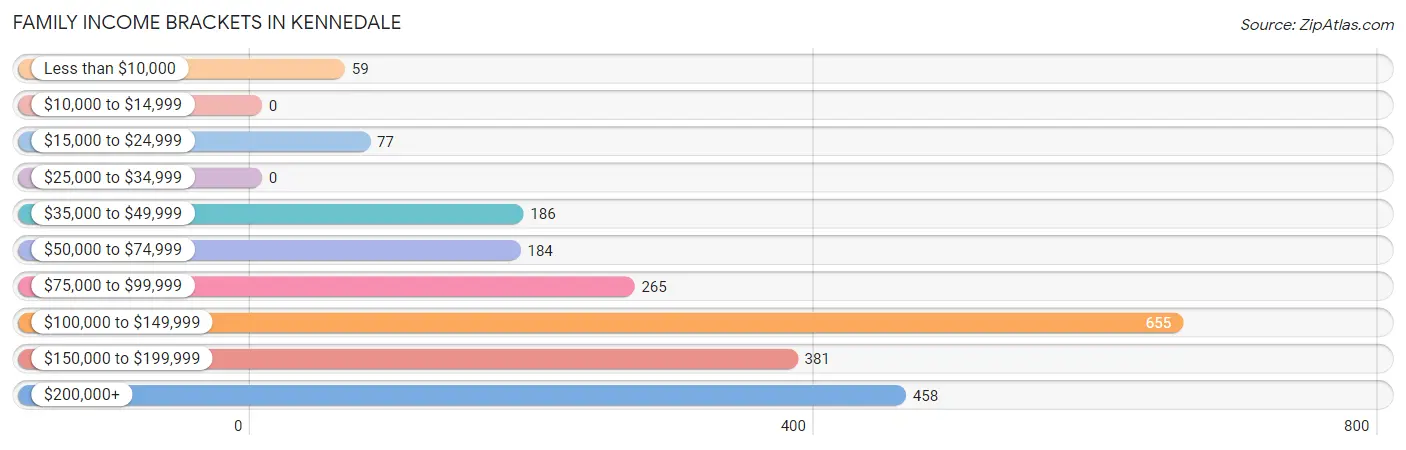
| Income Bracket | # Families | % Families |
| Less than $10,000 | 59 | 2.6% |
| $10,000 to $14,999 | 0 | 0.0% |
| $15,000 to $24,999 | 77 | 3.4% |
| $25,000 to $34,999 | 0 | 0.0% |
| $35,000 to $49,999 | 186 | 8.2% |
| $50,000 to $74,999 | 184 | 8.1% |
| $75,000 to $99,999 | 265 | 11.7% |
| $100,000 to $149,999 | 655 | 28.9% |
| $150,000 to $199,999 | 381 | 16.8% |
| $200,000+ | 458 | 20.2% |
Family Income by Famaliy Size in Kennedale
4-person families (292 | 12.9%) account for the highest median family income in Kennedale with $221,707 per family, while 2-person families (928 | 40.9%) have the highest median income of $56,389 per family member.
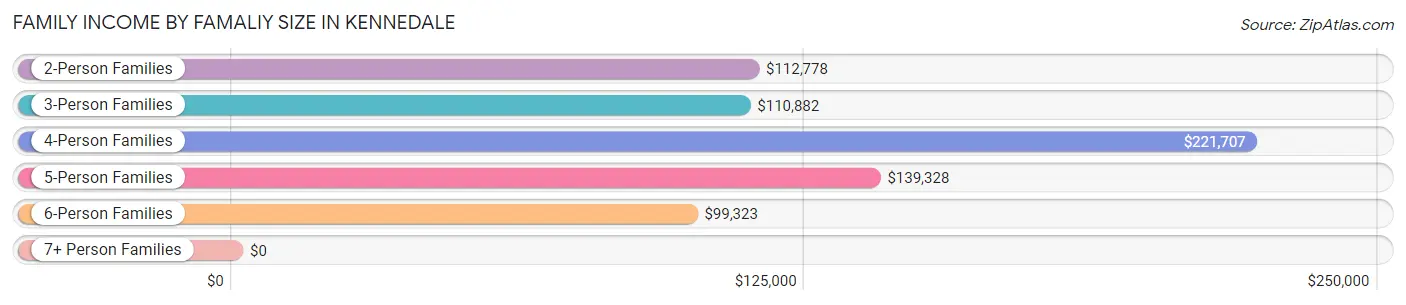
| Income Bracket | # Families | Median Income |
| 2-Person Families | 928 (40.9%) | $112,778 |
| 3-Person Families | 560 (24.7%) | $110,882 |
| 4-Person Families | 292 (12.9%) | $221,707 |
| 5-Person Families | 364 (16.1%) | $139,328 |
| 6-Person Families | 98 (4.3%) | $99,323 |
| 7+ Person Families | 25 (1.1%) | $0 |
| Total | 2,267 (100.0%) | $119,141 |
Family Income by Number of Earners in Kennedale
The median family income in Kennedale is $119,141, with families comprising 2 earners (1,153) having the highest median family income of $150,699, while families with no earners (194) have the lowest median family income of $53,000, accounting for 50.9% and 8.6% of families, respectively.
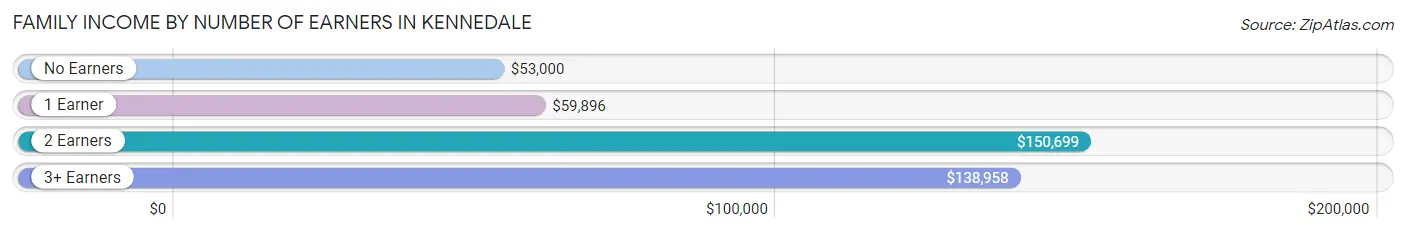
| Number of Earners | # Families | Median Income |
| No Earners | 194 (8.6%) | $53,000 |
| 1 Earner | 418 (18.4%) | $59,896 |
| 2 Earners | 1,153 (50.9%) | $150,699 |
| 3+ Earners | 502 (22.1%) | $138,958 |
| Total | 2,267 (100.0%) | $119,141 |
Household Income in Kennedale
Household Income Brackets in Kennedale
With 756 households falling in the category, the $100,000 to $149,999 income range is the most frequent in Kennedale, accounting for 26.1% of all households. In contrast, only 26 households (0.9%) fall into the $25,000 to $34,999 income bracket, making it the least populous group.
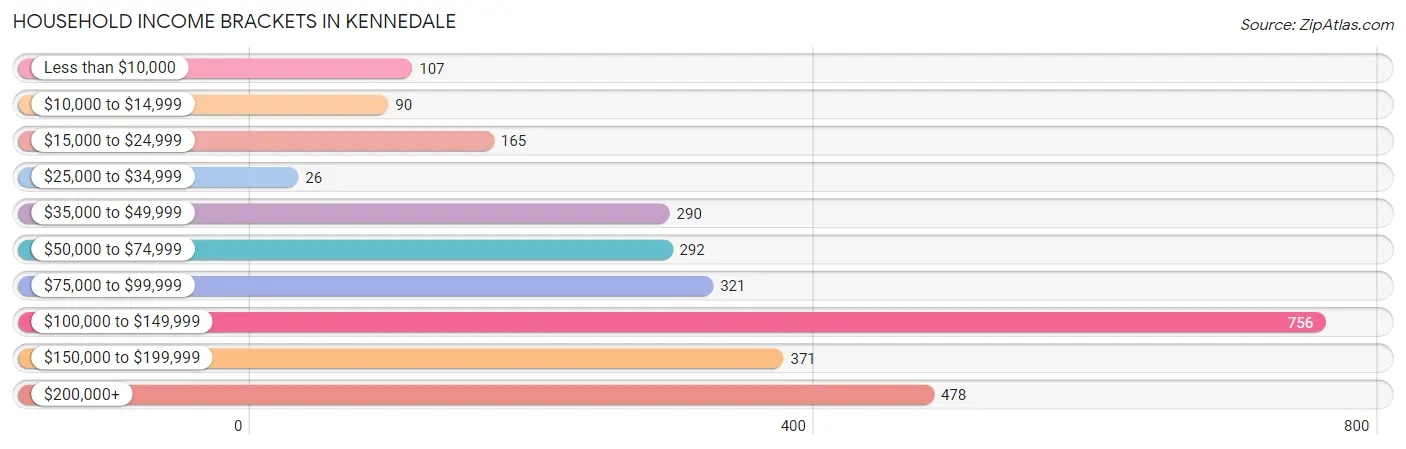
| Income Bracket | # Households | % Households |
| Less than $10,000 | 107 | 3.7% |
| $10,000 to $14,999 | 90 | 3.1% |
| $15,000 to $24,999 | 165 | 5.7% |
| $25,000 to $34,999 | 26 | 0.9% |
| $35,000 to $49,999 | 290 | 10.0% |
| $50,000 to $74,999 | 292 | 10.1% |
| $75,000 to $99,999 | 321 | 11.1% |
| $100,000 to $149,999 | 756 | 26.1% |
| $150,000 to $199,999 | 371 | 12.8% |
| $200,000+ | 478 | 16.5% |
Household Income by Householder Age in Kennedale
The median household income in Kennedale is $112,646, with the highest median household income of $118,490 found in the 25 to 44 years age bracket for the primary householder. A total of 743 households (25.7%) fall into this category. Meanwhile, the 15 to 24 years age bracket for the primary householder has the lowest median household income of $0, with 17 households (0.6%) in this group.
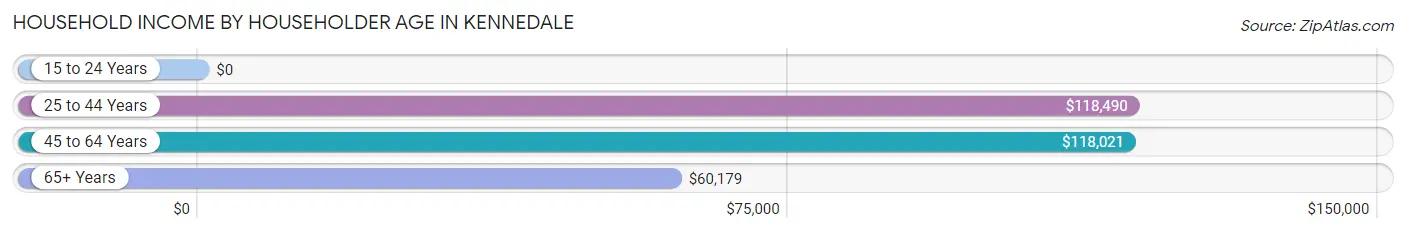
| Income Bracket | # Households | Median Income |
| 15 to 24 Years | 17 (0.6%) | $0 |
| 25 to 44 Years | 743 (25.7%) | $118,490 |
| 45 to 64 Years | 1,490 (51.4%) | $118,021 |
| 65+ Years | 646 (22.3%) | $60,179 |
| Total | 2,896 (100.0%) | $112,646 |
Poverty in Kennedale
Income Below Poverty by Sex and Age in Kennedale
With 4.5% poverty level for males and 8.5% for females among the residents of Kennedale, 6 to 11 year old males and 75 year old and over females are the most vulnerable to poverty, with 64 males (16.9%) and 74 females (27.1%) in their respective age groups living below the poverty level.
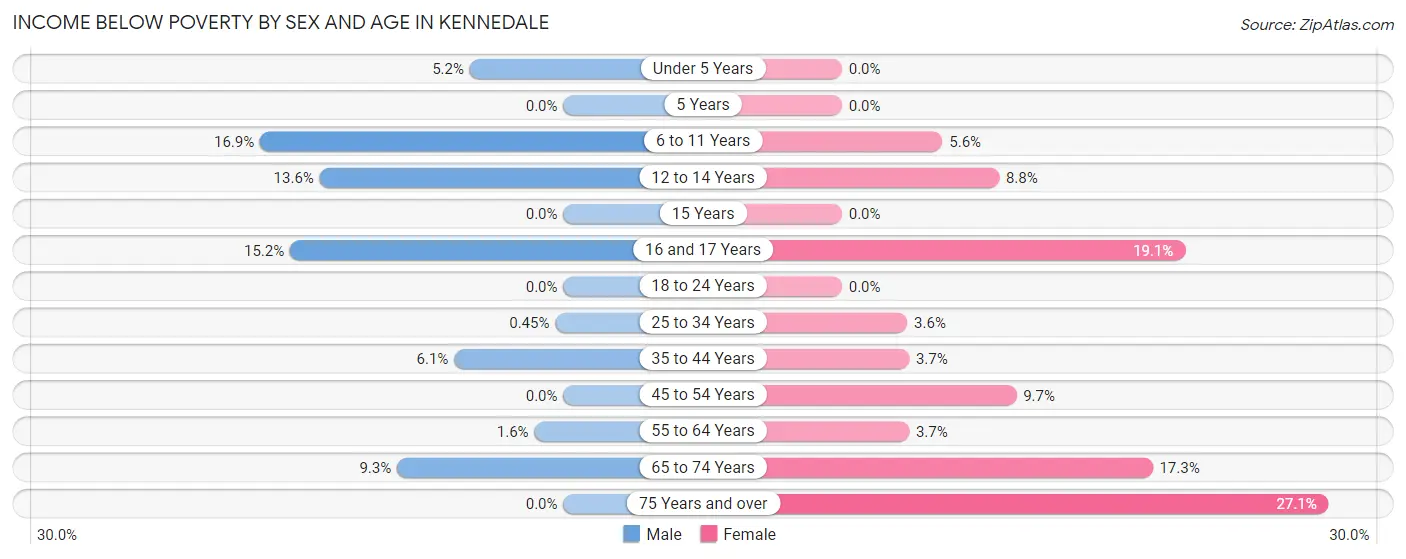
| Age Bracket | Male | Female |
| Under 5 Years | 15 (5.2%) | 0 (0.0%) |
| 5 Years | 0 (0.0%) | 0 (0.0%) |
| 6 to 11 Years | 64 (16.9%) | 13 (5.6%) |
| 12 to 14 Years | 35 (13.6%) | 26 (8.7%) |
| 15 Years | 0 (0.0%) | 0 (0.0%) |
| 16 and 17 Years | 7 (15.2%) | 26 (19.1%) |
| 18 to 24 Years | 0 (0.0%) | 0 (0.0%) |
| 25 to 34 Years | 3 (0.4%) | 15 (3.6%) |
| 35 to 44 Years | 32 (6.1%) | 18 (3.7%) |
| 45 to 54 Years | 0 (0.0%) | 70 (9.7%) |
| 55 to 64 Years | 10 (1.6%) | 22 (3.7%) |
| 65 to 74 Years | 41 (9.3%) | 73 (17.3%) |
| 75 Years and over | 0 (0.0%) | 74 (27.1%) |
| Total | 207 (4.5%) | 337 (8.5%) |
Income Above Poverty by Sex and Age in Kennedale
According to the poverty statistics in Kennedale, males aged 18 to 24 years and females aged under 5 years are the age groups that are most secure financially, with 100.0% of males and 100.0% of females in these age groups living above the poverty line.
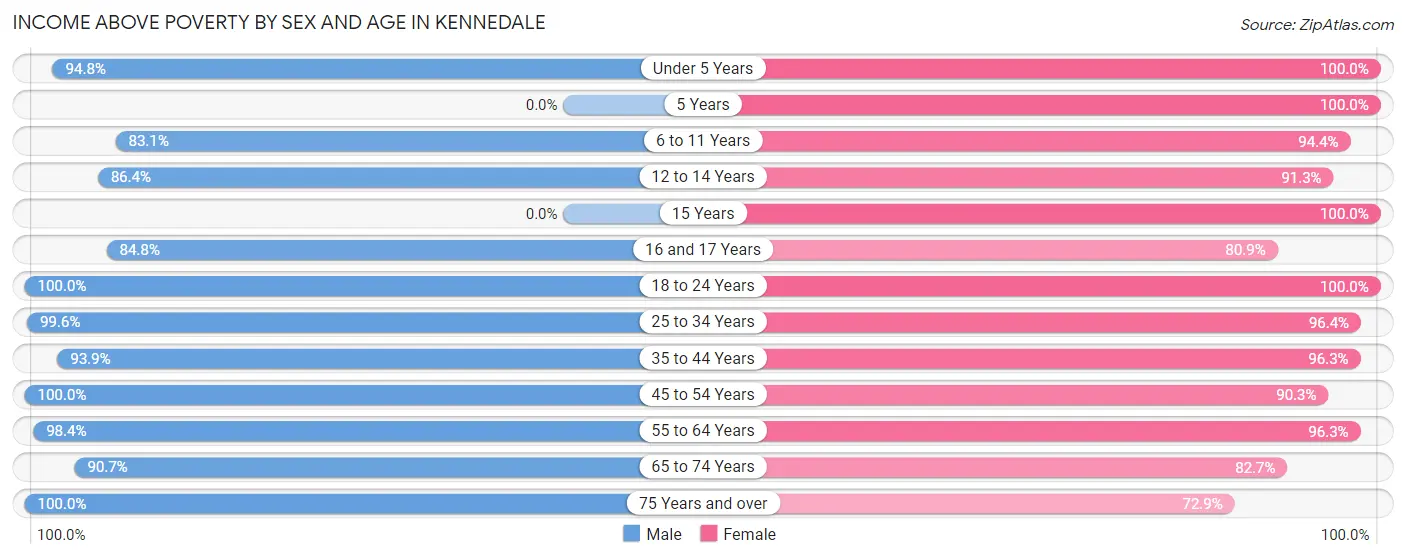
| Age Bracket | Male | Female |
| Under 5 Years | 273 (94.8%) | 143 (100.0%) |
| 5 Years | 0 (0.0%) | 29 (100.0%) |
| 6 to 11 Years | 315 (83.1%) | 219 (94.4%) |
| 12 to 14 Years | 223 (86.4%) | 271 (91.2%) |
| 15 Years | 0 (0.0%) | 47 (100.0%) |
| 16 and 17 Years | 39 (84.8%) | 110 (80.9%) |
| 18 to 24 Years | 433 (100.0%) | 178 (100.0%) |
| 25 to 34 Years | 670 (99.6%) | 397 (96.4%) |
| 35 to 44 Years | 494 (93.9%) | 463 (96.3%) |
| 45 to 54 Years | 688 (100.0%) | 651 (90.3%) |
| 55 to 64 Years | 612 (98.4%) | 566 (96.3%) |
| 65 to 74 Years | 402 (90.7%) | 349 (82.7%) |
| 75 Years and over | 223 (100.0%) | 199 (72.9%) |
| Total | 4,372 (95.5%) | 3,622 (91.5%) |
Income Below Poverty Among Married-Couple Families in Kennedale
The poverty statistics for married-couple families in Kennedale show that 1.5% or 27 of the total 1,761 families live below the poverty line. Families with 3 or 4 children have the highest poverty rate of 9.0%, comprising of 27 families. On the other hand, families with no children have the lowest poverty rate of 0.0%, which includes 0 families.
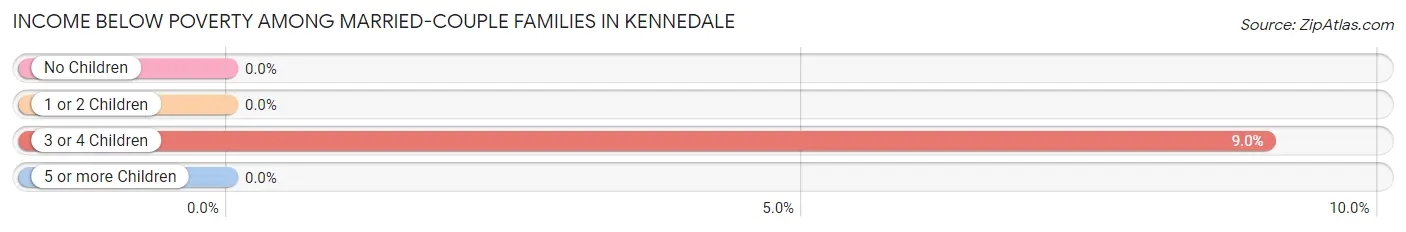
| Children | Above Poverty | Below Poverty |
| No Children | 1,032 (100.0%) | 0 (0.0%) |
| 1 or 2 Children | 430 (100.0%) | 0 (0.0%) |
| 3 or 4 Children | 272 (91.0%) | 27 (9.0%) |
| 5 or more Children | 0 (0.0%) | 0 (0.0%) |
| Total | 1,734 (98.5%) | 27 (1.5%) |
Income Below Poverty Among Single-Parent Households in Kennedale
According to the poverty data in Kennedale, 9.8% or 23 single-father households and 24.1% or 65 single-mother households are living below the poverty line. Among single-father households, those with 1 or 2 children have the highest poverty rate, with 23 households (100.0%) experiencing poverty. Likewise, among single-mother households, those with 1 or 2 children have the highest poverty rate, with 65 households (35.5%) falling below the poverty line.
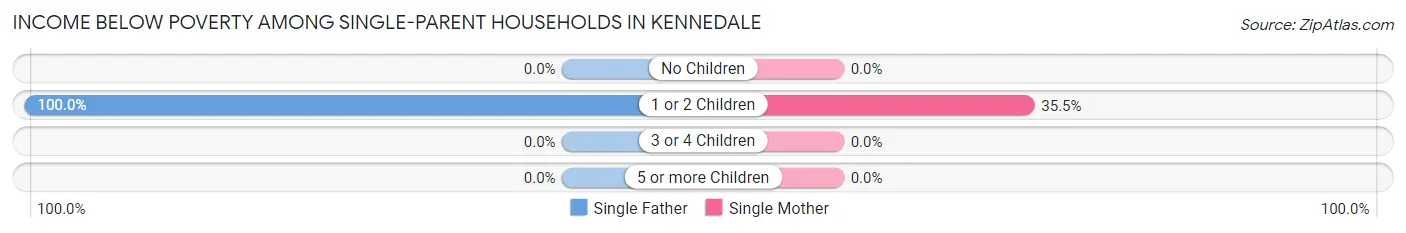
| Children | Single Father | Single Mother |
| No Children | 0 (0.0%) | 0 (0.0%) |
| 1 or 2 Children | 23 (100.0%) | 65 (35.5%) |
| 3 or 4 Children | 0 (0.0%) | 0 (0.0%) |
| 5 or more Children | 0 (0.0%) | 0 (0.0%) |
| Total | 23 (9.8%) | 65 (24.1%) |
Income Below Poverty Among Married-Couple vs Single-Parent Households in Kennedale
The poverty data for Kennedale shows that 27 of the married-couple family households (1.5%) and 88 of the single-parent households (17.4%) are living below the poverty level. Within the married-couple family households, those with 3 or 4 children have the highest poverty rate, with 27 households (9.0%) falling below the poverty line. Among the single-parent households, those with 1 or 2 children have the highest poverty rate, with 88 household (42.7%) living below poverty.
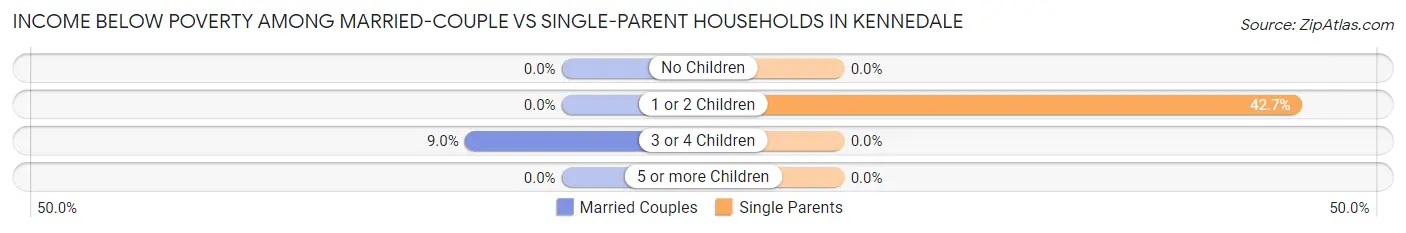
| Children | Married-Couple Families | Single-Parent Households |
| No Children | 0 (0.0%) | 0 (0.0%) |
| 1 or 2 Children | 0 (0.0%) | 88 (42.7%) |
| 3 or 4 Children | 27 (9.0%) | 0 (0.0%) |
| 5 or more Children | 0 (0.0%) | 0 (0.0%) |
| Total | 27 (1.5%) | 88 (17.4%) |
Race in Kennedale
The most populous races in Kennedale are White / Caucasian (5,743 | 66.9%), Hispanic or Latino (1,678 | 19.5%), and Black / African American (1,158 | 13.5%).
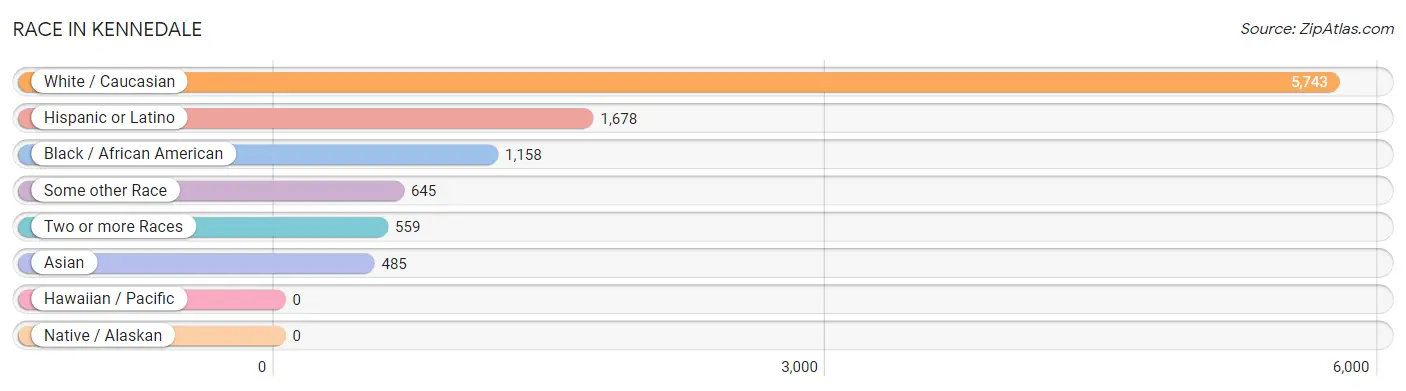
| Race | # Population | % Population |
| Asian | 485 | 5.7% |
| Black / African American | 1,158 | 13.5% |
| Hawaiian / Pacific | 0 | 0.0% |
| Hispanic or Latino | 1,678 | 19.5% |
| Native / Alaskan | 0 | 0.0% |
| White / Caucasian | 5,743 | 66.9% |
| Two or more Races | 559 | 6.5% |
| Some other Race | 645 | 7.5% |
| Total | 8,590 | 100.0% |
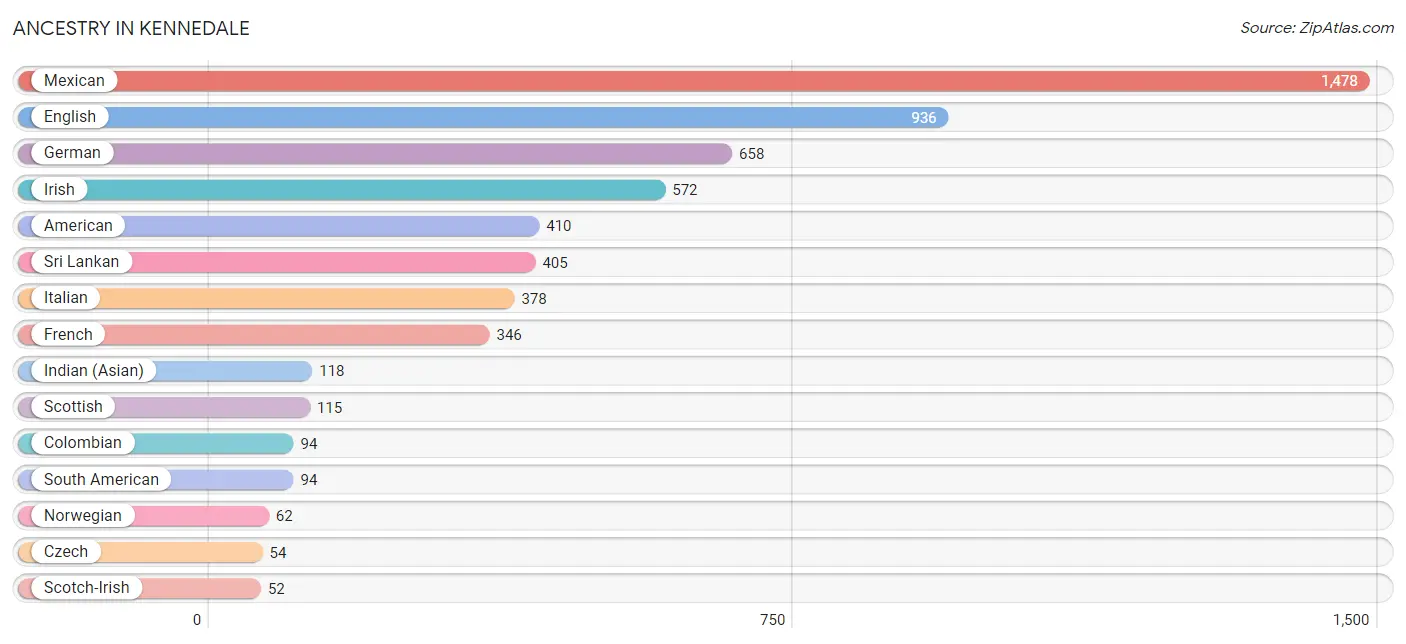
Ancestry in Kennedale
The most populous ancestries reported in Kennedale are Mexican (1,478 | 17.2%), English (936 | 10.9%), German (658 | 7.7%), Irish (572 | 6.7%), and American (410 | 4.8%), together accounting for 47.2% of all Kennedale residents.
| Ancestry | # Population | % Population |
| American | 410 | 4.8% |
| Arab | 13 | 0.2% |
| Austrian | 23 | 0.3% |
| British | 28 | 0.3% |
| Central American | 45 | 0.5% |
| Cherokee | 16 | 0.2% |
| Choctaw | 22 | 0.3% |
| Colombian | 94 | 1.1% |
| Creek | 9 | 0.1% |
| Cuban | 35 | 0.4% |
| Czech | 54 | 0.6% |
| Dutch | 46 | 0.5% |
| English | 936 | 10.9% |
| European | 31 | 0.4% |
| French | 346 | 4.0% |
| French Canadian | 21 | 0.2% |
| German | 658 | 7.7% |
| Greek | 44 | 0.5% |
| Hungarian | 15 | 0.2% |
| Indian (Asian) | 118 | 1.4% |
| Iranian | 14 | 0.2% |
| Irish | 572 | 6.7% |
| Iroquois | 3 | 0.0% |
| Italian | 378 | 4.4% |
| Jamaican | 14 | 0.2% |
| Jordanian | 13 | 0.2% |
| Korean | 36 | 0.4% |
| Mexican | 1,478 | 17.2% |
| Native Hawaiian | 39 | 0.4% |
| Norwegian | 62 | 0.7% |
| Polish | 45 | 0.5% |
| Portuguese | 48 | 0.6% |
| Puerto Rican | 26 | 0.3% |
| Russian | 24 | 0.3% |
| Salvadoran | 45 | 0.5% |
| Samoan | 39 | 0.4% |
| Scandinavian | 20 | 0.2% |
| Scotch-Irish | 52 | 0.6% |
| Scottish | 115 | 1.3% |
| South American | 94 | 1.1% |
| Sri Lankan | 405 | 4.7% |
| Swedish | 13 | 0.2% |
| Swiss | 3 | 0.0% |
| Thai | 27 | 0.3% |
| Trinidadian and Tobagonian | 14 | 0.2% |
| Ukrainian | 47 | 0.5% |
| Welsh | 20 | 0.2% | View All 47 Rows |
Immigrants in Kennedale
The most numerous immigrant groups reported in Kennedale came from Latin America (560 | 6.5%), Central America (497 | 5.8%), Mexico (497 | 5.8%), Asia (307 | 3.6%), and South Eastern Asia (272 | 3.2%), together accounting for 24.8% of all Kennedale residents.
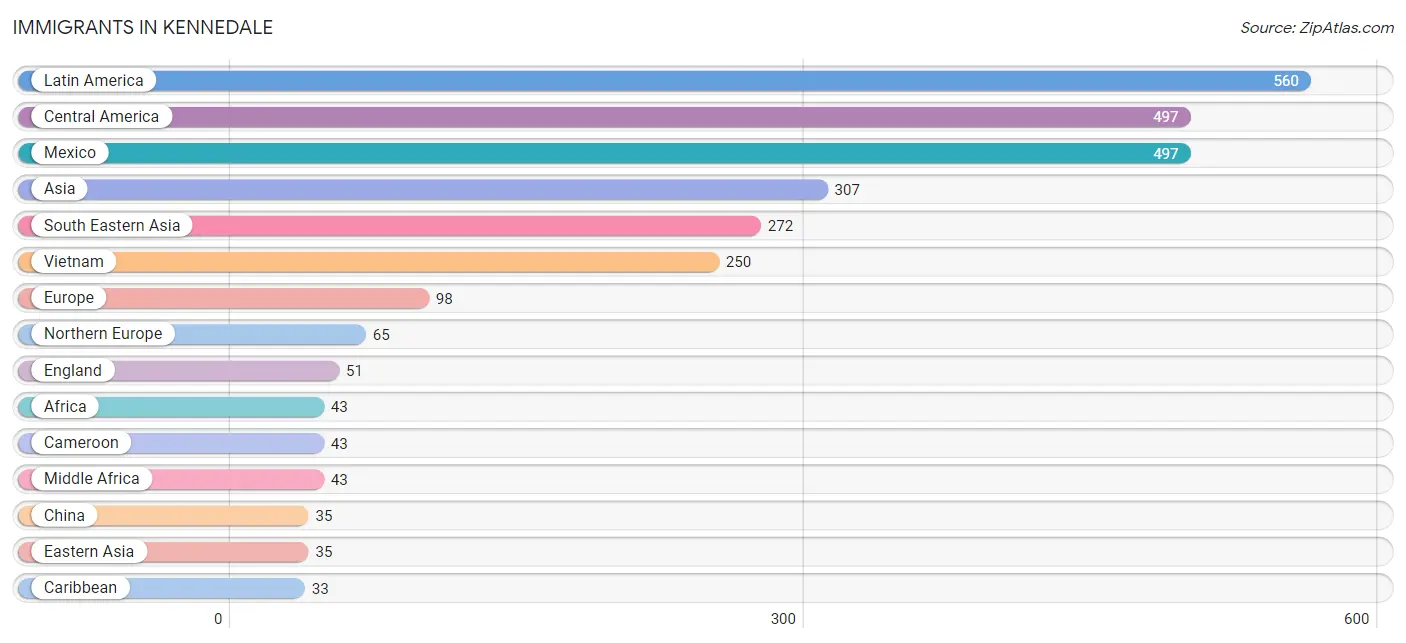
| Immigration Origin | # Population | % Population |
| Africa | 43 | 0.5% |
| Asia | 307 | 3.6% |
| Cameroon | 43 | 0.5% |
| Caribbean | 33 | 0.4% |
| Central America | 497 | 5.8% |
| China | 35 | 0.4% |
| Colombia | 30 | 0.4% |
| Cuba | 19 | 0.2% |
| Eastern Asia | 35 | 0.4% |
| Eastern Europe | 24 | 0.3% |
| England | 51 | 0.6% |
| Europe | 98 | 1.1% |
| Italy | 9 | 0.1% |
| Latin America | 560 | 6.5% |
| Mexico | 497 | 5.8% |
| Middle Africa | 43 | 0.5% |
| Northern Europe | 65 | 0.8% |
| Norway | 14 | 0.2% |
| Oceania | 7 | 0.1% |
| Philippines | 22 | 0.3% |
| Russia | 24 | 0.3% |
| South America | 30 | 0.4% |
| South Eastern Asia | 272 | 3.2% |
| Southern Europe | 9 | 0.1% |
| Trinidad and Tobago | 14 | 0.2% |
| Vietnam | 250 | 2.9% | View All 26 Rows |
Sex and Age in Kennedale
Sex and Age in Kennedale
The most populous age groups in Kennedale are 25 to 29 Years (403 | 8.8%) for men and 45 to 49 Years (435 | 10.9%) for women.
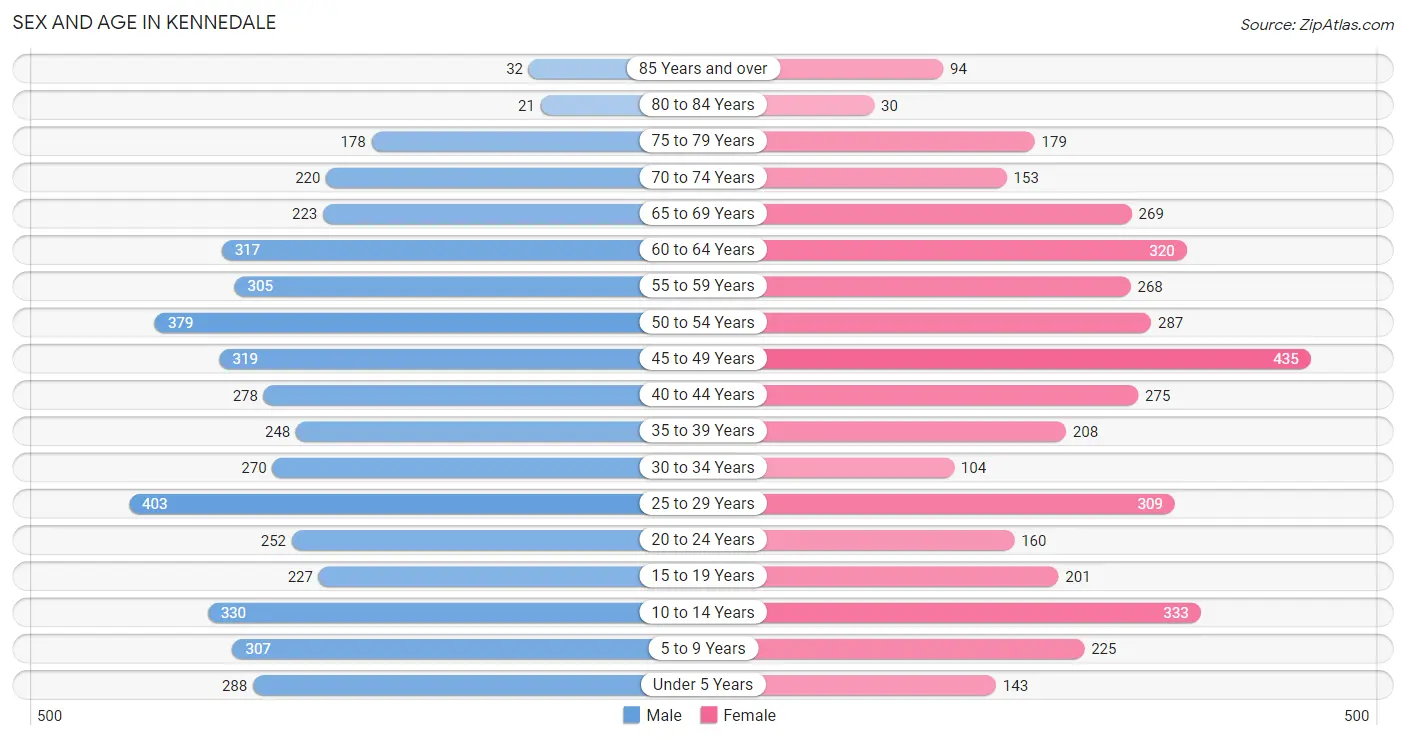
| Age Bracket | Male | Female |
| Under 5 Years | 288 (6.3%) | 143 (3.6%) |
| 5 to 9 Years | 307 (6.7%) | 225 (5.6%) |
| 10 to 14 Years | 330 (7.2%) | 333 (8.3%) |
| 15 to 19 Years | 227 (4.9%) | 201 (5.0%) |
| 20 to 24 Years | 252 (5.5%) | 160 (4.0%) |
| 25 to 29 Years | 403 (8.8%) | 309 (7.7%) |
| 30 to 34 Years | 270 (5.9%) | 104 (2.6%) |
| 35 to 39 Years | 248 (5.4%) | 208 (5.2%) |
| 40 to 44 Years | 278 (6.0%) | 275 (6.9%) |
| 45 to 49 Years | 319 (6.9%) | 435 (10.9%) |
| 50 to 54 Years | 379 (8.2%) | 287 (7.2%) |
| 55 to 59 Years | 305 (6.6%) | 268 (6.7%) |
| 60 to 64 Years | 317 (6.9%) | 320 (8.0%) |
| 65 to 69 Years | 223 (4.9%) | 269 (6.7%) |
| 70 to 74 Years | 220 (4.8%) | 153 (3.8%) |
| 75 to 79 Years | 178 (3.9%) | 179 (4.5%) |
| 80 to 84 Years | 21 (0.5%) | 30 (0.7%) |
| 85 Years and over | 32 (0.7%) | 94 (2.4%) |
| Total | 4,597 (100.0%) | 3,993 (100.0%) |
Families and Households in Kennedale
Median Family Size in Kennedale
The median family size in Kennedale is 3.39 persons per family, with married-couple families (1,761 | 77.7%) accounting for the largest median family size of 3.59 persons per family. On the other hand, single male/father families (236 | 10.4%) represent the smallest median family size with 2.64 persons per family.
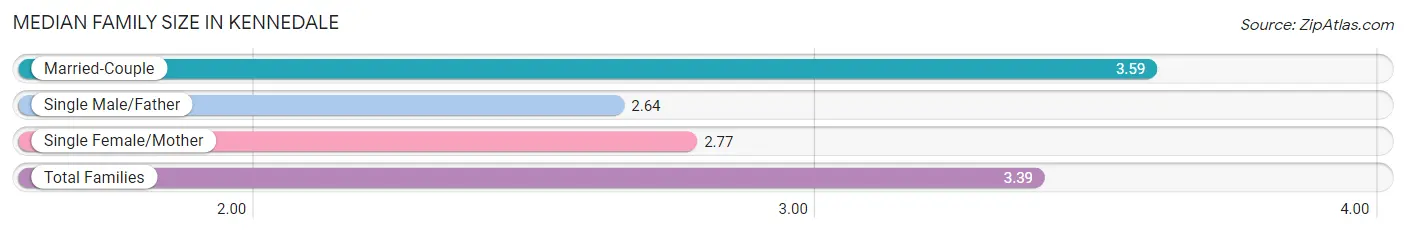
| Family Type | # Families | Family Size |
| Married-Couple | 1,761 (77.7%) | 3.59 |
| Single Male/Father | 236 (10.4%) | 2.64 |
| Single Female/Mother | 270 (11.9%) | 2.77 |
| Total Families | 2,267 (100.0%) | 3.39 |
Median Household Size in Kennedale
The median household size in Kennedale is 2.94 persons per household, with married-couple households (1,761 | 60.8%) accounting for the largest median household size of 3.59 persons per household. non-family households (629 | 21.7%) represent the smallest median household size with 1.21 persons per household.
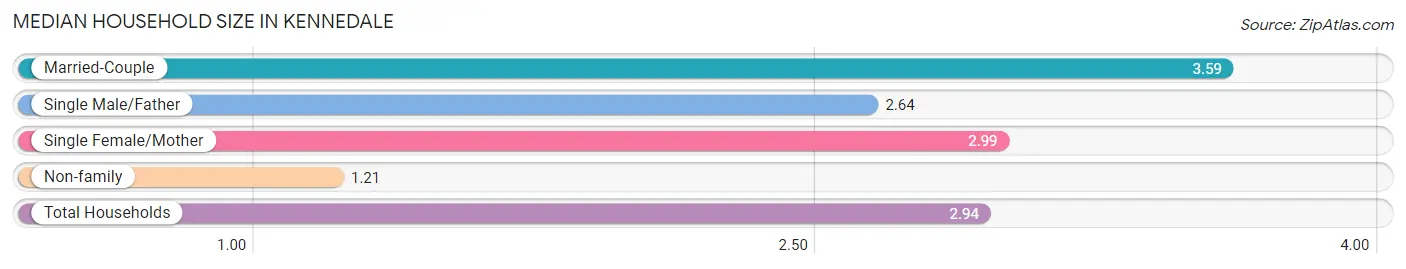
| Household Type | # Households | Household Size |
| Married-Couple | 1,761 (60.8%) | 3.59 |
| Single Male/Father | 236 (8.2%) | 2.64 |
| Single Female/Mother | 270 (9.3%) | 2.99 |
| Non-family | 629 (21.7%) | 1.21 |
| Total Households | 2,896 (100.0%) | 2.94 |
Household Size by Marriage Status in Kennedale
Out of a total of 2,896 households in Kennedale, 2,267 (78.3%) are family households, while 629 (21.7%) are nonfamily households. The most numerous type of family households are 2-person households, comprising 928, and the most common type of nonfamily households are 1-person households, comprising 508.
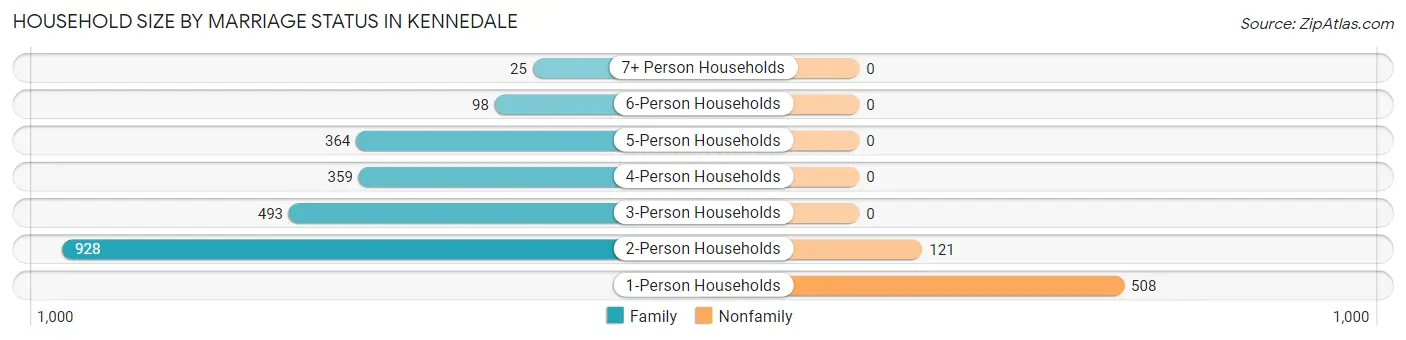
| Household Size | Family Households | Nonfamily Households |
| 1-Person Households | - | 508 (17.5%) |
| 2-Person Households | 928 (32.0%) | 121 (4.2%) |
| 3-Person Households | 493 (17.0%) | 0 (0.0%) |
| 4-Person Households | 359 (12.4%) | 0 (0.0%) |
| 5-Person Households | 364 (12.6%) | 0 (0.0%) |
| 6-Person Households | 98 (3.4%) | 0 (0.0%) |
| 7+ Person Households | 25 (0.9%) | 0 (0.0%) |
| Total | 2,267 (78.3%) | 629 (21.7%) |
Female Fertility in Kennedale
Fertility by Age in Kennedale
Average fertility rate in Kennedale is 43.0 births per 1,000 women. Women in the age bracket of 20 to 34 years have the highest fertility rate with 115.0 births per 1,000 women. Women in the age bracket of 20 to 34 years acount for 86.8% of all women with births.
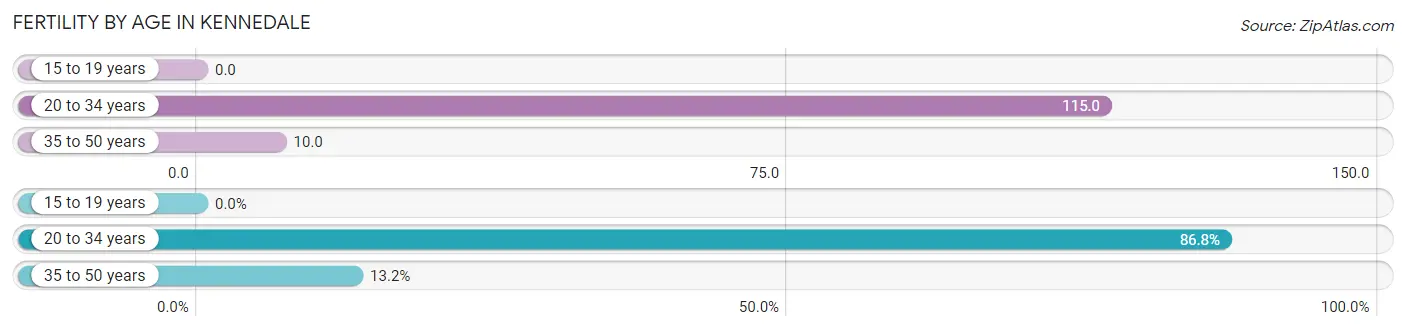
| Age Bracket | Women with Births | Births / 1,000 Women |
| 15 to 19 years | 0 (0.0%) | 0.0 |
| 20 to 34 years | 66 (86.8%) | 115.0 |
| 35 to 50 years | 10 (13.2%) | 10.0 |
| Total | 76 (100.0%) | 43.0 |
Fertility by Age by Marriage Status in Kennedale
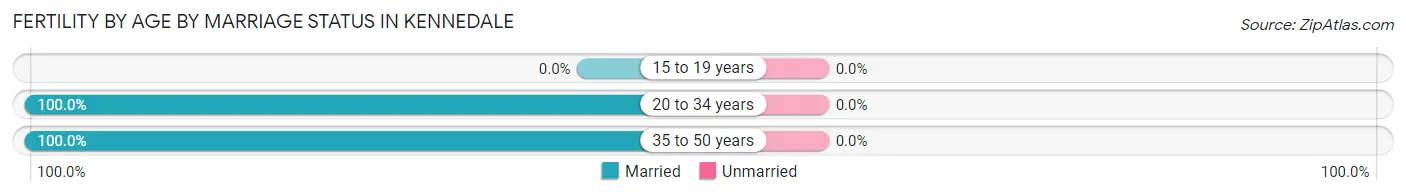
| Age Bracket | Married | Unmarried |
| 15 to 19 years | 0 (0.0%) | 0 (0.0%) |
| 20 to 34 years | 66 (100.0%) | 0 (0.0%) |
| 35 to 50 years | 10 (100.0%) | 0 (0.0%) |
| Total | 76 (100.0%) | 0 (0.0%) |
Fertility by Education in Kennedale
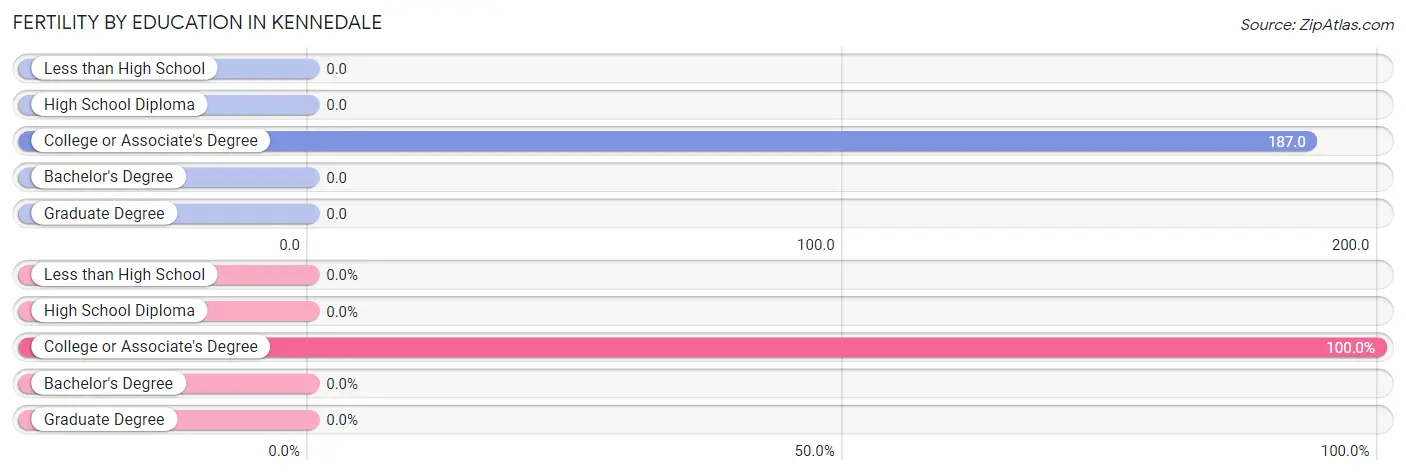
| Educational Attainment | Women with Births | Births / 1,000 Women |
| Less than High School | 0 (0.0%) | 0.0 |
| High School Diploma | 0 (0.0%) | 0.0 |
| College or Associate's Degree | 76 (100.0%) | 187.0 |
| Bachelor's Degree | 0 (0.0%) | 0.0 |
| Graduate Degree | 0 (0.0%) | 0.0 |
| Total | 76 (100.0%) | 43.0 |
Fertility by Education by Marriage Status in Kennedale
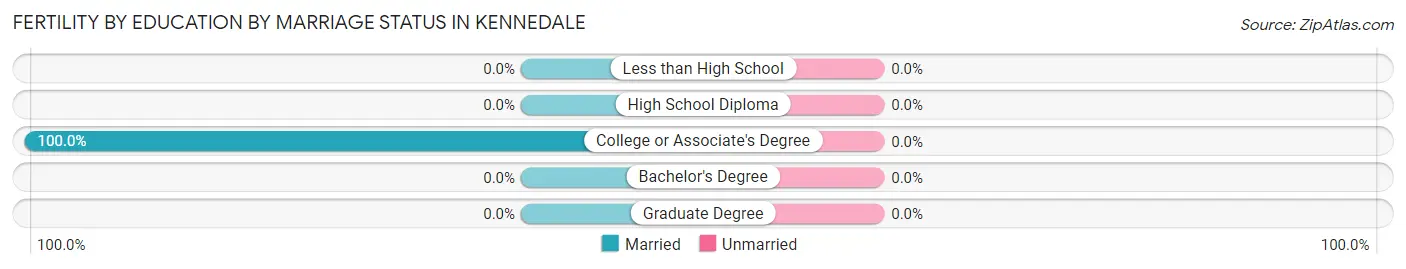
| Educational Attainment | Married | Unmarried |
| Less than High School | 0 (0.0%) | 0 (0.0%) |
| High School Diploma | 0 (0.0%) | 0 (0.0%) |
| College or Associate's Degree | 76 (100.0%) | 0 (0.0%) |
| Bachelor's Degree | 0 (0.0%) | 0 (0.0%) |
| Graduate Degree | 0 (0.0%) | 0 (0.0%) |
| Total | 76 (100.0%) | 0 (0.0%) |
Employment Characteristics in Kennedale
Employment by Class of Employer in Kennedale
Among the 4,627 employed individuals in Kennedale, private company employees (2,901 | 62.7%), local government employees (511 | 11.0%), and not-for-profit organizations (341 | 7.4%) make up the most common classes of employment.
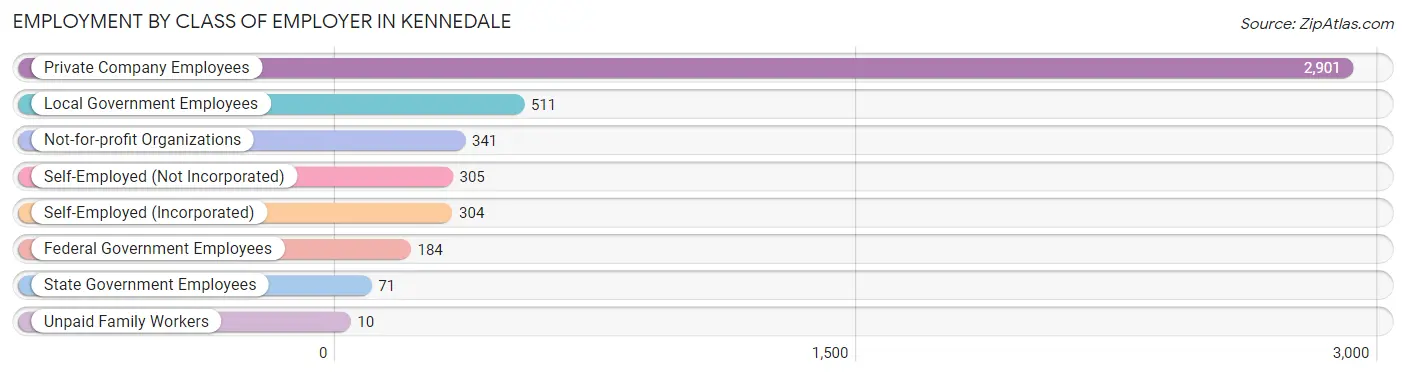
| Employer Class | # Employees | % Employees |
| Private Company Employees | 2,901 | 62.7% |
| Self-Employed (Incorporated) | 304 | 6.6% |
| Self-Employed (Not Incorporated) | 305 | 6.6% |
| Not-for-profit Organizations | 341 | 7.4% |
| Local Government Employees | 511 | 11.0% |
| State Government Employees | 71 | 1.5% |
| Federal Government Employees | 184 | 4.0% |
| Unpaid Family Workers | 10 | 0.2% |
| Total | 4,627 | 100.0% |
Employment Status by Age in Kennedale
According to the labor force statistics for Kennedale, out of the total population over 16 years of age (6,917), 71.6% or 4,953 individuals are in the labor force, with 4.7% or 233 of them unemployed. The age group with the highest labor force participation rate is 30 to 34 years, with 98.4% or 368 individuals in the labor force. Within the labor force, the 25 to 29 years age range has the highest percentage of unemployed individuals, with 20.9% or 134 of them being unemployed.
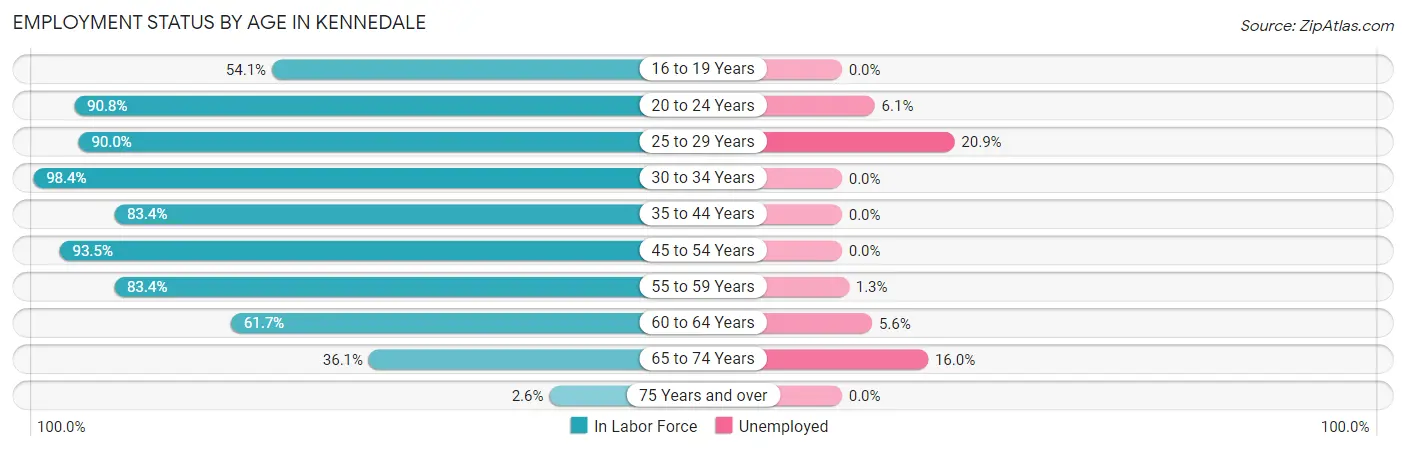
| Age Bracket | In Labor Force | Unemployed |
| 16 to 19 Years | 206 (54.1%) | 0 (0.0%) |
| 20 to 24 Years | 374 (90.8%) | 23 (6.1%) |
| 25 to 29 Years | 641 (90.0%) | 134 (20.9%) |
| 30 to 34 Years | 368 (98.4%) | 0 (0.0%) |
| 35 to 44 Years | 842 (83.4%) | 0 (0.0%) |
| 45 to 54 Years | 1,328 (93.5%) | 0 (0.0%) |
| 55 to 59 Years | 478 (83.4%) | 6 (1.3%) |
| 60 to 64 Years | 393 (61.7%) | 22 (5.6%) |
| 65 to 74 Years | 312 (36.1%) | 50 (16.0%) |
| 75 Years and over | 14 (2.6%) | 0 (0.0%) |
| Total | 4,953 (71.6%) | 233 (4.7%) |
Employment Status by Educational Attainment in Kennedale
According to labor force statistics for Kennedale, 85.7% of individuals (4,049) out of the total population between 25 and 64 years of age (4,725) are in the labor force, with 4.0% or 162 of them being unemployed. The group with the highest labor force participation rate are those with the educational attainment of bachelor's degree or higher, with 96.6% or 1,549 individuals in the labor force. Within the labor force, individuals with high school diploma education have the highest percentage of unemployment, with 8.4% or 71 of them being unemployed.
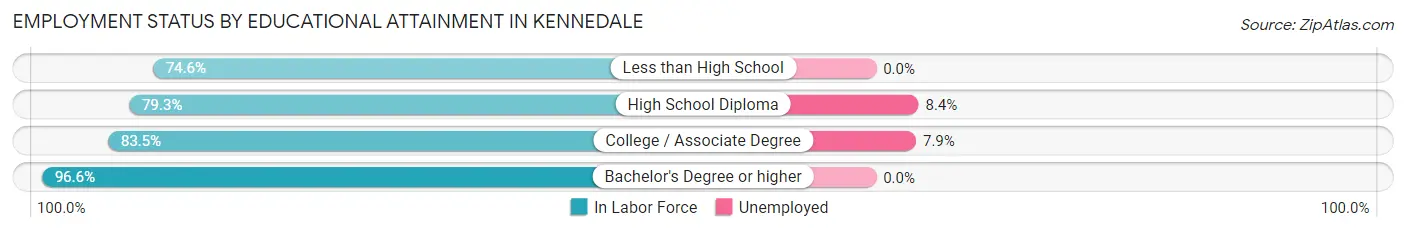
| Educational Attainment | In Labor Force | Unemployed |
| Less than High School | 502 (74.6%) | 0 (0.0%) |
| High School Diploma | 842 (79.3%) | 89 (8.4%) |
| College / Associate Degree | 1,157 (83.5%) | 109 (7.9%) |
| Bachelor's Degree or higher | 1,549 (96.6%) | 0 (0.0%) |
| Total | 4,049 (85.7%) | 189 (4.0%) |
Employment Occupations by Sex in Kennedale
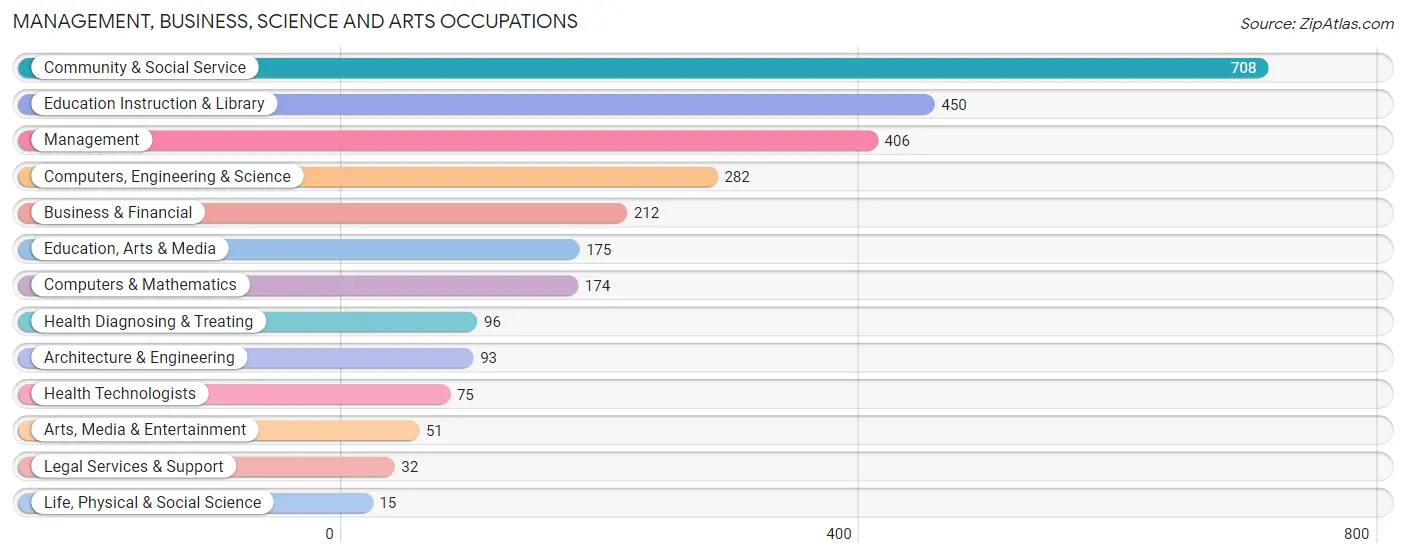
Management, Business, Science and Arts Occupations
The most common Management, Business, Science and Arts occupations in Kennedale are Community & Social Service (708 | 15.0%), Education Instruction & Library (450 | 9.5%), Management (406 | 8.6%), Computers, Engineering & Science (282 | 6.0%), and Business & Financial (212 | 4.5%).
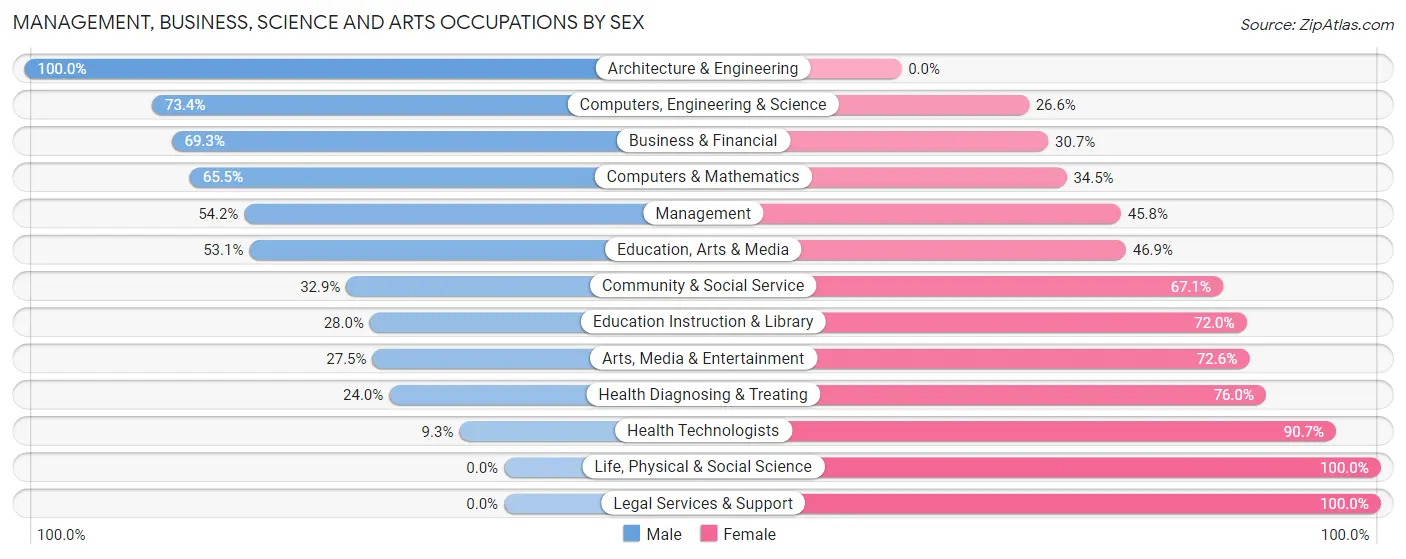
Management, Business, Science and Arts Occupations by Sex
Within the Management, Business, Science and Arts occupations in Kennedale, the most male-oriented occupations are Architecture & Engineering (100.0%), Computers, Engineering & Science (73.4%), and Business & Financial (69.3%), while the most female-oriented occupations are Life, Physical & Social Science (100.0%), Legal Services & Support (100.0%), and Health Technologists (90.7%).
| Occupation | Male | Female |
| Management | 220 (54.2%) | 186 (45.8%) |
| Business & Financial | 147 (69.3%) | 65 (30.7%) |
| Computers, Engineering & Science | 207 (73.4%) | 75 (26.6%) |
| Computers & Mathematics | 114 (65.5%) | 60 (34.5%) |
| Architecture & Engineering | 93 (100.0%) | 0 (0.0%) |
| Life, Physical & Social Science | 0 (0.0%) | 15 (100.0%) |
| Community & Social Service | 233 (32.9%) | 475 (67.1%) |
| Education, Arts & Media | 93 (53.1%) | 82 (46.9%) |
| Legal Services & Support | 0 (0.0%) | 32 (100.0%) |
| Education Instruction & Library | 126 (28.0%) | 324 (72.0%) |
| Arts, Media & Entertainment | 14 (27.5%) | 37 (72.6%) |
| Health Diagnosing & Treating | 23 (24.0%) | 73 (76.0%) |
| Health Technologists | 7 (9.3%) | 68 (90.7%) |
| Total (Category) | 830 (48.7%) | 874 (51.3%) |
| Total (Overall) | 2,694 (57.1%) | 2,027 (42.9%) |
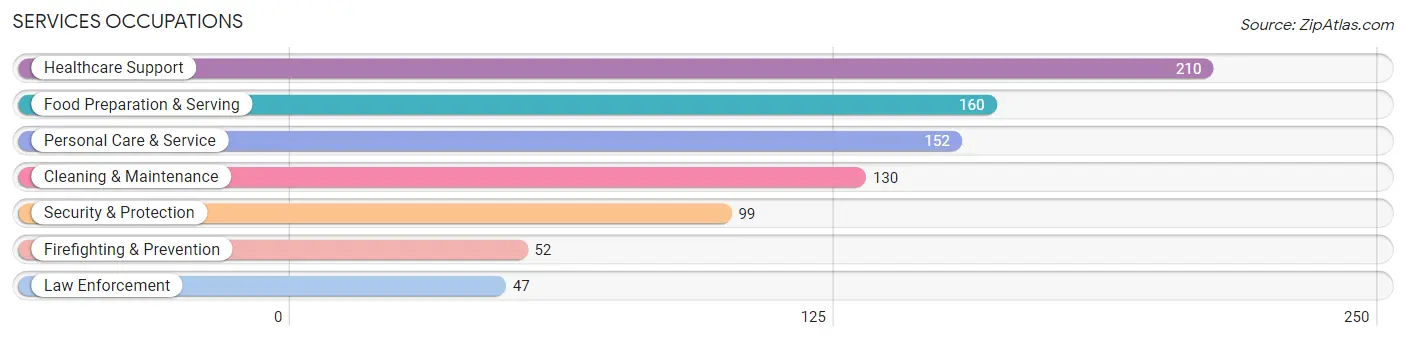
Services Occupations
The most common Services occupations in Kennedale are Healthcare Support (210 | 4.4%), Food Preparation & Serving (160 | 3.4%), Personal Care & Service (152 | 3.2%), Cleaning & Maintenance (130 | 2.8%), and Security & Protection (99 | 2.1%).
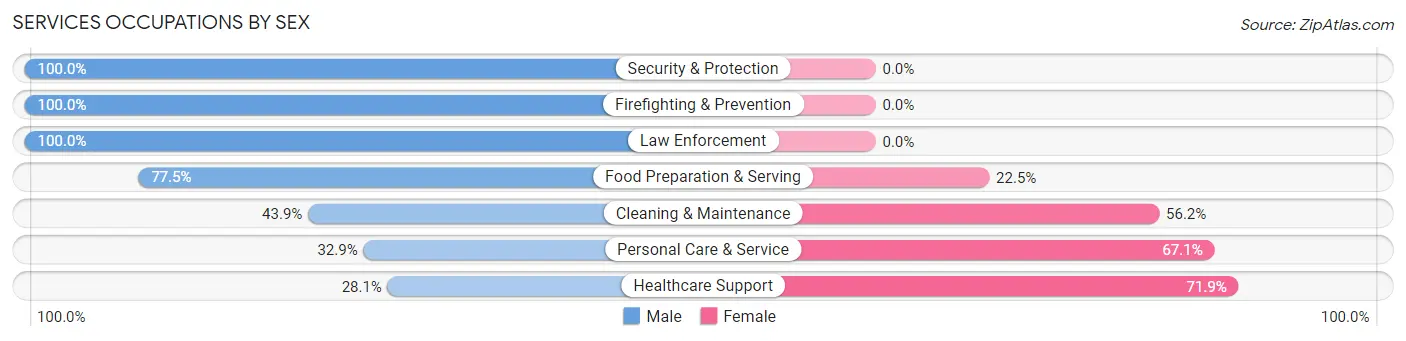
Services Occupations by Sex
Within the Services occupations in Kennedale, the most male-oriented occupations are Security & Protection (100.0%), Firefighting & Prevention (100.0%), and Law Enforcement (100.0%), while the most female-oriented occupations are Healthcare Support (71.9%), Personal Care & Service (67.1%), and Cleaning & Maintenance (56.1%).
| Occupation | Male | Female |
| Healthcare Support | 59 (28.1%) | 151 (71.9%) |
| Security & Protection | 99 (100.0%) | 0 (0.0%) |
| Firefighting & Prevention | 52 (100.0%) | 0 (0.0%) |
| Law Enforcement | 47 (100.0%) | 0 (0.0%) |
| Food Preparation & Serving | 124 (77.5%) | 36 (22.5%) |
| Cleaning & Maintenance | 57 (43.9%) | 73 (56.1%) |
| Personal Care & Service | 50 (32.9%) | 102 (67.1%) |
| Total (Category) | 389 (51.8%) | 362 (48.2%) |
| Total (Overall) | 2,694 (57.1%) | 2,027 (42.9%) |
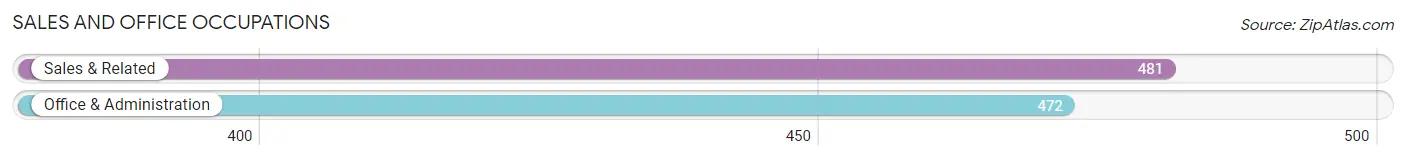
Sales and Office Occupations
The most common Sales and Office occupations in Kennedale are Sales & Related (481 | 10.2%), and Office & Administration (472 | 10.0%).
Sales and Office Occupations by Sex
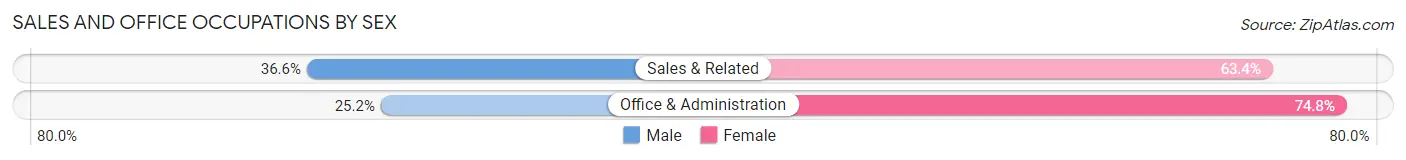
| Occupation | Male | Female |
| Sales & Related | 176 (36.6%) | 305 (63.4%) |
| Office & Administration | 119 (25.2%) | 353 (74.8%) |
| Total (Category) | 295 (30.9%) | 658 (69.1%) |
| Total (Overall) | 2,694 (57.1%) | 2,027 (42.9%) |
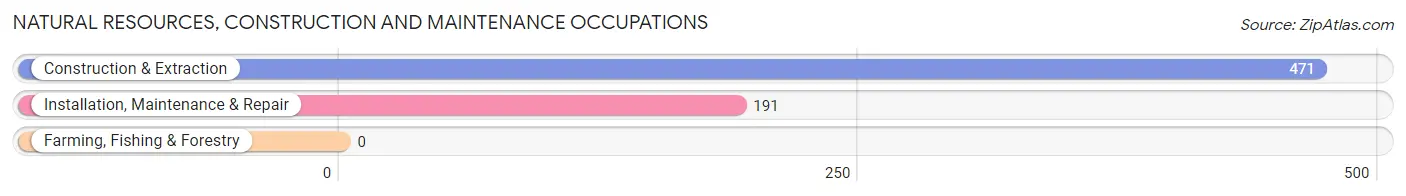
Natural Resources, Construction and Maintenance Occupations
The most common Natural Resources, Construction and Maintenance occupations in Kennedale are Construction & Extraction (471 | 10.0%), and Installation, Maintenance & Repair (191 | 4.1%).
Natural Resources, Construction and Maintenance Occupations by Sex
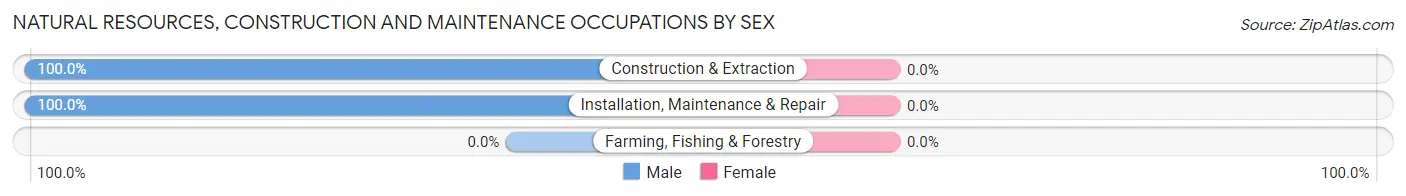
| Occupation | Male | Female |
| Farming, Fishing & Forestry | 0 (0.0%) | 0 (0.0%) |
| Construction & Extraction | 471 (100.0%) | 0 (0.0%) |
| Installation, Maintenance & Repair | 191 (100.0%) | 0 (0.0%) |
| Total (Category) | 662 (100.0%) | 0 (0.0%) |
| Total (Overall) | 2,694 (57.1%) | 2,027 (42.9%) |
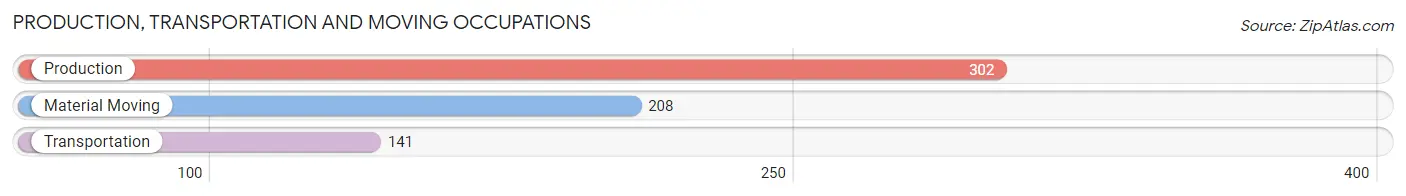
Production, Transportation and Moving Occupations
The most common Production, Transportation and Moving occupations in Kennedale are Production (302 | 6.4%), Material Moving (208 | 4.4%), and Transportation (141 | 3.0%).
Production, Transportation and Moving Occupations by Sex
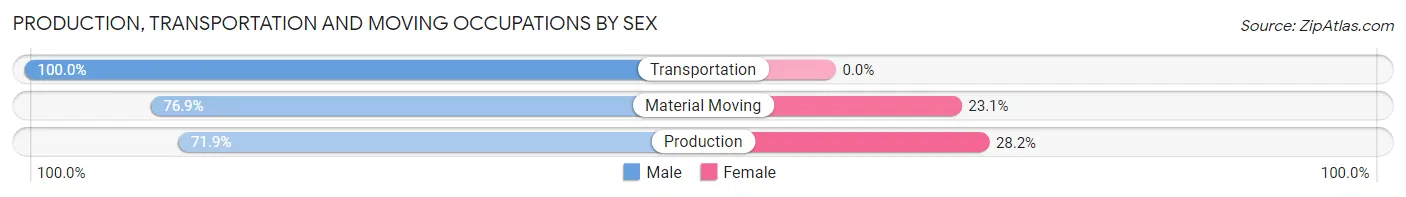
| Occupation | Male | Female |
| Production | 217 (71.9%) | 85 (28.1%) |
| Transportation | 141 (100.0%) | 0 (0.0%) |
| Material Moving | 160 (76.9%) | 48 (23.1%) |
| Total (Category) | 518 (79.6%) | 133 (20.4%) |
| Total (Overall) | 2,694 (57.1%) | 2,027 (42.9%) |
Employment Industries by Sex in Kennedale
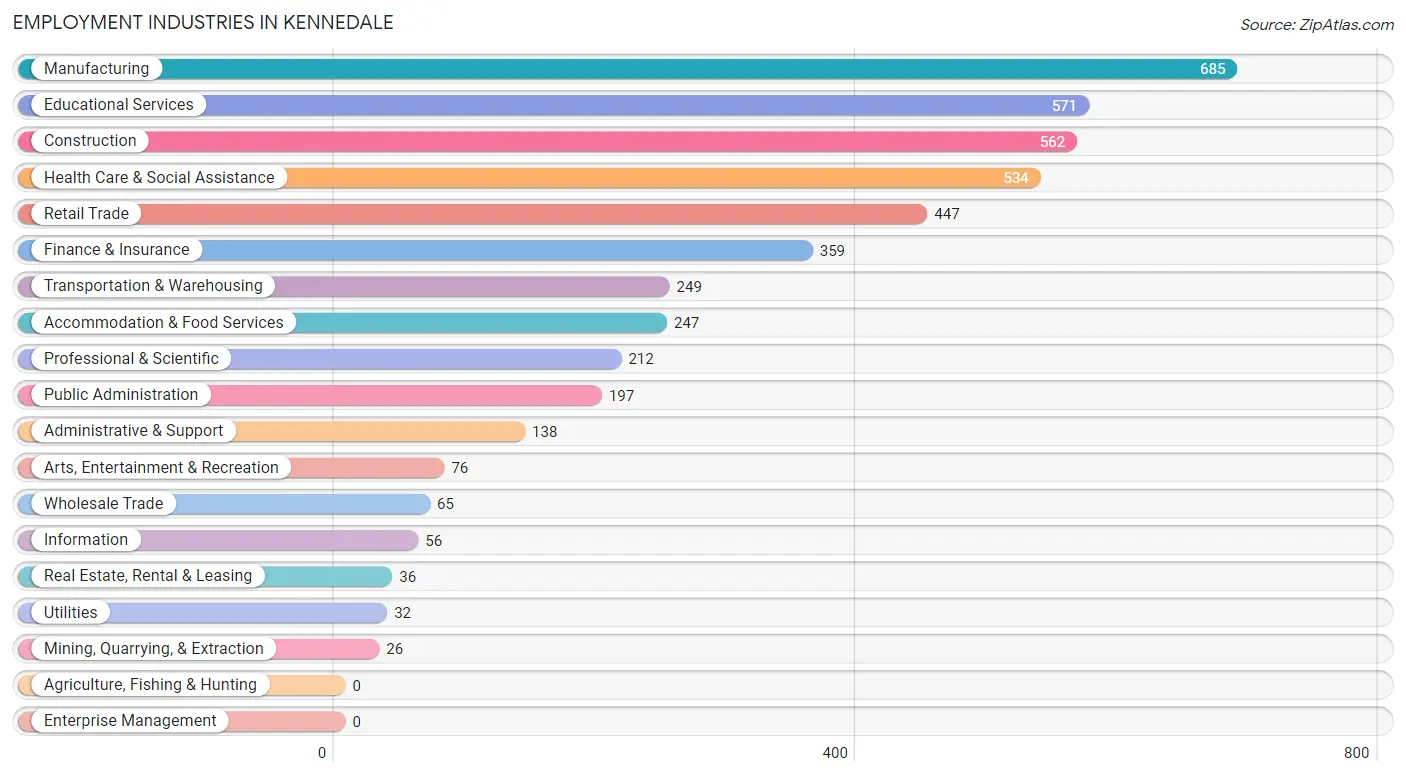
Employment Industries in Kennedale
The major employment industries in Kennedale include Manufacturing (685 | 14.5%), Educational Services (571 | 12.1%), Construction (562 | 11.9%), Health Care & Social Assistance (534 | 11.3%), and Retail Trade (447 | 9.5%).
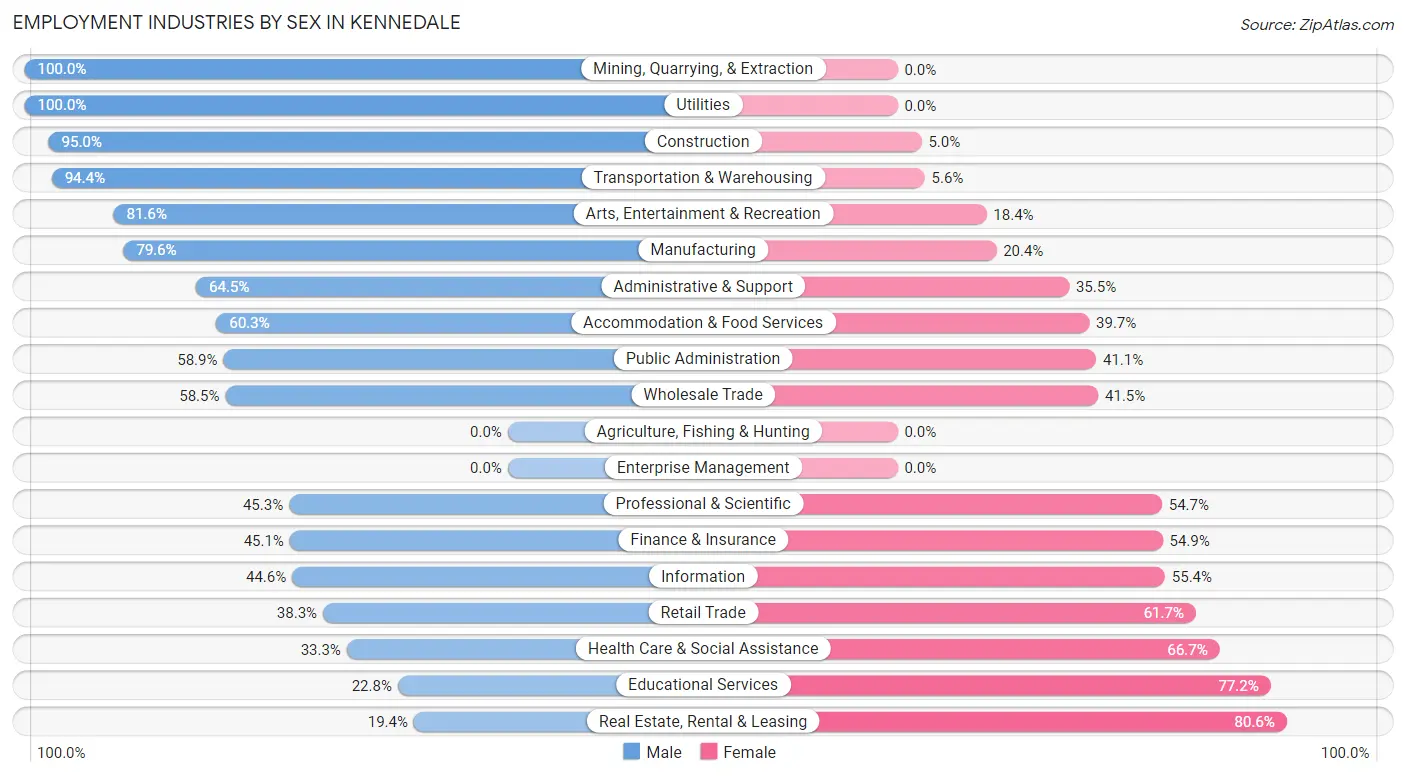
Employment Industries by Sex in Kennedale
The Kennedale industries that see more men than women are Mining, Quarrying, & Extraction (100.0%), Utilities (100.0%), and Construction (95.0%), whereas the industries that tend to have a higher number of women are Real Estate, Rental & Leasing (80.6%), Educational Services (77.2%), and Health Care & Social Assistance (66.7%).
| Industry | Male | Female |
| Agriculture, Fishing & Hunting | 0 (0.0%) | 0 (0.0%) |
| Mining, Quarrying, & Extraction | 26 (100.0%) | 0 (0.0%) |
| Construction | 534 (95.0%) | 28 (5.0%) |
| Manufacturing | 545 (79.6%) | 140 (20.4%) |
| Wholesale Trade | 38 (58.5%) | 27 (41.5%) |
| Retail Trade | 171 (38.3%) | 276 (61.7%) |
| Transportation & Warehousing | 235 (94.4%) | 14 (5.6%) |
| Utilities | 32 (100.0%) | 0 (0.0%) |
| Information | 25 (44.6%) | 31 (55.4%) |
| Finance & Insurance | 162 (45.1%) | 197 (54.9%) |
| Real Estate, Rental & Leasing | 7 (19.4%) | 29 (80.6%) |
| Professional & Scientific | 96 (45.3%) | 116 (54.7%) |
| Enterprise Management | 0 (0.0%) | 0 (0.0%) |
| Administrative & Support | 89 (64.5%) | 49 (35.5%) |
| Educational Services | 130 (22.8%) | 441 (77.2%) |
| Health Care & Social Assistance | 178 (33.3%) | 356 (66.7%) |
| Arts, Entertainment & Recreation | 62 (81.6%) | 14 (18.4%) |
| Accommodation & Food Services | 149 (60.3%) | 98 (39.7%) |
| Public Administration | 116 (58.9%) | 81 (41.1%) |
| Total | 2,694 (57.1%) | 2,027 (42.9%) |
Education in Kennedale
School Enrollment in Kennedale
The most common levels of schooling among the 2,030 students in Kennedale are high school (605 | 29.8%), elementary school (455 | 22.4%), and middle school (442 | 21.8%).
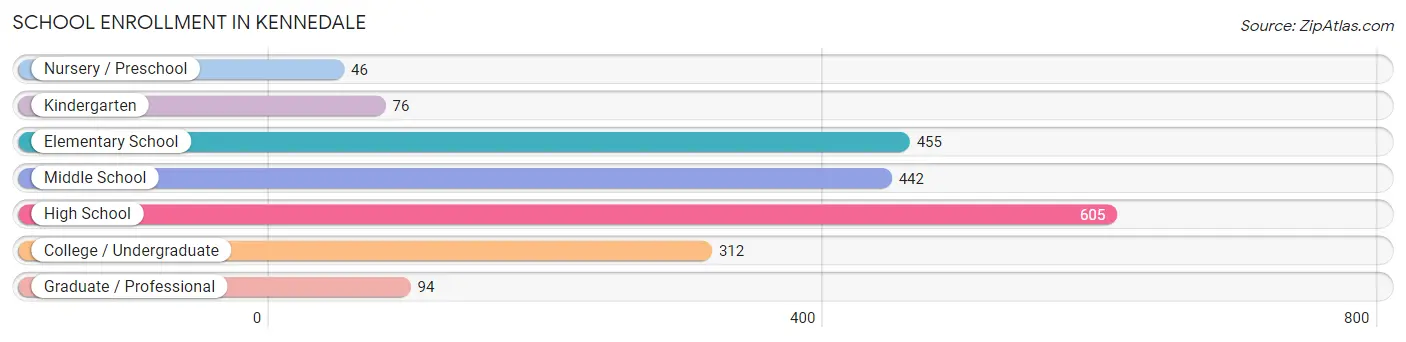
| School Level | # Students | % Students |
| Nursery / Preschool | 46 | 2.3% |
| Kindergarten | 76 | 3.7% |
| Elementary School | 455 | 22.4% |
| Middle School | 442 | 21.8% |
| High School | 605 | 29.8% |
| College / Undergraduate | 312 | 15.4% |
| Graduate / Professional | 94 | 4.6% |
| Total | 2,030 | 100.0% |
School Enrollment by Age by Funding Source in Kennedale
Out of a total of 2,030 students who are enrolled in schools in Kennedale, 238 (11.7%) attend a private institution, while the remaining 1,792 (88.3%) are enrolled in public schools. The age group of 25 to 34 year olds has the highest likelihood of being enrolled in private schools, with 54 (64.3% in the age bracket) enrolled. Conversely, the age group of 18 to 19 year olds has the lowest likelihood of being enrolled in a private school, with 173 (100.0% in the age bracket) attending a public institution.
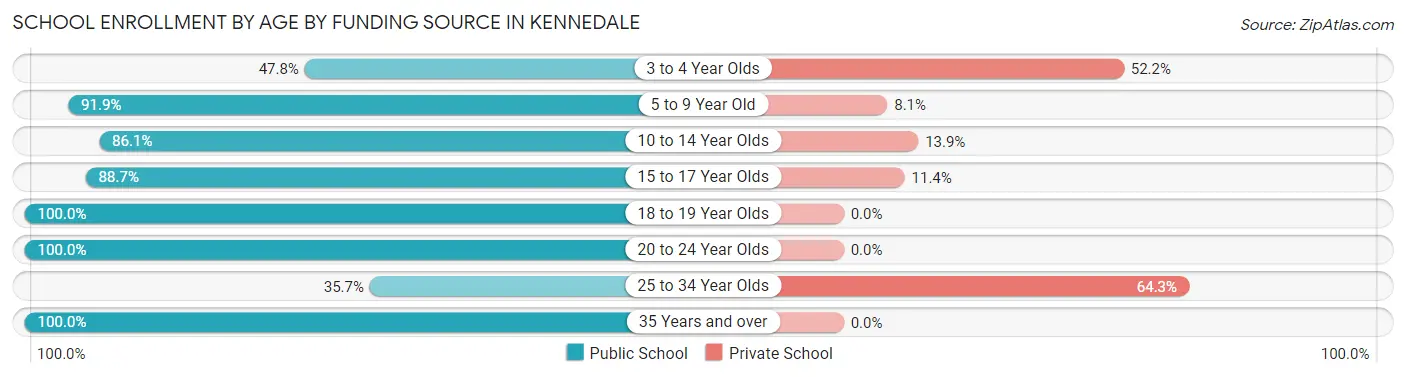
| Age Bracket | Public School | Private School |
| 3 to 4 Year Olds | 22 (47.8%) | 24 (52.2%) |
| 5 to 9 Year Old | 475 (91.9%) | 42 (8.1%) |
| 10 to 14 Year Olds | 571 (86.1%) | 92 (13.9%) |
| 15 to 17 Year Olds | 203 (88.6%) | 26 (11.4%) |
| 18 to 19 Year Olds | 173 (100.0%) | 0 (0.0%) |
| 20 to 24 Year Olds | 110 (100.0%) | 0 (0.0%) |
| 25 to 34 Year Olds | 30 (35.7%) | 54 (64.3%) |
| 35 Years and over | 208 (100.0%) | 0 (0.0%) |
| Total | 1,792 (88.3%) | 238 (11.7%) |
Educational Attainment by Field of Study in Kennedale
Business (554 | 30.2%), education (199 | 10.8%), science & technology (139 | 7.6%), liberal arts & history (124 | 6.8%), and arts & humanities (113 | 6.1%) are the most common fields of study among 1,837 individuals in Kennedale who have obtained a bachelor's degree or higher.
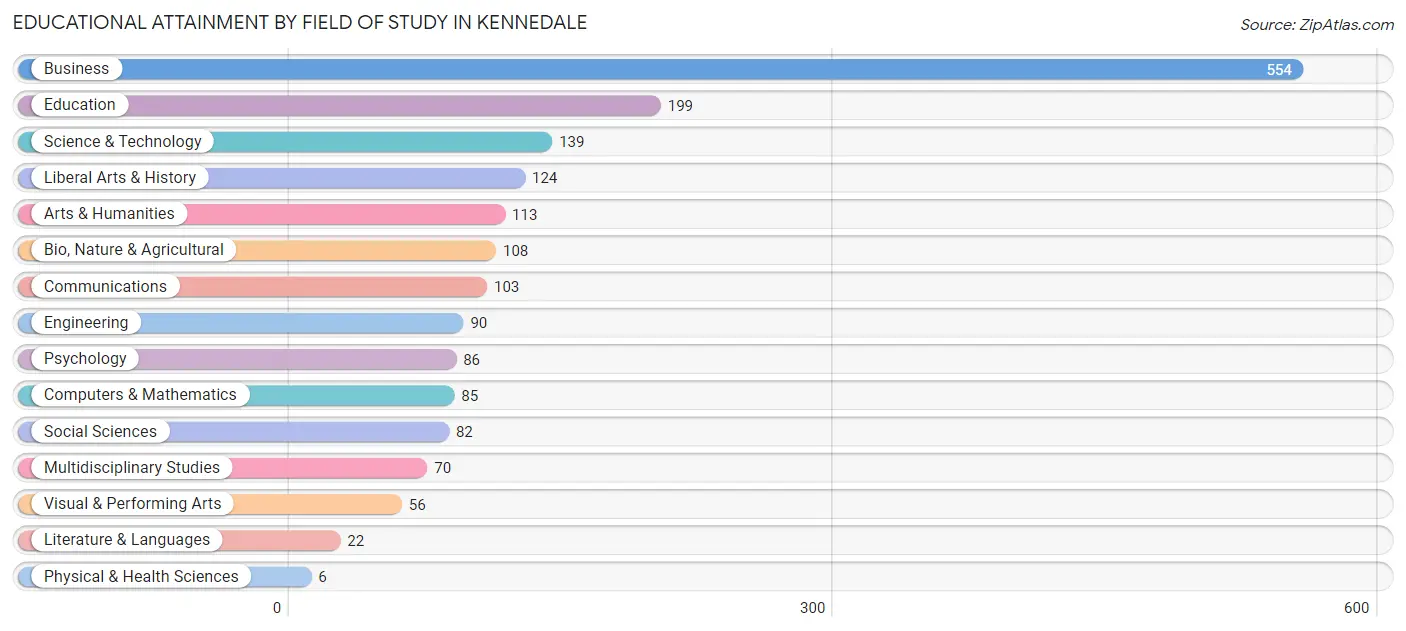
| Field of Study | # Graduates | % Graduates |
| Computers & Mathematics | 85 | 4.6% |
| Bio, Nature & Agricultural | 108 | 5.9% |
| Physical & Health Sciences | 6 | 0.3% |
| Psychology | 86 | 4.7% |
| Social Sciences | 82 | 4.5% |
| Engineering | 90 | 4.9% |
| Multidisciplinary Studies | 70 | 3.8% |
| Science & Technology | 139 | 7.6% |
| Business | 554 | 30.2% |
| Education | 199 | 10.8% |
| Literature & Languages | 22 | 1.2% |
| Liberal Arts & History | 124 | 6.8% |
| Visual & Performing Arts | 56 | 3.0% |
| Communications | 103 | 5.6% |
| Arts & Humanities | 113 | 6.1% |
| Total | 1,837 | 100.0% |
Transportation & Commute in Kennedale
Vehicle Availability by Sex in Kennedale
The most prevalent vehicle ownership categories in Kennedale are males with 2 vehicles (1,258, accounting for 48.3%) and females with 2 vehicles (808, making up 62.5%).
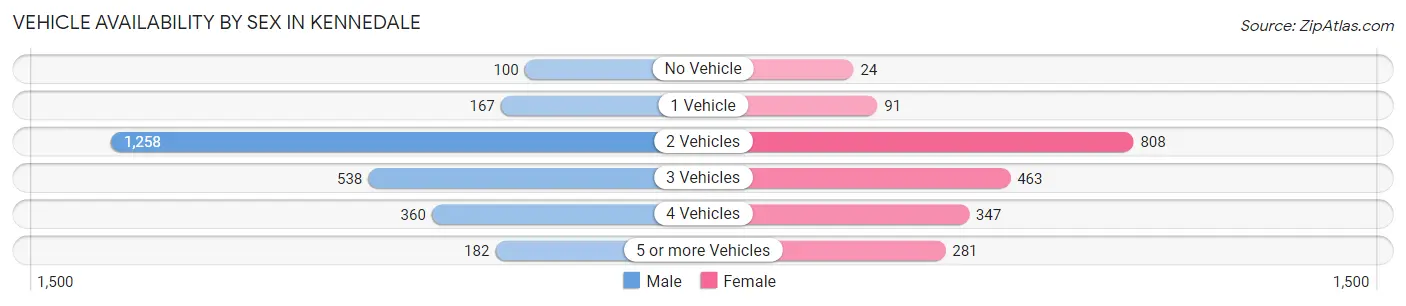
| Vehicles Available | Male | Female |
| No Vehicle | 100 (3.8%) | 24 (1.2%) |
| 1 Vehicle | 167 (6.4%) | 91 (4.5%) |
| 2 Vehicles | 1,258 (48.3%) | 808 (40.1%) |
| 3 Vehicles | 538 (20.6%) | 463 (23.0%) |
| 4 Vehicles | 360 (13.8%) | 347 (17.2%) |
| 5 or more Vehicles | 182 (7.0%) | 281 (14.0%) |
| Total | 2,605 (100.0%) | 2,014 (100.0%) |
Commute Time in Kennedale
The most frequently occuring commute durations in Kennedale are 45 to 59 minutes (619 commuters, 14.3%), 20 to 24 minutes (579 commuters, 13.4%), and 15 to 19 minutes (523 commuters, 12.1%).
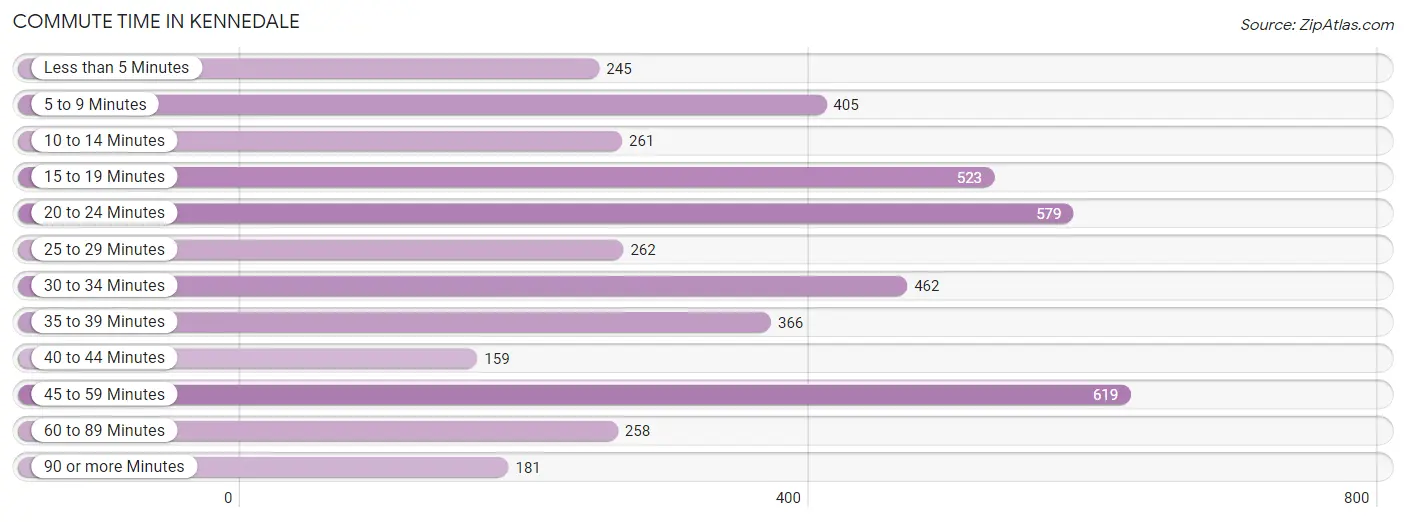
| Commute Time | # Commuters | % Commuters |
| Less than 5 Minutes | 245 | 5.7% |
| 5 to 9 Minutes | 405 | 9.4% |
| 10 to 14 Minutes | 261 | 6.0% |
| 15 to 19 Minutes | 523 | 12.1% |
| 20 to 24 Minutes | 579 | 13.4% |
| 25 to 29 Minutes | 262 | 6.1% |
| 30 to 34 Minutes | 462 | 10.7% |
| 35 to 39 Minutes | 366 | 8.5% |
| 40 to 44 Minutes | 159 | 3.7% |
| 45 to 59 Minutes | 619 | 14.3% |
| 60 to 89 Minutes | 258 | 6.0% |
| 90 or more Minutes | 181 | 4.2% |
Commute Time by Sex in Kennedale
The most common commute times in Kennedale are 15 to 19 minutes (358 commuters, 14.4%) for males and 20 to 24 minutes (295 commuters, 16.0%) for females.
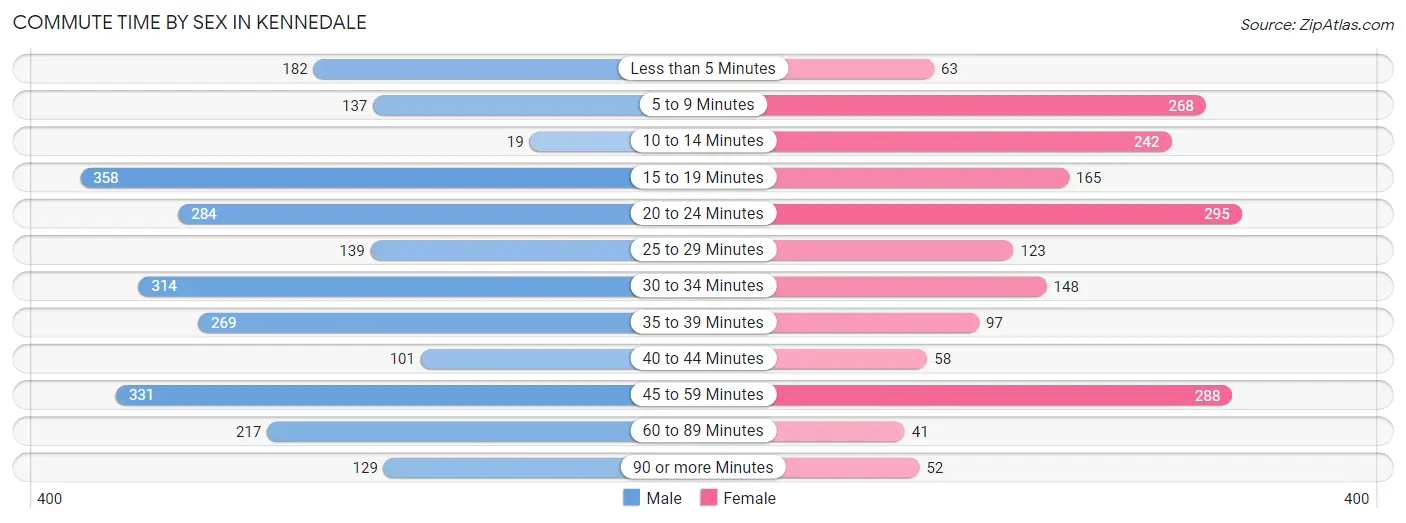
| Commute Time | Male | Female |
| Less than 5 Minutes | 182 (7.3%) | 63 (3.4%) |
| 5 to 9 Minutes | 137 (5.5%) | 268 (14.6%) |
| 10 to 14 Minutes | 19 (0.8%) | 242 (13.2%) |
| 15 to 19 Minutes | 358 (14.4%) | 165 (9.0%) |
| 20 to 24 Minutes | 284 (11.5%) | 295 (16.0%) |
| 25 to 29 Minutes | 139 (5.6%) | 123 (6.7%) |
| 30 to 34 Minutes | 314 (12.7%) | 148 (8.0%) |
| 35 to 39 Minutes | 269 (10.8%) | 97 (5.3%) |
| 40 to 44 Minutes | 101 (4.1%) | 58 (3.2%) |
| 45 to 59 Minutes | 331 (13.4%) | 288 (15.7%) |
| 60 to 89 Minutes | 217 (8.7%) | 41 (2.2%) |
| 90 or more Minutes | 129 (5.2%) | 52 (2.8%) |
Time of Departure to Work by Sex in Kennedale
The most frequent times of departure to work in Kennedale are 7:00 AM to 7:29 AM (342, 13.8%) for males and 7:00 AM to 7:29 AM (344, 18.7%) for females.
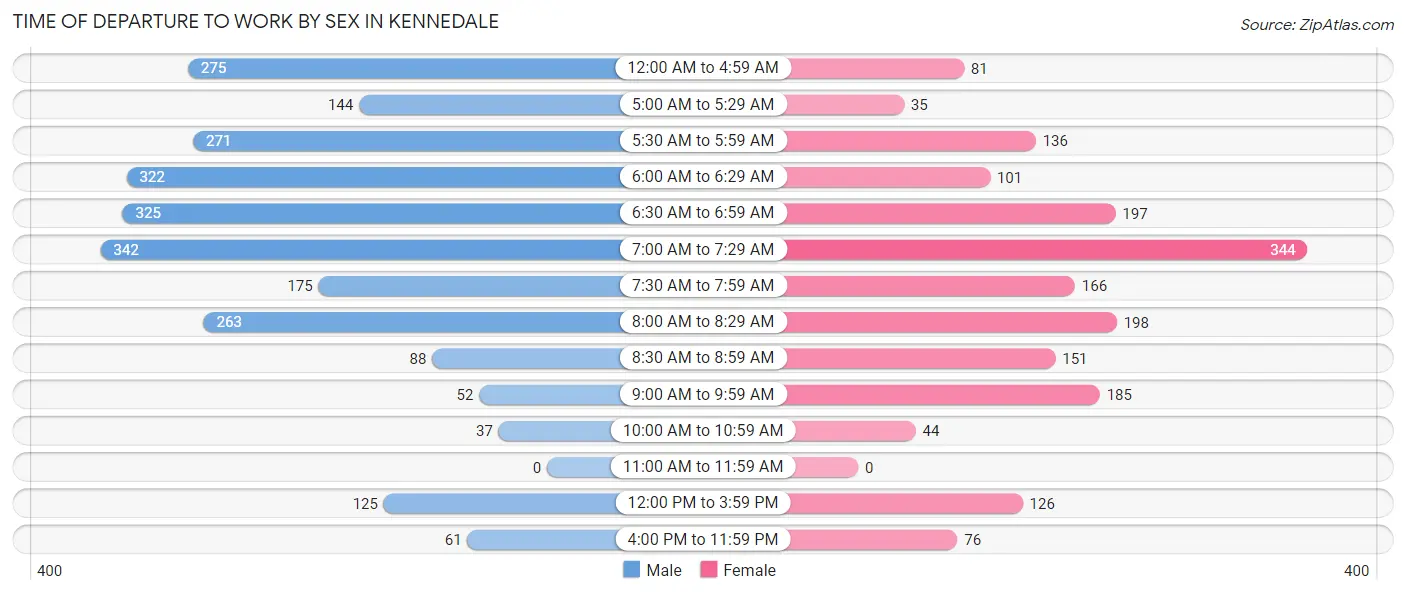
| Time of Departure | Male | Female |
| 12:00 AM to 4:59 AM | 275 (11.1%) | 81 (4.4%) |
| 5:00 AM to 5:29 AM | 144 (5.8%) | 35 (1.9%) |
| 5:30 AM to 5:59 AM | 271 (10.9%) | 136 (7.4%) |
| 6:00 AM to 6:29 AM | 322 (13.0%) | 101 (5.5%) |
| 6:30 AM to 6:59 AM | 325 (13.1%) | 197 (10.7%) |
| 7:00 AM to 7:29 AM | 342 (13.8%) | 344 (18.7%) |
| 7:30 AM to 7:59 AM | 175 (7.1%) | 166 (9.0%) |
| 8:00 AM to 8:29 AM | 263 (10.6%) | 198 (10.8%) |
| 8:30 AM to 8:59 AM | 88 (3.5%) | 151 (8.2%) |
| 9:00 AM to 9:59 AM | 52 (2.1%) | 185 (10.1%) |
| 10:00 AM to 10:59 AM | 37 (1.5%) | 44 (2.4%) |
| 11:00 AM to 11:59 AM | 0 (0.0%) | 0 (0.0%) |
| 12:00 PM to 3:59 PM | 125 (5.0%) | 126 (6.9%) |
| 4:00 PM to 11:59 PM | 61 (2.5%) | 76 (4.1%) |
| Total | 2,480 (100.0%) | 1,840 (100.0%) |
Housing Occupancy in Kennedale
Occupancy by Ownership in Kennedale
Of the total 2,896 dwellings in Kennedale, owner-occupied units account for 2,060 (71.1%), while renter-occupied units make up 836 (28.9%).
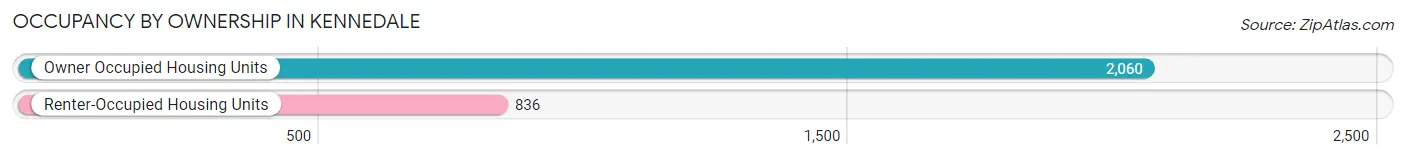
| Occupancy | # Housing Units | % Housing Units |
| Owner Occupied Housing Units | 2,060 | 71.1% |
| Renter-Occupied Housing Units | 836 | 28.9% |
| Total Occupied Housing Units | 2,896 | 100.0% |
Occupancy by Household Size in Kennedale
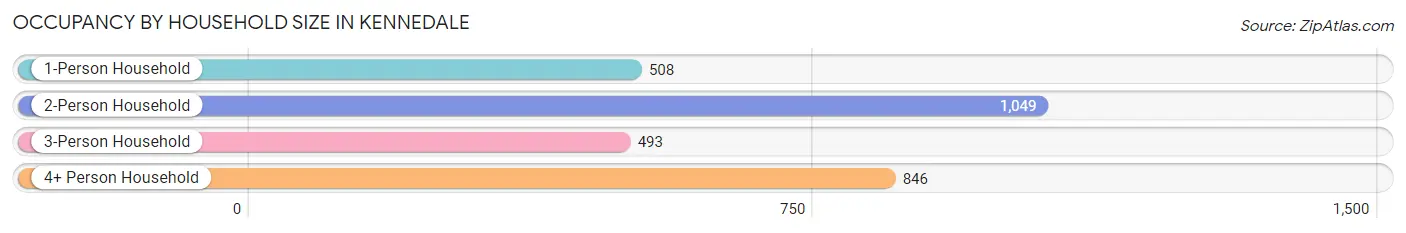
| Household Size | # Housing Units | % Housing Units |
| 1-Person Household | 508 | 17.5% |
| 2-Person Household | 1,049 | 36.2% |
| 3-Person Household | 493 | 17.0% |
| 4+ Person Household | 846 | 29.2% |
| Total Housing Units | 2,896 | 100.0% |
Occupancy by Ownership by Household Size in Kennedale
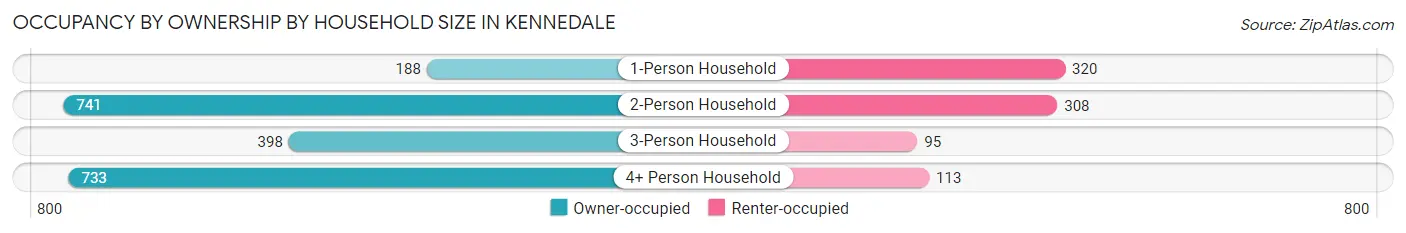
| Household Size | Owner-occupied | Renter-occupied |
| 1-Person Household | 188 (37.0%) | 320 (63.0%) |
| 2-Person Household | 741 (70.6%) | 308 (29.4%) |
| 3-Person Household | 398 (80.7%) | 95 (19.3%) |
| 4+ Person Household | 733 (86.6%) | 113 (13.4%) |
| Total Housing Units | 2,060 (71.1%) | 836 (28.9%) |
Occupancy by Educational Attainment in Kennedale
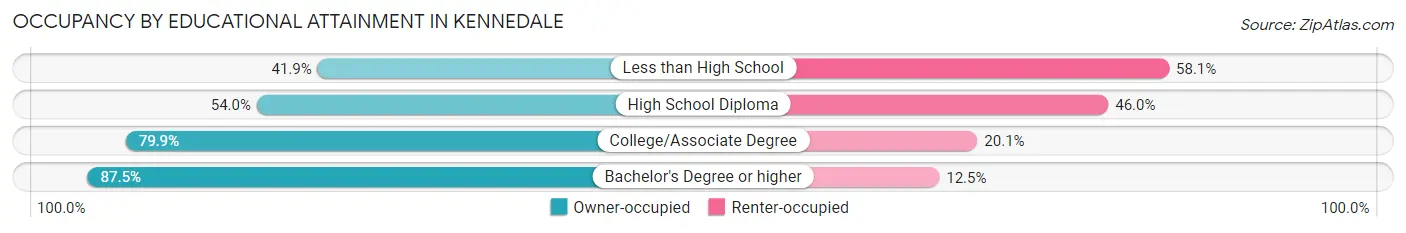
| Household Size | Owner-occupied | Renter-occupied |
| Less than High School | 192 (41.9%) | 266 (58.1%) |
| High School Diploma | 326 (54.0%) | 278 (46.0%) |
| College/Associate Degree | 661 (79.9%) | 166 (20.1%) |
| Bachelor's Degree or higher | 881 (87.5%) | 126 (12.5%) |
Occupancy by Age of Householder in Kennedale
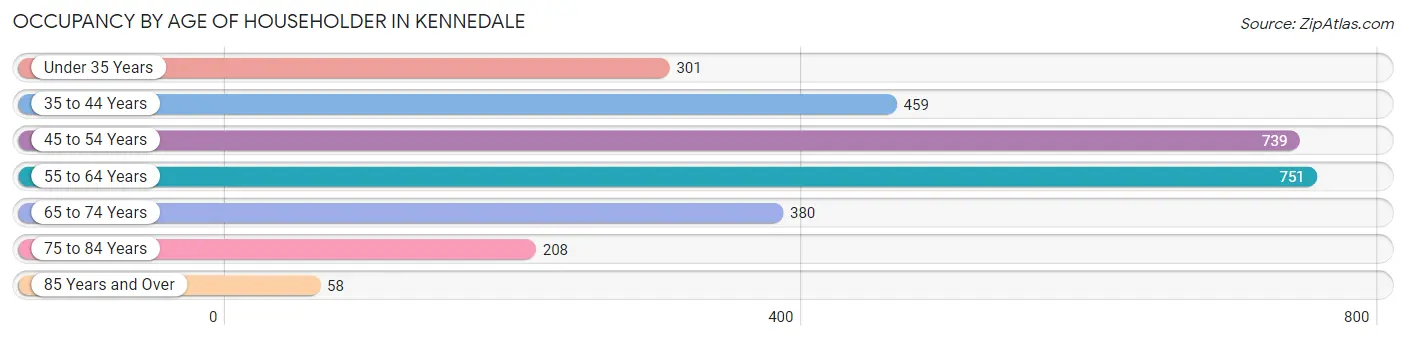
| Age Bracket | # Households | % Households |
| Under 35 Years | 301 | 10.4% |
| 35 to 44 Years | 459 | 15.9% |
| 45 to 54 Years | 739 | 25.5% |
| 55 to 64 Years | 751 | 25.9% |
| 65 to 74 Years | 380 | 13.1% |
| 75 to 84 Years | 208 | 7.2% |
| 85 Years and Over | 58 | 2.0% |
| Total | 2,896 | 100.0% |
Housing Finances in Kennedale
Median Income by Occupancy in Kennedale
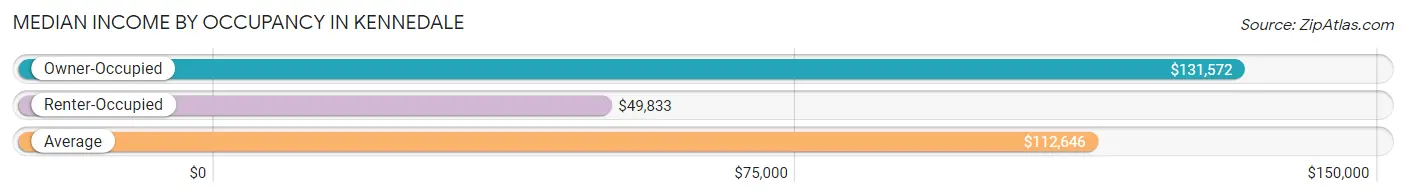
| Occupancy Type | # Households | Median Income |
| Owner-Occupied | 2,060 (71.1%) | $131,572 |
| Renter-Occupied | 836 (28.9%) | $49,833 |
| Average | 2,896 (100.0%) | $112,646 |
Occupancy by Householder Income Bracket in Kennedale
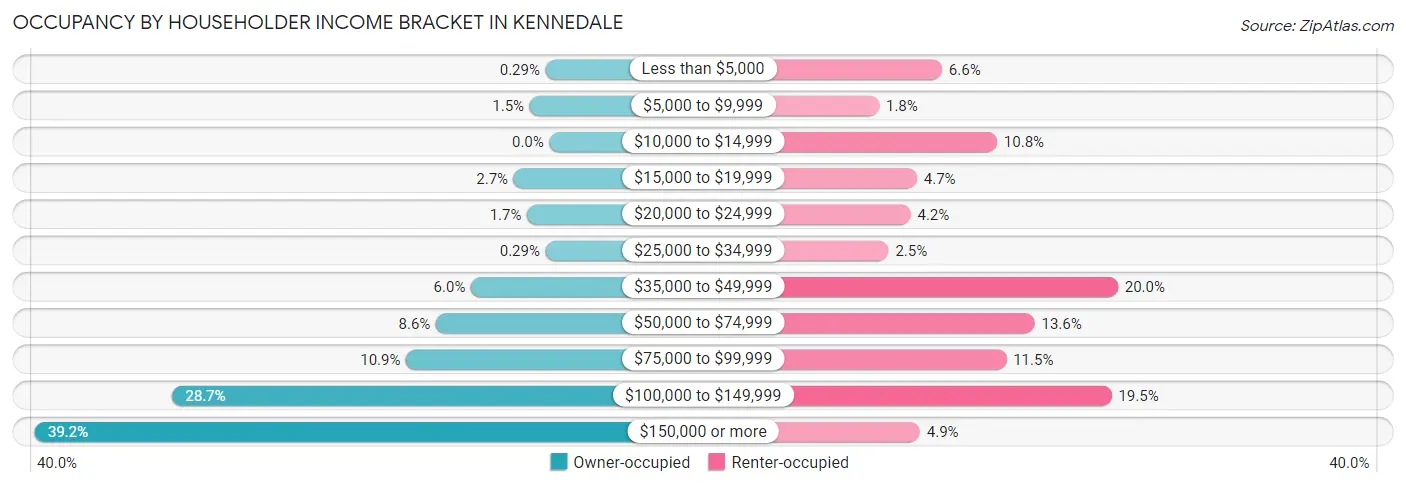
| Income Bracket | Owner-occupied | Renter-occupied |
| Less than $5,000 | 6 (0.3%) | 55 (6.6%) |
| $5,000 to $9,999 | 31 (1.5%) | 15 (1.8%) |
| $10,000 to $14,999 | 0 (0.0%) | 90 (10.8%) |
| $15,000 to $19,999 | 56 (2.7%) | 39 (4.7%) |
| $20,000 to $24,999 | 35 (1.7%) | 35 (4.2%) |
| $25,000 to $34,999 | 6 (0.3%) | 21 (2.5%) |
| $35,000 to $49,999 | 123 (6.0%) | 167 (20.0%) |
| $50,000 to $74,999 | 178 (8.6%) | 114 (13.6%) |
| $75,000 to $99,999 | 225 (10.9%) | 96 (11.5%) |
| $100,000 to $149,999 | 592 (28.7%) | 163 (19.5%) |
| $150,000 or more | 808 (39.2%) | 41 (4.9%) |
| Total | 2,060 (100.0%) | 836 (100.0%) |
Monthly Housing Cost Tiers in Kennedale
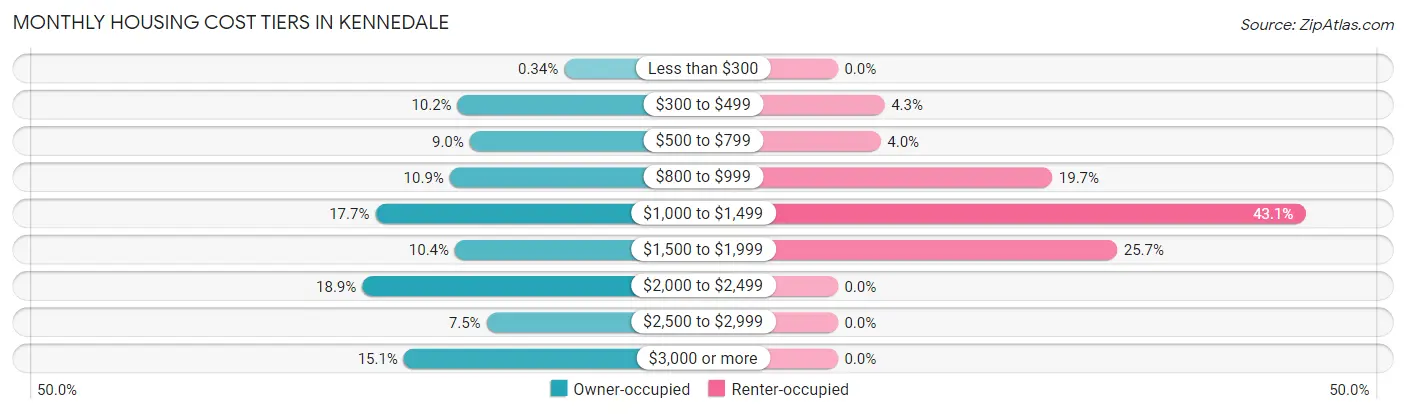
| Monthly Cost | Owner-occupied | Renter-occupied |
| Less than $300 | 7 (0.3%) | 0 (0.0%) |
| $300 to $499 | 209 (10.2%) | 36 (4.3%) |
| $500 to $799 | 186 (9.0%) | 33 (4.0%) |
| $800 to $999 | 224 (10.9%) | 165 (19.7%) |
| $1,000 to $1,499 | 365 (17.7%) | 360 (43.1%) |
| $1,500 to $1,999 | 214 (10.4%) | 215 (25.7%) |
| $2,000 to $2,499 | 390 (18.9%) | 0 (0.0%) |
| $2,500 to $2,999 | 154 (7.5%) | 0 (0.0%) |
| $3,000 or more | 311 (15.1%) | 0 (0.0%) |
| Total | 2,060 (100.0%) | 836 (100.0%) |
Physical Housing Characteristics in Kennedale
Housing Structures in Kennedale
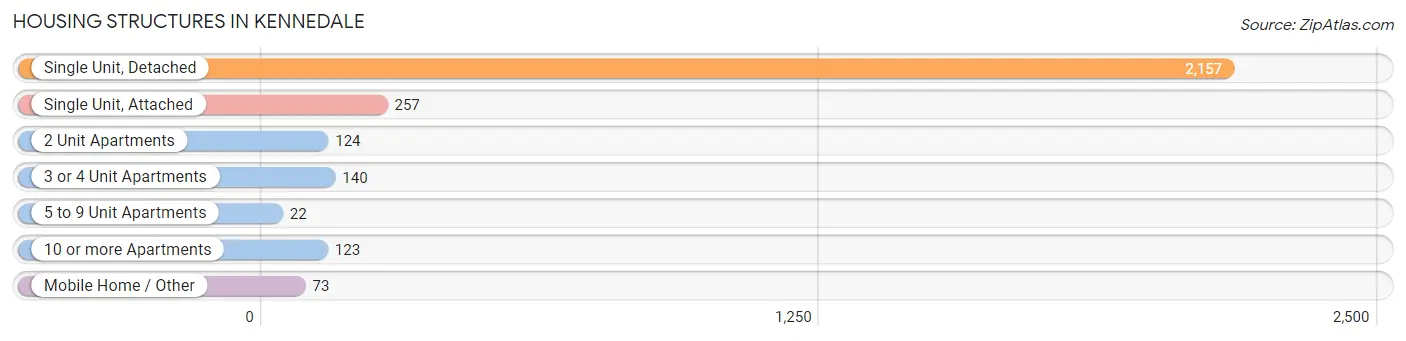
| Structure Type | # Housing Units | % Housing Units |
| Single Unit, Detached | 2,157 | 74.5% |
| Single Unit, Attached | 257 | 8.9% |
| 2 Unit Apartments | 124 | 4.3% |
| 3 or 4 Unit Apartments | 140 | 4.8% |
| 5 to 9 Unit Apartments | 22 | 0.8% |
| 10 or more Apartments | 123 | 4.3% |
| Mobile Home / Other | 73 | 2.5% |
| Total | 2,896 | 100.0% |
Housing Structures by Occupancy in Kennedale
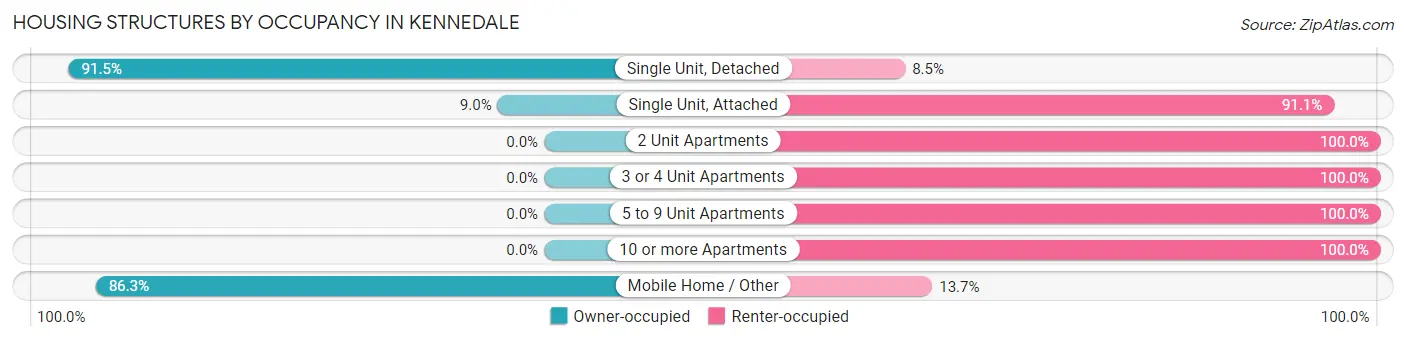
| Structure Type | Owner-occupied | Renter-occupied |
| Single Unit, Detached | 1,974 (91.5%) | 183 (8.5%) |
| Single Unit, Attached | 23 (8.9%) | 234 (91.0%) |
| 2 Unit Apartments | 0 (0.0%) | 124 (100.0%) |
| 3 or 4 Unit Apartments | 0 (0.0%) | 140 (100.0%) |
| 5 to 9 Unit Apartments | 0 (0.0%) | 22 (100.0%) |
| 10 or more Apartments | 0 (0.0%) | 123 (100.0%) |
| Mobile Home / Other | 63 (86.3%) | 10 (13.7%) |
| Total | 2,060 (71.1%) | 836 (28.9%) |
Housing Structures by Number of Rooms in Kennedale
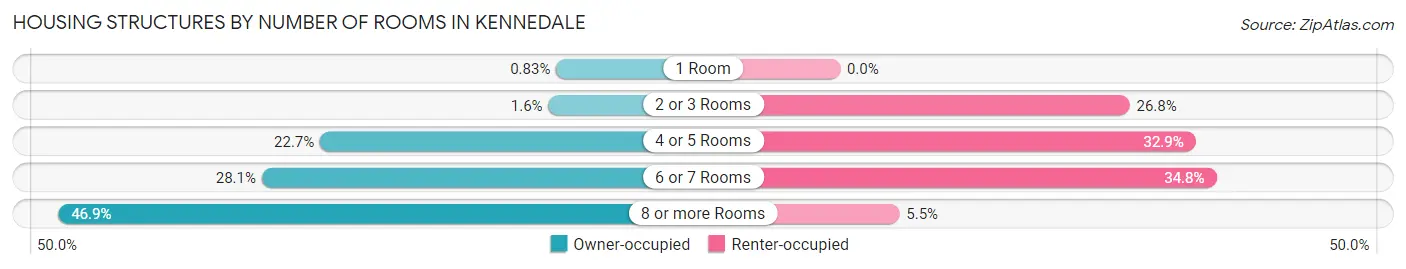
| Number of Rooms | Owner-occupied | Renter-occupied |
| 1 Room | 17 (0.8%) | 0 (0.0%) |
| 2 or 3 Rooms | 32 (1.5%) | 224 (26.8%) |
| 4 or 5 Rooms | 467 (22.7%) | 275 (32.9%) |
| 6 or 7 Rooms | 578 (28.1%) | 291 (34.8%) |
| 8 or more Rooms | 966 (46.9%) | 46 (5.5%) |
| Total | 2,060 (100.0%) | 836 (100.0%) |
Housing Structure by Heating Type in Kennedale
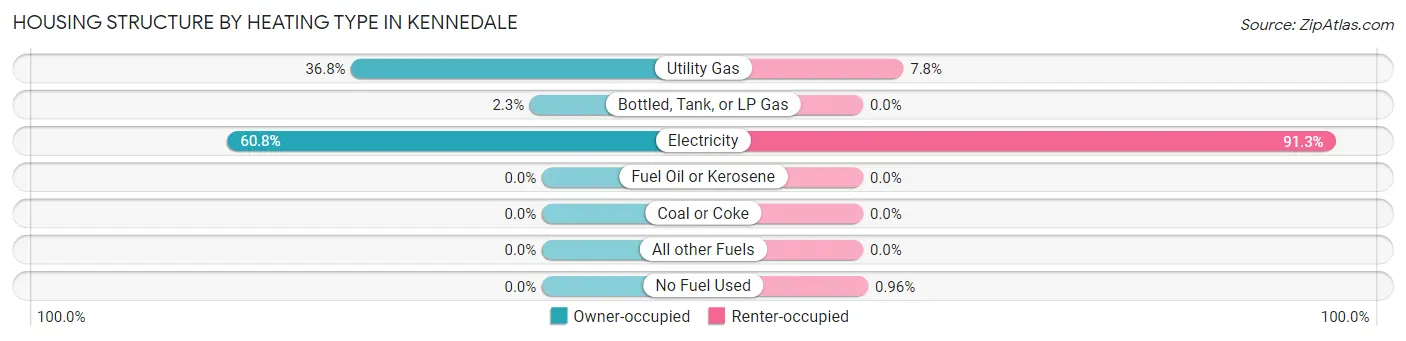
| Heating Type | Owner-occupied | Renter-occupied |
| Utility Gas | 759 (36.8%) | 65 (7.8%) |
| Bottled, Tank, or LP Gas | 48 (2.3%) | 0 (0.0%) |
| Electricity | 1,253 (60.8%) | 763 (91.3%) |
| Fuel Oil or Kerosene | 0 (0.0%) | 0 (0.0%) |
| Coal or Coke | 0 (0.0%) | 0 (0.0%) |
| All other Fuels | 0 (0.0%) | 0 (0.0%) |
| No Fuel Used | 0 (0.0%) | 8 (1.0%) |
| Total | 2,060 (100.0%) | 836 (100.0%) |
Household Vehicle Usage in Kennedale
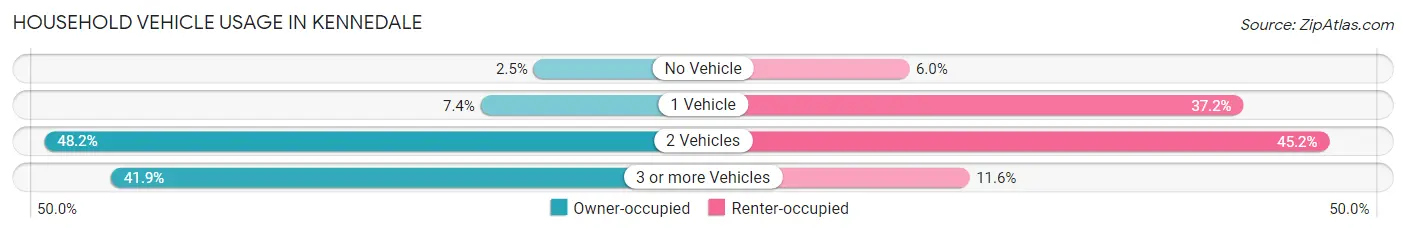
| Vehicles per Household | Owner-occupied | Renter-occupied |
| No Vehicle | 51 (2.5%) | 50 (6.0%) |
| 1 Vehicle | 153 (7.4%) | 311 (37.2%) |
| 2 Vehicles | 992 (48.2%) | 378 (45.2%) |
| 3 or more Vehicles | 864 (41.9%) | 97 (11.6%) |
| Total | 2,060 (100.0%) | 836 (100.0%) |
Real Estate & Mortgages in Kennedale
Real Estate and Mortgage Overview in Kennedale
| Characteristic | Without Mortgage | With Mortgage |
| Housing Units | 861 | 1,199 |
| Median Property Value | $273,300 | $366,900 |
| Median Household Income | $99,974 | $566 |
| Monthly Housing Costs | $845 | $311 |
| Real Estate Taxes | $4,893 | $48 |
Property Value by Mortgage Status in Kennedale
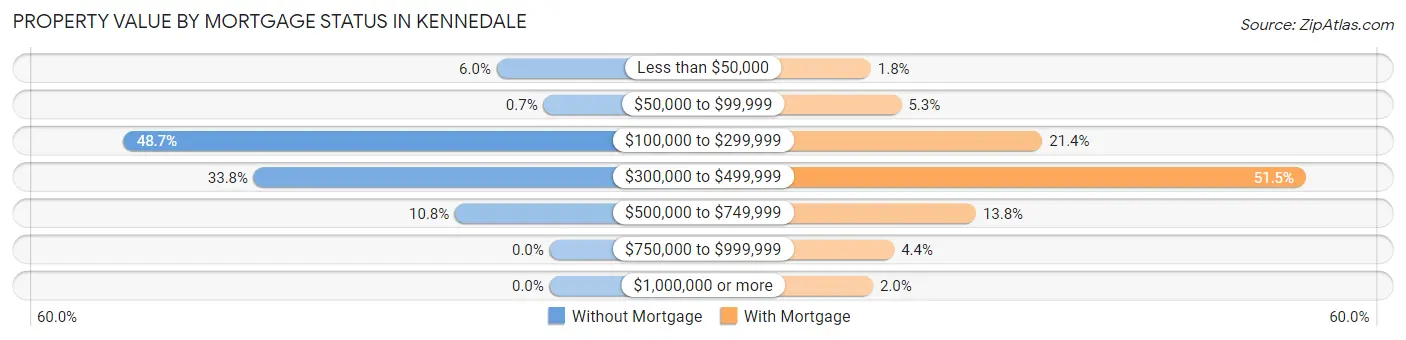
| Property Value | Without Mortgage | With Mortgage |
| Less than $50,000 | 52 (6.0%) | 21 (1.8%) |
| $50,000 to $99,999 | 6 (0.7%) | 63 (5.2%) |
| $100,000 to $299,999 | 419 (48.7%) | 256 (21.3%) |
| $300,000 to $499,999 | 291 (33.8%) | 617 (51.5%) |
| $500,000 to $749,999 | 93 (10.8%) | 165 (13.8%) |
| $750,000 to $999,999 | 0 (0.0%) | 53 (4.4%) |
| $1,000,000 or more | 0 (0.0%) | 24 (2.0%) |
| Total | 861 (100.0%) | 1,199 (100.0%) |
Household Income by Mortgage Status in Kennedale
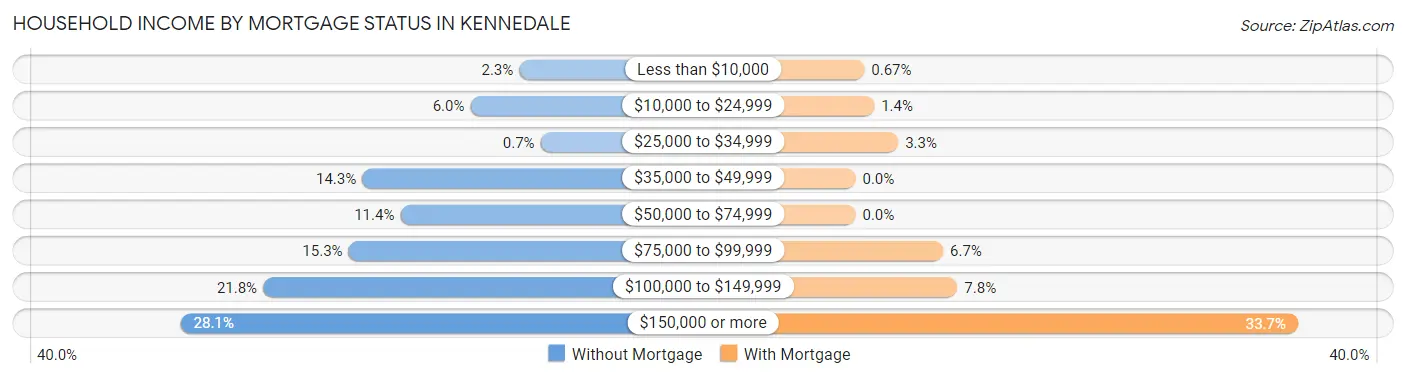
| Household Income | Without Mortgage | With Mortgage |
| Less than $10,000 | 20 (2.3%) | 8 (0.7%) |
| $10,000 to $24,999 | 52 (6.0%) | 17 (1.4%) |
| $25,000 to $34,999 | 6 (0.7%) | 39 (3.3%) |
| $35,000 to $49,999 | 123 (14.3%) | 0 (0.0%) |
| $50,000 to $74,999 | 98 (11.4%) | 0 (0.0%) |
| $75,000 to $99,999 | 132 (15.3%) | 80 (6.7%) |
| $100,000 to $149,999 | 188 (21.8%) | 93 (7.8%) |
| $150,000 or more | 242 (28.1%) | 404 (33.7%) |
| Total | 861 (100.0%) | 1,199 (100.0%) |
Property Value to Household Income Ratio in Kennedale
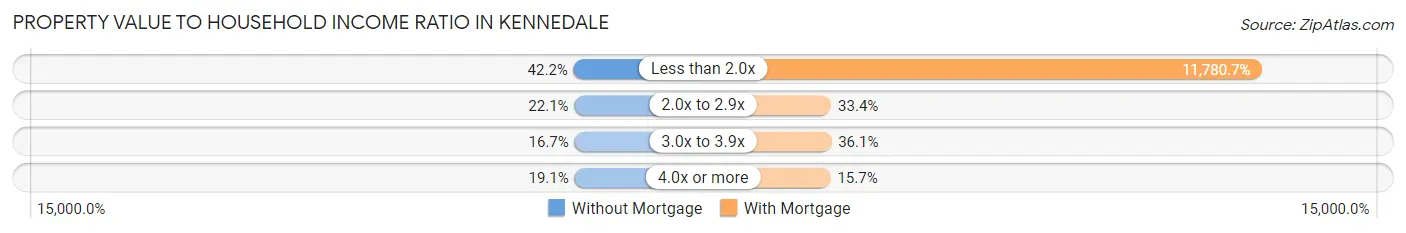
| Value-to-Income Ratio | Without Mortgage | With Mortgage |
| Less than 2.0x | 363 (42.2%) | 141,250 (11,780.6%) |
| 2.0x to 2.9x | 190 (22.1%) | 400 (33.4%) |
| 3.0x to 3.9x | 144 (16.7%) | 433 (36.1%) |
| 4.0x or more | 164 (19.1%) | 188 (15.7%) |
| Total | 861 (100.0%) | 1,199 (100.0%) |
Real Estate Taxes by Mortgage Status in Kennedale
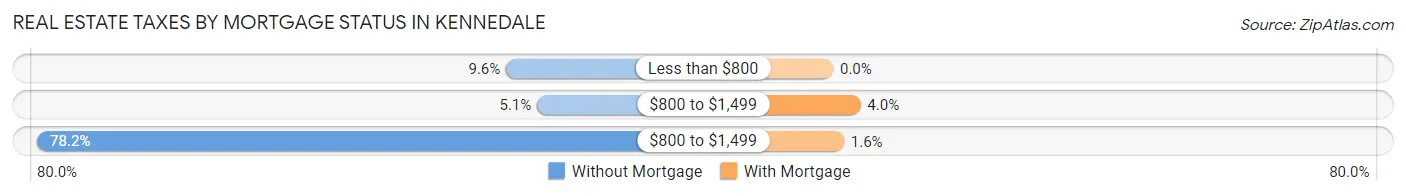
| Property Taxes | Without Mortgage | With Mortgage |
| Less than $800 | 83 (9.6%) | 0 (0.0%) |
| $800 to $1,499 | 44 (5.1%) | 48 (4.0%) |
| $800 to $1,499 | 673 (78.2%) | 19 (1.6%) |
| Total | 861 (100.0%) | 1,199 (100.0%) |
Health & Disability in Kennedale
Health Insurance Coverage by Age in Kennedale
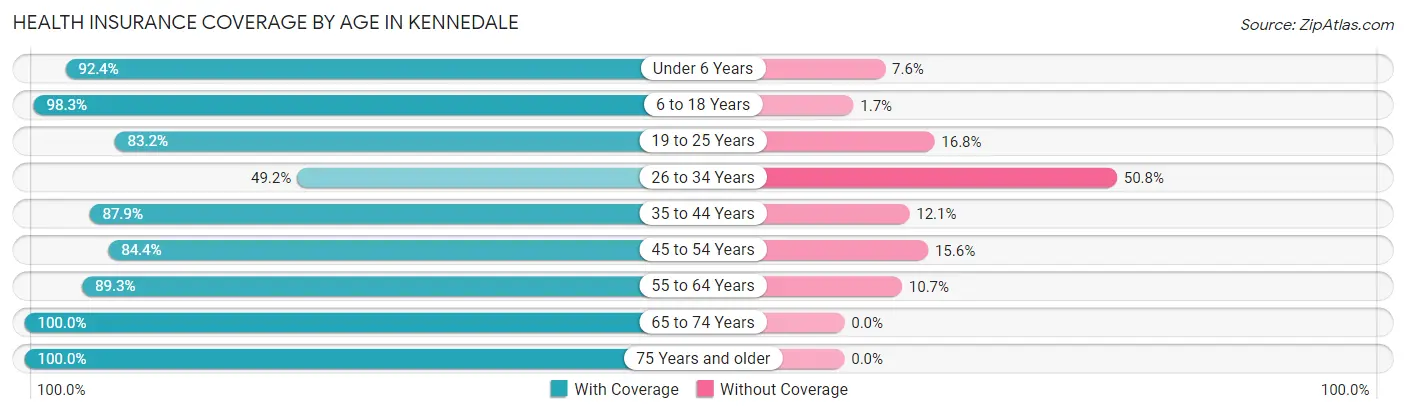
| Age Bracket | With Coverage | Without Coverage |
| Under 6 Years | 425 (92.4%) | 35 (7.6%) |
| 6 to 18 Years | 1,511 (98.3%) | 26 (1.7%) |
| 19 to 25 Years | 520 (83.2%) | 105 (16.8%) |
| 26 to 34 Years | 457 (49.2%) | 472 (50.8%) |
| 35 to 44 Years | 885 (87.9%) | 122 (12.1%) |
| 45 to 54 Years | 1,189 (84.4%) | 220 (15.6%) |
| 55 to 64 Years | 1,080 (89.3%) | 130 (10.7%) |
| 65 to 74 Years | 865 (100.0%) | 0 (0.0%) |
| 75 Years and older | 496 (100.0%) | 0 (0.0%) |
| Total | 7,428 (87.0%) | 1,110 (13.0%) |
Health Insurance Coverage by Citizenship Status in Kennedale
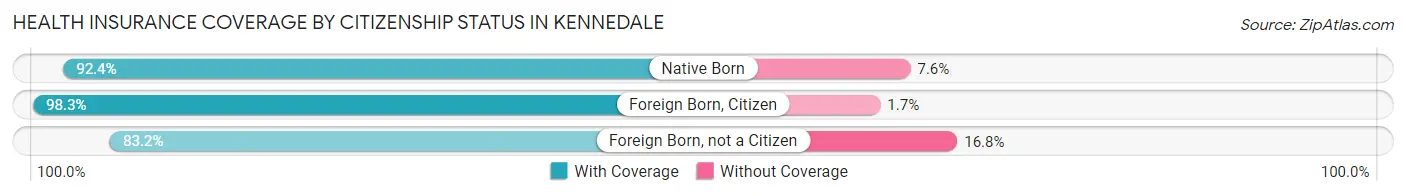
| Citizenship Status | With Coverage | Without Coverage |
| Native Born | 425 (92.4%) | 35 (7.6%) |
| Foreign Born, Citizen | 1,511 (98.3%) | 26 (1.7%) |
| Foreign Born, not a Citizen | 520 (83.2%) | 105 (16.8%) |
Health Insurance Coverage by Household Income in Kennedale
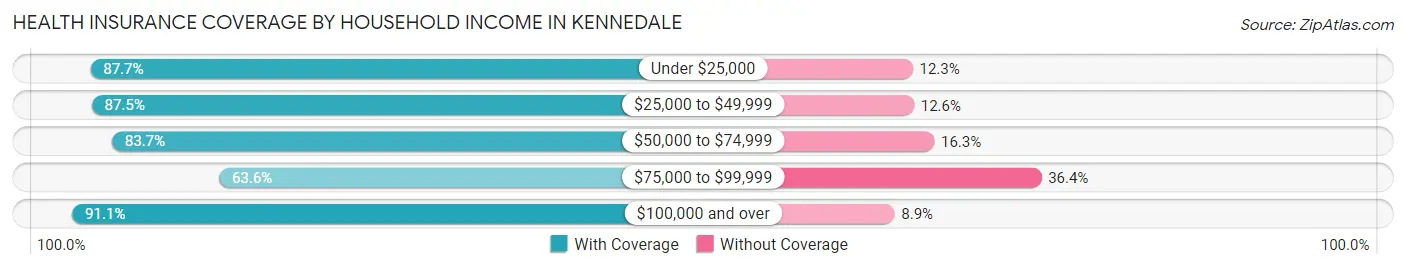
| Household Income | With Coverage | Without Coverage |
| Under $25,000 | 555 (87.7%) | 78 (12.3%) |
| $25,000 to $49,999 | 634 (87.5%) | 91 (12.6%) |
| $50,000 to $74,999 | 548 (83.7%) | 107 (16.3%) |
| $75,000 to $99,999 | 557 (63.6%) | 319 (36.4%) |
| $100,000 and over | 5,131 (91.1%) | 502 (8.9%) |
Public vs Private Health Insurance Coverage by Age in Kennedale
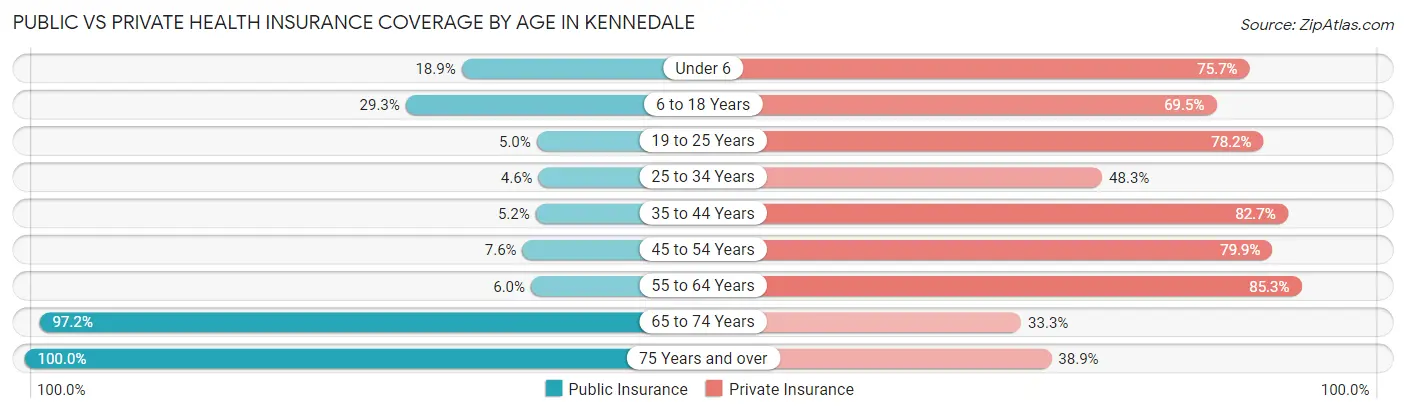
| Age Bracket | Public Insurance | Private Insurance |
| Under 6 | 87 (18.9%) | 348 (75.6%) |
| 6 to 18 Years | 450 (29.3%) | 1,068 (69.5%) |
| 19 to 25 Years | 31 (5.0%) | 489 (78.2%) |
| 25 to 34 Years | 43 (4.6%) | 449 (48.3%) |
| 35 to 44 Years | 52 (5.2%) | 833 (82.7%) |
| 45 to 54 Years | 107 (7.6%) | 1,126 (79.9%) |
| 55 to 64 Years | 73 (6.0%) | 1,032 (85.3%) |
| 65 to 74 Years | 841 (97.2%) | 288 (33.3%) |
| 75 Years and over | 496 (100.0%) | 193 (38.9%) |
| Total | 2,180 (25.5%) | 5,826 (68.2%) |
Disability Status by Sex by Age in Kennedale
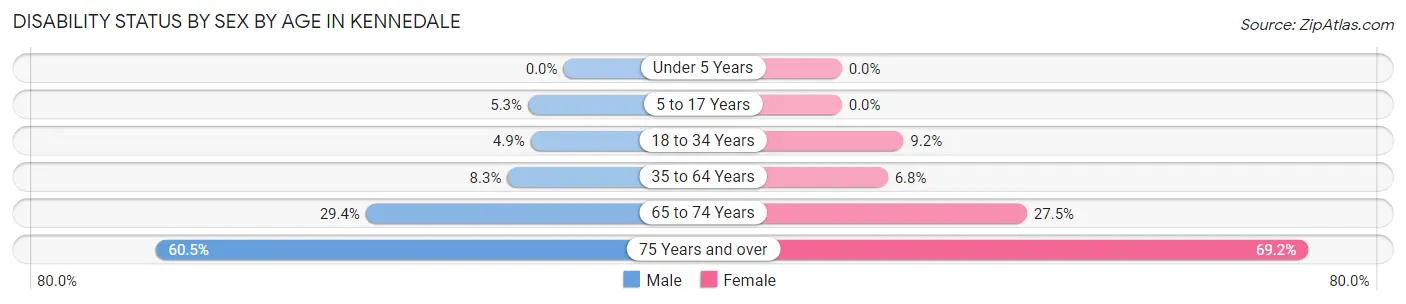
| Age Bracket | Male | Female |
| Under 5 Years | 0 (0.0%) | 0 (0.0%) |
| 5 to 17 Years | 36 (5.3%) | 0 (0.0%) |
| 18 to 34 Years | 54 (4.9%) | 54 (9.1%) |
| 35 to 64 Years | 153 (8.3%) | 122 (6.8%) |
| 65 to 74 Years | 130 (29.3%) | 116 (27.5%) |
| 75 Years and over | 135 (60.5%) | 189 (69.2%) |
Disability Class by Sex by Age in Kennedale
Disability Class: Hearing Difficulty
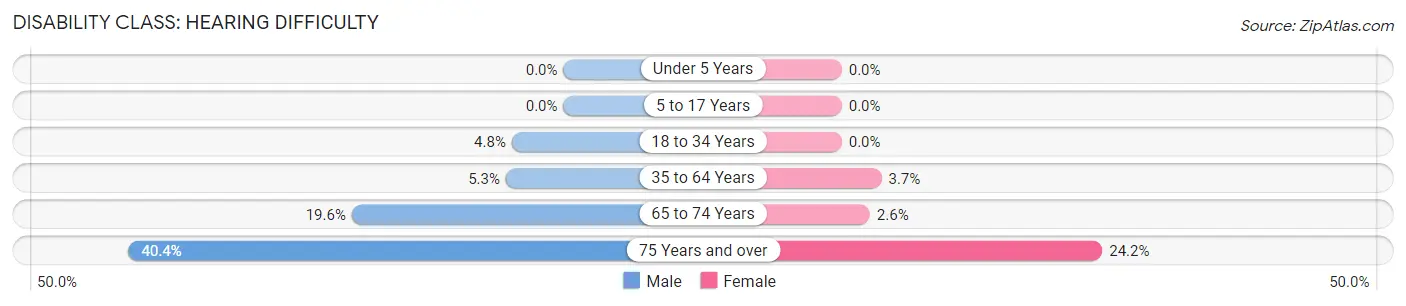
| Age Bracket | Male | Female |
| Under 5 Years | 0 (0.0%) | 0 (0.0%) |
| 5 to 17 Years | 0 (0.0%) | 0 (0.0%) |
| 18 to 34 Years | 53 (4.8%) | 0 (0.0%) |
| 35 to 64 Years | 98 (5.3%) | 66 (3.7%) |
| 65 to 74 Years | 87 (19.6%) | 11 (2.6%) |
| 75 Years and over | 90 (40.4%) | 66 (24.2%) |
Disability Class: Vision Difficulty
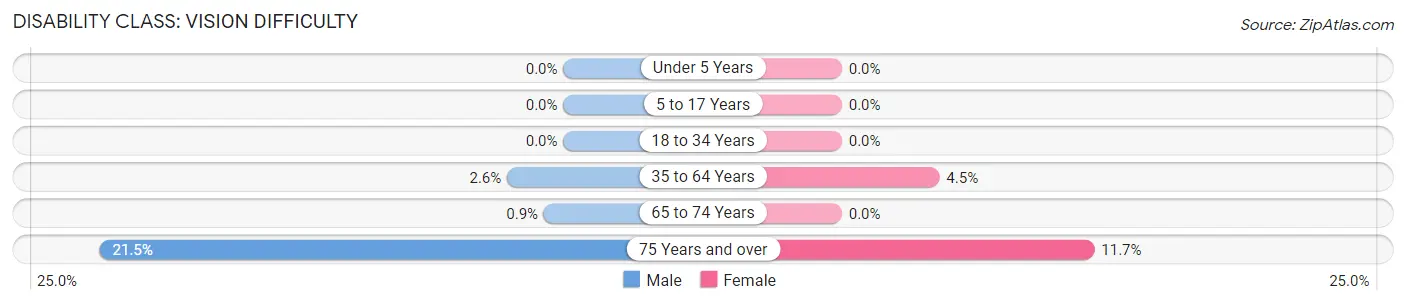
| Age Bracket | Male | Female |
| Under 5 Years | 0 (0.0%) | 0 (0.0%) |
| 5 to 17 Years | 0 (0.0%) | 0 (0.0%) |
| 18 to 34 Years | 0 (0.0%) | 0 (0.0%) |
| 35 to 64 Years | 48 (2.6%) | 81 (4.5%) |
| 65 to 74 Years | 4 (0.9%) | 0 (0.0%) |
| 75 Years and over | 48 (21.5%) | 32 (11.7%) |
Disability Class: Cognitive Difficulty
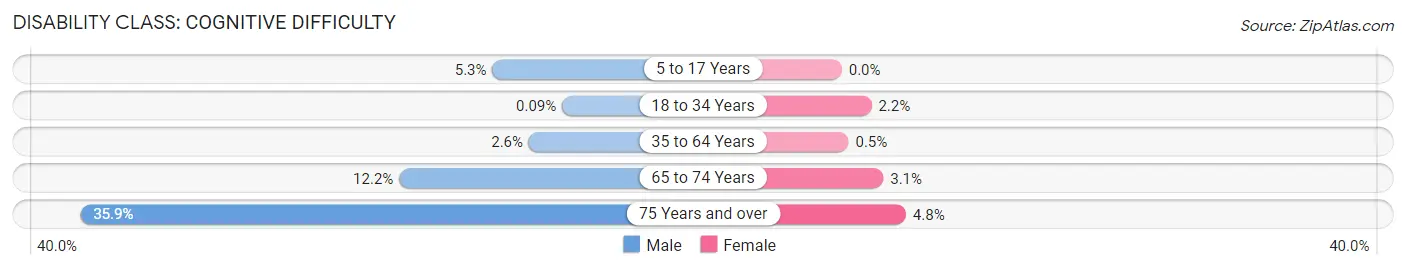
| Age Bracket | Male | Female |
| 5 to 17 Years | 36 (5.3%) | 0 (0.0%) |
| 18 to 34 Years | 1 (0.1%) | 13 (2.2%) |
| 35 to 64 Years | 47 (2.6%) | 9 (0.5%) |
| 65 to 74 Years | 54 (12.2%) | 13 (3.1%) |
| 75 Years and over | 80 (35.9%) | 13 (4.8%) |
Disability Class: Ambulatory Difficulty
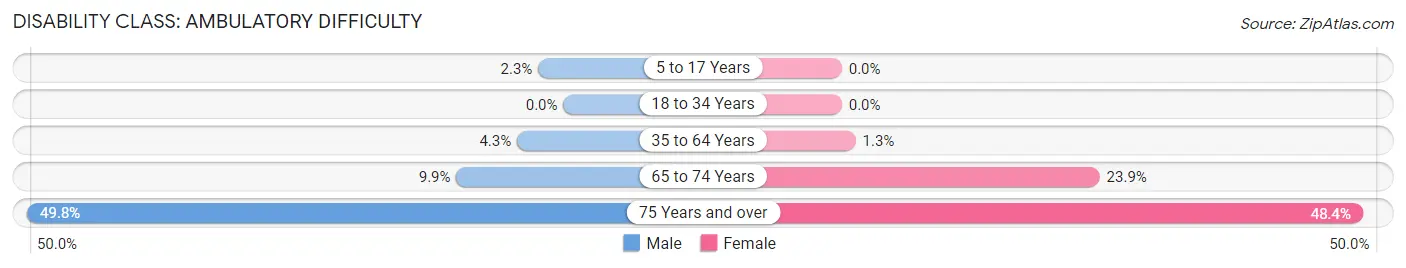
| Age Bracket | Male | Female |
| 5 to 17 Years | 16 (2.3%) | 0 (0.0%) |
| 18 to 34 Years | 0 (0.0%) | 0 (0.0%) |
| 35 to 64 Years | 79 (4.3%) | 23 (1.3%) |
| 65 to 74 Years | 44 (9.9%) | 101 (23.9%) |
| 75 Years and over | 111 (49.8%) | 132 (48.3%) |
Disability Class: Self-Care Difficulty
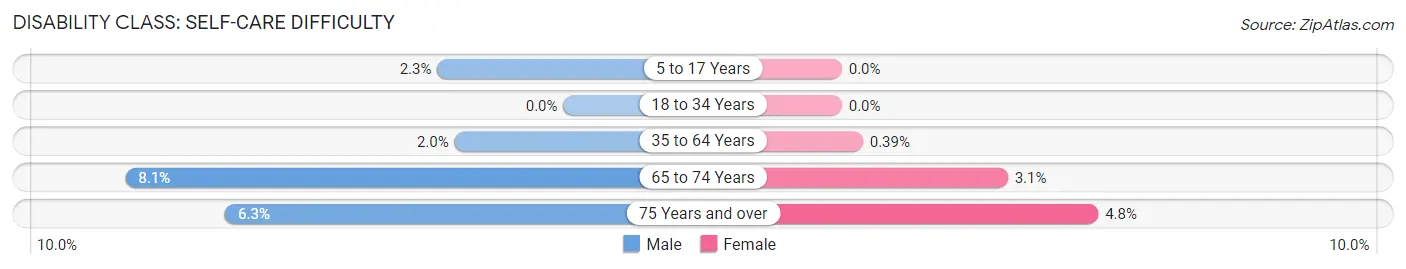
| Age Bracket | Male | Female |
| 5 to 17 Years | 16 (2.3%) | 0 (0.0%) |
| 18 to 34 Years | 0 (0.0%) | 0 (0.0%) |
| 35 to 64 Years | 37 (2.0%) | 7 (0.4%) |
| 65 to 74 Years | 36 (8.1%) | 13 (3.1%) |
| 75 Years and over | 14 (6.3%) | 13 (4.8%) |
Technology Access in Kennedale
Computing Device Access in Kennedale
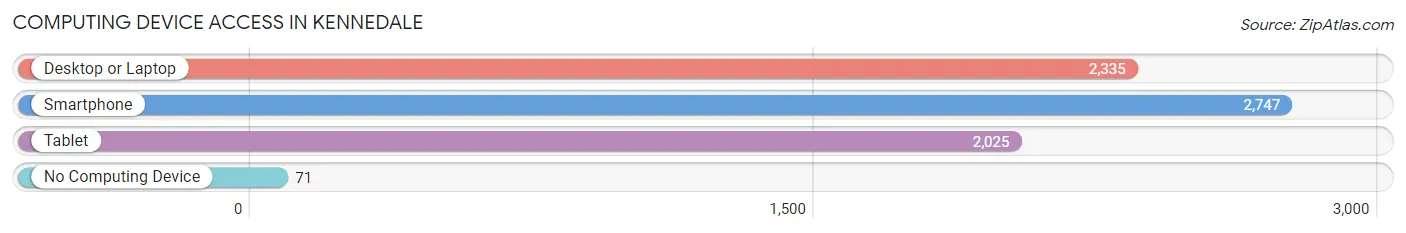
| Device Type | # Households | % Households |
| Desktop or Laptop | 2,335 | 80.6% |
| Smartphone | 2,747 | 94.9% |
| Tablet | 2,025 | 69.9% |
| No Computing Device | 71 | 2.5% |
| Total | 2,896 | 100.0% |
Internet Access in Kennedale
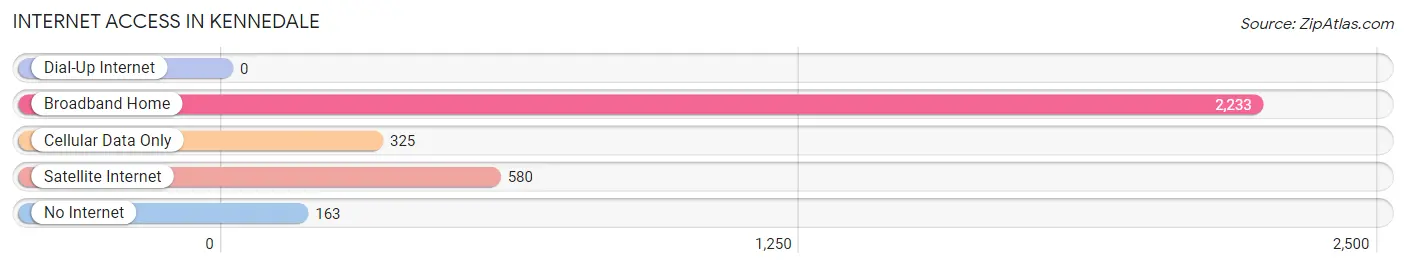
| Internet Type | # Households | % Households |
| Dial-Up Internet | 0 | 0.0% |
| Broadband Home | 2,233 | 77.1% |
| Cellular Data Only | 325 | 11.2% |
| Satellite Internet | 580 | 20.0% |
| No Internet | 163 | 5.6% |
| Total | 2,896 | 100.0% |
Kennedale Summary
Kennedale, Texas is a small city located in Tarrant County, Texas, United States. The city is part of the Dallas-Fort Worth-Arlington metropolitan area and is located about 15 miles southeast of downtown Fort Worth. The population of Kennedale was 6,763 at the 2010 census, up from 5,770 at the 2000 census.
History
The area that is now Kennedale was first settled in the 1840s by the Kennedale family, who were among the first settlers in the area. The family established a small farm and a trading post, which served as a hub for the local community. The town was officially established in 1881 and was named after the Kennedale family.
In the early 1900s, the town began to grow as a result of the oil boom in the area. The town was incorporated in 1947 and has since grown to become a small city.
Geography
Kennedale is located at 32°37'17" North, 97°14'45" West (32.6214, -97.2458). According to the United States Census Bureau, the city has a total area of 4.2 square miles, all of it land.
Economy
The economy of Kennedale is largely based on the oil and gas industry. The city is home to several oil and gas companies, including ExxonMobil, Chevron, and Shell. The city also has a number of small businesses, including restaurants, retail stores, and service providers.
Demographics
As of the 2010 census, there were 6,763 people, 2,541 households, and 1,845 families residing in the city. The population density was 1,611.3 people per square mile. The racial makeup of the city was 79.2% White, 8.2% African American, 0.7% Native American, 0.7% Asian, 0.1% Pacific Islander, 8.7% from other races, and 2.4% from two or more races. Hispanic or Latino of any race were 18.2% of the population.
The median income for a household in the city was $50,945, and the median income for a family was $60,945. The per capita income for the city was $23,945. About 8.2% of families and 10.2% of the population were below the poverty line, including 14.2% of those under age 18 and 6.2% of those age 65 or over.
Conclusion
Kennedale, Texas is a small city located in Tarrant County, Texas, United States. The city is part of the Dallas-Fort Worth-Arlington metropolitan area and is located about 15 miles southeast of downtown Fort Worth. The population of Kennedale was 6,763 at the 2010 census, up from 5,770 at the 2000 census. The economy of Kennedale is largely based on the oil and gas industry, and the city is home to several oil and gas companies. The racial makeup of the city was 79.2% White, 8.2% African American, 0.7% Native American, 0.7% Asian, 0.1% Pacific Islander, 8.7% from other races, and 2.4% from two or more races. The median income for a household in the city was $50,945, and the median income for a family was $60,945. The per capita income for the city was $23,945.
Common Questions
What is Per Capita Income in Kennedale?
Per Capita income in Kennedale is $44,483.
What is the Median Family Income in Kennedale?
Median Family Income in Kennedale is $119,141.
What is the Median Household income in Kennedale?
Median Household Income in Kennedale is $112,646.
What is Income or Wage Gap in Kennedale?
Income or Wage Gap in Kennedale is 40.3%.
Women in Kennedale earn 59.7 cents for every dollar earned by a man.
What is Inequality or Gini Index in Kennedale?
Inequality or Gini Index in Kennedale is 0.41.
What is the Total Population of Kennedale?
Total Population of Kennedale is 8,590.
What is the Total Male Population of Kennedale?
Total Male Population of Kennedale is 4,597.
What is the Total Female Population of Kennedale?
Total Female Population of Kennedale is 3,993.
What is the Ratio of Males per 100 Females in Kennedale?
There are 115.13 Males per 100 Females in Kennedale.
What is the Ratio of Females per 100 Males in Kennedale?
There are 86.86 Females per 100 Males in Kennedale.
What is the Median Population Age in Kennedale?
Median Population Age in Kennedale is 42.7 Years.
What is the Average Family Size in Kennedale
Average Family Size in Kennedale is 3.4 People.
What is the Average Household Size in Kennedale
Average Household Size in Kennedale is 2.9 People.
How Large is the Labor Force in Kennedale?
There are 4,953 People in the Labor Forcein in Kennedale.
What is the Percentage of People in the Labor Force in Kennedale?
71.6% of People are in the Labor Force in Kennedale.
What is the Unemployment Rate in Kennedale?
Unemployment Rate in Kennedale is 4.7%.